Client Report : Compression Wood Project - Final Report Client report number 218-309 Prepared for : Mr Bob Selmes 6 th July 2004

Welcome message from author
This document is posted to help you gain knowledge. Please leave a comment to let me know what you think about it! Share it to your friends and learn new things together.
Transcript

Client Report : Compression Wood Project - Final Report Client report number 218-309
Prepared for : Mr Bob Selmes
6th July 2004

Compression Wood Project – Final Report
BRE Client Report No. 218-309 Building Research Establishment Ltd 2004 Commercial in confidence
Prepared by
Signature
Name T N Reynolds
Position Senior Consultant
Approved on behalf of BRE
Signature
Name Dr Vahik Enjily
Position Director of Centre for Timber Technology and Construction
Date 6th July 2004
BRE Bucknalls Lane
Garston Watford
WD25 9XX
Tel : 01923 664000 Fax: 01923 664010
Email : [email protected]
Website : www.bre.co.uk

Compression Wood Project – Final Report
BRE Client Report No. 218-309 Building Research Establishment Ltd 2004 Commercial in confidence
Executive Summary This is the final report for the following project, entitled: "WOOD CHARACTERISTICS -The influence of compression wood on timber quality". The project aim is to achieve a greater understanding of the influence of compression wood on timber quality. Report Summary:
• Work on determining compression wood properties and in evaluating in-line 3D log sorting for compression wood has gone very well – yielding useful results.
• Compression wood was found to have little effect on the stiffness of the full scale battens studied and therefore should not be a significant variable in the model to predict machine grade output (Indicating Property).
• In small clear samples (300mm x 20 x 20) a trend for decreasing stiffness with increasing amounts of compression wood was observed.
• Compression wood was found to occur in straight, round logs – often leading to serious distortion because the compression wood was consistently along the edge or side of a batten.
• Log ovality was not found to be a good indicator of the likelihood of compression wood being present in battens.
• Modelling work for machine grading stiffness (low mean IP) showed good results for 100 x 47mm size battens, but was less successful for 150 x 47mm battens. The most successful combined site model for 100 x 47mm battens explained 56% of the variance, however it was found that for differing sites and sizes of timber (ie different parts of the tree) there were differing significant variables both positive and negative.
• Modelling work did not have a high level of success in predicting distortion in bow and spring because it is simply not possible to determine with any certainty the extent and nature of compression wood below the surface, without cross cutting into sections.
• Because of the generally lower level of compression wood and bow and spring in the FR1,2,3 and 4 sets of timber and the fact that that detailed STUD data already existed, the models were re-worked using compression wood variables alone. The rate of prediction is described as successful by the modeller; however they account for only 40% of the variance.
• Based on longitudinal shrinkage of small scale samples of normal wood and compression wood it was possible to calculate the maximum bow and spring of full scale battens.
• Investigations into the potential of image analysis, laser tracheid effect and X rays to identify compression wood in battens have been carried out, but these methods are not capable of resolving below the surface details.
• Preliminary recommendations for dealing with compression wood have been formulated. In general it is recommended that compression wood rich material should be ear-marked for applications where it will not be allowed to dry out unrestrained, or where it is well-restrained in service e.g. timber frame.
• Generally, compression wood in large sizes of timber such as joists will have a more serious effect than on shorter, smaller sections such as timber frame studding and one solution might be to cut down 200mm joists into 100mm studding on indications of high compression wood content. This will, however, require an advanced scanner to be placed in-line. It is important to realise that the opportunity for close inspection of battens probably only currently occurs

Compression Wood Project – Final Report
BRE Client Report No. 218-309 Building Research Establishment Ltd 2004 Commercial in confidence
during grading and that if re-sizing is performed the material will have to be graded once more.
• The particular need to effectively deal with compression wood in laminated re-engineered timber products has been highlighted
• Two scientific papers were produced as a result of this work (for WCTE 2004 and Forestry Wood Chain 2004).
• It was noted on a batch of machine grade rejects currently under study by BRE that severe compression wood was associated with poor stem form in early tree life
Compression Wood Project – Final Report
BRE Client Report No. 218-309 Building Research Establishment Ltd 2004 Commercial in confidence
Contents
1. Introduction 1 2. Progress and Activity 3 3. Results 6 3.1 Test work on small samples 6 3.2 Relating scanned log shape to compression wood 13 3.3 Relating pith eccentricity to compression wood 20 3.4 Effect of compression wood on grading and strength 21 3.5 Effect of compression wood on distortion 22 3.6 Methods of detection 30 4. Preliminary recommendations for compression wood 33 5. Modelling 35 6. Conclusions 72 References 73
Appendix 1 - Site and Stand Characteristics Appendix 2 - Sawn Timber Testing Protocol Appendix 3 - Report on Models

Compression Wood Project – Final Report
BRE Client Report No. 218-309 Building Research Establishment Ltd 2004 Commercial in confidence
1
1. Introduction General: This report details the final results and activity on the following project, full title: "WOOD CHARACTERISTICS -The influence of Compression Wood on timber quality". This project is key matched funding for the EU Compression Wood Project due to end in May, with report deadlines in June 2004. Final conclusion to the project is dependent on refinement of the modelling work and results from other EU colleagues. Project Details: PPD99 (BRE project no. CV7502) The BRE Project Manager is Tim Reynolds (01923 664832, [email protected]) Other key contributors: Gerald Moore, Keye Liu, Keith Maun, Jean Tunnicliffe-Wilson (external consultant) Background: The project relates to work required to support the Policy and Practice Division’s crop quality programme. It will combine and enhance work in Contract FPD 44 completed March 2000 and Contract PPD51 completed March 2001 with EC project QLRT-2000-00177 concerned with Compression wood in conifers “The Characterisation of its Formation and its relevance to Timber Quality” (COMPRESSION). Recent work completed to relate growth characteristics to machine grade (MG) stiffness has identified the possible significance of compression wood on MG stiffness. This was established using the data collected for growth characteristics of Sitka and Norway spruce battens analysed within the European shared cost ‘STUD’ project. Compression wood was a significant variable for the model developed within STUD to predict kiln drying distortion (twist, bow and spring) from the measured characteristics. Objectives: • To enhance the BRE/FC model to predict stiffness within the EC Compression Wood
project. • To assess quantitatively the impact of compression wood on micro-structural,
physical and mechanical properties. • To minimise the negative impact of compression wood during the various steps of
processing by developing adequate processing/ treatment methodologies at laboratory and industrial scale.
• To develop new methods for identifying the presence of compression wood in saw logs and battens.
• To compile an overall evaluation of the impact of compression wood on the utilisation of softwood timber and suggest solutions to minimise this impact both at processing and industrial level.
• To enhance and verify wood quality models using information gained above concerning compression wood.
• To communicate the results and conclusions to the relevant forestry and industrial sectors (end users) and seek their feedback and comments.

Compression Wood Project – Final Report
BRE Client Report No. 218-309 Building Research Establishment Ltd 2004 Commercial in confidence
2
General Method: • Sample logs from four characterised Sitka spruce forest stands. • Survey forest products industry to establish economic aspects of occurrence of
compression wood. • Establish tree and log characterisation using 3D scanning techniques at a sawmill • Classify compression wood content • Determine physical and mechanical properties of wood containing different amounts
of compression wood. • Analyse industrially cut timber containing compression wood and industrial
processes to minimise the impact of compression wood. • Assess sampled material for end use quality by 3D log scanning, machine stress
grading, drying trials and growth features to link with BRE models. • Develop an enhanced model for stiffness and drying distortion with the help of an
external consultant (modeller) using the new compression wood information. Outputs: Concise information notes and information for the Forestry Commission describing: • Enhanced stiffness model. • Definition of compression wood severity classes for structural timber use. • Improved timber quality models. • Recommendations to obtain a long-term improvement in the quality of softwood
timber. • Closing report. Impact: Enhancements to the stiffness/distortion models through a better understanding of compression wood will give BRE/FC a more powerful modelling tool for predicting machine stress grade stiffness and drying distortion from growth characteristics of battens and logs. It will allow further moves towards an integrated Timber Quality model linking forest management with sawn product (end-uses). It will give valuable information to forest managers to improve their tree crops, and enable a long-term improvement in the quality of softwood timber in terms of mechanical properties (strength and stiffness) and geometrical stability (warp, distortion) related to the occurrence of compression wood. The general effects of compression wood on the performance of timber are believed to be a reduction in the strength, stiffness and in dimensional stability. An Industrial process will be developed to minimise the effect of these and therefore improve the quality of end products and reduce losses in financial outcome.

Compression Wood Project – Final Report
BRE Client Report No. 218-309 Building Research Establishment Ltd 2004 Commercial in confidence
3
2. Progress and Activity Project Planning: BRE has attended and contributed to the following project planning meetings: • Project kick-off meeting (Edinburgh, June 2001) • 6 month meeting (Florence, Jan 2002) • 12 month meeting (Garpenburg, June 2003) • 18 month meeting (Strasbourg, December 2003) • 24 month meeting (Joensuu, July 2003) • 30 month meeting (Freiburg, Nov 2003) • BRE hosted 2 UK compression wood meetings to discuss results (BRE and FR) • BRE discussed results of the programme of small clear testing with Chalmers
University (Feb 2004) • BRE produced a detailed work plan (see Appendix 2), in consultation with other
partners Main Work Programme: • BRE has assisted with the protocol for sampling strategy and measurement of logs. • BRE has assisted with and carried out extraction, field characterisation, marking and
numbering of around 200 sawlogs from 4 stands of Sitka spruce (3 site trips); site codes FR1, FR2, FR3 and FR4 (detailed in the Appendix) • BRE has carried out 3 operations at Troon sawmill obtaining "optimised" 3m
battens in commercial sizes (47x100mm, 47x150mm, and 47x200mm) and collecting data from the 3D scanner
• A program to decode, display and output 3D log scanning data has been developed
• Routines to convert 3D scanner data into formats suitable for processing in other analysis and graphical software such as XL, Surfer and Axum have been developed.
• Distortion measurements have been made on all of the 47x100mm battens at green in the sawmill.
• Work on distortion characteristics (bow, spring, twist, cup) and conditioning to in service condition has been completed on all 500 Sitka spruce battens obtained.
• Analysis of the distortion characteristics observed so far has been carried out. • Machine grading and analysis of the results has taken place on battens for all 4 sites • Slope of grain measurements have been made on selected falling boards in N/S/E/W
quadrants from site FR1 • Slope of grain measurements have been made on all 500 battens • Visual grading and characterisation has been carried out on all timber from FR1 and
FR2 • Rate of growth, dry density, percentage of juvenile wood and batten position and
orientation data have been recorded on all of the timber obtained. • MOE and MOR values have been obtained for 47 x 150mm battens from FR1 • MOE values have been obtained for 47 x 100mm battens from FR1
• A preliminary assessment has been made of a Solartronic laser scanner to detect compression wood from sample battens

Compression Wood Project – Final Report
BRE Client Report No. 218-309 Building Research Establishment Ltd 2004 Commercial in confidence
4
• Investigation into X ray and image analysis of compression wood rich timber has taken place
• Trials have taken place using the Wood Eye scanner at BRE to detect compression wood
• Analysis and testing of small clear samples taken from selected FR3 and FR4 200mm size battens and a separate consignment of curved logs from FR3 and FR4 has been completed.
• Testing of a further batch of small clear samples obtained from material supplied by James Jones Ltd, which were rich in compression wood, is nearing completion.
• BRE carried out detailed analysis of 149 battens from an additional stand of Sitka spruce (Scotch Coultard), including distortion measurements, machine grading, slope of grain and compression wood measurement, and testing 30 selected battens to destruction for MOE and MOR. This additional testing was part funded by a contribution of £1k from Forest Research but brought into the main work because of the high levels of compression wood in the sample.
• An assessment of the effects of compression wood on re-engineered timber has taken place.
• BRE recorded and processed pith eccentricity from 186 disc images supplied by Forest Research
• Modelling analysis for FR1, FR2, FR3, FR4 bow and spring distortion using compression wood variables has been performed, with re-analysis of a sample of timber from the STUD project with higher levels of compression wood also being undertaken. The results of the modelling to the current set of timber need further refinement.
BRE also carried out field and sawmill work on a stands FR5 and FR6 of Scots pine and have dried the material at BRE, however work on this species falls outside of the scope of this project. Dissemination and End User Focus Group • BRE produced dissemination material and organised updates to the main website
(http://www.forestry.gov.uk/compressionwood) • BRE produced a projects page on the BRE website
(http://projects.bre.co.uk/compressionwood/index.html) • BRE has produced and distributed 4 newsletters ("Best Utilisation") containing
information on this project to UK sawmills • BRE has produced and distributed display boards • BRE has disseminated the project outline and preliminary results at the following
events:
1. Kiln Drying Projects Meeting: 25th October 2001 at Dower House, Edinburgh 2. STRAIGHT Kick Off Meeting: 14th & 15th October 2001, Enniskillen, Ireland 3. Timber Quality Meeting, Roslin 18th Oct 2002

Compression Wood Project – Final Report
BRE Client Report No. 218-309 Building Research Establishment Ltd 2004 Commercial in confidence
5
4. Meeting with a representative of a major sawmill (T B Jones) at BRE on 26 Nov 2002 5. BRE presented project results at a meeting with five major sawmill operators at BRE on 28th Nov 2002 6. BRE presented project results at a meeting with Forest Enterprise at BRE on 28th April 2003 7. BRE presented project results at the Timber Quality Meeting, Roslin April 2003 8. BRE presented project results at the Timber Quality Seminar, Roslin, Oct 2003 9. BRE presented the results to a meeting with 11 representatives of James Jones Ltd (sawmillers), at BRE on 23rd Feb 04.
• A questionnaire to sawmills and wood processors was produced by BRE and
circulated. The UK replies have been entered into a database. • A paper was produced for WCTE 2004 on the results of the mechanical tests and
grading on British grown Sitka spruce • A paper is in preparation for the Forestry Wood Chain conference in Sept 04
Compression Wood Project – Final Report
BRE Client Report No. 218-309 Building Research Establishment Ltd 2004 Commercial in confidence
6
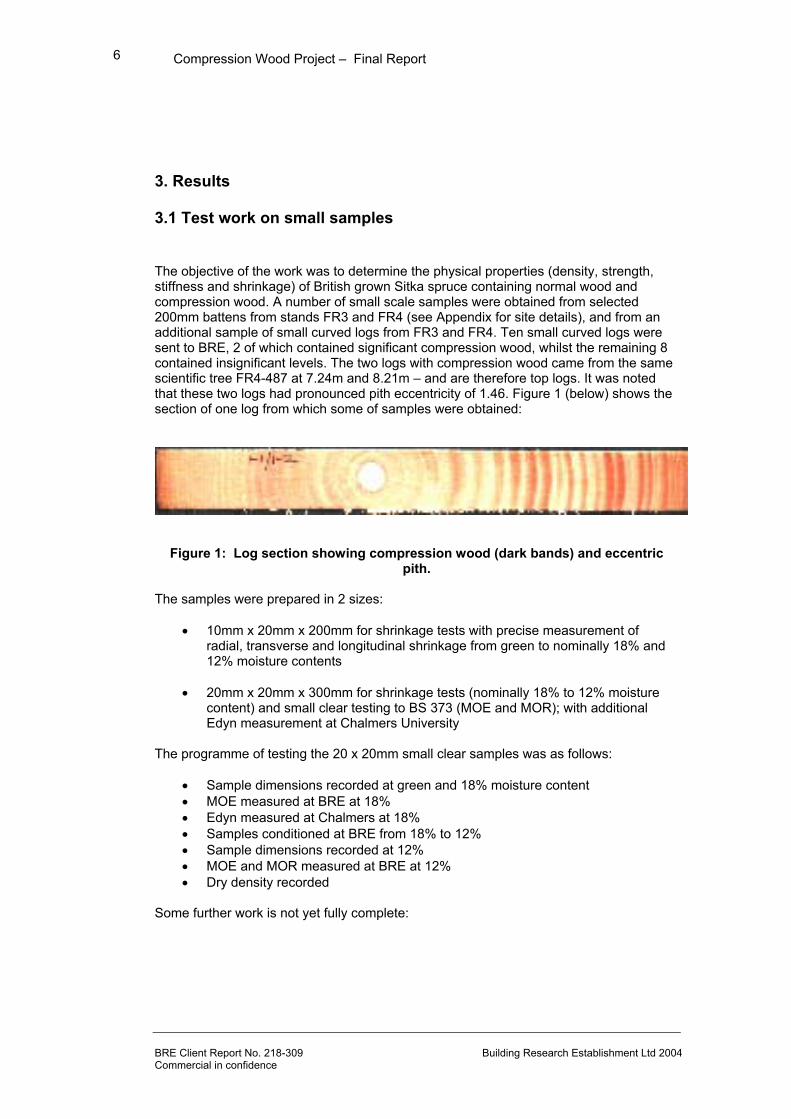
3. Results 3.1 Test work on small samples The objective of the work was to determine the physical properties (density, strength, stiffness and shrinkage) of British grown Sitka spruce containing normal wood and compression wood. A number of small scale samples were obtained from selected 200mm battens from stands FR3 and FR4 (see Appendix for site details), and from an additional sample of small curved logs from FR3 and FR4. Ten small curved logs were sent to BRE, 2 of which contained significant compression wood, whilst the remaining 8 contained insignificant levels. The two logs with compression wood came from the same scientific tree FR4-487 at 7.24m and 8.21m – and are therefore top logs. It was noted that these two logs had pronounced pith eccentricity of 1.46. Figure 1 (below) shows the section of one log from which some of samples were obtained:
Figure 1: Log section showing compression wood (dark bands) and eccentric pith.
The samples were prepared in 2 sizes:
• 10mm x 20mm x 200mm for shrinkage tests with precise measurement of radial, transverse and longitudinal shrinkage from green to nominally 18% and 12% moisture contents
• 20mm x 20mm x 300mm for shrinkage tests (nominally 18% to 12% moisture
content) and small clear testing to BS 373 (MOE and MOR); with additional Edyn measurement at Chalmers University
The programme of testing the 20 x 20mm small clear samples was as follows:
• Sample dimensions recorded at green and 18% moisture content • MOE measured at BRE at 18% • Edyn measured at Chalmers at 18% • Samples conditioned at BRE from 18% to 12% • Sample dimensions recorded at 12% • MOE and MOR measured at BRE at 12% • Dry density recorded
Some further work is not yet fully complete:
Compression Wood Project – Final Report
BRE Client Report No. 218-309 Building Research Establishment Ltd 2004 Commercial in confidence
7
• MOR tests on 2nd batch of high CW samples and microfibril angle measurements
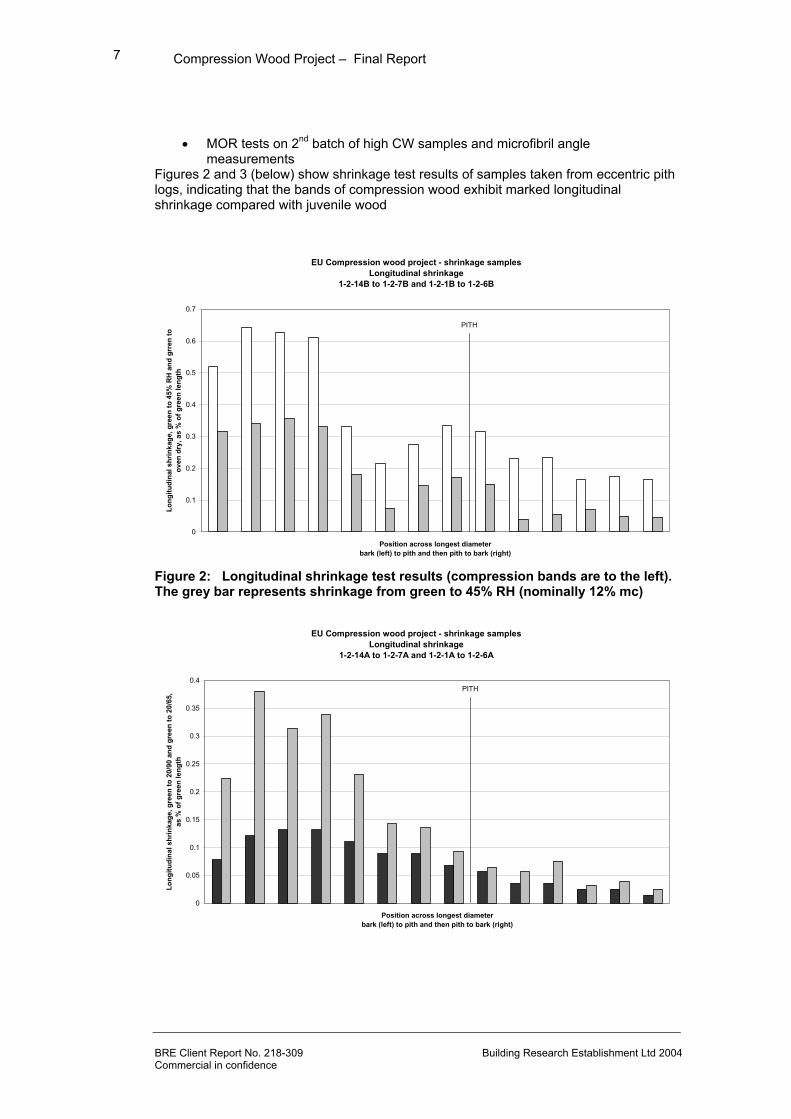
Figures 2 and 3 (below) show shrinkage test results of samples taken from eccentric pith logs, indicating that the bands of compression wood exhibit marked longitudinal shrinkage compared with juvenile wood
EU Compression wood project - shrinkage samplesLongitudinal shrinkage
1-2-14B to 1-2-7B and 1-2-1B to 1-2-6B
0
0.1
0.2
0.3
0.4
0.5
0.6
0.7
Position across longest diameterbark (left) to pith and then pith to bark (right)
Long
itudi
nal s
hrin
kage
, gre
en to
45%
RH
and
grr
en to
ov
en d
ry, a
s %
of g
reen
leng
th
PITH
Figure 2: Longitudinal shrinkage test results (compression bands are to the left). The grey bar represents shrinkage from green to 45% RH (nominally 12% mc)
EU Compression wood project - shrinkage samplesLongitudinal shrinkage
1-2-14A to 1-2-7A and 1-2-1A to 1-2-6A
0
0.05
0.1
0.15
0.2
0.25
0.3
0.35
0.4
Position across longest diameterbark (left) to pith and then pith to bark (right)
Long
itudi
nal s
hrin
kage
, gre
en to
20/
90 a
nd g
reen
to 2
0/65
, as
% o
f gre
en le
ngth
PITH
Compression Wood Project – Final Report
BRE Client Report No. 218-309 Building Research Establishment Ltd 2004 Commercial in confidence
8
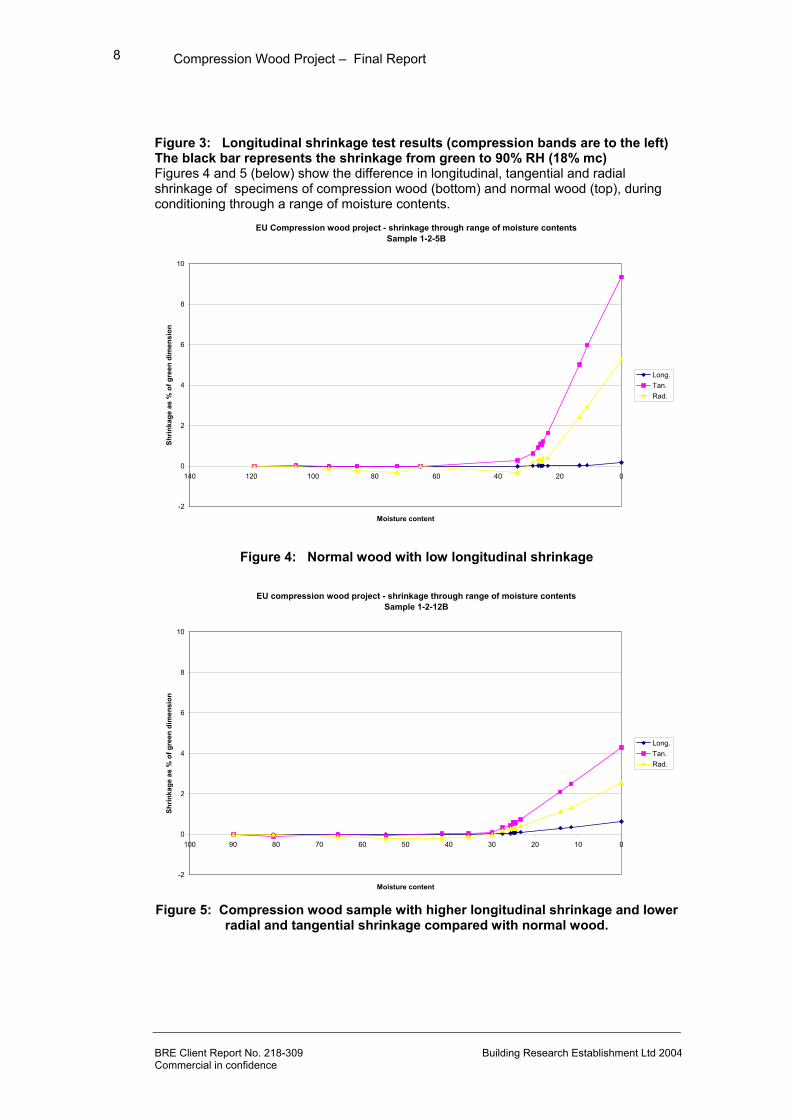
Figure 3: Longitudinal shrinkage test results (compression bands are to the left) The black bar represents the shrinkage from green to 90% RH (18% mc) Figures 4 and 5 (below) show the difference in longitudinal, tangential and radial shrinkage of specimens of compression wood (bottom) and normal wood (top), during conditioning through a range of moisture contents.
EU Compression wood project - shrinkage through range of moisture contentsSample 1-2-5B
-2
0
2
4
6
8
10
020406080100120140
Moisture content
Shrin
kage
as
% o
f gre
en d
imen
sion
Long.Tan.Rad.
Figure 4: Normal wood with low longitudinal shrinkage
EU compression wood project - shrinkage through range of moisture contentsSample 1-2-12B
-2
0
2
4
6
8
10
0102030405060708090100
Moisture content
Shrin
kage
as
% o
f gre
en d
imen
sion
Long.Tan.Rad.
Figure 5: Compression wood sample with higher longitudinal shrinkage and lower
radial and tangential shrinkage compared with normal wood.

Compression Wood Project – Final Report
BRE Client Report No. 218-309 Building Research Establishment Ltd 2004 Commercial in confidence
9
It is possible using the results of shrinkage tests to calculate the theoretical bow and spring of a batten using the following formula (detailed in BRE Digest 229): Bow at mid-length, bm = ( L2 / 8d ) x difference in strain between the two faces where, L = length over which distortion is measured, and d = thickness of the batten. Thus when considering a batten for which one face is mild compression wood typical of that encountered in this study, and the other normal wood, the maximum bow over 2m is about 30 to 50mm and the maximum spring 18 to 25mm, depending on the values for longitudinal shrinkage used and the change in moisture content considered. This suggests that, generally, bow caused by compression wood will be greater than spring. This was confirmed by observations of the full scale battens studied.

Compression Wood Project – Final Report
BRE Client Report No. 218-309 Building Research Establishment Ltd 2004 Commercial in confidence
10
The results of the programme of small clear bending tests allow, for example, stiffness measured dynamically (Edyn) to be compared with MOE as measured during a static bending test (Figure 6, below)
MOEstat v Edyn
y = 1.3648xR2 = 0.7111
0
2000
4000
6000
8000
10000
12000
14000
16000
0 2000 4000 6000 8000 10000 12000
Edyn
MO
Esta
tic
Series1Linear (Series1)
Figure 6: Edyn v. MOE in static bending tests
Compression Wood Project – Final Report
BRE Client Report No. 218-309 Building Research Establishment Ltd 2004 Commercial in confidence
11
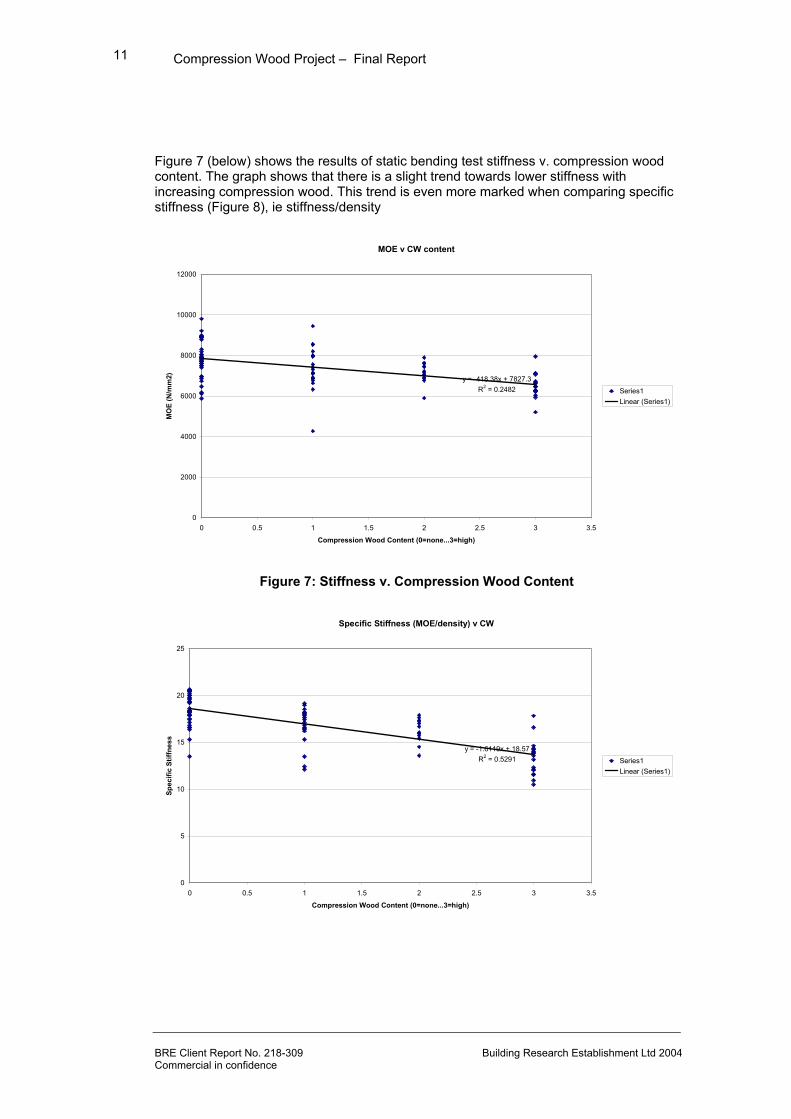
Figure 7 (below) shows the results of static bending test stiffness v. compression wood content. The graph shows that there is a slight trend towards lower stiffness with increasing compression wood. This trend is even more marked when comparing specific stiffness (Figure 8), ie stiffness/density
MOE v CW content
y = -418.38x + 7827.3R2 = 0.2482
0
2000
4000
6000
8000
10000
12000
0 0.5 1 1.5 2 2.5 3 3.5
Compression Wood Content (0=none...3=high)
MO
E (N
/mm
2)
Series1Linear (Series1)
Figure 7: Stiffness v. Compression Wood Content
Specific Stiffness (MOE/density) v CW
y = -1.6119x + 18.57R2 = 0.5291
0
5
10
15
20
25
0 0.5 1 1.5 2 2.5 3 3.5
Compression Wood Content (0=none...3=high)
Spec
ific
Stiff
ness
Series1Linear (Series1)

Compression Wood Project – Final Report
BRE Client Report No. 218-309 Building Research Establishment Ltd 2004 Commercial in confidence
12
Figure 8: Specific stiffness v. compression wood content The implications of the slightly lower stiffness of the compression wood (due most likely to the higher microfibril angle), on a volume by volume basis, is that compression wood per se will have no effect on machine grading which works by measuring stiffness (Eplank). This also suggests that compression wood will not be a significant variable in a model which might aim to predict machine grader output or Indicating Property (IP). In any case, the grade determining low mean IP is very often at some knot position. Table 1 (below) shows a comparison of the mean densities of the samples:
Table 1 Density
Compression Wood Content
Mean density at 18% m/c (kg/m3)
0 = none 1= slight 2= moderate 3= high
422 439 442 492
Whilst compression wood may have no effect on the output of the machine grader in terms of affecting Eplank or IP, there is an effect on timber grading in general because for any grade there are requirements for stiffness, strength and density. Density is important for connection design, particularly in bearing. Compression wood, although having no effect on stiffness, causes other problems for modelling, significant variables for which are density and rate of growth. Because compression wood is associated with eccentric growth about the pith - by definition the rate of growth is higher; whilst at the same time density increases markedly, yet there is no corresponding increase in stiffness. In this study, compression wood was found to have no influence on strength (MOR), although because of the increased density of compression wood, specific strength (ie MOR/density) tends to reduce with increasing compression wood. Microfribrillar angle measurements on selected samples of normal wood and compression wood indicate that there is a trend for decreasing stiffness with increasing microfribrillar angle, and confirmed the higher microfribrillar angle in compression wood compared with normal wood. This work will continue and be incorporated into future dissemination outputs.
Compression Wood Project – Final Report
BRE Client Report No. 218-309 Building Research Establishment Ltd 2004 Commercial in confidence
13
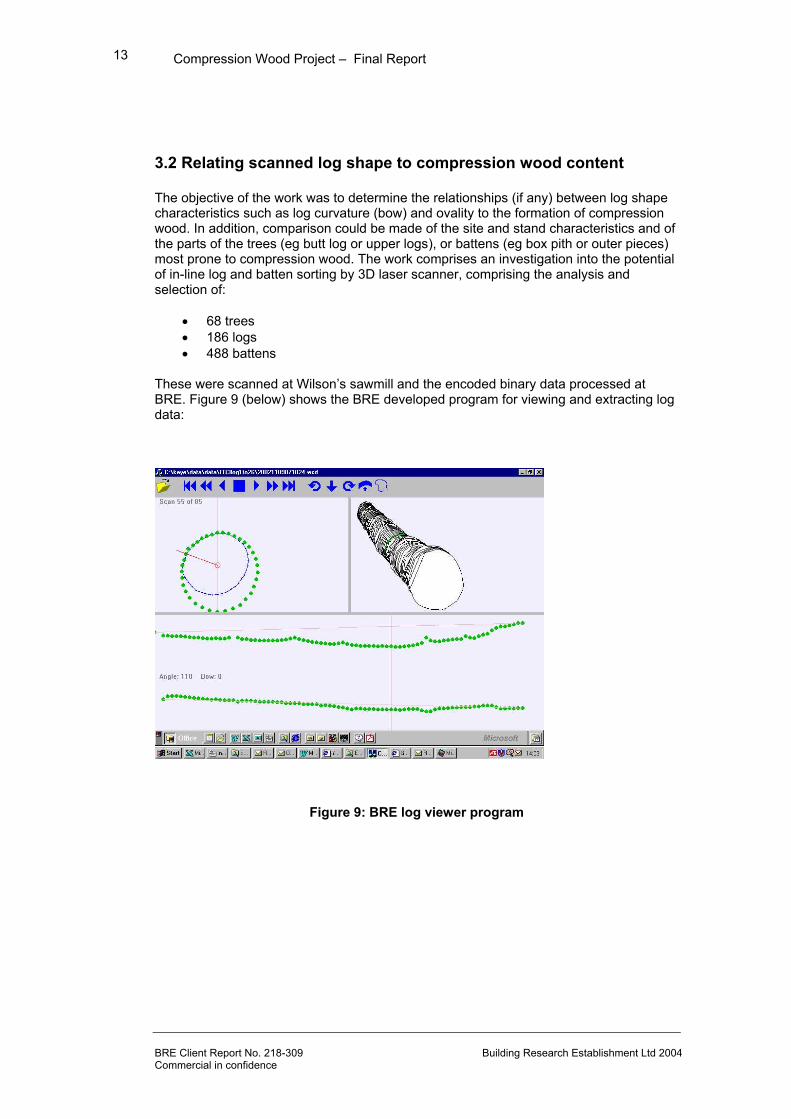
3.2 Relating scanned log shape to compression wood content The objective of the work was to determine the relationships (if any) between log shape characteristics such as log curvature (bow) and ovality to the formation of compression wood. In addition, comparison could be made of the site and stand characteristics and of the parts of the trees (eg butt log or upper logs), or battens (eg box pith or outer pieces) most prone to compression wood. The work comprises an investigation into the potential of in-line log and batten sorting by 3D laser scanner, comprising the analysis and selection of:
• 68 trees • 186 logs • 488 battens
These were scanned at Wilson’s sawmill and the encoded binary data processed at BRE. Figure 9 (below) shows the BRE developed program for viewing and extracting log data:
Figure 9: BRE log viewer program
Compression Wood Project – Final Report
BRE Client Report No. 218-309 Building Research Establishment Ltd 2004 Commercial in confidence
14
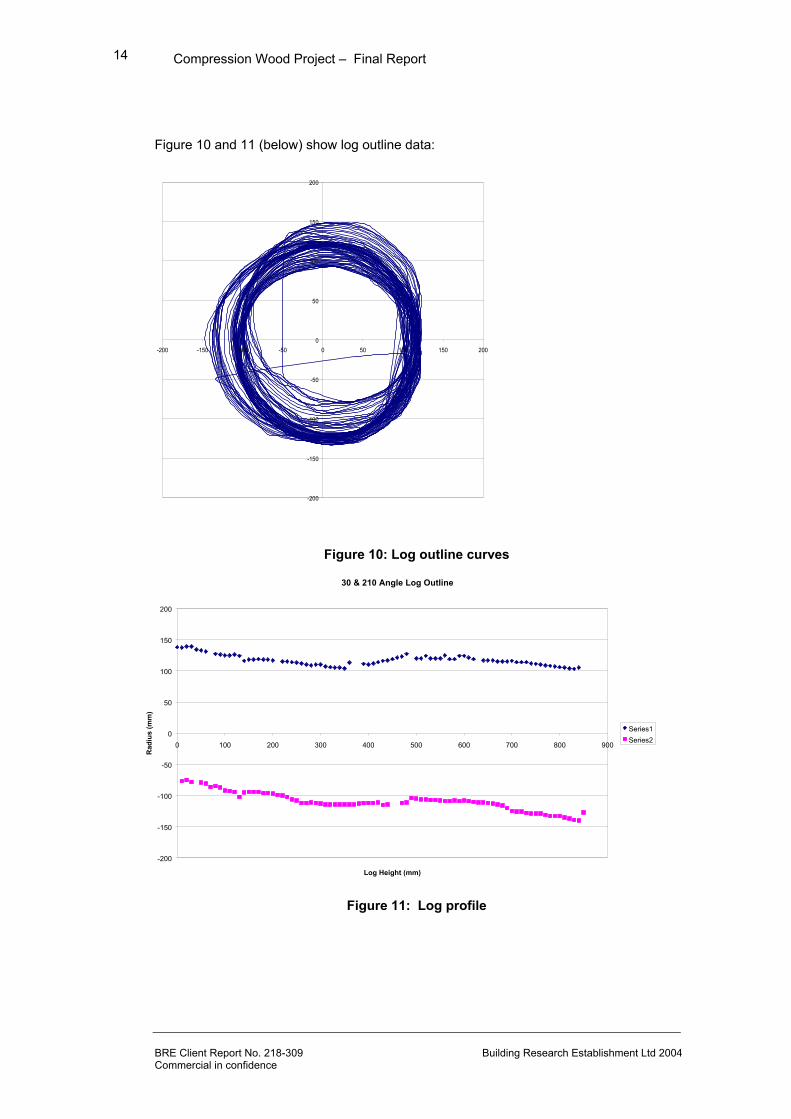
Figure 10 and 11 (below) show log outline data:
Figure 10: Log outline curves
Figure 11: Log profile
-200
-150
-100
-50
0
50
100
150
200
-200 -150 -100 -50 0 50 100 150 200
30 & 210 Angle Log Outline
-200
-150
-100
-50
0
50
100
150
200
0 100 200 300 400 500 600 700 800 900
Log Height (mm)
Rad
ius
(mm
)
Series1Series2
Compression Wood Project – Final Report
BRE Client Report No. 218-309 Building Research Establishment Ltd 2004 Commercial in confidence
15
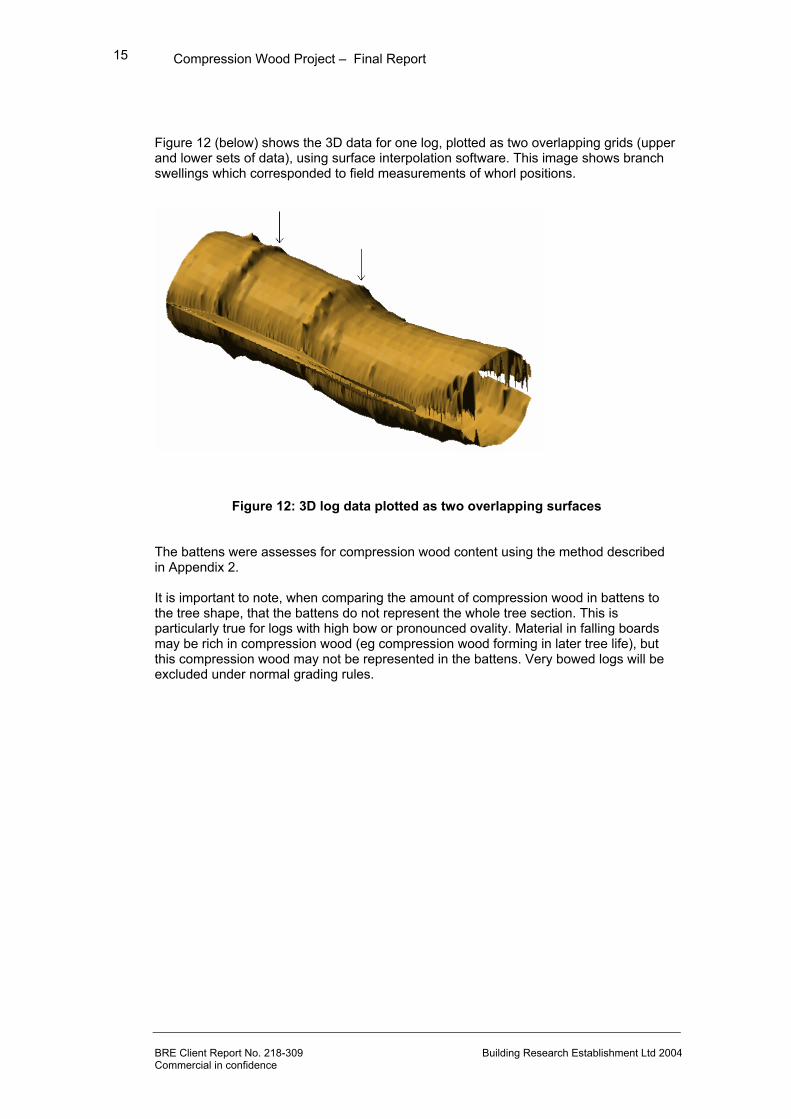
Figure 12 (below) shows the 3D data for one log, plotted as two overlapping grids (upper and lower sets of data), using surface interpolation software. This image shows branch swellings which corresponded to field measurements of whorl positions.
Figure 12: 3D log data plotted as two overlapping surfaces The battens were assesses for compression wood content using the method described in Appendix 2. It is important to note, when comparing the amount of compression wood in battens to the tree shape, that the battens do not represent the whole tree section. This is particularly true for logs with high bow or pronounced ovality. Material in falling boards may be rich in compression wood (eg compression wood forming in later tree life), but this compression wood may not be represented in the battens. Very bowed logs will be excluded under normal grading rules.
Compression Wood Project – Final Report
BRE Client Report No. 218-309 Building Research Establishment Ltd 2004 Commercial in confidence
16
Table 2 (below) gives the format of the log codes:
Table 2 Log Code
Stand Tree Number
Height of log (m)
Example FR1 44 3.87 The following details a compression wood summary for a number of notable logs and battens:
• FR2 – 44 – 3.87: curved log, lots of compression wood at curve, 2 out of 4 battens from the log badly bowed.
• FR2 – 127- 0.5: log with large butt sweep, no compression wood, 2 out of 3 battens twisted
• FR2 – 79 – 0.51: log with large butt sweep, no compression wood, one batten very twisted, the other ok.
• FR2 – 210 -0.45: straight log, compression wood on edge of battens, 3 out of 4 battens sprung, 1 also bowed.
• FR2 – 44 – 7.09: straight, lots of compression wood, all battens bowed and sprung
• FR2 – 133 – 6.7: straight log with curved base, compression wood is at other end, both battens twisted.
• FR1 - 9 - 6.96 / 0.58 / 3.78: tree with the most compression wood of all, straight tree, slight butt sweep.
• FR1 – 70 – 6.8: curved log, high compression wood content • FR1 – 133 – 3.52: straight but flat profile (max dia/min dia. = 1.14), high
compression wood content • FR4-554-0.55: straight, round but high compression wood • FR4-558-3.54: pronounced bow, but low value, high compression wood content. • FR4-238-0.7: high consistent bow, low compression wood • FR4 – 554 -0.55: butt log with slight sweep otherwise straight and round,
yielded 1 batten with highest compression wood content of all. • FR3-148-7.01: upper log, straight and round, yielded 1 batten with second
highest compression wood of all • Of the battens which had the top 18 compression wood content: only 3 came
from butt logs, whilst 5 came from middle logs and 10 came from top logs. • Around half of the battens assessed had nil or very little visible compression
wood on the surface
Compression Wood Project – Final Report
BRE Client Report No. 218-309 Building Research Establishment Ltd 2004 Commercial in confidence
17
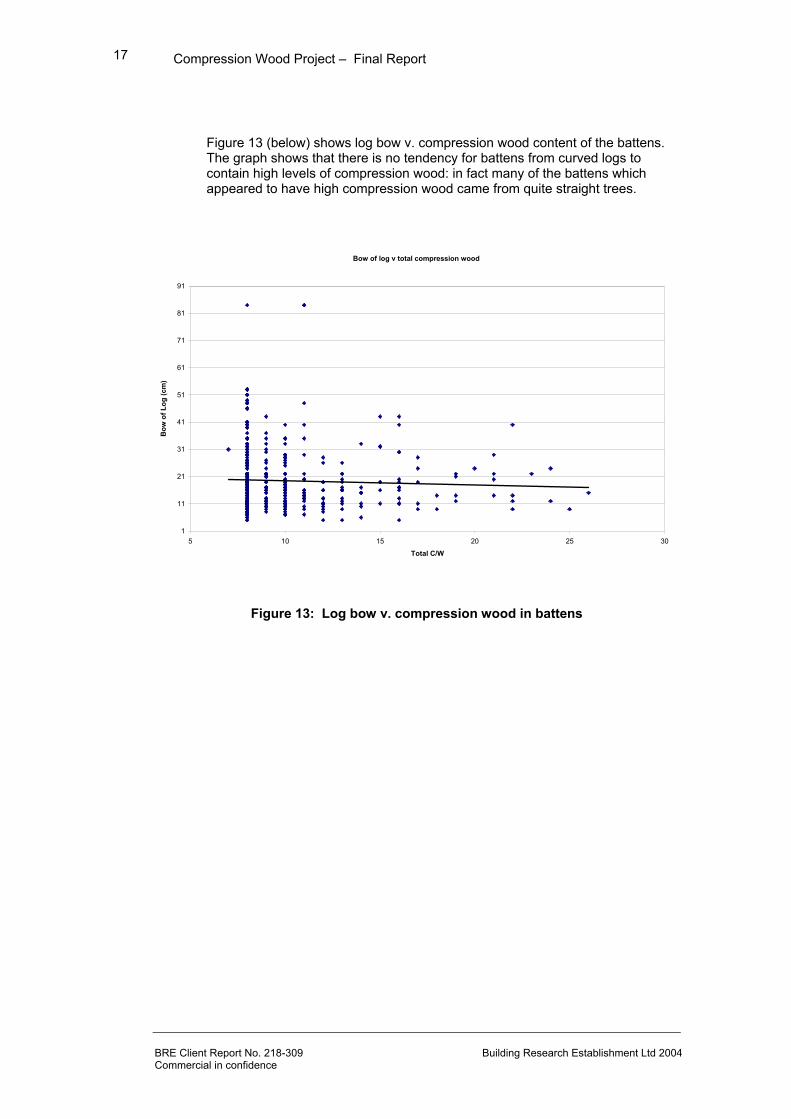
Figure 13 (below) shows log bow v. compression wood content of the battens. The graph shows that there is no tendency for battens from curved logs to contain high levels of compression wood: in fact many of the battens which appeared to have high compression wood came from quite straight trees.
Bow of log v total compression wood
1
11
21
31
41
51
61
71
81
91
5 10 15 20 25 30
Total C/W
Bow
of L
og (c
m)
Figure 13: Log bow v. compression wood in battens
Compression Wood Project – Final Report
BRE Client Report No. 218-309 Building Research Establishment Ltd 2004 Commercial in confidence
18
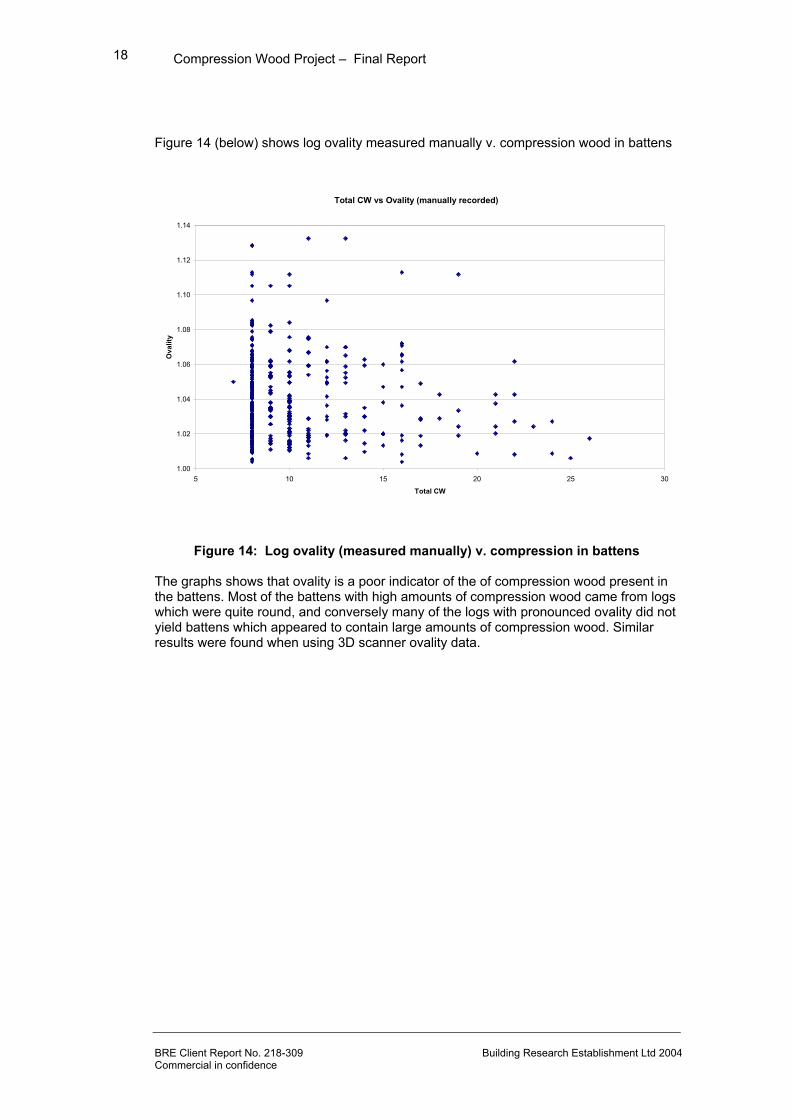
Figure 14 (below) shows log ovality measured manually v. compression wood in battens
Total CW vs Ovality (manually recorded)
1.00
1.02
1.04
1.06
1.08
1.10
1.12
1.14
5 10 15 20 25 30
Total CW
Ova
lity
Figure 14: Log ovality (measured manually) v. compression in battens The graphs shows that ovality is a poor indicator of the of compression wood present in the battens. Most of the battens with high amounts of compression wood came from logs which were quite round, and conversely many of the logs with pronounced ovality did not yield battens which appeared to contain large amounts of compression wood. Similar results were found when using 3D scanner ovality data.

Compression Wood Project – Final Report
BRE Client Report No. 218-309 Building Research Establishment Ltd 2004 Commercial in confidence
19
Aside from finding that straight, round logs can contain large amounts of compression wood; there are a number of practical problems when using 3D log scanner data for in- line sorting:
• The true axis of the log is not determined, i.e. it is not possible to tell which part of a crooked log was originally vertical, and which was originally off-vertical.
• Site information such as degree of lean is, of course, absent
• A tree might be crooked or have a large butt sweep, but the information is
separated from one log to another.
• Large butt sweeps will be left in the forest.
• The tree may be cut up so that the compression wood is in one log and the bend or kink is in the other.
• Lots of compression wood appears to form in the later part of the tree life,
effectively wrapping a straight log.
• Later growth is at a slower rate, so it may not affect log shape
• Some battens distort, whilst others from the same log do not
• Straight logs with compression wood are more likely to produce battens which bow and spring because of the consistent gross difference of compression wood content between one side of the batten and another.
• Bow measurements need to take into account rate of curvature and spurious
features such as branch swelling – which is difficult for in line sorting
• Logs may have compression wood, but this may not end up in the battens, eg butt sweep can be outside of the common area
• Butts can be reduced prior to scanning, losing shape data
• Compression wood could be in later growth and ends up in the falling boards
• A tree growing at an angle can either straighten up, or it can continue at an
angle whilst growing compression wood
Compression Wood Project – Final Report
BRE Client Report No. 218-309 Building Research Establishment Ltd 2004 Commercial in confidence
20
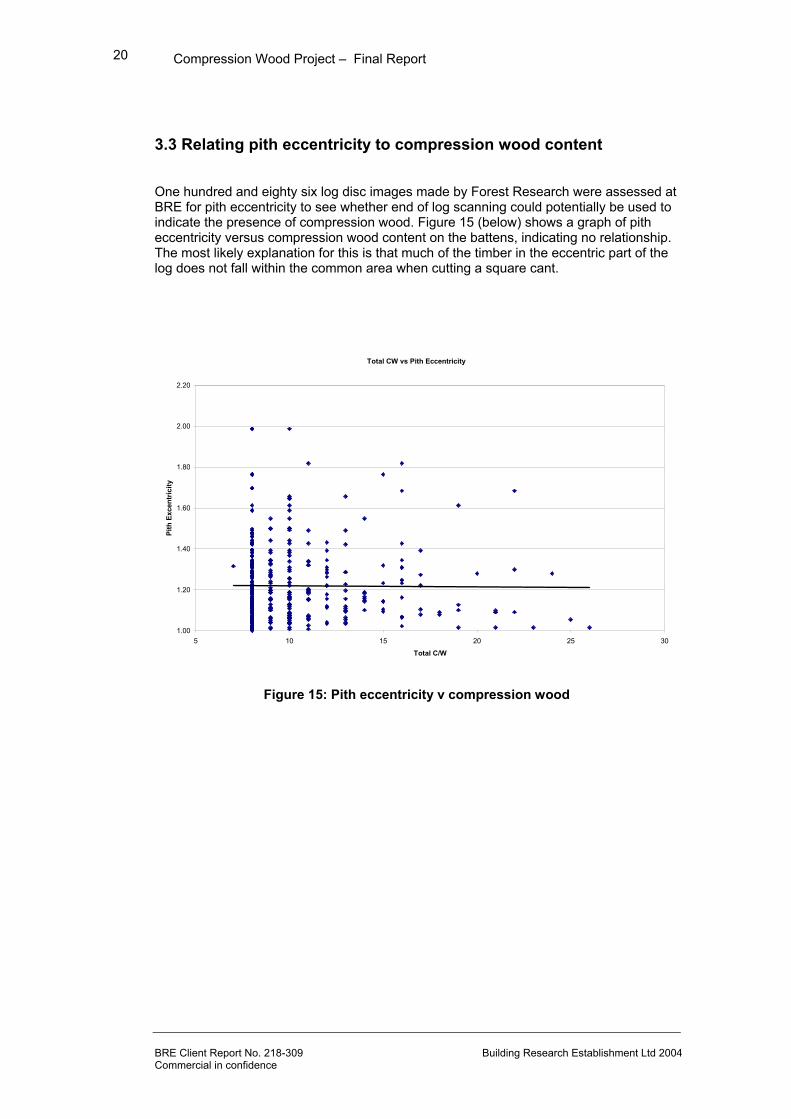
3.3 Relating pith eccentricity to compression wood content One hundred and eighty six log disc images made by Forest Research were assessed at BRE for pith eccentricity to see whether end of log scanning could potentially be used to indicate the presence of compression wood. Figure 15 (below) shows a graph of pith eccentricity versus compression wood content on the battens, indicating no relationship. The most likely explanation for this is that much of the timber in the eccentric part of the log does not fall within the common area when cutting a square cant.
Total CW vs Pith Eccentricity
1.00
1.20
1.40
1.60
1.80
2.00
2.20
5 10 15 20 25 30
Total C/W
Pith
Exc
entr
icity
Figure 15: Pith eccentricity v compression wood
Compression Wood Project – Final Report
BRE Client Report No. 218-309 Building Research Establishment Ltd 2004 Commercial in confidence
21
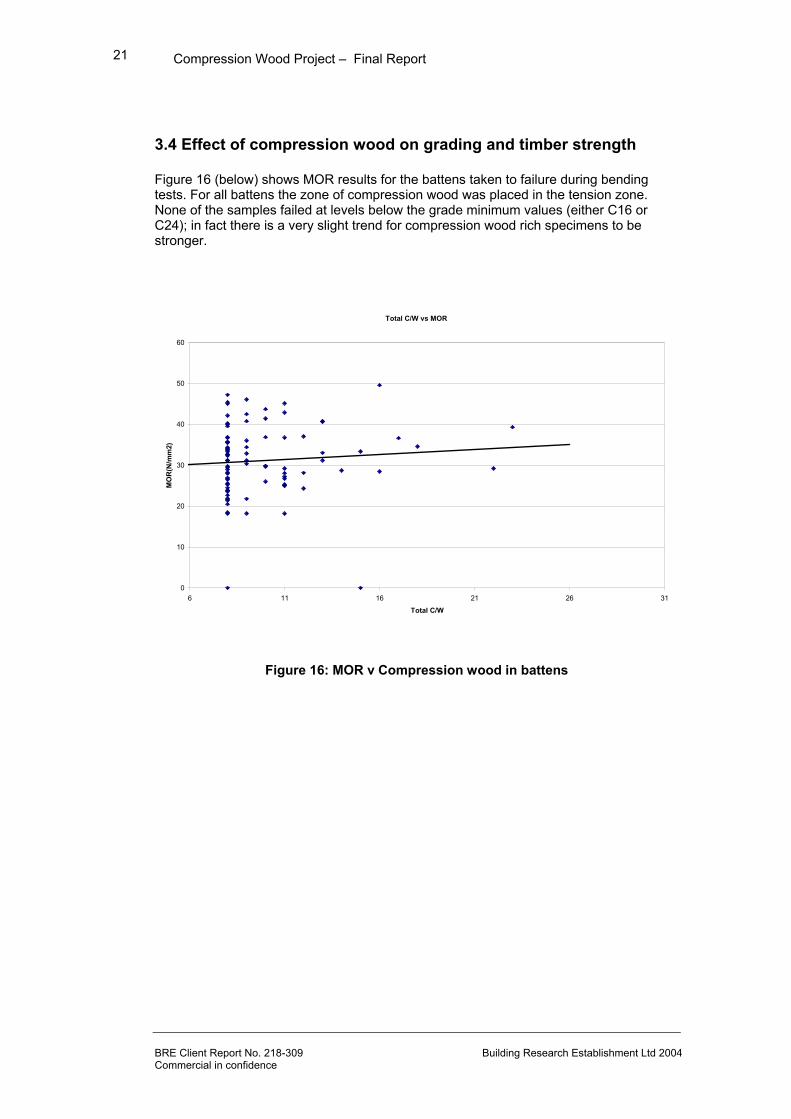
3.4 Effect of compression wood on grading and timber strength Figure 16 (below) shows MOR results for the battens taken to failure during bending tests. For all battens the zone of compression wood was placed in the tension zone. None of the samples failed at levels below the grade minimum values (either C16 or C24); in fact there is a very slight trend for compression wood rich specimens to be stronger.
Total C/W vs MOR
0
10
20
30
40
50
60
6 11 16 21 26 31
Total C/W
MO
R(N
/mm
2)
Figure 16: MOR v Compression wood in battens
Compression Wood Project – Final Report
BRE Client Report No. 218-309 Building Research Establishment Ltd 2004 Commercial in confidence
22
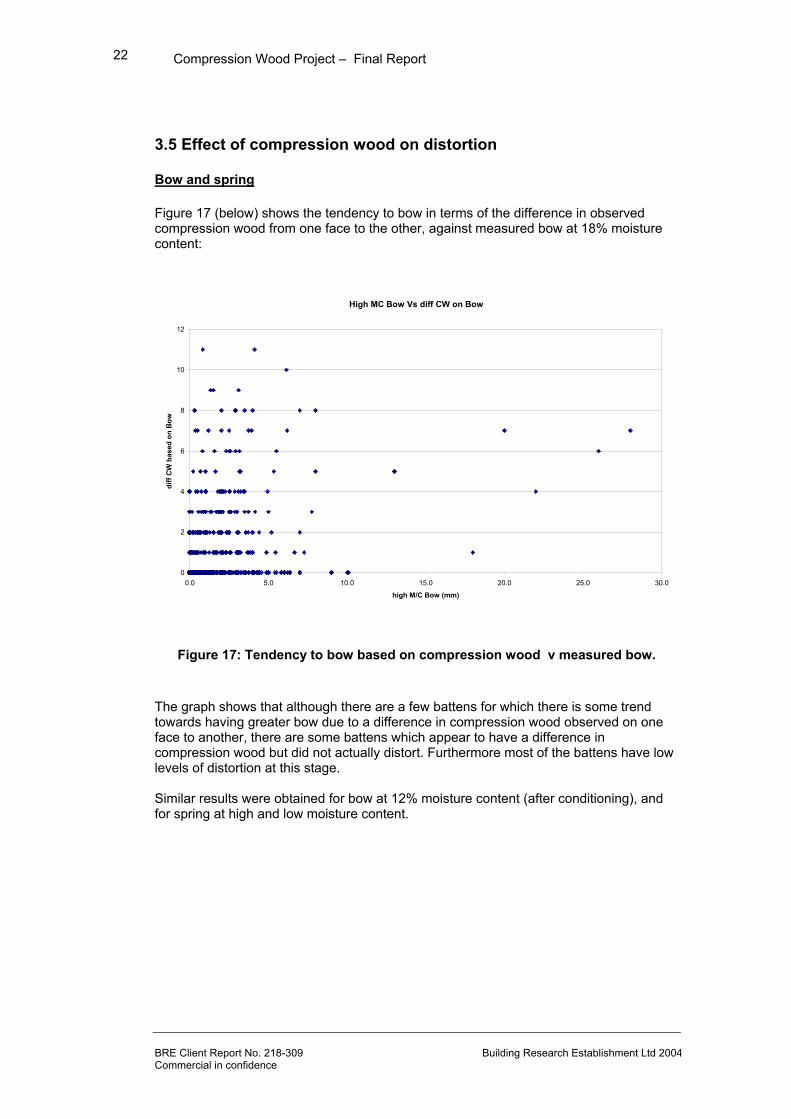
3.5 Effect of compression wood on distortion Bow and spring Figure 17 (below) shows the tendency to bow in terms of the difference in observed compression wood from one face to the other, against measured bow at 18% moisture content:
High MC Bow Vs diff CW on Bow
0
2
4
6
8
10
12
0.0 5.0 10.0 15.0 20.0 25.0 30.0
high M/C Bow (mm)
diff
CW
bas
ed o
n B
ow
Figure 17: Tendency to bow based on compression wood v measured bow. The graph shows that although there are a few battens for which there is some trend towards having greater bow due to a difference in compression wood observed on one face to another, there are some battens which appear to have a difference in compression wood but did not actually distort. Furthermore most of the battens have low levels of distortion at this stage. Similar results were obtained for bow at 12% moisture content (after conditioning), and for spring at high and low moisture content.
Compression Wood Project – Final Report
BRE Client Report No. 218-309 Building Research Establishment Ltd 2004 Commercial in confidence
23
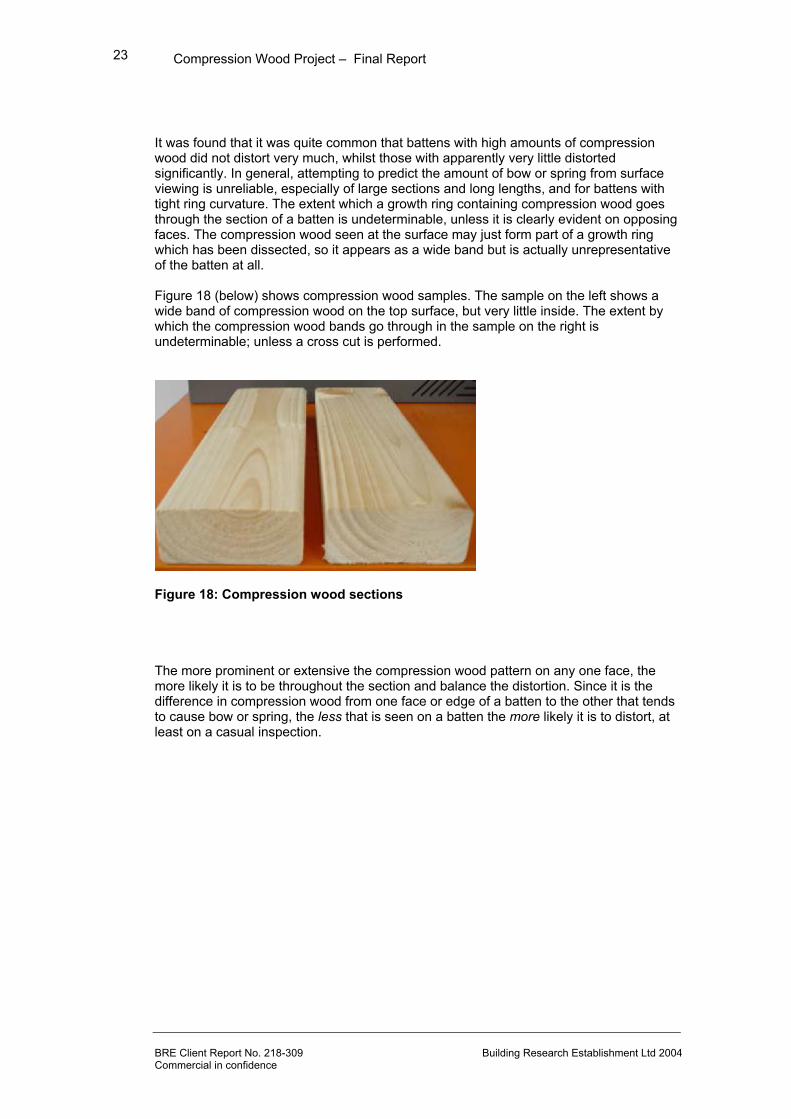
It was found that it was quite common that battens with high amounts of compression wood did not distort very much, whilst those with apparently very little distorted significantly. In general, attempting to predict the amount of bow or spring from surface viewing is unreliable, especially of large sections and long lengths, and for battens with tight ring curvature. The extent which a growth ring containing compression wood goes through the section of a batten is undeterminable, unless it is clearly evident on opposing faces. The compression wood seen at the surface may just form part of a growth ring which has been dissected, so it appears as a wide band but is actually unrepresentative of the batten at all. Figure 18 (below) shows compression wood samples. The sample on the left shows a wide band of compression wood on the top surface, but very little inside. The extent by which the compression wood bands go through in the sample on the right is undeterminable; unless a cross cut is performed.
Figure 18: Compression wood sections The more prominent or extensive the compression wood pattern on any one face, the more likely it is to be throughout the section and balance the distortion. Since it is the difference in compression wood from one face or edge of a batten to the other that tends to cause bow or spring, the less that is seen on a batten the more likely it is to distort, at least on a casual inspection.

Compression Wood Project – Final Report
BRE Client Report No. 218-309 Building Research Establishment Ltd 2004 Commercial in confidence
24
The complex algorithms necessary to predict the underlying extent of compression wood from viewing the surface features of all four faces do not exist and are unlikely to work for the following reasons:
• You need to know the pith position, and the batten may have wavy pith or be from a curved log.
• The pith position cannot be determined without using an end of batten scanner- at both ends
• For long battens the compression wood pattern may is likely to be non linear along the sample, with the compression wood in patches
• The rate of growth varies with the age of the tree • The pith may be eccentric • Grain is wild around knots (Figure 19,below) • Compression wood also forms below branches • The grain may be spiral • The battens may be cut off axis with the log, and the true axis is not known.
Figure 19: Compression wood in wild grain around knots
Compression Wood Project – Final Report
BRE Client Report No. 218-309 Building Research Establishment Ltd 2004 Commercial in confidence
25
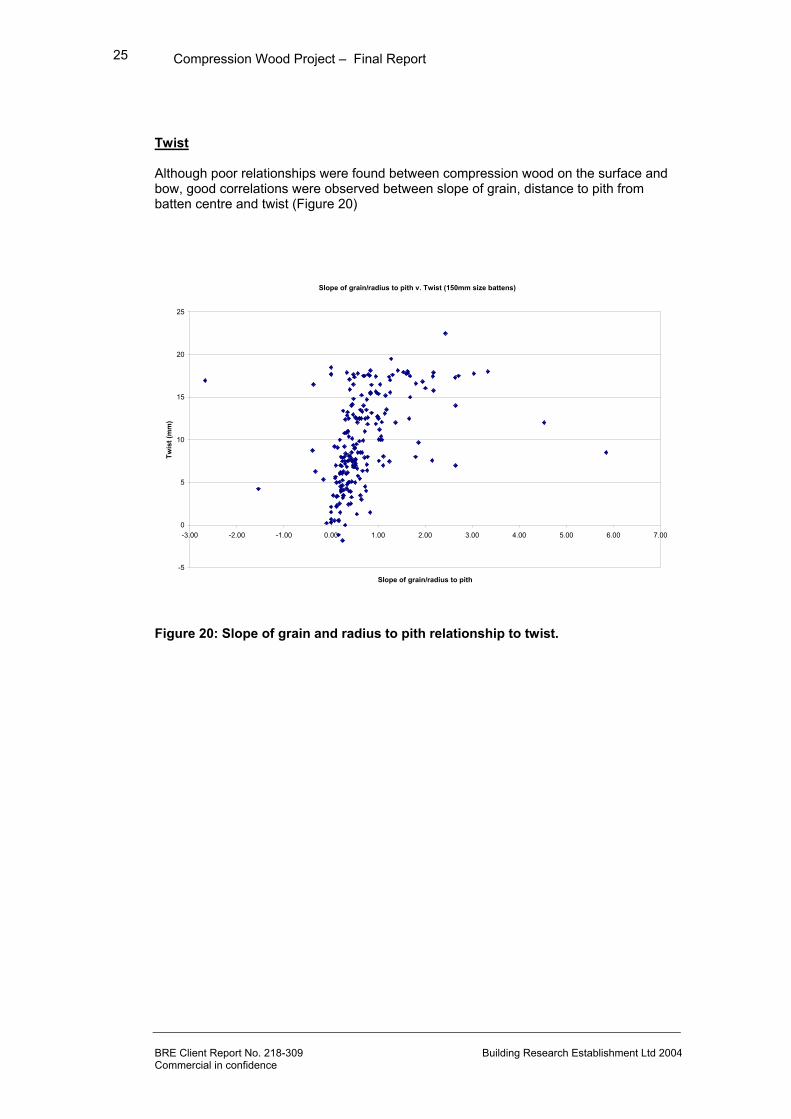
Twist Although poor relationships were found between compression wood on the surface and bow, good correlations were observed between slope of grain, distance to pith from batten centre and twist (Figure 20)
Slope of grain/radius to pith v. Twist (150mm size battens)
-5
0
5
10
15
20
25
-3.00 -2.00 -1.00 0.00 1.00 2.00 3.00 4.00 5.00 6.00 7.00
Slope of grain/radius to pith
Twis
t (m
m)
Figure 20: Slope of grain and radius to pith relationship to twist.
Compression Wood Project – Final Report
BRE Client Report No. 218-309 Building Research Establishment Ltd 2004 Commercial in confidence
26
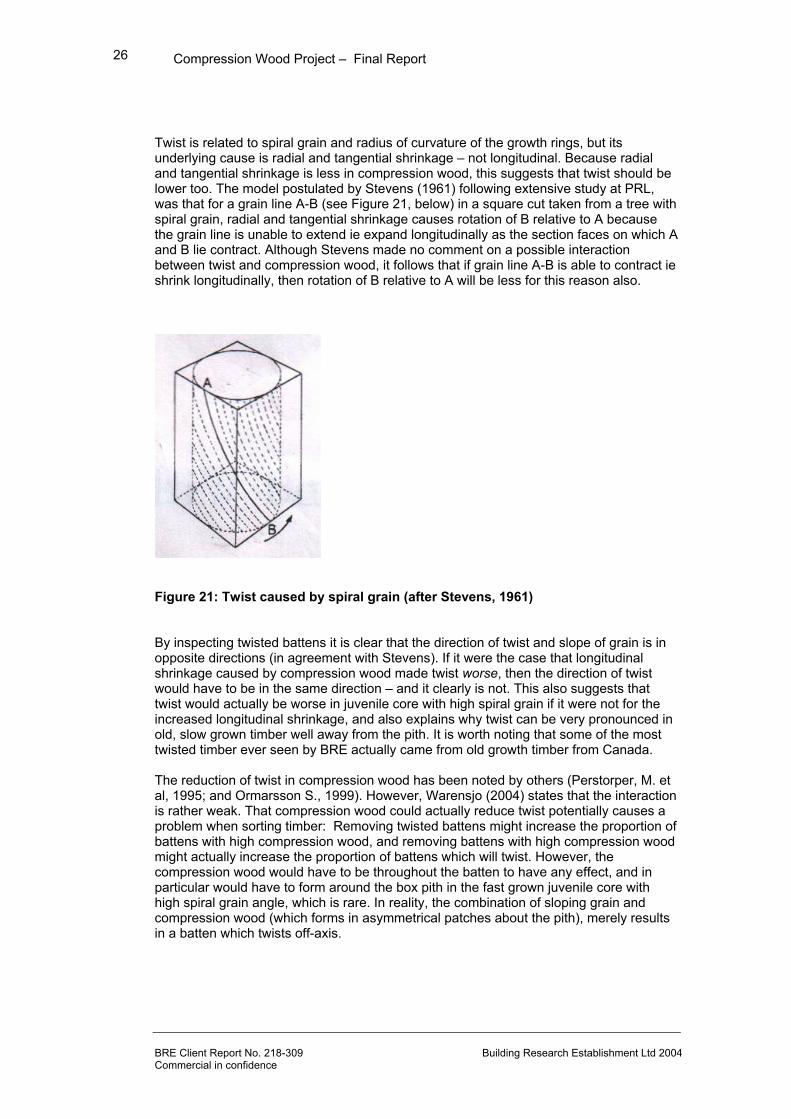
Twist is related to spiral grain and radius of curvature of the growth rings, but its underlying cause is radial and tangential shrinkage – not longitudinal. Because radial and tangential shrinkage is less in compression wood, this suggests that twist should be lower too. The model postulated by Stevens (1961) following extensive study at PRL, was that for a grain line A-B (see Figure 21, below) in a square cut taken from a tree with spiral grain, radial and tangential shrinkage causes rotation of B relative to A because the grain line is unable to extend ie expand longitudinally as the section faces on which A and B lie contract. Although Stevens made no comment on a possible interaction between twist and compression wood, it follows that if grain line A-B is able to contract ie shrink longitudinally, then rotation of B relative to A will be less for this reason also.
Figure 21: Twist caused by spiral grain (after Stevens, 1961) By inspecting twisted battens it is clear that the direction of twist and slope of grain is in opposite directions (in agreement with Stevens). If it were the case that longitudinal shrinkage caused by compression wood made twist worse, then the direction of twist would have to be in the same direction – and it clearly is not. This also suggests that twist would actually be worse in juvenile core with high spiral grain if it were not for the increased longitudinal shrinkage, and also explains why twist can be very pronounced in old, slow grown timber well away from the pith. It is worth noting that some of the most twisted timber ever seen by BRE actually came from old growth timber from Canada. The reduction of twist in compression wood has been noted by others (Perstorper, M. et al, 1995; and Ormarsson S., 1999). However, Warensjo (2004) states that the interaction is rather weak. That compression wood could actually reduce twist potentially causes a problem when sorting timber: Removing twisted battens might increase the proportion of battens with high compression wood, and removing battens with high compression wood might actually increase the proportion of battens which will twist. However, the compression wood would have to be throughout the batten to have any effect, and in particular would have to form around the box pith in the fast grown juvenile core with high spiral grain angle, which is rare. In reality, the combination of sloping grain and compression wood (which forms in asymmetrical patches about the pith), merely results in a batten which twists off-axis.
Compression Wood Project – Final Report
BRE Client Report No. 218-309 Building Research Establishment Ltd 2004 Commercial in confidence
27
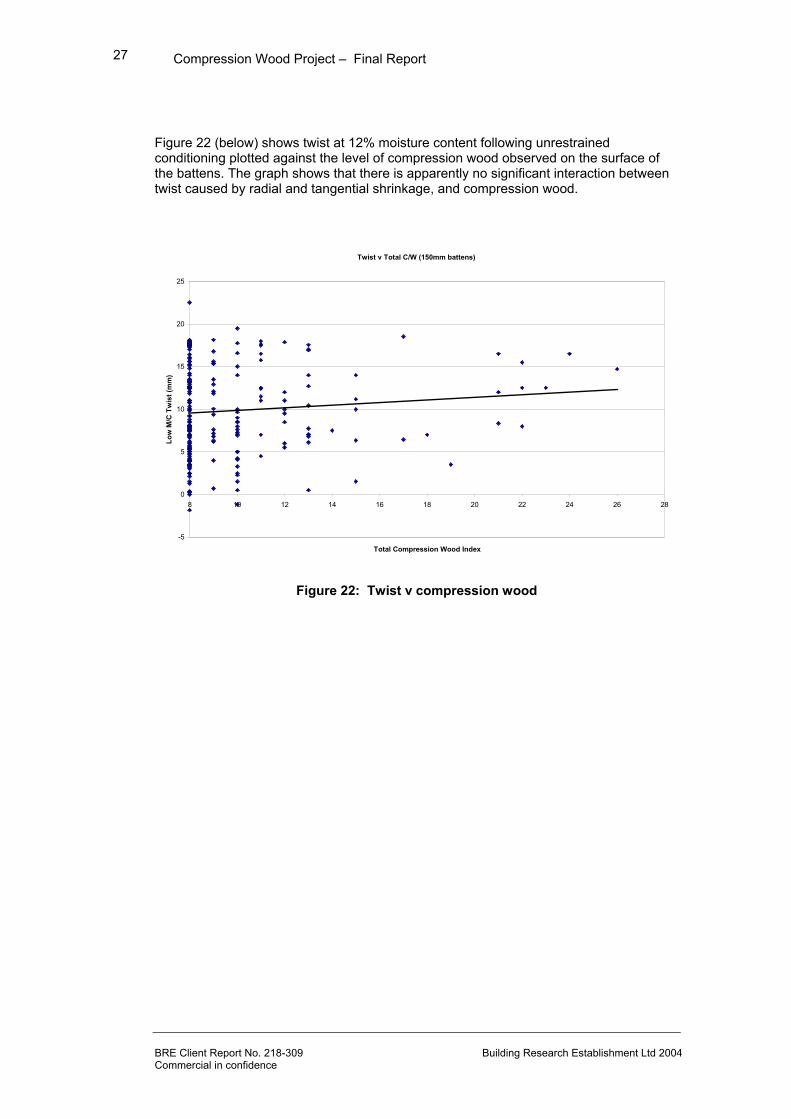
Figure 22 (below) shows twist at 12% moisture content following unrestrained conditioning plotted against the level of compression wood observed on the surface of the battens. The graph shows that there is apparently no significant interaction between twist caused by radial and tangential shrinkage, and compression wood.
Twist v Total C/W (150mm battens)
-5
0
5
10
15
20
25
8 10 12 14 16 18 20 22 24 26 28
Total Compression Wood Index
Low
M/C
Tw
ist (
mm
)
Figure 22: Twist v compression wood
Compression Wood Project – Final Report
BRE Client Report No. 218-309 Building Research Establishment Ltd 2004 Commercial in confidence
28
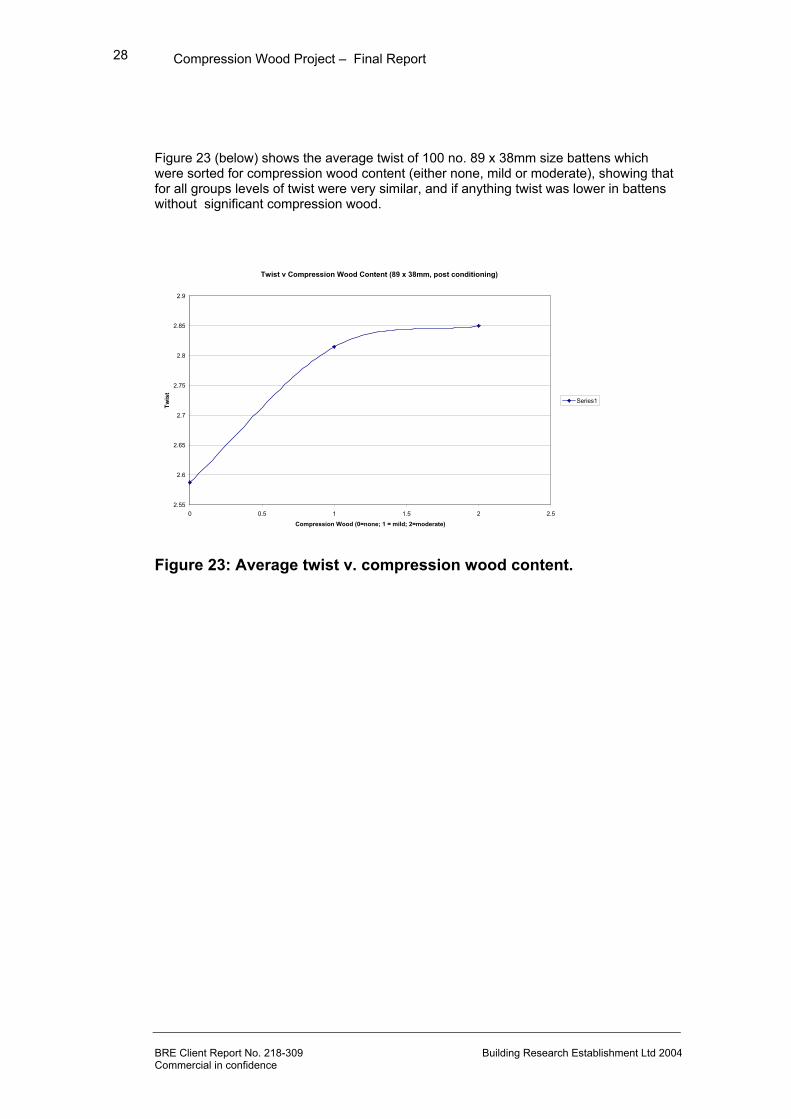
Figure 23 (below) shows the average twist of 100 no. 89 x 38mm size battens which were sorted for compression wood content (either none, mild or moderate), showing that for all groups levels of twist were very similar, and if anything twist was lower in battens without significant compression wood.
Twist v Compression Wood Content (89 x 38mm, post conditioning)
2.55
2.6
2.65
2.7
2.75
2.8
2.85
2.9
0 0.5 1 1.5 2 2.5
Compression Wood (0=none; 1 = mild; 2=moderate)
Twis
t
Series1
Figure 23: Average twist v. compression wood content.
Compression Wood Project – Final Report
BRE Client Report No. 218-309 Building Research Establishment Ltd 2004 Commercial in confidence
29
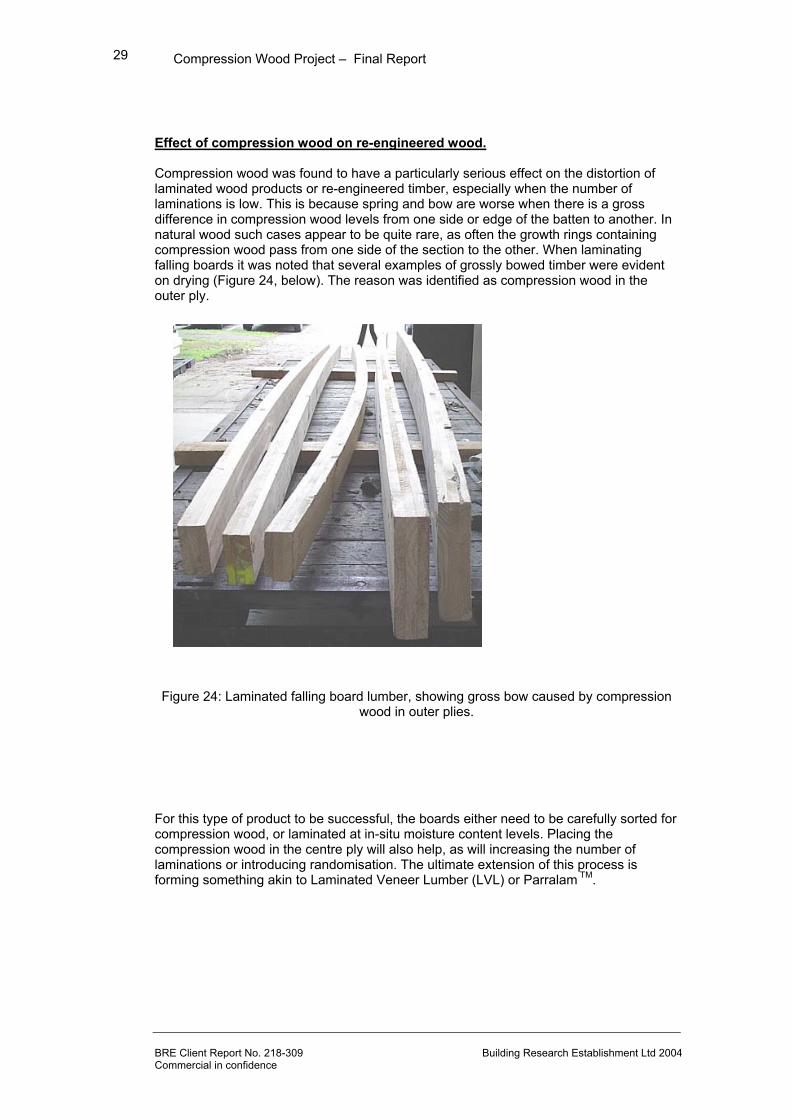
Effect of compression wood on re-engineered wood. Compression wood was found to have a particularly serious effect on the distortion of laminated wood products or re-engineered timber, especially when the number of laminations is low. This is because spring and bow are worse when there is a gross difference in compression wood levels from one side or edge of the batten to another. In natural wood such cases appear to be quite rare, as often the growth rings containing compression wood pass from one side of the section to the other. When laminating falling boards it was noted that several examples of grossly bowed timber were evident on drying (Figure 24, below). The reason was identified as compression wood in the outer ply. Figure 24: Laminated falling board lumber, showing gross bow caused by compression
wood in outer plies.
For this type of product to be successful, the boards either need to be carefully sorted for compression wood, or laminated at in-situ moisture content levels. Placing the compression wood in the centre ply will also help, as will increasing the number of laminations or introducing randomisation. The ultimate extension of this process is forming something akin to Laminated Veneer Lumber (LVL) or Parralam TM.
Compression Wood Project – Final Report
BRE Client Report No. 218-309 Building Research Establishment Ltd 2004 Commercial in confidence
30
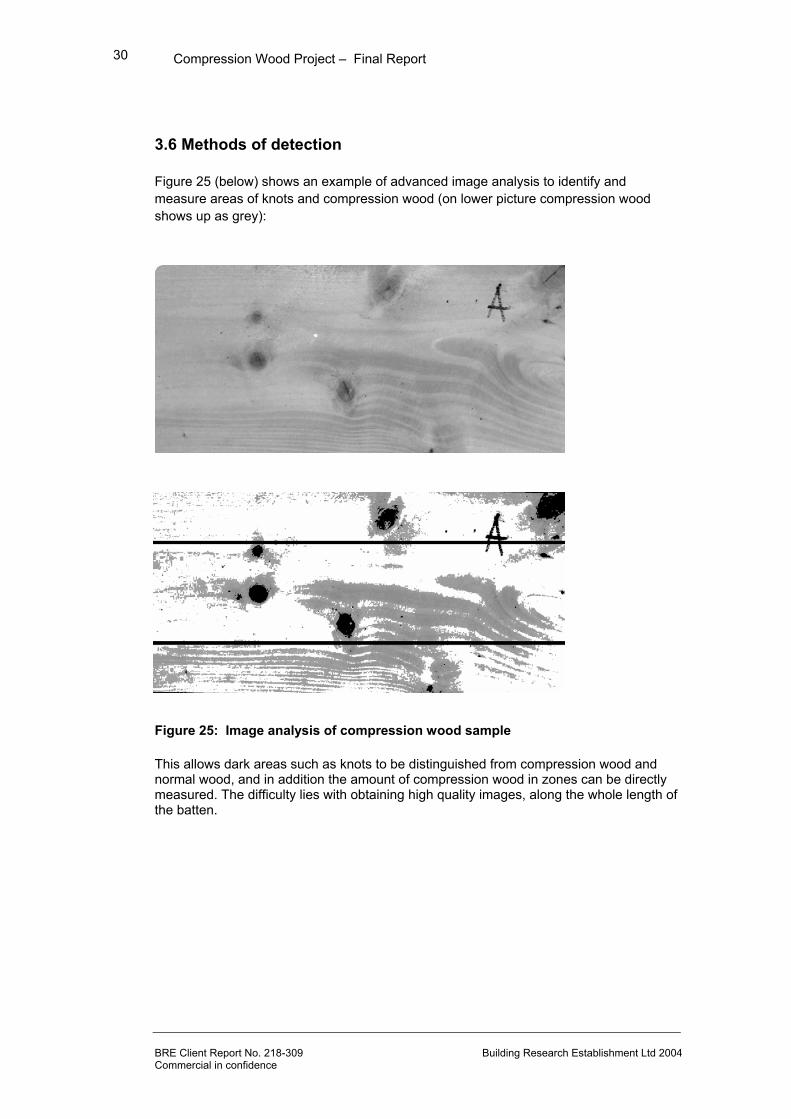
3.6 Methods of detection Figure 25 (below) shows an example of advanced image analysis to identify and measure areas of knots and compression wood (on lower picture compression wood shows up as grey):
Figure 25: Image analysis of compression wood sample This allows dark areas such as knots to be distinguished from compression wood and normal wood, and in addition the amount of compression wood in zones can be directly measured. The difficulty lies with obtaining high quality images, along the whole length of the batten.
Compression Wood Project – Final Report
BRE Client Report No. 218-309 Building Research Establishment Ltd 2004 Commercial in confidence
31
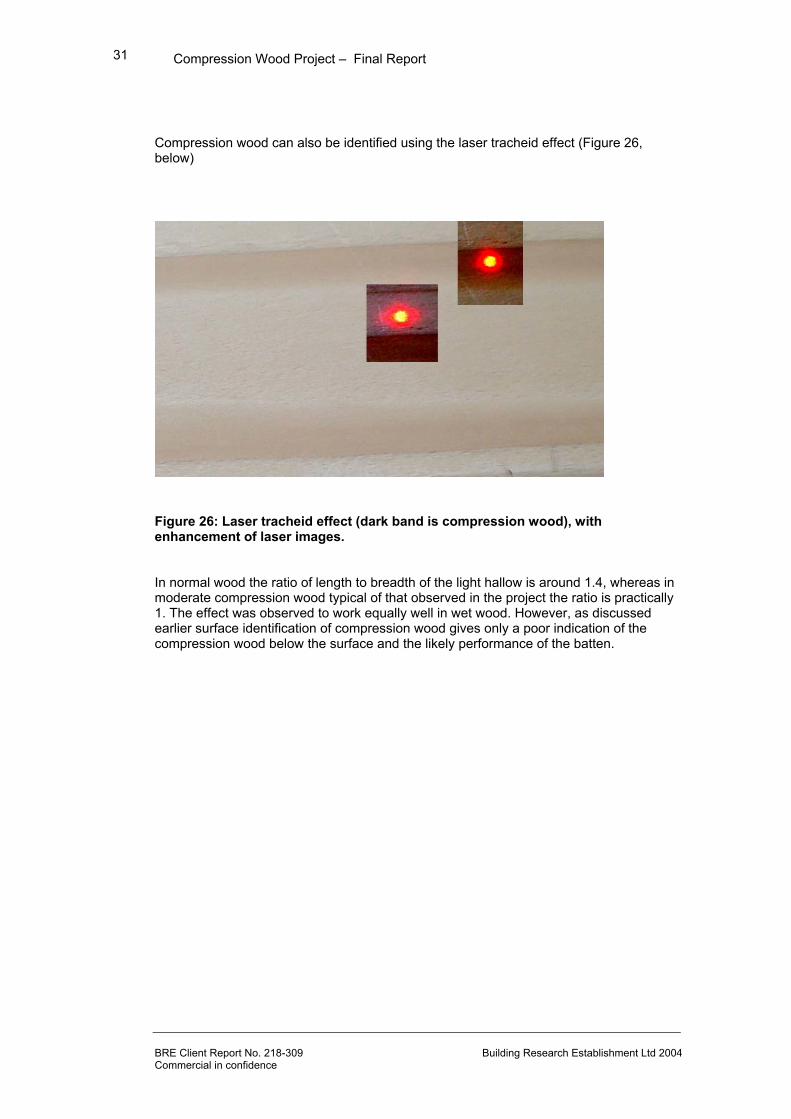
Compression wood can also be identified using the laser tracheid effect (Figure 26, below)
Figure 26: Laser tracheid effect (dark band is compression wood), with enhancement of laser images. In normal wood the ratio of length to breadth of the light hallow is around 1.4, whereas in moderate compression wood typical of that observed in the project the ratio is practically 1. The effect was observed to work equally well in wet wood. However, as discussed earlier surface identification of compression wood gives only a poor indication of the compression wood below the surface and the likely performance of the batten.
Compression Wood Project – Final Report
BRE Client Report No. 218-309 Building Research Establishment Ltd 2004 Commercial in confidence
32
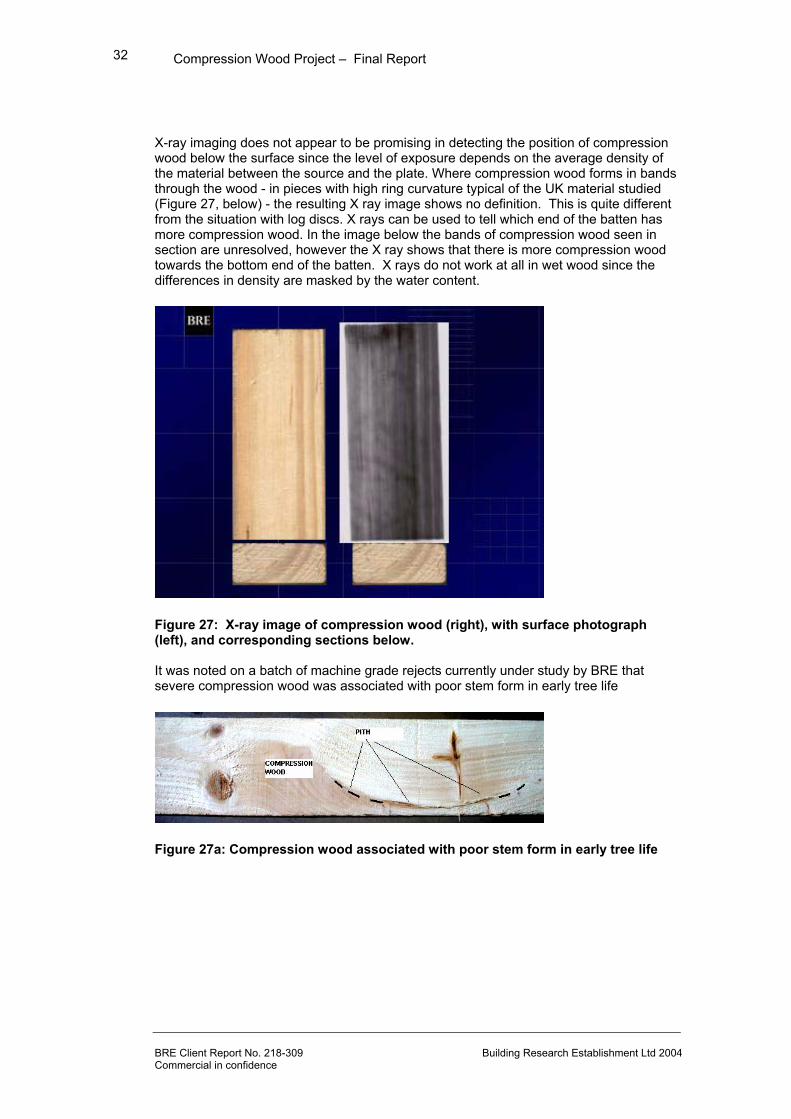
X-ray imaging does not appear to be promising in detecting the position of compression wood below the surface since the level of exposure depends on the average density of the material between the source and the plate. Where compression wood forms in bands through the wood - in pieces with high ring curvature typical of the UK material studied (Figure 27, below) - the resulting X ray image shows no definition. This is quite different from the situation with log discs. X rays can be used to tell which end of the batten has more compression wood. In the image below the bands of compression wood seen in section are unresolved, however the X ray shows that there is more compression wood towards the bottom end of the batten. X rays do not work at all in wet wood since the differences in density are masked by the water content.
Figure 27: X-ray image of compression wood (right), with surface photograph (left), and corresponding sections below. It was noted on a batch of machine grade rejects currently under study by BRE that severe compression wood was associated with poor stem form in early tree life
Figure 27a: Compression wood associated with poor stem form in early tree life

Compression Wood Project – Final Report
BRE Client Report No. 218-309 Building Research Establishment Ltd 2004 Commercial in confidence
33
4. Preliminary recommendations for compression wood No relationship was indicated between log shape and compression wood content in battens, either for log bow, ovality or pith eccentricity. However, it appears likely from other observations that where ovality is greater than 1.2 there is quite likely to be compression wood in the log – although this may not be represented in the batten faces. Logs with pith eccentricity greater than 1.5 appear likely to have significant compression wood content, although this needs to be confirmed from other project partners working on discs. The highest level of compression wood observed came from straight logs, and when it occurs in this form it is likely to feature all along the length of one batten edge leading to significant bow or spring. Logs with high ovality or pith eccentricity are more likely to produce timber which is unacceptable for cutting into joists destined to be “super dried” or regularized at in situ moisture content levels, and where lamination of timber such as falling boards occurs. Sawn timber with over 25% compression wood on any one face or edge is at risk from significant bow or spring. Patches smaller than 25% of the board face can probably be ignored, especially if they are random and spread out along the board. Boards which either have compression wood or an identified tendency for twist (eg box pith pieces) should be kiln dried with top loading or placed at the bottom of the stack allowing self weighting. However, it is quite possible to find battens which have bowed or sprung considerably and yet little edge of board compression wood is actually visible; conversely some battens with high levels of compression wood remain balanced and stable. Large section sizes such as 200mm x 47mm with an apparent imbalance of compression wood, in particular when comparing from the top and bottom of the board (which might cause spring) should be cut to smaller and shorter batten sizes. One option would be to post saw 4.8m long 200mm wide boards into 4.8m long (2 no. 2.4m long) 100mm wide boards on indications of compression wood. These could then be used for 95mm x 45mm studding. However it is important to realise that close inspection of battens probably only occurs during grading and that on re-sizing the material will have to be done again. Compression wood rich material is unsuitable for joists for the following results:
• Joists need to be straight and true to fit in hangers • Joists should be preferably conditioned to 12% i.e. insitu moisture ie “super-
dried”, then regularized. • Decking will not sit true on sprung boards leading to creaking floors • There is limited use for off-cuts and rejects since solid strutting is ¾ depth. • Larger section sizes mobilise greater forces when distorting • Joists are typically 3.6 to 4.8m long, whereas smaller section material is used
over shorter lengths.

Compression Wood Project – Final Report
BRE Client Report No. 218-309 Building Research Establishment Ltd 2004 Commercial in confidence
34
It appears likely that compression wood rich material would cause few problems in the timber frame market for the following reasons:
• Battens are well-restricted in timber frame with every 3rd or 4th stud fixed back to back with other studs.
• Brickwork, plywood sheathing, and panel intersections offer additional restriction against distortion.
• Sole plates, headers and footers are under constant dead load from the roof and upper floors.
• Members are in compression. • Rejects can be used as noggings, cripple studs and framing under windows. • Timber for timber frame is ordered in large packs and panels are mass
produced little time to dry out unrestrained. • The change in moisture content from KD to insitu is lower for timber frame
panels, than for joists. In general, compression wood affected timber should be used in markets where it will not be allowed to dry out unrestrained. Timber should be stored restrained. Test work indicated that compression wood has little effect on machine grader output or IP (Indicating Property), because the stiffness per volume of material is practically the same for normal wood, even though compression wood is significantly denser. The fact that the specific density (ie stiffness per unit weight) is lower is irrelevant. There was no indication that compression wood rich battens were grading in an unsafe level. None of the timber when tested to destruction failed at levels lower that the minimum C16 or C24 level, although some of the fractures where quite brash. Sitka spruce is already banned from use in ladders and scaffold boards, and currently none goes into trussed rafters in the UK. The structural use is almost always load sharing with the design governed by deflection/stiffness, and with almost no use as primary members. During the project BRE received a batch of 89mm x38mm CLS lumber of which 30% had significant level of compression wood. This timber was supplied with very low levels of distortion, although it is important to note that it had been planed and some of the worst material was probably rejected. However, this suggests that with normal kiln schedules and practices compression wood does not significantly worsen distortion levels of supplied material. However, this material should not be allowed to dry out unrestrained.

Compression Wood Project – Final Report
BRE Client Report No. 218-309 Building Research Establishment Ltd 2004 Commercial in confidence
35
5. Modelling Models based on Multiple Linear Regression for machine grading stiffness (low mean IP), bow, spring and twist have been produced with the aid of an external consultant (Jean Tunnicliffe-Wilson) using “Genstat” statistical analysis software. Both parties have contributed to the interpretation of the results. This modelling uses simple variables such as density, slope of grain, Knot Area Ratio etc, rather than the weighted knot variables or transformed variables which were used in some of the earlier work (Maun, 1998). The Sitka spruce battens studied by BRE were 3m long and 100,150 and 200mm wide x 47mm thick. These were sawn from the log in an industry standard square cant. Because of the relatively low number of 200mm size battens, no models are presented based on this size. Models for machine grading stiffness (low mean Indicating Property) Variables recorded and methods: Machine grading stiffness or low mean Indicating Property (IP) - sometimes referred to an Indicating Parameter - obtained from a Cook Bollinder grader has been modelled for Sitka spruce battens of 100x47 mm and 150x47mm size across the four sites FR1, 2, 3 and 4, both combined and separately. All models include the negative effects of knot variables and half of the ten models explain more than 50% of the variance. Other batten variables found useful include batten end variables relating position of piece relative to the pith and growth rate, Knot Area Ratio (KAR), density and grain angles. The total number of battens is 439, but some had selected parts of the batten variable data set and there are battens for which variables such as slope of grain were indeterminable due to wild grain or wandering pith. This made modelling more complicated, particularly across different sites. A large number of variables were recorded on each batten, some of which are interrelated (eg percentage of juvenile core and pith position). Low mean IP is an indicator of stiffness only, not a precise variable in itself. The nature and usefulness of this predictor will be discussed later. The batten variables recorded were as follows: Position of piece (distance from pith to centre of batten), angle between long edge of batten and pith, presence of pith (central, on edge or outside of batten), rate of growth, percentage of juvenile core, dry density of clear wood. These are referred to as “batten end” variables and were recorded on the lowest part of the batten for all battens and for some battens at both ends, for comparison. Note that "presence of pith" variables are available for some batten sets at both ends. Pith was recorded as 1 when in the end of the batten, 0.5 when on the edge and zero if not visible. Over the middle 2000mm of the battens the following was recorded: Grain angles on both faces, compression wood on faces and margins (as per the protocol given in the Appendix), Knot Area Ratios as per visual grading to BS 4978: 1996 (TKAR, MKAR etc), number of knots on each face and edge, area of knots on each face and edge, plus knot positions. Knots below 10mm in diameter were disregarded. It was found that there was only modest improvement in the model when the more sophisticated KAR variables were available, than the simple knot variables such as number and area of knots.
Compression Wood Project – Final Report
BRE Client Report No. 218-309 Building Research Establishment Ltd 2004 Commercial in confidence
36
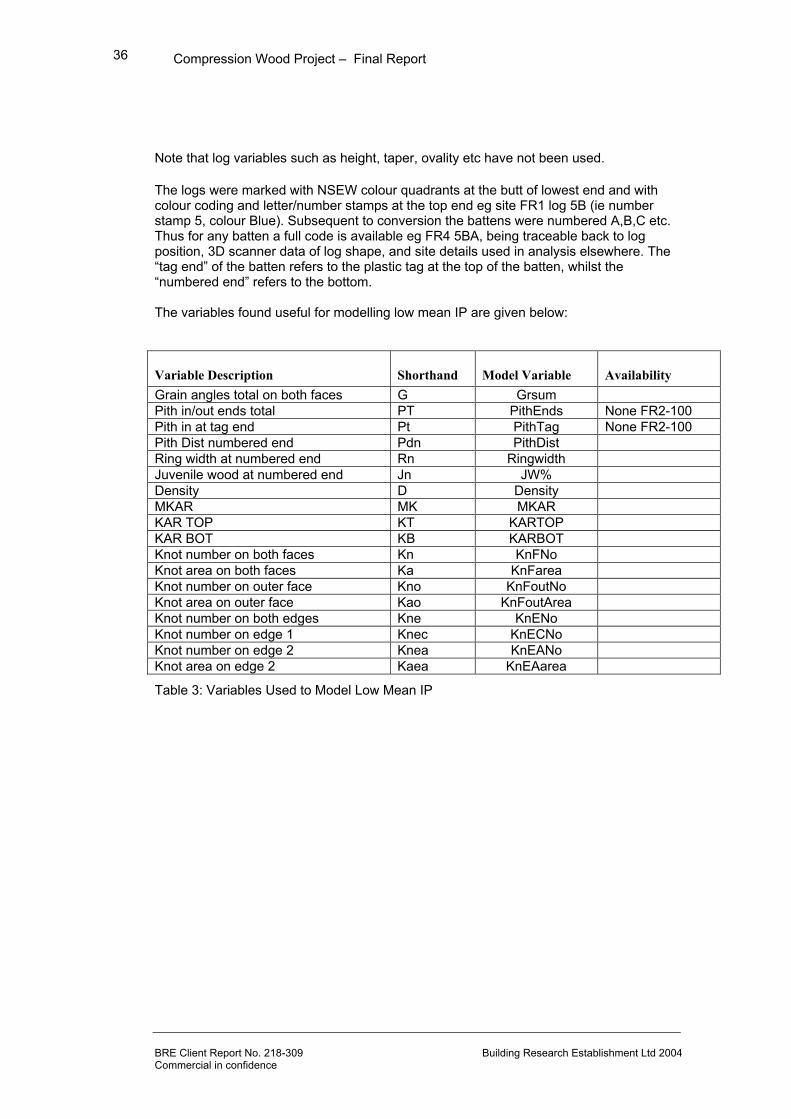
Note that log variables such as height, taper, ovality etc have not been used. The logs were marked with NSEW colour quadrants at the butt of lowest end and with colour coding and letter/number stamps at the top end eg site FR1 log 5B (ie number stamp 5, colour Blue). Subsequent to conversion the battens were numbered A,B,C etc. Thus for any batten a full code is available eg FR4 5BA, being traceable back to log position, 3D scanner data of log shape, and site details used in analysis elsewhere. The “tag end” of the batten refers to the plastic tag at the top of the batten, whilst the “numbered end” refers to the bottom. The variables found useful for modelling low mean IP are given below:
Variable Description Shorthand Model Variable Availability Grain angles total on both faces G Grsum Pith in/out ends total PT PithEnds None FR2-100 Pith in at tag end Pt PithTag None FR2-100 Pith Dist numbered end Pdn PithDist Ring width at numbered end Rn Ringwidth Juvenile wood at numbered end Jn JW% Density D Density MKAR MK MKAR KAR TOP KT KARTOP KAR BOT KB KARBOT Knot number on both faces Kn KnFNo Knot area on both faces Ka KnFarea Knot number on outer face Kno KnFoutNo Knot area on outer face Kao KnFoutArea Knot number on both edges Kne KnENo Knot number on edge 1 Knec KnECNo Knot number on edge 2 Knea KnEANo Knot area on edge 2 Kaea KnEAarea
Table 3: Variables Used to Model Low Mean IP

Compression Wood Project – Final Report
BRE Client Report No. 218-309 Building Research Establishment Ltd 2004 Commercial in confidence
37
The significant variables are grouped by their positive or negative effects and listed by model in Table 3, with the % variance explained by each model:
Site Size 100mm Size 150mm +ve -ve % var +ve -ve % var
All* D G0, Pdn, Rn, PT, Kn, 55.5 D G0, Rn, Kao, Knec, Knea 30.6 FR1 - G0, MK, Kne 51.4 MK Kne, Kn 41.9 FR2 - G, Rn, KT, Ka 56.7 - Pt, Knea 31.5 FR3 D Rn, Kn 55.5 D Kno, Kaea 43.1 FR4 - Rn, Kn 43.5 - Pdn, Jn, Kaea 50.0
*for 100mm battens, using PT excludes FR2 battens Note that G0 = missing grain angles ie wild or indeterminable grain
Table 4: Effects and % variance explained by models of Lowest IP mean Knots appear with a negative effect in all models although the precise variable changes. Using the most significant two of the four ‘total’ variables – by number and area and by faces and edges – the models across all sites account for about 20% of the variance. Models using knots are slightly less successful with 100mm battens at FR1 and 150mm battens at FR2. The other site and size combinations have knot models accounting for a percentage variance between 25 and 50. It is illogical to include in a model a variable such as number on knots on edge 1 and exclude the number on edge 2, however results of the analysis are presented raw. KAR variables appear in all models where they are available but they may be positive or negative. In two of the three models, the KAR variable is the least significant. Only for 100mm battens at FR1 does MKAR have greater significance than the knot variable and this occurs when the wild grain is the most significant. Wild grain, indicated by missing grain angles (G0), has a negative effect in three models. It is contradictory that that both “pith in” and “radius from pith to centre of batten” are both negative variables. It is interesting that density is significant and always positive, but for some sites/sizes and not others. The average ring width, juvenile wood % and pith distance are only known at the numbered end on the battens (ie the lowest part, or butt ends). They all have a consistently negative effect when significant, as do the presence of pith and grain angles. Table 5 gives the explanation of the shorthand used in the following report:
Shorthand Explanation Df Degrees of freedom Ss Sum of squares Ms Mean square Vr Variance ratio se Standard error
Table 5: Model Details explained
Compression Wood Project – Final Report
BRE Client Report No. 218-309 Building Research Establishment Ltd 2004 Commercial in confidence
38
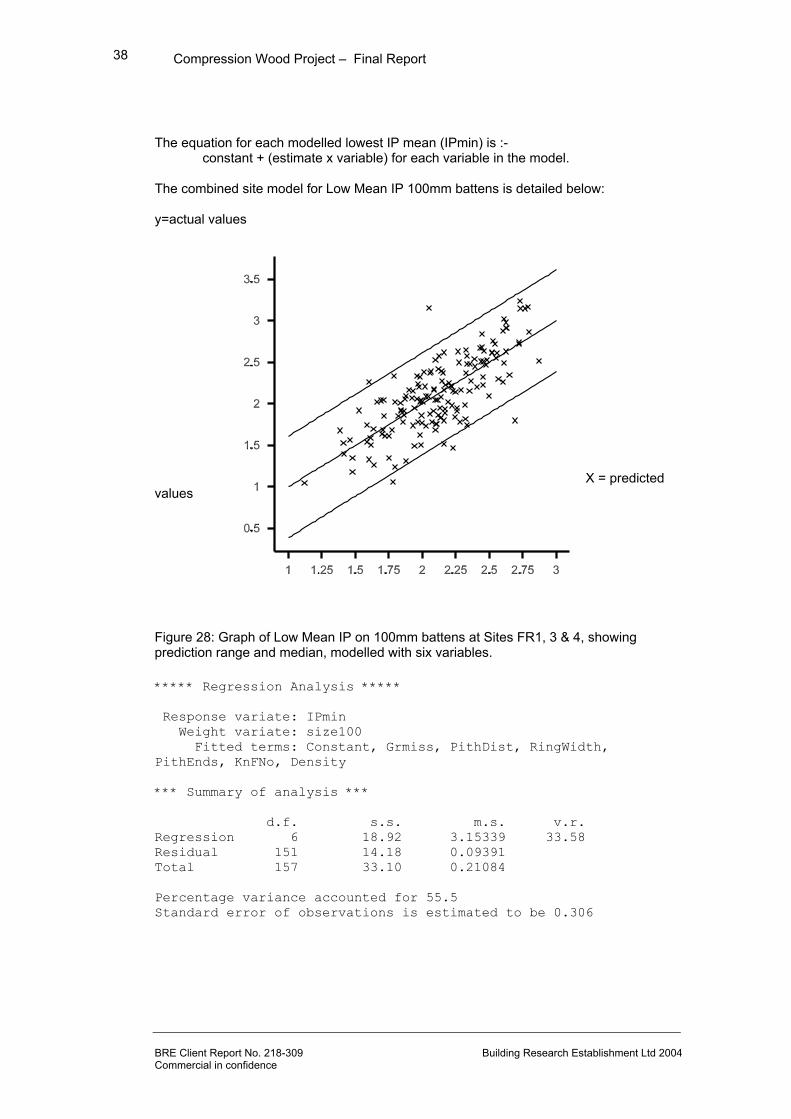
The equation for each modelled lowest IP mean (IPmin) is :- constant + (estimate x variable) for each variable in the model.
The combined site model for Low Mean IP 100mm battens is detailed below: y=actual values X = predicted values
Figure 28: Graph of Low Mean IP on 100mm battens at Sites FR1, 3 & 4, showing prediction range and median, modelled with six variables. ***** Regression Analysis ***** Response variate: IPmin Weight variate: size100 Fitted terms: Constant, Grmiss, PithDist, RingWidth, PithEnds, KnFNo, Density *** Summary of analysis *** d.f. s.s. m.s. v.r. Regression 6 18.92 3.15339 33.58 Residual 151 14.18 0.09391 Total 157 33.10 0.21084 Percentage variance accounted for 55.5 Standard error of observations is estimated to be 0.306
Compression Wood Project – Final Report
BRE Client Report No. 218-309 Building Research Establishment Ltd 2004 Commercial in confidence
39
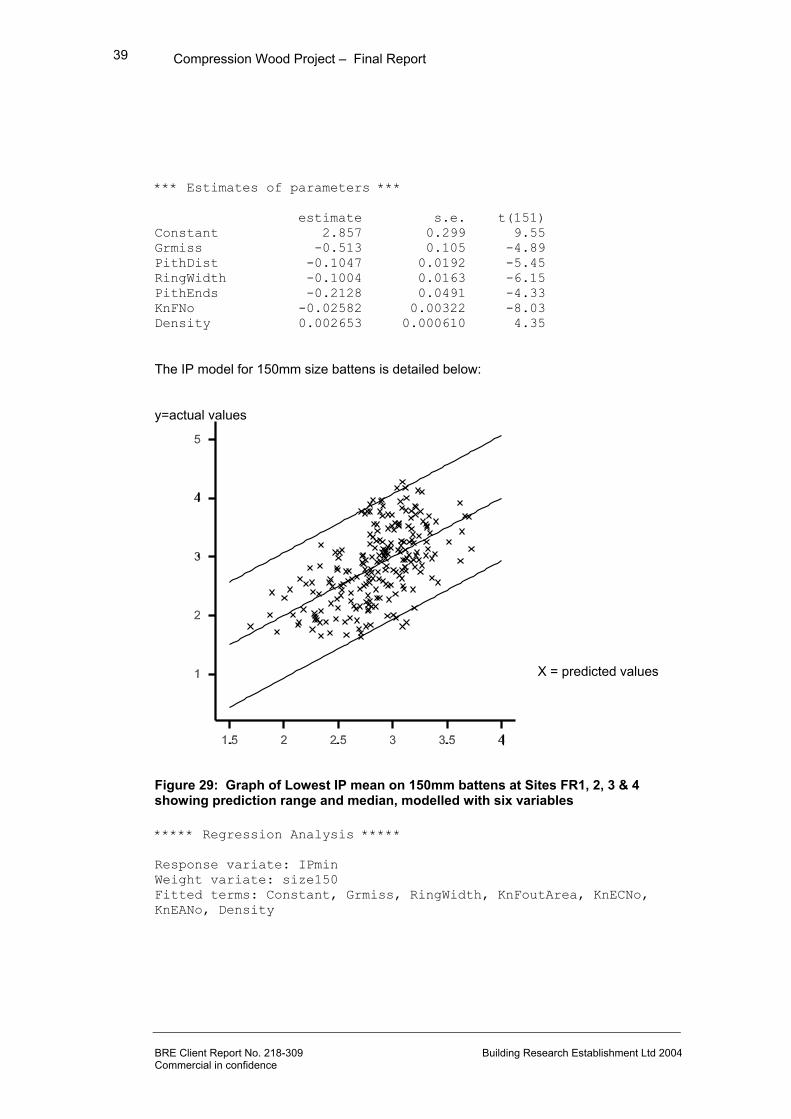
*** Estimates of parameters *** estimate s.e. t(151) Constant 2.857 0.299 9.55 Grmiss -0.513 0.105 -4.89 PithDist -0.1047 0.0192 -5.45 RingWidth -0.1004 0.0163 -6.15 PithEnds -0.2128 0.0491 -4.33 KnFNo -0.02582 0.00322 -8.03 Density 0.002653 0.000610 4.35 The IP model for 150mm size battens is detailed below: y=actual values X = predicted values
Figure 29: Graph of Lowest IP mean on 150mm battens at Sites FR1, 2, 3 & 4 showing prediction range and median, modelled with six variables ***** Regression Analysis ***** Response variate: IPmin Weight variate: size150 Fitted terms: Constant, Grmiss, RingWidth, KnFoutArea, KnECNo, KnEANo, Density
Compression Wood Project – Final Report
BRE Client Report No. 218-309 Building Research Establishment Ltd 2004 Commercial in confidence
40
*** Summary of analysis *** d.f. s.s. m.s. v.r. Regression 6 29.90 4.9836 17.47 Residual 218 62.20 0.2853 Total 224 92.10 0.4112 Percentage variance accounted for 30.6 Standard error of observations is estimated to be 0.534 *** Estimates of parameters *** estimate s.e. t(218) Constant 3.035 0.425 7.14 Grmiss -0.627 0.242 -2.59 RingWidth -0.0592 0.0259 -2.28 KnFoutArea -0.0000340 0.0000144 -2.35 KnECNo -0.0414 0.0144 -2.87 KnEANo -0.0909 0.0182 -4.99 Density 0.00248 0.00101 2.45 Interpretation: Different stands of trees and different parts of trees (yielding different sizes of battens) appear to have, on the basis of this analysis, differing significant variables, both negative and positive. Many of the recorded variables are simplistic, and do not properly account for within batten variation (eg position of pith, rate of growth) nor within tree variability, particularly for tress which are oval in section, bowed or have eccentric pith. Machine grade low mean IP is itself not a perfect measurement of stiffness - for many sets of batten data the first and second passes from which the mean is calculated are significantly different. Compression wood variables were not found to be significant in themselves. However, the test work on small clear samples has shown that compression wood does not behave like normal wood, especially in the relationship between density, rate of growth and stiffness. Compression wood is denser than normal wood, though less stiff. It is suspected therefore that compression wood, when present to significant levels in the battens, is the cause of much of the scatter in the data. Other work at BRE and elsewhere has shown the significance of microfibril angle in the latewood to be of prime importance, but this cannot of course be measured without destroying the specimen. Simplistic variables such as percentage of juvenile core, rate of growth etc cannot, it appears, substitute for this. No descriptor of the disturbed grain around knots is available, nor of the nature of the knots themselves. Disturbed grain may be present in the batten without the actual appearance of a knot. Low mean IP frequently occurs at some knot group in battens. The combined site model for the 150mm battens is less successful than for the 100mm battens. The most likely explanation for this is that the 150mm battens for sites FR3 and FR4 come mainly from butt logs, which show a consistent trend to be weaker at the base (ie there is a trend for reducing machine grade stiffness from 1.5m to the butt). This is known to be because of ultra-structural differences in the wood make-up (ie root wood),

Compression Wood Project – Final Report
BRE Client Report No. 218-309 Building Research Establishment Ltd 2004 Commercial in confidence
41
compared to wood from higher in the tree, which may not be represented in simple evaluation of the density and rate of growth. Models for Twist Models have been developed for twist in 100mm battens across four sites and for each site separately, at both stages of twist (at 18% and 12% moisture content, following unrestrained drying) Grain angles and presence/absence of pith were the most important explanatory variables, as expected. Also included, however, as significant variables were density, knots and batten end data such as juvenile wood % and rate of growth (which are related). Half of the ten models explained over 60% of the variance, however the significant variables are not completely consistent from one site or size to another, and the unrestrained drying conditions clearly exaggerate the tendency to distort. Moisture content was recorded for each batten at each stage of distortion but this data was naturally excluded from all models variables, although there are slight variations due particularly in post kiln drying stage relating to initial moisture content variations and position within the stack. The battens were conditioned unrestrained to 12% moisture content until equilibrium was reached. The total number of battens was 210. As before, Pith was recorded as 1 when in the end of the batten, 0.5 when on the edge and zero if not visible. The variables used for modelling twist are in Table 6, below: Variable Description Shorthand Model Variable Availability Pith Deg numbered end Pan PithDeg Grain angles on inner face Gi GrinDeg Grain angles on outer face Go GroutDeg Pith in/out numbered end Pn PithNum Pith in/out ends total PT PithEnds None FR2-100 Juvenile wood at numbered end Jn JW% Density D Density Knot area on inner face Kai KnFinArea Knot number on edge 1 Knec KnECNo Knot area on edge 1 Kae KnECarea
Table 6: Variables Used to Model Twist Models were investigated for both stages of twist for all battens together and separately for each site. All available data was considered but this varied from model to model, depending on availability. Where there were different model options with more or less variables, the option with fewer variables was used. There are a considerable number of alternative possibilities because the explanatory variables are closely interdependent. The significant variables are grouped by their positive or negative effects and listed by model in Table 7(below), with the % variance explained by each model. Site Twist at stage 1 Twist at stage 2 +ve -ve % var +ve -ve % var FR1,3,4 Gi, Go, PT, Kai, D - 66.7 Gi, Go, Jn, PT - 57.9 FR1 PT, Knec - 54.0 PT, Knec - 68.3 FR2 Jn, Kae, D Pan 62.8 Go, Jn, Pn - 46.8 FR3 Gi, Go, PT - 67.0 Gi, Go, PT - 51.4 FR4 Gi, Go, PT, Kai, D - 66.3 Gi, Pn, Knec, D - 56.3

Compression Wood Project – Final Report
BRE Client Report No. 218-309 Building Research Establishment Ltd 2004 Commercial in confidence
42
Table7: Effects and % variance explained by models of twist for 100mm battens The main variables of note are grain angles and pith position, both with positive effects. At site FR2 the two grain angle variables on their own accounted for only 17.8% of the variance for twist at stage 1. For all other models the percentage for Twist at stage 1 ranged between 50% and 70% of the variance for individual sites with 34.1% across all four sites. At stage 2 the grain angles model over all sites had 38.1% of the variance accounted for, with 26.1% for site FR2 and a range of 40% to 70% for the other three sites. Grain angles are missing from several of the battens at FR1 (ie they are wild or undeterminable) so they could not be included in more detailed models for this site alone. Slope of grain on its own is not, therefore, a good indicator of the degree of twist. Pith position is not known at the tag end for site FR2 so for the single variable summing the pith in the two ends, there was no model for FR2. Models were checked at the other three sites and across all three sites, for both stages of twist. These eight models had between 28% and 50% of the variance accounted for, by using the single pith variable. For all sites the juvenile wood % and pith angle are known at the numbered end, however it is recognised that these values can vary considerably throughout the batten. Knots, density and juvenile wood have a consistently positive effect when significant. The pith angle “Pan” only appears in one model, for Twist at stage 1 at site FR2, where it has a negative effect. The influence of this will be discussed later. As before the equation for each modelled twist is :-
constant + (estimate x variable) for each variable in the model.
Only the combined site models are presented, with the exception of FR2:
Compression Wood Project – Final Report
BRE Client Report No. 218-309 Building Research Establishment Ltd 2004 Commercial in confidence
43
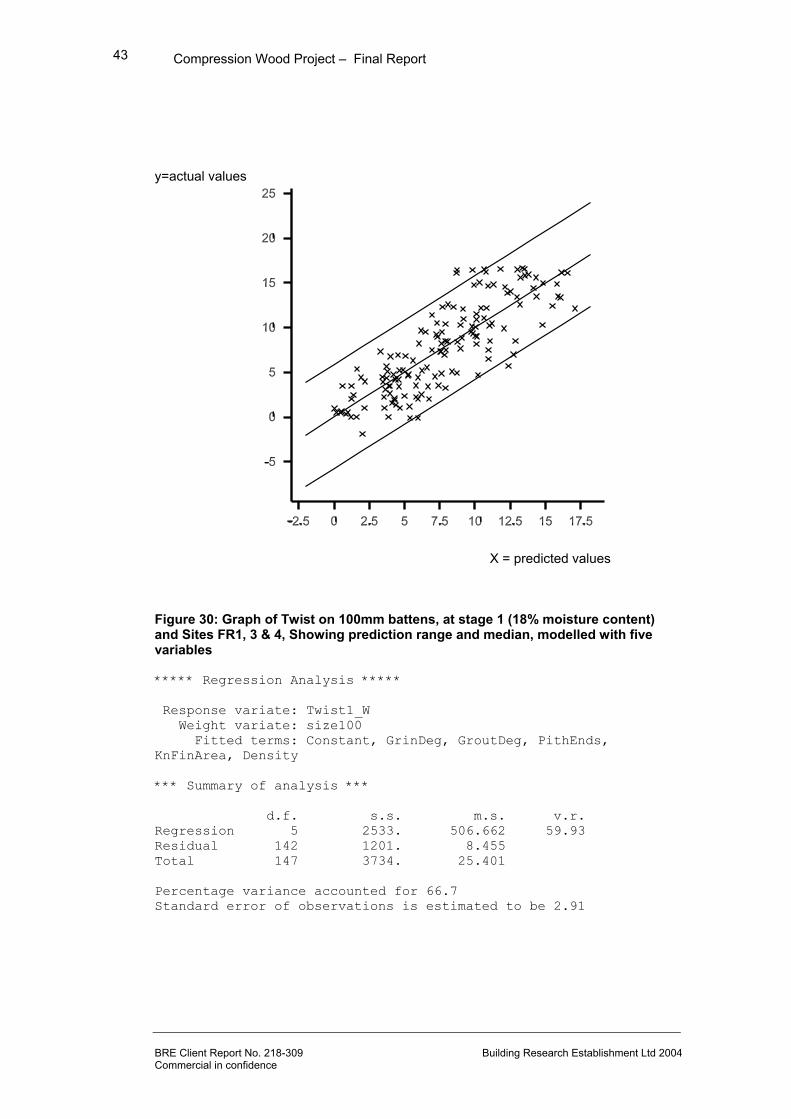
y=actual values
X = predicted values Figure 30: Graph of Twist on 100mm battens, at stage 1 (18% moisture content) and Sites FR1, 3 & 4, Showing prediction range and median, modelled with five variables ***** Regression Analysis ***** Response variate: Twist1_W Weight variate: size100 Fitted terms: Constant, GrinDeg, GroutDeg, PithEnds, KnFinArea, Density *** Summary of analysis *** d.f. s.s. m.s. v.r. Regression 5 2533. 506.662 59.93 Residual 142 1201. 8.455 Total 147 3734. 25.401 Percentage variance accounted for 66.7 Standard error of observations is estimated to be 2.91

Compression Wood Project – Final Report
BRE Client Report No. 218-309 Building Research Establishment Ltd 2004 Commercial in confidence
44
*** Estimates of parameters *** estimate s.e. t(142) Constant -4.39 2.31 -1.90 GrinDeg 1.133 0.159 7.12 GroutDeg 1.238 0.223 5.56 PithEnds 1.867 0.444 4.20 KnFinArea 0.000423 0.000162 2.61 Density 0.01381 0.00627 2.20
Compression Wood Project – Final Report
BRE Client Report No. 218-309 Building Research Establishment Ltd 2004 Commercial in confidence
45
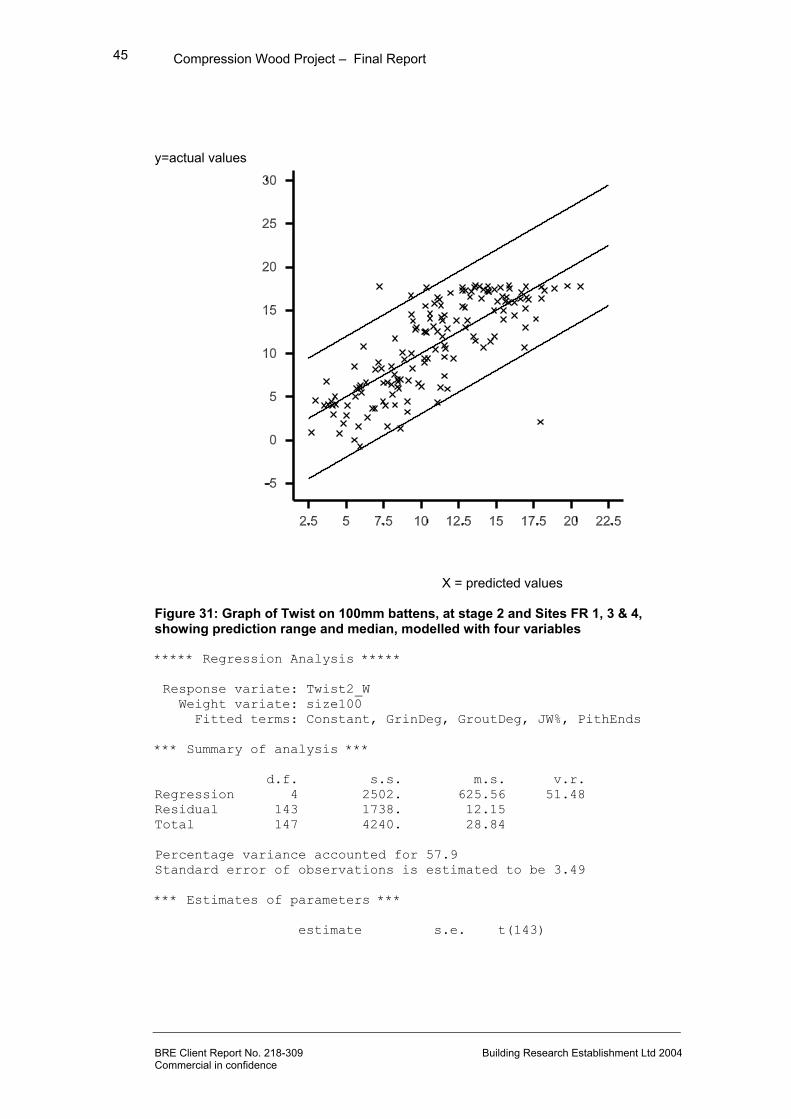
y=actual values
X = predicted values Figure 31: Graph of Twist on 100mm battens, at stage 2 and Sites FR 1, 3 & 4, showing prediction range and median, modelled with four variables ***** Regression Analysis ***** Response variate: Twist2_W Weight variate: size100 Fitted terms: Constant, GrinDeg, GroutDeg, JW%, PithEnds *** Summary of analysis *** d.f. s.s. m.s. v.r. Regression 4 2502. 625.56 51.48 Residual 143 1738. 12.15 Total 147 4240. 28.84 Percentage variance accounted for 57.9 Standard error of observations is estimated to be 3.49 *** Estimates of parameters *** estimate s.e. t(143)
Compression Wood Project – Final Report
BRE Client Report No. 218-309 Building Research Establishment Ltd 2004 Commercial in confidence
46
Constant 1.76 1.51 1.17 GrinDeg 0.899 0.192 4.69 GroutDeg 1.353 0.242 5.59 JW% 0.0380 0.0156 2.43 PithEnds 2.470 0.554 4.46
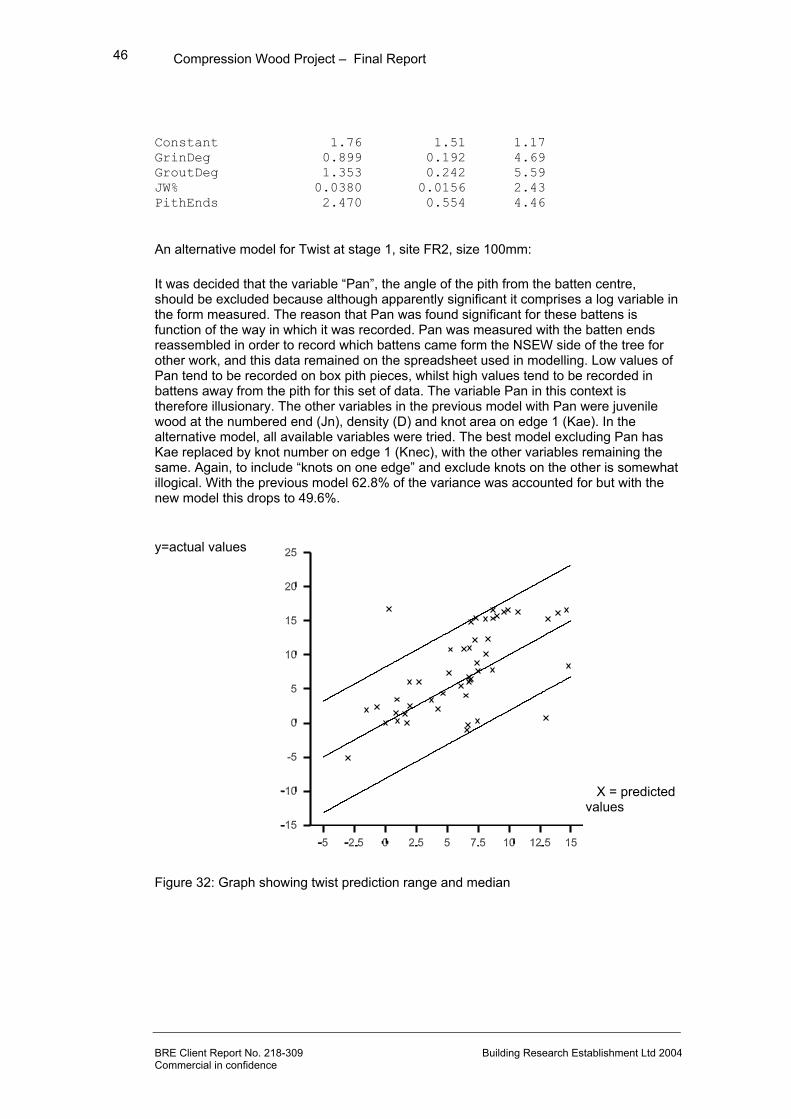
An alternative model for Twist at stage 1, site FR2, size 100mm: It was decided that the variable “Pan”, the angle of the pith from the batten centre, should be excluded because although apparently significant it comprises a log variable in the form measured. The reason that Pan was found significant for these battens is function of the way in which it was recorded. Pan was measured with the batten ends reassembled in order to record which battens came form the NSEW side of the tree for other work, and this data remained on the spreadsheet used in modelling. Low values of Pan tend to be recorded on box pith pieces, whilst high values tend to be recorded in battens away from the pith for this set of data. The variable Pan in this context is therefore illusionary. The other variables in the previous model with Pan were juvenile wood at the numbered end (Jn), density (D) and knot area on edge 1 (Kae). In the alternative model, all available variables were tried. The best model excluding Pan has Kae replaced by knot number on edge 1 (Knec), with the other variables remaining the same. Again, to include “knots on one edge” and exclude knots on the other is somewhat illogical. With the previous model 62.8% of the variance was accounted for but with the new model this drops to 49.6%. y=actual values
X = predicted values
Figure 32: Graph showing twist prediction range and median
Compression Wood Project – Final Report
BRE Client Report No. 218-309 Building Research Establishment Ltd 2004 Commercial in confidence
47
***** Regression Analysis ***** Response variate: Twist1_W Weight variate: FR2_100 Fitted terms: Constant, JW%, KnECNo, Density *** Summary of analysis *** d.f. s.s. m.s. v.r. Regression 3 841.4 280.48 16.73 Residual 45 754.6 16.77 Total 48 1596.0 33.25 Percentage variance accounted for 49.6 Standard error of observations is estimated to be 4.09 *** Estimates of parameters *** estimate s.e. t(45) Constant -23.23 6.03 -3.85 JW% 0.1306 0.0272 4.79 KnECNo 0.507 0.211 2.40 Density 0.0416 0.0140 2.97
Overall, the models for twist for sites FR1,3 and 4 are quite good, with significant variables as expected being slope of grain and position or presence of pith. Generally the exact value of twist is difficult to predict but the propensity for high twist in certain battens as opposed to low is quite clear. That twist is associated with high slope of grain and timber cut near to the centre of the log is well known. The quite low variance accounted for in the model is undoubtedly caused by variation of pith position within the pith, and its consequent effect on the measurements. Variation in tangential shrinkage may also be a factor. Density and knots which feature as positive variables in some form, are probably not statistically significant. Of interest is the fact that there are no negative variables. Density (which might be an indication of high compression wood), or compression wood variables themselves do not, apparently, tend to reduce twist. Compression wood with its lower tangential shrinkage than normal wood might reduce twist (this is explored and reported on elsewhere). One other reason that the model does not account for a higher proportion of the twist is that some twist is attributable to the method of conversion ie cutting the batten off axis compared with the log axis, which is only partly described by the variables related to pith position (these were only recorded for certain sets of battens at both ends). Battens which are cut at an angle to the main axis of the log might be highlighted from differing pith in/out variables at each end, with some hope that these variables together with others (such as distance to pith from centre of batten) would account for much more of the observed twist. Unfortunately, differing pith in/out variables at each end of the batten merely ensure that the pith distance variable is less meaningful, together with the slope of grain.

Compression Wood Project – Final Report
BRE Client Report No. 218-309 Building Research Establishment Ltd 2004 Commercial in confidence
48
No models were developed for 150mm and 200mm battens because the level on twist in this size is much less, most likely due to the restraining effect of the material away from the pith. Models for bow and spring Models for bow and spring, at both 18% and 12% moisture content following unrestrained drying have been developed for battens of 100mm and 150mm widths across the four sites FR1,2,3,4. In five cases, out of the 40 possible combinations of data/site etc considered, no model could be found. Ten models accounted for more at least 30% of the variance. Both compression wood and other batten variables have been found significant in these models. Again, the conditions of unrestrained drying exaggerate the tendency to distort. Overall, the level of success and usefulness of the models is rather low and this is most likely due to the difficulty in assessing the true compression wood content of a batten from the surface only, particularly when the battens are large, contain disturbed grain and have high ring curvature. In observations of other material it has been noted that battens with high levels of visible compression wood can remain quite straight, whereas in some highly distorted battens in is difficult to see any compression wood on the surface at all. There is also the problem that battens which twist can twist with high bow (ie the twist off-axis), not accounted by compression wood. An imbalance of juvenile wood to later growth on one edge or face of a batten can also cause bow or spring, and this is not accounted for in the simple measurement of percentage of juvenile wood. The compression wood was recorded as an integer between 1 and 4 for the margins and the centre of each face, as per the compression wood protocol (detailed in the Annexe). For modelling purposes these records were reduced to integers between 0 and 3 so the absence of significant compression wood was represented by zero. As before, Pith was recorded as 1 when in the end of the batten, 0.5 when on the edge and zero if not visible. The missing grain angles variable was 1 for missing grain angles, otherwise 0.
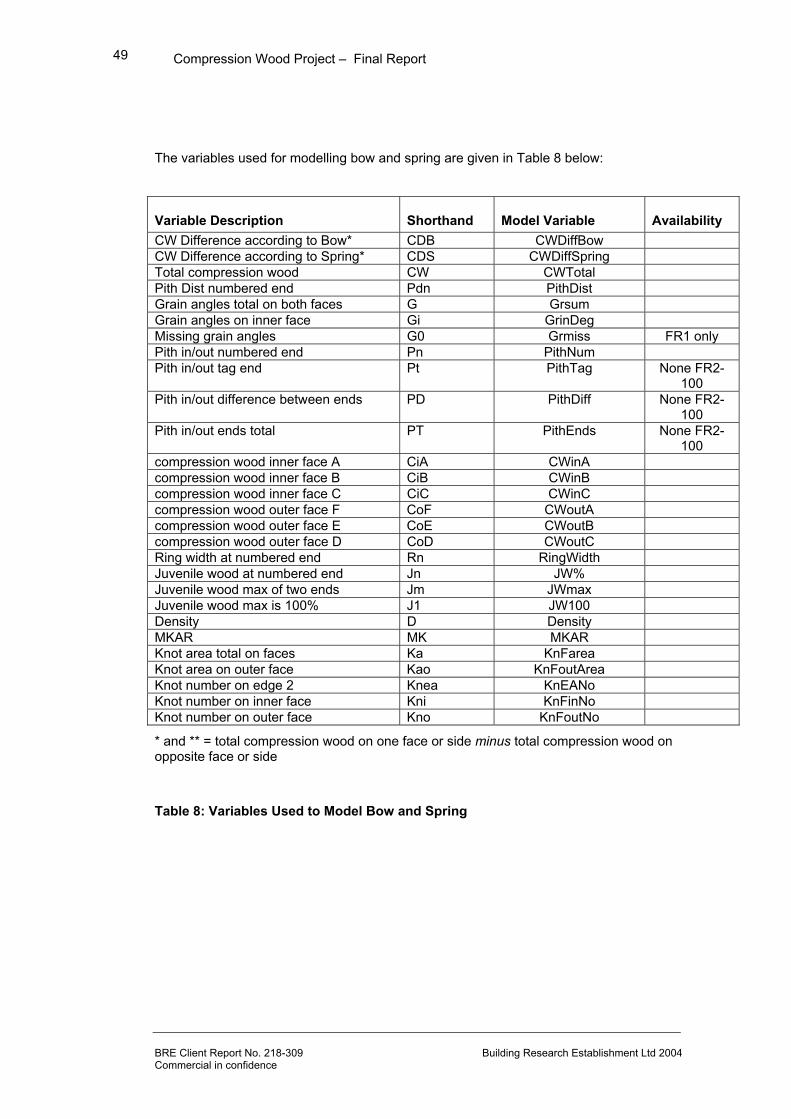
Compression Wood Project – Final Report
BRE Client Report No. 218-309 Building Research Establishment Ltd 2004 Commercial in confidence
49
The variables used for modelling bow and spring are given in Table 8 below:
Variable Description Shorthand Model Variable Availability CW Difference according to Bow* CDB CWDiffBow CW Difference according to Spring* CDS CWDiffSpring Total compression wood CW CWTotal Pith Dist numbered end Pdn PithDist Grain angles total on both faces G Grsum Grain angles on inner face Gi GrinDeg Missing grain angles G0 Grmiss FR1 only Pith in/out numbered end Pn PithNum Pith in/out tag end Pt PithTag None FR2-
100 Pith in/out difference between ends PD PithDiff None FR2-
100 Pith in/out ends total PT PithEnds None FR2-
100 compression wood inner face A CiA CWinA compression wood inner face B CiB CWinB compression wood inner face C CiC CWinC compression wood outer face F CoF CWoutA compression wood outer face E CoE CWoutB compression wood outer face D CoD CWoutC Ring width at numbered end Rn RingWidth Juvenile wood at numbered end Jn JW% Juvenile wood max of two ends Jm JWmax Juvenile wood max is 100% J1 JW100 Density D Density MKAR MK MKAR Knot area total on faces Ka KnFarea Knot area on outer face Kao KnFoutArea Knot number on edge 2 Knea KnEANo Knot number on inner face Kni KnFinNo Knot number on outer face Kno KnFoutNo
* and ** = total compression wood on one face or side minus total compression wood on opposite face or side
Table 8: Variables Used to Model Bow and Spring
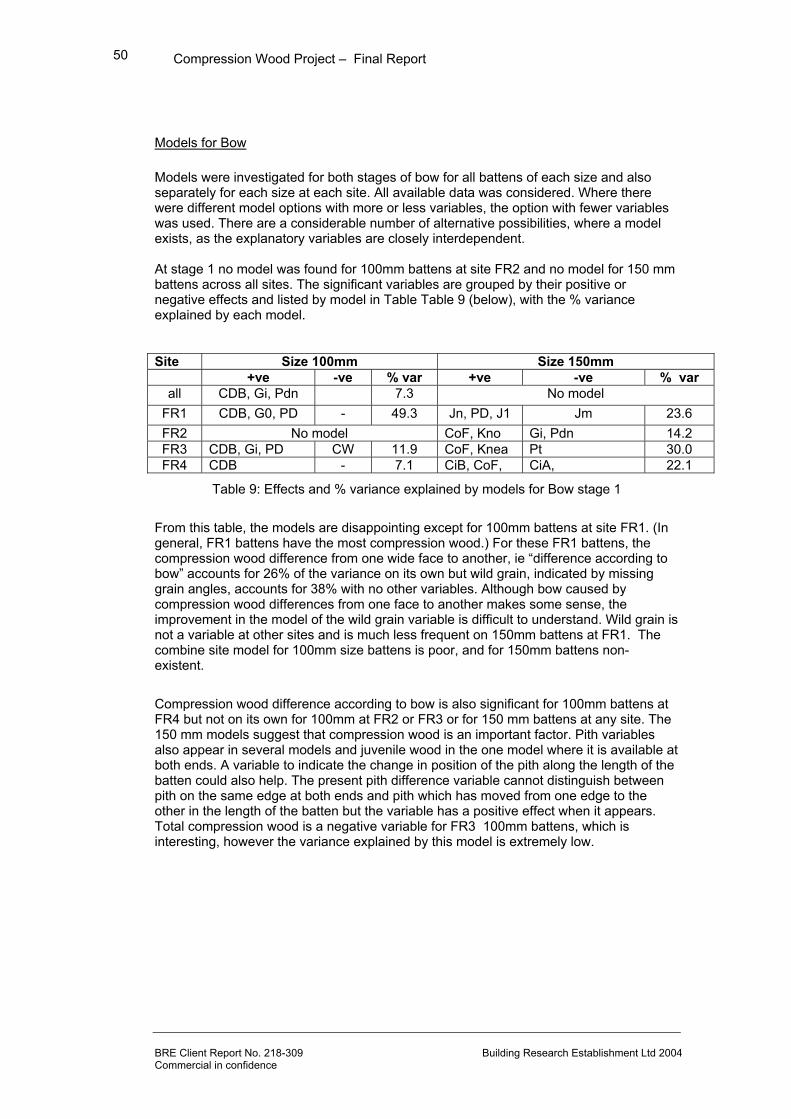
Compression Wood Project – Final Report
BRE Client Report No. 218-309 Building Research Establishment Ltd 2004 Commercial in confidence
50
Models for Bow Models were investigated for both stages of bow for all battens of each size and also separately for each size at each site. All available data was considered. Where there were different model options with more or less variables, the option with fewer variables was used. There are a considerable number of alternative possibilities, where a model exists, as the explanatory variables are closely interdependent. At stage 1 no model was found for 100mm battens at site FR2 and no model for 150 mm battens across all sites. The significant variables are grouped by their positive or negative effects and listed by model in Table Table 9 (below), with the % variance explained by each model. Site Size 100mm Size 150mm
+ve -ve % var +ve -ve % var all CDB, Gi, Pdn 7.3 No model
FR1 CDB, G0, PD - 49.3 Jn, PD, J1 Jm 23.6 FR2 No model CoF, Kno Gi, Pdn 14.2 FR3 CDB, Gi, PD CW 11.9 CoF, Knea Pt 30.0 FR4 CDB - 7.1 CiB, CoF, CiA, 22.1
Table 9: Effects and % variance explained by models for Bow stage 1
From this table, the models are disappointing except for 100mm battens at site FR1. (In general, FR1 battens have the most compression wood.) For these FR1 battens, the compression wood difference from one wide face to another, ie “difference according to bow” accounts for 26% of the variance on its own but wild grain, indicated by missing grain angles, accounts for 38% with no other variables. Although bow caused by compression wood differences from one face to another makes some sense, the improvement in the model of the wild grain variable is difficult to understand. Wild grain is not a variable at other sites and is much less frequent on 150mm battens at FR1. The combine site model for 100mm size battens is poor, and for 150mm battens non-existent.
Compression wood difference according to bow is also significant for 100mm battens at FR4 but not on its own for 100mm at FR2 or FR3 or for 150 mm battens at any site. The 150 mm models suggest that compression wood is an important factor. Pith variables also appear in several models and juvenile wood in the one model where it is available at both ends. A variable to indicate the change in position of the pith along the length of the batten could also help. The present pith difference variable cannot distinguish between pith on the same edge at both ends and pith which has moved from one edge to the other in the length of the batten but the variable has a positive effect when it appears. Total compression wood is a negative variable for FR3 100mm battens, which is interesting, however the variance explained by this model is extremely low.

Compression Wood Project – Final Report
BRE Client Report No. 218-309 Building Research Establishment Ltd 2004 Commercial in confidence
51
At stage 2 (ie 12% moisture content) no model was found for 100mm battens at either site FR2 or at site FR3. The significant variables are grouped by their positive or negative effects and listed by model in Table 10 with the % variance explained by each model. Site Size 100mm Size 150mm
+ve -ve % var +ve -ve % var all CiA, CiC, CDB CoD 12.0 CiB, PT, Kno Pn 6.31
FR1 CW, G0 47.2 CiC - 8.2 FR2 No model CiA, CoF, Kno Pdn, Jn, Pn, 21.0 FR3 No model Kni 11.7 FR4 CiA 10.9 CiB, CoF, PD CiA 26.42
1. without batten 6RA (site FR4), 10.7 with 6RA 2. without batten 6RA, 53.7% with 6RA
Table 10: Effects and % variance explained by models for Bow stage 2 As at stage 1, the 100mm battens at FR1 have the only good model, but this time using total compression wood rather than difference from one face to another – which is not consistent. Again the wild grain appears to be significant but this time the total compression wood accounts for nearly 43% of the variance on its own. No other site and size combination shows any real significance for total compression wood. Many of the same comments apply as to first stage bow. Knots appear even more in models for 150mm battens.
Models for Spring Models were investigated for both stages of spring for all battens of each size and also separately for each size at each site. All available data was considered, regardless of any preconceptions. Where there were different model options with more or less variables, the option with fewer variables was used. There are a considerable number of alternative possibilities, where a model exists, as the explanatory variables are closely interdependent. At stage 1 models were obtained for each site and size combination. The significant variables are grouped by their positive or negative effects and listed by model in Table 11 with the % variance explained by each model. Site Size 100mm Size 150mm
+ve -ve % var +ve -ve % var FR1,3 &
4 CiC, CDS, Pt, D CiA 30.1 No model
FR1 CiC, Rn CiA 34.1 CW, Ka CiB, MK 26.0 FR2 CiC, Rn, Kao CiB 27.4 CoE, Pt, Ka 20.1 FR3 CDS, Rn CiA 25.5 CDS, Rn G 18.2 FR4 CDS - 17.4 CiB, CW 16.82
2. Without batten 6RA, 51% with batten 6RA
Table 11: Effects and % variance explained by models for Spring stage 1

Compression Wood Project – Final Report
BRE Client Report No. 218-309 Building Research Establishment Ltd 2004 Commercial in confidence
52
The model for 100mm battens at site FR1 is again the best but the model for 100mm battens across sites is much better than for bow. Site FR2 is omitted from the cross-site model because it has no record of the pith position at the tag end of the batten. Compression wood difference according to spring is significantly positive on its own in four batten groups – 100mm battens at FR3 and FR4 and 150mm battens at FR2 and FR3 and also across all sites for 100mm battens. Other variables which are significant on their own include density across all sites for 100mm battens, ring width for several site and size combinations and knot area for FR1 150. Again, some of these variables are clearly related (eg density and compression wood). At stage 2 no model was obtained for 100 mm battens at site FR2. The significant variables are grouped by their positive or negative effects and listed by model in Table 12, with the % variance explained by each model. Site Size 100mm Size 150mm
+ve -ve % var +ve -ve % var All* CiC, CDS, Rn, Pt CiA, CiB 32.51 CiB, Kao - 6.63
FR1 CiC, Jn CiB 57.62 CiA 5.3 FR2 No model CoE, Kao - 31.0 FR3 CiC, CoD, Rn Pt CoE 38.7 CiC, Ka - 24.3 FR4 CiC, CDS CW 24.8 CiB, CoE, Rn 30.64
*for 100mm battens, using Pt excludes FR2 battens 1without batten COA (Site FR1), 28% with batten COA 2without batten COA, 29.8% with batten COA 3without batten 6RA (Site FR4), 9.5% with batten 6RA 4without batten 6RA, 55.1% with batten 6RA
Table 12: Effects and % variance explained by models for Spring stage 2
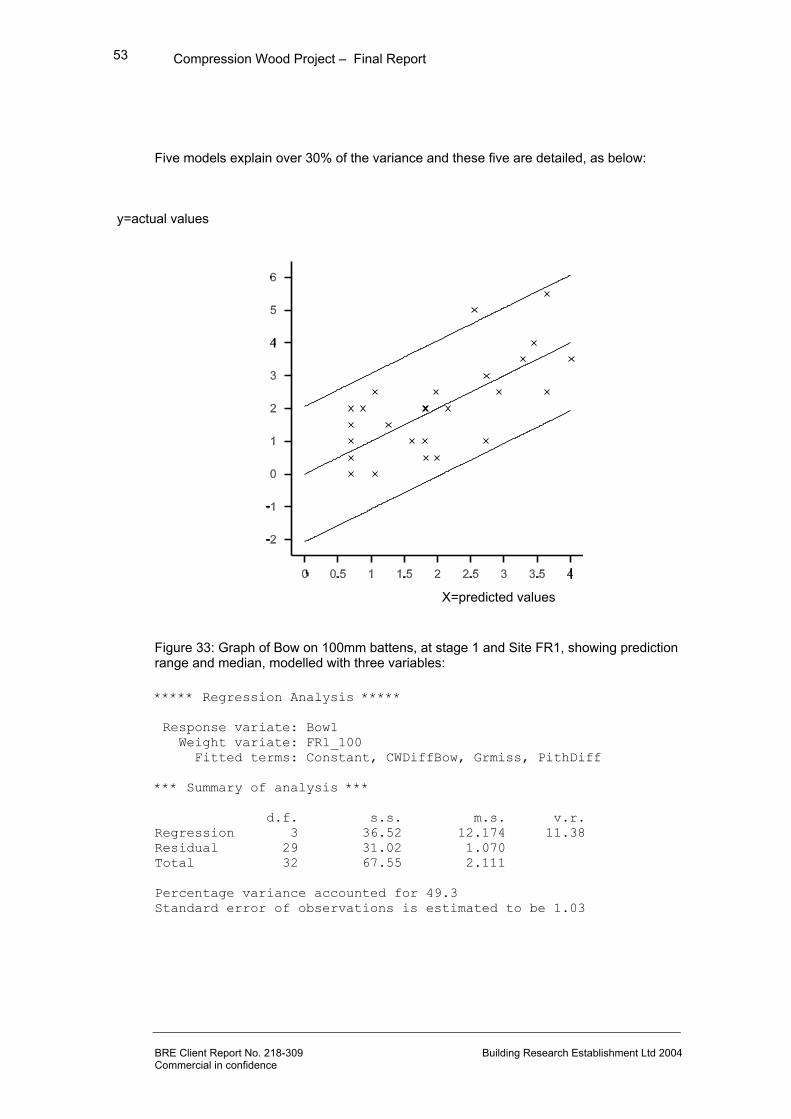
Compression Wood Project – Final Report
BRE Client Report No. 218-309 Building Research Establishment Ltd 2004 Commercial in confidence
53
Five models explain over 30% of the variance and these five are detailed, as below:
y=actual values
X=predicted values
Figure 33: Graph of Bow on 100mm battens, at stage 1 and Site FR1, showing prediction range and median, modelled with three variables: ***** Regression Analysis ***** Response variate: Bow1 Weight variate: FR1_100 Fitted terms: Constant, CWDiffBow, Grmiss, PithDiff *** Summary of analysis *** d.f. s.s. m.s. v.r. Regression 3 36.52 12.174 11.38 Residual 29 31.02 1.070 Total 32 67.55 2.111 Percentage variance accounted for 49.3 Standard error of observations is estimated to be 1.03

Compression Wood Project – Final Report
BRE Client Report No. 218-309 Building Research Establishment Ltd 2004 Commercial in confidence
54
*** Estimates of parameters *** estimate s.e. t(29) Constant 0.697 0.261 2.67 CWDiffBow 0.1827 0.0723 2.53 Grmiss 1.296 0.452 2.87 PithDiff 1.127 0.627 1.80
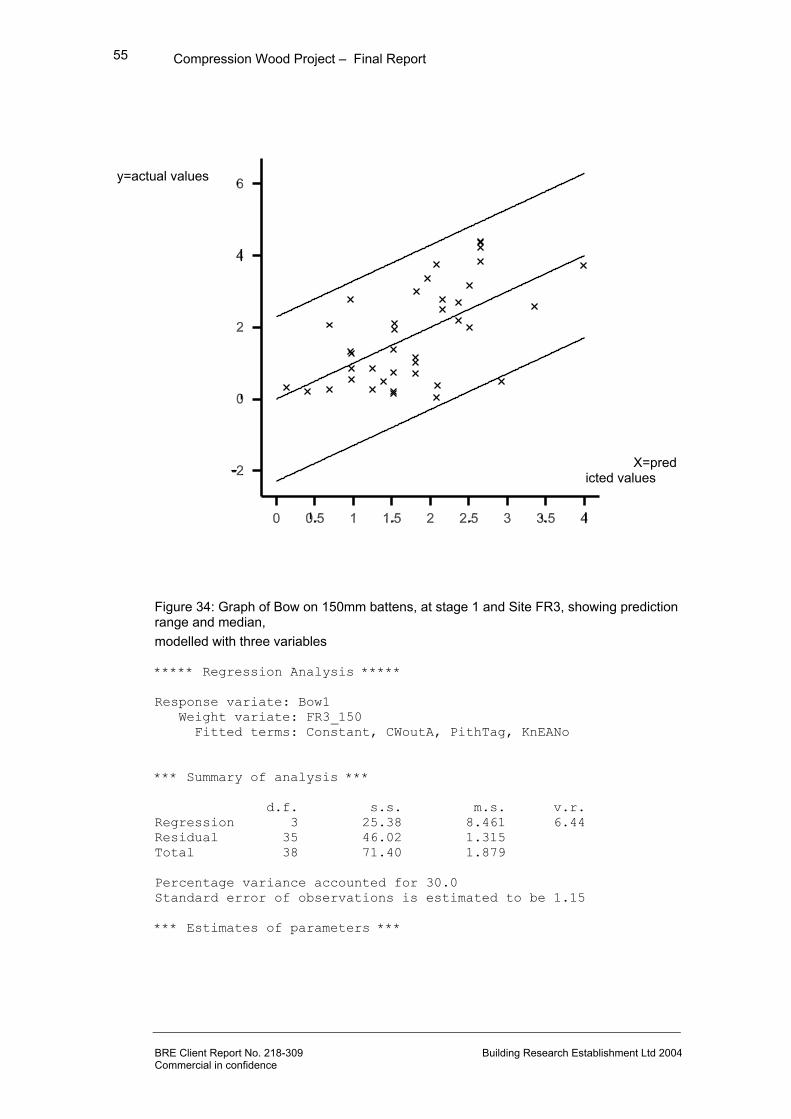
Compression Wood Project – Final Report
BRE Client Report No. 218-309 Building Research Establishment Ltd 2004 Commercial in confidence
55
y=actual values
X=predicted values
Figure 34: Graph of Bow on 150mm battens, at stage 1 and Site FR3, showing prediction range and median, modelled with three variables ***** Regression Analysis ***** Response variate: Bow1 Weight variate: FR3_150 Fitted terms: Constant, CWoutA, PithTag, KnEANo *** Summary of analysis *** d.f. s.s. m.s. v.r. Regression 3 25.38 8.461 6.44 Residual 35 46.02 1.315 Total 38 71.40 1.879 Percentage variance accounted for 30.0 Standard error of observations is estimated to be 1.15 *** Estimates of parameters ***

Compression Wood Project – Final Report
BRE Client Report No. 218-309 Building Research Establishment Ltd 2004 Commercial in confidence
56
estimate s.e. t(35) Constant 0.325 0.629 0.52 CWoutA 0.633 0.240 2.64 PithTag -1.675 0.481 -3.48 KnEANo 0.282 0.105 2.67
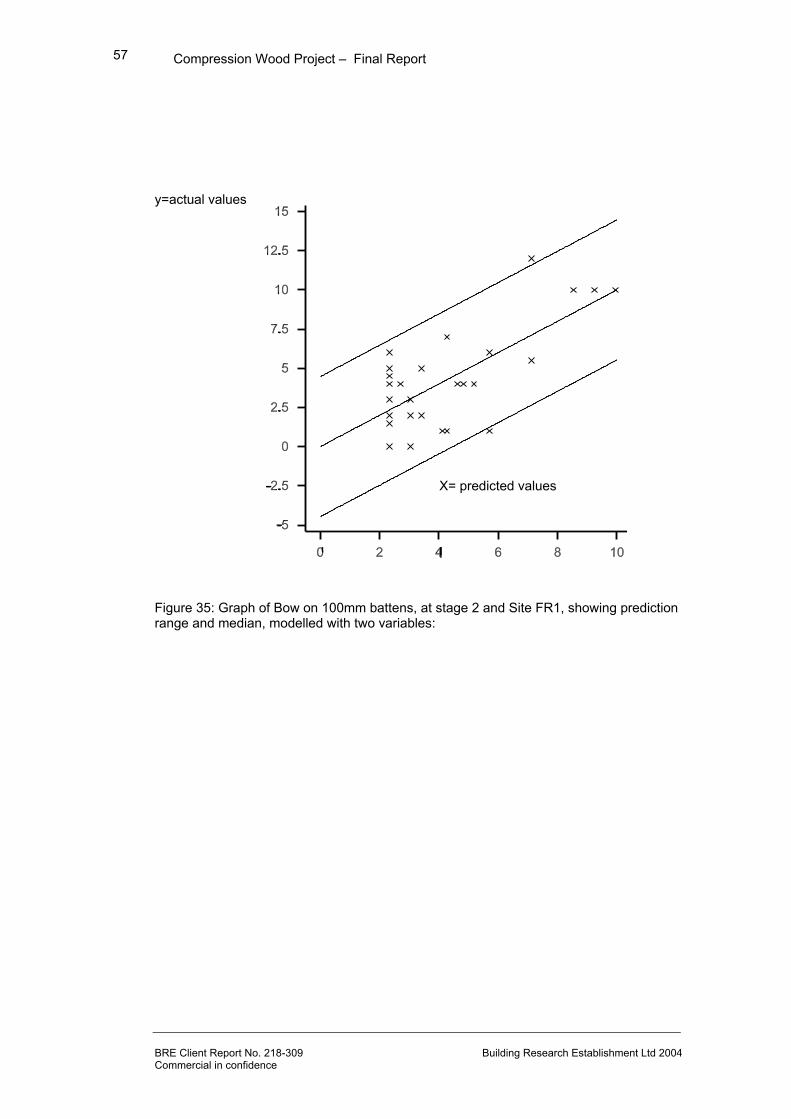
Compression Wood Project – Final Report
BRE Client Report No. 218-309 Building Research Establishment Ltd 2004 Commercial in confidence
57
y=actual values
X= predicted values
Figure 35: Graph of Bow on 100mm battens, at stage 2 and Site FR1, showing prediction range and median, modelled with two variables:
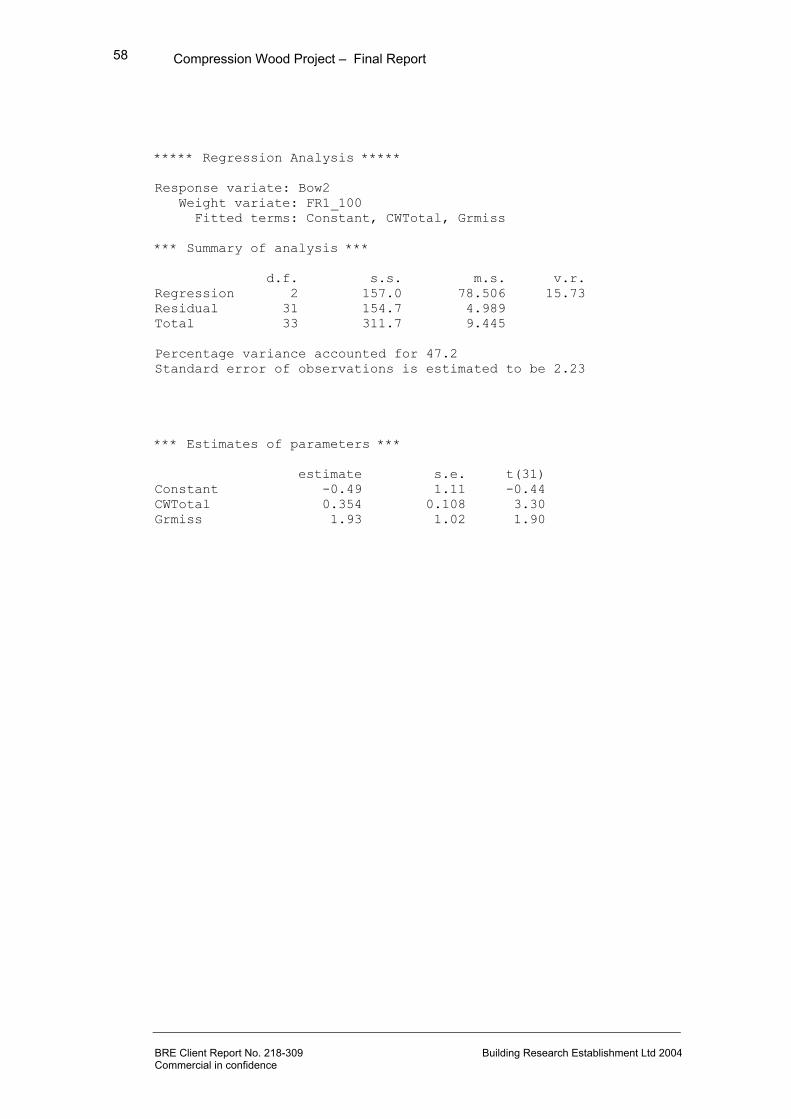
Compression Wood Project – Final Report
BRE Client Report No. 218-309 Building Research Establishment Ltd 2004 Commercial in confidence
58
***** Regression Analysis ***** Response variate: Bow2 Weight variate: FR1_100 Fitted terms: Constant, CWTotal, Grmiss *** Summary of analysis *** d.f. s.s. m.s. v.r. Regression 2 157.0 78.506 15.73 Residual 31 154.7 4.989 Total 33 311.7 9.445 Percentage variance accounted for 47.2 Standard error of observations is estimated to be 2.23 *** Estimates of parameters *** estimate s.e. t(31) Constant -0.49 1.11 -0.44 CWTotal 0.354 0.108 3.30 Grmiss 1.93 1.02 1.90
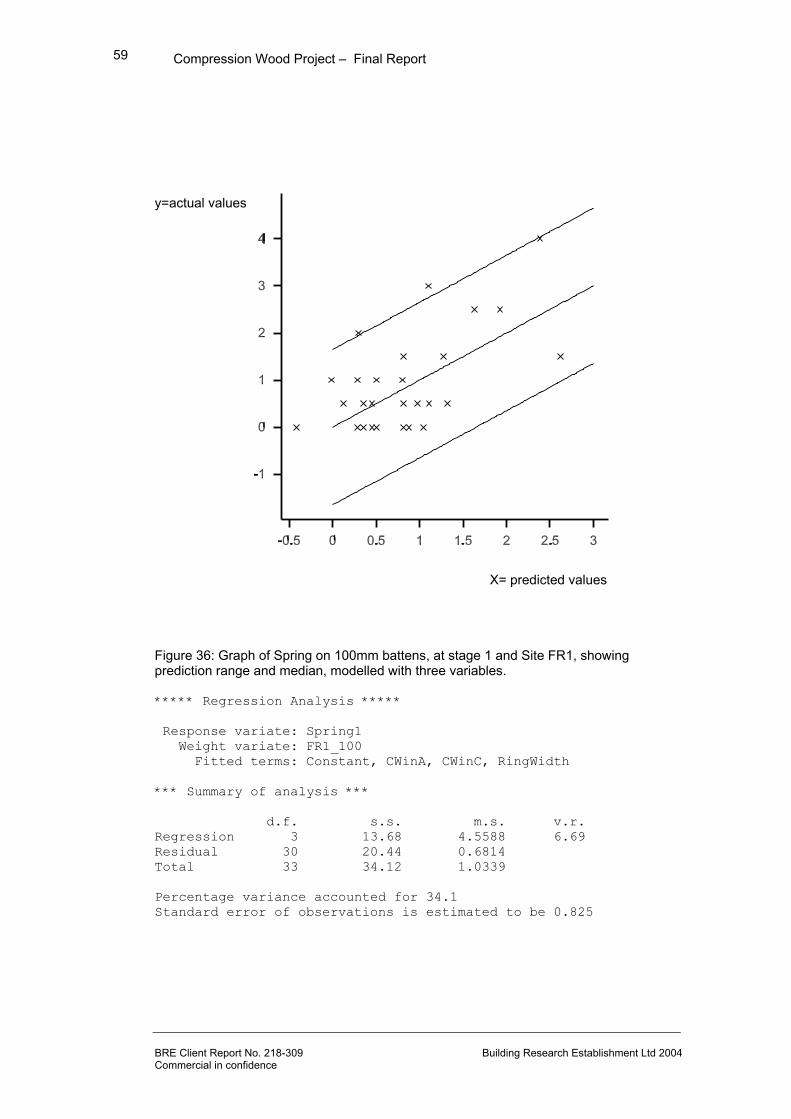
Compression Wood Project – Final Report
BRE Client Report No. 218-309 Building Research Establishment Ltd 2004 Commercial in confidence
59
y=actual values
X= predicted values Figure 36: Graph of Spring on 100mm battens, at stage 1 and Site FR1, showing prediction range and median, modelled with three variables. ***** Regression Analysis ***** Response variate: Spring1 Weight variate: FR1_100 Fitted terms: Constant, CWinA, CWinC, RingWidth *** Summary of analysis *** d.f. s.s. m.s. v.r. Regression 3 13.68 4.5588 6.69 Residual 30 20.44 0.6814 Total 33 34.12 1.0339 Percentage variance accounted for 34.1 Standard error of observations is estimated to be 0.825

Compression Wood Project – Final Report
BRE Client Report No. 218-309 Building Research Establishment Ltd 2004 Commercial in confidence
60
*** Estimates of parameters *** estimate s.e. t(30) Constant -1.320 0.720 -1.83 CWinA -0.521 0.258 -2.02 CWinC 0.815 0.250 3.26 RingWidth 0.230 0.104 2.22
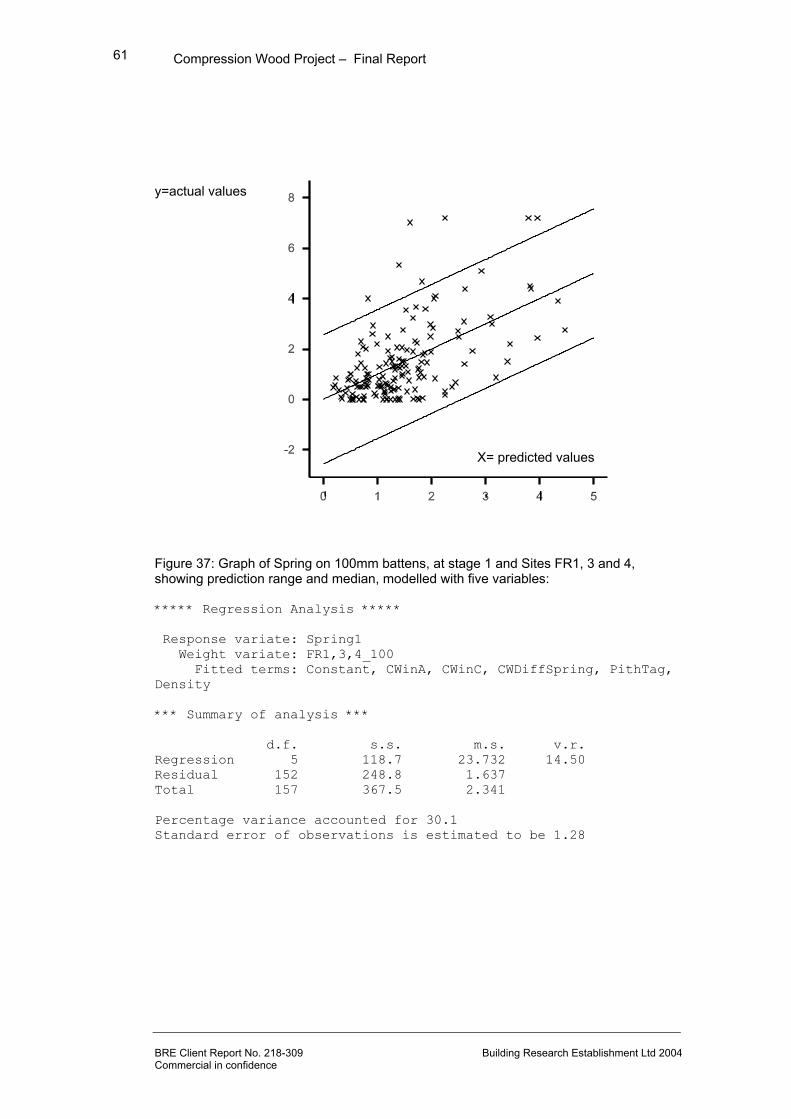
Compression Wood Project – Final Report
BRE Client Report No. 218-309 Building Research Establishment Ltd 2004 Commercial in confidence
61
y=actual values
X= predicted values Figure 37: Graph of Spring on 100mm battens, at stage 1 and Sites FR1, 3 and 4, showing prediction range and median, modelled with five variables: ***** Regression Analysis ***** Response variate: Spring1 Weight variate: FR1,3,4_100 Fitted terms: Constant, CWinA, CWinC, CWDiffSpring, PithTag, Density *** Summary of analysis *** d.f. s.s. m.s. v.r. Regression 5 118.7 23.732 14.50 Residual 152 248.8 1.637 Total 157 367.5 2.341 Percentage variance accounted for 30.1 Standard error of observations is estimated to be 1.28

Compression Wood Project – Final Report
BRE Client Report No. 218-309 Building Research Establishment Ltd 2004 Commercial in confidence
62
*** Estimates of parameters *** estimate s.e. t(152) Constant -2.353 0.980 -2.40 CWinA -0.814 0.212 -3.84 CWinC 0.511 0.218 2.35 CWDiffSpring 0.626 0.128 4.88 PithTag 0.547 0.260 2.11 Density 0.00956 0.00245 3.91
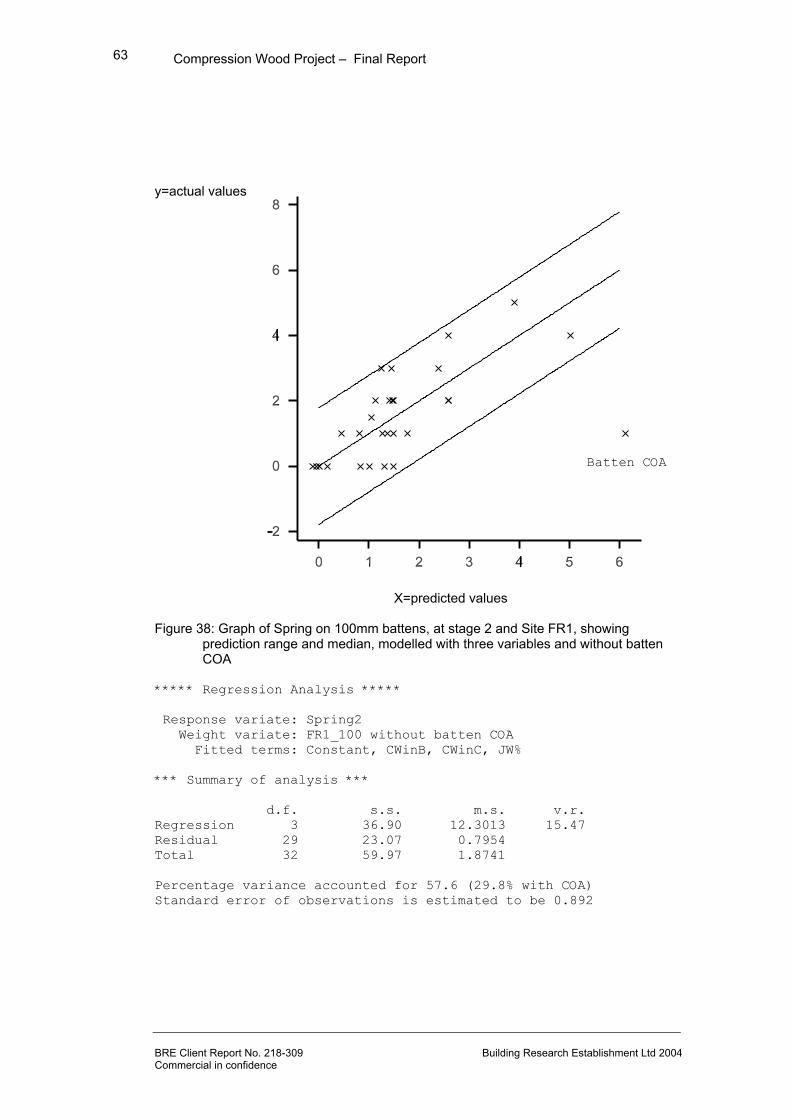
Compression Wood Project – Final Report
BRE Client Report No. 218-309 Building Research Establishment Ltd 2004 Commercial in confidence
63
y=actual values
Batten COA
X=predicted values Figure 38: Graph of Spring on 100mm battens, at stage 2 and Site FR1, showing
prediction range and median, modelled with three variables and without batten COA
***** Regression Analysis ***** Response variate: Spring2 Weight variate: FR1_100 without batten COA Fitted terms: Constant, CWinB, CWinC, JW% *** Summary of analysis *** d.f. s.s. m.s. v.r. Regression 3 36.90 12.3013 15.47 Residual 29 23.07 0.7954 Total 32 59.97 1.8741 Percentage variance accounted for 57.6 (29.8% with COA) Standard error of observations is estimated to be 0.892
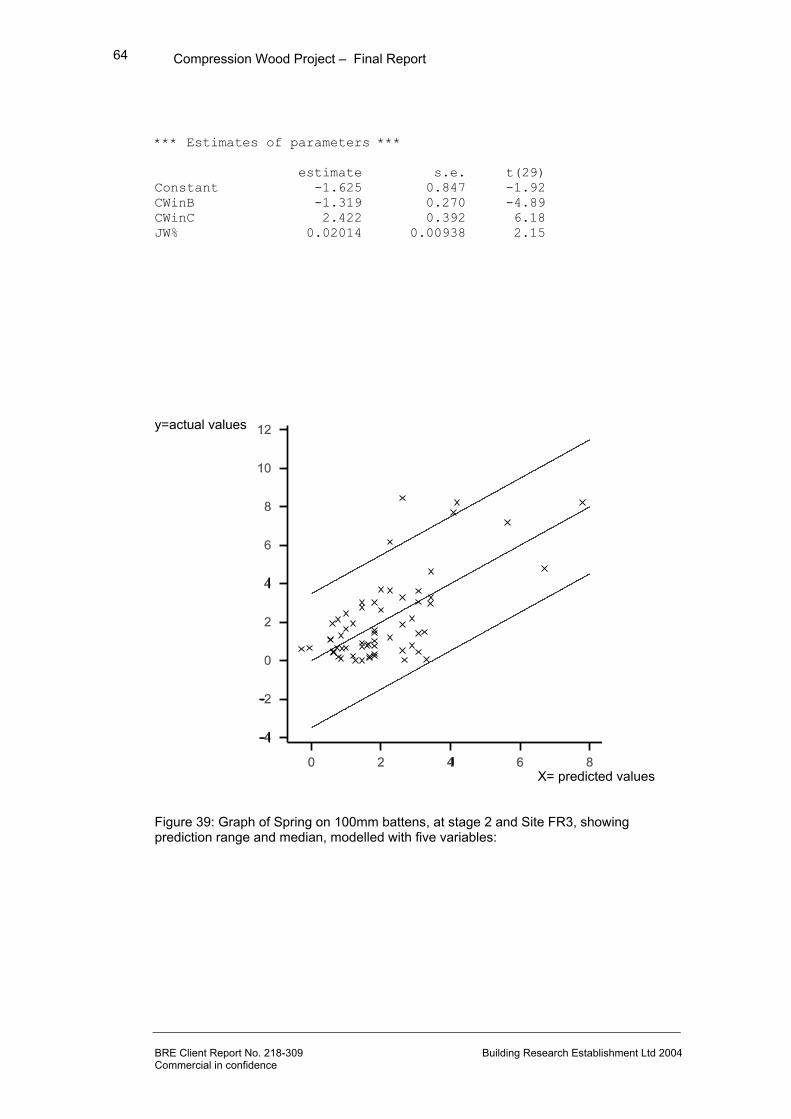
Compression Wood Project – Final Report
BRE Client Report No. 218-309 Building Research Establishment Ltd 2004 Commercial in confidence
64
*** Estimates of parameters *** estimate s.e. t(29) Constant -1.625 0.847 -1.92 CWinB -1.319 0.270 -4.89 CWinC 2.422 0.392 6.18 JW% 0.02014 0.00938 2.15
y=actual values X= predicted values Figure 39: Graph of Spring on 100mm battens, at stage 2 and Site FR3, showing prediction range and median, modelled with five variables:
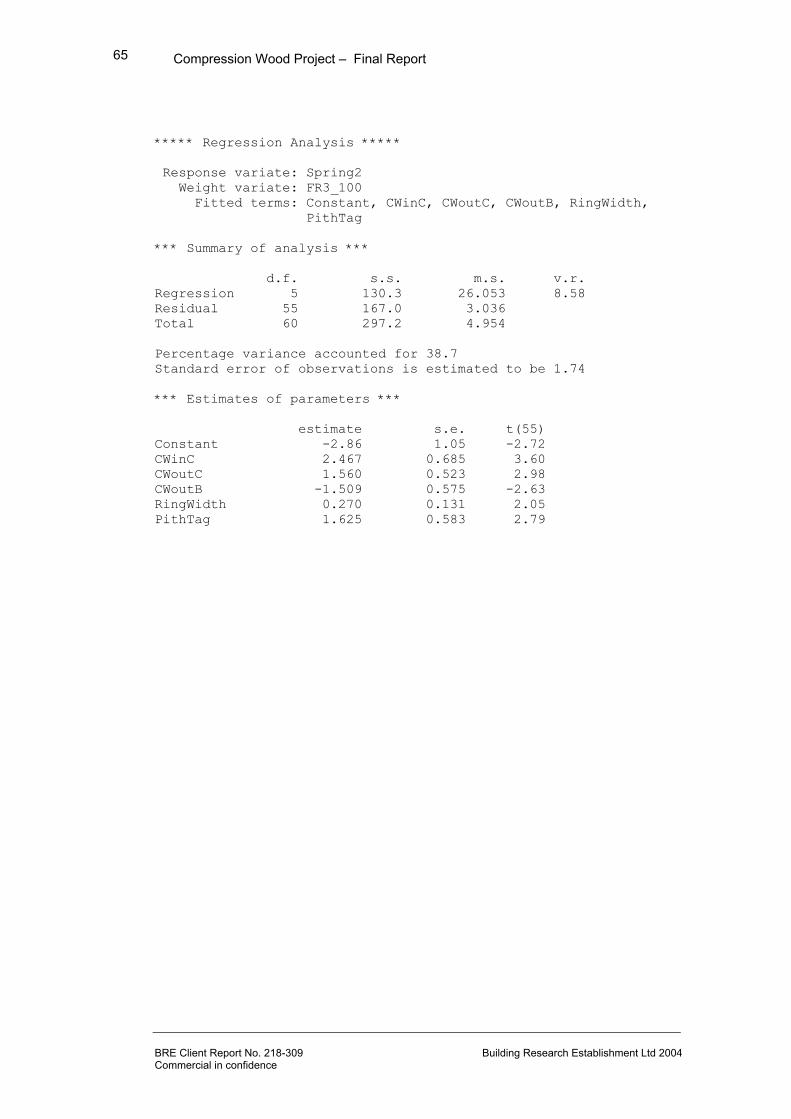
Compression Wood Project – Final Report
BRE Client Report No. 218-309 Building Research Establishment Ltd 2004 Commercial in confidence
65
***** Regression Analysis ***** Response variate: Spring2 Weight variate: FR3_100 Fitted terms: Constant, CWinC, CWoutC, CWoutB, RingWidth, PithTag *** Summary of analysis *** d.f. s.s. m.s. v.r. Regression 5 130.3 26.053 8.58 Residual 55 167.0 3.036 Total 60 297.2 4.954 Percentage variance accounted for 38.7 Standard error of observations is estimated to be 1.74 *** Estimates of parameters *** estimate s.e. t(55) Constant -2.86 1.05 -2.72 CWinC 2.467 0.685 3.60 CWoutC 1.560 0.523 2.98 CWoutB -1.509 0.575 -2.63 RingWidth 0.270 0.131 2.05 PithTag 1.625 0.583 2.79
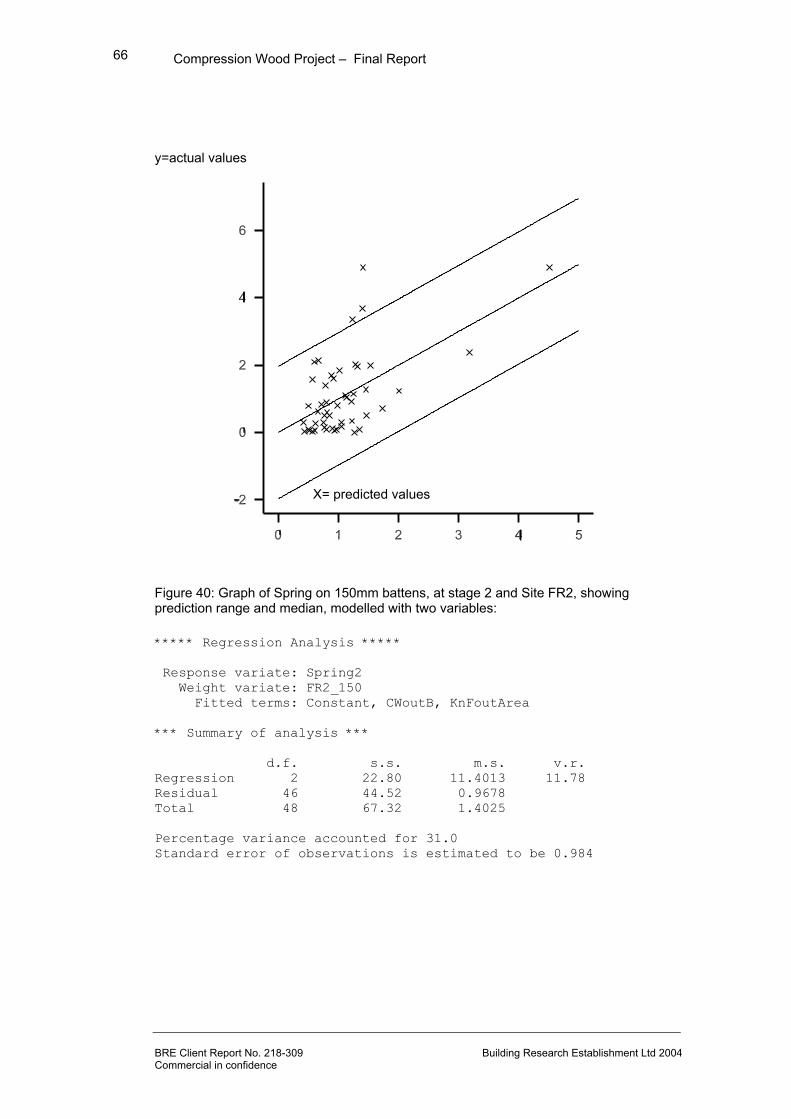
Compression Wood Project – Final Report
BRE Client Report No. 218-309 Building Research Establishment Ltd 2004 Commercial in confidence
66
y=actual values X= predicted values
Figure 40: Graph of Spring on 150mm battens, at stage 2 and Site FR2, showing prediction range and median, modelled with two variables: ***** Regression Analysis ***** Response variate: Spring2 Weight variate: FR2_150 Fitted terms: Constant, CWoutB, KnFoutArea *** Summary of analysis *** d.f. s.s. m.s. v.r. Regression 2 22.80 11.4013 11.78 Residual 46 44.52 0.9678 Total 48 67.32 1.4025 Percentage variance accounted for 31.0 Standard error of observations is estimated to be 0.984

Compression Wood Project – Final Report
BRE Client Report No. 218-309 Building Research Establishment Ltd 2004 Commercial in confidence
67
*** Estimates of parameters *** estimate s.e. t(46) Constant -1.757 0.606 -2.90 CWoutB 2.076 0.457 4.55 KnFoutArea 0.0001391 0.0000547 2.54
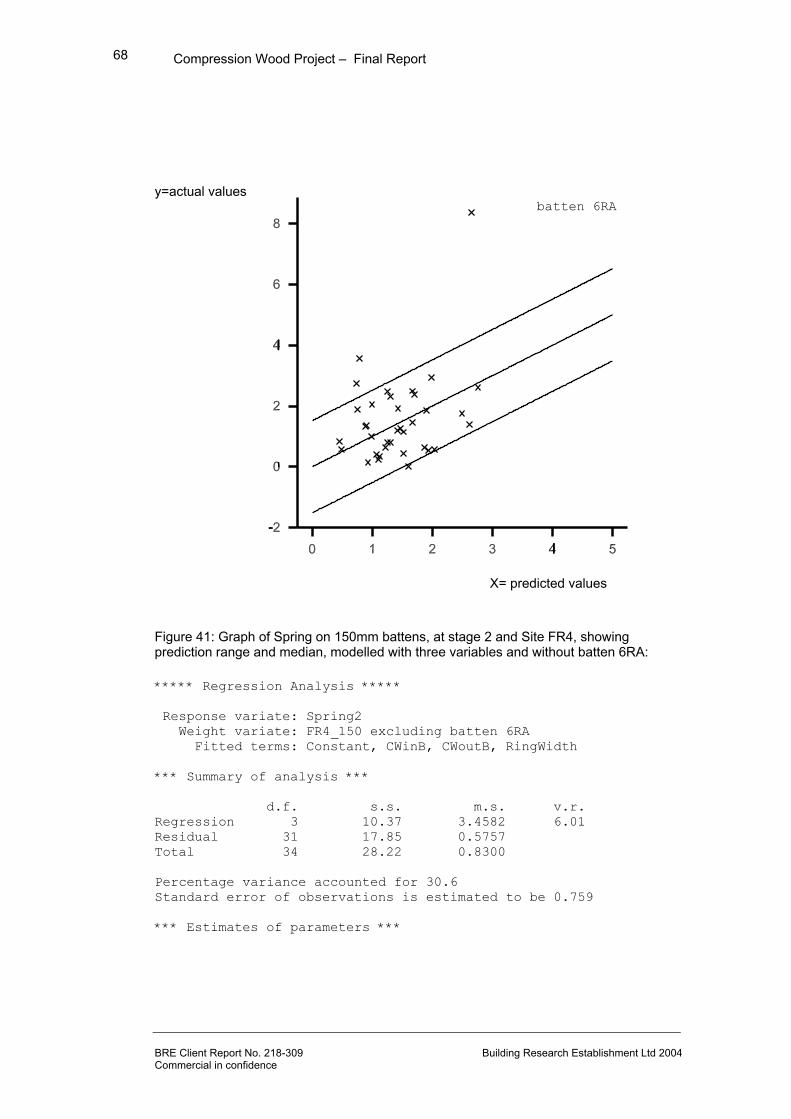
Compression Wood Project – Final Report
BRE Client Report No. 218-309 Building Research Establishment Ltd 2004 Commercial in confidence
68
y=actual values batten 6RA
X= predicted values
Figure 41: Graph of Spring on 150mm battens, at stage 2 and Site FR4, showing prediction range and median, modelled with three variables and without batten 6RA: ***** Regression Analysis ***** Response variate: Spring2 Weight variate: FR4_150 excluding batten 6RA Fitted terms: Constant, CWinB, CWoutB, RingWidth *** Summary of analysis *** d.f. s.s. m.s. v.r. Regression 3 10.37 3.4582 6.01 Residual 31 17.85 0.5757 Total 34 28.22 0.8300 Percentage variance accounted for 30.6 Standard error of observations is estimated to be 0.759 *** Estimates of parameters ***

Compression Wood Project – Final Report
BRE Client Report No. 218-309 Building Research Establishment Ltd 2004 Commercial in confidence
69
estimate s.e. t(31) Constant 1.595 0.552 2.89 CWinB 1.168 0.301 3.89 CWoutB -0.523 0.273 -1.92 RingWidth -0.1545 0.0724 -2.13
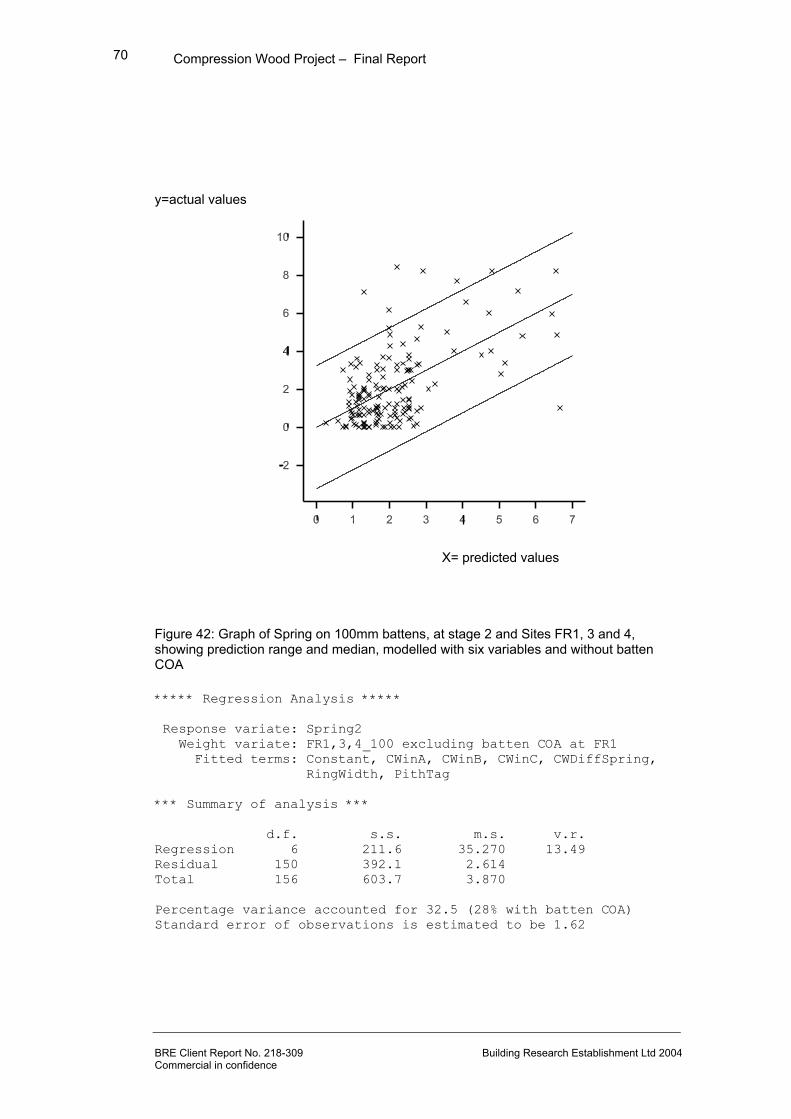
Compression Wood Project – Final Report
BRE Client Report No. 218-309 Building Research Establishment Ltd 2004 Commercial in confidence
70
y=actual values
X= predicted values
Figure 42: Graph of Spring on 100mm battens, at stage 2 and Sites FR1, 3 and 4, showing prediction range and median, modelled with six variables and without batten COA ***** Regression Analysis ***** Response variate: Spring2 Weight variate: FR1,3,4_100 excluding batten COA at FR1 Fitted terms: Constant, CWinA, CWinB, CWinC, CWDiffSpring, RingWidth, PithTag *** Summary of analysis *** d.f. s.s. m.s. v.r. Regression 6 211.6 35.270 13.49 Residual 150 392.1 2.614 Total 156 603.7 3.870 Percentage variance accounted for 32.5 (28% with batten COA) Standard error of observations is estimated to be 1.62

Compression Wood Project – Final Report
BRE Client Report No. 218-309 Building Research Establishment Ltd 2004 Commercial in confidence
71
*** Estimates of parameters ***
estimate s.e. t(150) Constant 0.215 0.611 0.35 CWinA -0.703 0.300 -2.35 CWinB -0.708 0.271 -2.61 CWinC 1.565 0.366 4.28 CWDiffSpring 0.714 0.170 4.20 RingWidth 0.1617 0.0809 2.00 PithTag 1.083 0.335 3.24
To further investigate the potential for modelling bow and spring, extensive re-analysis of the more detailed compression wood data collected during the STUD project (Maun et al, 2000) was also carried out (detailed in Appendix 3). This data used a 5mm grid to define compression wood presence on the surface on all four faces and edges of the board. Similarly with the above work, distortion data was available for a range of moisture contents. The models produced showed only a marginal improvement in variance explained by the less detailed characterisation of the battens which were the principal subject of this work (Sitka spruce from stands FR1, 2, 3 and 4).

Compression Wood Project – Final Report
BRE Client Report No. 218-309 Building Research Establishment Ltd 2004 Commercial in confidence
72
Conclusions Report Summary:
• Work on determining compression wood properties and in evaluating in-line 3D log sorting for compression wood has gone very well – yielding useful results.
• Compression wood was found to have little effect on the stiffness of full scale battens stiffness and therefore should not be a significant variable in predicting machine grade output (Indicating Property). However, because compression wood is denser than normal wood whilst at the same time having apparently higher rate of growth (in terms of ring width); this tends to undermine the normal relationship of timber stiffness, rate of growth and density.
• In small clear samples (300 x 20 x 20mm) a trend for decreasing stiffness with increasing amounts of compression wood was observed.
• Compression wood was found to occur in straight, round logs – often leading to serious distortion because the compression wood was consistently along the edge or side of a batten.
• Log ovality was not found to be a good indicator of the likelihood of compression wood being present in battens.
• Modelling work for machine grading stiffness (low mean IP) showed good results for 100 x 47mm size battens, but was less successful for 150 x 47mm battens. The most successful combined site model for 100 x 47mm battens explained 56% of the variance, however it was found that for differing sites and sizes of timber (ie different parts of the tree) there were differing significant variables both positive and negative. This modelling work used simple variables such as density, slope of grain, Knot Area Ratio etc, rather than the weighted knot variables or transformed variables which were used in some of the earlier work (Maun, 1998).
• Modelling work did not have a high level of success in predicting distortion in bow and spring because it is simply not possible to determine with any certainty the extent and nature of compression wood below the surface, without cross cutting into sections
• Because of the generally lower level of compression wood and bow and spring in the FR1,2,3 and 4 sets of timber and the fact that that detailed STUD data already existed, the models were re-worked using compression wood variables alone. The rate of prediction is described as successful by the modeller; however they account for only 40% of the variance.
• Based on longitudinal shrinkage of small scale samples of normal wood and compression wood it was possible to calculate the maximum bow and spring of full scale battens.
• Investigations into the potential of image analysis, laser tracheid effect and X rays to identify compression wood in battens has taken place, but these methods are not capable of resolving below the surface details.
• Preliminary recommendations for dealing with compression wood have been formulated. In general it is recommended that compression wood rich material should be ear-marked for applications were it will not be allowed to dry out unrestrained, or where it is well-restrained in service e.g. timber frame.
• Generally, compression wood in large sizes of timber such as joists will have a more serious effect than on shorter, smaller sections such as timber frame studding and one solution might be to cut down 200mm joists into 100mm studding on indications of high compression wood content. This will, however,
Compression Wood Project – Final Report
BRE Client Report No. 218-309 Building Research Establishment Ltd 2004 Commercial in confidence
73
require an advanced scanner to be placed in-line. It is important to realise that the opportunity for close inspection of battens probably only currently occurs during grading and that if re-sizing is performed the material will have to be graded once more.
• The particular need to effectively deal with compression wood in laminated re-engineered timber products has been highlighted
• Two scientific papers were produced as a result of this work (for WCTE 2004 and Forestry Wood Chain 2004).
• It was noted on a batch of machine grade rejects currently under study by BRE that severe compression wood was associated with poor stem form in early tree life
References BRE Digest 229 Estimation of thermal and moisture movements and stresses: Part 3 Maun K. (1998) The relationship between growth characteristics of sawn timber, logs and machine stress grading BRE Client Report CR 166/98 Ormarsson, S. (1999) Numerical analysis of moisture-related distortions in sawn timber. Doctoral thesis. Department of structural mechanics, Chalmers University of Technology, Göteborg, Sweden Perstorper, M., Pellicane, I.R., Kliger, R. & Johansson, G. (1995). Quality of timber products from Norway spruce part 2. Influence of spatial position and growth characteristics on warp. Wood Science and Technology 29, 339-352. Stevens, W.C. (1961) Distortions of Wood: Drying With and Without Restraint. Forest Products Journal August 1961 p 318 to 356 Warensjo, M (2004) Swedish University of Agricultural Sciences - Personal Communication Warensjo, M (2004) Compression wood in Scots pine and Norway spruce – distribution in relation to external geometry and the impact on dimensional stability in sawn wood. Doctoral thesis, Swedish University of Agricultural Sciences
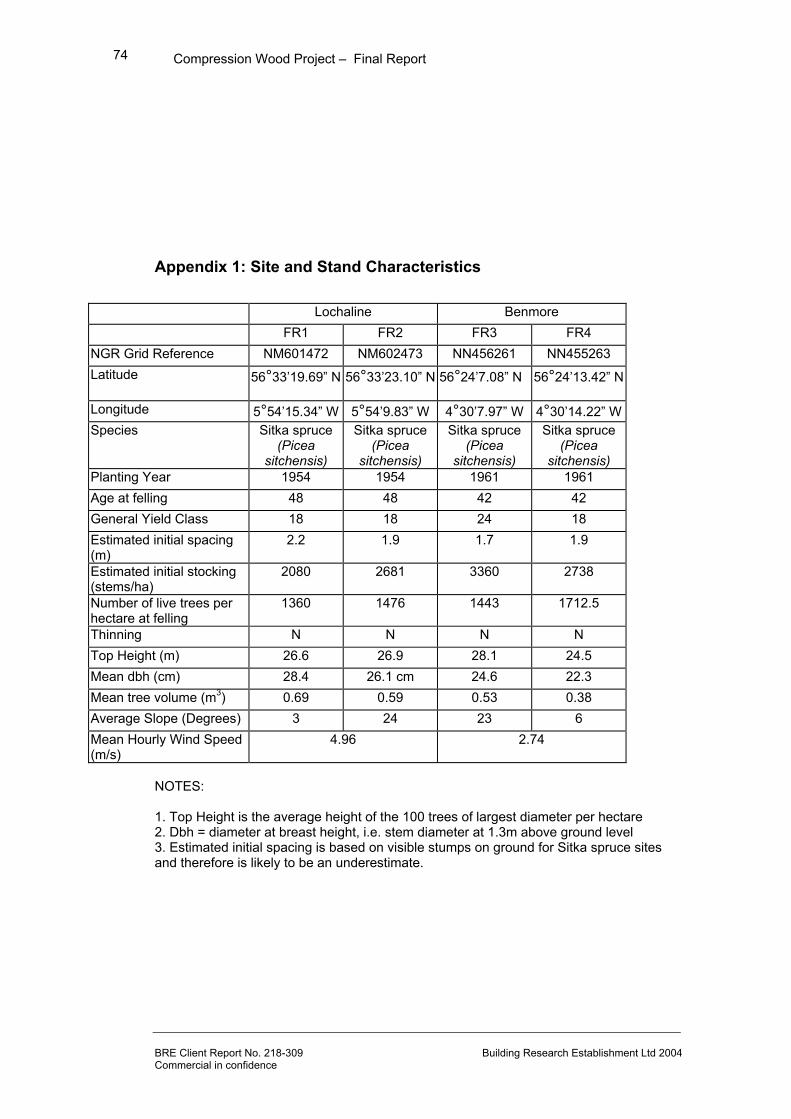
Compression Wood Project – Final Report
BRE Client Report No. 218-309 Building Research Establishment Ltd 2004 Commercial in confidence
74
Appendix 1: Site and Stand Characteristics
Lochaline Benmore FR1 FR2 FR3 FR4 NGR Grid Reference NM601472 NM602473 NN456261 NN455263 Latitude 56°33’19.69” N
56°33’23.10” N 56°24’7.08” N 56°24’13.42” N
Longitude 5°54’15.34” W 5°54’9.83” W 4°30’7.97” W 4°30’14.22” W Species Sitka spruce
(Picea sitchensis)
Sitka spruce (Picea
sitchensis)
Sitka spruce (Picea
sitchensis)
Sitka spruce (Picea
sitchensis) Planting Year 1954 1954 1961 1961 Age at felling 48 48 42 42 General Yield Class 18 18 24 18 Estimated initial spacing (m)
2.2 1.9 1.7 1.9
Estimated initial stocking (stems/ha)
2080 2681 3360 2738
Number of live trees per hectare at felling
1360 1476 1443 1712.5
Thinning N N N N Top Height (m) 26.6 26.9 28.1 24.5 Mean dbh (cm) 28.4 26.1 cm 24.6 22.3 Mean tree volume (m3) 0.69 0.59 0.53 0.38 Average Slope (Degrees) 3 24 23 6 Mean Hourly Wind Speed (m/s)
4.96 2.74
NOTES: 1. Top Height is the average height of the 100 trees of largest diameter per hectare 2. Dbh = diameter at breast height, i.e. stem diameter at 1.3m above ground level 3. Estimated initial spacing is based on visible stumps on ground for Sitka spruce sites and therefore is likely to be an underestimate.

Compression Wood Project – Final Report
BRE Client Report No. 218-309 Building Research Establishment Ltd 2004 Commercial in confidence
75
Appendix 2: BRE Sawn Timber Testing Protocol
Incidence of Compression Wood The battens studied by BRE are 3m long and 100,150 and 200mm width, 47mm thick. These are sawn from the log in an industry standard square cant. This method is used as the basic recording of visible surface compression wood only. It does not attempt to describe the intensity or darkness of the compression wood, nor indicate the presence of below-the-surface compression wood, nor does in take into account at this stage the pattern of compression wood vis tangential/radial surface cut (i.e. whether the batten is a box pith or an outer piece), nor make any record of the grain pattern. The compression wood areas are marked out on the wide faces of the battens, along the whole length, but recorded along the centre 2000mm. This corresponds to the region in which distortion is measured, where machine grading results are available, and where for most pieces a standard four-point bending test can be performed. In other analysis, such as comparing log shape characteristics to incidence of compression wood, the battens are reassembled to form the log and all areas of compression wood are considered, in conjunction with features such as large knots, whilst also looking at the cross section. This method belies the very great difficulty in assessing the compression wood content of a batten, particularly when they are of large section and long. However, it can be used to indicate which battens have the most compression wood, and which have a likely imbalance from one face to another causing spring or bow. The presence of significant compression wood is quite subjective: in all of the BRE work the same operator (an experience wood scientist) carried out the procedure. Instructions: 1. Place the batten on the support surface with the top end of the batten to the left (in the BRE samples this end has the plastic tag and indented number/colour marking; whilst the other end is the lower or butt end of the log which will have some fragment of the original multicoloured segment marking "NSEW" and some fragment of the original marker pen site and log ID mark). 2. First select the inner face (nearest to the pith) of the batten. Where the two ends vary in this respect as a result of wandering pith or conversion - use the end with the plastic tag to decide the inner face. 3. With the inner face uppermost, mark the outer quarters and inner half of the batten width with A, B, and C, with A being the quarter furthest from you i.e. these are strips along the length of the batten, thus:
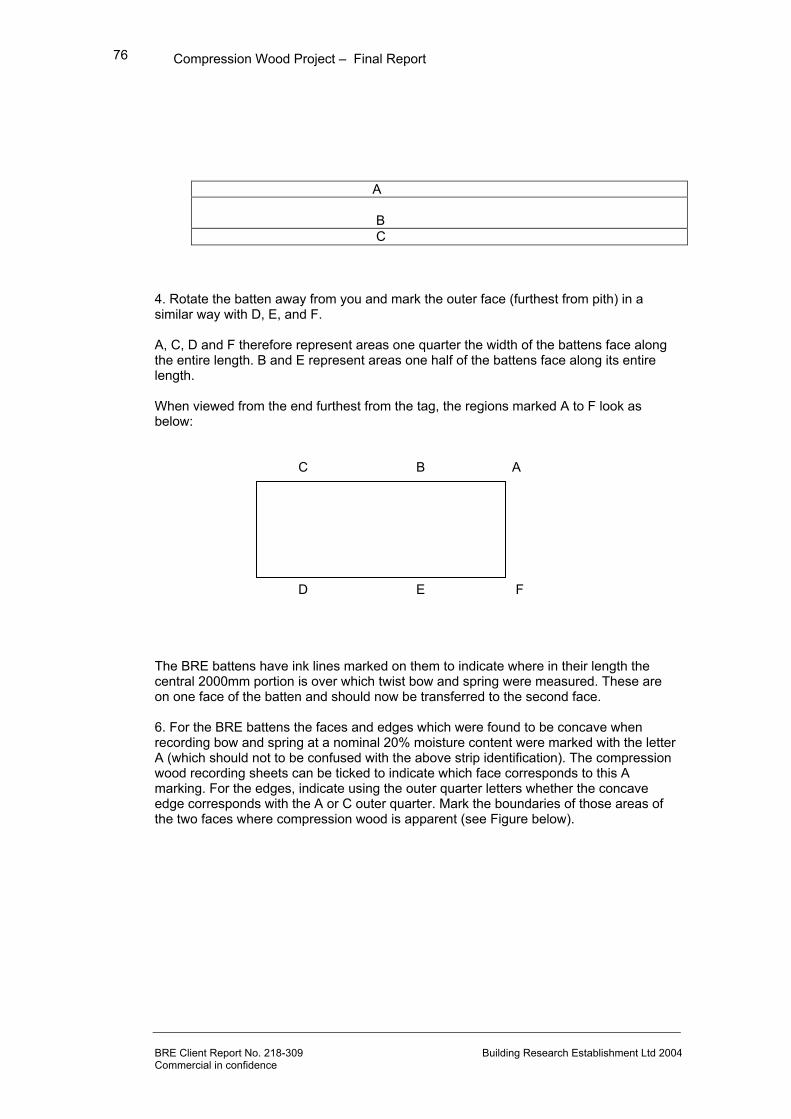
Compression Wood Project – Final Report
BRE Client Report No. 218-309 Building Research Establishment Ltd 2004 Commercial in confidence
76
A B C
4. Rotate the batten away from you and mark the outer face (furthest from pith) in a similar way with D, E, and F. A, C, D and F therefore represent areas one quarter the width of the battens face along the entire length. B and E represent areas one half of the battens face along its entire length. When viewed from the end furthest from the tag, the regions marked A to F look as below: C B A
D E F The BRE battens have ink lines marked on them to indicate where in their length the central 2000mm portion is over which twist bow and spring were measured. These are on one face of the batten and should now be transferred to the second face. 6. For the BRE battens the faces and edges which were found to be concave when recording bow and spring at a nominal 20% moisture content were marked with the letter A (which should not to be confused with the above strip identification). The compression wood recording sheets can be ticked to indicate which face corresponds to this A marking. For the edges, indicate using the outer quarter letters whether the concave edge corresponds with the A or C outer quarter. Mark the boundaries of those areas of the two faces where compression wood is apparent (see Figure below).
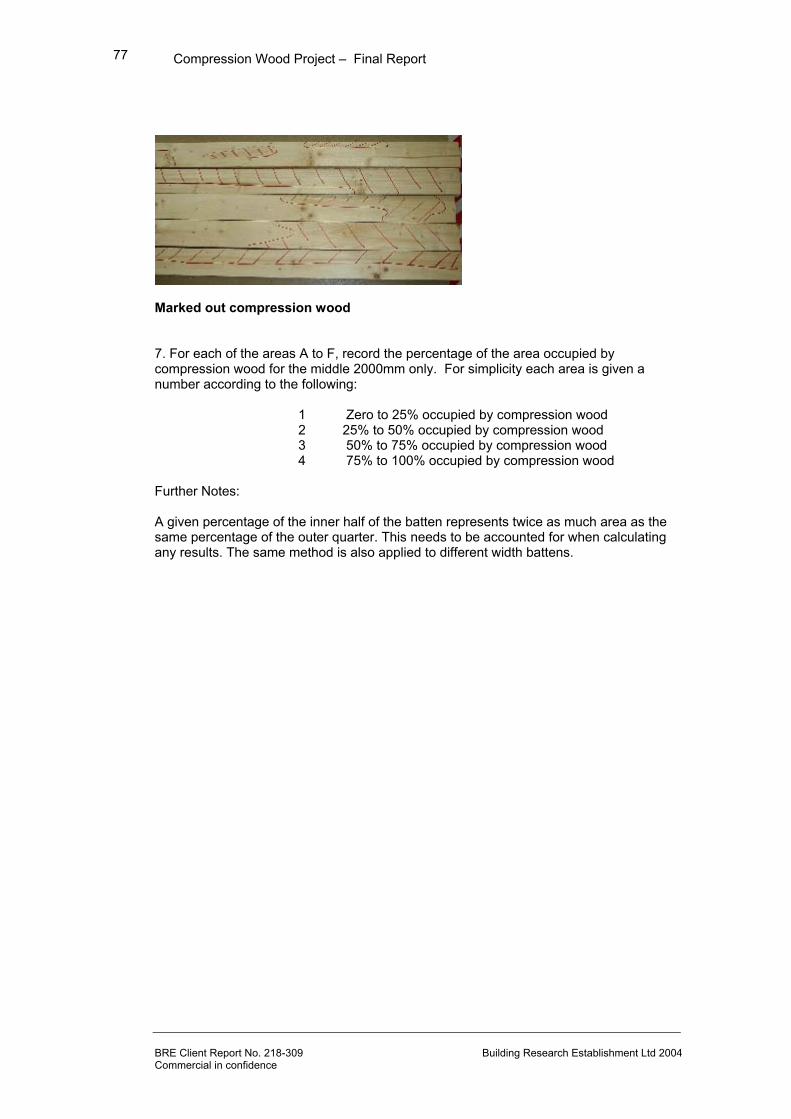
Compression Wood Project – Final Report
BRE Client Report No. 218-309 Building Research Establishment Ltd 2004 Commercial in confidence
77
Marked out compression wood 7. For each of the areas A to F, record the percentage of the area occupied by compression wood for the middle 2000mm only. For simplicity each area is given a number according to the following:
1 Zero to 25% occupied by compression wood 2 25% to 50% occupied by compression wood 3 50% to 75% occupied by compression wood 4 75% to 100% occupied by compression wood
Further Notes: A given percentage of the inner half of the batten represents twice as much area as the same percentage of the outer quarter. This needs to be accounted for when calculating any results. The same method is also applied to different width battens.
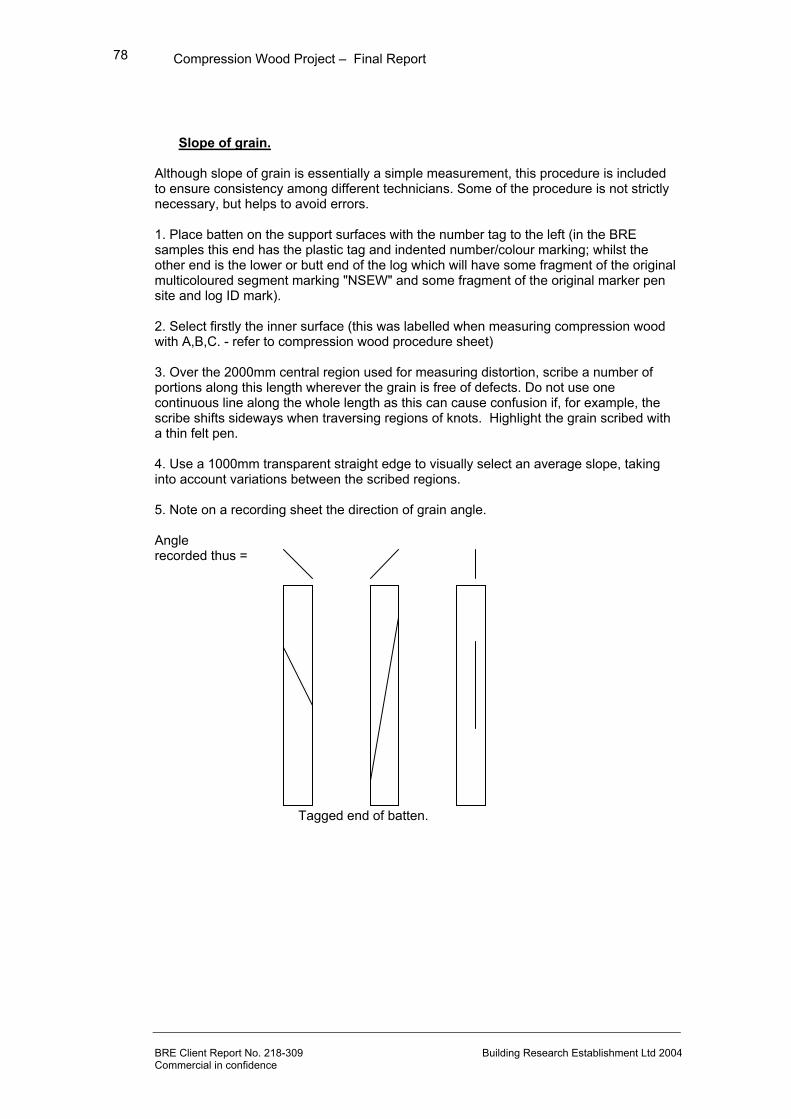
Compression Wood Project – Final Report
BRE Client Report No. 218-309 Building Research Establishment Ltd 2004 Commercial in confidence
78
Slope of grain.
Although slope of grain is essentially a simple measurement, this procedure is included to ensure consistency among different technicians. Some of the procedure is not strictly necessary, but helps to avoid errors. 1. Place batten on the support surfaces with the number tag to the left (in the BRE samples this end has the plastic tag and indented number/colour marking; whilst the other end is the lower or butt end of the log which will have some fragment of the original multicoloured segment marking "NSEW" and some fragment of the original marker pen site and log ID mark). 2. Select firstly the inner surface (this was labelled when measuring compression wood with A,B,C. - refer to compression wood procedure sheet) 3. Over the 2000mm central region used for measuring distortion, scribe a number of portions along this length wherever the grain is free of defects. Do not use one continuous line along the whole length as this can cause confusion if, for example, the scribe shifts sideways when traversing regions of knots. Highlight the grain scribed with a thin felt pen. 4. Use a 1000mm transparent straight edge to visually select an average slope, taking into account variations between the scribed regions. 5. Note on a recording sheet the direction of grain angle.
Angle recorded thus =
+ _ Tagged end of batten.

Compression Wood Project – Final Report
BRE Client Report No. 218-309 Building Research Establishment Ltd 2004 Commercial in confidence
79
6. Record the distances between the batten edge and the two marks 1000mm apart on the diagonal straight edge which is labelled Left and Right. Left Right 1000mm
7. Basic trigonometry gives you the grain angle 8. Repeat this on the outer face, which was labelled during compression wood recording as D,E,F Note: These are the angles as viewed on the surfaces and thus the two opposing faces are as seen looking in opposing directions within the tree. Only the outer face will represent spiral grain as seen looking from bark to pith. The inner face is recorded as seen looking from pith towards bark and may need to be reversed in direction if considering spirallity in the tree.

Compression Wood Project – Final Report
BRE Client Report No. 218-309 Building Research Establishment Ltd 2004 Commercial in confidence
80
Machine Grading This was carried out in accordance with BS EN 519 (pr EN 14081-1/2/3), which details operating principals and procedure. In UK the grading machine used is a Cook Bollinder grader. Values of Indicating Property (IP) are recorded every 100mm. The orientation of the batten is known during both passes and kept constant for the sample. This enables the value of IP to correlate to the height of log. Values of Ep may be derived from IP using standard mechanics equations. In the UK machine settings are based on the BS 5268 specification for strength class (based permissible stress). The CEN specification for strength class is detailed in EN 338 (based on characteristic stress). Machine settings for EN 338 will be in pr EN 14081-4 (in preparation); none formally exist at the present, although comparative data does. Visual grading procedure (knot sizes and positions) This method conforms to BS 4978: 1996 (determining TKAR and MKAR). Using in the UK BS 4978 grades GS (General Structural) and SS (Special Structural). The assignment of visual grades/species to strength class uses BS EN 1912 (eg for UK whitewood SS = C24 GS = C16) TKAR = Total knot area ratio, the total area of the knot that appears in the cross section of the knot plot. MKAR = Marginal knot area ratio, the area of the knots that appear in the margins. Each margin is equal to 25% of the whole cross section.
• Note position of worst knot cluster relative to one end of the batten • Transfer knot dimensions to prepared knot plot template (see below). • Join all points to show path of knot through the cross section. Where more than one
knot is in the locality and the grain has not recovered all such knots should be included.
• Calculate the total area of the knots in the cross section. Where knots overlap only count the shaded area once.
• Calculate the portions of the knots in both margins, record TKAR and MKAR • It is easier to calculate these areas (TKAR & MKAR) as % rather than fractions.

Compression Wood Project – Final Report
BRE Client Report No. 218-309 Building Research Establishment Ltd 2004 Commercial in confidence
81
• Refer to BS 4978 to determine grade using the TKAR and the worst case MKAR (see Figure 3)
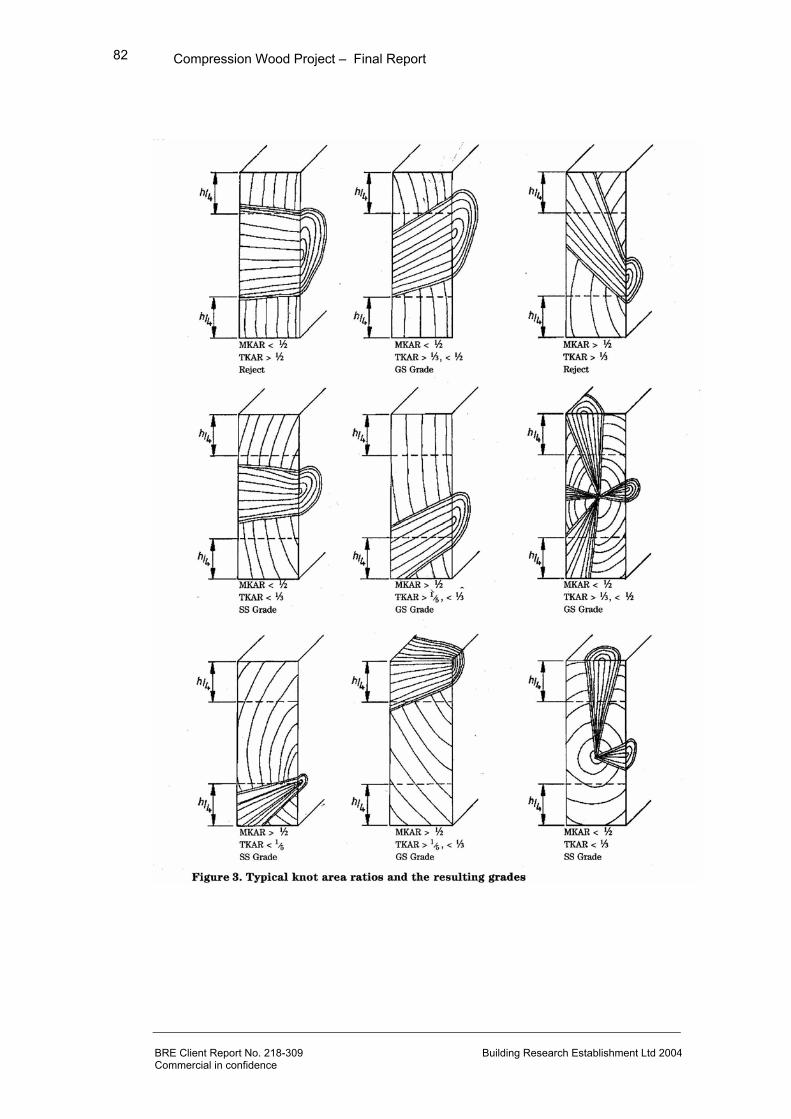
Compression Wood Project – Final Report
BRE Client Report No. 218-309 Building Research Establishment Ltd 2004 Commercial in confidence
82

Compression Wood Project – Final Report
BRE Client Report No. 218-309 Building Research Establishment Ltd 2004 Commercial in confidence
83
Notes: Knot sizes (largest and smallest diameters) and position of centre (co-ordinates x, y relative to tagged lower corner are also noted, on both ABC and DEF sides of batten) - for worst knot cluster. On some battens all knot positions and sizes are recorded. Strength Testing The method of testing MOE and MOR conforms with EN 408, with analysis of results to EN 384: Options for positioning of the sample are as follows: 1. Lowest IP value from grader to be in middle 1/3 (usually a knot group) 2. Compression wood area in middle 1/3 3. Centrally placed Another variation is which way up the plank is (defect in tension or compression zone) or random. The "usual" method (eg for derivation of machine settings) is to test lowest IP in the middle 1/3, but random way up, and to correlate that reading of IP to MOE and MOR. For 100mm depth samples of 3m length some decision has to be made on the position of the plank. For 150mm samples of 3m length no decision needs to be made because the 6d /18d loading arrangement gives almost no choice. For both 100mm and 150mm there is a choice on orientation. 200mm depth samples of 3m length cannot be tested to EN408.

Compression Wood Project – Final Report
BRE Client Report No. 218-309 Building Research Establishment Ltd 2004 Commercial in confidence
84
Appendix 3 - Report on Models of Spring and Bow using only Compression Wood variables and based on STUD data from 1999 and 2002
Using very detailed measurements of compression wood, it has been possible to develop models for spring and bow, at both stages 3 and 4, using only the compression wood data.
Development of Models The data received in 1999 included distortion, both spring and bow at different stages for two sites – 71 and 72. Models were developed, separately for each site, for this data using a number of growth variables including compression wood. In 2002 new data arrived, for many of the same battens, included much more detailed measurements of compression wood at 50 stations along the length of the batten. From the new compression wood data a total of 16 variables were derived. These represented both the distribution of the compressed wood over the centre and sides of the faces and edges of the battens (eight variables) and the relative positioning of these along the length of the batten (eight variables). These 16 variables are defined in Table A3 - 1. Variable Definition CWThroF Total of minimum compression wood on a face at each station CWThroE Total of minimum compression wood on an edge at each station CWFonly1 Compression wood on face 1 with nothing on face 2 at the same station CWFonly2 Compression wood on face 2 with nothing on face 1 at the same station CWEonly1 Compression wood on edge 1 with nothing on edge 2 at the same station CWEonly2 Compression wood on edge 2 with nothing on edge 1 at the same station CWFdiff Absolute difference between CWFonly1 and CWFonly2 CWEdiff Absolute difference between CWEonly1 and CWEonly2 CWSWc Compression wood in west centre of batten edges CWSEc Compression wood in east centre of batten edges CWSEe Compression wood on east side of batten edges CWSWe Compression wood on west side of batten edges CWWc Compression wood in centre of west batten face CWWe Compression wood on sides of west batten face CWEc Compression wood in centre of east batten face CWEe Compression wood on sides of east batten face
Table A3 - 1 Site 71 showed more association between distortion and compression wood than site 72. Site 71also had more battens in the data, 65 compared to 40, so this report concentrates on models for this site.

Compression Wood Project – Final Report
BRE Client Report No. 218-309 Building Research Establishment Ltd 2004 Commercial in confidence
85
Models for Spring Each of the two models for spring uses the same six variables and the models have very similar success, accounting for 38.2 and 38.5 % of the variance. Four of the variables produce a negative effect, including the three describing the relative position of compression wood along the length of the batten. The models suggest that the appearance of compression wood particularly on both faces or on both edges, at the same station, reduces the spring of the batten. The total of the compression wood, when recorded in detail, also has this negative significance but accounts for less than 3% of the variance.
Models for Bow Initial models for bow were considered unsatisfactory as they depended too much on a batten with an extreme value of bow. This difficulty was overcome by using a transformed variable. Experimentation led to the use of the fourth root of bow and this allowed acceptable models, which predict between 30% and 40% of the variance. Two models are given for each stage, one with four variables and one with seven, to demonstrate the lack of independence between the variables and thus the different models that can be obtained. It is clear from the models of bow that compression wood has an overall positive relationship with bow. The total of the compression wood, when recorded in detail, has this positive significance and accounts for 12.6% (transformed bow 3) and 20.8% (transformed bow 4) of the variance. Without the transformation of the bow variables, these models accounted for less than 3% and less than 7% of the variance.
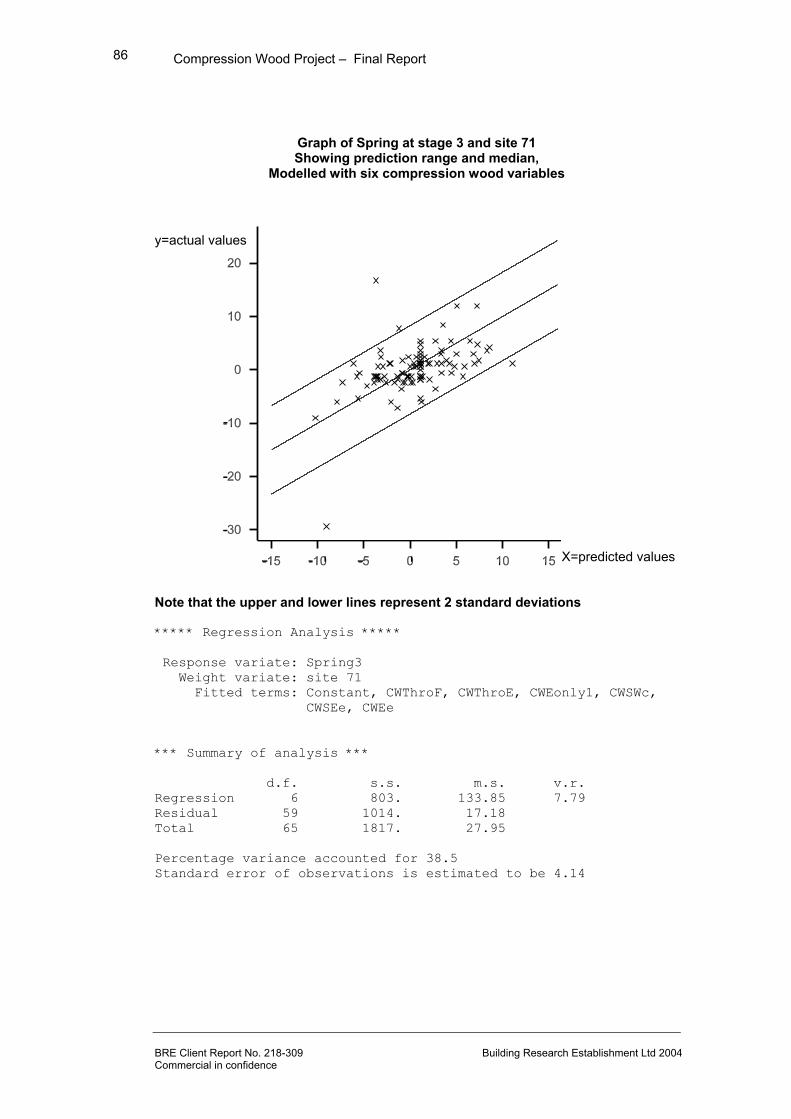
Compression Wood Project – Final Report
BRE Client Report No. 218-309 Building Research Establishment Ltd 2004 Commercial in confidence
86
Graph of Spring at stage 3 and site 71 Showing prediction range and median,
Modelled with six compression wood variables
y=actual values X=predicted values Note that the upper and lower lines represent 2 standard deviations ***** Regression Analysis ***** Response variate: Spring3 Weight variate: site 71 Fitted terms: Constant, CWThroF, CWThroE, CWEonly1, CWSWc, CWSEe, CWEe *** Summary of analysis *** d.f. s.s. m.s. v.r. Regression 6 803. 133.85 7.79 Residual 59 1014. 17.18 Total 65 1817. 27.95 Percentage variance accounted for 38.5 Standard error of observations is estimated to be 4.14

Compression Wood Project – Final Report
BRE Client Report No. 218-309 Building Research Establishment Ltd 2004 Commercial in confidence
87
*** Estimates of parameters *** estimate s.e. t(59) Constant 1.112 0.716 1.55 CWThroF -0.0858 0.0277 -3.10 CWThroE -0.1061 0.0429 -2.47 CWEonly1 -0.1113 0.0211 -5.28 CWSWc 0.383 0.101 3.80 CWSEe -0.178 0.104 -1.70 CWEe 0.1104 0.0389 2.84
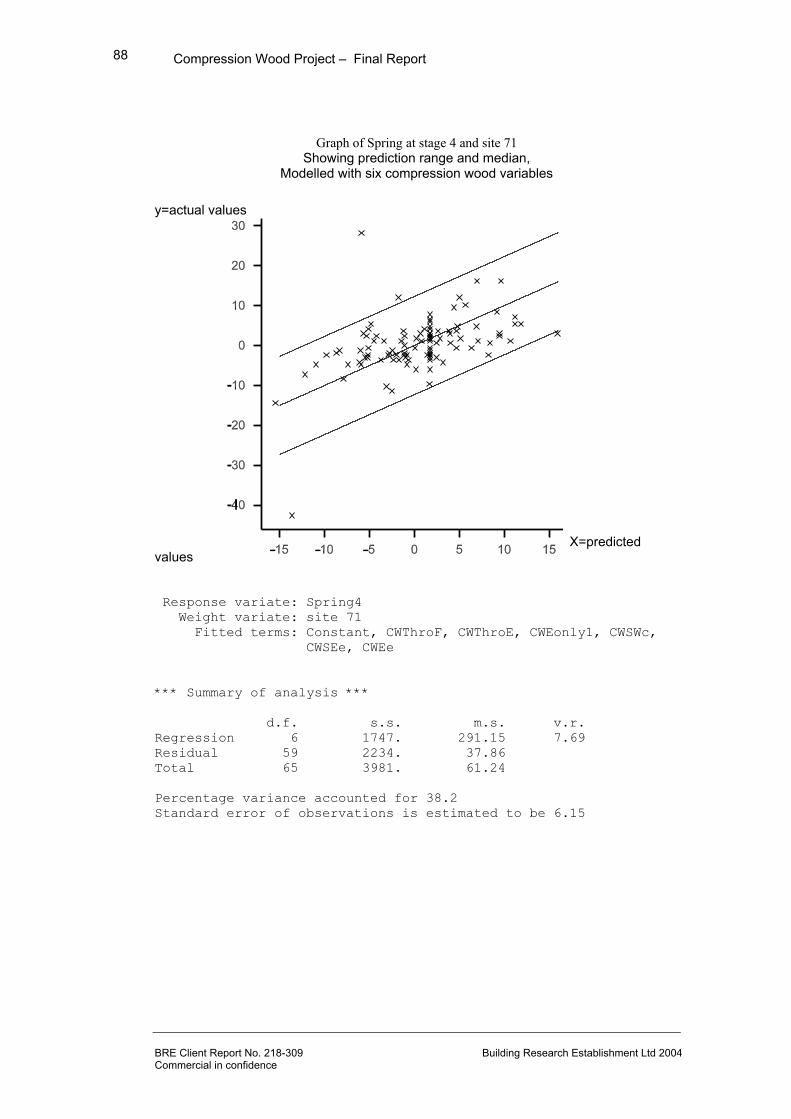
Compression Wood Project – Final Report
BRE Client Report No. 218-309 Building Research Establishment Ltd 2004 Commercial in confidence
88
Graph of Spring at stage 4 and site 71 Showing prediction range and median,
Modelled with six compression wood variables
y=actual values X=predicted values Response variate: Spring4 Weight variate: site 71 Fitted terms: Constant, CWThroF, CWThroE, CWEonly1, CWSWc, CWSEe, CWEe *** Summary of analysis *** d.f. s.s. m.s. v.r. Regression 6 1747. 291.15 7.69 Residual 59 2234. 37.86 Total 65 3981. 61.24 Percentage variance accounted for 38.2 Standard error of observations is estimated to be 6.15

Compression Wood Project – Final Report
BRE Client Report No. 218-309 Building Research Establishment Ltd 2004 Commercial in confidence
89
*** Estimates of parameters *** estimate s.e. t(59) Constant 1.72 1.06 1.61 CWThroF -0.1195 0.0411 -2.91 CWThroE -0.1421 0.0637 -2.23 CWEonly1 -0.1608 0.0313 -5.14 CWSWc 0.598 0.150 3.99 CWSEe -0.320 0.155 -2.07 CWEe 0.1492 0.0577 2.59
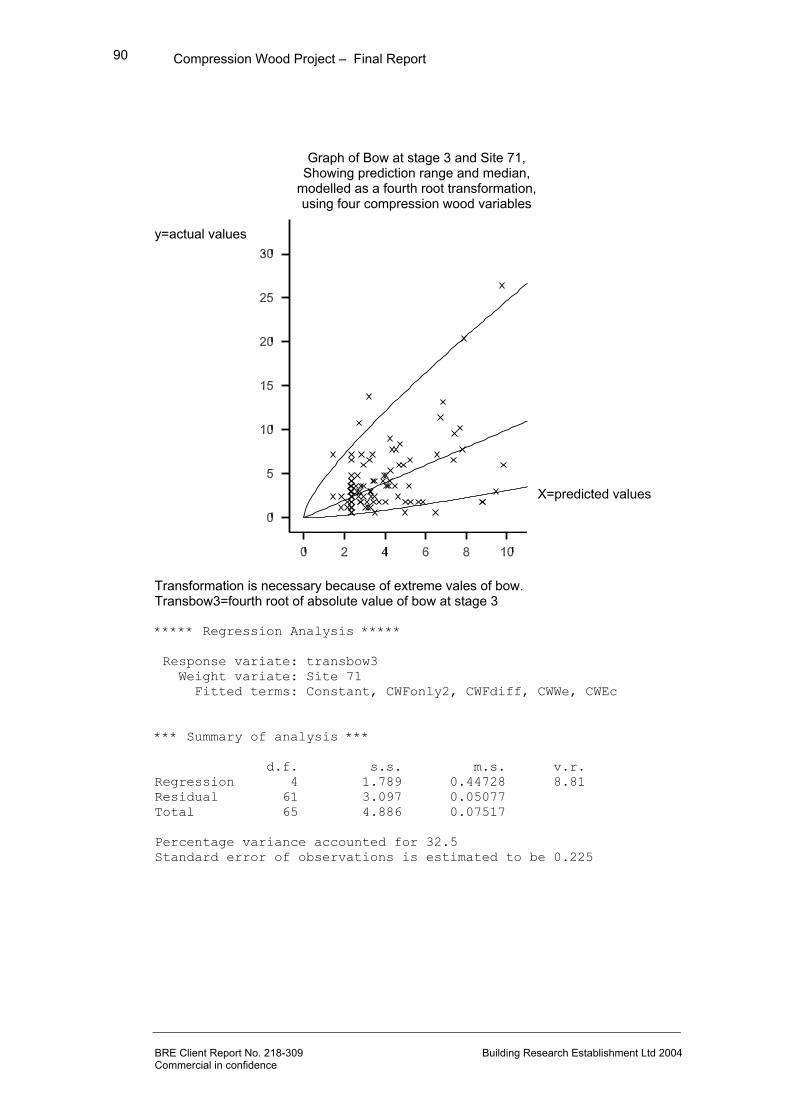
Compression Wood Project – Final Report
BRE Client Report No. 218-309 Building Research Establishment Ltd 2004 Commercial in confidence
90
Graph of Bow at stage 3 and Site 71,
Showing prediction range and median, modelled as a fourth root transformation, using four compression wood variables
y=actual values
X=predicted values Transformation is necessary because of extreme vales of bow. Transbow3=fourth root of absolute value of bow at stage 3 ***** Regression Analysis ***** Response variate: transbow3 Weight variate: Site 71 Fitted terms: Constant, CWFonly2, CWFdiff, CWWe, CWEc *** Summary of analysis *** d.f. s.s. m.s. v.r. Regression 4 1.789 0.44728 8.81 Residual 61 3.097 0.05077 Total 65 4.886 0.07517 Percentage variance accounted for 32.5 Standard error of observations is estimated to be 0.225

Compression Wood Project – Final Report
BRE Client Report No. 218-309 Building Research Establishment Ltd 2004 Commercial in confidence
91
*** Estimates of parameters *** estimate s.e. t(61) Constant 1.2370 0.0370 33.44 CWFonly2 0.00518 0.00239 2.17 CWFdiff -0.00234 0.00126 -1.86 CWWe 0.01161 0.00249 4.66 CWEc -0.00644 0.00230 -2.80
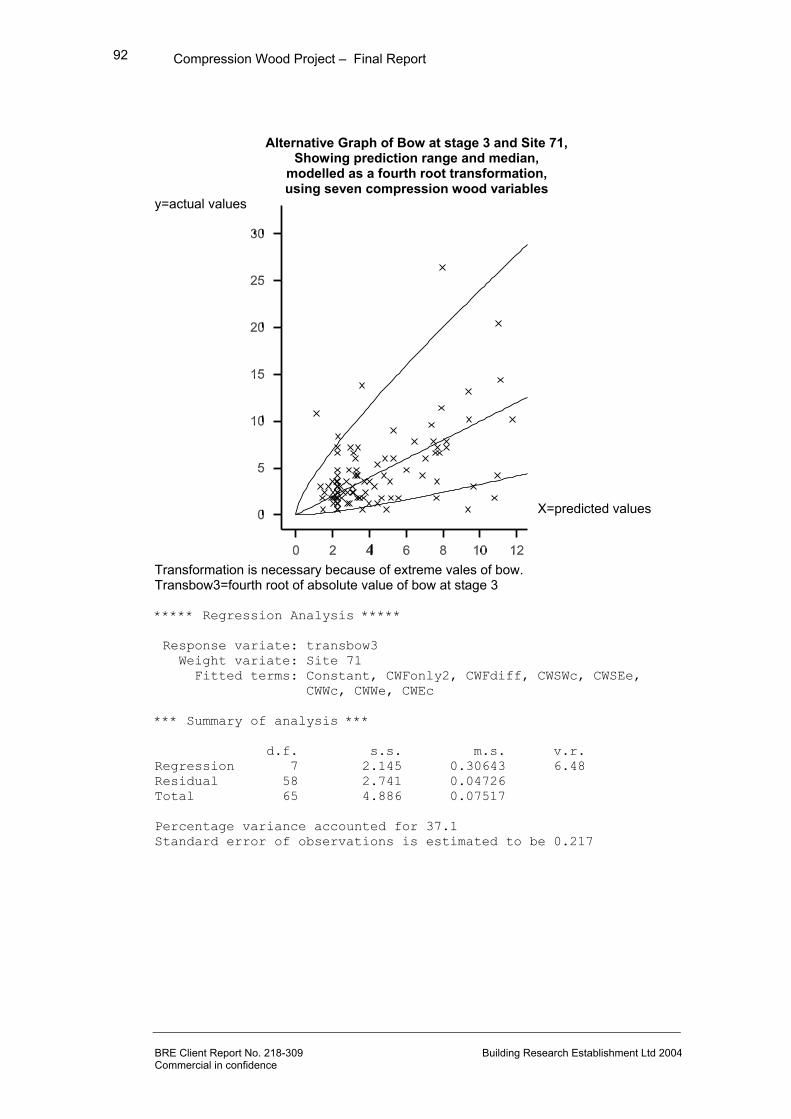
Compression Wood Project – Final Report
BRE Client Report No. 218-309 Building Research Establishment Ltd 2004 Commercial in confidence
92
Alternative Graph of Bow at stage 3 and Site 71, Showing prediction range and median,
modelled as a fourth root transformation, using seven compression wood variables
y=actual values X=predicted values Transformation is necessary because of extreme vales of bow. Transbow3=fourth root of absolute value of bow at stage 3 ***** Regression Analysis ***** Response variate: transbow3 Weight variate: Site 71 Fitted terms: Constant, CWFonly2, CWFdiff, CWSWc, CWSEe, CWWc, CWWe, CWEc *** Summary of analysis *** d.f. s.s. m.s. v.r. Regression 7 2.145 0.30643 6.48 Residual 58 2.741 0.04726 Total 65 4.886 0.07517 Percentage variance accounted for 37.1 Standard error of observations is estimated to be 0.217

Compression Wood Project – Final Report
BRE Client Report No. 218-309 Building Research Establishment Ltd 2004 Commercial in confidence
93
*** Estimates of parameters *** estimate s.e. t(58) Constant 1.2264 0.0387 31.67 CWFonly2 0.01007 0.00300 3.35 CWFdiff -0.00507 0.00170 -2.98 CWSWc 0.00950 0.00496 1.91 CWSEe -0.00960 0.00505 -1.90 CWWc 0.00720 0.00345 2.09 CWWe 0.00905 0.00327 2.77 CWEc -0.01080 0.00288 -3.75
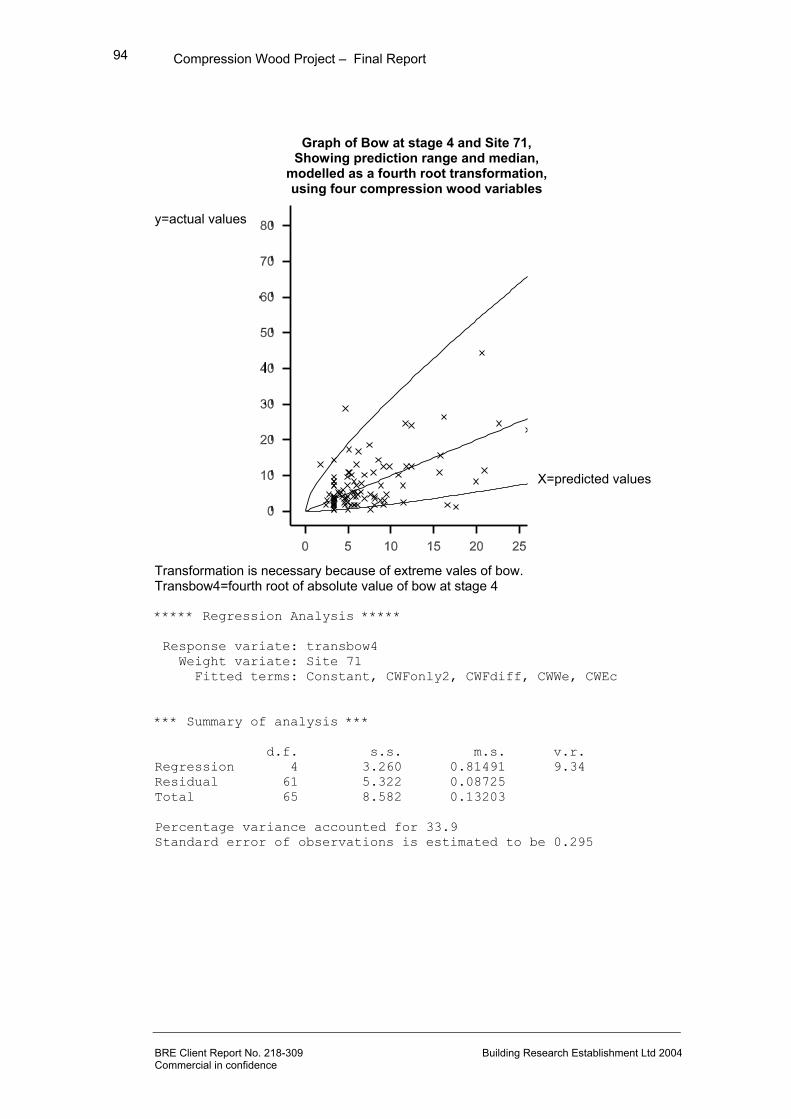
Compression Wood Project – Final Report
BRE Client Report No. 218-309 Building Research Establishment Ltd 2004 Commercial in confidence
94
Graph of Bow at stage 4 and Site 71, Showing prediction range and median,
modelled as a fourth root transformation, using four compression wood variables
y=actual values
X=predicted values Transformation is necessary because of extreme vales of bow. Transbow4=fourth root of absolute value of bow at stage 4 ***** Regression Analysis ***** Response variate: transbow4 Weight variate: Site 71 Fitted terms: Constant, CWFonly2, CWFdiff, CWWe, CWEc *** Summary of analysis *** d.f. s.s. m.s. v.r. Regression 4 3.260 0.81491 9.34 Residual 61 5.322 0.08725 Total 65 8.582 0.13203 Percentage variance accounted for 33.9 Standard error of observations is estimated to be 0.295

Compression Wood Project – Final Report
BRE Client Report No. 218-309 Building Research Establishment Ltd 2004 Commercial in confidence
95
*** Estimates of parameters *** estimate s.e. t(61) Constant 1.3556 0.0485 27.96 CWFonly2 0.00677 0.00313 2.16 CWFdiff -0.00334 0.00165 -2.02 CWWe 0.01501 0.00327 4.59 CWEc -0.00718 0.00301 -2.38
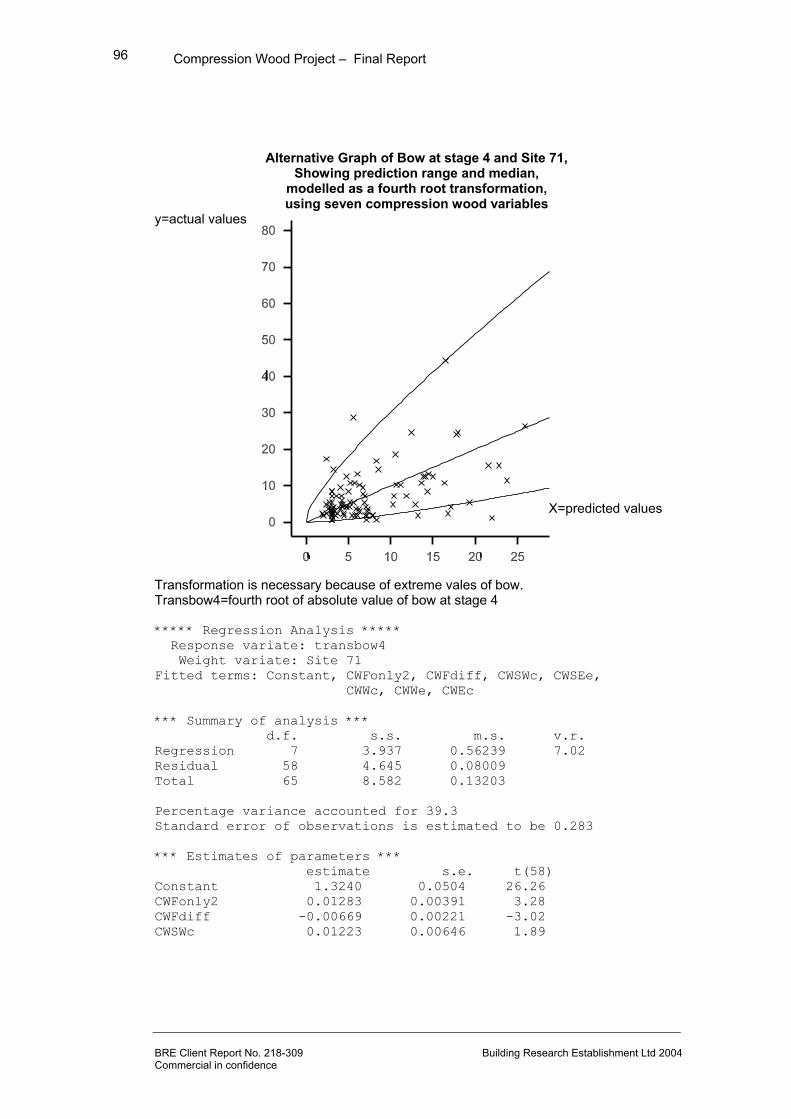
Compression Wood Project – Final Report
BRE Client Report No. 218-309 Building Research Establishment Ltd 2004 Commercial in confidence
96
Alternative Graph of Bow at stage 4 and Site 71,
Showing prediction range and median, modelled as a fourth root transformation, using seven compression wood variables
y=actual values X=predicted values Transformation is necessary because of extreme vales of bow. Transbow4=fourth root of absolute value of bow at stage 4 ***** Regression Analysis ***** Response variate: transbow4 Weight variate: Site 71 Fitted terms: Constant, CWFonly2, CWFdiff, CWSWc, CWSEe,
CWWc, CWWe, CWEc *** Summary of analysis *** d.f. s.s. m.s. v.r. Regression 7 3.937 0.56239 7.02 Residual 58 4.645 0.08009 Total 65 8.582 0.13203 Percentage variance accounted for 39.3 Standard error of observations is estimated to be 0.283 *** Estimates of parameters *** estimate s.e. t(58) Constant 1.3240 0.0504 26.26 CWFonly2 0.01283 0.00391 3.28 CWFdiff -0.00669 0.00221 -3.02 CWSWc 0.01223 0.00646 1.89

Compression Wood Project – Final Report
BRE Client Report No. 218-309 Building Research Establishment Ltd 2004 Commercial in confidence
97
CWSEe -0.00992 0.00658 -1.51 CWWc 0.01080 0.00449 2.41 CWWe 0.00937 0.00426 2.20 CWEc -0.01366 0.00375 -3.64 Footnote: Stage 1=green, Stage 2 = 20% moisture content, Stage 3= 15%,
Stage 4 =12%
Related Documents