REGULAR ARTICLE Comprehensive transcriptome and immunophenotype analysis of renal and cardiac MSC-like populations supports strong congruence with bone marrow MSC despite maintenance of distinct identities Rebecca A. Pelekanos b , c , 1 , 2 , Joan Li a , b , 2 , Milena Gongora a , b , Vashe Chandrakanthan b , d , Janelle Scown b , e , Norseha Suhaimi a , b , Gary Brooke c , Melinda E. Christensen f , Tram Doan d , Alison M. Rice f , Geoffrey W. Osborne b , e , Sean M. Grimmond a , b , Richard P. Harvey b , d , g , 3 , Kerry Atkinson b , c , h , 3 , Melissa H. Little a , b , ⁎ , 3 a Institute for Molecular Bioscience, The University of Queensland, St Lucia, Brisbane, Queensland, Australia b Australian Stem Cell Centre, Monash University, Clayton, Victoria, Australia c Adult Stem Cell Laboratory, Mater Medical Research Institute, Brisbane, Queensland, Australia d Victor Chang Cardiac Research Institute, Sydney, New South Wales, Australia e Queensland Brain Institute, The University of Queensland, St Lucia, Brisbane, Queensland, Australia f Bone Marrow Transplantation Team, Mater Medical Research Institute, Brisbane, Queensland, Australia g Faculty of Medicine, University of New South Wales, Kensington, New South Wales, Australia h School of Medicine and Australian Institute of Nanotechnology and Bioengineering, The University of Queensland, St Lucia, Brisbane, Queensland, Australia Received 8 August 2011; accepted 9 August 2011 Available online 17 August 2011 Abstract Cells resembling bone marrow mesenchymal stem cells (MSC) have been isolated from many organs but their functional relationships have not been thoroughly examined. Here we compared the immunophenotype, gene expression, multipotency and immunosuppressive potential of MSC-like colony-forming cells from adult murine bone marrow (bmMSC), kidney (kCFU-F) and heart (cCFU-F), cultured under uniform conditions. All populations showed classic MSC morphology and in vitro mesodermal ⁎ Corresponding author at: NHMRC Principal Research Fellow, Institute for Molecular Bioscience, The University of Queensland, St. Lucia, 4072, Australia. Fax: +61 7 3346 2101. E-mail address: [email protected] (M.H. Little). 1 Current address. University of Queensland Centre for Clinical Research, The University of Queensland, Herston, Brisbane, Queensland, Australia. 2 Joint first authors representing equal contribution. 3 Joint senior authors. 1873-5061/$ - see front matter. Crown Copyright © 2011 Published by Elsevier B.V. All rights reserved. doi:10.1016/j.scr.2011.08.003 Available online at www.sciencedirect.com www.elsevier.com/locate/scr Stem Cell Research (2012) 8, 58–73 brought to you by CORE View metadata, citation and similar papers at core.ac.uk provided by Elsevier - Publisher Connector

Welcome message from author
This document is posted to help you gain knowledge. Please leave a comment to let me know what you think about it! Share it to your friends and learn new things together.
Transcript

Ava i l ab l e on l i ne a t www.sc i enced i r ec t . com
www.e l sev i e r . com/ l oca te / sc r
Stem Cell Research (2012) 8, 58–73
brought to you by COREView metadata, citation and similar papers at core.ac.uk
provided by Elsevier - Publisher Connector
REGULAR ARTICLE
Comprehensive transcriptome and immunophenotypeanalysis of renal and cardiac MSC-like populationssupports strong congruence with bone marrow MSCdespite maintenance of distinct identitiesRebecca A. Pelekanos b, c, 1, 2, Joan Li a, b, 2, Milena Gongora a, b,Vashe Chandrakanthan b, d, Janelle Scown b, e, Norseha Suhaimi a, b,Gary Brooke c, Melinda E. Christensen f, Tram Doan d, Alison M. Rice f,Geoffrey W. Osborne b, e, Sean M. Grimmond a, b, Richard P. Harvey b, d, g, 3,Kerry Atkinson b, c, h, 3, Melissa H. Little a, b,⁎, 3
a Institute for Molecular Bioscience, The University of Queensland, St Lucia, Brisbane, Queensland, Australiab Australian Stem Cell Centre, Monash University, Clayton, Victoria, Australiac Adult Stem Cell Laboratory, Mater Medical Research Institute, Brisbane, Queensland, Australiad Victor Chang Cardiac Research Institute, Sydney, New South Wales, Australiae Queensland Brain Institute, The University of Queensland, St Lucia, Brisbane, Queensland, Australiaf Bone Marrow Transplantation Team, Mater Medical Research Institute, Brisbane, Queensland, Australiag Faculty of Medicine, University of New South Wales, Kensington, New South Wales, Australiah School of Medicine and Australian Institute of Nanotechnology and Bioengineering, The University of Queensland, St Lucia,Brisbane, Queensland, Australia
Received 8 August 2011; accepted 9 August 2011
Available online 17 August 2011Abstract Cells resembling bonemarrowmesenchymal stem cells (MSC) have been isolated frommany organs but their functionalrelationships have not been thoroughly examined. Here we compared the immunophenotype, gene expression, multipotency andimmunosuppressive potential of MSC-like colony-forming cells from adult murine bone marrow (bmMSC), kidney (kCFU-F) andheart (cCFU-F), cultured under uniform conditions. All populations showed classic MSC morphology and in vitro mesodermal
⁎ Corresponding author at: NHMRC Principal Research Fellow, Institute for Molecular Bioscience, The University of Queensland, St. Lucia,4072, Australia. Fax: +61 7 3346 2101.
E-mail address: [email protected] (M.H. Little).1 Current address. University of Queensland Centre for Clinical Research, The University of Queensland, Herston, Brisbane, Queensland,
Australia.2 Joint first authors representing equal contribution.3 Joint senior authors.
1873-5061/$ - see front matter. Crown Copyright © 2011 Published by Elsevier B.V. All rights reserved.doi:10.1016/j.scr.2011.08.003

59Comparisons between MSC-like populations
multipotency. Of the two solid organ-specific CFU-F, only kCFU-F displayed suppression of T-cell alloreactivity in vitro, albeit to alesser extent than bmMSC. Quantitative immunophenotyping using 81 phycoerythrin-conjugated CD antibodies demonstrated thatall populations contained high percentages of cells expressing diagnostic MSC surface markers (Sca1, CD90.2, CD29, CD44), as wellas others noted previously on murine MSC (CD24, CD49e, CD51, CD80, CD81, CD105). Illumina microarray expression profiling andbioinformatic analysis indicated a correlation of gene expression of 0.88–0.92 between pairwise comparisons. All populationsexpressed approximately 66% of genes in the pluripotency network (Plurinet), presumably reflecting their stem-like character.Furthermore, all populations expressed genes involved in immunomodulation, homing and tissue repair, suggesting these asconserved functions for MSC-like cells in solid organs. Despite this molecular congruence, strong biases in gene and proteinexpression and pathway activity were seen, suggesting organ-specific functions. Hence, tissue-derived MSC may also retain uniqueproperties potentially rendering them more appropriate as cellular therapeutic agents for their organ of origin.
Crown Copyright © 2011 Published by Elsevier B.V. All rights reserved.Introduction
Mesenchymal stem cells or multipotent mesenchymal stromalcells (both referred to as MSC) (Horwitz et al., 2005) arestem-like cells, traditionally of bone marrow origin, able todifferentiate into a variety of mesenchymal lineages, includingbone, fat and cartilage (Pittenger et al., 1999). Originallydesignated Colony Forming Unit-Fibroblast (CFU-F) cellsbased upon their phenotype in culture (Friedenstein et al.,1974; Bianco et al., 2008), attempts to identify, localise andpurify MSC have been hampered by a lack of unique cell surfacemarker/s. Currently, the minimal criteria for human MSCare i) adherence to plastic with fibroblast-like morphology;ii) expression of CD105, CD73, CD90 and lack of expressionof CD45, CD34, CD14 or CD11b, CD79a/CD19, HLA-DR; andiii) ability to differentiate into osteoblasts, adipocytes andchondrocytes in vitro (Dominici et al., 2006; Kassem et al.,2004). In the mouse, MSC are Sca1+CD90+CD45− (da SilvaMeirelles and Nardi, 2003). Whilst first described in the stromaof bone marrow, CFU-F have now been reported to exist inmany foetal and adult tissues, including fat, bone, kidney,lung, liver, umbilical cord, amniotic fluid and placenta (Wanget al., 2009; Ebihara et al., 2006; Fraser et al., 2007; Steigmanand Fauza, 2007; Sarugaser et al., 2005). As proposed for bonemarrow-derived MSC (bmMSC), such cells may act as tissuestem cells, provide a niche for other stem cells, or play a rolein tissue homeostasis and repair. Recently, Crisan et al. (Crisanet al., 2008) prospectively isolated perivascular cells from avariety of human organs, including kidney, based on theexpression of pericyte markers CD146, NG2 and PDGFRβ(CD140b), and showed that these cells displayed MSC features.Other studies also support the concept that MSCs arise from aperivascular niche (da Silva Meirelles et al., 2006).
Despite similarities between bmMSC and MSC-like popula-tions from other locations, absolute phenotypic and functionalequivalence has not been established. Indeed, evidence existsthat there is a differentiative and reparative bias that dependsupon the tissue of origin. Both foetal and bmMSC can induce re-pair after acute necrotizing injury of the heart, but via differentmechanisms (Iop et al., 2008). Placental and foetal MSC fromamniotic fluid express pluripotency genes (Nanog, SSEA-4 andOct4), proliferate faster and show greater colony forming effi-ciency and osteogenic capacity (Roubelakis et al., 2007; Guillotet al., 2007). This suggests a more primitive stem-like pheno-type and potentially enhanced utility in bone engineering appli-cations (Zhang et al., 2009; Guillot et al., 2008). Placental MSCalso show superior migratory capacity but less adipogenic
potential (Li et al., 2009; Montesinos et al., 2009; Barlow etal., 2008). Adipose MSC show greater capacity to form fat(Noel et al., 2008), whilst umbilical cord MSC show no suchcapacity (Kern et al., 2006). Comparisons of gene expressionbetween adipose, umbilical cord and bmMSC versus maturefibroblasts defined 25 genes uniformly present in these MSC(Wagner et al., 2005; Phinney et al., 2006), but considerabledifferences in MSC phenotype and functional capacity werenoted depending upon their tissue of origin (Noel et al., 2008;Wagner et al., 2005). A microarray comparison betweenamniotic fluid, amniotic membrane and cord blood derived-MSC also suggested specific biological functions for MSC fromdifferent gestational tissues (Tsai et al., 2007).
In this study we compare, both at the transcript andprotein levels, distinct murine organ-specific MSC-likepopulations isolated from adult tissues (bone/bone marrow,heart and kidney). Although initial isolation approachesvaried, once established as plastic adherent cultures dis-playing the anticipated cell surface antigens to definethem as MSCs (Sca1+CD29+CD44+CD90.2+) all populationswere cultured under identical conditions for a similar pas-sage number prior to extensive phenotypic and functionalcharacterisation. We report a high level of concordancewith respect to morphology, growth properties, cell surfaceproteins, gene expression profile and multipotentiality invitro between these three populations. Our data support acommon phenotype for distinct organ-specific MSCs,reinforcing the hypothesis that such cells are involved in tis-sue maintenance and repair (da Silva Meirelles et al., 2008).However, we also report variations in the level of epitopepresentation and distinct phenotypic signatures, supportingthe concept of molecular ‘memory of tissue origin’ and theexistence of distinct functional roles for MSC-like cells iso-lated from different tissues.
Results
The colony forming assay represents an accepted and robust se-lection for a specific stem cell-like population (Bianco et al.,
2008; Friedenstein et al., 1974). CFU-F cultures are known tocontain stem cells that are self-renewing but also able to giverise to more committed progenitors through asymmetric divi-sion. They may also contain a few differentiated offspringwith time. Whilst the ultimate cultures are not homogeneous,short term proliferating cells are purged from the cultures bycontinued passage. In order to directly compare MSC-like cells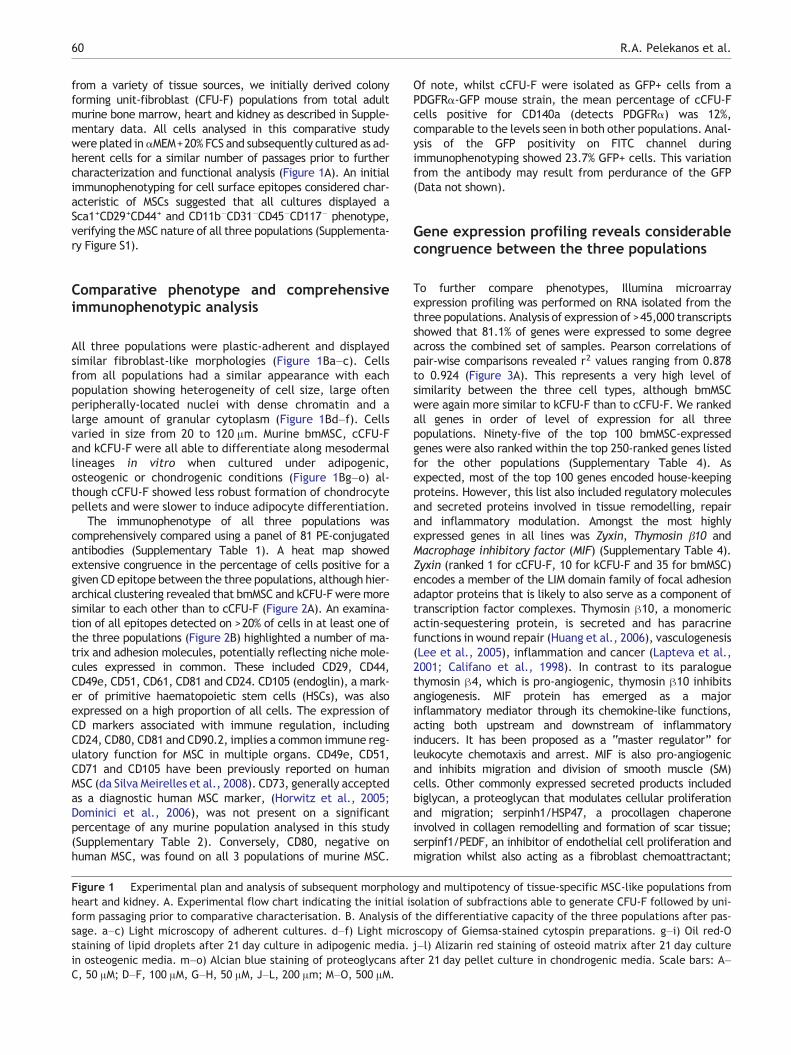
60 R.A. Pelekanos et al.
from a variety of tissue sources, we initially derived colonyforming unit-fibroblast (CFU-F) populations from total adultmurine bone marrow, heart and kidney as described in Supple-mentary data. All cells analysed in this comparative studywere plated inαMEM+20% FCS and subsequently cultured as ad-herent cells for a similar number of passages prior to furthercharacterization and functional analysis (Figure 1A). An initialimmunophenotyping for cell surface epitopes considered char-acteristic of MSCs suggested that all cultures displayed aSca1+CD29+CD44+ and CD11b−CD31−CD45−CD117− phenotype,verifying the MSC nature of all three populations (Supplementa-ry Figure S1).
Comparative phenotype and comprehensiveimmunophenotypic analysis
All three populations were plastic-adherent and displayedsimilar fibroblast-like morphologies (Figure 1Ba–c). Cellsfrom all populations had a similar appearance with eachpopulation showing heterogeneity of cell size, large oftenperipherally-located nuclei with dense chromatin and alarge amount of granular cytoplasm (Figure 1Bd–f). Cellsvaried in size from 20 to 120 μm. Murine bmMSC, cCFU-Fand kCFU-F were all able to differentiate along mesodermallineages in vitro when cultured under adipogenic,osteogenic or chondrogenic conditions (Figure 1Bg–o) al-though cCFU-F showed less robust formation of chondrocytepellets and were slower to induce adipocyte differentiation.
The immunophenotype of all three populations wascomprehensively compared using a panel of 81 PE-conjugatedantibodies (Supplementary Table 1). A heat map showedextensive congruence in the percentage of cells positive for agiven CD epitope between the three populations, although hier-archical clustering revealed that bmMSC and kCFU-F were moresimilar to each other than to cCFU-F (Figure 2A). An examina-tion of all epitopes detected on >20% of cells in at least one ofthe three populations (Figure 2B) highlighted a number of ma-trix and adhesion molecules, potentially reflecting niche mole-cules expressed in common. These included CD29, CD44,CD49e, CD51, CD61, CD81 and CD24. CD105 (endoglin), a mark-er of primitive haematopoietic stem cells (HSCs), was alsoexpressed on a high proportion of all cells. The expression ofCD markers associated with immune regulation, includingCD24, CD80, CD81 and CD90.2, implies a common immune reg-ulatory function for MSC in multiple organs. CD49e, CD51,CD71 and CD105 have been previously reported on humanMSC (da Silva Meirelles et al., 2008). CD73, generally acceptedas a diagnostic human MSC marker, (Horwitz et al., 2005;Dominici et al., 2006), was not present on a significantpercentage of any murine population analysed in this study(Supplementary Table 2). Conversely, CD80, negative onhuman MSC, was found on all 3 populations of murine MSC.
Figure 1 Experimental plan and analysis of subsequent morphologheart and kidney. A. Experimental flow chart indicating the initial iform passaging prior to comparative characterisation. B. Analysis ofsage. a–c) Light microscopy of adherent cultures. d–f) Light microstaining of lipid droplets after 21 day culture in adipogenic media.in osteogenic media. m–o) Alcian blue staining of proteoglycans afC, 50 μM; D–F, 100 μM, G–H, 50 μM, J–L, 200 μm; M–O, 500 μM.
Of note, whilst cCFU-F were isolated as GFP+ cells from aPDGFRα-GFP mouse strain, the mean percentage of cCFU-Fcells positive for CD140a (detects PDGFRα) was 12%,comparable to the levels seen in both other populations. Anal-ysis of the GFP positivity on FITC channel duringimmunophenotyping showed 23.7% GFP+ cells. This variationfrom the antibody may result from perdurance of the GFP(Data not shown).
Gene expression profiling reveals considerablecongruence between the three populations
To further compare phenotypes, Illumina microarrayexpression profiling was performed on RNA isolated from thethree populations. Analysis of expression of >45,000 transcriptsshowed that 81.1% of genes were expressed to some degreeacross the combined set of samples. Pearson correlations ofpair-wise comparisons revealed r2 values ranging from 0.878to 0.924 (Figure 3A). This represents a very high level ofsimilarity between the three cell types, although bmMSCwere again more similar to kCFU-F than to cCFU-F. We rankedall genes in order of level of expression for all threepopulations. Ninety-five of the top 100 bmMSC-expressedgenes were also ranked within the top 250-ranked genes listedfor the other populations (Supplementary Table 4). Asexpected, most of the top 100 genes encoded house-keepingproteins. However, this list also included regulatory moleculesand secreted proteins involved in tissue remodelling, repairand inflammatory modulation. Amongst the most highlyexpressed genes in all lines was Zyxin, Thymosin β10 andMacrophage inhibitory factor (MIF) (Supplementary Table 4).Zyxin (ranked 1 for cCFU-F, 10 for kCFU-F and 35 for bmMSC)encodes a member of the LIM domain family of focal adhesionadaptor proteins that is likely to also serve as a component oftranscription factor complexes. Thymosin β10, a monomericactin-sequestering protein, is secreted and has paracrinefunctions in wound repair (Huang et al., 2006), vasculogenesis(Lee et al., 2005), inflammation and cancer (Lapteva et al.,2001; Califano et al., 1998). In contrast to its paraloguethymosin β4, which is pro-angiogenic, thymosin β10 inhibitsangiogenesis. MIF protein has emerged as a majorinflammatory mediator through its chemokine-like functions,acting both upstream and downstream of inflammatoryinducers. It has been proposed as a “master regulator” forleukocyte chemotaxis and arrest. MIF is also pro-angiogenicand inhibits migration and division of smooth muscle (SM)cells. Other commonly expressed secreted products includedbiglycan, a proteoglycan that modulates cellular proliferationand migration; serpinh1/HSP47, a procollagen chaperoneinvolved in collagen remodelling and formation of scar tissue;serpinf1/PEDF, an inhibitor of endothelial cell proliferation andmigration whilst also acting as a fibroblast chemoattractant;
y and multipotency of tissue-specific MSC-like populations fromsolation of subfractions able to generate CFU-F followed by uni-the differentiative capacity of the three populations after pas-scopy of Giemsa-stained cytospin preparations. g–i) Oil red-Oj–l) Alizarin red staining of osteoid matrix after 21 day cultureter 21 day pellet culture in chondrogenic media. Scale bars: A–

61Comparisons between MSC-like populations
Sparc/Osteonectin, an MMP-activated, collagen-binding proteinimplicated in collagen fibril and basal lamina formation; andCTGF/CCN2, a known mediator of tissue fibrosis. These all
strongly reflect the fibroblastic phenotype of these cells.Pathway analysis of genes expressed in common between theseMSC populations identified genes involved in immunity, cell

62 R.A. Pelekanos et al.
adhesion, BMP signalling, chemokine signalling, homeodomaintranscription factors, metalloproteinases and their TIMPinhibitors (Table 1).
Microarray data was validated using quantitative PCR(qPCR). This was first performed on a set of genes chosen fortheir wide variation in gene expression between the three celltypes (Prl2c2, GHR, Zyx, Des) (Supplementary Figure S2).qPCR was then performed to validate the expression of genesregarded as classical MSC (Wagner et al., 2005; Phinney et al.,2006) and/or pericyte markers (da Silva Meirelles et al., 2008;Covas et al., 2008) (Twist1, CCL7, MMP2, MIF, HoxA5, Tagln)(Muller et al., 2008) (Supplementary Figure S3). Thisdemonstrated good validation of relative expression levelsbetween microarray and qPCR.
Enrichment for stem cell networks in all threeMSC-like populations
To investigate the stem cell nature of these three populations,the expression of murine orthologs of components of the re-
cently described Plurinet was examined in these cell lines(Muller et al., 2008). Murine orthologs of the human Plurinetgenes were examined for their mean normalisedexpression and 66% of these orthologs displayed an Illumina de-tection score >0 in at least one population (SupplementaryTable 6). In addition, hierarchical clustering showed strongcongruence between the three CFU-F populations(Figure 3B). Once again, a closer relationship was evident be-tween bmCFU-F and kCFU-F. Figure 3C illustrates the subcellu-lar localisation and network relationships of those Plurinetgenes expressed by these populations and qPCR was used tovalidated these results for a subset of Plurinet genes detectedas present in the three populations (Myc, AnxA2 and Smarcad1)(Supplementary Figure S4). We also investigated the expres-sion of genes critical for induced pluripotency. Expression ofKlf4 and Sox2 (not in the Plurinet), whilst above the thresholdfor detection by microarray, was very low (Supplementary Fig-ure S4). Expression of both Nanog and Oct4 (Pou5f1) fell belowthe Illumina detection threshold for all cell lines. qPCR forthese genes also indicated extremely low levels of mRNA(Supplementary Figure S4). Despite this, the extensiveexpression of other Plurinet genes implies an active stem cellstate in all three MSC-like populations.Immunosuppressive capacity of bmMSC, cCFU-Fand kCFU-F
bmMSC have long been known to be immunomodulatory,affecting the proliferation and phenotype of T-cells, B-cells, NK cells and antigen-presenting cells through a cyto-kine/chemokine cascade (Kode et al., 2009). Lacking MHCClass II, they are also immunoprivileged in an allogeneic set-ting, leading to the concept of an “off-the-shelf” therapy forregenerative medicine. Given the molecular and immuno-phenotypic evidence for considerable congruence betweenthese three populations, we assessed the in vitro capacityof each population to suppress T-cell proliferation whenadded to a mixed lymphocyte reaction using LPS-stimulated allogeneic T-cells as responders (Figure 4A).bmMSC were suppressive at both low and high numbers of
cells added (MSC:responder ratios 1:100 and 1:10,respectively). kCFU-F were only significantly suppressiveusing the higher number of cells. In contrast, cCFU-F werenot suppressive with either cell number. This was confirmedin a “third party” MLR in which cCFU-F, donor and responderlymphocytes were all mismatched for MHC. In this setting,cCFU-F in fact increased responder T-cell proliferation(data not shown), suggesting a possible pro-survival effect(Xu et al., 2008).
Correlating differences in gene expression withfunctional behaviour
Given this functional difference between the populations,hierarchical clustering was performed on a set of 6487genes shown to be differentially expressed between the 3populations (Figure 4B). The number of genes differentiallyexpressed (B>0, pb0.005) between bmMSC and kCFU-Fwas 2746, with 3535 between cCFU-F and kCFU-F and 4572between bmMSC and cCFU-F (Figure 4C). We then identifiedgenes in which expression was differentially higher or lowerin one of the three populations versus the remaining two(Figures 4D,E). Genes up-regulated in one populationrepresent genes enriched in or specific to a given cell type(Figure 4D). These genes are listed in Supplementary Table7A, C and E. We have defined specific markers of eachcell population as those genes for which expression in thepopulation of interest was >500RFU, expression in the com-parative populations was b200RFU and the fold differencegreater than 5. Table 2 lists the 5 most population-specificgenes. Genes that were differentially under-expressed in agiven cell type were also identified (Figure 4E, SupplementaryTable 7B, D, F). Genes underexpressed in bmMSC representgenes commonly enriched in the two solid tissue-derivedMSC populations.
Organ-specific gene expression signatures inMSC-like populations
Observed differences in gene expression between thesethree populations should inform our understanding of func-tions enhanced in one organ but reduced in others,unique organ-specific functions, and potentially featuresthat relate to the cellular or developmental origins oforgan-specific CFU-F (“memory of tissue origin”). Inthe case of kCFU-F, the enriched expression of Mylk,Myom, Desmin and Serpinb2 (Supplementary Table 7C) sug-gests a strong relationship with the perivascular and mesan-gial cells of the kidney, in keeping with the proposedperivascular origin for MSC (Bianco et al., 2008; Crisan etal., 2008). As well as mesangial cells, Mylk and Myom1 areexpressed in smooth muscle, as is Myh11, a gene expressedequivalently in cCFU-F and kCFU-F but not in bmMSC. Thismay again reflect a perivascular location due to the moreestablished arterio-venous circulation present in solid or-gans. No evidence was found for the derivation of kCFU-Ffrom the nephron epithelia. kCFU-F also differentially ex-press Nestin. This gene is expressed in a number of stemcell populations and has been proposed as a marker ofmultipotent progenitors (Wiese et al., 2004). Nestin

Figure 2 Comprehensive CD epitope profiling of bmMSC, cCFU-F and kCFU-F populations. A) Clustered heat map representation ofdata from (total number) cell surface antigens expressed as percentage cells positive for each epitope. Increasing colour intensityindicates an increasing percentage of cells positive. Epitopes in common or enriched in kCFU-F or cCFU-F are shown in expandedlists alongside heat map. B) Graphical representative of CD profiling for all epitopes where >20% of any cell populations was positive.Values are an average of 2 replicates with the same cell line.
63Comparisons between MSC-like populations
expression has been reported in mesangial cells, endothelialcells and podocytes of the kidney, where its expression in-creases in response to glomerular injury. It has alsobeen shown to mark a population of papillary interstitialcells (Oliver et al., 2004) whose distribution within the kid-ney shifts from the medulla to the cortex in response toacute renal ischaemia (Patschan et al., 2007). This mayimply an organ-specific role for these cells in normal tissueturnover.
For cCFU-F, analysis of differential gene expression im-plied a possible ‘memory of tissue origin’. The gene
encoding the MADS box transcription factor, Mef2c, essen-tial for deployment of cardiac progenitor cells to the form-ing heart (Lin et al., 1997), was cCFU-F specificand expressed 6.6-fold and 66 fold over kCFU-F andbmMSC levels, respectively. An enhancer responsiblefor cardiac Mef2c expression is regulated by the LIM home-odomain factor ISL1, which is often used to definecardiac progenitor cells in the embryo and adult(Dodou et al., 2004). Whilst Isl1 fell just short ofthe criteria for tissue-specificity, it was nonethelessexpressed 45-fold and 33-fold above the low levels

Figure 3 Correlation of gene expression profile between bmMSC, cCFU-F and kCFU-F populations. A) Pair-wise correlation of geneexpression profiles (medium-high expression genes only). B) Gene expression heat map of 327 mouse orthologs to defined Plurinetgenes in bmMSC, cCFU-F and kCFU-F. Colour key shown in upper left corner (Log2). C) Representation of the spatial location of Plurinetgene-encoded proteins expressed in all three MSC-like populations. Only the genes that had expression above background fluorescenceare shown in the network. Level of expression for listed genes is as for panel B. Grey indicates a genewithin the networkwhose expressionwas not detected in any population at a level above background.
64 R.A. Pelekanos et al.
seen in kidney and bmMSC, respectively. T-box genesalso play a major role in heart development, andTbx4 was identified here as cCFU-F-specific. Whilstnot itself expressed in the developing heart, Tbx4 is a para-logue of Tbx5, which participates in the core cardiac tran-scription factor gene network and is mutated in Holt–Oram(hand/heart) syndrome in humans (Basson et al., 1997).Tbx4 induces the fibroblast growth factor 10 gene(Fgf10) in limb patterning (Naiche and Papaioannou,2007) and Fgf10 was also cCFU-F-specific. Other genes in-volved in transcription, cell shape, migration, growthand differentiation (Barx1, Ednrb, Gpr88, Ramp3, Gas7,Mapk13, Mmp3, Sema3F/5F), were also enriched incCFU-F, perhaps identifying unique functions or adapta-tions of cCFU-F.
The bmMSC population showed strong enrichment forMeox1 (10-fold up-regulated in bmMSC), a transcriptionfactor associated with formation of somites andmaintenance of axial skeleton formation (Mankoo et al.,2003; Skuntz et al., 2009). This may reflect ‘memory of thetissue of origin’ or represent the presence of a subpopulationof more primitive cells. A striking number of immune-relatedgenes were also found to be either specific to, or enrichedin, bmMSC (Supplementary Table 7). Whilst many of theseappear to be involved in innate immunity (Oas1g, Oasl2,Ccl9, Cxcl10, Granzyme D/E and Dhx58), they are notknown to influence T-cell proliferation in the assay usedhere. Whilst the up-regulation of these genes implies anactive stress response pathway, or even the initiation of aviral response, other genes indicative of such a response,
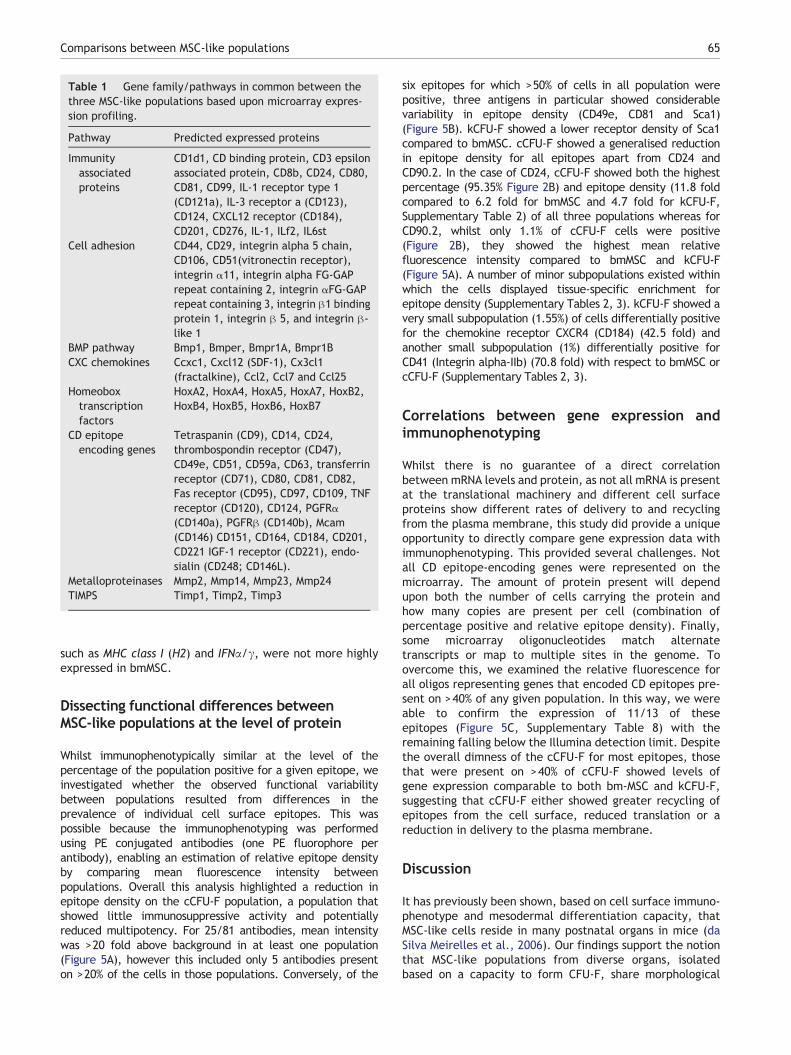
Table 1 Gene family/pathways in common between thethree MSC-like populations based upon microarray expres-sion profiling.
Pathway Predicted expressed proteins
Immunityassociatedproteins
CD1d1, CD binding protein, CD3 epsilonassociated protein, CD8b, CD24, CD80,CD81, CD99, IL-1 receptor type 1(CD121a), IL-3 receptor a (CD123),CD124, CXCL12 receptor (CD184),CD201, CD276, IL-1, ILf2, IL6st
Cell adhesion CD44, CD29, integrin alpha 5 chain,CD106, CD51(vitronectin receptor),integrin α11, integrin alpha FG-GAPrepeat containing 2, integrin αFG-GAPrepeat containing 3, integrin β1 bindingprotein 1, integrin β 5, and integrin β-like 1
BMP pathway Bmp1, Bmper, Bmpr1A, Bmpr1BCXC chemokines Ccxc1, Cxcl12 (SDF-1), Cx3cl1
(fractalkine), Ccl2, Ccl7 and Ccl25Homeoboxtranscriptionfactors
HoxA2, HoxA4, HoxA5, HoxA7, HoxB2,HoxB4, HoxB5, HoxB6, HoxB7
CD epitopeencoding genes
Tetraspanin (CD9), CD14, CD24,thrombospondin receptor (CD47),CD49e, CD51, CD59a, CD63, transferrinreceptor (CD71), CD80, CD81, CD82,Fas receptor (CD95), CD97, CD109, TNFreceptor (CD120), CD124, PGFRα(CD140a), PGFRβ (CD140b), Mcam(CD146) CD151, CD164, CD184, CD201,CD221 IGF-1 receptor (CD221), endo-sialin (CD248; CD146L).
Metalloproteinases Mmp2, Mmp14, Mmp23, Mmp24TIMPS Timp1, Timp2, Timp3
65Comparisons between MSC-like populations
such as MHC class I (H2) and IFNα/γ, were not more highlyexpressed in bmMSC.
Dissecting functional differences betweenMSC-like populations at the level of protein
Whilst immunophenotypically similar at the level of thepercentage of the population positive for a given epitope, weinvestigated whether the observed functional variabilitybetween populations resulted from differences in theprevalence of individual cell surface epitopes. This waspossible because the immunophenotyping was performedusing PE conjugated antibodies (one PE fluorophore perantibody), enabling an estimation of relative epitope densityby comparing mean fluorescence intensity betweenpopulations. Overall this analysis highlighted a reduction inepitope density on the cCFU-F population, a population thatshowed little immunosuppressive activity and potentiallyreduced multipotency. For 25/81 antibodies, mean intensitywas >20 fold above background in at least one population(Figure 5A), however this included only 5 antibodies presenton >20% of the cells in those populations. Conversely, of the
six epitopes for which >50% of cells in all population werepositive, three antigens in particular showed considerablevariability in epitope density (CD49e, CD81 and Sca1)(Figure 5B). kCFU-F showed a lower receptor density of Sca1compared to bmMSC. cCFU-F showed a generalised reductionin epitope density for all epitopes apart from CD24 andCD90.2. In the case of CD24, cCFU-F showed both the highestpercentage (95.35% Figure 2B) and epitope density (11.8 foldcompared to 6.2 fold for bmMSC and 4.7 fold for kCFU-F,Supplementary Table 2) of all three populations whereas forCD90.2, whilst only 1.1% of cCFU-F cells were positive(Figure 2B), they showed the highest mean relativefluorescence intensity compared to bmMSC and kCFU-F(Figure 5A). A number of minor subpopulations existed withinwhich the cells displayed tissue-specific enrichment forepitope density (Supplementary Tables 2, 3). kCFU-F showed avery small subpopulation (1.55%) of cells differentially positivefor the chemokine receptor CXCR4 (CD184) (42.5 fold) andanother small subpopulation (1%) differentially positive forCD41 (Integrin alpha-IIb) (70.8 fold) with respect to bmMSC orcCFU-F (Supplementary Tables 2, 3).
Correlations between gene expression andimmunophenotyping
Whilst there is no guarantee of a direct correlationbetween mRNA levels and protein, as not all mRNA is presentat the translational machinery and different cell surfaceproteins show different rates of delivery to and recyclingfrom the plasma membrane, this study did provide a uniqueopportunity to directly compare gene expression data withimmunophenotyping. This provided several challenges. Notall CD epitope-encoding genes were represented on themicroarray. The amount of protein present will dependupon both the number of cells carrying the protein andhow many copies are present per cell (combination ofpercentage positive and relative epitope density). Finally,some microarray oligonucleotides match alternatetranscripts or map to multiple sites in the genome. Toovercome this, we examined the relative fluorescence forall oligos representing genes that encoded CD epitopes pre-sent on >40% of any given population. In this way, we wereable to confirm the expression of 11/13 of theseepitopes (Figure 5C, Supplementary Table 8) with theremaining falling below the Illumina detection limit. Despitethe overall dimness of the cCFU-F for most epitopes, thosethat were present on >40% of cCFU-F showed levels ofgene expression comparable to both bm-MSC and kCFU-F,suggesting that cCFU-F either showed greater recycling ofepitopes from the cell surface, reduced translation or areduction in delivery to the plasma membrane.
Discussion
It has previously been shown, based on cell surface immuno-phenotype and mesodermal differentiation capacity, thatMSC-like cells reside in many postnatal organs in mice (daSilva Meirelles et al., 2006). Our findings support the notionthat MSC-like populations from diverse organs, isolatedbased on a capacity to form CFU-F, share morphological

Figure 4 Differential function and gene expression profile of bmMSC, cCFU-F and kCFU-F. A) Mixed lymphocyte reaction assay of in vitroimmune suppression of T-cell alloreactivity. The ability of each of the threeMSC-like populations to suppress proliferation of T-cells activatedin response to BALB/c [H-2d] stimulator cells. R+S=baseline proliferation (
3
H-thymidine uptake) of activated T-cells in the presence ofstimulator cells. 3×10³ or 3×10⁴ cells of each MSC-like population were co-cultured with responders and stimulators. Error bars representstandard error of the mean, n=3 to 5. Statistics calculated using one way analysis of variance with post hoc Dunnett's test (comparing allsamples to controls). ***=P>0.001, NS = not significantly different. B) Heat map representing the relative expression of 6533 genesdifferentially expressed between the three MSC-like populations. Blue — reduced relative expression, red — elevated relative expression.C) Venn diagram of differentially expressed genes from B). Venn diagram showing numbers of genes statistically differentially expressedby fold change. D) Representation of the most differentially up-regulated genes present in each of the three MSC-like populations. E) Repre-sentation of the most differentially down-regulated genes present in each of the three MSC-like populations.
66 R.A. Pelekanos et al.
and molecular characteristics as well as multipotency incommon with archetypal bmMSC (Caplan, 1991). Our resultsshow high congruence in gene expression, mesodermalpotential and immunophenotype. However, embedded inthe detectable differences were expression patterns thatsupport the hypothesis that tissue-specific MSC populations
are distinct and retain a ‘memory of tissue origin’ reflectiveof their unique ontogeny and functional roles.
This is not the first report describing MSC-like populationsfrom adult organs. Several groups have previously comparedthe transcriptional profiles of MSC populations from bonemarrow, amniotic fluid, amniotic membrane and umbilical

Table 2 Five most population-specific gene transcripts foreach of the three populations examined. Genes showingthe greatest enrichment of expression in comparison withboth other populations (enriched genes) were defined aspopulations specific if their relative expression was >5fold higher than the remaining populations, both of whichshowed expression of b200RFU (relative fluorescenceunits) for the same gene.
Bone marrow MSC specific genes
Gene name (symbol) bmMSCRaw RFU
cCFU-FRawRFU
kCFU-FRawRFU
Ubiquitin specific peptidase18 (USP18)
937.12 34.63 39.11
DEXH (Asp-Glu-X-His) boxpolypeptide 58 (DHX58)
742.94 42.40 30.41
2′-5′ oligoadenylatesynthetase-like 2 (OASL2)
2471.00 95.86 163.54
Radical S-adenosylmethionine domaincontaining 2 (RSAD2)
852.07 64.12 33.6
Kininogen 2 (Kng2) 1393.55 161.86 155.10
Cardiac cCFU-F specific genes
Gene name (symbol) cCFU-FRaw RFU
kCFU-FRawRFU
bmMSCRawRFU
Serine (or cysteine)peptidase inhibitor, cladeA, member 3N (Serpina3n)
11,937.01 12.13 23.66
G-protein coupled receptor88 (Gpr88)
2710.62 13.29 9.26
Fibroblast growth factor 10(Fgf10)
1204.88 8.85 11.01
LOC100046120 (similar toclusterin)
1602.12 11.60 15.18
SLIT and NTRK-like family,member 5 (Slitrk5)
1819.02 19.77 14.71
Kidney kCFU-F specific genes
Gene name (symbol) kCFU-FRaw RFU
bmMSCRawRFU
cCFU-FRawRFU
Natriuretic peptide precursortype B (NPPB)
1132.44 38.67 105.62
LOC100044395 (similar toRNA binding protein genewith multiple splicing)
831.74 99.50 63.39
Sciellin (SCEL) 559.75 8.54 66.58Williams–Beuren syndromechromosome region 17homolog (human)(WBSCR17)
616.02 73.79 71.70
LOC233466 942.52 179.03 93.15
67Comparisons between MSC-like populations
cord blood and compared these to foetal organs, includingdeveloping heart and kidney (Tsai et al., 2007; Menicaninet al., 2009). As we observed in our studies, such studiesreported Ctgf, CD44, and S100 genes encoding calciumbinding proteins (S100a6 in their study and S100a11 inours), serpin peptidase inhibitor genes (Serpine1 versusSerpinh1 and Serpinf1) and annexins (Anxa1 versus Anxa2)as some of the most highly expressed genes common to allsources of MSC. However, other genes previously linked toMSC were only selectively over-expressed in specificpopulations in this study. For example, kCFU-F showeddifferential over-expression of Hoxb6 and Anxa1 whereascCFU-F showed differential over-expression of Agtr1b.
MSC are reported to be able to home to distant sites ofdamage and participate in tissue repair and regeneration.This occurs in response to adhesion molecules, cytokinesand chemokines, presumably via a mechanism not dissim-ilar to that required to initiate leukocyte rolling and dia-pedesis (Kollar et al., 2009). Our immunophenotypinganalysis showed significant expression of CD29 (integrinα1), CD49e (integrin α5), CD51 (integrin αV) and CD44,all of which are likely to play a role in cell–cell adhesionduring active homing. Of note, CD61 (integrin α3) wasonly detected on bmMSC and kCFU-F. The expressiondata revealed marked expression of Mmp2, Mmp13 andMmp24 and their inhibitors Timp1, Timp2 and Timp3 inall three cell types. The balance between MMP and TIMPis crucial in allowing MSC to migrate through basementmembrane and endothelium to reach a distant sight of in-jury. It has been recently reported that Mmp/Timp ex-pression by MSC can be mediated by inflammatorycytokines. Such compounds may also regulate the mobili-sation of these populations from perivascular locations invivo when required for localised tissue repair (Tondreauet al., 2009; Ries et al., 2007).
Many immunity-associated genes previously linked toMSCs were also expressed by all 3 cell populations,particularly by bmMSC. A comparison of the functionalcapacity of each population to influence lymphocyticproliferation suggested significant differences betweenthe three sources of cells, with cCFU-F showing little activi-ty. This has also been observed in a previous study of MSC-derived populations from foetal heart (Jiang et al., 2006),although the converse has also been reported(Hoogduijn et al., 2007). We re-examined the cellsurface immunophenotype of these three populations inorder to identify an underlying mechanism for such function-al variability. All three populations showed high percentagesof cells positive for CD81, the relative mean intensity of thisepitope on cCFU-F was dramatically lower than in either ofthe other populations. CD81 (TAPA-1) is a member of thetransmembrane 4 superfamily whose loss has been associat-ed with enhanced T-cell proliferation (Miyazaki et al., 1997).It has been proposed that MSCs mediate their humoral prop-erties via the secretion of membrane-bound exosomes thatcontain a variety of chemokines and have been reported tocontain CD81 (Lai et al., 2010). The delivery of such exo-somes can reduce infarct size in animal models (Lai et al.,2010), suggesting a potential role for CD81 in immunosup-pression. Hence, reduced CD81 may at least in part explainthe reduced immunosuppressive capacity of the cCFU-Fpopulation.

Figure 5 Differential epitope density between bmMSC, cCFU-F and kCFU-F populations and correlations between gene expressionand immunophenotype. A) Graph of fold change in fluorescence intensity (representing relative epitope density) for all epitopeswhere at least one population displayed a fold change of >20. B) Graph of fold change in fluorescence intensity for all epitopesdetected on >50% of all three populations. C) Graph indicating the level of gene expression (mean fluorescence intensity) for allgenes encoding CD epitopes detected as present on >40% of cells in any given population. Epitope names are listed rather than thegene symbol of the encoding gene. Expression of CD201 and CD61 showed an Illumina detection score >0 (not expressed above back-ground). Gene expression for CD24 was not used as it mapped to more than one location in the genome. Gene expression could notdistinguish between CD90 and CD90.2 hence the intensity displayed is for an oligonucleotide mapping to Thy1, which encodes bothprotein isoforms. Data is presented for two Illumina probes representing CD71.
68 R.A. Pelekanos et al.
Several studies (Riekstina et al., 2009; Greco et al., 2007;Barraud et al., 2007; Lengner et al., 2007) have reported theexpression of embryonic stem (ES) cell markers on MSC derivedfrom bone marrow, adipose, dermal and heart. Knockdown ofOct4 in MSCs removes them from the cell cycle, as may be therole for this protein in ES cells. However, not all studies show
Oct4 expression in MSC and our data suggests no/negligibleexpression of this gene. However, we did observe expressionof a large number of Plurinet genes in these MSC populations.This may indicate a closer alignment to the ‘attractor state’ ofpluri/multipotency than other adult cell populations. IndeedMSCs from a variety of sources aremore readily reprogrammed

69Comparisons between MSC-like populations
to a pluripotent state than fibroblasts (Yan et al., 2009; Cai etal., 2010).
The proposed association between organ-specific MSCpopulations and the pericytic/perivascular compartmentagrees with literature from over 50 years ago addressing thepotency and plasticity of pericytes and their relatedlineages (Tilton, 1991). MSCs and pericytes likely share acommon phylogenetic and possibly ontological relationshipbeing descendants of distinct vascular beds both duringembryo development but also in the adult (Yamashita et al.,2000), and in the vasculature of tumours (Bexell et al.,2009). It has been suggested that within the perivascularenvironment, a continuum exists between fibroblasts, myofi-broblasts and vascular smooth muscle cells and that pericytesand MSC-like populations are closely related and locatedadjacent to the vascular endothelium throughout the organsof the body. In humans, both MSC and pericytes expressCD146, CD140b, CD271 and NG2 suggesting considerable com-monality between these cell types (Crisan et al., 2008; da SilvaMeirelles et al., 2008; Covas et al., 2008; Sundberg et al.,2002; Brachvogel et al., 2005). In support of this, we foundgene and/or protein expression of CD146, CD140b, αSMA,Cspg4/NG2, CD24, Annexin A5, and Desmin in each of our 3MSC-like populations. The relative level of each marker didvary, potentially indicating differences in the cell of origin orposition along a lineage continuumof each population, the lat-ter again potentially being affected by population heteroge-neity. Analysis of the most compartment-specific genes foreach population particularly supported this hypothesis forthe kCFU-F with enriched expression of Myh11, Mylk, Mcam(CD146), Efnb2, Edn1, Angpt2 and Vegfc (SupplementaryTable 7C), all of which are associatedwith vascular, lymphaticor perivascular smooth muscle development. In addition, bothkCFU-F and cCFU-F differentially expressed Crim1, a trans-membrane regulator of VEGF activity that is known to beexpressed in the perivascular musculature of large arteries(Pennisi et al., 2007). The stronger link with this ontogenyand MSC-like fractions isolated from solid organs may be ofsignificance.
One of the major challenges to the application of MSCs toorgan regeneration and repair in vivo has been cell delivery.Whilst it has been shown in some studies that MSCs deliveredinto the circulation can home to sites of damage, includingsites of ischemic injury in the kidney, the mechanism ofmigration is still unclear and there is substantial loss of cellsdelivered via this approach (Kollar et al., 2009). To fulfil thepromise of MSC-mediated tissue repair, it may thereforeprove necessary to stimulate the endogenous organ-specificMSC populations. Our data on the patterns of differentialgene expression between populations provide supportingevidence for a ‘memory of tissue origin’, highlighting a keygap in our understanding of CFU-F/MSC biology and thepotential of these cells for tissue repair. Most notable herewas the link between cCFU-F and key developmentaltranscriptional networks, including Mef2c and Isl1. Suchtissue-specific signatures may be derivative of the stem cellor more differentiated components of the colonies. Thesemay be related in evolutionary or ontological origin andshare a common set of functions, yet nonetheless possessdifferentiative potential and/or cellular functions attuned totheir specific roles in the tissue of origin. The otherexplanation for such differential gene expression in specific
MSC populations would be contamination of the cultures withorgan-specific cell types. The derivation of these MSCpopulations from CFU-F, followed by passaging, would makeit unlikely that such residual heterogeneity is the primarycause of differential gene expression unless these‘contaminating’ subpopulations were able to proliferate witha similar phenotype to MSCs. The functional pertinence ofsuch tissue-specific phenotypes will require additionalfunctional investigation, but may be critical to conferringorgan-specific regenerative capacities on organ-specificpopulations.
In conclusion, this study has expanded our understandingof the commonalities in genotype, phenotype and functionof murine MSC-like cells of distinct tissue origin. This hasserved to further reinforce the concept of a commonperivascular continuum and the retention of organ-specificroles. Further functional understanding of both the similari-ties and differences between such organ-specific popula-tions will be crucial to the development of future cellulartherapeutic approaches to tissue repair as these resultssuggest that finding the best “MSC” for a particular clinicalapplication will be of paramount importance.
Materials and methods
Isolation and ex vivo expansion of MSC-like populations
All procedures were approved by the University of Queenslandor the St. Vincent's Hospital/Garvan Institute Animal EthicCommittees. All MSC populations were derived from mice ofthe C57BL/6 strain. Bone/bone marrow MSC (bmMSC) wereisolated from crushed bones as described in Supplementarydata. Both cardiac and kidney MSC populations representpopulations able to be cultured as colony forming unit-fibroblast (CFU-F) cultures (Friedenstein et al., 1974) althougheach were isolated based upon specific protocols devised forheart or kidney respectively, as described in Supplementarydata. Each biological replicate represented an independentlyinitiated culture. In the case of cCFU-F, a single culture repre-sented a single heart with each heart able to generate approx-imately 17,000 CFU-F colonies. In the case of kidney, onebiological replicate represents isolation from a single animal(two kidneys), which equates to approximately 3–5000colonies. As bmMSC was isolated from crushed bones and notsimple bone marrow aspirates, a single replicate representedthe pooled crushed bones of 6–8 animals. Due to the capacityfor CD45+ leucocytes to be propagated alongwith bmMSC, cul-tures once established were FACS sorted to remove CD45+
cells.
All three cell types were cultured in αMEM(Invitrogen)+20% FCS for up to 14 passages. Microarray ex-pression profiling and initial immunophenotyping was per-formed at passage 5 to 10 (kidney P5, heart P7, bm P10).Initial immunophenotyping were performed with Sca1,CD11b, CD29, CD31, CD34, CD44, CD45, CD90.2 and CD117to establish that they displayed an MSC-like phenotype (Sup-plementary Figure S1). Subsequent characterization includ-ed morphological analysis and mesodermal differentiationassays (Figure 1), performed as described in Supplementarydata.

70 R.A. Pelekanos et al.
CD antibody array immunophenotyping
A total of 81 R-Phycoerythrin (PE)-conjugated CD antibodieswere used to examine the immunophenotype of each celltype. A list of all antibodies used and the protein epitopesthey recognise can be found in Supplementary Table 1. Anti-bodies were sourced from BD Biosciences and eBioscience.bmMSC, cCFU-F and kCFU-F were cultured until 70–80% con-fluent and dissociated from flasks with TrypLE Select (Invitro-gen), washed with PBS and 5×10⁶ cells were resuspended inPBS+2% BSA. 5×10⁴ cells were transferred to each well in aV-bottom 96 well plate and incubated with a 1:100 dilutionof anti-mouse PE-conjugated antibodies. Plates were incubat-ed on ice for 30 min, centrifuged at 1000 rpm, 5 min, 4 °C,washed in PBS+1% BSA, fixed in 4% PFA, 15 min on ice beforebeing washed and resuspended in PBS. Samples were analysedusing BD Bioscience LSRII with microplate reader attachment.Percentage positive cells (gating relative to unstained nega-tive control) and mean fluorescence intensity data were cal-culated using BD FACSDiva software (v 6.1.2). Histogramoverlays of representative results were created using Walterand Eliza Analysis Software: Eclectic and Lucid (WEASEL,V2.7.4, Walter and Eliza Hall Institute for Medical Research,Melbourne, Australia). Tree graphs were created in R software(v 2.6.2; http://www.r-project.org/) (Smyth, 2005). Initialexperiments using the Violet Viability kit (Invitrogen) wereused to define a region encompassing viable cells on ForwardScatter Area versus Side Scatter Area dotplot. This was appliedto subsequent analysis where the dye was not used (data notshown). Positive populations were delineated based upongating to exclude non-stained internal negative controlsincluded in each series of biological replicates (two non-stained control per dataset). The same gate was applied toall epitopes analysed in each replicate. The percentage ofcells positive represents the percentage of the counts presentwithin the positive gate. Mean fluorescence intensityindicates ce:hsp sp="0.25"/>the mean fluorescence for allcells within the positive cell gate. The average of these valuesfor each cell type is tabulated in Supplementary Table 3.Relative intensity for different epitopes (equivalent to epi-tope density) within a given biological replicate wascalculated by normalising mean fluorescence intensity backto the mean fluorescence intensity of the unstained negativecontrol samples, arbitrarily set at 1.0. This was expressed asfold change relative to no stain (see Supplementary Table 2).A direct comparison between immunophenotypic data obtainedusing the protocol adopted in the screen with the conventionalFACs performed in the initial immunophenotyping is presentedin Supplementary Figure S5.
Microarray sample preparation and data analysis
Detailed microarray sample preparation and analysis methodscan be found in the Supplementary data. Briefly, biological rep-licates included cells cultured to 65–80% confluence in 4 sepa-rate flasks concurrently for all three cell types. The samebatch of αMEM and FCS was used for all cells and handling wascarried out on all cells simultaneously tominimise transcription-al noise. Biotin-labelled cRNA was hybridised to mouse WG6 v2array (Illumina Inc, San Diego, CA) at 55 °C for 18 h, followedby labelling with streptavidin-Cy3 (GE Healthcare). Arrays
were scanned with the BeadStation 500 System and raw probeexpression values were extracted using BeadStudio v3 software(Illumina). The complete microarray data can be found in thepublicly accessible GEO database (GSE31738; GSM787845 toGSM787856). Further details of data analyses are described inSupplementary data. In brief, raw probe expression valueswere imported in R software (version 2.6.2) (Smyth, 2005),background corrected and quantile normalised using the Lumipackage (Du et al., 2008). Using the LIMMA package (Smyth,2005), an Empirical Bayes Analysis was run to determine thegenes with significant differential expression between each ofthe three cell types. This analysis included a multiple testingcorrection to reduce false positives (Smyth, 2004). For eachpair-wise comparison genes with a B-score greater than0 were selected as significant (pb0.005).
In order to measure the similarity between the three celltypes, Pearson correlations of each cell type against eachother were calculated (r2). The correlations were based ona subset of genes with medium to high expression levelsselected using Illumina's Detection Score (20,662 genes).Ingenuity Pathway Analysis (Ingenuity Systems Inc., RedwoodCity, CA) was performed to categorise the differentially regu-lated genes.
When comparing gene expression with protein levels ofCD epitopes, all oligonucleotides designated as representinga given CD epitope encoding gene were mapped back to theUCSC mouse genome build to check for oligonucleotides thatmapped to multiple locations in the genome (multimap-pers), alternative isoforms or the wrong locus. Data from ol-igonucleotides was also excluded from the comparison if theexpression of that oligonucleotide was regarded as belowbackground as determined by an Illumina detection scoreof >0.
Mixed leukocyte reaction (MLR) assay
Mixed lymphocyte reaction assays were performed as previ-ously described (Christensen et al., 2010). bmMSC, cCFU-Fand kCFU-F were plated at 3000 or 30 000 cells per well in aU-bottom 96 well plate (Greiner, Kremsmünster, Austria) inαMEM+20% FCS overnight and then irradiated (2000 cGy)prior to co-culture. Assays were carried out in completemedia (αMEM, 10% FCS, β-mercaptoethanol, HEPES andP/S/G). Stimulator splenocyte cells from BALB/c mice werecultured overnight with 100 ng/ml lipopolysaccharide (LPS,Sigma-Aldrich) in culture media in a humidified 37 °C, 5%CO2 incubator, then irradiated (2000 cGy) prior to co-culture(Christensen et al., 2010). Responder T-cells derived fromC57BL/6 mice were purified using a pan T-cell isolation kit(Miltenyi Biotec, Gladbach, Germany). Stimulator cells(2×10⁵ cells/well) and responder T-cells (3×10⁵ cells/well)were co-cultured (complete αMEM) in a humidified 37 °C, 5%CO2 incubator. Proliferation was assessed by [ 3H]-thymidineincorporation (1 μcurie/well) (GE Healthcare) after a total of96 h of culture. Cells were harvested using the TOMTEC 96-well Mach III Harvester (Perkin-Elmer, Victoria, Australia)and counts per minute (cpm) measured on a 1450 MICROBETATRILUX β-scintillation counter (Perkin-Elmer).
Supplementary materials related to this article can befound online at doi:10.1016/j.scr.2011.08.003.

71Comparisons between MSC-like populations
Acknowledgments
This work was supported by the Australian Stem CellCentre (grants to K.A., M.L, R.H. and S.G.), the Mater Medi-cal Research Institute/Mater Foundation (KA) and NHMRC(AMR). The microarray research was supported by theAustralian Research Council Special Research Centre for Func-tional and Applied Genomics (Institute for MolecularBioscience) Microarray Facility. Technical assistance inimmunophenotyping was provided by John Wilson andVirginia Nink from the Queensland Brain Institute FlowCytometry Facility, University of Queensland. Furthertechnical assistance was supplied by Robert Wadley. AMRis a Queensland Government Smart Futures Fellow. ML andSG are Research Fellows and RH is an Australia Fellow withthe National Health and Medical Research Council, Australia.
References
Barlow, S., Brooke, G., Chatterjee, K., Price, G., Pelekanos, R.,Rossetti, T., Doody, M., Venter, D., Pain, S., Gilshenan, K.,Atkinson, K., 2008. Comparison of human placenta- and bonemarrow-derived multipotent mesenchymal stem cells. StemCells Dev. 17, 1095–1107.
Barraud, P., Stott, S., Mollgard, K., Parmar, M., Bjorklund, A., 2007. Invitro characterization of a humanneural progenitor cell coexpressingSSEA4 and CD133. J. Neurosci. Res. 85, 250–259.
Basson, C.T., Bachinsky, D.R., Lin, R.C., Levi, T., Elkins, J.A., Soults,J., Grayzel, D., Kroumpouzou, E., Traill, T.A., Leblanc-Straceski,J., Renault, B., Kucherlapati, R., Seidman, J.G., Seidman, C.E.,1997. Mutations in human TBX5 [corrected] cause limb and cardiacmalformation in Holt–Oram syndrome. Nat. Genet. 15, 30–35.
Bexell, D., Gunnarsson, S., Tormin, A., Darabi, A., Gisselsson, D.,Roybon, L., Scheding, S., Bengzon, J., 2009. Bone marrowmultipotentmesenchymal stroma cells act as pericyte-likemigratoryvehicles in experimental gliomas. Mol. Ther. 17, 183–190.
Bianco, P., Robey, P.G., Simmons, P.J., 2008. Mesenchymal stemcells: revisiting history, concepts, and assays. Cell Stem Cell 2,313–319.
Brachvogel, B., Moch, H., Pausch, F., Schlotzer-Schrehardt, U.,Hofmann, C., Hallmann, R., von der Mark, K., Winkler, T., Poschl,E., 2005. Perivascular cells expressing annexin A5 define a novelmesenchymal stem cell-like population with the capacity to differ-entiate into multiple mesenchymal lineages. Development 132,2657–2668.
Cai, J., Li, W., Su, H., Qin, D., Yang, J., Zhu, F., Xu, J., He, W., Guo,X., Labuda, K., Peterbauer, A., Wolbank, S., Zhong, M., Li, Z.,Wu, W., So, K.F., Redl, H., Zeng, L., Esteban, M.A., Pei, D.,2010. Generation of human induced pluripotent stem cells fromumbilical cord matrix and amniotic membrane mesenchymalcells. J. Biol. Chem. 285, 11227–11234.
Califano, D., Monaco, C., Santelli, G., Giuliano, A., Veronese, M.L.,Berlingieri, M.T., de Franciscis, V., Berger, N., Trapasso, F.,Santoro, M., Viglietto, G., Fusco, A., 1998. Thymosin beta-10gene overexpression correlated with the highly malignantneoplastic phenotype of transformed thyroid cells in vivo andin vitro. Cancer Res. 58, 823–828.
Caplan, A.I., 1991. Mesenchymal stem cells. J. Orthop. Res. 9, 641–650.Christensen, M.E., Turner, B.E., Sinfield, L.J., Cullup, H., Kollar, K.,
Waterhouse, N.J., Hart, D.N., Atkinson, K., Rice, A.M., 2010.Infusion of allogeneic mesenchymal stromal cells can delay butnot prevent GVHD after murine transplantation. Haematologica95, 2102–2110.
Covas, D.T., Panepucci, R.A., Fontes, A.M., Silva Jr., W.A., Orellana,M.D., Freitas, M.C., Neder, L., Santos, A.R., Peres, L.C., Jamur,M.C., Zago, M.A., 2008. Multipotent mesenchymal stromal cellsobtained from diverse human tissues share functional propertiesand gene-expression profile with CD146+ perivascular cells andfibroblasts. Exp. Hematol. 36, 642–654.
Crisan, M., Yap, S., Casteilla, L., Chen, C.W., Corselli, M., Park,T.S., Andriolo, G., Sun, B., Zheng, B., Zhang, L., Norotte, C.,Teng, P.N., Traas, J., Schugar, R., Deasy, B.M., Badylak, S.,Buhring, H.J., Giacobino, J.P., Lazzari, L., Huard, J., Peault,B., 2008. A perivascular origin for mesenchymal stem cells inmultiple human organs. Cell Stem Cell 3, 301–313.
da Silva Meirelles, L., Nardi, N.B., 2003. Murine marrow-derivedmesenchymal stem cell: isolation, in vitro expansion, and character-ization. Br. J. Haematol. 123, 702–711.
da Silva Meirelles, L., Chagastelles, P.C., Nardi, N.B., 2006. Mesen-chymal stem cells reside in virtually all post-natal organs and tis-sues. J. Cell Sci. 119, 2204–2213.
da Silva Meirelles, L., Caplan, A.I., Nardi, N.B., 2008. In search ofthe in vivo identity of mesenchymal stem cells. Stem Cells 26,2287–2299.
Dodou, E., Verzi, M.P., Anderson, J.P., Xu, S.M., Black, B.L., 2004.Mef2c is a direct transcriptional target of ISL1 and GATA factorsin the anterior heart field during mouse embryonic develop-ment. Development 131, 3931–3942.
Dominici, M., Le Blanc, K., Mueller, I., Slaper-Cortenbach, I.,Marini, F., Krause, D., Deans, R., Keating, A., Prockop, D.,Horwitz, E., 2006. Minimal criteria for defining multipotentmesenchymal stromal cells. The International Society forCellular Therapy position statement. Cytotherapy 8, 315–317.
Du, P., Kibbe, W.A., Lin, S.M., 2008. lumi: a pipeline for processingIllumina microarray. Bioinformatics 24, 1547–1548.
Ebihara, Y., Masuya, M., Larue, A.C., Fleming, P.A., Visconti, R.P.,Minamiguchi, H., Drake, C.J., Ogawa, M., 2006. Hematopoieticorigins of fibroblasts: II. In vitro studies of fibroblasts, CFU-F,and fibrocytes. Exp. Hematol. 34, 219–229.
Fraser, J.K., Wulur, I., Alfonso, Z., Zhu, M., Wheeler, E.S., 2007.Differences in stem and progenitor cell yield in different subcu-taneous adipose tissue depots. Cytotherapy 9, 459–467.
Friedenstein, A.J., Deriglasova, U.F., Kulagina, N.N., Panasuk, A.F.,Rudakowa, S.F., Luria, E.A., Ruadkow, I.A., 1974. Precursors for fi-broblasts in different populations of hematopoietic cells as detectedby the in vitro colony assay method. Exp. Hematol. 2, 83–92.
Greco, S.J., Liu, K., Rameshwar, P., 2007. Functional similaritiesamong genes regulated by OCT4 in human mesenchymal and em-bryonic stem cells. Stem Cells 25, 3143–3154.
Guillot, P.V., Gotherstrom, C., Chan, J., Kurata, H., Fisk, N.M.,2007. Human first-trimester fetal MSC express pluripotencymarkers and grow faster and have longer telomeres than adultMSC. Stem Cells 25, 646–654.
Guillot, P.V., De Bari, C., Dell'Accio, F., Kurata, H., Polak, J., Fisk,N.M., 2008. Comparative osteogenic transcription profiling ofvarious fetal and adult mesenchymal stem cell sources. Differen-tiation 76, 946–957.
Hoogduijn, M.J., Crop, M.J., Peeters, A.M., Van Osch, G.J., Balk,A.H., Ijzermans, J.N., Weimar, W., Baan, C.C., 2007. Humanheart, spleen, and perirenal fat-derived mesenchymal stemcells have immunomodulatory capacities. Stem Cells Dev. 16,597–604.
Horwitz, E.M., Le Blanc, K., Dominici, M., Mueller, I., Slaper-Cortenbach, I., Marini, F.C., Deans, R.J., Krause, D.S., Keating,A., 2005. Clarification of the nomenclature for MSC: The Interna-tional Society for Cellular Therapy position statement. Cytother-apy 7, 393–395.
Huang, C.M., Wang, C.C., Barnes, S., Elmets, C.A., 2006. In vivo de-tection of secreted proteins from wounded skin using capillaryultrafiltration probes and mass spectrometric proteomics. Prote-omics 6, 5805–5814.

72 R.A. Pelekanos et al.
Iop, L., Chiavegato, A., Callegari, A., Bollini, S., Piccoli, M., Pozzobon,M., Rossi, C.A., Calamelli, S., Chiavegato, D., Gerosa, G., DeCoppi, P., Sartore, S., 2008. Different cardiovascular potential ofadult- and fetal-type mesenchymal stem cells in a rat model ofheart cryoinjury. Cell Transplant. 17, 679–694.
Jiang, X.X., Su, Y.F., Li, X.S., Zhang, Y., Wu, Y., Mao, N., 2006.Human fetal heart-derived adherent cells with characteristicssimilar to mesenchymal progenitor cells. Zhongguo Shi Yan XueYe Xue Za Zhi 14, 1191–1194.
Kassem, M., Kristiansen, M., Abdallah, B.M., 2004. Mesenchymalstem cells: cell biology and potential use in therapy. Basic Clin.Pharmacol. Toxicol. 95, 209–214.
Kern, S., Eichler, H., Stoeve, J., Kluter, H., Bieback, K., 2006. Compar-ative analysis of mesenchymal stem cells from bone marrow, umbil-ical cord blood, or adipose tissue. Stem Cells 24, 1294–1301.
Kode, J.A., Mukherjee, S., Joglekar, M.V., Hardikar, A.A., 2009.Mesenchymal stem cells: immunobiology and role in immunomo-dulation and tissue regeneration. Cytotherapy 11, 377–391.
Kollar, K., Cook, M.M., Atkinson, K., Brooke, G., 2009. Molecularmechanisms involved in mesenchymal stem cell migration to thesite of acute myocardial infarction. Int. J. Cell Biol. 2009, 904682.
Lai, R.C., Arslan, F., Lee, M.M., Sze, N.S., Choo, A., Chen, T.S.,Salto-Tellez, M., Timmers, L., Lee, C.N., El Oakley, R.M.,Pasterkamp, G., de Kleijn, D.P., Lim, S.K., 2010. Exosome se-creted by MSC reduces myocardial ischemia/reperfusion inju-ry. Stem Cell Res. 4, 214–222.
Lapteva, N., Ando, Y., Nieda, M., Hohjoh, H., Okai, M., Kikuchi, A.,Dymshits, G., Ishikawa, Y., Juji, T., Tokunaga, K., 2001. Profilingof genes expressed in human monocytes and monocyte-deriveddendritic cells using cDNA expression array. Br. J. Haematol.114, 191–197.
Lee, S.H., Son, M.J., Oh, S.H., Rho, S.B., Park, K., Kim, Y.J., Park, M.S.,Lee, J.H., 2005. Thymosin {beta}(10) inhibits angiogenesis and tumorgrowth by interfering with Ras function. Cancer Res. 65, 137–148.
Lengner, C.J., Camargo, F.D., Hochedlinger, K., Welstead, G.G.,Zaidi, S., Gokhale, S., Scholer, H.R., Tomilin, A., Jaenisch, R.,2007. Oct4 expression is not required for mouse somatic stemcell self-renewal. Cell Stem Cell 1, 403–415.
Li, G., Zhang, X.A., Wang, H., Wang, X., Meng, C.L., Chan, C.Y.,Yew, D.T., Tsang, K.S., Li, K., Tsai, S.N., Ngai, S.M., Han, Z.C.,Lin, M.C., He, M.L., Kung, H.F., 2009. Comparative proteomicanalysis of mesenchymal stem cells derived from human bonemarrow, umbilical cord, and placenta: implication in the migra-tion. Proteomics 9, 20–30.
Lin, Q., Schwarz, J., Bucana, C., Olson, E.N., 1997. Control ofmouse cardiac morphogenesis and myogenesis by transcriptionfactor MEF2C. Science 276, 1404–1407.
Mankoo, B.S., Skuntz, S., Harrigan, I., Grigorieva, E., Candia, A.,Wright, C.V., Arnheiter, H., Pachnis, V., 2003. The concerted ac-tion of Meox homeobox genes is required upstream of geneticpathways essential for the formation, patterning and differenti-ation of somites. Development 130, 4655–4664.
Menicanin, D., Bartold, P.M., Zannettino, A.C., Gronthos, S., 2009.Genomic profiling of mesenchymal stem cells. Stem Cell Rev.5, 36–50.
Miyazaki, T., Muller, U., Campbell, K.S., 1997. Normal developmentbut differentially altered proliferative responses of lymphocytesin mice lacking CD81. EMBO J. 16, 4217–4225.
Montesinos, J.J., Flores-Figueroa, E., Castillo-Medina, S., Flores-Guzman, P., Hernandez-Estevez, E., Fajardo-Orduna, G., Orozco,S., Mayani, H., 2009. Human mesenchymal stromal cells fromadult and neonatal sources: comparative analysis of their morphol-ogy, immunophenotype, differentiation patterns and neural pro-tein expression. Cytotherapy 11, 163–176.
Muller, F.J., Laurent, L.C., Kostka, D., Ulitsky, I., Williams, R., Lu,C., Park, I.H., Rao, M.S., Shamir, R., Schwartz, P.H., Schmidt,N.O., Loring, J.F., 2008. Regulatory networks define phenotypicclasses of human stem cell lines. Nature 455, 401–405.
Naiche, L.A., Papaioannou, V.E., 2007. Tbx4 is not required for hin-dlimb identity or post-bud hindlimb outgrowth. Development134, 93–103.
Noel, D., Caton, D., Roche, S., Bony, C., Lehmann, S., Casteilla, L.,Jorgensen, C., Cousin, B., 2008. Cell specific differences be-tween human adipose-derived and mesenchymal–stromal cellsdespite similar differentiation potentials. Exp. Cell Res. 314,1575–1584.
Oliver, J.A., Maarouf, O., Cheema, F.H., Martens, T.P., Al-Awqati,Q., 2004. The renal papilla is a niche for adult kidney stemcells. J. Clin. Investig. 114, 795–804.
Patschan, D., Michurina, T., Shi, H.K., Dolff, S., Brodsky, S.V.,Vasilieva, T., Cohen-Gould, L., Winaver, J., Chander, P.N.,Enikolopov, G., Goligorsky, M.S., 2007. Normal distribution andmedullary-to-cortical shift of Nestin-expressing cells in acuterenal ischemia. Kidney Int. 71, 744–754.
Pennisi, D.J., Wilkinson, L., Kolle, G., Sohaskey, M.L., Gillinder, K.,Piper, M.J., McAvoy, J.W., Lovicu, F.J., Little, M.H., 2007.Crim1KST264/KST264 mice display a disruption of the Crim1gene resulting in perinatal lethality with defects in multipleorgan systems. Dev. Dyn. 236, 502–511.
Phinney, D.G., Hill, K., Michelson, C., DuTreil, M., Hughes, C.,Humphries, S., Wilkinson, R., Baddoo, M., Bayly, E., 2006. Bio-logical activities encoded by the murine mesenchymal stemcell transcriptome provide a basis for their developmentalpotential and broad therapeutic efficacy. Stem Cells 24,186–198.
Pittenger, M.F., Mackay, A.M., Beck, S.C., Jaiswal, R.K., Douglas,R., Mosca, J.D., Moorman, M.A., Simonetti, D.W., Craig, S.,Marshak, D.R., 1999. Multilineage potential of adult humanmesenchymal stem cells. Science 284, 143–147.
Riekstina, U., Cakstina, I., Parfejevs, V., Hoogduijn, M., Jankovskis,G., Muiznieks, I., Muceniece, R., Ancans, J., 2009. Embryonicstem cell marker expression pattern in human mesenchymalstem cells derived from bone marrow, adipose tissue, heartand dermis. Stem Cell Rev. 5, 378–386.
Ries, C., Egea, V., Karow, M., Kolb, H., Jochum, M., Neth, P.,2007. MMP-2, MT1-MMP, and TIMP-2 are essential for the inva-sive capacity of human mesenchymal stem cells: differentialregulation by inflammatory cytokines. Blood 109, 4055–4063.
Roubelakis, M.G., Pappa, K.I., Bitsika, V., Zagoura, D., Vlahou, A.,Papadaki, H.A., Antsaklis, A., Anagnou, N.P., 2007. Molecularand proteomic characterization of human mesenchymal stemcells derived from amniotic fluid: comparison to bone marrowmesenchymal stem cells. Stem Cells Dev. 16, 931–952.
Sarugaser, R., Lickorish, D., Baksh, D., Hosseini, M.M., Davies, J.E.,2005. Human umbilical cord perivascular (HUCPV) cells: a sourceof mesenchymal progenitors. Stem Cells 23, 220–229.
Skuntz, S., Mankoo, B., Nguyen, M.T., Hustert, E., Nakayama, A.,Tournier-Lasserve, E., Wright, C.V., Pachnis, V., Bharti, K.,Arnheiter, H., 2009. Lack of the mesodermal homeodomainprotein MEOX1 disrupts sclerotome polarity and leads to aremodeling of the cranio-cervical joints of the axial skeleton.Dev. Biol. 332, 383–395.
Smyth, G.K., 2004. Linear models and empirical bayes methods forassessing differential expression in microarray experiments.Stat. Appl. Genet. Mol. Biol. 3 Article3.
Smyth, G.K., 2005. Limma: Linear Models For Microarray Data, eds.Bioinformatics and Computational Biology Solutions Using R andBioconductor. Springer, New York, pp. 397–420.
Steigman, S.A., Fauza, D.O., 2007. Isolation of mesenchymal stemcells from amniotic fluid and placenta. Curr. Protoc. Stem CellBiol. 1:1E.2.1–1E.2.12.
Sundberg, C., Kowanetz, M., Brown, L.F., Detmar, M., Dvorak, H.F.,2002. Stable expression of angiopoietin-1 and other markers bycultured pericytes: phenotypic similarities to a subpopulationof cells in maturing vessels during later stages of angiogenesisin vivo. Lab. Investig. 82, 387–401.

73Comparisons between MSC-like populations
Tilton, R.G., 1991. Capillary pericytes: perspectives and futuretrends. J. Electron Microsc. Tech. 19, 327–344.
Tondreau, T., Meuleman, N., Stamatopoulos, B., De Bruyn, C.,Delforge, A., Dejeneffe, M., Martiat, P., Bron, D., Lagneaux, L.,2009. In vitro study of matrix metalloproteinase/tissue inhibitorof metalloproteinase production by mesenchymal stromal cells inresponse to inflammatory cytokines: the role of their migration ininjured tissues. Cytotherapy 11, 559–569.
Tsai, M.S., Hwang, S.M., Chen, K.D., Lee, Y.S., Hsu, L.W., Chang,Y.J., Wang, C.N., Peng, H.H., Chang, Y.L., Chao, A.S., Chang,S.D., Lee, K.D., Wang, T.H., Wang, H.S., Soong, Y.K., 2007.Functional network analysis of the transcriptomes of mesenchy-mal stem cells derived from amniotic fluid, amniotic mem-brane, cord blood, and bone marrow. Stem Cells 25, 2511–2523.
Wagner, W., Wein, F., Seckinger, A., Frankhauser, M., Wirkner, U.,Krause, U., Blake, J., Schwager, C., Eckstein, V., Ansorge, W.,Ho, A.D., 2005. Comparative characteristics of mesenchymalstem cells from human bone marrow, adipose tissue, and umbilicalcord blood. Exp. Hematol. 33, 1402–1416.
Wang, S.S., Asfaha, S., Okumura, T., Betz, K.S., Muthupalani, S.,Rogers, A.B., Tu, S., Takaishi, S., Jin, G., Yang, X., Wu, D.C.,Fox, J.G., Wang, T.C., 2009. Fibroblastic colony-forming unit
bone marrow cells delay progression to gastric dysplasia in ahelicobacter model of gastric tumorigenesis. Stem Cells 27,2301–2311.
Wiese, C., Rolletschek, A., Kania, G., Blyszczuk, P., Tarasov, K.V.,Tarasova, Y., Wersto, R.P., Boheler, K.R., Wobus, A.M., 2004.Nestin expression—a property of multi-lineage progenitor cells?Cell. Mol. Life Sci. 61, 2510–2522.
Xu, G., Zhang, Y., Zhang, L., Ren, G., Shi, Y., 2008. Bone marrow stro-mal cells induce apoptosis of lymphoma cells in the presence ofIFNgamma and TNF by producing nitric oxide. Biochem. Biophys.Res. Commun. 375, 666–670.
Yamashita, J., Itoh, H., Hirashima, M., Ogawa, M., Nishikawa, S.,Yurugi, T., Naito, M., Nakao, K., 2000. Flk1-positive cells derivedfrom embryonic stem cells serve as vascular progenitors. Nature408, 92–96.
Yan, X., Qin, H., Qu, C., Tuan, R.S., Shi, S., Huang, G.T., 2009. iPScells reprogrammed from human mesenchymal-like stem/pro-genitor cells of dental tissue origin. Stem Cells Dev. 19, 469–480.
Zhang, Z.Y., Teoh, S.H., Chong, M.S., Schantz, J.T., Fisk, N.M.,Choolani, M.A., Chan, J., 2009. Superior osteogenic capacityfor bone tissue engineering of fetal compared with perinataland adult mesenchymal stem cells. Stem Cells 27, 126–137.
Related Documents