Comprehensive Study on Polluted River Stretch of Ulhas River – Downstream of Mohane, Kalyan for Maharashtra Pollution Control Board Kalyan Prepared By M/s SADEKAR ENVIRO ENGINEERS PVT. LTD. QCI – NABET Accredited EIA Consultant Lab. Accredited by MoEF, Govt. of India & NABL Certified by ISO 9001:2008 Certified by BS OHSAS 18001:2007 Address 403, Paradise Tower, Opp.Alok Hotel, Gokhale Road, Thane: 400602 Email : [email protected] /[email protected] Web site:- www.sadekarenviro.com January, 2015 Pollution Stretch Node ‐02 Node ‐01

Welcome message from author
This document is posted to help you gain knowledge. Please leave a comment to let me know what you think about it! Share it to your friends and learn new things together.
Transcript
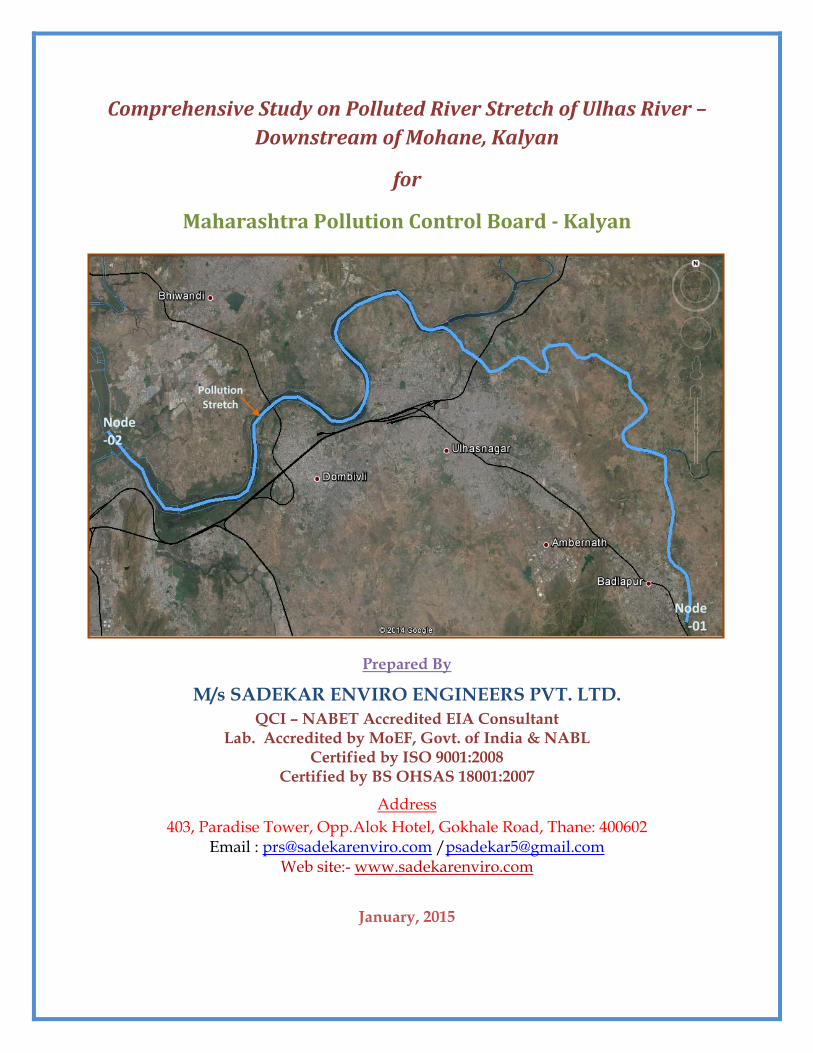
Comprehensive Study on Polluted River Stretch of Ulhas River – Downstream of Mohane, Kalyan
for
Maharashtra Pollution Control Board Kalyan
Prepared By
M/s SADEKAR ENVIRO ENGINEERS PVT. LTD. QCI – NABET Accredited EIA Consultant
Lab. Accredited by MoEF, Govt. of India & NABL Certified by ISO 9001:2008
Certified by BS OHSAS 18001:2007
Address 403, Paradise Tower, Opp.Alok Hotel, Gokhale Road, Thane: 400602
Email : [email protected] /[email protected] Web site:- www.sadekarenviro.com
January, 2015
Pollution Stretch
Node ‐02
Node ‐01
Particulars Content Page No.
Chapter ‐ 1 INTRODUCTION 1‐1 ‐ 1‐5 1.1 Ulhas River 1‐1 1.2 Course of River 1‐1 1.3 Objectives of the Study 1‐1 1.4 Scope of the study 1‐2 1.5 Approach strategy 1‐4 1.5.1 Identification of pollution stretch 1‐4 1.6 Purpose of the study 1‐5
Chapter ‐ 2 PROJECT DESCRIPTION 2‐1 ‐ 2‐6 2 .1 Pollution Stretch 2‐1 2.2 Background 2‐1 2.3 Period of Study and Sampling Locations 2‐2 2.4 Materials and Methods 2‐5
Chapter ‐3 PREVAILING ENVIRONMENT 3‐1 ‐ 3‐30 3.0 Location of cities & Towns 3‐1
3.1 Polluting Industries (from Notified Industrial Estates/ Area)
3‐1
3.1.1 Pollution load from Industries located out of notified industrial area
3‐5
3.2 Pollution Load from Notified Industrial Estate /Area 3‐7 3.3 Application of CETPs for Cluster of Small Scale Industries 3‐12 3.4 Domestic pollution 3‐12 3.4.1 Major Outfalls 3‐14 3.4.2 Characterization of Municipal Waste Water 3‐16
3.4.3 Identification of extent of Pollution Control needed in a view of critical flow conditions
3‐18
3.4.4 Utilization of Waste Water 3‐19
3.5 Water Quality in identified Pollution Stretch of Ulhas River
3‐19
3.5.1 River Flow 3‐19
3.6 Graphical representation of Parameters for Samples collected from UR, ME, LE & RU
3‐20
3.6.1 Temperature 3‐20 3.6.2 pH 3‐21 3.6.3 TSS and O&G 3‐22 3.6.4 TDS, Salinity, Chlorides and Sodium 3‐23 3.6.5 DO, COD and BOD 3‐25 3.6.6 Metals 3‐28 3.7 Outcome of the study 3‐30
Chapter – 4 SITE SELECTION AND TREATMENT TECHNOLOGY 4‐1 ‐ 4‐4 4.1 Site Identification and proposed Treatment 4‐1 4.2 Google Imaginary for the proposed location of STP 4‐2 4.3 Treatment Technology 4‐2 4.3.1 Settling Tank 4‐2 4.3.2 Bio Reactor 4‐3 4.3.3 Classification of the Process 4‐3 4.3.4 Clarisettler 4‐4
Annexure ‐ I ANALYSIS RESULTS I:1‐ I:16 1 Water Quality at Polluted River Stretch I:1 2 Water Quality of identified Major Outfalls I:11
Annexure ‐ II MONITORING PHOTOGRAPHS II:1 – II: 15 Annexure ‐ III LAND USE AND LAND COVER III:1
Attachments Land Use Land Cover ‐1 Land Use Land Cover ‐2 Drainage Pattern
‐
Comprehensive Study on Polluted River Stretch of Ulhas River – Downstream of Mohane, Kalyan
MPCB Kalyan
Chapter 1‐1 | Sadekar Enviro Engineers Pvt. Ltd.
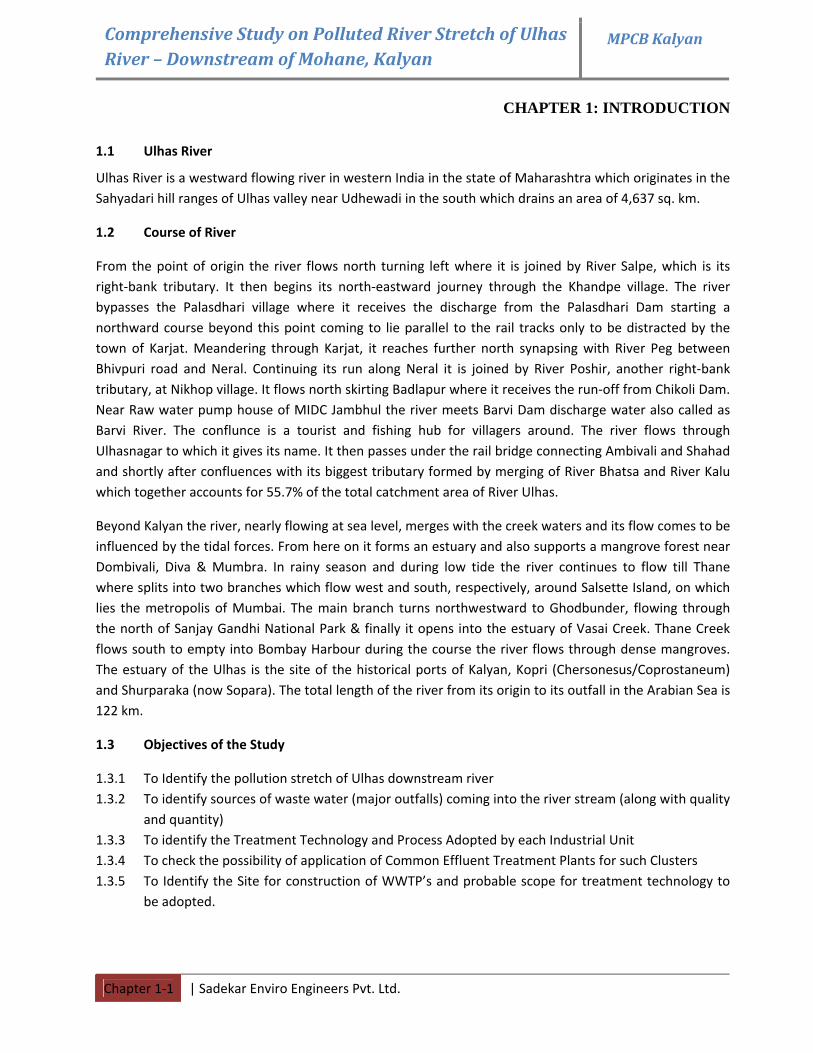
CHAPTER 1: INTRODUCTION
1.1 Ulhas River
Ulhas River is a westward flowing river in western India in the state of Maharashtra which originates in the Sahyadari hill ranges of Ulhas valley near Udhewadi in the south which drains an area of 4,637 sq. km.
1.2 Course of River
From the point of origin the river flows north turning left where it is joined by River Salpe, which is its right‐bank tributary. It then begins its north‐eastward journey through the Khandpe village. The river bypasses the Palasdhari village where it receives the discharge from the Palasdhari Dam starting a northward course beyond this point coming to lie parallel to the rail tracks only to be distracted by the town of Karjat. Meandering through Karjat, it reaches further north synapsing with River Peg between Bhivpuri road and Neral. Continuing its run along Neral it is joined by River Poshir, another right‐bank tributary, at Nikhop village. It flows north skirting Badlapur where it receives the run‐off from Chikoli Dam. Near Raw water pump house of MIDC Jambhul the river meets Barvi Dam discharge water also called as Barvi River. The conflunce is a tourist and fishing hub for villagers around. The river flows through Ulhasnagar to which it gives its name. It then passes under the rail bridge connecting Ambivali and Shahad and shortly after confluences with its biggest tributary formed by merging of River Bhatsa and River Kalu which together accounts for 55.7% of the total catchment area of River Ulhas.
Beyond Kalyan the river, nearly flowing at sea level, merges with the creek waters and its flow comes to be influenced by the tidal forces. From here on it forms an estuary and also supports a mangrove forest near Dombivali, Diva & Mumbra. In rainy season and during low tide the river continues to flow till Thane where splits into two branches which flow west and south, respectively, around Salsette Island, on which lies the metropolis of Mumbai. The main branch turns northwestward to Ghodbunder, flowing through the north of Sanjay Gandhi National Park & finally it opens into the estuary of Vasai Creek. Thane Creek flows south to empty into Bombay Harbour during the course the river flows through dense mangroves. The estuary of the Ulhas is the site of the historical ports of Kalyan, Kopri (Chersonesus/Coprostaneum) and Shurparaka (now Sopara). The total length of the river from its origin to its outfall in the Arabian Sea is 122 km.
1.3 Objectives of the Study
1.3.1 To Identify the pollution stretch of Ulhas downstream river 1.3.2 To identify sources of waste water (major outfalls) coming into the river stream (along with quality
and quantity) 1.3.3 To identify the Treatment Technology and Process Adopted by each Industrial Unit 1.3.4 To check the possibility of application of Common Effluent Treatment Plants for such Clusters 1.3.5 To Identify the Site for construction of WWTP’s and probable scope for treatment technology to
be adopted.
Comprehensive Study on Polluted River Stretch of Ulhas River – Downstream of Mohane, Kalyan
MPCB Kalyan
Chapter 1‐2 | Sadekar Enviro Engineers Pvt. Ltd.
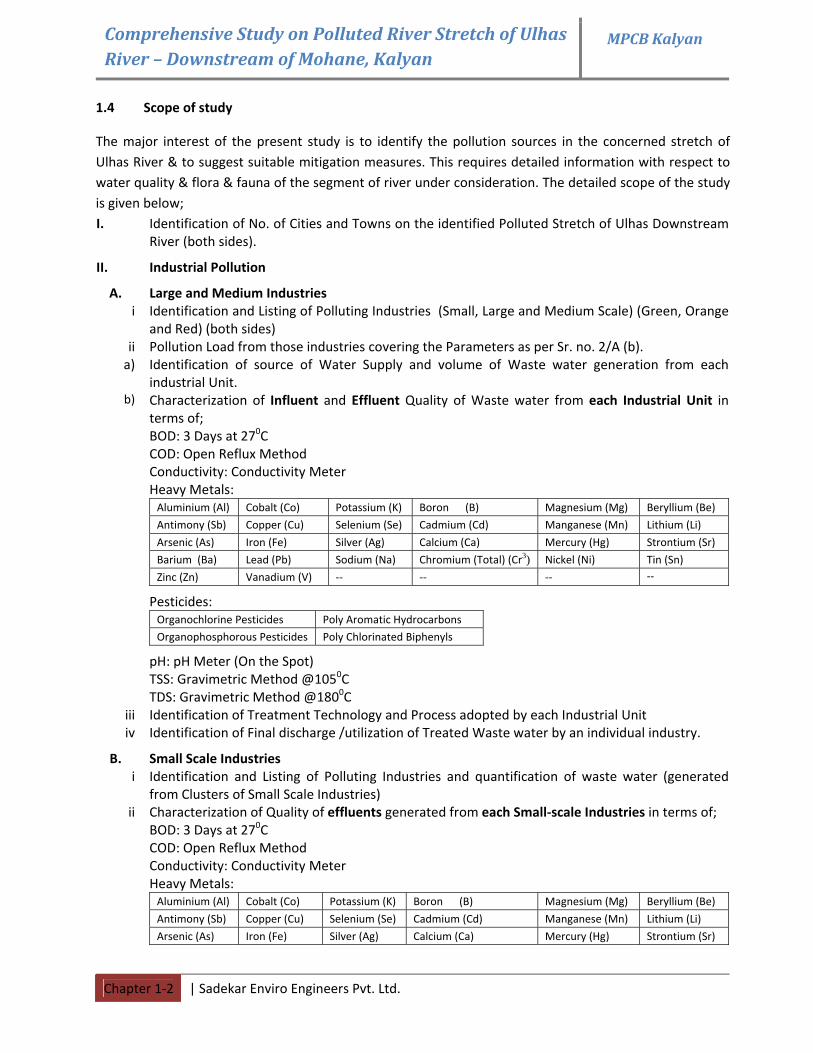
1.4 Scope of study
The major interest of the present study is to identify the pollution sources in the concerned stretch of Ulhas River & to suggest suitable mitigation measures. This requires detailed information with respect to water quality & flora & fauna of the segment of river under consideration. The detailed scope of the study is given below; I. Identification of No. of Cities and Towns on the identified Polluted Stretch of Ulhas Downstream
River (both sides).
II. Industrial Pollution
A. Large and Medium Industries i Identification and Listing of Polluting Industries (Small, Large and Medium Scale) (Green, Orange
and Red) (both sides) ii Pollution Load from those industries covering the Parameters as per Sr. no. 2/A (b). a) Identification of source of Water Supply and volume of Waste water generation from each
industrial Unit. b) Characterization of Influent and Effluent Quality of Waste water from each Industrial Unit in
terms of; BOD: 3 Days at 270C COD: Open Reflux Method Conductivity: Conductivity Meter Heavy Metals: Aluminium (Al) Cobalt (Co) Potassium (K) Boron (B) Magnesium (Mg) Beryllium (Be)
Antimony (Sb) Copper (Cu) Selenium (Se) Cadmium (Cd) Manganese (Mn) Lithium (Li)
Arsenic (As) Iron (Fe) Silver (Ag) Calcium (Ca) Mercury (Hg) Strontium (Sr)
Barium (Ba) Lead (Pb) Sodium (Na) Chromium (Total) (Cr3) Nickel (Ni) Tin (Sn)
Zinc (Zn) Vanadium (V) ‐‐ ‐‐ ‐‐ ‐‐
Pesticides: Organochlorine Pesticides Poly Aromatic Hydrocarbons
Organophosphorous Pesticides Poly Chlorinated Biphenyls
pH: pH Meter (On the Spot) TSS: Gravimetric Method @1050C TDS: Gravimetric Method @1800C
iii Identification of Treatment Technology and Process adopted by each Industrial Unit iv Identification of Final discharge /utilization of Treated Waste water by an individual industry.
B. Small Scale Industries i Identification and Listing of Polluting Industries and quantification of waste water (generated
from Clusters of Small Scale Industries) ii Characterization of Quality of effluents generated from each Small‐scale Industries in terms of;
BOD: 3 Days at 270C COD: Open Reflux Method Conductivity: Conductivity Meter Heavy Metals: Aluminium (Al) Cobalt (Co) Potassium (K) Boron (B) Magnesium (Mg) Beryllium (Be)
Antimony (Sb) Copper (Cu) Selenium (Se) Cadmium (Cd) Manganese (Mn) Lithium (Li)
Arsenic (As) Iron (Fe) Silver (Ag) Calcium (Ca) Mercury (Hg) Strontium (Sr)
Comprehensive Study on Polluted River Stretch of Ulhas River – Downstream of Mohane, Kalyan
MPCB Kalyan
Chapter 1‐3 | Sadekar Enviro Engineers Pvt. Ltd.
Barium (Ba) Lead (Pb) Sodium (Na) Chromium (Total) (Cr3) Nickel (Ni) Tin (Sn)
Zinc (Zn) Vanadium (V) ‐‐ ‐‐ ‐‐ ‐‐
Pesticides: Organochlorine Pesticides Poly Aromatic Hydrocarbons
Organophosphorous Pesticides Poly Chlorinated Biphenyls
pH: pH Meter (On the Spot) TSS: Gravimetric Method @1050C TDS: Gravimetric Method @1800C
iii Possibility of application of Common Effluent Treatment Plants for such Clusters.
III. Domestic Pollution i Identification of number of waste water outfalls coming directly into the River along with their
locations. Ii
iii
Estimation of the Quantity of Municipal Waste water generation based upon the capacity of CWWTP wherever available and by identifying the area of contamination (both sides of River). Collection of samples from the source of Municipal Waste Water and to perform the Qualitative analysis for the following Parameters; BOD: 3 Days at 270C COD: Open Reflux Method Conductivity: Conductivity Meter Heavy Metals: Aluminium (Al) Cobalt (Co) Potassium (K) Boron (B) Magnesium (Mg) Beryllium (Be)
Antimony (Sb) Copper (Cu) Selenium (Se) Cadmium (Cd) Manganese (Mn) Lithium (Li)
Arsenic (As) Iron (Fe) Silver (Ag) Calcium (Ca) Mercury (Hg) Strontium (Sr)
Barium (Ba) Lead (Pb) Sodium (Na) Chromium (Total) (Cr3) Nickel (Ni) Tin (Sn)
Zinc (Zn) Vanadium (V) ‐‐ ‐‐ ‐‐ ‐‐
Pesticides: Organochlorine Pesticides Poly Aromatic Hydrocarbons
Organophosphorous Pesticides Poly Chlorinated Biphenyls pH: pH Meter (On the Spot) TSS: Gravimetric Method @1050C TDS: Gravimetric Method @1800C
iv Identification of extent of Pollution Control needed in a view of critical flow conditions and comparing with desired quality criteria.
v Identification of the sources utilizing the Waste water for Agriculture purposes along with the Quantity.
IV. River Water Quality i Measurement of River Flow at specific distance considering the Geographical condition of that
particular stretch or ingress of major source of pollution. ii Collection of samples from polluted stretch at a specific distance or at a point of ingress of major
source of pollution and to perform the Qualitative analysis for the following Parameters; BOD: 3 Days at 270C COD: Open Reflux Method Conductivity: Conductivity Meter Heavy Metals:
Comprehensive Study on Polluted River Stretch of Ulhas River – Downstream of Mohane, Kalyan
MPCB Kalyan
Chapter 1‐4 | Sadekar Enviro Engineers Pvt. Ltd.
Aluminium (Al) Cobalt (Co) Potassium (K) Boron (B) Magnesium (Mg) Beryllium (Be)
Antimony (Sb) Copper (Cu) Selenium (Se) Cadmium (Cd) Manganese (Mn) Lithium (Li)
Arsenic (As) Iron (Fe) Silver (Ag) Calcium (Ca) Mercury (Hg) Strontium (Sr)
Barium (Ba) Lead (Pb) Sodium (Na) Chromium (Total) (Cr3) Nickel (Ni) Tin (Sn)
Zinc (Zn) Vanadium (V) ‐‐ ‐‐ ‐‐ ‐‐
Pesticides: Organochlorine Pesticides Poly Aromatic Hydrocarbons
Organophosphorous Pesticides Poly Chlorinated Biphenyls
pH: pH Meter (On the Spot) TSS: Gravimetric Method @1050C TDS: Gravimetric Method @1800C
iii Projection of quality of River water in those stretches if effluents are either diverted or discharged after adequate treatment only.
iv Identification and quantification of Industries contributing the Municipal Waste.
V. Site Selection for WWT and Treatment Technology i Identification of Site for the construction of WWTP as per the Geographical conditions and the
probable scope of Treatment Technology to be adopted. 1.5 Approach strategy
It is inevitable that the release of treated effluent & untreated domestic sewage into Ulhas River would cause certain adverse impact on the riverine ecology, the intensity of which would vary depending on various factors such as quality & quantity of the effluent, assimilative capacity of the receiving water and the degree of the ecological sensitivity of the region. The enhancement in the levels of pollutants in the receiving water over the natural background is the major factor to influence the ecology.
However, as the estuarine & rivirine environment can undergo changes on the short time scales, the prevailing conditions needs to be assessed. Hence a comprehensive study on water quality was conducted in Ulhas River during Pre monsoon 2014. M/s Sadekar Enviro Engineers Pvt. Ltd. has undertaken field investigations in different locations in the Ulhas River.
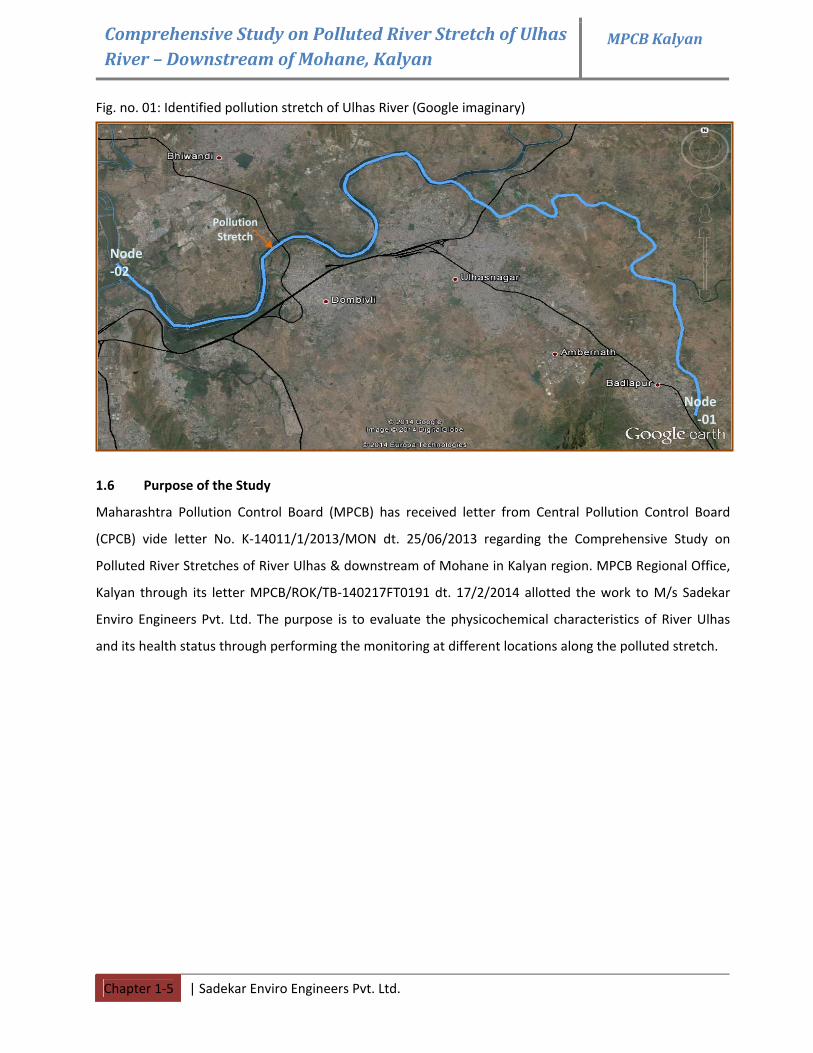
1.5.1 Identification of pollution stretch
For the study purpose the stretch is identified based on the closed proximity of large habitations (Commercial & residential) along the course of river Ulhas which is irrespective of its length.
The pollution stretch started from barrage dam near Kharvai, Badlapur (Node ‐01) and ends at Pipeline road, Raheja complex (fly over), Majiwada, Thane (Node ‐02) and the total length of the pollution stretch is coming around 50km in length.
Comprehensive Study on Polluted River Stretch of Ulhas River – Downstream of Mohane, Kalyan
MPCB Kalyan
Chapter 1‐5 | Sadekar Enviro Engineers Pvt. Ltd.
Fig. no. 01: Identified pollution stretch of Ulhas River (Google imaginary)
1.6 Purpose of the Study
Maharashtra Pollution Control Board (MPCB) has received letter from Central Pollution Control Board
(CPCB) vide letter No. K‐14011/1/2013/MON dt. 25/06/2013 regarding the Comprehensive Study on
Polluted River Stretches of River Ulhas & downstream of Mohane in Kalyan region. MPCB Regional Office,
Kalyan through its letter MPCB/ROK/TB‐140217FT0191 dt. 17/2/2014 allotted the work to M/s Sadekar
Enviro Engineers Pvt. Ltd. The purpose is to evaluate the physicochemical characteristics of River Ulhas
and its health status through performing the monitoring at different locations along the polluted stretch.
Pollution Stretch
Node ‐02
Node ‐01
Comprehensive Study on Polluted River Stretch of Ulhas River – Downstream of Mohane, Kalyan
MPCB Kalyan
Chapter 2‐1 | Sadekar Enviro Engineers Pvt. Ltd.
CHAPTER 2: PROJECT DESCRIPTION
2.1 Pollution Stretch
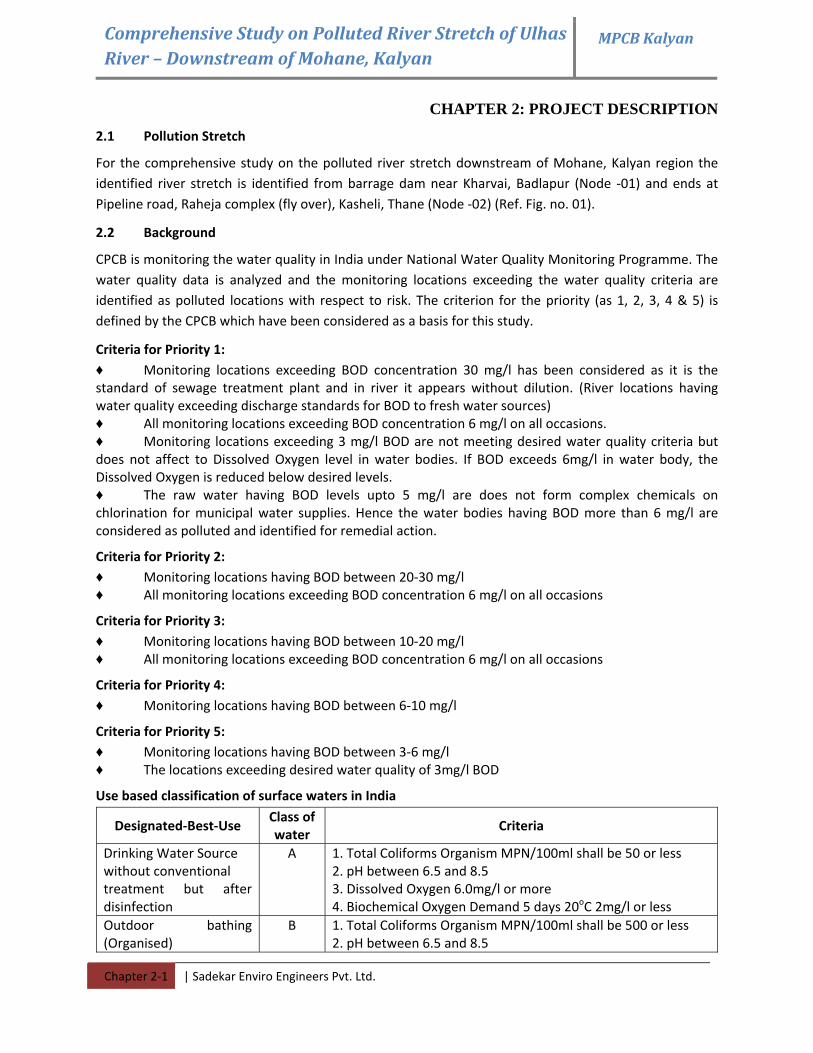
For the comprehensive study on the polluted river stretch downstream of Mohane, Kalyan region the identified river stretch is identified from barrage dam near Kharvai, Badlapur (Node ‐01) and ends at Pipeline road, Raheja complex (fly over), Kasheli, Thane (Node ‐02) (Ref. Fig. no. 01).
2.2 Background
CPCB is monitoring the water quality in India under National Water Quality Monitoring Programme. The water quality data is analyzed and the monitoring locations exceeding the water quality criteria are identified as polluted locations with respect to risk. The criterion for the priority (as 1, 2, 3, 4 & 5) is defined by the CPCB which have been considered as a basis for this study.
Criteria for Priority 1: ♦ Monitoring locations exceeding BOD concentration 30 mg/l has been considered as it is the standard of sewage treatment plant and in river it appears without dilution. (River locations having water quality exceeding discharge standards for BOD to fresh water sources) ♦ All monitoring locations exceeding BOD concentration 6 mg/l on all occasions. ♦ Monitoring locations exceeding 3 mg/l BOD are not meeting desired water quality criteria but does not affect to Dissolved Oxygen level in water bodies. If BOD exceeds 6mg/l in water body, the Dissolved Oxygen is reduced below desired levels. ♦ The raw water having BOD levels upto 5 mg/l are does not form complex chemicals on chlorination for municipal water supplies. Hence the water bodies having BOD more than 6 mg/l are considered as polluted and identified for remedial action.
Criteria for Priority 2: ♦ Monitoring locations having BOD between 20‐30 mg/l ♦ All monitoring locations exceeding BOD concentration 6 mg/l on all occasions
Criteria for Priority 3: ♦ Monitoring locations having BOD between 10‐20 mg/l ♦ All monitoring locations exceeding BOD concentration 6 mg/l on all occasions
Criteria for Priority 4: ♦ Monitoring locations having BOD between 6‐10 mg/l
Criteria for Priority 5: ♦ Monitoring locations having BOD between 3‐6 mg/l ♦ The locations exceeding desired water quality of 3mg/l BOD
Use based classification of surface waters in India
Designated‐Best‐Use Class of water
Criteria
Drinking Water Source without conventional treatment but after disinfection
A 1. Total Coliforms Organism MPN/100ml shall be 50 or less 2. pH between 6.5 and 8.5 3. Dissolved Oxygen 6.0mg/l or more 4. Biochemical Oxygen Demand 5 days 20oC 2mg/l or less
Outdoor bathing (Organised)
B 1. Total Coliforms Organism MPN/100ml shall be 500 or less 2. pH between 6.5 and 8.5
Comprehensive Study on Polluted River Stretch of Ulhas River – Downstream of Mohane, Kalyan
MPCB Kalyan
Chapter 2‐2 | Sadekar Enviro Engineers Pvt. Ltd.
3. Dissolved Oxygen 5mg/l or more 4. Biochemical Oxygen Demand 5 days 20oC 2mg/l or less
Drinking water source after conventional treatment and disinfection
C 1. Total Coliforms Organism MPN/100ml shall be 5000 or less 2. pH between 6 to 9 3. Dissolved Oxygen 4mg/l or more 4. Biochemical Oxygen Demand 5 days 20oC 2mg/l or less
Propagation of Wild life and Fisheries
D 1. pH between 6.5 to 8.5 2. Dissolved Oxygen 4mg/l or more 3. Free Ammonia (as N) 1.2 mg/l or less
Irrigation, Industrial Cooling, Controlled Waste disposal
E 1. pH between 6.0 to 8.5 2. Electrical Conductivity at 25oC micro mhos/cm Max.2250 3. Sodium absorption Ratio Max. 26 4. Boron Max. 2mg/l
River Polluted Stretch Source/Town Monitoring Location BOD (mg/l)POLLUTED RIVER STRETCHES (BOD Between 6‐10 mg/l)
1. U/S Of NRC Bund at Mohane 6.0 Ulhas Mohane
Industrial & Domestic runoff Ulhasnagar 2. Jhambul Water Works 7.5
POLLUTED RIVER STRETCHES (BOD between 3‐6 mg/l) Ulhas Along Badlapur ‐‐ 1. U/s of Badlapur 3.4
Based on the above referred data the pollution stretch of river Ulhas is falling under Priority 4 and 5 at three different locations as identified by CPCB (Ref. Polluted River Stretch in India –Criteria & Status by CPCB)
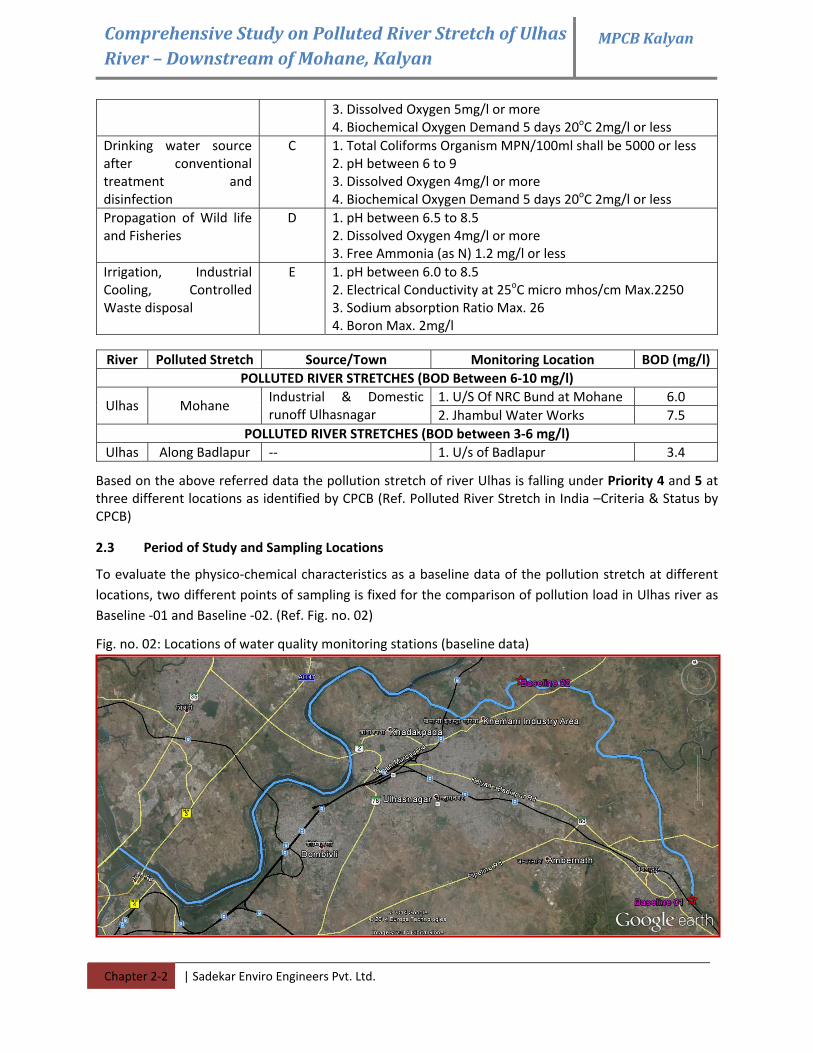
2.3 Period of Study and Sampling Locations
To evaluate the physico‐chemical characteristics as a baseline data of the pollution stretch at different locations, two different points of sampling is fixed for the comparison of pollution load in Ulhas river as Baseline ‐01 and Baseline ‐02. (Ref. Fig. no. 02)
Fig. no. 02: Locations of water quality monitoring stations (baseline data)
Comprehensive Study on Polluted River Stretch of Ulhas River – Downstream of Mohane, Kalyan
MPCB Kalyan
Chapter 2‐3 | Sadekar Enviro Engineers Pvt. Ltd.
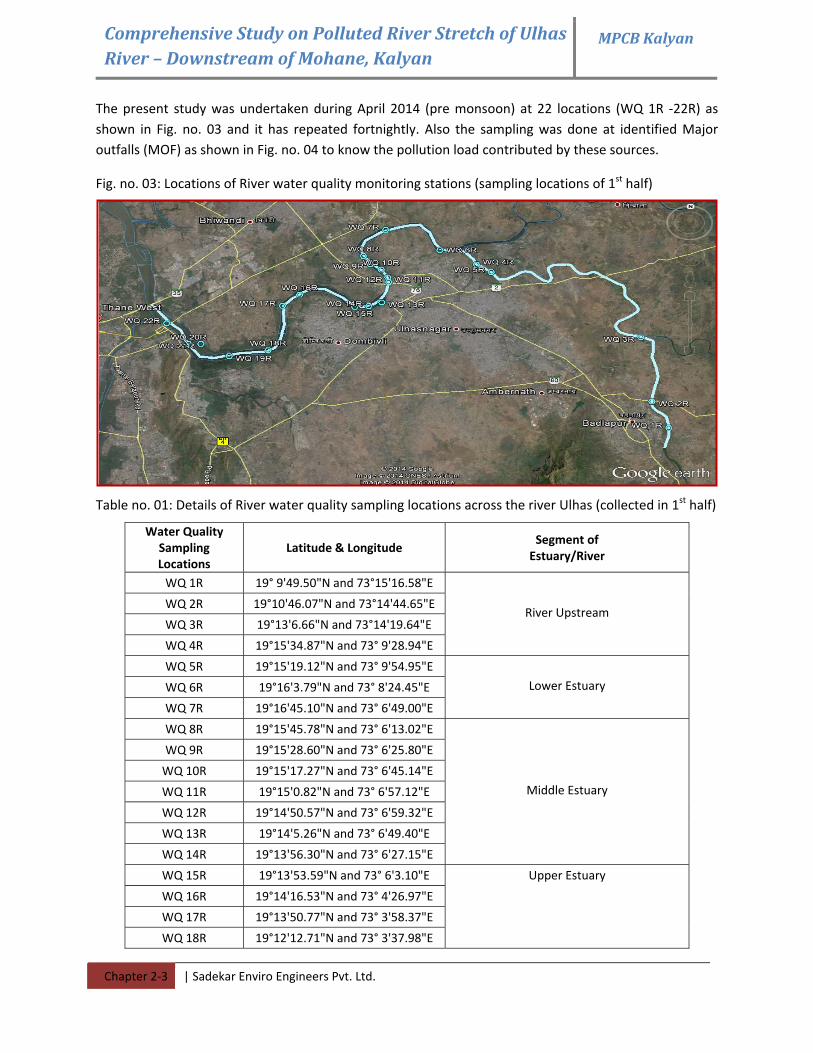
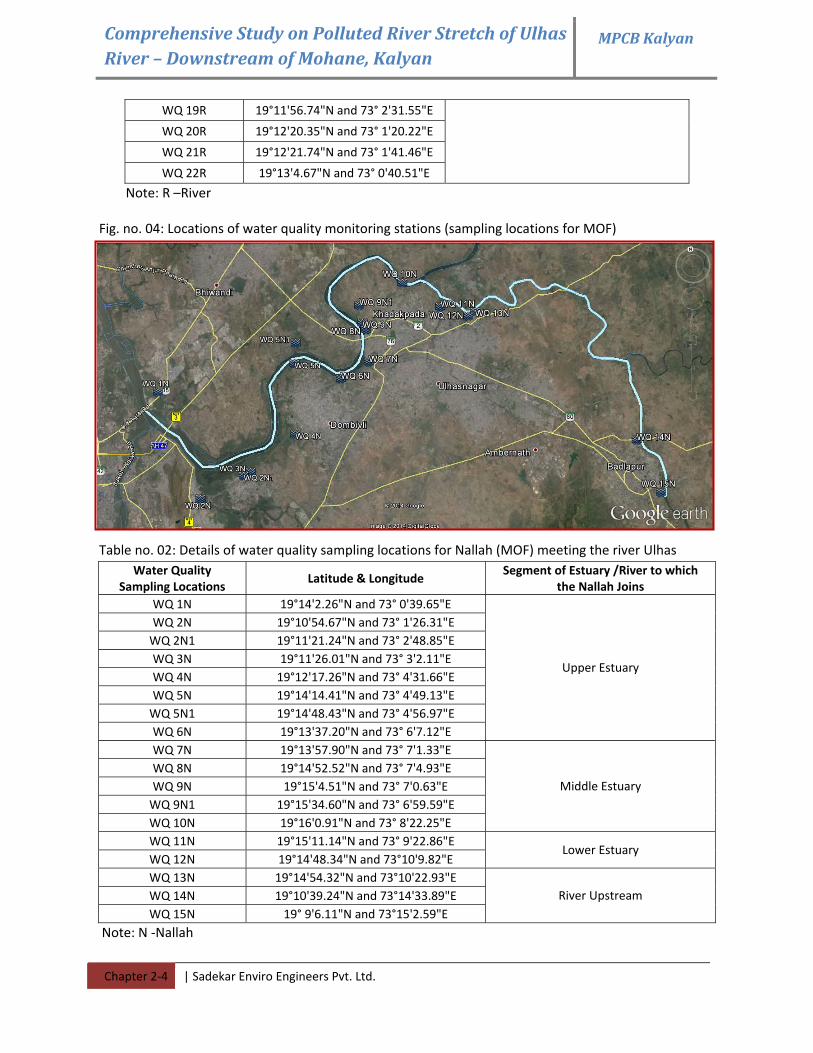
The present study was undertaken during April 2014 (pre monsoon) at 22 locations (WQ 1R ‐22R) as shown in Fig. no. 03 and it has repeated fortnightly. Also the sampling was done at identified Major outfalls (MOF) as shown in Fig. no. 04 to know the pollution load contributed by these sources.
Fig. no. 03: Locations of River water quality monitoring stations (sampling locations of 1st half)
Table no. 01: Details of River water quality sampling locations across the river Ulhas (collected in 1st half)
Water Quality Sampling Locations
Latitude & Longitude Segment of Estuary/River
WQ 1R 19° 9'49.50"N and 73°15'16.58"E
WQ 2R 19°10'46.07"N and 73°14'44.65"E
WQ 3R 19°13'6.66"N and 73°14'19.64"E
WQ 4R 19°15'34.87"N and 73° 9'28.94"E
River Upstream
WQ 5R 19°15'19.12"N and 73° 9'54.95"E
WQ 6R 19°16'3.79"N and 73° 8'24.45"E
WQ 7R 19°16'45.10"N and 73° 6'49.00"E
Lower Estuary
WQ 8R 19°15'45.78"N and 73° 6'13.02"E
WQ 9R 19°15'28.60"N and 73° 6'25.80"E
WQ 10R 19°15'17.27"N and 73° 6'45.14"E
WQ 11R 19°15'0.82"N and 73° 6'57.12"E
WQ 12R 19°14'50.57"N and 73° 6'59.32"E
WQ 13R 19°14'5.26"N and 73° 6'49.40"E
WQ 14R 19°13'56.30"N and 73° 6'27.15"E
Middle Estuary
WQ 15R 19°13'53.59"N and 73° 6'3.10"E
WQ 16R 19°14'16.53"N and 73° 4'26.97"E
WQ 17R 19°13'50.77"N and 73° 3'58.37"E
WQ 18R 19°12'12.71"N and 73° 3'37.98"E
Upper Estuary
Comprehensive Study on Polluted River Stretch of Ulhas River – Downstream of Mohane, Kalyan
MPCB Kalyan
Chapter 2‐4 | Sadekar Enviro Engineers Pvt. Ltd.
WQ 19R 19°11'56.74"N and 73° 2'31.55"E
WQ 20R 19°12'20.35"N and 73° 1'20.22"E
WQ 21R 19°12'21.74"N and 73° 1'41.46"E
WQ 22R 19°13'4.67"N and 73° 0'40.51"E
Note: R –River
Fig. no. 04: Locations of water quality monitoring stations (sampling locations for MOF)
Table no. 02: Details of water quality sampling locations for Nallah (MOF) meeting the river Ulhas Water Quality
Sampling Locations Latitude & Longitude
Segment of Estuary /River to which the Nallah Joins
WQ 1N 19°14'2.26"N and 73° 0'39.65"E WQ 2N 19°10'54.67"N and 73° 1'26.31"E WQ 2N1 19°11'21.24"N and 73° 2'48.85"E WQ 3N 19°11'26.01"N and 73° 3'2.11"E WQ 4N 19°12'17.26"N and 73° 4'31.66"E WQ 5N 19°14'14.41"N and 73° 4'49.13"E WQ 5N1 19°14'48.43"N and 73° 4'56.97"E WQ 6N 19°13'37.20"N and 73° 6'7.12"E
Upper Estuary
WQ 7N 19°13'57.90"N and 73° 7'1.33"E WQ 8N 19°14'52.52"N and 73° 7'4.93"E WQ 9N 19°15'4.51"N and 73° 7'0.63"E WQ 9N1 19°15'34.60"N and 73° 6'59.59"E WQ 10N 19°16'0.91"N and 73° 8'22.25"E
Middle Estuary
WQ 11N 19°15'11.14"N and 73° 9'22.86"E WQ 12N 19°14'48.34"N and 73°10'9.82"E
Lower Estuary
WQ 13N 19°14'54.32"N and 73°10'22.93"E WQ 14N 19°10'39.24"N and 73°14'33.89"E WQ 15N 19° 9'6.11"N and 73°15'2.59"E
River Upstream
Note: N ‐Nallah
Comprehensive Study on Polluted River Stretch of Ulhas River – Downstream of Mohane, Kalyan
MPCB Kalyan
Chapter 2‐5 | Sadekar Enviro Engineers Pvt. Ltd.
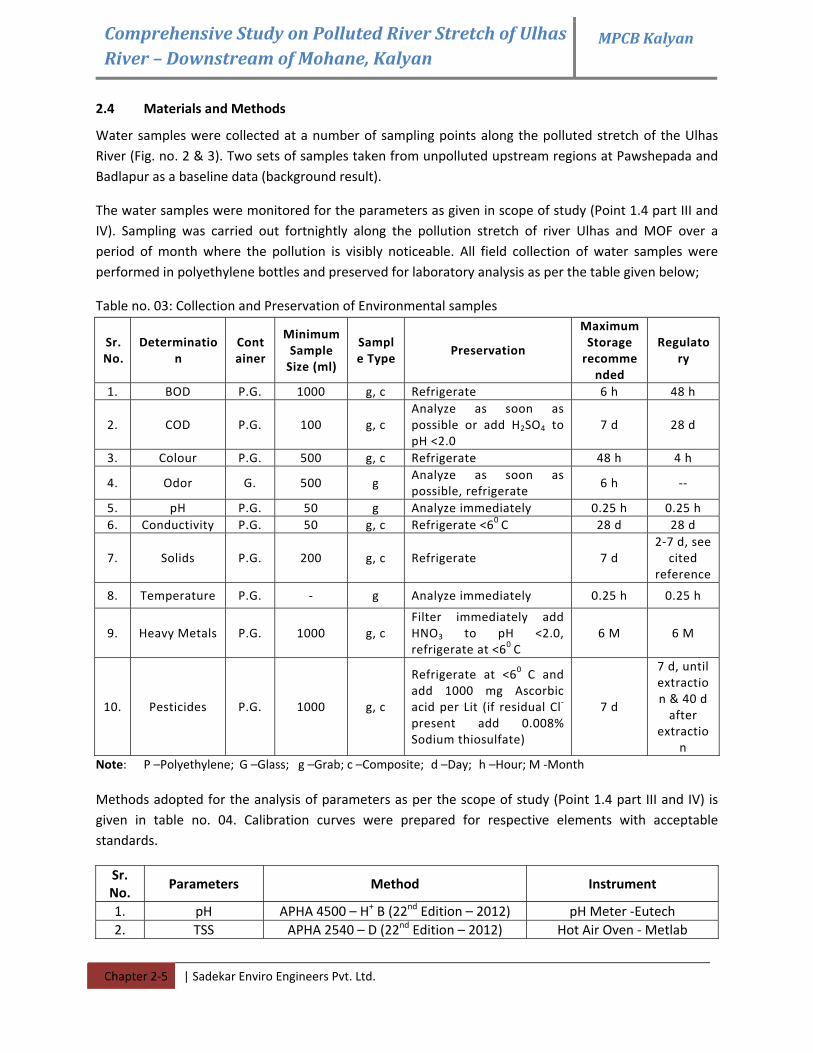
2.4 Materials and Methods
Water samples were collected at a number of sampling points along the polluted stretch of the Ulhas River (Fig. no. 2 & 3). Two sets of samples taken from unpolluted upstream regions at Pawshepada and Badlapur as a baseline data (background result).
The water samples were monitored for the parameters as given in scope of study (Point 1.4 part III and IV). Sampling was carried out fortnightly along the pollution stretch of river Ulhas and MOF over a period of month where the pollution is visibly noticeable. All field collection of water samples were performed in polyethylene bottles and preserved for laboratory analysis as per the table given below;
Table no. 03: Collection and Preservation of Environmental samples
Sr. No.
Determination
Container
Minimum Sample Size (ml)
Sample Type
Preservation
Maximum Storage recommended
Regulatory
1. BOD P.G. 1000 g, c Refrigerate 6 h 48 h
2. COD P.G. 100 g, c Analyze as soon as possible or add H2SO4 to pH <2.0
7 d 28 d
3. Colour P.G. 500 g, c Refrigerate 48 h 4 h
4. Odor G. 500 g Analyze as soon as possible, refrigerate
6 h ‐‐
5. pH P.G. 50 g Analyze immediately 0.25 h 0.25 h 6. Conductivity P.G. 50 g, c Refrigerate <60 C 28 d 28 d
7. Solids P.G. 200 g, c Refrigerate 7 d 2‐7 d, see
cited reference
8. Temperature P.G. ‐ g Analyze immediately 0.25 h 0.25 h
9. Heavy Metals P.G. 1000 g, c Filter immediately add HNO3 to pH <2.0, refrigerate at <60 C
6 M 6 M
10. Pesticides P.G. 1000 g, c
Refrigerate at <60 C and add 1000 mg Ascorbic acid per Lit (if residual Cl‐ present add 0.008% Sodium thiosulfate)
7 d
7 d, until extraction & 40 d after
extraction
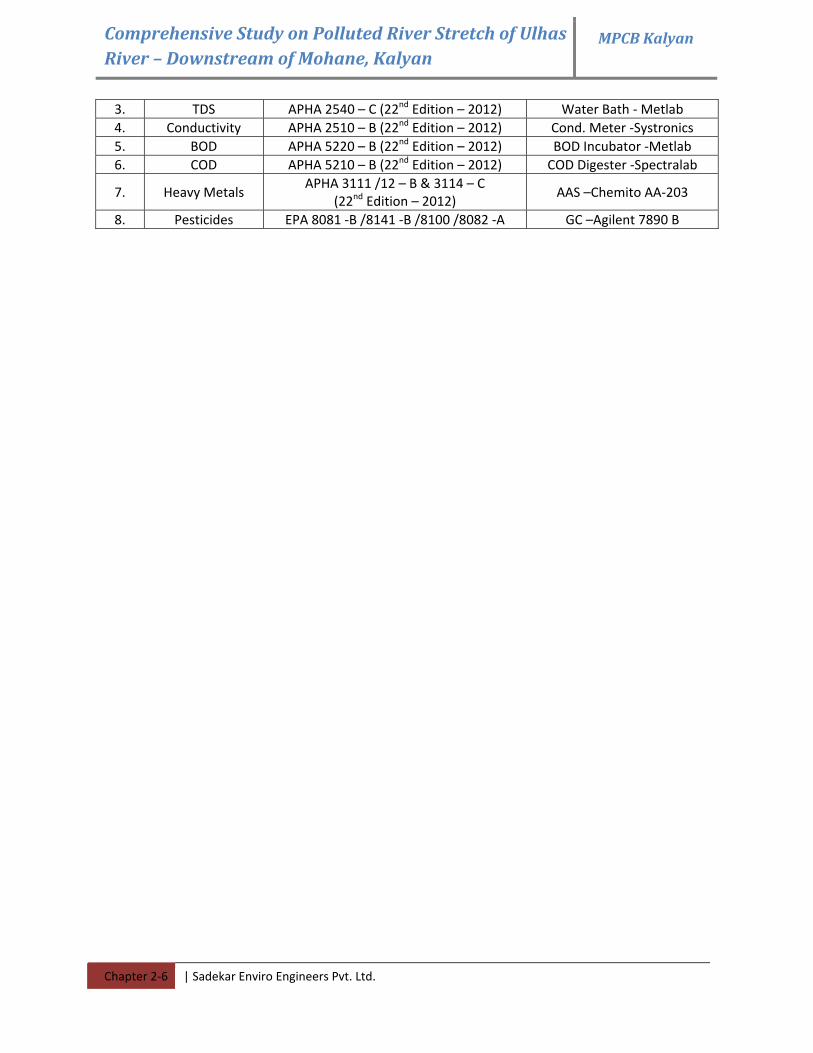
Note: P –Polyethylene; G –Glass; g –Grab; c –Composite; d –Day; h –Hour; M ‐Month Methods adopted for the analysis of parameters as per the scope of study (Point 1.4 part III and IV) is given in table no. 04. Calibration curves were prepared for respective elements with acceptable standards.
Sr. No.
Parameters Method Instrument
1. pH APHA 4500 – H+ B (22nd Edition – 2012) pH Meter ‐Eutech 2. TSS APHA 2540 – D (22nd Edition – 2012) Hot Air Oven ‐ Metlab
Comprehensive Study on Polluted River Stretch of Ulhas River – Downstream of Mohane, Kalyan
MPCB Kalyan
Chapter 2‐6 | Sadekar Enviro Engineers Pvt. Ltd.
3. TDS APHA 2540 – C (22nd Edition – 2012) Water Bath ‐ Metlab 4. Conductivity APHA 2510 – B (22nd Edition – 2012) Cond. Meter ‐Systronics 5. BOD APHA 5220 – B (22nd Edition – 2012) BOD Incubator ‐Metlab 6. COD APHA 5210 – B (22nd Edition – 2012) COD Digester ‐Spectralab
7. Heavy Metals APHA 3111 /12 – B & 3114 – C
(22nd Edition – 2012) AAS –Chemito AA‐203
8. Pesticides EPA 8081 ‐B /8141 ‐B /8100 /8082 ‐A GC –Agilent 7890 B
Comprehensive Study on Polluted River Stretch of Ulhas River – Downstream of Mohane, Kalyan
MPCB Kalyan
Chapter 3‐1 | Sadekar Enviro Engineer Pvt. Ltd.
CHAPTER 3: PREVAILING ENVIRONMENT
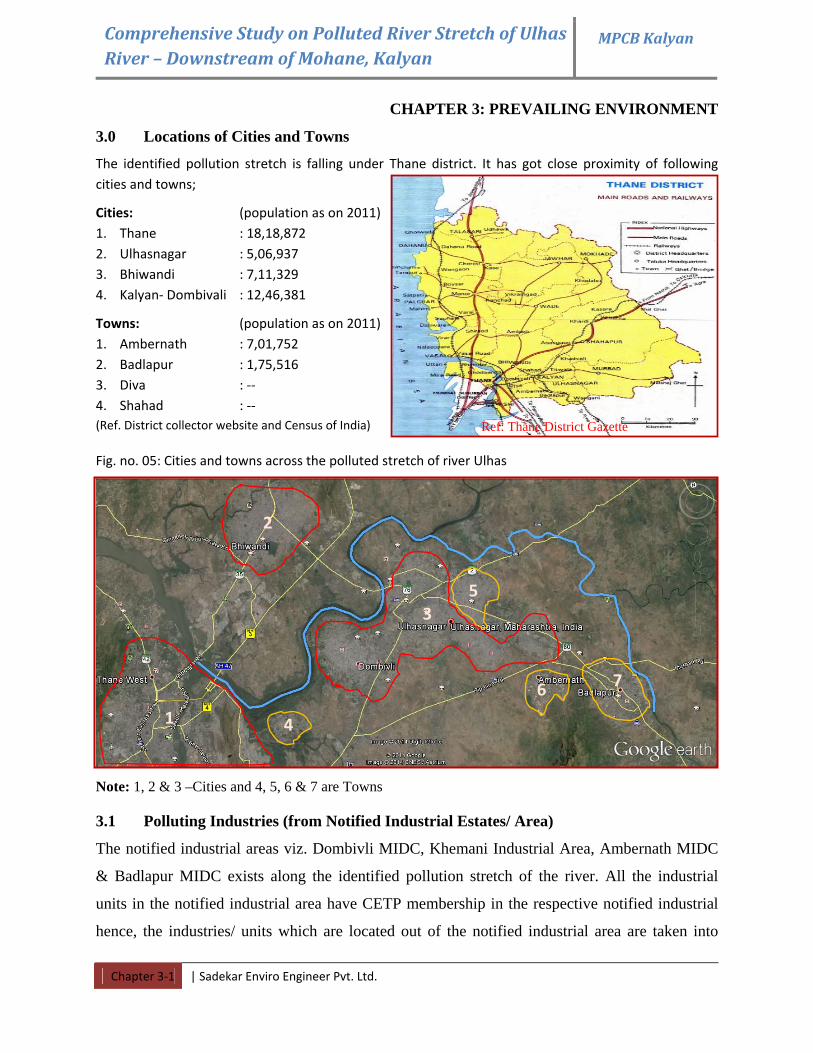
3.0 Locations of Cities and Towns
The identified pollution stretch is falling under Thane district. It has got close proximity of following cities and towns;
Cities: (population as on 2011) 1. Thane : 18,18,872 2. Ulhasnagar : 5,06,937 3. Bhiwandi : 7,11,329 4. Kalyan‐ Dombivali : 12,46,381
Towns: (population as on 2011) 1. Ambernath : 7,01,752 2. Badlapur : 1,75,516 3. Diva : ‐‐ 4. Shahad : ‐‐ (Ref. District collector website and Census of India) Fig. no. 05: Cities and towns across the polluted stretch of river Ulhas
Note: 1, 2 & 3 –Cities and 4, 5, 6 & 7 are Towns
3.1 Polluting Industries (from Notified Industrial Estates/ Area)
The notified industrial areas viz. Dombivli MIDC, Khemani Industrial Area, Ambernath MIDC
& Badlapur MIDC exists along the identified pollution stretch of the river. All the industrial
units in the notified industrial area have CETP membership in the respective notified industrial
hence, the industries/ units which are located out of the notified industrial area are taken into
1
2
3
4
5
6 7
Ref: Thane District Gazette
Comprehensive Study on Polluted River Stretch of Ulhas River – Downstream of Mohane, Kalyan
MPCB Kalyan
Chapter 3‐2 | Sadekar Enviro Engineer Pvt. Ltd.
account as potential polluting industries. The industries/units located out of the notified industrial
area are as mentioned in the below table:
Comprehensive Study on Polluted River Stretch of Ulhas River – Downstream of Mohane, Kalyan
MPCB Kalyan
Chapter 3‐3 | Sadekar Enviro Engineer Pvt. Ltd.
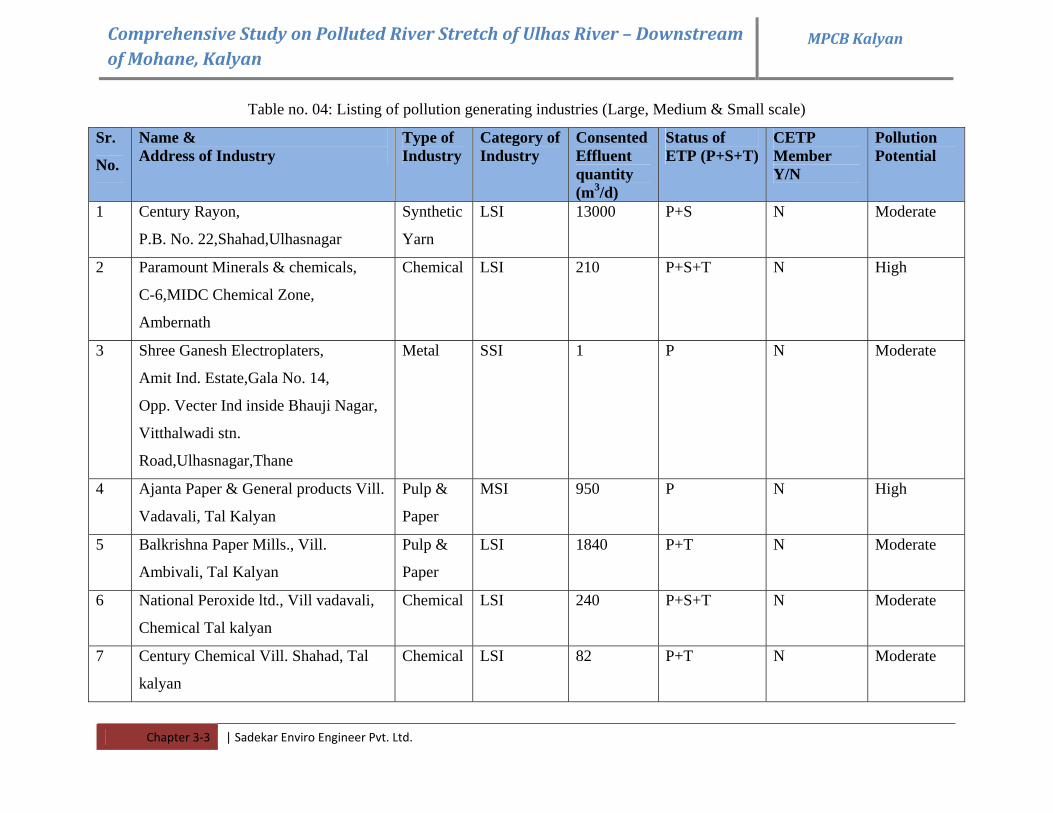
Table no. 04: Listing of pollution generating industries (Large, Medium & Small scale)
Sr.
No.
Name & Address of Industry
Type of Industry
Category of Industry
Consented Effluent quantity (m3/d)
Status of ETP (P+S+T)
CETP Member Y/N
Pollution Potential
1 Century Rayon,
P.B. No. 22,Shahad,Ulhasnagar
Synthetic
Yarn
LSI 13000 P+S N Moderate
2 Paramount Minerals & chemicals,
C-6,MIDC Chemical Zone,
Ambernath
Chemical LSI 210 P+S+T N High
3 Shree Ganesh Electroplaters,
Amit Ind. Estate,Gala No. 14,
Opp. Vecter Ind inside Bhauji Nagar,
Vitthalwadi stn.
Road,Ulhasnagar,Thane
Metal SSI 1 P N Moderate
4 Ajanta Paper & General products Vill.
Vadavali, Tal Kalyan
Pulp &
Paper
MSI 950 P N High
5 Balkrishna Paper Mills., Vill.
Ambivali, Tal Kalyan
Pulp &
Paper
LSI 1840 P+T N Moderate
6 National Peroxide ltd., Vill vadavali,
Chemical Tal kalyan
Chemical LSI 240 P+S+T N Moderate
7 Century Chemical Vill. Shahad, Tal
kalyan
Chemical LSI 82 P+T N Moderate
Comprehensive Study on Polluted River Stretch of Ulhas River – Downstream of Mohane, Kalyan
MPCB Kalyan
Chapter 3‐4 | Sadekar Enviro Engineer Pvt. Ltd.
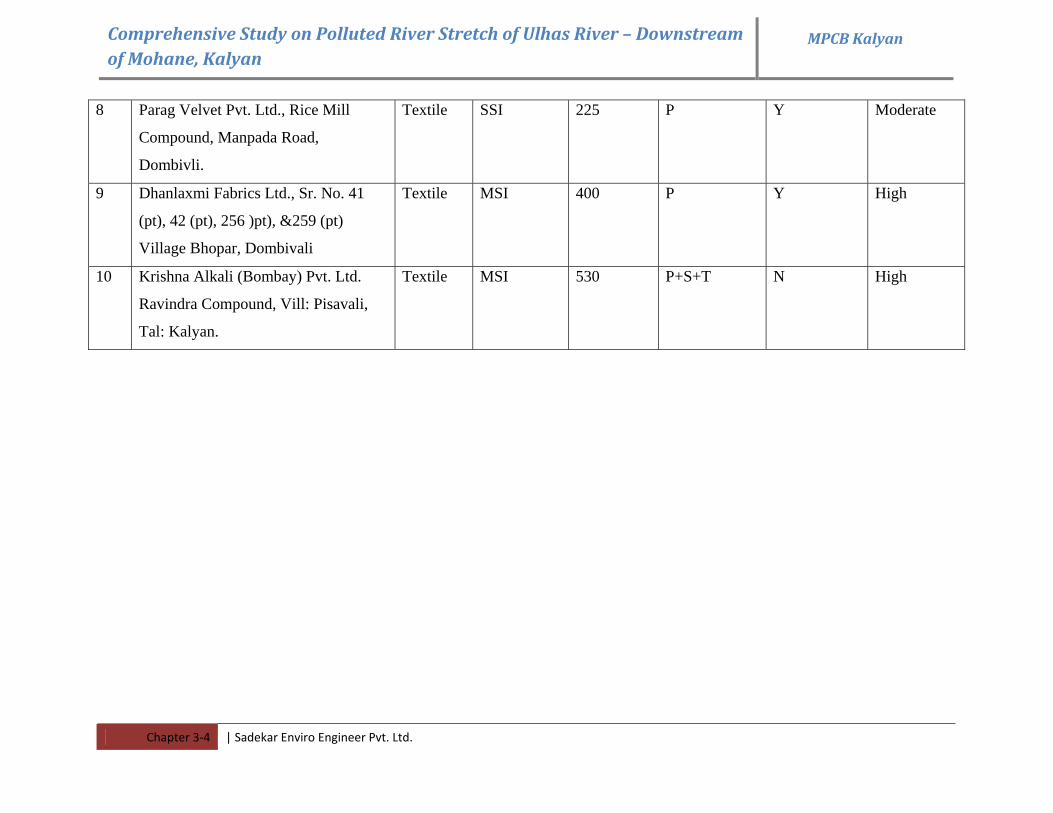
8 Parag Velvet Pvt. Ltd., Rice Mill
Compound, Manpada Road,
Dombivli.
Textile SSI 225 P Y Moderate
9 Dhanlaxmi Fabrics Ltd., Sr. No. 41
(pt), 42 (pt), 256 )pt), &259 (pt)
Village Bhopar, Dombivali
Textile MSI 400 P Y High
10 Krishna Alkali (Bombay) Pvt. Ltd.
Ravindra Compound, Vill: Pisavali,
Tal: Kalyan.
Textile MSI 530 P+S+T N High
Comprehensive Study on Polluted River Stretch of Ulhas River – Downstream of Mohane, Kalyan
MPCB Kalyan
Chapter 3‐5 | Sadekar Enviro Engineer Pvt. Ltd.
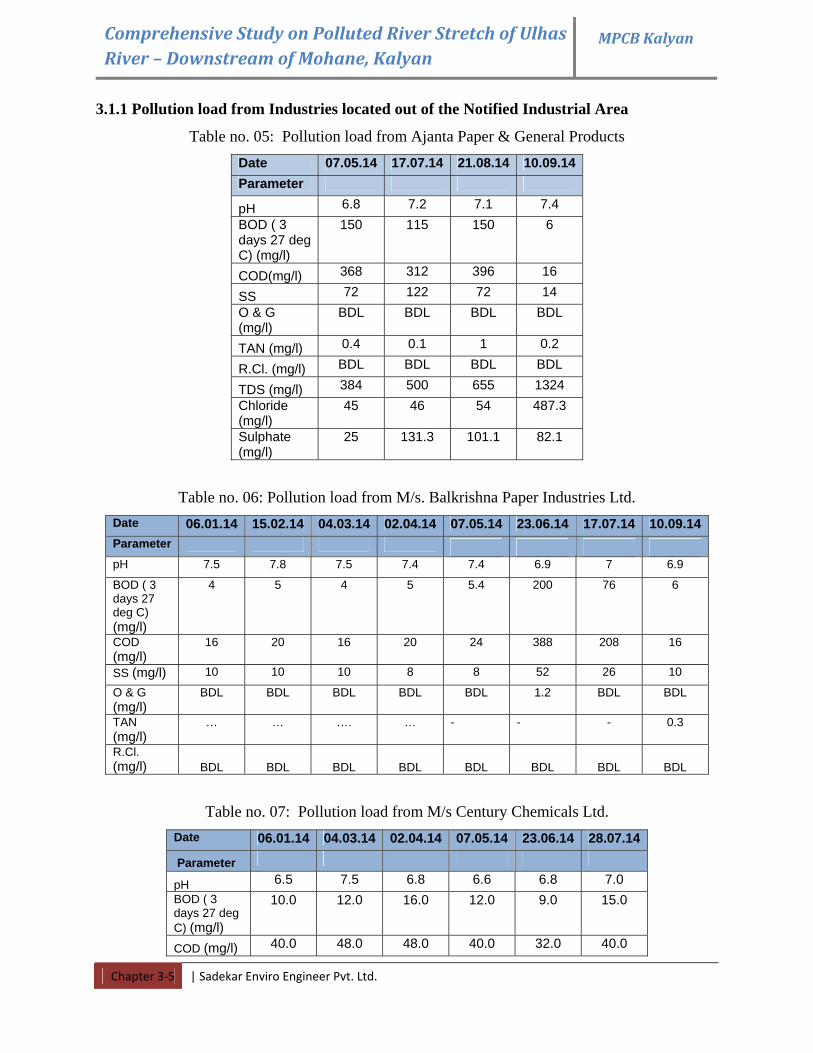
3.1.1 Pollution load from Industries located out of the Notified Industrial Area
Table no. 05: Pollution load from Ajanta Paper & General Products Date 07.05.14 17.07.14 21.08.14 10.09.14 Parameter
pH 6.8 7.2 7.1 7.4 BOD ( 3 days 27 deg C) (mg/l)
150 115 150 6
COD(mg/l) 368 312 396 16
SS 72 122 72 14 O & G (mg/l)
BDL BDL BDL BDL
TAN (mg/l) 0.4 0.1 1 0.2
R.Cl. (mg/l) BDL BDL BDL BDL
TDS (mg/l) 384 500 655 1324 Chloride (mg/l)
45 46 54 487.3
Sulphate (mg/l)
25 131.3 101.1 82.1
Table no. 06: Pollution load from M/s. Balkrishna Paper Industries Ltd. Date 06.01.14 15.02.14 04.03.14 02.04.14 07.05.14 23.06.14 17.07.14 10.09.14Parameter pH 7.5 7.8 7.5 7.4 7.4 6.9 7 6.9
BOD ( 3 days 27 deg C) (mg/l)
4 5 4 5 5.4 200 76 6
COD (mg/l)
16 20 16 20 24 388 208 16
SS (mg/l) 10 10 10 8 8 52 26 10
O & G (mg/l)
BDL BDL BDL BDL BDL 1.2 BDL BDL
TAN (mg/l)
… … …. … - - - 0.3
R.Cl. (mg/l) BDL BDL BDL BDL BDL BDL BDL BDL
Table no. 07: Pollution load from M/s Century Chemicals Ltd. Date 06.01.14 04.03.14 02.04.14 07.05.14 23.06.14 28.07.14
Parameter
pH 6.5 7.5 6.8 6.6 6.8 7.0 BOD ( 3 days 27 deg C) (mg/l)
10.0 12.0 16.0 12.0 9.0 15.0
COD (mg/l) 40.0 48.0 48.0 40.0 32.0 40.0
Comprehensive Study on Polluted River Stretch of Ulhas River – Downstream of Mohane, Kalyan
MPCB Kalyan
Chapter 3‐6 | Sadekar Enviro Engineer Pvt. Ltd.
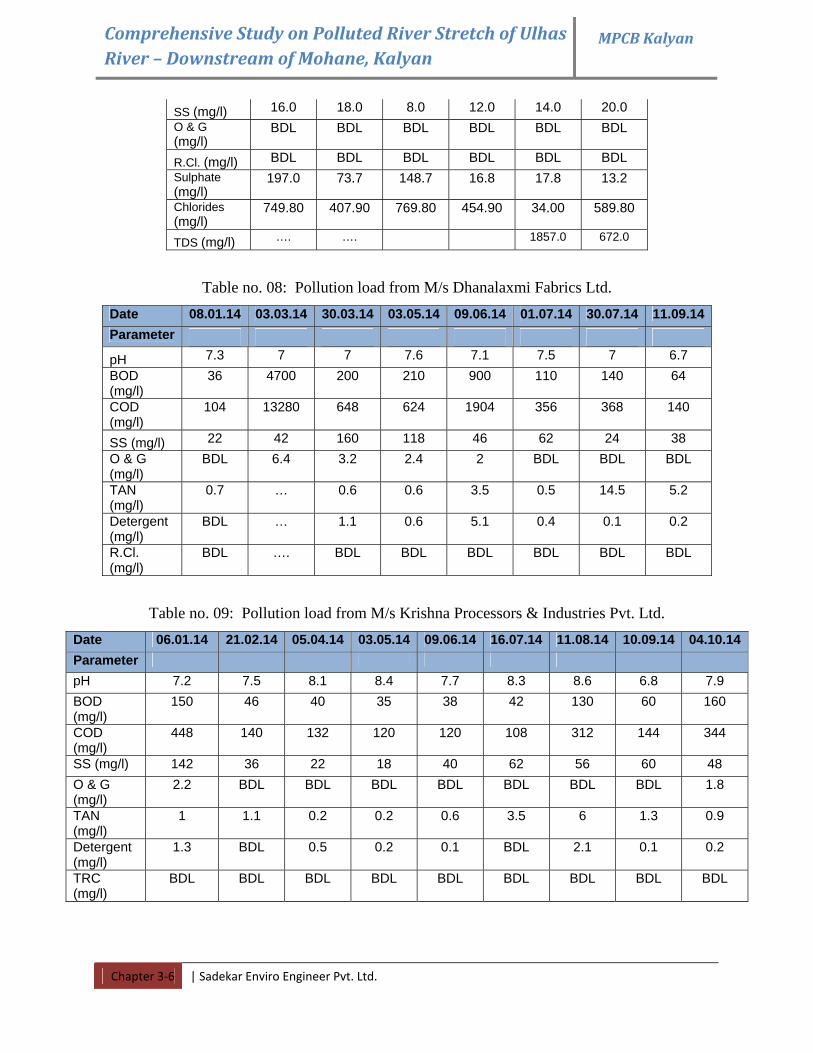
SS (mg/l) 16.0 18.0 8.0 12.0 14.0 20.0 O & G (mg/l)
BDL BDL BDL BDL BDL BDL
R.Cl. (mg/l) BDL BDL BDL BDL BDL BDL Sulphate (mg/l)
197.0 73.7 148.7 16.8 17.8 13.2
Chlorides (mg/l)
749.80 407.90 769.80 454.90 34.00 589.80
TDS (mg/l) …. …. 1857.0 672.0
Table no. 08: Pollution load from M/s Dhanalaxmi Fabrics Ltd. Date 08.01.14 03.03.14 30.03.14 03.05.14 09.06.14 01.07.14 30.07.14 11.09.14Parameter
pH 7.3 7 7 7.6 7.1 7.5 7 6.7 BOD (mg/l)
36 4700 200 210 900 110 140 64
COD (mg/l)
104 13280 648 624 1904 356 368 140
SS (mg/l) 22 42 160 118 46 62 24 38 O & G (mg/l)
BDL 6.4 3.2 2.4 2 BDL BDL BDL
TAN (mg/l)
0.7 … 0.6 0.6 3.5 0.5 14.5 5.2
Detergent (mg/l)
BDL … 1.1 0.6 5.1 0.4 0.1 0.2
R.Cl. (mg/l)
BDL …. BDL BDL BDL BDL BDL BDL
Table no. 09: Pollution load from M/s Krishna Processors & Industries Pvt. Ltd. Date 06.01.14 21.02.14 05.04.14 03.05.14 09.06.14 16.07.14 11.08.14 10.09.14 04.10.14Parameter pH 7.2 7.5 8.1 8.4 7.7 8.3 8.6 6.8 7.9 BOD (mg/l)
150 46 40 35 38 42 130 60 160
COD (mg/l)
448 140 132 120 120 108 312 144 344
SS (mg/l) 142 36 22 18 40 62 56 60 48 O & G (mg/l)
2.2 BDL BDL BDL BDL BDL BDL BDL 1.8
TAN (mg/l)
1 1.1 0.2 0.2 0.6 3.5 6 1.3 0.9
Detergent (mg/l)
1.3 BDL 0.5 0.2 0.1 BDL 2.1 0.1 0.2
TRC (mg/l)
BDL BDL BDL BDL BDL BDL BDL BDL BDL
Comprehensive Study on Polluted River Stretch of Ulhas River – Downstream of Mohane, Kalyan
MPCB Kalyan
Chapter 3‐7 | Sadekar Enviro Engineer Pvt. Ltd.
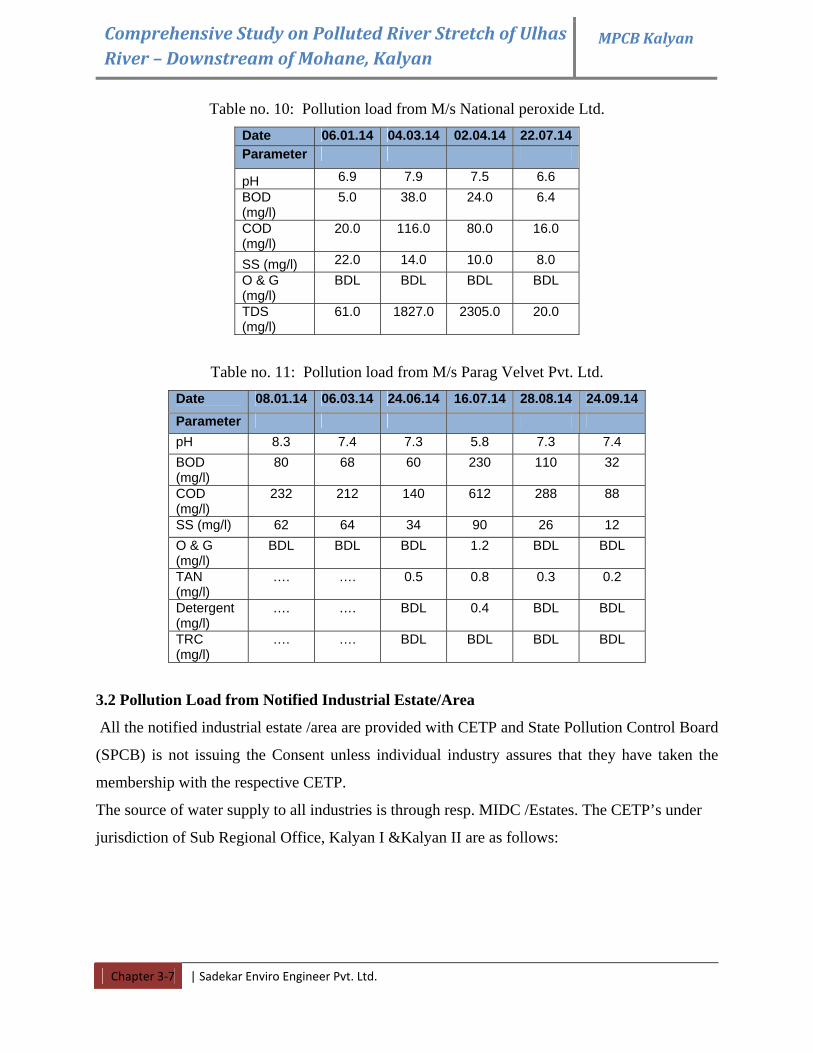
Table no. 10: Pollution load from M/s National peroxide Ltd. Date 06.01.14 04.03.14 02.04.14 22.07.14 Parameter
pH 6.9 7.9 7.5 6.6 BOD (mg/l)
5.0 38.0 24.0 6.4
COD (mg/l)
20.0 116.0 80.0 16.0
SS (mg/l) 22.0 14.0 10.0 8.0 O & G (mg/l)
BDL BDL BDL BDL
TDS (mg/l)
61.0 1827.0 2305.0 20.0
Table no. 11: Pollution load from M/s Parag Velvet Pvt. Ltd. Date 08.01.14 06.03.14 24.06.14 16.07.14 28.08.14 24.09.14 Parameter pH 8.3 7.4 7.3 5.8 7.3 7.4 BOD (mg/l)
80 68 60 230 110 32
COD (mg/l)
232 212 140 612 288 88
SS (mg/l) 62 64 34 90 26 12 O & G (mg/l)
BDL BDL BDL 1.2 BDL BDL
TAN (mg/l)
…. …. 0.5 0.8 0.3 0.2
Detergent (mg/l)
…. …. BDL 0.4 BDL BDL
TRC (mg/l)
…. …. BDL BDL BDL BDL
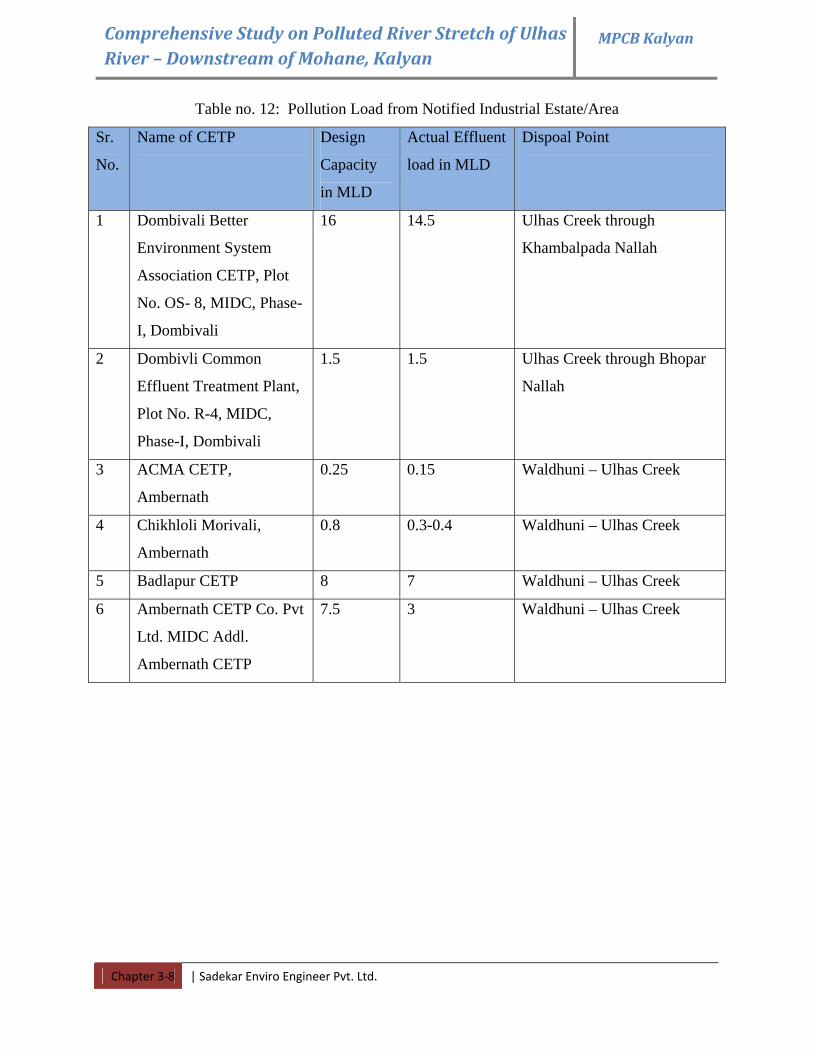
3.2 Pollution Load from Notified Industrial Estate/Area
All the notified industrial estate /area are provided with CETP and State Pollution Control Board
(SPCB) is not issuing the Consent unless individual industry assures that they have taken the
membership with the respective CETP.
The source of water supply to all industries is through resp. MIDC /Estates. The CETP’s under
jurisdiction of Sub Regional Office, Kalyan I &Kalyan II are as follows:
Comprehensive Study on Polluted River Stretch of Ulhas River – Downstream of Mohane, Kalyan
MPCB Kalyan
Chapter 3‐8 | Sadekar Enviro Engineer Pvt. Ltd.
Table no. 12: Pollution Load from Notified Industrial Estate/Area
Sr.
No.
Name of CETP Design
Capacity
in MLD
Actual Effluent
load in MLD
Dispoal Point
1 Dombivali Better
Environment System
Association CETP, Plot
No. OS- 8, MIDC, Phase-
I, Dombivali
16 14.5 Ulhas Creek through
Khambalpada Nallah
2 Dombivli Common
Effluent Treatment Plant,
Plot No. R-4, MIDC,
Phase-I, Dombivali
1.5 1.5 Ulhas Creek through Bhopar
Nallah
3 ACMA CETP,
Ambernath
0.25 0.15 Waldhuni – Ulhas Creek
4 Chikhloli Morivali,
Ambernath
0.8 0.3-0.4 Waldhuni – Ulhas Creek
5 Badlapur CETP 8 7 Waldhuni – Ulhas Creek
6 Ambernath CETP Co. Pvt
Ltd. MIDC Addl.
Ambernath CETP
7.5 3 Waldhuni – Ulhas Creek
Comprehensive Study on Polluted River Stretch of Ulhas River – Downstream of Mohane, Kalyan
MPCB Kalyan
Chapter 3‐9 | Sadekar Enviro Engineer Pvt. Ltd.
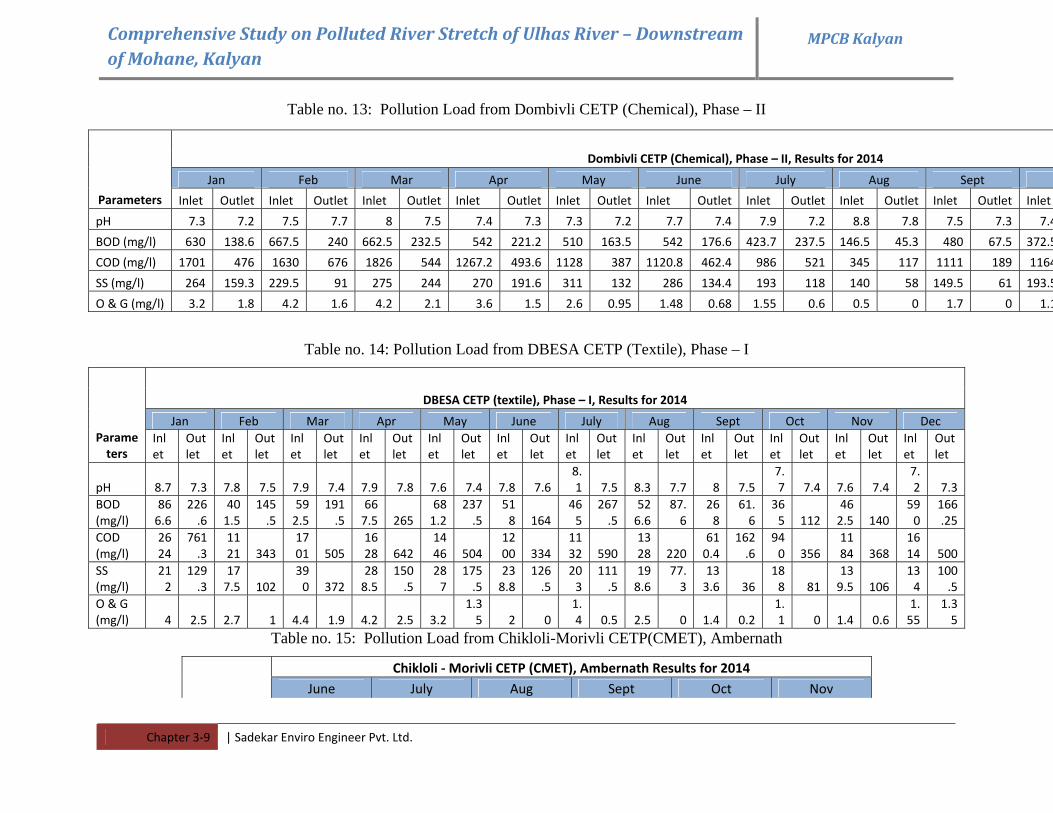
Table no. 13: Pollution Load from Dombivli CETP (Chemical), Phase – II
Table no. 14: Pollution Load from DBESA CETP (Textile), Phase – I
DBESA CETP (textile), Phase – I, Results for 2014
Jan Feb Mar Apr May June July Aug Sept Oct Nov Dec Parameters
Inlet
Outlet
Inlet
Outlet
Inlet
Outlet
Inlet
Outlet
Inlet
Outlet
Inlet
Outlet
Inlet
Outlet
Inlet
Outlet
Inlet
Outlet
Inlet
Outlet
Inlet
Outlet
Inlet
Outlet
pH 8.7 7.3 7.8 7.5 7.9 7.4 7.9 7.8 7.6 7.4 7.8 7.6 8.1 7.5 8.3 7.7 8 7.5
7.7 7.4 7.6 7.4
7.2 7.3
BOD (mg/l)
866.6
226.6
401.5
145.5
592.5
191.5
667.5 265
681.2
237.5
518 164
465
267.5
526.6
87.6
268
61.6
365 112
462.5 140
590
166.25
COD (mg/l)
2624
761.3
1121 343
1701 505
1628 642
1446 504
1200 334
1132 590
1328 220
610.4
162.6
940 356
1184 368
1614 500
SS (mg/l)
212
129.3
177.5 102
390 372
288.5
150.5
287
175.5
238.8
126.5
203
111.5
198.6
77.3
133.6 36
188 81
139.5 106
134
100.5
O & G (mg/l) 4 2.5 2.7 1 4.4 1.9 4.2 2.5 3.2
1.35 2 0
1.4 0.5 2.5 0 1.4 0.2
1.1 0 1.4 0.6
1.55
1.35
Table no. 15: Pollution Load from Chikloli-Morivli CETP(CMET), Ambernath
Chikloli ‐ Morivli CETP (CMET), Ambernath Results for 2014 June July Aug Sept Oct Nov
Dombivli CETP (Chemical), Phase – II, Results for 2014
Jan Feb Mar Apr May June July Aug Sept
Parameters Inlet Outlet Inlet Outlet Inlet Outlet Inlet Outlet Inlet Outlet Inlet Outlet Inlet Outlet Inlet Outlet Inlet Outlet Inlet
pH 7.3 7.2 7.5 7.7 8 7.5 7.4 7.3 7.3 7.2 7.7 7.4 7.9 7.2 8.8 7.8 7.5 7.3 7.4
BOD (mg/l) 630 138.6 667.5 240 662.5 232.5 542 221.2 510 163.5 542 176.6 423.7 237.5 146.5 45.3 480 67.5 372.5
COD (mg/l) 1701 476 1630 676 1826 544 1267.2 493.6 1128 387 1120.8 462.4 986 521 345 117 1111 189 1164
SS (mg/l) 264 159.3 229.5 91 275 244 270 191.6 311 132 286 134.4 193 118 140 58 149.5 61 193.5
O & G (mg/l) 3.2 1.8 4.2 1.6 4.2 2.1 3.6 1.5 2.6 0.95 1.48 0.68 1.55 0.6 0.5 0 1.7 0 1.1
Comprehensive Study on Polluted River Stretch of Ulhas River – Downstream of Mohane, Kalyan
MPCB Kalyan
Chapter 3‐10 | Sadekar Enviro Engineer Pvt. Ltd.
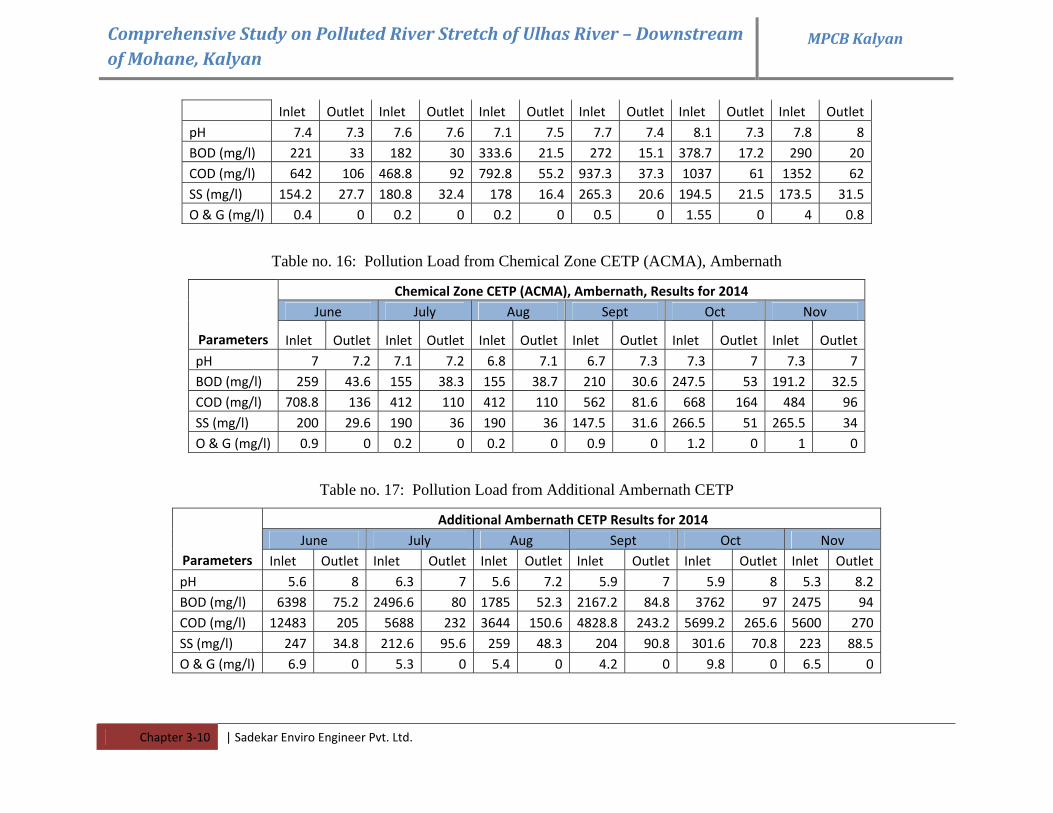
Inlet Outlet Inlet Outlet Inlet Outlet Inlet Outlet Inlet Outlet Inlet OutletpH 7.4 7.3 7.6 7.6 7.1 7.5 7.7 7.4 8.1 7.3 7.8 8BOD (mg/l) 221 33 182 30 333.6 21.5 272 15.1 378.7 17.2 290 20COD (mg/l) 642 106 468.8 92 792.8 55.2 937.3 37.3 1037 61 1352 62SS (mg/l) 154.2 27.7 180.8 32.4 178 16.4 265.3 20.6 194.5 21.5 173.5 31.5O & G (mg/l) 0.4 0 0.2 0 0.2 0 0.5 0 1.55 0 4 0.8
Table no. 16: Pollution Load from Chemical Zone CETP (ACMA), Ambernath
Chemical Zone CETP (ACMA), Ambernath, Results for 2014 June July Aug Sept Oct Nov
Parameters Inlet Outlet Inlet Outlet Inlet Outlet Inlet Outlet Inlet Outlet Inlet OutletpH 7 7.2 7.1 7.2 6.8 7.1 6.7 7.3 7.3 7 7.3 7BOD (mg/l) 259 43.6 155 38.3 155 38.7 210 30.6 247.5 53 191.2 32.5COD (mg/l) 708.8 136 412 110 412 110 562 81.6 668 164 484 96SS (mg/l) 200 29.6 190 36 190 36 147.5 31.6 266.5 51 265.5 34O & G (mg/l) 0.9 0 0.2 0 0.2 0 0.9 0 1.2 0 1 0
Table no. 17: Pollution Load from Additional Ambernath CETP
Additional Ambernath CETP Results for 2014 June July Aug Sept Oct Nov
Parameters Inlet Outlet Inlet Outlet Inlet Outlet Inlet Outlet Inlet Outlet Inlet OutletpH 5.6 8 6.3 7 5.6 7.2 5.9 7 5.9 8 5.3 8.2BOD (mg/l) 6398 75.2 2496.6 80 1785 52.3 2167.2 84.8 3762 97 2475 94COD (mg/l) 12483 205 5688 232 3644 150.6 4828.8 243.2 5699.2 265.6 5600 270SS (mg/l) 247 34.8 212.6 95.6 259 48.3 204 90.8 301.6 70.8 223 88.5O & G (mg/l) 6.9 0 5.3 0 5.4 0 4.2 0 9.8 0 6.5 0
Comprehensive Study on Polluted River Stretch of Ulhas River – Downstream of Mohane, Kalyan
MPCB Kalyan
Chapter 3‐11 | Sadekar Enviro Engineer Pvt. Ltd.
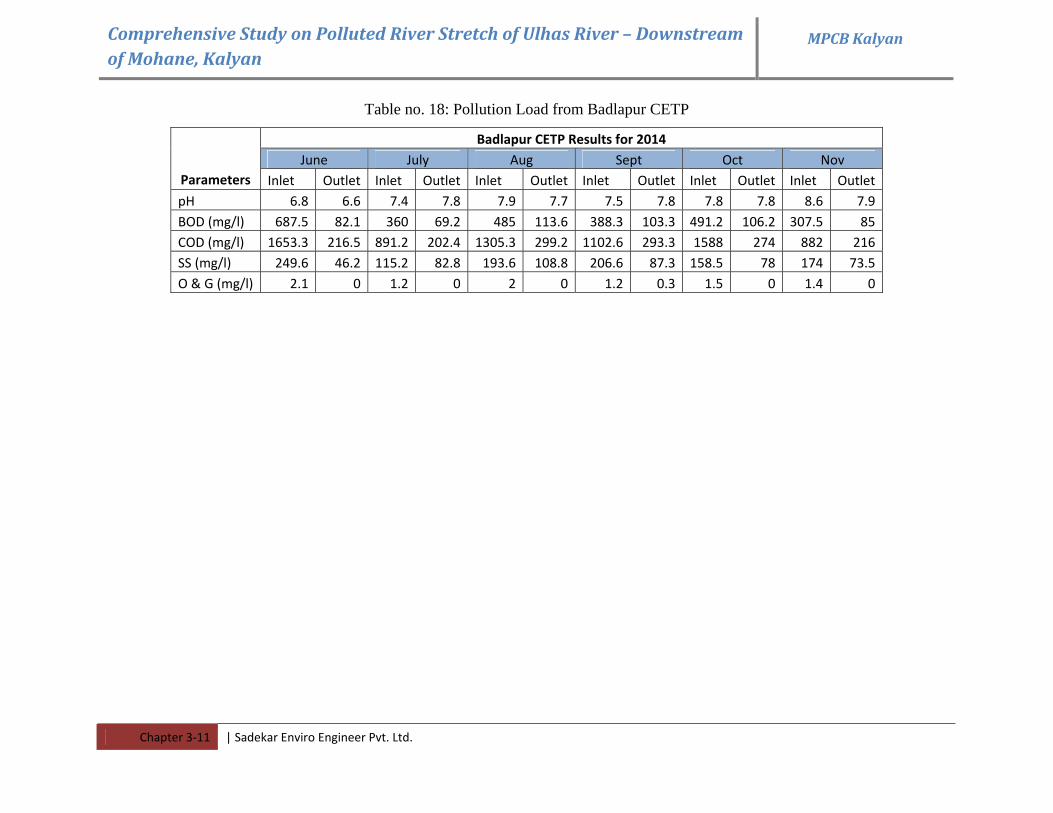
Table no. 18: Pollution Load from Badlapur CETP
Badlapur CETP Results for 2014 June July Aug Sept Oct Nov
Parameters Inlet Outlet Inlet Outlet Inlet Outlet Inlet Outlet Inlet Outlet Inlet OutletpH 6.8 6.6 7.4 7.8 7.9 7.7 7.5 7.8 7.8 7.8 8.6 7.9BOD (mg/l) 687.5 82.1 360 69.2 485 113.6 388.3 103.3 491.2 106.2 307.5 85COD (mg/l) 1653.3 216.5 891.2 202.4 1305.3 299.2 1102.6 293.3 1588 274 882 216SS (mg/l) 249.6 46.2 115.2 82.8 193.6 108.8 206.6 87.3 158.5 78 174 73.5O & G (mg/l) 2.1 0 1.2 0 2 0 1.2 0.3 1.5 0 1.4 0
Comprehensive Study on Polluted River Stretch of Ulhas River – Downstream of Mohane, Kalyan
MPCB Kalyan
Chapter 3‐12 | Sadekar Enviro Engineer Pvt. Ltd.
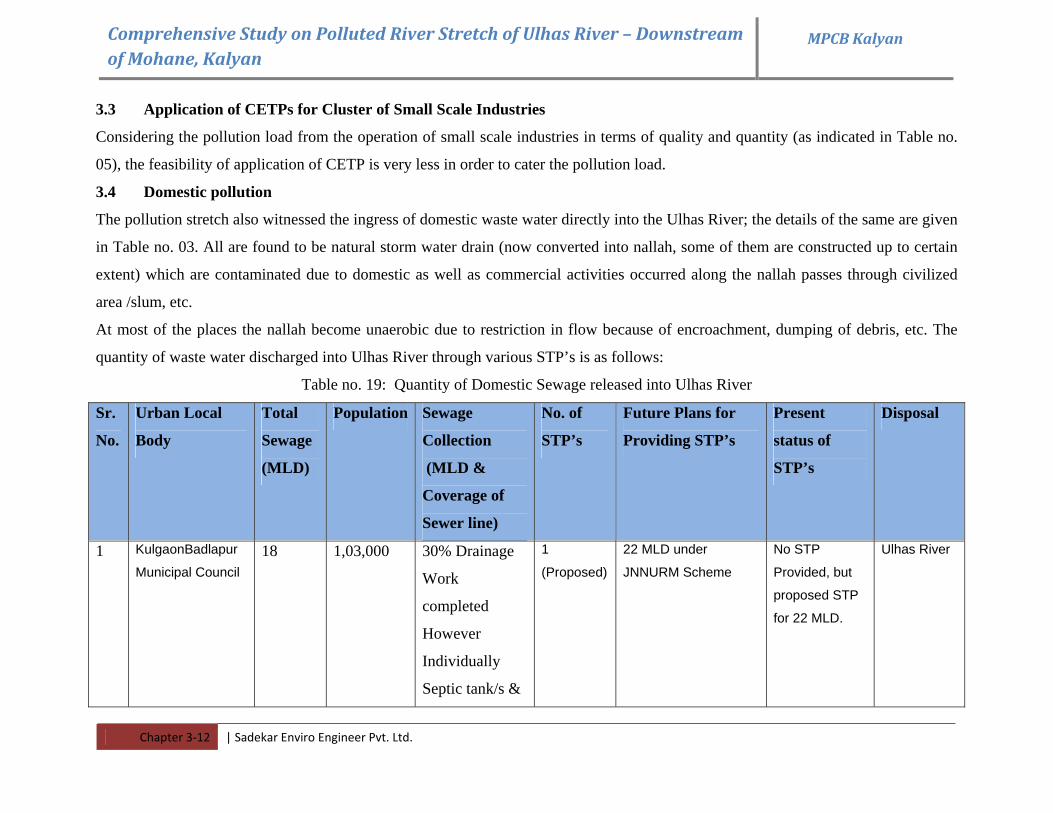
3.3 Application of CETPs for Cluster of Small Scale Industries
Considering the pollution load from the operation of small scale industries in terms of quality and quantity (as indicated in Table no.
05), the feasibility of application of CETP is very less in order to cater the pollution load.
3.4 Domestic pollution
The pollution stretch also witnessed the ingress of domestic waste water directly into the Ulhas River; the details of the same are given
in Table no. 03. All are found to be natural storm water drain (now converted into nallah, some of them are constructed up to certain
extent) which are contaminated due to domestic as well as commercial activities occurred along the nallah passes through civilized
area /slum, etc.
At most of the places the nallah become unaerobic due to restriction in flow because of encroachment, dumping of debris, etc. The
quantity of waste water discharged into Ulhas River through various STP’s is as follows:
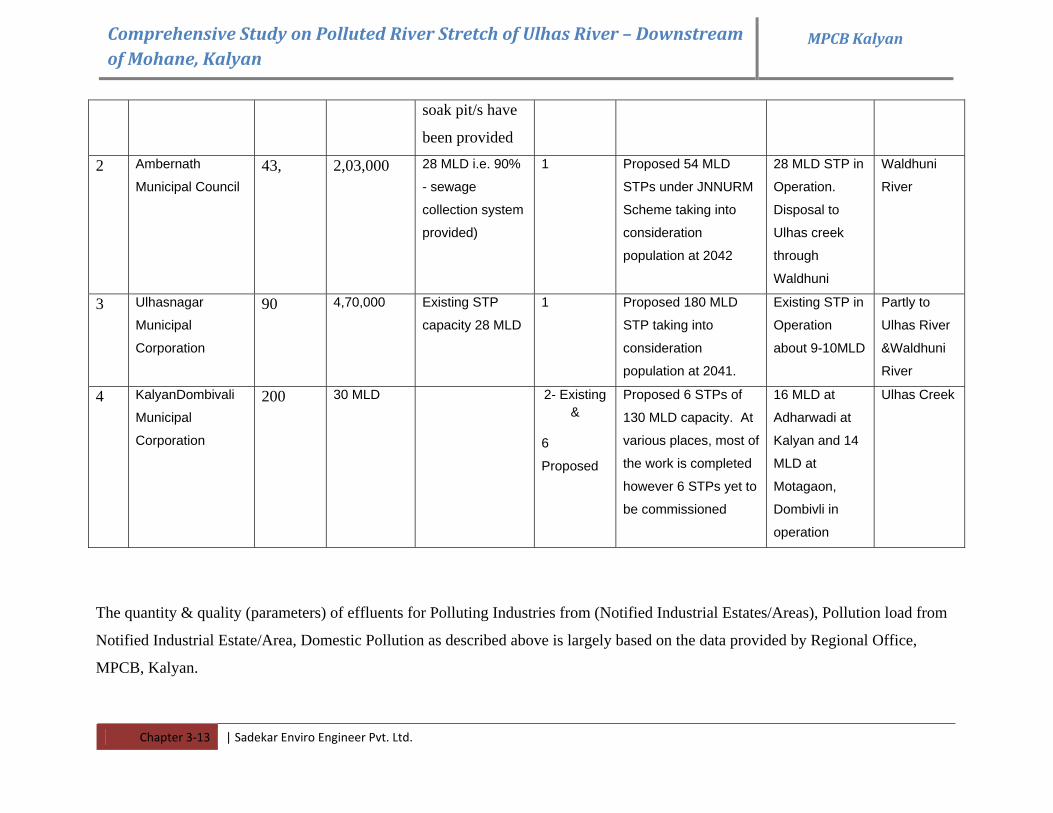
Table no. 19: Quantity of Domestic Sewage released into Ulhas River
Sr.
No.
Urban Local
Body
Total
Sewage
(MLD)
Population Sewage
Collection
(MLD &
Coverage of
Sewer line)
No. of
STP’s
Future Plans for
Providing STP’s
Present
status of
STP’s
Disposal
1 KulgaonBadlapur
Municipal Council 18 1,03,000 30% Drainage
Work
completed
However
Individually
Septic tank/s &
1
(Proposed) 22 MLD under
JNNURM Scheme No STP
Provided, but
proposed STP
for 22 MLD.
Ulhas River
Comprehensive Study on Polluted River Stretch of Ulhas River – Downstream of Mohane, Kalyan
MPCB Kalyan
Chapter 3‐13 | Sadekar Enviro Engineer Pvt. Ltd.
soak pit/s have
been provided
2 Ambernath
Municipal Council 43, 2,03,000 28 MLD i.e. 90%
- sewage
collection system
provided)
1 Proposed 54 MLD
STPs under JNNURM
Scheme taking into
consideration
population at 2042
28 MLD STP in
Operation.
Disposal to
Ulhas creek
through
Waldhuni
Waldhuni
River
3 Ulhasnagar
Municipal
Corporation
90 4,70,000 Existing STP
capacity 28 MLD
1 Proposed 180 MLD
STP taking into
consideration
population at 2041.
Existing STP in
Operation
about 9-10MLD
Partly to
Ulhas River
&Waldhuni
River
4 KalyanDombivali
Municipal
Corporation
200 30 MLD 2- Existing &
6
Proposed
Proposed 6 STPs of
130 MLD capacity. At
various places, most of
the work is completed
however 6 STPs yet to
be commissioned
16 MLD at
Adharwadi at
Kalyan and 14
MLD at
Motagaon,
Dombivli in
operation
Ulhas Creek
The quantity & quality (parameters) of effluents for Polluting Industries from (Notified Industrial Estates/Areas), Pollution load from
Notified Industrial Estate/Area, Domestic Pollution as described above is largely based on the data provided by Regional Office,
MPCB, Kalyan.
Comprehensive Study on Polluted River Stretch of Ulhas River – Downstream of Mohane, Kalyan
MPCB Kalyan
Chapter 3‐14 | Sadekar Enviro Engineer Pvt. Ltd.
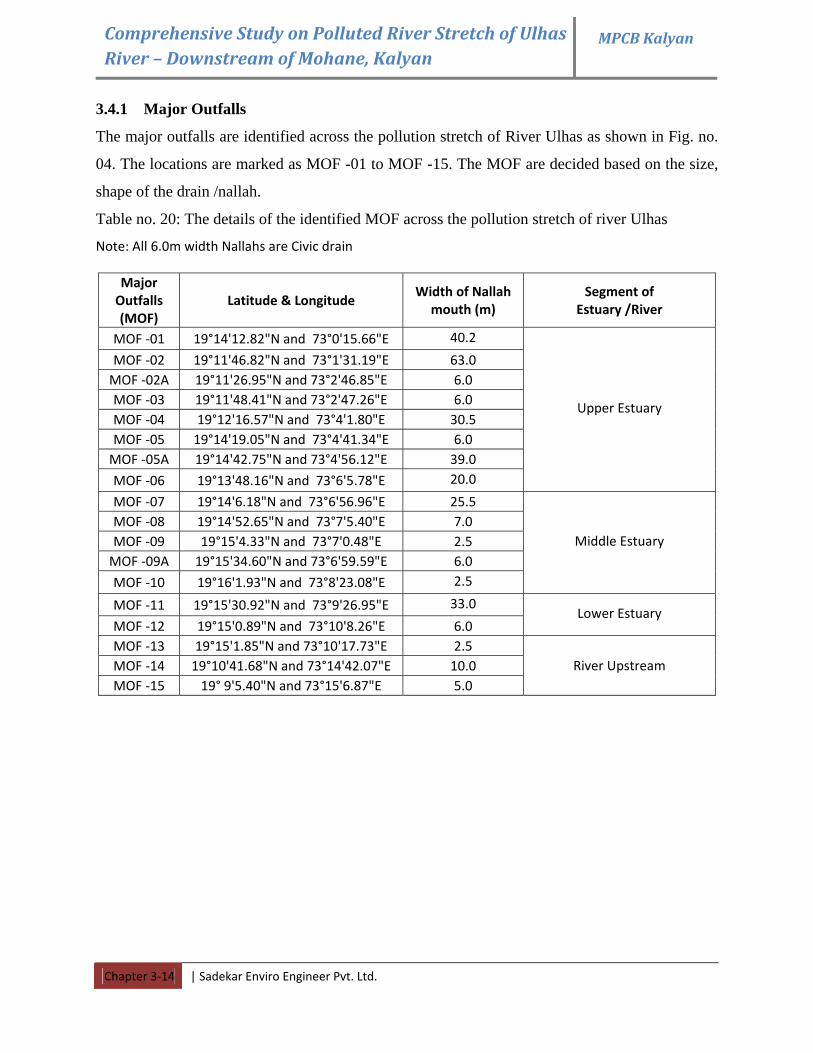
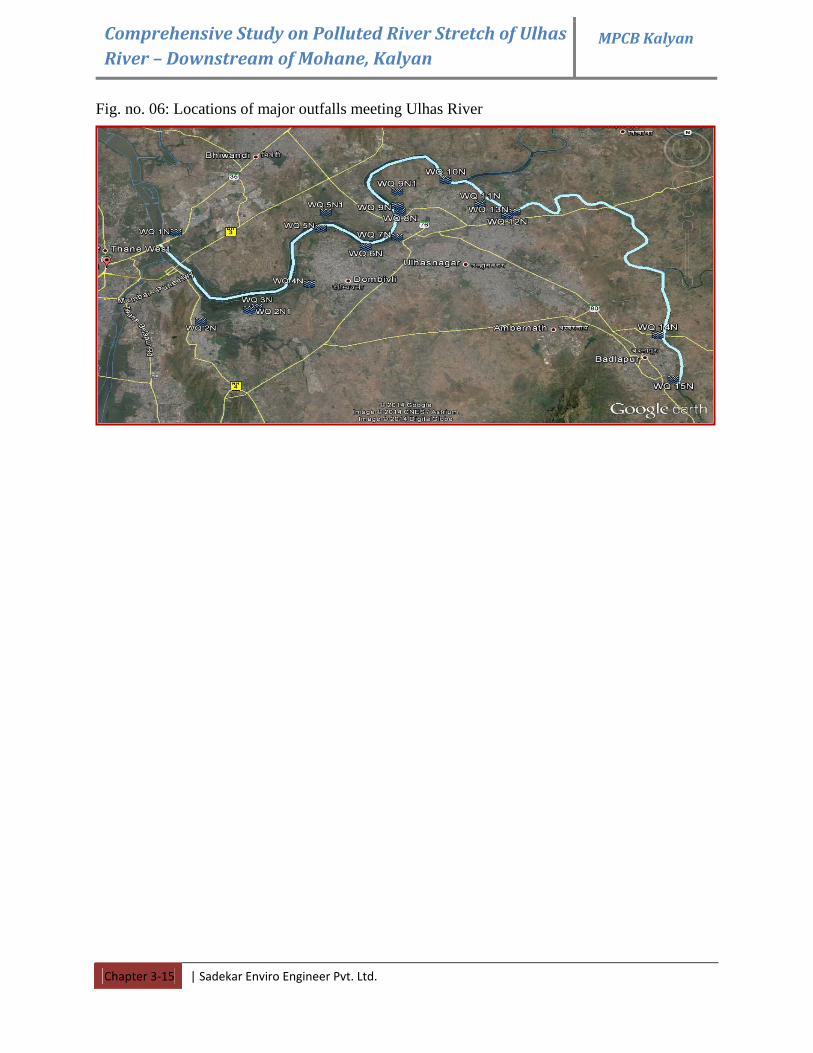
3.4.1 Major Outfalls
The major outfalls are identified across the pollution stretch of River Ulhas as shown in Fig. no.
04. The locations are marked as MOF -01 to MOF -15. The MOF are decided based on the size,
shape of the drain /nallah.
Table no. 20: The details of the identified MOF across the pollution stretch of river Ulhas
Note: All 6.0m width Nallahs are Civic drain
Major Outfalls (MOF)
Latitude & Longitude Width of Nallah
mouth (m) Segment of
Estuary /River
MOF ‐01 19°14'12.82"N and 73°0'15.66"E 40.2
MOF ‐02 19°11'46.82"N and 73°1'31.19"E 63.0 MOF ‐02A 19°11'26.95"N and 73°2'46.85"E 6.0 MOF ‐03 19°11'48.41"N and 73°2'47.26"E 6.0 MOF ‐04 19°12'16.57"N and 73°4'1.80"E 30.5 MOF ‐05 19°14'19.05"N and 73°4'41.34"E 6.0 MOF ‐05A 19°14'42.75"N and 73°4'56.12"E 39.0
MOF ‐06 19°13'48.16"N and 73°6'5.78"E 20.0
Upper Estuary
MOF ‐07 19°14'6.18"N and 73°6'56.96"E 25.5 MOF ‐08 19°14'52.65"N and 73°7'5.40"E 7.0 MOF ‐09 19°15'4.33"N and 73°7'0.48"E 2.5 MOF ‐09A 19°15'34.60"N and 73°6'59.59"E 6.0
MOF ‐10 19°16'1.93"N and 73°8'23.08"E 2.5
Middle Estuary
MOF ‐11 19°15'30.92"N and 73°9'26.95"E 33.0
MOF ‐12 19°15'0.89"N and 73°10'8.26"E 6.0 Lower Estuary
MOF ‐13 19°15'1.85"N and 73°10'17.73"E 2.5 MOF ‐14 19°10'41.68"N and 73°14'42.07"E 10.0 MOF ‐15 19° 9'5.40"N and 73°15'6.87"E 5.0
River Upstream
Comprehensive Study on Polluted River Stretch of Ulhas River – Downstream of Mohane, Kalyan
MPCB Kalyan
Chapter 3‐15 | Sadekar Enviro Engineer Pvt. Ltd.
Fig. no. 06: Locations of major outfalls meeting Ulhas River
Comprehensive Study on Polluted River Stretch of Ulhas River – Downstream of Mohane, Kalyan
MPCB Kalyan
Chapter 3‐16 | Sadekar Enviro Engineer Pvt. Ltd.
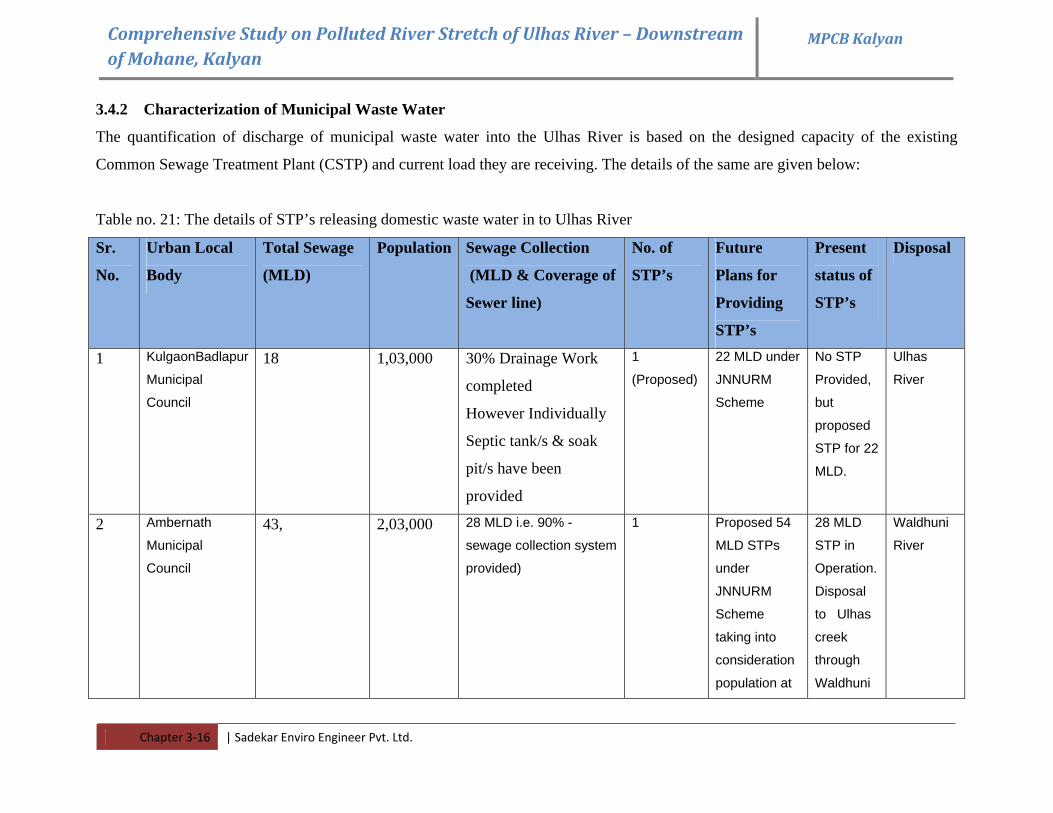
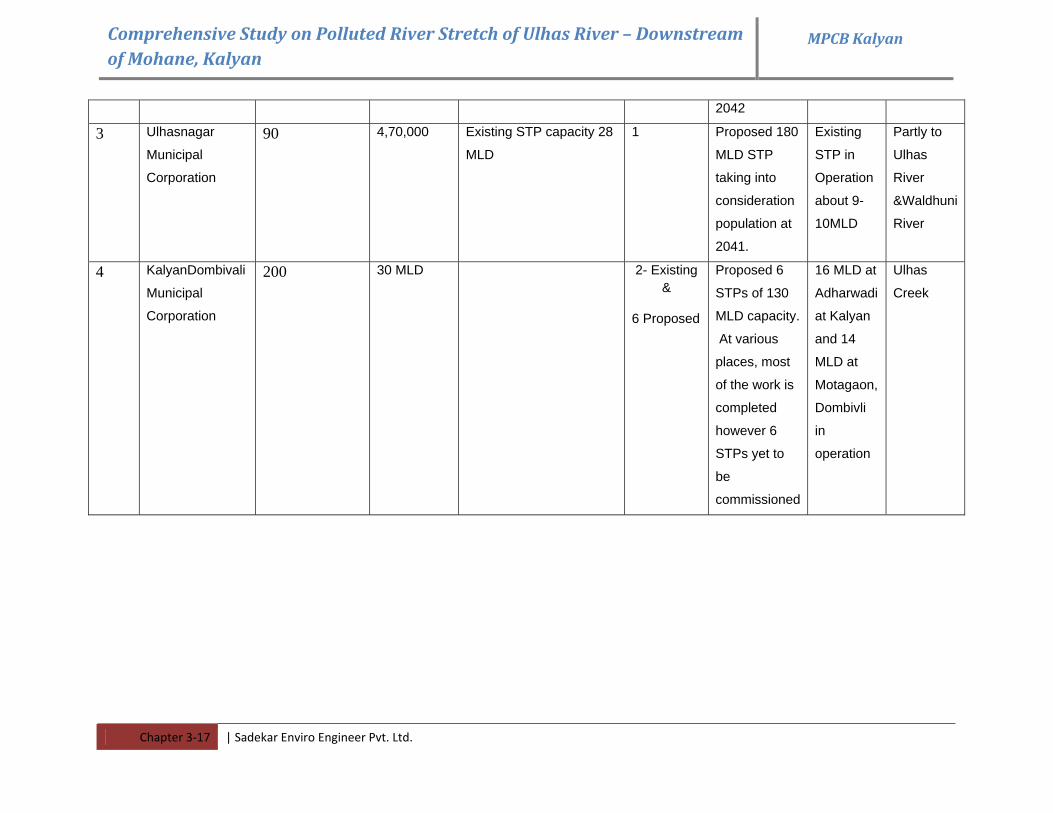
3.4.2 Characterization of Municipal Waste Water
The quantification of discharge of municipal waste water into the Ulhas River is based on the designed capacity of the existing
Common Sewage Treatment Plant (CSTP) and current load they are receiving. The details of the same are given below:
Table no. 21: The details of STP’s releasing domestic waste water in to Ulhas River
Sr.
No.
Urban Local
Body
Total Sewage
(MLD)
Population Sewage Collection
(MLD & Coverage of
Sewer line)
No. of
STP’s
Future
Plans for
Providing
STP’s
Present
status of
STP’s
Disposal
1 KulgaonBadlapur
Municipal
Council
18 1,03,000 30% Drainage Work
completed
However Individually
Septic tank/s & soak
pit/s have been
provided
1
(Proposed) 22 MLD under
JNNURM
Scheme
No STP
Provided,
but
proposed
STP for 22
MLD.
Ulhas
River
2 Ambernath
Municipal
Council
43, 2,03,000 28 MLD i.e. 90% -
sewage collection system
provided)
1 Proposed 54
MLD STPs
under
JNNURM
Scheme
taking into
consideration
population at
28 MLD
STP in
Operation.
Disposal
to Ulhas
creek
through
Waldhuni
Waldhuni
River
Comprehensive Study on Polluted River Stretch of Ulhas River – Downstream of Mohane, Kalyan
MPCB Kalyan
Chapter 3‐17 | Sadekar Enviro Engineer Pvt. Ltd.
2042
3 Ulhasnagar
Municipal
Corporation
90 4,70,000 Existing STP capacity 28
MLD
1 Proposed 180
MLD STP
taking into
consideration
population at
2041.
Existing
STP in
Operation
about 9-
10MLD
Partly to
Ulhas
River
&Waldhuni
River
4 KalyanDombivali
Municipal
Corporation
200 30 MLD 2- Existing &
6 Proposed
Proposed 6
STPs of 130
MLD capacity.
At various
places, most
of the work is
completed
however 6
STPs yet to
be
commissioned
16 MLD at
Adharwadi
at Kalyan
and 14
MLD at
Motagaon,
Dombivli
in
operation
Ulhas
Creek
Comprehensive Study on Polluted River Stretch of Ulhas River – Downstream of Mohane, Kalyan
MPCB Kalyan
Chapter 3‐18 | Sadekar Enviro Engineer Pvt. Ltd.
3.4.3 Identification of extent of Pollution Control needed in a view of critical flow conditions
The critical flow conditions are considered as the period when there is sudden increase in
generation of municipal waste water and would not be possible to treat in CSTP. Processing of
such waste water could hamper the designed and stabilized capability of CSPT. It is very
significant to address and tackling of critical flow conditions which generates at the time of
different festivals, communal occasions /gathering, major events etc.
This report would suggest emphasizing on prevention of generation at the source instead of
putting control measures to cater the pollution generated during different communal events.
It is not advisable to control the utilization of water during the festive season as Ulhas River
witnessed the different communal growth along its stretch. But the generation of waste water
from different activities like gatherings, major events, tournaments, etc. can be restricted to the
maximum extent by putting them under regulatory frame work as given below;
a. Registration of all above mentioned events through local municipal authority and CSTP
and SPCB shall keep informed best before one month prior to such activity been carried out.
b. SPCB shall impose certain stipulations /guidelines to the organizer in order to restrict the
pollution at source.
c. Municipal authority in coordination with SPCB shall impose certain conditions to
organizer to provide the permanent infrastructure for the treatment of domestic waste water
generated at source and it should meet the criteria of discharge as per the CSTP norms.
d. CSTP shall provide NOC to such organizer to discharge the treated waste water into the
municipal drain.
e. Apart from this a small scale service /process industry contributing to domestic waste
water under the roof of Corporate Housing Society (CHS) shall be restricted to discharge there
waste water to full-fledged in-house STPs and shall be governed by SPCB.
f. The above conditions can be regularized under law.
Considering the 3 cities and 4 towns across the pollution stretch of Ulhas river and there
geographical conditions as they are much compacted and un-planned it will be difficult to
implement above given recommendations. It would be advisable to provide the lagoon nearest to
the CSTP in order to tackle the situation under critical flow conditions. This has to be restricted
through fencing or other means.
Comprehensive Study on Polluted River Stretch of Ulhas River – Downstream of Mohane, Kalyan
MPCB Kalyan
Chapter 3‐19 | Sadekar Enviro Engineer Pvt. Ltd.
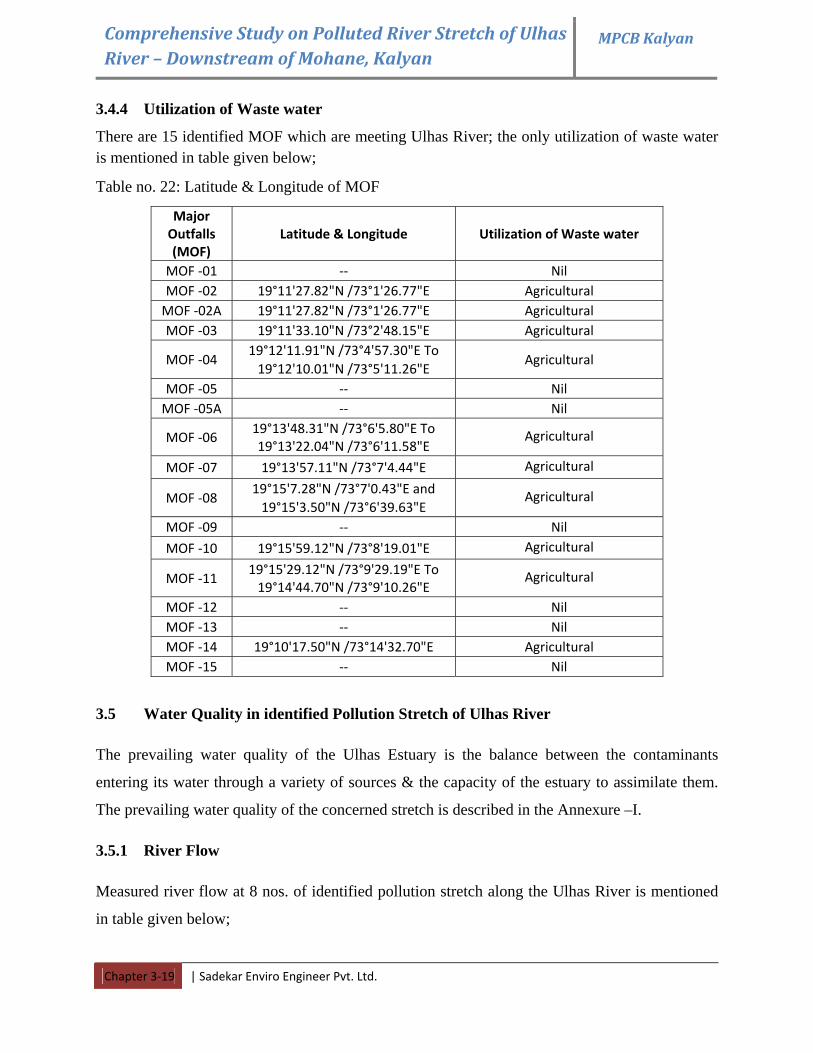
3.4.4 Utilization of Waste water
There are 15 identified MOF which are meeting Ulhas River; the only utilization of waste water is mentioned in table given below;
Table no. 22: Latitude & Longitude of MOF
Major Outfalls (MOF)
Latitude & Longitude Utilization of Waste water
MOF ‐01 ‐‐ Nil MOF ‐02 19°11'27.82"N /73°1'26.77"E Agricultural MOF ‐02A 19°11'27.82"N /73°1'26.77"E Agricultural MOF ‐03 19°11'33.10"N /73°2'48.15"E Agricultural
MOF ‐04 19°12'11.91"N /73°4'57.30"E To 19°12'10.01"N /73°5'11.26"E
Agricultural
MOF ‐05 ‐‐ Nil MOF ‐05A ‐‐ Nil
MOF ‐06 19°13'48.31"N /73°6'5.80"E To 19°13'22.04"N /73°6'11.58"E
Agricultural
MOF ‐07 19°13'57.11"N /73°7'4.44"E Agricultural
MOF ‐08 19°15'7.28"N /73°7'0.43"E and 19°15'3.50"N /73°6'39.63"E
Agricultural
MOF ‐09 ‐‐ Nil
MOF ‐10 19°15'59.12"N /73°8'19.01"E Agricultural
MOF ‐11 19°15'29.12"N /73°9'29.19"E To 19°14'44.70"N /73°9'10.26"E
Agricultural
MOF ‐12 ‐‐ Nil MOF ‐13 ‐‐ Nil MOF ‐14 19°10'17.50"N /73°14'32.70"E Agricultural MOF ‐15 ‐‐ Nil
3.5 Water Quality in identified Pollution Stretch of Ulhas River
The prevailing water quality of the Ulhas Estuary is the balance between the contaminants
entering its water through a variety of sources & the capacity of the estuary to assimilate them.
The prevailing water quality of the concerned stretch is described in the Annexure –I.
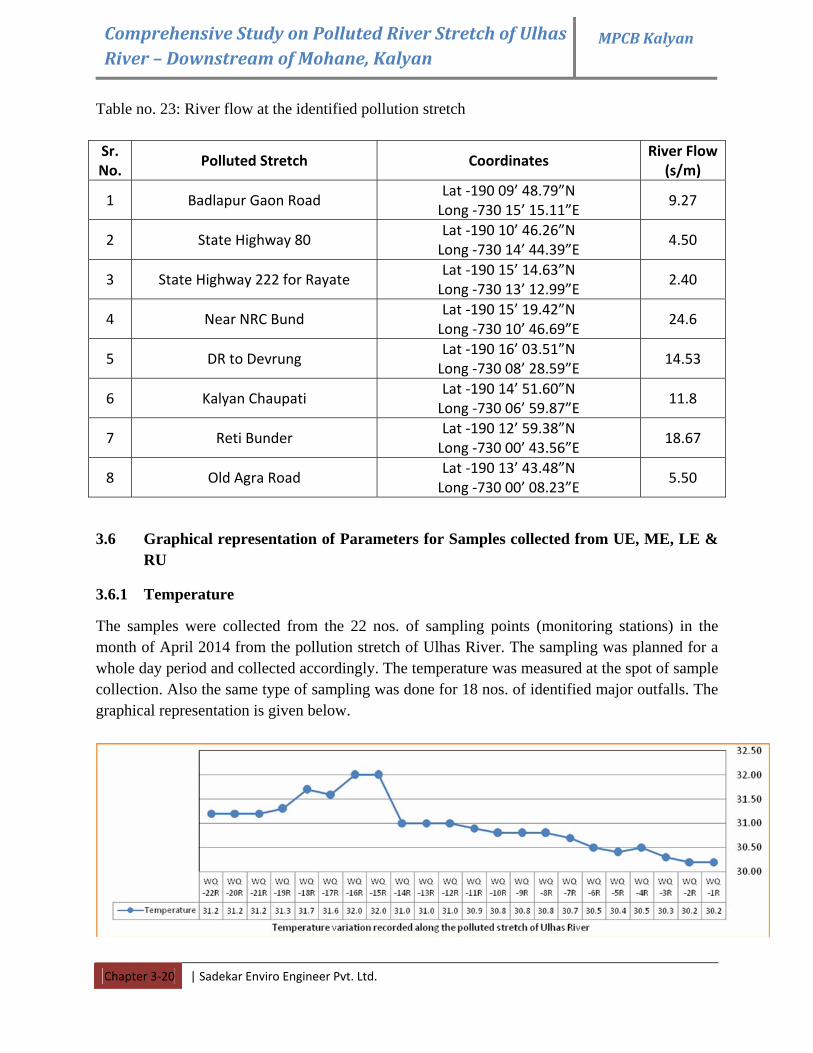
3.5.1 River Flow
Measured river flow at 8 nos. of identified pollution stretch along the Ulhas River is mentioned
in table given below;
Comprehensive Study on Polluted River Stretch of Ulhas River – Downstream of Mohane, Kalyan
MPCB Kalyan
Chapter 3‐20 | Sadekar Enviro Engineer Pvt. Ltd.
Table no. 23: River flow at the identified pollution stretch
Sr. No.
Polluted Stretch Coordinates River Flow
(s/m)
1 Badlapur Gaon Road Lat ‐190 09’ 48.79”N Long ‐730 15’ 15.11”E
9.27
2 State Highway 80 Lat ‐190 10’ 46.26”N Long ‐730 14’ 44.39”E
4.50
3 State Highway 222 for Rayate Lat ‐190 15’ 14.63”N Long ‐730 13’ 12.99”E
2.40
4 Near NRC Bund Lat ‐190 15’ 19.42”N Long ‐730 10’ 46.69”E
24.6
5 DR to Devrung Lat ‐190 16’ 03.51”N Long ‐730 08’ 28.59”E
14.53
6 Kalyan Chaupati Lat ‐190 14’ 51.60”N Long ‐730 06’ 59.87”E
11.8
7 Reti Bunder Lat ‐190 12’ 59.38”N Long ‐730 00’ 43.56”E
18.67
8 Old Agra Road Lat ‐190 13’ 43.48”N Long ‐730 00’ 08.23”E
5.50
3.6 Graphical representation of Parameters for Samples collected from UE, ME, LE & RU
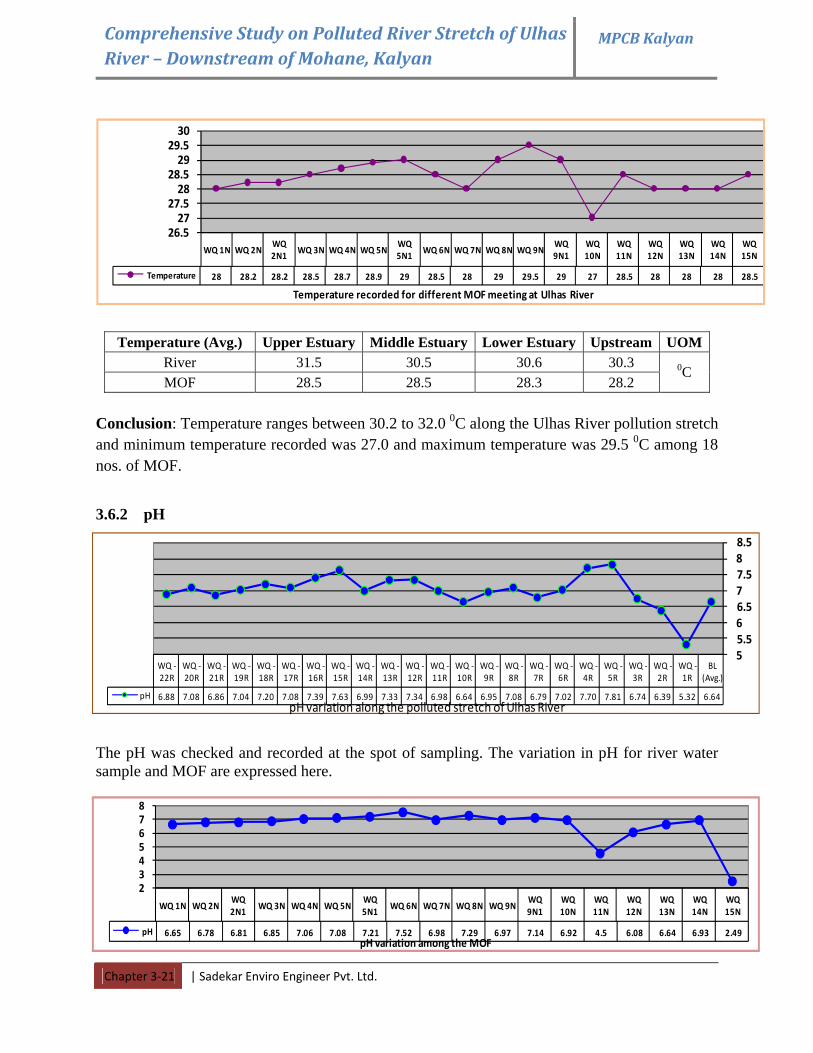
3.6.1 Temperature
The samples were collected from the 22 nos. of sampling points (monitoring stations) in the month of April 2014 from the pollution stretch of Ulhas River. The sampling was planned for a whole day period and collected accordingly. The temperature was measured at the spot of sample collection. Also the same type of sampling was done for 18 nos. of identified major outfalls. The graphical representation is given below.
Comprehensive Study on Polluted River Stretch of Ulhas River – Downstream of Mohane, Kalyan
MPCB Kalyan
Chapter 3‐21 | Sadekar Enviro Engineer Pvt. Ltd.
Temperature (Avg.) Upper Estuary Middle Estuary Lower Estuary Upstream UOM
River 31.5 30.5 30.6 30.3 MOF 28.5 28.5 28.3 28.2
0C
Conclusion: Temperature ranges between 30.2 to 32.0 0C along the Ulhas River pollution stretch and minimum temperature recorded was 27.0 and maximum temperature was 29.5 0C among 18 nos. of MOF.
3.6.2 pH
The pH was checked and recorded at the spot of sampling. The variation in pH for river water sample and MOF are expressed here.
BL (Avg.)
WQ ‐1R
WQ ‐2R
WQ ‐3R
WQ ‐5R
WQ ‐4R
WQ ‐6R
WQ ‐7R
WQ ‐8R
WQ ‐9R
WQ ‐10R
WQ ‐11R
WQ ‐12R
WQ ‐13R
WQ ‐14R
WQ ‐15R
WQ ‐16R
WQ ‐17R
WQ ‐18R
WQ ‐19R
WQ ‐21R
WQ ‐20R
WQ ‐22R
pH 6.645.326.396.747.817.707.026.797.086.956.646.987.347.336.997.637.397.087.207.046.867.086.88
55.566.577.588.5
pH variation along the polluted stretch of Ulhas River
WQ 1N WQ 2NWQ 2N1
WQ 3N WQ 4N WQ 5NWQ 5N1
WQ 6N WQ 7N WQ 8N WQ 9NWQ 9N1
WQ 10N
WQ 11N
WQ 12N
WQ 13N
WQ 14N
WQ 15N
Temperature 28 28.2 28.2 28.5 28.7 28.9 29 28.5 28 29 29.5 29 27 28.5 28 28 28 28.5
26.527
27.528
28.529
29.530
Temperature recorded for different MOF meeting at Ulhas River
WQ 1N WQ 2NWQ 2N1
WQ 3N WQ 4N WQ 5NWQ 5N1
WQ 6N WQ 7N WQ 8N WQ 9NWQ 9N1
WQ 10N
WQ 11N
WQ 12N
WQ 13N
WQ 14N
WQ 15N
pH 6.65 6.78 6.81 6.85 7.06 7.08 7.21 7.52 6.98 7.29 6.97 7.14 6.92 4.5 6.08 6.64 6.93 2.49
2345678
pH variation among the MOF
Comprehensive Study on Polluted River Stretch of Ulhas River – Downstream of Mohane, Kalyan
MPCB Kalyan
Chapter 3‐22 | Sadekar Enviro Engineer Pvt. Ltd.
pH (Avg.) Upper Estuary Middle Estuary Lower Estuary Upstream UOM
River 7.15 7.04 7.17 7.10 MOF 7.00 7.06 5.29 5.37
-
Conclusion: Minimum pH recorded as 5.30 at monitoring location WQ -1R which is hardly 1.3km away from the MOF no. WQ -15N of which minimum pH was recorded as 2.49 (highly acidic). Whereas maximum pH recorded were 7.8 for the polluted stretch and 7.5 for MOF resp.
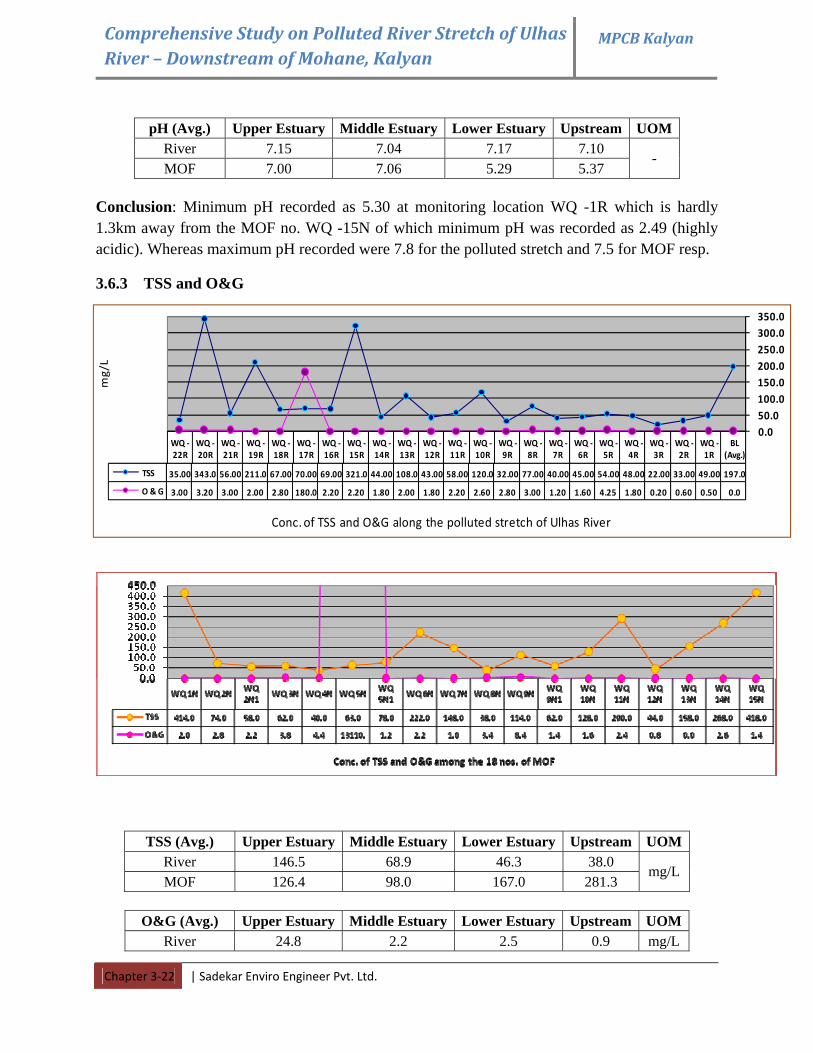
3.6.3 TSS and O&G
TSS (Avg.) Upper Estuary Middle Estuary Lower Estuary Upstream UOMRiver 146.5 68.9 46.3 38.0 MOF 126.4 98.0 167.0 281.3
mg/L
O&G (Avg.) Upper Estuary Middle Estuary Lower Estuary Upstream UOM
River 24.8 2.2 2.5 0.9 mg/L
BL (Avg.)
WQ ‐1R
WQ ‐2R
WQ ‐3R
WQ ‐4R
WQ ‐5R
WQ ‐6R
WQ ‐7R
WQ ‐8R
WQ ‐9R
WQ ‐10R
WQ ‐11R
WQ ‐12R
WQ ‐13R
WQ ‐14R
WQ ‐15R
WQ ‐16R
WQ ‐17R
WQ ‐18R
WQ ‐19R
WQ ‐21R
WQ ‐20R
WQ ‐22R
TSS 197.049.0033.0022.0048.0054.0045.0040.0077.0032.00120.058.0043.00108.044.00321.069.0070.0067.00211.056.00343.035.00
O & G 0.00.500.600.201.804.251.601.203.002.802.602.201.802.001.802.202.20180.02.802.003.003.203.00
0.050.0100.0150.0200.0250.0300.0350.0
mg/L
Conc. of TSS and O&G along the polluted stretch of Ulhas River
Comprehensive Study on Polluted River Stretch of Ulhas River – Downstream of Mohane, Kalyan
MPCB Kalyan
Chapter 3‐23 | Sadekar Enviro Engineer Pvt. Ltd.
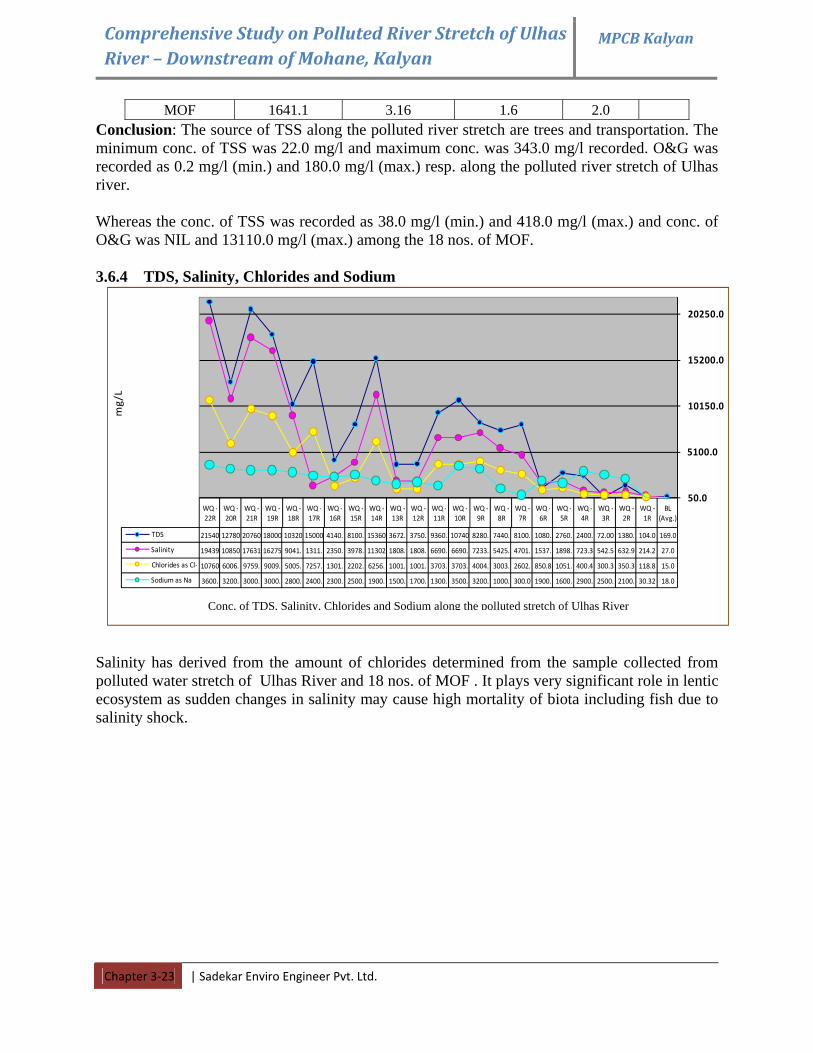
MOF 1641.1 3.16 1.6 2.0 Conclusion: The source of TSS along the polluted river stretch are trees and transportation. The minimum conc. of TSS was 22.0 mg/l and maximum conc. was 343.0 mg/l recorded. O&G was recorded as 0.2 mg/l (min.) and 180.0 mg/l (max.) resp. along the polluted river stretch of Ulhas river. Whereas the conc. of TSS was recorded as 38.0 mg/l (min.) and 418.0 mg/l (max.) and conc. of O&G was NIL and 13110.0 mg/l (max.) among the 18 nos. of MOF. 3.6.4 TDS, Salinity, Chlorides and Sodium
Salinity has derived from the amount of chlorides determined from the sample collected from polluted water stretch of Ulhas River and 18 nos. of MOF . It plays very significant role in lentic ecosystem as sudden changes in salinity may cause high mortality of biota including fish due to salinity shock.
BL (Avg.)
WQ ‐1R
WQ ‐2R
WQ ‐3R
WQ ‐4R
WQ ‐5R
WQ ‐6R
WQ ‐7R
WQ ‐8R
WQ ‐9R
WQ ‐10R
WQ ‐11R
WQ ‐12R
WQ ‐13R
WQ ‐14R
WQ ‐15R
WQ ‐16R
WQ ‐17R
WQ ‐18R
WQ ‐19R
WQ ‐21R
WQ ‐20R
WQ ‐22R
TDS 169.0104.01380.72.002400.2760.1080.8100.7440.8280.107409360.3750.3672.153608100.4140.150001032018000207601278021540
Salinity 27.0214.2632.9542.5723.31898.1537.4701.5425.7233.6690.6690.1808.1808.113023978.2350.1311.9041.16275176311085019439
Chlorides as Cl‐ 15.0118.8350.3300.3400.41051.850.82602.3003.4004.3703.3703.1001.1001.6256.2202.1301.7257.5005.9009.9759.6006.10760
Sodium as Na 18.030.322100.2500.2900.1600.1900.300.01000.3200.3500.1300.1700.1500.1900.2500.2300.2400.2800.3000.3000.3200.3600.
50.0
5100.0
10150.0
15200.0
20250.0
mg/L
Conc. of TDS, Salinity, Chlorides and Sodium along the polluted stretch of Ulhas River
Comprehensive Study on Polluted River Stretch of Ulhas River – Downstream of Mohane, Kalyan
MPCB Kalyan
Chapter 3‐24 | Sadekar Enviro Engineer Pvt. Ltd.
WQ 1N
WQ 2N
WQ 2N1
WQ 3N
WQ 4N
WQ 5N
WQ 5N1
WQ 6N
WQ 7N
WQ 8N
WQ 9N
WQ 9N1
WQ 10N
WQ 11N
WQ 12N
WQ 13N
WQ 14N
WQ 15N
TDS 6908 552 728 754 756 560 648 3110 494 400 214 452 428 1742 244 563 136 156
Salinity 548.0 124.2 69.9 84.0 799.3 697.8 307.5 614.4 113.9 87.6 97.6 99.9 76.0 146.1 139.3 95.8 70.5 47.0
Chloride 303.3 68.76 38.71 46.52 442.4 386.2 170.1 340.0 63.06 48.5 54.05 55.27 42.04 80.88 77.08 53.05 39.04 26.03
Sodium as Na 66 36 32 44 48 33 34 39 30 16 36 18 31 42 26 30 34 50
0
1000
2000
3000
4000
5000
6000
7000
Conc. of TDS, Salinity, Chlorides and Sodium among the 18 nos. of MOF
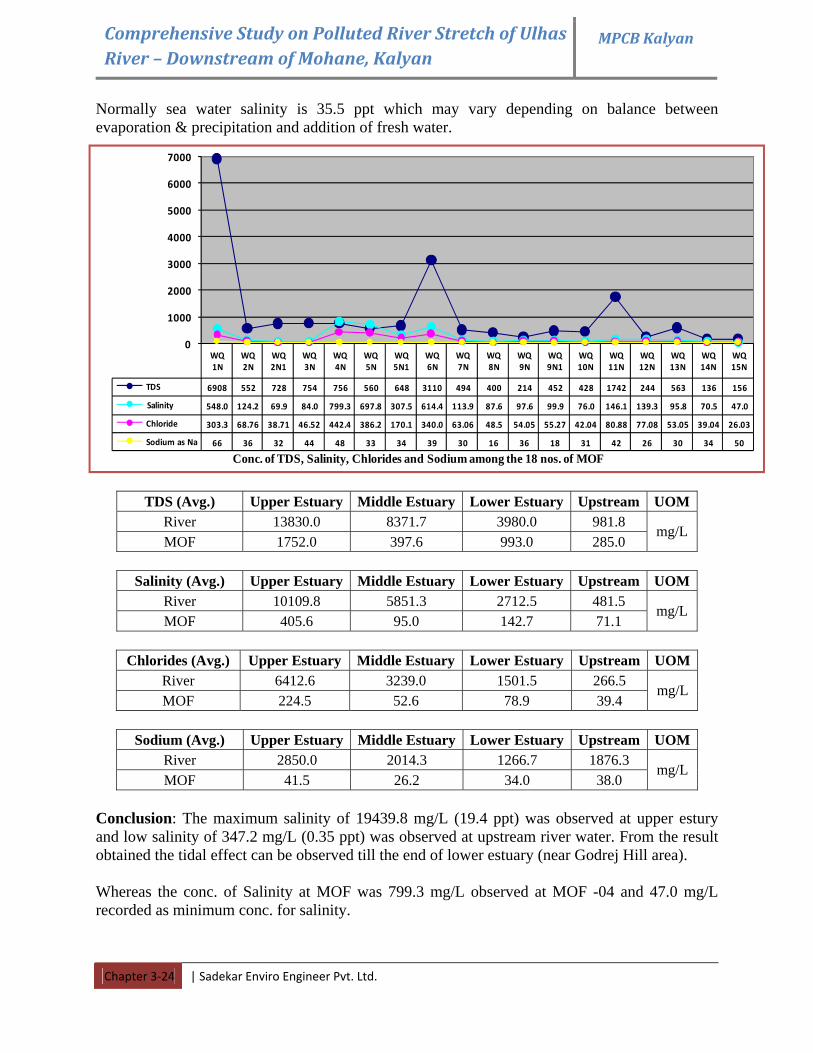
Normally sea water salinity is 35.5 ppt which may vary depending on balance between evaporation & precipitation and addition of fresh water.
TDS (Avg.) Upper Estuary Middle Estuary Lower Estuary Upstream UOMRiver 13830.0 8371.7 3980.0 981.8 MOF 1752.0 397.6 993.0 285.0
mg/L
Salinity (Avg.) Upper Estuary Middle Estuary Lower Estuary Upstream UOM
River 10109.8 5851.3 2712.5 481.5 MOF 405.6 95.0 142.7 71.1
mg/L
Chlorides (Avg.) Upper Estuary Middle Estuary Lower Estuary Upstream UOM
River 6412.6 3239.0 1501.5 266.5 MOF 224.5 52.6 78.9 39.4
mg/L
Sodium (Avg.) Upper Estuary Middle Estuary Lower Estuary Upstream UOM
River 2850.0 2014.3 1266.7 1876.3 MOF 41.5 26.2 34.0 38.0
mg/L
Conclusion: The maximum salinity of 19439.8 mg/L (19.4 ppt) was observed at upper estury and low salinity of 347.2 mg/L (0.35 ppt) was observed at upstream river water. From the result obtained the tidal effect can be observed till the end of lower estuary (near Godrej Hill area). Whereas the conc. of Salinity at MOF was 799.3 mg/L observed at MOF -04 and 47.0 mg/L recorded as minimum conc. for salinity.
Comprehensive Study on Polluted River Stretch of Ulhas River – Downstream of Mohane, Kalyan
MPCB Kalyan
Chapter 3‐25 | Sadekar Enviro Engineer Pvt. Ltd.
3.6.5 DO, COD and BOD
DO (Avg.) Upper Estuary Middle Estuary Lower Estuary Upstream UOMRiver 3.59 4.40 4.96 5.54 MOF - - - -
mg/L
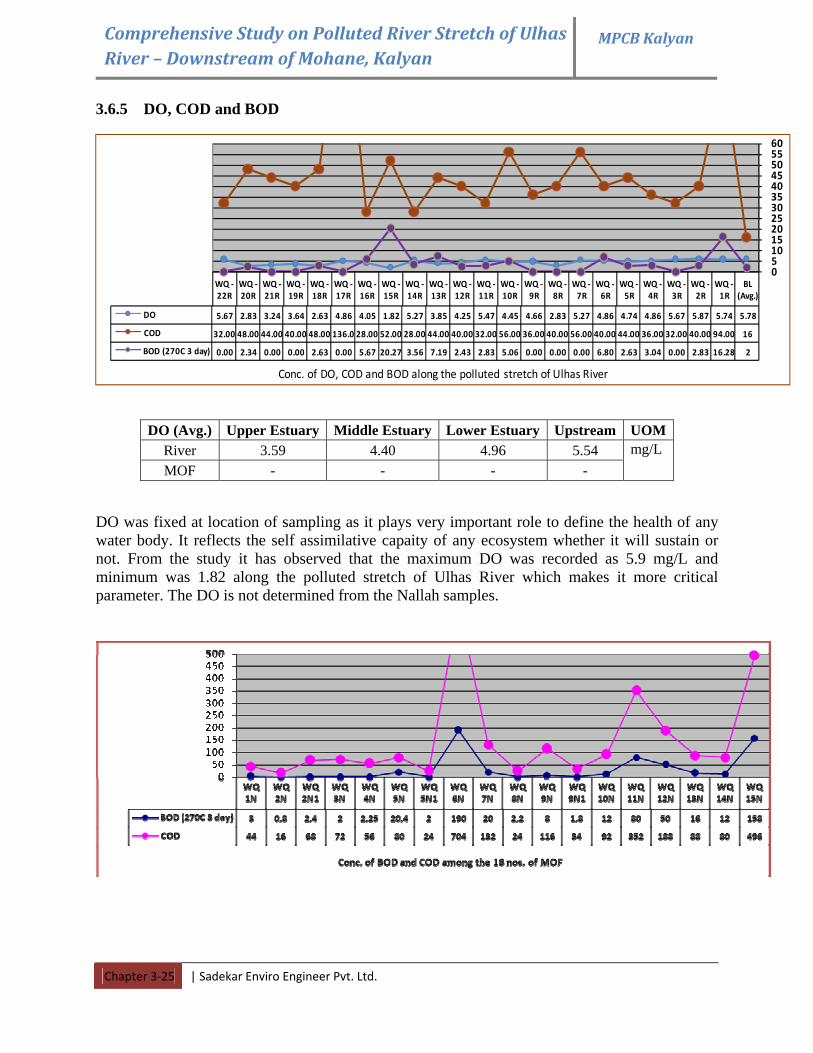
DO was fixed at location of sampling as it plays very important role to define the health of any water body. It reflects the self assimilative capaity of any ecosystem whether it will sustain or not. From the study it has observed that the maximum DO was recorded as 5.9 mg/L and minimum was 1.82 along the polluted stretch of Ulhas River which makes it more critical parameter. The DO is not determined from the Nallah samples.
BL (Avg.)
WQ ‐1R
WQ ‐2R
WQ ‐3R
WQ ‐4R
WQ ‐5R
WQ ‐6R
WQ ‐7R
WQ ‐8R
WQ ‐9R
WQ ‐10R
WQ ‐11R
WQ ‐12R
WQ ‐13R
WQ ‐14R
WQ ‐15R
WQ ‐16R
WQ ‐17R
WQ ‐18R
WQ ‐19R
WQ ‐21R
WQ ‐20R
WQ ‐22R
DO 5.785.745.875.674.864.744.865.272.834.664.455.474.253.855.271.824.054.862.633.643.242.835.67
COD 1694.0040.0032.0036.0044.0040.0056.0040.0036.0056.0032.0040.0044.0028.0052.0028.00136.048.0040.0044.0048.0032.00
BOD (270C 3 day) 216.282.830.003.042.636.800.000.000.005.062.832.437.193.5620.275.670.002.630.000.002.340.00
051015202530354045505560
Conc. of DO, COD and BOD along the polluted stretch of Ulhas River
Comprehensive Study on Polluted River Stretch of Ulhas River – Downstream of Mohane, Kalyan
MPCB Kalyan
Chapter 3‐26 | Sadekar Enviro Engineer Pvt. Ltd.
BOD (Avg.) Upper Estuary Middle Estuary Lower Estuary Upstream UOMRiver 7.73 4.21 4.72 7.38 MOF 30.69 11.33 65.0 62.0
mg/L
COD (Avg.) Upper Estuary Middle Estuary Lower Estuary Upstream UOM
River 53.5 39.4 46.7 50.5 MOF 133.0 79.6 270.0 221.3
mg/L
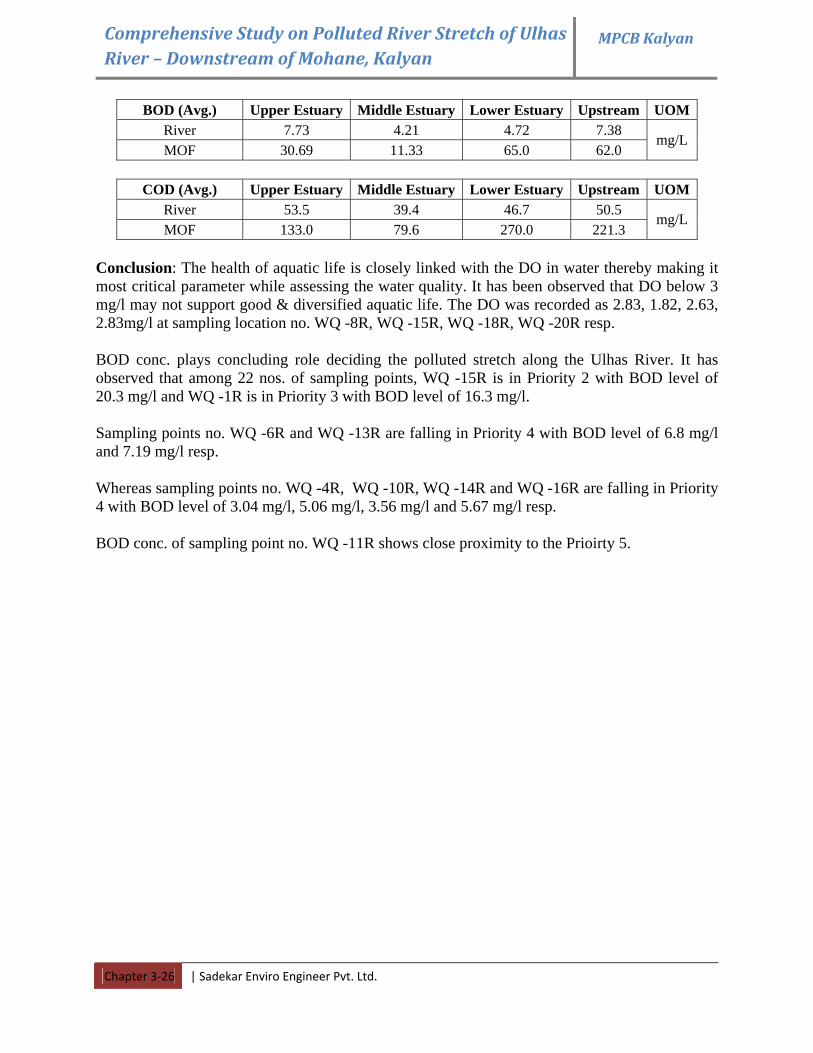
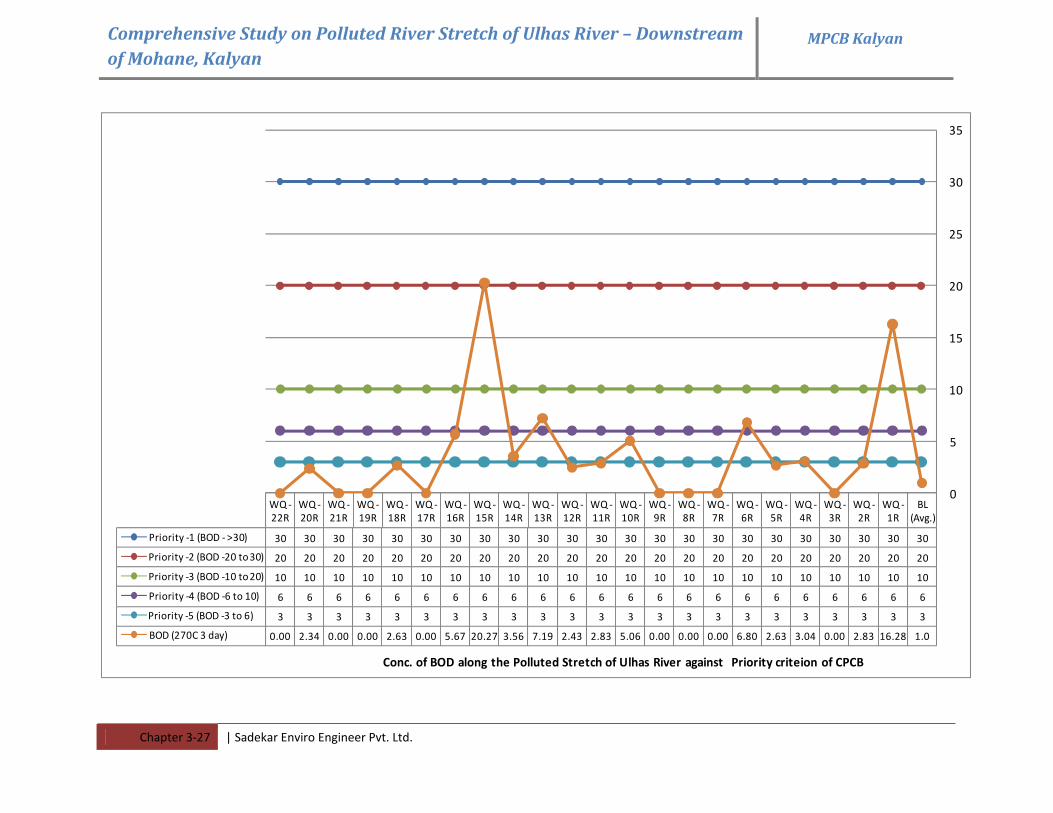
Conclusion: The health of aquatic life is closely linked with the DO in water thereby making it most critical parameter while assessing the water quality. It has been observed that DO below 3 mg/l may not support good & diversified aquatic life. The DO was recorded as 2.83, 1.82, 2.63, 2.83mg/l at sampling location no. WQ -8R, WQ -15R, WQ -18R, WQ -20R resp. BOD conc. plays concluding role deciding the polluted stretch along the Ulhas River. It has observed that among 22 nos. of sampling points, WQ -15R is in Priority 2 with BOD level of 20.3 mg/l and WQ -1R is in Priority 3 with BOD level of 16.3 mg/l. Sampling points no. WQ -6R and WQ -13R are falling in Priority 4 with BOD level of 6.8 mg/l and 7.19 mg/l resp. Whereas sampling points no. WQ -4R, WQ -10R, WQ -14R and WQ -16R are falling in Priority 4 with BOD level of 3.04 mg/l, 5.06 mg/l, 3.56 mg/l and 5.67 mg/l resp. BOD conc. of sampling point no. WQ -11R shows close proximity to the Prioirty 5.
Comprehensive Study on Polluted River Stretch of Ulhas River – Downstream of Mohane, Kalyan
MPCB Kalyan
Chapter 3‐27 | Sadekar Enviro Engineer Pvt. Ltd.
BL (Avg.)
WQ ‐1R
WQ ‐2R
WQ ‐3R
WQ ‐4R
WQ ‐5R
WQ ‐6R
WQ ‐7R
WQ ‐8R
WQ ‐9R
WQ ‐10R
WQ ‐11R
WQ ‐12R
WQ ‐13R
WQ ‐14R
WQ ‐15R
WQ ‐16R
WQ ‐17R
WQ ‐18R
WQ ‐19R
WQ ‐21R
WQ ‐20R
WQ ‐22R
Priority ‐1 (BOD ‐ >30) 3030303030303030303030303030303030303030303030
Priority ‐2 (BOD ‐20 to 30) 2020202020202020202020202020202020202020202020
Priority ‐3 (BOD ‐10 to 20) 1010101010101010101010101010101010101010101010
Priority ‐4 (BOD ‐6 to 10) 66666666666666666666666
Priority ‐5 (BOD ‐3 to 6) 33333333333333333333333
BOD (270C 3 day) 1.016.282.830.003.042.636.800.000.000.005.062.832.437.193.5620.275.670.002.630.000.002.340.00
0
5
10
15
20
25
30
35
Conc. of BOD along the Polluted Stretch of Ulhas River against Priority criteion of CPCB
Comprehensive Study on Polluted River Stretch of Ulhas River – Downstream of Mohane, Kalyan
MPCB Kalyan
Chapter 3‐28 | Sadekar Enviro Engineer Pvt. Ltd.
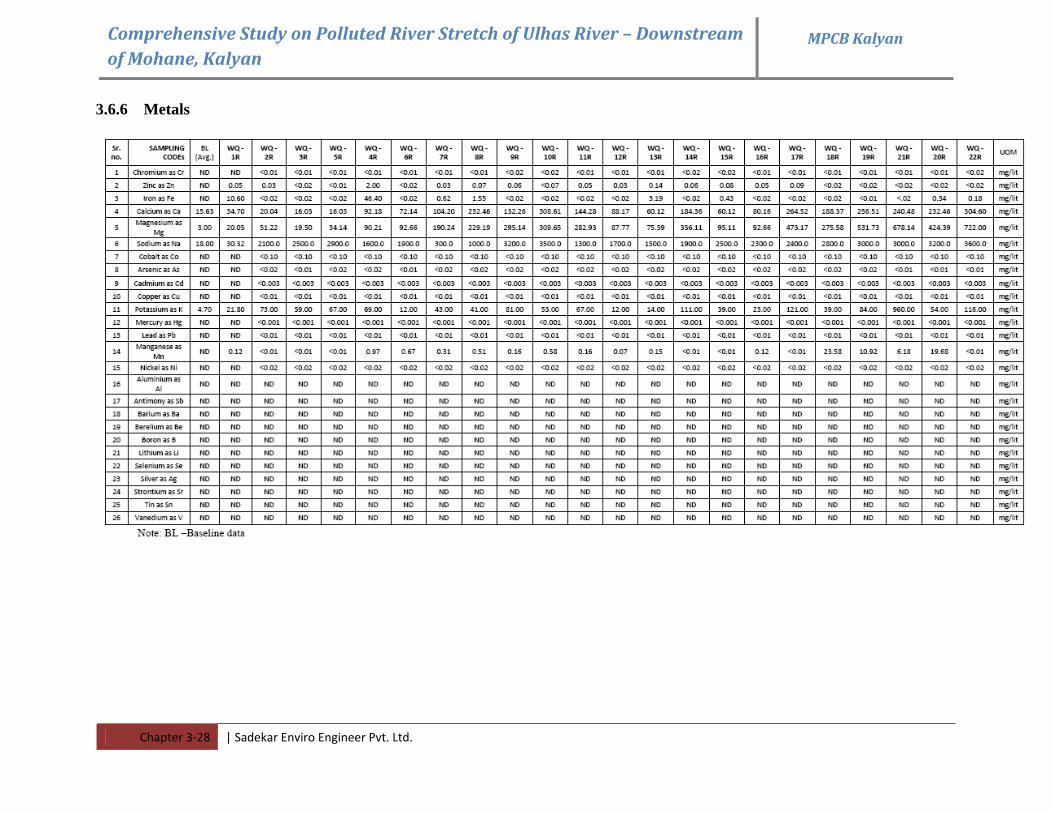
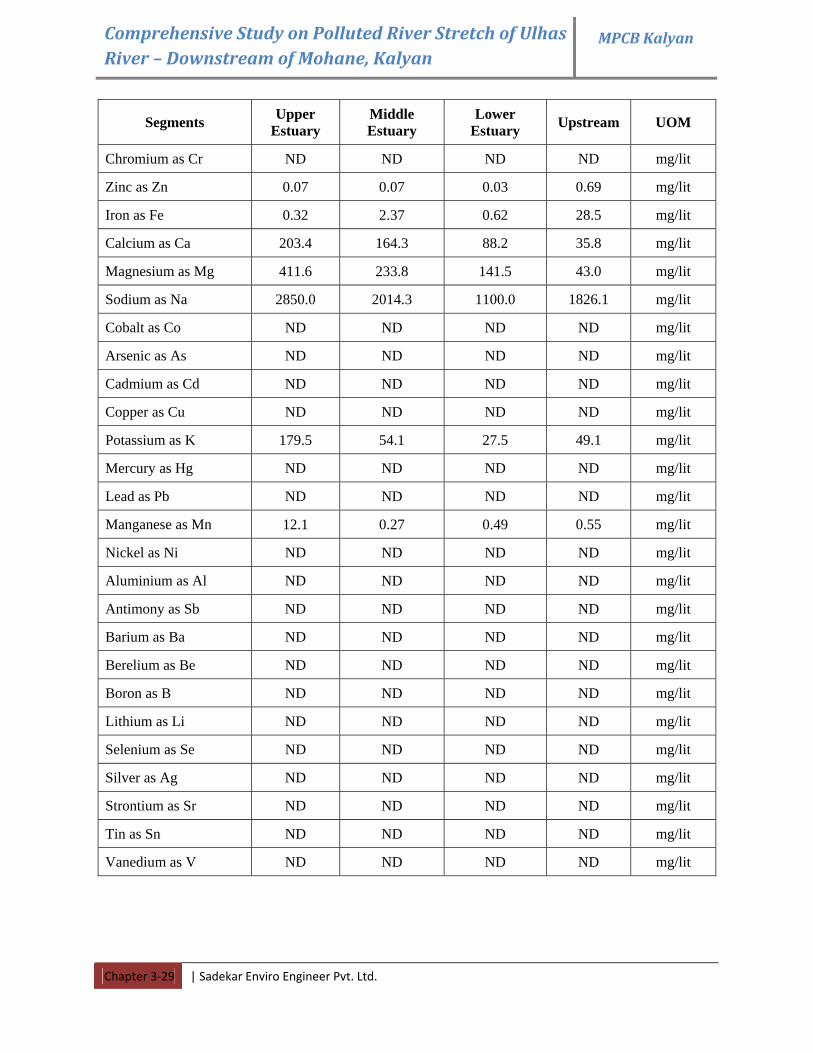
3.6.6 Metals
Comprehensive Study on Polluted River Stretch of Ulhas River – Downstream of Mohane, Kalyan
MPCB Kalyan
Chapter 3‐29 | Sadekar Enviro Engineer Pvt. Ltd.
Segments Upper Estuary
Middle Estuary
Lower Estuary Upstream UOM
Chromium as Cr ND ND ND ND mg/lit
Zinc as Zn 0.07 0.07 0.03 0.69 mg/lit
Iron as Fe 0.32 2.37 0.62 28.5 mg/lit
Calcium as Ca 203.4 164.3 88.2 35.8 mg/lit
Magnesium as Mg 411.6 233.8 141.5 43.0 mg/lit
Sodium as Na 2850.0 2014.3 1100.0 1826.1 mg/lit
Cobalt as Co ND ND ND ND mg/lit
Arsenic as As ND ND ND ND mg/lit
Cadmium as Cd ND ND ND ND mg/lit
Copper as Cu ND ND ND ND mg/lit
Potassium as K 179.5 54.1 27.5 49.1 mg/lit
Mercury as Hg ND ND ND ND mg/lit
Lead as Pb ND ND ND ND mg/lit
Manganese as Mn 12.1 0.27 0.49 0.55 mg/lit
Nickel as Ni ND ND ND ND mg/lit
Aluminium as Al ND ND ND ND mg/lit
Antimony as Sb ND ND ND ND mg/lit
Barium as Ba ND ND ND ND mg/lit
Berelium as Be ND ND ND ND mg/lit
Boron as B ND ND ND ND mg/lit
Lithium as Li ND ND ND ND mg/lit
Selenium as Se ND ND ND ND mg/lit
Silver as Ag ND ND ND ND mg/lit
Strontium as Sr ND ND ND ND mg/lit
Tin as Sn ND ND ND ND mg/lit
Vanedium as V ND ND ND ND mg/lit
Comprehensive Study on Polluted River Stretch of Ulhas River – Downstream of Mohane, Kalyan
MPCB Kalyan
Chapter 3‐30 | Sadekar Enviro Engineer Pvt. Ltd.
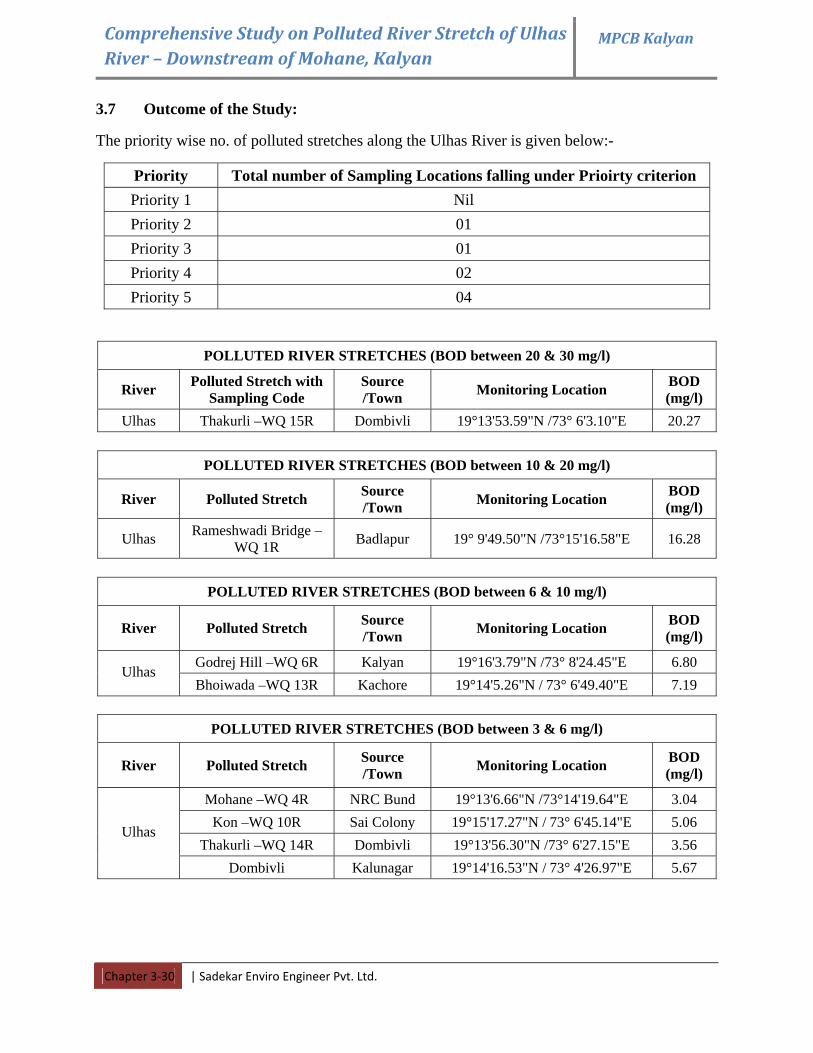
3.7 Outcome of the Study:
The priority wise no. of polluted stretches along the Ulhas River is given below:-
Priority Total number of Sampling Locations falling under Prioirty criterion Priority 1 Nil Priority 2 01 Priority 3 01 Priority 4 02 Priority 5 04
POLLUTED RIVER STRETCHES (BOD between 20 & 30 mg/l)
River Polluted Stretch with Sampling Code
Source /Town Monitoring Location BOD
(mg/l) Ulhas Thakurli –WQ 15R Dombivli 19°13'53.59"N /73° 6'3.10"E 20.27
POLLUTED RIVER STRETCHES (BOD between 10 & 20 mg/l)
River Polluted Stretch Source /Town Monitoring Location BOD
(mg/l)
Ulhas Rameshwadi Bridge –WQ 1R Badlapur 19° 9'49.50"N /73°15'16.58"E 16.28
POLLUTED RIVER STRETCHES (BOD between 6 & 10 mg/l)
River Polluted Stretch Source /Town Monitoring Location BOD
(mg/l)
Godrej Hill –WQ 6R Kalyan 19°16'3.79"N /73° 8'24.45"E 6.80 Ulhas
Bhoiwada –WQ 13R Kachore 19°14'5.26"N / 73° 6'49.40"E 7.19
POLLUTED RIVER STRETCHES (BOD between 3 & 6 mg/l)
River Polluted Stretch Source /Town Monitoring Location BOD
(mg/l)
Mohane –WQ 4R NRC Bund 19°13'6.66"N /73°14'19.64"E 3.04 Kon –WQ 10R Sai Colony 19°15'17.27"N / 73° 6'45.14"E 5.06
Thakurli –WQ 14R Dombivli 19°13'56.30"N /73° 6'27.15"E 3.56 Ulhas
Dombivli Kalunagar 19°14'16.53"N / 73° 4'26.97"E 5.67
Comprehensive Study on Polluted River Stretch of Ulhas River – Downstream of Mohane, Kalyan
MPCB Kalyan
Chapter 4‐1 | Sadekar Enviro Engineer Pvt. Ltd.
CHAPTER 4: SITE SELECTION AND TREATMENT TECHNOLOGY
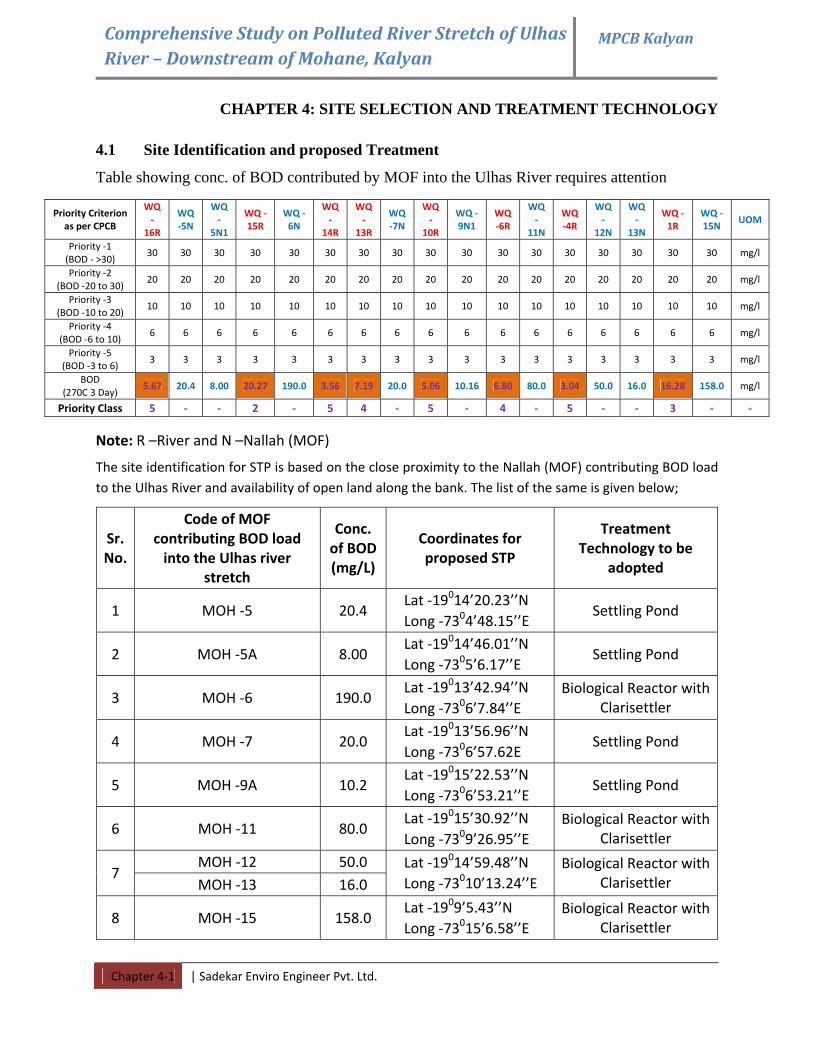
4.1 Site Identification and proposed Treatment
Table showing conc. of BOD contributed by MOF into the Ulhas River requires attention
Priority Criterion as per CPCB
WQ ‐
16R
WQ ‐5N
WQ ‐
5N1
WQ ‐15R
WQ ‐6N
WQ ‐
14R
WQ ‐
13R
WQ ‐7N
WQ ‐
10R
WQ ‐9N1
WQ ‐6R
WQ ‐
11N
WQ ‐4R
WQ ‐
12N
WQ ‐
13N
WQ ‐1R
WQ ‐15N
UOM
Priority ‐1 (BOD ‐ >30)
30 30 30 30 30 30 30 30 30 30 30 30 30 30 30 30 30 mg/l
Priority ‐2 (BOD ‐20 to 30)
20 20 20 20 20 20 20 20 20 20 20 20 20 20 20 20 20 mg/l
Priority ‐3 (BOD ‐10 to 20)
10 10 10 10 10 10 10 10 10 10 10 10 10 10 10 10 10 mg/l
Priority ‐4 (BOD ‐6 to 10)
6 6 6 6 6 6 6 6 6 6 6 6 6 6 6 6 6 mg/l
Priority ‐5 (BOD ‐3 to 6)
3 3 3 3 3 3 3 3 3 3 3 3 3 3 3 3 3 mg/l
BOD (270C 3 Day)
5.67 20.4 8.00 20.27 190.0 3.56 7.19 20.0 5.06 10.16 6.80 80.0 3.04 50.0 16.0 16.28 158.0 mg/l
Priority Class 5 ‐ ‐ 2 ‐ 5 4 ‐ 5 ‐ 4 ‐ 5 ‐ ‐ 3 ‐ ‐
Note: R –River and N –Nallah (MOF)
The site identification for STP is based on the close proximity to the Nallah (MOF) contributing BOD load to the Ulhas River and availability of open land along the bank. The list of the same is given below;
Sr. No.
Code of MOF contributing BOD load into the Ulhas river
stretch
Conc. of BOD (mg/L)
Coordinates for proposed STP
Treatment Technology to be
adopted
1 MOH ‐5 20.4 Lat ‐19014’20.23’’N Long ‐7304’48.15’’E
Settling Pond
2 MOH ‐5A 8.00 Lat ‐19014’46.01’’N Long ‐7305’6.17’’E
Settling Pond
3 MOH ‐6 190.0 Lat ‐19013’42.94’’N Long ‐7306’7.84’’E
Biological Reactor with Clarisettler
4 MOH ‐7 20.0 Lat ‐19013’56.96’’N Long ‐7306’57.62E
Settling Pond
5 MOH ‐9A 10.2 Lat ‐19015’22.53’’N Long ‐7306’53.21’’E
Settling Pond
6 MOH ‐11 80.0 Lat ‐19015’30.92’’N Long ‐7309’26.95’’E
Biological Reactor with Clarisettler
MOH ‐12 50.0 7
MOH ‐13 16.0 Lat ‐19014’59.48’’N Long ‐73010’13.24’’E
Biological Reactor with Clarisettler
8 MOH ‐15 158.0 Lat ‐1909’5.43’’N Long ‐73015’6.58’’E
Biological Reactor with Clarisettler
Comprehensive Study on Polluted River Stretch of Ulhas River – Downstream of Mohane, Kalyan
MPCB Kalyan
Chapter 4‐2 | Sadekar Enviro Engineer Pvt. Ltd.
The settling ponds are recommended to the MOH with BOD conc. less than 100 mg/l, as the suspended particulates can be removed through physical separation. It is suitable for MOH ‐5, 5A, 7, 9A, 11, 12 and 13. Whereas MOH ‐6 and 15 are recommended with Biological Reactor with Clarifier considering the high BOD load.
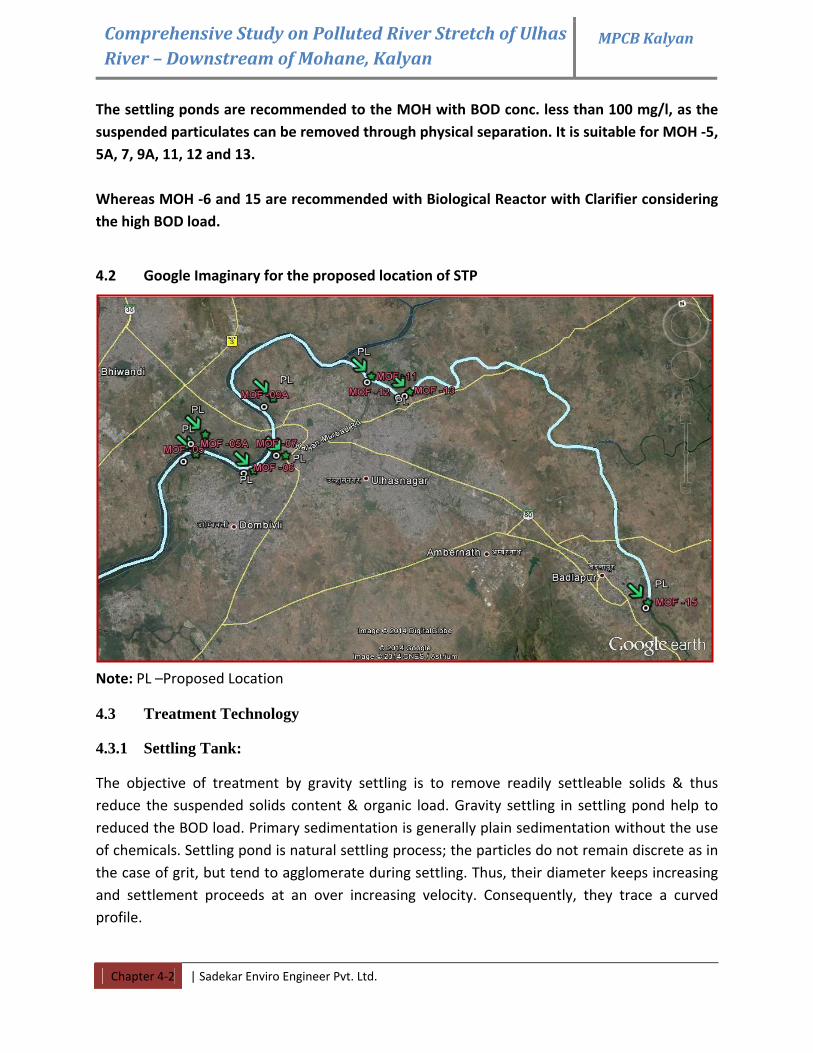
4.2 Google Imaginary for the proposed location of STP
Note: PL –Proposed Location
4.3 Treatment Technology
4.3.1 Settling Tank:
The objective of treatment by gravity settling is to remove readily settleable solids & thus reduce the suspended solids content & organic load. Gravity settling in settling pond help to reduced the BOD load. Primary sedimentation is generally plain sedimentation without the use of chemicals. Settling pond is natural settling process; the particles do not remain discrete as in the case of grit, but tend to agglomerate during settling. Thus, their diameter keeps increasing and settlement proceeds at an over increasing velocity. Consequently, they trace a curved profile.
Comprehensive Study on Polluted River Stretch of Ulhas River – Downstream of Mohane, Kalyan
MPCB Kalyan
Chapter 4‐3 | Sadekar Enviro Engineer Pvt. Ltd.
4.3.2 Bio reactor:
Bioreactors consists supply of a free‐flowing, chemically inert medium which acts as a receptacle for the bacteria that break down the raw sewage. Examples of these bioreactors often have separate, sequential tanks and a mechanical separator or cyclone to speed the separation of water and bio solids. Aerators supply oxygen to the sewage and medium, further accelerating breakdown. Submersible mixers provide agitation in anoxic bioreactors to keep the solids in suspension and thereby ensure that the bacteria and the organic materials "meet". In the process, the liquid's Biochemical Oxygen Demand (BOD) is reduced sufficiently to render the contaminated water fit for reuse. The bio solids can be collected for further processing, or dried and used as fertilizer.
Biological reactors are reactors in which organic matter, which serves as substrate or food to micro organisms, is utilized for the growth of micro organisms. These processes are:
a) Aerobic Biological Suspended Growth Processes: Conversion of colloidal, dissolved & residual suspended organic matter into settable biofloc & stable inorganic.
b) Aerobic Biological Attached Growth Processes: Conversion of colloidal, dissolved & residual suspended organic matter into settable biofloc & stable inorganic.
4.3.3 CLASSIFICATION OF THE PROCESSES
A number of treatment processes are available depending upon method of disposal, degree of treatment, waste water influent quality (domestic or industrial), availability of the land etc and requirement of recycling treated waste water. Waste Water Treatment Methodology commonly adopted for treatment of domestic waste may be any of the following:
Biological Processes
In these processes a mixture of wastewater and microorganisms (biomass) is agitated and aerated. Certain microbes, mainly bacteria of specific kind, have the capability to oxidize the dissolved organic matter in the waste water. Microbial growth is accelerated and controlled in the process. Thus, reduction or removal of organic matter in waste is brought about by microorganisms by oxidation. After oxidation, the sludge is separated from wastewater.
Aerobic Processes‐ The following conventional methodologies are examples of Aerobic
Processes‐ a) Activated sludge process (ASP) b) Trickling filters c) Facultative aerated lagoons d) Extended aeration process
Comprehensive Study on Polluted River Stretch of Ulhas River – Downstream of Mohane, Kalyan
MPCB Kalyan
Chapter 4‐4 | Sadekar Enviro Engineer Pvt. Ltd.
e) Wet Lands f) Oxidation ponds g) Oxidation ditches In modern nomenclature the aerobic processes are divided into Aerobic Suspended and
Attached Growth Processes and the Soil Biotechnology. Aerobic Suspended Growth Processes (SGP) The conventional activated sludge process (ASP) is
the best known suspended growth aerobic system and is the process most commonly used in
large, centralized WWTPs though it can also be used in small plants. Some of the process
variants of ASP are‐ a. Sequencing Batch Reactor (SBR) b. Extended Aeration c. Membrane Bioreactors (MBR) 4.3.4 Clarifier
The clarifier are recommended to remove the settlable sludge carried over from the biological reactor and to discharge the clear water into the river.
Comprehensive Study on Polluted River Stretch of Ulhas River – Downstream of Mohane, Kalyan
MPCB Kalyan
Annexure –I :1 | Sadekar Enviro Engineers Pvt. Ltd.
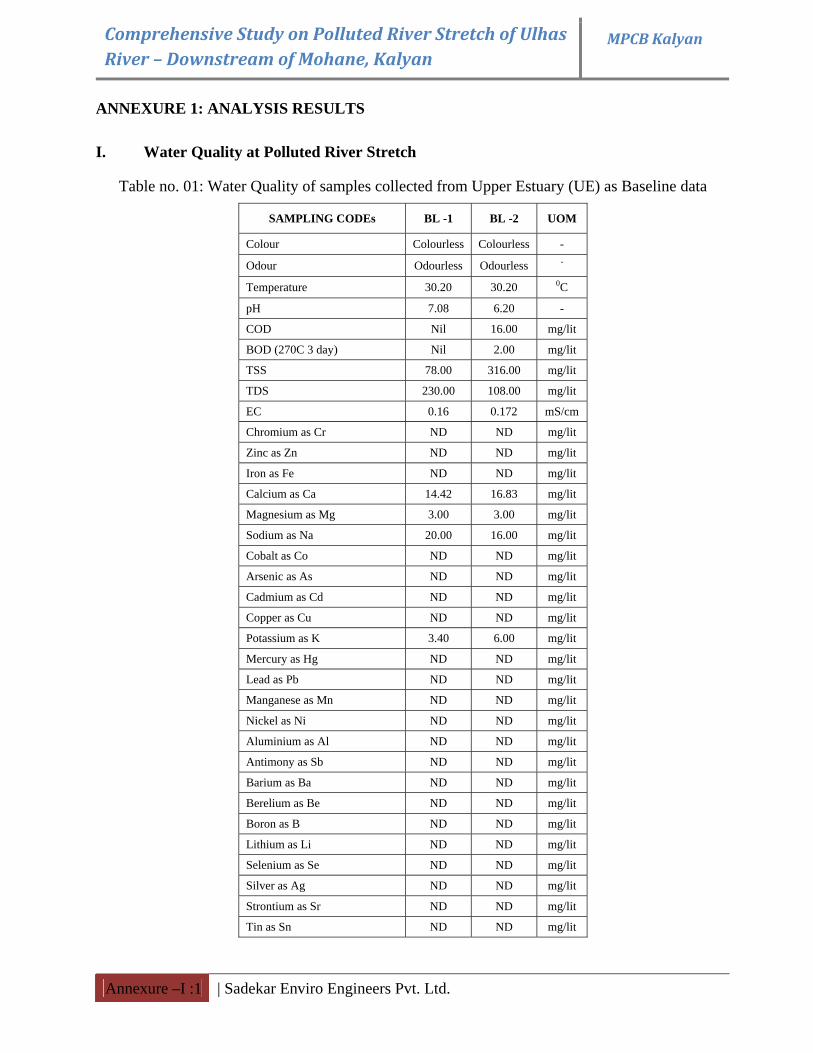
ANNEXURE 1: ANALYSIS RESULTS
I. Water Quality at Polluted River Stretch
Table no. 01: Water Quality of samples collected from Upper Estuary (UE) as Baseline data
SAMPLING CODEs BL -1 BL -2 UOM
Colour Colourless Colourless -
Odour Odourless Odourless -
Temperature 30.20 30.20 0C
pH 7.08 6.20 -
COD Nil 16.00 mg/lit
BOD (270C 3 day) Nil 2.00 mg/lit
TSS 78.00 316.00 mg/lit
TDS 230.00 108.00 mg/lit
EC 0.16 0.172 mS/cm
Chromium as Cr ND ND mg/lit
Zinc as Zn ND ND mg/lit
Iron as Fe ND ND mg/lit
Calcium as Ca 14.42 16.83 mg/lit
Magnesium as Mg 3.00 3.00 mg/lit
Sodium as Na 20.00 16.00 mg/lit
Cobalt as Co ND ND mg/lit
Arsenic as As ND ND mg/lit
Cadmium as Cd ND ND mg/lit
Copper as Cu ND ND mg/lit
Potassium as K 3.40 6.00 mg/lit
Mercury as Hg ND ND mg/lit
Lead as Pb ND ND mg/lit
Manganese as Mn ND ND mg/lit
Nickel as Ni ND ND mg/lit
Aluminium as Al ND ND mg/lit
Antimony as Sb ND ND mg/lit
Barium as Ba ND ND mg/lit
Berelium as Be ND ND mg/lit
Boron as B ND ND mg/lit
Lithium as Li ND ND mg/lit
Selenium as Se ND ND mg/lit
Silver as Ag ND ND mg/lit
Strontium as Sr ND ND mg/lit
Tin as Sn ND ND mg/lit
Comprehensive Study on Polluted River Stretch of Ulhas River – Downstream of Mohane, Kalyan
MPCB Kalyan
Annexure –I :2 | Sadekar Enviro Engineers Pvt. Ltd.
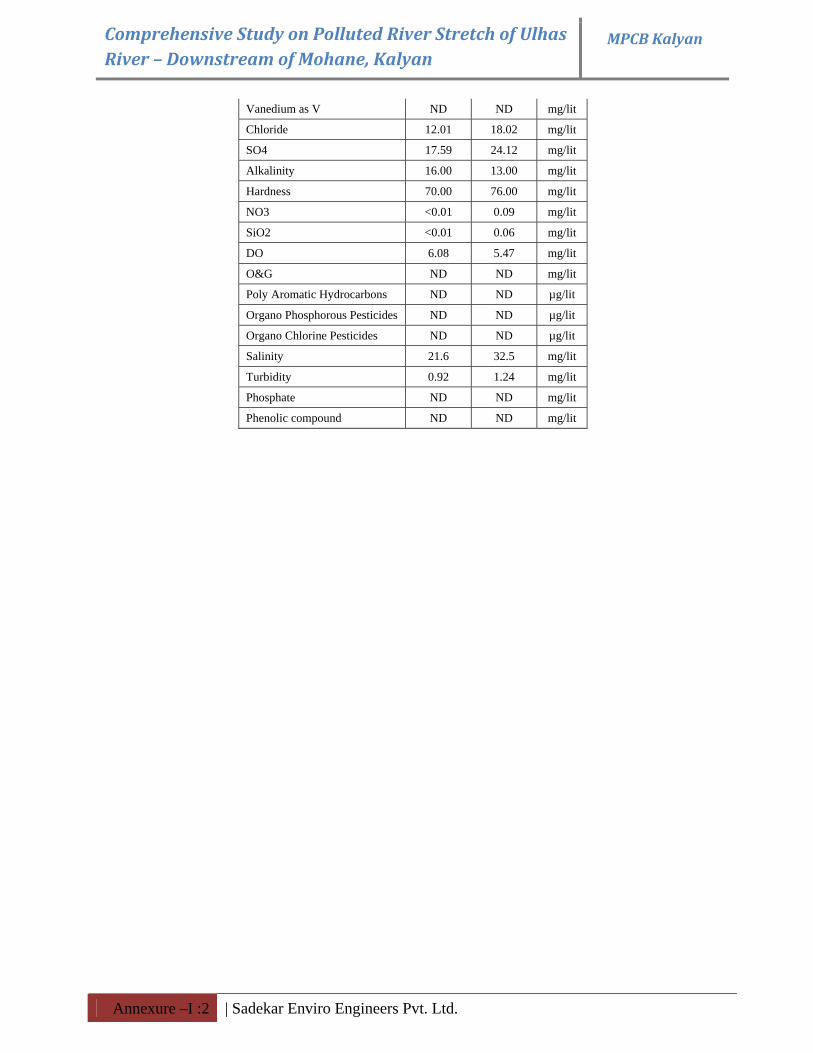
Vanedium as V ND ND mg/lit
Chloride 12.01 18.02 mg/lit
SO4 17.59 24.12 mg/lit
Alkalinity 16.00 13.00 mg/lit
Hardness 70.00 76.00 mg/lit
NO3 <0.01 0.09 mg/lit
SiO2 <0.01 0.06 mg/lit
DO 6.08 5.47 mg/lit
O&G ND ND mg/lit
Poly Aromatic Hydrocarbons ND ND µg/lit
Organo Phosphorous Pesticides ND ND µg/lit
Organo Chlorine Pesticides ND ND µg/lit
Salinity 21.6 32.5 mg/lit
Turbidity 0.92 1.24 mg/lit
Phosphate ND ND mg/lit
Phenolic compound ND ND mg/lit
Comprehensive Study on Polluted River Stretch of Ulhas River – Downstream of Mohane, Kalyan
MPCB Kalyan
Annexure –I :3 | Sadekar Enviro Engineers Pvt. Ltd.
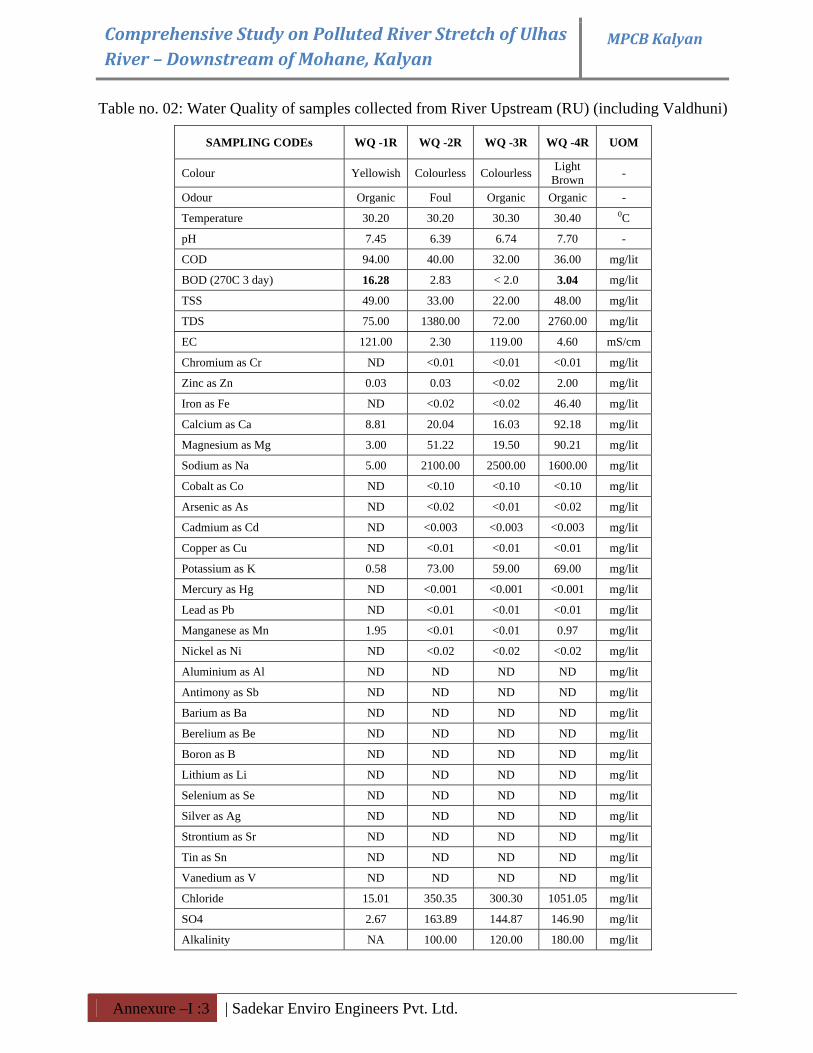
Table no. 02: Water Quality of samples collected from River Upstream (RU) (including Valdhuni)
SAMPLING CODEs WQ -1R WQ -2R WQ -3R WQ -4R UOM
Colour Yellowish Colourless Colourless Light Brown -
Odour Organic Foul Organic Organic -
Temperature 30.20 30.20 30.30 30.40 0C
pH 7.45 6.39 6.74 7.70 -
COD 94.00 40.00 32.00 36.00 mg/lit
BOD (270C 3 day) 16.28 2.83 < 2.0 3.04 mg/lit
TSS 49.00 33.00 22.00 48.00 mg/lit
TDS 75.00 1380.00 72.00 2760.00 mg/lit
EC 121.00 2.30 119.00 4.60 mS/cm
Chromium as Cr ND <0.01 <0.01 <0.01 mg/lit
Zinc as Zn 0.03 0.03 <0.02 2.00 mg/lit
Iron as Fe ND <0.02 <0.02 46.40 mg/lit
Calcium as Ca 8.81 20.04 16.03 92.18 mg/lit
Magnesium as Mg 3.00 51.22 19.50 90.21 mg/lit
Sodium as Na 5.00 2100.00 2500.00 1600.00 mg/lit
Cobalt as Co ND <0.10 <0.10 <0.10 mg/lit
Arsenic as As ND <0.02 <0.01 <0.02 mg/lit
Cadmium as Cd ND <0.003 <0.003 <0.003 mg/lit
Copper as Cu ND <0.01 <0.01 <0.01 mg/lit
Potassium as K 0.58 73.00 59.00 69.00 mg/lit
Mercury as Hg ND <0.001 <0.001 <0.001 mg/lit
Lead as Pb ND <0.01 <0.01 <0.01 mg/lit
Manganese as Mn 1.95 <0.01 <0.01 0.97 mg/lit
Nickel as Ni ND <0.02 <0.02 <0.02 mg/lit
Aluminium as Al ND ND ND ND mg/lit
Antimony as Sb ND ND ND ND mg/lit
Barium as Ba ND ND ND ND mg/lit
Berelium as Be ND ND ND ND mg/lit
Boron as B ND ND ND ND mg/lit
Lithium as Li ND ND ND ND mg/lit
Selenium as Se ND ND ND ND mg/lit
Silver as Ag ND ND ND ND mg/lit
Strontium as Sr ND ND ND ND mg/lit
Tin as Sn ND ND ND ND mg/lit
Vanedium as V ND ND ND ND mg/lit
Chloride 15.01 350.35 300.30 1051.05 mg/lit
SO4 2.67 163.89 144.87 146.90 mg/lit
Alkalinity NA 100.00 120.00 180.00 mg/lit
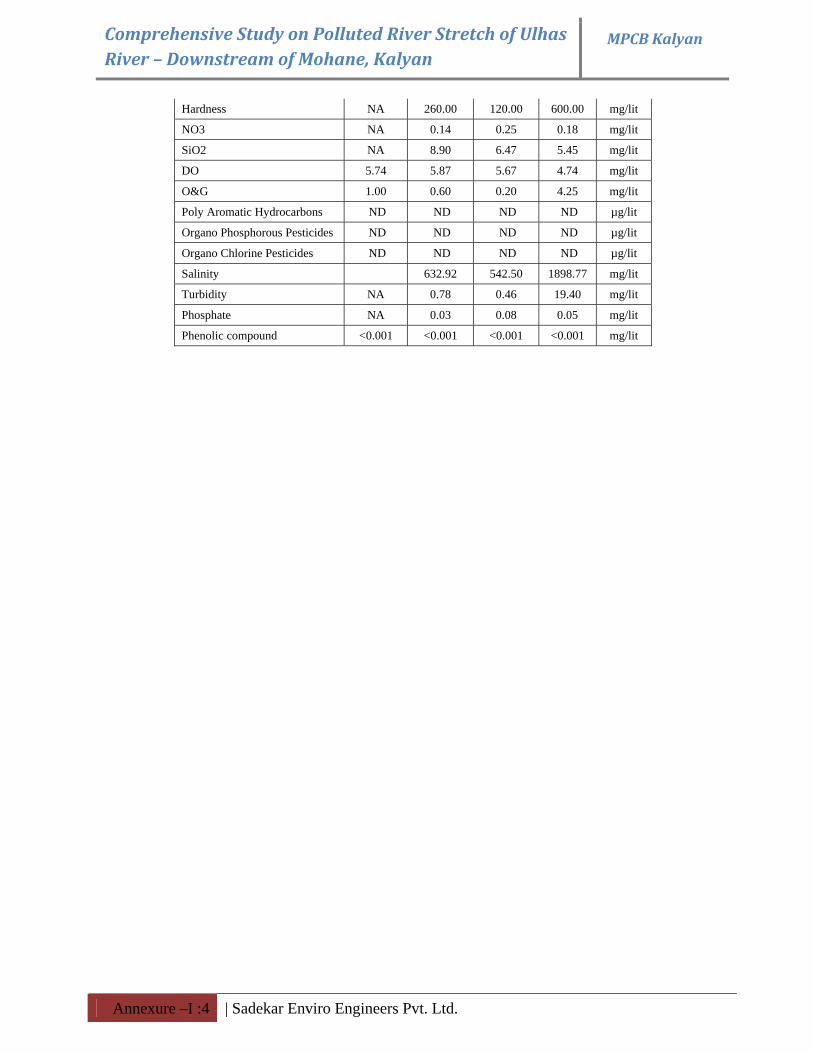
Comprehensive Study on Polluted River Stretch of Ulhas River – Downstream of Mohane, Kalyan
MPCB Kalyan
Annexure –I :4 | Sadekar Enviro Engineers Pvt. Ltd.
Hardness NA 260.00 120.00 600.00 mg/lit
NO3 NA 0.14 0.25 0.18 mg/lit
SiO2 NA 8.90 6.47 5.45 mg/lit
DO 5.74 5.87 5.67 4.74 mg/lit
O&G 1.00 0.60 0.20 4.25 mg/lit
Poly Aromatic Hydrocarbons ND ND ND ND µg/lit
Organo Phosphorous Pesticides ND ND ND ND µg/lit
Organo Chlorine Pesticides ND ND ND ND µg/lit
Salinity 632.92 542.50 1898.77 mg/lit
Turbidity NA 0.78 0.46 19.40 mg/lit
Phosphate NA 0.03 0.08 0.05 mg/lit
Phenolic compound <0.001 <0.001 <0.001 <0.001 mg/lit
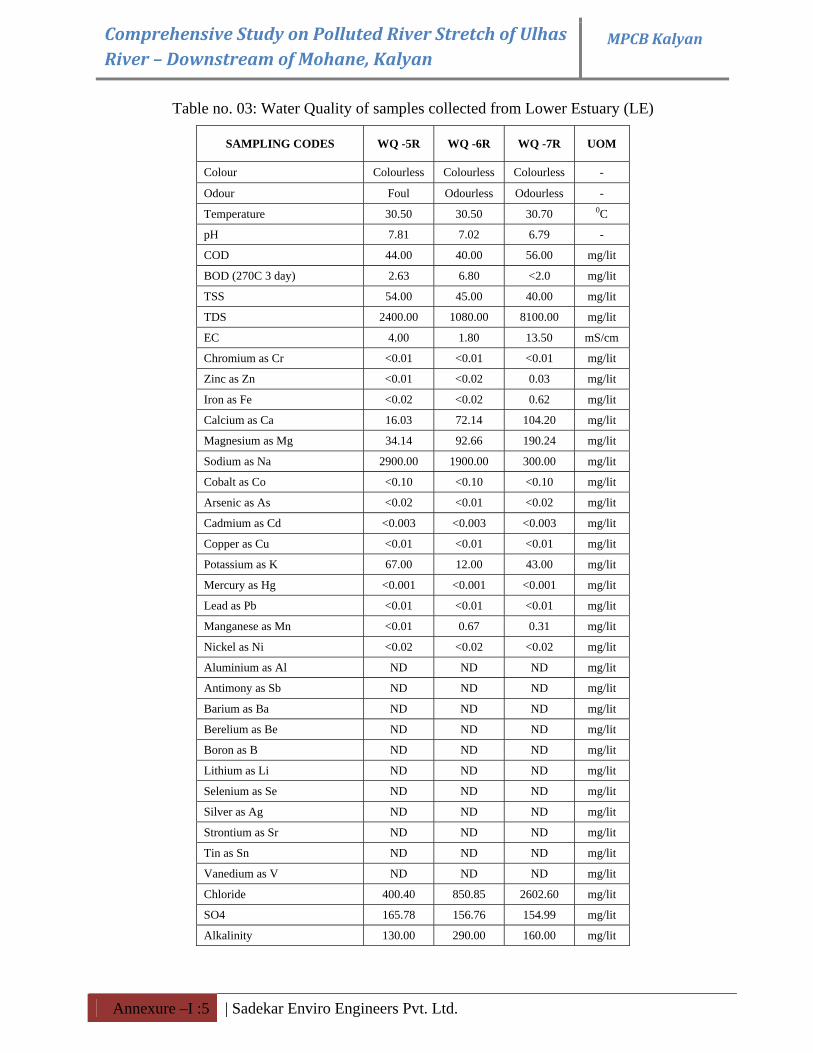
Comprehensive Study on Polluted River Stretch of Ulhas River – Downstream of Mohane, Kalyan
MPCB Kalyan
Annexure –I :5 | Sadekar Enviro Engineers Pvt. Ltd.
Table no. 03: Water Quality of samples collected from Lower Estuary (LE)
SAMPLING CODES WQ -5R WQ -6R WQ -7R UOM
Colour Colourless Colourless Colourless -
Odour Foul Odourless Odourless -
Temperature 30.50 30.50 30.70 0C
pH 7.81 7.02 6.79 -
COD 44.00 40.00 56.00 mg/lit
BOD (270C 3 day) 2.63 6.80 <2.0 mg/lit
TSS 54.00 45.00 40.00 mg/lit
TDS 2400.00 1080.00 8100.00 mg/lit
EC 4.00 1.80 13.50 mS/cm
Chromium as Cr <0.01 <0.01 <0.01 mg/lit
Zinc as Zn <0.01 <0.02 0.03 mg/lit
Iron as Fe <0.02 <0.02 0.62 mg/lit
Calcium as Ca 16.03 72.14 104.20 mg/lit
Magnesium as Mg 34.14 92.66 190.24 mg/lit
Sodium as Na 2900.00 1900.00 300.00 mg/lit
Cobalt as Co <0.10 <0.10 <0.10 mg/lit
Arsenic as As <0.02 <0.01 <0.02 mg/lit
Cadmium as Cd <0.003 <0.003 <0.003 mg/lit
Copper as Cu <0.01 <0.01 <0.01 mg/lit
Potassium as K 67.00 12.00 43.00 mg/lit
Mercury as Hg <0.001 <0.001 <0.001 mg/lit
Lead as Pb <0.01 <0.01 <0.01 mg/lit
Manganese as Mn <0.01 0.67 0.31 mg/lit
Nickel as Ni <0.02 <0.02 <0.02 mg/lit
Aluminium as Al ND ND ND mg/lit
Antimony as Sb ND ND ND mg/lit
Barium as Ba ND ND ND mg/lit
Berelium as Be ND ND ND mg/lit
Boron as B ND ND ND mg/lit
Lithium as Li ND ND ND mg/lit
Selenium as Se ND ND ND mg/lit
Silver as Ag ND ND ND mg/lit
Strontium as Sr ND ND ND mg/lit
Tin as Sn ND ND ND mg/lit
Vanedium as V ND ND ND mg/lit
Chloride 400.40 850.85 2602.60 mg/lit
SO4 165.78 156.76 154.99 mg/lit
Alkalinity 130.00 290.00 160.00 mg/lit
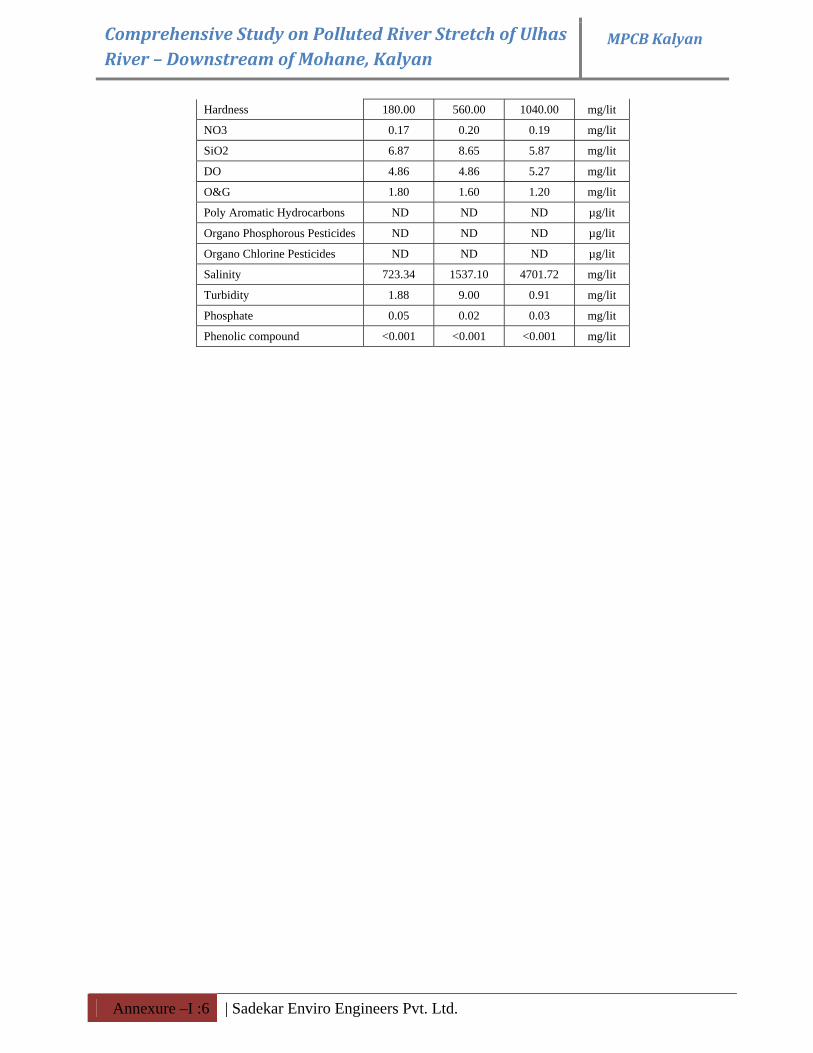
Comprehensive Study on Polluted River Stretch of Ulhas River – Downstream of Mohane, Kalyan
MPCB Kalyan
Annexure –I :6 | Sadekar Enviro Engineers Pvt. Ltd.
Hardness 180.00 560.00 1040.00 mg/lit
NO3 0.17 0.20 0.19 mg/lit
SiO2 6.87 8.65 5.87 mg/lit
DO 4.86 4.86 5.27 mg/lit
O&G 1.80 1.60 1.20 mg/lit
Poly Aromatic Hydrocarbons ND ND ND µg/lit
Organo Phosphorous Pesticides ND ND ND µg/lit
Organo Chlorine Pesticides ND ND ND µg/lit
Salinity 723.34 1537.10 4701.72 mg/lit
Turbidity 1.88 9.00 0.91 mg/lit
Phosphate 0.05 0.02 0.03 mg/lit
Phenolic compound <0.001 <0.001 <0.001 mg/lit
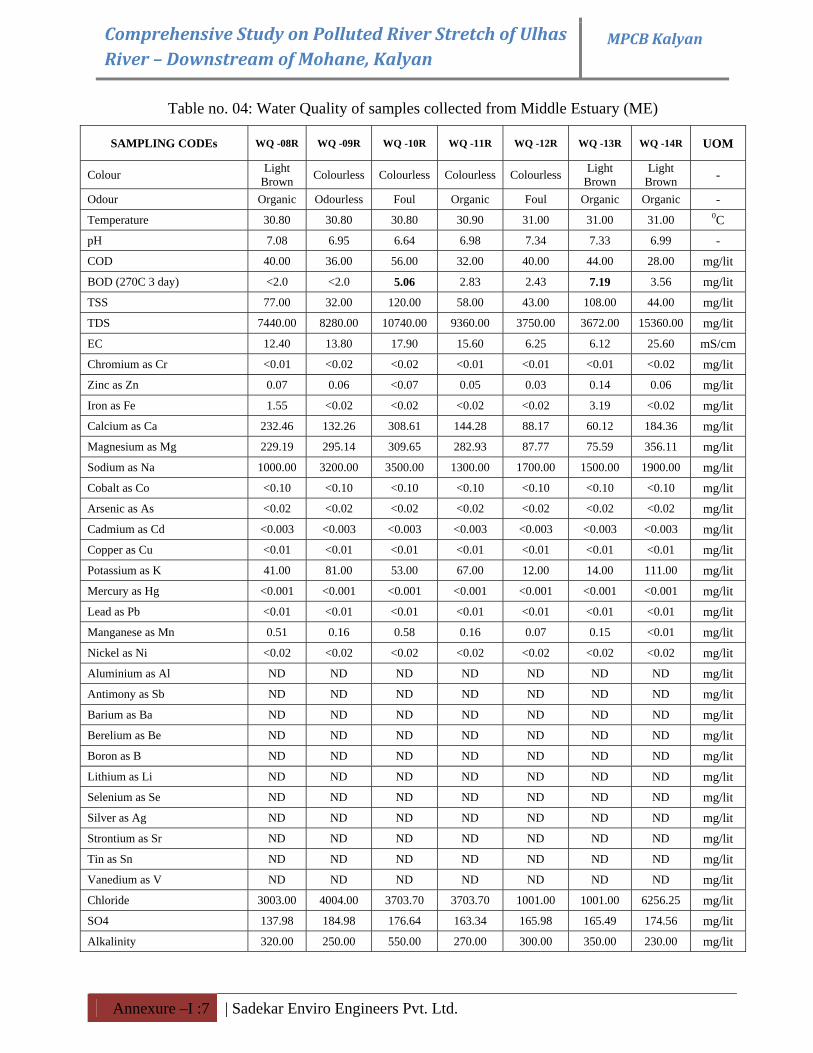
Comprehensive Study on Polluted River Stretch of Ulhas River – Downstream of Mohane, Kalyan
MPCB Kalyan
Annexure –I :7 | Sadekar Enviro Engineers Pvt. Ltd.
Table no. 04: Water Quality of samples collected from Middle Estuary (ME)
SAMPLING CODEs WQ -08R WQ -09R WQ -10R WQ -11R WQ -12R WQ -13R WQ -14R UOM
Colour Light Brown Colourless Colourless Colourless Colourless Light
Brown Light
Brown -
Odour Organic Odourless Foul Organic Foul Organic Organic - Temperature 30.80 30.80 30.80 30.90 31.00 31.00 31.00 0C pH 7.08 6.95 6.64 6.98 7.34 7.33 6.99 - COD 40.00 36.00 56.00 32.00 40.00 44.00 28.00 mg/lit BOD (270C 3 day) <2.0 <2.0 5.06 2.83 2.43 7.19 3.56 mg/lit TSS 77.00 32.00 120.00 58.00 43.00 108.00 44.00 mg/lit TDS 7440.00 8280.00 10740.00 9360.00 3750.00 3672.00 15360.00 mg/lit EC 12.40 13.80 17.90 15.60 6.25 6.12 25.60 mS/cm Chromium as Cr <0.01 <0.02 <0.02 <0.01 <0.01 <0.01 <0.02 mg/lit Zinc as Zn 0.07 0.06 <0.07 0.05 0.03 0.14 0.06 mg/lit Iron as Fe 1.55 <0.02 <0.02 <0.02 <0.02 3.19 <0.02 mg/lit Calcium as Ca 232.46 132.26 308.61 144.28 88.17 60.12 184.36 mg/lit Magnesium as Mg 229.19 295.14 309.65 282.93 87.77 75.59 356.11 mg/lit Sodium as Na 1000.00 3200.00 3500.00 1300.00 1700.00 1500.00 1900.00 mg/lit Cobalt as Co <0.10 <0.10 <0.10 <0.10 <0.10 <0.10 <0.10 mg/lit Arsenic as As <0.02 <0.02 <0.02 <0.02 <0.02 <0.02 <0.02 mg/lit Cadmium as Cd <0.003 <0.003 <0.003 <0.003 <0.003 <0.003 <0.003 mg/lit Copper as Cu <0.01 <0.01 <0.01 <0.01 <0.01 <0.01 <0.01 mg/lit Potassium as K 41.00 81.00 53.00 67.00 12.00 14.00 111.00 mg/lit Mercury as Hg <0.001 <0.001 <0.001 <0.001 <0.001 <0.001 <0.001 mg/lit Lead as Pb <0.01 <0.01 <0.01 <0.01 <0.01 <0.01 <0.01 mg/lit Manganese as Mn 0.51 0.16 0.58 0.16 0.07 0.15 <0.01 mg/lit Nickel as Ni <0.02 <0.02 <0.02 <0.02 <0.02 <0.02 <0.02 mg/lit Aluminium as Al ND ND ND ND ND ND ND mg/lit Antimony as Sb ND ND ND ND ND ND ND mg/lit Barium as Ba ND ND ND ND ND ND ND mg/lit Berelium as Be ND ND ND ND ND ND ND mg/lit Boron as B ND ND ND ND ND ND ND mg/lit Lithium as Li ND ND ND ND ND ND ND mg/lit Selenium as Se ND ND ND ND ND ND ND mg/lit Silver as Ag ND ND ND ND ND ND ND mg/lit Strontium as Sr ND ND ND ND ND ND ND mg/lit Tin as Sn ND ND ND ND ND ND ND mg/lit Vanedium as V ND ND ND ND ND ND ND mg/lit Chloride 3003.00 4004.00 3703.70 3703.70 1001.00 1001.00 6256.25 mg/lit SO4 137.98 184.98 176.64 163.34 165.98 165.49 174.56 mg/lit Alkalinity 320.00 250.00 550.00 270.00 300.00 350.00 230.00 mg/lit
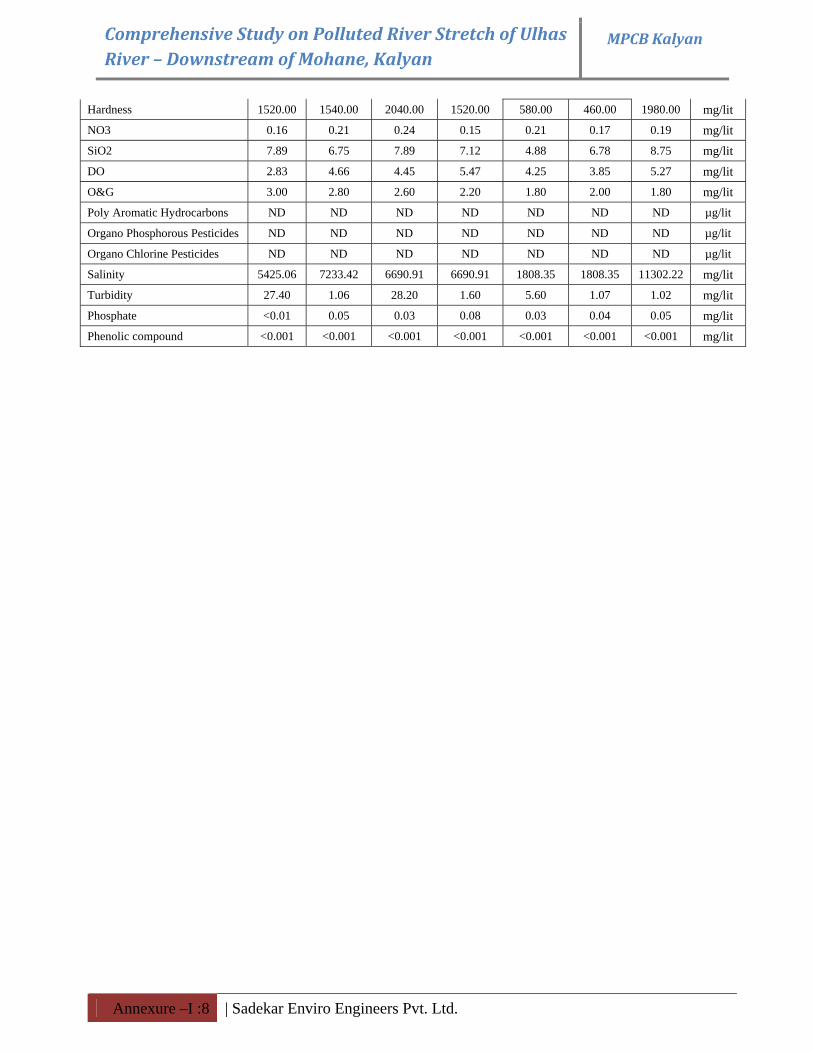
Comprehensive Study on Polluted River Stretch of Ulhas River – Downstream of Mohane, Kalyan
MPCB Kalyan
Annexure –I :8 | Sadekar Enviro Engineers Pvt. Ltd.
Hardness 1520.00 1540.00 2040.00 1520.00 580.00 460.00 1980.00 mg/lit NO3 0.16 0.21 0.24 0.15 0.21 0.17 0.19 mg/lit SiO2 7.89 6.75 7.89 7.12 4.88 6.78 8.75 mg/lit DO 2.83 4.66 4.45 5.47 4.25 3.85 5.27 mg/lit O&G 3.00 2.80 2.60 2.20 1.80 2.00 1.80 mg/lit Poly Aromatic Hydrocarbons ND ND ND ND ND ND ND µg/lit
Organo Phosphorous Pesticides ND ND ND ND ND ND ND µg/lit
Organo Chlorine Pesticides ND ND ND ND ND ND ND µg/lit
Salinity 5425.06 7233.42 6690.91 6690.91 1808.35 1808.35 11302.22 mg/lit Turbidity 27.40 1.06 28.20 1.60 5.60 1.07 1.02 mg/lit Phosphate <0.01 0.05 0.03 0.08 0.03 0.04 0.05 mg/lit Phenolic compound <0.001 <0.001 <0.001 <0.001 <0.001 <0.001 <0.001 mg/lit
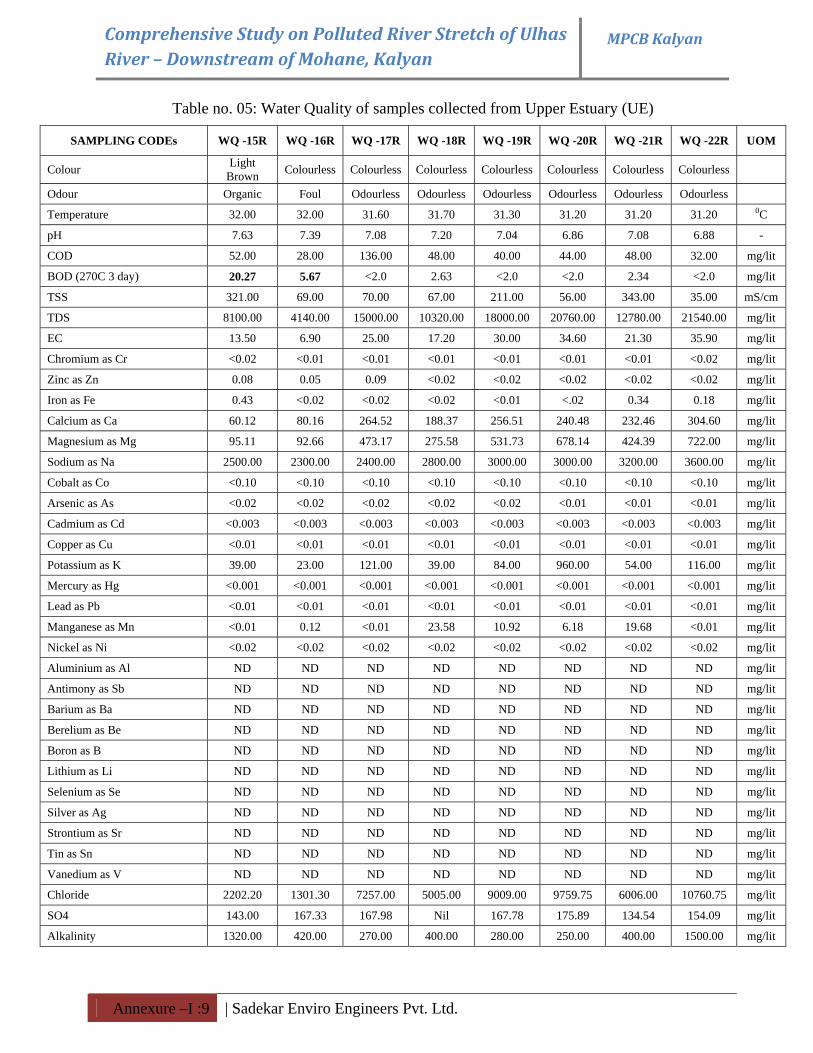
Comprehensive Study on Polluted River Stretch of Ulhas River – Downstream of Mohane, Kalyan
MPCB Kalyan
Annexure –I :9 | Sadekar Enviro Engineers Pvt. Ltd.
Table no. 05: Water Quality of samples collected from Upper Estuary (UE)
SAMPLING CODEs WQ -15R WQ -16R WQ -17R WQ -18R WQ -19R WQ -20R WQ -21R WQ -22R UOM
Colour Light Brown Colourless Colourless Colourless Colourless Colourless Colourless Colourless
Odour Organic Foul Odourless Odourless Odourless Odourless Odourless Odourless
Temperature 32.00 32.00 31.60 31.70 31.30 31.20 31.20 31.20 0C
pH 7.63 7.39 7.08 7.20 7.04 6.86 7.08 6.88 -
COD 52.00 28.00 136.00 48.00 40.00 44.00 48.00 32.00 mg/lit
BOD (270C 3 day) 20.27 5.67 <2.0 2.63 <2.0 <2.0 2.34 <2.0 mg/lit
TSS 321.00 69.00 70.00 67.00 211.00 56.00 343.00 35.00 mS/cm
TDS 8100.00 4140.00 15000.00 10320.00 18000.00 20760.00 12780.00 21540.00 mg/lit
EC 13.50 6.90 25.00 17.20 30.00 34.60 21.30 35.90 mg/lit
Chromium as Cr <0.02 <0.01 <0.01 <0.01 <0.01 <0.01 <0.01 <0.02 mg/lit
Zinc as Zn 0.08 0.05 0.09 <0.02 <0.02 <0.02 <0.02 <0.02 mg/lit
Iron as Fe 0.43 <0.02 <0.02 <0.02 <0.01 <.02 0.34 0.18 mg/lit
Calcium as Ca 60.12 80.16 264.52 188.37 256.51 240.48 232.46 304.60 mg/lit
Magnesium as Mg 95.11 92.66 473.17 275.58 531.73 678.14 424.39 722.00 mg/lit
Sodium as Na 2500.00 2300.00 2400.00 2800.00 3000.00 3000.00 3200.00 3600.00 mg/lit
Cobalt as Co <0.10 <0.10 <0.10 <0.10 <0.10 <0.10 <0.10 <0.10 mg/lit
Arsenic as As <0.02 <0.02 <0.02 <0.02 <0.02 <0.01 <0.01 <0.01 mg/lit
Cadmium as Cd <0.003 <0.003 <0.003 <0.003 <0.003 <0.003 <0.003 <0.003 mg/lit
Copper as Cu <0.01 <0.01 <0.01 <0.01 <0.01 <0.01 <0.01 <0.01 mg/lit
Potassium as K 39.00 23.00 121.00 39.00 84.00 960.00 54.00 116.00 mg/lit
Mercury as Hg <0.001 <0.001 <0.001 <0.001 <0.001 <0.001 <0.001 <0.001 mg/lit
Lead as Pb <0.01 <0.01 <0.01 <0.01 <0.01 <0.01 <0.01 <0.01 mg/lit
Manganese as Mn <0.01 0.12 <0.01 23.58 10.92 6.18 19.68 <0.01 mg/lit
Nickel as Ni <0.02 <0.02 <0.02 <0.02 <0.02 <0.02 <0.02 <0.02 mg/lit
Aluminium as Al ND ND ND ND ND ND ND ND mg/lit
Antimony as Sb ND ND ND ND ND ND ND ND mg/lit
Barium as Ba ND ND ND ND ND ND ND ND mg/lit
Berelium as Be ND ND ND ND ND ND ND ND mg/lit
Boron as B ND ND ND ND ND ND ND ND mg/lit
Lithium as Li ND ND ND ND ND ND ND ND mg/lit
Selenium as Se ND ND ND ND ND ND ND ND mg/lit
Silver as Ag ND ND ND ND ND ND ND ND mg/lit
Strontium as Sr ND ND ND ND ND ND ND ND mg/lit
Tin as Sn ND ND ND ND ND ND ND ND mg/lit
Vanedium as V ND ND ND ND ND ND ND ND mg/lit
Chloride 2202.20 1301.30 7257.00 5005.00 9009.00 9759.75 6006.00 10760.75 mg/lit
SO4 143.00 167.33 167.98 Nil 167.78 175.89 134.54 154.09 mg/lit
Alkalinity 1320.00 420.00 270.00 400.00 280.00 250.00 400.00 1500.00 mg/lit
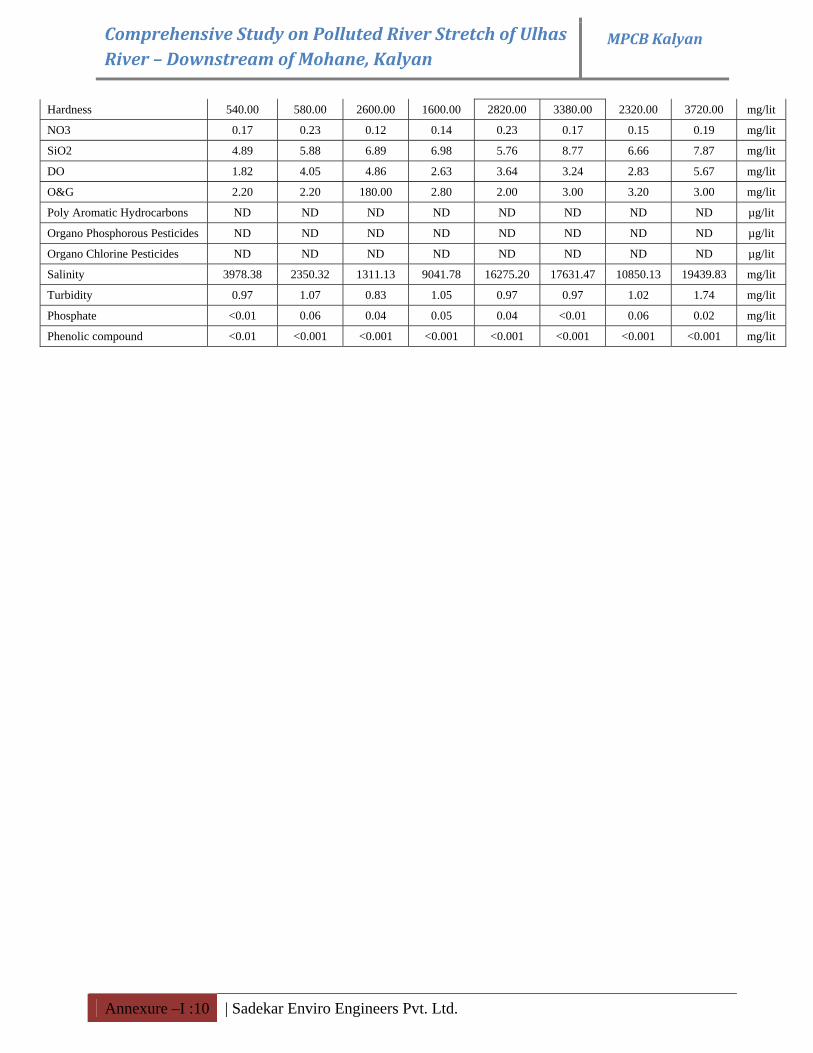
Comprehensive Study on Polluted River Stretch of Ulhas River – Downstream of Mohane, Kalyan
MPCB Kalyan
Annexure –I :10 | Sadekar Enviro Engineers Pvt. Ltd.
Hardness 540.00 580.00 2600.00 1600.00 2820.00 3380.00 2320.00 3720.00 mg/lit
NO3 0.17 0.23 0.12 0.14 0.23 0.17 0.15 0.19 mg/lit
SiO2 4.89 5.88 6.89 6.98 5.76 8.77 6.66 7.87 mg/lit
DO 1.82 4.05 4.86 2.63 3.64 3.24 2.83 5.67 mg/lit
O&G 2.20 2.20 180.00 2.80 2.00 3.00 3.20 3.00 mg/lit
Poly Aromatic Hydrocarbons ND ND ND ND ND ND ND ND µg/lit
Organo Phosphorous Pesticides ND ND ND ND ND ND ND ND µg/lit
Organo Chlorine Pesticides ND ND ND ND ND ND ND ND µg/lit
Salinity 3978.38 2350.32 1311.13 9041.78 16275.20 17631.47 10850.13 19439.83 mg/lit
Turbidity 0.97 1.07 0.83 1.05 0.97 0.97 1.02 1.74 mg/lit
Phosphate <0.01 0.06 0.04 0.05 0.04 <0.01 0.06 0.02 mg/lit
Phenolic compound <0.01 <0.001 <0.001 <0.001 <0.001 <0.001 <0.001 <0.001 mg/lit
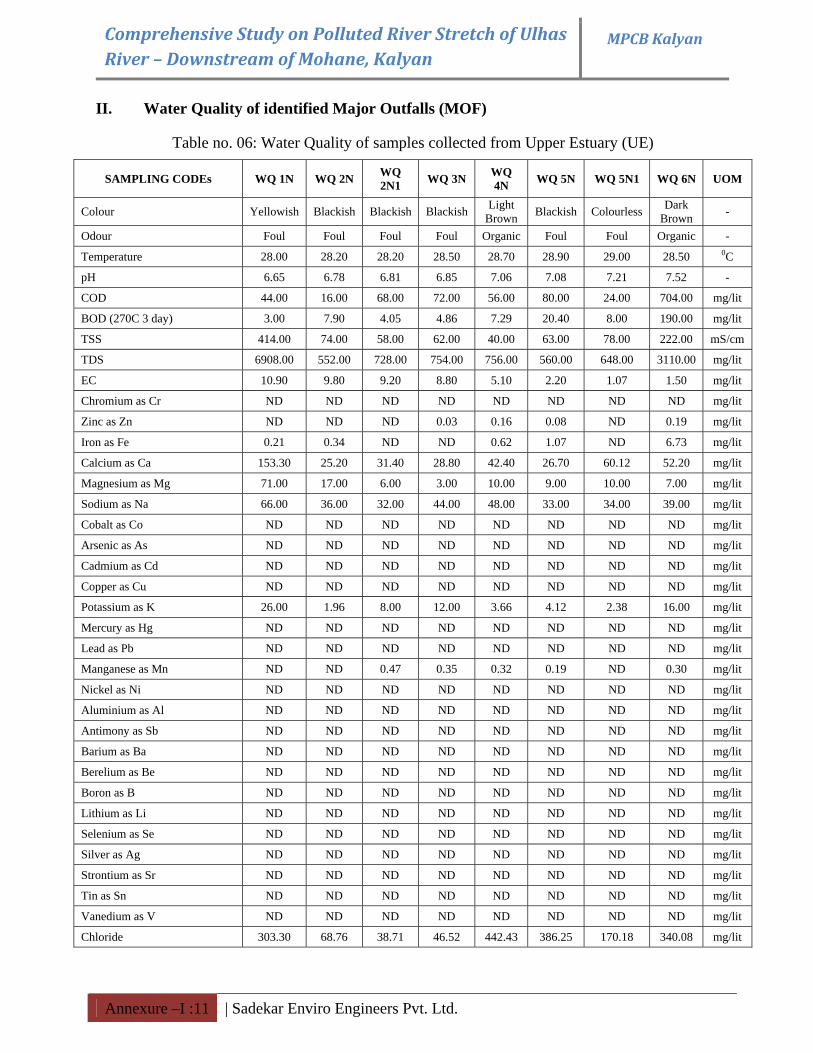
Comprehensive Study on Polluted River Stretch of Ulhas River – Downstream of Mohane, Kalyan
MPCB Kalyan
Annexure –I :11 | Sadekar Enviro Engineers Pvt. Ltd.
II. Water Quality of identified Major Outfalls (MOF)
Table no. 06: Water Quality of samples collected from Upper Estuary (UE)
SAMPLING CODEs WQ 1N WQ 2N WQ 2N1 WQ 3N WQ
4N WQ 5N WQ 5N1 WQ 6N UOM
Colour Yellowish Blackish Blackish Blackish Light Brown Blackish Colourless Dark
Brown -
Odour Foul Foul Foul Foul Organic Foul Foul Organic -
Temperature 28.00 28.20 28.20 28.50 28.70 28.90 29.00 28.50 0C
pH 6.65 6.78 6.81 6.85 7.06 7.08 7.21 7.52 -
COD 44.00 16.00 68.00 72.00 56.00 80.00 24.00 704.00 mg/lit
BOD (270C 3 day) 3.00 7.90 4.05 4.86 7.29 20.40 8.00 190.00 mg/lit
TSS 414.00 74.00 58.00 62.00 40.00 63.00 78.00 222.00 mS/cm
TDS 6908.00 552.00 728.00 754.00 756.00 560.00 648.00 3110.00 mg/lit
EC 10.90 9.80 9.20 8.80 5.10 2.20 1.07 1.50 mg/lit
Chromium as Cr ND ND ND ND ND ND ND ND mg/lit
Zinc as Zn ND ND ND 0.03 0.16 0.08 ND 0.19 mg/lit
Iron as Fe 0.21 0.34 ND ND 0.62 1.07 ND 6.73 mg/lit
Calcium as Ca 153.30 25.20 31.40 28.80 42.40 26.70 60.12 52.20 mg/lit
Magnesium as Mg 71.00 17.00 6.00 3.00 10.00 9.00 10.00 7.00 mg/lit
Sodium as Na 66.00 36.00 32.00 44.00 48.00 33.00 34.00 39.00 mg/lit
Cobalt as Co ND ND ND ND ND ND ND ND mg/lit
Arsenic as As ND ND ND ND ND ND ND ND mg/lit
Cadmium as Cd ND ND ND ND ND ND ND ND mg/lit
Copper as Cu ND ND ND ND ND ND ND ND mg/lit
Potassium as K 26.00 1.96 8.00 12.00 3.66 4.12 2.38 16.00 mg/lit
Mercury as Hg ND ND ND ND ND ND ND ND mg/lit
Lead as Pb ND ND ND ND ND ND ND ND mg/lit
Manganese as Mn ND ND 0.47 0.35 0.32 0.19 ND 0.30 mg/lit
Nickel as Ni ND ND ND ND ND ND ND ND mg/lit
Aluminium as Al ND ND ND ND ND ND ND ND mg/lit
Antimony as Sb ND ND ND ND ND ND ND ND mg/lit
Barium as Ba ND ND ND ND ND ND ND ND mg/lit
Berelium as Be ND ND ND ND ND ND ND ND mg/lit
Boron as B ND ND ND ND ND ND ND ND mg/lit
Lithium as Li ND ND ND ND ND ND ND ND mg/lit
Selenium as Se ND ND ND ND ND ND ND ND mg/lit
Silver as Ag ND ND ND ND ND ND ND ND mg/lit
Strontium as Sr ND ND ND ND ND ND ND ND mg/lit
Tin as Sn ND ND ND ND ND ND ND ND mg/lit
Vanedium as V ND ND ND ND ND ND ND ND mg/lit
Chloride 303.30 68.76 38.71 46.52 442.43 386.25 170.18 340.08 mg/lit
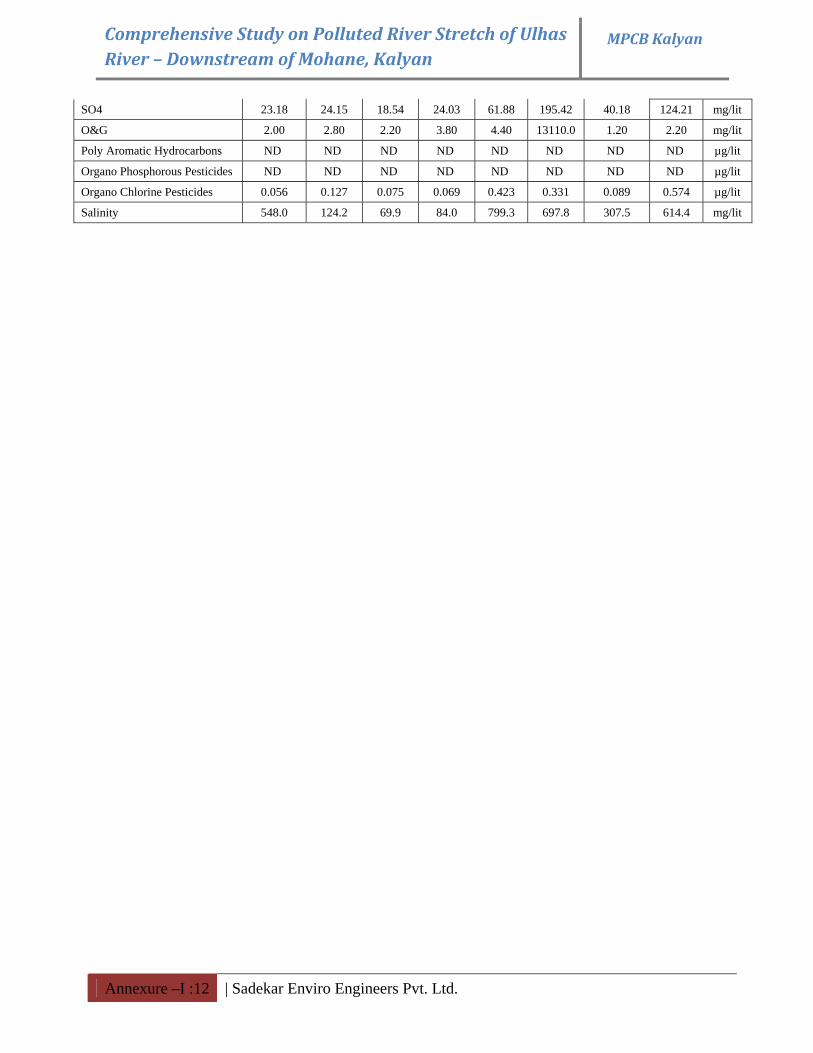
Comprehensive Study on Polluted River Stretch of Ulhas River – Downstream of Mohane, Kalyan
MPCB Kalyan
Annexure –I :12 | Sadekar Enviro Engineers Pvt. Ltd.
SO4 23.18 24.15 18.54 24.03 61.88 195.42 40.18 124.21 mg/lit
O&G 2.00 2.80 2.20 3.80 4.40 13110.0 1.20 2.20 mg/lit
Poly Aromatic Hydrocarbons ND ND ND ND ND ND ND ND µg/lit
Organo Phosphorous Pesticides ND ND ND ND ND ND ND ND µg/lit
Organo Chlorine Pesticides 0.056 0.127 0.075 0.069 0.423 0.331 0.089 0.574 µg/lit
Salinity 548.0 124.2 69.9 84.0 799.3 697.8 307.5 614.4 mg/lit
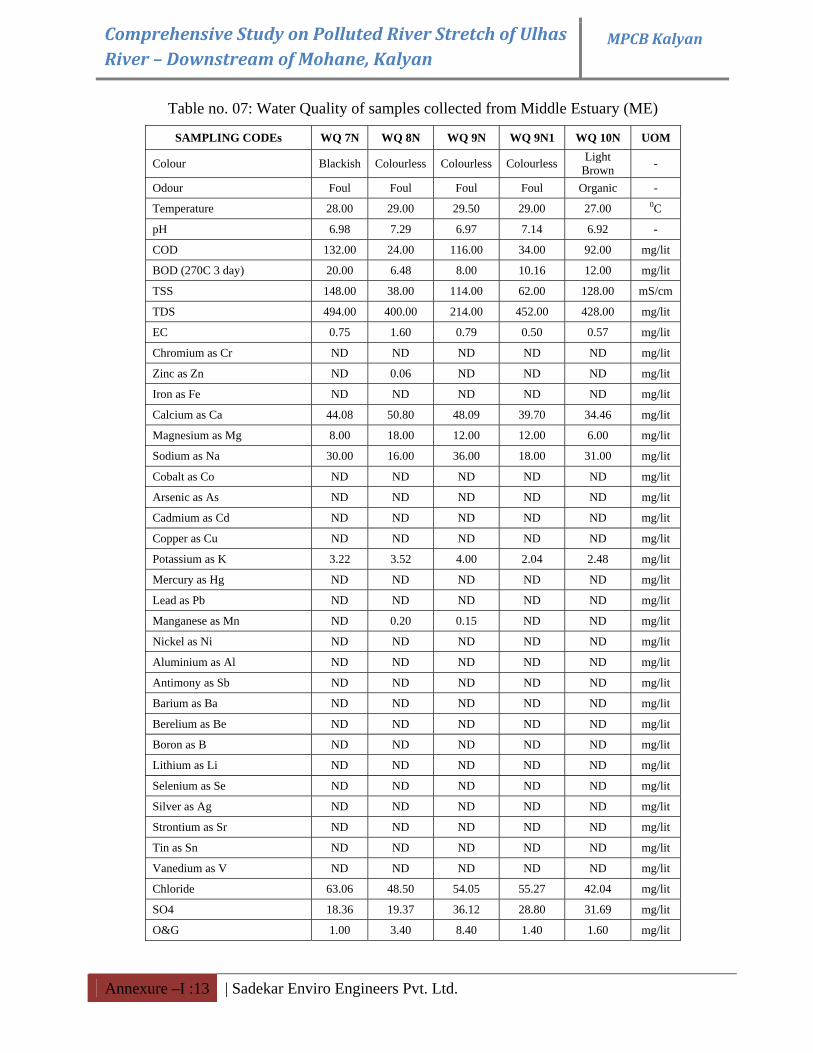
Comprehensive Study on Polluted River Stretch of Ulhas River – Downstream of Mohane, Kalyan
MPCB Kalyan
Annexure –I :13 | Sadekar Enviro Engineers Pvt. Ltd.
Table no. 07: Water Quality of samples collected from Middle Estuary (ME)
SAMPLING CODEs WQ 7N WQ 8N WQ 9N WQ 9N1 WQ 10N UOM
Colour Blackish Colourless Colourless Colourless Light Brown -
Odour Foul Foul Foul Foul Organic -
Temperature 28.00 29.00 29.50 29.00 27.00 0C
pH 6.98 7.29 6.97 7.14 6.92 -
COD 132.00 24.00 116.00 34.00 92.00 mg/lit
BOD (270C 3 day) 20.00 6.48 8.00 10.16 12.00 mg/lit
TSS 148.00 38.00 114.00 62.00 128.00 mS/cm
TDS 494.00 400.00 214.00 452.00 428.00 mg/lit
EC 0.75 1.60 0.79 0.50 0.57 mg/lit
Chromium as Cr ND ND ND ND ND mg/lit
Zinc as Zn ND 0.06 ND ND ND mg/lit
Iron as Fe ND ND ND ND ND mg/lit
Calcium as Ca 44.08 50.80 48.09 39.70 34.46 mg/lit
Magnesium as Mg 8.00 18.00 12.00 12.00 6.00 mg/lit
Sodium as Na 30.00 16.00 36.00 18.00 31.00 mg/lit
Cobalt as Co ND ND ND ND ND mg/lit
Arsenic as As ND ND ND ND ND mg/lit
Cadmium as Cd ND ND ND ND ND mg/lit
Copper as Cu ND ND ND ND ND mg/lit
Potassium as K 3.22 3.52 4.00 2.04 2.48 mg/lit
Mercury as Hg ND ND ND ND ND mg/lit
Lead as Pb ND ND ND ND ND mg/lit
Manganese as Mn ND 0.20 0.15 ND ND mg/lit
Nickel as Ni ND ND ND ND ND mg/lit
Aluminium as Al ND ND ND ND ND mg/lit
Antimony as Sb ND ND ND ND ND mg/lit
Barium as Ba ND ND ND ND ND mg/lit
Berelium as Be ND ND ND ND ND mg/lit
Boron as B ND ND ND ND ND mg/lit
Lithium as Li ND ND ND ND ND mg/lit
Selenium as Se ND ND ND ND ND mg/lit
Silver as Ag ND ND ND ND ND mg/lit
Strontium as Sr ND ND ND ND ND mg/lit
Tin as Sn ND ND ND ND ND mg/lit
Vanedium as V ND ND ND ND ND mg/lit
Chloride 63.06 48.50 54.05 55.27 42.04 mg/lit
SO4 18.36 19.37 36.12 28.80 31.69 mg/lit
O&G 1.00 3.40 8.40 1.40 1.60 mg/lit
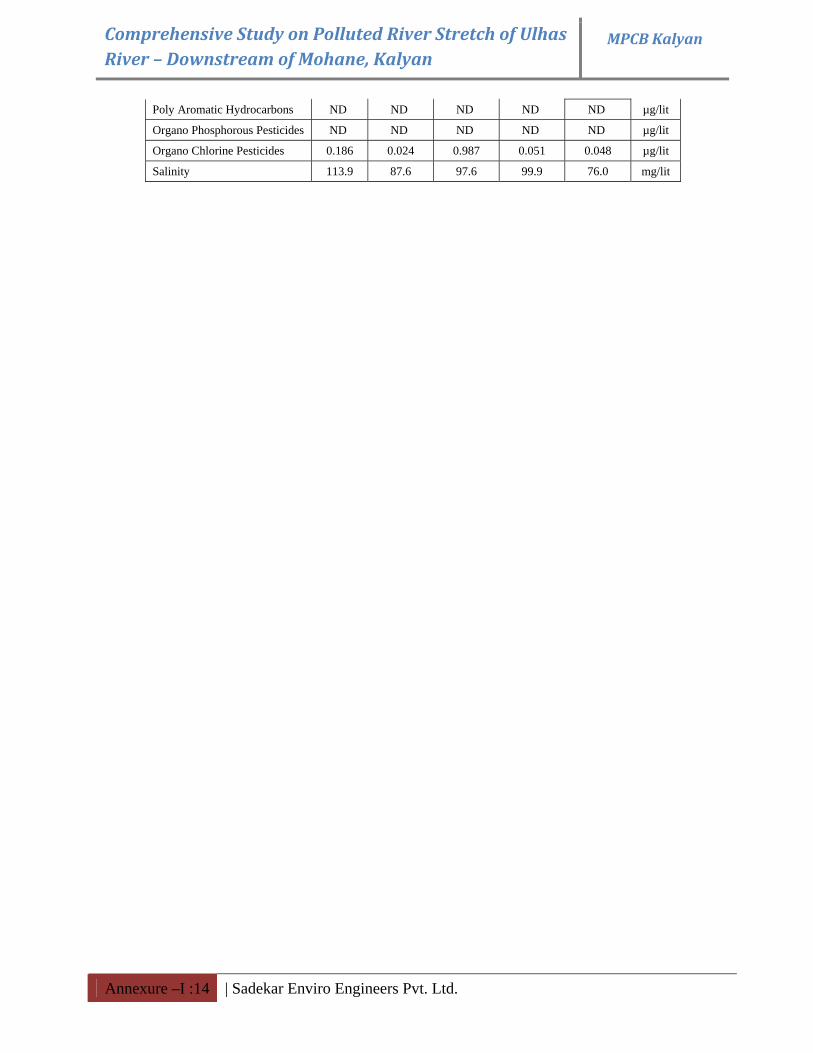
Comprehensive Study on Polluted River Stretch of Ulhas River – Downstream of Mohane, Kalyan
MPCB Kalyan
Annexure –I :14 | Sadekar Enviro Engineers Pvt. Ltd.
Poly Aromatic Hydrocarbons ND ND ND ND ND µg/lit
Organo Phosphorous Pesticides ND ND ND ND ND µg/lit
Organo Chlorine Pesticides 0.186 0.024 0.987 0.051 0.048 µg/lit
Salinity 113.9 87.6 97.6 99.9 76.0 mg/lit
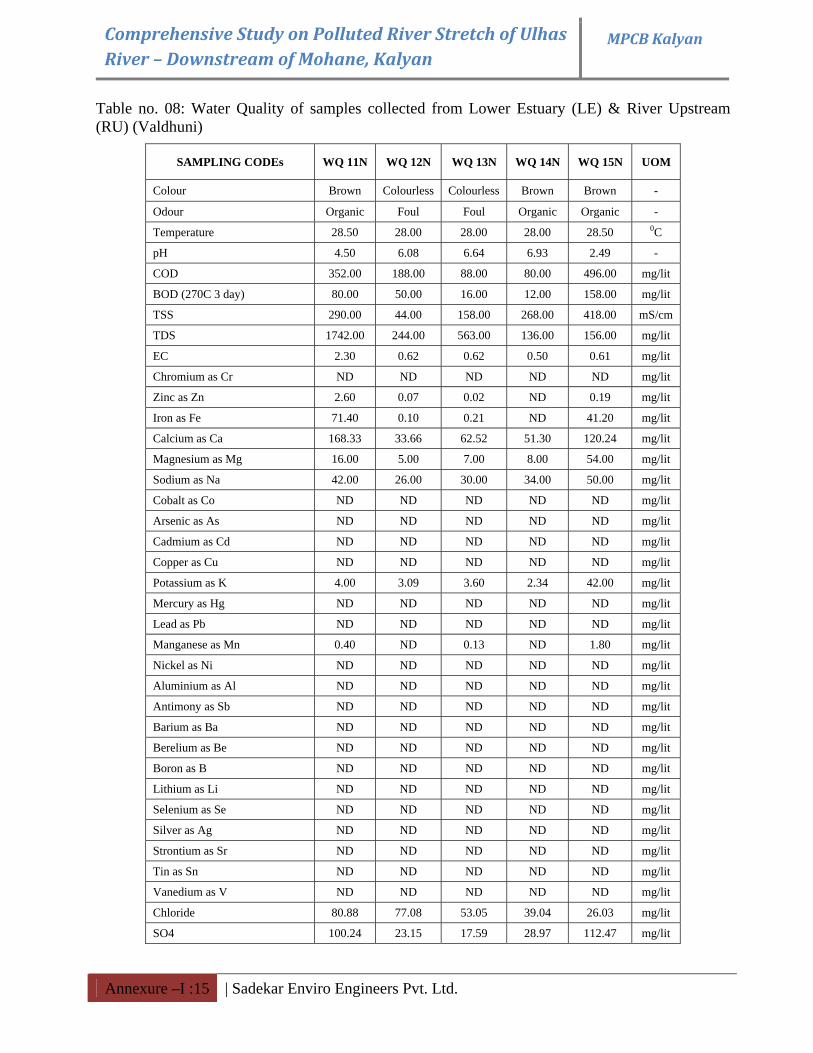
Comprehensive Study on Polluted River Stretch of Ulhas River – Downstream of Mohane, Kalyan
MPCB Kalyan
Annexure –I :15 | Sadekar Enviro Engineers Pvt. Ltd.
Table no. 08: Water Quality of samples collected from Lower Estuary (LE) & River Upstream (RU) (Valdhuni)
SAMPLING CODEs WQ 11N WQ 12N WQ 13N WQ 14N WQ 15N UOM
Colour Brown Colourless Colourless Brown Brown -
Odour Organic Foul Foul Organic Organic -
Temperature 28.50 28.00 28.00 28.00 28.50 0C
pH 4.50 6.08 6.64 6.93 2.49 -
COD 352.00 188.00 88.00 80.00 496.00 mg/lit
BOD (270C 3 day) 80.00 50.00 16.00 12.00 158.00 mg/lit
TSS 290.00 44.00 158.00 268.00 418.00 mS/cm
TDS 1742.00 244.00 563.00 136.00 156.00 mg/lit
EC 2.30 0.62 0.62 0.50 0.61 mg/lit
Chromium as Cr ND ND ND ND ND mg/lit
Zinc as Zn 2.60 0.07 0.02 ND 0.19 mg/lit
Iron as Fe 71.40 0.10 0.21 ND 41.20 mg/lit
Calcium as Ca 168.33 33.66 62.52 51.30 120.24 mg/lit
Magnesium as Mg 16.00 5.00 7.00 8.00 54.00 mg/lit
Sodium as Na 42.00 26.00 30.00 34.00 50.00 mg/lit
Cobalt as Co ND ND ND ND ND mg/lit
Arsenic as As ND ND ND ND ND mg/lit
Cadmium as Cd ND ND ND ND ND mg/lit
Copper as Cu ND ND ND ND ND mg/lit
Potassium as K 4.00 3.09 3.60 2.34 42.00 mg/lit
Mercury as Hg ND ND ND ND ND mg/lit
Lead as Pb ND ND ND ND ND mg/lit
Manganese as Mn 0.40 ND 0.13 ND 1.80 mg/lit
Nickel as Ni ND ND ND ND ND mg/lit
Aluminium as Al ND ND ND ND ND mg/lit
Antimony as Sb ND ND ND ND ND mg/lit
Barium as Ba ND ND ND ND ND mg/lit
Berelium as Be ND ND ND ND ND mg/lit
Boron as B ND ND ND ND ND mg/lit
Lithium as Li ND ND ND ND ND mg/lit
Selenium as Se ND ND ND ND ND mg/lit
Silver as Ag ND ND ND ND ND mg/lit
Strontium as Sr ND ND ND ND ND mg/lit
Tin as Sn ND ND ND ND ND mg/lit
Vanedium as V ND ND ND ND ND mg/lit
Chloride 80.88 77.08 53.05 39.04 26.03 mg/lit
SO4 100.24 23.15 17.59 28.97 112.47 mg/lit
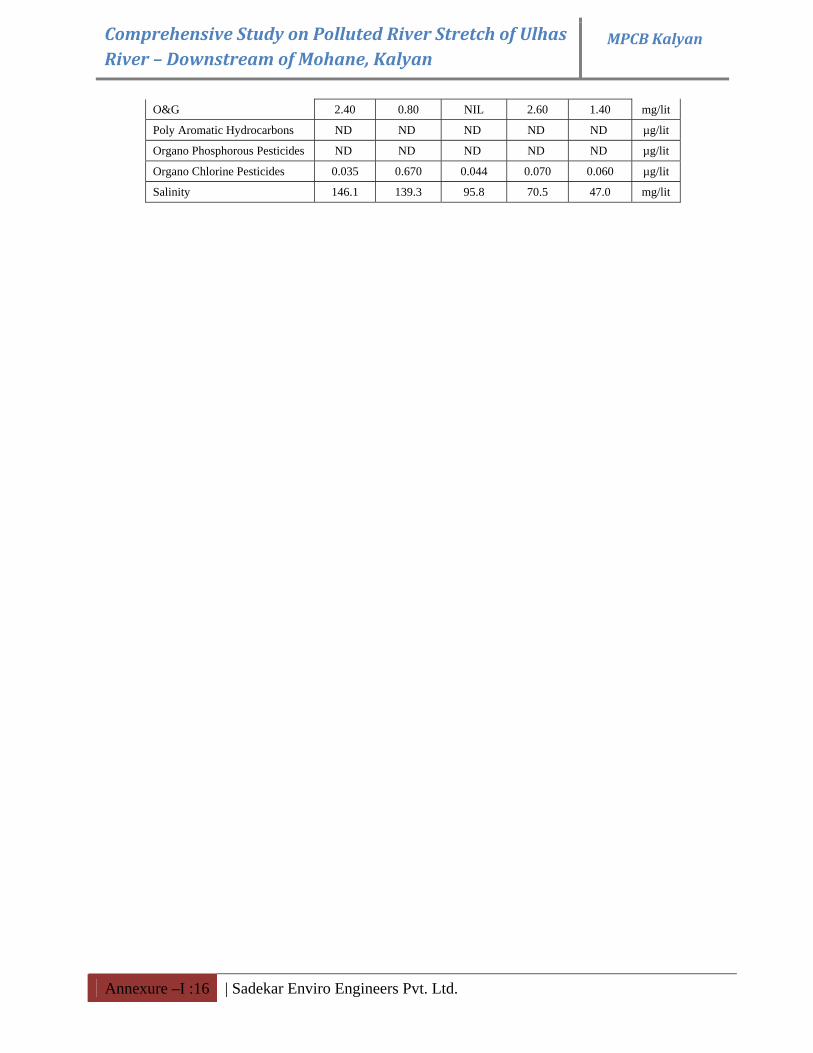
Comprehensive Study on Polluted River Stretch of Ulhas River – Downstream of Mohane, Kalyan
MPCB Kalyan
Annexure –I :16 | Sadekar Enviro Engineers Pvt. Ltd.
O&G 2.40 0.80 NIL 2.60 1.40 mg/lit
Poly Aromatic Hydrocarbons ND ND ND ND ND µg/lit
Organo Phosphorous Pesticides ND ND ND ND ND µg/lit
Organo Chlorine Pesticides 0.035 0.670 0.044 0.070 0.060 µg/lit
Salinity 146.1 139.3 95.8 70.5 47.0 mg/lit
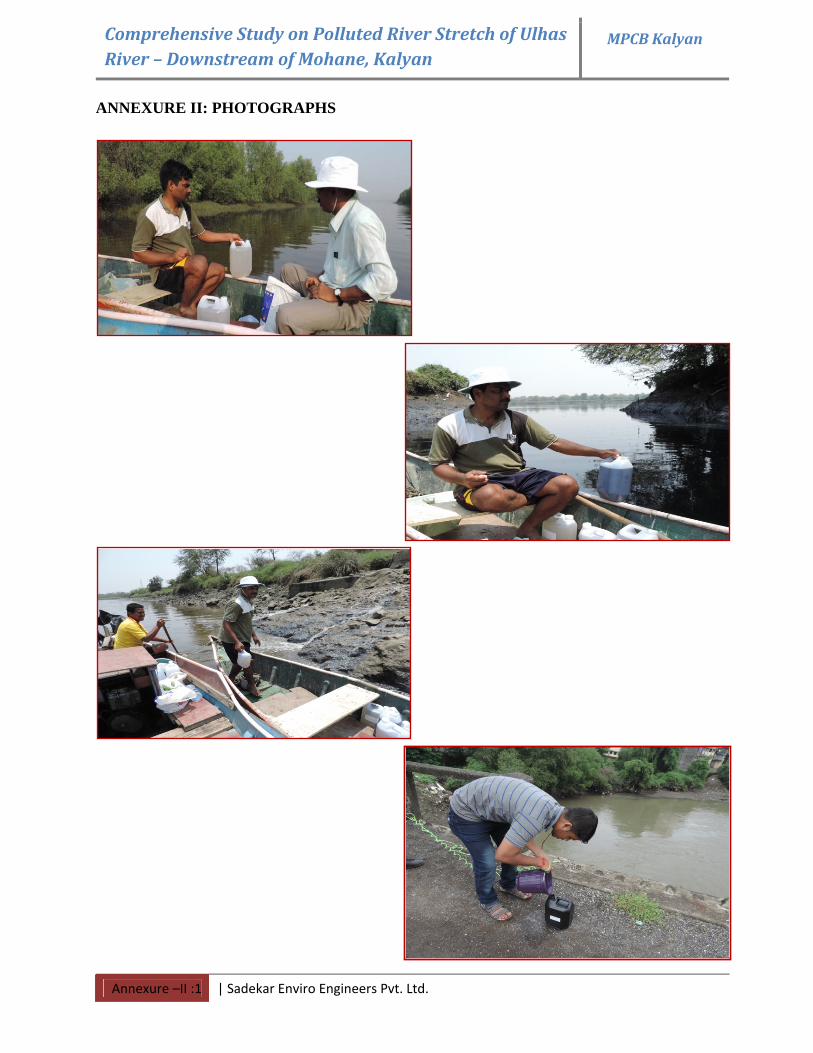
Comprehensive Study on Polluted River Stretch of Ulhas River – Downstream of Mohane, Kalyan
MPCB Kalyan
Annexure –II :1 | Sadekar Enviro Engineers Pvt. Ltd.
ANNEXURE II: PHOTOGRAPHS
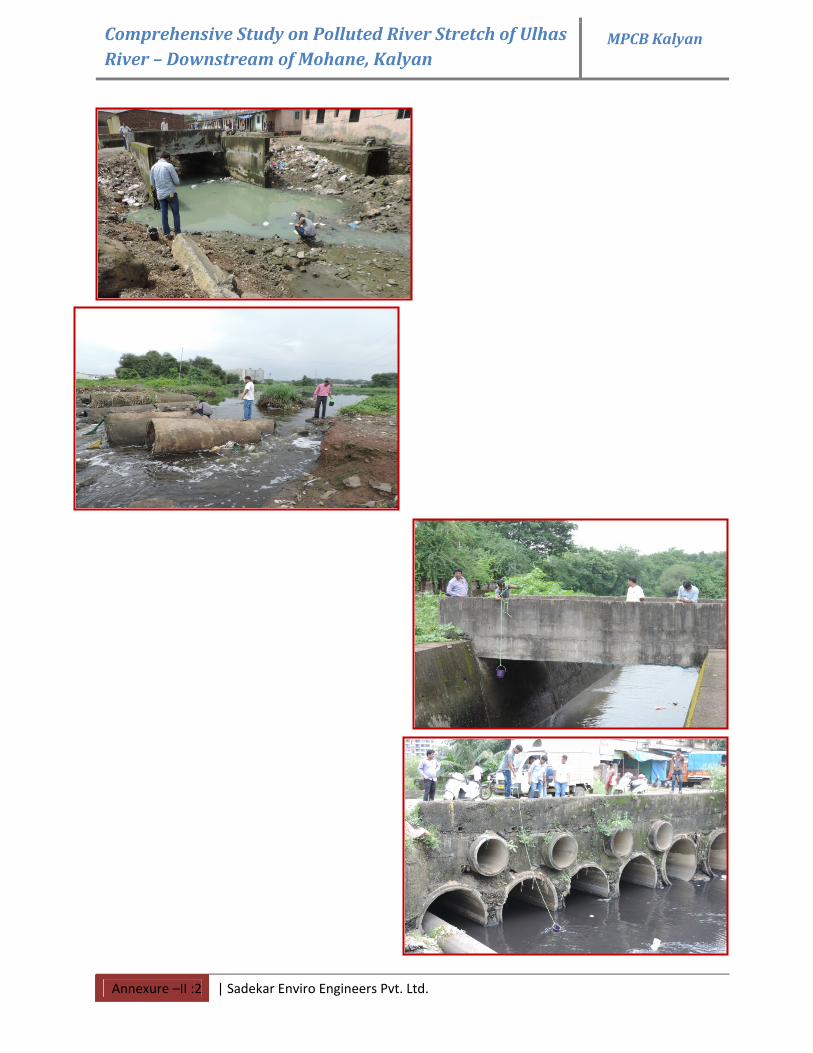
Comprehensive Study on Polluted River Stretch of Ulhas River – Downstream of Mohane, Kalyan
MPCB Kalyan
Annexure –II :2 | Sadekar Enviro Engineers Pvt. Ltd.
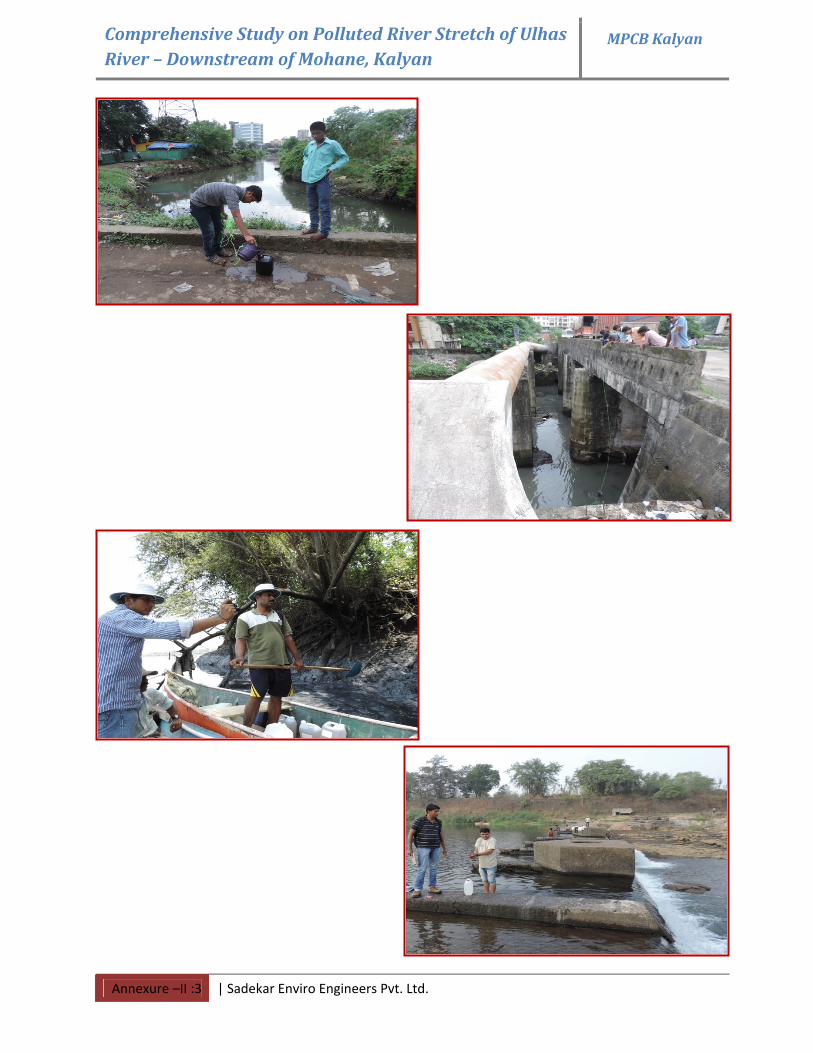
Comprehensive Study on Polluted River Stretch of Ulhas River – Downstream of Mohane, Kalyan
MPCB Kalyan
Annexure –II :3 | Sadekar Enviro Engineers Pvt. Ltd.
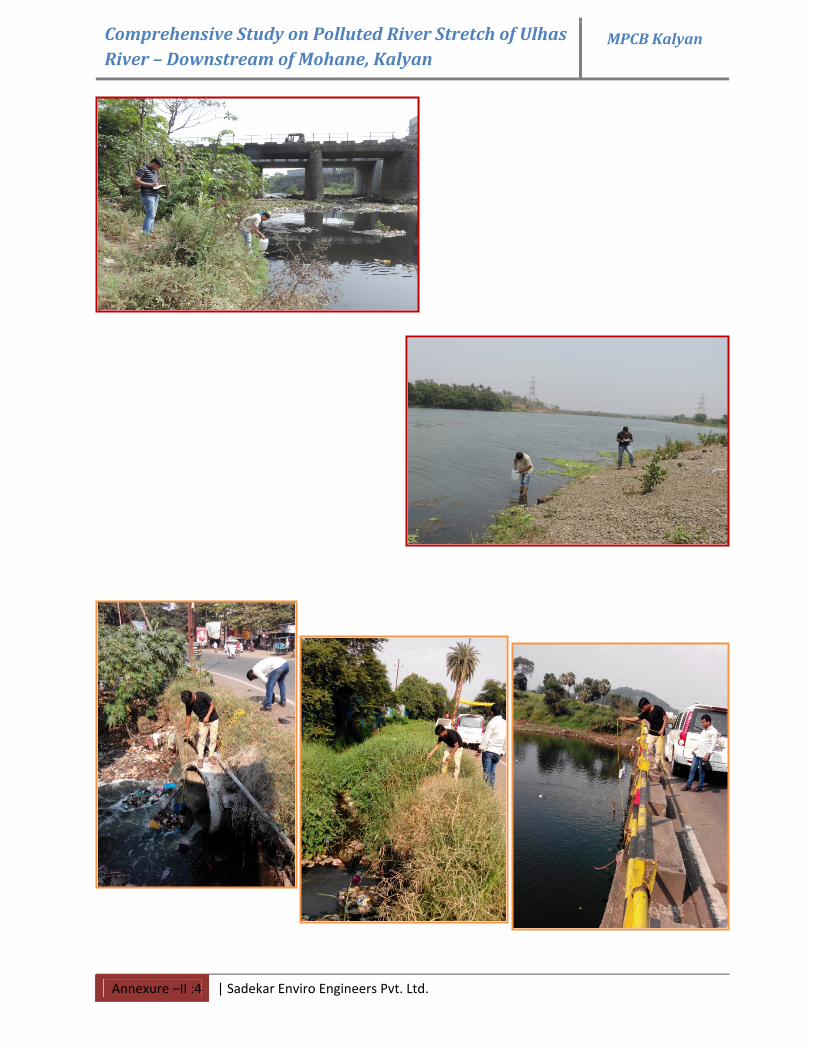
Comprehensive Study on Polluted River Stretch of Ulhas River – Downstream of Mohane, Kalyan
MPCB Kalyan
Annexure –II :4 | Sadekar Enviro Engineers Pvt. Ltd.
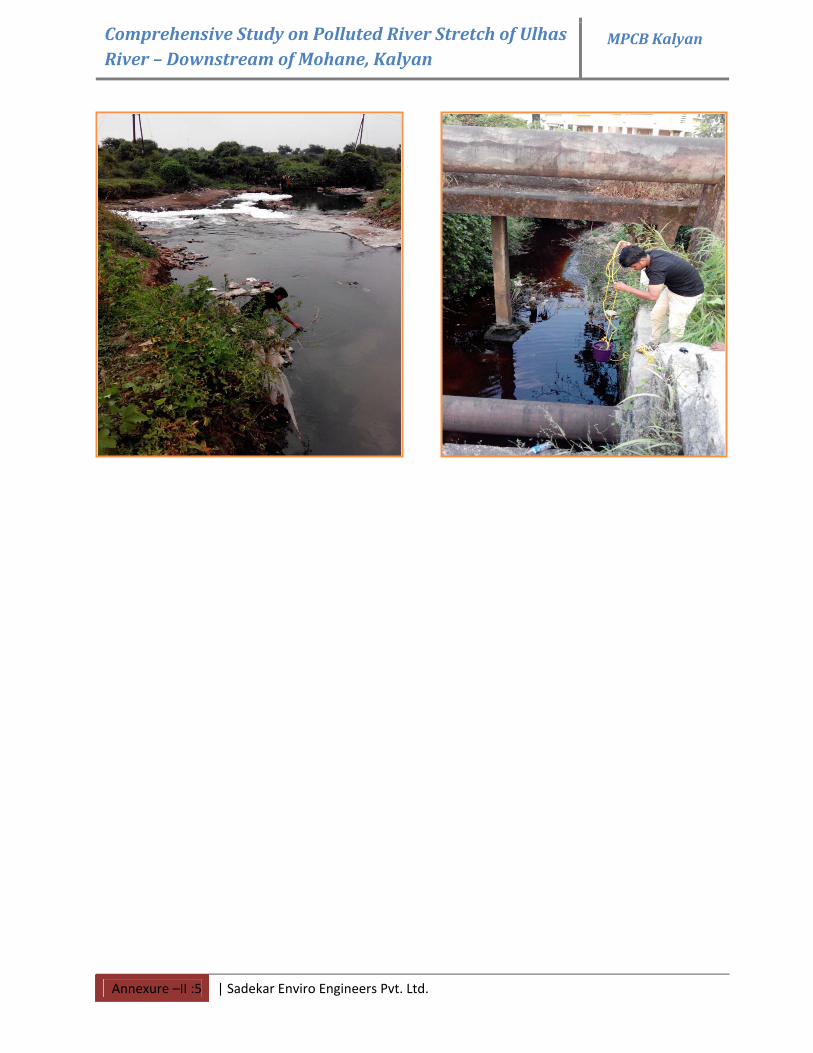
Comprehensive Study on Polluted River Stretch of Ulhas River – Downstream of Mohane, Kalyan
MPCB Kalyan
Annexure –II :5 | Sadekar Enviro Engineers Pvt. Ltd.
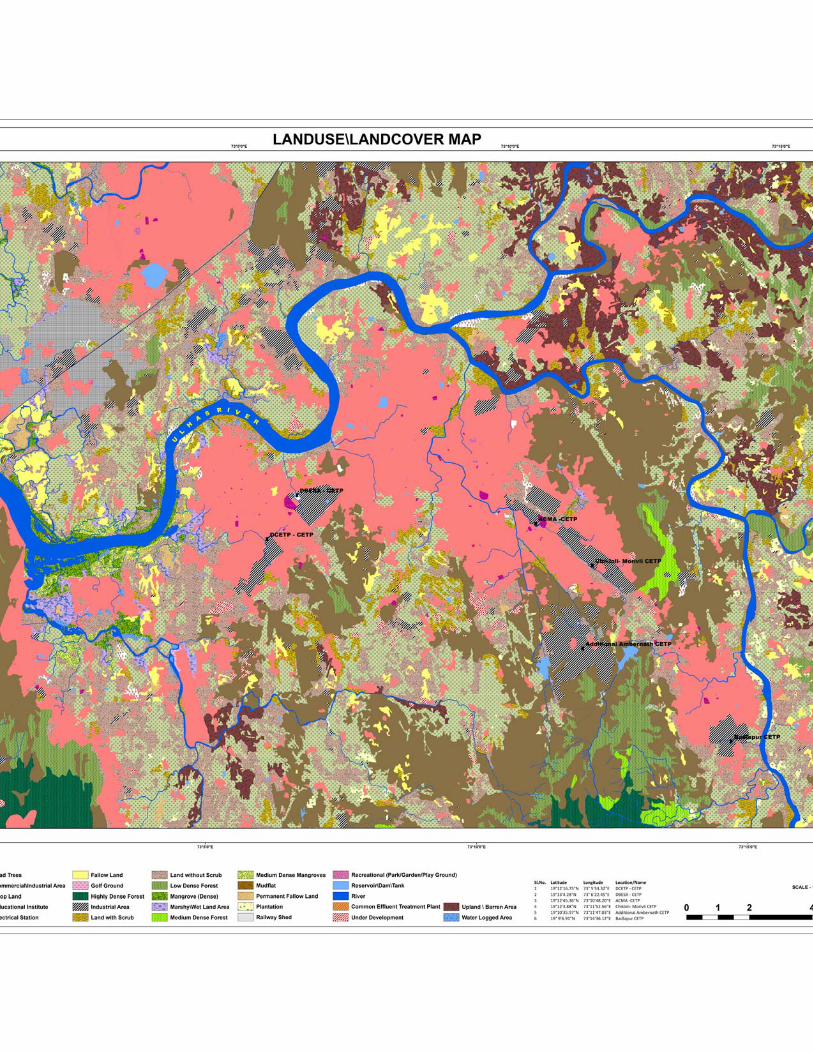
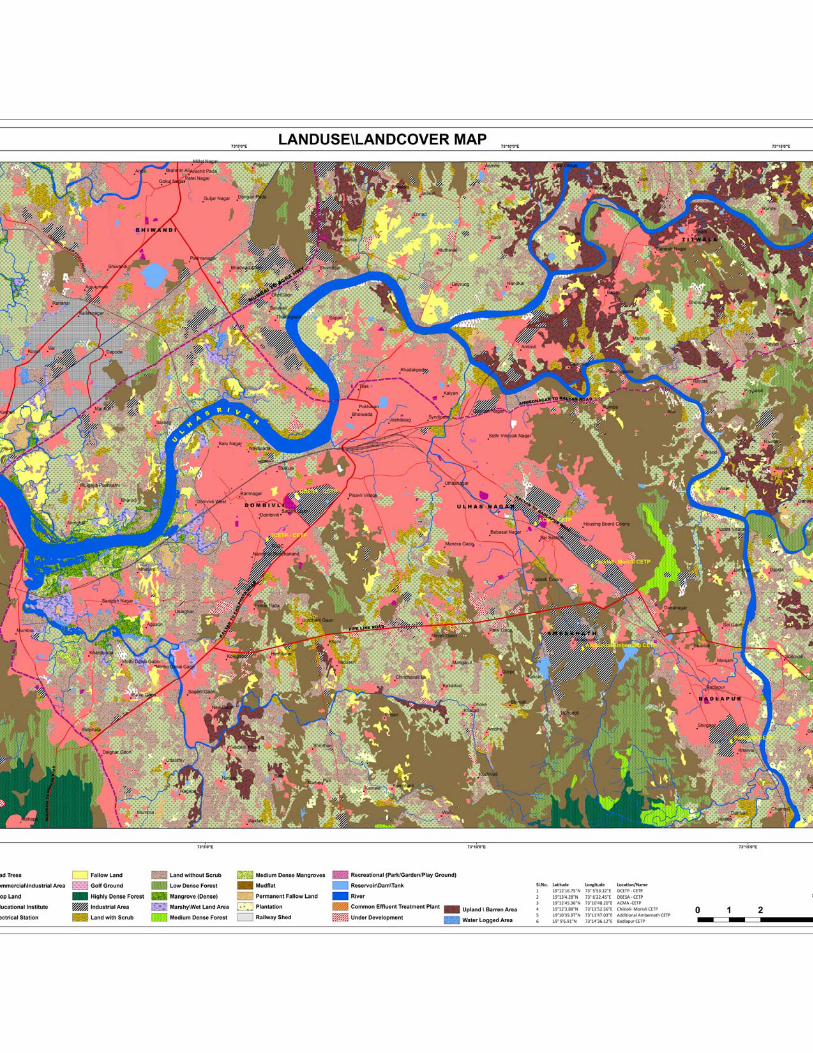
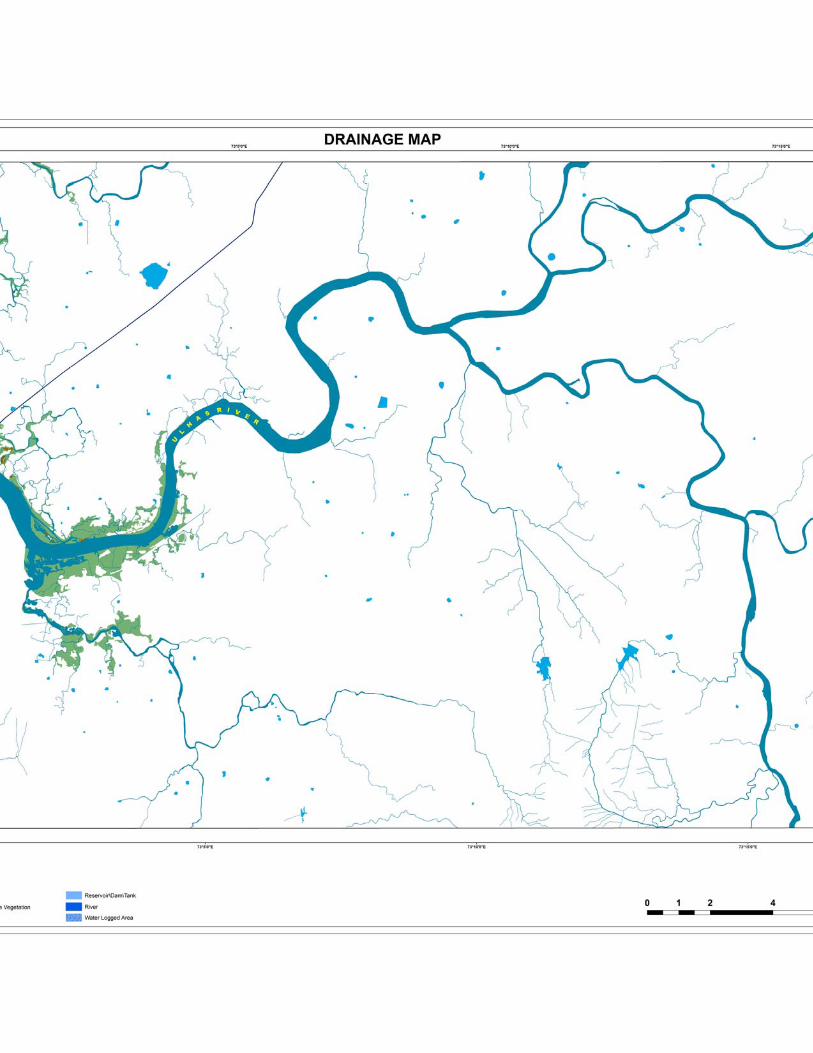
Related Documents


