This is a repository copy of Comprehensive review of statistical methods for analysing patient-reported outcomes (PROs) used as primary outcomes in randomised controlled trials (RCTs) published by the UK’s Health Technology Assessment (HTA) journal (1997– 2020). White Rose Research Online URL for this paper: https://eprints.whiterose.ac.uk/177936/ Version: Published Version Article: Qian, Y., Walters, S.J. orcid.org/0000-0001-9000-8126, Jacques, R. orcid.org/0000-0001- 6710-5403 et al. (1 more author) (2021) Comprehensive review of statistical methods for analysing patient-reported outcomes (PROs) used as primary outcomes in randomised controlled trials (RCTs) published by the UK’s Health Technology Assessment (HTA) journal (1997–2020). BMJ Open, 11 (9). e051673. ISSN 2044-6055 https://doi.org/10.1136/bmjopen-2021-051673 [email protected] https://eprints.whiterose.ac.uk/ Reuse This article is distributed under the terms of the Creative Commons Attribution (CC BY) licence. This licence allows you to distribute, remix, tweak, and build upon the work, even commercially, as long as you credit the authors for the original work. More information and the full terms of the licence here: https://creativecommons.org/licenses/ Takedown If you consider content in White Rose Research Online to be in breach of UK law, please notify us by emailing [email protected] including the URL of the record and the reason for the withdrawal request.

Welcome message from author
This document is posted to help you gain knowledge. Please leave a comment to let me know what you think about it! Share it to your friends and learn new things together.
Transcript
This is a repository copy of Comprehensive review of statistical methods for analysing patient-reported outcomes (PROs) used as primary outcomes in randomised controlled trials (RCTs) published by the UK’s Health Technology Assessment (HTA) journal (1997–2020).
White Rose Research Online URL for this paper:https://eprints.whiterose.ac.uk/177936/
Version: Published Version
Article:
Qian, Y., Walters, S.J. orcid.org/0000-0001-9000-8126, Jacques, R. orcid.org/0000-0001-6710-5403 et al. (1 more author) (2021) Comprehensive review of statistical methods for analysing patient-reported outcomes (PROs) used as primary outcomes in randomised controlled trials (RCTs) published by the UK’s Health Technology Assessment (HTA) journal (1997–2020). BMJ Open, 11 (9). e051673. ISSN 2044-6055
https://doi.org/10.1136/bmjopen-2021-051673
[email protected]://eprints.whiterose.ac.uk/
Reuse
This article is distributed under the terms of the Creative Commons Attribution (CC BY) licence. This licence allows you to distribute, remix, tweak, and build upon the work, even commercially, as long as you credit the authors for the original work. More information and the full terms of the licence here: https://creativecommons.org/licenses/
Takedown
If you consider content in White Rose Research Online to be in breach of UK law, please notify us by emailing [email protected] including the URL of the record and the reason for the withdrawal request.

1Qian Y, et al. BMJ Open 2021;11:e051673. doi:10.1136/bmjopen-2021-051673
Open access
Comprehensive review of statistical methods for analysing patient- reported outcomes (PROs) used as primary outcomes in randomised controlled trials (RCTs) published by the UK’s Health Technology Assessment (HTA) journal (1997–2020)
Yirui Qian , Stephen J Walters , Richard Jacques , Laura Flight
To cite: Qian Y, Walters SJ,
Jacques R, et al.
Comprehensive review of
statistical methods for analysing
patient- reported outcomes
(PROs) used as primary
outcomes in randomised
controlled trials (RCTs)
published by the UK’s Health
Technology Assessment (HTA)
journal (1997–2020). BMJ Open
2021;11:e051673. doi:10.1136/
bmjopen-2021-051673
► Prepublication history for
this paper is available online.
To view these files, please visit
the journal online (http:// dx. doi.
org/ 10. 1136/ bmjopen- 2021-
051673).
Received 26 March 2021
Accepted 13 August 2021
School of Health and Related
Research, The University of
Sheffield, Sheffield, UK
Correspondence to
Professor Stephen J Walters;
s. j. walters@ sheffield. ac. uk
Original research
© Author(s) (or their
employer(s)) 2021. Re- use
permitted under CC BY.
Published by BMJ.
ABSTRACTObjectives To identify how frequently patient- reported
outcomes (PROs) are used as primary and/or secondary
outcomes in randomised controlled trials (RCTs) and to
summarise what statistical methods are used for the
analysis of PROs.
Design Comprehensive review.
Setting RCTs funded and published by the United
Kingdom’s (UK) National Institute for Health Research
(NIHR) Health Technology Assessment (HTA) Programme.
Data sources and eligibility HTA reports of RCTs
published between January 1997 and December 2020
were reviewed.
Data extraction Information relating to PRO use and
analysis methods was extracted.
Primary and secondary outcome measures The
frequency of using PROs as primary and/or secondary
outcomes; statistical methods that were used for the
analysis of PROs as primary outcomes.
Results In this review, 37.6% (114/303) of trials used
PROs as primary outcomes, and 82.8% (251/303) of trials
used PROs as secondary outcomes from 303 NIHR HTA
reports of RCTs. In the 114 RCTs where the PRO was the
primary outcome, the most used PRO was the Short- Form
36 (8/114); the most popular methods for multivariable
analysis were linear mixed model (45/114), linear
regression (29/114) and analysis of covariance (13/114);
logistic regression was applied for binary and ordinal
outcomes in 14/114 trials; and the repeated measures
analysis was used in 39/114 trials.
Conclusion The majority of trials used PROs as primary
and/or secondary outcomes. Conventional methods such
as linear regression are widely used, despite the potential
violation of their assumptions. In recent years, there is an
increasing trend of using complex models (eg, with mixed
effects). Statistical methods developed to address these
violations when analysing PROs, such as beta- binomial
regression, are not routinely used in practice. Future
research will focus on evaluating available statistical
methods for the analysis of PROs.
INTRODUCTION
Patient- reported outcomes (PROs) are health or health- related outcomes of health inter-ventions reported by patients themselves. PROs enable health researchers to measure,
Strengths and limitations of this study
► Patient- reported outcomes (PROs) are increasingly
used as clinical outcomes, and the use of appropri-
ate statistical methods will ensure reliable estimates
are produced to support decision making.
► This review summarises the up- to- date statistical
methods that have been used for the primary anal-
ysis of PROs in 114 randomised controlled trials
published by the UK’s National Institute for Health
Research (NIHR) Health Technology Assessment
(HTA) journal between January 1997 and December
2020, and it is the largest comprehensive review
of trials on the use of PROs and the corresponding
statistical methods for the analysis of PROs to date.
► Most studies apply conventional statistical methods
(eg, linear regression) for the analysis of PROs de-
spite the potential violation of the model assump-
tions, and even though specialist statistical methods
have been developed to solve this problem, these
methods are rarely used in practice.
► There was a lack of explicit reporting of PROs in
some trials. Although assumptions have been made
based on the context where some required informa-
tion was not explicitly stated, it is possible the ex-
tracted data were inconsistent with the researchers’
intention.
► This study included only trials published in the NIHR
HTA journal as the information relating to PROs in
other journals are not reported in as much detail and
the HTA journal intends to publish all NIHR- funded
studies, regardless of their findings.
on S
ep
tem
be
r 7, 2
021
by g
ue
st. P
rote
cte
d b
y c
opyrig
ht.
http
://bm
jopen.b
mj.c
om
/B
MJ O
pe
n: firs
t pu
blis
he
d a
s 1
0.1
13
6/b
mjo
pe
n-2
02
1-0
51
67
3 o
n 6
Septe
mber 2
021. D
ow
nlo
aded fro
m

2 Qian Y, et al. BMJ Open 2021;11:e051673. doi:10.1136/bmjopen-2021-051673
Open access
analyse and compare clinical outcomes from the patient perspective and provide clinical effectiveness outcomes to support decision making. The descriptive and scoring system of a PRO can transform subjective descriptions of health to numerical scores in a range of dimensions,1 and this transformation quantifies and allows the statistical analysis of these health- related outcomes.
Randomised controlled trials (RCTs) are regarded as the gold standard for evaluating the effectiveness of interventions.2 3 The randomisation process in a well- conducted RCT can reduce the selection bias and allo-cation bias, and inform the causality of the treatment on responses.4 These traits of RCTs can simplify the analysis of PRO data. However, the RCT methodology does not bypass the possible systematic error from sources such as invalid measurements (eg, poorly or mistakenly filled PRO forms, ceiling or floor effects of the PRO scales), publica-tion bias or selective reporting of statistical analyses.
Despite these traits of RCTs, it can still be complex to analyse PRO data in RCT settings for the following reasons.
First, one PRO can generate multiple outcomes and can be reported in different forms—using different score types such as subscales or summary scores; gener-ating quality- adjusted survivals (ie, the integration of the quality- of- life function over the observed period of survival, such as quality- adjusted life years); producing dichotomised outcomes (eg, proportion of responders with a PRO score above or below a particular prespecified value or cut- off); and producing ordinal outcomes using several cut- offs. The various forms can result in multiple endpoints, and potentially increase the complexity of analysing PRO data.
Second, PRO data are likely to be discrete, skewed and bounded (ie, with ceiling effect and floor effects).5 When analysing PRO data using a general linear model (including t- test, analysis of variance (ANOVA), analysis of covariance (ANCOVA) and linear regression), there are a number of assumptions6:1. The values of the outcome variable should have a
Normal distribution for each value of the explanatory variable. This assumption means that the residuals are Normally distributed and should have a mean of 0.
2. Constant variance or homoscedasticity of the outcome variable at each value of the explanatory variable.
3. The relationship between the outcome variable and the explanatory variable should be linear.
4. Independent observations in the sample.These assumptions such as Normality of residuals and
linear relationship between the outcome independent variable and explanatory dependent variables are likely to be violated.7 8
Also, the application of statistical methods might vary according to PRO data and the aim of the statistical analysis, but these features (multidimensional, discrete, skewed and bounded) of PRO data may obscure the deci-sion on what statistical methods need to be applied for the data analysis.
An inappropriate statistical analysis of PROs can result in unreliable estimands of clinical effectiveness and accordingly fail to provide accurate and robust results for decision making, with wider confidence intervals (CIs) or larger errors.9 10 For example, patients may fail to receive an effective treatment because this treatment is falsely shown not to be clinically effective based on inaccurate estimands; vice versa, patients may receive treatment which may potentially harm their health when unreli-able evidence supports the use of this treatment. Thus, applying appropriate statistical methods for the anal-ysis of PROs is crucial to reduce biases of estimands, to accurately evaluate clinical effectiveness and to support healthcare decision making.
This study aimed to first identify how frequently PROs have been used as primary or secondary clinical outcomes in reports of RCTs published in the UK’s National Insti-tute for Health Research (NIHR) Health Technology Assess-
ment (HTA) journal, and second, when the PRO was the primary outcome for trial, to summarise the statistical methods used to analyse the outcome.
METHODS
Definition of a PRO
There are several definitions of a PRO. For the purpose of this review, a PRO measure was defined as a question-naire that measures health or a health- related outcome as a result of health interventions reported by patients them-selves without any interpretation by clinicians or any other proxies. A PRO is an umbrella term for outcomes used to measure patients’ perceptions of health- related quality of life (QoL), broader aspects of QoL, health status, satisfac-tion with the treatment and health conditions.1 11–13
Trial identification
Reports of RCTs published in the UK’s NIHR HTA journal between 1 January 1997 and 31 December 2020 that defined and reported a PRO as a clinical endpoint or outcome for the trial were systematically identified and reviewed. The HTA journal was chosen because, in comparison to major medical journals, the information related to the trial and the PROs are reported in more detail. Information related to the use of PROs included the frequency of using PROs as clinical outcomes; whether the PROs were used as primary and/or secondary outcomes; the characteristics of the PROs when they were used as primary outcomes; and when the PRO was the primary outcome, the statistical method used for the analysis of the PRO data. The identification of HTA reports of RCTs used the same search strategy as previous work.14 The selection of trials with PROs was conducted by one reviewer (YQ). Three reviewers (SW, RJ and LF) conducted quality assurance checks on 30% of the included papers after the data extraction was completed, and disagreements were discussed to achieve consensus.
Inclusion and exclusion criteria
The studies included in this review satisfied the following criteria: (1) RCTs where individual participants were
on S
ep
tem
be
r 7, 2
021
by g
ue
st. P
rote
cte
d b
y c
opyrig
ht.
http
://bm
jopen.b
mj.c
om
/B
MJ O
pe
n: firs
t pu
blis
he
d a
s 1
0.1
13
6/b
mjo
pe
n-2
02
1-0
51
67
3 o
n 6
Septe
mber 2
021. D
ow
nlo
aded fro
m

3Qian Y, et al. BMJ Open 2021;11:e051673. doi:10.1136/bmjopen-2021-051673
Open access
randomised, (2) trials with at least one PRO as the primary outcome and (3) trials with the statistical anal-ysis conducted for the PRO. Studies excluded from this review included cluster RCTs as these have specific statis-tical issues, influenza trials as these rarely use PROs as clinical outcomes, adaptive or group sequential trials as these have different statistical issues that may influence the choice of analysis, and follow- on studies and pilot/feasibility studies.
PROs identified in this review can be well- established measures from previous studies with feasibility, reliability and validity already tested, or self- developed measures by researchers for use in the trial. For studies with measures which were not clearly defined as a PRO in the trial, various methods were taken to identify whether the measure was categorised as a PRO, including retrieving the cited paper that developed the measure, identifying signal words such as ‘carers’ and ‘physicians’ for rating or assessing patients’ outcomes in the measure descrip-tion, and referring to other papers that developed or applied the outcome measure. According to our defini-tion of PROs, trials that recruited only patients, or trials that recruited both patients and proxies when patients were unable to complete PROs were included; trials that used only proxies as informants to complete the PROs were excluded in order to avoid the cases where clinicians respond to health outcome measures on the patients’ behalf.
Trials using the product of PROs, such as a dichotomised outcome and quality- adjusted survival, were included. Trials that used PROs only as primary cost- effectiveness outcomes but not as clinical primary outcomes were excluded. Even if the statistical methods were proposed, trials that did not actually conduct the statistical analysis were excluded.
Data extraction
The following information was extracted from the reports of the included trials:1. Characteristics of the trials with PROs as primary
outcomes, including the number of participants ran-domised and analysed, the baseline and postrandomi-sation assessment, the most frequently used PROs and special types of PROs (including patient satisfaction, preference- based and proxy- reported).
2. Statistical methods conducted for the primary analy-sis of the PROs, including the study population, the specific statistical methods, the adjustment for baseline score or other covariates, involvement of random ef-fects, robust standard errors (SEs) and bootstrapping techniques, repeated measures analysis, and strategies for missing data.
3. The quality of reporting PROs, including whether there is a clear definition or justification of the prima-ry outcomes or primary endpoints, statistical methods and covariates.
For the purpose of this review, the statistical methods were broadly categorised into two categories: ‘univariable
methods’ that do not adjust for any other covariates except the randomised group (eg, t- test, χ2 test and simple linear regression) and ‘multivariable methods’ that have one or more explanatory variables (eg, baseline score) in addi-tion to the randomised group (eg, multiple linear regres-sion). The multivariable methods were further classified according to the categories of generalized linear models (GzLM), including linear regression, ANCOVA, binary logistic regression, ordinal logistic regression, and their extensions for correlated responses such as models with coefficients estimated by generalized estimating equa-tions (GEEs) and mixed effect models. Repeated meas-ures analysis for PROs with more than one postbaseline assessments was classified into four categories: response feature analysis (ie, using summary measures, such as the area under the curve or postrandomisation mean score); generalized linear mixed models; GzLM with parameters estimated by GEE; and repeated measures ANOVA.5 15
Patient and public involvement
Patients and the public were not involved in any way in this study.
RESULTS
In total, 1356 reports were published by the HTA journal between 1 January 1997 and 31 December 2020, and 928 reports were excluded after screening the titles and abstracts. In the remaining 428 reports, 125 were excluded for various reasons (figure 1). In the 303 published individual RCTs, 37.6% (114/303) of trials used PROs as primary outcomes and 82.8% (251/303) of trials used PROs as secondary outcomes. Two trials with
Figure 1 Flow diagram for the inclusion and exclusion of
trials published in the Health Technology Assessment journal
from 1997 to 2020. PRO, patient- reported outcome.
on S
ep
tem
be
r 7, 2
021
by g
ue
st. P
rote
cte
d b
y c
opyrig
ht.
http
://bm
jopen.b
mj.c
om
/B
MJ O
pe
n: firs
t pu
blis
he
d a
s 1
0.1
13
6/b
mjo
pe
n-2
02
1-0
51
67
3 o
n 6
Septe
mber 2
021. D
ow
nlo
aded fro
m

4 Qian Y, et al. BMJ Open 2021;11:e051673. doi:10.1136/bmjopen-2021-051673
Open access
PROs as primary outcomes were excluded as they were closed without conducting a statistical analysis of the data using the statistical methods that were proposed in the report.16 17 It should be noted that the first RCT with a PRO as a clinical outcome was published in the HTA journal in 1999,18 and the earlier reports published in the HTA journal were mainly systematic reviews.
All included trials that used PROs as primary outcomes also used PROs as secondary outcomes. The trend of using PROs as clinical outcomes in trials between 1999 and 2020 is shown in figure 2. Except for the earlier years (1999–2003) with a small number of studies, the propor-tion of trials with PROs used as secondary outcomes (the red curve) is approximately two times higher than the proportion of the trials with PROs as primary outcomes (the blue curve). Generally, there is an increase in using PROs as clinical outcomes in HTA trials.
Trial characteristics
In total, 83.1% (61 715/74 298) of the participants randomised in the 114 trials were used for the primary analysis (table 1). The characteristics of these trials are summarised in table 2. The most common design was a two- arm parallel group trial. More than half of the trials were in either mental health (30/114) or musculoskel-etal conditions (28/114). Most trials collected baseline
assessments (101/114) and more than one postbaseline assessments (107/114). The maximum number of post-baseline assessments was 24 in a trial on eczema manage-ment for children.19
Most trials (107/114) clearly defined the primary outcomes; the sample size calculation implied the primary outcomes for the trial was a PRO in six trials that did not explicitly specify the primary outcome, and one trial defined PROs as main outcome measures but used an alternative outcome for the sample size calculation.20 Table 3 summarises the PROs used as primary outcomes in four or more included trials. The most popular PROs were mainly generic (ie, Short Form-36/Short Form 6- Dimension (SF- 6D) and EuroQol-5 Dimension (EQ- 5D)) and depression- specific (ie, Beck Depression Inven-tory, Hospital Anxiety and Depression Scale and Patient Health Questionnaire). Eight trials used more than one PRO as the primary outcomes, and 14 trials used non- PRO clinical outcomes as coprimary outcomes.
Preference- based PROs were used in six trials as primary outcomes, including five21–25 that used the EQ- 5D and one26 that used the SF- 6D. Seven trials used the quality- adjusted survival, including three22 23 25 that used the EQ- 5D and four27–30 that used specific PROs for estima-tion. Patient satisfaction was used as the primary outcome
Figure 2 Number and proportion of trials using patient- reported outcomes (PROs) as primary and/or secondary outcomes
from 1999 to 2020.
Table 1 Recruitment and retention of trial participants included from the 144 reports
Items Mean Median SD Min Max Total
Number of participants randomised 652 480 928 85 8003 74 298
Number of participants analysed* 541 388 847 65 7677 61 715
*Number of participants analysed in the primary analysis of patient- reported outcomes; if multiple postbaseline assessments were used for
the primary outcome, the number of participants analysed at the longest postbaseline timepoint was taken.
on S
ep
tem
be
r 7, 2
021
by g
ue
st. P
rote
cte
d b
y c
opyrig
ht.
http
://bm
jopen.b
mj.c
om
/B
MJ O
pe
n: firs
t pu
blis
he
d a
s 1
0.1
13
6/b
mjo
pe
n-2
02
1-0
51
67
3 o
n 6
Septe
mber 2
021. D
ow
nlo
aded fro
m

5Qian Y, et al. BMJ Open 2021;11:e051673. doi:10.1136/bmjopen-2021-051673
Open access
in two trials.31 32 Proxies were recruited in six trials19 33–37 that primarily aimed to collect PROs and only recruited proxies for patients who were unable to complete the PROs. Seven included trials used self- developed PROs as the primary or coprimary outcome. Most of these PROs had one item based on Likert Scale or Visual Analogue Scale (VAS), except for one trial38 that specially developed a REFLUX questionnaire with 31 items to generate the QoL of patients with gastro- oesophageal
reflux disease. Health outcomes assessed by investigators were not included as primary outcomes, for example, four trials39–41 using the Quality of Life Scale or Rankin Scale, that were completely assessed by investigators were excluded.
Different score types were used to summarise the PRO primary outcomes. Most trials (98/114) used one score type to report the primary outcome, and the rest of the trials used two types of scores. Summary scores were the most popular way to measure PROs (83/114), followed by subscales (30/114) and single items (16/114), including Likert Scale (11/114) and VAS (5/114).
Statistical methods for the primary analysis of PROs
The majority of trials stated the proportion of missing PRO data (109/114), developed strategies to deal with missing data (99/114), imputed missing data using various methods such as mean imputation and last obser-vation carried forward (89/114). In 40/114 studies, missing data were imputed as part of a sensitivity analysis to check the robustness of the primary analysis strategy which did not consider missing data.
Intention- to- treat (ITT) analysis (ie, analysis based on the randomised treatment assignment of all participants but not the actual treatment received),42 including ITT with and without missing data imputation, was used in 111/114 trials, and 46 trials used other study popula-tions such as per protocol analysis (ie, analysis based on the patients who completed the originally treatment
Table 3 Most frequently used PROs as primary outcomes
in the included trials
PROs Abbreviation No % Reference
Short Form-36 SF-36 8 7.0 79–82
Short Form
6- Dimension
SF- 6D
Beck Depression
Inventory
BDI 7 6.1 83
Hospital Anxiety
and Depression
Scale
HADS 5 4.4 84
EuroQol-5
Dimension
EQ- 5D 5 4.4 85–87
Patient Health
Questionnaire
PHQ 5 4.4 88
Oxford Shoulder
Score
OSS 4 3.5 89
Other* 90 78.9
Total† 124 108.8
*Only PROs that were used in four or more trials are listed
separately.
†The total number of included trials is 114. Eight trials used more
than one PRO as primary outcomes, including two trials that
used three PROs and six trials that used two PROs as primary
outcomes.
PRO, patient- reported outcome.
Table 2 Trial design and assessment characteristics of the
114 trials included in the review
Items No % Total
Trial design Parallel group 102 87.2 114
Factorial 3 2.6
Crossover 0 0.0
Other* 9 7.7
Number of arms 2 83 70.9 114
3 21 17.9
4 5 4.3
>4 5 4.3
Clinical area Mental health 30 25.6 114
Musculoskeletal 28 23.9
Obstetrics and
gynaecology
9 7.7
Gastrointestinal 7 6.0
Respiratory 5 4.3
Stroke 5 4.3
Primary care 4 3.4
Cardiovascular 4 3.4
Cancer/oncology 3 2.6
Dermatology 4 3.4
Other† 15 12.8
Number of trials
with a baseline
assessment of the
patient- reported
outcome
101 86.3 114
Timing of
primary outcome
postbaseline
assessments
<1 month 7 6.0 114
1–6 months 28 23.9
>6–18 months 50 42.7
>18 months 27 23.1
Missing‡ 2 1.7
Number of
postbaseline
assessments
1 5 4.3 114
2 41 35.0
3 29 24.8
4 19 16.2
>4 18 15.4
Missing‡ 2 1.7
*Patient preference/Zelen’s.
†Chronic fatigue, minor surgery, multiple sclerosis, neurosurgery,
paediatric, sleep disorders, urology, vascular.
‡Two trials did not specify the timing and number of postbaseline
assessments.
on S
ep
tem
be
r 7, 2
021
by g
ue
st. P
rote
cte
d b
y c
opyrig
ht.
http
://bm
jopen.b
mj.c
om
/B
MJ O
pe
n: firs
t pu
blis
he
d a
s 1
0.1
13
6/b
mjo
pe
n-2
02
1-0
51
67
3 o
n 6
Septe
mber 2
021. D
ow
nlo
aded fro
m
6 Qian Y, et al. BMJ Open 2021;11:e051673. doi:10.1136/bmjopen-2021-051673
Open access
assigned), as treated or complier average causal effect analysis (ie, analysis of the treatment effect based on the subgroup that completed the originally treatment assigned) for the secondary or sensitivity analysis.
The statistical methods applied for primary analyses were clearly defined in 79/114 trials, and the use of univariable or multivariable methods for primary analyses were justified in 92/114 trials. Except for two trials that did not specify the timing and number of postrandomi-sation assessments,43 44 72/114 clearly defined the single timepoint used for the primary analysis (eg, x months postbaseline), and 40/114 used the repeated postbase-line outcomes for the primary analysis.
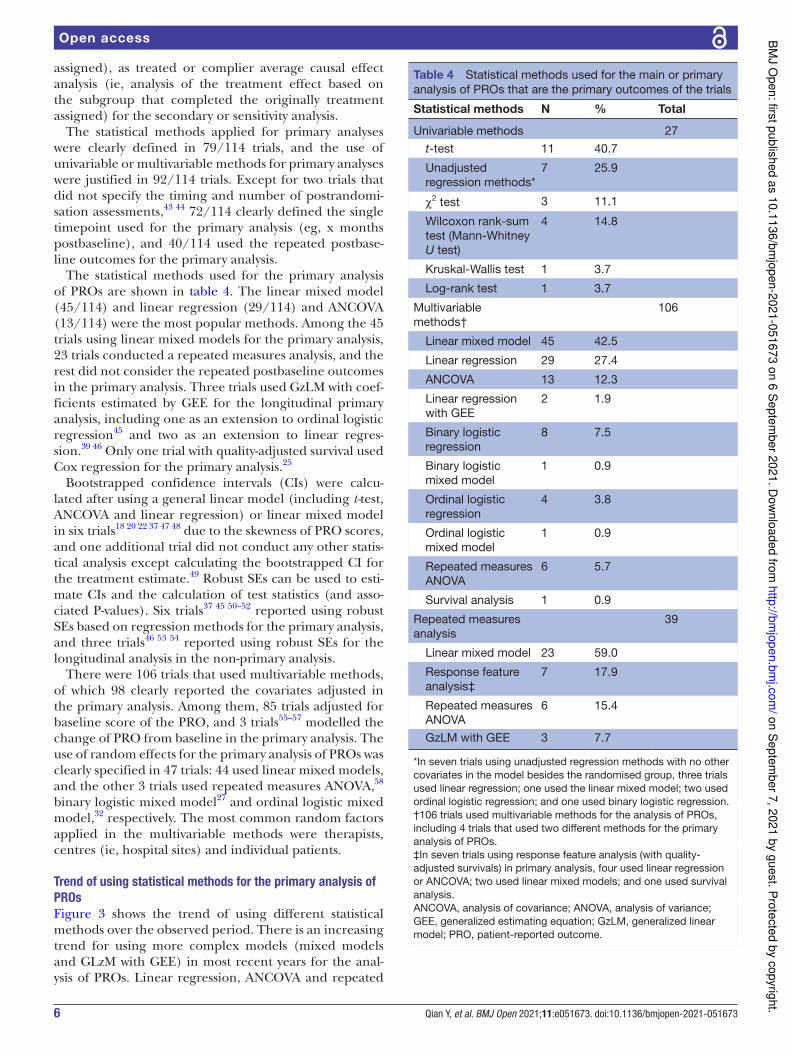
The statistical methods used for the primary analysis of PROs are shown in table 4. The linear mixed model (45/114) and linear regression (29/114) and ANCOVA (13/114) were the most popular methods. Among the 45 trials using linear mixed models for the primary analysis, 23 trials conducted a repeated measures analysis, and the rest did not consider the repeated postbaseline outcomes in the primary analysis. Three trials used GzLM with coef-ficients estimated by GEE for the longitudinal primary analysis, including one as an extension to ordinal logistic regression45 and two as an extension to linear regres-sion.39 46 Only one trial with quality- adjusted survival used Cox regression for the primary analysis.25
Bootstrapped confidence intervals (CIs) were calcu-lated after using a general linear model (including t-test, ANCOVA and linear regression) or linear mixed model in six trials18 20 22 37 47 48 due to the skewness of PRO scores, and one additional trial did not conduct any other statis-tical analysis except calculating the bootstrapped CI for the treatment estimate.49 Robust SEs can be used to esti-mate CIs and the calculation of test statistics (and asso-ciated P- values). Six trials37 45 50–52 reported using robust SEs based on regression methods for the primary analysis, and three trials46 53 54 reported using robust SEs for the longitudinal analysis in the non- primary analysis.
There were 106 trials that used multivariable methods, of which 98 clearly reported the covariates adjusted in the primary analysis. Among them, 85 trials adjusted for baseline score of the PRO, and 3 trials55–57 modelled the change of PRO from baseline in the primary analysis. The use of random effects for the primary analysis of PROs was clearly specified in 47 trials: 44 used linear mixed models, and the other 3 trials used repeated measures ANOVA,58 binary logistic mixed model27 and ordinal logistic mixed model,32 respectively. The most common random factors applied in the multivariable methods were therapists, centres (ie, hospital sites) and individual patients.
Trend of using statistical methods for the primary analysis of
PROs
Figure 3 shows the trend of using different statistical methods over the observed period. There is an increasing trend for using more complex models (mixed models and GLzM with GEE) in most recent years for the anal-ysis of PROs. Linear regression, ANCOVA and repeated
Table 4 Statistical methods used for the main or primary
analysis of PROs that are the primary outcomes of the trials
Statistical methods N % Total
Univariable methods 27
t- test 11 40.7
Unadjusted
regression methods*
7 25.9
χ2 test 3 11.1
Wilcoxon rank- sum
test (Mann- Whitney
U test)
4 14.8
Kruskal- Wallis test 1 3.7
Log- rank test 1 3.7
Multivariable
methods†
106
Linear mixed model 45 42.5
Linear regression 29 27.4
ANCOVA 13 12.3
Linear regression
with GEE
2 1.9
Binary logistic
regression
8 7.5
Binary logistic
mixed model
1 0.9
Ordinal logistic
regression
4 3.8
Ordinal logistic
mixed model
1 0.9
Repeated measures
ANOVA
6 5.7
Survival analysis 1 0.9
Repeated measures
analysis
39
Linear mixed model 23 59.0
Response feature
analysis‡
7 17.9
Repeated measures
ANOVA
6 15.4
GzLM with GEE 3 7.7
*In seven trials using unadjusted regression methods with no other
covariates in the model besides the randomised group, three trials
used linear regression; one used the linear mixed model; two used
ordinal logistic regression; and one used binary logistic regression.
†106 trials used multivariable methods for the analysis of PROs,
including 4 trials that used two different methods for the primary
analysis of PROs.
‡In seven trials using response feature analysis (with quality-
adjusted survivals) in primary analysis, four used linear regression
or ANCOVA; two used linear mixed models; and one used survival
analysis.
ANCOVA, analysis of covariance; ANOVA, analysis of variance;
GEE, generalized estimating equation; GzLM, generalized linear
model; PRO, patient- reported outcome.
on S
epte
mb
er 7
, 20
21
by g
uest. P
rote
cte
d b
y c
opyrig
ht.
http
://bm
jopen.b
mj.c
om
/B
MJ O
pe
n: firs
t pu
blis
he
d a
s 1
0.1
13
6/b
mjo
pe
n-2
02
1-0
51
67
3 o
n 6
Septe
mber 2
021. D
ow
nlo
aded fro
m

7Qian Y, et al. BMJ Open 2021;11:e051673. doi:10.1136/bmjopen-2021-051673
Open access
measures ANOVA were the most popular regression methods used from 1999 to 2010, used in around 63% of trials on average. However, this popularity dropped to 28.6% during 2011–2015 and 30.0% during 2016–2020. In contrast, the proportion of trials using the linear mixed model and linear regression with GEE for correlated outcomes increased across the observation period, from 11.1% to 54.0%. While the use of binary logistic regres-sion slightly decreased from 11.1% to 4.0% over time, the proportion of trials using ordinal logistic regression for the primary analysis remained small.
DISCUSSION
This study has systematically conducted a review which summarised how frequently PROs have been used and what statistical methods have been applied for the primary analysis of PROs in RCTs published by the UK’s NIHR HTA journal between 1997 and 2020. This review found that 82.8% (251/303) used PROs as primary or secondary outcome, and 37.6% (114/303) used PROs as primary outcomes. Though conventional methods (such as t- test, multiple linear regression and ANCOVA) have been widely used, there is a growing trend of using more complex methods such as linear mixed models (with both fixed and random effects) for the analysis of PROs over the observed period of this review.
The general linear model (including t- test, ANOVA, ANCOVA and linear regression) and linear mixed model
were widely used over the past two decades, which could possibly result from the frequent use of continuous data type of response variables. The trend of using complex models could result from the increasing complexity of trial designs and from recommendations on using linear mixed models over repeated measures ANOVA for the longitudinal analysis of PROs.5 59 There is a decrease in the use of binary logistic regression as the dichoto-mised outcome gathers less information from the PROs compared with other score types.60
There is a gap between the statistical methods devel-oped by methodologists and statistical methods used for the analysis of PROs in trials. For example, Arostegui et al recommend the use of ordinal logistic regression with random effects model, beta- binomial regression or beta- logit- normal regression for continuous or ordinal PRO data after testing distributional assumptions.59 61 However, only one of the five included trials that used ordinal logistic regression for the primary analysis consid-ered random effects.32 Neither beta- binomial regression nor beta- logit- normal regression were used by the 114 trials. Interestingly, the international standards for the analysis of PROs in cancer trials by the SISAQOL (Setting International Standards in Analysing Patient- Reported Outcomes and Quality of Life Endpoints Data) Consor-tium neither recommended the use of ordinal regression nor compared ordinal regression with other statistical methods.62 The conventional methods are popular since the estimands produced by simple models can remain
Figure 3 Percentage of trials using multivariable methods for the primary analysis of PROs from 1999 to 2020
(N=xx) denotes the number of trials published in the specified period. As the survival analysis was used only in one trial,
it is not shown in this graph. As this graph only summarised multivariable methods and one trial could use two or more
multivariable methods for the primary analysis, the number of trials summarised in this graph may not equal the total
number of included trials. ANCOVA, analysis of covariance; ANOVA, analysis of variance; GEE, generalized estimating
equation.
on S
ep
tem
be
r 7, 2
021
by g
ue
st. P
rote
cte
d b
y c
opyrig
ht.
http
://bm
jopen.b
mj.c
om
/B
MJ O
pe
n: firs
t pu
blis
he
d a
s 1
0.1
13
6/b
mjo
pe
n-2
02
1-0
51
67
3 o
n 6
Septe
mber 2
021. D
ow
nlo
aded fro
m

8 Qian Y, et al. BMJ Open 2021;11:e051673. doi:10.1136/bmjopen-2021-051673
Open access
robust regardless of the violation of model assumptions.7 In addition, the difficulty in applying newly developed models in statistical software and the complexity to explain estimands of these models may make researchers more reluctant to use them.
PRO outcomes tend to generate data with discrete, skewed and bounded distributions that are not Normally distributed, and the assumptions for statistical methods such as the t- test, linear regression and ANCOVA may not be valid. However, Heeren and D’Agostino63 have demon-strated the robustness of the two independent samples t- test when applied to three- point, four- point and five- point ordinal scaled data using assigned scores, in sample sizes as small as 20 subjects per group. Sullivan and D’Agos-tino64 have expanded this work to account for a covariate when the outcome is ordinal in nature. They again assign numeric scores to the distinct response categories and compare means between treatment groups adjusting for a covariate reflecting a baseline assessment measured on the same scale. Their simulation study shows that in the presence of three- point, four- point and five- point ordinal data and small sample sizes (as low as 20 per group), both ANCOVA and the two independent sample t- tests on difference scores are robust and produce actual signifi-cance levels close to the nominal significance levels.
Furthermore, statistical theory says that if the distri-bution of an outcome variable is Normal, so will be the distribution of the sample mean for that outcome vari-able. Much more importantly, even if the distribution of the outcome is not Normal, that of the sample mean will become closer to the Normal distribution as the sample size gets larger. This is a consequence of the Central Limit Theorem. The Normal distribution is strictly only the limiting form of the sampling distribution as the sample size increases to infinity, but it provides a remarkably good approximation to the sampling distribution even when the sample size is small, and the distribution of the outcome variable is far from Normal.65 Thus, conventional statistical methods such as the t- test, linear regression/ANCOVA for analysing PROs are robust to the violation of assumptions for moderate to large sample sizes.66
To the best of our knowledge, this study is by far the largest review of trials (with 114 studies) published by the HTA journal which analysed the frequency of using PROs and the statistical methods for the analysis of PROs. The reviews by Pe et al10 (breast cancer); Hamel et al9 (lung cancer) and Fiteni et al67 (lung cancer) had sample sizes of 66, 33, 27 articles, respectively. Compared with other reviews that concentrate on only one clinical area (ie, oncology),9 10 67–70 this review summarised details in the frequency of using PROs and applying statistical methods in RCTs with a range of clinical areas.
It is noteworthy that the proportions of trials using PROs reported in this review represent the average rate of HTA trials focusing on different clinical areas, and when considering specific disease(s) or selecting different database(s), the proportions may vary. For example, Pe et al10 identified 3/66 (5%) and 46/66 (70%) RCTs
of locally advanced and metastatic breast cancer using PROs as primary and secondary endpoints, respectively. Marandino et al71 reviewed 446 cancer trials published in major journals between 2012 and 2016, and found that PRO or QoL was a primary endpoint in five trials (1.1%), a secondary endpoint in 195 trials (43.7%) and an exploratory endpoint in 36 trials (8.1%), while in the remaining 210 (47.1%), QoL was not listed at all among the study endpoints. Our review found that 3 of 18 cancer trials (17%) used PROs as primary outcomes, and 13/18 (72%) used PROs as secondary outcomes. Our results showed that PROs were more frequently used for health problems such as mental and musculoskeletal diseases.
This study has the following limitations. First, this review looked only at publicly funded trials in the UK, which may represent a limitation in terms of the generalisability of the findings. It is possible that statistical methods are used differently in industry- funded trials or in trials in other countries. However, as the NIHR HTA journal intends to publish all NIHR- funded projects, it has less publication bias compared with journals that publish only positive outcomes, and the information related to PROs in other journals is not reported in as much detail. The extracted statistical methods for the analysis of PROs from this review are consistent with those included from other similar reviews.9 10 67–70 Second, there might be other appropriate methods for the analysis of PROs that were not included in this review. This review mainly analysed RCTs with PROs as primary outcomes because primary outcomes and the corresponding statistical methods were more explicitly reported.
Third, trials with PROs used only as cost- effectiveness outcomes were excluded. This is because the statistical strategies for clinical effectiveness and cost- effectiveness outcomes may vary, and cost- effectiveness analysis (CEA) produces both cost and clinical effectiveness outcomes. If PROs for CEA were included in this review, the propor-tion of included trials would increase, as there were some studies using EQ- 5D for the primary CEA. It could be argued that the analysis of effectiveness estimated by PROs in CEA also requires appropriate statistical methods, but estimands calculated for a health economic analysis could be different from those for a clinical analysis as they hold different purposes to conduct these analyses. Therefore, we believe it is justified to make this exclusion.
We used a broad definition for a PRO, and a small number of trials (seven) used PROs that were specifically developed for the trial and were not validated in another external study. The inclusion of such non- validated instru-ments as primary outcomes should be discouraged and may have affected the results, although the characteristics of these PROs (Likert Scale or VAS) are similar to those of the PROs that have been formally validated. We believe that it is not unreasonable to assume that the statistical analysis of such outcomes would be similar to the analysis of validated PROs.
Another potential limitation is the large time window, 1997–2020, chosen for the review. This may introduce
on S
ep
tem
be
r 7, 2
021
by g
ue
st. P
rote
cte
d b
y c
opyrig
ht.
http
://bm
jopen.b
mj.c
om
/B
MJ O
pe
n: firs
t pu
blis
he
d a
s 1
0.1
13
6/b
mjo
pe
n-2
02
1-0
51
67
3 o
n 6
Septe
mber 2
021. D
ow
nlo
aded fro
m

9Qian Y, et al. BMJ Open 2021;11:e051673. doi:10.1136/bmjopen-2021-051673
Open access
some variability and potential heterogeneity in the trials included in the review, but on the positive side, it allows testing of time trends in the type of statistical methods used in the trials.
Last, the information related to PROs and statistical methods was not clearly reported in some trials. Although assumptions have been made based on the context where some required information was not explicitly stated, it is possible that the data extracted were inconsistent with researchers’ intention. However, as the data have been extracted for all reports by one reviewer, there is consis-tency in the interpretation and assumptions made.
To produce explicit reports, it is recommended that researchers follow specific guidelines that can instruct the reporting of using PROs in RCT papers and protocols such as the CONSORT (Consolidated Standards of Reporting Trials) PRO (patient- reported outcomes) Extension,13 SPIRIT (Standard Protocol Items: Recommendations for Interventional Trials) PRO (patient- reported outcome) Extension72 and the standards for the analysis of PROs in cancer RCTs.62 In addition, a clear classification of the terminology of the statistical methods is desired. It is a historical problem that the names of statistical methods are confusing (eg, general linear model vs GzLM), and multiple terms can be used to describe the same method; for example, the proportional odds model, ordered logit model and ordinal logistic regression refer to the same regression technique. Thus, researchers should be clear and cautious when describing the exact statistical method for the analysis.
In addition to the abovementioned issues, other obsta-cles are also worth attention when analysing PROs in RCT settings, which can be broadly classified into three domains: first, the statistics domain—inadequate under-standing of basic statistical concepts,73 incorrect proce-dures used to carry out statistical analysis and incorrect statistical inference (eg, secretly hypothesising after results are known)74 75; second, the PROs domain—appli-cation of invalid measurements,76 lack of comparability among the results produced by various PROs77; and the third domain, reporting and publishing—publication bias and selective reporting of trials and their associated outcomes.77 78
In conclusion, the majority of trials funded by the NIHR HTA Programme used PROs as primary and/or secondary outcomes. Although there is an increasing trend of using complex models (eg, mixed effects), conventional methods such as linear regression remain widely used for the analysis of PROs, despite the potential violation of their assumptions. Statistical methods devel-oped to address these violations when analysing PROs, such as beta- binomial regression, are not routinely used in practice. Various methods for the analysis of PROs have been identified from this review, but it is still unknown which methods are the most appropriate for the analysis of PRO data. Future research will focus on evaluating available statistical methods and make recommendations on using different methods for the analysis of PRO data.
Contributors All authors contributed to the study concept and study design. YQ
and RJ contributed to the selection of data. YQ conducted the data extraction and
data analysis and drafted the manuscript. SW, RJ and LF contributed to the quality
assurance check of the data. All authors critically revised the manuscript and
approved the final manuscript.
Funding YQ is sponsored jointly by the University of Sheffield and China
Scholarship Council (grant number 201908890049). SW, RJ and LF received
funding across various projects by National Institute for Health Research (NIHR). SW
is an NIHR Senior Investigator supported by the NIHR (NF- SI-0617-10012) for this
research project. The views expressed in this publication are those of the authors
and not necessarily those of the NIHR, NHS or the UK Department of Health and
Social Care. These organisations had no role in the study design; in the collection,
analysis and interpretation of the data; in the writing of the report; or in the decision
to submit the paper for publication.
Competing interests The PhD study of YQ is financially sponsored by
the University of Sheffield and China Scholarship Council (grant number
201908890049). SW, RJ and LF received funding across various projects by the
National Institute for Health Research (NIHR). SW is a senior investigator at NIHR
(NF- SI-0617-10012) supported by the NIHR for this research project. The views
expressed in this publication are those of the authors and not necessarily those of
the NIHR, NHS or the UK Department of Health and Social Care. These organisations
had no role in the study design; in the collection, analysis and interpretation of
the data; in the writing of the report; or in the decision to submit the paper for
publication.
Patient and public involvement Patients and/or the public were not involved in
the design, conduct, reporting or dissemination plans of this research.
Patient consent for publication Not required.
Ethics approval The information extracted in this review is based on published
HTA trials where ethics approvals were obtained by the original trial teams.
This review does not involve recruiting new participants or analysing individual
participants, and the original participants cannot be identified from this review.
Provenance and peer review Not commissioned; externally peer reviewed.
Data availability statement Data are available upon reasonable request. The
information extracted in this review is based on published trials in the Health
Technology Assessment (HTA) journal. The data extracted from the HTA Journal
supporting the finding of this study is available on reasonable request from YQ at
yqian21@ sheffield. ac. uk.
Open access This is an open access article distributed in accordance with the
Creative Commons Attribution 4.0 Unported (CC BY 4.0) license, which permits
others to copy, redistribute, remix, transform and build upon this work for any
purpose, provided the original work is properly cited, a link to the licence is given,
and indication of whether changes were made. See: https:// creativecommons. org/
licenses/ by/ 4. 0/.
ORCID iDs
Yirui Qian http:// orcid. org/ 0000- 0002- 9276- 5654
Stephen J Walters http:// orcid. org/ 0000- 0001- 9000- 8126
Richard Jacques http:// orcid. org/ 0000- 0001- 6710- 5403
REFERENCES 1 Brazier J, Ratcliffe J, Salomon JA. Introduction to the measurement
and valuation of health. in: measuring and Valuing health benefits for economic evaluation. 2nd edn. Oxford: Oxford University Press, 2016: 7–30.
2 Akobeng AK. Understanding randomised controlled trials. Arch Dis Child 2005;90:840–4.
3 Altman DG. Better reporting of randomised controlled trials: the CONSORT statement. BMJ 1996;313:570–1.
4 Moher D, Hopewell S, Schulz KF, et al. Consort 2010 explanation and elaboration: updated guidelines for reporting parallel group randomised trials. BMJ 2010;340:c869.
5 Walters SJ. Quality of life outcomes in clinical trials and health- care evaluation. Chichester, UK: John Wiley & Sons, Ltd, 2009.
6 Walters S, Campbell J, Machin D. Medical statistics: a textbook for the health sciences. Hoboken: Wiley- Blackwell, 2021.
7 Walters SJ, Campbell MJ. The use of bootstrap methods for analysing health- related quality of life outcomes (particularly the SF-36). Health Qual Life Outcomes 2004;2.
on S
ep
tem
be
r 7, 2
021
by g
ue
st. P
rote
cte
d b
y c
opyrig
ht.
http
://bm
jopen.b
mj.c
om
/B
MJ O
pe
n: firs
t pu
blis
he
d a
s 1
0.1
13
6/b
mjo
pe
n-2
02
1-0
51
67
3 o
n 6
Septe
mber 2
021. D
ow
nlo
aded fro
m

10 Qian Y, et al. BMJ Open 2021;11:e051673. doi:10.1136/bmjopen-2021-051673
Open access
8 Lumley T, Diehr P, Emerson S, et al. The importance of the normality assumption in large public health data sets. Annu Rev Public Health 2002;23:151–69.
9 Hamel J- F, Saulnier P, Pe M, et al. A systematic review of the quality of statistical methods employed for analysing quality of life data in cancer randomised controlled trials. Eur J Cancer 2017;83:166–76.
10 Pe M, Dorme L, Coens C, et al. Statistical analysis of patient- reported outcome data in randomised controlled trials of locally advanced and metastatic breast cancer: a systematic review. Lancet Oncol 2018;19:e459–69.
11 Fitzpatrick R, Davey C, Buxton MJ, et al. Evaluating patient- based outcome measures for use in clinical trials. Health Technol Assess 1998;2:i- iv, 1-74.
12 Mokkink LB, Terwee CB, Patrick DL, et al. The COSMIN checklist for assessing the methodological quality of studies on measurement properties of health status measurement instruments: an international Delphi study. Qual Life Res 2010;19:539–49.
13 Calvert M, Blazeby J, Altman DG, et al. Reporting of patient- reported outcomes in randomized trials: the CONSORT pro extension. JAMA 2013;309:814–22.
14 Walters SJ, Bonacho Dos Anjos Henriques- Cadby I, Bortolami O, et al. Recruitment and retention of participants in randomised controlled trials: a review of trials funded and published by the United Kingdom health technology assessment programme. BMJ Open 2017;7:15276.
15 Schober P, Vetter TR. Repeated measures designs and analysis of longitudinal data: if at first you do not succeed- try, try again. Anesth Analg 2018;127:569–75.
16 Williams NH, Jenkins A, Goulden N, et al. Subcutaneous injection of adalimumab trial compared with control (sciatic): a randomised controlled trial of adalimumab injection compared with placebo for patients receiving physiotherapy treatment for sciatica. Health Technol Assess 2017;21:1–179.
17 Mihaylov S, Stark C, McColl E, et al. Stepped treatment of older adults on laxatives. The stool trial. Health Technol Assess 2008;12:iii- iv, ix-139.
18 Morrell CJ, Spiby H, Stewart P, et al. Costs and benefits of community postnatal support workers: a randomised controlled trial. Health Technol Assess 2000;4:1–100.
19 Santer M, Rumsby K, Ridd MJ, et al. Adding emollient bath additives to standard eczema management for children with eczema: the BATHE RCT. Health Technol Assess 2018;22:1–116.
20 Kerry S, Hilton S, Patel S, et al. Routine referral for radiography of patients presenting with low back pain: is patients' outcome influenced by GPs' referral for plain radiography? Health Technol Assess 2000;4:i–v.
21 Gazzard G, Konstantakopoulou E, Garway- Heath D, et al. Selective laser trabeculoplasty versus drops for newly diagnosed ocular hypertension and glaucoma: the LiGHT RCT. Health Technol Assess 2019;23:1–101.
22 Sharples L, Everett C, Singh J, et al. Amaze: a double- blind, multicentre randomised controlled trial to investigate the clinical effectiveness and cost- effectiveness of adding an ablation device- based maze procedure as an adjunct to routine cardiac surgery for patients with pre- existing atrial fibrillation. Health Technol Assess 2018;22:1–132.
23 Watson AJ, Cook J, Hudson J, et al. A pragmatic multicentre randomised controlled trial comparing stapled haemorrhoidopexy with traditional excisional surgery for haemorrhoidal disease: the eTHoS study. Health Technol Assess 2017;21:1–223.
24 Brittenden J, Cotton SC, Elders A, et al. Clinical effectiveness and cost- effectiveness of foam sclerotherapy, endovenous laser ablation and surgery for varicose veins: results from the comparison of laser, surgery and foam sclerotherapy (class) randomised controlled trial. Health Technol Assess 2015;19:1–341.
25 Russell IT, Edwards RT, Gliddon AE, et al. Cancer of Oesophagus or Gastricus - New Assessment of Technology of Endosonography (COGNATE): report of pragmatic randomised trial. Health Technol Assess 2013;17:1–13.
26 Michaels JA, Campbell WB, Brazier JE, et al. Randomised clinical trial, observational study and assessment of cost- effectiveness of the treatment of varicose veins (REACTIV trial). Health Technol Assess 2006;10:1–114.
27 Pickard R, Goulao B, Carnell S, et al. Open urethroplasty versus endoscopic urethrotomy for recurrent urethral stricture in men: the open rct. Health Technol Assess 2020;24:1–110.
28 Hewison J, Nixon J, Fountain J, et al. Amniocentesis results: investigation of anxiety. The ARIA trial. Health Technol Assess 2006;10:iii, ix- x, 1-78.
29 Bedson E, Bell D, Carr D, et al. Folate augmentation of treatment --Evaluation for depression (folated): randomised trial and economic evaluation. Health Technol Assess 2014;18:1–159.
30 Williams JG, Alam MF, Alrubaiy L, et al. Comparison of iNfliximab and ciclosporin in steroid resistant ulcerative colitis: pragmatic randomised trial and economic evaluation (construct). Health Technol Assess 2016;20:1–320.
31 Townsend J, Wolke D, Hayes J, et al. Routine examination of the newborn: the EMREN study. evaluation of an extension of the midwife role including a randomised controlled trial of appropriately trained midwives and paediatric senior house officers. Health Technol Assess 2004;8:iii- iv, ix- xi, 1-100.
32 Cooper K, Breeman S, Scott NW, et al. Laparoscopic supracervical hysterectomy compared with second- generation endometrial ablation for heavy menstrual bleeding: the health RCT. Health Technol Assess 2019;23:1–108.
33 Dennis M, Forbes J, Graham C, et al. Fluoxetine to improve functional outcomes in patients after acute stroke: the focus RCT. Health Technol Assess 2020;24:1–94.
34 Dennis M, Lewis S, Cranswick G, et al. FOOD: a multicentre randomised trial evaluating feeding policies in patients admitted to hospital with a recent stroke. Health Technol Assess 2006;10:1–91.
35 Banerjee S, Hellier J, Romeo R, et al. Study of the use of antidepressants for depression in dementia: the HTA- SADD trial – a multicentre, randomised, double- blind, placebo- controlled trial of the clinical effectiveness and cost- effectiveness of sertraline and mirtazapine. Health Technol Assess 2013;17:1–166.
36 Francis NA, Ridd MJ, Thomas- Jones E, et al. A randomised placebo- controlled trial of oral and topical antibiotics for children with clinically infected eczema in the community: the ChildRen with eczema, antibiotic management (CREAM) study. Health Technol Assess 2016;20:i- xxiv, 1-84.
37 Weindling AM, Cunningham CC, Glenn SM, et al. Additional therapy for young children with spastic cerebral palsy: a randomised controlled trial. Health Technol Assess 2007;11:iii- iv, ix- x, 1-71.
38 Grant A, Wileman S, Ramsay C, et al. The effectiveness and cost- effectiveness of minimal access surgery amongst people with gastro- oesophageal reflux disease - a UK collaborative study. The REFLUX trial. Health Technol Assess 2008;12:1–218.
39 Lewis SW, Davies L, Jones PB, et al. Randomised controlled trials of conventional antipsychotic versus new atypical drugs, and new atypical drugs versus clozapine, in people with schizophrenia responding poorly to, or intolerant of, current drug treatment. Health Technol Assess 2006;10:1–94.
40 Langhorne P, Wu O, Rodgers H, et al. A very early rehabilitation trial after stroke (AVERT): a phase III, multicentre, randomised controlled trial. Health Technol Assess 2017;21:1–119.
41 Bath PM, Woodhouse LJ, Appleton JP, et al. Triple versus guideline antiplatelet therapy to prevent recurrence after acute ischaemic stroke or transient ischaemic attack: the tardis RCT. Health Technol Assess 2018;22:1–75.
42 Montedori A, Bonacini MI, Casazza G, et al. Modified versus standard intention- to- treat reporting: are there differences in methodological quality, sponsorship, and findings in randomized trials? A cross- sectional study. Trials 2011;12:58.
43 Little P, Hobbs FDR, Moore M, et al. Primary care streptococcal management (PriSM) study: in vitro study, diagnostic cohorts and a pragmatic adaptive randomised controlled trial with nested qualitative study and cost- effectiveness study. Health Technol Assess 2014;18:1–102.
44 Little P, Turner S, Rumsby K, et al. Dipsticks and diagnostic algorithms in urinary tract infection: development and validation, randomised trial, economic analysis, observational cohort and qualitative study. Health Technol Assess 2009;13:iii- iv, ix- xi, 1-73.
45 Kennedy TM, Chalder T, McCrone P, et al. Cognitive behavioural therapy in addition to antispasmodic therapy for irritable bowel syndrome in primary care: randomised controlled trial. Health Technol Assess 2006;10:iii- iv, ix- x, 1-67.
46 Molassiotis A, Russell W, Hughes J, et al. The effectiveness and cost- effectiveness of acupressure for the control and management of chemotherapy- related acute and delayed nausea: assessment of nausea in chemotherapy research (anchor), a randomised controlled trial. Health Technol Assess 2013;17:1–114.
47 Shaw L, Bhattarai N, Cant R, et al. An extended stroke rehabilitation service for people who have had a stroke: the EXTRAS RCT. Health Technol Assess 2020;24:1–202.
48 Symmons D, Tricker K, Roberts C. Aggressive versus symptomatic therapy in established rheumatoid arthritis. Health Technol Assess 2005;9.
49 Wiggins M, Oakley A, Roberts I, et al. The social support and family health study: a randomised controlled trial and economic evaluation
on S
ep
tem
be
r 7, 2
021
by g
ue
st. P
rote
cte
d b
y c
opyrig
ht.
http
://bm
jopen.b
mj.c
om
/B
MJ O
pe
n: firs
t pu
blis
he
d a
s 1
0.1
13
6/b
mjo
pe
n-2
02
1-0
51
67
3 o
n 6
Septe
mber 2
021. D
ow
nlo
aded fro
m

11Qian Y, et al. BMJ Open 2021;11:e051673. doi:10.1136/bmjopen-2021-051673
Open access
of two alternative forms of postnatal support for mothers living in disadvantaged inner- city areas. Health Technol Assess 2004;8:iii, ix- x, 1-120.
50 Kennedy ADM, Sculpher MJ, Coulter A, et al. A multicentre randomised controlled trial assessing the costs and benefits of using structured information and analysis of women’s preferences in the management of menorrhagia. Health Technol Assess 2003;7.
51 Francis NA, Gillespie D, White P, et al. C- Reactive protein point- of- care testing for safely reducing antibiotics for acute exacerbations of chronic obstructive pulmonary disease: the PACE RCT. Health Technol Assess 2020;24:1–108.
52 Beard DJ, Davies LJ, Cook JA, et al. Total versus partial knee replacement in patients with medial compartment knee osteoarthritis: the TOPKAT RCT. Health Technol Assess 2020;24:1-98.
53 Chalder M, Wiles NJ, Campbell J, et al. A pragmatic randomised controlled trial to evaluate the cost- effectiveness of a physical activity intervention as a treatment for depression: the treating depression with physical activity (TREAD) trial. Health Technol Assess 2012;16:1-164, iii- iv.
54 Goodyer IM, Reynolds S, Barrett B, et al. Cognitive- behavioural therapy and short- term psychoanalytic psychotherapy versus brief psychosocial intervention in adolescents with unipolar major depression (IMPACT): a multicentre, pragmatic, observer- blind, randomised controlled trial. Health Technol Assess 2017;21:1–93.
55 Goodacre S, Cohen J, Bradburn M, et al. The 3Mg trial: a randomised controlled trial of intravenous or nebulised magnesium sulphate versus placebo in adults with acute severe asthma. Health Technol Assess 2014;18:1–168.
56 Williams MA, Williamson EM, Heine PJ, et al. Strengthening and stretching for rheumatoid arthritis of the hand (SARAH). A randomised controlled trial and economic evaluation. Health Technol Assess 2015;19:221.
57 Clarke CE, Patel S, Ives N, et al. Clinical effectiveness and cost- effectiveness of physiotherapy and occupational therapy versus no therapy in mild to moderate Parkinson’s disease: a large pragmatic randomised controlled trial (PD REHAB). Health Technol Assess 2016;20:1–96.
58 Peveler R, Kendrick T, Buxton M, et al. A randomised controlled trial to compare the cost- effectiveness of tricyclic antidepressants, selective serotonin reuptake inhibitors and lofepramine. Health Technol Assess 2005;9:1-134, iii.
59 Arostegui I, Núñez- Antón V, Quintana JM. Statistical approaches to analyse patient- reported outcomes as response variables: an application to health- related quality of life. Stat Methods Med Res 2012;21:189–214.
60 Shields A, Coon C, Hao Y, et al. Patient- reported outcomes for us oncology labeling: review and discussion of score interpretation and analysis methods. Expert Rev Pharmacoecon Outcomes Res 2015;15:951–9.
61 Arostegui I, Núñez- Antón V, Quintana JM. Analysis of the short form-36 (SF-36): the beta- binomial distribution approach. Stat Med 2007;26:1318–42.
62 Coens C, Pe M, Dueck AC, et al. International standards for the analysis of quality- of- life and patient- reported outcome endpoints in cancer randomised controlled trials: recommendations of the SISAQOL Consortium. Lancet Oncol 2020;21:e83–96.
63 Heeren T, D'Agostino R. Robustness of the two independent samples t- test when applied to ordinal scaled data. Stat Med 1987;6:79–90.
64 Sullivan LM, D'Agostino RB. Robustness and power of analysis of covariance applied to ordinal scaled data as arising in randomized controlled trials. Stat Med 2003;22:1317–34.
65 Armitage P, Berry G, Matthews JNS. Statistical methods in medical research. 4th edn. Oxford: Blackwell Science, 2002.
66 Walters SJ. Quality of life outcomes in clinical trials and health- care evaluation. Chichester: Wiley, 2009.
67 Fiteni F, Anota A, Westeel V, et al. Methodology of health- related quality of life analysis in phase III advanced non- small- cell lung cancer clinical trials: a critical review. BMC Cancer 2016;16:122.
68 Fiteni F, Ray IL, Ousmen A, et al. Health- related quality of life as an endpoint in oncology phase I trials: a systematic review. BMC Cancer 2019;19:361.
69 Nielsen LK, Abildgaard N, Jarden M, et al. Methodological aspects of health- related quality of life measurement and analysis in patients with multiple myeloma. Br J Haematol 2019;185:11–24.
70 Turner- Bowker DM, Hao Y, Foley C, et al. The use of patient- reported outcomes in advanced breast cancer clinical trials: a review of the published literature. Curr Med Res Opin 2016;32:1709–17.
71 Marandino L, La Salvia A, Sonetto C, et al. Deficiencies in health- related quality- of- life assessment and reporting: a systematic review of oncology randomized phase III trials published between 2012 and 2016. Ann Oncol 2018;29:2288–95.
72 Calvert M, Kyte D, Mercieca- Bebber R, et al. Guidelines for inclusion of patient- reported outcomes in clinical trial protocols: the spirit- pro extension. JAMA 2018;319:483–94.
73 Gigerenzer G, Gaissmaier W, Kurz- Milcke E, et al. Helping doctors and patients make sense of health statistics. Psychol Sci Public Interest 2007;8:53–96.
74 Hollenbeck JR, Harking WPM. Sharking, and Tharking: making the case for post hoc analysis of scientific data. J Manage 2017;43:5–18.
75 Localio AR, Stack CB, Meibohm AR, et al. Inappropriate statistical analysis and reporting in medical research: perverse incentives and institutional solutions. Ann Intern Med 2018;169:577–8.
76 Chang EM, Gillespie EF, Shaverdian N. Truthfulness in patient- reported outcomes: factors affecting patients' responses and impact on data quality. Patient Relat Outcome Meas 2019;10:171–86.
77 Yordanov Y, Dechartres A, Atal I, et al. Avoidable waste of research related to outcome planning and reporting in clinical trials. BMC Med 2018;16:87.
78 Ioannidis JPA, Greenland S, Hlatky MA, et al. Increasing value and reducing waste in research design, conduct, and analysis. Lancet 2014;383:166–75.
79 Ware JE, Sherbourne CD. The mos 36- item short- form health survey (SF-36). I. conceptual framework and item selection. Med Care 1992;30:473–83.
80 McHorney CA, Ware JE, Raczek AE. The MOS 36- item short- form health survey (SF-36): II. Psychometric and clinical tests of validity in measuring physical and mental health constructs. Med Care 1993;31:247–63.
81 McHorney CA, Ware JE, Lu JF, et al. The MOS 36- item short- form health survey (SF-36): III. Tests of data quality, scaling assumptions, and reliability across diverse patient groups. Med Care 1994;32:40–66.
82 Brazier J, Roberts J, Deverill M. The estimation of a preference- based measure of health from the SF-36. J Health Econ 2002;21:271–92.
83 Beck AT, Steer RA, Carbin MG. Psychometric properties of the Beck depression inventory: twenty- five years of evaluation. Clin Psychol Rev 1988;8:77–100.
84 Zigmond AS, Snaith RP. The hospital anxiety and depression scale. Acta Psychiatr Scand 1983;67:361–70.
85 The EuroQol Group. EuroQol - a new facility for the measurement of health- related quality of life. Health Policy 1990;16:199–208.
86 Dolan P. Modeling valuations for EuroQol health states. Med Care 1997;35:1095–108.
87 Herdman M, Gudex C, Lloyd A, et al. Development and preliminary testing of the new five- level version of EQ- 5D (EQ- 5D- 5L). Qual Life Res 2011;20:1727–36.
88 Spitzer RL, Kroenke K, Williams JBW. Validation and utility of a self- report version of PRIME- MD: the PHQ primary care study. J Am Med Assoc 1999;282:1737–44.
89 Dawson J, Fitzpatrick R, Carr A. Questionnaire on the perceptions of patients about shoulder surgery. J Bone Joint Surg Br 1996;78- B:593–600.
on S
ep
tem
be
r 7, 2
021
by g
ue
st. P
rote
cte
d b
y c
opyrig
ht.
http
://bm
jopen.b
mj.c
om
/B
MJ O
pe
n: firs
t pu
blis
he
d a
s 1
0.1
13
6/b
mjo
pe
n-2
02
1-0
51
67
3 o
n 6
Septe
mber 2
021. D
ow
nlo
aded fro
m
Related Documents