Sidik Mulyono, M. Ivan Fanany Faculty of Computer Science Universitas Indonesia Indonesia Agency for The Assessment and Application of Technology Comprehensive Hyperspectral Analysis for Indonesian Rice Agricultural Needs involving Climate and Social Dynamics

Welcome message from author
This document is posted to help you gain knowledge. Please leave a comment to let me know what you think about it! Share it to your friends and learn new things together.
Transcript

Page 1
Sidik Mulyono,
M. Ivan Fanany
Faculty of Computer ScienceUniversitas Indonesia
Indonesia Agency for The Assessment and Application of Technology
Comprehensive Hyperspectral
Analysis for Indonesian Rice
Agricultural Needs involving
Climate and Social Dynamics
Page 2
OUTLINE
1. Introduction:
Indonesia at a glance
Background
2. Our research
GA-NSPCR for feature
selection and yield
prediction using
hyperspectral
Balanced branches SVM
for growth stages
classification
An ensemble incremental
approach ELM for growth
stages classification
3. Related Studies
4. Remaining Problems &
Discussion

Page 3
1. INTRODUCTION
Page 4
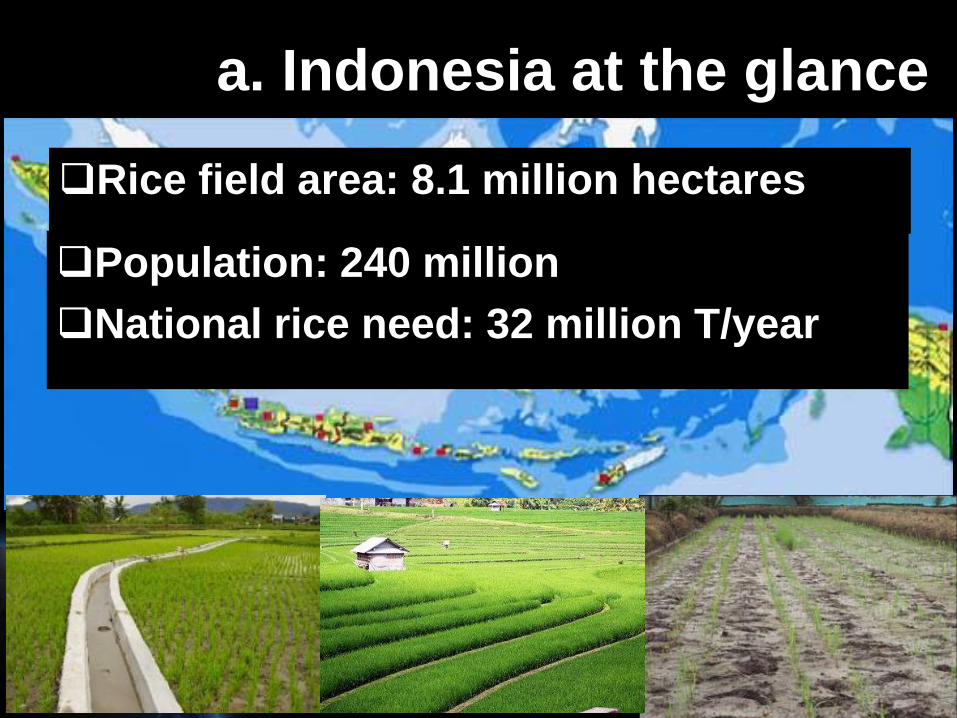
a. Indonesia at the glance
Indonesia Archipelago
Rice field area: 8.1 million hectares
Population: 240 million
National rice need: 32 million T/year
Page 5
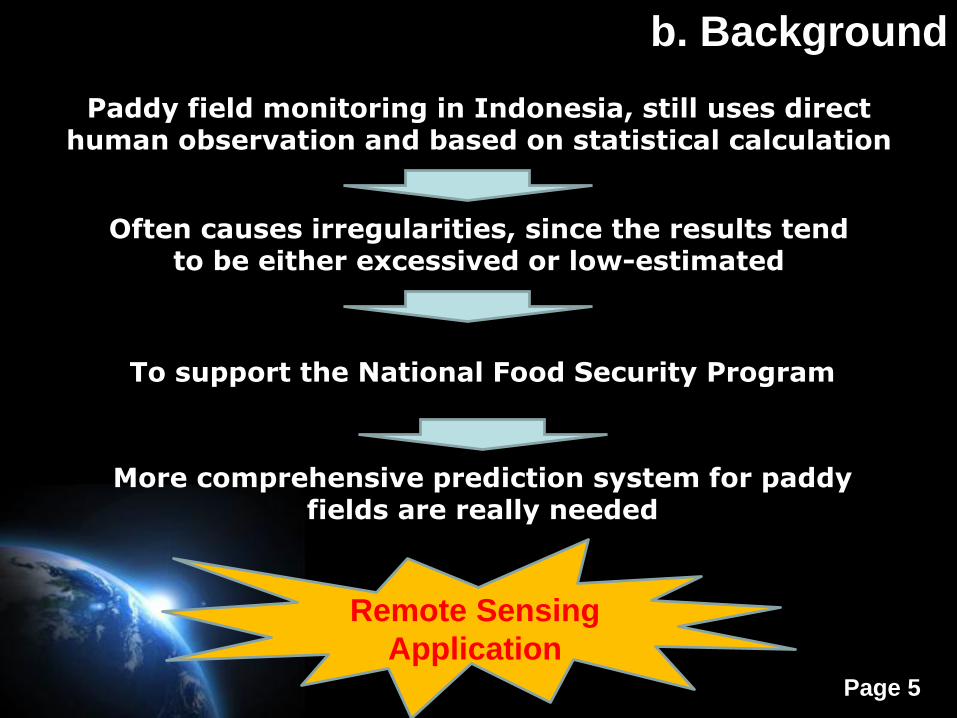
b. Background
Paddy field monitoring in Indonesia, still uses direct human observation and based on statistical calculation
Often causes irregularities, since the results tend to be either excessived or low-estimated
More comprehensive prediction system for paddy fields are really needed
To support the National Food Security Program
Remote Sensing
Application

Page 6
2. OUR RESEARCH
Page 7
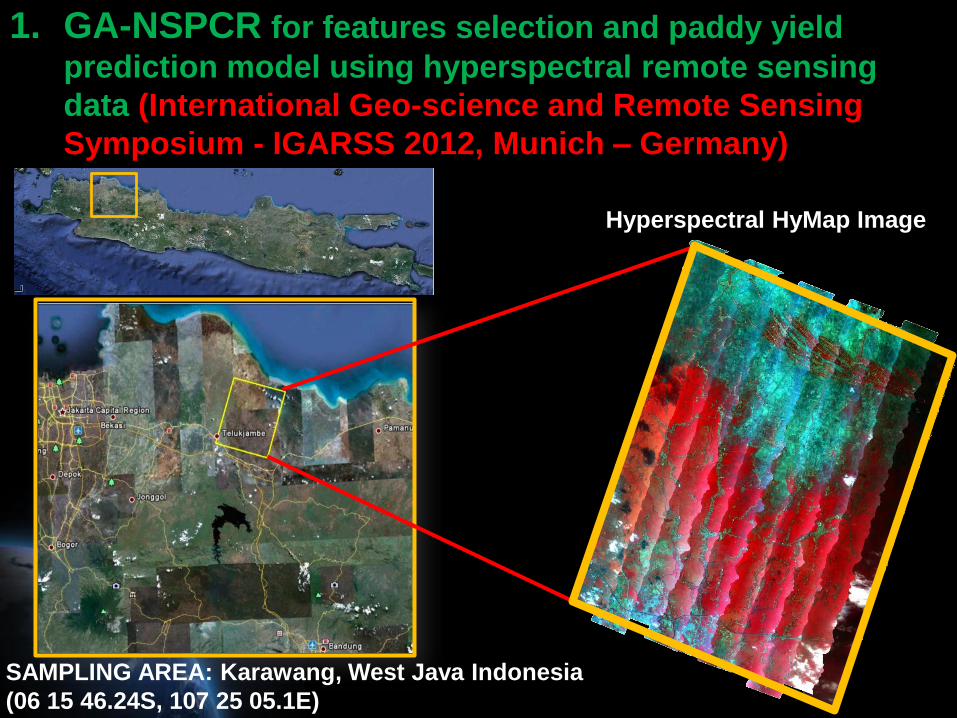
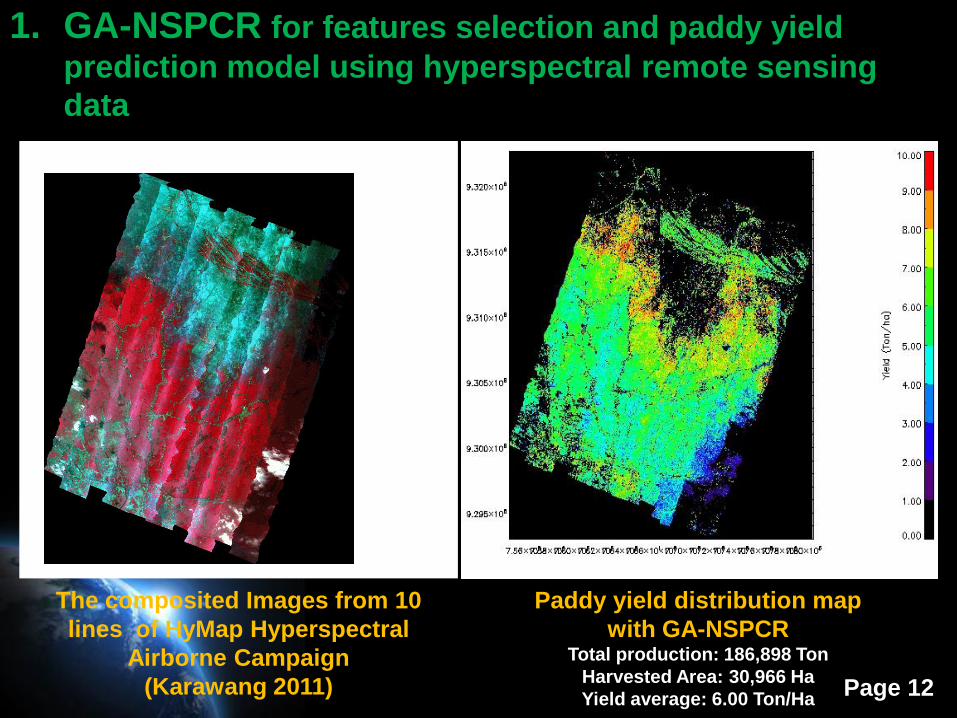
1. GA-NSPCR for features selection and paddy yield
prediction model using hyperspectral remote sensing
data (International Geo-science and Remote Sensing
Symposium - IGARSS 2012, Munich – Germany)
SAMPLING AREA: Karawang, West Java Indonesia
(06 15 46.24S, 107 25 05.1E)
Hyperspectral HyMap Image
Page 8
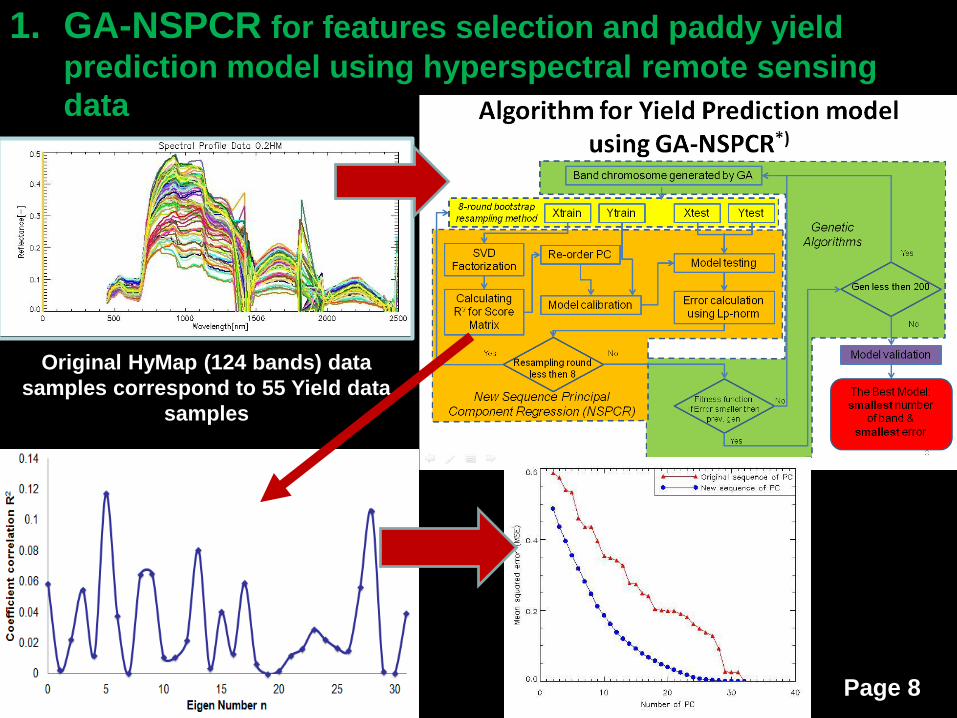
1. GA-NSPCR for features selection and paddy yield
prediction model using hyperspectral remote sensing
data
Original HyMap (124 bands) data
samples correspond to 55 Yield data
samples
Page 99
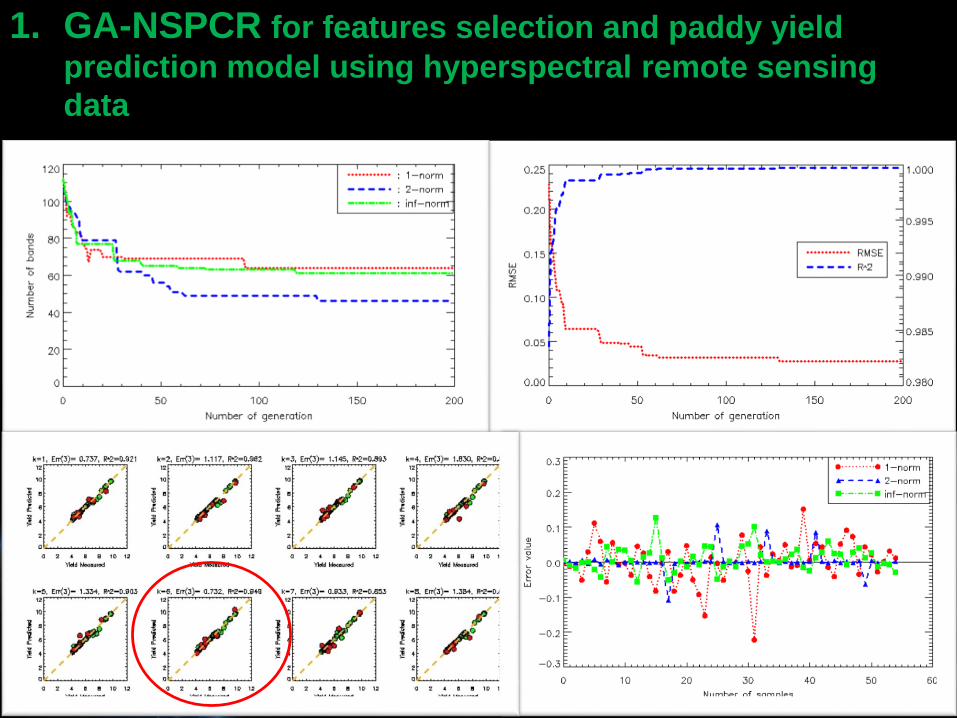
1. GA-NSPCR for features selection and paddy yield
prediction model using hyperspectral remote sensing
data
Page 1010
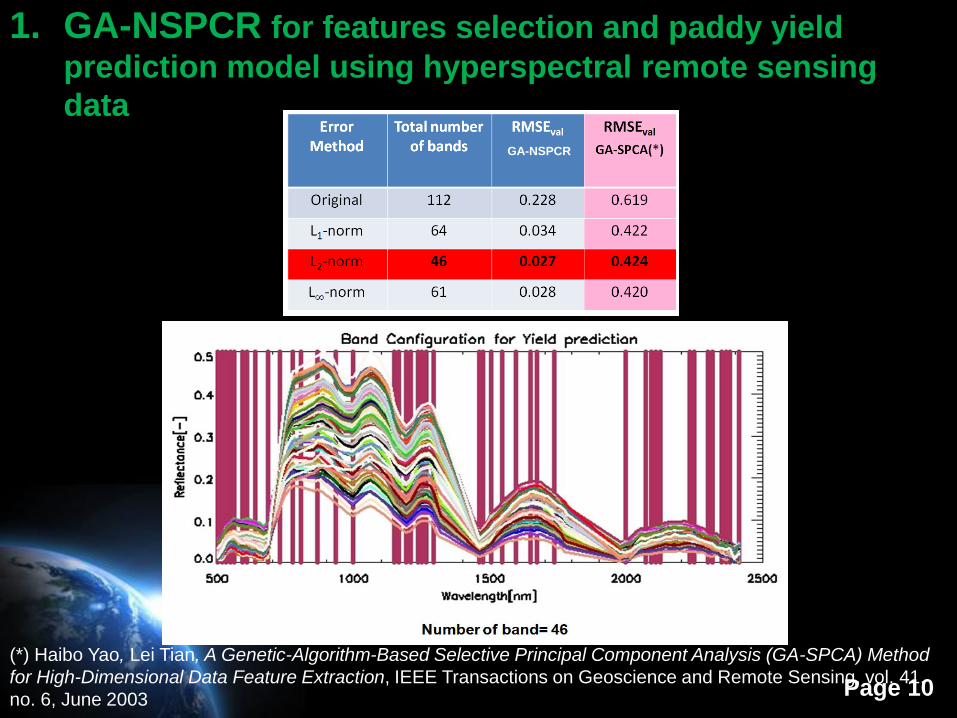
1. GA-NSPCR for features selection and paddy yield
prediction model using hyperspectral remote sensing
data
GA-NSPCR
(*) Haibo Yao, Lei Tian, A Genetic-Algorithm-Based Selective Principal Component Analysis (GA-SPCA) Method
for High-Dimensional Data Feature Extraction, IEEE Transactions on Geoscience and Remote Sensing, vol. 41,
no. 6, June 2003
Page 11
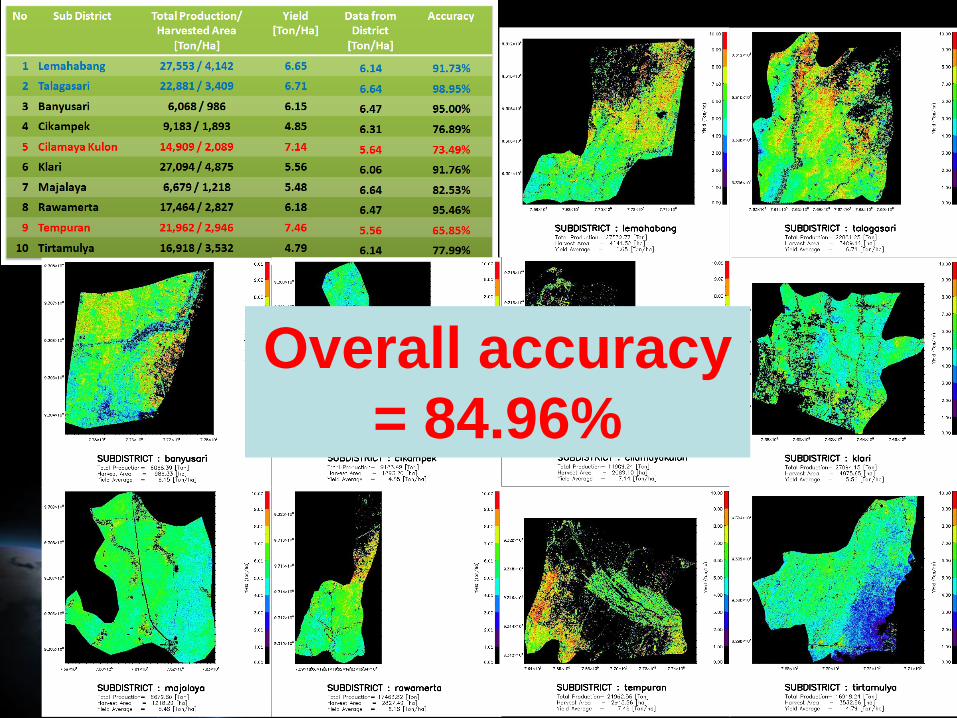
Statistical Validation
Overall accuracy
= 84.96%
Page 12
The composited Images from 10
lines of HyMap Hyperspectral
Airborne Campaign
(Karawang 2011)
Paddy yield distribution map
with GA-NSPCRTotal production: 186,898 Ton
Harvested Area: 30,966 Ha
Yield average: 6.00 Ton/Ha
1. GA-NSPCR for features selection and paddy yield
prediction model using hyperspectral remote sensing
data
Page 13
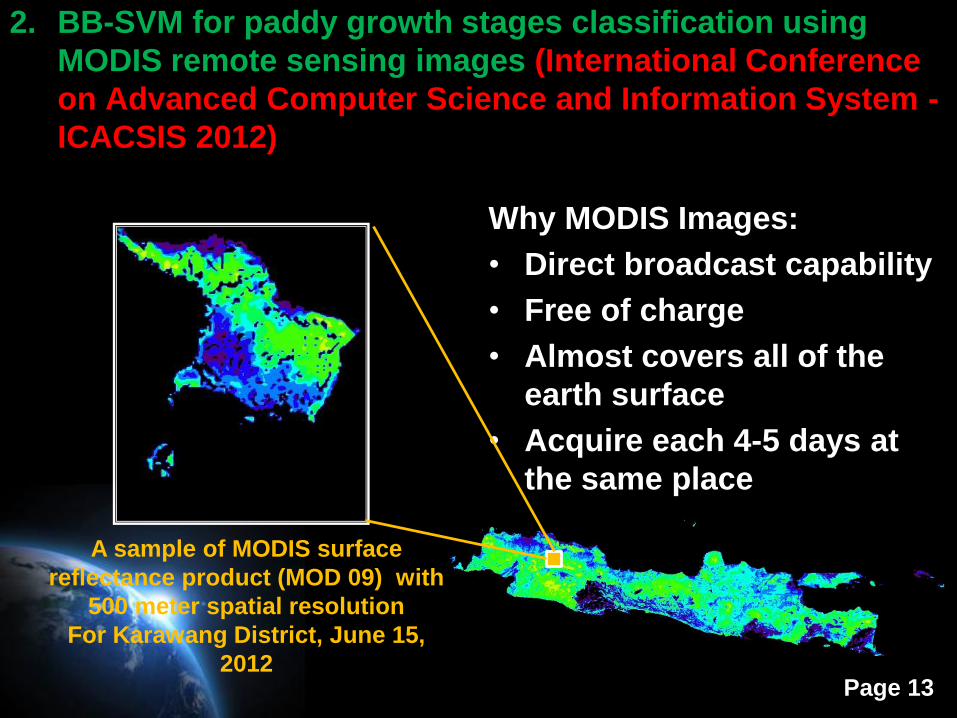
Why MODIS Images:
• Direct broadcast capability
• Free of charge
• Almost covers all of the
earth surface
• Acquire each 4-5 days at
the same place
A sample of MODIS surface
reflectance product (MOD 09) with
500 meter spatial resolution
For Karawang District, June 15,
2012
2. BB-SVM for paddy growth stages classification using
MODIS remote sensing images (International Conference
on Advanced Computer Science and Information System -
ICACSIS 2012)
Page 14
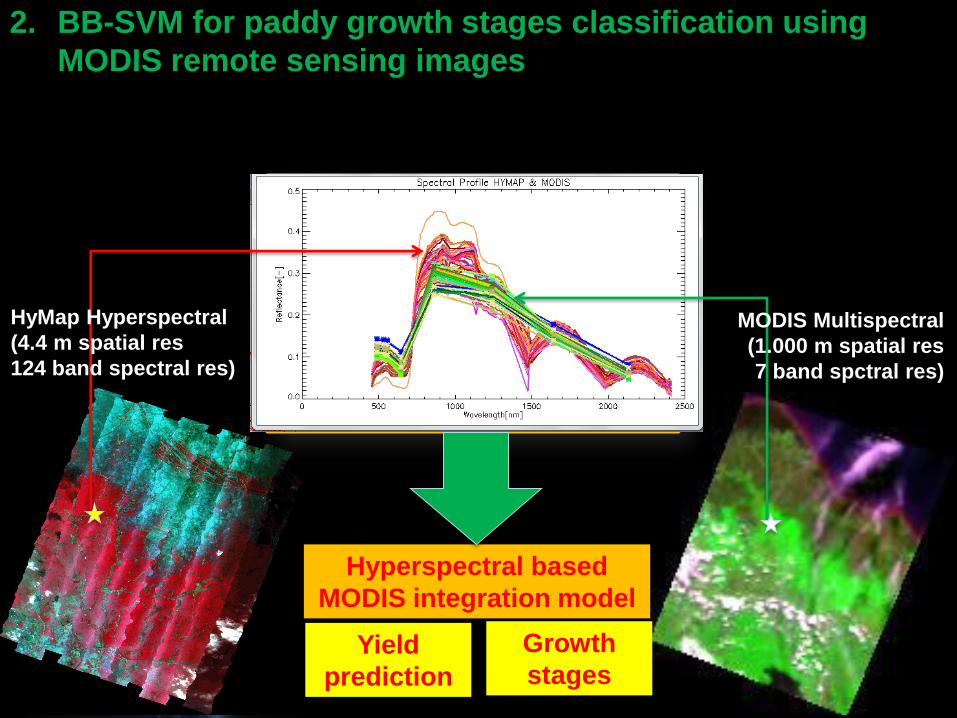
HyMap Hyperspectral
(4.4 m spatial res
124 band spectral res)
MODIS Multispectral
(1.000 m spatial res
7 band spctral res)
Hyperspectral based
MODIS integration model
2. BB-SVM for paddy growth stages classification using
MODIS remote sensing images
Yield
prediction
Growth
stages
Page 15
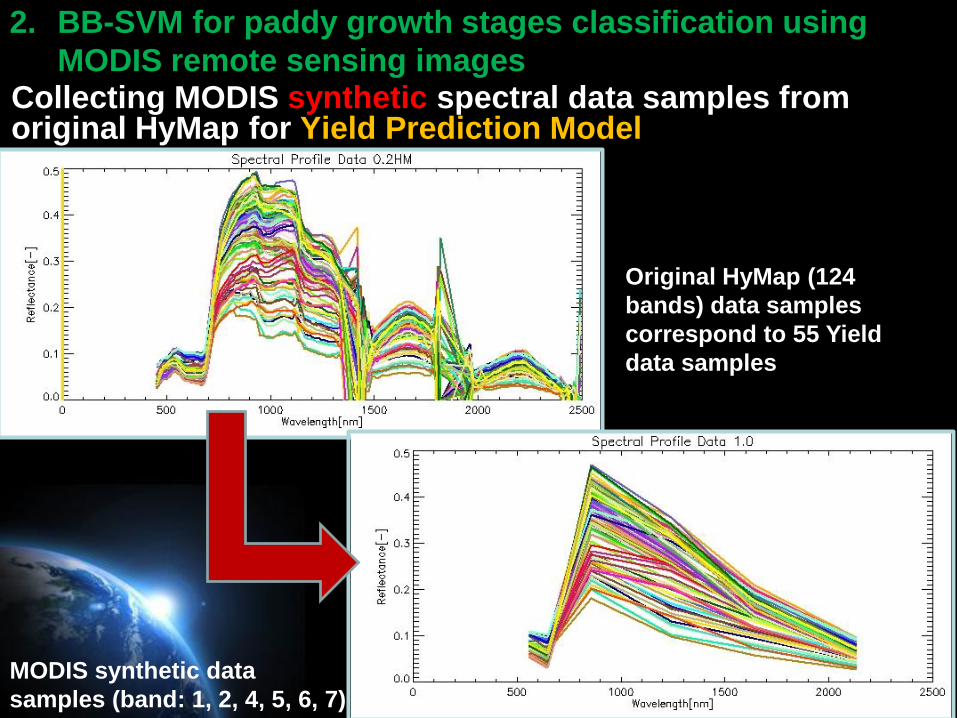
Collecting MODIS synthetic spectral data samples from original HyMap for Yield Prediction Model
Original HyMap (124
bands) data samples
correspond to 55 Yield
data samples
MODIS synthetic data
samples (band: 1, 2, 4, 5, 6, 7)
2. BB-SVM for paddy growth stages classification using
MODIS remote sensing images
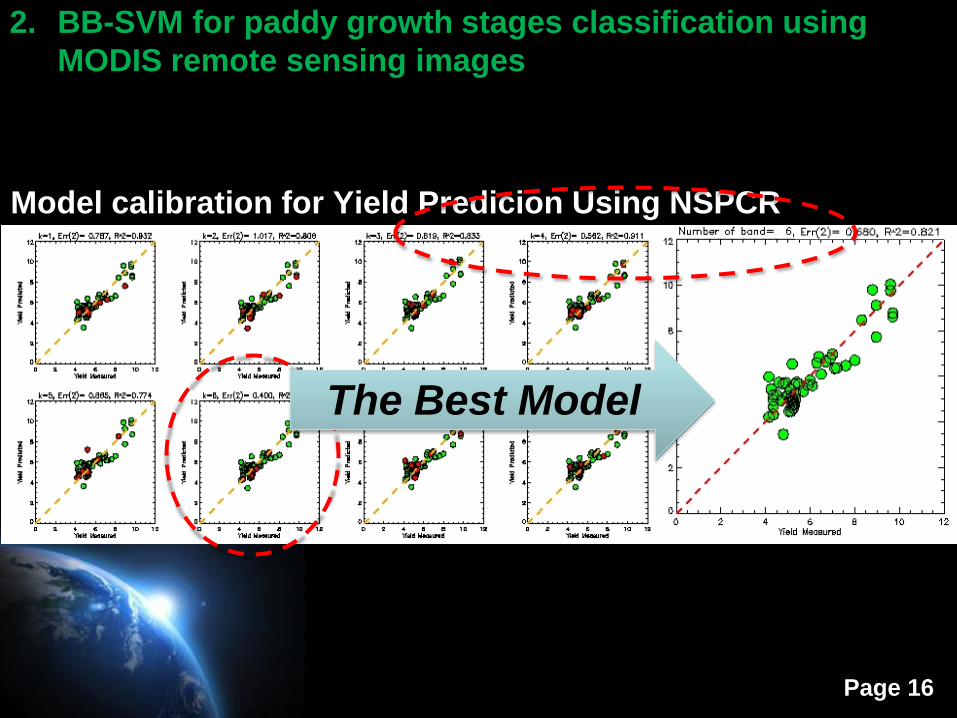
Page 16
Model calibration for Yield Predicion Using NSPCR
The Best Model
2. BB-SVM for paddy growth stages classification using
MODIS remote sensing images
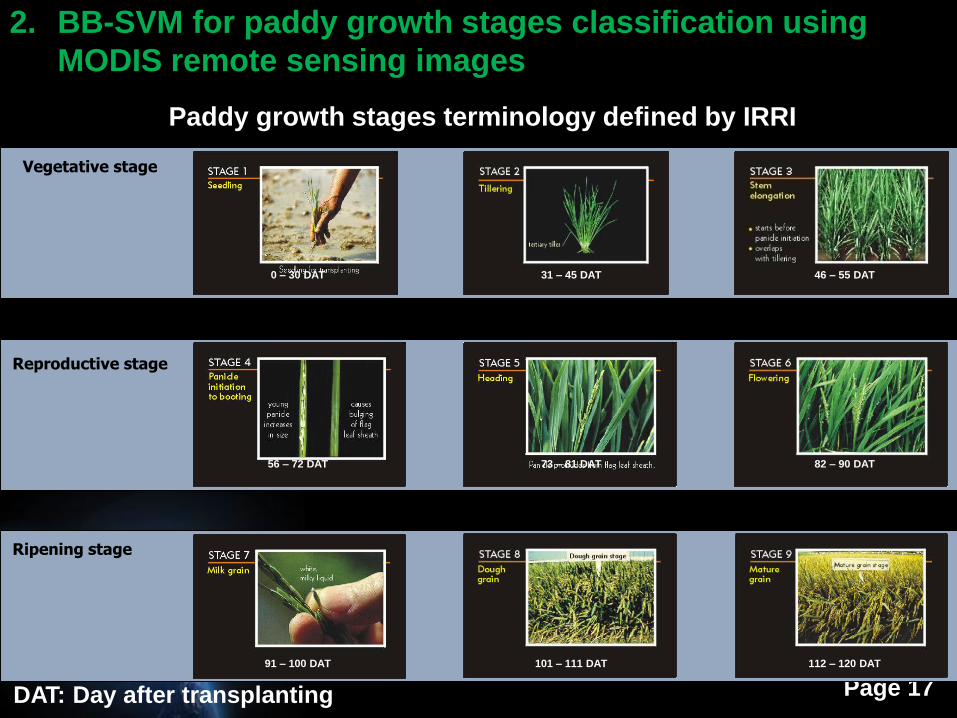
Page 17
Vegetative stage
Reproductive stage
Ripening stage
0 – 30 DAT 31 – 45 DAT 46 – 55 DAT
56 – 72 DAT 73 – 81 DAT 82 – 90 DAT
91 – 100 DAT 101 – 111 DAT 112 – 120 DAT
Paddy growth stages terminology defined by IRRI
2. BB-SVM for paddy growth stages classification using
MODIS remote sensing images
DAT: Day after transplanting
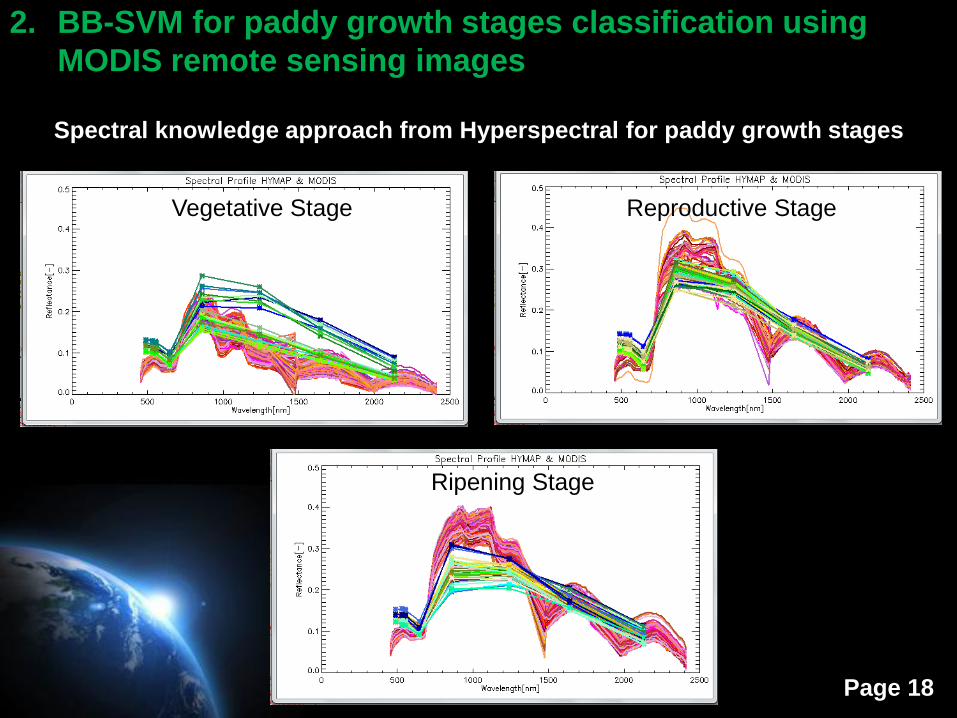
Page 18
Spectral knowledge approach from Hyperspectral for paddy growth stages
Vegetative Stage Reproductive Stage
Ripening Stage
2. BB-SVM for paddy growth stages classification using
MODIS remote sensing images
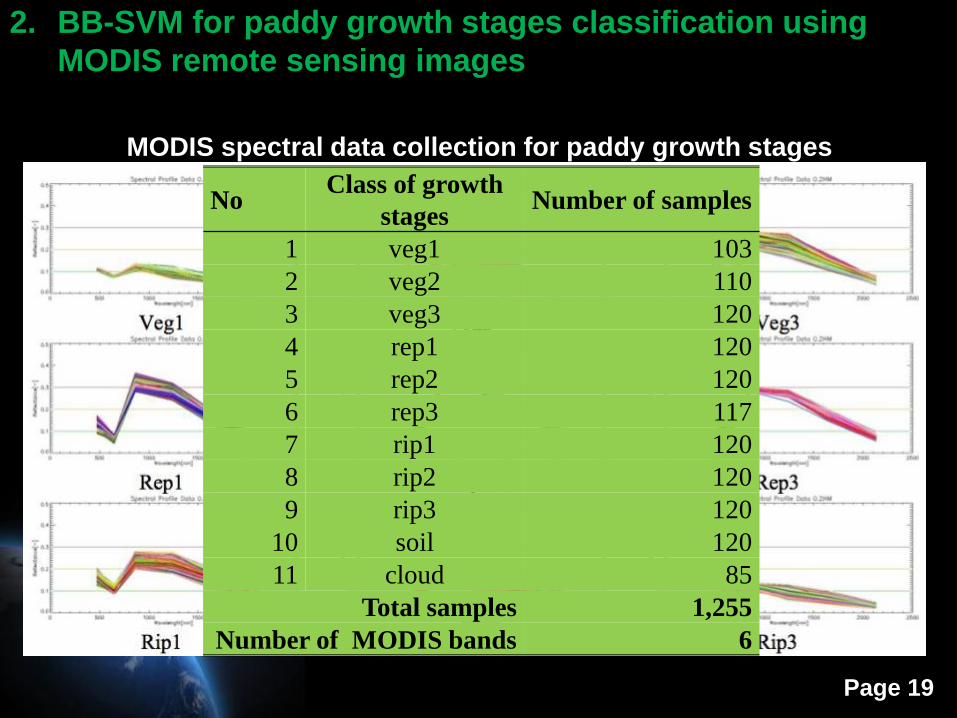
Page 19
MODIS spectral data collection for paddy growth stages
NoClass of growth
stagesNumber of samples
1 veg1 103
2 veg2 110
3 veg3 120
4 rep1 120
5 rep2 120
6 rep3 117
7 rip1 120
8 rip2 120
9 rip3 120
10 soil 120
11 cloud 85
Total samples 1,255
Number of MODIS bands 6
2. BB-SVM for paddy growth stages classification using
MODIS remote sensing images
Page 20
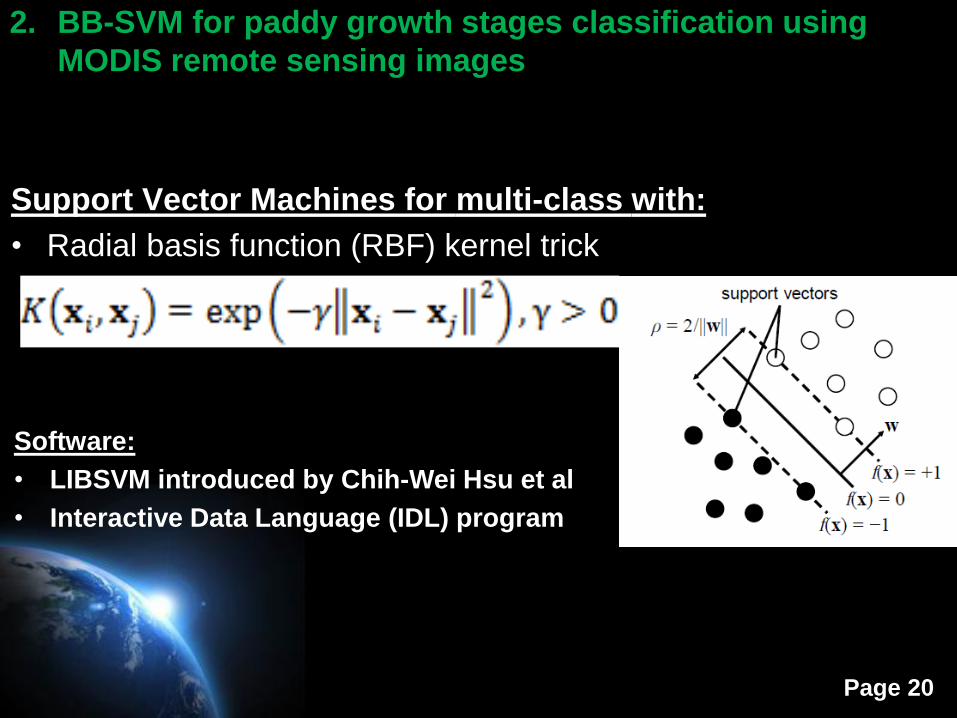
Support Vector Machines for multi-class with:
• Radial basis function (RBF) kernel trick
Software:
• LIBSVM introduced by Chih-Wei Hsu et al
• Interactive Data Language (IDL) program
2. BB-SVM for paddy growth stages classification using
MODIS remote sensing images
Page 21
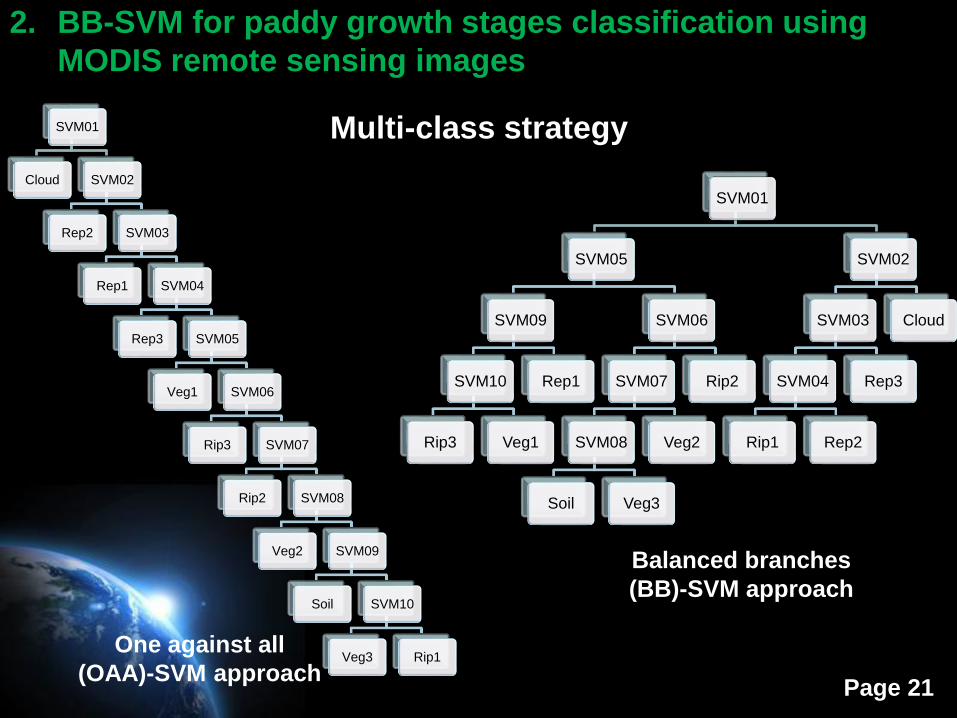
SVM01
Cloud SVM02
Rep2 SVM03
Rep1 SVM04
Rep3 SVM05
Veg1 SVM06
Rip3 SVM07
Rip2 SVM08
Veg2 SVM09
Soil SVM10
Veg3 Rip1One against all
(OAA)-SVM approach
SVM01
SVM05
SVM09
SVM10
Rip3 Veg1
Rep1
SVM06
SVM07
SVM08
Soil Veg3
Veg2
Rip2
SVM02
SVM03
SVM04
Rip1 Rep2
Rep3
Cloud
Balanced branches
(BB)-SVM approach
Multi-class strategy
2. BB-SVM for paddy growth stages classification using
MODIS remote sensing images
Page 22
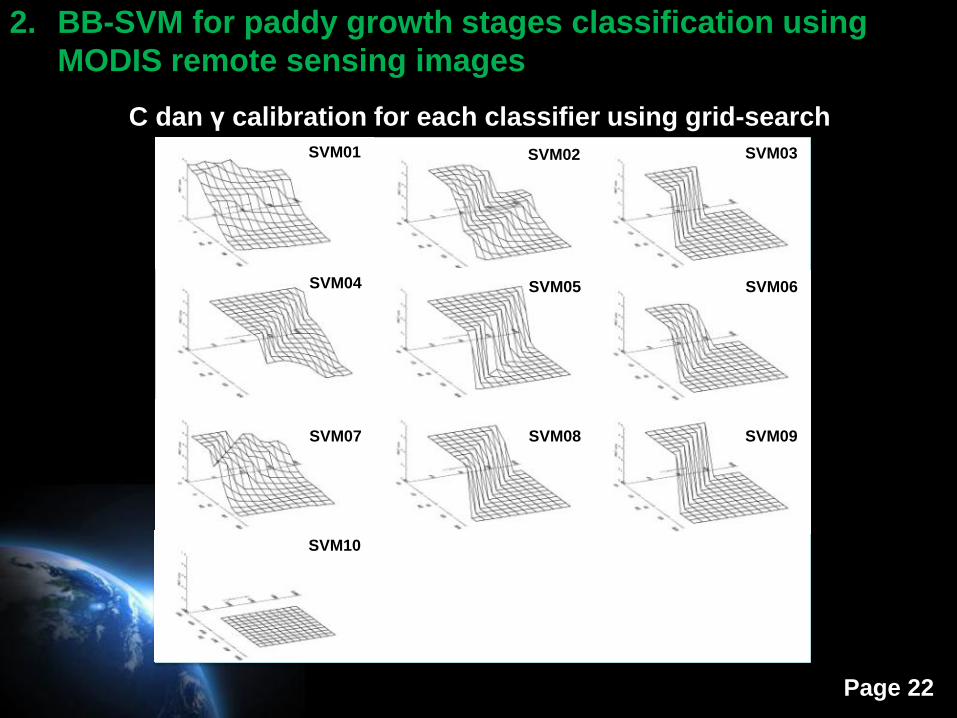
C dan γ calibration for each classifier using grid-search
SVM01 SVM02 SVM03
SVM04 SVM05 SVM06
SVM07 SVM08 SVM09
SVM10
2. BB-SVM for paddy growth stages classification using
MODIS remote sensing images
Page 23
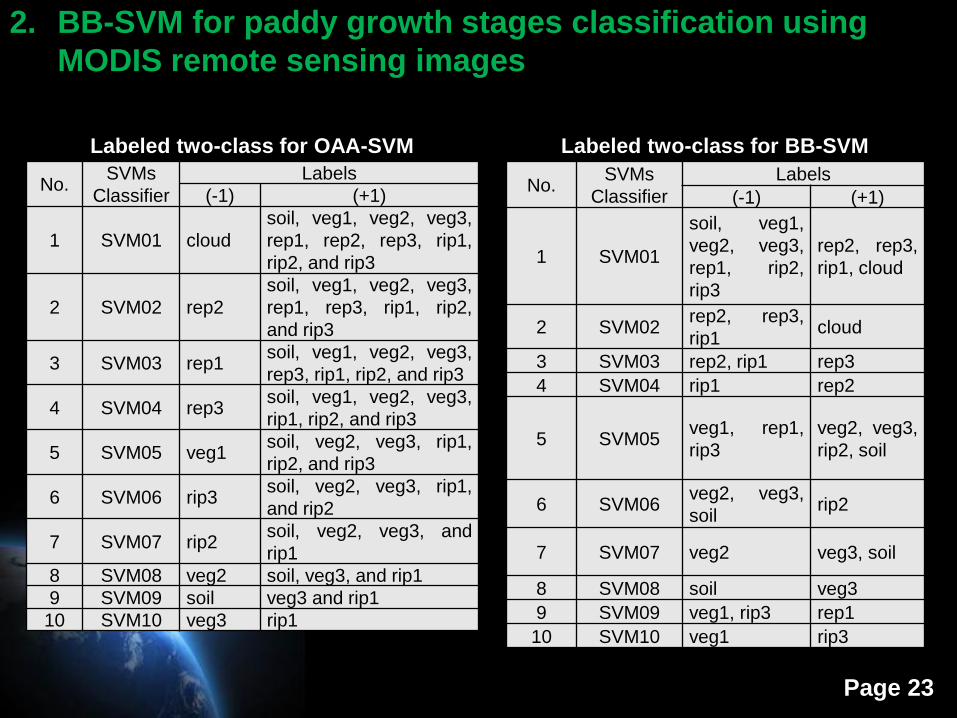
Labeled two-class for OAA-SVM Labeled two-class for BB-SVM
No.SVMs
Classifier
Labels
(-1) (+1)
1 SVM01 cloud
soil, veg1, veg2, veg3,
rep1, rep2, rep3, rip1,
rip2, and rip3
2 SVM02 rep2
soil, veg1, veg2, veg3,
rep1, rep3, rip1, rip2,
and rip3
3 SVM03 rep1soil, veg1, veg2, veg3,
rep3, rip1, rip2, and rip3
4 SVM04 rep3soil, veg1, veg2, veg3,
rip1, rip2, and rip3
5 SVM05 veg1soil, veg2, veg3, rip1,
rip2, and rip3
6 SVM06 rip3soil, veg2, veg3, rip1,
and rip2
7 SVM07 rip2soil, veg2, veg3, and
rip1
8 SVM08 veg2 soil, veg3, and rip1
9 SVM09 soil veg3 and rip1
10 SVM10 veg3 rip1
No.SVMs
Classifier
Labels
(-1) (+1)
1 SVM01
soil, veg1,
veg2, veg3,
rep1, rip2,
rip3
rep2, rep3,
rip1, cloud
2 SVM02rep2, rep3,
rip1cloud
3 SVM03 rep2, rip1 rep3
4 SVM04 rip1 rep2
5 SVM05veg1, rep1,
rip3
veg2, veg3,
rip2, soil
6 SVM06veg2, veg3,
soilrip2
7 SVM07 veg2 veg3, soil
8 SVM08 soil veg3
9 SVM09 veg1, rip3 rep1
10 SVM10 veg1 rip3
2. BB-SVM for paddy growth stages classification using
MODIS remote sensing images
Page 24
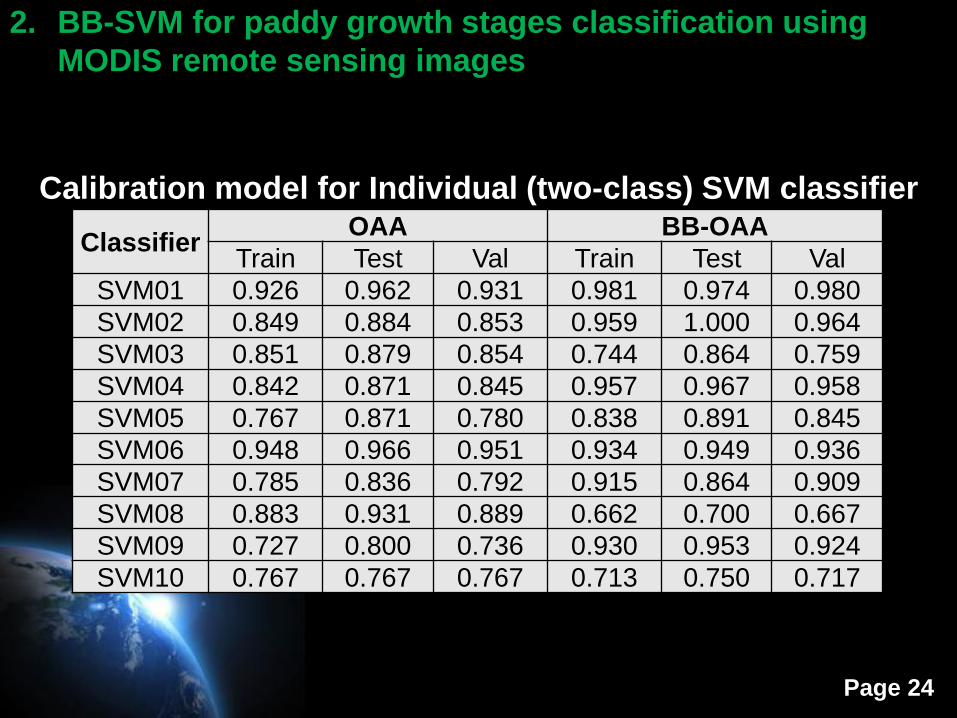
Calibration model for Individual (two-class) SVM classifier
ClassifierOAA BB-OAA
Train Test Val Train Test Val
SVM01 0.926 0.962 0.931 0.981 0.974 0.980
SVM02 0.849 0.884 0.853 0.959 1.000 0.964
SVM03 0.851 0.879 0.854 0.744 0.864 0.759
SVM04 0.842 0.871 0.845 0.957 0.967 0.958
SVM05 0.767 0.871 0.780 0.838 0.891 0.845
SVM06 0.948 0.966 0.951 0.934 0.949 0.936
SVM07 0.785 0.836 0.792 0.915 0.864 0.909
SVM08 0.883 0.931 0.889 0.662 0.700 0.667
SVM09 0.727 0.800 0.736 0.930 0.953 0.924
SVM10 0.767 0.767 0.767 0.713 0.750 0.717
2. BB-SVM for paddy growth stages classification using
MODIS remote sensing images
Page 25
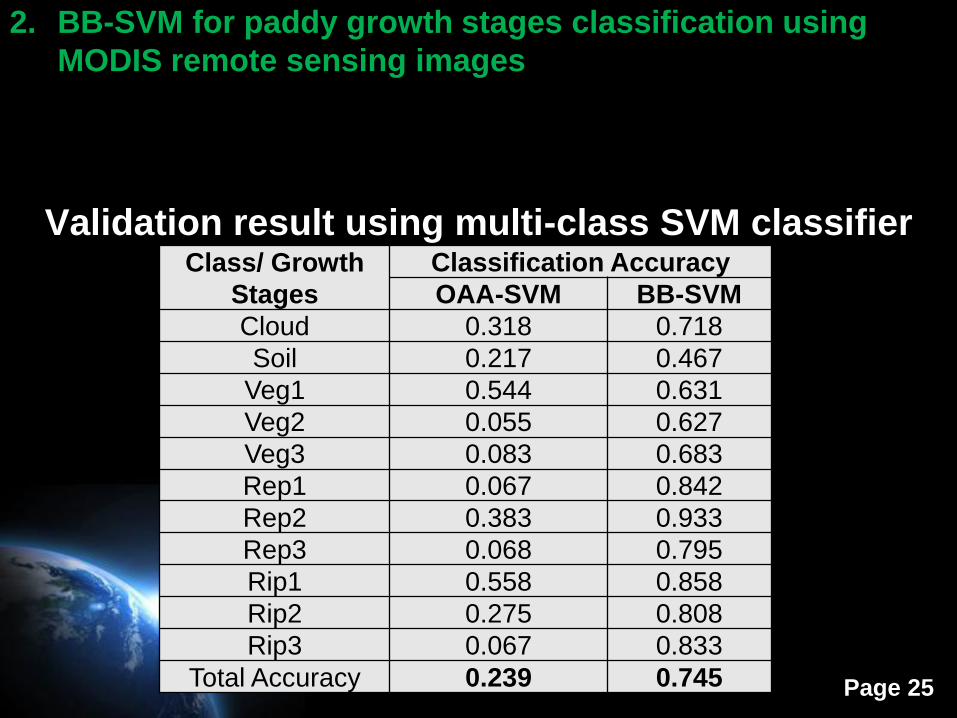
Validation result using multi-class SVM classifierClass/ Growth
Stages
Classification Accuracy
OAA-SVM BB-SVM
Cloud 0.318 0.718
Soil 0.217 0.467
Veg1 0.544 0.631
Veg2 0.055 0.627
Veg3 0.083 0.683
Rep1 0.067 0.842
Rep2 0.383 0.933
Rep3 0.068 0.795
Rip1 0.558 0.858
Rip2 0.275 0.808
Rip3 0.067 0.833
Total Accuracy 0.239 0.745
2. BB-SVM for paddy growth stages classification using
MODIS remote sensing images
Page 26
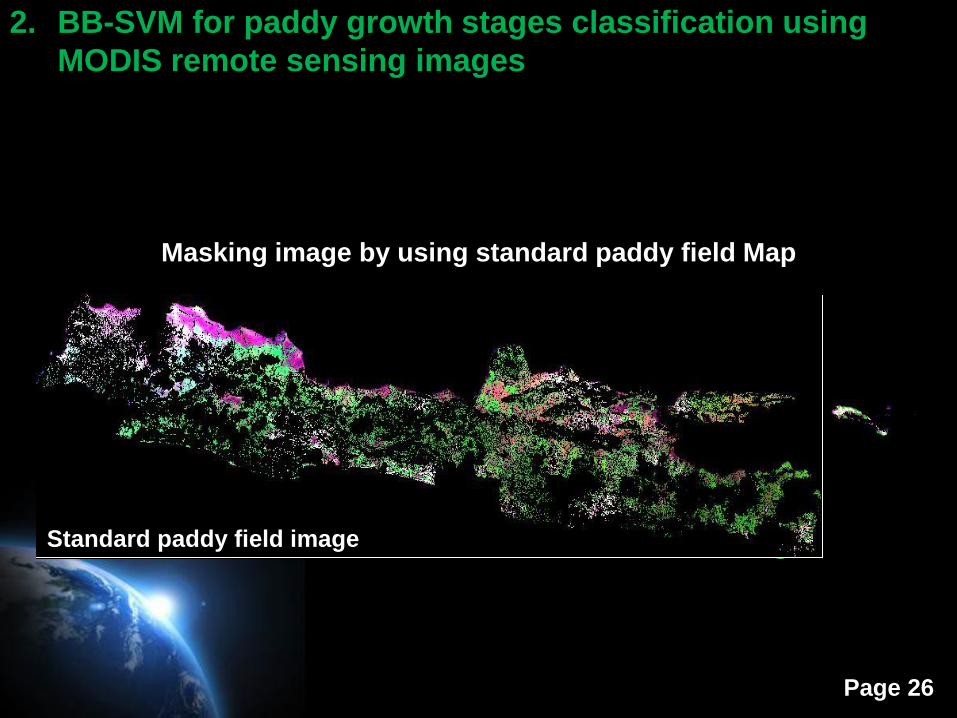
Masking image by using standard paddy field Map
Original MODIS Image (1,000m)Standard paddy field mapStandard paddy field image
2. BB-SVM for paddy growth stages classification using
MODIS remote sensing images
Page 27
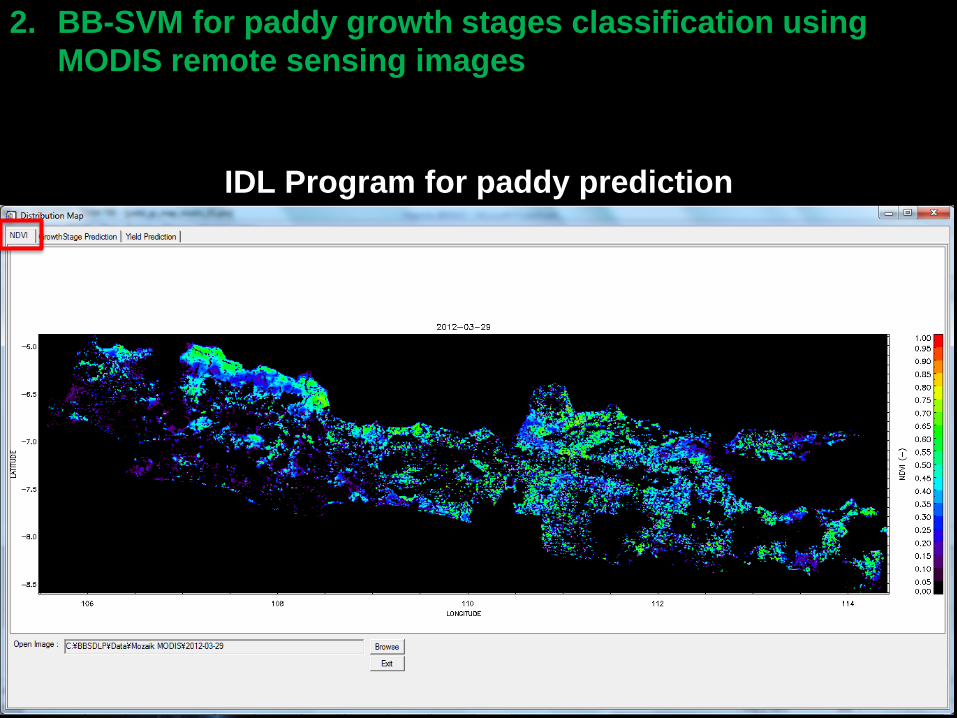
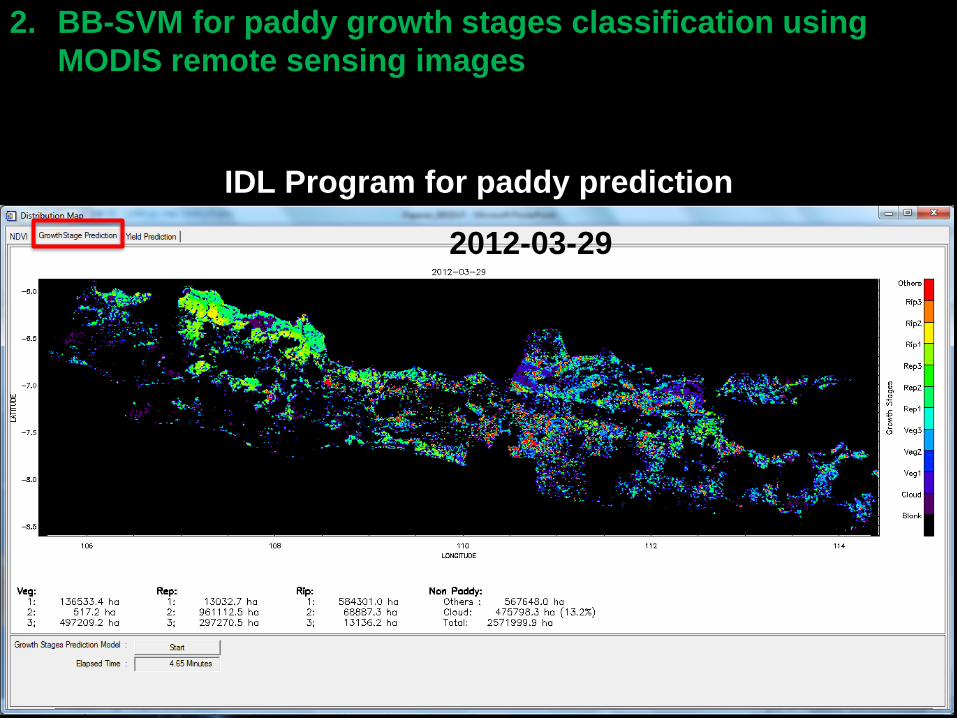
IDL Program for paddy prediction
2. BB-SVM for paddy growth stages classification using
MODIS remote sensing images
Page 28
IDL Program for paddy prediction
2012-03-29
2. BB-SVM for paddy growth stages classification using
MODIS remote sensing images
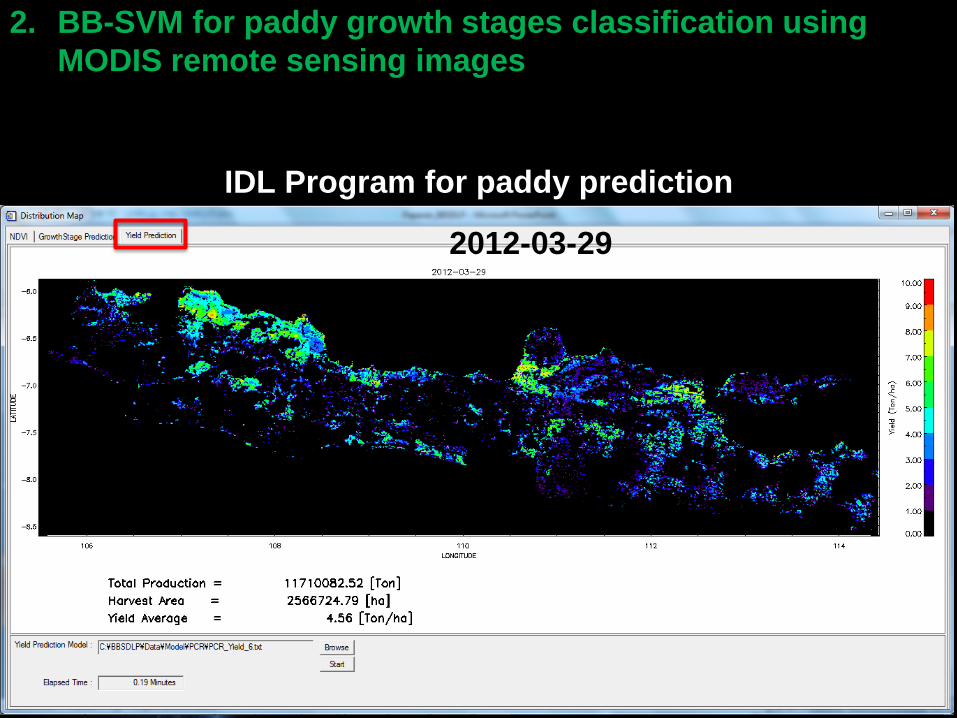
Page 29
IDL Program for paddy prediction
2. BB-SVM for paddy growth stages classification using
MODIS remote sensing images
2012-03-29
Page 30
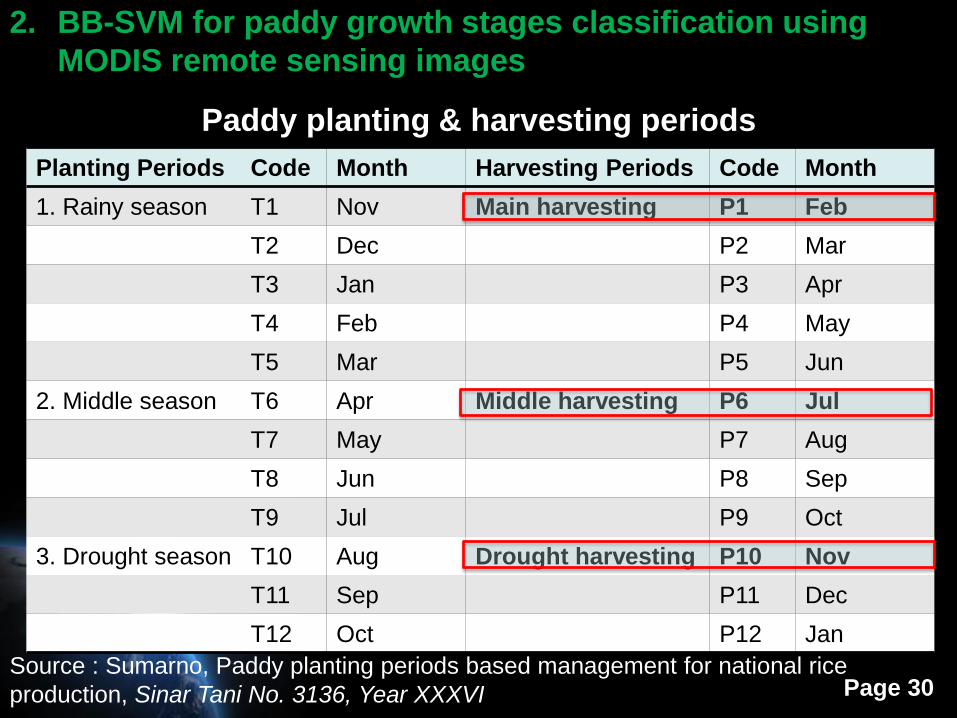
Paddy planting & harvesting periods
Source : Sumarno, Paddy planting periods based management for national rice
production, Sinar Tani No. 3136, Year XXXVI
2. BB-SVM for paddy growth stages classification using
MODIS remote sensing images
Planting Periods Code Month Harvesting Periods Code Month
1. Rainy season T1 Nov Main harvesting P1 Feb
T2 Dec P2 Mar
T3 Jan P3 Apr
T4 Feb P4 May
T5 Mar P5 Jun
2. Middle season T6 Apr Middle harvesting P6 Jul
T7 May P7 Aug
T8 Jun P8 Sep
T9 Jul P9 Oct
3. Drought season T10 Aug Drought harvesting P10 Nov
T11 Sep P11 Dec
T12 Oct P12 Jan
Page 31
-
2.00
4.00
6.00
8.00
10.00
12.00
14.00
16.00
18.00
1/2
9/2
01
2
2/2
9/2
01
2
3/3
1/2
01
2
4/3
0/2
012
5/3
1/2
01
2
6/3
0/2
01
2
7/3
1/2
01
2
8/3
1/2
01
2
9/3
0/2
01
2
10
/31
/20
12
11
/30
/20
12
Pro
du
cti
on
(in
milli
on
to
ns)
Date
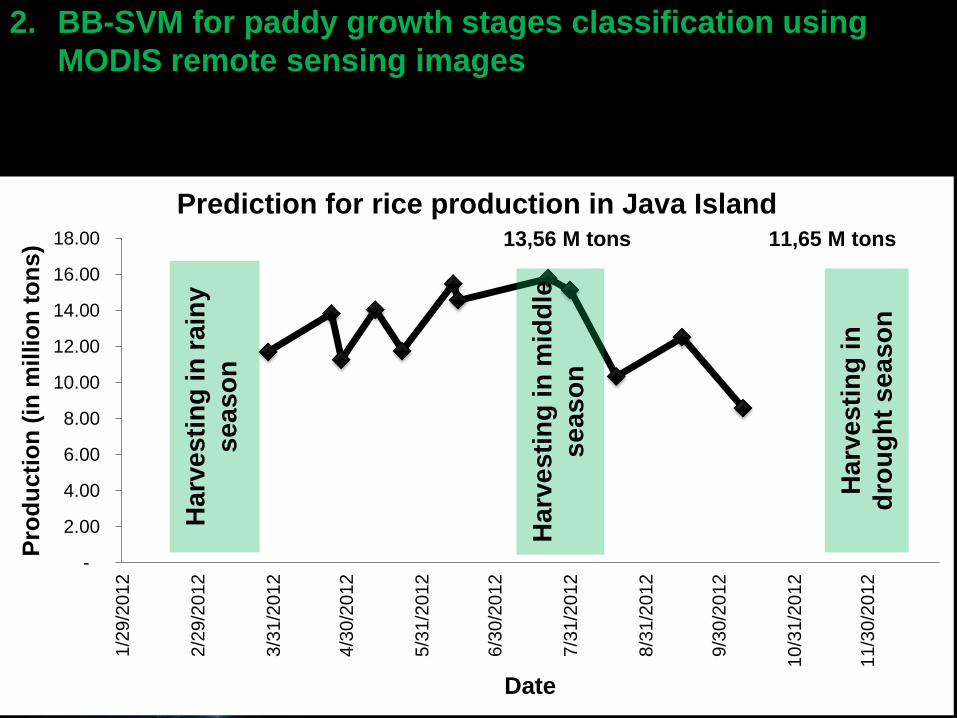
Prediction for rice production in Java Island
Ha
rve
sti
ng
in
mid
dle
se
as
on
Ha
rve
sti
ng
in
ra
iny
se
as
on
Ha
rve
sti
ng
in
dro
ug
ht
se
as
on
13,56 M tons 11,65 M tons
2. BB-SVM for paddy growth stages classification using
MODIS remote sensing images
Page 32
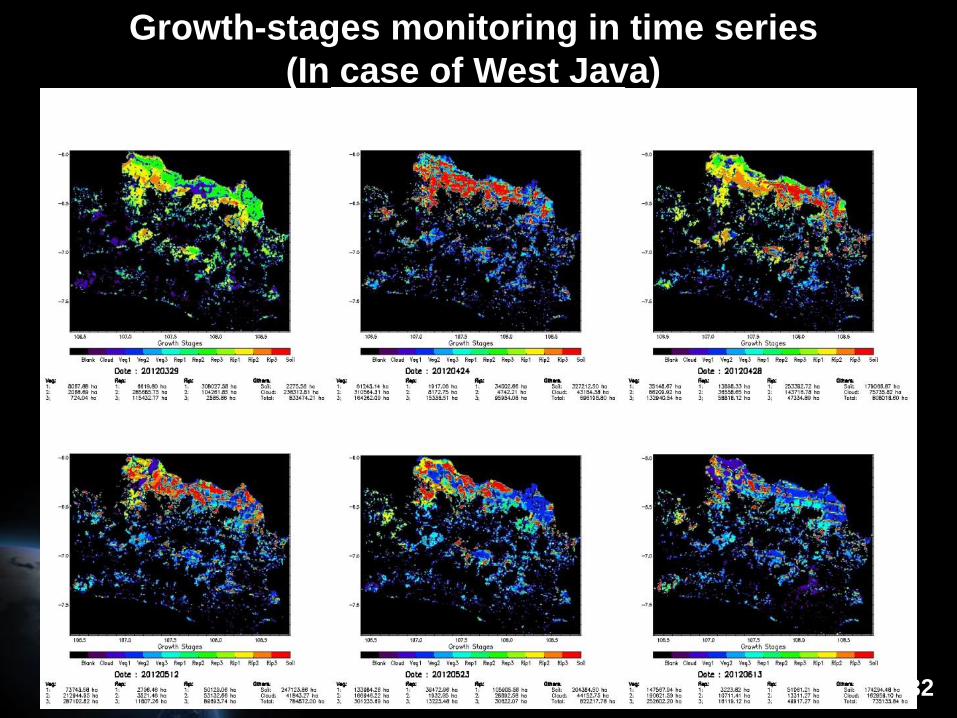
Growth-stages monitoring in time series
(In case of West Java)
Page 33
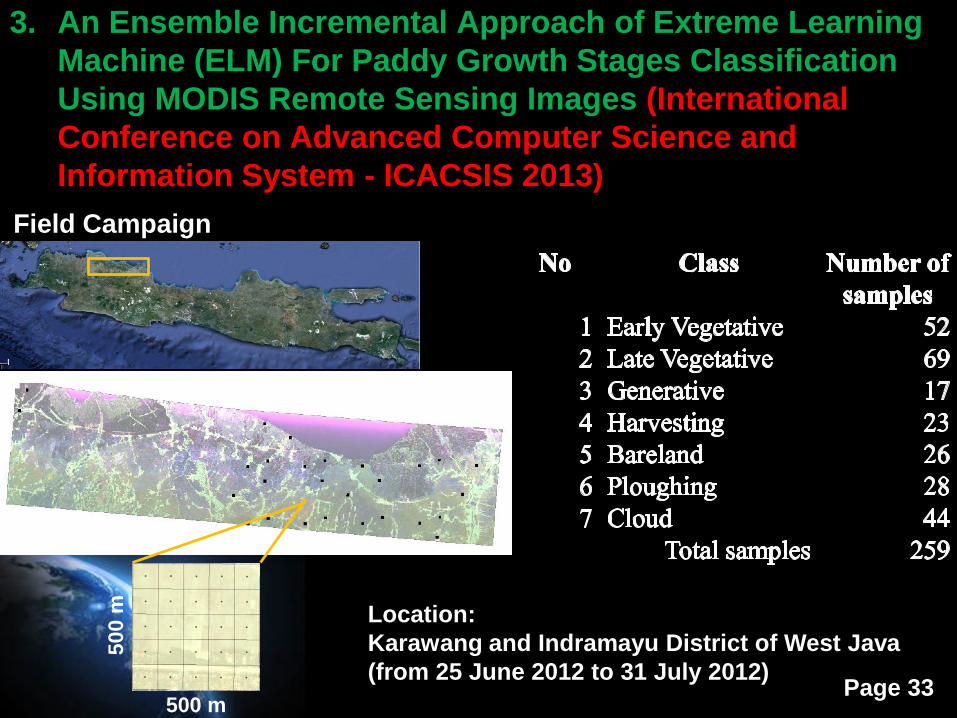
Field Campaign
Location:
Karawang and Indramayu District of West Java
(from 25 June 2012 to 31 July 2012)
50
0 m
500 m
3. An Ensemble Incremental Approach of Extreme Learning
Machine (ELM) For Paddy Growth Stages Classification
Using MODIS Remote Sensing Images (International
Conference on Advanced Computer Science and
Information System - ICACSIS 2013)
Page 34
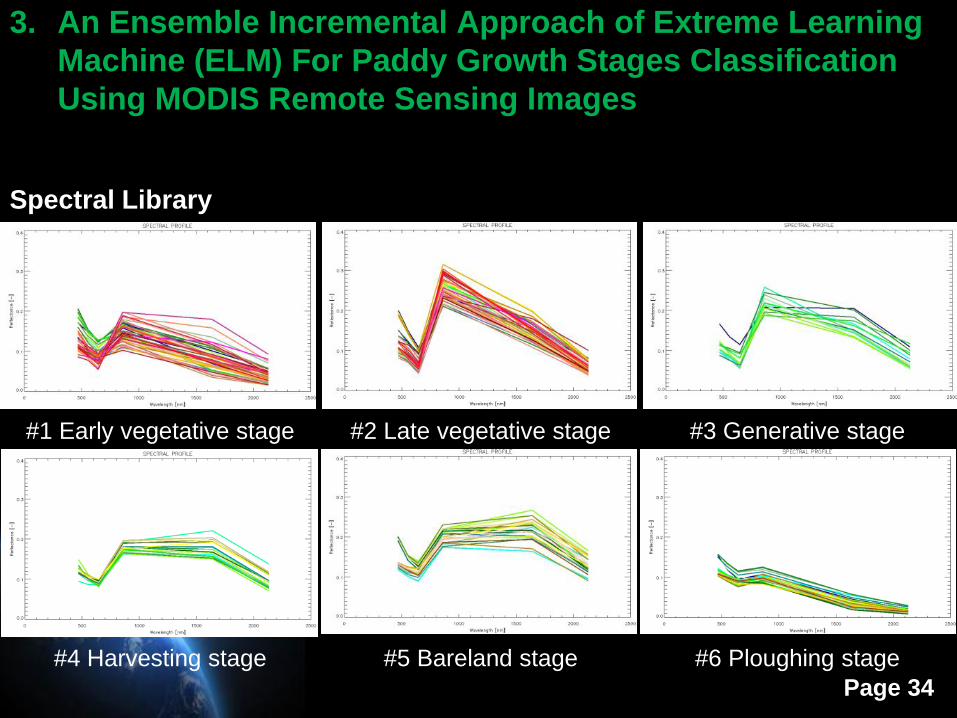
Spectral Library
#1 Early vegetative stage #2 Late vegetative stage #3 Generative stage
#4 Harvesting stage #5 Bareland stage #6 Ploughing stage
3. An Ensemble Incremental Approach of Extreme Learning
Machine (ELM) For Paddy Growth Stages Classification
Using MODIS Remote Sensing Images
Page 35
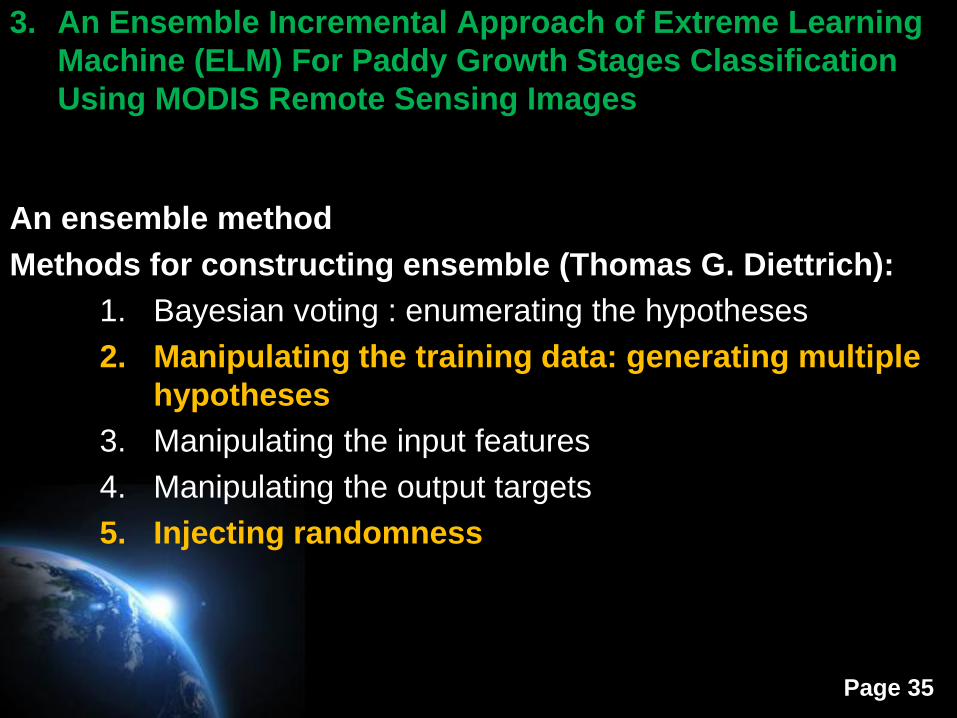
An ensemble method
Methods for constructing ensemble (Thomas G. Diettrich):
1. Bayesian voting : enumerating the hypotheses
2. Manipulating the training data: generating multiple
hypotheses
3. Manipulating the input features
4. Manipulating the output targets
5. Injecting randomness
3. An Ensemble Incremental Approach of Extreme Learning
Machine (ELM) For Paddy Growth Stages Classification
Using MODIS Remote Sensing Images
Page 36
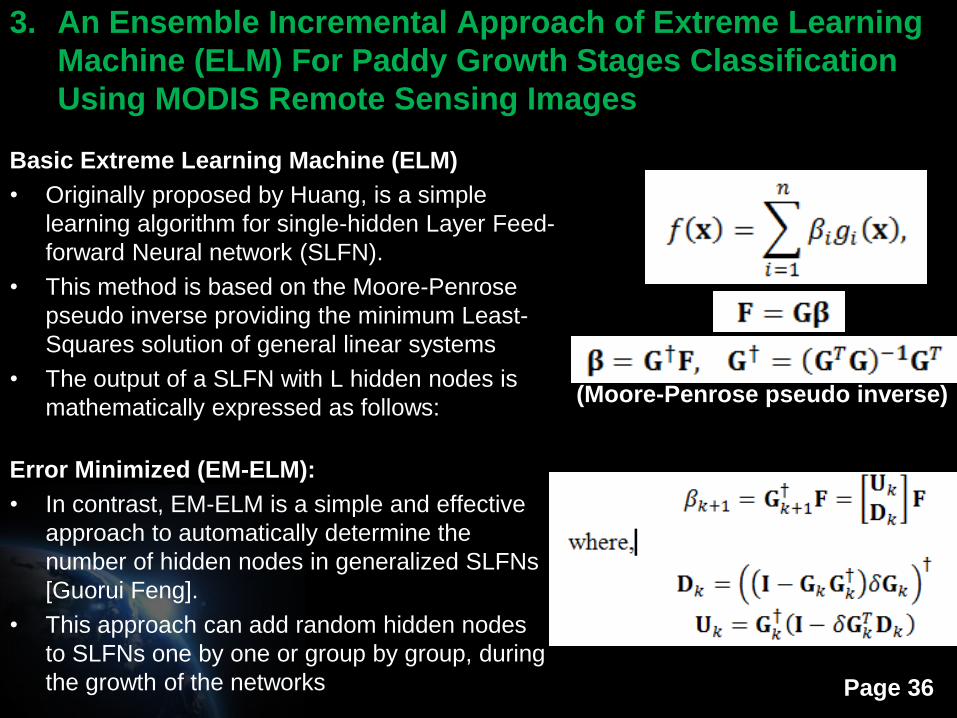
Basic Extreme Learning Machine (ELM)
• Originally proposed by Huang, is a simple
learning algorithm for single-hidden Layer Feed-
forward Neural network (SLFN).
• This method is based on the Moore-Penrose
pseudo inverse providing the minimum Least-
Squares solution of general linear systems
• The output of a SLFN with L hidden nodes is
mathematically expressed as follows:(Moore-Penrose pseudo inverse)
3. An Ensemble Incremental Approach of Extreme Learning
Machine (ELM) For Paddy Growth Stages Classification
Using MODIS Remote Sensing Images
Error Minimized (EM-ELM):
• In contrast, EM-ELM is a simple and effective
approach to automatically determine the
number of hidden nodes in generalized SLFNs
[Guorui Feng].
• This approach can add random hidden nodes
to SLFNs one by one or group by group, during
the growth of the networks
Page 37
3. An Ensemble Incremental Approach of Extreme Learning
Machine (ELM) For Paddy Growth Stages Classification
Using MODIS Remote Sensing Images
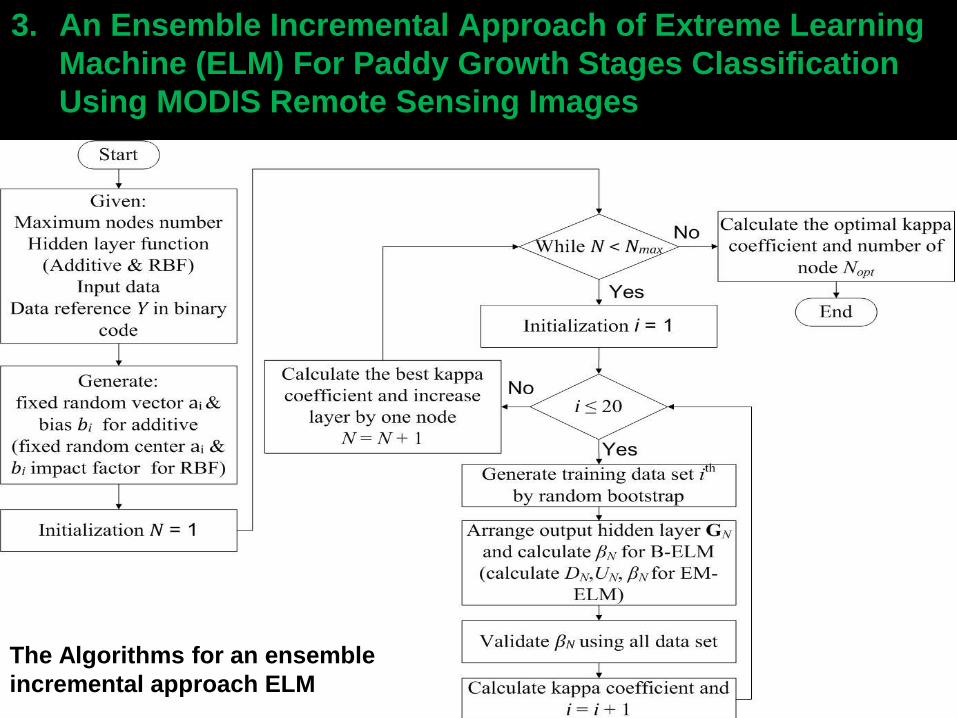
The Algorithms for an ensemble
incremental approach ELM
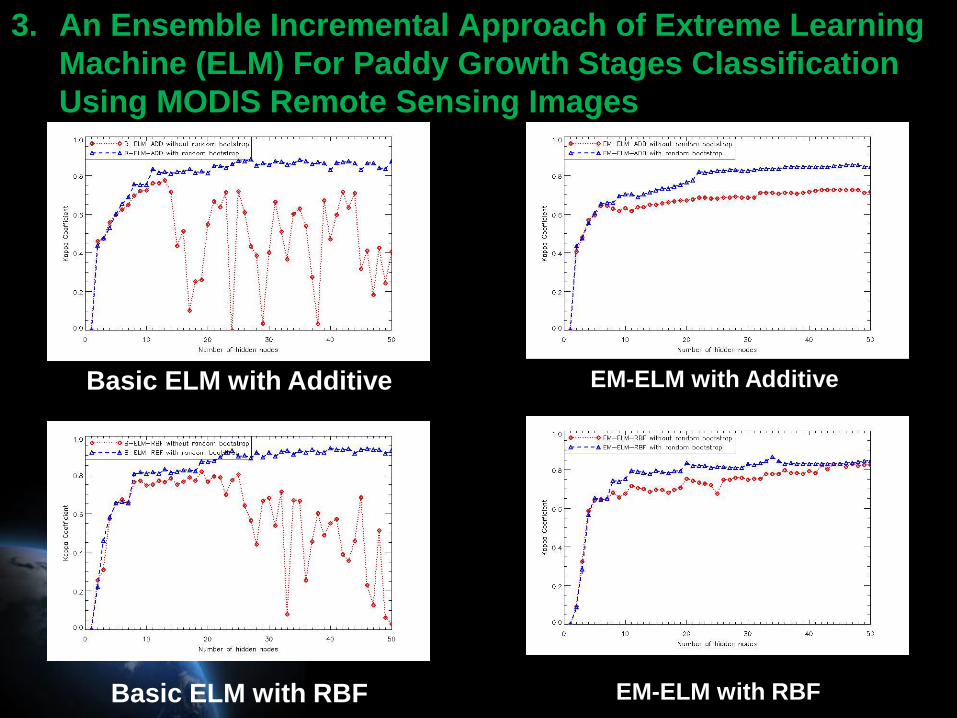
Page 38Basic ELM with RBF EM-ELM with RBF
3. An Ensemble Incremental Approach of Extreme Learning
Machine (ELM) For Paddy Growth Stages Classification
Using MODIS Remote Sensing Images
Basic ELM with Additive EM-ELM with Additive
Page 39
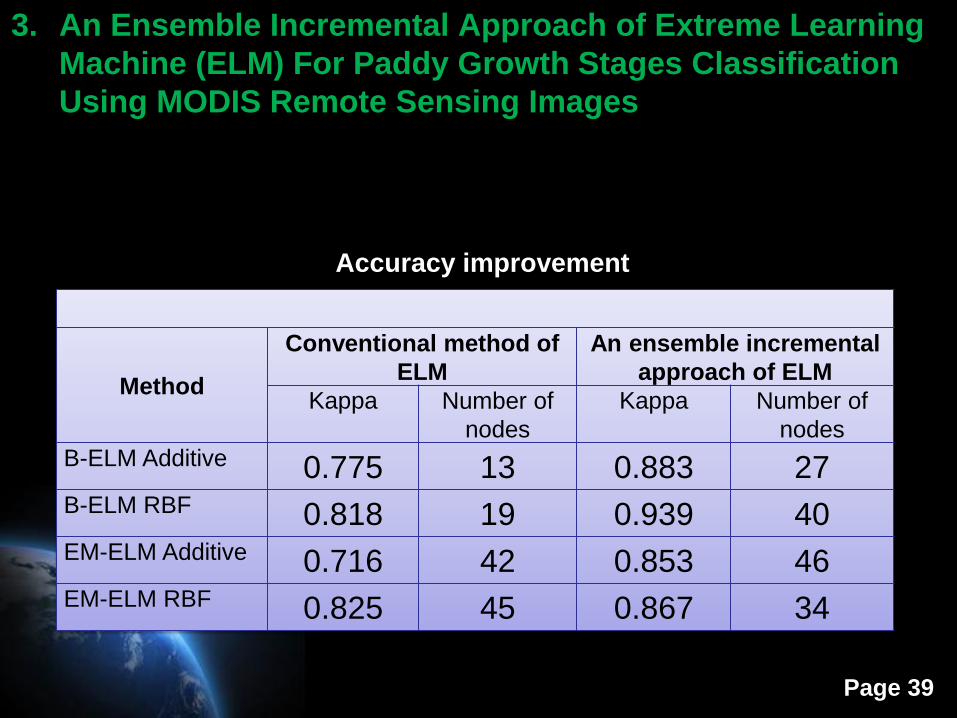
Accuracy improvement
Method
Conventional method of
ELM
An ensemble incremental
approach of ELM
Kappa Number of
nodes
Kappa Number of
nodes
B-ELM Additive 0.775 13 0.883 27B-ELM RBF 0.818 19 0.939 40EM-ELM Additive 0.716 42 0.853 46EM-ELM RBF 0.825 45 0.867 34
3. An Ensemble Incremental Approach of Extreme Learning
Machine (ELM) For Paddy Growth Stages Classification
Using MODIS Remote Sensing Images
Page 40
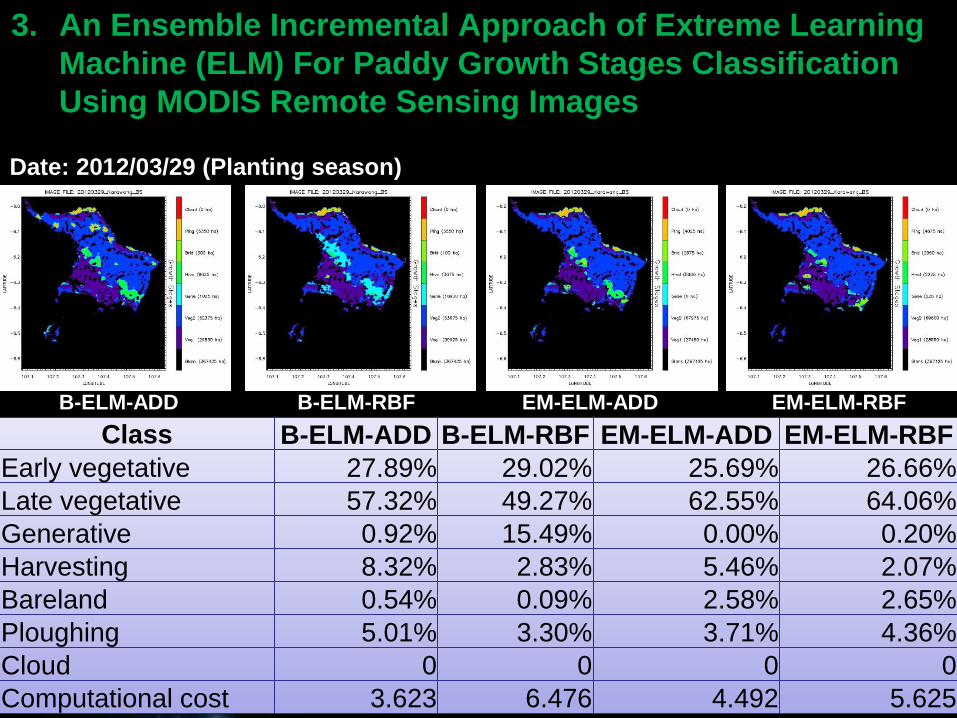
Class B-ELM-ADD B-ELM-RBF EM-ELM-ADD EM-ELM-RBF
Early vegetative 27.89% 29.02% 25.69% 26.66%
Late vegetative 57.32% 49.27% 62.55% 64.06%
Generative 0.92% 15.49% 0.00% 0.20%
Harvesting 8.32% 2.83% 5.46% 2.07%
Bareland 0.54% 0.09% 2.58% 2.65%
Ploughing 5.01% 3.30% 3.71% 4.36%
Cloud 0 0 0 0
Computational cost 3.623 6.476 4.492 5.625
Date: 2012/03/29 (Planting season)
B-ELM-ADD B-ELM-RBF EM-ELM-ADD EM-ELM-RBF
3. An Ensemble Incremental Approach of Extreme Learning
Machine (ELM) For Paddy Growth Stages Classification
Using MODIS Remote Sensing Images
Page 41
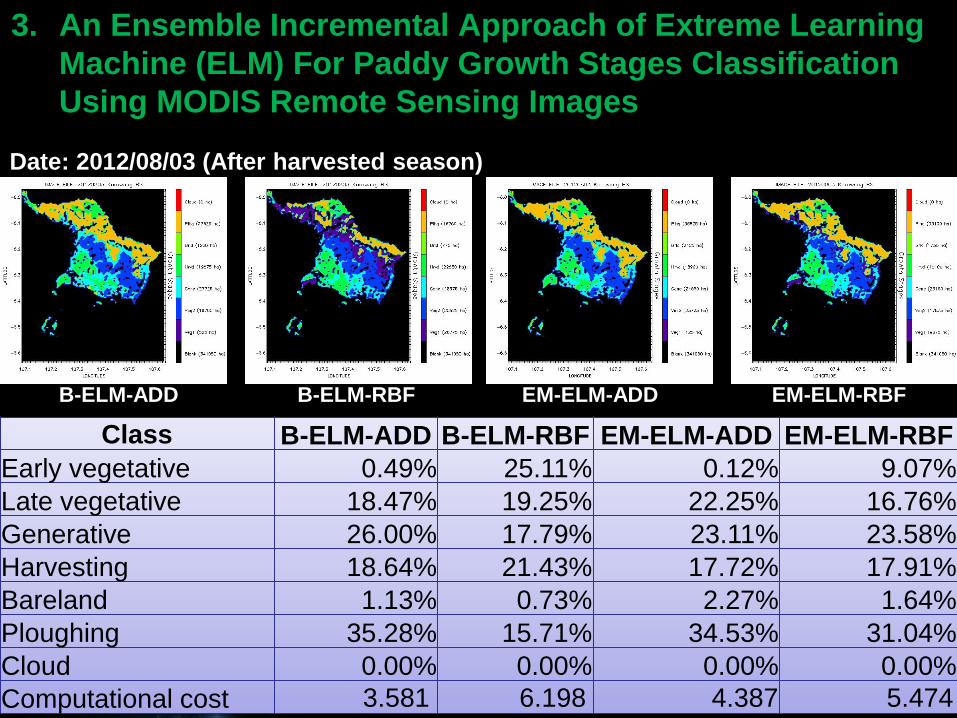
Class B-ELM-ADD B-ELM-RBF EM-ELM-ADD EM-ELM-RBF
Early vegetative 0.49% 25.11% 0.12% 9.07%
Late vegetative 18.47% 19.25% 22.25% 16.76%
Generative 26.00% 17.79% 23.11% 23.58%
Harvesting 18.64% 21.43% 17.72% 17.91%
Bareland 1.13% 0.73% 2.27% 1.64%
Ploughing 35.28% 15.71% 34.53% 31.04%
Cloud 0.00% 0.00% 0.00% 0.00%
Computational cost 3.581 6.198 4.387 5.474
Date: 2012/08/03 (After harvested season)
B-ELM-ADD B-ELM-RBF EM-ELM-ADD EM-ELM-RBF
3. An Ensemble Incremental Approach of Extreme Learning
Machine (ELM) For Paddy Growth Stages Classification
Using MODIS Remote Sensing Images

Page 42
3. RELATED STUDIES
Page 43
compa
1. Modeling Paddy Rice Yield Using MODIS
Data, Dailiang, et al, Agriculture and
forest meteorology, Elsevier 2014
2. Hyperspectral Versus Multispectral Crop
Productivity Modeling and Type
Discrimination For The HyspIRI mission,
Mariotto, et al, Remote Sensing of
Environment, Elsevier 2013
Page 44
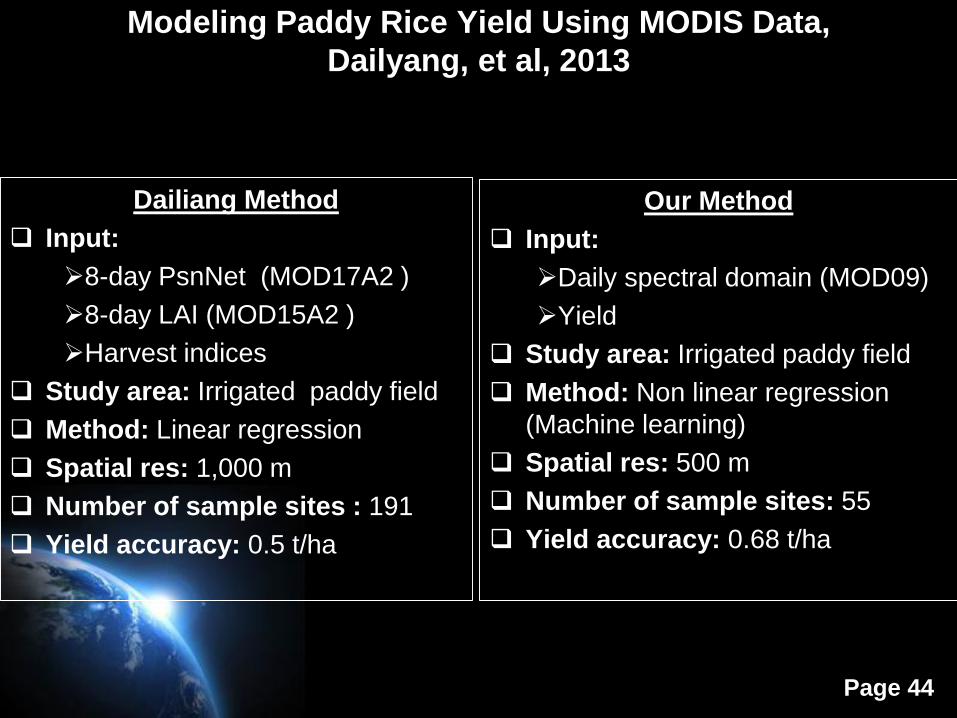
Modeling Paddy Rice Yield Using MODIS Data,
Dailyang, et al, 2013
Dailiang Method
Input:
8-day PsnNet (MOD17A2 )
8-day LAI (MOD15A2 )
Harvest indices
Study area: Irrigated paddy field
Method: Linear regression
Spatial res: 1,000 m
Number of sample sites : 191
Yield accuracy: 0.5 t/ha
Our Method
Input:
Daily spectral domain (MOD09)
Yield
Study area: Irrigated paddy field
Method: Non linear regression
(Machine learning)
Spatial res: 500 m
Number of sample sites: 55
Yield accuracy: 0.68 t/ha
Page 45
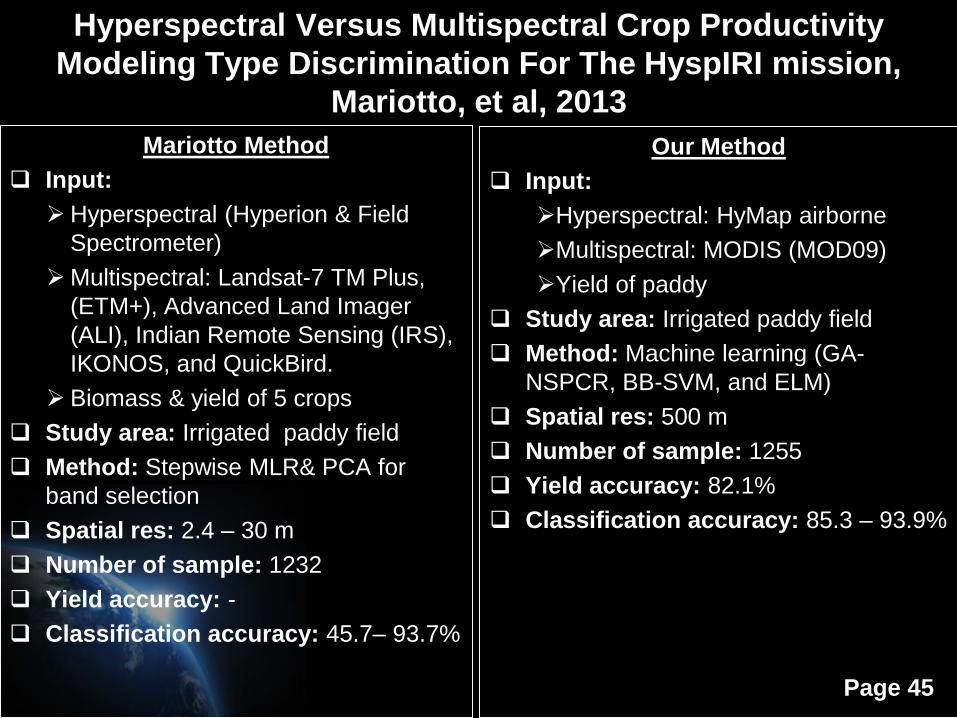
Hyperspectral Versus Multispectral Crop Productivity
Modeling Type Discrimination For The HyspIRI mission,
Mariotto, et al, 2013
Mariotto Method
Input:
Hyperspectral (Hyperion & Field
Spectrometer)
Multispectral: Landsat-7 TM Plus,
(ETM+), Advanced Land Imager
(ALI), Indian Remote Sensing (IRS),
IKONOS, and QuickBird.
Biomass & yield of 5 crops
Study area: Irrigated paddy field
Method: Stepwise MLR& PCA for
band selection
Spatial res: 2.4 – 30 m
Number of sample: 1232
Yield accuracy: -
Classification accuracy: 45.7– 93.7%
Our Method
Input:
Hyperspectral: HyMap airborne
Multispectral: MODIS (MOD09)
Yield of paddy
Study area: Irrigated paddy field
Method: Machine learning (GA-
NSPCR, BB-SVM, and ELM)
Spatial res: 500 m
Number of sample: 1255
Yield accuracy: 82.1%
Classification accuracy: 85.3 – 93.9%

Page 46
4. REMAINING PROBLEMS &
DISCUSSION
Page 47
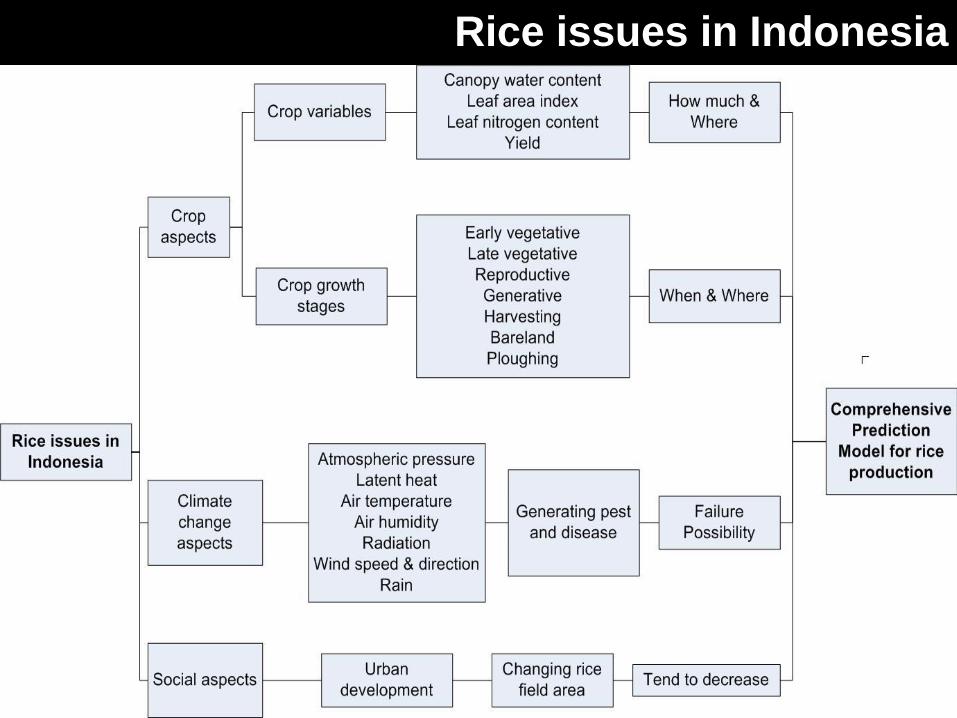
Rice issues in Indonesia

Page 48
THANK YOUQ & A
Related Documents