Comprehensive Annual Financial Report For the fiscal year ended June 30, 2012 A component unit of the City of Richmond, Virginia Philip R. Langham, Executive Director Richmond Retirement System

Welcome message from author
This document is posted to help you gain knowledge. Please leave a comment to let me know what you think about it! Share it to your friends and learn new things together.
Transcript

Comprehensive Annual Financial ReportFor the fiscal year ended June 30, 2012
A c o m p o n e n t u n i t o f t h e C i t y o f R i c h m o n d , V i r g i n i a
Philip R. Langham, Executive DirectorR i c h m o n d R e t i r e m e n t S y s t e m

ComprehensiveAnnualFinancial Reportfor the fiscal year endedJune 30, 2012
VisionOur vision is to be a recognized leader in pension fund management and administration, the standard by which others measure their progress and success. Every employee of the RRS displays a devotion to maintaining excellence in public service and embraces the highest standards of excellence, accountability, dependability and integrity. All participating employers, along with active, former and vested members, should take pride in knowing that the RRS provides the best retirement services available and is an exemplary steward of their pension funds.
MissionTo deliver timely and effective communications and retirement services with integrity and professionalism to the members of the Richmond Retirement System, its Board of Trustees, City officials, departments, and City Council.
A publication of the
Richmond Retirement System,A component unit of the City of Richmond, Virginia

Table of Contents
Introductory Section ...........................................6Awards .........................................................................7Letter of Transmittal .....................................................8Organizational Chart .................................................12Board of Trustees ........................................................13Executive Director ......................................................13Investment Advisory Committee ................................14Benefits Advisory Committee .....................................14Professional Services ...................................................15Medical Examiners .....................................................15Investment Managers .................................................15
Financial Section ............................................... 16Independent Auditor’s Report ....................................17Management’s Discussion and Analysis ......................18
Statement of Fiduciary Net Assets ..............................22Statement of Changes in Fiduciary Net Assets ............23 Notes to Financial Statements ....................................24
Required Supplementary Information ........................38Schedule of Funding Progress (Unaudited) .................39Schedule of Employer Contributions (Unaudited) .....39Notes to the Schedules of Trend Information .............40
Supporting Schedules .................................................41Schedule of Administrative Expenses ..........................42Schedule of Investment Expenses ...............................43Schedule of Payments to Investment Consultant ........43
continued on next page17th Street Market, Courtesy of the Virginia Tourism Corporation

continued from previous page
Investment Section ........................................... 44Investment Consultant Report ...................................45Investment Policy .......................................................48 Schedules of Investment Results .................................52Asset Allocation ..........................................................53Schedule of Investments .............................................54Schedule of Fees .........................................................55Schedule of Brokerage Commissions ..........................56Investment Summary .................................................57
Actuarial Section ............................................... 58Actuary’s Report .........................................................59Actuarial Assumptions and Methods ..........................63Schedule of Active Members Valuation Data ..............65Schedule of Beneficiaries Added to and
Removed from Rolls ................................................66Solvency Test ..............................................................67Analysis of Financial Experience .................................69
Statistical Section ............................................... 70Schedule of Changes and Growth in Net Assets .........71Schedule of Retirees and Beneficiaries
by Type of Retirement .............................................72Schedule of Participating Employers ...........................73Schedule of Average Benefit Payments ........................74Schedule of Membership ............................................75
Statute of Bill “Bojangles” Robinson, Courtesy of the Richmond Metropolitan Convention and Visitors Bureau

Activity for the Fiscal Year Ended June 30 2012 2011 2010 2009 2008 2007
Contributions $41,132 $42,191 $34,616 $35,821 $34,826 $33,434
Investment Income (Net of Investment Expenses) $1,896 $93,770 $59,128 ($97,507) ($27, 347) $82,273
Retirement Benefits and Refunds (Net of Investment Expenses) $70,086 $62,474 $61,340 $62,937 $54,189 $52,119
Administrative Expenses (Net of Miscellaneous Income) $1,167 $1,169 $1,094 $1,095 $1,162 $1,114
Increase (Decrease) in Net Assets Held in Trust for Pension Benefits ($28,226) $72,318 $31,310 ($125,719) ($47,872) $62,474
Net Assets Held in Trust for Benefits at Fiscal Year End $461,761 $489,987 $417,669 $385,938 $511,657 $559,529
Contributions as a Percentage of Benefits Payments 58.7% 67.5% 56.4% 56.9% 64.3% 64.1%
Investment Income as a Percentage of Benefit Payments 2.7% 150.1% 96.4% (154.9%) (50.5%) 157.9%
Investment Performance
One-Year Return 1.0% 23.1% 15.7% (18.4%) (3.8%) 17.0%
Three-Year Return 12.9% 5.2% (3.2%) (2.8%) 7.8% 13.3%
Five-Year Return 2.5% 5.5% 3.4% 2.7% 10.4% 12.0%
Members/Retirees
Active DB Plan Members 2,360 2,498 2,616 2,782 2,878 3,056
Terminated Vested DB Plan Members 1,763 1,778 1,763 1,781 1,810 1,864
Active DC 401(a) Plan Members 1,735 1,656 1,632 1,614 1,402 1,059
Retirees and Beneficiaries 4,131 4,078 3,997 3,963 3,921 3,841
TOTAL Members/Retirees 9,989 10,010 10,008 10,140 10,011 9,820
Richmond Retirement SystemFinancial and Statistical Highlights — Pension Trust Fund
(Dollars in Thousands)

In this section:
Awards
Letter of Transmittal
Organizational Chart
Board of Trustees
Executive Director
Advisory Committees
Services, Examiners and Investment Managers
Richmond International Airport, Courtesy of RIA and Virginia Tourism Corporation
Introductory Section
Introductory Section | 7
Certificate of Achievement for Excellence in Financial Reporting
The Government Finance Officers Association of the United States and Canada (GFOA) awarded a Certifi-cate of Achievement for Excellence in Financial Report-ing to the RRS for its Comprehensive Annual Financial Report (CAFR) for the fiscal year ended June 30, 2011. This was the 21st consecutive year that the RRS achieved this prestigious recognition.
To be awarded the certificate, a government unit must publish an easily readable and efficiently organized com-prehensive annual report. This report must satisfy both generally accepted accounting principles and applicable legal requirements. The certificate is valid for a period of one year. The RRS’s CAFR for FY 2012 continues to conform to the Certificate of Achievement Program requirements and will be submitted to GFOA to deter-mine its eligibility for another certificate.
Public Pension Coordinating Council Achievement Award
The RRS received the 2011 Achievement Award from the Public Pension Coordinating Council in recogni-tion of the agency’s excellence in meeting the Public Pension Standards. Developed by PPCC, these stan-dards are the benchmark for measuring excellence in defined benefit plan funding and administration.
This is the second award from the PPCC. The purpose of the award is to promote high professional standards for public employee retirement systems and publicly commend systems that adhere to these standards. The PPCC is a coalition of the National Association of State Retirement Administrators (NASRA), National Conference on Public Employee Retirement Systems (NCPERS) and the National Council on Teacher Retirement (NCTR).
Awards
Public Pension Coordinating Council
Public Pension Standards Award For Funding and Administration
2011
Presented to
Richmond Retirement System In recognition of meeting professional standards for
plan funding and administration as set forth in the Public Pension Standards.
Presented by the Public Pension Coordinating Council, a confederation of
National Association of State Retirement Administrators (NASRA) National Conference on Public Employee Retirement Systems (NCPERS)
National Council on Teacher Retirement (NCTR)
Alan H. Winkle Program Administrator
P CP C

8 | RRS Comprehensive Financial Report FY 2012
Letter of Transmittal
City of Richmond, Virginiarichmond retirement system
The Honorable City Council September 14, 2012City of Richmond900 East Broad Street, Suite 200Richmond, VA 23219andThe Honorable Mayor Dwight C. JonesCity of Richmond900 East Broad Street, Suite 201Richmond, VA 23219
Dear City Council Members and Mayor Jones:
On behalf of the Board of Trustees and in compliance with city of Richmond code § 78-54, submitted herewith is the Comprehensive Annual Report (CAFR) of the Richmond Retirement System (RRS) for the year ended June 30, 2012. The CAFR was prepared by the RRS, a component unit of the city of Richmond, and management maintains responsibility for the accuracy and the completeness of the presentation including all disclosures. Financial state-ments were prepared in accordance with U.S. generally accepted accounting principles (GAAP) as established by the Governmental Accounting Standards Board (GASB). The auditing firm of Cherry, Bekaert & Holland, LLP, an inde-pendent auditor has issued on September 14, 2012 an unqualified opinion for the financial statements for the fiscal year ending June 30, 2012. Their report is included on page 17 in this report.
The CAFR is presented primarily in five distinct sections: introductory, financial, investment, actuarial, and statisti-cal. The introductory section includes this transmittal letter, the RRS’s organizational chart, a list of principal offi-cials and certificates of achievement. The financial section includes the auditor’s opinion, management’s discussion and analysis and basic financial statements with related notes, and required supplementary information. The statisti-cal section includes selected financial and demographic information, generally presented on a multiyear basis.
Management’s discussion and analysis (MD&A), which should be read in conjunction with this letter of transmittal, begins on page 18 of the CAFR. This provides a more in-depth narrative, overview, and analysis of the RRS’s basic financial statements.
Richmond Retirement System900 East Broad Street • Room 400 • Richmond, VA 23219
Phone: 804-646-5958 • 1-888-288-2781 • Fax: 804-646-5299http://www.richmondgov.com/retirement
continued on next page

Introductory Section | 9
City of Richmond, Virginiarichmond retirement system
Plan History and Provisions
The RRS was first established in 1945 by Richmond City Council and reestablished by the acts of the Virginia Gen-eral Assembly in 1998, 2005, 2008, and 2010. The System administers benefits to members in accordance with pro-visions outlined in both the Richmond City Charter (5B.01) and Code (Chapter 78).
The RRS administers retirement pension benefits to active and former employees and their designated beneficiaries of the City of Richmond and Richmond Behavioral Health Authority. These two employers have produced a mem-bership in the System of approximately 10,000 active, deferred vested, and retirees/beneficiaries participating in either a defined benefit or defined contribution 401 (a) plan. Participants in both plans become “vested” in their respective plans after 5 years of full-time employment or at “normal retirement” age. For sworn police officers and firefighters, this is age 60. For all other employees, referred to as “general employees,” the normal retirement age is age 65. In 2006, the defined benefit plan was closed to newly hired employees with the exception of public safety (sworn police officers and firefighters) and senior executive employees.
For members, management and staff provide pre-retirement education through workshops and classes. Other ser-vices consist of counseling, annual benefit statements, and estimates of retirement benefits. Tax statements, and infor-mation relating to healthcare in retirement are sent to retirees, and additional support is available, both online and in-person, with daily walk-in hours.
Additional information about RRS plans, members and participating employers, are provided on pages 29-35 and 70-73.
Major Initiatives
The RRS believes that continuous improvement is important and meaningful in every aspect of our work so that we can provide exceptional service(s) to our members. To that end, we’ve laid the ground work by investing significant time and energy to replacing our legacy payroll and actuary systems. This information technology conversion will allow for greater built-in security enhancements and data availability at anytime over the Internet.
We’ve also reviewed and improved upon our standard operating procedures and internal controls to promote trust, transparency and – above all – accuracy and accountability in our operations.
Funding Status
The RRS trust fund ended the fiscal year (June 30, 2012) with a funded status of 56.2%, down 2.4% from fiscal year 2011. The funded status of a retirement trust is measure of actuarial assets versus its liabilities and an indicator of the system’s ability to pay its long-term obligations. The Richmond Retirement System’s goal is to be at a funded status of 80% or higher to be considered a “healthy plan” – one that can meet its long term obligations.
Richmond Retirement System900 East Broad Street • Room 400 • Richmond, VA 23219
Phone: 804-646-5958 • 1-888-288-2781 • Fax: 804-646-5299http://www.richmondgov.com/retirement
continued on next page

10 | RRS Comprehensive Financial Report FY 2012
In general, two significant events during the fiscal year attributed to the reduction of the RRS’s funded status, namely the lowering of the investment rate return assumption from 8% to 7.5% and the lower rate of return (1.1%) gross of fees in the investment markets versus the actuarial assumed rate of return of 7.5%.
To keep things in perspective, for fiscal year 2011 and fiscal year 2010, investment returns outpaced the implied investment return assumption of 8% in these years earning 23.1% and 15.7%, respectively. Further, for the past three fiscal year periods (2010 – 2012), the pension trust earned an average 12.9%, gross-of-fees well ahead of its average 7.8% return assumption. Better news is that while the RRS did not meet its investment return target in fiscal year 2012, the System outperformed 92% of other public pension funds in its peer group, with details about this peer group comparison found on page 47 of this report.
Other positive developments came from the City Council by appropriating $493,529 above the System’s annual required contributions (ARC) in fiscal year 2012 to shore up and sustain the pension fund. In addition, the Board of Trustees approved a new investment policy statement and guidelines for investment managers to strengthen invest-ment compliance. With the recommendation of its Investment Advisory Committee, the Board acted to release one investment manager and hire four new managers specializing in alternative investments to lower investment return volatility and improve returns. Long term, we expect these measures to smooth the contribution amounts required by the city and improve the System’s funded status.
Yet, these efforts alone may not support the needs of the Retirement System in the future with a funded status of just 56.2% given the investment market’s outlook over the next 30 years. The RRS may require more aggressiveness on behalf of the City Council and Administration to improve the trust’s funded status sooner than later through con-tinued ad hoc contributions above the ARC as well as little-to-no increases in pension benefits (cost of living allow-ances) without the funding to support such changes. This year the Board adopted a new strategy to recommend cost of living allowance increases to the City Council should the System’s funded status reach at least 70%.
Only through continued city leadership support will it be in a position to ensure that the trust is adequately funded to pay promised pension benefits for the eligible members who served through employment the City of Richmond and Richmond Behavioral Authority.
Investment Strategy and Governance
The Board of Trustees develops investment objectives and policy guidelines to manage the System’s investments. Dur-ing the fiscal year, NEPC, LLC served as the Board’s investment consultant. Investment managers are selected by the Board of Trustees to best manage funds, given the manager’s area of asset allocation. More information about RRS’s investment policies can be found on pages 48-51 of this CAFR. The State Street Corporation serves as the System’s fund custodian in accordance with city of Richmond code § 78 - 83.
continued on next page
City of Richmond, Virginiarichmond retirement system
Richmond Retirement System900 East Broad Street • Room 400 • Richmond, VA 23219
Phone: 804-646-5958 • 1-888-288-2781 • Fax: 804-646-5299http://www.richmondgov.com/retirement

Introductory Section | 11
City of Richmond, Virginiarichmond retirement system
Richmond Retirement System900 East Broad Street • Room 400 • Richmond, VA 23219
Phone: 804-646-5958 • 1-888-288-2781 • Fax: 804-646-5299http://www.richmondgov.com/retirement
Internal Controls
The RRS’s management has developed a comprehensive framework of internal controls and written procedures to ensure the reliability of the financial information contained herein. Our objective is to provide a reasonable rather than absolute assurance that the financial statements presented are free of any material misstatements and that any costs for the RRS to maintain financial internal controls are not outweighed by their anticipated benefits.
The retirement fund held by the RRS is established as a trust fund dedicated to the exclusive benefit of its members, retirees, and beneficiaries. In management’s opinion, the internal controls in effect during the fiscal year ended June 30, 2012 adequately safeguard the RRS’s assets and provide a reasonable assurance regarding the proper recording of all financial transactions.
Awards and Acknowledgments
The RRS was awarded a Certificate of Achievement for Excellence in Financial Reporting by the GFOA for the fiscal year ended June 30, 2011. This is a prestigious national award for governments whose comprehensive annual finan-cial reports meet or exceed the GFOA’s strict guidelines. Additionally, the RRS was awarded a Certificate of Funding and Administration by the Public Pension Coordinating Council (PPCC) for the fiscal year ended June 30, 2011.
As I depart the Richmond Retirement System for the Pension Benefit Guaranty Corporation in Washington DC, I would like to express sincere gratitude to the Board of Trustees, the Investment Advisory Committee, and the men and women of the RRS’s staff who serve tirelessly each day to ensure pension benefits are secure and delivered to its eligible members. These folks are dedicated and share my belief in excellent government and continuous improve-ment in public service. Their efforts have earned a well deserved national recognition of achievement both through benefits administration and investment management.
Lastly, please allow me to recognize you, the members of City Council and the Mayor of the City of Richmond who have supported the RRS throughout my tenure and in particular this past year. Your commitment and leadership by going beyond the call of duty to study and improve the Retirement System and its funded status with an additional contribution, especially during these times of economic uncertainty, isn’t unnoticed throughout Virginia. I salute and thank you.
Respectfully submitted,
Philip R. Langham Executive Director

12 | RRS Comprehensive Financial Report FY 2012
Organizational Chart
City CouncilAppoints five
Board members
MayorAppoints two
Board members
Board of TrusteesFive citizens and two employees
Executive Director
Appointed by Board
Investment Advisory
CommitteeSelected by Board
Benefits Advisory
CommitteeSelected by Board
Staff
Actuary
Legal Counsel
Medical Examiners
Investment Consultant
Investment Managers
Investment Custodian

Introductory Section | 13
Executive Director
Philip R. LanghamExecutive DirectorRichmond Retirement System
Board of Trustees
Ronald L. Tillett, ChairmanManaging Director, Public FinanceMorgan Keegan & Company, Inc.
Kenneth N. Daniels, Ph.D. Vice ChairmanProfessor of FinanceVirginia Commonwealth University
Lawrence GlidewellBattalion Chief, Fire & Emergency ServicesCity of Richmond
Wallace G. Harris, Ph.D., SPHRAssistant Professor & Interim Program ChairEmergency Management School of Professional and Continuing StudiesUniversity of Richmond
Jacquelyn E. Stone, Esq.PartnerMcGuire Woods, LLP
Garland W. WilliamsSenior Assistant to the Chief Administrative OfficerCity of Richmond

14 | RRS Comprehensive Financial Report FY 2012
Investment Advisory Committee Kenneth N. Daniels, Ph.D., ChairmanProfessor of FinanceVirginia Commonwealth University
Ronald L. Tillett, Vice ChairmanManaging Director, Public FinanceMorgan Keegan & Company, Inc.
Michael Hultzapple, CPA, CFAManaging DirectorAlpha Performance Verification Services
Basil L. Hurst IIIManaging DirectorPlural Investments, LLC
Philip R. LanghamExecutive DirectorRichmond Retirement System
Wayne LassiterInterim Director of FinanceCity of Richmond
W. Massie Meredith, Jr.Family Wealth Advisors, LLC
Gregory A. SchnitzlerManaging PartnerAscential Equity LLC
Donald A. Steinbrugge, CFAManaging PartnerAgecroft Partners, LLC
Benefits Advisory CommitteeWallace G. Harris, Ph.D., SPHR, ChairmanAssistant Professor & Interim Program ChairEmergency Management School of Professional and Continuing StudiesUniversity of Richmond
Lawrence Glidewell, Vice ChairmanBattalion Chief, Fire & Emergency ServicesCity of Richmond
Michael Hultzapple, CPA, CFAManaging DirectorAlpha Performance Verification Services
Garland W. WilliamsSenior Assistant to the Chief Administrative OfficerCity of Richmond
Advisory Committees

Introductory Section | 15
Professional ServicesConsulting ActuarySageView Consulting Group, LLCWilliam M. Dowd, fca, ea, maaa4421 Cox RoadRichmond, VA 23060
Independent AuditorCherry, Bekaert & Holland, LLP200 South 10th Street, Suite 900Richmond, VA 23219
Investment ConsultantNEPC, LLCKevin Leonard, PartnerOne Main Street, 8th FloorCambridge, MA 02142
Investment CustodianState Street CorporationRobert Taylor Vice President, Public Fund Services2 Avenue de Lafayette, 6th FloorBoston, MA 02111
Services, Examiners and Investment Managers
Medical ExaminersCardiopulmonaryDr. Phillip B. Duncan
Eye, Ear, Nose and ThroatDr. Nicholas G. Tarasidis
General MedicineDr. Barrington Bowser, Jr.Dr. Roderick HaithcockDr. George Maughan
OrthopedicDr. Robert S. AdelaarDr. William FlemingDr. Harry ShaiaTuckahoe Orthopaedic
Associates, Ltd.West End Orthopaedics
Vascular SpecialistDr. Broadie G. NewtonThe Vascular Group at Richmond
Surgical Group
Investment ManagersAbbey Capital, Ltd.1-2 Cavendish RowDublin 1, Ireland
ABS Investment Management, LLC537 Steamboat RoadGreenwich, CT 06830
Acadian Asset Management, Inc.One Post Office Square 20th FloorBoston, MA 02109
Audax Group, L.P.101 Huntington Ave., 24th Floor Boston, MA 02199
BlackRock Financial Management, Inc.40 E. 52nd St.New York, NY 10022
Brandywine Global Investment Management, LLC2929 Arch St., 8th FloorPhiladelphia, PA 19104
Chartwell Investment Partners1235 Westlakes Dr., Suite 400Berwyn, PA 19312-2412
Fort Hill Investment Partners, LLCformerly Aladdin CapitalSix Landmark Square, 6th FloorStamford, CT 06901-2704
Grantham, Mayo, Van Otterloo & Co., LLC40 Rowes WharfBoston, MA 02110
Hughes Capital Management, Inc.916 Prince Street, Third FloorAlexandria, VA 22314
J.P. Morgan Global Real Assets270 Park Ave., 7th FloorNew York, NY 10017
Lexington Partners, Inc. 111 Huntington Ave., Suite 3020Boston, MA 02199
Loomis, Sayles & Co., L.P. One Financial CenterBoston, MA 02111
LSV Asset Management155 North Wacker Dr.Suite 4600Chicago, IL 60606
Pine Grove Associates, Inc.25 De Forest Ave., 2nd FloorSummit, NJ 07901
Private Advisors, LLC1800 Bayberry CourtRichmond, VA 23226
Protégé Partners QP Fund, Ltd.Styne House, Upper Hatch StreetDublin 2, Ireland
State Street Global AdvisorsOne Lincoln St.Boston, MA 02111-2900
StepStone Group, LLCformerly Parish Capital4350 La Jolla Village Dr., Suite 800San Diego, CA 92122
Stone Harbor Investment Partners, L.P. 31 W 52nd St., 16th FloorNew York, NY 10019
TPG Opportunities Partners, L.P.301 Commerce St., Suite 3300Fort Worth, TX 76102
Urdang Investment Management, Inc.630 W. Germantown PikeSuite 300Plymouth Meeting, PA 19462
Westwood Management200 Crescent Ct., Suite 1200Dallas, TX 75201

In this section:
Independent Auditor’s Report
Management’s Discussion and Analysis
Summary of Financial Statements
Schedule of Funding Status and Funding Progress
Asset Allocation
Statement of Fiduciary Net Assets
Statement of Changes in Fiduciary Net Assets
Notes to Financial Statements
Summary of Significant Financial PoliciesDeposits and InvestmentsLitigationPlan DescriptionContributions Required and
Contributions Made
The Landmark Theater, Richmond, Virginia
Financial Section
The RRS administers pension benefit plans for approximately 10,000 members, retirees and beneficiaries. The purpose of the financial sec-tion is to present the plan’s assets for the fiscal year through the audited basic financial state-ments. To support this information, the section includes management’s discussion and analysis as well as the notes to the financial statements.

Financial Section | 17
Independent Auditor’s Report
The Board of Trustees Richmond Retirement System Richmond, Virginia
We have audited the accompanying statement of plan net assets of the Richmond Retirement System (the “System”), a component unit of the City of Richmond, as of June 30, 2012, and the related statement of changes in plan net assets for the year then ended. These financial statements are the responsibility of the System’s management. Our responsibility is to express an opinion on these financial statements based on our audit.We conducted our audit in accordance with auditing standards generally accepted in the United States of America. Those standards require that we plan and perform the audit to obtain reasonable assurance about whether the financial state-ments are free of material misstatement. An audit includes examining, on a test basis, evidence supporting the amounts and disclosures in the financial statements. An audit also includes assessing the accounting principles used and significant estimates made by management, as well as evaluating the overall financial statement presentation. We believe that our audit provides a reasonable basis for our opinion.In our opinion, the financial statements referred to above present fairly, in all material respects, the plan net assets of the Richmond Retirement System as of June 30, 2012 and the changes in its plan net assets for the year then ended in con-formity with accounting principles generally accepted in the United States of America.Management’s Discussion and Analysis, the Schedule of Funding Progress, and the Schedule of Employer Contributions are not a required part of the basic financial statements but are supplementary information required by the Governmental Accounting Standards Board. We have applied certain limited procedures, which consisted principally of inquiries of manage-ment regarding the methods of measurement and presentation of the supplementary information. However, we did not audit the information and express no opinion on it.Our audit was made for the purpose of forming an opinion on the financial statements that collectively comprise the System’s basic financial statements. The supporting schedules listed on pages 41 to 43 are presented for purposes of additional analysis and are not a required part of the basic financial statements. The information has been subjected to the auditing procedures applied in the audit of the basic financial statements and, in our opinion, is fairly stated in all material respects when consid-ered in relation to the financial statements taken as a whole.The introductory, investment, actuarial and statistical sections, as listed in the accompanying table of contents, are also presented for purposes of additional analysis and are not a required part of the basic financial statements. Such information has not been subjected to auditing procedures applied in the audit of the System’s basic financial statements and, accordingly, we express no opinion on it.
Cherry, Bekaert & Holland, L.L.P.
Richmond, Virginia September 14, 2012
Independent Auditor’s Report The Board of Trustees Richmond Retirement System Richmond, Virginia We have audited the accompanying statement of plan net assets of the Richmond Retirement System (the “System”), a component unit of the City of Richmond, as of June 30, 2012, and the related statement of changes in plan net assets for the year then ended. These financial statements are the responsibility of the System’s management. Our responsibility is to express an opinion on these financial statements based on our audit. We conducted our audit in accordance with auditing standards generally accepted in the United States of America. Those standards require that we plan and perform the audit to obtain reasonable assurance about whether the financial statements are free of material misstatement. An audit includes examining, on a test basis, evidence supporting the amounts and disclosures in the financial statements. An audit also includes assessing the accounting principles used and significant estimates made by management, as well as evaluating the overall financial statement presentation. We believe that our audit provides a reasonable basis for our opinion. In our opinion, the financial statements referred to above present fairly, in all material respects, the plan net assets of the Richmond Retirement System as of June 30, 2012 and the changes in its plan net assets for the year then ended in conformity with accounting principles generally accepted in the United States of America. Management’s Discussion and Analysis, the Schedule of Funding Progress, and the Schedule of Employer Contributions are not a required part of the basic financial statements but are supplementary information required by the Governmental Accounting Standards Board. We have applied certain limited procedures, which consisted principally of inquiries of management regarding the methods of measurement and presentation of the supplementary information. However, we did not audit the information and express no opinion on it. Our audit was made for the purpose of forming an opinion on the financial statements that collectively comprise the System’s basic financial statements. The supporting schedules listed on pages 41 to 43 are presented for purposes of additional analysis and are not a required part of the basic financial statements. The information has been subjected to the auditing procedures applied in the audit of the basic financial statements and, in our opinion, is fairly stated in all material respects when considered in relation to the financial statements taken as a whole. The introductory, investment, actuarial and statistical sections, as listed in the accompanying table of contents, are also presented for purposes of additional analysis and are not a required part of the basic financial statements. Such information has not been subjected to auditing procedures applied in the audit of the System’s basic financial statements and, accordingly, we express no opinion on it. CHERRY, BEKAERT & HOLLAND, L.L.P.
Richmond, Virginia September 14, 2012

18 | RRS Comprehensive Financial Report FY 2012
Management’s Discussion and Analysis
The discussion and analysis of the Richmond Retirement System’s (RRS) pension fund financial performance provides an overview of its financial activities and fund-ing condition for the fiscal year ended June 30, 2012.
Plan Highlights
The investment return on the actuarial value of assets was 1.09% versus the expected rate of return of 7.5%. The actuarial value of assets which is used to determine the contribution rate for the participating employers of the RRS for the following fiscal year, is determined using a method that is designed to smooth the impact of market fluctuations.
Unlike the market value which immediately reflects all realized and unrealized appreciation during the year, the actuarial value recognizes the difference between actual earnings on investments and expected earnings on investments (using a 7.5% investment return assump-tion) over a five-year period, with the stipulation that the actuarial value cannot be less than 90% or more than 110% of the market value. The net gain for the fiscal year ended June 30, 2012 will be recognized gradually, a portion recognized in this year’s asset value and the remainder recognized over the next four years.
Plan Membership
The table titled Plan Membership reflects the RRS’s membership, including Defined Benefit Plan partici-pants and Defined Contribution 401(a) Plan partici-pants, as of the beginning and end of the year. Please see the Schedule of Membership on page 75 for a com-plete listing of active members by department.
The following table demonstrates the changes in retirees and beneficiaries during the period.
Plan Membership
Financial Statements
The basic financial statements are designed to provide readers with a broad overview of the RRS’s finances in a manner similar to a private-sector business and in accordance with U.S. Generally Accepted Accounting Principles (GAAP).
The Statement of Fiduciary Net Assets on (page 22) presents information on all of the RRS’s assets and lia-bilities, with the difference between the two reported as net assets. Over time, increases or decreases in net assets may serve as a useful indicator of whether the financial position of the system is improving or deteriorating.
The Statement of Changes in Fiduciary Net Assets (page 23) displays the changes in the RRS’s net assets that occurred during the fiscal year. All changes in net assets are reported as soon as the underlying event giving rise to the change occurs, regardless of the timing of related cash flows. Thus, revenues and expenses are reported in the statement for some items that will result in cash flows in future fiscal periods (for example, administra-tive expenses and investment expenses).
The City of Richmond’s basic financial statements present information about the RRS as a fiduciary pension trust
Count as of 6/30/2011 4,078
New Retirees 206
Benefits Terminated (153)
Count as of 6/30/2012 4,131
FY 2012
FY 2011
Increase/ (Decrease)
Percent Change
Active Vested DB Plan Members 2,107 2,203 (96) -4.4%
Active Non-vested DB Plan Members 253 295 (42) -14.2%
Terminated Vested DB Plan Members 1,763 1,778 (15) -0.8%
Active DC 401(a) Plan Members 1,735 1,656 79 4.8%
Retirees & Beneficiaries 4,131 4,078 53 1.3%
Total: 9,989 10,010 (21) -0.2%

Financial Section | 19
fund. A fiduciary fund is used to account for resources held for the benefit of parties outside the government. Fiduciary funds are not available to support the City of Richmond’s programs.
Notes to the Financial Statements
The notes to the basic financial statements provide addi-tional information essential for a full understanding of the information provided in the RRS’s financial statements.
Analysis of Financial Statements
The RRS’s net assets decreased by approximately $28.2 million to $461,760,532 during fiscal year 2012. The total assets were $522,416,855 and the total liabilities were $60,656,323. The market value of the investment portfolio decreased by approximately $36.7 million.
The major components of the RRS’s additions were contributions of $41.1 million and $1.9 million in net investment gains.
The primary deductions of the RRS were the retirement, survivor, and disability benefit payments to members and their beneficiaries; additional deductions were for admin-istrative costs. Deductions for fiscal year 2012 totaled $71.3 million, an increase of $7.6 million or 11.96%
over fiscal year 2011. The increase is primarily attributable to a $5.9 million accounting adjustment to public safety benefit payments that was recorded in fiscal year 2012 to recognize the accrued Deferred Retirement Option Pro-gram (DROP) liability and expenses incurred through 6/30/2012; previously the DROP liability was not included in the RRS’s financial statements as DROP expenses were recognized on a cash basis. Nineteen retirees exited the DROP program in fiscal year 2012 with total pay-outs of $2.16 million, a decrease of $2.18 million com-pared to the prior year. The condensed financial data of net assets, additions, and deductions for the fiscal years ended June 30, 2012 and 2011 is on the next page.
Pension Plan ActivityFiscal Year 2012
$49,609 Refunds$1,166,997 Administrative and
Other Expenses
$70,036,680 Benefits
The Fan Neighborhood, Courtesy of the Virginia Tourism Corporation Shockoe Slip, © Chris Hancock, Courtesy of the Virginia Tourism Corporation

20 | RRS Comprehensive Financial Report FY 2012
Summary of Financial Statements
The table on page 21 indicates the policy target asset allocation as of June 30, 2012. In identifying the opti-mal asset mix strategy for the RRS, the Board of Trust-ees has adopted the aforementioned asset allocation policy. To ensure compliance with the policy, a rebal-ancing strategy is employed which requires periodic rebalancing for each asset class.
0%
20%
40%
60%
80%
100%
201220112010200920082007200620052004200320022001200019991998
89.4%94.8%
98.6%
54.4%
58.3%
58.6%
56.2%
82.1%
73.9%69.3%
63.3%60.2%
69.5%71.1%
71.2%
Funded Status
Funding Status
Of primary concern to most pension plan participants is the amount of money available to pay benefits. The City of Richmond has traditionally contributed the annual required contribution (ARC) as determined by the RRS’s actuary. Therefore, a net pension obligation has never existed for the system. This is due in large part to the City Code requirement that contributions to the RRS consist of a normal contribution plus an accrued liabil-ity contribution which, combined, equal the ARC.
An indicator of funding status is the ratio of the actuarial value of the assets to the actuarial liability when using the Projected Unit Credit Method. An increase in this percentage over time usually indicates a plan is becoming financially stronger. However, a decrease will not neces-sarily indicate a plan is in financial decline. Changes in actuarial assumptions can significantly impact the actu-arial liability. Performance in equity and fixed income markets can have a material impact on the actuarial value of assets.
Schedule of Funding ProgressAs of June 30, 2012
Activity for the Fiscal Year Ended June 30 (Dollars in Millions) FY 2012 FY 2011Increase / (Decrease)
Percentage Change
Total Assets $522.42 $552.18 $(29.76) -5.39%
Total Liabilities (60.66) (62.19) (1.54) -2.46%
Net Assets 461.76 489.99 (28.23) -5.76%
Contributions 41.13 42.19 (1.06) -2.51%
Net Investment Earnings 1.90 93.77 (91.87) -97.97%
Total Additions 43.03 135.96 (92.93) -68.35%
Benefits Payments 70.08 62.47 7.61 12.20%
Administrative Expenses 1.17 1.17 – 0.00%
Total Deductions 71.25 63.64 7.61 11.97%
Total Additions 43.03 135.96 (92.93) -68.35%
Total Deductions (71.25) (63.64) (7.61) 11.96%
Net Change $(28.23) $72.32 $(100.54) -139.03%
Contribution Rates
General 26.86% 27.83%
Police/Fire 33.89% 33.31%

Financial Section | 21
The RRS’s Total Fund return underperformed the actuarial return assumption. The fund’s investment return of 1.0% (gross of fees) underperformed the long-term 7.5% actu-arial return assumption target for the year. The RRS’s Total Fund gained 2.5% on an average annual basis in the five-year period ending June 30, 2012, which exceeded the Total Fund benchmark for the same period. The Total Fund returns are reported gross of fees. A schedule of investment results of one-year, three-year, and five-year average performance, with comparable benchmarks, is available in the Investment Section (see page 52.)
Economic Factors
In terms of economic outlook, two factors primarily impact the system: (1) the employer/employee contributions; and (2) the return on investments. These factors directly impact the primary functions of the pension trust, which are to (a) appropriately award and pay benefits and (b) manage investments.
Contacting the RRS’s Financial Management
The financial report is designed to provide citizens, tax-payers, plan participants and the marketplace’s credit analysis with an overview of the RRS’s finances and the prudent exercise of the Board of Trustee’s oversight. If you have any questions regarding this report or need additional financial information, please contact the Richmond Retirement System, 900 E. Broad Street, Room 400, Richmond, Virginia 23219.
Investment Performance
0
3
6
9
12
15Total Fund
Benchmark
5 Years3 Years1 Year
2.4% 2.5%
13.3%
2.4%
1.0%
12.9%
Asset ClassTarget
AllocationTarget Range
US Equity Total: 27.00%Large Cap Passive 8.00% 6-16%Large Cap Growth 5.00% 2-12%Large Cap Value 5.00% 2-12%Long/Short Equity 4.00% 0-9%Small/Mid Cap Growth 2.50% 0-8.5%Small/Mid Cap Value 2.50% 0-8.5%
International Equity Total: 15.00%Developed Markets 8.00% 5-15%Emerging Markets 7.00% 0-10%
Fixed Income Total: 30.50%Core Plus 9.50% 8.5-18.5%Global Fixed Income Hedge 8.00% 3-13%High Yield 6.00% 1-11%TIPS 4.00% 0-9%Credit Opportunities 2.00% 0-7%Core 1.00% 0-6%
Alternatives Total: 26.00%Hedge Funds 8.00% 0-10%Private Equity 8.00% 0-10%Private Debt 5.00% 0-10%Private Real Estate 3.00% 0-9%REITs 2.00% 0-9%
Cash Total: 1.50% 0-5%
Asset Allocation
Investment Activities
Investment income is vital to the RRS’s current and continued financial stability. Therefore, the Board of Trustees has a fiduciary responsibility to act prudently when making investment decisions. To assist the Board in this area, a comprehensive formal investment policy is updated periodically.
As managers and asset classes have been added, specific detailed investment guidelines have been developed, adopted, and included as an addendum to each Invest-ment Manager’s Professional Service Contract.
The Board and its consultants, New England Pension Consultants, review portfolio performance quarterly. Performance is evaluated individually by money man-ager style, collectively by investment type and for the aggregate portfolio.

22 | RRS Comprehensive Financial Report FY 2012
Statement of Fiduciary Net Assets
Defined Benefit Pension Trust Fund As of June 30, 2012
AssetsCash and Short-Term Investments (Note II) $12,261,002
Receivables
Receivables for Security Transactions 16,106,719
Contributions from Participating Employers 1,513,822
Interest and Dividends 1,246,996
Other Receivables 11,278
Total Receivables 18,878,815
Investments, at Fair Value (Note II)
Common Stock 135,882,491
International Stock 70,787,614
Corporate Bonds and Notes 68,071,874
International Bonds and Notes 43,351,641
Hedge Funds 42,679,494
US Government and Agency Obligations 22,258,498
Mutual Funds 19,923,080
Private Real Estate 18,259,655
REITs 11,975,060
Private Equity 9,863,886
Emerging Market Debt 4,507,791
Total Investments 447,561,084
Cash Collateral Received Under Securities Lending Program 43,715,954
Total Assets 522,416,855
Liabilities
DROP Payable* 7,843,462
Payable for Security Transactions 7,052,326
Accounts Payable and Accrued Expenses 1,223,681
Investment Expenses Payable 497,299
Retirement and Death Benefits Payable 323,601
Total Accounts Payable 16,940,369
Payable for Collateral Received Under Securities Lending Program 43,715,954
Total Liabilities 60,656,323
Net Assets Held in Trust for Benefits $461,760,532
* A $5.9M accounting adjustment was made in FY12 to public safety benefit payments to recognize the accrued DROP liability and expenses incurred through 6/30/2012; previously the DROP liability was not included in the RRS’s financial statements as DROP expenses were recognized on a cash basis.
The accompanying Notes to Financial Statements, which begin on page 24, are an integral part of this statement.

Financial Section | 23
Statement of Changes in Fiduciary Net Assets
Defined Benefit Pension Trust Fund As of June 30, 2012
AdditionsCity of Richmond (Note V) $37,589,187
Richmond Behavioral Health Authority 1,037,264
Richmond Public Schools 257,146
Revenue for DC Plan Expenses 30,624
Total Employer Contributions 38,914,221
Total Member Contributions 2,217,385
Total Contributions 41,131,606
Investment Income
Net Appreciation in Fair Value of Investments (Note II) (5,970,817)
Dividends 6,172,105
Interest 3,718,339
Net Investment Gain 3,919,627
Investment Activity Expenses
Investment Management Fees (1,595,549)
Investment Consulting Fees (285,706)
Investment Custodial Fees (252,112)
Total Investment Expenses (2,133,367)
Net Gain from Investing Activities 1,786,260
Security Lending Income
Gross Income 199,499
Less Borrower Rebates and Agent Fees (90,193)
Net Security Lending Income 109,306
Total Net Investment Gain 1,895,566
Total Additions 43,027,172
DeductionsRetirement Benefits* 70,036,680
Refunds of Member Contributions 49,609
Administrative Expenses 1,166,997
Total Deductions (71,253,286)
Net Decrease (28,226,114)
Net Assets Held in Trust for Benefits
Beginning of Year 489,986,646
End of Year $461,760,532
* A $5.9M accounting adjustment was made in FY12 to public safety benefit payments to recognize the accrued DROP liability and expenses incurred through 6/30/2012; previously the DROP liability was not included in the RRS’s financial statements as DROP expenses were recognized on a cash basis.
The accompanying Notes to Financial Statements, which begin on the following page, are an integral part of this statement.
24 | RRS Comprehensive Financial Report FY 2012
Notes to Financial Statements
I. Summary of Significant Financial Policies
(A) Financial Reporting Entity
The RRS is a component unit of the City of Richmond, Virginia. The RRS’s operations are accounted for as a blended component unit in the city’s financial reporting entity because it provides services for the benefit of the city’s employees. Its operations are included in the City of Richmond’s basic financial statements as a fiduciary pension trust fund.
(B) Administration and Management
The RRS is governed by the Board of Trustees, which administers the retirement program according to the requirements of the Code of the City of Richmond, and other governing law. The Board is responsible for the gen-eral administration and operation of the Defined Benefit Plan. The Board has full power to invest and reinvest the trust funds of the RRS through the adoption of the investment policies and guidelines that fulfill the Board’s investment objectives to maximize long-term investment returns while targeting an acceptable level of risk.
The Board of Trustees consists of seven members; City Council appoints five members and the Mayor appoints two members. The Board appoints an Executive Director to administer and transact the RRS’s business. The Board also retains outside investment managers and consul-
tants to advise and assist in the implementation of these policies, and State Street Corporation is the custodian of designated assets of the RRS.
The provisions of Chapter 78 of the Code of the City of Richmond govern the actual operations of the RRS.
The Board of Trustees has oversight and limited admin-istrative responsibility, but no investment responsibility, for the Defined Contribution 401 (a) Plan established for employees of participating employers who were hired or rehired on or after July 1, 2006. Because the Board neither owns nor has custody of the assets, their financial transac-tions are not recorded in the RRS’s accounting system. Therefore, these programs are not included in the RRS’s basic financial statements. Additional information about the Defined Contribution 401(a) Plan is provided in the statistical section of this report.
(C) Accounting Basis
The basic financial statements are presented in accor-dance with U.S. Generally Accepted Accounting Prin-ciples (GAAP) using the accrual basis of accounting and the economic resources measurement focus.
Under the accrual basis, revenues are recognized when earned and expenses are recognized when liabilities are incurred, regardless of the timing of related cash flows. Member and employer contributions are recognized as revenue, when due, in the period in which employees’
Investment Standard of CareAs stated in Section 78-82(d) of the City of Richmond Code, “…the Board shall discharge their duties with respect to the System solely in the interest of the members and beneficiaries of the System and shall invest the assets of the System with the care, skill, prudence, and diligence under the circumstances then prevail-ing that a prudent person acting in a like capacity and familiar with such matters would use in the conduct of an enterprise of a like character and like aims.”
Accordingly, the Board must diversify the portfolio to minimize the risk of large losses unless, under the cir-cumstances, it is clearly prudent not to do so. Primary risk measures are volatility in the plan’s assets, funded status, and contribution rates.

Financial Section | 25
services are performed pursuant to the City of Rich-mond Code.
Investment income is recognized when earned by the plan. Benefits and refunds are recognized when due and payable in accordance with the City Code. The cost of adminis-tering the plan is primarily financed by contributions.
(D) Actuarial Basis and Contribution Rates
The funding policy for the pension plan provides for periodic employer contributions at actuarially determined rates, as a percentage of payroll and will accumulate sufficient assets to meet the cost of all benefits when due. Member and employer contributions are required by Sections 78-111 – 78-113 of the Code.
The actuarial cost method utilized in determining annual required contribution rates is the Projected Unit Credit Method. The unfunded actuarial liability, and any changes in unfunded actuarial liability due to changes in bene-fit provisions, actuarial gains and losses and changes in methods and assumptions, is amortized over a period not more than 30 years, with contributions increasing 4% per year for Police and Fire employees and level contributions for General Employees.
Actuarial valuations estimate the value of reported amounts and assumptions about the probability of occurrence of events in the future. The actuarial assumptions include mortality, turnover, and the use of benefits. Actuarially determined amounts are subject to revision as actual results are compared with past expectations and new estimates are made about the future. The required sup-plemental schedules of funding progress and employer contributions, which follow these notes, present histor-ical information about the increase or decrease of the actuarial values of the plan’s assets over time relative to the unfunded actuarial accrued liability.
(E) Administrative Expenses and Budget
The Board of Trustees approves expenses related to the administration and management of the RRS. These expenses are included in a budget prepared using the full accrual basis of accounting. Administrative expenses are funded exclusively from the investment income. Expenses for goods and services received but not paid
for prior to the RRS’s fiscal year end are accrued for financial reporting purposes in accordance with GAAP. Administrative expenses for the fiscal year ended June 30, 2012, are presented in the Schedule of Administra-tive Expenses in the Supporting Schedules Section fol-lowing the Required Supplementary Information.
(F) Governmental Accounting Standard Board (GASB) Statements
GASB Statement No. 28, Accounting and Financial Reporting for Securities Lending Transactions, estab-lishes accounting and financial reporting standards for securities lending transactions. In these transactions, gov-ernmental entities transfer their securities to broker-dealers and other entities for collateral which may be cash, securities, or letters of credit and simultaneously agree to return the collateral for the same securities in the future. This statement requires governmental enti-ties to report securities lent (the underlying securities) as assets in their balance sheets. Cash received as collat-eral on securities lending transactions and investments made with that cash should be reported as assets. Addi-tional information about the securities lending pro-gram is presented in Section H and in Note II.
GASB Statement No. 40, Deposits and Investment Risk Disclosures, requires disclosures related to credit risk, concentration of credit risk, interest rate risk, custo-dial credit risk and foreign currency risk. The statement also requires disclosure of custodial credit risk and for-eign currency risk for depository accounts. Information about the RRS’s deposit and investment risk is provided in Note II.
GASB Statement No. 50 Pension Disclosure, an Amend-ment to GASB Statements No. 25 and No. 27, enhances information disclosed in the notes to the financial state-ments or presented as required supplementary informa-tion by pension plans. Information about the pension plan administered by the system is presented in Notes IV and V.
GASB Statement No. 53, Accounting and Financial Reporting for Derivative Instruments, establishes accounting and financial reporting standards for govern-ments that enter into derivative instruments. Derivative

26 | RRS Comprehensive Financial Report FY 2012
received cash, U.S. government securities, and irrevo-cable bank letters of credit as collateral. The Custodian did not have the ability to pledge or sell collateral secu-rities delivered absent a borrower’s default.
Borrowers were required to deliver collateral for each loan in amounts equal to not less than 100% of the market value of the loaned securities. The RRS did not impose any restrictions during the fiscal year on the amount of the loans that the Custodian made on its behalf, and the Custodian indemnified the RRS by agreeing to purchase replacement securities, or return the cash collateral, in the event the borrower failed to return the loaned security. There were no such failures by any borrowers during the fiscal year, nor were there any losses during the fiscal year resulting from a default of a borrower or the Custodian.
The RRS and the borrowers maintain the right to ter-minate all securities lending transactions on demand. The cash collateral received on each loan was invested, together with the cash collateral of other qualified tax-exempt plan lenders, in a collective investment pool.
The average duration of the short-term investments in the duration pool which includes securities with a remaining maturity of 91 days or greater for the year ended June 30, 2012 was 1,329 days with weighted average maturity of 40 days. The average duration of the short-term invest-ments in the liquidity pool which primarily includes securities with the remaining maturity of 90 days or less for the year ended June 30, 2012 was 73 days with weighted average maturity of 36 days. As the loans are terminable at will, the duration of the investments gen-erally did not match the duration of the investments made with the cash collateral.
As of June 30, 2012, the market value of the securities on loan was $43,653,581. This balance is composed of U.S. government and agency securities of $4,064,570, common stock of $33,811,157, and corporate bonds of $5,777,854. Securities on loan are included with invest-ments on the Statement of Fiduciary Net Assets and the invested cash collateral is included as an asset and cor-responding liability. At June 30, 2012, the invested cash collateral had a market value of $43,715,954 and was composed of U.S. government and agency securities of
instruments are often complex financial arrangements used by governments to manage specific risks or to make investments. The objective of the statement is to enhance the usefulness and compatibility of derivative financial instruments information reported by state and local government. It provides a comprehensive frame-work for the measurement, recognition, and disclosure of derivative instruments transaction. Additional disclo-sures resulting from the implementation of this state-ment are presented in Note II.
(G) Investments
The investments of the RRS are reported at fair value as determined by the RRS’s custodian, State Street Corpora-tion. The fair value is based on either quotations obtained from national security exchanges or on the basis of quo-tations provided by a pricing service, which uses informa-tion with respect to transactions on bonds, quotations from bond dealers, market transactions in comparable securities and various relationships between securities.
The RRS has modified the investment categories for commingled funds from those provided by the custo-dian to accurately present the underlying investments.
Security transactions and related gains and losses are recorded on a trade date basis. The cost of investments sold is the average cost of the aggregate holding of the spe-cific investment sold. Dividend income is recorded on the ex-dividend date and interest income is accrued as earned.
Futures contracts are valued daily, with the resulting adjustment recorded as realized gains or losses arising from the daily settlement of the variation margin. Gains and losses related to forward contracts and options are recognized at the time the contracts are set-tled. Investments in limited partnerships are accounted for on the equity method of accounting, and their earn-ings or losses for the period are included in investment income using the equity method.
(H) Securities Lending Program
The RRS lends securities to firms on a temporary basis through its custodian bank, State Street Corporation (Custodian). During the fiscal year, the Custodian loaned its securities at the direction of the RRS and

Financial Section | 27
$4,171,751, common stock of $33,630,803 and corpo-rate bonds of $5,913,400.
The RRS cannot sell or pledge the collateral received absent a borrower default. At June 30, 2012, the RRS had no credit risk exposure to borrowers because the amounts it owes the borrowers exceeds the amounts the borrowers owe it.
II. Deposits and Investments
(A) Deposits
On June 30, 2012, the carrying amount of the RRS’s deposits with financial institutions was $170,306 and the bank balance was $1,798,617. All funds deposited in banks are protected under the provisions of the Vir-ginia Securities for Public Deposit Act (the Act).
The Act requires financial institutions holding public deposits in excess of amounts insured by the Federal Deposit Insurance Corporation to pledge collateral in the amount of 50% of excess deposits, and savings and loans to pledge collateral in the amount of 100% of excess deposits to a collateral pool in the name of the State Treasury Board.
The State Treasury Board can assess additional collateral from participating financial institutions to cover collat-eral shortfalls in the event of default, and is responsible for: (1) monitoring compliance with the collateraliza-tion, (2) reporting requirements of the Act, and (3) notifying local governments of compliance by financial institutions.
(B) Investments
1. Authorized Investments
The RRS invests in obligations of the U.S. government or its agencies, approved money market funds, other banks and savings and loan associations not exceeding federal insurance coverage, and commercial paper rated A-1 by Standard & Poor’s or P-1 by Moody’s.
The RRS is also authorized to invest in fixed income securities; domestic and international equities; Real Estate Investment Trusts (REITs); private equity; private real estate and hedge fund-of-funds. Each investment man-
Cost and Fair Value of Investments
June 30, 2012 Cost Fair Value
Common Stock $120,573,357 $135,882,491
International Stock 79,969,756 70,787,614
Corporate Bonds and Notes 63,892,327 68,071,874
International Bonds and Notes 34,968,131 43,351,641
Hedge Funds 43,723,630 42,679,494
US Government & Agency Obligations 21,337,245 22,258,498
Mutual Funds 18,041,696 19,923,080
Private Real Estate 14,935,227 18,259,655
REITs 9,356,995 11,975,060
Private Equity 9,142,057 9,863,886
Emerging Market Debt 4,226,622 4,507,791
Total Long-Term Investments 420,167,043 447,561,083
Collateral Held for Securities on Loan 43,715,954 43,715,954
Total Investments $463,882,997 $491,277,037
Net Change in Position of Fair Value of Investments
Year Ended June 30, 2012 Change
Common Stock $(26,690,616)
International Stock (12,803,815)
Corporate Bonds and Notes (5,157,660)
International Bonds and Notes (1,056,477)
Hedge Funds 2,048,115
US Government and Agency Obligations 3,703,930
Mutual Funds 978,840
Private Real Estate 1,800,621
REITs 757,966
Private Equity 2,297,917
Emerging Market Debt (2,548,982)
Net Change $(36,670,164)

28 | RRS Comprehensive Financial Report FY 2012
Custodial Credit Risk
This is the risk that in the event of the failure of the counterparty, the RRS will not be able to recover the value of its investment or collateral securities that are in the possession of an outside party.
The RRS does not have exposure to custodial credit risk because the cash collateral received in each loan was invested together with the cash collateral of other qualified tax-exempt plan lenders in a collective investment pool.
At June 30, 2012, the market values of securities on loan and cash collateral, which are included in the amounts on page 27, were as follows:
Securities on Loan
Cash Collateral
U.S. Government and agency obligations $4,064,570 $4,171,751
U.S. Stocks 33,811,157 33,630,803
U.S. Bonds 5,777,854 5,913,400
Total $43,653,581 $43,715,954
3. Foreign Currency Risk
Foreign currency risk is the risk that changes in exchange rates will adversely affect the fair value of an investment. The RRS’s currency risk exposures, or exchange rate risk, primarily exist in the international and global equity investment holdings. From time to time, the RRS’s exter-nal managers may hedge their portfolios’ foreign currency exposures with currency forward contracts, depending on their views about a specific foreign currency relative to the U.S. dollar.
The RRS has an Investment Policy for international invest-ments which is presented on pages 48-51. At June 30, 2012, the RRS has no foreign currency risk exposure because it did not have any foreign currency holdings in its portfolio.
4. Interest Rate Risk
Interest rate risk is the risk that changes in interest rates will adversely affect the fair value of an investment. The RRS does not have a specific investment policy governing interest rate risk. The Effective Duration of Debt Secu-rities by Investment Type table on the next page shows the RRS’s interest rate exposure at June 30, 2012.
ager is authorized to invest no more than 5% of its holdings, at market value, in equity securities of a sin-gle issuer excepting the U.S government and agencies and sovereign nations and their agencies.
The RRS has eleven types of investments: common stock, international stock, corporate bonds and notes, inter-national bonds and notes, hedge funds, mutual funds, U.S. government and agency obligations, private real estate, REITs, private equity, and emerging market debt.
2. Credit Risk
Credit risk is the risk that an issuer or other counterparty to an investment will not fulfill its obligation to the RRS. As of June 30, 2012, the RRS’s fixed income assets that are not government guaranteed represent 87% of the domestic fixed income assets.
The RRS has an investment policy for credit risk. The domestic fixed income investments should emphasize high-quality and reasonable diversification. Investments shall not be rated below B3, as rated by Moody’s, or an equivalent rating agency, and the overall weighted aver-age quality shall be A or higher. The ratings in the pol-icy statement are for guidance only; the investment managers are responsible for making an independent analysis of the credit worthiness of securities and their suitability as investments regardless of the classifica-tions provided by rating agencies.
For purposes of calculating compliance with the credit constraints, if split rated, the lowest rating will apply. The System’s fixed income portfolio credit quality and exposure levels as of June 30, 2012 are summarized in the Credit Quality and Exposure Levels of Nongovern-ment Guaranteed Securities table on the next page.
Concentration of Credit Risk
This is the risk of loss that may be attributed to the magnitude of a government’s investment in a single issue. The RRS’s investment guidelines for each specific portfolio limits investments in any corporate entity to no more than 5% of the market value of the account for both the internally and externally managed portfolios. There is no concentration of investments in any one organization that represents 5% or more of plan net assets available for benefits.

Financial Section | 29
Effective Duration of Debt Securities by Duration TypeAs of June 30, 2012
Investment Type Market Value
Weighted Average Effective Duration
(Years)
Corporate $41,793,051 6.47
US Treasury 12,104,005 6.54
Mortgage Pass-Through1 9,213,335 1.72
CMO 4,068,736 6.54
CMBS 2,956,612 2.53
Yankee 1,485,458 3.35
Asset Backed 1,202,413 6.55
Agency 1,025,077 2.63
Convertible 811,988 18.01
Preferred Stock 409,946 9.46
SWAPS (168,728) 5.42
Total Fixed Income $74,901,893 5.77
1 All mortgage pass-through securities held by the RRS as of June 30, 2012 were issued by U.S. Government Agencies.
IV. Plan Description
The RRS was established by action of the Richmond City Council on February 1, 1945. The City Council appoints five members and the Mayor appoints two members of the Board of Trustees to administer the RRS. However, City Council retains the authority to establish or amend benefit provisions. The RRS is currently not subject to the provisions of the Employee Retirement Income Security Act of 1974.
The RRS is of the agent multiple-employer Defined Benefit variety. The RRS has two participating employers — the City of Richmond and the Richmond Behav-ioral Health Authority — covering all full-time, perma-nent employees, with the exception of those elected officials and persons eligible for membership in the Judicial Retirement System and the Virginia Retirement System. Members are vested after five years of credit-able service. The plan is contributory for employees.
The City of Richmond also offers a Defined Contribution 401(a) Plan as another retirement option. This plan is mandatory for general employees hired on/or after July 1, 2006, and optional for senior executives and public safety officers. The RRS is the Trustee for this Plan and has
III. Litigation
The RRS, including its Board of Trustees, officers and employees, is not involved in any ongoing claims or lawsuits that would have an adverse effect on the RRS’s financial conditions.
Credit Quality and Exposure Levels of Nongovernment Guaranteed Securities
As of June 30, 2012
Investment TypeCredit Rating
Level Fair Value
U.S. Government Agencies FNMA $5,188,228
FHLMC 3,648,572
GNMA 1,317,693
10,154,493
Corporate Bonds and Notes AAA 3,262,301
AA1 - AA3 654,240
A1 - A3 6,415,324
BAA1 - BAA3 14,043,325
BA1 - BA3 4,734,856
B1 - B3 8,893,806
Below B3 4,062,978
NR 24,601,787
WR 1,403,258
68,071,874
Foreign Bonds and Notes AAA 74,524
AA1 - AA3 1,763,147
A1 - A3 1,319,026
BAA1 - BAA3 1,922,955
BA1 - BA3 220,345
B1 - B3 305,550
Below B3 355,200
NR 37,390,894
43,351,641
REITs NA 6,700,301
NR 5,274,760
11,975,061
Hedge Funds NR 42,679,494
Total $176,232,563
The RRS used Moody’s ratings for this presentation. A large portion of the securities are not rated by Moody’s but are rated by other agencies.
30 | RRS Comprehensive Financial Report FY 2012
A) Summary of Benefit and Contribution Provisions
Outlined on the following pages are the principal fea-tures of the System reflected in the 2012 valuation.
1. Definitions:
Average Final Compensation
The average annual creditable compensation of a mem-ber during the member’s 36 consecutive months of creditable service in which such compensation was at its greatest amount or during the entire period of the member’s creditable service, if less than three years.
Creditable Compensation
The base compensation payable to an eligible employee working in a full-time position, plus shift differentials, bonuses, severance pay and educational incentive pay but excluding overtime pay, imputed income under Section 79 of the Internal Revenue Service Code, and lump-sum payments for unused sick or vacation leave.
Creditable Service
Total service as an employee, whether or not continu-ous, but excluding any separate periods of service less than nine months in duration and any periods of leave without pay unless otherwise required by law. Effective July 1, 1999, 50% of unused sick leave counts as cred-itable service at retirement for current employees. Vested members who terminated City employment between July 1, 1998 and June 30, 1999 received 25% of unused sick leave as creditable service.
Normal Retirement Date
The first day of the month following the sixtieth (60th) birthday of a sworn public safety employee or the (65th) birthday of a general employee.
2. Retirement Plan Options:
a) Defined Benefit
The Defined Benefit Plan pays a monthly benefit at retirement based on the member’s years of creditable service and average final compensation. General and public safety employees are required to pay contribu-tions of 1% and 1.5% respectively, of their creditable compensation.
contracted with an independent, not-for-profit financial services organization to administer the Plan. The City of Richmond contributes a percentage of an employee’s creditable compensation, based on years of service, to a portable account for investment by the employee. This plan is non-contributory for employees.
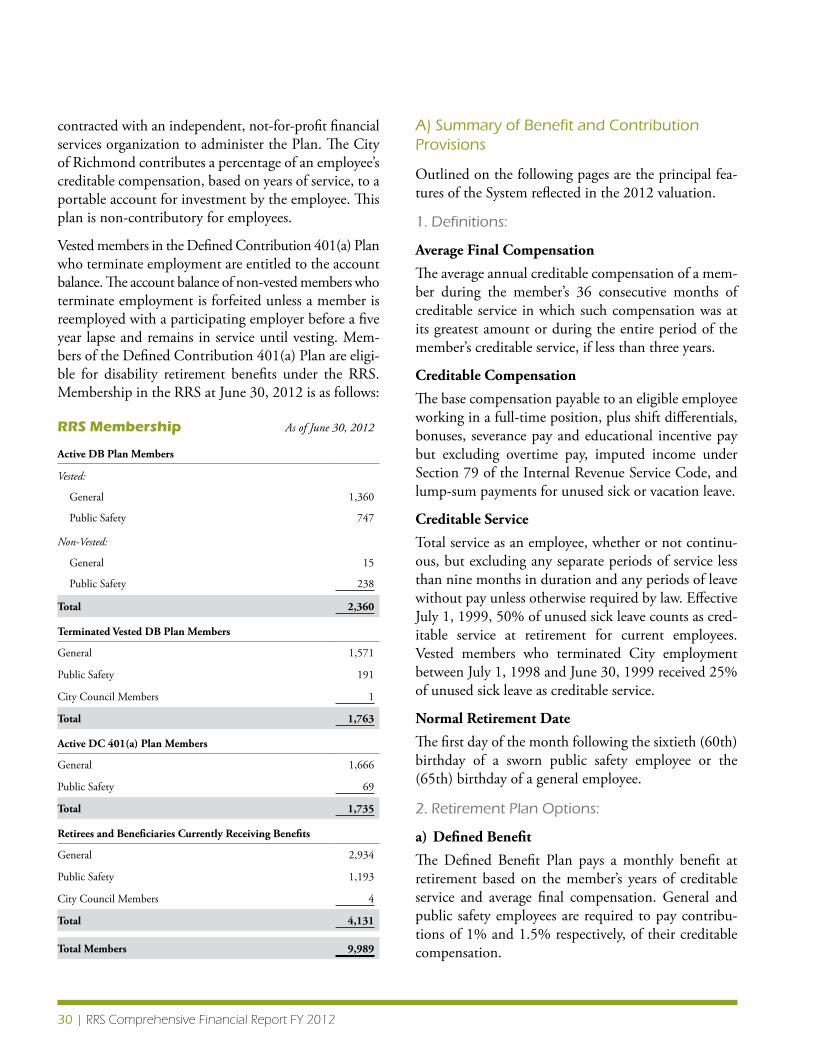
Vested members in the Defined Contribution 401(a) Plan who terminate employment are entitled to the account balance. The account balance of non-vested members who terminate employment is forfeited unless a member is reemployed with a participating employer before a five year lapse and remains in service until vesting. Mem-bers of the Defined Contribution 401(a) Plan are eligi-ble for disability retirement benefits under the RRS. Membership in the RRS at June 30, 2012 is as follows:
RRS Membership As of June 30, 2012
Active DB Plan Members
Vested:
General 1,360
Public Safety 747
Non-Vested:
General 15
Public Safety 238
Total 2,360
Terminated Vested DB Plan Members
General 1,571
Public Safety 191
City Council Members 1
Total 1,763
Active DC 401(a) Plan Members
General 1,666
Public Safety 69
Total 1,735
Retirees and Beneficiaries Currently Receiving Benefits
General 2,934
Public Safety 1,193
City Council Members 4
Total 4,131
Total Members 9,989

Financial Section | 31
c) Defined Contribution Plan
The Defined Contribution Plan is a 401(a) account which grows through contributions from the partici-pating employers and investment earnings. The Defined Contribution Plan is funded entirely by employer con-tributions, and no employee contributions are required. Participating employers contribute a percentage of the member’s salary to an account each pay period in accor-dance with the following schedule, which is based on years of creditable service:
• Lessthan5yearsofservice—5%
• 5-10yearsofservice—6%
• 10-15yearsofservice—8%
• 15ormoreyearsofservice—10%
Once a vested member (5 years of creditable service) terminates employment, the benefit is a lump sum amount equal to the account balance.
It may also be payable in installment payments, rolled over to another qualified investment plan, or used to purchase a lifetime annuity.
3. Deferred Retirement Option Program (DROP):
Effective October 1, 2003, the DROP was implemented for public safety employees eligible for an unreduced retirement allowance. Eligible members may elect to participate for a maximum of five years, deferring receipt of unreduced retirement benefits while continuing employment with the City without loss of any other employee benefits.
Upon a member’s election to participate in the DROP, the amount of creditable service and the average final compensation becomes frozen for purposes of deter-mining pension benefits. The participant is considered retired for all purposes related to the System and does not accrue additional retirement benefits, except for annual benefit cost-of-living adjustments, if applicable.
The DROP participant’s monthly pension is paid into a DROP account in lieu of being paid to the partici-pant. Upon termination of employment, the partici-pant will receive the DROP account balance and will begin receiving the monthly pension directly.
The Defined Benefit Plan formula has a multiplier of 1.75% for general employees and 1.65% for public safety employees. In addition, the formula includes a pre-65 supplement of 0.75%, up to a maximum of twenty-five (25) years for public safety employees.
The benefit level is set by formula, regardless of the retirement fund’s investment performance. Participating employers contribute an amount each year that varies according to the contribution rate as determined by the RRS’s actuary. The participating employers’ contributions are invested by outside investment firms with the primary objective of ensuring the security, stability and contin-ued growth of assets for members’ future benefits.
The Code of the City of Richmond requires that the Plan be maintained on an actuarially sound basis.
b) Enhanced Defined Benefit
The Enhanced Defined Benefit Plan option pays a monthly benefit at retirement based on the member’s years of creditable service and average final compensation.
General employees are required to make contributions of 4.57% of their creditable compensation, and public safety employees are required to make contributions of 5.45% of their creditable compensation, until they ter-minate employment or retire in order to receive the benefits of the Enhanced Option.
For general members, the Enhanced Option formula has a multiplier of 2%.
For public safety employees, the Enhanced Option allows eligibility for an unreduced early service retirement upon the completion of twenty (20) years of creditable service, regardless of age.
The benefit level for the Enhanced Option is set by for-mula, regardless of the fund’s investment performance. Participating employers contribute an amount each year that varies according to calculations by the actuary. The participating employers’ contributions are invested by outside investment firms with the primary objective of ensuring the security, stability, and continued growth of assets for members’ future benefits. The Code of the City of Richmond requires that the Plan be maintained on an actuarially sound basis.

32 | RRS Comprehensive Financial Report FY 2012
the allowance is determined as described in letter a). For general employees, the benefit is reduced by 5/12 of 1% for each complete month by which retirement precedes the earlier of age 65 or the date on which the employee would have completed 30 years of service had the member remained employed. For public safety employees, the benefit is reduced by 5/12 of 1% for each complete month by which retirement precedes either age 60 or the date on which the employee would have completed 25 years of service had the member remained in service, whichever is earlier.
c) Workers’ Compensation Offset:
In no instance may a member who receives both (a) a com-pensation award pursuant to the Virginia Workers’ Com-pensation Act, and (b) a retirement allowance before the attainment of age 65 from the RRS, receive a benefit which would cause the sum of the Workers’ Compensation award and retirement allowance to exceed the member’s average final compensation at the time the member sep-arated from active service. After attainment of age 65, the member shall be entitled to the full retirement allowance.
If a member in receipt of a retirement allowance elects to receive a lump-sum settlement in lieu of periodic payments for disability under the Virginia Workers’ Compensation Act, the member’s service retirement allowance shall continue to be reduced in the same amount required by Section 78-206(5) for the number of months equivalent to the lump-sum award amount divided by the amount of the original Workers’ Com-pensation award.
7. Retirement Benefit Payment Options:
The member may elect, with the approval of the Board, one of the following options, in which case the amount payable is the actuarial equivalent of the Basic Benefit otherwise payable.
a) Joint and Survivor Option:
A reduced allowance is payable to the member during their lifetime; with the same amount or a designated fraction thereof continued after the member’s death to a designated contingent beneficiary, if living.
b) Pop-Up Joint and Survivor Option:
A reduced allowance is payable to the member during
The RRS made a $5.9M accounting adjustment in FY12 to public safety benefit payments to recognize the accrued DROP liability and expenses incurred through 6/30/2012; previously the DROP liability was not included in the RRS’s financial statements as DROP expenses were recognized on a cash basis.
4. Assets of System:
All of the funds and assets of the RRS are credited to a single retirement account. This account is credited with all income from the assets of the RRS, and all of the RRS’s benefits are paid from this account.
5. Retirement Eligibility:
A member is eligible for normal retirement upon attaining their normal retirement date (general employees, age 65; public safety employees, age 60). Early retirement is per-mitted at any time within the ten-year period prior to the normal retirement date, provided the member has completed five or more years of creditable service or at any age with 30 years of creditable service (general employ-ees) or 25 years of creditable service (public safety employees participating in defined benefit plan) or 20 years of creditable service (public safety employees par-ticipating in the enhanced defined benefit plan option).
6. Retirement Allowance:
Upon retirement, a member becomes eligible to receive an annual allowance, payable in equal monthly install-ments. The annual allowance is computed as follows:
a) Normal Retirement Allowance:
General Employees: 1.75% (2% Enhanced option) of the member’s average final compensation, multiplied by the number of years of creditable service up to 35 years.
Public Safety Employees: 1.65% of the member’s aver-age final compensation, multiplied by the number of years of creditable service up to 35 years. In addition, a supplement of .75% of the member’s average final compensation, multiplied by the number of years of creditable service up to 25 years is payable from retire-ment until age 65.
b) Early Retirement Allowance:
If a member retires prior to their normal retirement age,

Financial Section | 33
ing modifications: “Disability Average Compensation” is used in place of Average Final Compensation. In essence, this is the annual rate of compensation in effect at the date of disability, graded into average final com-pensation for members who become disabled within three years of their normal retirement date Creditable Service is replaced by “Disability Credited Service,” which is the smaller of: i. The number of years of cred-itable service the member would have completed at age 60 if the member had remained in service until that time, or ii. The larger of: a. 20 years, or b. Twice the member’s actual years of creditable service except that if the dis-ability occurs after age 60, disability credited service is equal to the number of years of creditable service. A deduction for Social Security is made prior to age 65 if the member is entitled to total and permanent disabil-ity benefits under Social Security. The early service reduction factor of 5/12 of 1% per month early retire-ment reduction is not imposed. The additional pre-age 65 allowance for public safety employees is not payable.
In no instance may a member who receives a compensa-tion award pursuant to the Virginia Workers’ Compensa-tion Act and a non-service connected disability retirement allowance from the City receive a benefit which would cause the sum of the disability retirement allowance and Workers’ Compensation award to exceed the member’s average final compensation at the time the non service connected disability caused separation from active service.
b) Service Connected Disability
The annual allowance payable monthly, is computed in the same way as a normal retirement allowance prior to the changes effective March 1,1997, with the following modifications: The disability retirement allowance is computed as 2/3 of the member’s disability average compensation. This allowance shall be reduced dollar for dollar by the amount of compensation, if any, awarded to the member under the Virginia Workers’ Compen-sation Act for as long as such compensation is payable. If any member who retired on or after July 1, 1989, elects to receive a lump-sum settlement in lieu of periodic payments for disability under the Virginia Workers’ Compensation Act, the member’s retirement allowance shall continue to be reduced in the same amount and for the number of months equivalent to the lump-sum
their lifetime; with the same amount or a designated fraction thereof continued after the member’s death to a designated contingent beneficiary, if living. If the des-ignated contingent beneficiary predeceases the member, the allowance is increased to the amount that would have been payable in the absence of the election of an optional form of benefit.
c) Smooth-Out Option:
An increased retirement allowance is paid prior to age 65 and a decreased retirement allowance thereafter. The pur-pose of this option is to provide for a more nearly level total retirement income before and after age 65, taking into account the primary federal Social Security benefits.
d) Level Option:
A reduced allowance is paid prior to age 65 and an increased retirement allowance thereafter. The allow-ance remains level for the lifetime of the member. This option is available to current public safety employees and to former vested general employees who termi-nated service prior to March 1, 1997.
8. Disability Retirement Eligibility:
Any member in service who has 5 or more years of creditable service may retire, or may be retired by the member’s appointing authority, at any time prior to the member’s normal retirement date on account of perma-nent disability, provided that the medical examiners certify that the member has been completely incapaci-tated by reason of sickness or injury from performing the duties required by the participating employers, and provided further that if the disability is service con-nected (i.e., if it arises from a cause that would be com-pensable under the Virginia Workers’ Compensation Act), the five-year service requirement does not apply. The service requirement is also waived for public safety employees if the disability arises from respiratory or heart disease or from hypertension, unless it is certified that such disability was not suffered in the line of duty.
9. Disability Retirement Allowance:
a) Non-Service Connected Disability
The annual allowance, payable monthly, is computed in the same way as a normal retirement allowance prior to the changes effective March 1, 1997, with the follow-

34 | RRS Comprehensive Financial Report FY 2012
award divided by the amount of the original Workers’ Compensation award. A deduction for Social Security is made prior to age 65 if the member is entitled to total and permanent disability benefits under Social Secu-rity. The early service reduction factor of 5/12 of 1% per month early retirement reduction is not imposed. The additional pre-age 65 allowance for public safety employees is not payable.
10. Withdrawal of Benefits:
If termination occurs after five years of service, a mem-ber is entitled to a retirement allowance commencing on the member’s earliest retirement date or later, based on the years of creditable service and average final com-pensation as of the member’s termination date. If ben-efit payments commence prior to the member’s normal retirement date, benefits are reduced by 5/12 of 1% for each complete month by which retirement precedes the normal retirement date.
11. Death Benefits Before Retirement:
If a member who became an employee of the partici-pating employer on or before June 13, 1988 and has one or more years of creditable service dies before retirement, a death benefit is payable equal to $16.67 multiplied by the number of months of creditable ser-vice of the member, subject to a maximum of $1,000.
If a member who is eligible for an early or normal retire-ment dies prior to actual retirement and no benefit of the type described in the paragraph below is payable, the surviving spouse is entitled to receive an allowance for life equal to that amount which would have been paid if the full Joint and Survivor Option had been in effect at the time of the member’s death. The additional allowance paid from retirement to age 65 to public safety employees is not included in this benefit.
If a member dies at any time before retirement from a cause that would be compensable under the Virginia Workers’ Compensation Act, an allowance is payable to the surviving spouse or to the member’s children under the age of 18 equal to that which would have been pay-able if the full Joint and Survivor Option had been in effect at the time of the member’s death. The allowance is calculated by projecting creditable service to that which
the member would have earned had they remained in service until age 65 with the same final average com-pensation in effect at the time of their death. The ben-efit is reduced by any compensation awarded under the Virginia Worker’s Compensation Act.
12. Death Benefits after Retirement:
The beneficiary of a retired member with at least one year of creditable service will receive, at the member’s death, a death benefit of $16.67 multiplied by the number of months of creditable service of the member, subject to a maximum of $1,000.
An allowance for life, as described in the preceding paragraphs, is also payable to the widow or widower of a member who retired for disability after attaining early retirement age but dies before reaching normal retire-ment age. In this case, the member’s average final com-pensation as of the disability retirement date is used, but it is assumed the member’s service continued to the last day of the month in which the member died.
13. Cost-of-Living Allowances (COLA):
Retirement allowances are periodically supplemented to reflect increases in the Consumer Price Index. The amounts of future COLAs are determined by action of City Council. Any such COLAs are subject to the same conditions of payment as the regular allowances.
14. City Council Benefits:
Effective July 1, 1991, any member of City Council serv-ing 10 or more years on City Council shall be entitled to a retirement benefit under the RRS. The amount of the benefit is 50% of final compensation, payable at age 65. Early retirement is allowed at age 62, with benefits reduced 5% per year prior to the earlier of age 65 or the age that the City Council member would have had 15 years of creditable service. This provision was repealed for active members of City Council effective February 2, 1996.
15. Benefits for City Officials and Department Heads:
Effective March 1, 1997, certain City of Richmond officials and department heads can make additional contributions to the RRS in order to receive two years of credit for each year of service in a covered position (up to a maximum of 15 additional years).

Financial Section | 35
16. Purchase of Prior Service:
Any Defined Benefit Plan member in service who has completed 5 or more years of creditable service may pur-chase credit for service for all or part of: (1) certified cred-itable service in the retirement system of another state or of a political subdivision, and (2) any period of full-time service rendered to a participating employer on a tempo-rary, seasonal, provisional, Comprehensive Employment Training Act (CETA) or contractual basis, provided that such period has not been previously included in the cred-itable service. Service purchased under this section shall not be considered in determining eligibility for an unre-duced early retirement, if the member’s retirement is within 5 years of the date of purchase of service credit.
17. Portability:
Effective April 1, 1999, the RRS entered into a reciprocal agreement with the Virginia Retirement System (VRS) that allows vested members to transfer the value of their retirement benefits between VRS and the RRS. Effective May 1, 2001 and August 30, 2007 the RRS also entered into reciprocal agreements with the Newport News Employee Retirement Fund (NNERF) and the Nor-folk Employee Retirement System (NERS), respec-tively. System members must have a vested benefit with
VRS, NNERF, or NERS. VRS, NNERF, and NERS members must have deferred vested benefits with their System. The election period is eighteen (18) months from the date of eligibility.
V. Contributions Required and Contributions Made
Employer contributions to the RRS are based on a per-centage of the creditable compensation of the active members. This percentage is calculated annually by the RRS’s actuary using the projected unit credit method. The annual contribution percentages include amortiza-tion of the unfunded actuarial liability.
The City Code requires that contributions to the RRS consist of a normal contribution plus an accrued liabil-ity contribution, which, combined, equal the annual required contribution. Employer contribution rates and amounts for the years ended June 30th of 2012, 2011, and 2010, are shown in the table below.
Contributions totaling $41,131,606, including $2,217,385 in member contributions, were made from July 1, 2011 to June 30, 2012 in accordance with the actuarially determined contribution requirements stated above.
Contributions Required and Contributions Made (Dollars in Thousands)
General Employees Police & Fire Employees
2012 2011 2010 2012 2011 2010
Normal Costs Rate 6.84% 6.87% 7.10% 10.68% 10.34% 10.75%
Amount $4,958 $5,258 $5,822 $5,670 $5,442 $5,832
Accrued Liability Rate 20.02% 20.96% 14.06% 23.21% 22.97% 14.79%
Amount $14,513 $16,042 $11,529 $12,322 $12,088 $8,024
Additional for COLA Rate N/A2 N/A2 N/A2 N/A2 N/A2 N/A2
Amount $504 $504 $504 $454 $436 $419
Employer Contributions Rate 26.86% 27.83% 21.16% 33.89% 33.31% 25.54%
Amount $19,9751 $21,804 $17,854 $18,4461 $17,966 $14,276
Employee Contributions Rate 1.60% 1.71% 1.67% 1.99% 2.12% 2.06%
Amount $1,160 $1,305 $1,370 $1,058 $1,116 $1,116
Total Contributions Rate 28.46% 29.54% 22.83% 35.88% 35.43% 27.60%
Amount $21,134 $23,109 $19,224 $19,504 $19,082 $15,392
1 The City contributed an additional $493,529 in excess of the required contribution amounts shown above for the fiscal year ended June 30, 2012.2 Additional contributions for COLA are paid in annual lump sum payments by the City and are not included in the contribution rates shown.

36 | RRS Comprehensive Financial Report FY 2012
Funding Policy
The Richmond City Code of 1993, as amended, requires the City to contribute to the RRS, annually, an amount as determined by the actuary, expressed as a percentage of payroll, equal to the sum of the “normal contribution” and the “actuarial liability contribution.”
The actuarial liability contribution is determined as that amount necessary to amortize the unfunded actuarial liability and any increase or decrease in the unfunded actuarial liability in future years due to changes in actu-arial assumptions, changes in RRS provisions, including the granting of COLA increases, or actuarial gains or losses amortized over a closed period not to exceed 30 years, with payments increasing up to 4% per year.
Actuarial Assumptions
The information presented in the plan funding status was determined as part of the actuarial valuation on July 1, 2012. The Projected Unit Credit actuarial cost method was used. The amortization method used was a level percent of pay over a closed period not to exceed 30 years for police and fire employees, and a level dollar amount over a closed period not to exceed 30 years for general members. The remaining amortization period is 20 years for remaining unfunded accrued liability as of July 1, 2006 and 20 years for subsequent changes.
The asset valuation method was a five-year spread of actual over expected investment earnings with the restriction that the resulting value must be within 90%-110% of market value. A 7.5% investment rate of return was assumed, as was a 2.5% payroll growth rate attributable to inflation. No cost-of-living adjustment was assumed. Projected salary increases were 0.5%-3.5% for general employees and 0.5%-4.0% for police and fire employees. The funded status decreased to 56.2% as of June 30, 2012. The required Schedule of Funding Progress immediately following the notes to the financial statements presents multi-year trend information about whether the actuarial value of plan assets is increasing or decreasing relative to the actuarial liability for benefits over time.
Potential effects of legal and contractual limitations are not explicitly incorporated in benefits for financial reporting purposes.
System Termination
In the event the system is terminated, the net assets of the RRS will be allocated generally to provide the fol-lowing benefits in the order indicated: (a) For the ben-efit of the then existing beneficiaries and persons already designated by former members who are then beneficiaries under one of the options provided for in the RRS, to the extent of the actuarial value of their retirement allowances. If any funds remain, then: (b) For the benefit of members and persons, if any, desig-nated by the members under one of the options pro-vided for in the RRS, to the extent not provided under the preceding paragraph (a) of the actuarial value of their accrued retirement allowances, based on years of creditable service, average final compensation and anticipated social security benefits as of the date of ter-mination of the pension plan. The allocation under this paragraph (b) shall be on the basis of the “oldest ages first” method.
The Richmond City Code of 1993, as amended, states: “In the event the assets at such date of repeal are insuf-ficient to provide all the benefits of preceding para-graph (a), then the employer will contribute to the assets from time to time, as and when required, the amount necessary to make up such insufficiency.”
The Code of Virginia of 1950, as amended, requires that “on or before July 1, 1977, every county, city, and every town, having a population of five thousand or more, shall provide a retirement system for those offi-cers and employees eligible for coverage under Section 51-111.31(a) of the State Code.” The City of Rich-mond is included in this provision.
Participants are not guaranteed any benefits by the Pen-sion Benefit Guaranty Corporation because this is a public pension trust.
Tax Status
The RRS has received a favorable determination letter from the Internal Revenue Service stating that it is qual-ified in form under the Internal Revenue Service Code.
Analysis of the dollar amounts of actuarial valued assets, actuarial liability, and unfunded actuarial liability in

Financial Section | 37
Plan Funding Status
Actuarial Valuation Date
Actuarial Value of Assets [a]
Actuarial Liability (AAL) Projected Unit Credit [b]
Unfunded AAL (UAAL) [b]-[a]
Percentage Funded
Ratio [a]/[b] Covered
Payroll [c]
UAAL as a Percentage of
Covered Payroll [UAAL]/[c]
7/1/12 $476,122,597 $846,441,828 $370,319,231 56.25% $125,060,489 296.11%
Library of Virginia, Courtesy Visit Richmond
isolation can be misleading. Expressing actuarial valued assets as a percentage of the actuarial liability provides one indication of the RRS’s funding status on a going-concern basis. Analysis of this percentage over time indicates whether the system is becoming financially stronger or weaker. Generally, the greater this percent-age, the stronger the system.
Trends in the unfunded actuarial liability and annual covered payroll are both affected by inflation. Express-ing the unfunded actuarial liability as a percentage of annual covered payroll approximately adjusts for the effects of inflation and aids in the analysis of the system’s progress made in accumulating sufficient assets to pay benefits when due. Generally, the smaller this percentage, the stronger the system.

In this section:
Schedule of Funding Progress
Schedule of Employer Contributions
Notes to the Schedules of Trend Information
View of downtown Richmond from the Virginia State Capitol building
RequiredSupplementaryInformation
Financial Section, continued

Financial Section | 39
Schedule of Employer Contributions (Unaudited) (Dollars in Thousands)Excludes Member Contributions
Year Ended June 30 Annual Required Contribution Percentage Contributed
2012 $38,421 101%*
2011 39,770 100%
2010 32,130 100%
2009 33,241 100%
2008 32,026 100%
2007 30,889 100%
* The City contributed an additional $493,529 in excess of the required contribution amounts shown above for the fiscal year ended June 30, 2012.
Schedule of Funding Progress (Unaudited) (Dollars in Thousands)
Actuarial Valuation Date
Actuarial Value of Assets [a]
Actuarial Liability (AAL) Projected Unit Credit [b]
Unfunded AAL (UAAL) [b]-[a]
Percentage Funded
Ratio [a]/[b]Covered
Payroll [c]
UAAL as a Percentage of
Covered Payroll [UAAL]/[c]
7/1/12 $476,123 $846,442 $370,319 56.25% $125,060 296.11%
7/1/11 493,375 841,362 347,987 58.64% 130,971 265.70%
7/1/10 459,436 787,931 328,496 58.31% 137,473 238.95%
7/1/09 424,532 779,825 355,293 54.44% 145,868 243.57%
7/1/08 544,772 765,417 220,646 71.17% 144,833 152.35%
7/1/07 526,201 740,465 214,264 71.06% 147,898 114.87%

40 | RRS Comprehensive Financial Report FY 2012
Methodology:
Valuation Date July 1, 2012
Actuarial Cost Method Projected Unit Credit
Amortization Method Level percent of pay over a closed period not to exceed 30 years for police and fire employees; level dollar amount over a closed period not to exceed 30 years for general members.
Remaining Amortization Period 20 years for remaining unfunded accrued liability as of July 1, 2006; 20 years for subsequent changes.
Asset Valuation Method Five-year spread of actual over expected investment earnings with the restriction that the resulting value must be within 90%-110% of market value.
Actuarial Assumptions:
Investment Rate of Return 7.5%
Payroll growth rate, attributable to inflation 2.5%
Annual Cost-of-Living Adjustment No cost-of-living adjustment granted.
Projected Salary Increases:
General Employees 0.50% to 3.50%
Police and Fire Employees 0.50% to 4.00%

In this section:
Schedule of Administrative Expenses
Schedule of Investment Expenses
Schedule of Payments to Investment Consultants
The James River, Richmond, Virginia
Supporting Schedules
Financial Section, continued

42 | RRS Comprehensive Financial Report FY 2012
Notes to the Schedules of Trend Information
The information presented in the required supplementary information schedules was determined as part of the actu-arial valuations at the dates indicated. Additional information as to the latest actuarial valuation follows:
Schedule of Administrative Expenses Year Ended June 30, 2012
Personnel Services
Payroll Expenses $959,822
Total Personnel Services 959,822
Professional Services
Actuarial 78,965
Legal Services 30,557
Audit 18,000
Medical Examiners 4,455
Total Professional Services 131,977
Communications
Printing & Publications 18,071
Telephone & Postage 17,627
Total Communications 35,698
Miscellaneous
Stipends to Board Members 10,250
Supplies 4,717
Recruitment 2,293
Conferences 1,831
Other 20,408
Total Miscellaneous 39,499
Total Administrative Expenses $1,166,997
VCU Basketball, Courtesy of the Virginia Tourism CorporationBlack History Museum, Courtesy Visit Richmond

Financial Section | 43
Schedule of Investment Expenses Year Ended June 30, 2012
Investment Managers:
LSV Asset Management $150,336
Loomis, Sayles & Co. (High Yield) 146,866
Westwood 146,507
Stone Harbor Investment Partners 132,055
Loomis, Sayles & Co. (Large Cap) 118,844
Chartwell Investment Partners (Small Cap) 82,868
Chartwell Investment Partners (Mid Cap) 78,491
Urdang Investment Management, Inc. 64,469
Loomis, Sayles & Co. (Credit Opportunistic) 45,613
State Street Global Advisors 16,050
Hughes Capital 12,158
Commingled Funds:
Brandywine Global Investment Management, LLC 232,847
JP Morgan Asset Management 202,618
Acadian Asset Management 165,827
Total Investment Managers Expenses* $1,595,549
Investment Custodian
State Street Corporation 252,112
Total Investment Expenses $1,847,660
*This list excludes investment management fees for ABS Investment Management, LLC; Audax Group, L.P.; BlackRock Financial Management, Inc.; Gratham, Mayo Van Otterloo & Co, LLC.; K2 Advisors, LLC; Lexington Partners, Inc.; Pine Grove Associates, Inc.; and Protégé Partners QP Fund, Ltd. Fees for these managers are deducted from the assets under management.
Investment Consultant:
New England Pension Consultants $285,706
Total Consultant Expenses: $285,706
During the fiscal year ended June 30, 2012, the RRS did not direct any soft dollar transactions.
Schedule of Payments to Investment Consultant Year Ended June 30, 2012

In this section:
Investment Consultant Report
Investment Policy
RRS Fiscal Year Return
Asset Allocation
Ten Largest Equity Holdings
Schedule of Fees
Schedule of Brokerage Commissions
Investment Summary
The Virginia State Capitol, Courtesy of the Virginia Tourism Corporation
Investment Section
The Investment Section provides detailed information regarding the performance of the investment pool. This information includes asset allocation, investment management fees and expenses, and an investment summary.

Investment Section | 45
Investment Consultant Report
August 31, 2012
Board of Trustees Richmond Retirement System City Hall, Room 400 900 East Broad Street Richmond, VA 23219RE: Fiscal Year End 2012
Dear Trustees,
NEPC, LLC currently serves as the pension consultant for the Richmond Retirement System (RRS). In our role as the pension consultant, we assist the Board in several manners: determining and executing the overall asset allocation strategy of the Plan, drafting of the investment policy of the Plan (and amendment of when necessary), conducting investment manager searches (both traditional and alternative asset classes); conducting custodial services searches, providing ongoing performance evaluation to each individual investment manager, to each asset class composite, and for the overall investment portfolio as a whole, and providing pertinent education to the Board.
The overall objective of the RRS is to provide service, disability, death and vested retirement benefits, and other post-employment benefits to members and their beneficiaries. To ensure a solid foundation for the future of the System, RRS plans to implement an investment program designed to achieve the actuarial assumed rate of return of the long term, while prudently managing the risk of the portfolio.
Although investment manager performance is key in the future “success” of the Plan, the overall asset allocation pol-icy will be the primary determinant of such “success.” Modern portfolio theory maintains that long-term investors, who assume prudent levels of risk, will be rewarded with incremental returns above lower returning and risk free assets (i.e. T-Bills). The pension fund, in its asset allocation policy, is required to satisfy the need to pay accumulated/earned retirement benefits today, while at the same time be prepared for “uncertain” future benefits. This balancing of short-term needs versus long-term needs is a key tenant in the overall construction of the portfolio known as the generation of income versus appreciation of assets. To facilitate this demand balance of short term versus long term, the Board has adopted a diversified asset allocation structure that is primarily weighted in equity asset classes, such as US equities and Non-US equities, which seek return with offsetting investments in fixed income which provide cur-rent income and stability.
One Main Street | Cambridge, MA 02142 | TEL: 617.374.1300 | www.nepc.com
CAMBRIDGE | ATLANTA | CHARLOTTE | CHICAGO | DETROIT | LAS VEGAS | SAN FRANCISCO
KEVIN M. LEONARD PARTNER August 31, 2012 Board of Trustees Richmond Retirement System City Hall, Room 400 900 East Broad Street Richmond, VA 23219 RE: Fiscal Year End 2012 Dear Trustees, NEPC LLC currently serves as the pension consultant for the Richmond Retirement System (RRS). In our role as the pension consultant, we assist the Board in several manners: determining and executing the overall asset allocation strategy of the Plan, drafting of the investment policy of the Plan (and amendment of when necessary), conducting investment manager searches (both traditional and alternative asset classes); conducting custodial services searches, providing ongoing performance evaluation to each individual investment manager, to each asset class composite, and for the overall investment portfolio as a whole, and providing pertinent education to the Board. The overall objective of the RRS is to provide service, disability, death and vested retirement benefits, and other postemployment benefits to members and their beneficiaries. To ensure a solid foundation for the future of the System, RRS plans to implement an investment program designed to achieve the actuarial assumed rate of return of the long term, while prudently managing the risk of the portfolio. Although investment manager performance is key in the future “success” of the Plan, the overall asset allocation policy will be the primary determinant of such “success”. Modern portfolio theory maintains that long term investors, who assume prudent levels of risk, will be rewarded with incremental returns above lower returning and risk free assets (i.e. T-Bills). The pension fund, in its asset allocation policy, is required to satisfy the need to pay accumulated/earned retirement benefits today, while at the same time be prepared for “uncertain” future benefits. This balancing of short-term needs versus long-term needs is a key tenant in the overall construction of the portfolio known as the generation of income versus appreciation of assets. To facilitate this demand balance of short term versus long term, the Board has adopted a diversified asset allocation structure that is primarily weighted in equity asset classes, such as US equities and Non-US equities, which seek return with offsetting investments in fixed income which provide current income and stability. The Board continues to work diligently on restructuring and expanding the alternative investment program, which will further assist in the diversification of the portfolio. Asset classes such as hedge funds are designed to lower the overall volatility of the program, while private equity is designed to provide higher long term performance above what is expected from traditional equity markets. As the allocation strategy evolves year after year, diversification and risk mitigation will continue to be the pillars of the asset allocation
continued on next page

46 | RRS Comprehensive Financial Report FY 2012
The Board continues to work diligently on restructuring and expanding the alternative investment program, which will further assist in the diversification of the portfolio. Asset classes such as hedge funds are designed to lower the overall volatility of the program, while private equity is designed to provide higher long-term performance above what is expected from traditional equity markets. As the allocation strategy evolves year after year, diversification and risk mitigation will continue to be the pillars of the asset allocation structure. During fiscal year 2012, the Board con-ducted an asset liability study (ALS) with the primary goal to make determinations regarding areas of concern and potential areas for improvement with the context of the program’s asset allocation targets and ranges. A liquidity study was conducted in conjunction with the ALM process. This study analyzed the current profile of net contribu-tions vs. benefit payments, as well as the current liquidity demands of the short and long-term illiquid segments of the portfolio. The liquidity analysis modeled several market environments, including stressed scenarios, to test how the investment program would respond under various market conditions. The liquidity analysis is a useful tool in assessing how much of the portfolio can be allocated to illiquid investments before having a negative impact on the portfolio’s ability to meet current and future liability obligations. The liquidity study showed that there are no signif-icant immediate concerns with RRS’s current liquidity profile and that RRS could afford an increased allocation to illiquid investments. Given the structure of the RRS, liquidity demands may change, therefore the Board will need to continue to monitor the Fund’s liquidity profile. As a result of the ALM and the liquidity study, the Board deter-mined that is was prudent to make slight changes to the current asset allocation. It is expected that the Board will implement these changes during the fourth quarter of 2012 and into the first half of 2013.
NEPC provides RRS with quarterly economic and investment market updates and performance reviews, investment manager monitoring and selection advice, and related investment services for traditional and non-traditional asset classes. Investment performance analysis and comparisons produced by NEPC have been calculated using standard performance evaluation methodologies and are consistent with industry standards. Performance results are calculated using a time-weighted return methodology. The Board’s goal of achieving market rates of returns, while mitigating unwarranted risk, is measured against appropriate benchmarks and comparative universes on a quarterly basis. Per-formance is measured on a most recent quarter, year-to-date, and accumulated trailing annual periods, as well as three and five year periods (full market cycle). Risk-adjusted performance on an absolute basis and a comparative basis is also measured. This review process allows the Board to evaluate and determine whether established goals and objective are being achieved.
NEPC will recommend termination and replacement when individual manager goals and objectives are not being met, when there are significant changes to an investment management firms’ organizational structure, departures of key investment professionals, or when a manager deviates from the investment style for which they were hired.
Fiscal Year 2012 Market Review
As fiscal year 2012 started, the global equity markets were tumbling, high-yield bonds and other credit sectors were selling off, and Treasury yields were near rock bottom. The Eurozone was in crisis, and the recently downgraded U.S.
One Main Street | Cambridge, MA 02142 | TEL: 617.374.1300 | www.nepc.com
CAMBRIDGE | ATLANTA | CHARLOTTE | CHICAGO | DETROIT | LAS VEGAS | SAN FRANCISCO
KEVIN M. LEONARD PARTNER August 31, 2012 Board of Trustees Richmond Retirement System City Hall, Room 400 900 East Broad Street Richmond, VA 23219 RE: Fiscal Year End 2012 Dear Trustees, NEPC LLC currently serves as the pension consultant for the Richmond Retirement System (RRS). In our role as the pension consultant, we assist the Board in several manners: determining and executing the overall asset allocation strategy of the Plan, drafting of the investment policy of the Plan (and amendment of when necessary), conducting investment manager searches (both traditional and alternative asset classes); conducting custodial services searches, providing ongoing performance evaluation to each individual investment manager, to each asset class composite, and for the overall investment portfolio as a whole, and providing pertinent education to the Board. The overall objective of the RRS is to provide service, disability, death and vested retirement benefits, and other postemployment benefits to members and their beneficiaries. To ensure a solid foundation for the future of the System, RRS plans to implement an investment program designed to achieve the actuarial assumed rate of return of the long term, while prudently managing the risk of the portfolio. Although investment manager performance is key in the future “success” of the Plan, the overall asset allocation policy will be the primary determinant of such “success”. Modern portfolio theory maintains that long term investors, who assume prudent levels of risk, will be rewarded with incremental returns above lower returning and risk free assets (i.e. T-Bills). The pension fund, in its asset allocation policy, is required to satisfy the need to pay accumulated/earned retirement benefits today, while at the same time be prepared for “uncertain” future benefits. This balancing of short-term needs versus long-term needs is a key tenant in the overall construction of the portfolio known as the generation of income versus appreciation of assets. To facilitate this demand balance of short term versus long term, the Board has adopted a diversified asset allocation structure that is primarily weighted in equity asset classes, such as US equities and Non-US equities, which seek return with offsetting investments in fixed income which provide current income and stability. The Board continues to work diligently on restructuring and expanding the alternative investment program, which will further assist in the diversification of the portfolio. Asset classes such as hedge funds are designed to lower the overall volatility of the program, while private equity is designed to provide higher long term performance above what is expected from traditional equity markets. As the allocation strategy evolves year after year, diversification and risk mitigation will continue to be the pillars of the asset allocation
continued on next page

Investment Section | 47
was politically deadlocked as deficits gaped and long-term growth prospects were muted. Markets turned around in the fourth quarter of 2011, driven by improvements in U.S. economic data on unemployment and consumer spend-ing. The rally continued into the first quarter of calendar year 2012 with global stock markets all up double digits in the first quarter as a result of positive events at the European Central Bank, the successful refinancing of a portion of Greece’s debt, and the further development of the European Financial Stability Facility.
The fiscal year ended much the way it started, with the European debt crisis and global economic issues taking cen-ter stage, with fears surrounding the election of the Socialist party in France and the belief that the Greek political parties would not be able to support the country’s austerity driving negative sentiment. Beyond the Eurozone, China announced an official lowering of GDP growth targets. These headlines triggered a sell-off in the global equity mar-kets, effectively reducing the gains experienced in the previous two quarters. Amid this backdrop, Treasury yields dropped to all-time lows and the dollar rose relative to most developed and emerging market currencies in a flight to safety.
For the fiscal-year-ending June 30, 2012, the RRS Total Fund returned 1.1% on a gross-of-fees basis (0.6% on a net-of-fees basis). For the trailing three-year-ending June 30, 2012 period, the RRS Total Fund returned 12.9% on a gross-of-fees basis (12.4% on a net-of-fees basis). Relative to peer group comparison (InvestorForce Public Fund Uni-verse), this ranked the RRS in the 8th percentile (1% being the highest, 100% being the lowest), outpacing 92% of other public funds within the universe.
Diversification aims to reduce volatility and better equalize the contribution to an overall plan’s risk across a variety of asset classes with unrelated return patterns. Our goal is to diversify the System’s assets within the traditional and non-traditional asset classes to reduce volatility, achieve above market returns, and to better protect the portfolio against difficult market conditions.
Sincerely,
One Main Street | Cambridge, MA 02142 | TEL: 617.374.1300 | www.nepc.com
CAMBRIDGE | ATLANTA | CHARLOTTE | CHICAGO | DETROIT | LAS VEGAS | SAN FRANCISCO
KEVIN M. LEONARD PARTNER August 31, 2012 Board of Trustees Richmond Retirement System City Hall, Room 400 900 East Broad Street Richmond, VA 23219 RE: Fiscal Year End 2012 Dear Trustees, NEPC LLC currently serves as the pension consultant for the Richmond Retirement System (RRS). In our role as the pension consultant, we assist the Board in several manners: determining and executing the overall asset allocation strategy of the Plan, drafting of the investment policy of the Plan (and amendment of when necessary), conducting investment manager searches (both traditional and alternative asset classes); conducting custodial services searches, providing ongoing performance evaluation to each individual investment manager, to each asset class composite, and for the overall investment portfolio as a whole, and providing pertinent education to the Board. The overall objective of the RRS is to provide service, disability, death and vested retirement benefits, and other postemployment benefits to members and their beneficiaries. To ensure a solid foundation for the future of the System, RRS plans to implement an investment program designed to achieve the actuarial assumed rate of return of the long term, while prudently managing the risk of the portfolio. Although investment manager performance is key in the future “success” of the Plan, the overall asset allocation policy will be the primary determinant of such “success”. Modern portfolio theory maintains that long term investors, who assume prudent levels of risk, will be rewarded with incremental returns above lower returning and risk free assets (i.e. T-Bills). The pension fund, in its asset allocation policy, is required to satisfy the need to pay accumulated/earned retirement benefits today, while at the same time be prepared for “uncertain” future benefits. This balancing of short-term needs versus long-term needs is a key tenant in the overall construction of the portfolio known as the generation of income versus appreciation of assets. To facilitate this demand balance of short term versus long term, the Board has adopted a diversified asset allocation structure that is primarily weighted in equity asset classes, such as US equities and Non-US equities, which seek return with offsetting investments in fixed income which provide current income and stability. The Board continues to work diligently on restructuring and expanding the alternative investment program, which will further assist in the diversification of the portfolio. Asset classes such as hedge funds are designed to lower the overall volatility of the program, while private equity is designed to provide higher long term performance above what is expected from traditional equity markets. As the allocation strategy evolves year after year, diversification and risk mitigation will continue to be the pillars of the asset allocation

48 | RRS Comprehensive Financial Report FY 2012
Investment Policy
Introduction
This policy statement is issued for the guidance of fidu-ciaries, including the members of the Board of Trustees and investment managers, in the course of investing the assets of the RRS.
Policy guidelines may be amended by the Board of Trustees both upon their own initiative and upon consideration of the advice and recommendations of the investment managers and fund professionals. Proposed modifications should be documented in writing to the RRS.
Statement of Goals and Objectives
This statement of investment goals and objectives is set forth in keeping with the fiduciary requirements under existing federal laws. Its purpose is to set forth an appro-priate set of goals and objectives for the RRS’s assets and to define guidelines within which the investment managers may formulate and execute their investment decisions.
1. Total return, consistent with prudent investment management, is the primary goal of the System. The total return target is 7.5% net compounded annually, which considers the actuarial rate of return of 7.5%. Total return, as used herein, includes income plus realized and unrealized gains and losses on assets. In addition, assets shall be invested to ensure that prin-cipal is preserved and enhanced over time.
2. The total return shall meet or exceed the Policy Index. As a secondary comparison, the RRS shall also be compared with comparable public pension funds as represented by the Consultants Public Pension Fund peer group universe (ICC Universe), with the under-standing that the funded status and overall invest-ment risk profile may differ from the average public pension fund in that universe.
3. Total portfolio risk exposure and risk-adjusted returns will be regularly evaluated and compared with a uni-verse of similar funds for the RRS and each invest-ment manager. Total portfolio risk exposure should
generally rank in the mid-range of comparable funds. Risk-adjusted returns are expected to consistently rank in the top-half of comparable funds.
It is expected that each asset class portfolio will exceed the return of the designated benchmark index and rank in the top-half of the appropriate asset class and style universe.
4. The Board of Trustees is aware that there may be deviations from these performance targets. Normally, results are evaluated over a three- to five-year time horizon, but shorter-term results will be regularly reviewed and earlier action taken if in the best interest of the RRS.
Investment Guidelines
The overall capital structure targets and permissible ranges for eligible asset classes are detailed in the asset allocation schedule located in the Financial Section.
Full discretion, within the parameters of the guidelines described herein, is granted to the investment manag-ers regarding the asset allocation, the selection of secu-rities, and the timing of transactions.
1. Equity investments, i.e., common stocks, convertibles, warrants and rights are permitted subject to the guide-lines identified in the Investment Policy Statement. Equity specialists may vary equity commitment from 90% to 100% of assets under management. The man-agers should determine that the securities to be pur-chased are of an investment grade. American Depository Receipts, which are dollar-denominated foreign secu-rities traded on the domestic U.S. stock exchanges, e.g., Reuters, Nestle, Sony, may be held by each domes-tic stock manager in proportions which each man-ager shall deem appropriate.
2. Domestic fixed income investments are permitted, subject to the guidelines identified in the Investment Policy Statement, and may include U.S. Government and Agency obligations, mortgage backed securities;

Investment Section | 49
including non-agency mortgages and commercial mortgage-backed securities; asset-backed securities; corporate bonds; debentures; commercial paper; and taxable municipals.
3. The minimum quality rating of any fixed income issue held in an investment grade portfolio shall be B as rated by Moody’s, or an equivalent rating agency, and the overall weighted average quality shall be A or higher. The ratings in this Policy Statement are for guidance only; the investment managers are respon-sible for making an independent analysis of the credit worthiness of securities and their suitability as invest-ments regardless of the classifications provided by rating agencies.
4. The average duration (interest rate sensitivity) of an actively managed fixed income portfolio shall be within +/- 30% of its benchmark index.
5. Securities of an individual issuer, excepting the U.S. government and agencies and sovereign nations and their agencies, shall not constitute more than 5% of an investment manager’s portfolio at any time, at market value.
6. Investment managers may maintain reserve and cash equivalent investments. However, these investments should be made on the basis of safety and liquidity, and only secondarily by yield available. Such securities shall carry the equivalent of S&P A1 or A2 ratings. Cash reserves will be limited to cash equivalent instru-ments of maturities less than one year; the pooled cash fund of the custodian bank and commingled funds meeting this requirement are permitted.
7. There shall be no specific limitation to turnover. However, modest turnover is preferred.
Ineligible Investments
Unless specifically approved, certain securities, strate-gies and investments are ineligible for inclusion within separately managed accounts in the RRS’s asset base. Among these are: derivative instruments except as spe-cifically provided for in individual manager guidelines; privately-placed or other non-marketable debt, except securities issued under Rule 144a of the Securities Act of 1933; lettered, legend or other so-called restricted
stock; commodities; straight preferred stocks and non-taxable municipal securities should not normally be held unless pricing anomalies in the marketplace suggest the likelihood of near-term capital gains when normal spread relationships resume; short sales; direct investments in private placements, real estate, oil and gas and venture capital; any transaction prohibited by Employee Retire-ment Income Security Act (ERISA).
Benefit Payments
Investment managers will be given adequate notice of cash needs and an estimation of the liquidity require-ments from their funds. They will be expected to man-age their funds to provide for anticipated withdrawals without impairing the investment process.
Proxy Voting
Responsibility for the exercise of ownership rights through proxy solicitations shall rest solely with the investment managers, who shall exercise this responsi-bility strictly for the economic benefit of the portfolios. Managers shall annually report to the Plan standing policies with respect to proxy voting, including any changes that have occurred in those policies.
Commingled Funds
Mutual funds and other types of commingled investment vehicles provide, under some circumstances, lower costs and better diversification than can be obtained with a separately managed fund pursuing the same investment objectives. However, commingled investment funds can-not customize investment policies and guidelines to the specific needs of individual clients. The Board of Trustees is willing to accept the policies of such funds in order to achieve the lower costs and diversification benefits of commingled funds therefore, commingled investment vehicles selected by the board are exempt from the pol-icies and restrictions specified herein.
Alternative Investments
The Board of Trustees recognizes that certain Alterna-tive Investment strategies (such as hedge fund, absolute return and private equity strategies) do in fact make use of derivatives and other instruments which may not be in full compliance with the guidelines set out for separately

50 | RRS Comprehensive Financial Report FY 2012
managed portfolios. Given that virtually all alternative investment strategies will be in a commingled format, the Guidelines for Pooled Funds will apply. To the extent that the Board of Trustees selects an Alternative Invest-ment manager offering a separately managed account, the board may use its discretion in terms of granting exceptions to these guidelines to that manager.
Hedge Fund Investments
The Board of Trustees has determined that a strategic allocation to hedge fund strategies may improve the overall performance characteristics of the Fund’s invest-ment program by enhancing expected returns, reduc-ing risk, or a combination of both. The objective of the hedge fund program is to reduce the volatility of the total fund while attempting to maximize returns in a variety of market conditions.
Manager Probation
Investment Managers may be placed on a watch list in response to the Board of Trustees’ concerns about the manager’s recent or long-term investment results, failure of the Investment Manager to comply with any of this Investment Policy Statement, significant changes in the Investment Manager’s firm, changes in the manager’s investment strategy, anticipated changes in fund struc-ture, or any other reasons which the Board of Trustees deems appropriate. A manager may be placed on proba-tionary status if: performance fails over eight consecu-tive quarters or any eight quarters during a ten quarter period, to achieve median same style universe perfor-mance levels, and during this same period the return does not meet the return of the benchmark index.
This does not preclude the Board of Trustees from placing an Investment Manager on the watch list for performance in a lesser time period or taking other actions if deemed appropriate.
Roles and Responsibilities
Board of Trustees
The Board of Trustees shall review the total investment program. The board shall approve the investment policy
and provide overall direction to the staff in the execution of the investment policy. The board, with the assistance of the investment consultant, are responsible for evalu-ating, hiring, and terminating investment managers, consultants and custodian banks.
Investment Consultant
The Investment Consultant shall assist the Board of Trust-ees in developing and modifying policy objectives and guidelines, including the development of asset allocation strategies, recommendations on long-term asset allocation and the appropriate mix of investment manager styles and strategies. The consultant shall also provide assistance in manager searches and selection, and in investment perfor-mance calculation, evaluation, and analysis. The consul-tant shall provide timely information, written and/or oral, on investment strategies, instruments, managers and other related issues, as requested by the board.
Investment Managers
The duties and responsibilities of each of the invest-ment advisors include: 1. Managing the RRS’s assets in accordance with the policy guidelines and objectives expressed herein. 2. Meeting with the Board of Trustees at their request. Each manager shall report to the board and the Investment Consultant as outlined in the Investment Policy Statement. Quarterly reports should be submitted in writing within 30 days at the end of a quarter. 3. Working with the custodian bank to verify monthly accounting reports. 4. Acknowledging in writ-ing to the Board of Trustees the Investment Manager’s intention to comply with this Statement as it currently exists or as modified in the future.
Custodian Bank
In order to maximize the RRS’s return, no money should be allowed to remain idle. Dividends, interest, proceeds from sales, new contributions and all other monies are to be invested or reinvested promptly.
The custodian bank will be responsible for performing the following functions:
1. Accept daily instructions from designated staff.

Investment Section | 51
Other Consideration
It is the intent of the Board of Trustees to revise this statement of goals and objectives to reflect modifica-tions and revisions, which may develop from time to time. It is also the policy of the board to review these goals and objectives at least once per year and to com-municate any material change thereto to the Invest-ment Managers.
This Policy statement is prepared to provide appropri-ate guidelines for the investment managers, consistent with the RRS’s return objectives and risk tolerances. Should any investment manager believe that the guide-lines are unduly restrictive or inappropriate; the Board of Trustees expects to be advised accordingly. Invest-ment Managers will be expected to include “most favored nations” clauses within their contracts when working on behalf of the RRS.
2. Notify investment managers of proxies, tenders, rights, fractional shares or other dispositions of holdings.
3. Resolve any problems that designated staff may have relating to the custodial account.
4. Safekeeping of securities.
5. Collection of interest and dividends.
6. Daily cash sweep of idle principal and income cash balances.
7. Processing of all investment manager transactions.
8. Collection of proceeds from maturing securities.
9. Disbursement of all income or principal cash bal-ances as directed.
10. Collect asset values from pooled accounts, hedge funds, private equity investments and other alterna-tive asset classes not custodized by the bank for inclusion in the System’s com prehensive monthly valuation reports.
11. Providing monthly statements by investment account and a consolidated statement of all assets.
12. Working with the investment consultant and the System’s accountant to ensure accuracy in reporting.
13. Provide written statements revealing monthly rec-onciliation of custody and investment managers’ accounting statements.

52 | RRS Comprehensive Financial Report FY 2012
Schedules of Investment Results
Investment Performance (Gross of Fees) One, Three, & Five Years Ending June 30, 2012
Fiscal Year Returns (Gross of Fees)
(a) Russell 3000(b) 71% MSCI EAFE/29% MSCI ACWI ex US net(c) 73% Russell 3000/19% MSCI EAFE/8% MSCI
ACWI ex US net(d) 56% BC Aggregate/22% US TIPS/22%
Citigroup High-Yield Index(e) 40% BC Aggregate/30% BC Global AGG
Unhedged/15% Citigroup High-Yield Index/15% Barclays US TIPS
(f ) Wilshire RESI/Nareit Eq REIT(g) 91-Day Treasury Bills
(h) Policy Index: i. 12/2009 – present: Total Fund Index: 45%
Russell 3000/13% BC Aggregate/12% MSCI EAFE/10% LB Global AGG Unhedged/5% MSCI ACWI ex US net/5% US TIPS/5% Citigroup High-Yield Index/5% NAREIT Eq REIT
ii. 11/2008 – 11/2009: Total Fund Index: 45% Russell 3000/13% BC Aggregate/12% MSCI EAFE/10% LB Global AGG Unhedged/5% MSCI ACWI ex US net/5% US TIPS/5% Citigroup High-Yield Index/5% Dow Jones Wilshire Real Estate
iii. 2/2008 – 10/2008: Total Fund Index: 45% Russell 3000/13% BC Aggregate/12% MSCI EAFE/10% LB Global AGG Unhedged/5% IFC Invest/5% US TIPS/ 5% Citigroup High-Yield Index/5% Dow Jones Wilshire Real Estate
iv. Inception – 1/2008: Total Fund Index: 45% Russell 3000/13% BC Aggregate/12% MSCI EAFE/10% Non-US WGBI ex US/5% IFC Invest/5% US TIPS/5% Citigroup High-Yield Index/5% Dow Jones Wilshire Real Estate
Benchmarks:
Source: State Street Summary of Plan Performance Report as of June 30, 2012. The rates of return as reflected on the accompanying schedule were calculated using the time-weighted rate of return using an approximation of the Daily Valuation Method called the Modified Dietz Method.
-20%
-15%
-10%
-5%
0%
5%
10%
15%
20%
25%
2012201120102009200820072006200520042003
1 YEAR 3 YEARS 5 YEARS
Asset Category Note% Rate of
Return%
Benchmark% Rate of
Return%
Benchmark% Rate of
Return%
Benchmark
U.S. Equity (a) 1.3 3.8 16.5 16.7 -0.2 0.4International Equity (b) -14.8 -14.0 8.3 6.3 -5.8 -5.2Total Equity (c) -3.8 -1.2 14.0 13.9 -1.8 -1.2
U.S. Fixed Income (d) 6.6 8.5 11.6 9.5 8.3 7.6Total Fixed Income (e) 7.2 6.8 11.9 8.4 9.6 7.6
Hedge Funds -4.2 N/A 2.5 N/A N/A N/AREITs (f ) 14.1 12.9 35.9 33.2 6.7 1.7Private Real Estate 12.0 N/A N/A N/A N/A N/APrivate Equity 5.6 N/A N/A N/A N/A N/ATotal Alternative Assets 3.8 N/A 13.1 N/A 2.2 N/A
Cash (g) 0.0 0.1 0.1 0.1 1.4 1.0Total Plan (h) 1.0 2.4 12.9 13.3 2.5 2.4
Investment Return Assumption
Effective July 1, 2011 the investment return assumption was changed to 7.5% (from 8%)
3.5%
17.0%
11.9% 11.4%
17.0%
-3.8%
-18.4%
15.7%
23.1%
1.0%

Investment Section | 53
Asset ClassTarget
AllocationActual
Allocation*
US Equity
Large Cap Passive 8.00% 10.77%
Large Cap Value 5.00% 5.67%
Large Cap Growth 5.00% 5.46%
Long/Short Equity 4.00% 5.13%
Small/Mid Cap Growth 2.50% 4.13%
Small/Mid Cap Value 2.50% 3.40%
Total 27.00% 34.56%
International Equity
Developed Markets 8.00% 9.27%
Emerging Markets 7.00% 4.78%
Total 15.00% 14.05%
Fixed Income
Core Plus 9.50% 13.18%
Global Fixed Income Hedge 8.00% 7.92%
High Yield 6.00% 6.61%
TIPS 4.00% 4.23%
Credit Opportunities 2.00% 2.24%
Core 1.00% 1.15%
Total 30.50% 35.33%
Alternatives
Hedge Funds 8.00% 7.10%
Private Equity 8.00% 2.10%
Private Debt 5.00% 0.00%
Private Real Estate 3.00% 3.88%
REITs 2.00% 2.63%
Total 26.00% 15.71%
Cash 1.50% 0.35%
Total 1.50% 0.35%
Total 100.00% 100.00%
Asset Allocation
* Actual allocation based upon fair market value presented in the Statement of Fiduciary Net Assets.
14.05% International Equity
0.35% Cash
34.56% U.S. Equity
35.33% Fixed Income
15.71% Alternatives

54 | RRS Comprehensive Financial Report FY 2012
Schedule of Investments
Ten Largest Equity Holdings at June 30, 2012
Description Share/Par Fair Value
Amazon.com Inc. 6,557 $1,497,291
Google Inc. CL A 2,451 1,421,752
CISCO Systems Inc. 78,696 1,351,210
Oracle Corp. 45,068 1,338,520
Visa Inc. Class A shares 10,253 1,267,578
Qualcomm Inc. 21,398 1,191,441
SEI Investments Company 55,797 1,109,802
Zimmer Holdings Inc. 16,807 1,081,699
Chevron Corp. 10,100 1,065,550
Pfizer Inc. 45,600 1,048,800
Total Ten Largest Equity Holdings $12,373,642
Fair Value of cash, short-term investments, and investments, June 30, 2012 $513,342,708
Percentage of Ten Largest Equity Holdings 2.41%
A complete listing of the holdings at June 30, 2012 is available from the RRS's executive office.
Science Museum of Virginia, Courtesy Visit Richmond Virginia State Capitol, Courtesy Visit Richmond

Investment Section | 55
Schedule of Fees
For Fiscal Year Ending June 30, 2012
Assets Under Management Related Fees*
Investment Manager's Strategy
Corporate Stock $135,882,491 $572,907
International Stock 70,787,614 194,340
Corporate Bonds and Notes 68,071,874 224,047
International Bonds and Notes 43,351,641 252,668
Hedge Funds 42,679,494 –
US government and agency obligations 22,258,498 45,097
Mutual Funds 19,923,080 –
Private Real Estate 18,259,656 202,618
Cash 12,090,696 33,415
REITs 11,975,061 62,535
Private Equity 9,863,886 –
Emerging Market Debt 4,507,791 7,923
Total Long-Term Investments 459,651,781 1,595,549
Cash Collateral for Securities Lending 43,715,954 –
Payables 7,549,625 –
Short-Term 2,425,348 –
Total $513,342,708 1,595,549
Other Investment Service Fees
Consultant 285,706
Custodian 252,112
Securities Lending Agent 72,828
Total Investment Service Fees $2,206,195
*This list excludes investment management fees for ABS Investment Management, LLC; Audax Group, L.P.; BlackRock Financial Management, Inc.; Gratham, Mayo Van Otterloo & Co, LLC.; K2 Advisors, LLC; Lexington Partners, Inc.; Pine Grove Associates, Inc.; and Protégé Partners QP Fund, Ltd. Fees for these managers are deducted from the assets under management.

56 | RRS Comprehensive Financial Report FY 2012
Schedule of Brokerage Commissions
Commissions in Excess of $10,000
For the Fiscal Year Ended June 30, 2012
Broker Name Shares/Par Commission Per Share
Broadcort Capital (through Merrill Lynch) 402,267 $16,069 $0.04
Goldman Sachs International 694,476 12,467 0.02
Other* 460,784,309 76,952 0.00
Total Commissions 461,881,052 $105,489
*Other includes all commissions to brokerage firms receiving less than $10,000 during the fiscal year ended 6/30/2012.
Maymont, Courtesy Visit Richmond Lewis Ginter Botanical Gardens, Courtesy Visit Richmond

Investment Section | 57
Investment Summary
As of June 30, 2012Fair
Value% of Total Fair Value
U.S. Stocks
Information Technology $15,065,320 2.93%Consumer 12,719,863 2.48%Financial 11,572,446 2.25%Healthcare 10,583,805 2.06%Industrials 7,990,936 1.56%Energy 5,292,835 1.03%Materials 1,593,689 0.31%Utilities 1,075,821 0.21%Telecommunications 260,318 0.05%Other 69,727,458 13.58%Total U.S. Stock 135,882,491 26.47%
Fixed Income
Corporate Bonds 68,071,874 13.26%International Bonds 43,351,641 8.44%U.S. Government and Agency Obligations 22,258,498 4.34%Total Fixed Income 133,682,013 26.04%
Alternative Investments
International Stock 70,787,614 13.79%Hedge Funds 42,679,494 8.31%Mutual Funds 19,923,079 3.88%Private Real Estate 18,259,656 3.56%REITs 11,975,061 2.33%Private Equity 9,863,886 1.92%Emerging Market Debt 4,507,791 0.88%Total Alternative Investments 177,996,580 34.67%
Short-Term Investments
Cash Collateral (Securities Lending) 43,715,954 8.52%Short Term 12,261,002 2.39%Total Short-Term Investments 55,976,956 10.90%
Receivables and Payables
Due from Brokers on Sale of Securities 16,106,719 3.14%Interest and Dividends Receivable 1,246,997 0.25%Other Investment Receivables 578 0.00%Due to Broker on Purchase of Securities (7,549,625) -1.47%Total Receivables and Payables 9,804,669 1.91%
Total Investments $513,342,708 100.00%
12.81% Short-Term Investments and Receivables and Payables
26.47% U.S. Stocks
26.04% Fixed Income
34.67% Alternative Investments

In this section:
Actuary’s Report
Actuarial Assumptions and Methods
Schedule of Active Members Valuation Data
Schedule of Beneficiaries Added and Removed from Rolls
Solvency Test
Analysis of Financial Experience
The Virginia Museum of Fine Arts, Courtesy of the Richmond Metropolitan Convention and Visitors Bureau © Bilyana Dimitrova
Actuarial Section
The Actuarial Section presents information relat-ing to the funded status of the pension plan. Additionally, the section provides detailed infor-mation about actuarial assumptions, includes retirement trend data, and summarized provi-sions and changes.

Actuarial Section | 59
Actuary’s Report
September 4, 2012
Board of Trustees The Richmond Retirement System Richmond, Virginia
Ladies and Gentlemen:
Actuarial valuations of the Richmond Retirement System are performed annually. The results of the latest actuarial valuation of the System, which was prepared as of July 1, 2012, are summarized in this letter.
The valuation reflects the benefits in effect on the valuation date, and was prepared on the basis of the data submit-ted by the City using generally accepted actuarial principles and methods.
Financing Objective and City’s Contribution Rate
The financing objective of the System is to:
(a) fully fund all current costs based on the normal contribution rate payable by the City determined under the fund-ing method; and
(b) liquidate the unfunded actuarial liability based on actuarial liability contributions payable by the City over an amortization period of no more than 30 years, with contributions increasing 4% per year for Police/Fire employ-ees and level contributions for General employees.
The July 1, 2012 valuation develops contribution rates for the fiscal year ending June 30, 2014. These contribution rates are as follows:
General Employees Police & Fire Total
Beginning of Year 34.41% 38.39% 36.14%
Monthly 35.70% 39.83% 37.50%
End of Year 36.99% 41.27% 38.85%
SageView Consulting Group
4421 Cox Road, Glen Allen, VA 23060
804.270.1508 | www.sageviewadvisory.com
continued on next page

60 | RRS Comprehensive Financial Report FY 2012
The City is also making annual contributions to fund retiree COLAs granted in 2007 and 2009 as follows:
General Employees Police & Fire Total
Amount Payable July 1, 2012 $503,818 $471,800 $975,618
The contribution rates and amounts displayed above are sufficient to support the benefits of the System and admin-istrative expenses, and achieve the financing objective set forth above.
The actuarial funded status of the System (ratio of actuarial value of assets to actuarial liability) as of June 30, 2012 is 56.2% as compared to 58.6% as of June 30, 2011.
The market value funded status of the System (ratio of market value of assets to actuarial liability) as of June 30, 2012 is 55.5% as compared to 58.2% as of June 30, 2011.
City’s Assets and Participant Data
The individual data for members of the System as of the valuation date were reported to the actuary by the City. While we did not verify the data at their source, we did perform tests for internal consistency and reasonability in relation to the data submitted for the previous valuation. It is our understanding that the outside auditor of the Sys-tem has also made an examination of the data.
The amount of current assets in the trust fund taken into account in the valuation was based on statements prepared for us by the Retirement System Staff and audited by the independent auditor of the System. No reduction for future DROP payments was recognized in the asset value as those amounts are still held in the Trust. Instead an estimated present value of future DROP payments is included in the actuarial liability.
Actuarial Assumptions and Methods
Actuarial assumptions are adopted by the Board, upon review of recommendations made by the actuary. An experi-ence study was conducted for the five-year period ended June 30, 2008. This study resulted in the Board adopting several changes in assumptions, at the recommendation of the actuary, in order to better anticipate emerging experi-ence under the system. In addition, the Board reviewed the investment return assumption and decided to lower that assumption to 7.5% effective July 1, 2011.
The actuarial cost method utilized is the projected unit credit actuarial cost method. This method is an acceptable method for determining the annual required contribution in accordance with GASB Statements 25, 27, and 34. The amortization method used for General employees is a level dollar method over a closed period not to exceed 30 years. The amortization method used for Police & Fire employees is a level percent of pay method over a closed period not to exceed 30 years.
continued on next page
Board of TrusteesSeptember 4, 2012page 2

Actuarial Section | 61
For purposes of determining contribution rates, the difference between actual investment earnings and expected investment earnings is recognized over a five-year period, with the restriction that the actuarial asset value cannot be less than 90% or more than 110% of market value. This smoothing method is utilized in order to smooth the impact of short-term market fluctuations on the System’s contribution rates and funded status.
Samples of the actuarial assumptions, and descriptions of the actuarial cost method and asset valuation method are set forth in the outline of actuarial assumptions and methods included in the report.
Legislative and Administrative Changes
There were no legislative or administrative changes since the last valuation that had a financial impact on the System.
A summary of plan provisions can be found in Table 13 of the actuarial valuation report.
Unfunded Actuarial Liability
The unfunded actuarial liability is determined as the excess, if any, of the actuarial liability determined under the pro-jected unit credit cost method over the actuarial value of assets. This unfunded actuarial liability, and any changes in unfunded actuarial liability due to changes in benefit provisions, actuarial gains and losses, and changes in methods and/or assumptions is amortized over a period of not more than 30 years, with contributions increasing 4% per year for Police & Fire employees and level contributions for General employees.
The unfunded actuarial liability is $370,319,231 as of July 1, 2012, as compared to the unfunded actuarial liability of $347,987,178 as of July 1, 2011.
The unfunded actuarial liability as of July 1, 2006 is being amortized over a period of 20 years; subsequent changes in unfunded actuarial liability (with the exception of changes due to COLA) are also being amortized over a period of 20 years, with contributions increasing 4% per year for Police & Fire employees and level contributions for Gen-eral employees. Increases in unfunded actuarial liability due to COLA are funded via a first year lump sum payment with the remaining increase amortized over a period of five to ten years. The portion funded via a lump sum and the portion amortized are based on the System’s funded status in accordance with a schedule adopted by the Board of Trustees. These amortization periods and methods are acceptable for determining the annual required contribution in accordance with GASB Statements 25, 27, and 34.
Funding Adequacy
The annual rate of return (net of fees) for the fiscal year ended June 30, 2012 was 0.6% which was less than the expected return of 7.5%. The net result is that the System’s funded status has decreased. The calculated total contri-bution rates have also increased.
Board of TrusteesSeptember 4, 2012page 3
continued on next page

62 | RRS Comprehensive Financial Report FY 2012
The results of the valuation indicate the rate of contribution payable by the City, when taken together with the cur-rent assets of the System including member contributions, is adequate to fund the actuarial liabilities on account of all benefits payable under the System in accordance with generally accepted actuarial principles utilizing the assump-tions and methods adopted by the Board.
Financial Results and Membership Data
Detailed summaries of the financial results of the valuation and membership data used in preparing the valuation are shown in the valuation report and the related membership data schedules. We were responsible for providing infor-mation for all schedules included in the Actuarial Section, as well as certain schedules included in the Financial Sec-tion (Schedule of Funding Progress and Schedule of Employer Contributions) of the consolidated annual financial report for the fiscal year ended June 30, 2012.
Defined Contribution Plan
The City also sponsors a 401(a) Defined Contribution Plan for all General employees hired on or after July 1, 2006 and other employees who have elected to participate in that plan in lieu of the Richmond Retirement System. We have prepared an analysis of the Defined Contribution Plan with respect to Virginia Code Title 51.1-800 and believe it is in compliance.
To the best of our knowledge, this report is complete and accurate, and the System is being operated on an actuari-ally sound basis. All costs and liabilities have been determined in conformance with generally accepted actuarial prin-ciples and on the basis of actuarial assumptions and methods which are each individually reasonable taking into account past experience and reasonable expectations of future experience.
Respectfully submitted,
SageView Consulting Group
__________________________
William M. Dowd, FCA, EA Managing Principal
__________________________
William J. Reid, FCA, EA Principal
Board of TrusteesSeptember 4, 2012page 4

Actuarial Section | 63
Actuarial Assumptions
Interest
7.5% per annum, compounded annually.
Mortality
Active Lives and Service Retirements
General Employees: RP–2000 Mor-tality Table with 2-year set-forward for males
Police and Fire Employees: RP– 2000 Mortality Table
Disabled Lives
General Employees: PBGC dis-abled life table for retirees receiving Social Security
Police and Fire Employees: PBGC disabled life table for retirees not receiving Social Security
Turnover
General Employees: An attained age table with the following typical rates:
Age Rate
25 .238335 .148445 .082055 .031360 .0195
Police and Fire Employees: An attained age table with the following typical rates:
Age Rate
25 .070935 .038745 .008555 .001360 .0000
Retirement
General Employees: A select and ultimate table with the following typical rates; 25% for the first year in which the employee is eligible for unreduced immediate retirement benefits, and:
Age Rate
55-57 .05058-59 .090
60 .04561 .15062 .25063 .15064 .25065 .400
66-70 .30071-74 .500
75 1.000
Actuarial Assumptions and Methods
Actuarial Cost Method
The actuarial cost method used to determine the actuarial liability and the normal cost is the Projected Unit Credit (PUC) Method. The accrued liability and the normal cost are used to determine the City of Richmond’s contri-bution requirement. Under this method, a PUC accrued benefit is determined for each active member in the RRS on the basis of the member’s average final compensation projected to the assumed date of retirement and the member’s creditable service at the valuation date.
The actuarial liability for retirement benefits is the sum of the actuarial present value of the PUC accrued ben-efit for each active member. The normal cost for retire-ment benefits is the sum of the actuarial present value
of the expected increase in the PUC accrued benefit during the system year for each active member under the assumed retirement age.
The actuarial liability and normal cost for termination benefits, disability benefits, and pre-retirement spouse’s death benefits are determined in a similar manner by projecting the member’s average final compensation to each assumed date of termination, disablement, or death. The actuarial liability for inactive members is determined as the actuarial present value of the benefits expected to be paid; no normal cost is determined for these members.
The investment return assumption of 7.5% was adopted July 1, 2011. The following actuarial assumptions and methods were adopted July 1, 2009.

64 | RRS Comprehensive Financial Report FY 2012
Police and Fire Employees: A select and ultimate table with the following typical rates; 40% for the first year in which the employee is eligible for unreduced immediate retirement benefits, and:
Age Rate
50 .15051-54 .20055-56 .25057-58 .15059-63 .500
64 1.000
Disability
General Employees: An attained age table with the following typical rates:
Age Rate
25 .00062335 .00062345 .00167055 .00489860 .007000
Police and Fire Employees: An attained age table with the following typical rates:
Age Rate
25 .00034435 .00034445 .00123155 .005414
Duty Disability
General Employees: An attained age table with the following typical rates:
Age Rate
25 .00007335 .00007345 .00026055 .001147
Police and Fire Employees: An attained age table with the following typical rates:
Age Rate
25 .00016335 .00024445 .00087155 .003835
Salary Increases
General Employees: An attained age table with the following typical rates:
Age Rate
25 .06035 .05045 .05055 .04060 .040
Police and Fire Employees: An attained age table with the follow-ing typical rates:
Age Rate
25 .06535 .06545 .05055 .05060 .050
Cost-of-Living Adjustments
None assumed.
Asset Valuation Basis
Five-year spread of the difference between actual investment earnings and assumed investment earnings at 7.5%. The resulting actuarial asset value cannot be less than 90% or greater than 110% of market value.
Virginia War Memorial, Courtesy Visit Richmond Virginia Museum of Fine Arts, © Bilyana Dim, Courtesy Visit Richmond

Actuarial Section | 65
Schedule of Active Members Valuation Data
General Defined Benefit Plan Members (Dollars in Thousands)
Valuation Date Members Annual Payroll Average SalaryPercent Increase
(Decrease)
6/30/2012 1,375 $70,773 $51 1.6
6/30/2011 1,510 76,521 51 1.1
6/30/2010 1,644 82,411 50 1.0
6/30/2009 1,778 88,214 50 3.7
6/30/2008 1,886 90,250 48 4.7
6/30/2007 2,071 94,688 46 5.3
6/30/2006 2,570 111,637 43 3.6
6/30/2005 2,651 111,178 42 2.1
6/30/2004 2,704 111,086 41 3.0
Police and Fire Defined Benefit Plan Members (Dollars in Thousands)
Valuation Date Members Annual Payroll Average SalaryPercent Increase
(Decrease)
6/30/2012 985 $54,287 $55 0.0
6/30/2011 988 54,450 55 (2.7)
6/30/2010 972 55,062 57 (1.4)
6/30/2009 1,004 57,654 57 4.4
6/30/2008 992 54,583 55 1.9
6/30/2007 985 53,210 54 0.2
6/30/2006 956 51,556 54 7.7
6/30/2005 956 47,871 50 1.6
6/30/2004 950 46,804 49 0.0
Defined Contribution 401(a) Plan Members (Dollars in Thousands)
Valuation Date Members Annual Payroll Average SalaryPercent Increase
(Decrease)
6/30/2012 1,735 $81,603 $47 (1.2)
6/30/2011 1,656 78,861 48 1.2
6/30/2010 1,632 76,819 47 1.4
6/30/2009 1,614 74,938 46 3.1
6/30/2008 1,402 63,161 45 4.2
6/30/2007 1,059 45,801 43 0.6
6/30/2006 494 21,248 43 3.8
6/30/2005 470 19,469 41 0.2
6/30/2004 361 21,248 43 N/A*
*The Defined Contribution 401(a) plan was initiated in fiscal year 2004.

66 | RRS Comprehensive Financial Report FY 2012
Schedule of Beneficiaries Added to and Removed from Rolls
(Dollars in Thousands) Retirees as a Percent of Active Members
Ended Added
Annual Allowances
Added Removed
Annual Allowances
Removed TotalAnnual
Allowances%
Change
Average Annual
Allowances Number Pay
6/30/12 206 $2,885 153 $1,630 4,131 $64,341 2.0% $16 175.0% 51.4%
6/30/11 217 $4,038 136 $1,462 4,078 $63,086 4.3% $15 163.3% 48.2%
6/30/10 205 $3,580 171 $1,581 3,997 $60,511 3.4% $15 152.8% 44.0%
6/30/09 159 $1,703 117 $1,123 3,963 $58,512 1.0% $15 142.5% 40.1%
6/30/08 239 $3,628 159 $1,525 3,921 $57,932 3.8% $15 136.2% 40.0%
6/30/07 186 $3,539 120 $1,120 3,841 $55,830 4.5% $15 125.7% 37.7%
6/30/06 235 $3,318 180 $1,431 3,775 $53,411 3.7% $14 107.1% 32.7%
6/30/05 248 $3,709 160 $1,469 3,720 $51,524 4.5% $14 103.1% 32.4%
6/30/04 289 $6,231 112 $937 3,632 $49,283 12.0% $14 99.4% 31.2%
6/30/03 193 $2,806 123 $1,027 3,455 $43,989 4.2% $13 84.6% 25.5%
6/30/02 198 $4,765 146 $932 3,385 $42,210 10.0% $12 82.2% 25.3%
6/30/01 218 $3,425 139 $991 3,333 $38,377 6.8% $12 81.1% 24.3%
6/30/00 197 $3,421 122 $791 3,254 $35,942 7.9% $11 77.4% 23.3%
6/30/99 167 $2,659 122 $788 3,179 $33,313 6.0% $10 76.2% 23.4%
6/30/98 218 N/A 145 N/A 3,134 $31,441 12.4% $10 73.3% 22.4%
6/30/97 138 N/A 100 N/A 3,061 $27,966 5.2% $9 71.3% 20.6%
6/30/96 144 N/A 122 N/A 3,023 $26,580 7.6% $9 71.0% 20.6%
6/30/95 140 N/A 118 N/A 3,001 $24,713 1.8% $8 67.3% 18.7%
The RRS’s funding objective is to meet long-term ben-efit obligations through contributions that remain approximately level for general employees and approx-imately level as percentage of pay for public safety employees. If the contributions to the RRS are level in concept and soundly executed, the RRS will pay all promised benefits when due, thus providing the ulti-mate test of financial soundness. Testing for level con-tribution rates is the long-term test.
A short condition test is one means of checking a plan’s progress under its funding program. In a short condition test, the RRS’s present assets (cash and investments) are compared with: (1) the liabilities for future benefits to
present retired lives, and; (2) the liabilities for service already rendered by active members. In a plan that has been following the discipline of level percent of payroll financing, the liabilities for future benefits to present retired members (Liability B) will be fully covered by present assets, except in rare circumstances. In addi-tion, the liabilities for service already rendered by active members (Liabilities A and C) will be at least partially covered by the remainder of present assets.
The relationship between accrued liabilities and net assets of the RRS for the fiscal years ended June 30, 1998 through June 30, 2012 are presented as follows on the next page:

Actuarial Section | 67
Solvency Test
(Dollars in Thousands)
Aggregate Actuarial Liability Portion of Accrued Liabilities Covered by
Assets (%)(A) (B) (C) (D) (E)
Valuation Date
Active Contributions
Retirees & Terminated
Vested Beneficiaries
Vested Active DB Plan
Members
Non-Vested Active DB Plan
Members Total
Actuarial Value of Assets* (A)+(B)+(C) (D)
6/30/12 $11,192 $565,994 $231,024 $38,231 $846,442 $476,123 58.9% 0.0%
6/30/11 (a) $10,395 $548,220 $243,768 $38,978 $841,362 $493,375 61.5% 0.0%
6/30/10 $9,322 $508,047 $231,012 $39,550 $787,931 $459,436 61.4% 0.0%
6/30/09 (b) $7,624 $490,004 $242,614 $39,583 $779,825 $424,532 57.4% 0.0%
6/30/08 (c) $5,621 $490,402 $229,227 $40,167 $765,417 $544,772 75.1% 0.0%
6/30/07 (d) $3,698 $471,134 $222,147 $43,487 $740,465 $526,201 75.5% 0.0%
6/30/06 (e) $3,253 $440,704 $227,406 $44,668 $716,031 $497,450 74.1% 0.0%
6/30/05 (f ) $2,095 $425,836 $224,769 $44,003 $696,703 $419,185 64.2% 0.0%
6/30/04 (g) $739 $403,803 $227,355 $46,225 $678,123 $429,317 67.9% 0.0%
6/30/03 (h) N/A $349,576 $241,015 $44,045 $634,636 $439,599 74.4% 0.0%
6/30/02 (i) N/A $329,765 $235,597 $43,317 $608,679 $413,929 73.2% 0.0%
6/30/01 (j) N/A $303,280 $217,729 $39,282 $560,292 $481,408 92.4% 0.0%
6/30/00 (k) N/A $268,128 $221,410 $39,966 $529,504 $586,296 100.0% 100.0%
6/30/99 (l) N/A $251,171 $194,222 $39,935 $485,328 $516,782 100.0% 100.0%
6/30/98 (m) N/A $245,189 $212,580 N/A $457,769 $458,857 100.0% 100.0%
a) Includes $38,327,753 attributable to changes in actuarial assumptions. Prior to this change, the portion of vested liabilities covered by assets was 64.4%.
b) Includes ($8,533,088) attributable to changes in actuarial assumptions. Prior to this change, the portion of vested liabilities covered by assets was 56.6%.
c) Includes $6,170,310 attributable to changes in benefit provisions (COLA in current year). Prior to this change, the portion of vested liabilities covered by assets was 75.8%.
d) Includes $3,157,901 attributable to changes in benefit provisions (COLA in current year). Prior to this change, the portion of vested liabilities covered by assets was 75.8%.
e) Includes $49,745,021 increase in actuarial value of assets as a result of restarting the actuarial smoothing method. Prior to this change, the portion of vested liabilities covered by assets was 66.7%.
f ) Includes $0 attributable to changes in benefit provisions (COLA in current year and benefit enhancements and assumptions).
g) Includes $29,155,694 attributable to changes in benefit provisions (COLA in current year and benefit enhancements and assumptions. Prior to these changes, the portion of these liabilities covered by assets was 21.7%).
h) Includes $11,551,454 attributable to changes in benefit provisions (COLA in current year and benefit enhancements and assumptions. Prior to these changes, the portion of these liabilities covered by assets was 39.4%).
i) Includes $9,055,310 attributable to changes in benefit provisions (COLA in current year and benefit enhancements and assumptions. Prior to these changes, the portion of these liabilities covered by assets was 37.4%).
j) Includes $5,477,641 attributable to changes in benefit provisions (COLA in current year and benefit enhancements and assumptions. Prior to these changes, the portion of these liabilities covered by assets was 73.1%).
k) Includes $6,366,113 attributable to changes in benefit provisions (COLA in current year and benefit enhancements and assumptions. Prior to these changes, the portion of these liabilities covered by assets was 122.9%).
l) Includes $5,461,284 attributable to changes in benefit provisions (COLA in current year and benefit enhancements and assumptions. Prior to these changes, the portion of these liabilities covered by assets was 114.0%).
m) Includes $12,790,318 attributable to changes in benefit provisions (COLA in current year and benefit enhancements and assumptions. Prior to these changes, the portion of these liabilities covered by assets was 106.2%).
*Market value used for years prior to 2003. Actuarial value used in 2003 and later to be consistent with Schedule of Funding Progress

68 | RRS Comprehensive Financial Report FY 2012
Solvency Test
Accumulated Plan Benefits (Dollars in Thousands)
For Retirees and Dependents 2012 2011 2010 2009 2008 2007
Reserves $534,822 $518,118 $481,577 $464,429 $465,317 $446,322
Net Assets Available 476,123 493,375 459,436 424,532 465,317 446,322
Unfunded Reserves 58,699 24,743 22,141 39,898 – –
For Active and Terminated Vested Employees
Reserves $257,732 $269,828 $251,244 $255,796 $238,127 $232,326
Net Assets Available – – – – 79,455 79,880
Unfunded Reserves 257,732 269,828 251,244 255,796 158,672 152,446
Excess Assets Available – – – – – –
Total
Reserves $792,553 $787,946 $732,821 $720,225 $703,444 $678,648
Net Assets Available 476,123 493,375 459,436 424,532 544,772 526,201
Unfunded Reserves 316,431 294,571 273,385 295,693 158,672 152,446
Excess Assets Available – – – – – –
% Funded (Solvency Test) 60.1% 62.6% 62.7% 58.9% 77.4% 77.5%
Credited Projected Benefits
For Projected Future Salary Increases $53,889 $53,416 $55,111 $59,600 $61,974 $61,818
Net Assets Available – – – – – –
Unfunded Reserves 53,889 53,416 55,111 59,600 61,974 61,818
Excess Assets Available – – – – – –
Total
Reserves $846,442 $841,362 $787,931 $779,825 $765,418 $740,465
Net Assets Available 476,123 493,375 459,436 424,532 544,772 526,201
Unfunded Reserves 370,319 347,987 328,496 355,293 220,646 214,264
Excess Assets Available – – – –
% Funded (Solvency Test) 56.2% 58.6% 58.3% 54.4% 71.2% 71.1%

Actuarial Section | 69
Analysis of Financial Experience
Reasons for Change in the Unfunded Actuarial Liability
The unfunded actuarial liability was $370,319,231 as of June 30, 2012. The increase from the prior year was primarily due to the actual investment return on the actuarial value of assets being less than expected.
Reasons for Change in Funded Status
The funded status decreased from 58.6% as of June 30, 2011 to 56.2% as of June 30, 2012. The decrease is pri-marily due to investment return on the actuarial value of assets, which was less than assumed.
Reasons for Change in Contribution Rates
The overall employer contribution rate, as of the begin-ning of the year, decreased from 28.85% for the fiscal year ending June 30, 2011 to 28.53% for the fiscal year ending June 30, 2012. The decrease of 0.32% is due to the following reasons:
Decrease due to investment gain on actuarial value of assets: (1.83%)
Decrease due to changes in assumptions: 0.00%
Increase due to changes in benefit provisions: 0.00%
Increase due to other experience factors: 1.51%
Total: (0.32%)
Civil Rights Memorial, Courtesy of the Virginia Tourism Corporation
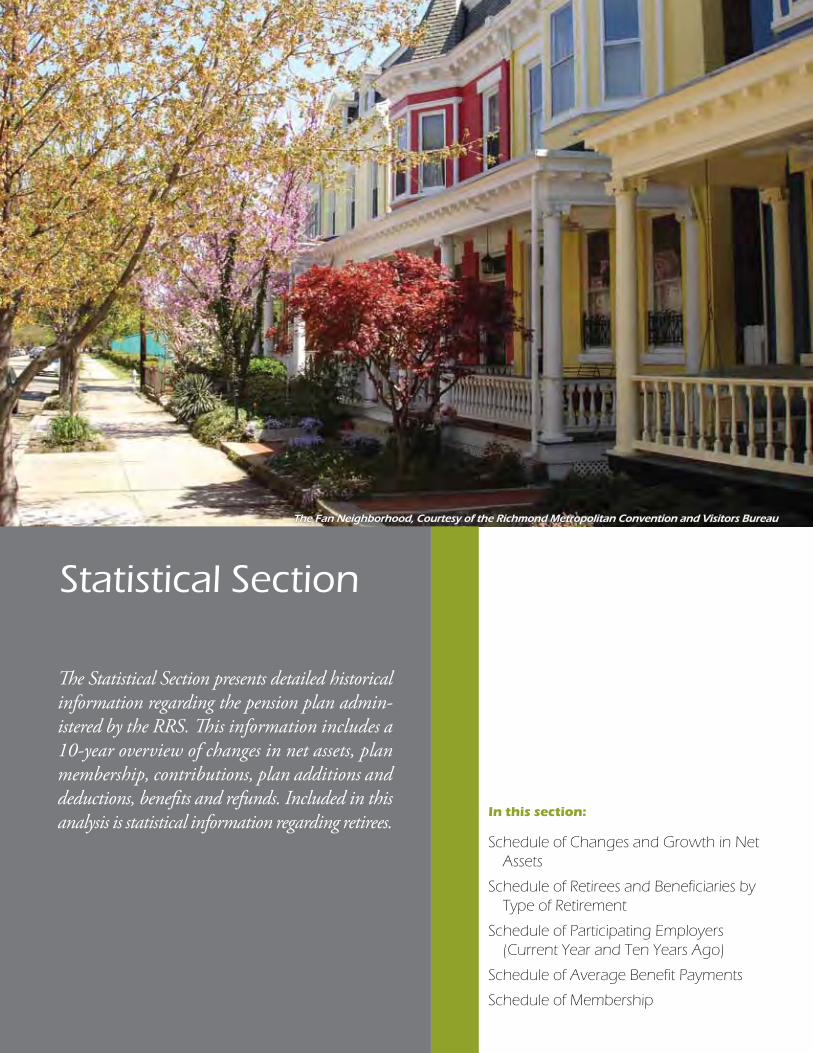
In this section:
Schedule of Changes and Growth in Net Assets
Schedule of Retirees and Beneficiaries by Type of Retirement
Schedule of Participating Employers (Current Year and Ten Years Ago)
Schedule of Average Benefit Payments
Schedule of Membership
The Fan Neighborhood, Courtesy of the Richmond Metropolitan Convention and Visitors Bureau
Statistical Section
The Statistical Section presents detailed historical information regarding the pension plan admin-istered by the RRS. This information includes a 10-year overview of changes in net assets, plan membership, contributions, plan additions and deductions, benefits and refunds. Included in this analysis is statistical information regarding retirees.

Statistical Section | 71
Schedule of Changes and Growth in Net Assets
Pension Trust Fund (Dollars in Thousands)
For the year ended June 30
2012 2011 2010 2009 2008 2007 2006 2005 2004 2003
Net Assets Available — Beginning of Year $489,987 $417,669 $386,358 $511,657 $559,529 $497,054 $465,795 $440,934 $399,635 $413,929
Additions
Employer Contributions 38,884 39,718 32,079 33,192 31,936 30,889 30,712 23,387 21,449 18,573
Member Contributions 2,217 2,421 2,486 2,579 2,800 2,545 1,158 1,314 $729 120
Investment Income (Loss) 1,896 93,770 59,128 (97,507) (27,346) 82,273 49,635 48,524 65,062 10,859
DC Contribution Revenue 31 52 51 49 90 – – – – –
Total Additions 43,028 135,961 93,744 (61,686) 7,479 115,707 81,505 73,224 87,239 29,552
Deductions
Benefit Payments 70,037 62,392 61,222 62,835 54,134 51,584 49,188 47,395 44,981 43,079
Refunds 49 81 118 102 54 535 – – – –
Administrative Expenses 1,166 1,169 1,094 1,095 1,162 1,114 1,058 969 960 767
Total Deductions 71,253 63,643 62,434 64,033 55,351 53,233 50,246 48,363 45,941 43,845
Change in Net Assets (28,225) 72,318 31,310 (125,719) (47,872) 62,474 31,259 24,861 41,298 (14,293)
Net Assets Available — End of Year $461,761 $489,987 $417,669 $386,359 $511,657 $559,529 $497,054 $465,795 $440,934 $399,635

72 | RRS Comprehensive Financial Report FY 2012
Schedule of Retirees and Beneficiaries
Type of Retirement1 Option Selected2
Amount of Monthly Benefit
Number of Retirees A B C D E F G Life 1 2 3 4 5
$1-$100 328 0 29 281 14 3 1 0 290 11 0 5 0 22
$101-$200 358 9 70 259 12 1 3 4 305 17 2 0 0 34
$201-$300 250 14 80 136 6 1 9 4 203 10 0 4 2 31
$301-$400 216 11 93 75 16 0 13 8 147 14 0 3 1 51
$401-$500 188 20 80 50 10 2 22 4 142 9 0 0 0 37
$501-$600 193 14 82 58 10 6 16 7 142 4 1 2 1 43
$601-$700 160 14 83 40 7 1 13 2 115 3 0 3 1 38
$701-$800 125 14 67 20 9 3 10 2 78 2 1 2 1 41
$801-$900 136 16 79 10 9 8 12 2 79 2 1 1 3 50
$901-$1000 126 19 66 14 4 9 13 1 77 3 0 3 5 38
Over $1000 2,051 266 1,508 27 42 113 93 2 1,286 101 35 96 82 451
Total 4,131 397 2,237 970 139 147 205 36 2,864 176 40 119 96 836
1Types of RetirementA Normal Retirement — A general employee age 65 or a sworn
public safety officer age 60 or older.B Early Service — A general employee at least age 55, with five
years of creditable service, or a sworn public safety officer at least age 50, with five years of creditable service.
C Deferred Service — A former vested general employee age 65 or older or a former vested sworn public safety officer age 60 or older.
Deferred Early Service — A former vested general employee at least age 55 but less than age 65 or a sworn public safety officers at least age 50 but less than age 60.
D Beneficiary (normal, early, deferred retirement) — Surviving beneficiary of a deceased retiree who is receiving a retirement allowance payable monthly for life.
E Compensable Disability — An employee who retires from active service due to a job-related disability.
F Ordinary Disability — A vested employee who retires from active service due to a non-job-related disability.
G Beneficiary (disability) — Beneficiary of a deceased disability retiree who is receiving a retirement allowance payable monthly for life.
2Option SelectedLIFE — Basic BenefitOption 1 — 100% Joint and Survivor BenefitOption 2 — 75% Joint and Survivor BenefitOption 3 — 50% Joint and Survivor BenefitOption 4 — 25% Joint and Survivor BenefitOption 5 — Social Security (Smooth-Out)
June 30, 2012
$0
$20000
$40000
$60000
$80000
2012201120102009200820072006200520042003
$43,079
$70,037
$44,981 $47,395 $49,188 $51,584 $54,134
$62,835 $61,222 $62,392
0
1000
2000
3000
4000
5000
2012201120102009200820072006200520042003
3,455
4,1313,632 3,720 3,775 3,841 3,921 3,963 3,997 4,078
0
1000
2000
3000
4000
5000
2012201120102009200820072006200520042003
4,084
2,360
3,654 3,607 3,5263,056 2,878 2,782 2,616 2,498
Number of Active Defined Benefit Plan Members
Retirement Benefit Expenses (Dollars in Thousands)
Number of Retirees and Beneficiaries

Statistical Section | 73
Schedule of Participating Employers Current Year and Ten Years Ago
2012 2002
Participating EmployersCovered
Employees RankPercentage of Total System
Covered Employees Rank
Percentage of Total System
City of Richmond 2,302 1 97.54% 3,870 1 94.02%
Richmond Behavioral Health Authority 58 2 2.46% 246 2 5.98%
Total 2,360 100.00% 4,116 100.00%
Benefit Payment Options:
Basic Benefit
This form of payment provides a monthly benefit for life. However, when member dies, all benefits stop. There are no monthly payments to a beneficiary after death.
Social Security (Smooth-Out) Option
This form of payment provides an increased monthly benefit prior to age 65. When a member reaches age 65, retirement benefits will be reduced by the projected amount of their primary Social Security benefit. The purpose of this option is to provide for a more level total retirement income before and after age 65, taking into account the federal Social Security benefits. There are no monthly payments to a beneficiary after the mem-ber’s death.
Joint and Survivor Benefit Option
This form of payment provides a reduced benefit during a member’s lifetime. Upon the member’s death, the same amount or a designated fraction (25%, 50%, 75% or 100%) will continue to be paid to a designated benefi-ciary, if living. The benefit remains reduced if the des-ignated beneficiary precedes the member in death.
Retirement Types
Benefit Payment Options
4% Beneficiaries9% Disability
54% Early Service
70% Basic Benefit
10% Normal for Age and/or Service
23% Deferred
20% Social Security (Smooth-Out)
10% Joint and Survivor Benefit

74 | RRS Comprehensive Financial Report FY 2012
Schedule of Average Benefit Payments
Retirements Effective July 1, 2002 to June 30, 2012
Years of Creditable Service
0-5 5-10 10-15 15-20 20-25 25-30 30+
FY 2012
Average monthly benefit $322 $299 $457 $677 $2,032 $2,792 $2,722 Average final salary $40,323 $33,962 $33,936 $31,863 $52,933 $60,187 $50,971 Number of retired members 1 32 25 18 15 31 68
FY 2011
Average monthly benefit $26 $285 $562 $1,041 $1,884 $3,026 $2,814Average final salary $30,691 $29,926 $29,721 $51,322 $55,280 $64,226 $52,330Number of retired members 1 43 22 23 28 34 62
FY 2010
Average monthly benefit $105 $204 $472 $709 $2,007 $3,122 $2,766Average final salary $28,580 $25,991 $35,365 $33,647 $55,308 $64,977 $51,989Number of retired members 1 33 18 16 27 37 48
FY 2009
Average monthly benefit $0 $177 $538 $812 $1,307 $2,674 $2,396Average final salary $0 $22,323 $34,916 $37,829 $42,471 $60,212 $46,044Number of retired members 0 41 21 17 16 20 36
FY 2008
Average monthly benefit $102 $229 $593 $695 $1,653 $2,088 $2,500Average final salary $19,692 $21,941 $40,280 $34,364 $48,623 $45,546 $48,974Number of retired members 1 51 16 25 29 27 50
FY 2007
Average monthly benefit $0 $ 325 $564 $639 $854 $2,137 $2,579Average final salary $0 $35,270 $29,671 $35,828 $53,399 $47,612 $48,148Number of retired members 0 32 20 16 37 30 54
FY 2006
Average monthly benefit $151 $174 $634 $520 $1,320 $2,145 $2,458Average final salary $33,120 $20,592 $32,286 $28,257 $41,150 $46,932 $45,775Number of retired members 2 53 26 19 21 40 52
FY 2005
Average monthly benefit $0 $236 $ 384 $777 $1,235 $2,189 $2,459Average final salary $0 $23,867 $25,595 $42,767 $39,350 $48,364 $47,119Number of retired members 0 38 26 13 26 61 83
FY 2004
Average monthly benefit $0 $161 $294 $622 $1,014 $2,110 $2,703Average final salary $0 $18,300 $21,327 $33,155 $34,500 $46,127 $48,692Number of retired members 0 33 24 16 24 65 116
FY 2003
Average monthly benefit $0 $138 $276 $618 $891 $1,974 $2,223Average final salary $0 $19,809 $27,376 $29,631 $36,672 $43,203 $42,525Number of retired members 0 29 19 17 20 32 59

Statistical Section | 75
Schedule of Membership
Active Defined Benefit Plan Members — By Departments and Agencies
Assessor of Real Estate 10 City Auditor 2 City Clerk 4 City Council 5 Department of Budget & Strategic Planning 6 Department of Community Development 49 Department of Economic Development 14 Department of Finance 45 Department of Fire & Emergency Services 366
General Employees 8 Firefighters 358
Department of General Services 3 Department of Health 3 Department of Human Resources 8 Department of Information Technology 37 Department of Parks, Recreations & Community Facilities 126 Department of Procurement Services 2 Department of Public Utilities 328 Department of Public Works 240 Department of Real Estate – Department of Social Services 189 Juvenile Justice Services 60 Law Department 15 Minority Business Enterprise 1 Office of the Chief Administrative Officer 4 Office of the Mayor 3 Port of Richmond – Public Library 37 Richmond Behavioral Health Authority 58 Richmond Police Department 730
General Employees 103 Police Officers 627
Richmond Public Schools 10 Richmond Retirement System 2 Youth Services 3 Total 2,360 Terminated Vested Defined Benefit Plan Members General Employees 1,571 Police & Fire Employees 191 City Council Members 1 Total 1,763 Active Defined Contribution 401(a) Plan MembersGeneral Employees 1,666 Police & Fire Employees 69 Total 1,735 Retired MembersGeneral Employees 2,934 Police & Fire Employees 1,193 City Council Members 4 Total 4,131 Total Membership 9,989
June 30, 2012

900 E. Broad Street , Room 400R i c h m o n d , V i r g i n i a 2 3 2 1 9Ph: 804.646.5958 | F: 804.646.5299www.richmondgov.com/retirement
Related Documents


