For the years ended December 31, 2016 & 2015 TEXAS COUNTY & DISTRICT RETIREMENT SYSTEM COMPREHENSIVE ANNUAL FINANCIAL REPORT

Welcome message from author
This document is posted to help you gain knowledge. Please leave a comment to let me know what you think about it! Share it to your friends and learn new things together.
Transcript

For the years ended December 31, 2016 & 2015
TEXAS COUNTY & DISTRICT RETIREMENT SYSTEM
COMPREHENSIVE ANNUALFINANCIAL REPORT

Strength in Numbers: TCDRS celebrates 50 years
For 50 years, Texas has meant one thing for all of us at TCDRS and for the generations of Texans we have served — home.
In 1967, counties and districts across Texas needed a secure retirement system that met their unique needs. By coming together, they found strength in numbers. Together they would have better access to investment opportunities, more efficient plan administration and the ability to provide a meaningful retirement benefit.
We can see the wisdom of that decision in the numbers. Over the last five decades, TCDRS has built a strong financial foundation to achieve important milestones:• Among the top 20% of best-funded public retirement plans• $26 billion in assets• More than $1 billion in benefits paid annually
We’re honored to have served so many that serve Texas. At TCDRS, we take pride in providing county and district employees confidence in their future. And we’re determined to keep delivering on that promise for generations of Texans to come.
Join us as we celebrate our 50th anniversary at
www.TCDRS.org/50

For the years ended December 31, 2016 & 2015
TEXAS COUNTY & DISTRICT RETIREMENT SYSTEM
COMPREHENSIVE ANNUALFINANCIAL REPORT
901 MOPAC EXPY. SOUTH • BARTON OAKS PLAZA IV, SUITE 500 • AUSTIN, TEXAS 78746Prepared by the Actuarial Services, Communications, Finance and Investment Divisions
300,000
250,000
200,000
150,000
100,000
50,000
0 2012 2013 2014 2015 2016
MEMBERSHIP
ANNUITANTSMEMBERS
More than $150 million
$10 million to $60 million
$5 million to $10 million
$1 million to $5 million
$500,000 to $1 million
$100,000 to $500,000
Less than $100,000
TCDRS: AT A GLANCE
We serve a membership of more than 282,000, including nearly 60,000 retirees and beneficiaries.
S E R V I N G O U R M E M B E R S H I P
B E N E F I T I N G T E X A S
TCDRS retirees continue to live in Texas, returning value to their local communities.
In 2016, TCDRS paid $1.2 billion in benefits with over 96% staying in Texas.
Average Age Average Years Average at Retirement of Service Annual Benefit
61 18 $21,804
RETIREE PROFILE (as of Jan. 1, 2017)
BENEFITS PAID
Since 1967, the system has grown to include 738 counties and districts.
2
800
700
600
500
0 2012 2013 2014 2015 2016
PARTICIPATING EMPLOYERS
738
1,400 1,200 1,000 800 600 400 200 0 2012 2013 2014 2015 2016
BENEFITS PAID AND WITHDRAWALS
BENEFITS PAID WITHDRAWALS
$ M
ILLI
ON
S
$1,242
1967TCDRS CREATED
1982ADDS OPTIONAL GROUP TERM LIFE
1997DIVERSIFIES INVESTMENT PORTFOLIO
1998OPENS CALL CENTER
2000LAUNCHES FIRST WEBSITE
5 0 Y E A R S O F S E R V I N G T E X A N S

I N V E S T I N G F O R T H E L O N G T E R M
Fiduciary net position totaled $26.3 billion. Broad diversity in our investment portfolio
reduces possible overall losses due to negative experience in any single asset class or investment.
F U N D I N G P L A N S R E S P O N S I B L Y
Investment earnings fund nearly 80¢ of every dollar of benefits. Employers must pay 100% of their required contributions every year. Each plan is funded independently by a county or district and its employees. Our conservative funding methods ensure any debt is paid down to zero within 20 years. This means money is there when needed and debt is not pushed to future generations.
BENEFIT FUNDING
13¢EMPLOYER
CONTRIBUTIONS
10¢EMPLOYEE DEPOSITS
77¢INVESTMENT
EARNINGS
All figures as of Dec. 31, 2016, except where noted.
Our investments have achieved our target return of 8% over the long term.
3
(Estimated)
ASSET ALLOCATION TARGETS
30
25
20
15
10
5
0 2012 2013 2014 2015 2016
FIDUCIARY NET POSITION
$ BI
LLIO
NS
$26.3Annualized 2016 5 10 20 30Returns Return Year Year Year Year
Total Fund 7.5% 8.4% 4.9% 7.1% 8.0%
TOTAL FUND RETURN—NET OF ALL FEES
14.0%
12.0
10.0
8.0
6.0
4.0
2.0
0 2012 2013 2014 2015 2016
AVERAGE REQUIRED EMPLOYER CONTRIBUTION RATES
11.2%
100%
80
60
40
20
0 2012 2013 2014 2015 2016
FUNDED RATIO
88.4%
HIGH-YIELDINVESTMENTS
13%EQUITIES HEDGE FUNDS PRIVATE EQUITY REAL ASSETS INVESTMENT-
GRADE BONDS
3%11%14%25%34%
2002CREATES EMPLOYER SERVICES TEAM
2009DEBUTS ONLINE ESTIMATES
2011GOES SOCIAL ON FACEBOOK
2014INVENTS PLAN CUSTOMIZER
2016SIGNS UP 37 EMPLOYERS (MOST SINCE FIRST YEAR)
5 0 Y E A R S O F S E R V I N G T E X A N S

Texas County & District Retirement System4
TABLE OF CONTENTS
INTRODUCTORY SECTION (Unaudited)
Certificate of Achievement for Excellence in Financial Reporting and Public Pension Standards Award . . . . . . . . . . . . . . . . . . . . . . . . . . . . . . . 6Letter of Transmittal . . . . . . . . . . . . . . . . . . . . . . . . . . . . 7Organization Chart . . . . . . . . . . . . . . . . . . . . . . . . . . . . 10Board of Trustees . . . . . . . . . . . . . . . . . . . . . . . . . . . . . . 11Executive Staff and Professional Advisors . . . . . . . . . . . 12Participating Counties and Districts as of Dec . 31, 2016 . . . . . . . . . . . . . . . . . . . . . . . . . . . . . 13
FINANCIAL SECTIONIndependent Auditors’ Report . . . . . . . . . . . . . . . . . . . . 20Management’s Discussion and Analysis . . . . . . . . . . . . 22
Basic Financial Statements Statements of Fiduciary Net Position . . . . . . . . . . . . 26 Statements of Changes in Fiduciary Net Position . . . 27 Notes to the Financial Statements . . . . . . . . . . . . . . . 28
Required Supplementary Information Notes to the Required Supplementary Information . . . . . . . . . . . . . . . . . . . . 47
Other Supplementary Information Changes in Fiduciary Net Position by Fund and Interfund Transfers . . . . . . . . . . . . . . . . . . . . . . . 48 Changes in Endowment Fund . . . . . . . . . . . . . . . . . . 50 Changes in Income Fund . . . . . . . . . . . . . . . . . . . . . . 51 Administrative Revenues and Expenses . . . . . . . . . . . 52 Investment Expenses . . . . . . . . . . . . . . . . . . . . . . . . . 53 Professional/Consultant Fees and Services . . . . . . . . 54
INVESTMENT SECTION (Unaudited)
Investment Consultant’s Report . . . . . . . . . . . . . . . . . . 56The TCDRS Act and Investment Policy . . . . . . . . . . . . 57Investment Philosophy and Strategy . . . . . . . . . . . . . . . 57Asset Allocation . . . . . . . . . . . . . . . . . . . . . . . . . . . . . . 57Asset Classes, Investment Styles and Investment Managers . . . . . . . . . . . . . . . . . . . . . . . 58Investment Results . . . . . . . . . . . . . . . . . . . . . . . . . . . . 58Lists of Largest Holdings . . . . . . . . . . . . . . . . . . . . . . . 59Results of Securities-Lending Activities . . . . . . . . . . . . 60Fees and Commissions . . . . . . . . . . . . . . . . . . . . . . . . . 60Asset Growth of the System . . . . . . . . . . . . . . . . . . . . . 62Investment Summary . . . . . . . . . . . . . . . . . . . . . . . . . . 62
ACTUARIAL SECTION (Unaudited)
Pension Trust Fund Actuary’s Certification Letter . . . . . . . . . . . . . . . . . . 66 Summary of Actuarial Assumptions and Methods . . . 67 Summary Actuarial Data . . . . . . . . . . . . . . . . . . . . . . 70 Funding Progress . . . . . . . . . . . . . . . . . . . . . . . . . . 71 Employer Contributions . . . . . . . . . . . . . . . . . . . . . 71 Retiree and Beneficiary Data — Accounts . . . . . . . 72 Retiree and Beneficiary Data — Amounts . . . . . . . 72 Solvency Test . . . . . . . . . . . . . . . . . . . . . . . . . . . . . 72 Contribution Rate Information for Participating Employers . . . . . . . . . . . . . . . . . . 73 Participating Employers and Depositing Members . . 73 Analysis of Financial Experience . . . . . . . . . . . . . . 73 Summary of Plan Provisions . . . . . . . . . . . . . . . . . . . 74 Summary Actuarial Valuation Results . . . . . . . . . . . . 76
Group Term Life Fund Actuary’s Certification Letter . . . . . . . . . . . . . . . . . . 77 Summary of Actuarial Assumptions, Methods and Data . . . . . . . . . . . . . . . . 78 GTLF — Retirees Covered . . . . . . . . . . . . . . . . . . 79 GTLF — Retirees Coverage Amounts . . . . . . . . . 79 GTLF Solvency Test . . . . . . . . . . . . . . . . . . . . . . . 80 GTLF Participating Employers and Covered Members . . . . . . . . . . . . . 80
STATISTICAL SECTION (Unaudited)
Introduction . . . . . . . . . . . . . . . . . . . . . . . . . . . . . . . . . 82
Financial Trends Data Changes in Net Position, Last 10 Fiscal Years . . . . . . 83
Demographic and Operating Information Benefit at Retirement for Recent Retirees . . . . . . . . . 85 Average Benefits . . . . . . . . . . . . . . . . . . . . . . . . . . . . 85 Average Benefit Profile by Employer Type . . . . . . . . 85 Annuitants by Type of Benefit . . . . . . . . . . . . . . . . . . 86 Largest Participating Employers — Current Year and Nine Years Ago . . . . . . . . . . . . . 87 GTLF — Average Benefits Paid . . . . . . . . . . . . . . . . 88
Glossary . . . . . . . . . . . . . . . . . . . . . . . . . . . . . . . . . . . . . 89

TCDRS was created in 1967 to give Texas counties and districts a way to provide secure retirement benefits to meet their unique needs. After our first year of operations, we had 106 participating employers. Today, we serve 253 counties and 485 districts.
735+PARTICIPATINGEMPLOYERS
1 Introductory

Texas County & District Retirement System6
The Certificate of Achievement for Excellence in Financial Reporting was presented by the Government Finance Officers Association of the United States and Canada for the fiscal year ended Dec . 31, 2015 . This was the 24th consecutive year that TCDRS has received this prestigious award, which recognizes comprehensive annual financial reports that have achieved the highest standards in government accounting and reporting .
TCDRS was awarded the Public Pension Coordinating Council’s Public Pension Standards award for the 14th consecutive year . This award is in recognition of meeting professional standards for plan funding and administration as set forth in the Public Pension Standards .
2016 Comprehensive Annual Financial Report 7
INTR
OD
UC
TOR
Y
Post Office Box 2034 Tel. 800-823-7782Austin, Texas 78768-2034 512-328-8889
901 MoPac Expy . South Fax 512-328-8887Barton Oaks Plaza IV Suite 500Austin, Texas 78746 www.tcdrs.org
LETTER OF TRANSMITTAL
June 1, 2017
We are pleased to present the Comprehensive Annual Financial Report (CAFR) of the Texas County & District Retirement System (TCDRS) for the year ended Dec . 31, 2016 . This year we are celebrating our 50th anniversary of being a model for responsibly funded retirement benefits . By coming together in 1967, our participating employers found strength in numbers – better access to investment opportunities, more efficient plan administration and a way to provide secure retirement benefits that met their local needs and budgets .
Over the last fifty years, we have grown into a financially strong, multi-billion dollar trust partnering with 738 counties and governmental districts to provide reliable retirement, disability and survivor benefits . These attractive benefits help our employers hire and retain qualified staff . Each employer selects and funds its customized plan of benefits and adjusts benefits annually based on local needs and budgets . Our number of participating employers continues to grow . For the 10-year period ended Dec . 31, 2016, the number of participating employers increased by 31% .
We now serve more than 282,000 Texans, who make our local communities better and safer places to live . This includes nearly 60,000 retirees and beneficiaries . Over the past decade the number of members has risen by 54%, and the number of benefit recipients has grown by 85% .
Our unique savings-based plan design ensures that benefits remain reliable and makes costs more predictable for employers . Members save for their own retirement over the length of their careers . At retirement, benefits are based on a member’s final savings balance and employer matching . In 2016, we paid out in excess of $1 .2 billion in benefits to retirees and former members . Over 96% of these benefits went to Texas addresses . These benefits act as an
economic engine to our local economies . On average, our current retirees began taking a benefit at age 61 after working 18 years . The average annual benefit for current retirees is $21,804 as of Dec . 31, 2016 .
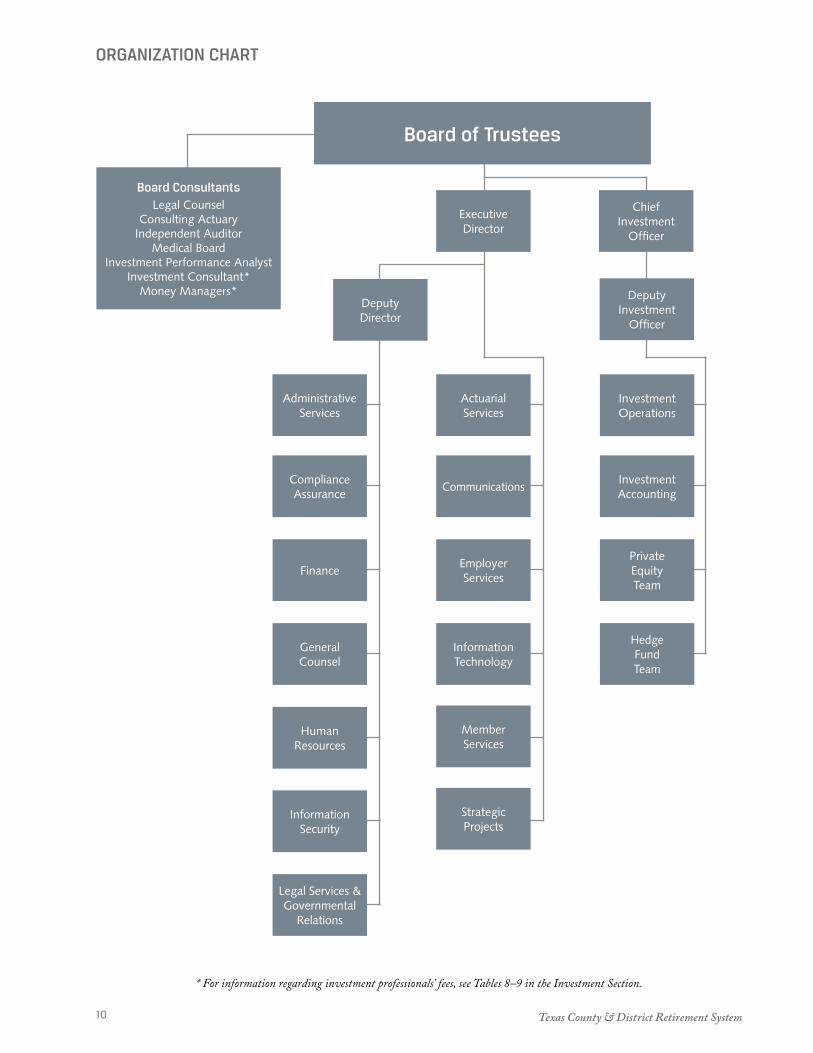
The TCDRS Board of Trustees provides leadership for the system . Our nine-person board is appointed by the governor and confirmed by the Texas Senate . The board appoints an executive director, who is responsible for all day-to-day operations, and a chief investment officer, who oversees investment operations . The board also appoints legal counsel, a consulting actuary, an independent auditor, a medical board and investment consultants .
INVESTMENTS
When it comes to managing investments, we focus on the long term with an investment horizon of 30-plus years . As employers and members save for benefits in advance over the course of an employee’s career, these funds are pooled and invested with the returns compounding over time . As a result, investment earnings fund most of the benefits our members receive .
The TCDRS Board of Trustees constructs the investment portfolio to achieve our long-term investment return goal of 8% with an acceptable amount of risk . In 2016, the TCDRS portfolio returned 7 .5%, net of all fees . The return was slightly under our policy benchmark return of 7 .9% due to defensive positioning of the portfolio; however, we have consistently exceeded our benchmarks over longer periods . Our 30-year return is 8 .0% for the period ended Dec . 31, 2016 .
To ensure that the investment process is protected by appropriate safeguards, the board has adopted, and periodically reviews, an investment policy that defines and restricts investment authority . The policy also emphasizes the importance of a long-term investment philosophy with minimization of risk .

Texas County & District Retirement System8
LETTER OF TRANSMITTAL
MAJOR INITIATIVES
This year we made great strides in ensuring that TCDRS is set up to provide best-in-class services and sound benefits for the next fifty years by:
• Updating the TCDRS Strategic Plan 2017–2020 to prepare for the future . Major initiatives include efforts to protect sensitive information; enable members and employers to connect with TCDRS applications anytime, anywhere; prepare members for retirement; enhance employer decision-making; make administration easier for employers; support employer recruiting and retention; and strengthen organizational responsiveness .
• Implementing updated annuity purchase rates to get retirement costs back in balance with improv-ing longevity . The solution was cost neutral for employers, had minimal impact on employees and no impact on retirees .
• Completing significant work on the final phase of our technology infrastructure upgrade which will set us up to provide enhanced services to members and employers .
FUNDING
TCDRS is one of the nation’s best-funded retirement systems . As of Dec . 31, 2016, TCDRS was 88 .4% funded in aggregate . The actuarial value of assets and actuarial liabilities totaled $26 .95 billion and $30 .47 billion, respectively . The net position for pension benefits at year end 2016 and 2015 was $26 .29 billion and $24 .53 billion, respectively, an increase of $1 .76 billion (7 .2%) .
We do not receive funding from the State of Texas . Each plan is funded by our employers, members and investment earnings . Employers pay 100% of their required contributions every year . Many participating employers make additional contributions over the required amounts in order to provide a buffer against future adverse experience or to prefund benefit enhancements .
In addition, TCDRS has one of the most conservative funding policies in the nation . By paying the required contribution rate, employers are paying for their current employees’ future benefits and are paying down any unfunded liabilities to zero within 20 years . The average amortization period of TCDRS plans is 13 .5 years .
TCDRS maintains a reserve fund to help keep rates stable and to offset future adverse experience . In 2016, the board used $107 million of general reserves to offset the effect of 2016 investment results . A total of $309 million in the general reserves account is available as of Dec . 31, 2016 .
Cash flow from deposits and contributions currently are slightly less than the amounts required to meet annual benefits paid to TCDRS retirees, member account withdrawals and the administrative expenses of the organization in 2016 . The negative net cash flow is expected as the system has matured and the number of members receiving benefits increased . Investment returns and changes in employers’ plans will also affect annual cash flow and the change in net position .
The recent history of net investment income, contributions and deposits, benefit payments and administrative costs is shown in the Statistical Section on page 83 . Information on funding progress for all employers as a group is in the Actuarial Section, Table 6: Funding Progress, on page 71 . In addition, each employer receives a customized Summary Valuation Report, which provides detailed information on their individual annual plan valuation .
MANAGEMENT RESPONSIBILITY FOR FINANCIAL REPORTING
This report fulfills the requirements established by the Texas Government Code for public retirement systems to publish an annual financial report . TCDRS’ management is responsible for the accuracy of the data and the completeness and fairness of the presentation within this report .
The financial statements have been prepared in accordance with the principles of governmental accounting and reporting set forth by the Governmental Accounting Standards Board (GASB) .
A comprehensive framework of internal controls exists to provide reasonable assurance regarding the safekeeping of assets and fair presentation of the financial statements and supporting schedules . Internal controls also provide reasonable, rather than absolute, assurance that the financial statements are free of any material misstatements . The concept of reasonable assurance recognizes that first, the cost
2016 Comprehensive Annual Financial Report 9
INTR
OD
UC
TOR
Y
LETTER OF TRANSMITTAL
of a control should not exceed the benefits likely to be derived, and second, the valuation of the cost and benefits requires estimates and judgments by management .
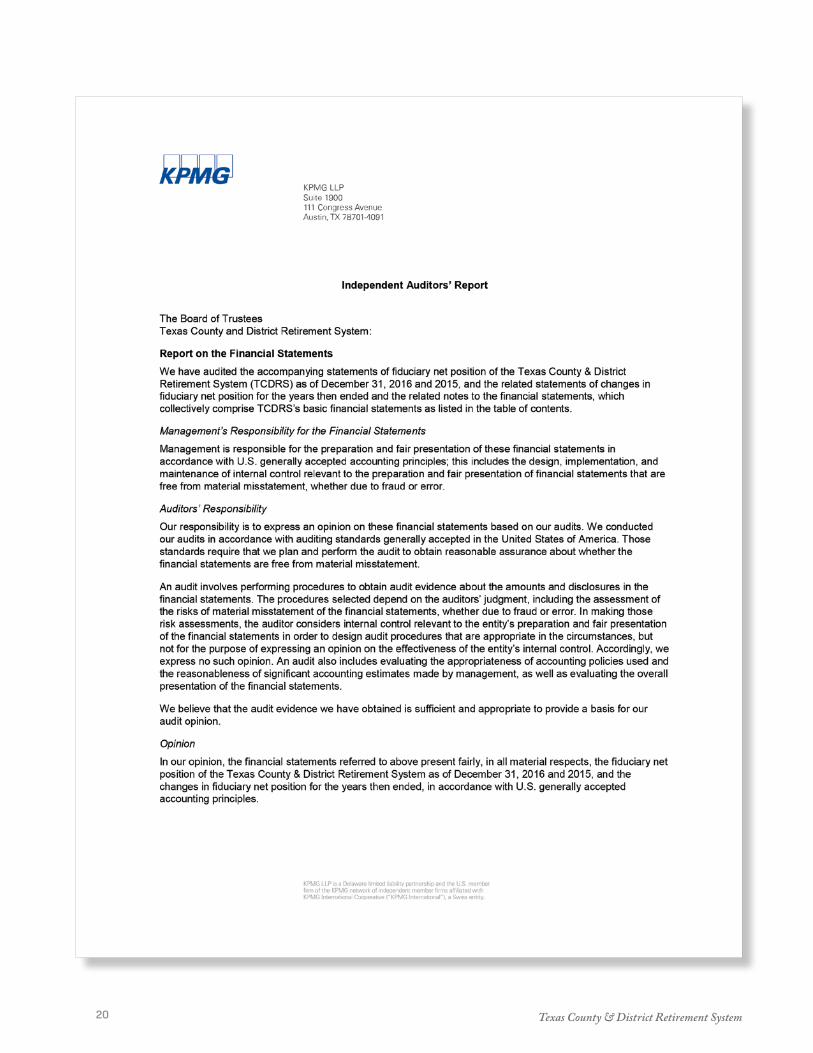
KPMG LLP, Certified Public Accountants, has issued an unmodified (“clean”) opinion on TCDRS’ financial statements for the year ended Dec . 31, 2016 . The independent auditor’s opinion is located at the front of the Financial Section of this report (see page 20) .
Immediately following the independent auditor’s opinion, Management’s Discussion and Analysis (MD&A) provides a narrative introduction, overview and analysis of the basic financial statements . The MD&A complements the Letter of Transmittal and should be read in conjunction with it .
AWARDS AND ACKNOWLEDGMENTS
TCDRS proudly accepted a Certificate of Achievement for Excellence in Financial Reporting from the Government Finance Officers Association of the United States and Canada (GFOA) for the fiscal year ended Dec . 31, 2015 .
This was the 24th consecutive year that the system achieved this prestigious award, which recognizes comprehensive annual financial reports that are readable and efficiently organized, and that satisfy accepted accounting principles and applicable legal requirements .
TCDRS was also awarded the Public Pension Coordinating Council’s (PPCC) Public Pension Standards award for 2016, which is the 14th consecutive year that the system received this award in recognition of meeting professional standards for plan funding and administration .
SUMMARY
TCDRS staff under the direction of the board of trustees worked together to produce this report . Our thanks go out to everyone who has contributed to the preparation of this report and who works to ensure TCDRS’ continued success in the future . At TCDRS we are proud to serve those who serve Texas and look forward to continuing to do retirement right for the next 50 years .
Sincerely,
Robert A . EckelsChair
Amy BishopExecutive Director
Paul J . WilliamsChief Investment Officer
Texas County & District Retirement System10
ORGANIZATION CHART
* For information regarding investment professionals’ fees, see Tables 8–9 in the Investment Section.
Board ConsultantsLegal Counsel
Consulting ActuaryIndependent Auditor
Medical BoardInvestment Performance Analyst
Investment Consultant* Money Managers*
Chief Investment
Officer
Finance
General Counsel
Human Resources
Investment Operations
Investment Accounting
Administrative Services
Compliance Assurance
Deputy Investment
Officer
Deputy Director
Private Equity Team
Hedge Fund Team
Actuarial Services
Communications
Employer Services
Information Technology
Member Services
Strategic Projects
Executive Director
Board of Trustees
Information Security
Legal Services & Governmental
Relations

2016 Comprehensive Annual Financial Report 11
INTR
OD
UC
TOR
Y
BOARD OF TRUSTEES As of Dec. 31, 2016
CHAIRRobert A. EckelsRetireeHarris County JudgeTerm expires Dec . 31, 2019
VICE-CHAIRH.C. “Chuck” CazalasRetireeNueces County CommissionerTerm expires Dec . 31, 2017
Chris DavisCherokee County Judge Term expires Dec . 31, 2021
Mary Louise GarciaTarrant County ClerkTerm expires Dec . 31, 2017
Deborah HuntWilliamson Central Appraisal District Board of DirectorsTerm expires Dec . 31, 2021
Bill MetzgerDallas County Justice of the PeaceTerm expires Dec . 31, 2021
Bridget McDowellRetireeTaylor County AuditorTerm expires Dec . 31, 2019
Kristeen Roe Brazos County Tax Assessor-CollectorTerm expires Dec . 31, 2017
Bob WillisPolk County CommissionerTerm expires Dec . 31, 2019
[Back row] Mary Louise Garcia, Chris Davis, Deborah Hunt [front row] Bridget McDowell, H .C . “Chuck” Cazalas, Bill Metzger, Robert A . Eckels
[Not pictured] Kristeen Roe, Bob Willis

Texas County & District Retirement System12
EXECUTIVE STAFF AND PROFESSIONAL ADVISORS
ADMINISTRATIVE STAFF
Amy BishopExecutive Director
Tom HarrisonDeputy Director
INVESTMENT STAFF
Paul J. WilliamsChief Investment Officer
Vinson & Elkins LLP Bradshaw & Bickerton PLLCInvestment Counsel
Milliman, Inc.Consulting Actuary
Bank of New York MellonInvestment Performance Analyst
Cliffwater LLCInvestment Consultant
KPMG LLPIndependent Auditor
Jackson Walker LLP Fiduciary & Benefit Plan Administration Counsel
Ace Alsup, M.D., Chairman Shelby H. Carter, M.D. Frank E. Robinson, M.D. John P. Vineyard Jr., M.D.Medical Board
PROFESSIONAL ADVISORS
Sandra BraggDeputy Investment Officer
Ann McGeehanGeneral Counsel

2016 Comprehensive Annual Financial Report 13
INTR
OD
UC
TOR
Y
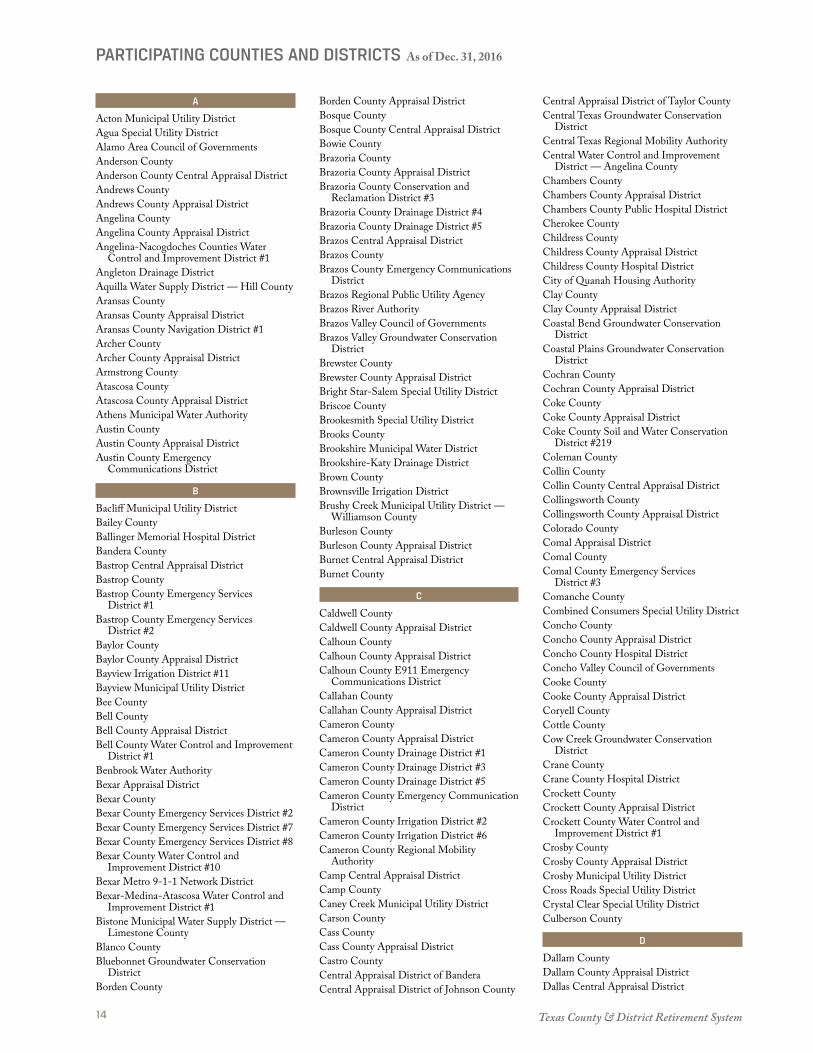
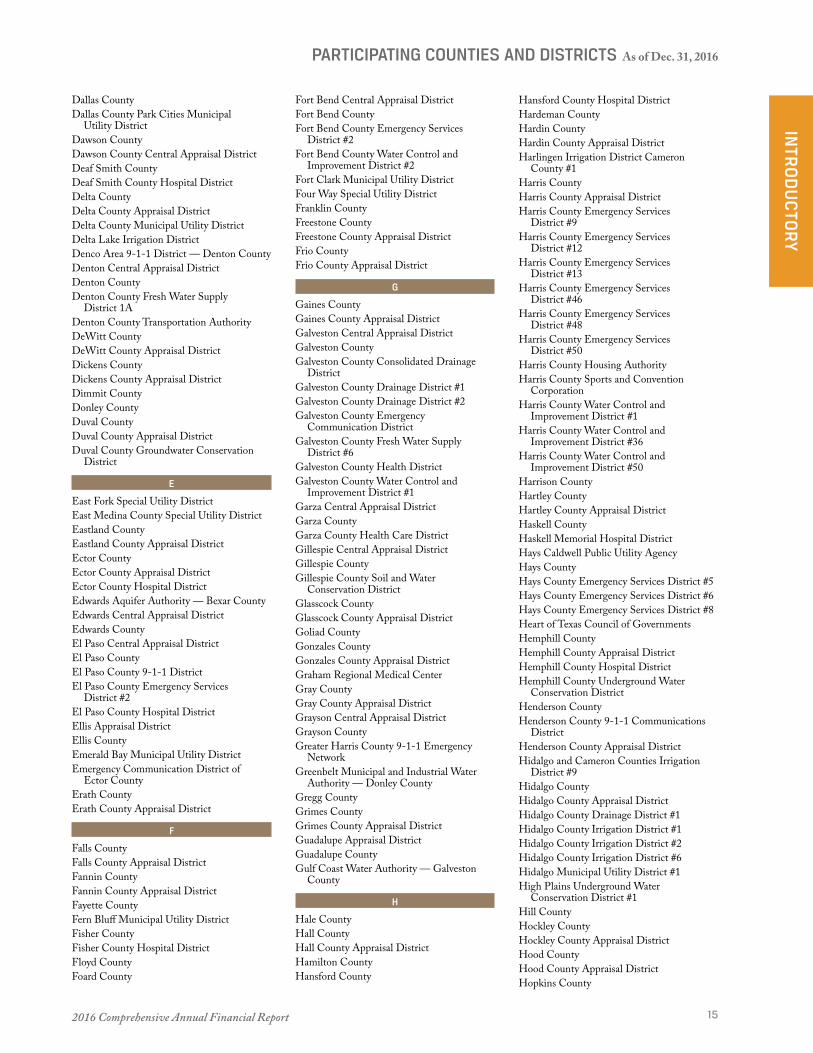
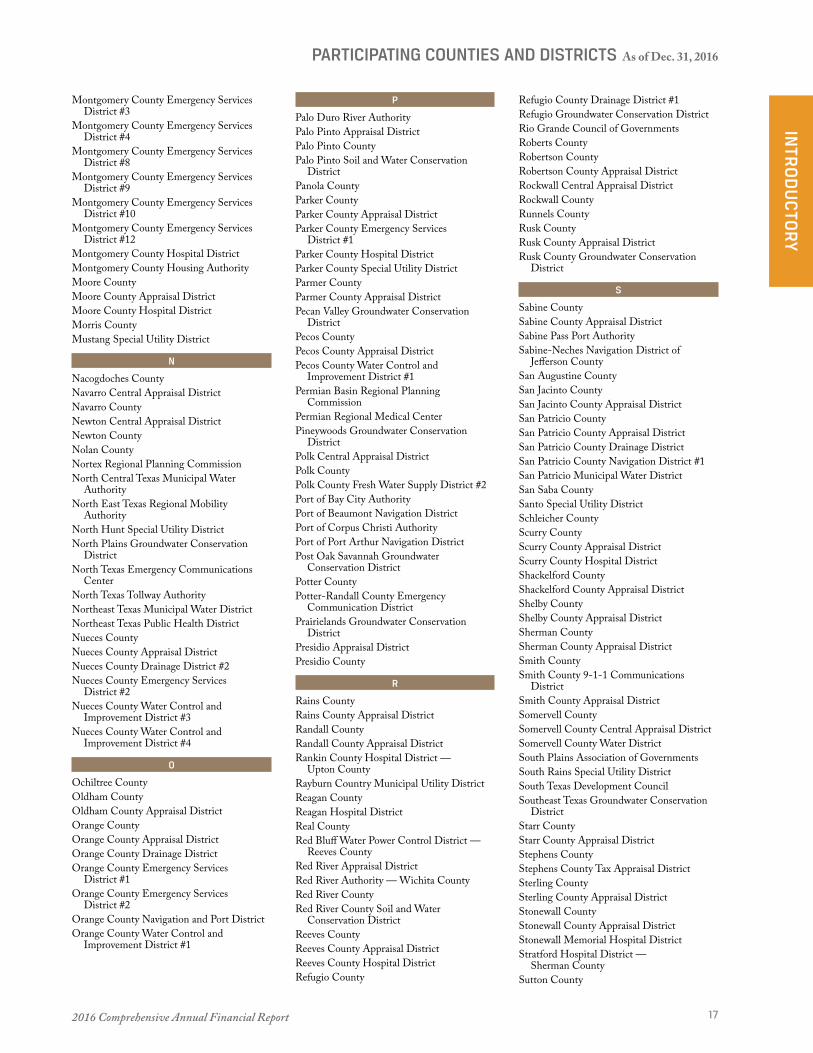
PARTICIPATING COUNTIES AND DISTRICTS As of Dec. 31, 2016
Dallam Sherman Hansford
CarsonPotterOldham
HemphillRobertsHutchinsonMooreHartley
LipscombOchiltree
BriscoeSwisherCastroParmer
Collings-worth
DonleyArmstrongRandallDeaf Smith
WheelerGray
Childress
LubbockCochran
Lamb HaleBailey
Hall
Haskell
Knox
Hardeman
GarzaLynnYoakum
Crosby
Floyd Cottle
Hockley
Terry
Dickens
Kent
King
Stonewall
FisherScurryBordenDawsonGaines Jones
TaylorNolanMitchellHowardMartinAndrews
Clay
Callahan
StephensShackelford
YoungThrockmorton
Archer
Wichita
Baylor
Wilbarger
Palo Pinto
MontagueCooke
Denton
Parker Tarrant
Eastland Erath
El Paso Culberson Loving
Jeff Davis
Presidio
Reeves
Pecos
Brewster
Terrell
Winkler Ector Midland Glasscock Sterling Coke Runnels
CraneWard Upton
Crockett
Reagan
Val Verde Edwards
Sutton
Schleicher
Irion Concho
Coleman
McCulloch
Mason
Gillespie
Kerr
Kimble
Kinney Uvalde Medina
Maverick Zavala Frio Atascosa
Dimmit La Salle
San Saba
Brown
Mills Hamilton
Bosque
McMullenLiveOak
Webb
Zapata Jim Hogg
Duval Jim Wells Nueces
Kleberg
Brooks Kenedy
Willacy
Cameron
Hidalgo
Bee
Lampasas
Coryell
BurnetBell
JohnsonHood
Collin
Grayson FanninLamar Red
RiverBowie
Kendall
Bexar
Wilson
KarnesGoliad
Comal
Blanco
Hays
Travis
Williamson
Bastrop
Caldwell
Guadalupe Gonzales
Fayette
Lavaca
Victoria
Jackson
Colorado
Wharton
Matagorda
Brazoria
Ft. Bend
Austin
WashingtonLee
Burleson
Milam
Robertson
GrimesBrazos
Harris
Walker
Leon
Madison
Falls
5
Liberty
4
Jefferson
Hardin
Tyler
Orange
NewtonJasper
Hill
Ellis
LimestoneMcLennan
Navarro
Kaufman
Dallas
Hunt
Freestone
Houston
Trinity
Angelina
NacogdochesAnderson
Henderson
3Sabine
SanJacinto
Polk
Cass
Harrison
Marion
Panola
Delta Titus
Van Zandt
Wood
Smith
UpshurCamp
Cherokee
Rusk
Hudspeth Comanche
Tom Green
LlanoMenard
RealBandera
Starr
Refugio
San Patricio
6
Calhoun
DeWitt
Shelby
Jack WiseHopkins
Fran
klin
Mor
ris
Rains1
2
WallerMontgomery
Gregg
Foard
Motley
1 Rockwall
2 Somervell
3 San Augustine
4 Chambers
5 Galveston
6 Aransas
Motley County is not a participating employer with TCDRS .
Texas County & District Retirement System14
PARTICIPATING COUNTIES AND DISTRICTS As of Dec. 31, 2016
A
Acton Municipal Utility DistrictAgua Special Utility DistrictAlamo Area Council of GovernmentsAnderson CountyAnderson County Central Appraisal DistrictAndrews CountyAndrews County Appraisal DistrictAngelina CountyAngelina County Appraisal DistrictAngelina-Nacogdoches Counties Water
Control and Improvement District #1Angleton Drainage DistrictAquilla Water Supply District — Hill CountyAransas CountyAransas County Appraisal DistrictAransas County Navigation District #1Archer CountyArcher County Appraisal DistrictArmstrong CountyAtascosa CountyAtascosa County Appraisal DistrictAthens Municipal Water AuthorityAustin CountyAustin County Appraisal DistrictAustin County Emergency
Communications District
B
Bacliff Municipal Utility DistrictBailey CountyBallinger Memorial Hospital DistrictBandera CountyBastrop Central Appraisal DistrictBastrop CountyBastrop County Emergency Services
District #1Bastrop County Emergency Services
District #2Baylor CountyBaylor County Appraisal DistrictBayview Irrigation District #11Bayview Municipal Utility DistrictBee CountyBell CountyBell County Appraisal DistrictBell County Water Control and Improvement
District #1Benbrook Water AuthorityBexar Appraisal DistrictBexar CountyBexar County Emergency Services District #2Bexar County Emergency Services District #7Bexar County Emergency Services District #8Bexar County Water Control and
Improvement District #10Bexar Metro 9-1-1 Network District Bexar-Medina-Atascosa Water Control and
Improvement District #1Bistone Municipal Water Supply District —
Limestone CountyBlanco CountyBluebonnet Groundwater Conservation
DistrictBorden County
Borden County Appraisal DistrictBosque CountyBosque County Central Appraisal DistrictBowie CountyBrazoria CountyBrazoria County Appraisal DistrictBrazoria County Conservation and
Reclamation District #3Brazoria County Drainage District #4Brazoria County Drainage District #5Brazos Central Appraisal DistrictBrazos CountyBrazos County Emergency Communications
DistrictBrazos Regional Public Utility AgencyBrazos River AuthorityBrazos Valley Council of GovernmentsBrazos Valley Groundwater Conservation
DistrictBrewster CountyBrewster County Appraisal DistrictBright Star-Salem Special Utility DistrictBriscoe CountyBrookesmith Special Utility DistrictBrooks CountyBrookshire Municipal Water DistrictBrookshire-Katy Drainage DistrictBrown CountyBrownsville Irrigation District Brushy Creek Municipal Utility District —
Williamson CountyBurleson CountyBurleson County Appraisal DistrictBurnet Central Appraisal DistrictBurnet County
C
Caldwell CountyCaldwell County Appraisal DistrictCalhoun CountyCalhoun County Appraisal DistrictCalhoun County E911 Emergency
Communications DistrictCallahan CountyCallahan County Appraisal DistrictCameron CountyCameron County Appraisal DistrictCameron County Drainage District #1Cameron County Drainage District #3Cameron County Drainage District #5Cameron County Emergency Communication
DistrictCameron County Irrigation District #2Cameron County Irrigation District #6Cameron County Regional Mobility
AuthorityCamp Central Appraisal DistrictCamp CountyCaney Creek Municipal Utility DistrictCarson CountyCass CountyCass County Appraisal DistrictCastro CountyCentral Appraisal District of BanderaCentral Appraisal District of Johnson County
Central Appraisal District of Taylor CountyCentral Texas Groundwater Conservation
DistrictCentral Texas Regional Mobility AuthorityCentral Water Control and Improvement
District — Angelina CountyChambers CountyChambers County Appraisal DistrictChambers County Public Hospital DistrictCherokee CountyChildress CountyChildress County Appraisal DistrictChildress County Hospital DistrictCity of Quanah Housing AuthorityClay CountyClay County Appraisal DistrictCoastal Bend Groundwater Conservation
DistrictCoastal Plains Groundwater Conservation
DistrictCochran CountyCochran County Appraisal DistrictCoke CountyCoke County Appraisal DistrictCoke County Soil and Water Conservation
District #219Coleman CountyCollin CountyCollin County Central Appraisal DistrictCollingsworth CountyCollingsworth County Appraisal DistrictColorado CountyComal Appraisal DistrictComal CountyComal County Emergency Services
District #3Comanche CountyCombined Consumers Special Utility District Concho CountyConcho County Appraisal DistrictConcho County Hospital DistrictConcho Valley Council of GovernmentsCooke CountyCooke County Appraisal DistrictCoryell CountyCottle CountyCow Creek Groundwater Conservation
DistrictCrane CountyCrane County Hospital DistrictCrockett CountyCrockett County Appraisal DistrictCrockett County Water Control and
Improvement District #1Crosby CountyCrosby County Appraisal DistrictCrosby Municipal Utility DistrictCross Roads Special Utility DistrictCrystal Clear Special Utility DistrictCulberson County
D
Dallam CountyDallam County Appraisal DistrictDallas Central Appraisal District
2016 Comprehensive Annual Financial Report 15
INTR
OD
UC
TOR
Y
PARTICIPATING COUNTIES AND DISTRICTS As of Dec. 31, 2016
Dallas CountyDallas County Park Cities Municipal
Utility DistrictDawson CountyDawson County Central Appraisal DistrictDeaf Smith CountyDeaf Smith County Hospital DistrictDelta CountyDelta County Appraisal DistrictDelta County Municipal Utility DistrictDelta Lake Irrigation DistrictDenco Area 9-1-1 District — Denton CountyDenton Central Appraisal DistrictDenton CountyDenton County Fresh Water Supply
District 1ADenton County Transportation AuthorityDeWitt CountyDeWitt County Appraisal DistrictDickens CountyDickens County Appraisal DistrictDimmit CountyDonley CountyDuval CountyDuval County Appraisal DistrictDuval County Groundwater Conservation
District
E
East Fork Special Utility DistrictEast Medina County Special Utility DistrictEastland CountyEastland County Appraisal DistrictEctor CountyEctor County Appraisal DistrictEctor County Hospital DistrictEdwards Aquifer Authority — Bexar CountyEdwards Central Appraisal DistrictEdwards CountyEl Paso Central Appraisal DistrictEl Paso CountyEl Paso County 9-1-1 DistrictEl Paso County Emergency Services
District #2El Paso County Hospital DistrictEllis Appraisal DistrictEllis CountyEmerald Bay Municipal Utility DistrictEmergency Communication District of
Ector CountyErath CountyErath County Appraisal District
F
Falls CountyFalls County Appraisal DistrictFannin CountyFannin County Appraisal DistrictFayette CountyFern Bluff Municipal Utility DistrictFisher CountyFisher County Hospital DistrictFloyd CountyFoard County
Fort Bend Central Appraisal DistrictFort Bend CountyFort Bend County Emergency Services
District #2Fort Bend County Water Control and
Improvement District #2Fort Clark Municipal Utility DistrictFour Way Special Utility DistrictFranklin CountyFreestone CountyFreestone County Appraisal DistrictFrio CountyFrio County Appraisal District
G
Gaines CountyGaines County Appraisal DistrictGalveston Central Appraisal DistrictGalveston CountyGalveston County Consolidated Drainage
DistrictGalveston County Drainage District #1Galveston County Drainage District #2Galveston County Emergency
Communication DistrictGalveston County Fresh Water Supply
District #6Galveston County Health DistrictGalveston County Water Control and
Improvement District #1Garza Central Appraisal DistrictGarza CountyGarza County Health Care DistrictGillespie Central Appraisal DistrictGillespie CountyGillespie County Soil and Water
Conservation DistrictGlasscock CountyGlasscock County Appraisal DistrictGoliad CountyGonzales CountyGonzales County Appraisal DistrictGraham Regional Medical CenterGray CountyGray County Appraisal DistrictGrayson Central Appraisal DistrictGrayson CountyGreater Harris County 9-1-1 Emergency
NetworkGreenbelt Municipal and Industrial Water
Authority — Donley CountyGregg CountyGrimes CountyGrimes County Appraisal DistrictGuadalupe Appraisal DistrictGuadalupe CountyGulf Coast Water Authority — Galveston
County
H
Hale CountyHall CountyHall County Appraisal DistrictHamilton CountyHansford County
Hansford County Hospital DistrictHardeman CountyHardin CountyHardin County Appraisal DistrictHarlingen Irrigation District Cameron
County #1Harris CountyHarris County Appraisal DistrictHarris County Emergency Services
District #9Harris County Emergency Services
District #12Harris County Emergency Services
District #13Harris County Emergency Services
District #46Harris County Emergency Services
District #48Harris County Emergency Services
District #50Harris County Housing AuthorityHarris County Sports and Convention
CorporationHarris County Water Control and
Improvement District #1Harris County Water Control and
Improvement District #36Harris County Water Control and
Improvement District #50Harrison CountyHartley CountyHartley County Appraisal DistrictHaskell CountyHaskell Memorial Hospital DistrictHays Caldwell Public Utility AgencyHays CountyHays County Emergency Services District #5Hays County Emergency Services District #6Hays County Emergency Services District #8Heart of Texas Council of GovernmentsHemphill CountyHemphill County Appraisal DistrictHemphill County Hospital DistrictHemphill County Underground Water
Conservation DistrictHenderson CountyHenderson County 9-1-1 Communications
DistrictHenderson County Appraisal DistrictHidalgo and Cameron Counties Irrigation
District #9Hidalgo CountyHidalgo County Appraisal DistrictHidalgo County Drainage District #1Hidalgo County Irrigation District #1Hidalgo County Irrigation District #2Hidalgo County Irrigation District #6Hidalgo Municipal Utility District #1High Plains Underground Water
Conservation District #1Hill CountyHockley CountyHockley County Appraisal DistrictHood CountyHood County Appraisal DistrictHopkins County

Texas County & District Retirement System16
PARTICIPATING COUNTIES AND DISTRICTS As of Dec. 31, 2016
Hopkins County Appraisal DistrictHopkins-Rains Soil and Water Conservation
DistrictHousing Authority of the City of AbileneHousing Authority of the City of EdinburgHousing Authority of the City of HuntingtonHousing Authority of the City of MercedesHousing Authority of the City of PharrHousing Authority of the County of HidalgoHouston CountyHouston County Appraisal DistrictHoward CountyHudspeth CountyHunt CountyHunt County Appraisal DistrictHutchinson CountyHutchinson County Appraisal District
I
Iraan General Hospital DistrictIrion CountyIrion County Appraisal District
J
Jack CountyJack County Appraisal DistrictJackson CountyJackson County Appraisal DistrictJackson County County-Wide Drainage
DistrictJackson County Emergency Services
District #3Jasper CountyJasper County Water Control and
Improvement District #1Jeff Davis CountyJefferson CountyJefferson County Appraisal DistrictJefferson County Drainage District #3Jefferson County Drainage District #6Jefferson County Drainage District #7Jefferson County Water Control and
Improvement District #10Jim Hogg CountyJim Hogg County Appraisal DistrictJim Hogg County Emergency Services
District #1Jim Hogg County Water Control and
Improvement District #2Jim Wells CountyJohnson CountyJonah Water Special Utility DistrictJones CountyJones County Appraisal District
K
Karnes CountyKarnes County Appraisal DistrictKarnes County Hospital DistrictKaufman CountyKaufman County Appraisal DistrictKendall Appraisal DistrictKendall County
Kendall County Water Control and Improvement District #1
Kenedy CountyKenedy County Central Appraisal DistrictKenedy County Fire and Emergency Services
District #1Kent CountyKent County Tax Appraisal DistrictKerr CountyKerr County Soil and Water Conservation
DistrictKerr Emergency 9-1-1 NetworkKimble CountyKing CountyKing County Appraisal DistrictKinney CountyKinney County Appraisal DistrictKleberg CountyKnox County
L
La Salle CountyLa Salle County Appraisal DistrictLaguna Madre Water District —
Cameron CountyLake Cities Municipal Utility AuthorityLake Kiowa Special Utility DistrictLakeway Municipal Utility District —
Travis CountyLamar CountyLamar County Appraisal DistrictLamb CountyLampasas CountyLampasas County Appraisal DistrictLavaca CountyLavaca-Navidad River Authority —
Jackson CountyLee Central Appraisal DistrictLee CountyLeon CountyLeon County Central Appraisal DistrictLiberty CountyLiberty County Central Appraisal DistrictLimestone CountyLimestone County Appraisal DistrictLipscomb CountyLive Oak CountyLive Oak County Appraisal DistrictLlano CountyLoving CountyLoving County Appraisal DistrictLower Trinity Groundwater Conservation
DistrictLower Valley Water DistrictLubbock Central Appraisal DistrictLubbock CountyLubbock County Water Control and
Improvement District #1Lubbock Emergency Communication DistrictLubbock Reese Redevelopment AuthorityLumberton Municipal Utility DistrictLynn CountyLynn County Appraisal DistrictLynn County Hospital District
M
Macedonia-Eylau Municipal Utility District — Bowie County
Mackenzie Municipal Water Authority — Briscoe County
Madison CountyMadison County Appraisal DistrictMarion CountyMarion County Appraisal DistrictMarion-Cass Soil and Water Conservation
DistrictMarshall-Harrison County Health DistrictMartin CountyMartin County Appraisal DistrictMason CountyMason County Soil and Water Conservation
District #223Matagorda CountyMatagorda County Appraisal DistrictMatagorda County Drainage DistrictMatagorda County Hospital DistrictMatagorda County Navigation District #1Maverick CountyMaverick County Hospital DistrictMaverick County Water Control and
Improvement District #1McCamey County Hospital DistrictMcCulloch CountyMcCulloch County Appraisal DistrictMcLennan CountyMcLennan County 9-1-1 Emergency
Assistance DistrictMcLennan County Appraisal DistrictMcLennan County Water Control and
Improvement District #2McMullen CountyMedical Arts Hospital — Dawson CountyMedina CountyMedina County 9-1-1 DistrictMedina County Appraisal DistrictMemorial Medical Center — Calhoun
CountyMenard CountyMesa Underground Water Conservation
DistrictMiddle Rio Grande Development CouncilMidland Central Appraisal DistrictMidland CountyMidland Emergency Communication DistrictMilam Appraisal DistrictMilam CountyMills Central Appraisal DistrictMills CountyMitchell CountyMitchell County Appraisal DistrictMonahans Housing AuthorityMontague CountyMontague County Tax Appraisal DistrictMontgomery Central Appraisal DistrictMontgomery CountyMontgomery County Emergency
Communication DistrictMontgomery County Emergency Services
District #1
2016 Comprehensive Annual Financial Report 17
INTR
OD
UC
TOR
Y
PARTICIPATING COUNTIES AND DISTRICTS As of Dec. 31, 2016
Montgomery County Emergency Services District #3
Montgomery County Emergency Services District #4
Montgomery County Emergency Services District #8
Montgomery County Emergency Services District #9
Montgomery County Emergency Services District #10
Montgomery County Emergency Services District #12
Montgomery County Hospital District Montgomery County Housing AuthorityMoore CountyMoore County Appraisal DistrictMoore County Hospital DistrictMorris CountyMustang Special Utility District
N
Nacogdoches CountyNavarro Central Appraisal DistrictNavarro CountyNewton Central Appraisal DistrictNewton CountyNolan CountyNortex Regional Planning CommissionNorth Central Texas Municipal Water
AuthorityNorth East Texas Regional Mobility
AuthorityNorth Hunt Special Utility DistrictNorth Plains Groundwater Conservation
DistrictNorth Texas Emergency Communications
CenterNorth Texas Tollway AuthorityNortheast Texas Municipal Water DistrictNortheast Texas Public Health DistrictNueces CountyNueces County Appraisal DistrictNueces County Drainage District #2Nueces County Emergency Services
District #2Nueces County Water Control and
Improvement District #3Nueces County Water Control and
Improvement District #4
O
Ochiltree CountyOldham CountyOldham County Appraisal DistrictOrange CountyOrange County Appraisal DistrictOrange County Drainage DistrictOrange County Emergency Services
District #1Orange County Emergency Services
District #2Orange County Navigation and Port DistrictOrange County Water Control and
Improvement District #1
P
Palo Duro River AuthorityPalo Pinto Appraisal DistrictPalo Pinto CountyPalo Pinto Soil and Water Conservation
DistrictPanola CountyParker CountyParker County Appraisal DistrictParker County Emergency Services
District #1Parker County Hospital DistrictParker County Special Utility DistrictParmer CountyParmer County Appraisal DistrictPecan Valley Groundwater Conservation
DistrictPecos CountyPecos County Appraisal DistrictPecos County Water Control and
Improvement District #1Permian Basin Regional Planning
CommissionPermian Regional Medical CenterPineywoods Groundwater Conservation
DistrictPolk Central Appraisal DistrictPolk CountyPolk County Fresh Water Supply District #2Port of Bay City AuthorityPort of Beaumont Navigation DistrictPort of Corpus Christi AuthorityPort of Port Arthur Navigation DistrictPost Oak Savannah Groundwater
Conservation DistrictPotter CountyPotter-Randall County Emergency
Communication DistrictPrairielands Groundwater Conservation
DistrictPresidio Appraisal DistrictPresidio County
R
Rains CountyRains County Appraisal DistrictRandall CountyRandall County Appraisal DistrictRankin County Hospital District —
Upton CountyRayburn Country Municipal Utility DistrictReagan CountyReagan Hospital DistrictReal CountyRed Bluff Water Power Control District —
Reeves CountyRed River Appraisal DistrictRed River Authority — Wichita CountyRed River CountyRed River County Soil and Water
Conservation DistrictReeves CountyReeves County Appraisal DistrictReeves County Hospital DistrictRefugio County
Refugio County Drainage District #1Refugio Groundwater Conservation DistrictRio Grande Council of GovernmentsRoberts CountyRobertson CountyRobertson County Appraisal DistrictRockwall Central Appraisal DistrictRockwall CountyRunnels CountyRusk CountyRusk County Appraisal DistrictRusk County Groundwater Conservation
District
S
Sabine CountySabine County Appraisal DistrictSabine Pass Port AuthoritySabine-Neches Navigation District of
Jefferson CountySan Augustine CountySan Jacinto CountySan Jacinto County Appraisal DistrictSan Patricio CountySan Patricio County Appraisal DistrictSan Patricio County Drainage DistrictSan Patricio County Navigation District #1San Patricio Municipal Water DistrictSan Saba CountySanto Special Utility DistrictSchleicher CountyScurry CountyScurry County Appraisal DistrictScurry County Hospital DistrictShackelford CountyShackelford County Appraisal DistrictShelby CountyShelby County Appraisal DistrictSherman CountySherman County Appraisal DistrictSmith CountySmith County 9-1-1 Communications
DistrictSmith County Appraisal DistrictSomervell CountySomervell County Central Appraisal DistrictSomervell County Water DistrictSouth Plains Association of GovernmentsSouth Rains Special Utility DistrictSouth Texas Development CouncilSoutheast Texas Groundwater Conservation
DistrictStarr CountyStarr County Appraisal DistrictStephens CountyStephens County Tax Appraisal DistrictSterling CountySterling County Appraisal DistrictStonewall CountyStonewall County Appraisal DistrictStonewall Memorial Hospital DistrictStratford Hospital District —
Sherman CountySutton County
Texas County & District Retirement System18
PARTICIPATING COUNTIES AND DISTRICTS As of Dec. 31, 2016
Sutton County Hospital DistrictSwisher CountySwisher County Appraisal District
T
Tarrant Appraisal DistrictTarrant CountyTarrant County 9-1-1 Emergency Assistance
DistrictTax Appraisal District of Cottle CountyTaylor CountyTerrell CountyTerrell County Water Control and
Improvement District #1Terry CountyTerry Memorial Hospital DistrictTexas Association of CountiesTexas County & District Retirement SystemTexas Eastern 9-1-1 NetworkThrockmorton CountyTitus CountyTitus County Appraisal DistrictTitus County Fresh Water Supply DistrictTom Green CountyTravis Central Appraisal DistrictTravis CountyTravis County Emergency Services District #1
North Lake Travis Fire and RescueTravis County Emergency Services District #2Travis County Emergency Services District #4Travis County Emergency Services District #11Travis County Emergency Services District #12Travis County Water Control and
Improvement District — Point VentureTri-County Special Utility DistrictTrinity Bay Conservation DistrictTrinity CountyTrinity County Appraisal DistrictTrophy Club Municipal Utility District #1Two Way Special Utility DistrictTyler CountyTyler County Appraisal District
U
United Irrigation District — Hidalgo CountyUpper Brushy Creek Water Control and
Improvement DistrictUpper Leon River Municipal Water DistrictUpper Trinity Groundwater Conservation
DistrictUpshur CountyUpton CountyUpton County Appraisal DistrictUvalde County
V
Val Verde CountyValley Municipal Utility District #2 —
Cameron CountyValwood Improvement Authority —
Dallas CountyVan Zandt CountyVan Zandt County Appraisal DistrictVelasco Drainage District — Brazoria County
Victoria CountyVictoria County Drainage District #3Victoria County Groundwater Conservation
District
W
Walker CountyWalker County Appraisal DistrictWalker County Special Utility DistrictWaller CountyWaller County Appraisal DistrictWard CountyWard County Central Appraisal DistrictWard Memorial HospitalWashington CountyWebb CountyWebb County Appraisal DistrictWest Central Texas Council of GovernmentsWest Central Texas Municipal Water DistrictWest Jefferson County Municipal Water
DistrictWest Nueces-Las Moras Soil and Water
Conservation District #236West Travis County Public Utility AgencyWharton CountyWharton County Central Appraisal DistrictWharton County Water Control and
Improvement District #1Wharton County Water Control and
Improvement District #2Wheeler CountyWheeler County Appraisal DistrictWhite River Municipal Water District —
Dickens CountyWichita Appraisal DistrictWichita CountyWichita County Water Improvement
District #2Wichita-Wilbarger 9-1-1 DistrictWickson Creek Special Utility District —
Brazos CountyWilbarger CountyWilbarger County Appraisal DistrictWilbarger County Hospital DistrictWillacy CountyWillacy County Appraisal DistrictWillacy County Housing AuthorityWilliamson Central Appraisal DistrictWilliamson CountyWilliamson County Emergency Service
District #4Williamson County Emergency Services
District #3Williamson County Emergency Services
District #5Wilson CountyWilson County Appraisal DistrictWinkler CountyWinkler County Appraisal DistrictWintergarden Groundwater Conservation
DistrictWise County Wise County Appraisal DistrictWood County
Wood County Appraisal DistrictWylie Northeast Special Utility District
Y
Yoakum CountyYoakum County Appraisal DistrictYoung County
Z
Zapata CountyZapata County Appraisal DistrictZapata Soil and Water Conservation DistrictZavala CountyZavala County Appraisal District
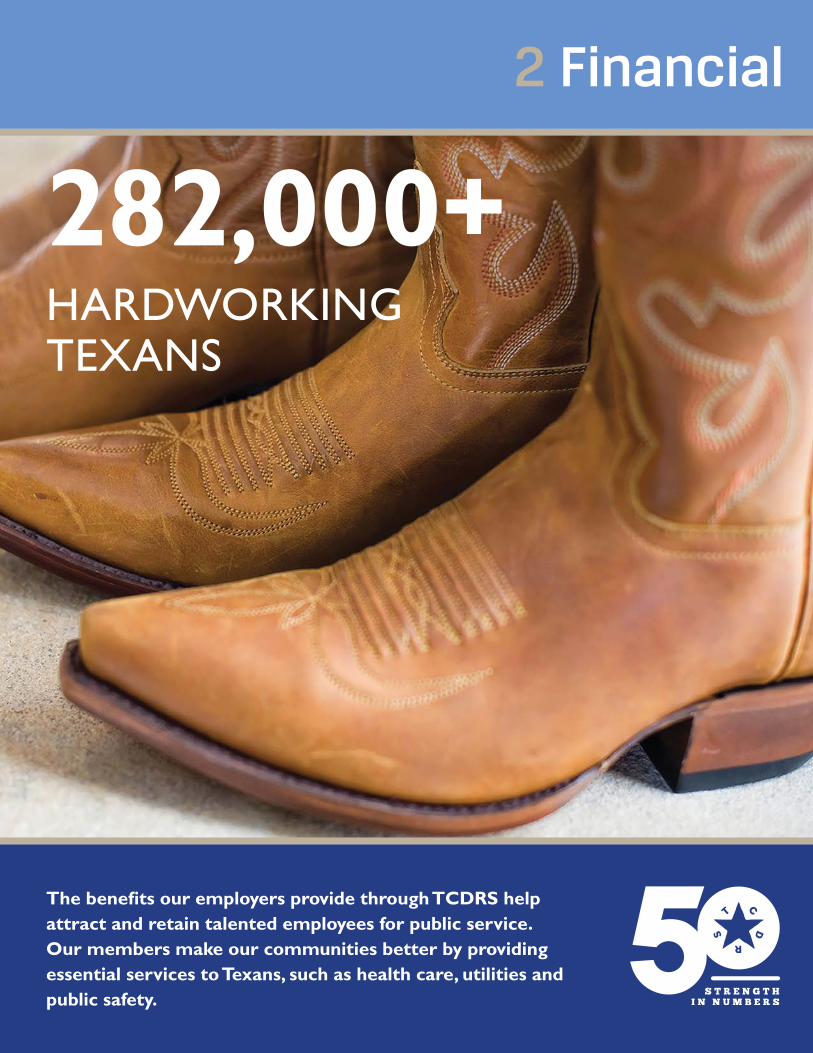
The benefits our employers provide through TCDRS help attract and retain talented employees for public service. Our members make our communities better by providing essential services to Texans, such as health care, utilities and public safety.
282,000+HARDWORKINGTEXANS
2 Financial
Texas County & District Retirement System20
2016 Comprehensive Annual Financial Report 21
FINA
NC
IAL

Texas County & District Retirement System22
FIDUCIARY NET POSITION($ Billions)
$ 30
$ 25
$ 20
$ 15
$ 10
$ 0
2014 2015 2016
$26.29
MANAGEMENT’S DISCUSSION AND ANALYSIS
INTRODUCTION
This section provides an overview and analysis of the system’s financial position and performance, focusing on the current year’s results, changes in those results (including three-year trends), and other currently known information . Readers are encouraged to consider this information in conjunction with information provided in other areas of the Financial Section, as well as information presented in the Letter of Transmittal in the Introductory Section .
OVERVIEW OF THE FINANCIAL STATEMENTS
The basic financial statements consist of the Statements of Fiduciary Net Position, Statements of Changes in Fiduciary Net Position and the Notes to the Financial Statements . Required Supplementary Information and Other Supplementary Information are also presented .
• The Statements of Fiduciary Net Position report the assets less liabilities and the resulting net position for pension or insurance benefits at the end of 2016, compared to 2015 .
• The Statements of Changes in Fiduciary Net Position report the transactions that occurred during 2016 and 2015 for which additions less deductions equal the net increase or decrease in fiduciary net position .
• Notes to the Financial Statements include ad-ditional information not readily evident in the statements themselves . The notes are considered essential to a full understanding of the informa-tion provided in the financial statements .
• Required Supplementary Information provides the money-weighted rate of return information . In addition, there is historical funding progress and employer contributions information for the Group Term Life Fund .
• Other Supplementary Information provides detailed information, including activity by fund, administrative and investment expenses, and professional and consultant fees and services . These schedules support summary data present-ed in the basic financial statements .
TCDRS operates two trusts, both of which are accounted for as fiduciary funds . The Pension Trust Fund accounts for and provides retirement,
disability and survivor benefits to the employees of participating employers . The Group Term Life Fund (GTLF or Group Term Life) provides a program of group term life insurance for the employees and, if covered, retirees of electing employers . No assets of the Pension Trust Fund may be used to pay any insurance benefit due from the GTLF, nor may assets of the GTLF be used to pay any benefit due from the Pension Trust Fund . Discussion and analysis is provided separately for each of the two trusts .
The Statements of Fiduciary Net Position and Statements of Changes in Fiduciary Net Position show financial information for both the Pension Trust Fund and the GTLF .
FINANCIAL ANALYSIS: PENSION TRUST FUND
The Pension Trust Fund is comprised of six individual funds, each with a specific operational purpose . Note A in the Notes to the Financial Statements has additional information about each of these funds .
Summary information about fiduciary net position and the changes in fiduciary net position showing comparative detail for 2016, 2015 and 2014 is presented on page 23 .
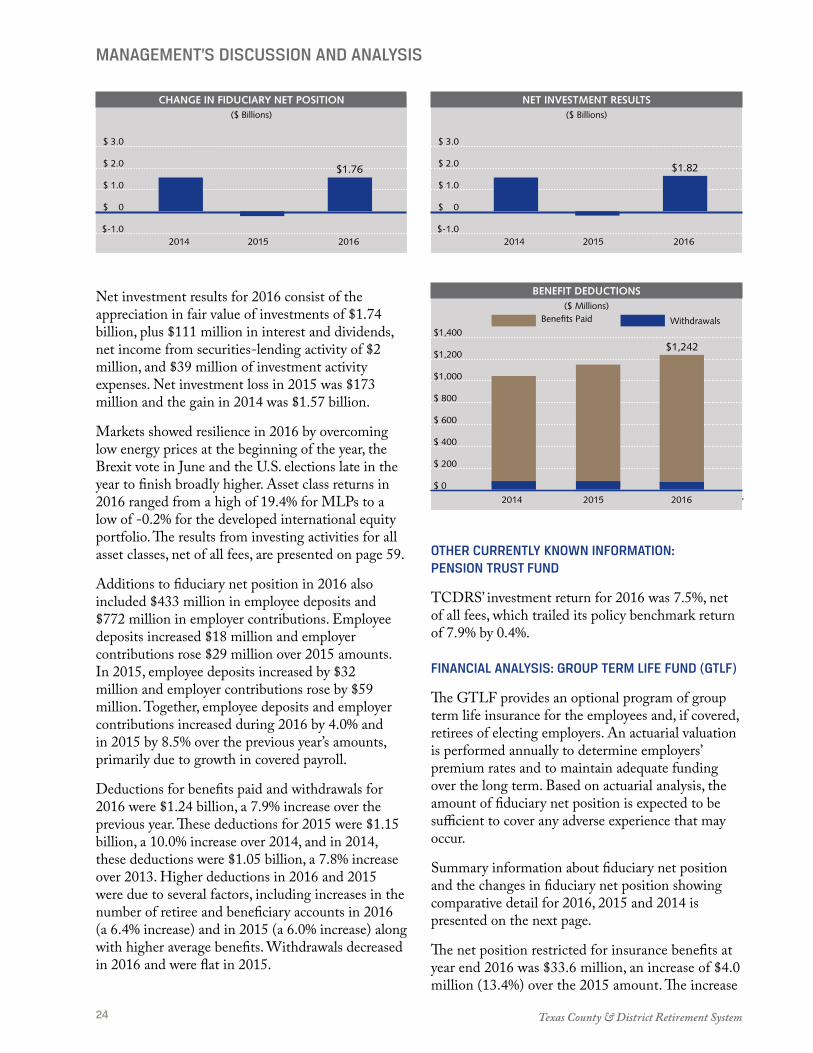
Net position (the amount that assets exceed liabilities) restricted for pensions at year end 2016 totaled $26 .29 billion . The 2015 amount was $24 .53 billion and for 2014 was $24 .72 billion . The increase in fiduciary net position in 2016 was $1 .76 billion, while fiduciary net position decreased in 2015 by $0 .19 billion, and increased in 2014 by $1 .57 billion .
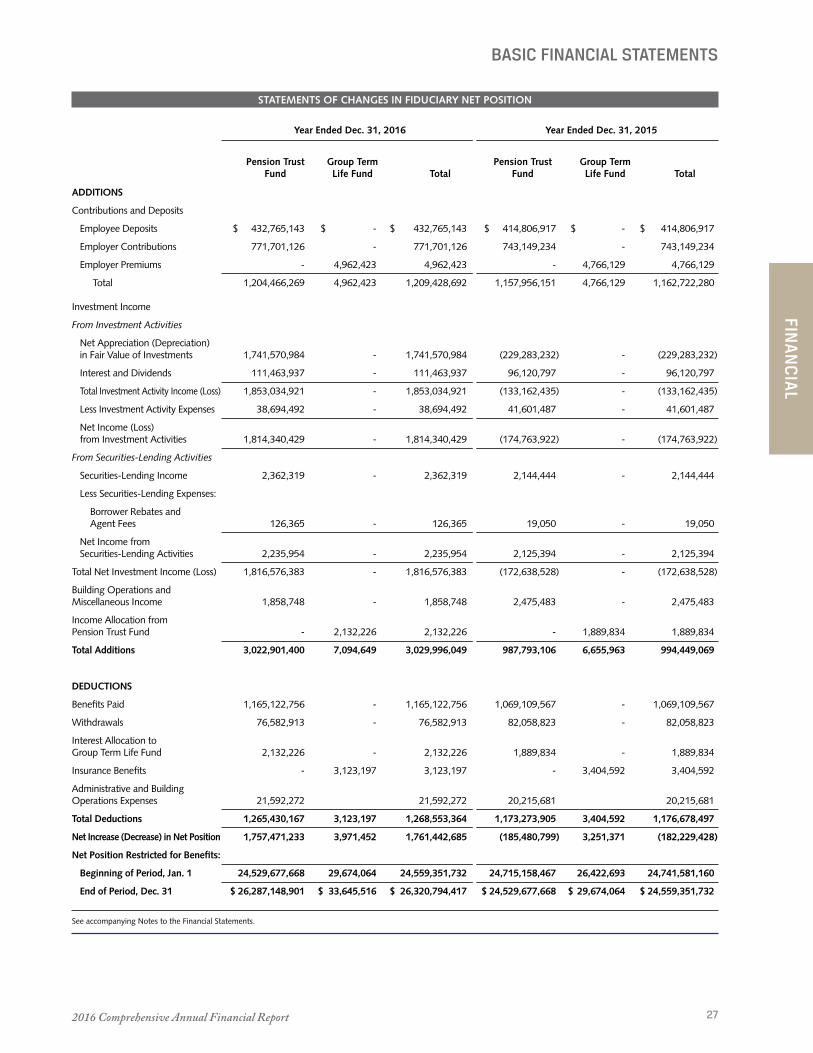
The increase in 2016 fiduciary net position was primarily due to a net investment gain of $1 .82 billion — a 7 .5% overall return, net of all fees .

2016 Comprehensive Annual Financial Report 23
FINA
NC
IAL
MANAGEMENT’S DISCUSSION AND ANALYSIS
SUMMARY INFORMATION ABOUT FIDUCIARY NET POSITION
Pension Trust Fund ($ Millions)
Dec. 31, 2016 – 2015 2015 – 2014 2016 2015 2014 $ Change % Change $ Change % ChangeAssets
Investments, at Fair Value $ 26,163 $ 24,418 $ 24,618 $ 1,745 7.1% $ (200) (0.8)%
Invested Securities-Lending Collateral 5 39 41 (34) (87.2) (2) (4.9)
Receivables, Cash and Cash Equivalents, Other 164 148 129 16 10.8 19 14.7
Capital Assets, Net 21 19 17 2 10.5 2 11.8
Total Assets 26,353 24,624 24,805 1,729 7.0 (181) (0.7)
Liabilities
Securities-Lending Collateral 5 39 41 (34) (87.2) (2) (4.9)
Other Liabilities 61 55 49 6 10.9 6 12.2
Total Liabilities 66 94 90 (28) (29.8) 4 4.4
Net Position Restricted for Pensions $ 26,287 $ 24,530 $ 24,715 $ 1,757 7.2% $ (185) (0.7)%
Due to rounding, totals and detail may not equal. Percentages shown are based on rounded amounts and may differ slightly from actual.
SUMMARY INFORMATION ABOUT CHANGES IN FIDUCIARY NET POSITION
Pension Trust Fund ($ Millions)
Years Ended Dec. 31, 2016 – 2015 2015 – 2014 2016 2015 2014 $ Change % Change $ Change % ChangeAdditions
Employee Deposits $ 433 $ 415 $ 383 $ 18 4.3% $ 32 8.4%
Employer Contributions 772 743 684 29 3.9 59 8.6
Net Investment Results 1,816 (172) 1,568 1,988 (1,155.8) (1,740) (111.0)
Other Income 2 2 2 0 0.0 0 0.0
Total Additions 3,023 988 2,637 2,035 206.0 (1,649) (62.5)
Deductions
Benefits Paid 1,165 1,069 964 96 9.0 105 10.9
Withdrawals 77 82 82 (5) (6.1) - 0.0
Administrative Expenses 20 18 18 2 11.1 0 0.0
Other Expenses 4 4 4 0 0.0 0 0.0
Total Deductions 1,266 1,173 1,068 93 7.9 105 9.8
Net Increase (Decrease) in Fiduciary Net Position 1,757 (185) 1,569 1,942 (1,049.7) (1,754) (111.8)
Net Position Restricted for Pensions $ 26,287 $ 24,530 $ 24,715 $ 1,757 7.2% $ (185) (0.7)%
Due to rounding, totals and detail may not equal. Percentages shown are based on rounded amounts and may differ slightly from actual.
Texas County & District Retirement System24
NET INVESTMENT RESULTS($ Billions)
$ 3.0
$ 2.0
$ 1.0
$ 0
$-1.0 2014 2015 2016
$1.82
CHANGE IN FIDUCIARY NET POSITION($ Billions)
$ 3.0
$ 2.0
$ 1.0
$ 0
$-1.0 2014 2015 2016
$1.76
MANAGEMENT’S DISCUSSION AND ANALYSIS
Net investment results for 2016 consist of the appreciation in fair value of investments of $1 .74 billion, plus $111 million in interest and dividends, net income from securities-lending activity of $2 million, and $39 million of investment activity expenses . Net investment loss in 2015 was $173 million and the gain in 2014 was $1 .57 billion .
Markets showed resilience in 2016 by overcoming low energy prices at the beginning of the year, the Brexit vote in June and the U .S . elections late in the year to finish broadly higher . Asset class returns in 2016 ranged from a high of 19 .4% for MLPs to a low of -0 .2% for the developed international equity portfolio . The results from investing activities for all asset classes, net of all fees, are presented on page 59 .
Additions to fiduciary net position in 2016 also included $433 million in employee deposits and $772 million in employer contributions . Employee deposits increased $18 million and employer contributions rose $29 million over 2015 amounts . In 2015, employee deposits increased by $32 million and employer contributions rose by $59 million . Together, employee deposits and employer contributions increased during 2016 by 4 .0% and in 2015 by 8 .5% over the previous year’s amounts, primarily due to growth in covered payroll .
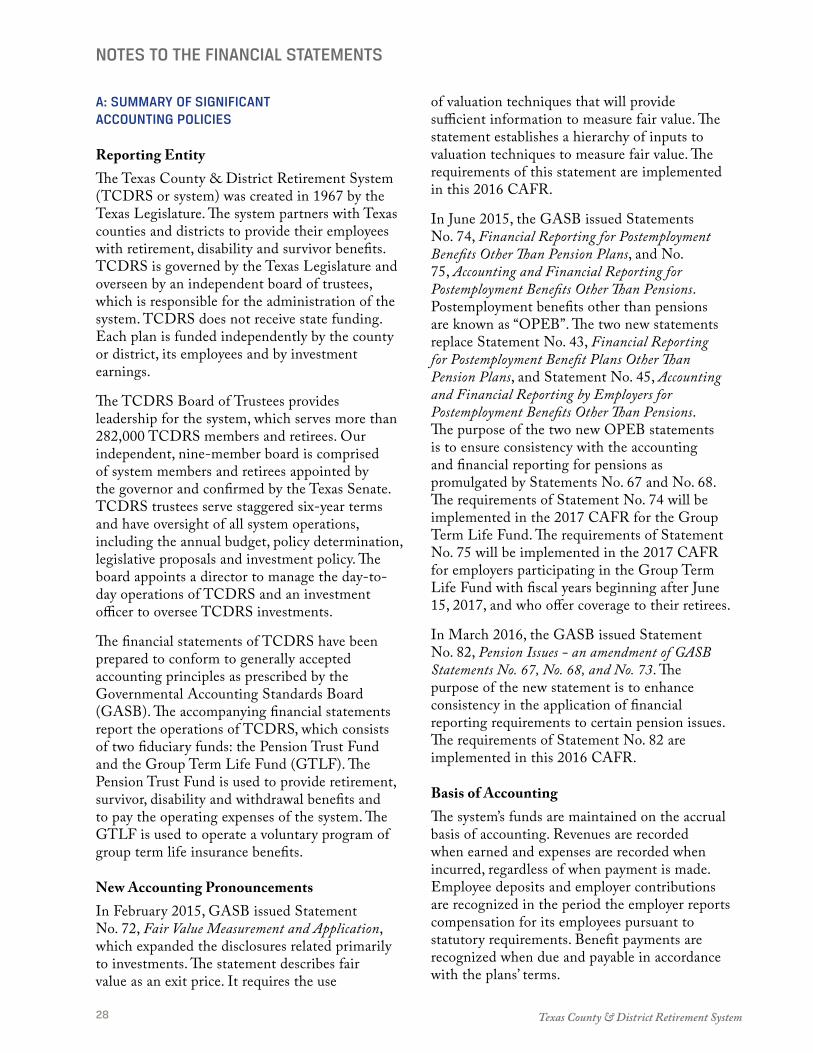
Deductions for benefits paid and withdrawals for 2016 were $1 .24 billion, a 7 .9% increase over the previous year . These deductions for 2015 were $1 .15 billion, a 10 .0% increase over 2014, and in 2014, these deductions were $1 .05 billion, a 7 .8% increase over 2013 . Higher deductions in 2016 and 2015 were due to several factors, including increases in the number of retiree and beneficiary accounts in 2016 (a 6 .4% increase) and in 2015 (a 6 .0% increase) along with higher average benefits . Withdrawals decreased in 2016 and were flat in 2015 .
OTHER CURRENTLY KNOWN INFORMATION: PENSION TRUST FUND
TCDRS’ investment return for 2016 was 7 .5%, net of all fees, which trailed its policy benchmark return of 7 .9% by 0 .4% .
FINANCIAL ANALYSIS: GROUP TERM LIFE FUND (GTLF)
The GTLF provides an optional program of group term life insurance for the employees and, if covered, retirees of electing employers . An actuarial valuation is performed annually to determine employers’ premium rates and to maintain adequate funding over the long term . Based on actuarial analysis, the amount of fiduciary net position is expected to be sufficient to cover any adverse experience that may occur .
Summary information about fiduciary net position and the changes in fiduciary net position showing comparative detail for 2016, 2015 and 2014 is presented on the next page .
The net position restricted for insurance benefits at year end 2016 was $33 .6 million, an increase of $4 .0 million (13 .4%) over the 2015 amount . The increase
BENEFIT DEDUCTIONS($ Millions)
$1,400
$1,200
$1,000
$ 800
$ 600
$ 400
$ 200
$ 0
Benefits Paid Withdrawals
2014 2015 2016
$1,242

2016 Comprehensive Annual Financial Report 25
FINA
NC
IAL
SUMMARY INFORMATION ABOUT FIDUCIARY NET POSITION
Group Term Life Fund
Dec. 31, 2016 – 2015 2015 – 2014 2016 2015 2014 $ Change % Change $ Change % Change
Total Assets $ 33,804,538 $ 29,918,402 $ 26,793,739 $ 3,886,136 13.0% $ 3,124,663 11.7%
Total Liabilities 159,022 244,338 371,046 (85,316) (34.9) (126,708) (34.1)
Net Position Restricted for Benefits $ 33,645,516 $ 29,674,064 $ 26,422,693 $ 3,971,452 13.4% $ 3,251,371 12.3%
SUMMARY INFORMATION ABOUT CHANGES IN FIDUCIARY NET POSITION
Group Term Life Fund
Years Ended Dec. 31, 2016 – 2015 2015 – 2014 2016 2015 2014 $ Change % Change $ Change % Change
Additions
Employer Premiums $ 4,962,423 $ 4,766,129 $ 4,510,866 $ 196,294 4.1% $ 255,263 5.7%
Income Allocation from Pension Trust Fund 2,132,226 1,889,834 1,738,911 242,392 12.8 150,923 8.7
Total Additions 7,094,649 6,655,963 6,249,777 438,686 6.6 406,186 6.5
Deductions
Insurance Benefits 3,123,197 3,404,592 4,637,239 (281,395) (8.3) (1,232,647) (26.6)
Total Deductions 3,123,197 3,404,592 4,637,239 (281,395) (8.3) (1,232,647) (26.6)
Net Increase in Fiduciary Net Position 3,971,452 3,251,371 1,612,538 720,081 22.1 1,638,833 101.6
Net Position Restricted for Benefits $ 33,645,516 $ 29,674,064 $ 26,422,693 $ 3,971,452 13.4% $ 3,251,371 12.3%
MANAGEMENT’S DISCUSSION AND ANALYSIS
is due to an interest allocation of $2 .1 million, along with a $1 .8 million increase in operating income (higher employer premiums than insurance benefits) . For the year ended 2016, employer premiums rose $0 .2 million (4 .1%), while insurance benefits declined by $0 .3 million (8 .3%) related to fewer active members having claims (down 14%), although their claims were for a higher average benefit (up 5%) .
At year end 2015, the net position restricted for insurance benefits was $29 .7 million, which was an increase of $3 .3 million (12 .3%) over the 2014 amount . For the year ended 2015, employer premiums rose by $0 .3 million while insurance benefits declined by $1 .2 million .
REQUESTS FOR INFORMATION
This annual report is designed to provide a general overview of TCDRS’ finances . Questions concerning any of the information provided in this report or requests for additional information should be addressed to TCDRS, Finance Division, P .O . Box 2034, Austin, Texas 78768-2034 .

Texas County & District Retirement System26
BASIC FINANCIAL STATEMENTS
STATEMENTS OF FIDUCIARY NET POSITION
Dec. 31, 2016 Dec. 31, 2015
Pension Trust Group Term Pension Trust Group Term Fund Life Fund Total Fund Life Fund Total
ASSETS
Cash and Cash Equivalents $ 25,415,477 $ — $ 25,415,477 $ 25,123,259 $ — $ 25,123,259 Receivables:
Contributions 114,372,139 — 114,372,139 104,566,054 — 104,566,054
Investment Interest and Dividends 19,689,461 — 19,689,461 16,004,403 — 16,004,403
Securities-Lending Interest 142,091 — 142,091 176,733 — 176,733
Foreign Currency & Exchange Contracts — — — 501,140 — 501,140
Employer Premiums — 294,806 294,806 — 243,435 243,435
Other 189,378 — 189,378 176,581 — 176,581
Total Receivables 134,393,069 294,806 134,687,875 121,424,911 243,435 121,668,346
Prepaid Expenses and Other Assets 4,923,365 — 4,923,365 1,994,614 — 1,994,614
Investments, at Fair Value:
U.S. Equities 4,415,816,725 — 4,415,816,725 3,915,643,420 — 3,915,643,420
International Equities 4,468,963,509 — 4,468,963,509 4,661,048,923 — 4,661,048,923
Global Equities 532,580,995 — 532,580,995 512,500,022 — 512,500,022
Hedge Funds 6,158,219,643 — 6,158,219,643 6,188,413,589 — 6,188,413,589
High-Yield Investments 3,084,561,022 — 3,084,561,022 3,421,841,960 — 3,421,841,960
Private Equity 3,100,313,544 — 3,100,313,544 2,568,020,567 — 2,568,020,567
REITs 811,874,484 — 811,874,484 772,654,712 — 772,654,712
Master Limited Partnerships 567,543,856 — 567,543,856 472,358,195 — 472,358,195
Private Real Estate Partnerships 572,533,783 — 572,533,783 491,450,067 — 491,450,067
Commodities 540,289,650 — 540,289,650 246,097,341 — 246,097,341
TIPS 508,931,316 — 508,931,316 48,642,878 — 48,642,878
Investment-Grade Bonds 987,974,697 — 987,974,697 950,888,291 — 950,888,291
Cash and Cash Equivalents 413,319,532 — 413,319,532 168,076,759 — 168,076,759
Total Investments 26,162,922,756 — 26,162,922,756 24,417,636,724 — 24,417,636,724
Invested Securities-Lending Collateral 4,930,942 — 4,930,942 39,219,985 — 39,219,985
Funds Held by Pension Trust Fund — 33,509,732 33,509,732 — 29,674,967 29,674,967
Capital Assets, Net 20,790,181 — 20,790,181 18,918,548 — 18,918,548
Total Assets 26,353,375,790 33,804,538 26,387,180,328 24,624,318,041 29,918,402 24,654,236,443
LIABILITIES
Accounts and Investments Payable 27,786,215 — 27,786,215 25,745,421 — 25,745,421
Insurance Benefits Payable — 159,022 159,022 — 244,338 244,338
Funds Held for Group Term Life Fund 33,509,732 — 33,509,732 29,674,967 — 29,674,967
Securities-Lending Collateral 4,930,942 — 4,930,942 39,219,985 — 39,219,985
Total Liabilities 66,226,889 159,022 66,385,911 94,640,373 244,338 94,884,711
Net Position Restricted for Benefits $ 26,287,148,901 $ 33,645,516 $ 26,320,794,417 $ 24,529,677,668 $ 29,674,064 $ 24,559,351,732
See accompanying Notes to the Financial Statements.
2016 Comprehensive Annual Financial Report 27
FINA
NC
IAL
BASIC FINANCIAL STATEMENTS
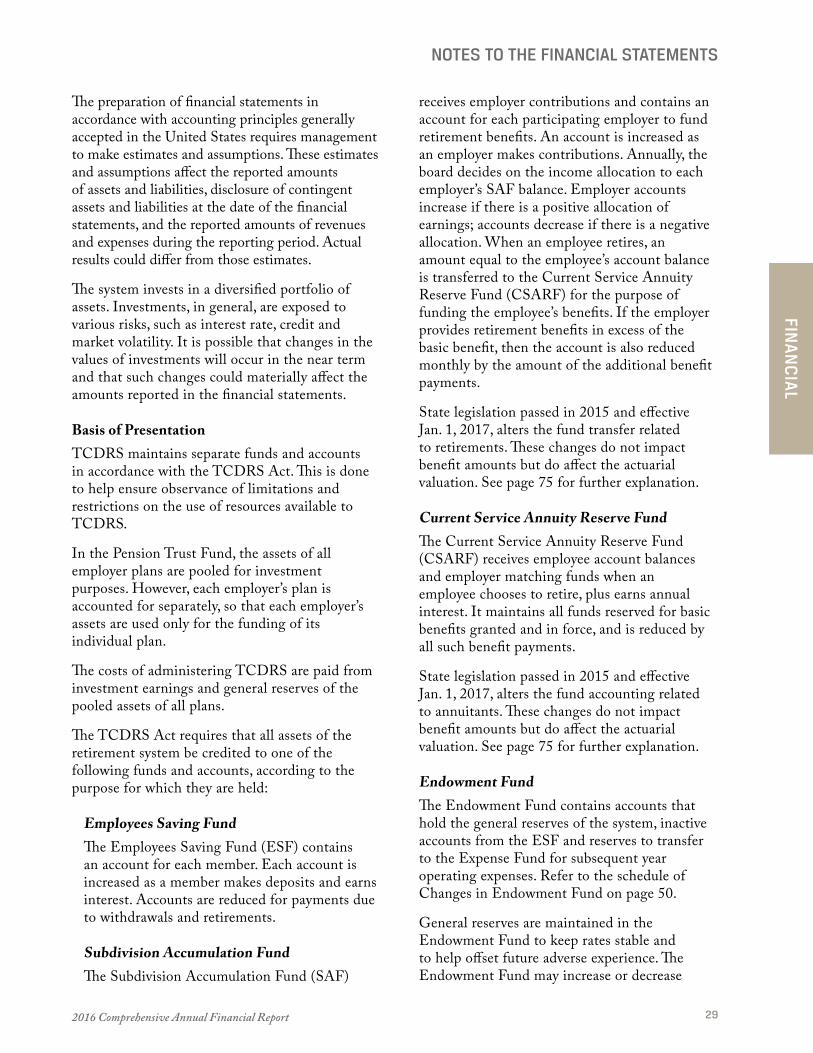
STATEMENTS OF CHANGES IN FIDUCIARY NET POSITION
Year Ended Dec. 31, 2016 Year Ended Dec. 31, 2015
Pension Trust Group Term Pension Trust Group Term Fund Life Fund Total Fund Life Fund Total
ADDITIONS
Contributions and Deposits
Employee Deposits $ 432,765,143 $ - $ 432,765,143 $ 414,806,917 $ - $ 414,806,917
Employer Contributions 771,701,126 - 771,701,126 743,149,234 - 743,149,234
Employer Premiums - 4,962,423 4,962,423 - 4,766,129 4,766,129
Total 1,204,466,269 4,962,423 1,209,428,692 1,157,956,151 4,766,129 1,162,722,280
Investment Income
From Investment Activities
Net Appreciation (Depreciation) in Fair Value of Investments 1,741,570,984 - 1,741,570,984 (229,283,232) - (229,283,232)
Interest and Dividends 111,463,937 - 111,463,937 96,120,797 - 96,120,797
Total Investment Activity Income (Loss) 1,853,034,921 - 1,853,034,921 (133,162,435) - (133,162,435)
Less Investment Activity Expenses 38,694,492 - 38,694,492 41,601,487 - 41,601,487
Net Income (Loss) from Investment Activities 1,814,340,429 - 1,814,340,429 (174,763,922) - (174,763,922)
From Securities-Lending Activities
Securities-Lending Income 2,362,319 - 2,362,319 2,144,444 - 2,144,444
Less Securities-Lending Expenses:
Borrower Rebates and Agent Fees 126,365 - 126,365 19,050 - 19,050
Net Income from Securities-Lending Activities 2,235,954 - 2,235,954 2,125,394 - 2,125,394
Total Net Investment Income (Loss) 1,816,576,383 - 1,816,576,383 (172,638,528) - (172,638,528)
Building Operations and Miscellaneous Income 1,858,748 - 1,858,748 2,475,483 - 2,475,483
Income Allocation from Pension Trust Fund - 2,132,226 2,132,226 - 1,889,834 1,889,834
Total Additions 3,022,901,400 7,094,649 3,029,996,049 987,793,106 6,655,963 994,449,069
DEDUCTIONS
Benefits Paid 1,165,122,756 - 1,165,122,756 1,069,109,567 - 1,069,109,567
Withdrawals 76,582,913 - 76,582,913 82,058,823 - 82,058,823
Interest Allocation to Group Term Life Fund 2,132,226 - 2,132,226 1,889,834 - 1,889,834
Insurance Benefits - 3,123,197 3,123,197 - 3,404,592 3,404,592
Administrative and Building Operations Expenses 21,592,272 21,592,272 20,215,681 20,215,681
Total Deductions 1,265,430,167 3,123,197 1,268,553,364 1,173,273,905 3,404,592 1,176,678,497
Net Increase (Decrease) in Net Position 1,757,471,233 3,971,452 1,761,442,685 (185,480,799) 3,251,371 (182,229,428)
Net Position Restricted for Benefits:
Beginning of Period, Jan. 1 24,529,677,668 29,674,064 24,559,351,732 24,715,158,467 26,422,693 24,741,581,160
End of Period, Dec. 31 $ 26,287,148,901 $ 33,645,516 $ 26,320,794,417 $ 24,529,677,668 $ 29,674,064 $ 24,559,351,732
See accompanying Notes to the Financial Statements.
Texas County & District Retirement System28
NOTES TO THE FINANCIAL STATEMENTS
A: SUMMARY OF SIGNIFICANT ACCOUNTING POLICIES
Reporting EntityThe Texas County & District Retirement System (TCDRS or system) was created in 1967 by the Texas Legislature . The system partners with Texas counties and districts to provide their employees with retirement, disability and survivor benefits . TCDRS is governed by the Texas Legislature and overseen by an independent board of trustees, which is responsible for the administration of the system . TCDRS does not receive state funding . Each plan is funded independently by the county or district, its employees and by investment earnings .
The TCDRS Board of Trustees provides leadership for the system, which serves more than 282,000 TCDRS members and retirees . Our independent, nine-member board is comprised of system members and retirees appointed by the governor and confirmed by the Texas Senate . TCDRS trustees serve staggered six-year terms and have oversight of all system operations, including the annual budget, policy determination, legislative proposals and investment policy . The board appoints a director to manage the day-to-day operations of TCDRS and an investment officer to oversee TCDRS investments .
The financial statements of TCDRS have been prepared to conform to generally accepted accounting principles as prescribed by the Governmental Accounting Standards Board (GASB) . The accompanying financial statements report the operations of TCDRS, which consists of two fiduciary funds: the Pension Trust Fund and the Group Term Life Fund (GTLF) . The Pension Trust Fund is used to provide retirement, survivor, disability and withdrawal benefits and to pay the operating expenses of the system . The GTLF is used to operate a voluntary program of group term life insurance benefits .
New Accounting PronouncementsIn February 2015, GASB issued Statement No . 72, Fair Value Measurement and Application, which expanded the disclosures related primarily to investments . The statement describes fair value as an exit price . It requires the use
of valuation techniques that will provide sufficient information to measure fair value . The statement establishes a hierarchy of inputs to valuation techniques to measure fair value . The requirements of this statement are implemented in this 2016 CAFR .
In June 2015, the GASB issued Statements No . 74, Financial Reporting for Postemployment Benefits Other Than Pension Plans, and No . 75, Accounting and Financial Reporting for Postemployment Benefits Other Than Pensions . Postemployment benefits other than pensions are known as “OPEB” . The two new statements replace Statement No . 43, Financial Reporting for Postemployment Benefit Plans Other Than Pension Plans, and Statement No . 45, Accounting and Financial Reporting by Employers for Postemployment Benefits Other Than Pensions . The purpose of the two new OPEB statements is to ensure consistency with the accounting and financial reporting for pensions as promulgated by Statements No . 67 and No . 68 . The requirements of Statement No . 74 will be implemented in the 2017 CAFR for the Group Term Life Fund . The requirements of Statement No . 75 will be implemented in the 2017 CAFR for employers participating in the Group Term Life Fund with fiscal years beginning after June 15, 2017, and who offer coverage to their retirees .
In March 2016, the GASB issued Statement No . 82, Pension Issues - an amendment of GASB Statements No. 67, No. 68, and No. 73 . The purpose of the new statement is to enhance consistency in the application of financial reporting requirements to certain pension issues . The requirements of Statement No . 82 are implemented in this 2016 CAFR .
Basis of AccountingThe system’s funds are maintained on the accrual basis of accounting . Revenues are recorded when earned and expenses are recorded when incurred, regardless of when payment is made . Employee deposits and employer contributions are recognized in the period the employer reports compensation for its employees pursuant to statutory requirements . Benefit payments are recognized when due and payable in accordance with the plans’ terms .
2016 Comprehensive Annual Financial Report 29
FINA
NC
IAL
NOTES TO THE FINANCIAL STATEMENTS
The preparation of financial statements in accordance with accounting principles generally accepted in the United States requires management to make estimates and assumptions . These estimates and assumptions affect the reported amounts of assets and liabilities, disclosure of contingent assets and liabilities at the date of the financial statements, and the reported amounts of revenues and expenses during the reporting period . Actual results could differ from those estimates .
The system invests in a diversified portfolio of assets . Investments, in general, are exposed to various risks, such as interest rate, credit and market volatility . It is possible that changes in the values of investments will occur in the near term and that such changes could materially affect the amounts reported in the financial statements .
Basis of PresentationTCDRS maintains separate funds and accounts in accordance with the TCDRS Act . This is done to help ensure observance of limitations and restrictions on the use of resources available to TCDRS .
In the Pension Trust Fund, the assets of all employer plans are pooled for investment purposes . However, each employer’s plan is accounted for separately, so that each employer’s assets are used only for the funding of its individual plan .
The costs of administering TCDRS are paid from investment earnings and general reserves of the pooled assets of all plans .
The TCDRS Act requires that all assets of the retirement system be credited to one of the following funds and accounts, according to the purpose for which they are held:
Employees Saving FundThe Employees Saving Fund (ESF) contains an account for each member . Each account is increased as a member makes deposits and earns interest . Accounts are reduced for payments due to withdrawals and retirements .
Subdivision Accumulation FundThe Subdivision Accumulation Fund (SAF)
receives employer contributions and contains an account for each participating employer to fund retirement benefits . An account is increased as an employer makes contributions . Annually, the board decides on the income allocation to each employer’s SAF balance . Employer accounts increase if there is a positive allocation of earnings; accounts decrease if there is a negative allocation . When an employee retires, an amount equal to the employee’s account balance is transferred to the Current Service Annuity Reserve Fund (CSARF) for the purpose of funding the employee’s benefits . If the employer provides retirement benefits in excess of the basic benefit, then the account is also reduced monthly by the amount of the additional benefit payments .
State legislation passed in 2015 and effective Jan . 1, 2017, alters the fund transfer related to retirements . These changes do not impact benefit amounts but do affect the actuarial valuation . See page 75 for further explanation .
Current Service Annuity Reserve FundThe Current Service Annuity Reserve Fund (CSARF) receives employee account balances and employer matching funds when an employee chooses to retire, plus earns annual interest . It maintains all funds reserved for basic benefits granted and in force, and is reduced by all such benefit payments .
State legislation passed in 2015 and effective Jan . 1, 2017, alters the fund accounting related to annuitants . These changes do not impact benefit amounts but do affect the actuarial valuation . See page 75 for further explanation .
Endowment FundThe Endowment Fund contains accounts that hold the general reserves of the system, inactive accounts from the ESF and reserves to transfer to the Expense Fund for subsequent year operating expenses . Refer to the schedule of Changes in Endowment Fund on page 50 .
General reserves are maintained in the Endowment Fund to keep rates stable and to help offset future adverse experience . The Endowment Fund may increase or decrease
Texas County & District Retirement System30
NOTES TO THE FINANCIAL STATEMENTS
based on allocation decisions to or from the general reserves by the Board of Trustees .
Income FundAll investment income is credited to the Income Fund . It accounts for investment earnings and expenses, and annual allocations to other funds . The fund is reduced by investment expenses and by the statutory allocation of interest to the ESF, CSARF and GTLF . In addition, the board makes an allocation to the SAF .
If any excess exists after all allocations are made, the remainder is transferred to the Endowment Fund . Refer to the Changes in Income Fund schedule on page 51 for additional information .
Expense FundTCDRS pays administrative and investment operating expenses from this fund . As mentioned in the Endowment Fund and the Income Fund, operating expenses are financed from general reserves at the beginning of the year, and the Income Fund finances the investment expenses by reimbursing the Expense Fund .
The Group Term Life Fund reports the net position available to pay insurance benefits for covered participants . Premiums paid by employers and an annual allocation are added to the fund, while insurance benefits are paid from the fund .
InvestmentsInvestments consist of a diversified portfolio, including equities, hedge funds, high-yield investments, private equity, real assets and investment-grade bonds along with cash and cash equivalents . The portfolio is further diversified within each of the asset classes .
Investment purchases and sales are recorded as of their trade dates . Investments are reported at fair value, and are primarily valued on the basis of market valuations provided by ICE Data Services . Government securities (including TIPS) and other fixed-income securities are priced using a matrix methodology . REIT investments are priced using their primary exchange closing price . U .S . and international commingled equity investments, commodities, hedge fund investments, private
equity and private real estate partnerships are valued based on shares held in the fund times a unit price or on the net asset value (NAV) provided by the respective investment company or partnership . Security transactions and any resulting gains or losses are accounted for by the specific identification method on a trade-date basis .
For the years ended Dec . 31, 2016 and 2015, the annual money-weighted rate of return on investments, net of investment expenses, was 7 .48% and -0 .66%, respectively . The money-weighted rate of return expresses investment performance, net of investment expenses, adjusted for the changing amounts actually invested . A table of the annual money-weighted rates of return for the 10-year period ended Dec . 31, 2016, is located in the Required Supplementary Information on page 47 .
Capital AssetsCapital assets, which consist of land, building and improvements, software, and equipment and furniture are reported at historical cost and are depreciated on a straight-line basis over the estimated useful lives . TCDRS has elected to capitalize items that individually exceed $5,000 . The estimated useful lives for building and improvements range from 5 to 40 years, for furniture and components from 3 to 10 years, for office equipment 3 to 5 years, for computer software 3 to 5 years, and for tenant improvements 2 to 20 years .
B: PLAN DESCRIPTION
Pension Trust FundTCDRS is a statewide, agent multiple-employer, public-employee retirement system . The system serves 738 participating counties and districts throughout Texas . Each employer maintains its own customized plan of benefits . Plan provisions are adopted by the governing body of each employer, within the options available in the TCDRS Act . Because of that, employers have the flexibility and local control to select benefits and pay for those benefits based on their needs and budgets .
Each employer has a defined benefit plan that functions similarly to a cash balance plan . The

2016 Comprehensive Annual Financial Report 31
FINA
NC
IAL
NOTES TO THE FINANCIAL STATEMENTS
assets of the plans are pooled for investment purposes, but each employer’s plan assets may be used only for the payment of benefits to the members of that employer’s plan . In accordance with Texas law, it is intended that the pension plan be construed and administered in a manner that the retirement system will be considered qualified under Section 401(a) of the Internal Revenue Code . All employees (except temporary staff ) of a participating employer must be enrolled in the plan . Membership in TCDRS as of Dec . 31, 2016 and 2015 is summarized in Table 1 .
BenefitsA percentage of each employee’s paycheck is deposited into his or her TCDRS account . That percentage (from 4% to 7%) is set by the employer .
The employee’s savings grow, by law, at a rate of 7%, compounded annually . The employer selects a matching rate — at least “dollar for dollar,” up to $2 .50 per $1 .00 in the employee’s account . At retirement, the employee’s account balance is combined with employer matching and converted into a lifetime monthly benefit .
Employees receive a month of service time for each month that they make a deposit into their account . The amount of service an employee needs to earn a future benefit is called the vesting requirement . When an employee is vested, they have the right to a monthly benefit, which includes employer matching, at age 60 or older . Employers may choose 5-, 8- or 10-year vesting . In addition, employees may retire before age 60 if they meet one of the following requirements, set by the employer:
• “Rule of ” eligibility: Under these rules, a vested employee can retire if their age plus years of service time add up to at least 75 or 80 .
• 20-year or 30-year retirement at any age: This lets employees retire when they have at least 20 or 30 years of service time .
Retirees elect to receive their lifetime benefit by choosing one of seven actuarially equivalent payment options, which are detailed on page 75 .
Employers may elect to provide other optional benefits . Prior service gives employees monetary credit for time worked for an organization before it joined the system . Buybacks allow current employees to re-establish a closed TCDRS account from previous service with an employer . Partial lump-sum payments at retirement allow employees to withdraw part of their TCDRS account balance as a lump sum at retirement with a reduced monthly benefit .
In addition, an employer may choose to adopt a cost-of-living adjustment (COLA) for its
TABLE 1: MEMBERSHIP
Dec. 31,
Pension Trust Fund: 2016 2015
Inactive Plan Members (or Beneficiaries) Currently Receiving Benefits 59,985 56,362
Inactive Plan Members Entitled to But Not Yet Receiving Benefits Accounts: Vested 20,711 19,735 Nonvested 70,217 65,673
Total 90,928 85,408
Active Plan Members’ Accounts: Vested 65,253 63,869 Nonvested 65,887 65,348
Total 131,140 129,217
Number of Plans: Counties 253 252 Districts 485 449 Inactive Plan 1 1
Total 739 702
Group Term Life Fund:
Annuitants 8,195 7,652
Terminated Employees: Vested 6,205 5,951
Current Employees: Vested 16,857 16,615 Nonvested 17,943 17,933
Total 34,800 34,548
Number of Plans: Counties 125 126 Districts 187 172
Total 312 298

Texas County & District Retirement System32
NOTES TO THE FINANCIAL STATEMENTS
retirees . This adjusts retiree benefits to restore purchasing power lost due to the effects of inflation .
ContributionsA combination of three elements funds each employer’s plan: employee deposits, employer contributions and investment income .
• The deposit rate for employees is 4%, 5%, 6% or 7% of compensation, as adopted by the employer’s governing body .
• Participating employers are required, by law, to contribute at actuarially determined rates, which are determined annually .
• Investment income funds a large part of the benefits employees earn .
Employers have the option of paying more than the required contribution rate each year . Additional contributions can help employers “pre-fund” benefit increases, such as a cost-of-living adjustment to retirees, and they can be used to help offset or mitigate future increases in the required rate due to negative plan experience . There are two approaches for making additional contributions: (a) paying an elected contribution rate higher than the required rate and (b) making a lump-sum contribution to the employer account .
Administrative costs of TCDRS are financed through the system’s general reserves, which are part of the Endowment Fund .
Group Term Life Fund (GTLF)TCDRS also administers the Group Term Life program, a group term life insurance . The fund for this benefit is a separate trust administered by the board . The fund receives monthly participating employers’ premiums and pays benefits when due . The obligations of the program are payable only from this fund, and are not an obligation of, or a claim against, the TCDRS Pension Trust Fund . The fund’s assets are pooled with those of the Pension Trust Fund under provisions of the TCDRS Act and annually receive an allocation of income based on the fund value . This optional program provides group term life insurance coverage to currently eligible employees, and if elected by employers, to retirees . Participation in
the Group Term Life program as of Dec . 31, 2016 and 2015 is summarized in Table 1 on page 31 .
BenefitsCurrent employees of participating employers are insured for an amount equivalent to the employee’s current annual compensation . Employers may also choose to cover retirees . Retirees are insured for $5,000 . Life insurance proceeds are payable as a lump sum . The coverage provided to retirees is a postemployment benefit other than pension benefits (OPEB) .
ContributionsEach participating employer contributes to the Group Term Life program at a contractually required rate . An annual actuarial valuation is performed and the contractual rate is equal to the cost of providing one-year term life insurance . The premium rate is expressed as a percentage of the covered payroll of members employed by the participating employer . There is a one-year delay between the actuarial valuation that serves as the basis for the employer contribution rate and the calendar year when the rate goes into effect .
The Group Term Life program is voluntary and employers can cease participation at any time . Therefore, the funding policy of the program is to ensure that adequate resources are available to meet all insurance benefit payments for the upcoming year . It is not the intent of the funding policy to pre-fund retiree term life insurance during employees’ entire careers .
Funded Status and Funding ProgressAs of Dec . 31, 2016, the most recent actuarial valuation date, the Group Term Life program was 130 .2% funded . The actuarial accrued liability for benefits was $25 .8 million, and the actuarial value of assets was $33 .6 million, resulting in an Overfunded Actuarial Accrued Liability (OAAL) of $7 .8 million . The covered payroll (annual payroll of active participants covered by the program) was $1 .6 billion and the ratio of the OAAL to the covered payroll was 0 .5% .
Actuarial valuations of an ongoing plan involve

2016 Comprehensive Annual Financial Report 33
FINA
NC
IAL
NOTES TO THE FINANCIAL STATEMENTS
estimates of the value of reported amounts and assumptions about the probability of occurrence of events far into the future . Examples include assumptions about future employment and mortality . Amounts determined regarding the funded status of the plan and the annual required contributions of the employer are subject to continual revision as actual results are compared with past expectations and new estimates are made about the future .
Projections of benefits for financial reporting purposes are based on the substantive plan (the plan as understood by the employer and the plan members) and include the types of benefits provided at the time of each valuation . The actuarial methods and assumptions used include techniques that are designed to reduce the effects of short-term volatility in actuarial accrued liabilities and the actuarial value of assets, consistent with the long-term perspective of the calculations .
Additional information as of the latest actuarial valuation for the GTLF follows:
Valuation Date: Dec . 31, 2016Actuarial Cost Method: Active Insurance Benefits Unit credit; determining one-year term cost Retiree Insurance Benefits Entry ageAmortization Method: Level percent, openRemaining Amortization Period: 30 yearsAsset Valuation Method: Fund value1
Actuarial Assumptions: Investment Return 7 .0%1
Inflation 3 .0% 1 The fund’s assets are pooled with those of the Pension
Trust Fund under provisions of the TCDRS Act . The fund receives an annual earnings allocation of 7% based on the fund value .
C: TCDRS AS EMPLOYER
Pension Trust FundTCDRS, as an employer, participates in the Texas County & District Retirement System .
A brief description of benefit terms:
1 . All full- and part-time non-temporary employ-ees participate in the plan, regardless of the number of hours they work in a year . Employ-ees in a temporary position are not eligible for membership .
2 . The plan provides retirement, disability and sur-vivor benefits .
3 . TCDRS is a savings-based plan . For TCDRS, as an employer, 7% of each employee’s pay is deposited into his or her TCDRS account . By law, employee accounts earn 7% interest on the beginning of year balances annually . At retire-ment, the account is matched at an employer set percentage (current match is 200%) and is then converted to an annuity .
4 . There are no automatic COLAs . Each year, TCDRS, as an employer, may elect an ad hoc COLA for its retirees . There are two COLA types, each limited by actual inflation .
5 . Benefit terms are established under the TCDRS Act . They may be amended as of Jan . 1 each year, but must remain in conformity with the Act .
TCDRS, as an employer, has a contribution rate that is calculated annually on an actuarial basis, although the employer may elect to contribute at a higher rate . The contribution rate is based on the TCDRS funding policy adopted by the TCDRS Board of Trustees and must conform with the TCDRS Act . Contributions to the pension plan from TCDRS, as an employer, for 2016, were based on the elected rate of 10 .5%, plus a one-time lump-sum amount of $500,000 .
Postemployment Benefits Other Than Pensions
Group Term Life FundTCDRS participates in the Group Term Life program . For a general explanation of the Group Term Life program, turn to page 32 . TCDRS provides coverage to current eligible employees and to retired employees .
TCDRS, as an employer, contributes to the Group Term Life program at a contractually required rate .
TCDRS’ contributions, as an employer, to the Group Term Life program for the years ended
Texas County & District Retirement System34
NOTES TO THE FINANCIAL STATEMENTS
Dec . 31, 2016, 2015 and 2014, were $27,497, $24,412 and $22,215, respectively, which equaled the required contributions each year .
TCDRS Bridge Program Health Reimburse-ment ArrangementTCDRS adopted the TCDRS Bridge Program Health Reimbursement Arrangement (Bridge Program) for its employees . The program is open to all former TCDRS employees who meet all three conditions: (a) employed with TCDRS on or after Jan . 1, 2007; (b) accumulated at least 10 years of full-time employment with TCDRS; and (c) an active TCDRS employee on or after attaining age 58½ .
The Bridge Program is a self-insured medical expense reimbursement plan that provides a maximum credit of $550 per month for 60 consecutive months . Coverage begins on the first day of the month immediately after the eligible former employee reaches age 60 or has separated from employment with TCDRS, whichever occurs later .
As of Jan . 1, 2016, the most recent actuarial valuation date, the Bridge Program was 0% funded . The actuarial accrued liability was $776,753 and the actuarial valuation of assets was $0, resulting in a UAAL of $776,753 . Based on an annual covered payroll of $10,998,211, the UAAL as a percentage of covered payroll was 7 .1% . The annual OPEB cost for 2016 was $98,350 and TCDRS’ contributions as an employer in 2016 were $36,142; the annual OPEB cost for 2015 was $94,053 and TCDRS’ contributions as an employer in 2015 were $32,276; and the annual OPEB cost for 2014 was $99,173, and TCDRS’ contributions as an employer in 2014 were $24,750 . The resulting net OPEB obligation at Dec . 31, 2016 was $550,926 .
The actuarial cost method used was the projected unit credit with a level dollar open amortization method and the amortization period of 15 years . The discount rate used was 3 .5% .
Deferred CompensationThe employees of TCDRS may participate in a deferred compensation plan created in accordance with Internal Revenue Code Section 457 . This
plan, available to all employees of TCDRS, permits the deferral of a portion of their salary until future years . The deferred compensation is not available to the employees until termination, retirement, death or certain unforeseeable emergencies . All compensation deferred under the plan is held by a custodian for the exclusive benefit of participants and beneficiaries .
D: CASH AND CASH EQUIVALENTS
Cash and cash equivalents consist of funds on deposit with a financial institution in interest-bearing demand deposit accounts . They are invested on an overnight basis (sweep) in a U .S . dollar-denominated investment under a repurchase agreement . The funds are collateralized at 102% using U .S . Treasury, government or agency securities . Cash held in (1) demand deposit accounts, (2) the overnight sweep, and (3) the JPMorgan U .S . Government Money Market Fund (an open-end institutional money market fund) is available to pay benefits, operational expenses and funds awaiting transfer to investment management .
In December 2016, changes were implemented in which the demand deposit accounts were no longer interest bearing and invested on an overnight basis (sweep), but whose balances provided earnings credits toward bank fees . Funds in excess of the revised collateral account ($30 .0 million collateralized with U .S . Agency securities) are transferred into the JPMorgan U .S . Government Money Market Fund, referred to above .
Custodial credit risk is the risk that in the event of a bank failure, the system’s deposits may not be returned to it . A discussion of custodial credit risk pertaining to cash and cash equivalents can be found in Note G, beginning on page 37 .
E: INVESTMENTS
Investment decisions of the board are subject to Section 67, Article XVI of the Texas Constitution, and to the applicable statutory provisions of the Texas Trust Code that provide for a “prudent person” standard of care . Investment authorization is restricted by the investment policy adopted by the board that emphasizes the importance

2016 Comprehensive Annual Financial Report 35
FINA
NC
IAL
NOTES TO THE FINANCIAL STATEMENTS
of a long-term investment philosophy with minimization of risk while targeting a long-term investment return of 8% . The board has determined that a diversified portfolio will offer the best opportunity to produce the desired 8% investment return . Accordingly, the TCDRS investment portfolio now includes investments in the following asset classes:
Equity HoldingsThe system’s U .S . equities and a portion of its developed international and emerging market equities are passively managed in commingled index funds . The remaining developed international, emerging market and global equities are actively managed in commingled funds and one limited partnership .
Hedge FundsThe vehicles for hedge fund investments are typically commingled vehicles, such as limited partnerships, limited liability companies or offshore corporations . At Dec . 31, 2016, the system’s hedge fund portfolio consisted of 31 partnerships with a fair value totaling $6 .16 billion .
High-Yield InvestmentsThe board has divided the high-yield asset class into four portions . The first portion, the high-yield bond portfolio, encompasses the portion of the U .S . corporate bond market that is rated below BBB- by S&P or below Baa3 by Moody’s . Accordingly, credit risks associated with these bonds are greater than risks with investment-grade bonds and have historically traded at yields of 3 .5% to 4 .5% above comparable
U .S . Treasury instruments . The second portion consists of distressed debt partnerships, which invest in securities of companies whose debt has declined in value because they are experiencing financial stress . Typical holdings are senior and subordinated debt instruments . The third portion consists of opportunistic credit partnerships that invest in securitized credit instruments made up of senior corporate bank loans and asset-backed credit investments secured by commercial and residential mortgages, car loans, and other types of assets . The fourth portion, direct lending partnerships, consists of privately originated debt made to small and medium-sized companies or to real estate investors in order to take advantage of dislocations in the capital markets . Table 2 lists the committed and unfunded capital to opportunistic credit, distressed debt and direct lending investments at Dec . 31, 2016 .
Private EquityTCDRS’ private equity investments consist of partnerships that (a) take public companies private in order to improve their operations and then resell them in the future; (b) invest in start-up companies with new ideas or technologies; (c) invest in both traditional and renewable energy discovery and production; and (d) invest in real estate . As of Dec . 31, 2016, TCDRS had committed $5 .70 billion of capital to 160 private equity partnerships .
Table 2 lists the committed and unfunded capital to private equity investments at Dec . 31, 2016 . During the first quarter of 2017, an additional $195 million has been committed to private equity partnerships .
TABLE 2: SCHEDULE OF UNFUNDED COMMITMENTS
Dec. 31, 2016
Total Unfunded Investment Category Commitment Commitment Fair Value
Opportunistic Credit $ 2,348,489,494 $ 248,411,776 $ 1,630,428,777
Distressed Debt 1,373,026,019 366,286,101 575,496,038
Direct Lending 1,005,959,750 541,404,813 471,306,988
Private Equity 5,703,831,022 2,343,195,531 3,100,313,544
Private Real Estate 1,425,642,690 712,519,444 572,533,783
Total Contingent Commitments $ 11,856,948,975 $ 4,211,817,665 $ 6,350,079,130
Texas County & District Retirement System36
NOTES TO THE FINANCIAL STATEMENTS
Real Assets• Real estate investment trusts (REITs) are com-
panies that own and operate income-producing real estate, such as commercial office build-ings, apartments, malls, warehouses and stor-age facilities . Under provisions of the U .S . tax law, if REITs pay out most of their income in dividends, they are not required to pay income taxes . Consequently, substantial amounts of in-come can be received from investing in REITs .
• Treasury Inflation-Protected Securities (TIPS) are issued by the U .S . Treasury and structured as a hedge against inflation . The principal value of the securities is adjusted based on changes in the consumer price index (CPI) . Interest payments are determined by multiplying a fixed coupon by the inflation-adjusted principal . The inflation-adjusted principal is payable at maturity .
• Commodities consist of investments in re-sources that can be either perishable (grains, sugar, etc .) or non-perishable (metals, energy, etc .) . Commodities provide protection against inflation and have low correlation to stocks and other asset classes .
• Private real estate partnerships acquire and operate commercial properties including of-fice buildings, apartments, hotels, malls and residential real estate . Private real estate invest-ments are illiquid and typically have expected holding periods of 10 to 12 years . As reported in Table 2, at Dec . 31, 2016, TCDRS had com-mitted $1 .43 billion to 29 private real estate partnerships .
• Master Limited Partnerships (MLPs) are pub-licly traded partnership interests authorized by Congress to encourage investment in domestic energy infrastructure . At the entity level, these interests are tax free provided that 90% of their income comes from natural resources such as oil, natural gas, coal, timber and other deplet-able resources .
Investment-Grade BondsThe investment-grade bond portfolio consists of debt instruments issued by the United States Treasury and governmental agencies, asset-backed securities, and corporate bonds that are rated investment grade by the major ratings agencies .
Additionally, this portfolio may contain minimal investments in short-term instruments, non-rated securities, private placement securities, convertible bonds and preferred stock .
The portfolio should exhibit an overall dollar-weighted average quality rating of AA with no investment rated lower than BBB- or equivalent as rated by Standard & Poor’s (S&P), Moody’s Investor Service or Fitch Investor’s Service at the time of purchase or, if not rated, be deemed by the manager to be of similar quality .
Cash and Cash EquivalentsThe TCDRS Board of Trustees may select one or more commercial banks, depository trust companies or other entities to serve as custodian or custodians of the system’s cash, cash equivalents and short-term investments, and may authorize the custodian to invest the cash in such short-term investments as the board determines . TCDRS has authorized its custodian to invest cash, on an overnight basis, in the custodian’s Collective Trust Government Short Term Investment Fund (STIF) . The investment objective of the STIF is to provide safety of principal, daily liquidity and competitive returns . The STIF owns high-quality debt instruments (which include U .S . government or U .S . government agencies, repurchase agreements, floating-rate notes, etc .) . At Dec . 31, 2016 the dollar-weighted average maturity of the STIF was 37 days with an average current yield of 0 .38% .
The investment officer manages cash in the STIF together with new contributions until they are allocated to a portfolio .
F: SECURITIES LENDING
State statutes and the board’s policies permit TCDRS to use its investments to enter into securities-lending transactions — loans of securities to broker-dealers and other entities in exchange for collateral with a simultaneous agreement to return the collateral for the same securities in the future . The system’s custodian, The Bank of New York Mellon Corp . (BNY Mellon), is engaged as the lending agent to lend securities from the system’s fixed-income portfolios for collateral of 102% of the fair value of the securities loaned .
2016 Comprehensive Annual Financial Report 37
FINA
NC
IAL
NOTES TO THE FINANCIAL STATEMENTS
Collateral, either cash or U .S . government securities, is initially pledged for the securities on loan and additional collateral is required from the borrower by the close of the next business day if its value falls to less than 100% of the fair value of the securities on loan . TCDRS does not have the ability to pledge or sell collateral securities unless the borrower defaults . At Dec . 31, 2016, BNY Mellon held $39,743,527 of non-cash collateral .
Cash collateral is invested in short-term fixed-income instruments in accordance with the system’s securities-lending guidelines . Table 3 lists the categories of collateral investments at Dec . 31, 2016 and 2015 .
At the end of years 2016 and 2015, TCDRS had no credit risk exposure to borrowers because the amounts the system owed to borrowers exceeded the amounts the borrowers owed to TCDRS . Contracts with the lending agents require the agents to indemnify TCDRS if the borrowers fail to return the securities (and if the collateral is inadequate to replace the securities on loan) or fail to pay TCDRS for income distributions while the securities are on loan . At Dec . 31, 2016 and 2015, the fair value of securities on loan was $43,726,236 and $108,404,001, respectively .
Additionally, TCDRS invests in two commingled domestic and international equity portfolios that participate in securities-lending programs managed by State Street Global Advisors . TCDRS receives a proportionate share of the securities-lending income generated from these activities .
G: DEPOSIT AND INVESTMENT RISK
Identification of credit risk, custodial credit risk, concentration of credit risk, interest rate risk and foreign currency risk is mandated by GASB Statement No . 40 .
Credit risk is the risk that an issuer of an investment will not fulfill its obligation to the holder of the investment . This is measured by the assignment of a rating by a nationally recognized statistical rating organization . The TIPS portfolio contains obligations of the U .S . government and is not considered to have credit risk . At both Dec . 31, 2016 and 2015, according to Standard and Poor’s (S&P) evaluations, the investment-grade bond portfolio exhibited an overall quality rating of AA- . The Bloomberg Barclays U .S . Aggregate Bond Index is the benchmark for performance measurement of the investment-grade bond portfolio . At Dec . 31, 2016 and 2015, the Bloomberg Barclays U .S . Aggregate Bond Index had an average S&P quality rating of AA- and AA, respectively .
At both Dec . 31, 2016 and 2015, according to S&P evaluations, the high-yield bond portfolio exhibited an overall quality rating of B+ . The Citigroup High-Yield Cash-Pay Capped Index is the benchmark for performance measurement of the high-yield bond portfolio . At both Dec . 31, 2016 and 2015, according to S&P evaluations, the benchmark exhibited an average quality rating of B+ .
The investment policy does not explicitly outline an acceptable level of credit risk for the investment-grade bond or high-yield bond portfolios, but the board’s adoption of their respective benchmark indices is an implicit adoption of the market risk inherent in these portfolios .
Table 4 lists the credit risk associated with the investment-grade bond portfolio and the high-yield investments portfolio .
At Dec . 31, 2016, according to Moody’s Investors Service evaluations, the BNY Mellon STIF contained short-term securities with quality ratings of P-1/P-2 (Prime-1 and Prime-2), which exhibit a superior ability for repayment of senior short-term debt obligations, and long-term
TABLE 3: INVESTED SECURITIES-LENDING COLLATERAL
Dec. 31,
Investment Type 2016 2015
Cash and Other Liquid Assets $ (13,734) $ (12,603)
Money Funds 446,000 5,214,000
Asset-Backed Securities 0 747
Agencies 0 0
Repurchase Agreements 4,498,676 30,017,728
Certificates of Deposit 0 0
Domestic Corporate Fixed-Income Securities 0 4,000,113
Total Invested Securities-Lending Collateral $ 4,930,942 $ 39,219,985
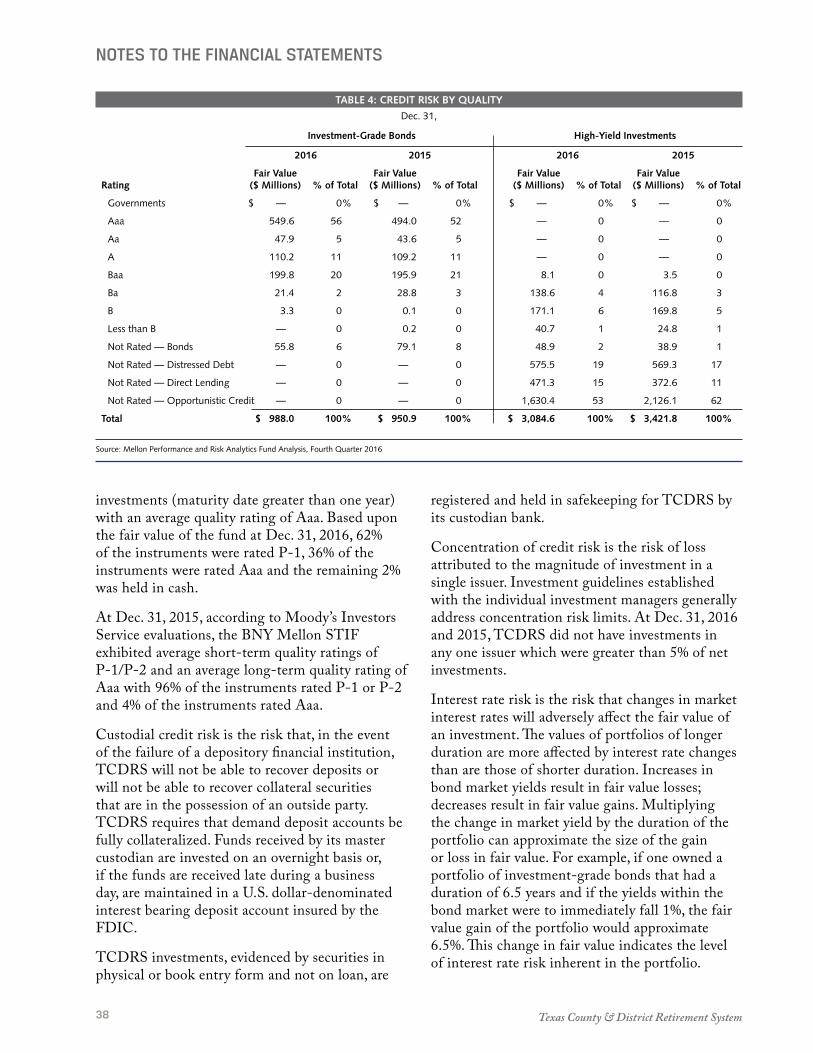
Texas County & District Retirement System38
NOTES TO THE FINANCIAL STATEMENTS
investments (maturity date greater than one year) with an average quality rating of Aaa . Based upon the fair value of the fund at Dec . 31, 2016, 62% of the instruments were rated P-1, 36% of the instruments were rated Aaa and the remaining 2% was held in cash .
At Dec . 31, 2015, according to Moody’s Investors Service evaluations, the BNY Mellon STIF exhibited average short-term quality ratings of P-1/P-2 and an average long-term quality rating of Aaa with 96% of the instruments rated P-1 or P-2 and 4% of the instruments rated Aaa .
Custodial credit risk is the risk that, in the event of the failure of a depository financial institution, TCDRS will not be able to recover deposits or will not be able to recover collateral securities that are in the possession of an outside party . TCDRS requires that demand deposit accounts be fully collateralized . Funds received by its master custodian are invested on an overnight basis or, if the funds are received late during a business day, are maintained in a U .S . dollar-denominated interest bearing deposit account insured by the FDIC .
TCDRS investments, evidenced by securities in physical or book entry form and not on loan, are
registered and held in safekeeping for TCDRS by its custodian bank .
Concentration of credit risk is the risk of loss attributed to the magnitude of investment in a single issuer . Investment guidelines established with the individual investment managers generally address concentration risk limits . At Dec . 31, 2016 and 2015, TCDRS did not have investments in any one issuer which were greater than 5% of net investments .
Interest rate risk is the risk that changes in market interest rates will adversely affect the fair value of an investment . The values of portfolios of longer duration are more affected by interest rate changes than are those of shorter duration . Increases in bond market yields result in fair value losses; decreases result in fair value gains . Multiplying the change in market yield by the duration of the portfolio can approximate the size of the gain or loss in fair value . For example, if one owned a portfolio of investment-grade bonds that had a duration of 6 .5 years and if the yields within the bond market were to immediately fall 1%, the fair value gain of the portfolio would approximate 6 .5% . This change in fair value indicates the level of interest rate risk inherent in the portfolio .
TABLE 4: CREDIT RISK BY QUALITY
Dec. 31,
Investment-Grade Bonds High-Yield Investments
2016 2015 2016 2015
Fair Value Fair Value Fair Value Fair Value Rating ($ Millions) % of Total ($ Millions) % of Total ($ Millions) % of Total ($ Millions) % of Total
Governments $ — 0% $ — 0% $ — 0% $ — 0%
Aaa 549.6 56 494.0 52 — 0 — 0
Aa 47.9 5 43.6 5 — 0 — 0
A 110.2 11 109.2 11 — 0 — 0
Baa 199.8 20 195.9 21 8.1 0 3.5 0
Ba 21.4 2 28.8 3 138.6 4 116.8 3
B 3.3 0 0.1 0 171.1 6 169.8 5
Less than B — 0 0.2 0 40.7 1 24.8 1
Not Rated — Bonds 55.8 6 79.1 8 48.9 2 38.9 1
Not Rated — Distressed Debt — 0 — 0 575.5 19 569.3 17
Not Rated — Direct Lending — 0 — 0 471.3 15 372.6 11
Not Rated — Opportunistic Credit — 0 — 0 1,630.4 53 2,126.1 62
Total $ 988.0 100% $ 950.9 100% $ 3,084.6 100% $ 3,421.8 100%
Source: Mellon Performance and Risk Analytics Fund Analysis, Fourth Quarter 2016

2016 Comprehensive Annual Financial Report 39
FINA
NC
IAL
NOTES TO THE FINANCIAL STATEMENTS
TABLE 5: INTEREST RATE RISK — FIXED-INCOME PORTFOLIOS
Dec. 31,
2016 2015 Effective Duration Effective Duration Asset Class Fair Value in Years Fair Value in Years
Investment-Grade Bonds $ 987,974,697 5.1 $ 950,888,291 5.0
TIPS 508,931,316 0.0 48,642,878 4.8
High-Yield Bonds1 407,329,219 3.7 353,864,468 4.1
1 Included in high-yield investments reported in the Statements of Fiduciary Net Position on page 26.
Table 5 discloses the level of interest rate risk inherent in the TCDRS fixed-income portfolios by reporting the effective duration of those portfolios .
The effective duration of the Bloomberg Barclays U .S . Aggregate Bond Index at Dec . 31, 2016 and 2015 was 5 .8 and 5 .5 years, respectively .
Performance of the TIPS portfolio was measured against the Bloomberg Barclays U .S . TIPS Index through July 2016 . Effective August 2016, the portfolio transitioned to a breakeven strategy and is measured against the Bloomberg Barclays U .S . 10 Year Breakeven Inflation Index . The portfolio seeks to benefit from a rise in inflation expectations . The primary risk to the strategy is not interest rate risk, but a significant decline in inflation expectations .
The high-yield investment portfolio is measured against the Citigroup High-Yield Cash-Pay Capped Index . The effective duration of the Citigroup High-Yield Cash-Pay Capped Index at Dec . 31, 2016 and 2015 was 4 .2 and 4 .4 years, respectively .
TCDRS does not have a formal policy governing interest rate risk, but the board’s adoption of the respective benchmark indices used to measure the investment-grade bond, TIPS, and high-yield bond portfolios against is an implicit adoption of the market risk inherent in these portfolios .
Cash collateral received from securities lending is invested in instruments whose maturity dates or periodic interest rate reset dates coincide with the maturity date of the particular securities loan providing the cash . This matching of investment and loan maturity/reset dates allows the agent to maintain the spread between the loan rate and the cash collateral investment rate over the term of
the loan and eliminates any material interest rate exposure to TCDRS over the term of the loan .
Foreign currency risk is the risk that changes in exchange rates will adversely affect the fair value of an investment or deposit . The asset allocation plan adopted in the Investment Policy includes a 19 .5% allocation to international and global equities, a 3% allocation to distressed debt, a 3% allocation to REITs, a 5% allocation to private real estate partnerships and a 14% allocation to private equity, all of which allow non-U .S . dollar-denominated investments . TCDRS does not have a formal policy governing foreign currency risk . Accordingly, the foreign currency risks inherent in the benchmark indices assigned to these asset classes have been implicitly adopted as an acceptable level of foreign currency risk .
Table 6 lists the foreign currency risk associated within the international equities, REITs, high-yield investments, private equity and private real estate partnerships portfolios .
Additionally, at Dec . 31, 2016 and 2015, the international equity portfolio contained ten commingled funds subject to foreign currency risk with an aggregate fair value of $4,468,963,509 and $4,554,452,632, respectively .
Derivative instruments are financial contracts whose values depend on the values of one or more underlying assets, reference rates or financial indexes . The investment policy does not explicitly outline the use of derivatives, but investment guidelines allow the TIPS and investment-grade bond managers the use of exchange-traded treasury futures to replicate cash investments or to manage yield curve or other risk positions within their portfolio . In 2015, the board approved the implementation of a currency overlay program

Texas County & District Retirement System40
NOTES TO THE FINANCIAL STATEMENTS
TAB
LE 6
: FO
REI
GN
CU
RR
ENC
Y R
ISK
Dec
. 31,
Forw
ard
Cur
renc
y C
ontr
acts
—
Priv
ate
Equi
ty &
Pri
vate
Rea
l
In
tern
atio
nal E
quit
ies
REI
Ts
Hig
h-Yi
eld
Inve
stm
ents
Es
tate
Par
tner
ship
s To
tal
2016
1 20
15
2016
20
15
2016
20
15
2016
20
15
2016
20
15
AU
STR
ALI
AN
DO
LLA
R
$ (4
62,5
05)
$ 10
,067
,865
$
10,0
01,9
79
$
$
$
$
$ 10
,067
,865
$
9,53
9,47
4
BRA
ZILI
AN
REA
L
2,7
22,6
26
1,70
6,40
3 2
,257
,611
1
,706
,403
4
,980
,237
BRIT
ISH
PO
UN
D S
TER
LIN
G
4
,938
,744
14
,703
,144
1
5,98
9,12
6
69,
967,
620
12
2,52
1,37
0 37
,760
,214
26
,380
,589
1
22,4
30,9
78
169
,829
,830
CA
NA
DIA
N D
OLL
AR
3,9
84,3
46
4,28
4,05
0 4
,209
,507
4
,284
,050
8
,193
,853
CH
ILEA
N P
ESO
(76
,122
)
(
76,1
22)
CH
INES
E Y
UA
N R
ENM
INBI
2,2
53,5
14
2,2
53,5
14
CO
LOM
BIA
N P
ESO
243
,601
2
43,6
01
CZE
CH
KO
RU
NA
(48
,916
)
(
48,9
16)
DA
NIS
H K
RO
NE
(
521,
921)
(
521,
921)
EUR
O C
UR
REN
CY
UN
IT
(
9,96
0,82
9)
17,1
98,7
28
14,
612,
703
30
,996
,659
15
,256
,993
23
8,26
4,44
2 18
5,69
3,86
2 2
86,4
59,8
28
205
,602
,729
HO
NG
KO
NG
DO
LLA
R
(
7,06
8)
31,1
72,3
32
39,
095,
528
3
1,17
2,33
2
39,
088,
460
HU
NG
AR
IAN
FO
RIN
T
(8,
854)
(
8,85
4)
IND
IAN
RU
PEE
(
593,
792)
(
593,
792)
IND
ON
ESIA
N R
UPI
AH
102
,582
64
8,59
7 5
56,1
05
648
,597
6
58,6
86
ISR
AEL
I SH
EKEL
41,
481
4
1,48
1
JAPA
NES
E Y
EN
(
6,54
5,85
2)
25,6
79,9
50
21,
210,
820
2
5,67
9,95
0
14,
664,
968
MA
LAY
SIA
N R
ING
GIT
270
,178
2
70,1
78
MEX
ICA
N P
ESO
1,9
90,6
65
1,9
90,6
65
NEW
TA
IWA
N D
OLL
AR
1,6
17,9
57
1,6
17,9
57
NEW
TU
RK
ISH
LIR
A
2
76,4
15
276
,415
NEW
ZEA
LAN
D D
OLL
AR
(69
,534
)
(
69,5
34)
NO
RWEG
IAN
KR
ON
E
114
,257
1,
027,
631
971
,628
1
,027
,631
1
,085
,885
PER
UV
IAN
NU
EVO
SO
L
31,
333
3
1,33
3
PHIL
IPPI
NE
PESO
(10
8,36
0)
1,90
5,13
1 8
92,3
76
1,9
05,1
31
784
,016
POLI
SH Z
LOTY
(14
6,08
4)
(14
6,08
4)
QAT
AR
I R
IYA
L
(13
,799
)
(
13,7
99)
RU
SSIA
N R
UBL
E
3,9
52,3
23
3,9
52,3
23
SOU
TH A
FRIC
AN
CO
MM
RA
ND
7,0
84,7
96
2,46
5,54
5 2
,188
,299
2
,465
,545
9
,273
,095
SIN
GA
POR
E D
OLL
AR
81,
329
4,
800,
052
3,7
57,9
21
4,8
00,0
52
3,8
39,2
50
SOU
TH K
OR
EAN
WO
N
2
,544
,179
2
,544
,179
SWED
ISH
KR
ON
A
(
1,10
7,41
3)
1,47
5,02
3 2
,143
,397
1
,475
,023
1
,035
,984
SWIS
S FR
AN
C
(
2,63
5,06
6)
1,52
4,09
2 1
,965
,931
1
,524
,092
(
669,
135)
THA
I BA
HT
9
1,89
8
91,
898
UA
E D
IRH
AM
(4,
159)
(
4,15
9)
Tota
l sub
ject
to
curr
ency
ris
k
$
10,0
31,9
50
$ 11
8,65
8,54
3 $
119
,852
,931
$
100,
964,
278
$ 13
7,77
8,36
3 $
276,
024,
656
$ 21
2,07
4,45
1 $
495,
647,
477
$ 47
9,73
7,69
5 1
No
activ
ity in
201
6.
Due
to
roun
ding
, tot
als
and
deta
il m
ay n
ot e
qual
.
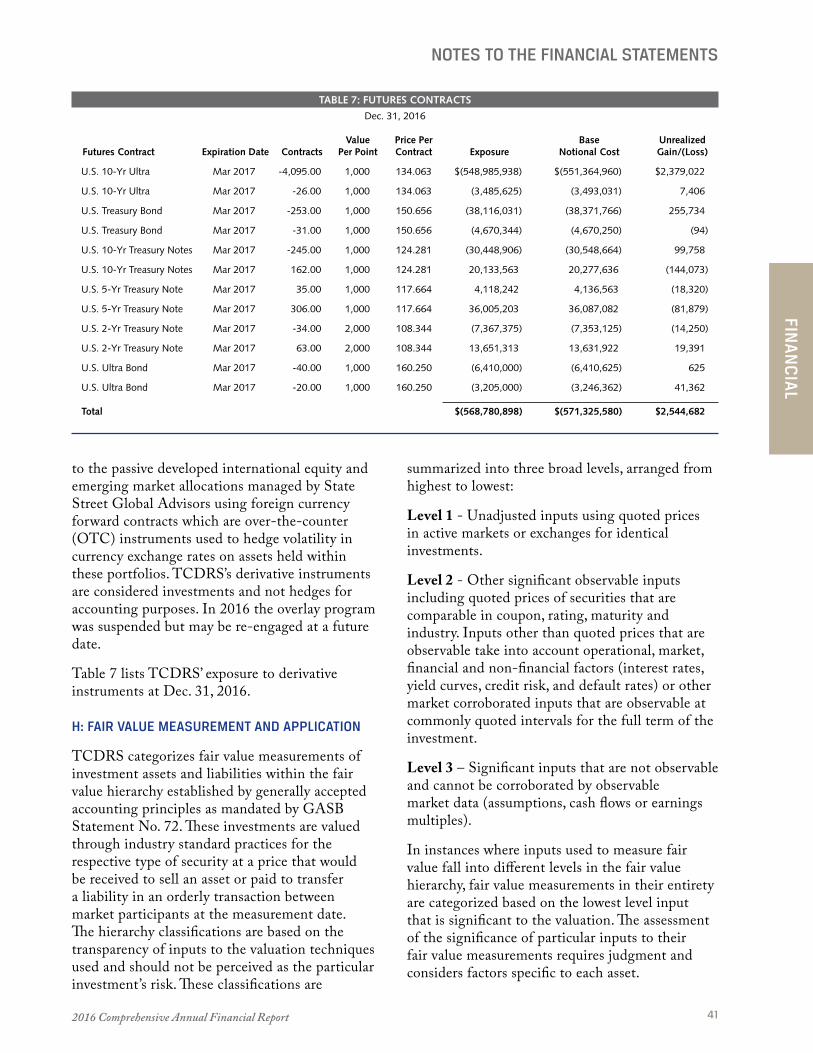
2016 Comprehensive Annual Financial Report 41
FINA
NC
IAL
NOTES TO THE FINANCIAL STATEMENTS
TABLE 7: FUTURES CONTRACTS
Dec. 31, 2016 Value Price Per Base Unrealized Futures Contract Expiration Date Contracts Per Point Contract Exposure Notional Cost Gain/(Loss)
U.S. 10-Yr Ultra Mar 2017 -4,095.00 1,000 134.063 $(548,985,938) $(551,364,960) $2,379,022
U.S. 10-Yr Ultra Mar 2017 -26.00 1,000 134.063 (3,485,625) (3,493,031) 7,406
U.S. Treasury Bond Mar 2017 -253.00 1,000 150.656 (38,116,031) (38,371,766) 255,734
U.S. Treasury Bond Mar 2017 -31.00 1,000 150.656 (4,670,344) (4,670,250) (94)
U.S. 10-Yr Treasury Notes Mar 2017 -245.00 1,000 124.281 (30,448,906) (30,548,664) 99,758
U.S. 10-Yr Treasury Notes Mar 2017 162.00 1,000 124.281 20,133,563 20,277,636 (144,073)
U.S. 5-Yr Treasury Note Mar 2017 35.00 1,000 117.664 4,118,242 4,136,563 (18,320)
U.S. 5-Yr Treasury Note Mar 2017 306.00 1,000 117.664 36,005,203 36,087,082 (81,879)
U.S. 2-Yr Treasury Note Mar 2017 -34.00 2,000 108.344 (7,367,375) (7,353,125) (14,250)
U.S. 2-Yr Treasury Note Mar 2017 63.00 2,000 108.344 13,651,313 13,631,922 19,391
U.S. Ultra Bond Mar 2017 -40.00 1,000 160.250 (6,410,000) (6,410,625) 625
U.S. Ultra Bond Mar 2017 -20.00 1,000 160.250 (3,205,000) (3,246,362) 41,362
Total $(568,780,898) $(571,325,580) $2,544,682
to the passive developed international equity and emerging market allocations managed by State Street Global Advisors using foreign currency forward contracts which are over-the-counter (OTC) instruments used to hedge volatility in currency exchange rates on assets held within these portfolios . TCDRS’s derivative instruments are considered investments and not hedges for accounting purposes . In 2016 the overlay program was suspended but may be re-engaged at a future date .
Table 7 lists TCDRS’ exposure to derivative instruments at Dec . 31, 2016 .
H: FAIR VALUE MEASUREMENT AND APPLICATION
TCDRS categorizes fair value measurements of investment assets and liabilities within the fair value hierarchy established by generally accepted accounting principles as mandated by GASB Statement No . 72 . These investments are valued through industry standard practices for the respective type of security at a price that would be received to sell an asset or paid to transfer a liability in an orderly transaction between market participants at the measurement date . The hierarchy classifications are based on the transparency of inputs to the valuation techniques used and should not be perceived as the particular investment’s risk . These classifications are
summarized into three broad levels, arranged from highest to lowest:
Level 1 - Unadjusted inputs using quoted prices in active markets or exchanges for identical investments .
Level 2 - Other significant observable inputs including quoted prices of securities that are comparable in coupon, rating, maturity and industry . Inputs other than quoted prices that are observable take into account operational, market, financial and non-financial factors (interest rates, yield curves, credit risk, and default rates) or other market corroborated inputs that are observable at commonly quoted intervals for the full term of the investment .
Level 3 – Significant inputs that are not observable and cannot be corroborated by observable market data (assumptions, cash flows or earnings multiples) .
In instances where inputs used to measure fair value fall into different levels in the fair value hierarchy, fair value measurements in their entirety are categorized based on the lowest level input that is significant to the valuation . The assessment of the significance of particular inputs to their fair value measurements requires judgment and considers factors specific to each asset .

Texas County & District Retirement System42
NOTES TO THE FINANCIAL STATEMENTS
TABLE 8: INVESTMENTS AND DERIVATIVE INSTRUMENTS MEASURED AT FAIR VALUE
Dec. 31, 2016 Fair Value Measurements Using
Quoted Prices in Significant Other Significant Active Markets for Observable Unobservable Fair Value Identical Assets Inputs Inputs 12/31/2016 Level 1 Level 2 Level 3Short-Term Securities
Collective US Gov STIF $ 506,362,975 $ $ 506,362,975
Total Short-Term Securities 506,362,975 $ 506,362,975
Equity Securities
Corporate Stock - Preferred 20,470,506 6,225,584 14,244,922
Corporate Stock - Common 874,531,038 874,531,038
Limited Partnership - Public Equity 475,922,873 475,922,873
Domestic Equity/Commingled 4,415,816,725 4,415,816,725
International Equity/Commingled Funds 3,676,718,230 3,676,718,230
Investment Derivative Instruments - Currency Futures/Swaps
Total Equity Securities 9,463,459,372 9,449,214,450 14,244,922
Debt Securities
Corp Debt Instruments 775,740,703 775,380,630 360,073
Government Non-US 7,415,509 7,415,509
Municipals 20,623,413 20,623,413
US Government Securities 1,019,527,133 1,019,527,133
Investment Derivative Instruments - Bond Futures/Swaps 2,544,681 2,544,681
Total Debt Securities 1,825,851,439 2,544,681 1,822,946,685 360,073
Commodities/Commingled 386,197,582 386,197,582
Invested Securities-Lending Collateral 4,930,942 446,000 4,484,942
Leveled Assets at Fair Value $ 12,186,802,310 $ 9,838,402,713 $ 2,348,039,524 $ 360,073
INVESTMENTS MEASURED AT THE NET ASSET VALUE (NAV)
Fair Value Unfunded Redemption Redemption 12/31/2016 Commitments Frequency Notice PeriodInternational Equity/Commingled Funds
Emerging $ 816,037,682 $ Monthly, Quarterly 30-60 days
Global 532,580,996 Monthly 45 days
Commodities/Commingled 154,092,068 Monthly 5 days
Private Real Estate Partnerships 572,533,783 712,519,444 Not eligible
Private Equity Partnerships
Buyout 1,654,658,528 1,509,672,092 Not eligible
Venture Capital 1,014,542,125 514,509,038 Not eligible
Real Assets 431,112,890 319,014,401 Not eligible
Hedge Funds
Equity Long/Short 1,584,253,840 Monthly, Quarterly 30-65 days
Market Neutral 241,265,783 Quarterly 60 days
Event-Driven 1,263,775,271 Quarterly, Semi-Annual, Annually 30-65 days
Credit/Distressed 1,404,004,591 Quarterly, Annually 60-90 days
Global Macro 961,134,653 Monthly, Quarterly 2-90 days
Multi-Strategies 338,969,353 Quarterly, Semi-Annual 45-95 days
Terminating Funds/In Liquidation 364,816,151 Not eligible
Opportunistic Credit 1,551,589,944 141,583,381 Monthly, Quarterly, Annually 60-90 days
Opportunistic Credit - not eligible for redemption 78,838,833 106,828,395 Not eligible
Distressed Debt 575,496,038 366,286,101 Not eligible
Direct Lending 471,306,988 541,404,813 Not eligible
Total Investments Measured at the NAV 14,011,009,518
Investment-related Cash, Receivables and Payables Not Included Above (29,958,130)
Total Investments and Securities-Lending Collateral Reinvested $ 26,167,853,698 Due to rounding, totals and detail may not equal.

2016 Comprehensive Annual Financial Report 43
FINA
NC
IAL
NOTES TO THE FINANCIAL STATEMENTS
TABLE 9: INVESTMENTS AND DERIVATIVE INSTRUMENTS MEASURED AT FAIR VALUE
Dec. 31, 2015 Fair Value Measurements Using
Quoted Prices in Significant Other Significant Active Markets for Observable Unobservable Fair Value Identical Assets Inputs Inputs 12/31/2015 Level 1 Level 2 Level 3Short-Term Securities
Collective US Gov STIF $ 396,222,329 $ $ 396,222,329
Total Short-Term Securities 396,222,329 $ 396,222,329
Equity Securities
Corporate Stock - Preferred 84,646 84,646
Corporate Stock - Common 799,649,244 799,649,244
Limited Partnership - Public Equity 407,690,224 407,690,224
Domestic Equity/Commingled 3,915,643,420 3,915,643,420
International Equity/Commingled Funds 3,694,358,965 3,694,358,965
Investment Derivative Instruments - Currency Futures/Swaps 10,031,951 10,031,951
Total Equity Securities 8,827,458,450 8,817,426,499 10,031,951
Debt Securities
Corp Debt Instruments 739,647,971 739,227,260 420,711
Government Non-US 5,287,171 5,287,171
Municipals 19,843,928 19,843,928
US Government Securities 530,246,008 530,246,008
Investment Derivative Instruments - Bond Futures/Swaps (80,464) (86,235) 5,771
Total Debt Securities 1,294,944,614 (86,235) 1,294,610,138 420,711
Commodities/Commingled 108,508,414 108,508,414
Invested Securities-Lending Collateral 39,219,985 5,214,000 34,005,985
Leveled Assets at Fair Value $ 10,666,353,792 $ 8,931,062,678 $ 1,734,870,403 $ 420,711
INVESTMENTS MEASURED AT THE NET ASSET VALUE (NAV)
Fair Value Unfunded Redemption Redemption 12/31/2015 Commitments Frequency Notice PeriodInternational Equity/Commingled Funds
Emerging $ 881,150,378 $ Monthly, Quarterly 30-60 days
Global 512,500,022 Monthly 45 days
Commodities/Commingled 137,588,927 Monthly 5 days
Private Real Estate Partnerships 491,450,067 644,485,928 Not eligible
Private Equity Partnerships
Buyout 1,421,956,745 1,490,262,443 Not eligible
Venture Capital 858,762,761 462,981,269 Not eligible
Real Assets 287,301,062 368,756,297 Not eligible
Hedge Funds
Equity Long/Short 1,784,901,741 Monthly, Quarterly 30-65 days
Market Neutral 218,821,379 Quarterly 60 days
Event-Driven 1,247,342,183 Quarterly, Semi-Annual, Annually 30-65 days
Credit/Distressed 1,350,875,348 Quarterly, Annually 60-90 days
Global Macro 1,142,805,806 Monthly, Quarterly 2-90 days
Multi-Strategies 415,156,757 Quarterly, Semi-Annual 45-95 days
Terminating Funds/In Liquidation 28,510,374 Not eligible
Opportunistic Credit 2,075,951,701 154,083,381 Monthly, Quarterly, Annually 60-90 days
Opportunistic Credit - not eligible for redemption 50,155,606 51,450,000 Not eligible
Distressed Debt 569,306,301 422,922,671 Not eligible
Direct Lending 372,563,884 274,124,840 Not eligible
Total Investments Measured at the NAV 13,847,101,041
Investment-related Cash, Receivables and Payables Not Included Above (56,598,124)
Total Investments and Securities-Lending Collateral Reinvested $ 24,456,856,709
Due to rounding, totals and detail may not equal.

Texas County & District Retirement System44
NOTES TO THE FINANCIAL STATEMENTS
In 2015 and 2016 there were no changes in valuation techniques that had a significant impact on the result .
Short Term SecuritiesHoldings in short-term securities at Dec . 31, 2016 and 2015 consist of a Government Short-Term Investment Fund (STIF) which invests principally or entirely in securities or other obligations issued by or guaranteed by the U .S . government or its agencies and repurchase agreements collateralized by securities or other obligations issued by or guaranteed by the U .S . government . The value of the fund is reported at cost plus accrued interest which approximates fair value . TCDRS classifies the STIF at level 2 based on the availability of a daily value, traded in an inactive market .
Equity, Debt and Other SecuritiesEquity and debt securities classified in level 1 are valued using prices quoted in active markets . Investments classified in level 2 are derived using either a bid evaluation or a matrix pricing technique . Bid evaluations may include market quotations, yields, maturities, call features and ratings . Matrix pricing is used to value securities based on the securities’ relationship to benchmark quoted prices . Index linked securities are valued by using multiples of the external market price and the index ratio . Level 3 debt securities at Dec . 31, 2016 and 2015 are impaired assets and are valued using unobservable inputs in inactive markets such as proprietary information or single source pricing .
Commingled funds listed under level 1 are valued using daily or monthly prices available through an exchange or provided by the investment manager .
Investments Measured at the Net Asset Value (NAV )For assets that are measured at the NAV per share (or its equivalent), the non-lagged year-end valuation provided by the fund manager is used . All partnerships provide audited financial statements with unmodified opinions, along with unaudited quarterly reports . In addition, as part of the annual audit, a confirmation is obtained which includes additional information regarding the underlying holdings and TCDRS’ ownership percentage of the total limited partnership .
Commingled FundsThe commingled funds with fair values reported at NAV per share (or its equivalent), such as member units or an ownership interest in partners’ capital to which a proportionate share of net assets is attributed, are reported in Tables 8 and 9 disclosures along with their redemption restrictions .
Hedge Funds & Opportunistic Credit FundsMost hedge funds and opportunistic credit funds are organized as limited partnerships under the laws of Delaware and use partnership accounting methodologies . These partnerships may invest their assets directly or through a master fund and may also use a wider range of investment techniques such as leverage, short selling and derivatives to achieve their objectives . The fair value of these investments has been determined using the NAV per share or its equivalent . Due to the inherent uncertainty of valuations of investments that are determined to be illiquid and/or do not have readily ascertainable fair values, the estimates of fair value may differ from the values ultimately realized by the partnership, and those differences can be material . The amount of notice the investor is required to give to the general partner in order to redeem ranges from two to ninety-five days . For hedge funds, investors are generally able to sell their interest in the partnerships at regular intervals ranging from monthly to every two years . Opportunistic credit funds can be organized using a traditional hedge fund structure, which provides investors regular intervals to sell their interest in the partnership ranging from quarterly to every two years, or organized using a shorter duration, private equity structure which allows for a two-year investment period, one-year harvest period, and an optional one- to two year extension . Certain funds may allow for the creation of “special investments” which are investments the investment manager believes lack a readily ascertainable fair value, are illiquid, or should be held until the resolution of a special event or circumstance .
TCDRS targets 25% of its hedge fund allocation to equity long/short funds in which the equity securities maintain some level of market exposure (either net long or net short); however, the level of exposure may vary through time . TCDRS

2016 Comprehensive Annual Financial Report 45
FINA
NC
IAL
NOTES TO THE FINANCIAL STATEMENTS
targets 5% of its hedge fund allocation to a market neutral strategy designed to maintain no net exposure to the overall direction of the equity market . Event-driven funds, which are targeted at 20% of TCDRS’ hedge fund allocation, focus on identifying and analyzing securities that can benefit from the occurrence of an extraordinary corporate transaction or event such as mergers, acquisitions, buyouts, stock splits and bankruptcies . Credit/distressed debt funds can come in the form of bonds, mutual funds or the distressed firm itself . TCDRS targets 20% of its hedge fund allocation to this strategy which has a low correlation with factors that affect the stock markets . The global macro strategy structures its holdings, such as long and short positions, in order to take advantage of shifts in macroeconomic trends; TCDRS allocates 20% of hedge funds to this strategy . The remaining 10% uses a multi-strategy approach, which represents a mix of the other hedge fund strategies .
Private EquityPrivate equity is risk capital provided outside of the public markets . Investments are illiquid and traded only on acquisition or exit . The term private equity is very broad and includes many types of investments . TCDRS targets 50% of its private equity allocation to buyout funds which include investments in acquisitions, growth equity, recovery investments, and special situations (a class which represents a diversified strategy across many sub-classes) . Buyouts use leverage (debt), aggressive restructuring and the purchase of large controlling stakes in the portfolio companies . Venture capital includes funds that invest in companies in a range of stages of development from start-up/seed-stage, early stage, and later/expansion stage . TCDRS targets 20% of its private equity allocation to venture capital funds . TCDRS targets 10% of its private equity allocation to real assets . Funds that invest in real assets have a return linked to inflation, such as energy or other commodity-based investments . The remaining allocation to private equity targets non-U .S . investments . These may be buyout, venture capital or real assets .
Fair value for these funds is determined by reference to observable valuation measures for comparable companies or transactions, adjusted
for differences between the investment and the referenced comparable, and in some instances by reference to option pricing models or other similar methods . Inputs may include, but are not limited to, significant developments such as meaningful third-party transactions, material progress or slippage in the development of the investee company’s business, a change in the cash or debt on a company’s balance sheet, dividend accretion on certain types of securities, valuation of comparable publicly traded companies, significant changes in the overall market environment and discounts for lack of marketability .
Private equity investments are illiquid and typically have expected holding periods of 10 to 12 years . These investments are not eligible for redemption . Distributions from each fund are received as the underlying investments in the funds are liquidated .
Distressed DebtDistressed debt includes investments in the debt instruments of companies which may be publicly traded or privately held that are financially distressed and are either in bankruptcy or likely candidates for bankruptcy . Typical holdings are senior and subordinated debt instruments and bank loans . Gains can be realized by holding the debt until there are some payments by the company at maturity or through distributions of cash, restructured debt or equity resulting from the bankruptcy process . Distressed debt investments are not eligible for redemption . Distributions are received as the underlying investments in the funds are liquidated . Investments are typically made in years one through five with capital typically returned in years three through ten .
Direct LendingDirect lending partnerships invest primarily in privately originated debt and preferred equity instruments to small and mid-sized companies and privately originated senior and mezzanine debt for real estate . Direct lending investments may also include other types of yield-oriented non-correlated funds including, but not limited to, royalty streams and aviation leases . Direct lending investments are not eligible for redemption . Distributions are received as the underlying investments in the funds are liquidated, which may take up to three to five years .

Texas County & District Retirement System46
NOTES TO THE FINANCIAL STATEMENTS
Private Real EstatePrivate real estate may behave as highly debt-like securities or as highly equity-like securities, depending on the characteristics of the property . Core properties tend to be held for a long time to take full advantage of the lease and rental cash flows that they provide . Value-added and opportunistic real estate achieve a substantial portion of their return from appreciation in value . Value-added real estate can involve repositioning, renovation, and redevelopment of existing properties while opportunistic real estate includes all of these activities as well as the purchase of raw land and ground-up development . These investments are not eligible for redemption . Distributions from each fund will be received as the underlying investments in the funds are liquidated .
As a private, non-exchange-traded asset, private real estate funds are illiquid . The life of a private real estate fund is typically 10 to 12 years .
I: RISK MANAGEMENT
TCDRS is exposed to various risks related to torts; theft of, damage to and destruction of assets; errors and omissions; and natural disasters . To mitigate potential losses, TCDRS purchases commercial insurance in the areas of property damage, general and umbrella liability, fiduciary liability, public official and employee benefits errors and omissions, automobile, crime and workers’ compensation . There were no changes in the types of insurance coverage TCDRS maintained in 2016 or 2015 . Settlements have not exceeded coverages for each of the past three years .
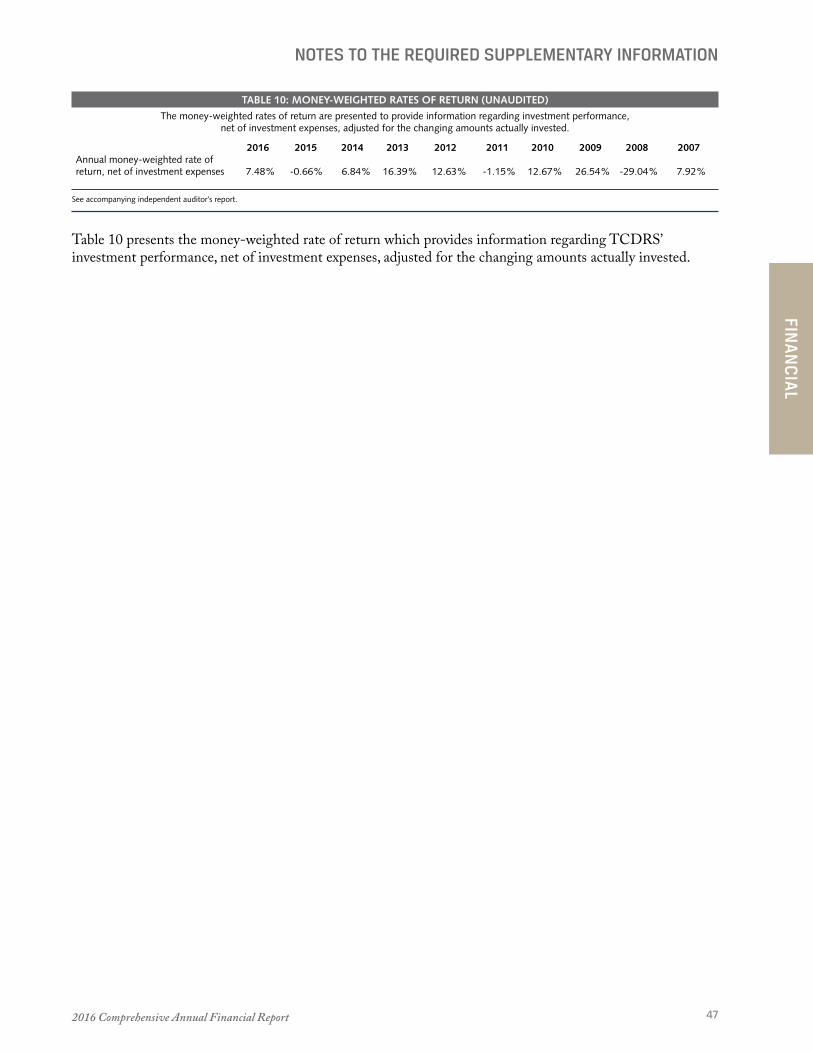
2016 Comprehensive Annual Financial Report 47
FINA
NC
IAL
NOTES TO THE REQUIRED SUPPLEMENTARY INFORMATION
Table 10 presents the money-weighted rate of return which provides information regarding TCDRS’ investment performance, net of investment expenses, adjusted for the changing amounts actually invested .
TABLE 10: MONEY-WEIGHTED RATES OF RETURN (UNAUDITED)
The money-weighted rates of return are presented to provide information regarding investment performance, net of investment expenses, adjusted for the changing amounts actually invested.
2016 2015 2014 2013 2012 2011 2010 2009 2008 2007Annual money-weighted rate of return, net of investment expenses 7.48% -0.66% 6.84% 16.39% 12.63% -1.15% 12.67% 26.54% -29.04% 7.92%
See accompanying independent auditor’s report.

Texas County & District Retirement System48
OTHER SUPPLEMENTARY INFORMATION
Employees Subdivision Current Service Saving Accumulation Annuity Reserve Endowment Income Expense Fund Fund Fund Fund Fund Fund Total
ADDITIONS
Employee Deposits and Employer Contributions $ 432,765,143 $ 771,701,126 $ — $ — $ — $ — $ 1,204,466,269
Investment Income
Net Appreciation in Fair Value of Investments — — — — 1,741,570,984 — 1,741,570,984
Interest and Dividends — — — — 111,463,937 — 111,463,937
Total Investment Activity Loss — — — — 1,853,034,921 — 1,853,034,921
Less Investment Activity Expenses — — — — 38,694,492 — 38,694,492
Net Income from Investment Activities — — — — 1,814,340,429 — 1,814,340,429
Net Income from Securities-Lending Activities — — — — 2,235,954 — 2,235,954
Total Net Investment Income — — — — 1,816,576,383 — 1,816,576,383
Building Operations and Miscellaneous Income — — — — — 1,858,748 1,858,748
Total Additions 432,765,143 771,701,126 — — 1,816,576,383 1,858,748 3,022,901,400
DEDUCTIONS
Benefits Paid — 441,982,892 723,139,864 — — — 1,165,122,756
Withdrawals 76,582,913 — — — — — 76,582,913
Interest Allocation to Group Term Life Fund — — — — 2,132,226 — 2,132,226
Administrative and Building Operations Expenses — — — — — 21,592,272 21,592,272
Total Deductions 76,582,913 441,982,892 723,139,864 — 2,132,226 21,592,272 1,265,430,167
TRANSFERS OF FUNDS
Retirement Allowances (480,378,001) (478,967,777) 959,345,778 — — — —
Income Allocation 409,650,478 1,021,200,329 490,644,392 (107,051,042) (1,814,444,157) — —
Expense Fund Transfer — — — (24,700,000) — 24,700,000 —
Partial-year Interest 13,240,451 — — (13,240,451) — — —
Escheated Accounts, Net (104,903) — — 104,903 — — —
Net Transfers (57,591,975) 542,232,552 1,449,990,170 (144,886,590) (1,814,444,157) 24,700,000 —
Net Increase (Decrease) in Fiduciary Net Position 298,590,255 871,950,786 726,850,306 (144,886,590) — 4,966,476 1,757,471,233
NET POSITION RESTRICTED FOR PENSION BENEFITS
Beginning of Period 6,264,773,284 10,746,192,702 7,011,478,083 478,348,846 — 28,884,753 24,529,677,668
End of Period $ 6,563,363,539 $ 11,618,143,488 $ 7,738,328,389 $ 333,462,256 $ — $ 33,851,229 $ 26,287,148,901
See accompanying independent auditor’s report.
CHANGES IN FIDUCIARY NET POSITION BY FUND AND INTERFUND TRANSFERS
Pension Trust Fund Year Ended Dec. 31, 2016
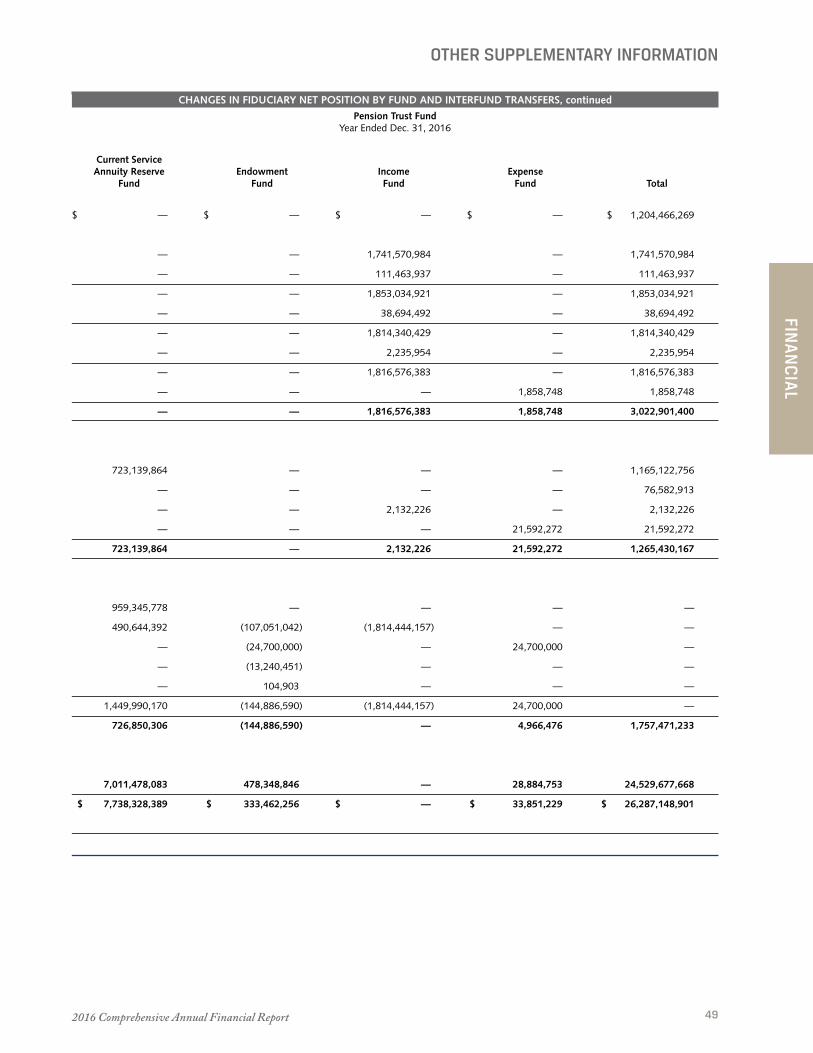
2016 Comprehensive Annual Financial Report 49
FINA
NC
IAL
OTHER SUPPLEMENTARY INFORMATION
CHANGES IN FIDUCIARY NET POSITION BY FUND AND INTERFUND TRANSFERS, continued
Pension Trust Fund Year Ended Dec. 31, 2016
Employees Subdivision Current Service Saving Accumulation Annuity Reserve Endowment Income Expense Fund Fund Fund Fund Fund Fund Total
ADDITIONS
Employee Deposits and Employer Contributions $ 432,765,143 $ 771,701,126 $ — $ — $ — $ — $ 1,204,466,269
Investment Income
Net Appreciation in Fair Value of Investments — — — — 1,741,570,984 — 1,741,570,984
Interest and Dividends — — — — 111,463,937 — 111,463,937
Total Investment Activity Loss — — — — 1,853,034,921 — 1,853,034,921
Less Investment Activity Expenses — — — — 38,694,492 — 38,694,492
Net Income from Investment Activities — — — — 1,814,340,429 — 1,814,340,429
Net Income from Securities-Lending Activities — — — — 2,235,954 — 2,235,954
Total Net Investment Income — — — — 1,816,576,383 — 1,816,576,383
Building Operations and Miscellaneous Income — — — — — 1,858,748 1,858,748
Total Additions 432,765,143 771,701,126 — — 1,816,576,383 1,858,748 3,022,901,400
DEDUCTIONS
Benefits Paid — 441,982,892 723,139,864 — — — 1,165,122,756
Withdrawals 76,582,913 — — — — — 76,582,913
Interest Allocation to Group Term Life Fund — — — — 2,132,226 — 2,132,226
Administrative and Building Operations Expenses — — — — — 21,592,272 21,592,272
Total Deductions 76,582,913 441,982,892 723,139,864 — 2,132,226 21,592,272 1,265,430,167
TRANSFERS OF FUNDS
Retirement Allowances (480,378,001) (478,967,777) 959,345,778 — — — —
Income Allocation 409,650,478 1,021,200,329 490,644,392 (107,051,042) (1,814,444,157) — —
Expense Fund Transfer — — — (24,700,000) — 24,700,000 —
Partial-year Interest 13,240,451 — — (13,240,451) — — —
Escheated Accounts, Net (104,903) — — 104,903 — — —
Net Transfers (57,591,975) 542,232,552 1,449,990,170 (144,886,590) (1,814,444,157) 24,700,000 —
Net Increase (Decrease) in Fiduciary Net Position 298,590,255 871,950,786 726,850,306 (144,886,590) — 4,966,476 1,757,471,233
NET POSITION RESTRICTED FOR PENSION BENEFITS
Beginning of Period 6,264,773,284 10,746,192,702 7,011,478,083 478,348,846 — 28,884,753 24,529,677,668
End of Period $ 6,563,363,539 $ 11,618,143,488 $ 7,738,328,389 $ 333,462,256 $ — $ 33,851,229 $ 26,287,148,901
See accompanying independent auditor’s report.
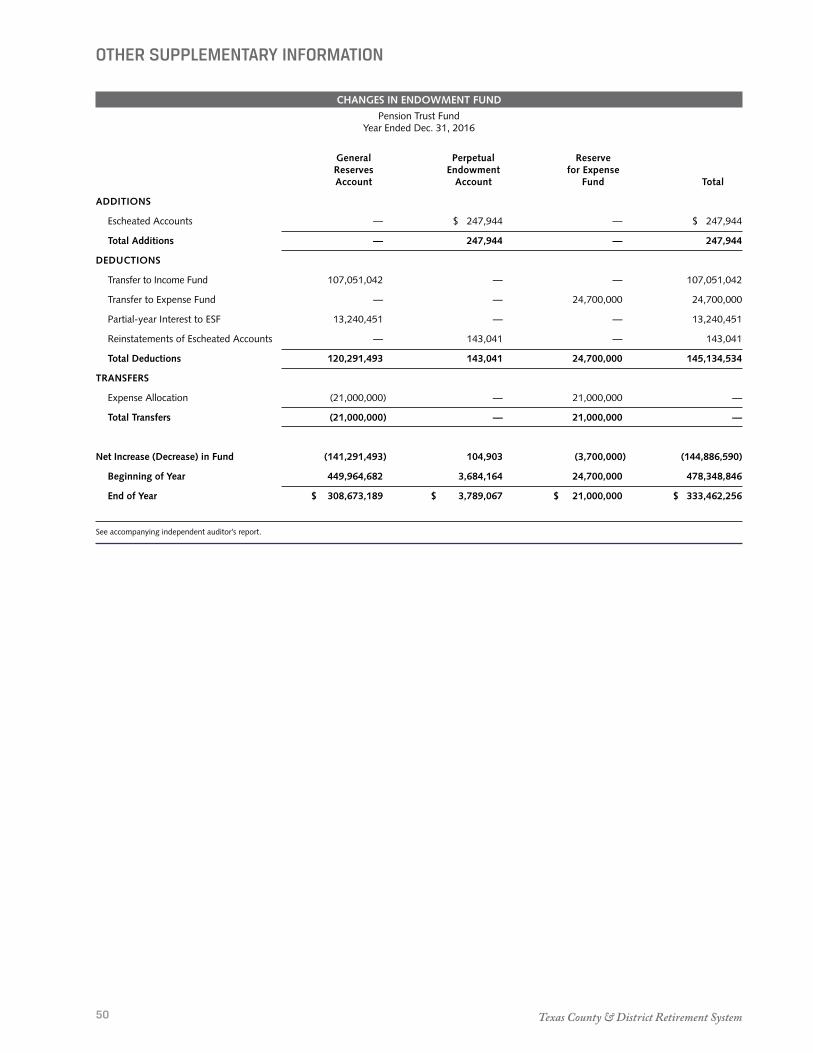
Texas County & District Retirement System50
OTHER SUPPLEMENTARY INFORMATION
CHANGES IN ENDOWMENT FUND
Pension Trust Fund Year Ended Dec. 31, 2016
General Perpetual Reserve Reserves Endowment for Expense Account Account Fund Total
ADDITIONS
Escheated Accounts — $ 247,944 — $ 247,944
Total Additions — 247,944 — 247,944
DEDUCTIONS
Transfer to Income Fund 107,051,042 — — 107,051,042
Transfer to Expense Fund — — 24,700,000 24,700,000
Partial-year Interest to ESF 13,240,451 — — 13,240,451
Reinstatements of Escheated Accounts — 143,041 — 143,041
Total Deductions 120,291,493 143,041 24,700,000 145,134,534
TRANSFERS
Expense Allocation (21,000,000) — 21,000,000 —
Total Transfers (21,000,000) — 21,000,000 —
Net Increase (Decrease) in Fund (141,291,493) 104,903 (3,700,000) (144,886,590)
Beginning of Year 449,964,682 3,684,164 24,700,000 478,348,846
End of Year $ 308,673,189 $ 3,789,067 $ 21,000,000 $ 333,462,256
See accompanying independent auditor’s report.

2016 Comprehensive Annual Financial Report 51
FINA
NC
IAL
OTHER SUPPLEMENTARY INFORMATION
CHANGES IN INCOME FUND
Pension Trust FundYear Ended Dec. 31, 2016
INVESTMENT RESULTS
Net Appreciation in Fair Value of Investments $ 1,741,570,984
Interest and Dividends 111,463,937
Net Income from Securities-Lending Activities 2,235,954
Investment Activity Expenses (38,694,492)
Net Investment Results 1,816,576,383
STATUTORY ALLOCATIONS
Allocation of Current Year Income:
Employees Saving Fund (409,650,478)
Current Service Annuity Reserve Fund (490,644,392)
Group Term Life Fund (2,132,226)
Total Statutory Allocations (902,427,096)
BOARD OF TRUSTEES’ ALLOCATIONS
Allocation to the Subdivision Accumulation Fund (1,021,200,329)
Transfer from General Reserves Account 107,051,042
Total Board of Trustees’ Allocations (914,149,287)
Net Change in Fund1 —
Beginning of Year —
End of Year $ —
1 Net Change in Fund is equal to: Net Investment Results less Total Statutory Allocations less Total Board of Trustees’ Allocations.
See accompanying independent auditor’s report.

Texas County & District Retirement System52
OTHER SUPPLEMENTARY INFORMATION
ADMINISTRATIVE REVENUES AND EXPENSES
Year Ended Dec. 31, 2016
Administrative Building Combined Operations Operations Operations
Administrative Revenues:
Rental Income $ — $ 1,848,432 $ 1,848,432
Other Income 10,316 — 10,316
Total Administrative Revenues 10,316 1,848,432 1,858,748
Administrative Expenses:
Payroll and Temporary Employees 8,523,548 — 8,523,548
Payroll Taxes 569,562 — 569,562
Pension Contributions 1,109,292 — 1,109,292
Employee Insurance and Benefits 1,292,961 — 1,292,961
Professional Fees/Outsourcing Services 2,295,617 — 2,295,617
Software Support & Equipment Service 879,805 — 879,805
Building Operations — 1,284,380 1,284,380
Office Supplies 32,855 — 32,855
Noncapitalized Equipment 178,497 — 178,497
Postage 295,696 — 295,696
Telephone 102,075 — 102,075
Printing 282,712 — 282,712
Records Management 11,597 — 11,597
Reference Materials and Memberships 85,923 — 85,923
Education and Training 60,826 — 60,826
Travel 323,437 — 323,437
Organization and Meeting 242,730 — 242,730
General Insurance 232,821 — 232,821
Depreciation and Amortization 3,105,294 682,643 3,787,937
Total Administrative Expenses $ 19,625,249 $ 1,967,023 $ 21,592,272
See accompanying independent auditor’s report.

2016 Comprehensive Annual Financial Report 53
FINA
NC
IAL
OTHER SUPPLEMENTARY INFORMATION
INVESTMENT EXPENSES
Year Ended Dec. 31, 2016
INVESTMENT-ACTIVITY EXPENSES
Department Operating Expenses
Salaries $ 2,959,568
Payroll Taxes 178,489
Pension Contributions 649,075
Employee Health and Term Life Insurance 310,389
Professional Fees and Services 2,748,225
Investment Data Systems 97,578
Equipment Service and Repairs 6,751
Office Supplies 29,750
Telephone 10,938
Subscriptions and Memberships 12,403
Education and Travel 166,010
Depreciation and Amortization 4,891
Total Department Operating Expenses 7,174,067
Nondepartment Managers’ Fees:
Equities 13,334,425
REITs 4,119,407
Master Limited Partnerships 3,176,628
Private Real Estate Partnerships 2,580,797
Investment-Grade Fixed Income 1,858,023
High-Yield Investments 1,469,254
Commodities 1,216,316
Private Equity 184,582
TIPS 241,837
Total Nondepartment Managers’ Fees 28,181,268
Total Department Operating Expenses and Managers’ Fees 35,355,335
Custodial Fees — Mellon Trust 589,158
Investment Consultant Fees — Cliffwater LLC 2,750,000
Total Investment-Activity Expenses $ 38,694,492
SECURITIES-LENDING EXPENSES
Borrower Rebates and Agent Fees $ 126,365
See accompanying independent auditor’s report.
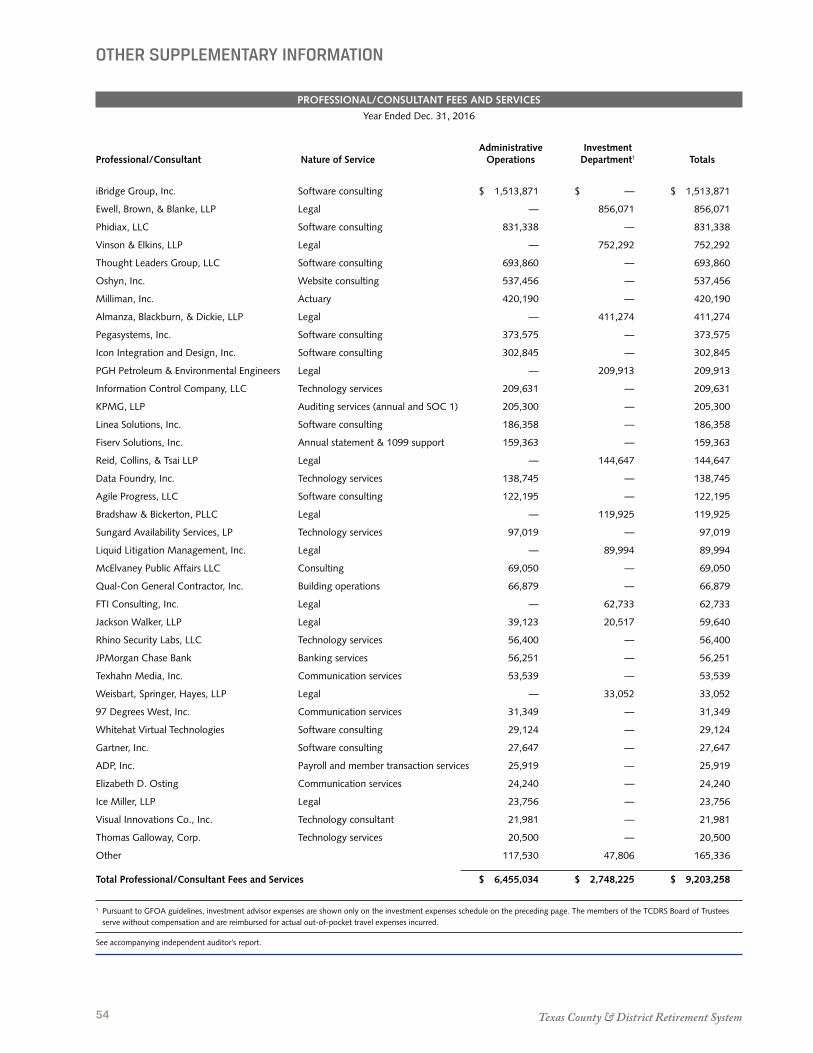
Texas County & District Retirement System54
OTHER SUPPLEMENTARY INFORMATION
PROFESSIONAL/CONSULTANT FEES AND SERVICES
Year Ended Dec. 31, 2016
Administrative Investment Professional/Consultant Nature of Service Operations Department1 Totals
iBridge Group, Inc. Software consulting $ 1,513,871 $ — $ 1,513,871
Ewell, Brown, & Blanke, LLP Legal — 856,071 856,071
Phidiax, LLC Software consulting 831,338 — 831,338
Vinson & Elkins, LLP Legal — 752,292 752,292
Thought Leaders Group, LLC Software consulting 693,860 — 693,860
Oshyn, Inc. Website consulting 537,456 — 537,456
Milliman, Inc. Actuary 420,190 — 420,190
Almanza, Blackburn, & Dickie, LLP Legal — 411,274 411,274
Pegasystems, Inc. Software consulting 373,575 — 373,575
Icon Integration and Design, Inc. Software consulting 302,845 — 302,845
PGH Petroleum & Environmental Engineers Legal — 209,913 209,913
Information Control Company, LLC Technology services 209,631 — 209,631
KPMG, LLP Auditing services (annual and SOC 1) 205,300 — 205,300
Linea Solutions, Inc. Software consulting 186,358 — 186,358
Fiserv Solutions, Inc. Annual statement & 1099 support 159,363 — 159,363
Reid, Collins, & Tsai LLP Legal — 144,647 144,647
Data Foundry, Inc. Technology services 138,745 — 138,745
Agile Progress, LLC Software consulting 122,195 — 122,195
Bradshaw & Bickerton, PLLC Legal — 119,925 119,925
Sungard Availability Services, LP Technology services 97,019 — 97,019
Liquid Litigation Management, Inc. Legal — 89,994 89,994
McElvaney Public Affairs LLC Consulting 69,050 — 69,050
Qual-Con General Contractor, Inc. Building operations 66,879 — 66,879
FTI Consulting, Inc. Legal — 62,733 62,733
Jackson Walker, LLP Legal 39,123 20,517 59,640
Rhino Security Labs, LLC Technology services 56,400 — 56,400
JPMorgan Chase Bank Banking services 56,251 — 56,251
Texhahn Media, Inc. Communication services 53,539 — 53,539
Weisbart, Springer, Hayes, LLP Legal — 33,052 33,052
97 Degrees West, Inc. Communication services 31,349 — 31,349
Whitehat Virtual Technologies Software consulting 29,124 — 29,124
Gartner, Inc. Software consulting 27,647 — 27,647
ADP, Inc. Payroll and member transaction services 25,919 — 25,919
Elizabeth D. Osting Communication services 24,240 — 24,240
Ice Miller, LLP Legal 23,756 — 23,756
Visual Innovations Co., Inc. Technology consultant 21,981 — 21,981
Thomas Galloway, Corp. Technology services 20,500 — 20,500
Other 117,530 47,806 165,336
Total Professional/Consultant Fees and Services $ 6,455,034 $ 2,748,225 $ 9,203,258
1 Pursuant to GFOA guidelines, investment advisor expenses are shown only on the investment expenses schedule on the preceding page. The members of the TCDRS Board of Trustees serve without compensation and are reimbursed for actual out-of-pocket travel expenses incurred.
See accompanying independent auditor’s report.
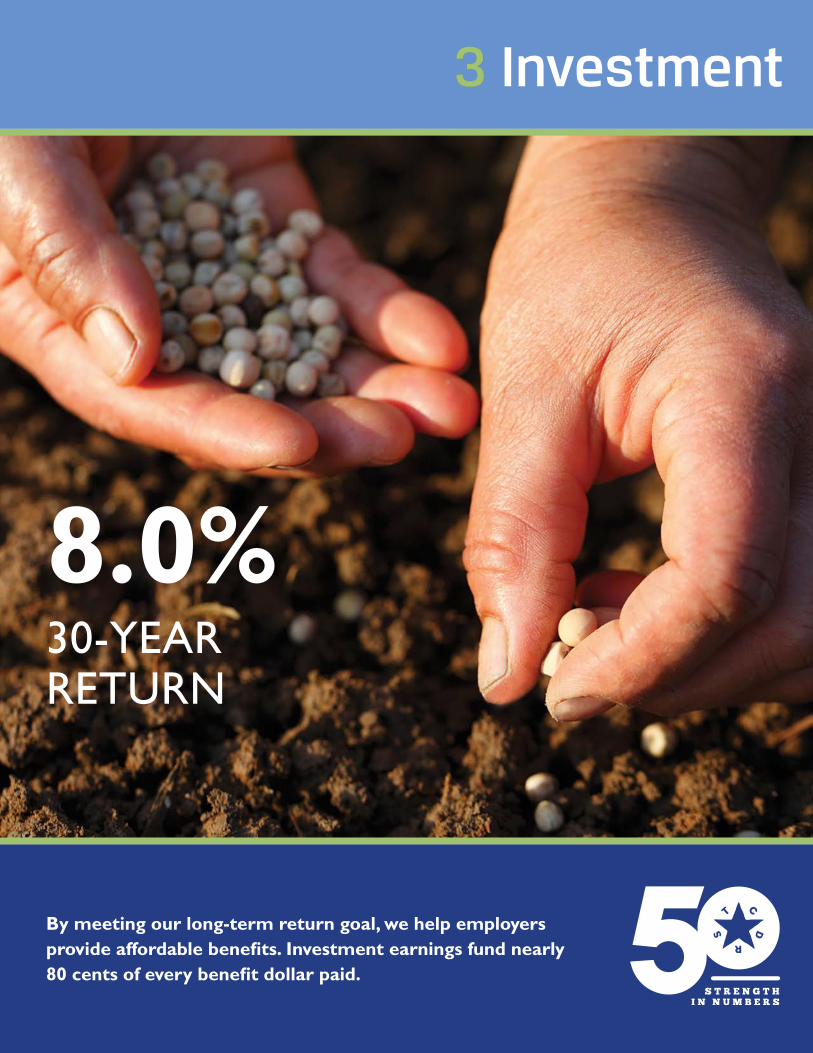
By meeting our long-term return goal, we help employers provide affordable benefits. Investment earnings fund nearly 80 cents of every benefit dollar paid.
8.0%30-YEARRETURN
3 Investment
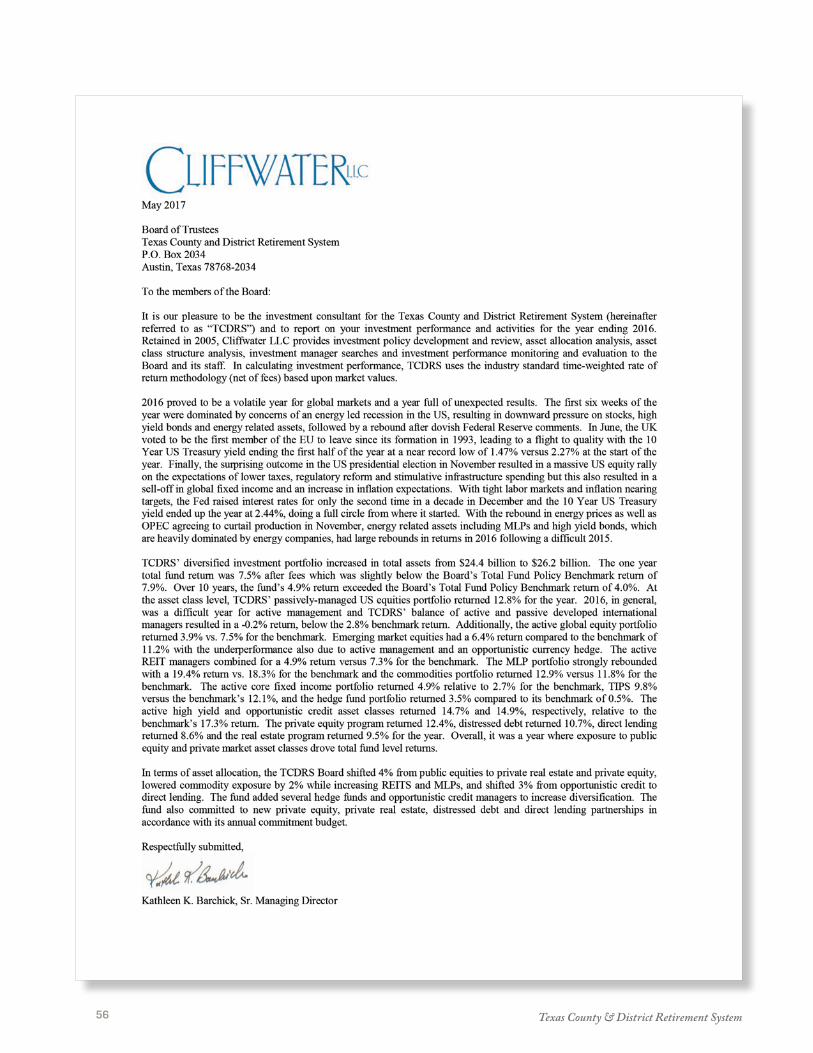
Texas County & District Retirement System56

2016 Comprehensive Annual Financial Report 57
INV
ESTM
ENT
A: THE TCDRS ACT AND INVESTMENT POLICY
Investment decisions of the TCDRS Board of Trustees (board) are subject to the Texas Constitution, the TCDRS Act and to the applicable statutory provisions of the Texas Trust Code that provide for a “prudent person” standard of care .
Additionally, the board has adopted, and reviews at least annually, an investment policy that defines investment authority and emphasizes the importance of a long-term investment philosophy with minimization of risk .
B: INVESTMENT PHILOSOPHY AND STRATEGY
The board has established a long-term target investment return of 8% and has diversified the TCDRS portfolio to include:
• Equities – U .S ., international developed and emerging
markets, and global equities• Hedge funds
• High-yield investments – High-yield bonds, distressed debt, opportunistic
credit and direct lending• Private equity • Real assets – Real estate investment trusts (REITs),
commodities, private real estate partnerships, Treasury Inflation-Protected Securities (TIPS) and Master Limited Partnerships (MLPs)
• Investment-grade bonds
(For more information on these types of securities, please see the Glossary on page 89 .)
The board uses a long-term, strategic approach to asset allocation based upon capital market assumptions that are reviewed and adopted annually . The assumptions in effect as of January 2016 are shown in Table 1 and include the long-term expected return and risk (standard deviation) for each asset class .
C: ASSET ALLOCATION
The board has established asset allocation targets for each asset class within the TCDRS portfolio . Table 2 shows the target allocations in effect during 2016 for each asset class .
TABLE 1: CAPITAL MARKET ASSUMPTIONS
As of Jan. 1, 2016
Asset Category Expected Standard (Portfolio) Return Deviation
Equities
U.S. Equities 7.05% 17.00%
International Equities — Developed 7.05 18.00
International Equities — Emerging 8.05 26.00
Global Equities 7.35 18.00
Hedge Funds 6.85 6.10
High-Yield Investments
High-Yield Bonds 6.70 11.00
Opportunistic Credit 6.69 7.16
Distressed Debt 9.70 11.00
Direct Lending 8.00 10.00
Private Equity 10.05 20.00
Real Assets
REIT Equities 5.60 22.00
Commodities 1.50 18.00
Private Real Estate Partnerships 8.50 30.00
TIPS 2.25 7.00
Master Limited Partnerships (MLPs) 8.40 17.00
Investment-Grade Bonds 2.60 4.00
Cash and Cash Equivalents1 1.50 2.00
1 Money awaiting allocation to an asset category and deposited with the system’s custodian.
TABLE 2: ASSET ALLOCATION TARGETS
Target Allocation Percentages in Effect at:
Asset Category Jan. 1, 2016 Dec. 31, 2016
Equities
U.S. Equities 16.5% 14.5%
International Equities — Developed 11.0 10.0
International Equities — Emerging 9.0 8.0
Global Equities 1.5 1.5
Hedge Funds 25.0 25.0
High-Yield Investments
High-Yield Bonds 3.0 3.0
Opportunistic Credit 5.0 2.0
Distressed Debt 3.0 3.0
Direct Lending 2.0 5.0
Private Equity 12.0 14.0
Real Assets
REITs 2.0 3.0
Commodities 2.0 0.0
Private Real Estate Partnerships 3.0 5.0
TIPS 0.0 0.0
Master Limited Partnerships 2.0 3.0
Investment-Grade Bonds 3.0 3.0

Texas County & District Retirement System58
A policy benchmark portfolio consisting of individual asset class benchmarks, weighted by asset class target allocation, is constructed for measurement of the performance of the entire portfolio .
Performance ResultsThe TCDRS 2016 portfolio return was 7 .5%, net of all fees, trailing its benchmark return of 7 .9% by 0 .4% . Resilience bests describes markets in 2016 . Markets overcame low energy prices at the beginning of the year, the surprise Brexit vote in
D: ASSET CLASSES, INVESTMENT STYLES AND INVESTMENT MANAGERS
TCDRS uses both active and passive styles of investment management . The passive style seeks to match the performance of an established market index by holding the same securities as the index . An active style seeks to exceed the performance of a benchmark by allowing the manager to actively trade securities that may be different from the index .
Asset classes managed actively are hedge funds, high-yield bonds, opportunistic credit, distressed debt, direct lending, private equity, REITs, TIPS, commodities, MLPs, private real estate partnerships, investment-grade bonds, global equities, and a portion of the developed international and emerging market equities portfolios . Asset classes managed passively are U .S . equities and the remainder of the developed international and emerging market equities .
The investment manager responsible for an externally managed portfolio holds any cash that portfolio generates in interest-bearing instruments or accounts until it is reinvested . The TCDRS Investment Officer manages cash as well as new contributions in a short-term investment fund until allocated to a portfolio .
E: INVESTMENT RESULTS
TCDRS retains a professional performance measurement analyst that regularly reports investment performance to the board for each investment manager, for the aggregate of all managers in each asset class and for the total portfolio .
Performance ReportingPerformance of each investment manager is measured against the performance of similar assets contained within a benchmark portfolio, as represented by a specific index . Comparisons indicate the value added by each manager, if any, in excess of the performance that was experienced by the specific benchmark index . When multiple investment managers are retained within a particular asset class, a benchmark portfolio is selected for measurement of the performance of the entire asset class . Table 3 identifies the benchmark portfolio associated with each asset class contained within the TCDRS investment portfolio .
TABLE 3: BENCHMARK PORTFOLIOS FOR PERFORMANCE MEASUREMENT
Asset Category Benchmark Portfolio Equities U.S. Equity Index Dow Jones U.S. Total Stock Market Index Developed International Equity Index MSCI World ex U.S. Index (net) Emerging Market International Equity Index MSCI EM (Emerging Markets) Index (net) Global Equity Index MSCI World Index (net) Hedge Funds Hedge Fund Research, Inc. (HFRI) Fund of Funds Composite Index High-Yield Investments High-Yield Bond Index Citigroup High-Yield Cash-Pay Capped Index Distressed Debt Index Cambridge Associates Distressed Securities Index1
Opportunistic Credit Index Citigroup High-Yield Cash-Pay Capped Index Direct Lending Index S&P/LSTA Leveraged Loan Index Private Equity Cambridge Associates Global Private Equity & Venture Capital Index2
Real Assets REIT Index 67% FTSE NAREIT Equity REITs Index, 33% FTSE EPRA/NAREIT Global Real Estate Index Commodities Index Bloomberg Commodities Index TIPS Index Bloomberg Barclays 10-Year Breakeven Inflation Index Private Real Estate Partnerships Cambridge Associates Real Estate Index3
MLP Index Alerian MLP Index Investment-Grade Bonds Bloomberg Barclays U.S. Aggregate Bond Index
1 Includes vintage years 2005-present of Quarter Pooled Horizon IRRs.2 Includes vintage years 2006–present of Quarter Pooled Horizon IRRs.3 Includes vintage years 2007–present of Quarter Pooled Horizon IRRs.

2016 Comprehensive Annual Financial Report 59
INV
ESTM
ENT
the middle of the year and the U .S . elections late in the year to finish broadly higher . In particular, several asset classes that suffered in 2015 from lower energy prices rebounded sharply in 2016 as energy prices rose with MLPs up 19 .4%, high-yield bonds up 14 .7% and commodities up 12 .9% . The private asset classes also produced strong returns with private equity up 12 .4%, distressed debt up 10 .7%, private real estate up 9 .5% and direct lending up 8 .6% . U .S . equities (+12 .8%) and emerging market equities (+6 .4%) led public market returns . The opportunistic credit portfolio (+14 .9%) performed well while the hedge fund portfolio (+3 .5%) was up modestly . 1 A complete listing of all securities TCDRS owned at Dec. 31, 2016, is available upon
written request.
TABLE 4: RESULTS FROM INVESTING ACTIVITIES, NET OF ALL FEES1
Periods Ended Dec. 31, 2016
2016 Annualized Returns
TCDRS Portfolio/Benchmark Portfolio Return 3-Year 5-Year 10-Year 20-Year 30-Year
Total Fund 7.5 4.5 8.4 4.9 7.1 8.0 Policy Benchmark Portfolio 7.9 3.3 6.8 4.0 6.1 6.9
Equities
U.S. Equities 12.8 8.5 14.7 7.3 8.1 — U.S. Equity Index Benchmark Portfolio 12.6 8.4 14.6 7.2 8.1 —
International Equities - Developed -0.2 -0.5 7.5 1.5 — — Developed Intl Equity Index Benchmark Portfolio 2.8 -1.6 6.1 0.9 — —
International Equities - Emerging 6.4 -2.4 1.3 1.0 — — Emerging Intl Equity Index Benchmark Portfolio 11.2 -2.6 1.3 1.8 — —
Global Equity 3.9 8.5 — — — — Global Equity Benchmark Portfolio 7.5 3.8 — — — —
Hedge Funds 3.5 2.4 5.8 3.5 — — Hedge Fund Benchmark Portfolio 0.5 1.2 3.4 1.3 — —
High-Yield Investments
High-Yield Bonds 14.7 3.8 7.0 7.0 — — High-Yield Bond Index Benchmark Portfolio 17.3 4.2 6.8 7.3 — —
Opportunistic Credit 14.9 7.1 11.0 — — — Opportunistic Credit Index Benchmark Portfolio 17.3 4.2 6.8 — — —
Distressed Debt 10.7 6.3 10.2 8.8 — — Distressed Debt Index Benchmark Portfolio 11.4 2.4 5.7 6.7 — —
Direct Lending 8.6 3.1 — — — — Direct Lending Index Benchmark Portfolio 10.2 2.0 — — — —
Private Equity 12.4 12.2 13.5 6.6 — — Private Equity Benchmark Portfolio 10.5 10.4 13.1 6.2 — —
Real Assets
REITs 4.9 10.2 11.0 3.2 — — REIT Index Benchmark Portfolio 7.3 10.7 11.4 3.8 — —
Commodities 12.9 -10.2 -8.4 — — — Commodities Index Benchmark Portfolio 11.8 -11.3 -9.0 — — —
TIPS 9.8 3.8 1.7 5.0 — — TIPS Benchmark Portfolio 12.1 4.6 2.3 5.1 — —
Private Real Estate Partnerships 9.5 13.7 15.6 — — — Private Real Estate Benchmark Portfolio 7.5 11.0 10.9 — — —
MLPs 19.4 -0.6 — — — — MLP Index Benchmark Portfolio 18.3 -5.8 — — — —
Investment-Grade Bonds 4.9 4.0 3.5 4.7 6.1 7.4 Investment-Grade Bond Index Benchmark Portfolio 2.7 3.0 2.2 4.3 5.4 6.4
1 Calculations of performance were prepared using time-weighted rates of return calculations and are reported net of all fees.Source: BNY Mellon Performance and Risk Analytics Fund Analysis, Fourth Quarter 2016
F: LISTS OF LARGEST HOLDINGS1
Equity HoldingsThe system’s exposure to equity markets is achieved through participation in commingled investment pools, such as State Street Global Advisors (SSgA) U .S . equity and international equity index funds, and direct investment in separately managed REIT and MLP portfolios . At Dec . 31, 2016, TCDRS’ largest equity holdings were in the U .S . equity and REIT portfolios . Table 5 displays our exposure to the 10 largest equity holdings .

Texas County & District Retirement System60
Fixed-Income HoldingsTable 6 presents the top 10 fixed-income securities owned by TCDRS . The securities are contained within the investment-grade bond and TIPS portfolios . At Dec . 31, 2016, the aggregate fair value of the investment-grade bond and TIPS portfolios was $988 million and $509 million, respectively .
G: RESULTS OF SECURITIES-LENDING ACTIVITIES
TCDRS retains The Bank of New York Mellon Corp . as securities-lending agent to engage in lending securities from its fixed-income portfolios . Securities-lending transactions consist of loans of securities to broker-dealers and other entities in exchange for collateral with a simultaneous agreement to return the collateral for the same securities in the future . The gross income and expenses attributable to securities-lending activity and net lending income of $0 .1 million are shown in Table 7 .
Additionally, SSgA passively manages the U .S . and international equity portfolios of TCDRS in commingled funds . The securities in these funds participate in the securities-lending program of SSgA with TCDRS receiving a proportionate share of the securities-lending income generated from this activity . Also shown in Table 7 is income of $2 .1 million representing TCDRS’ share of the 2016 equity portfolios’ securities-lending income .
H: FEES AND COMMISSIONS
Table 8 presents the 2016 investment managers’ fees TCDRS incurred, excluding securities-lending fees .
Note that all returns presented throughout this CAFR are reported net of the amounts reported in Table 8.
Alternative Investment FeesThe investment management fees included in Investment Activity Expenses presented in the Statement of Changes in Fiduciary Net Position represent only those paid directly from the Pension Trust Fund and do not include fees incurred and charged by general partners in partnerships investing in private equity, distressed debt, direct lending, opportunistic credit, private real estate and hedge funds as these types of fees are netted directly against returns for those investments in accordance
TABLE 7: SECURITIES-LENDING ACTIVITY
Year Ended Dec. 31, 2016
Elements of Securities-Lending Activity Amount
Gross Earnings $ 240,292
Less: Borrower Rebates and Agent Fees 126,365
Net Securities-Lending Income – Fixed Income 113,927
Securities-Lending Income (Commingled Funds) 2,122,027
Net Securities-Lending Income $ 2,235,954
TABLE 5: LIST OF LARGEST EQUITY HOLDINGS1
Dec. 31, 2016 ($ Millions)
Company Portfolio Fair Value
Apple, Inc. U.S. Equities $114.9
Microsoft Corporation U.S. Equities 89.9
Exxon Mobil Corporation U.S. Equities 69.8
Simon Property Group, Inc. REITs 65.1
Enterprise Products Partners, LP REITs 64.0
Johnson & Johnson U.S. Equities 58.0
JPMorgan Chase U.S. Equities 57.4
Berkshire Hathaway, Inc. U.S. Equities 57.2
Amazon.com U.S. Equities 55.1
General Electric Co. U.S. Equities 52.1
Facebook, Inc. U.S. Equities 49.9
1 TCDRS invests in equity securities through separately managed and commingled equity portfolios. At Dec. 31, 2016, the equities contained in the U.S. Equities portfolio represent TCDRS’ investment in a Dow Jones U.S. Total Stock Market Index Fund in which TCDRS owns an 84% undivided interest. The remaining largest equity holdings are separately managed shares held in the REIT portfolio.
TABLE 6: LIST OF LARGEST FIXED-INCOME HOLDINGS
Dec. 31, 2016 ($ Millions)
Interest Fair Description Maturity Rate Value
U.S. Treas-CPI Inflat 1/15/2027 2.375% $202.19
U.S. Treas-CPI Inflat 4/15/2028 3.625% 98.26
U.S. Treas-CPI Inflat 1/15/2028 1.750% 72.92
U.S. Treas-CPI Inflat 1/15/2029 2.500% 40.74
U.S. Treas-CPI Inflat 4/15/2029 3.875% 36.19
FNMA Pool #0AL8387 3/1/2046 4.000% 32.27
U.S. Treas-CPI Inflat 1/15/2026 0.625% 29.32
U.S. Treas-CPI Inflat 7/15/2026 0.125% 23.23
U.S. Treasury Bond 5/15/2045 3.000% 20.80
U.S. Treasury Note 5/31/2017 0.625% 17.85

2016 Comprehensive Annual Financial Report 61
INV
ESTM
ENT
with FASB ASC 820 . In the interest of greater transparency, fees and profit shares associated with these types of investments are disclosed in Table 8, based on information requested and received from fund general partners in conjunction with the annual audit .
The investment expenses related to TCDRS’ investments in partnerships investing in private equity, distressed debt, direct lending, opportunistic credit, private real estate and hedge funds fall into the categories of management fees and profit share (also called “carried interest”) .
Management fees typically range from 1 .5% to 2% of the value of invested assets (hedge funds and opportunistic credit) or committed capital (private equity, private real estate, distressed debt and direct lending) and are intended to compensate the general partner for its costs in operating the partnership .
Profit sharing or carried interest incentivizes and aligns the general partner’s interest with TCDRS’
TABLE 8: INVESTMENT MANAGERS’ FEES
Year Ended Dec. 31, 2016
Fees Paid from the Pension Trust Fund1 Fees Netted Against Returns
Management Performance Management Performance Fair Value Asset Class Fees Fees Fees Fees at Dec. 31, 2016
Equities $ 7,170,839 $ 6,163,585 $ 10,225,068 $ — $ 9,417,361,229
MLPs 3,176,628 — — — 567,543,856
REITs 4,119,407 — — — 811,874,484
Investment-Grade Bonds 1,858,023 — — — 987,974,697
Commodities 1,216,316 — — — 540,289,650
High-Yield Bonds 1,469,254 — — — 407,329,219
TIPS 241,837 — — — 508,931,316
Cash Equivalents — — — — 413,319,532
Management Performance Management General Partner Fair Value Alternative Investments Fees Fees Fees Carried Interest at Dec. 31, 2016
Private Equity 184,582 — 59,395,902 64,539,912 3,100,313,544
Private Real Estate Partnerships 2,580,797 — 12,119,927 10,935,605 572,533,783
Hedge Funds — — 93,930,310 59,343,015 6,158,219,643
Opportunistic Credit — — 19,097,379 28,532,057 1,630,428,777
Distressed Debt — — 10,908,298 22,843,546 575,496,038
Direct Lending — — 4,936,122 4,381,249 471,306,988
Total $ 22,017,683 $ 6,163,585 $ 210,613,006 $ 190,575,384 $ 26,162,922,756
1 See Nondepartment Managers’ Fees on page 53.
interest . The carried interest represents the general partner’s share of the partnership’s profits, typically 20%, with 80% going to the limited partners such as TCDRS . Carried interest earned by hedge funds and opportunistic credit funds is generally accrued monthly and paid annually since the underlying investments are relatively liquid and more easily valued . Due to the long-term nature of private equity, private real estate, distressed debt and direct lending partnerships (typically 8 to 12 years) and the illiquidity associated with the underlying investments, carried interest is accrued over the life of the partnership but is usually not finalized until the fund is fully liquidated . Generally, an agreed rate of return, or preferred return, must first be surpassed before carried interest is earned by the general partner . To incentivize general partners to maintain performance over the life of a partnership, periods of negative performance may result in previously accrued carried interest being reduced or “clawed back” . During such periods, negative carried interest expense would be reported .
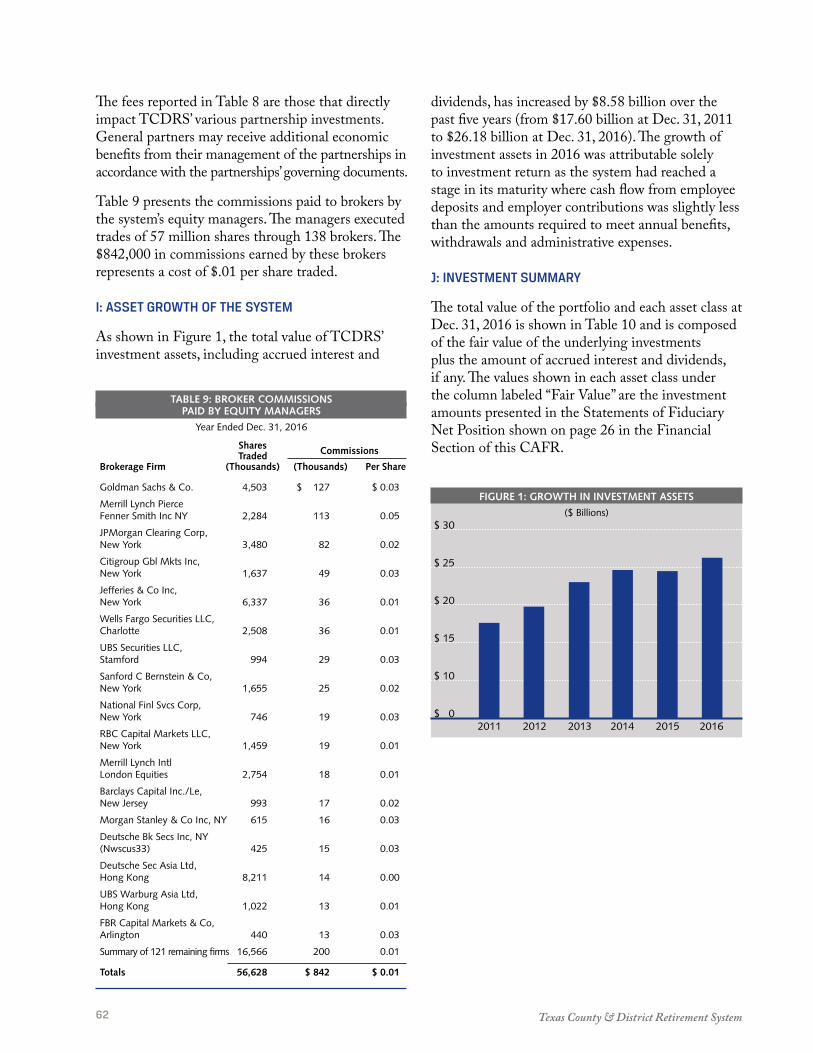
Texas County & District Retirement System62
The fees reported in Table 8 are those that directly impact TCDRS’ various partnership investments . General partners may receive additional economic benefits from their management of the partnerships in accordance with the partnerships’ governing documents .
Table 9 presents the commissions paid to brokers by the system’s equity managers . The managers executed trades of 57 million shares through 138 brokers . The $842,000 in commissions earned by these brokers represents a cost of $ .01 per share traded .
I: ASSET GROWTH OF THE SYSTEM
As shown in Figure 1, the total value of TCDRS’ investment assets, including accrued interest and
FIGURE 1: GROWTH IN INVESTMENT ASSETS
($ Billions) $ 30
$ 25
$ 20
$ 15
$ 10
$ 0 2011 2012 2013 2014 2015 2016
dividends, has increased by $8 .58 billion over the past five years (from $17 .60 billion at Dec . 31, 2011 to $26 .18 billion at Dec . 31, 2016) . The growth of investment assets in 2016 was attributable solely to investment return as the system had reached a stage in its maturity where cash flow from employee deposits and employer contributions was slightly less than the amounts required to meet annual benefits, withdrawals and administrative expenses .
J: INVESTMENT SUMMARY
The total value of the portfolio and each asset class at Dec . 31, 2016 is shown in Table 10 and is composed of the fair value of the underlying investments plus the amount of accrued interest and dividends, if any . The values shown in each asset class under the column labeled “Fair Value” are the investment amounts presented in the Statements of Fiduciary Net Position shown on page 26 in the Financial Section of this CAFR .
TABLE 9: BROKER COMMISSIONSPAID BY EQUITY MANAGERS
Year Ended Dec. 31, 2016
Shares Traded Commissions Brokerage Firm (Thousands) (Thousands) Per Share
Goldman Sachs & Co. 4,503 $ 127 $ 0.03
Merrill Lynch Pierce Fenner Smith Inc NY 2,284 113 0.05
JPMorgan Clearing Corp, New York 3,480 82 0.02
Citigroup Gbl Mkts Inc, New York 1,637 49 0.03
Jefferies & Co Inc, New York 6,337 36 0.01
Wells Fargo Securities LLC, Charlotte 2,508 36 0.01
UBS Securities LLC, Stamford 994 29 0.03
Sanford C Bernstein & Co, New York 1,655 25 0.02
National Finl Svcs Corp, New York 746 19 0.03
RBC Capital Markets LLC, New York 1,459 19 0.01
Merrill Lynch Intl London Equities 2,754 18 0.01
Barclays Capital Inc./Le, New Jersey 993 17 0.02
Morgan Stanley & Co Inc, NY 615 16 0.03
Deutsche Bk Secs Inc, NY (Nwscus33) 425 15 0.03
Deutsche Sec Asia Ltd, Hong Kong 8,211 14 0.00
UBS Warburg Asia Ltd, Hong Kong 1,022 13 0.01
FBR Capital Markets & Co, Arlington 440 13 0.03
Summary of 121 remaining firms 16,566 200 0.01
Totals 56,628 $ 842 $ 0.01

2016 Comprehensive Annual Financial Report 63
INV
ESTM
ENT
TABLE 10: INVESTMENTS BY ASSET SUBCLASS
Dec. 31, 2016
Fair Interest, Dividends Total % of Type of Investment Value and Other Receivables1 Value Total Value
Equities
US Equities $ 4,415,816,725 $ 0 $ 4,415,816,725 16.9%
International Equities 4,468,963,509 0 4,468,963,509 17.0%
Global Equities 532,580,995 0 532,580,995 2.0%
Hedge Funds 6,158,219,643 0 6,158,219,643 23.5%
High-Yield Investments
High-Yield Bonds 407,329,219 5,786,258 413,115,477 1.6%
Opportunistic Credit 1,630,428,777 0 1,630,428,777 6.2%
Distressed Debt 575,496,038 0 575,496,038 2.2%
Direct Lending 471,306,988 0 471,306,988 1.8%
Private Equity 3,100,313,544 0 3,100,313,544 11.8%
Real Assets
REITs 811,874,484 3,414,135 815,288,619 3.1%
Commodities 540,289,650 0 540,289,650 2.1%
TIPS 508,931,316 3,730,341 512,661,657 2.0%
Private Real Estate Partnerships 572,533,783 0 572,533,783 2.2%
MLPs 567,543,856 87,596 567,631,452 2.2%
Investment-Grade Bonds 987,974,697 6,536,184 994,510,881 3.8%
Cash and Cash Equivalents 413,319,532 125,867 413,445,399 1.6%
Total Investments Shown on Statements of Fiduciary Net Position $ 26,162,922,756 $ 19,680,381 $ 26,182,603,137 100.0%
1 Includes $9,080 of net foreign currency forwards payable included in Accounts and Investments Payable on page 26. Due to rounding, totals and detail may not equal. Percentages shown are based on rounded amounts and may differ slightly from actual.

Texas County & District Retirement System64
READER’S NOTES
TCDRS is an economic engine for Texas. Since we were created in 1967, we’ve paid more than $13.8 billion in benefits to retirees and former members. Most of our retirees continue to live in their local communities after retirement. That means they are using their retirement benefits to enrich their hometowns.
$13.8 BILLIONBACK TO TEXAS
4 Actuarial

Texas County & District Retirement System66
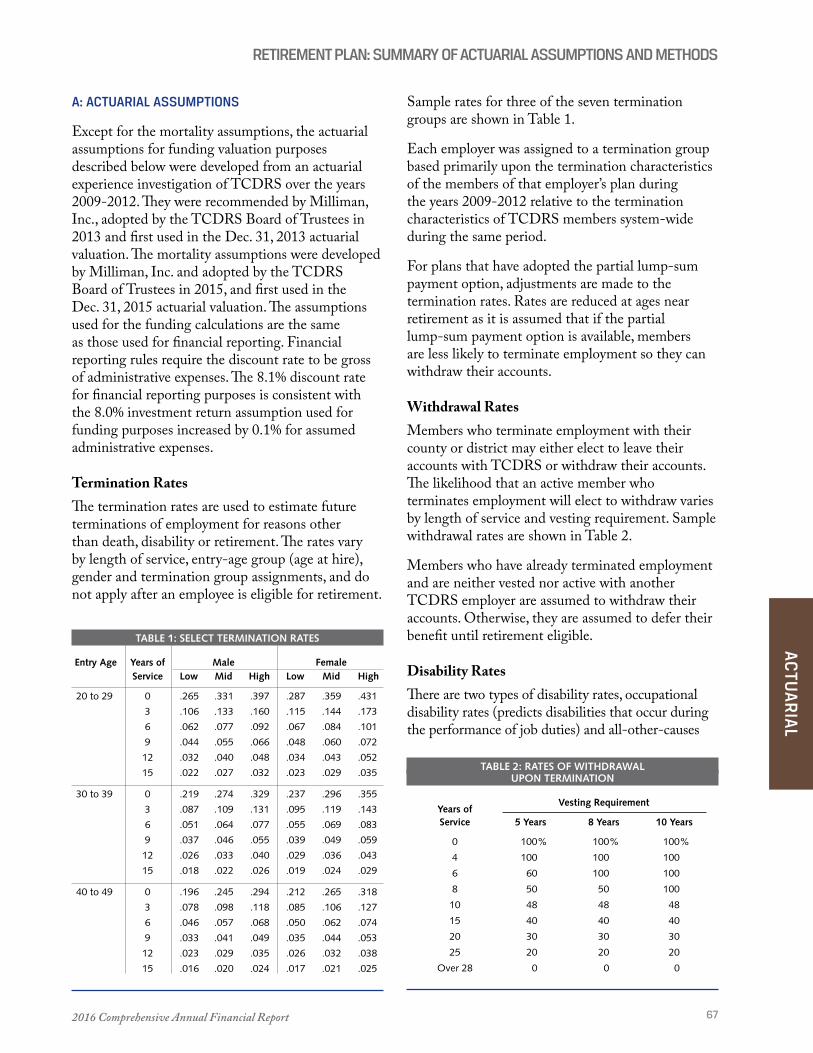
2016 Comprehensive Annual Financial Report 67
AC
TUA
RIA
L
RETIREMENT PLAN: SUMMARY OF ACTUARIAL ASSUMPTIONS AND METHODS
A: ACTUARIAL ASSUMPTIONS
Except for the mortality assumptions, the actuarial assumptions for funding valuation purposes described below were developed from an actuarial experience investigation of TCDRS over the years 2009-2012 . They were recommended by Milliman, Inc ., adopted by the TCDRS Board of Trustees in 2013 and first used in the Dec . 31, 2013 actuarial valuation . The mortality assumptions were developed by Milliman, Inc . and adopted by the TCDRS Board of Trustees in 2015, and first used in the Dec . 31, 2015 actuarial valuation . The assumptions used for the funding calculations are the same as those used for financial reporting . Financial reporting rules require the discount rate to be gross of administrative expenses . The 8 .1% discount rate for financial reporting purposes is consistent with the 8 .0% investment return assumption used for funding purposes increased by 0 .1% for assumed administrative expenses .
Termination RatesThe termination rates are used to estimate future terminations of employment for reasons other than death, disability or retirement . The rates vary by length of service, entry-age group (age at hire), gender and termination group assignments, and do not apply after an employee is eligible for retirement .
Sample rates for three of the seven termination groups are shown in Table 1 .
Each employer was assigned to a termination group based primarily upon the termination characteristics of the members of that employer’s plan during the years 2009-2012 relative to the termination characteristics of TCDRS members system-wide during the same period .
For plans that have adopted the partial lump-sum payment option, adjustments are made to the termination rates . Rates are reduced at ages near retirement as it is assumed that if the partial lump-sum payment option is available, members are less likely to terminate employment so they can withdraw their accounts .
Withdrawal RatesMembers who terminate employment with their county or district may either elect to leave their accounts with TCDRS or withdraw their accounts . The likelihood that an active member who terminates employment will elect to withdraw varies by length of service and vesting requirement . Sample withdrawal rates are shown in Table 2 .
Members who have already terminated employment and are neither vested nor active with another TCDRS employer are assumed to withdraw their accounts . Otherwise, they are assumed to defer their benefit until retirement eligible .
Disability RatesThere are two types of disability rates, occupational disability rates (predicts disabilities that occur during the performance of job duties) and all-other-causes
TABLE 1: SELECT TERMINATION RATES
Entry Age Years of Male Female Service Low Mid High Low Mid High
20 to 29 0 .265 .331 .397 .287 .359 .431
3 .106 .133 .160 .115 .144 .173
6 .062 .077 .092 .067 .084 .101
9 .044 .055 .066 .048 .060 .072
12 .032 .040 .048 .034 .043 .052
15 .022 .027 .032 .023 .029 .035
30 to 39 0 .219 .274 .329 .237 .296 .355
3 .087 .109 .131 .095 .119 .143
6 .051 .064 .077 .055 .069 .083
9 .037 .046 .055 .039 .049 .059
12 .026 .033 .040 .029 .036 .043
15 .018 .022 .026 .019 .024 .029
40 to 49 0 .196 .245 .294 .212 .265 .318
3 .078 .098 .118 .085 .106 .127
6 .046 .057 .068 .050 .062 .074
9 .033 .041 .049 .035 .044 .053
12 .023 .029 .035 .026 .032 .038
15 .016 .020 .024 .017 .021 .025
TABLE 2: RATES OF WITHDRAWAL UPON TERMINATION
Years of
Vesting Requirement
Service 5 Years 8 Years 10 Years
0 100% 100% 100%
4 100 100 100
6 60 100 100
8 50 50 100
10 48 48 48
15 40 40 40
20 30 30 30
25 20 20 20
Over 28 0 0 0

Texas County & District Retirement System68
RETIREMENT PLAN: SUMMARY OF ACTUARIAL ASSUMPTIONS AND METHODS
disability rates (predicts all disabilities that are not occupational) . Sample disability rates are shown in Table 3 . Before a member is vested, only the occupational disability rates are applicable . For members who are vested, but not eligible for service retirement, the rate of disablement is the sum of the occupational rate and the all-other-causes rate . Rates are assumed to be zero after the member is eligible for service retirement .
Service Retirement RatesRetirement rates predict when active retirement eligible members will commence receiving benefit payments and are based on age . Retirement eligible members age 75 or older are assumed to commence receiving benefits immediately . Sample rates are shown in Table 4, and vary by age .
Non-depositing members are assumed to retire at the later of first retirement eligibility or age 60 .
Mortality RatesDepositing members:
The RP-2000 Active Employee Mortality Table for males with a two-year set-forward and the RP-2000 Active Employee Mortality Table for females with a four-year setback, both projected to 2014 with scale AA and then projected with 110% of the MP-2014 Ultimate scale thereafter .
Service retirees, beneficiaries and non-depositing members:
The RP-2000 Combined Mortality Table projected to 2014 with scale AA and then projected with 110% of the MP-2014 Ultimate scale thereafter, with a one-year set-forward for males and no age adjustment for females .
Disabled retirees:
RP-2000 Disabled Mortality Table projected to 2014 with scale AA and then projected with 110% of the MP-2014 Ultimate scale thereafter, with no age adjustment for males and a two-year set-forward for females .
Investment ReturnAn 8% annual discount rate is used in the valuation based on the expected long-term investment return of 8% . The components of the 8% investment return
assumption are a 3% rate of inflation and a 5% real rate of return . This rate of 8% is net of investment and administrative expenses .
Salary IncreasesThe salary increase assumption predicts salary increases for individuals over their projected careers . These rates vary by the employee’s service and age at hire (entry age) . Annual increase percentages consist of a general wage inflation component of 3 .5% and a merit, promotion and longevity component that varies from 0 .40% to 5 .25% based on entry age and service . The 3 .5% wage inflation component is based on the underlying price inflation assumption of 3 .0% and 0 .5% for assumed increases in productivity . The salary scale varies by entry age, with an approximately 4 .9% average annual increase over a typical employee’s entire career . Because the TCDRS benefit is not based on final average salary, this assumption is generally not as significant as for other defined benefit retirement systems . Refer to Table 5 for sample salary increase rates .
TABLE 4: SERVICE RETIREMENT RATES
Age Male and Female
40–44 .045
45–49 .090
50–51 .100
52–54 .105
55–57 .110
58–59 .120
60 .140
61 .120
62 .250
63 .160
64 .160
65 .300
66 .250
67 .240
68–74 .220
Over 74 1.000
TABLE 3: DISABILITY RATES
Male and Female Male and Female Age Occupational All Other Causes
35 .00001 .00023
40 .00003 .00053
45 .00006 .00086
50 .00009 .00156
55 .00014 .00278
60 .00000 .00000
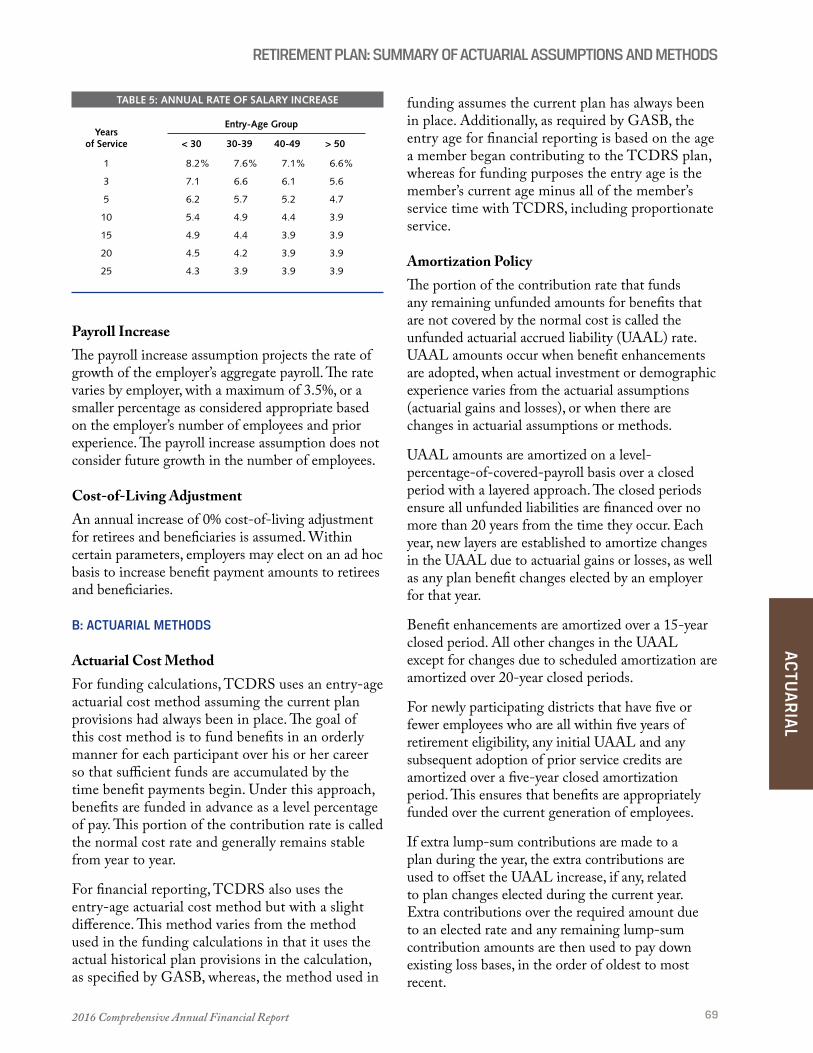
2016 Comprehensive Annual Financial Report 69
AC
TUA
RIA
L
RETIREMENT PLAN: SUMMARY OF ACTUARIAL ASSUMPTIONS AND METHODS
Payroll IncreaseThe payroll increase assumption projects the rate of growth of the employer’s aggregate payroll . The rate varies by employer, with a maximum of 3 .5%, or a smaller percentage as considered appropriate based on the employer’s number of employees and prior experience . The payroll increase assumption does not consider future growth in the number of employees .
Cost-of-Living AdjustmentAn annual increase of 0% cost-of-living adjustment for retirees and beneficiaries is assumed . Within certain parameters, employers may elect on an ad hoc basis to increase benefit payment amounts to retirees and beneficiaries .
B: ACTUARIAL METHODS
Actuarial Cost MethodFor funding calculations, TCDRS uses an entry-age actuarial cost method assuming the current plan provisions had always been in place . The goal of this cost method is to fund benefits in an orderly manner for each participant over his or her career so that sufficient funds are accumulated by the time benefit payments begin . Under this approach, benefits are funded in advance as a level percentage of pay . This portion of the contribution rate is called the normal cost rate and generally remains stable from year to year .
For financial reporting, TCDRS also uses the entry-age actuarial cost method but with a slight difference . This method varies from the method used in the funding calculations in that it uses the actual historical plan provisions in the calculation, as specified by GASB, whereas, the method used in
TABLE 5: ANNUAL RATE OF SALARY INCREASE
Years
Entry-Age Group
of Service < 30 30-39 40-49 > 50
1 8.2% 7.6% 7.1% 6.6%
3 7.1 6.6 6.1 5.6
5 6.2 5.7 5.2 4.7
10 5.4 4.9 4.4 3.9
15 4.9 4.4 3.9 3.9
20 4.5 4.2 3.9 3.9
25 4.3 3.9 3.9 3.9
funding assumes the current plan has always been in place . Additionally, as required by GASB, the entry age for financial reporting is based on the age a member began contributing to the TCDRS plan, whereas for funding purposes the entry age is the member’s current age minus all of the member’s service time with TCDRS, including proportionate service .
Amortization PolicyThe portion of the contribution rate that funds any remaining unfunded amounts for benefits that are not covered by the normal cost is called the unfunded actuarial accrued liability (UAAL) rate . UAAL amounts occur when benefit enhancements are adopted, when actual investment or demographic experience varies from the actuarial assumptions (actuarial gains and losses), or when there are changes in actuarial assumptions or methods .
UAAL amounts are amortized on a level-percentage-of-covered-payroll basis over a closed period with a layered approach . The closed periods ensure all unfunded liabilities are financed over no more than 20 years from the time they occur . Each year, new layers are established to amortize changes in the UAAL due to actuarial gains or losses, as well as any plan benefit changes elected by an employer for that year .
Benefit enhancements are amortized over a 15-year closed period . All other changes in the UAAL except for changes due to scheduled amortization are amortized over 20-year closed periods .
For newly participating districts that have five or fewer employees who are all within five years of retirement eligibility, any initial UAAL and any subsequent adoption of prior service credits are amortized over a five-year closed amortization period . This ensures that benefits are appropriately funded over the current generation of employees .
If extra lump-sum contributions are made to a plan during the year, the extra contributions are used to offset the UAAL increase, if any, related to plan changes elected during the current year . Extra contributions over the required amount due to an elected rate and any remaining lump-sum contribution amounts are then used to pay down existing loss bases, in the order of oldest to most recent .

Texas County & District Retirement System70
RETIREMENT PLAN: SUMMARY OF ACTUARIAL ASSUMPTIONS AND METHODS
Notwithstanding the layered approach, the total UAAL payment may not be less than the required payment obtained by amortizing the entire UAAL over a 20-year period .
If a plan is overfunded, the overfunded actuarial accrued liability (OAAL) is calculated annually using a 30-year open amortization period .
Asset Valuation MethodWhen determining the actuarial value of assets used for determining required plan funding, TCDRS smooths each year’s actuarial investment gains and losses in the following manner . First, to the extent that there is a loss for the year and there are unrecognized gains from previous years, or to the extent that there is a gain for the year and there are unrecognized losses from previous years, the gain or loss for the year shall be used to offset unrecognized gains or losses from previous years in the order of oldest to most recent . Any remaining gain or loss for the year is recognized over a five-year period . For the Dec . 31, 2016 valuation, this approach was applied to all unrecognized gains and losses from prior years . As actuarial asset investment gains and losses are recognized, they become part of the actuarial gains and losses for the year and are funded according to the amortization policy . This method stabilizes employer rates while still resulting in rates that are reasonably reflective of current market conditions .
The board has the ability to set aside reserves from investment earnings that are used to help offset future negative economic cycles . These reserves are held separately and are not counted as part of a participating employer’s plan assets until they are passed through to employers when determined necessary by the board . Reserves help maintain rate stability for employers . In addition, reserves ensure that employers do not adopt benefit increases based on a temporarily lower plan cost at a high point in a market cycle and, conversely, are not as pressured to immediately reduce benefit levels during a low point in a market cycle .
C: CHANGES IN ACTUARIAL ASSUMPTIONS AND METHODS
There were no changes in assumptions reflected in the Dec . 31, 2016 actuarial valuation, but there were changes in methods .
SUMMARY ACTUARIAL DATAFUNDED STATUS AND FUNDING PROGRESS
Pension Trust FundThe funded status of the pension plan as of Dec . 31, 2016, the most recent actuarial valuation date is:
($ Millions)Actuarial Value of Assets (a) $ 26,951 .9Actuarial Accrued Liability (AAL) (b) $ 30,473 .9Unfunded AAL (UAAL) (b-a) $ 3,522 .0Funded Ratio (a/b) 88 .4 %Covered Payroll (c) $ 6,378 .4UAAL as a Percentage of Covered Payroll [(b-a) / c] 55 .2 %
Actuarial valuations of an ongoing plan involve estimates of the value of reported amounts and assumptions about the probability of occurrence of events far into the future . Examples include assumptions about future employment and mortality . Actuarially determined amounts are subject to continual revision as actual results are compared with past expectations and new estimates are made about the future . The schedule of funding progress presents multi-year trend information about whether the actuarial values of plan assets are increasing or decreasing over time relative to the actuarial accrued liabilities for benefits .
The asset valuation method for the Dec . 31, 2016 actuarial valuation is described in Section B . For the prior valuation there was no offsetting of unrecognized gains and unrecognized losses, and all asset gains and losses for a year were recognized over a five-year period .
There was also a change in how extra plan contributions are treated effective with the Dec . 31, 2016 actuarial valuation . The current method is described in the amortization policy in Section B . For the prior valuation, extra contributions were first used to offset increases to the UAAL, if any, related to plan changes elected during the year . Any remaining extra contributions were then incorporated into the actuarial gains or losses for the current year .

2016 Comprehensive Annual Financial Report 71
AC
TUA
RIA
L
RETIREMENT PLAN: SUMMARY ACTUARIAL DATA
TABLE 6: FUNDING PROGRESS
($ Millions)
Actuarial Actuarial Unfunded Annual UAAL as a Actuarial Value of Accrued AAL Funded Covered Percentage of Valuation Assets Liability (AAL)2 (UAAL) Ratio Payroll3 Covered Payroll Date1 (a) (b) (b-a) (a/b) (c) [(b-a)/c]
12/31/07 $ 14,483.0 $ 15,364.5 $ 881.5 94.3% $ 4,420.5 19.9%
12/31/08 14,861.8 16,767.9 1,906.1 88.6 4,830.3 39.5
12/31/094 16,564.2 18,448.1 1,883.9 89.8 5,168.0 36.5
12/31/10 17,808.6 19,931.2 2,122.6 89.4 5,213.9 40.7
12/31/11 19,016.4 21,409.5 2,393.1 88.8 5,202.5 46.0
12/31/12 20,250.3 22,953.0 2,702.7 88.2 5,283.6 51.2
12/31/134 21,912.7 24,514.8 2,602.1 89.4 5,483.8 47.5
12/31/14 23,751.8 26,252.8 2,501.0 90.5 5,779.0 43.3
12/31/15 25,398.8 28,632.5 3,233.7 88.7 6,122.3 52.8
12/31/16 26,951.9 30,473.9 3,522.0 88.4 6,378.4 55.2
1 Each county and district participating in TCDRS is financially responsible for its own plan. Therefore, the aggregate numbers shown above reflect only the aggregate condition of TCDRS and are not indicative of the status of any one plan. The valuations above reflect changes in benefits elected by individual employers.
2 The entry-age actuarial cost method is used for all plans. Each valuation above reflects the actuarial cost method, assumptions and benefits in effect as of the valuation date.3 The annual covered payroll is based on the employee deposits received by TCDRS for the year ending with the valuation date.4 Revised economic and demographic assumptions due to an experience review were first used in this valuation.
TABLE 7: EMPLOYER CONTRIBUTIONS
($ Millions)
Actuarial Minimum Required Contributions (ARC) Actual Contributions
Plan Year Percentage Ended Average Dollar Average Dollar of ARC Dec. 31 Rate Amount Rate Amount Contributed
2007 9.50% $ 420.1 9.73% $ 430.3 102%
2008 9.17 443.0 9.54 460.6 102
2009 9.28 479.8 9.87 510.3 104
2010 10.20 531.8 10.55 550.1 102
2011 9.89 514.6 10.97 570.6 109
2012 10.32 545.2 11.05 583.9 106
2013 10.93 599.4 11.75 644.5 106
2014 11.36 656.7 11.84 684.2 103
2015 11.42 699.0 12.14 743.1 104
2016 11.20 714.2 12.10 771.7 108
Actuarial calculations reflect a long-term perspective . The actuarial methods and assumptions used include techniques that are designed to reduce the effects of short-term volatility in actuarial accrued liabilities and the actuarial values of assets, consistent with the long-term perspective of the calculations .
Additional information as of the latest actuarial valuation for the retirement plan follows:
Valuation Date: Dec . 31, 2016Actuarial Cost Method: Entry-ageAmortization Method: Level percent Unfunded AAL Closed Overfunded AAL OpenRemaining Amortization Period: Unfunded AAL 20 years Overfunded AAL 30 yearsAsset Valuation Method: 5-year smoothed valueActuarial Assumptions: Investment Return 8 .0% Career Average Projected Salary Increases 4 .9% avg .1
Payroll Increase (varies by plan) 3 .5% or less Inflation 3 .0% Cost-of-Living Adjustments 0 .0%1 Includes inflation at the indicated rate .
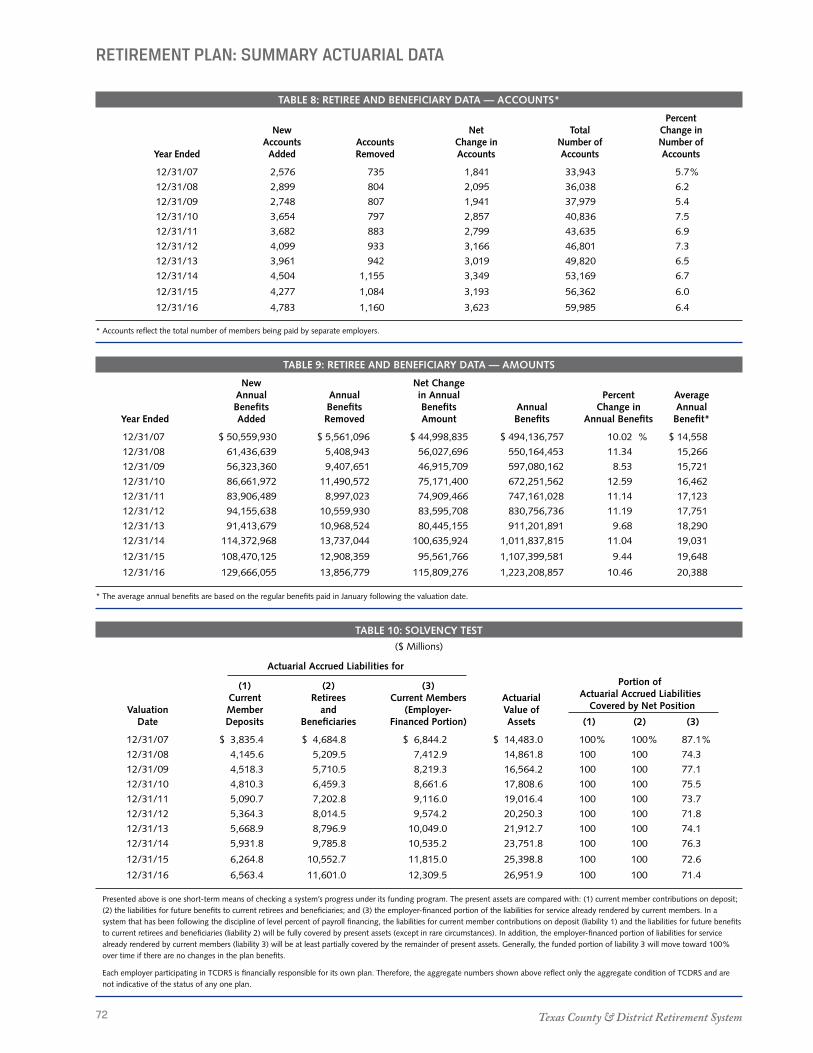
Texas County & District Retirement System72
RETIREMENT PLAN: SUMMARY ACTUARIAL DATA
TABLE 8: RETIREE AND BENEFICIARY DATA — ACCOUNTS*
Percent New Net Total Change in Accounts Accounts Change in Number of Number of Year Ended Added Removed Accounts Accounts Accounts
12/31/07 2,576 735 1,841 33,943 5.7%
12/31/08 2,899 804 2,095 36,038 6.2
12/31/09 2,748 807 1,941 37,979 5.4
12/31/10 3,654 797 2,857 40,836 7.5
12/31/11 3,682 883 2,799 43,635 6.9
12/31/12 4,099 933 3,166 46,801 7.3
12/31/13 3,961 942 3,019 49,820 6.5
12/31/14 4,504 1,155 3,349 53,169 6.7
12/31/15 4,277 1,084 3,193 56,362 6.0
12/31/16 4,783 1,160 3,623 59,985 6.4
* Accounts reflect the total number of members being paid by separate employers.
TABLE 9: RETIREE AND BENEFICIARY DATA — AMOUNTS
New Net Change Annual Annual in Annual Percent Average Benefits Benefits Benefits Annual Change in Annual Year Ended Added Removed Amount Benefits Annual Benefits Benefit*
12/31/07 $ 50,559,930 $ 5,561,096 $ 44,998,835 $ 494,136,757 10.02 % $ 14,558
12/31/08 61,436,639 5,408,943 56,027,696 550,164,453 11.34 15,266
12/31/09 56,323,360 9,407,651 46,915,709 597,080,162 8.53 15,721
12/31/10 86,661,972 11,490,572 75,171,400 672,251,562 12.59 16,462
12/31/11 83,906,489 8,997,023 74,909,466 747,161,028 11.14 17,123
12/31/12 94,155,638 10,559,930 83,595,708 830,756,736 11.19 17,751
12/31/13 91,413,679 10,968,524 80,445,155 911,201,891 9.68 18,290
12/31/14 114,372,968 13,737,044 100,635,924 1,011,837,815 11.04 19,031
12/31/15 108,470,125 12,908,359 95,561,766 1,107,399,581 9.44 19,648
12/31/16 129,666,055 13,856,779 115,809,276 1,223,208,857 10.46 20,388
* The average annual benefits are based on the regular benefits paid in January following the valuation date.
TABLE 10: SOLVENCY TEST
($ Millions)
Actuarial Accrued Liabilities for
(1) (2) (3) Portion of
Current Retirees Current Members Actuarial Actuarial Accrued Liabilities
Valuation Member and (Employer- Value of Covered by Net Position
Date Deposits Beneficiaries Financed Portion) Assets (1) (2) (3)
12/31/07 $ 3,835.4 $ 4,684.8 $ 6,844.2 $ 14,483.0 100% 100% 87.1%
12/31/08 4,145.6 5,209.5 7,412.9 14,861.8 100 100 74.3
12/31/09 4,518.3 5,710.5 8,219.3 16,564.2 100 100 77.1
12/31/10 4,810.3 6,459.3 8,661.6 17,808.6 100 100 75.5
12/31/11 5,090.7 7,202.8 9,116.0 19,016.4 100 100 73.7
12/31/12 5,364.3 8,014.5 9,574.2 20,250.3 100 100 71.8
12/31/13 5,668.9 8,796.9 10,049.0 21,912.7 100 100 74.1
12/31/14 5,931.8 9,785.8 10,535.2 23,751.8 100 100 76.3
12/31/15 6,264.8 10,552.7 11,815.0 25,398.8 100 100 72.6
12/31/16 6,563.4 11,601.0 12,309.5 26,951.9 100 100 71.4
Presented above is one short-term means of checking a system’s progress under its funding program. The present assets are compared with: (1) current member contributions on deposit; (2) the liabilities for future benefits to current retirees and beneficiaries; and (3) the employer-financed portion of the liabilities for service already rendered by current members. In a system that has been following the discipline of level percent of payroll financing, the liabilities for current member contributions on deposit (liability 1) and the liabilities for future benefits to current retirees and beneficiaries (liability 2) will be fully covered by present assets (except in rare circumstances). In addition, the employer-financed portion of liabilities for service already rendered by current members (liability 3) will be at least partially covered by the remainder of present assets. Generally, the funded portion of liability 3 will move toward 100% over time if there are no changes in the plan benefits.
Each employer participating in TCDRS is financially responsible for its own plan. Therefore, the aggregate numbers shown above reflect only the aggregate condition of TCDRS and are not indicative of the status of any one plan.
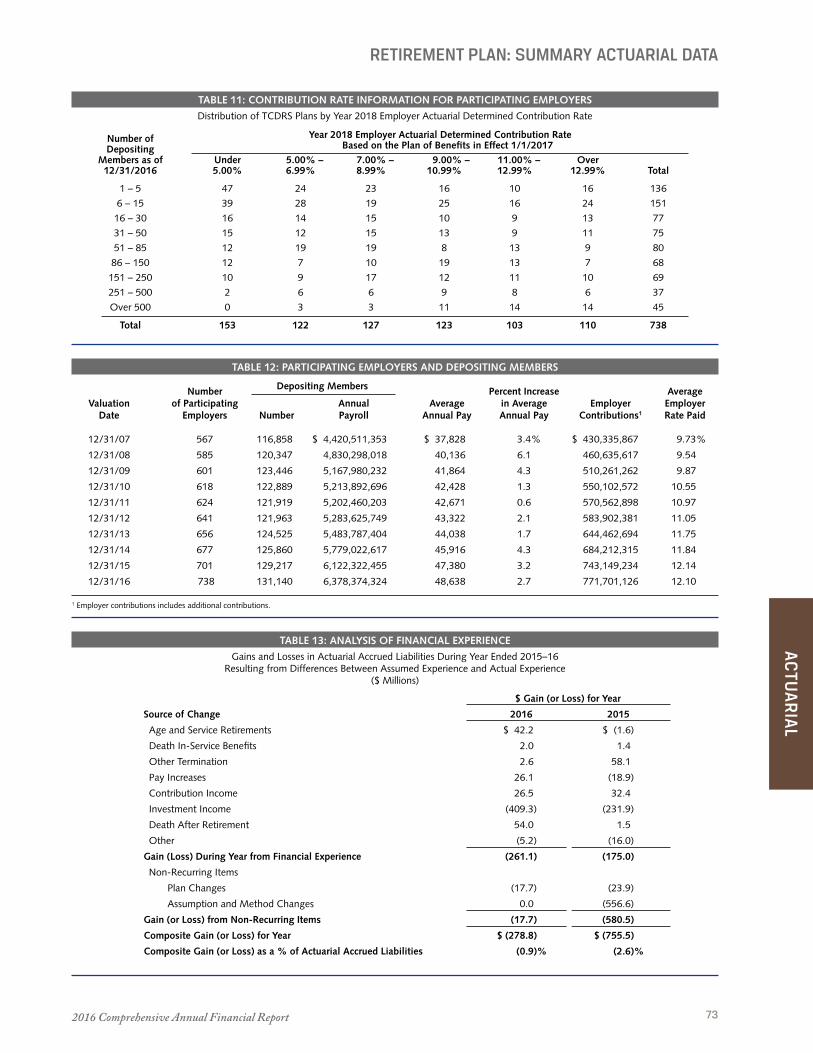
2016 Comprehensive Annual Financial Report 73
AC
TUA
RIA
L
RETIREMENT PLAN: SUMMARY ACTUARIAL DATA
TABLE 13: ANALYSIS OF FINANCIAL EXPERIENCE
Gains and Losses in Actuarial Accrued Liabilities During Year Ended 2015–16 Resulting from Differences Between Assumed Experience and Actual Experience
($ Millions)
$ Gain (or Loss) for Year
Source of Change 2016 2015
Age and Service Retirements $ 42.2 $ (1.6)
Death In-Service Benefits 2.0 1.4
Other Termination 2.6 58.1
Pay Increases 26.1 (18.9)
Contribution Income 26.5 32.4
Investment Income (409.3) (231.9)
Death After Retirement 54.0 1.5
Other (5.2) (16.0)
Gain (Loss) During Year from Financial Experience (261.1) (175.0)
Non-Recurring Items
Plan Changes (17.7) (23.9)
Assumption and Method Changes 0.0 (556.6)
Gain (or Loss) from Non-Recurring Items (17.7) (580.5)
Composite Gain (or Loss) for Year $ (278.8) $ (755.5)
Composite Gain (or Loss) as a % of Actuarial Accrued Liabilities (0.9)% (2.6)%
TABLE 12: PARTICIPATING EMPLOYERS AND DEPOSITING MEMBERS
Number Depositing Members Percent Increase Average Valuation of Participating Annual Average in Average Employer Employer Date Employers Number Payroll Annual Pay Annual Pay Contributions1 Rate Paid
12/31/07 567 116,858 $ 4,420,511,353 $ 37,828 3.4% $ 430,335,867 9.73%
12/31/08 585 120,347 4,830,298,018 40,136 6.1 460,635,617 9.54
12/31/09 601 123,446 5,167,980,232 41,864 4.3 510,261,262 9.87
12/31/10 618 122,889 5,213,892,696 42,428 1.3 550,102,572 10.55
12/31/11 624 121,919 5,202,460,203 42,671 0.6 570,562,898 10.97
12/31/12 641 121,963 5,283,625,749 43,322 2.1 583,902,381 11.05
12/31/13 656 124,525 5,483,787,404 44,038 1.7 644,462,694 11.75
12/31/14 677 125,860 5,779,022,617 45,916 4.3 684,212,315 11.84
12/31/15 701 129,217 6,122,322,455 47,380 3.2 743,149,234 12.14
12/31/16 738 131,140 6,378,374,324 48,638 2.7 771,701,126 12.10
1 Employer contributions includes additional contributions.
TABLE 11: CONTRIBUTION RATE INFORMATION FOR PARTICIPATING EMPLOYERS
Distribution of TCDRS Plans by Year 2018 Employer Actuarial Determined Contribution Rate
Number of Year 2018 Employer Actuarial Determined Contribution Rate Depositing Based on the Plan of Benefits in Effect 1/1/2017 Members as of Under 5.00% – 7.00% – 9.00% – 11.00% – Over 12/31/2016 5.00% 6.99% 8.99% 10.99% 12.99% 12.99% Total
1 – 5 47 24 23 16 10 16 136
6 – 15 39 28 19 25 16 24 151
16 – 30 16 14 15 10 9 13 77
31 – 50 15 12 15 13 9 11 75
51 – 85 12 19 19 8 13 9 80
86 – 150 12 7 10 19 13 7 68
151 – 250 10 9 17 12 11 10 69
251 – 500 2 6 6 9 8 6 37
Over 500 0 3 3 11 14 14 45
Total 153 122 127 123 103 110 738

Texas County & District Retirement System74
RETIREMENT PLAN: SUMMARY OF PLAN PROVISIONS
A: ORGANIZATION
TCDRS is a statewide, agent multiple-employer, public-employee retirement system that provides the employees of participating counties and districts with retirement, disability and survivor benefits . Each county or district that participates in TCDRS maintains its own customized plan of benefits which may be changed annually . The governing body of each employer has the option to adopt or change plan provisions based on their needs and budget .
Each employer has a savings-based defined benefit plan where member benefits are based on each member’s account balance at retirement and employer matching . All plan assets are pooled for investment purposes, but each employer’s plan assets may be used only for the payment of benefits to the members of that employer’s plan . This summary describes the plan provisions in general terms . Any questions related to the actual administration, provisions or policies of the retirement plans should be directed to TCDRS .
B: MEMBERSHIP
All full- and part-time non-temporary employees become members in TCDRS, regardless of the number of hours they work in a year . Employees in a temporary position are not eligible for membership .
C: TERMINATION OF MEMBER ACCOUNTS
TCDRS member accounts are terminated by a member’s death, retirement or withdrawal .
D: MEMBER DEPOSITS
TCDRS is a savings-based plan . Every paycheck, a portion of each employee’s pay — from 4% to 7% as set by the employer — is deposited into his or her TCDRS account . By law, member accounts earn 7% interest annually .
E: SERVICE
Members receive a month of service for each month that they make a deposit into their account . Service may also be granted for periods of employment prior to the employer joining TCDRS, and for military and certain other service .
Within TCDRS, all periods of service with any
TCDRS participating employers are combined . Also, service periods with other Texas public retirement plans participating with TCDRS in the Texas Proportionate Retirement Program are combined to satisfy TCDRS retirement eligibility and vesting requirements .
F: ELIGIBILITY REQUIREMENTS
Service Retirement BenefitsThe amount of service a member needs to earn a future monthly benefit is called the vesting requirement . When a member is vested, he or she has the right to a monthly benefit at age 60 or older . Employers may choose 5-, 8- or 10-year vesting . In addition, members may retire before age 60 if they meet one of the following requirements, set by the employer:
• “Rule of ” eligibility: Under these rules, vested members can retire if their age plus years of service time add up to at least 75 or 80 .
• 20-year or 30-year retirement at any age: This lets members retire when they have at least 20 or 30 years of service time .
Disability Retirement BenefitsA member who is vested and who is totally and permanently disabled is eligible for an immediate disability retirement benefit . A member who is not vested is eligible for an immediate disability retirement benefit if the total and permanent disability was a result of an on-the-job injury .
Survivor BenefitsBenefits are payable to the beneficiaries or estate of a deceased member . The eligibility requirement for an employer-provided survivor benefit is four years of TCDRS service . Otherwise, the survivor benefit is the deceased member’s account balance .
G: DETERMINATION OF RETIREMENT BENEFITS
The service or disability retirement benefit is calculated based on the member’s account balance and employer matching as selected by the employer, and may include other employer provided funds . The employer matching can range from a “dollar for dollar,” up to $2 .50 per $1 .00 in the member’s account . The member’s account and employer
2016 Comprehensive Annual Financial Report 75
AC
TUA
RIA
L
RETIREMENT PLAN: SUMMARY OF PLAN PROVISIONS
provided funds are combined and converted to a lifetime annuity . The retiree receives a payment every month for the rest of his or her life . Conversions to a lifetime annuity are based on a 7% discount rate and the following mortality assumptions:
• The portion of the benefit that accrues before 2018, including member deposits made before 2018 and interest and employer matching on those deposits, shall be calculated based on the UP-1984 table with an age setback of five years for retirees and an age setback of 10 years for beneficiaries, with a 30% reserve refund assumption for the single life option .
• The portion of the benefit that accrues after 2017, including member deposits made after 2017 and interest and employer matching on those depos-its, shall be calculated on a generational mortality basis using the RP-2000 Combined Mortality Table, with a one-year set-forward for males and no set-forward for females, projected to 2014 us-ing Scale AA and for projections after 2014 using 110% of MP-2014 Ultimate Projection Scale, with a 32 .79% reserve refund assumption for the single life option . Mortality assumptions for these calculations are blended 50% male and 50% female for retirees, and blended 30% male and 70% female for beneficiaries .
Retirees elect to receive their monthly lifetime benefit by choosing from one of the following seven actuarially equivalent payment options:
• Single Life option – Monthly payments cease upon death of the retiree . This option provides the highest monthly benefit .
• Guaranteed Term Benefit options – The two guaranteed term benefit options are 10-year guaranteed term and 15-year guaranteed term . These options provide a lifetime monthly benefit to the retiree . In addition, if the retiree passes away within 10 or 15 years of the retirement date, the beneficiary will receive the monthly benefit until the end of the guaranteed term .
• Dual Life options – The four dual life options are 100% to beneficiary, 75% to beneficiary, 50% to beneficiary and 100% to beneficiary with pop-up . Under each of these options, after the death of the retiree, the beneficiary receives a monthly lifetime benefit equal to the selected percentage of the retiree’s benefit payment . Under the 100% to
beneficiary with pop-up option, if the beneficiary dies before the retiree, the monthly benefit amount will “pop up” to a higher monthly amount, as if the retiree had retired under the single life option .
All options pay a death benefit equal to the excess of the person’s account at retirement over the total monthly benefits that have been paid .
Each employer may allow partial lump-sum payments . This allows the retiring member to receive an immediate lump-sum payment not to exceed his or her account balance, and choose a reduced monthly lifetime benefit from any of the payment options .
H: FUNDING PROVISIONS
Contributions are made monthly by both the employees and the employers based on covered payroll .
Each year the actuary determines the required contribution rate for the following year to adequately fund each employer’s benefit plan using the actuarial methods described beginning on page 67 . Employers may also elect to fund at a rate higher than the required rate, and may also make additional lump-sum contributions .
I: CHANGES IN PROVISIONS
There were changes in plan provisions that are reflected in the Dec . 31, 2016 actuarial valuation . State legislation passed in 2015 and effective Jan . 1, 2017, alters fund accounting related to annuitants . Note that these changes do not impact benefit amounts but do affect the actuarial valuation .
Prior to the 2015 legislation, when a member retired, the member’s account balance in the ESF plus an equal amount from the employer’s SAF account was transferred to the CSARF, a system-wide fund . This transfer funded a portion of the retiree’s benefit, with monthly payments for this portion being paid from the CSARF, and the remainder of the retiree’s monthly benefit being paid from the employer’s SAF account .
The 2015 legislation changed this structure . Effective with 2017 retirements, there is no transfer of funds to the CSARF at retirement . Instead the member’s account balance in the ESF is transferred to the
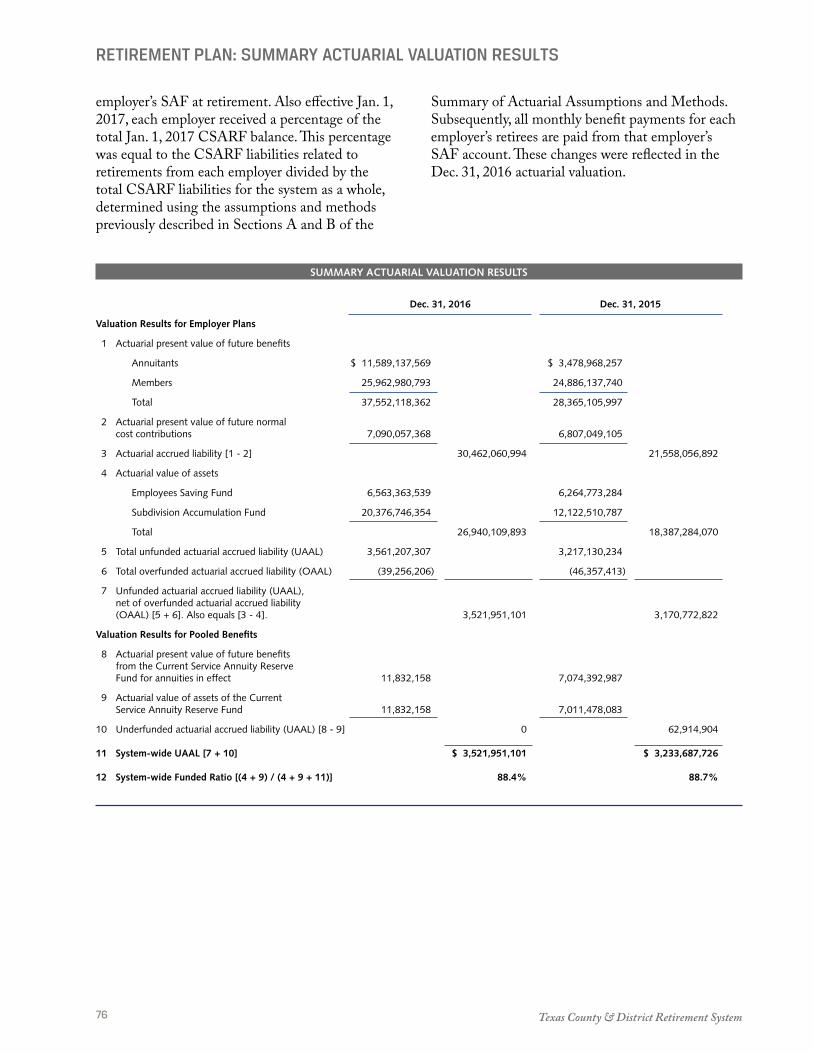
Texas County & District Retirement System76
RETIREMENT PLAN: SUMMARY ACTUARIAL VALUATION RESULTS
SUMMARY ACTUARIAL VALUATION RESULTS
Dec. 31, 2016 Dec. 31, 2015
Valuation Results for Employer Plans
1 Actuarial present value of future benefits
Annuitants $ 11,589,137,569 $ 3,478,968,257
Members 25,962,980,793 24,886,137,740
Total 37,552,118,362 28,365,105,997
2 Actuarial present value of future normal cost contributions 7,090,057,368 6,807,049,105
3 Actuarial accrued liability [1 - 2] 30,462,060,994 21,558,056,892
4 Actuarial value of assets
Employees Saving Fund 6,563,363,539 6,264,773,284
Subdivision Accumulation Fund 20,376,746,354 12,122,510,787
Total 26,940,109,893 18,387,284,070
5 Total unfunded actuarial accrued liability (UAAL) 3,561,207,307 3,217,130,234
6 Total overfunded actuarial accrued liability (OAAL) (39,256,206) (46,357,413)
7 Unfunded actuarial accrued liability (UAAL), net of overfunded actuarial accrued liability (OAAL) [5 + 6]. Also equals [3 - 4]. 3,521,951,101 3,170,772,822
Valuation Results for Pooled Benefits
8 Actuarial present value of future benefits from the Current Service Annuity Reserve Fund for annuities in effect 11,832,158 7,074,392,987
9 Actuarial value of assets of the Current Service Annuity Reserve Fund 11,832,158 7,011,478,083
10 Underfunded actuarial accrued liability (UAAL) [8 - 9] 0 62,914,904
11 System-wide UAAL [7 + 10] $ 3,521,951,101 $ 3,233,687,726
12 System-wide Funded Ratio [(4 + 9) / (4 + 9 + 11)] 88.4% 88.7%
employer’s SAF at retirement . Also effective Jan . 1, 2017, each employer received a percentage of the total Jan . 1, 2017 CSARF balance . This percentage was equal to the CSARF liabilities related to retirements from each employer divided by the total CSARF liabilities for the system as a whole, determined using the assumptions and methods previously described in Sections A and B of the
Summary of Actuarial Assumptions and Methods . Subsequently, all monthly benefit payments for each employer’s retirees are paid from that employer’s SAF account . These changes were reflected in the Dec . 31, 2016 actuarial valuation .

2016 Comprehensive Annual Financial Report 77
AC
TUA
RIA
L

Texas County & District Retirement System78
GTLF: SUMMARY OF ACTUARIAL ASSUMPTIONS, METHODS AND DATA
A: ACTUARIAL ASSUMPTIONS AND METHODS
Except for the mortality assumptions, the actuarial assumptions described below for the Group Term Life plan, an other post-employment benefit (OPEB) plan, were developed from an actuarial investigation of the experience of TCDRS over the years 2009-2012 . They were recommended by Milliman, Inc ., adopted by the TCDRS Board of Trustees in 2013 and first used in the Dec . 31, 2013 actuarial valuation . The mortality assumptions were developed by Milliman, Inc . and adopted by the TCDRS Board of Trustees in 2015, and first used in the Dec . 31, 2015 actuarial valuation .
Termination Rates
Same as for retirement plan .
Withdrawal Rates
Same as for retirement plan .
Disability Rates
Same as for retirement plan .
Service Retirement Rates
Same as for retirement plan .
Mortality Rates
Same as for retirement plan .
Investment Return
The rate of return is 7%, which is a statutory allocation and is not dependent on investment earnings .
Salary Increases
Same as for retirement plan .
Actuarial Value of Assets
All assets are valued at fund value . The fund’s assets are pooled with those of the Pension Trust Fund under provisions of the TCDRS Act .
Actuarial Cost Method
For funding purposes, the unit credit cost method is used for determining the cost of one-year term life insurance for both active employees and retirees . The only demographic assumptions used for determining
funding requirements are active employee mortality rates and retiree mortality rates .
For accounting reporting purposes, the unit credit cost method for determining one-year term life insurance is used for the active insurance benefit . Thus, the normal cost is equal to the active premium rate . For the retiree Group Term Life benefit, the entry-age actuarial cost method is used . The normal cost rate used in the valuation was calculated based on all current employees who are covered under the Group Term Life program, but only if the participating employer also covers its retirees . The aggregate normal cost is the ratio of the actuarial present value of projected insurance benefits payable after retirement to the projected salaries of all employees covered by the Group Term Life program . The total Group Term Life normal cost is the sum of this normal cost and the entry-age normal cost for the retiree insurance benefit .
Changes in Actuarial Assumptions and MethodsThere were no changes in assumptions or methods reflected in the Dec . 31, 2016 Group Term Life Plan actuarial valuation .
B: PLAN PROVISIONS
Participation in the Group Term Life PlanEmployers who participate in the TCDRS retirement plan may elect to participate in the Group Term Life plan . Employers may elect to cover members who are active employees only or both members who are active employees and retirees, and may elect to change or discontinue coverage annually .
Benefit EligibilityThe county or district must have elected the applicable Group Term Life coverage for the calendar year in which a member who is an active employee or retiree dies .
Amount of Insurance BenefitIf death occurs while the member is actively employed, the benefit is an amount equal to the employee’s most recent regular annualized salary . The insurance benefit payable to retirees is $5,000 .

2016 Comprehensive Annual Financial Report 79
AC
TUA
RIA
L
GTLF: SUMMARY OF ACTUARIAL ASSUMPTIONS, METHODS AND DATA
TABLE 14: GTLF — RETIREES COVERED
Total Percent New Retirees Net Change Number of Change in Year Ended Retirees Added Removed in Retirees Retirees1 Number Covered
12/31/11 555 4,806 (4,251) 5,814 (42.2)%
12/31/12 623 136 487 6,301 8.4
12/31/13 618 196 422 6,723 6.7
12/31/14 676 183 493 7,216 7.3
12/31/15 639 203 436 7,652 6.0
12/31/16 797 254 543 8,195 7.1
1 A single individual may have coverage with more than one participating employer.
TABLE 15: GTLF — RETIREES COVERAGE AMOUNTS
New Net Change Annual Annual in Annual Annual Percent Average Coverage Coverage Coverage Coverage Change in Annual Coverage Year Ended Added Removed Amount Amount1 Annual Coverage Per Retiree
12/31/11 $ 2,775,000 $ 24,030,000 $ (21,255,000) $ 29,070,000 (42.2)% $ 5,000
12/31/12 3,115,000 680,000 2,435,000 31,505,000 8.4 5,000
12/31/13 3,090,000 980,000 2,110,000 33,615,000 6.7 5,000
12/31/14 3,380,000 915,000 2,465,000 36,080,000 7.3 5,000
12/31/15 3,195,000 1,015,000 2,180,000 38,260,000 6.0 5,000
12/31/16 3,985,000 1,270,000 2,715,000 40,975,000 7.1 5,000
1 A single individual may have coverage with more than one participating employer.
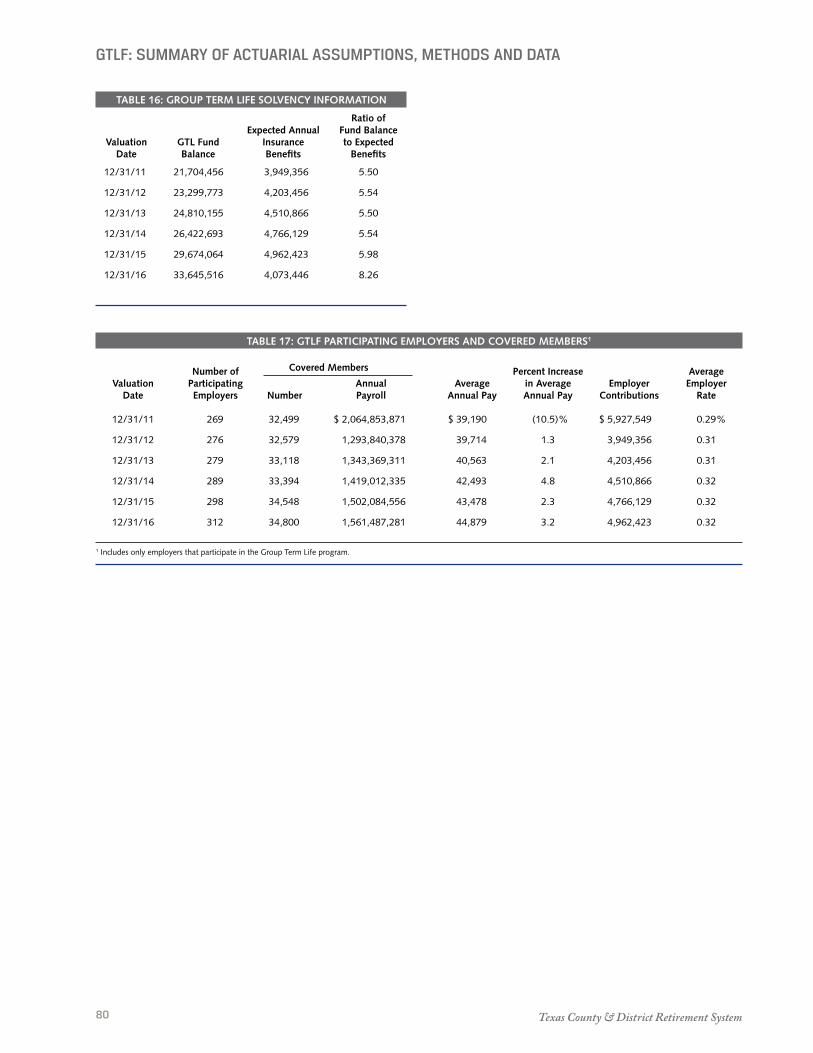
Texas County & District Retirement System80
TABLE 16: GROUP TERM LIFE SOLVENCY INFORMATION
Ratio of Expected Annual Fund Balance Valuation GTL Fund Insurance to Expected Date Balance Benefits Benefits
12/31/11 21,704,456 3,949,356 5.50
12/31/12 23,299,773 4,203,456 5.54
12/31/13 24,810,155 4,510,866 5.50
12/31/14 26,422,693 4,766,129 5.54
12/31/15 29,674,064 4,962,423 5.98
12/31/16 33,645,516 4,073,446 8.26
GTLF: SUMMARY OF ACTUARIAL ASSUMPTIONS, METHODS AND DATA
TABLE 17: GTLF PARTICIPATING EMPLOYERS AND COVERED MEMBERS1
Number of Covered Members Percent Increase Average Valuation Participating Annual Average in Average Employer Employer Date Employers Number Payroll Annual Pay Annual Pay Contributions Rate
12/31/11 269 32,499 $ 2,064,853,871 $ 39,190 (10.5)% $ 5,927,549 0.29%
12/31/12 276 32,579 1,293,840,378 39,714 1.3 3,949,356 0.31
12/31/13 279 33,118 1,343,369,311 40,563 2.1 4,203,456 0.31
12/31/14 289 33,394 1,419,012,335 42,493 4.8 4,510,866 0.32
12/31/15 298 34,548 1,502,084,556 43,478 2.3 4,766,129 0.32
12/31/16 312 34,800 1,561,487,281 44,879 3.2 4,962,423 0.32
1 Includes only employers that participate in the Group Term Life program.
By counties and districts coming together to administer retirement benefits, they benefit from economies of scale and low-cost investing. Our operating costs are one-quarter of one percent of assets using a five-year average. We do not charge fees to employers or members.
0.25%OPERATINGCOSTS
5 Statistical

Texas County & District Retirement System82
INTRODUCTION
The Statistical Section provides additional detail to assist you in interpreting the information in the Financial Statements, Notes to Financial Statements and Required Supplementary Information . The information is presented in two main categories: Financial Trends Data and Demographic and Operating Information .
The Financial Trends Data illustrates how TCDRS’ financial position has changed over time . The changes in net position for the last 10 fiscal years show additions by source, deductions by type and the total change in Pension Trust Fund and Group Term Life Fund (GTLF) net position for each year . The pension benefit expenses by type gives data on benefits paid and withdrawal deductions for the last 10 fiscal years .
The Demographic and Operating Information provides details about TCDRS’ operations and membership . The schedule of New Retiree Average Benefits gives the average monthly benefit and number of retired members, organized by five-year increments of credited service, for the last 10 fiscal years . Data is given for both pension benefits and for GTLF benefit payments . This section also includes information on the number of annuitants grouped by age and by type of benefits, along with a description of the retirement payment options . The schedule of largest participating employers compares the number of current members for those employers for the most recent year-end and as of nine years ago .
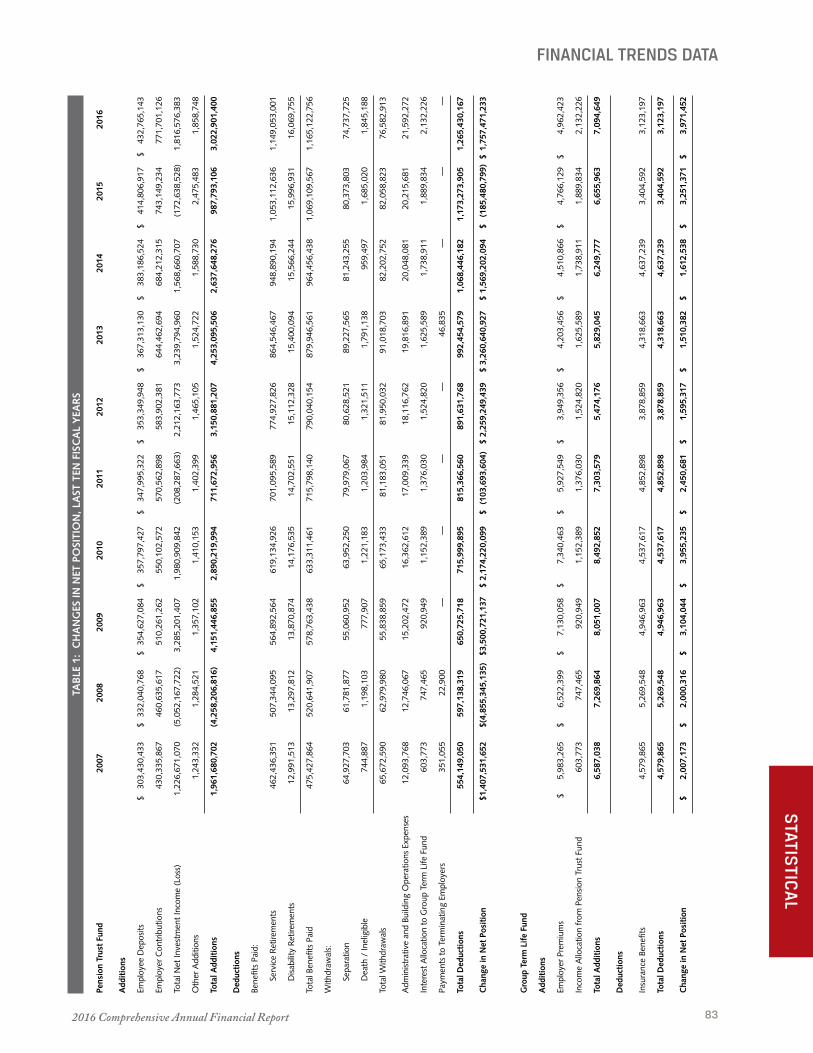
2016 Comprehensive Annual Financial Report 83
STATIS
TICA
L
FINANCIAL TRENDS DATATA
BLE
1:
CH
AN
GES
IN N
ET P
OSI
TIO
N, L
AST
TEN
FIS
CA
L Y
EAR
S
Pens
ion
Trus
t Fu
nd
2007
20
08
2009
20
10
2011
20
12
2013
20
14
2015
20
16
Add
itio
ns
Empl
oyee
Dep
osits
$
30
3,43
0,43
3
$
332,
040,
768
$
35
4,62
7,08
4
$
357,
797,
427
$
34
7,99
5,32
2
$
353,
349,
948
$
36
7,31
3,13
0
$
383,
186,
524
$
41
4,80
6,91
7
$
432,
765,
143
Empl
oyer
Con
trib
utio
ns
43
0,33
5,86
7
46
0,63
5,61
7
51
0,26
1,26
2
55
0,10
2,57
2
57
0,56
2,89
8
58
3,90
2,38
1
64
4,46
2,69
4
68
4,21
2,31
5
74
3,14
9,23
4
7
71,7
01,1
26
Tota
l Net
Inve
stm
ent I
ncom
e (L
oss)
1,22
6,67
1,07
0
(5,
052,
167,
722)
3,28
5,20
1,40
7
1,
980,
909,
842
(208
,287
,663
)
2,21
2,16
3,77
3
3,
239,
794,
960
1,56
8,66
0,70
7
(1
72,6
38,5
28)
1
,816
,576
,383
Oth
er A
dditi
ons
1,24
3,33
2
1,
284,
521
1,35
7,10
2
1,
410,
153
1,40
2,39
9
1,
465,
105
1,52
4,72
2
1,
588,
730
2,47
5,48
3
1
,858
,748
Tota
l Add
itio
ns
1,
961,
680,
702
(4,
258,
206,
816)
4,15
1,44
6,85
5
2,
890,
219,
994
711,
672,
956
3,15
0,88
1,20
7
4,
253,
095,
506
2,63
7,64
8,27
6
98
7,79
3,10
6
3
,022
,901
,400
Ded
ucti
ons
Bene
fits
Paid
:
Se
rvic
e R
etire
men
ts
46
2,43
6,35
1
50
7,34
4,09
5
56
4,89
2,56
4
61
9,13
4,92
6
70
1,09
5,58
9
77
4,92
7,82
6
86
4,54
6,46
7
94
8,89
0,19
4
1,
053,
112,
636
1,14
9,05
3,00
1
D
isabi
lity
Ret
irem
ents
12,9
91,5
13
13
,297
,812
13,8
70,8
74
14
,176
,535
14,7
02,5
51
15
,112
,328
15,4
00,0
94
15
,566
,244
15,9
96,9
31
1
6,06
9,75
5
Tota
l Ben
efits
Pai
d
47
5,42
7,86
4
52
0,64
1,90
7
57
8,76
3,43
8
63
3,31
1,46
1
71
5,79
8,14
0
79
0,04
0,15
4
87
9,94
6,56
1
96
4,45
6,43
8
1,
069,
109,
567
1,1
65,1
22,7
56
With
draw
als:
Se
para
tion
64,9
27,7
03
61
,781
,877
55,0
60,9
52
63
,952
,250
79,9
79,0
67
80
,628
,521
89,2
27,5
65
81
,243
,255
80,3
73,8
03
7
4,73
7,72
5
D
eath
/ In
elig
ible
744,
887
1,19
8,10
3
77
7,90
7
1,
221,
183
1,20
3,98
4
1,
321,
511
1,79
1,13
8
95
9,49
7
1,
685,
020
1,8
45,1
88
Tota
l With
draw
als
65,6
72,5
90
62
,979
,980
55,8
38,8
59
65
,173
,433
81,1
83,0
51
81
,950
,032
91,0
18,7
03
82
,202
,752
82,0
58,8
23
7
6,58
2,91
3
Adm
inist
rativ
e an
d Bu
ildin
g O
pera
tions
Exp
ense
s
12,0
93,7
68
12
,746
,067
15,2
02,4
72
16
,362
,612
17,0
09,3
39
18
,116
,762
19,8
16,8
91
20
,048
,081
20,2
15,6
81
2
1,59
2,27
2
Inte
rest
Allo
catio
n to
Gro
up T
erm
Life
Fun
d
603,
773
747,
465
920,
949
1,15
2,38
9
1,
376,
030
1,52
4,82
0
1,
625,
589
1,73
8,91
1
1,
889,
834
2,1
32,2
26
Paym
ents
to T
erm
inat
ing
Empl
oyer
s
351,
055
22,9
00
—
—
—
—
46
,835
—
—
—
Tota
l Ded
ucti
ons
55
4,14
9,05
0
59
7,13
8,31
9
65
0,72
5,71
8
71
5,99
9,89
5
81
5,36
6,56
0
89
1,63
1,76
8
99
2,45
4,57
9
1,
068,
446,
182
1,17
3,27
3,90
5
1
,265
,430
,167
Cha
nge
in N
et P
osit
ion
$
1,40
7,53
1,65
2
$ (4
,855
,345
,135
) $
3,50
0,72
1,13
7
$ 2,
174,
220,
099
$
(1
03,6
93,6
04)
$ 2
,259
,249
,439
$
3,2
60,6
40,9
27
$ 1
,569
,202
,094
$
(1
85,4
80,7
99)
$ 1,
757,
471,
233
Gro
up T
erm
Lif
e Fu
nd
Add
itio
ns
Empl
oyer
Pre
miu
ms
$
5,98
3,26
5
$
6,52
2,39
9
$
7,13
0,05
8
$
7,34
0,46
3
$
5,92
7,54
9
$
3,94
9,35
6
$
4,20
3,45
6
$
4,51
0,86
6
$
4,76
6,12
9 $
4,96
2,42
3
Inco
me
Allo
catio
n fr
om P
ensio
n Tr
ust F
und
60
3,77
3
74
7,46
5
92
0,94
9
1,
152,
389
1,37
6,03
0
1,
524,
820
1,62
5,58
9
1,
738,
911
1,88
9,83
4
2
,132
,226
Tota
l Add
itio
ns
6,
587,
038
7,26
9,86
4
8,
051,
007
8,49
2,85
2
7,
303,
579
5,47
4,17
6
5,
829,
045
6,24
9,77
7
6,
655,
963
7,0
94,6
49
Ded
ucti
ons
Insu
ranc
e Be
nefit
s
4,57
9,86
5
5,
269,
548
4,94
6,96
3
4,
537,
617
4,85
2,89
8
3,
878,
859
4,31
8,66
3
4,
637,
239
3,40
4,59
2
3
,123
,197
Tota
l Ded
ucti
ons
4,
579,
865
5,26
9,54
8
4,
946,
963
4,53
7,61
7
4,
852,
898
3,87
8,85
9
4,
318,
663
4,63
7,23
9
3,
404,
592
3,1
23,1
97
Cha
nge
in N
et P
osit
ion
$
2,00
7,17
3
$
2,00
0,31
6
$
3,10
4,04
4
$
3,95
5,23
5
$
2,45
0,68
1
$
1,59
5,31
7
$
1,51
0,38
2
$
1,61
2,53
8
$
3,25
1,37
1
$ 3,
971,
452

Texas County & District Retirement System84
FINANCIAL TRENDS DATA
FIGURE 1: ADDITIONS BY SOURCE — 2016 FIGURE 2: DEDUCTIONS BY TYPE — 2016
Benefi ts Paid to Annuitants92.07%
$1,165.1 million
2007 2008 2009 2010 2011 2012 2013 2014 2015 2016
$1,400
$1,300
$1,200
$1,100
$1,000
$900
$800
$700
$600
$500
$400
$300
$200
$100
$ 0
With
drawals
$7
6.6 m
illion
6.05%
Administrative and Miscellaneous
$23.7 million
1.87%
WITHDRAWALS
BENEFITS PAID
Net Investment Income60.09%
$1,816.6 million
Mis
cella
neou
s$1
.9 m
illio
n0.
06%
Empl
oyee
Dep
osits
$432
.8 m
illion
14.3
2%
Employer Contributions
$771.7 million25.53%
FIGURE 3: BENEFIT EXPENSES BY TYPE
($ Millions)
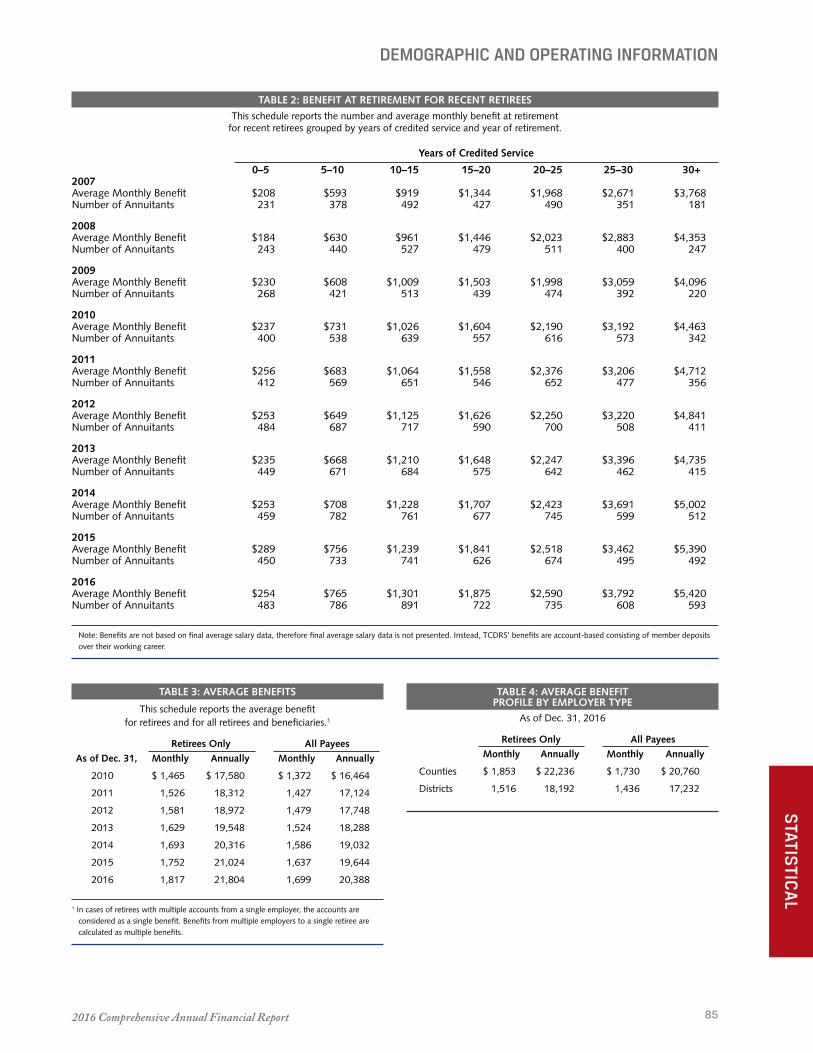
2016 Comprehensive Annual Financial Report 85
STATIS
TICA
L
DEMOGRAPHIC AND OPERATING INFORMATION
TABLE 3: AVERAGE BENEFITS
This schedule reports the average benefit for retirees and for all retirees and beneficiaries.1
Retirees Only All Payees
As of Dec. 31, Monthly Annually Monthly Annually
2010 $ 1,465 $ 17,580 $ 1,372 $ 16,464
2011 1,526 18,312 1,427 17,124
2012 1,581 18,972 1,479 17,748
2013 1,629 19,548 1,524 18,288
2014 1,693 20,316 1,586 19,032
2015 1,752 21,024 1,637 19,644
2016 1,817 21,804 1,699 20,388
1 In cases of retirees with multiple accounts from a single employer, the accounts are considered as a single benefit. Benefits from multiple employers to a single retiree are calculated as multiple benefits.
TABLE 4: AVERAGE BENEFIT PROFILE BY EMPLOYER TYPE
As of Dec. 31, 2016
Retirees Only All Payees
Monthly Annually Monthly Annually
Counties $ 1,853 $ 22,236 $ 1,730 $ 20,760
Districts 1,516 18,192 1,436 17,232
TABLE 2: BENEFIT AT RETIREMENT FOR RECENT RETIREES
This schedule reports the number and average monthly benefit at retirement for recent retirees grouped by years of credited service and year of retirement.
Years of Credited Service
0–5 5–10 10–15 15–20 20–25 25–30 30+2007 Average Monthly Benefit $208 $593 $919 $1,344 $1,968 $2,671 $3,768 Number of Annuitants 231 378 492 427 490 351 181
2008 Average Monthly Benefit $184 $630 $961 $1,446 $2,023 $2,883 $4,353 Number of Annuitants 243 440 527 479 511 400 247
2009 Average Monthly Benefit $230 $608 $1,009 $1,503 $1,998 $3,059 $4,096 Number of Annuitants 268 421 513 439 474 392 220
2010 Average Monthly Benefit $237 $731 $1,026 $1,604 $2,190 $3,192 $4,463 Number of Annuitants 400 538 639 557 616 573 342
2011 Average Monthly Benefit $256 $683 $1,064 $1,558 $2,376 $3,206 $4,712 Number of Annuitants 412 569 651 546 652 477 356
2012 Average Monthly Benefit $253 $649 $1,125 $1,626 $2,250 $3,220 $4,841 Number of Annuitants 484 687 717 590 700 508 411
2013 Average Monthly Benefit $235 $668 $1,210 $1,648 $2,247 $3,396 $4,735 Number of Annuitants 449 671 684 575 642 462 415
2014 Average Monthly Benefit $253 $708 $1,228 $1,707 $2,423 $3,691 $5,002 Number of Annuitants 459 782 761 677 745 599 512
2015 Average Monthly Benefit $289 $756 $1,239 $1,841 $2,518 $3,462 $5,390 Number of Annuitants 450 733 741 626 674 495 492
2016 Average Monthly Benefit $254 $765 $1,301 $1,875 $2,590 $3,792 $5,420 Number of Annuitants 483 786 891 722 735 608 593
Note: Benefits are not based on final average salary data, therefore final average salary data is not presented. Instead, TCDRS’ benefits are account-based consisting of member deposits over their working career.

Texas County & District Retirement System86
DEMOGRAPHIC AND OPERATING INFORMATION
TABLE 5: ANNUITANTS BY TYPE OF BENEFIT
Annuitants Retirement Option Selected
$ 0 – 499 10,035 3,745 5,330 3,051 1,518 335 1,127 159 1,469 667 125
500 – 999 11,014 2,418 5,263 2,927 1,653 413 1,209 68 1,103 657 139
1,000 – 1,499 7,997 1,199 3,360 1,907 1,345 350 994 69 664 406 100
1,500 – 1,999 5,715 658 2,378 1,213 908 352 745 47 380 282 68
2,000 – 2,499 4,293 383 1,724 895 687 211 639 18 271 199 32
2,500 – 2,999 3,048 239 1,243 595 518 169 429 11 173 130 21
3,000 – 3,499 2,281 166 888 460 353 141 345 10 129 103 18
3,500 – 3,999 1,614 96 662 305 242 87 243 3 92 70 8
4,000 – 4,499 1,208 69 472 245 198 75 162 2 57 63 4
4,500 – 4,999 858 35 343 157 112 56 150 2 37 32 4
5,000 – 5,499 721 32 284 137 92 53 114 2 27 43 2
5,500 – 5,999 502 12 194 96 76 45 67 0 18 18 0
6,000 – 6,499 405 9 153 69 49 34 75 2 13 19 0
6,500 – 6,999 259 10 96 51 32 23 41 0 13 13 1
7,000 & Over 935 30 312 199 103 84 182 2 41 41 1
Subtotals 50,884 9,101 22,701 12,306 7,886 2,427 6,522 394 4,485 2,742 523
Totals 59,985 59,985
1 Retirement payment option is no longer available to new retirees.
Amount of Monthly Benefit Reti
ree
Bene
ficiar
y
Single
Life
100%
to Be
nefic
iary
100%
to Be
nefic
iary
w
ith Po
p-up
75%
to Be
nefic
iary
50%
to Be
nefic
iary
25%
to Be
nefic
iary1
15-y
ear G
uaran
tee
10-y
ear G
uaran
tee
5-ye
ar Gua
rantee
1
RETIREMENT BENEFIT PAYMENT OPTIONS
All options pay the retiree a monthly benefit for life and, when a retiree passes away, guarantee that the total benefit paid will equal, at a minimum, the total accumulated contributions of the retiree .
Single LifePayments cease upon the death of the retiree .
15-year Guaranteed TermIf the retiree dies within 15 years of retirement, the beneficiary will receive the same monthly payment as the retiree for the balance of the 15-year period, at which time payments cease .
10-year Guaranteed Term
If the retiree dies within 10 years of retirement, the beneficiary will receive the same monthly payment as the retiree for the balance of the 10-year period, at which time payments cease .
50% to BeneficiaryAt the death of the retiree, the beneficiary will receive 50% of the retiree’s monthly payment throughout the beneficiary’s life .
75% to BeneficiaryAt the death of the retiree, the beneficiary will receive 75% of the retiree’s monthly payment throughout the beneficiary’s life .
100% to BeneficiaryAt the death of the retiree, the beneficiary will receive 100% of the monthly amount paid to the retiree throughout the beneficiary’s life .
100% to Beneficiary with Pop-upIf the beneficiary survives the retiree, monthly payments equal to 100% of the monthly amount paid to the retiree continue to the beneficiary for life . If the retiree outlives the beneficiary, the monthly payment amount will increase (pop up) after the beneficiary’s death to the higher amount of the Single Life option .

2016 Comprehensive Annual Financial Report 87
STATIS
TICA
L
DEMOGRAPHIC AND OPERATING INFORMATION
TABLE 6: LARGEST PARTICIPATING EMPLOYERS — CURRENT YEAR AND NINE YEARS AGO
2016 2007
Number of Number of Current Current Employee % of Total Employee % of Total Employer Accounts Rank System Accounts Rank System
Harris County 16,772 1 12.8% 15,866 1 13.6%
Dallas County 6,843 2 5.2% 7,026 2 6.0%
Travis County 5,226 3 4.0% 4,733 4 4.1%
Bexar County 5,199 4 4.0% 4,994 3 4.3%
Tarrant County 4,389 5 3.3% 4,258 5 3.6%
Hidalgo County 3,072 6 2.3% 2,704 7 2.3%
El Paso County 2,960 7 2.3% 2,815 6 2.4%
Fort Bend County 2,778 8 2.1% 1,982 8 1.7%
El Paso Co. Hospital District 2,694 9 2.1% 1,863 10 1.6%
Montgomery County 2,297 10 1.8% 1,904 9 1.6%
All others 78,910 60.1% 68,713 58.8%
Totals 131,140 100.0% 116,858 100.0%
24,000
23,000
22,000
21,000
20,000
19,000
18,000
17,000
16,000
15,000
14,000
13,000
12,000
11,000
10,000
9,000
8,000
7,000
6,000
5,000
4,000
3,000
2,000
1,000
0
younger than 50 50s 60s 70s 80s 90 and older
FIGURE 4: NUMBER OF ANNUITANTS GROUPED BY AGEN
UM
BER
OF
AN
NU
ITA
NTS
2,033
7,566
23,714
18,209
7,313
1,149

Texas County & District Retirement System88
DEMOGRAPHIC AND OPERATING INFORMATION
TABLE 7: GROUP TERM LIFE FUND — AVERAGE BENEFITS PAID
This schedule reports the number of GTLF insurance payments and the average benefits paid.
Active Retirees
2007 Average Benefit Payment $36,459 $5,000 Number of Payments 89 267
2008 Average Benefit Payment $37,068 $5,000 Number of Payments 111 231
2009 Average Benefit Payment $39,161 $5,000 Number of Payments 93 261
2010 Average Benefit Payment $36,918 $5,000 Number of Payments 90 243
2011 Average Benefit Payment $30,026 $5,000 Number of Payments 113 292
2012 Average Benefit Payment $35,890 $5,000 Number of Payments 83 180
2013 Average Benefit Payment $38,659 $5,000 Number of Payments 83 222
2014 Average Benefit Payment $41,205 $5,000 Number of Payments 89 194
2015 Average Benefit Payment $36,819 $5,000 Number of Payments 63 217
2016 Average Benefit Payment $38,763 $5,000 Number of Payments 54 206
2016 Comprehensive Annual Financial Report 89
GLOSSARY
ACTUARIAL ACCRUED LIABILITY
The portion, as determined by the actuarial cost method, of the Actuarial Present Value of pension plan benefits and expenses that is not provided for by future Normal Costs .
ACTUARIAL ASSUMPTIONS
In order to estimate the cost of funding benefits, the actuaries use long-term assumptions . Examples include mortality, termination, disablement and retirement; changes in salary; payroll growth; investment returns and other relevant items . Actuarial assumptions are adopted by the board of trustees upon recommendation of the consulting actuaries . The assumptions are reviewed every four years .
ACTUARIAL GAIN (LOSS)
The difference between actual results and what was projected to happen based on Actuarial Assumptions during the period between annual Actuarial Valuations .
ACTUARIAL PRESENT VALUE
The calculated value of a series of projected cash flows expressed in present day dollars as of the valuation date using actuarial assumptions .
ACTUARIAL VALUATION
The process to calculate the employer contribution rate . This process determines the Normal Cost, Actuarial Accrued Liability, Actuarial Value of Assets and Actuarial Present Values .
ACTUARIAL VALUE OF ASSETS
The value of cash, investments and other property belonging to a pension plan, as used by the actuary for the purpose of an Actuarial Valuation .
ACTUARIALLY EQUIVALENT PAYMENT OPTIONS
Different benefit payment options that pay different amounts per month, but are of equal value at the time the option is selected .
ALERIAN MLP INDEX
This index is a composite of the 50 most prominent energy Master Limited Partnerships . The index is
calculated using a float-adjusted, capitalization-weighted methodology .
BASIC BENEFIT
Benefits attributable to the member’s accumulated deposits and an equal matching amount provided by the employer .
BENCHMARK PORTFOLIOS
Portfolios represented by specific indices that are created for the purpose of measuring the relative performance of investment managers, asset classes and, in the case of the Policy Benchmark Portfolio, the entire TCDRS portfolio . Data regarding performance of these benchmark portfolios during any period indicate the returns that were available during the period for comparable investments that were passively managed . Comparisons indicate the value added by each manager, if any, in excess of the performance that was experienced by the specific benchmark index .
BLOOMBERG BARCLAYS U.S. AGGREGATE BOND INDEX
This index incorporates all domestic debt issues with maturities greater than one year and in amounts greater than $1 million . Included are publicly issued, nonconvertible, domestic debt issues of the U .S . government and its agencies and corporations in industrial, utility or financial segments .
BLOOMBERG BARCLAYS U.S. 10-YEAR BREAKEVEN INFLATION INDEX
This index is designed to provide access to 10-year breakeven inflation by capturing the returns of a simultaneous long position in 10-year inflation linked securities and a short position in suitable nominal comparator U .S . Treasury bonds .
BLOOMBERG COMMODITIES INDEX
This index is composed of futures contracts on physical commodities . It provides broad-based exposure to commodities, with no single commodity or sector dominating the index . The liquidity and diversity of the benchmark makes it suitable for institutional investment .
CAMBRIDGE ASSOCIATES DISTRESSED SECURITIES INDEX
A custom benchmark index provided by Cambridge

Texas County & District Retirement System90
GLOSSARY
Associates based on data compiled from more than 200 distressed debt funds, including fully liquidated partnerships with first cash flows beginning in 2005 . The benchmark return is net of fees, expenses and carried interest .
CAMBRIDGE ASSOCIATES GLOBAL PRIVATE EQUITY & VENTURE CAPITAL INDEX
A custom benchmark index provided by Cambridge Associates based on data compiled from more than 1,500 global private equity and venture capital funds, including fully liquidated partnerships, with first cash flows beginning 2006 . The benchmark return is net of fees, expenses and carried interest .
CAMBRIDGE ASSOCIATES REAL ESTATE INDEX
A custom benchmark index provided by Cambridge Associates based on data compiled from nearly 400 global private real estate funds, including fully liquidated partnerships with first cash flows beginning 2007 . The benchmark return is net of fees, expenses and carried interest .
CITIGROUP HIGH-YIELD CASH-PAY CAPPED INDEX
This index includes cash-pay bonds with a below-investment-grade rating by both Moody’s Investor Services and Standard & Poor’s . The bonds must have a maturity of at least one year and a minimum amount outstanding of $100 million . The par value of individual issuers is capped at $5 billion par outstanding .
COMMODITIES
Investment in resources that can be perishable (grains, sugar, etc .) and non-perishable (metals, energy, etc .) . Commodities provide protection against inflation and have low correlation to stocks and other asset classes .
DIRECT LENDING
Privately originated debt made to small to medium-sized companies or to real estate investors in order to take advantage of disruptions in the banking system .
DISTRESSED DEBT
Distressed debt investments are investments in partnerships that purchase the debt of companies
experiencing financial distress ranging from deteriorating financial conditions to bankruptcy . Strategies employed include trading, participating in restructuring transactions and controlling bankruptcy proceedings .
DOW JONES U.S. TOTAL STOCK MARKET INDEX
This index is one of the broadest measures of domestic equity performance since it is computed based upon all equity trades of U .S . stocks during any day . Each company included within the index is not equally weighted within the index, but rather is weighted according to its market value among the market values of all U .S . companies .
EMPLOYER REQUIRED CONTRIBUTION RATE
The percentage of payroll the employer is required to contribute to fund future benefits for their current employees, former employees and retirees . It is the sum of the Normal Cost Contribution Rate and the Unfunded Actuarial Accrued Liability Contribution Rate .
ENTRY-AGE ACTUARIAL COST METHOD
An actuarial cost method under which the Actuarial Present Value of the Projected Benefits of each individual included in an Actuarial Valuation is allocated on a level basis over the earnings or service of the individual between entry age and assumed exit ages . The portion of this Actuarial Present Value allocated to a valuation year is called the Normal Cost . The portion of this Actuarial Present Value not provided for at a Valuation Date by the Actuarial Present Value of future Normal Costs is called the Actuarial Accrued Liability .
FOREIGN CURRENCY FORWARD CONTRACTS
Forward contracts are over-the-counter agreements between two parties to buy and sell a currency at a set price on a future date . The contracts are marked-to-market on each valuation date with any resulting unrealized appreciation or depreciation recorded on such date . Realized gains or losses equal to the value of the contract when it was opened and the settlement amount at the time the contract is closed (or rolled) are recorded upon receipt of the currency .
2016 Comprehensive Annual Financial Report 91
GLOSSARY
FTSE EPRA/NAREIT GLOBAL REAL ESTATE INDEX
This index, developed by The Financial Times and London Stock Exchange (FTSE) in conjunction with the European Public Real Estate Association (EPRA) and National Association of Real Estate Investment Trusts (NAREIT) includes worldwide listed stocks of income-producing real estate .
FTSE NAREIT ALL EQUITY REIT INDEX
This index gives a broad exposure to U .S . publicly traded equity REITs in every property sector .
GLOBAL EQUITY
Investments in stocks included in all public markets, both domestic and international .
HEDGE FUND RESEARCH INSTITUTE (HFRI) FUND OF FUNDS COMPOSITE INDEX
This index consists of more than 650 funds with each managing a group of diverse hedge funds . Each fund of funds has at least $50 million under management or has been actively trading for at least twelve months . The index includes both domestic and offshore funds that offer diverse strategies . All constituent funds report returns net of fees on a monthly basis .
HEDGE FUNDS
An investment strategy applied to a variety of different investments to help manage risk within the entire portfolio . Over a full market cycle, hedge funds produce equity-like returns with less than half the risk of stocks . Hedge funds do well when markets are up and mitigate losses during market downturns .
HIGH-YIELD BONDS
Domestic fixed-income securities that have not been highly rated by national rating agencies, such as Moody’s Investors Service (Moody’s) or Standard & Poor’s (S&P) . A security is considered a high-yield bond if it is rated below Baa3 by Moody’s or below BBB- by S&P . To pay for the risk, the interest rates earned are higher than investment-grade bonds .
INVESTMENT-GRADE BONDS
The investment-grade bonds portfolio consists of
debt securities issued by the U .S . Treasury or an agency or government-sponsored entity (GSE) of the United States (U .S . governments); mortgage-related instruments, U .S . dollar-denominated fixed-income securities issued by U .S . and foreign corporations; and U .S . dollar-denominated debt issued by foreign governments and supranationals . Additionally, these portfolios may contain minimal investments in short-term instruments, non-rated securities, private placement securities, convertible bonds and preferred stock . The portfolio should exhibit an overall dollar-weighted average quality rating of AA .
MASTER LIMITED PARTNERSHIPS (MLPs)
Publicly traded partnership interests created by Congress to encourage investment in domestic energy infrastructure . At the entity level, these interests are tax free provided that 90% of their income comes from natural resources such as oil, natural gas, coal, timber and other depletable resources .
MSCI EAFE INDEX (EUROPE, AUSTRALASIA, FAR EAST)
This index, prepared by Morgan Stanley Capital International (MSCI), is designed to measure developed market equity performance excluding the United States and Canada .
MSCI EMERGING MARKETS (EM) INDEX
This index, prepared by Morgan Stanley Capital International (MSCI), captures large and mid-cap performance across 23 emerging market countries with 835 constituents .
MSCI WORLD EX U.S.
This index, prepared by Morgan Stanley Capital International (MSCI), is designed to measure developed market equity performance excluding the United States .
NORMAL COST
The portion of the Actuarial Present Value of pension plan benefits and expenses that is allocated to a valuation year by the actuarial cost method .
Texas County & District Retirement System92
GLOSSARY
NORMAL COST CONTRIBUTION RATE
This is the rate required to fund current employees’ benefits over their projected careers . It is equal to the Actuarial Present Value at hire of Projected Benefits divided by the Actuarial Present Value at hire of anticipated future compensation . It is calculated for each contributing member and the average is weighted by compensation .
OPPORTUNISTIC CREDIT
Comprises investments primarily in debt instruments that provide return opportunities resulting from dislocations in capital markets .
OVERFUNDED ACTUARIAL ACCRUED LIABILITY (OAAL)
The excess, if any, of the Actuarial Value of Assets over the Actuarial Accrued Liability .
PLAN YEAR
The period from Jan . 1 to Dec . 31 inclusive .
PRIOR SERVICE
Benefits attributable to an amount provided by the employer for service rendered by an employee prior to employer participation in TCDRS .
PRIVATE EQUITY
Private partnerships that (a) take public companies private in order to improve their operations and resell them in the future; (b) invest in start-up companies with new ideas or technologies; and (c) invest in both traditional and renewable energy discovery and production .
PRIVATE REAL ESTATE
Non-publicly traded vehicles that invest in a broad array of real estate properties and ventures . Private real estate investments are expected to be very illiquid and long term in nature . The vehicles for private real estate investments are typically partnerships, but may also include other entities such as limited liability companies or offshore corporations .
PROJECTED BENEFITS
Retirement benefit amounts that are estimated to be paid at various future times under a particular set
of Actuarial Assumptions, taking into account such factors as the effect of advancement in age, and past and anticipated future compensation and service time .
REITs
Real estate investment trusts are companies that own and operate income-producing real estate, such as commercial office buildings, apartments, malls, warehouses and storage facilities . Under provisions of the U .S . tax law, if REITs pay out most of their income, they do not pay income taxes . This means higher income earnings along with any increase in the value of the real estate .
S&P/LSTA LEVERAGED LOAN TOTAL RETURN INDEX
This index is a market value-weighted index designed to measure the performance of the U .S . leveraged loan market based upon market weights, spreads and interest payments .
TIPS
Treasury Inflation-Protected Securities are bonds issued by the U .S . Treasury just like other U .S . government bonds . However, the principal amount of TIPS increases with the rate of inflation so that inflation does not decrease the value of the bond . They provide a way to protect against inflation .
UNFUNDED ACTUARIAL ACCRUED LIABILITY (UAAL)
The excess, if any, of the Actuarial Accrued Liability over the Actuarial Value of Assets .
UNFUNDED ACTUARIAL ACCRUED LIABILITY CONTRIBUTION RATE
The amount needed to amortize the Unfunded Actuarial Accrued Liability over a closed period of 20 years, expressed as a percent of payroll . If the plan has an Overfunded Actuarial Accrued Liability, it is amortized over an open period of 30 years, and the resulting negative Unfunded Actuarial Accrued Liability Contribution Rate is offset against the Normal Cost Contribution Rate .


TELEPHONE
Local (512) 328-8889
Toll Free 800-823-7782
Fax (512) 328-8887
IN PERSON
901 MoPac Expy. SouthBarton Oaks Plaza IVSuite 500Austin, Texas 78746
BY MAIL
TCDRS P.O. Box 2034Austin, Texas 78768-2034
ONLINE
TCDRS.org
Related Documents