Nucleic Acids Research (2015) Database issue, in press ComPPI: a cellular compartment-specific database for protein- protein interaction network analysis Daniel V. Veres 1 , Dávid M. Gyurkó 1 , Benedek Thaler 1,2 , Kristóf Z. Szalay 1 , Dávid Fazekas 3 , Tamás Korcsmáros 3,4,5 and Peter Csermely 1,* 1 Department of Medical Chemistry, Semmelweis University, Budapest, Hungary 2 Faculty of Electrical Engineering and Informatics, Budapest University of Technology and Economics, Budapest, Hungary 3 Department of Genetics, Eötvös Loránd University, Budapest, Hungary 4 TGAC, The Genome Analysis Centre, Norwich, UK; 5 Gut Health and Food Safety Programme, Institute of Food Research, Norwich, UK; * To whom correspondence should be addressed. Tel: +361-459-1500; Fax: +361-266-3802; Email: [email protected] The authors wish it to be known that, in their opinion, the first 2 authors should be regarded as joint First Authors. ABSTRACT Here we present ComPPI, a cellular compartment-specific database of proteins and their interactions enabling an extensive, compartmentalized protein-protein interaction network analysis (URL: http://ComPPI.LinkGroup.hu). ComPPI enables the user to filter biologically unlikely interactions, where the two interacting proteins have no common subcellular localizations and to predict novel properties, such as compartment-specific biological functions. ComPPI is an integrated database covering four species (S. cerevisiae, C. elegans, D. melanogaster and H. sapiens). The compilation of 9 protein-protein interaction and 8 subcellular localization datasets had 4 curation steps including a manually built, comprehensive hierarchical structure of >1,600 subcellular localizations. ComPPI provides confidence scores for protein subcellular localizations and protein-protein interactions. ComPPI has user-friendly search options for individual proteins giving their subcellular localization, their interactions and the likelihood of their interactions considering the subcellular localization of their interacting partners. Download options of search results, whole-proteomes, organelle-specific interactomes, and subcellular localization data are available on its website. Due to its novel features, ComPPI is useful for the analysis of experimental results in biochemistry and molecular biology, as well as for proteome-wide studies in bioinformatics and network science helping cellular biology, medicine and drug design. 1

Welcome message from author
This document is posted to help you gain knowledge. Please leave a comment to let me know what you think about it! Share it to your friends and learn new things together.
Transcript
Nucleic Acids Research (2015) Database issue, in press
ComPPI: a cellular compartment-specific database for protein-
protein interaction network analysis
Daniel V. Veres1, Dávid M. Gyurkó1, Benedek Thaler1,2, Kristóf Z. Szalay1, Dávid Fazekas3, Tamás
Korcsmáros3,4,5 and Peter Csermely1,*
1 Department of Medical Chemistry, Semmelweis University, Budapest, Hungary
2 Faculty of Electrical Engineering and Informatics, Budapest University of Technology and
Economics, Budapest, Hungary
3 Department of Genetics, Eötvös Loránd University, Budapest, Hungary
4 TGAC, The Genome Analysis Centre, Norwich, UK;
5 Gut Health and Food Safety Programme, Institute of Food Research, Norwich, UK;
* To whom correspondence should be addressed. Tel: +361-459-1500; Fax: +361-266-3802; Email:
The authors wish it to be known that, in their opinion, the first 2 authors should be regarded as joint First Authors.
ABSTRACT
Here we present ComPPI, a cellular compartment-specific database of proteins and their interactions
enabling an extensive, compartmentalized protein-protein interaction network analysis (URL:
http://ComPPI.LinkGroup.hu). ComPPI enables the user to filter biologically unlikely interactions,
where the two interacting proteins have no common subcellular localizations and to predict novel
properties, such as compartment-specific biological functions. ComPPI is an integrated database
covering four species (S. cerevisiae, C. elegans, D. melanogaster and H. sapiens). The compilation of
9 protein-protein interaction and 8 subcellular localization datasets had 4 curation steps including a
manually built, comprehensive hierarchical structure of >1,600 subcellular localizations. ComPPI
provides confidence scores for protein subcellular localizations and protein-protein interactions.
ComPPI has user-friendly search options for individual proteins giving their subcellular localization,
their interactions and the likelihood of their interactions considering the subcellular localization of their
interacting partners. Download options of search results, whole-proteomes, organelle-specific
interactomes, and subcellular localization data are available on its website. Due to its novel features,
ComPPI is useful for the analysis of experimental results in biochemistry and molecular biology, as
well as for proteome-wide studies in bioinformatics and network science helping cellular biology,
medicine and drug design.
1
INTRODUCTION
Biological processes are separated in the cellular and subcellular space, which helps their precise
regulation. Compartmentalization of signalling pathways is a key regulator of several main
biochemical processes, such as the nuclear translocation-mediated activation of transcription factors
(1). Several proteins are located in more than one subcellular localizations. As an example, IGFBP-2
is a predominantly extracellular protein with a key role in insulin growth factor signalling (2), while its
translocation into the nucleus results in VEGF-mediated angiogenesis (3). Another important example
is the HIF-1 Alpha with translocation from the cytosol to the nucleus, where it acts as a transcription
factor involved in the maintenance of cellular oxygen homeostasis (4) (Supplementary Figure S1).
Their shuttling between these localizations is a key regulatory mechanism, which implicates the
importance of improving the systems level analysis of compartmentalized biological processes.
Protein-protein interaction data are one of the most valuable sources for proteome-wide analysis
(5), especially to understand human diseases on the systems-level (6) and to help network-related
drug design (7). However, protein-protein interaction databases often contain data with low overlap
(8), and are designed using different protocols (9), therefore their integration is needed to improve our
comprehensive knowledge (10). Low-throughput datasets often use of several different protein
naming conventions causing difficulties in data analysis and integration. Manual curation of data
yields a large improvement of data quality (11).
Interaction data often contain interactions, where the two interacting proteins have no common
subcellular localizations (12). These interactions could be biophysically possible, but biologically
unlikely (13). Thus, these interactions cause data bias that leads to deteriorated reliability in
interactome-based studies (14), especially those involving subcellular localization-specific cellular
processes (15). Unfortunately, subcellular localization data are incomplete. Despite the need of
experimentally verified subcellular localizations for reliable compartmentalization-based interactome
filtering (16), only computationally predicted subcellular localization information is available for a large
part of the proteome. Moreover, subcellular localization data are redundant, often poorly structured
and miss to highlight the reliability of data (17).
Existing analysis tools involving subcellular localizations offer the download of filtered interactomes
for a subset of proteins (like MatrixDB (18)). Several databases use only Gene Ontology (GO, 19)
cellular component terms as the source of the subcellular localization data (such as HitPredict (20) or
Cytoscape BiNGO plugin (21)), while GO still contains data inconsistency despite its highly-structured
annotations (22). Cytoscape Cerebral plugin (23) generates a view of the interactome separated into
layers according to their subcellular localization. In different datasets the subcellular localization
structure is not uniform, which makes their comparisons often difficult.
ComPPI-based interactomes introduced here provide a broader coverage (Supplementary Tables
S1 and S2), using several curation steps in data integration. ComPPI offers highly structured
subcellular localization data supplemented with Localization and Interaction confidence Scores, all
presented with user-friendly options. As a key feature ComPPI allows the construction of high-
confidence datasets, where potentially biologically unlikely interactions, where the interacting partners
are not localized in the same cellular compartment, have been deleted. As our examples will show,
2
this gives novel options of interactome analysis and also suggests potentially new subcellular
localizations and localization-based functions.
DESCRIPTION OF THE DATABASE
Overview of ComPPI
Our goal by constructing ComPPI was to provide a reliable subcellular compartment-based protein-
protein interaction database for the analysis of biological processes on the subcellular level. A key
feature of ComPPI is that it allows the filtering of localization-based biologically unlikely interactions
resulting in localization-wise more reliable interaction data. During the integration of 17 databases to
build up ComPPI, we used the following 4 curation steps to improve data quality (Figure 1). (i) Source
databases were selected by comparing them to a large number of other potential databases and their
data content was manually reviewed. (ii) Subcellular localization data were consistently structured to a
hierarchical subcellular localization tree (Supplementary Figure S2) containing more than 1,600
individual sub-localizations. (iii) We developed an algorithm to map different protein naming
conventions to UniProt accession numbers (11). (iv) Lastly, a manual follow up by 6 independent
experts was performed in order to revise the data content searching for data inconsistence and false
entries, and to test the functions of the web interface (Supplementary Table S3).
ComPPI database includes comprehensive and integrated data of four species (S. cerevisiae, C.
elegans, D. melanogaster and H. sapiens) cataloguing 125,757 proteins, their 791,059 interactions
and 195,815 major subcellular localizations in its current, 1.1 version. The proteome-wide dataset
contains localizations for 5 main subcellular organelles (nucleus, mitochondrion, cytosol, secretory-
pathway, membrane) and the extracellular compartment. Importantly, 60% of the ComPPI entries
have high resolution cellular localization data assigning them to one or several of >1,600 Gene
Ontology cellular component terms (19) assigning these proteins into distinct sub-cellular
compartments.
Design and implementation
Both protein-protein interaction and subcellular localization data are incorporated to ComPPI
automatically using their own interface to bridge the difference in data structure (Supplementary Table
S3). New interfaces can be added without limitations. The incoming data are merged to form a
consistent internal data pool using a comprehensive protein name mapping algorithm, in order to deal
with the redundancy in the input datasets (http://comppi.linkgroup.hu/help/naming_conventions). The
website and the downloadable contents are generated from this integrated internal data pool. All
curated parts are stored in separate, yet interconnected containers to maintain persistency between
ComPPI releases.
The website follows the hierarchical model-view-controller design pattern to ensure the separation
of the data layer from the business logic and the user interface. Each functional unit is implemented
as a module to further support easy maintenance and extensibility. Protein search algorithms have
3
been extensively optimized, and the served content is cached to ensure quick response times even
on low-end infrastructure. Due to these features ComPPI can be easily run on a general laptop or
desktop computer.
The downloadable datasets are pre-generated and validated automatically and manually in every
release to fulfil our high quality control requirements (Figure 1). The Python script that generates
these datasets also contains basic tools for data retrieval and manipulation in a network-oriented
manner, which enables the user to perform bioinformatics analysis on the interactome using the open
source code and also gives space for further improvement.
End user documentation is available at the website as tutorials, detailed descriptions and location-
specific tooltips. All components of ComPPI and the underlying software stack are open source. The
source code is available in a revision controlled repository at
http://bificomp2.sote.hu:22422/comppi/summary.
Third party tools and technologies were selected with open accessibility and scientific
reproducibility in mind including the Ubuntu Linux 14.04 operating system (http://ubuntu.com/), the
nginx HTTP server (http://nginx.org/), the MySQL 5 Community Edition database server
(http://www.mysql.com/), the git version control system (http://git-scm.com/), the PHP 5 scripting
language (https://php.net/), the Symfony 2 PHP framework (http://symfony.com/), the jQuery
JavaScript framework (http://jquery.com/), the D3.js JavaScript library for network visualization
(http://d3js.org/) and the Python3 scripting language (https://python.org/).
Database content and access
Input databases. The low overlap of protein-protein interaction and subcellular localization databases
(11) prompted us to integrate several source databases in order to improve data coverage and quality
(Supplementary Figure S3 and Supplementary Table S2). In this process we used publicly
downloadable license-free data sources, preferably containing proteome-wide datasets. Protein-
protein interaction data were selected to contain only physical interactions with experimental evidence
coming from high-throughput, as well as low-throughput techniques. We used the widely used
species-specific (DroID (24), HPRD (25), MatrixDB (18) and MIPS (26)) and general (BioGRID (27),
CCSB (28), DiP (29), IntAct (30) and MINT (31)) protein-protein interaction databases having high
data quality, update frequency and freely downloadable latest releases for academic research.
Subcellular localization data can be obtained from experimental evidence or using predictions.
Several source databases contained only experimentally verified subcellular localization entries (such
as Human Proteinpedia (32) and The Human Protein Atlas (33)). Other source data had only
computationally predicted information (such as PA-GOSUB (34)). Several data sources had
integrated data structure (such as eSLDB (35), Gene Ontology (19), LOCATE (36), MatrixDB (18),
OrganelleDB (37)) containing data of both experimental and predicted origin. During the selection of
the proteome-wide predicted subcellular localization databases with downloadable content we
focused on the use of prediction algorithms with combined methods using robust machine learning
tools validated on highly reliable training sets.
4
ComPPI dataset. The availability of the data sources differs between various species. As an
example ComPPI contains 8 protein-protein interaction and 8 subcellular localization databases for
human proteins (Supplementary Figure S3). Database integration was based on protein ID mapping
to the most reliable naming convention available, primarily to UniProt Swiss-Prot accession numbers
(11). The 4 curation steps (Figure 1) allow the users to access interaction and localization data at a
single resource having a higher coverage and reliability than the incorporated databases.
The ComPPI database contains three types of predefined datasets: (i) the compartmentalized
interactome catalogues of those protein-protein interactions, where the interacting proteins have at
least one common subcellular localization, (ii) the integrated protein-protein interaction dataset can be
customized by the 4 species included, and (iii) the subcellular localization dataset, which is one of the
biggest existing subcellular localization resource with a comprehensive structure for interactome
analysis. All downloadable ComPPI resources are licence free and publicly available for academic
and industrial research.
Search and download features
Search features. The internally hyper-linked web application of ComPPI enables even those users,
who have no bioinformatics expertise, to search for the interactions of individual proteins. Search
options (http://comppi.linkgroup.hu/protein_search) are available for protein names with autocomplete
function giving their subcellular localization, their interactions and the likelihood of their interactions
considering the subcellular localization of the interacting partners. Using the Advanced Settings of the
Search page the user is able to filter the list of the possible query proteins for species, subcellular
localizations and/or localization probability. These settings can be set for the interactors of the query
protein too and are adjustable with the Custom Settings on the Results page, which allows the filtering
of the interactors for subcellular localizations, localization probability and interaction score. The
properties of the query protein and its interactors are available for download. After filtration only those
interactions are exported that fulfil the custom filtering requirements set by the user. Network
visualization of the whole or filtered first-neighbour interactome of the query protein is also available,
where the width of the edges corresponds to the Interaction Score of the given interaction. These
options together provide a user-friendly web interface for data mining for both non-experts and
computational biologists. A Direct Search option is also available via URL, which gives the opportunity
to interconnect the ComPPI database with other resources, or to generate multiple searches for data
mining.
Download options. All ComPPI data are available for download at the web site. Predefined datasets
can be customized by the user to contain only data for a requested species or localization: (i)
Compartmentalized interactomes have interactions, where the two interacting protein-nodes have at
least one common subcellular localization. These interactomes can be filtered to species besides
5
subcellular localizations. (ii) Integrated protein-protein interaction datasets contain all the interactions,
and can be customized to the 4 species included. (iii) Integrated subcellular localization datasets
contain proteins together with their localization data. The user can select species and localizations to
customize these datasets. (iv) The current and previous releases of the full database can also be
downloaded. A detailed help and a tutorial for the Search and Download functions are both available.
Output. ComPPI output data provide lists of interactions, interaction scores of the interacting proteins
and localizations with localization scores. Moreover, the user receives the PubMed IDs and
references of the source databases for both the interactions and subcellular localizations, and the
additional information (if available) of the data type. The user-defined interactomes resulted after the
execution of Basic or Advanced Search options and the predefined datasets on the Downloads page
are available for download in plain text format to ensure convenient data handling. The complete
current and previous releases of the database are downloadable in SQL format to provide full access
to all the data in ComPPI.
Localization and Interaction Scores
Subcellular localization structure. Subcellular localization data are coming from different source
databases, containing localizations having experimental evidence (in the followings: experimental),
coming from unknown sources (unknown), or predictions (predicted; Figure 2). Experimental data
usually have high resolution, where the exact localization of the protein is often defined, such as the
nuclear pore complex for Nup107 (38). Predicted localizations have usually low resolution. As an
example nuclear localization can be predicted from the existence of a nuclear localization signal in the
amino acid sequence (39) without any experimental evidence.
Because of the incongruity in the resolution of the localization data and the different naming
conventions between the source databases, we standardized the subcellular localization data using
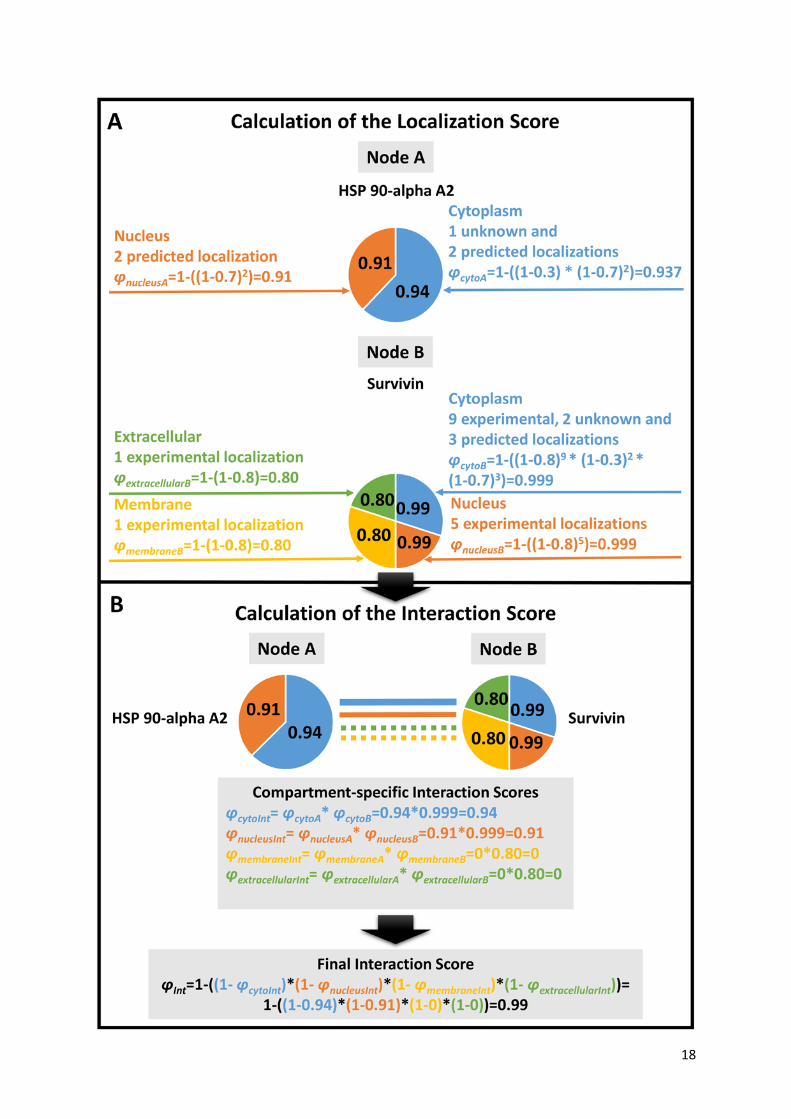
Gene Ontology cellular component terms (19). In order to solve the problem of the unequivocally
mapped GO terms (Figure 3) we created a manually built, non-redundant, hierarchical localization
tree (Supplementary Figure S2). With the help of this we clustered the >1,600 Gene Ontology cellular
component terms to six major compartments (cytosol, nucleus, mitochondrion, secretory-pathway,
membrane, extracellular) (Supplementary Table S4). This new structure allows ComPPI to store all
localization entries from different sources, and to assign the proteins efficiently to 6 major
compartments (Figure 3 and Supplementary Figure S4).
Localization and Interaction Scores. The ComPPI Localization Score is a novel measure to score the
probability of a localization for a given protein. The Localization Score depends on the subcellular
localization evidence type (experimental, unknown, predicted) and the number of sources (Figure 2).
The Interaction Score characterizes the probability of the subcellular localization of a protein-protein
interaction, and is based on the consensus of the compartment-specific Localization Scores of the
interacting proteins. With the help of the scoring algorithm ComPPI provides a novel localization
probability describing how likely it is that the protein exists in the given subcellular compartment, and
6
gives the opportunity to build high-confidence interactomes based on the distribution of the interaction
scores (Supplementary Figure S5).
Localization Scores are calculated using probabilistic disjunction (marked with operator V) among
the different localization evidence types and the number of ComPPI localization data entries of the
respective evidence type (Eq. 1, see top panel of Figure 2 for details).
(Eq. 1)
Where φLocX and pLocX are the Localization Score and the localization evidence type (experimental,
unknown or predicted) for protein X and localization Loc, respectively, while res is the number of
available ComPPI localization data entries for protein X.
As the first step of Interaction Score calculation, compartment-specific Interaction Scores are
obtained by multiplying the Localization Scores of the two interactors for each of the 6 major
compartments. Finally, the Interaction Score is calculated as the probabilistic disjunction (marked with
operator V) of the Compartment-specific Interaction Scores of all major localizations available for the
interacting pair from the maximal number of 6 major localizations (Eq. 2, see bottom panel of Figure 2
for details).
(Eq. 2)
Where φInt is the Interaction Score, while φLocA and φLocB are the Compartment-specific Localization
Scores of interacting proteins A and B, respectively.
Score optimization. As mentioned before ComPPI localization evidence type can be experimental,
unknown or predicted. ComPPI characterizes each of these localization evidence types by a
parameter called the evidence type weight to achieve a unified scoring system applicable to the
diverse data sources. To obtain these evidence type weights we performed their data-driven
optimization. Based on the fact that experimentally validated entries are the most reliable, while
localization entries coming from unknown or predicted origin are less reliable, we set the following
order of evidence type weights: experimental > predicted AND experimental > unknown as the two
requirements of the optimization process. We chose the Human Protein Atlas database (HPA (33))
containing only experimentally verified subcellular localizations in order to build a positive control
dataset, where the interactors have at least one common localization according to HPA. Our goal was
to find a specific ratio of the experimental, unknown and predicted evidence type weights that
maximizes the number of high confidence interactions in the positive control dataset (HPA) and
simultaneously maximizes the number of low confidence interactions in the ComPPI dataset not
containing HPA data. These ensure that the quality of data marked as high confidence will have a
good match the quality of experimentally verified data. All combinations of the experimental, unknown
and predicted evidence type weights were set up from 0 to 1 with 0.1 increments. The kernel density
of the interactions were calculated with all these settings (with a bandwidth of 0.01), which gave us
7
the ratio of interactions belonging to a given confidence level compared to the distribution of all the
interactions. Lastly, the 285 possible kernel density solutions were tested to find the parameter
combination that maximizes the number of both the low and high confidence interactions as described
above. This resulted in 0.8, 0.7, and 0.3 as the relative evidence type weights for experimental,
predicted and unknown data types, respectively (Supplementary Figure S6). Note that this
optimization is driven by the reliability of the subcellular localization data, and was not tested using
gold standard protein-protein interaction datasets, therefore the Interaction Score reflects the
reliability of the interaction in a subcellular localization-dependent but not in an interactome-
dependent manner.
Application examples
Merging of subcellular localization and interactome data provides several application opportunities: (i)
the filtration of localization-based biologically unlikely interactions – where the two interacting proteins
have no common localization and (ii) the prediction of possible new localizations and localization-
based biological functions (15). Both are important features of ComPPI as illustrated by an example in
this Section.
ComPPI-based interaction filtering. First, we made a systematic search for an example, which
highlights the importance of the removal of localization-based biologically unlikely interactions looking
for key hubs and bridges, where interaction structure changed the most after the filtering step. Here
we calculated the degree distribution of the whole human interactome and the high-confidence
interactome (containing 23,265/19,386 proteins and their 385,481/260,829 interactions, respectively)
where from the latter biologically unlikely interactions with no common subcellular localizations have
already been removed. We also calculated the distribution of the betweenness centrality in the two
datasets. After these procedures we manually reviewed the first 20 proteins from the UniProt Swiss-
Prot subset (15,258 proteins out of 19,386) with the highest differences in degree and centrality
measures (Supplementary Table S5). Enoyl-CoA hydratase (crotonase) had the largest absolute
change of degree among the top 20 proteins, thus we selected crotonase as our illustrative example
(Figure 4). Crotonase catalyses the second step in the beta-oxidation pathway of fatty acid
metabolism (40), and is a key member of the crotonase protein superfamily (41). Beta-oxidation takes
place primarily in the mitochondrion (42). Crotonase has only a mitochondrial ComPPI localization
with experimental evidence, which is in agreement with its cellular function.
Crotonase has 71 interacting partners in the integrated dataset, of which only 8 is present in the
mitochondrion, and only 5 have an interaction score equal or higher than 0.8. After the manual review
of crotonase neighbours, it turned out that only one of the 8 mitochondrial interactors (mitochondrial
Hsp70, (43)) has experimental evidence for mitochondrial localization. Mitochondrial localization of
the other 7 interactors is not based on strong evidence, while 63 out of 71 interactors have no known
mitochondrial localization at all. Figure 4 shows the interactome of crotonase and its 71 first
neighbours containing 428 edges. In the mitochondrial interaction subset only 13 edges remained,
8
while the high-confidence part contains only 10 interactions (Figure 4). Second neighbours of
crotonase contain 83% of the interactome, and their network contains 14,803 nodes and 319,305
edges. The filtered mitochondrial network of the second neighbours is much smaller, having only
2,107 nodes and 8,381 interactions.
ComPPI-based prediction of new or non-conventional functions. Importantly, 52 out of the 71
interactors, and more specifically, 7 out of the 8 mitochondrial interacting partners of crotonase have
cytosolic localization with a localization probability over 0.95. This indicates that crotonase may have
a cytosolic localization as well. Indeed, crotonase was shown to be overexpressed and localized in
the cytosol in hepatocarcinoma cells, where it contributes to lymphatic metastatis (44). Gene Ontology
(19) biological process term enrichment analysis of the mitochondrial crotonase interacting partners
using BiNGO (21) revealed that besides the known function of the crotonase in ‘catabolic process’ the
‘negative regulation of apoptosis’ and related terms were also significantly enriched (Supplementary
Table S6). In agreement with this, previous studies showed that crotonase is overexpressed in
several cancer types (45), and the knockdown of crotonase decreased cell viability and enhanced
cisplatin-induced apoptosis in hepatocellular carcinoma (46). The anti-apoptotic effect of crotonase
also exists in breast cancer, where its down-regulation potentiates PP2-induced apoptosis (47).
These findings may implicate that the high ratio of 'biologically unlikely' interactions may also be a
result of a transient and dynamic cytosolic subcellular localization of crotonase, where the enzyme
may be involved in currently not widely crotonase-associated biological processes, such as the
inhibition of apoptosis. Importantly, these compartment-specific crotonase functions may be applied
as potential therapeutic targets in the treatment of hepatocellular carcinoma or breast cancer.
In summary, the crotonase example shows the utility of ComPPI both (i) to filter low-confidence
interactions concentrating on high-confidence subcellular localizations and (ii) to predict unknown
biological functions in previously unknown or non-conventional subcellular localizations. Another
example of ComPPI-based prediction of potential, novel functions besides crotonase, is Monopolar
Spindle 1 protein (MPS1) having a centromere-associated cytosolic localization (48). We identified a
number of relatively undiscovered MPS1 functions related to the ComPPI analysis of nuclear MPS1
interactome as detailed in Supplementary Figure S7 and Supplementary Table S6.
CONCLUSIONS AND FUTURE DIRECTIONS
In summary, ComPPI provides a unique dataset for the analysis of protein-protein interaction
networks at the subcellular level. The assembly of the integrated ComPPI database with manual
curation protocols (Figure 1) provides an improvement of both coverage and data quality. ComPPI
subcellular localization data have a novel structure in order to incorporate localizations from different
data sources (Figure 3 and Supplementary Figure S4), and to reveal compartment-specific biological
functions based on the analysis of the interactomes extended with high-resolution localization data in
a hierarchical structure. With the use of the optimized Localization and Interaction Scores (Figure 2)
high-confidence interactomes could be created for further investigation in the field of compartment-
specific biological processes (15).
9
Comparison of integrated protein-protein interaction data and the compartmentalized interactome
allow the filtering of biologically unlikely interactions, where the interacting partners have no common
subcellular localization. Our examples (Figure 4 and Supplementary Figure S7) illustrate that besides
filtering, ComPPI has a strong predictive power to find new localizations of the proteins based on the
underlying network or to suggest new compartment-specific biological functions. The comprehensive
dataset for four species gives the opportunity to analyse evolutionary aspects of the
compartmentalization, such as the prediction of subcellular localization ortologes (‘localogs’).
The web interface of ComPPI (http://ComPPI.LinkGroup.hu) provides user-friendly search and
download options. Besides the basic Search feature to explore and download the interactions of
individual proteins, Advanced Settings could be applied to both query proteins and their interactors.
Interactome-wide studies could be applied using the downloadable compartment-specific
interactomes or the integrated protein-protein interaction dataset, while the integrated subcellular
localization dataset is also available on the webpage for further analyses.
ComPPI is available at http://ComPPI.LinkGroup.hu, and has an open source code, which allows
further improvement and the construction of 'ComPPI-based databases'. ComPPI is a community-
annotation resource, which will be continuously enriched by a user-community of experts helped by a
public issue-tracking system and by feedbacks from the core-team, and will be updated and upgraded
annually for minimum 5 years.
We plan to resolve current ComPPI limitations, such as the relatively low amount (29% of total) of
experimental subcellular localization entries with the incorporation of newly available experimental
data. Future plans include the development of improved gold standard-based Localization and
network neighbourhood-based Interaction Scores, as well as further advanced download and search
options, such as advanced localization-based network visualization and extended number of output
formats.
In summary, the ComPPI-based interactomes introduced here provide a broader coverage, offer
highly structured subcellular localization data, as well as offer Localization and Interaction confidence
Scores, all in a user-friendly manner. Importantly, ComPPI enables the user to filter biologically
unlikely interactions, where the two interacting proteins have no common subcellular localizations,
and to predict novel subcellular localization as well as localization-based properties, such as
compartment-specific biological functions.
SUPPLEMENTARY DATA
Supplementary Data are available at NAR Online.
ACKNOWLEDGEMENT
Authors acknowledge the members of the LINK-Group (http://LinkGroup.hu) and Cellular Network
Biology Group (http://NetBiol.elte.hu) for their advice, as well as Judit Gyurkó for the design of the
ComPPI web-site.
10
FUNDING
This work was supported by research grants from the Hungarian Science Foundation [grant number:
OTKA-K83314], by a fellowship in computational biology at The Genome Analysis Centre (Norwich,
UK) in partnership with the Institute of Food Research (University of Norwich, UK), and strategically
supported by Biotechnological and Biosciences Research Council, UK [TK] and by a János Bolyai
Scholarship of the Hungarian Academy of Sciences [TK]. Funding for open access charge: Hungarian
Science Foundation [grant number: OTKA-K83314].
Conflict of interest statement. None declared.
REFERENCES
1. Hao,N. and O’Shea,E.K. (2012) Signal-dependent dynamics of transcription factor translocation
controls gene expression. Nat. Struct. Mol. Biol., 19, 31-39.
2. Firth,S.M. and Baxter,R.C. (2002) Cellular actions of the insulin-like growth factor binding proteins.
Endocr. Rev., 23, 824–54.
3. Azar,W.J., Zivkovic,S., Werther,G.A. and Russo,V.C. (2014) IGFBP-2 nuclear translocation is
mediated by a functional NLS sequence and is essential for its pro-tumorigenic actions in cancer cells.
Oncogene, 33, 578–88.
4. Semenza,G.L. (2009) Regulation of oxygen homeostasis by hypoxia-inducible factor 1.
Physiology (Bethesda), 24, 97–106.
5. Koh,G.C.K.W., Porras,P., Aranda B., Hermjakob,H. and Orchard,S.E. (2012) Analyzing protein-
protein interaction networks. J. Proteome Res., 11, 2014–31.
6. Vidal,M., Cusick,M.E. and Barabási,A.-L. (2011) Interactome networks and human disease. Cell,
144, 986–98.
7. Bulusu, K.C., Tym, J.E., Coker, E.A., Schierz, A.C. and Al-Lazikani, B. (2014) canSAR: updated
cancer research and drug discovery knowledgebase. Nucleic Acids Res., 42, D1040–7.
8. De Las Rivas,J. and Fontanillo,C. (2010) Protein–protein interactions essentials: Key concepts to
building and analyzing interactome networks. PLoS Comput. Biol., 6, e1000807.
9. von Mering,C., Krause,R., Snel,B., Cornell,M., Oliver,S.G., Fields,S. and Bork,P. (2002)
Comparative assessment of large-scale data sets of protein-protein interactions. Nature, 417, 399–
403.
10. Kamburov,A., Stelzl,U., Lehrach,H. and Herwig,R. (2013) The ConsensusPathDB interaction
database: 2013 update. Nucleic Acids Res., 41, D793–800.
11. UniProt Consortium (2014) Activities at the Universal Protein Resource (UniProt). Nucleic Acids
Res., 42, D191–8.
12. Wiwatwattana,N. and Kumar,A. (2005) Organelle DB: a cross-species database of protein
localization and function. Nucleic Acids Res., 33, D598–604.
13. 1. Levy,E.D., Landry,C.R. and Michnick,S.W. (2009) How perfect can protein interactomes be?
Sci. Signal., 2, pe11.
11
14. Sprinzak,E., Sattath,S. and Margalit,H. (2003) How reliable are experimental protein–protein
interaction data? J. Mol. Biol., 327, 919–23.
15. Lee,K., Sung,M.-K., Kim,J., Kim,K., Byun,J., Paik,H., Kim,B., Huh,W.-K. and Ideker,T. (2014)
Proteome-wide remodeling of protein location and function by stress. Proc. Natl. Acad. Sci. U. S. A.,
111, E3157–3166.
16. Nastou,K.C., Tsaousis,G.N., Kremizas,K.E., Litou,Z.I. and Hamodrakas,S.J. (2014) The human
plasma membrane peripherome: visualization and analysis of interactions. Biomed Res. Int., 2014,
397145.
17. Sprenger,J., Fink,J.L. and Teasdale,R.D. (2006) Evaluation and comparison of mammalian
subcellular localization prediction methods. BMC Bioinformatics, 7 Suppl 5, S3.
18. Chautard,E., Ballut,L., Thierry-Mieg,N. and Ricard-Blum,S. (2009) MatrixDB, a database focused
on extracellular protein-protein and protein-carbohydrate interactions. Bioinformatics, 25, 690–1.
19. Ashburner,M., Ball, C.A., Blake,J.A., Botstein,D., Butler,H., Cherry,J.M., Davis,A.P., Dolinski,K.,
Dwight,S.S., Eppig, J.T., et al. (2000) Gene Ontology: tool for the unification of biology. Nat. Genet.,
25, 25–9.
20. Patil,A., Nakai,K. and Nakamura,H. (2011) HitPredict: a database of quality assessed protein-
protein interactions in nine species. Nucleic Acids Res., 39, D744–9.
21. Maere,S., Heymans,K. and Kuiper,M. (2005) BiNGO: a Cytoscape plugin to assess
overrepresentation of gene ontology categories in biological networks. Bioinformatics, 21, 3448–9.
22. Faria,D., Schlicker,A., Pesquita,C., Bastos,H., Ferreira,A.E.N., Albrecht,M. and Falcão,A.O.
(2012) Mining GO annotations for improving annotation consistency. PLoS ONE, 7, e40519.
23. Barsky,A., Gardy,J.L., Hancock,R.E.W. and Munzner,T. (2007) Cerebral: a Cytoscape plugin for
layout of and interaction with biological networks using subcellular localization annotation.
Bioinformatics, 23, 1040–2.
24. Murali,T., Pacifico,S., Yu,J., Guest,S., Roberts,G.G. and Finley,R.L. (2011) DroID 2011: a
comprehensive, integrated resource for protein, transcription factor, RNA and gene interactions for
Drosophila. Nucleic Acids Res., 39, D736–43.
25. Keshava Prasad,T.S., Goel,R., Kandasamy,K., Keerthikumar,S., Kumar,S., Mathivanan,S.,
Telikicherla,D., Raju,R., Shafreen,B., Venugopal,A., et al. (2009) Human Protein Reference Database
- 2009 update. Nucleic Acids Res., 37, D767–72.
26. Pagel,P., Kovac,S., Oesterheld,M., Brauner,B., Dunger-Kaltenbach,I., Frishman,G., Montrone,C.,
Mark,P., Stümpflen,V., Mewes,H.-W., et al. (2005) The MIPS mammalian protein-protein interaction
database. Bioinformatics, 21, 832–4.
27. Chatr-Aryamontri,A., Breitkreutz,B.-J., Heinicke,S., Boucher,L., Winter,A., Stark,C., Nixon,J.,
Ramage,L., Kolas,N., O’Donnell,L., et al. (2013) The BioGRID interaction database: 2013 update.
Nucleic Acids Res., 41, D816–23.
28. Yu,H., Tardivo,L., Tam,S., Weiner,E., Gebreab,F., Fan,C., Svrzikapa,N., Hirozane-Kishikawa,T.,
Rietman,E., Yang,X., et al. (2011) Next-generation sequencing to generate interactome datasets. Nat.
Methods, 8, 478–80.
12
29. Salwinski,L., Miller,C.S., Smith,A.J., Pettit,F.K., Bowie,J.U. and Eisenberg,D. (2004) The
Database of Interacting Proteins: 2004 update. Nucleic Acids Res., 32, D449–51.
30. Orchard,S., Ammari,M., Aranda,B., Breuza,L., Briganti,L., Broackes-Carter,F., Campbell,N.H.,
Chavali,G., Chen,C., del-Toro,N., et al. (2014) The MIntAct project--IntAct as a common curation
platform for 11 molecular interaction databases. Nucleic Acids Res., 42, D358–63.
31. Licata,L., Briganti,L., Peluso,D., Perfetto,L., Iannuccelli,M., Galeota,E., Sacco,F., Palma,A.,
Nardozza,A.P., Santonico,E., et al. (2012) MINT, the molecular interaction database: 2012 update.
Nucleic Acids Res., 40, D857–61.
32. Kandasamy,K., Keerthikumar,S., Goel,R., Mathivanan,S., Patankar,N., Shafreen,B., Renuse,S.,
Pawar,H., Ramachandra,Y.L., Acharya,P.K., et al. (2009) Human Proteinpedia: a unified discovery
resource for proteomics research. Nucleic Acids Res., 37, D773–81.
33. Uhlen,M., Oksvold,P., Fagerberg,L., Lundberg,E., Jonasson,K., Forsberg,M., Zwahlen,M.,
Kampf,C., Wester,K., Hober,S., et al. (2010) Towards a knowledge-based Human Protein Atlas. Nat.
Biotechnol., 28, 1248–50.
34. Lu,P., Szafron,D., Greiner,R., Wishart,D.S., Fyshe,A., Pearcy,B., Poulin,B., Eisner,R., Ngo,D.
and Lamb,N. (2005) PA-GOSUB: a searchable database of model organism protein sequences with
their predicted Gene Ontology molecular function and subcellular localization. Nucleic Acids Res., 33,
D147–53.
35. Pierleoni,A., Martelli,P.L., Fariselli,P. and Casadio,R. (2007) eSLDB: eukaryotic subcellular
localization database. Nucleic Acids Res., 35, D208–12.
36. Sprenger,J., Lynn Fink,J., Karunaratne,S., Hanson,K., Hamilton,N.A. and Teasdale,R.D. (2008)
LOCATE: a mammalian protein subcellular localization database. Nucleic Acids Res., 36, D230–3.
37. Wiwatwattana,N., Landau,C.M., Cope,G.J., Harp,G.A. and Kumar,A. (2007) Organelle DB: an
updated resource of eukaryotic protein localization and function. Nucleic Acids Res., 35, D810–4.
38. Hoelz,A., Debler,E.W. and Blobel,G. (2011) The structure of the nuclear pore complex. Annu.
Rev. Biochem., 80, 613–43.
39. Brameier,M., Krings,A. and MacCallum,R.M. (2007) NucPred--predicting nuclear localization of
proteins. Bioinformatics, 23, 1159–60.
40. Waterson,R.M. and Hill,R.L. (1972) Enoyl Coenzyme A Hydratase (Crotonase): Catalytic
properties of Crotonase and its possible regulatory role in fatty acid oxidation. J. Biol. Chem., 247,
5258-65.
41. Hamed,R.B., Batchelar,E.T., Clifton,I.J. and Schofield,C.J. (2008) Mechanisms and structures of
crotonase superfamily enzymes--how nature controls enolate and oxyanion reactivity. Cell. Mol. Life
Sci., 65, 2507–27.
42. Turteltaub,W. and Murphy,A. (1987) Subcellular localization and capacity of ß-oxidation and
aldehyde dehydrogenase in porcine liver. Arch. Biochem. Biophys., 255, 120–6.
43. Bhattacharyya,T., Karnezis,A.N., Murphy,S.P., Hoang,T., Freeman,B.C., Phillips,B. and
Morimoto,R.I. (1995) Cloning and subcellular localization of human mitochondrial hsp70. J. Biol.
Chem., 270, 1705-10.
13
44. Zhang,J., Sun,M., Li,R., Liu,S., Mao,J., Huang,Y., Wang,B., Hou,L., Ibrahim,M.M. and Tang,J.
(2013) Ech1 is a potent suppressor of lymphatic metastasis in hepatocarcinoma. Biomed.
Pharmacother., 67, 557–60.
45. Yeh,C.-S., Wang,J.-Y., Cheng,T.-L., Juan,C.-H., Wu,C.-H. and Lin,S.-R. (2006) Fatty acid
metabolism pathway play an important role in carcinogenesis of human colorectal cancers by
microarray-bioinformatics analysis. Cancer Lett., 233, 297–308.
46. Chen,Z., Dai,Y.-C., Chen,Z.-X., Xie,J.-P., Zeng,W., Lin,Y.-Y. and Tan,Q.-H. (2013) Knockdown
of ECHS1 protein expression inhibits hepatocellular carcinoma cell proliferation via suppression of Akt
activity. Crit. Rev. Eukaryotic Gene Expression, 23, 275-82.
47. Liu,X., Feng,R. and Du,L. (2010) The role of enoyl-CoA hydratase short chain 1 and
peroxiredoxin 3 in PP2-induced apoptosis in human breast cancer MCF-7 cells. FEBS Lett., 584,
3185–92.
48. Fisk,H.A., Mattison,C.P. and Winey,M. (2003) Human Mps1 protein kinase is required for
centrosome duplication and normal mitotic progression. Proc. Natl. Acad. Sci. U. S. A., 100, 14875–
80.
49. Huang,H., McGarvey,P.B., Suzek,B.E., Mazumder,R., Zhang,J., Chen,Y. and Wu,C.H. (2011) A
comprehensive protein-centric ID mapping service for molecular data integration. Bioinformatics, 27,
1190–1.
50. Wein,S.P., Côté,R.G., Dumousseau,M., Reisinger,F., Hermjakob,H. and Vizcaíno,J.A. (2012)
Improvements in the Protein Identifier Cross-Reference service. Nucleic Acids Res., 40, W276–80.
14
FIGURE LEGENDS
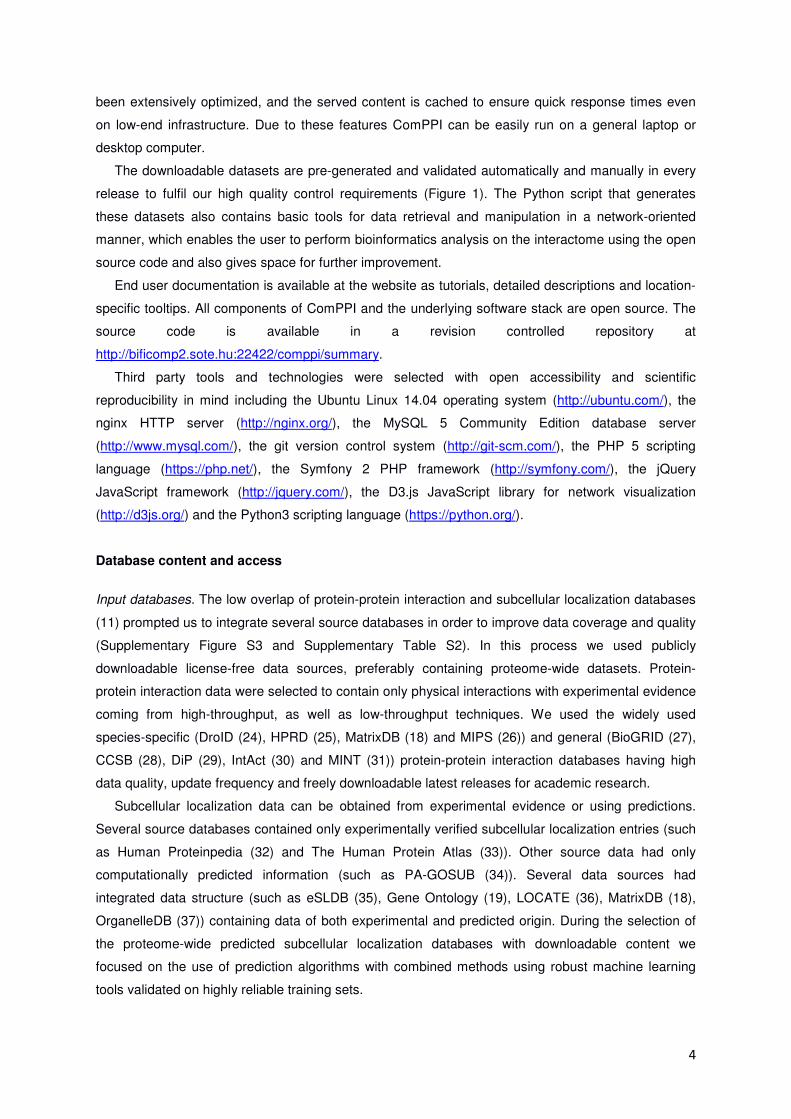
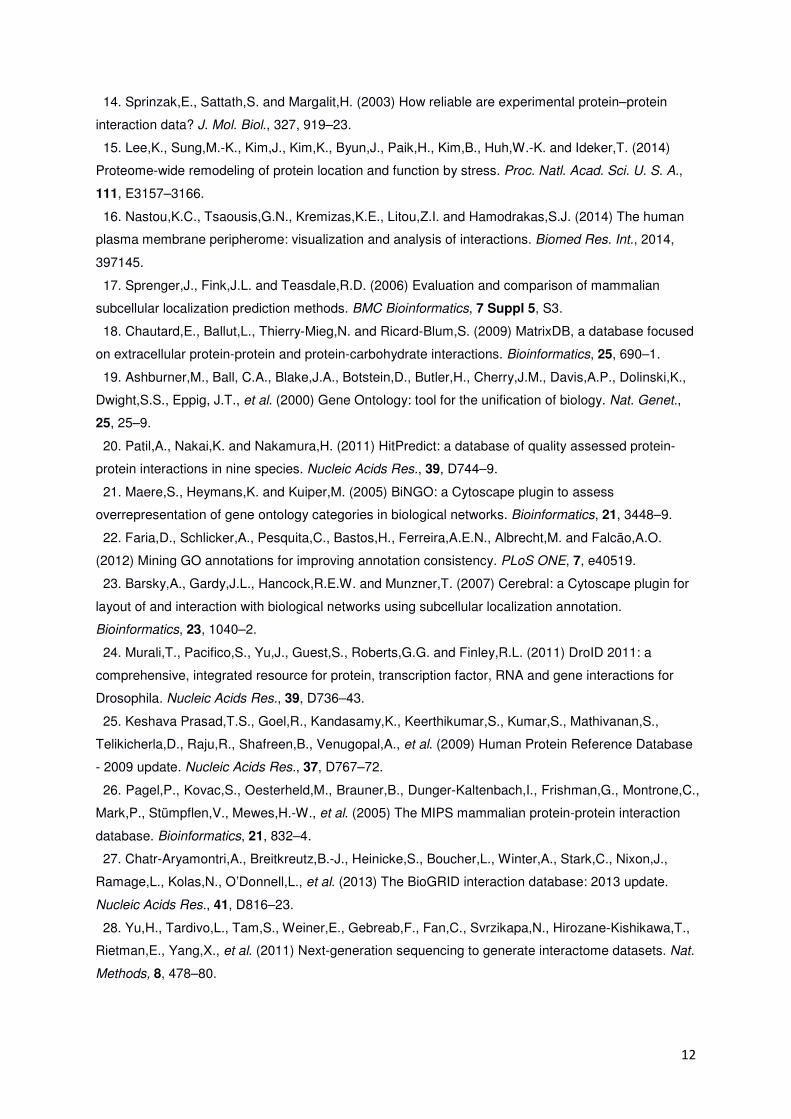
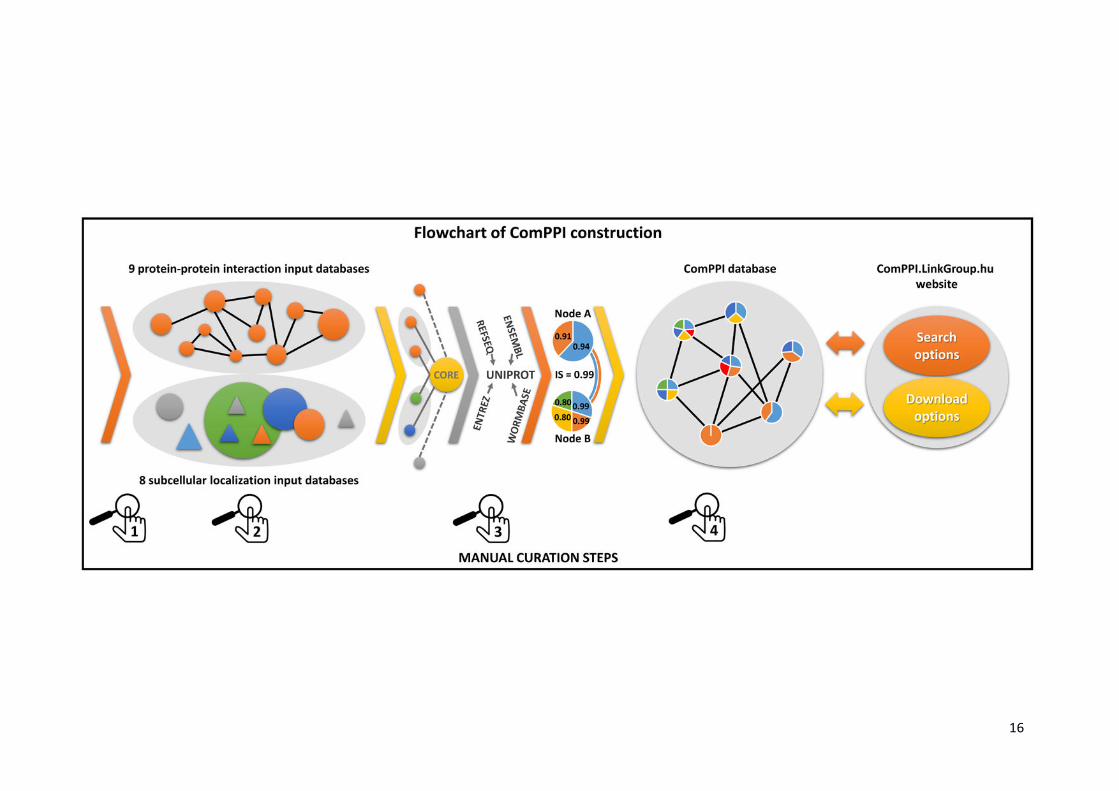
Figure 1. Flowchart of ComPPI construction highlighting the four curation steps. Constructing
the ComPPI database we first checked the data content of 24 possible input databases for false
entries, data inconsistence and compatible data structure in order to minimize the bias in ComPPI
coming from the input sources (1). As a consequence we selected 9 protein-protein interaction
(BioGRID (27), CCSB (28), DiP (29), DroID (24), HPRD (25), IntAct (30), MatrixDB (18), MINT (31)
and MIPS (26)) and 8 subcellular localization databases (eSLDB (35), Gene Ontology (19), Human
Proteinpedia (32), LOCATE (36), MatrixDB (18), OrganelleDB (37), PA-GOSUB (34) and The Human
Protein Atlas (33)) in order to integrate them into the ComPPI dataset. The subcellular localization
structure was manually annotated creating a hierarchic, non-redundant subcellular localization tree
using >1600 Gene Ontology cellular component terms (19) for the standardization of the different data
resolution and naming conventions (2). All input databases were connected to the ComPPI core
database with newly built interfaces in order to improve data consistency, to allow easy extensibility
with new databases and to incorporate automatic database updates. As part of the curation steps the
filtering efficiency of our newly built interfaces were tested on 200 random proteins for every input
databases, and the interfaces were accepted only when all the requested false-entries and data
content errors were filtered, in order to establish a more reliable content (Supplementary Table S3).
During data integration, different protein naming conventions were mapped to the most reliable
protein name. In this process we used publicly available mapping tables (UniProt (49) and HPRD
(25)). For 30% of protein names we applied manually built mapping tables with the help of online ID
cross-reference services (PICR (50) and Synergizer (http://llama.mshri.on.ca/synergizer/translate/))
(3). After data integration Localization and Interaction Scores were calculated (for detailed description
see Figure 2). As an illustration we show the example of Figure 2 with two interacting proteins (nodes
A and B corresponding to HSP 90-alpha A2 and Survivin, respectively) with shared cytosolic and
nuclear localizations (light blue and orange). Node B has an additional membrane (yellow) subcellular
localization and an extracellular localization (green). Numbers in the circles of nodes A and B refer to
their Localization Scores. The Interaction Score (IS) of nodes A and B is 0.99 (see Figure 2 for
details). The integrated ComPPI dataset was manually revised by 6 independent experts (4). During
the revision two of the 6 experts tested our database on 200 random proteins each to ensure high-
quality control requirements, and searched for exact matches between the entries in the input sources
and the ComPPI dataset. All the experts searched for false entries, data inconsistency, protein name
mapping errors in the downloadable data, and tested the operation of the online services as well.
After the revision we updated our source databases, their interfaces, the subcellular localization tree
and the algorithm generating the downloadable data, in order to acquire all the changes proposed
during the tests. As the final result, the webpage http://ComPPI.LinkGroup.hu is available for search
and download options in order to extract the biological information in a user-friendly way.
15
16
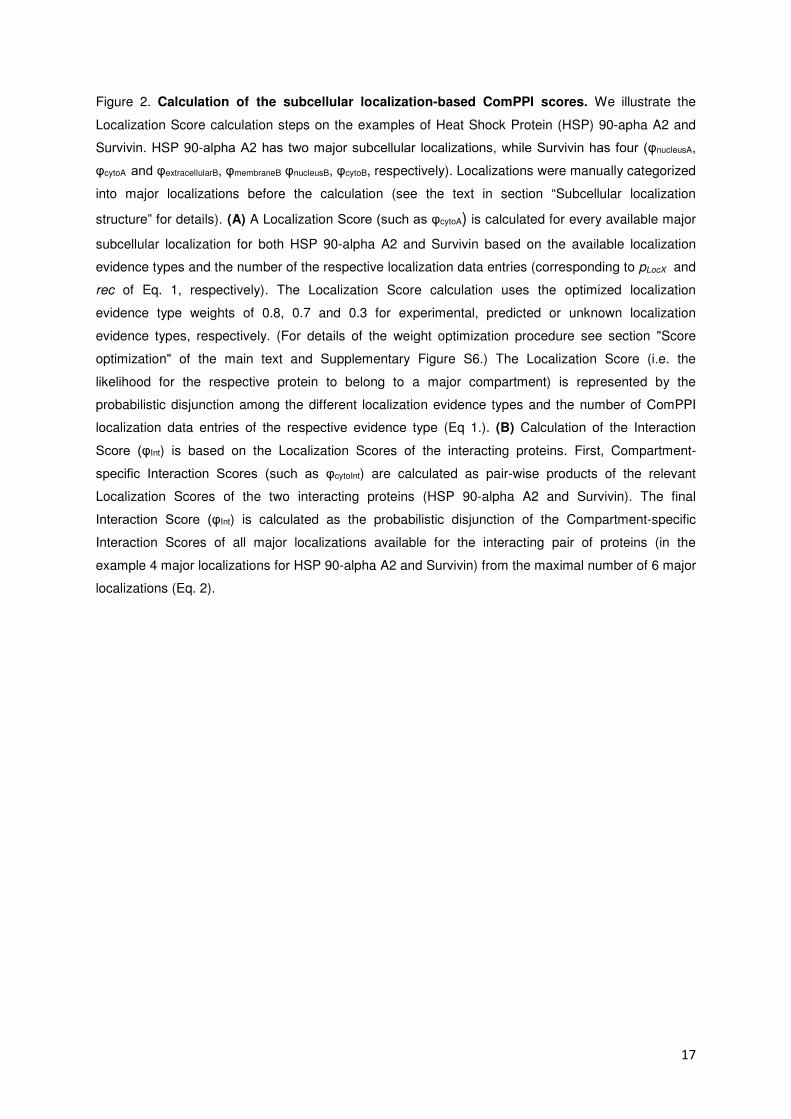
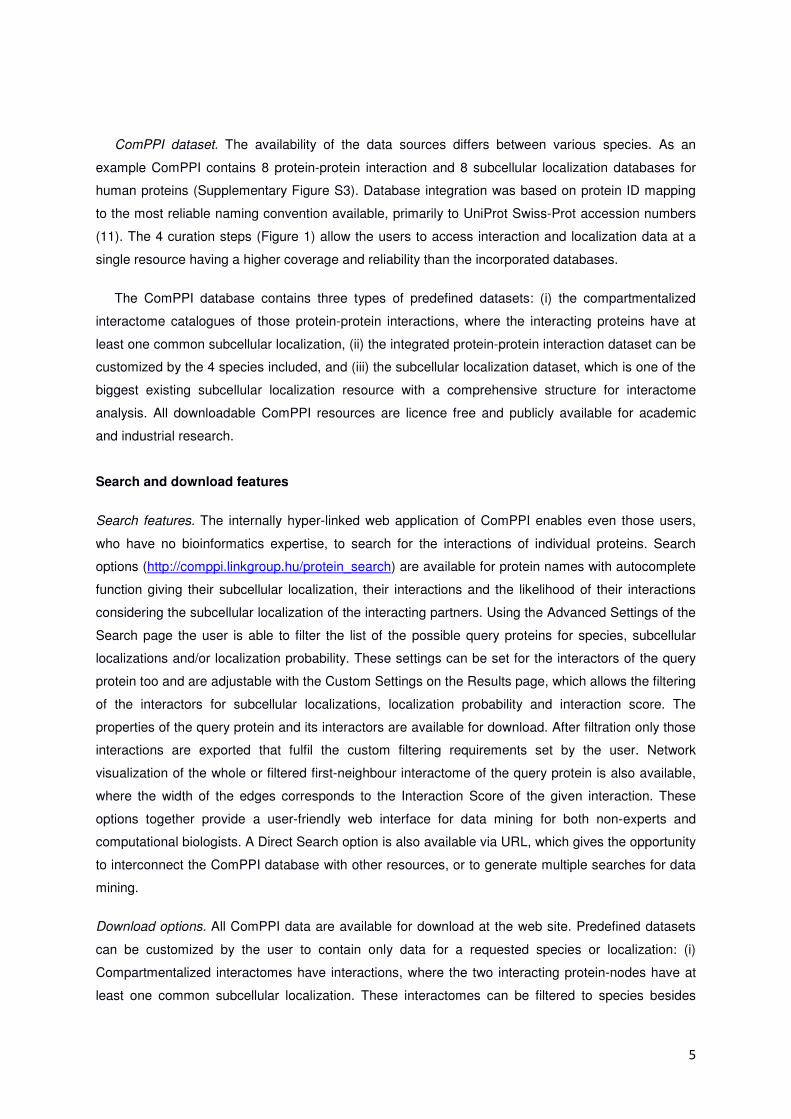
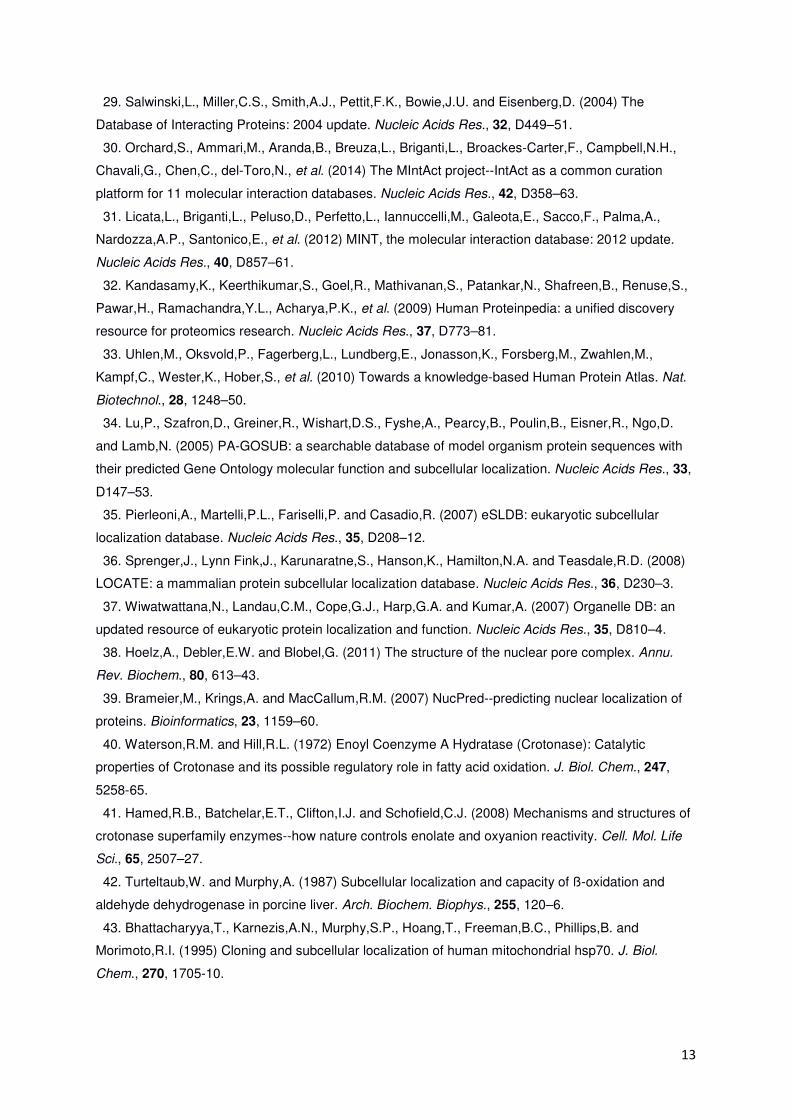
Figure 2. Calculation of the subcellular localization-based ComPPI scores. We illustrate the
Localization Score calculation steps on the examples of Heat Shock Protein (HSP) 90-apha A2 and
Survivin. HSP 90-alpha A2 has two major subcellular localizations, while Survivin has four (φnucleusA,
φcytoA and φextracellularB, φmembraneB φnucleusB, φcytoB, respectively). Localizations were manually categorized
into major localizations before the calculation (see the text in section “Subcellular localization
structure” for details). (A) A Localization Score (such as φcytoA) is calculated for every available major
subcellular localization for both HSP 90-alpha A2 and Survivin based on the available localization
evidence types and the number of the respective localization data entries (corresponding to pLocX and
rec of Eq. 1, respectively). The Localization Score calculation uses the optimized localization
evidence type weights of 0.8, 0.7 and 0.3 for experimental, predicted or unknown localization
evidence types, respectively. (For details of the weight optimization procedure see section "Score
optimization" of the main text and Supplementary Figure S6.) The Localization Score (i.e. the
likelihood for the respective protein to belong to a major compartment) is represented by the
probabilistic disjunction among the different localization evidence types and the number of ComPPI
localization data entries of the respective evidence type (Eq 1.). (B) Calculation of the Interaction
Score (φInt) is based on the Localization Scores of the interacting proteins. First, Compartment-
specific Interaction Scores (such as φcytoInt) are calculated as pair-wise products of the relevant
Localization Scores of the two interacting proteins (HSP 90-alpha A2 and Survivin). The final
Interaction Score (φInt) is calculated as the probabilistic disjunction of the Compartment-specific
Interaction Scores of all major localizations available for the interacting pair of proteins (in the
example 4 major localizations for HSP 90-alpha A2 and Survivin) from the maximal number of 6 major
localizations (Eq. 2).
17
18
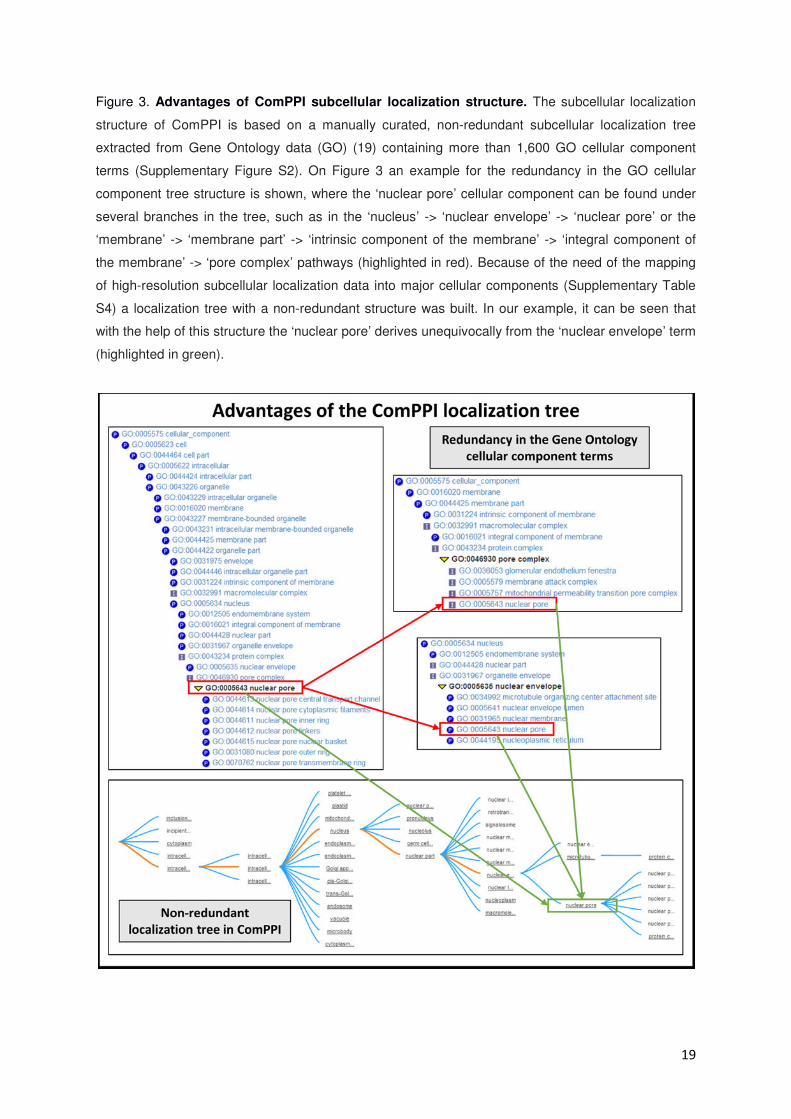
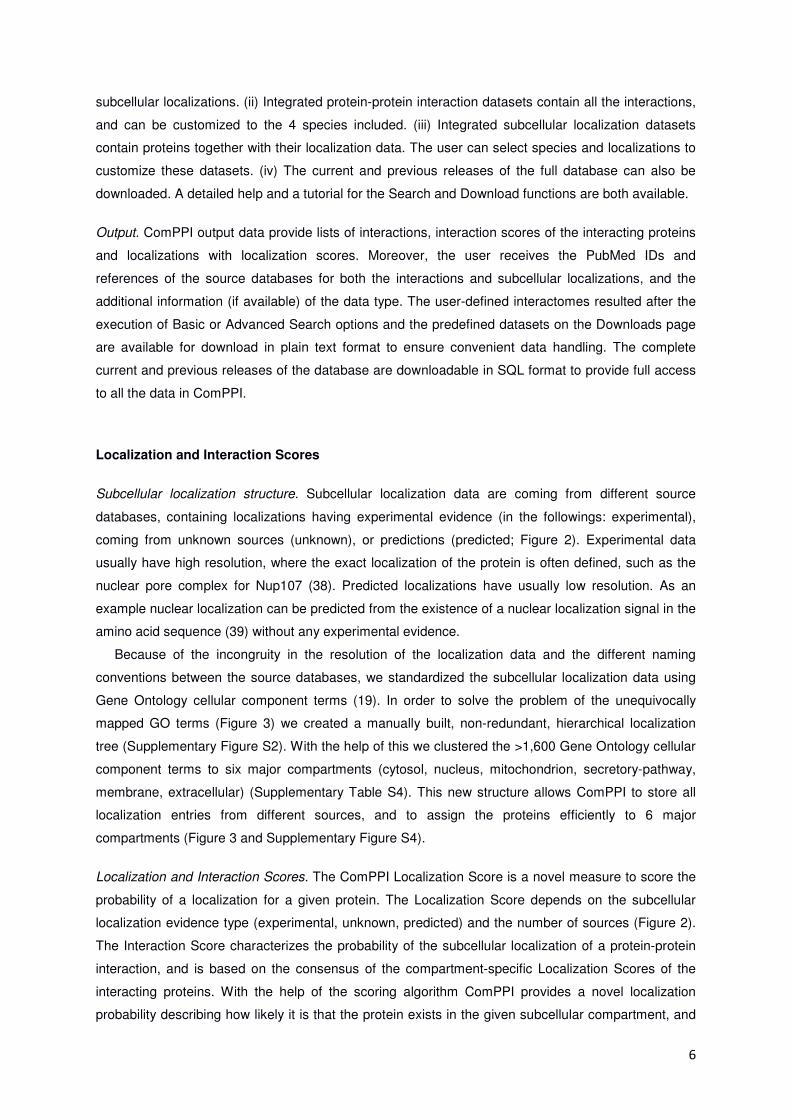
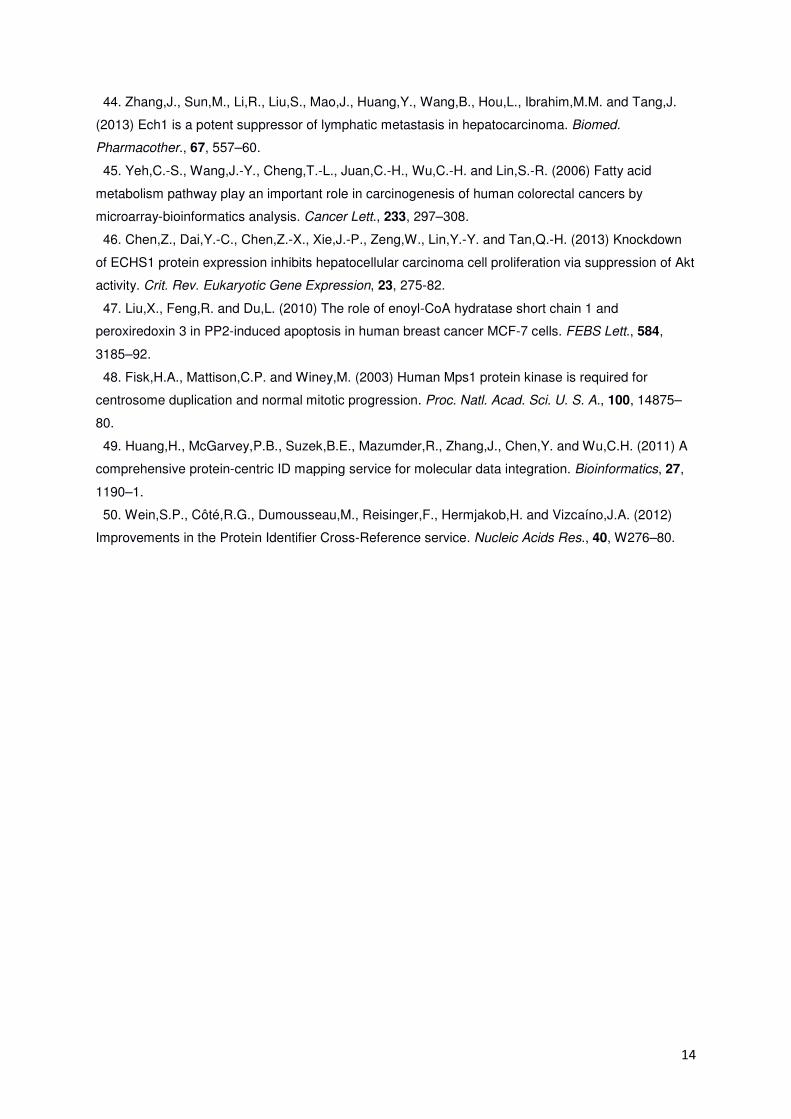
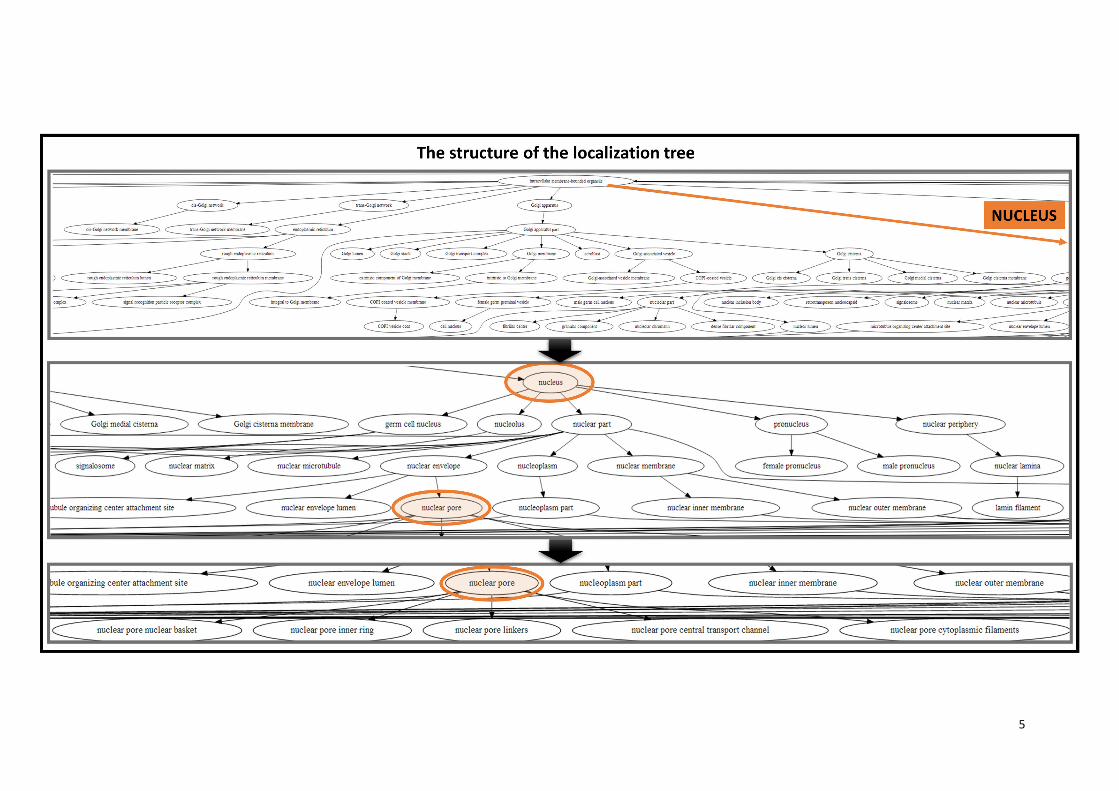
Figure 3. Advantages of ComPPI subcellular localization structure. The subcellular localization
structure of ComPPI is based on a manually curated, non-redundant subcellular localization tree
extracted from Gene Ontology data (GO) (19) containing more than 1,600 GO cellular component
terms (Supplementary Figure S2). On Figure 3 an example for the redundancy in the GO cellular
component tree structure is shown, where the ‘nuclear pore’ cellular component can be found under
several branches in the tree, such as in the ‘nucleus’ -> ‘nuclear envelope’ -> ‘nuclear pore’ or the
‘membrane’ -> ‘membrane part’ -> ‘intrinsic component of the membrane’ -> ‘integral component of
the membrane’ -> ‘pore complex’ pathways (highlighted in red). Because of the need of the mapping
of high-resolution subcellular localization data into major cellular components (Supplementary Table
S4) a localization tree with a non-redundant structure was built. In our example, it can be seen that
with the help of this structure the ‘nuclear pore’ derives unequivocally from the ‘nuclear envelope’ term
(highlighted in green).
19
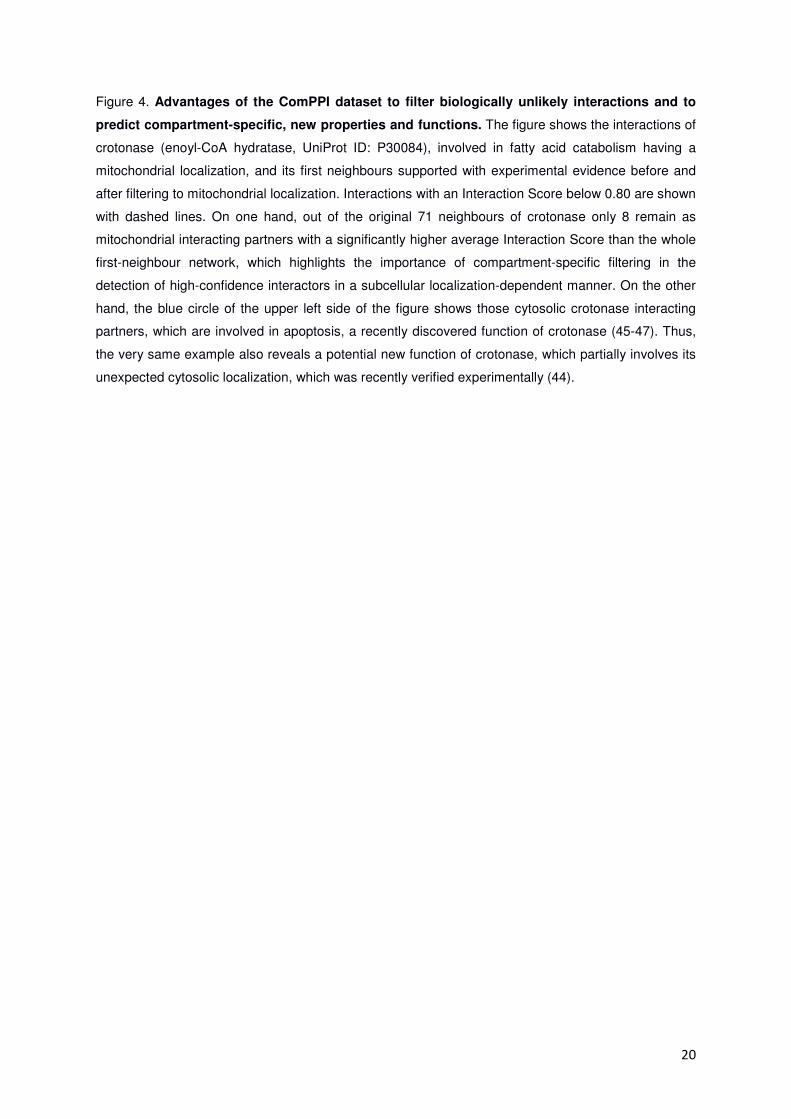
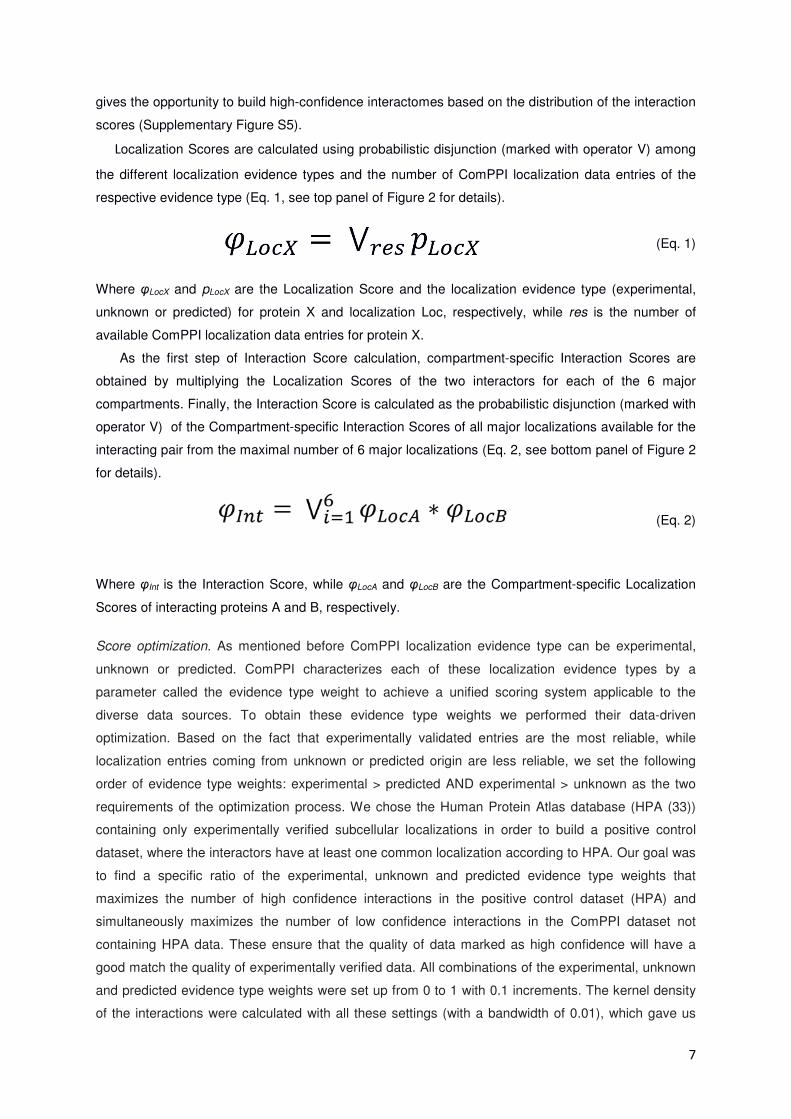
Figure 4. Advantages of the ComPPI dataset to filter biologically unlikely interactions and to
predict compartment-specific, new properties and functions. The figure shows the interactions of
crotonase (enoyl-CoA hydratase, UniProt ID: P30084), involved in fatty acid catabolism having a
mitochondrial localization, and its first neighbours supported with experimental evidence before and
after filtering to mitochondrial localization. Interactions with an Interaction Score below 0.80 are shown
with dashed lines. On one hand, out of the original 71 neighbours of crotonase only 8 remain as
mitochondrial interacting partners with a significantly higher average Interaction Score than the whole
first-neighbour network, which highlights the importance of compartment-specific filtering in the
detection of high-confidence interactors in a subcellular localization-dependent manner. On the other
hand, the blue circle of the upper left side of the figure shows those cytosolic crotonase interacting
partners, which are involved in apoptosis, a recently discovered function of crotonase (45-47). Thus,
the very same example also reveals a potential new function of crotonase, which partially involves its
unexpected cytosolic localization, which was recently verified experimentally (44).
20
21
Supplementary Material to
ComPPI: a cellular compartment-specific database for protein-protein interaction network analysis
Daniel V. Veres1, Dávid M. Gyurkó1, Benedek Thaler1,2, Kristóf Z. Szalay1, Dávid Fazekas3,
Tamás Korcsmáros3,4,5 and Peter Csermely1,*
1Department of Medical Chemistry, Semmelweis University, Budapest, Hungary; 2Faculty of Electrical
Engineering and Informatics, Budapest University of Technology and Economics, Budapest, Hungary; 3Department of Genetics, Eötvös Loránd University, Budapest, Hungary; 4TGAC, The Genome Analysis Centre,
Norwich, UK; 5Gut Health and Food Safety Programme, Institute of Food Research, Norwich, UK;
*To whom correspondence should be addressed. Tel: +361-459-1500; Fax: +361-266-3802; Email:
[email protected]; The authors wish it to be known that, in their opinion, the first 2
authors should be regarded as joint First Authors.
Table of Contents
Supplementary Figure S1. The role of multiple subcellular localizations on the example of
IGFBP-2 and HIF-1 Alpha proteins. ........................................................................................................... 2
Supplementary Figure S2. The localization tree used for the ComPPI subcellular localization
data integration. ............................................................................................................................................. 4
Supplementary Figure S3. The overlap between subcellular localization and protein-protein
interaction input databases used in the assembly of ComPPI. ......................................................... 6
Supplementary Figure S4. Advantages of multiple localization evidence. ..................................... 10
Supplementary Figure S5. The distribution of the ComPPI Localization and Interaction Scores.
.......................................................................................................................................................................... 12
Supplementary Figure S6. Optimization of the ComPPI localization evidence type weights. .... 15
Supplementary Figure S7. Advantages of ComPPI: prediction of compartment-specific, new
properties and functions of MPS1. .......................................................................................................... 18
Supplementary Table S1. Comparison of ComPPI with similar tools and databases.................. 20
Supplementary Table S2. Statistics of the ComPPI database. ........................................................... 22
Supplementary Table S3. Comparison of the ComPPI content to the input databases, and the
effects of our filtering algorithms and manual validation steps...................................................... 25
Supplementary Table S4. Mapping of high resolution subcellular localization data into major
cellular components. .................................................................................................................................. 28
Supplementary Table S5. Importance of the removal of localization-based biologically unlikely
interactions. .................................................................................................................................................. 30
Supplementary Table S6. The results of the Gene Ontology biological process enrichment
analysis of the two example proteins, crotonase and MPS1. .......................................................... 33
Supplementary References ....................................................................................................................... 35
1
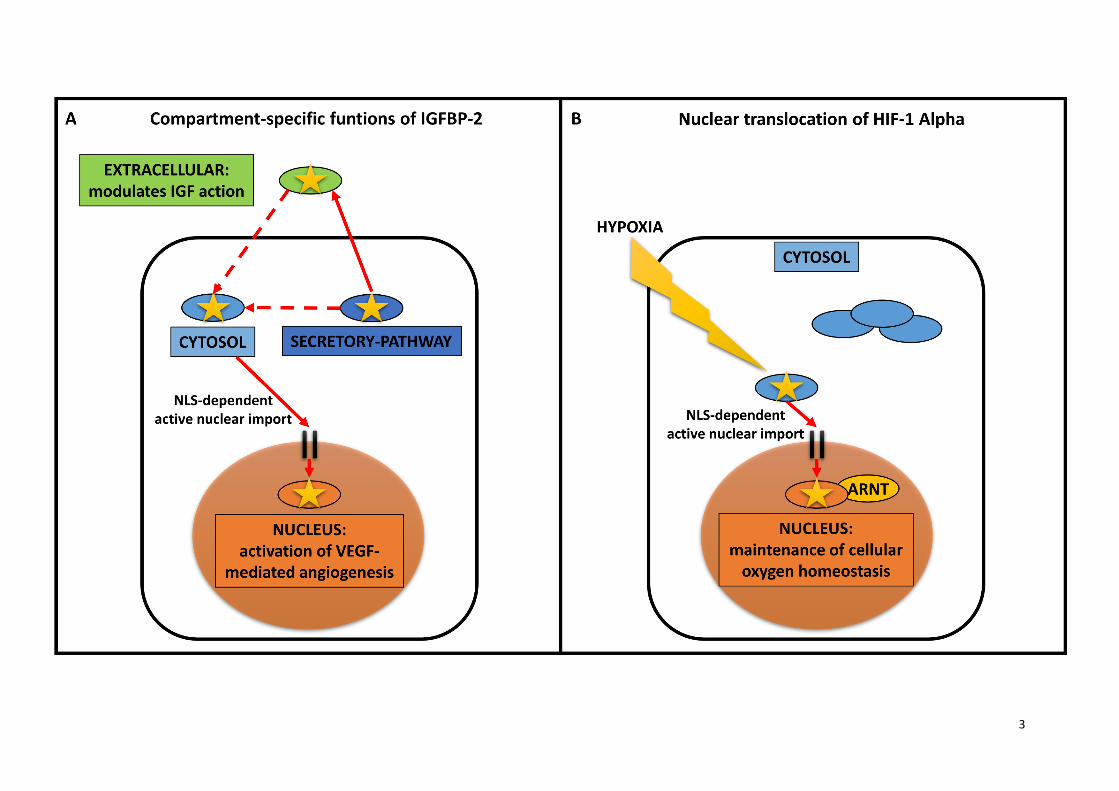
Supplementary Figure S1. The role of multiple subcellular localizations on the example of
IGFBP-2 and HIF-1 Alpha proteins.
Panel (A) depicts the compartment-specific functions of IGFBP-2. IGFBP-2 is a secreted (dark blue),
predominantly extracellular (green) protein involved in insulin growth factor (IGF) signalling (1).
IGFBP-2 is also localized in the nucleus (orange), where it is required for the activation of VEGF-
mediated angiogenesis (2). This binary function of IGFBP-2 turned out to be an important prognostic
biomarker in several cancer types, such as breast cancer (3). Panel (B) shows another important
example, HIF-1 Alpha, which is a member of the hypoxia inducible factor (HIF) family, and has a key
importance in the maintenance of cellular oxygen homeostasis, particularly in the response to hypoxia
(4). In order to act as a transcription factor, HIF-1 Alpha has to translocate from the cytosol (light blue)
into the nucleus (orange). HIF-1 Alpha and the aryl hydrocarbon receptor nuclear translocator (ARNT)
form a heterodimer in the nucleus, which is required for their stable nuclear association (5). This
regulated transport has key role in HIF-1 Alpha activity control both in healthy conditions (6) and in the
development of cancer (7).
2
3
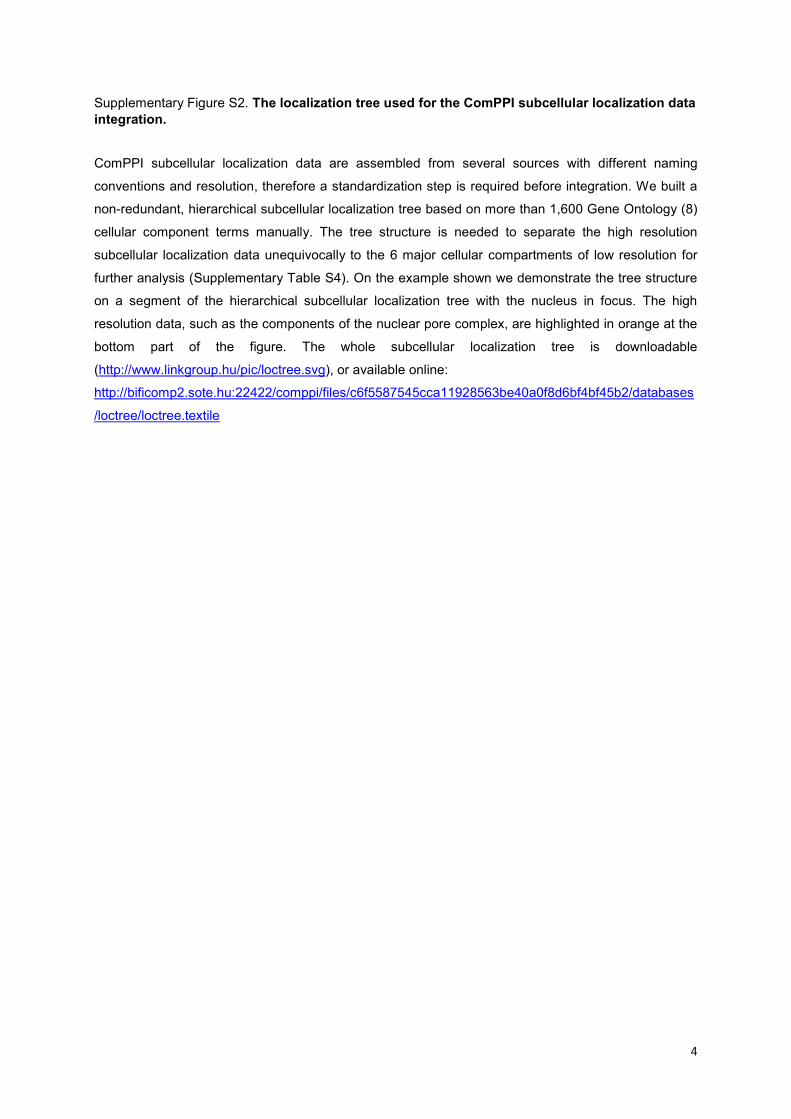
Supplementary Figure S2. The localization tree used for the ComPPI subcellular localization data
integration.
ComPPI subcellular localization data are assembled from several sources with different naming
conventions and resolution, therefore a standardization step is required before integration. We built a
non-redundant, hierarchical subcellular localization tree based on more than 1,600 Gene Ontology (8)
cellular component terms manually. The tree structure is needed to separate the high resolution
subcellular localization data unequivocally to the 6 major cellular compartments of low resolution for
further analysis (Supplementary Table S4). On the example shown we demonstrate the tree structure
on a segment of the hierarchical subcellular localization tree with the nucleus in focus. The high
resolution data, such as the components of the nuclear pore complex, are highlighted in orange at the
bottom part of the figure. The whole subcellular localization tree is downloadable
(http://www.linkgroup.hu/pic/loctree.svg), or available online:
http://bificomp2.sote.hu:22422/comppi/files/c6f5587545cca11928563be40a0f8d6bf4bf45b2/databases
/loctree/loctree.textile
4
5
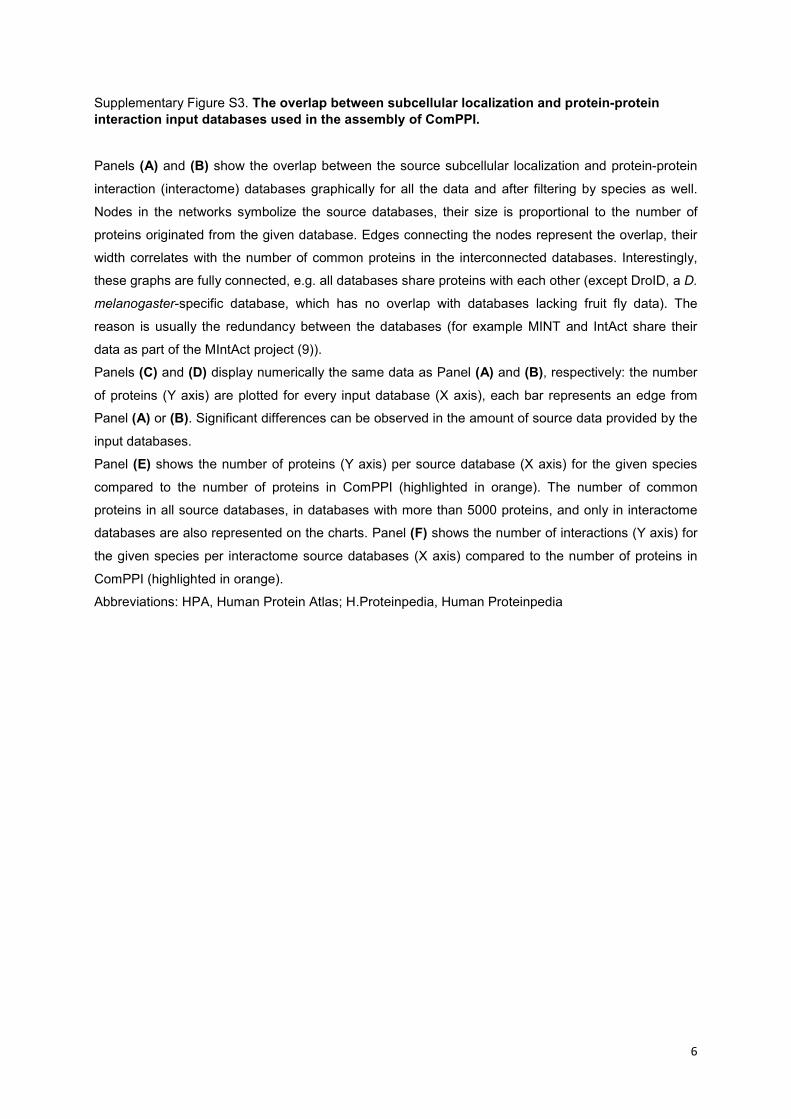
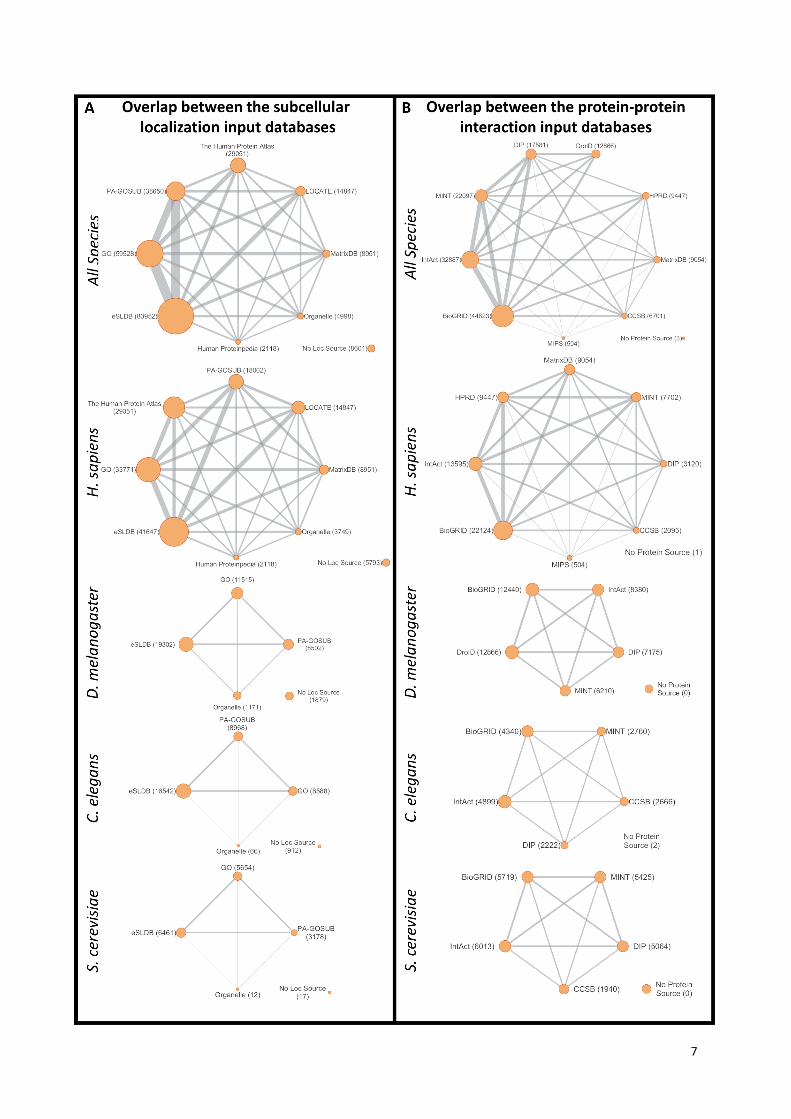
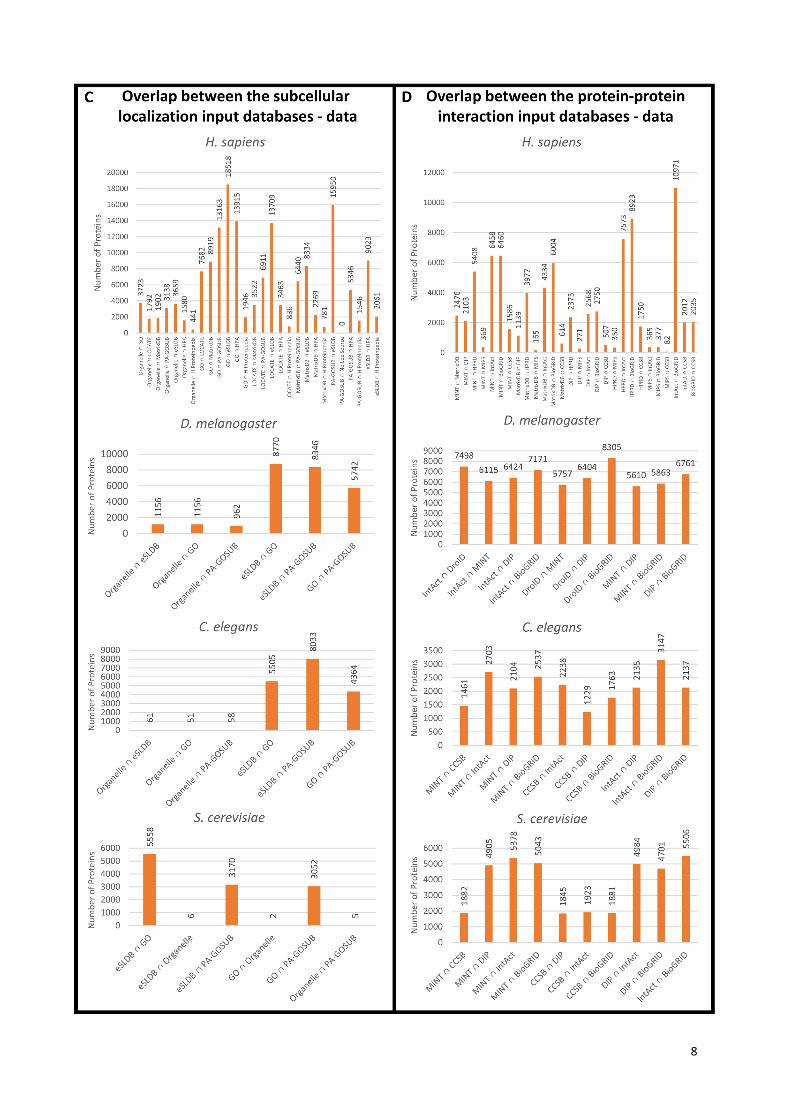
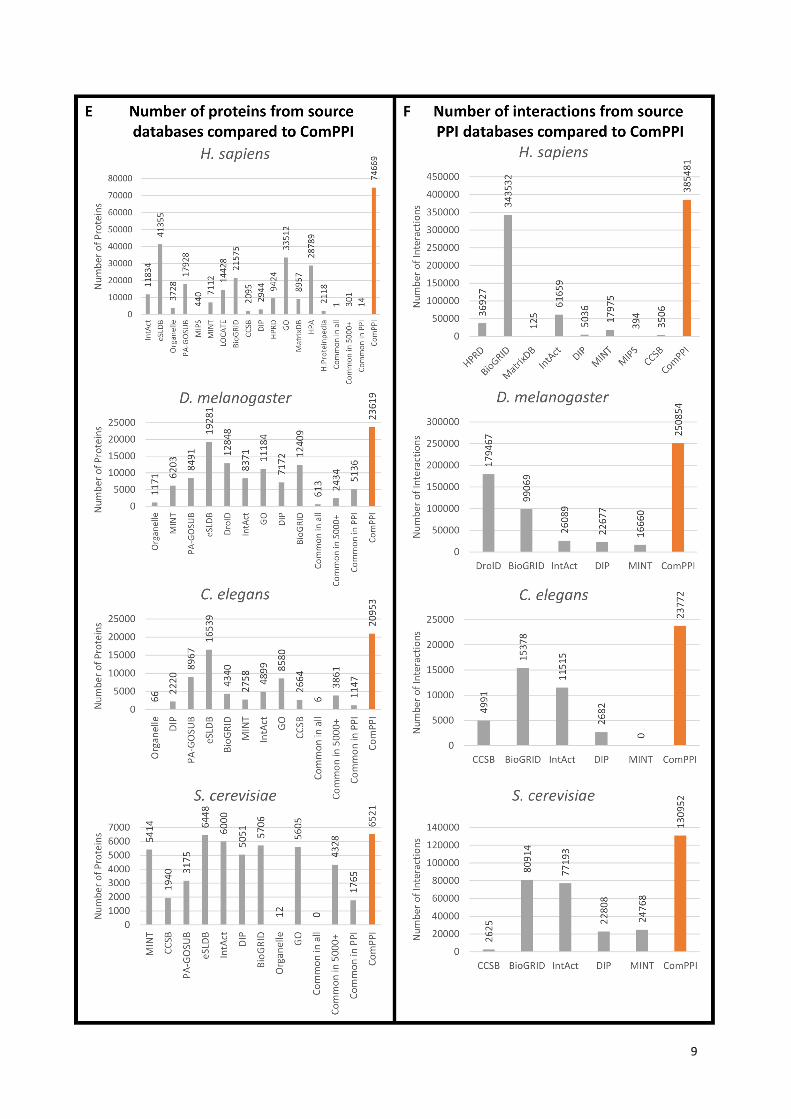
Supplementary Figure S3. The overlap between subcellular localization and protein-protein
interaction input databases used in the assembly of ComPPI.
Panels (A) and (B) show the overlap between the source subcellular localization and protein-protein
interaction (interactome) databases graphically for all the data and after filtering by species as well.
Nodes in the networks symbolize the source databases, their size is proportional to the number of
proteins originated from the given database. Edges connecting the nodes represent the overlap, their
width correlates with the number of common proteins in the interconnected databases. Interestingly,
these graphs are fully connected, e.g. all databases share proteins with each other (except DroID, a D.
melanogaster-specific database, which has no overlap with databases lacking fruit fly data). The
reason is usually the redundancy between the databases (for example MINT and IntAct share their
data as part of the MIntAct project (9)).
Panels (C) and (D) display numerically the same data as Panel (A) and (B), respectively: the number
of proteins (Y axis) are plotted for every input database (X axis), each bar represents an edge from
Panel (A) or (B). Significant differences can be observed in the amount of source data provided by the
input databases.
Panel (E) shows the number of proteins (Y axis) per source database (X axis) for the given species
compared to the number of proteins in ComPPI (highlighted in orange). The number of common
proteins in all source databases, in databases with more than 5000 proteins, and only in interactome
databases are also represented on the charts. Panel (F) shows the number of interactions (Y axis) for
the given species per interactome source databases (X axis) compared to the number of proteins in
ComPPI (highlighted in orange).
Abbreviations: HPA, Human Protein Atlas; H.Proteinpedia, Human Proteinpedia
6
7
8
9
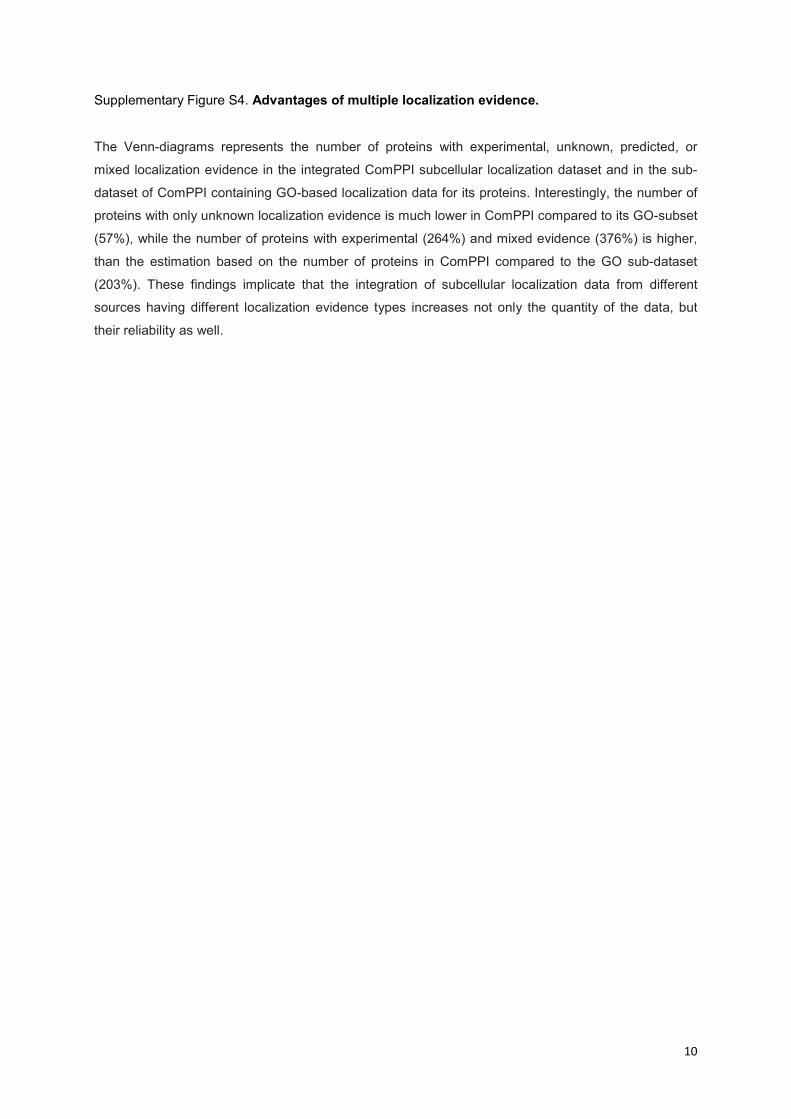
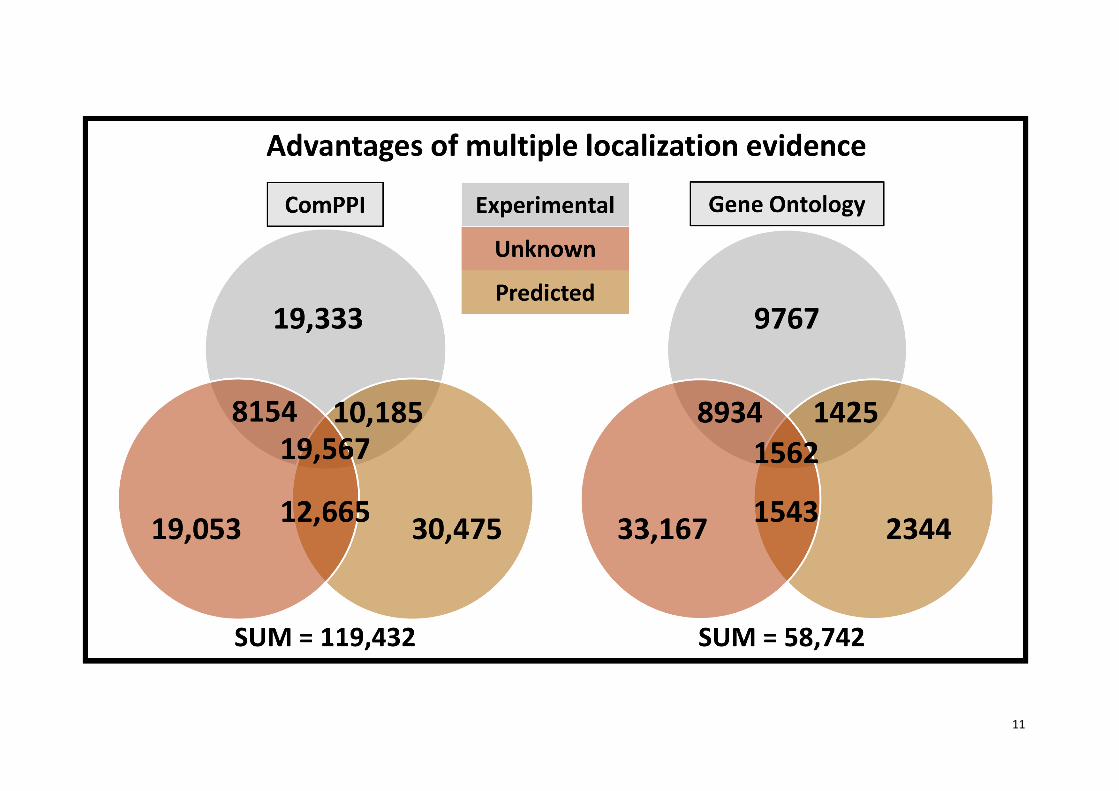
Supplementary Figure S4. Advantages of multiple localization evidence.
The Venn-diagrams represents the number of proteins with experimental, unknown, predicted, or
mixed localization evidence in the integrated ComPPI subcellular localization dataset and in the sub-
dataset of ComPPI containing GO-based localization data for its proteins. Interestingly, the number of
proteins with only unknown localization evidence is much lower in ComPPI compared to its GO-subset
(57%), while the number of proteins with experimental (264%) and mixed evidence (376%) is higher,
than the estimation based on the number of proteins in ComPPI compared to the GO sub-dataset
(203%). These findings implicate that the integration of subcellular localization data from different
sources having different localization evidence types increases not only the quantity of the data, but
their reliability as well.
10
11
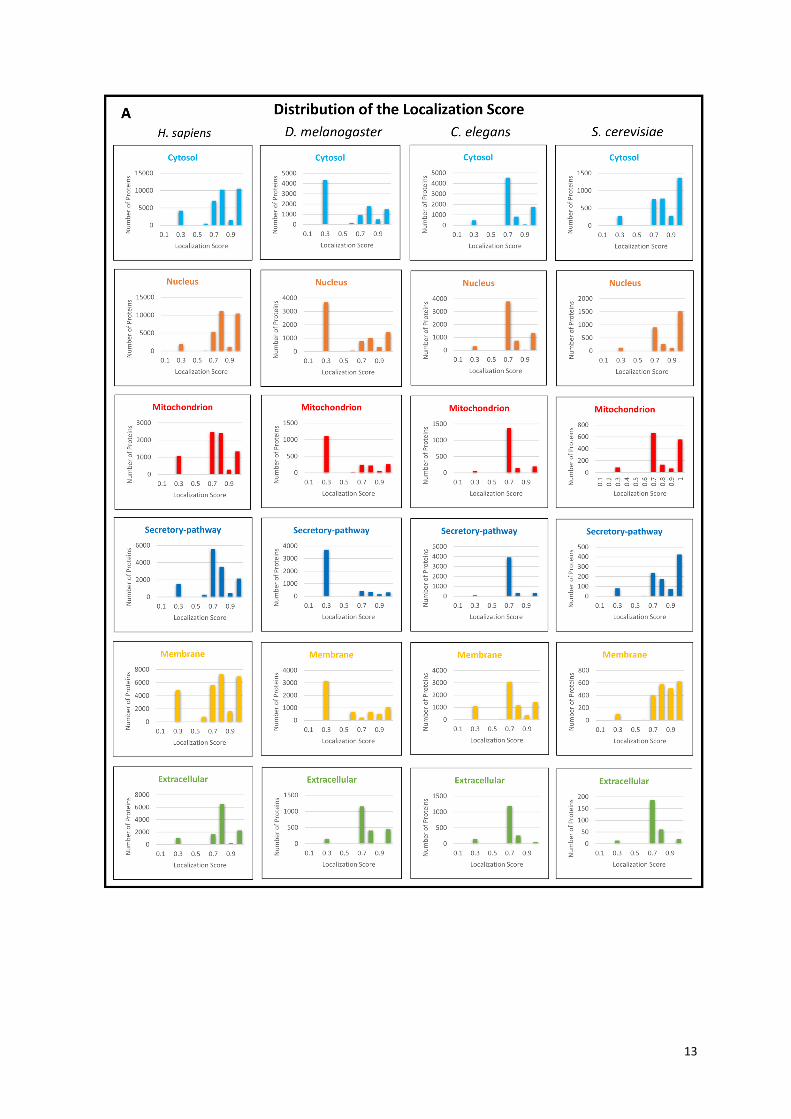
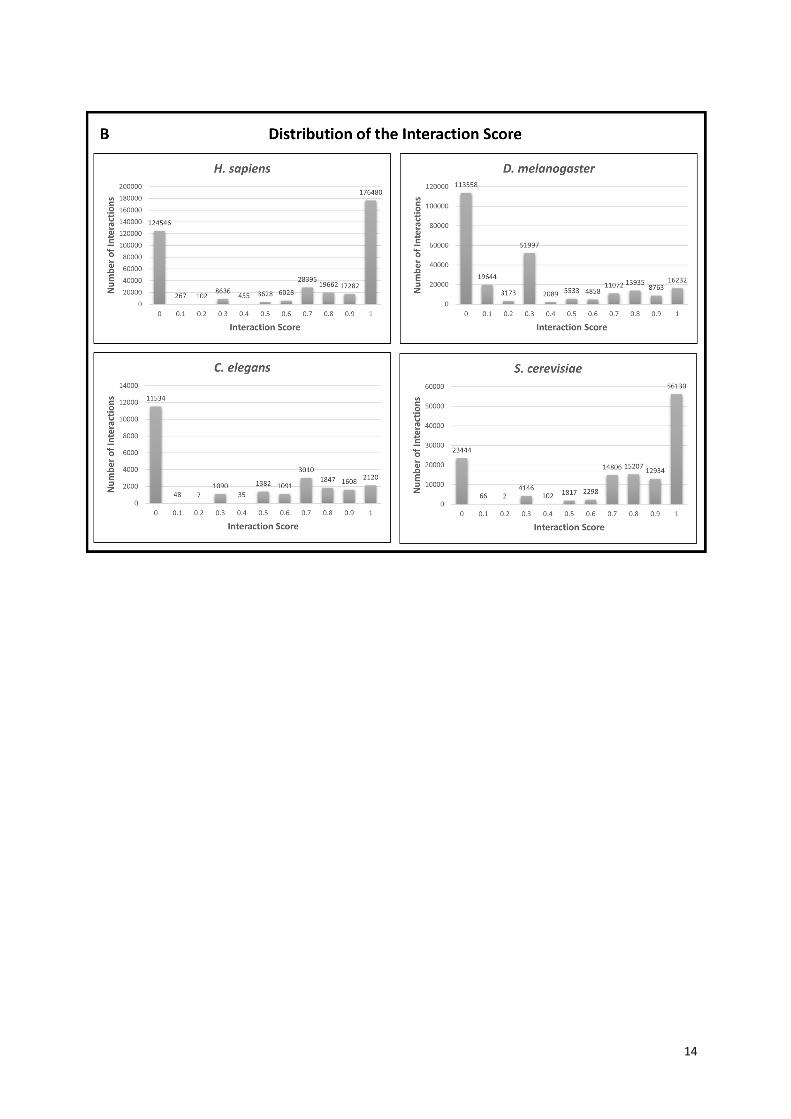
Supplementary Figure S5. The distribution of the ComPPI Localization and Interaction Scores.
Panel (A) shows the distribution histogram of the Localization Scores for the 4 species of ComPPI
separated by the 6 major cellular compartments containing all subcellular localization data. The X axis
represents the confidence intervals of the Localization Score between 0 and 1 by 0.1 increments,
while the Y axis shows the number of proteins belonging to the given compartment. On panel (B) the
distribution histogram of the Interaction Scores is shown for the 4 species of ComPPI containing the
integrated protein-protein interaction data. The X axis depicts the confidence intervals of the
Interaction Score between 0 and 1 by 0.1 increments, while the Y axis shows the number of
interactions in the given confidence interval. See more about the Localization and Interaction Scores
in Figure 2 and Supplementary Figure S6.
12
13
14
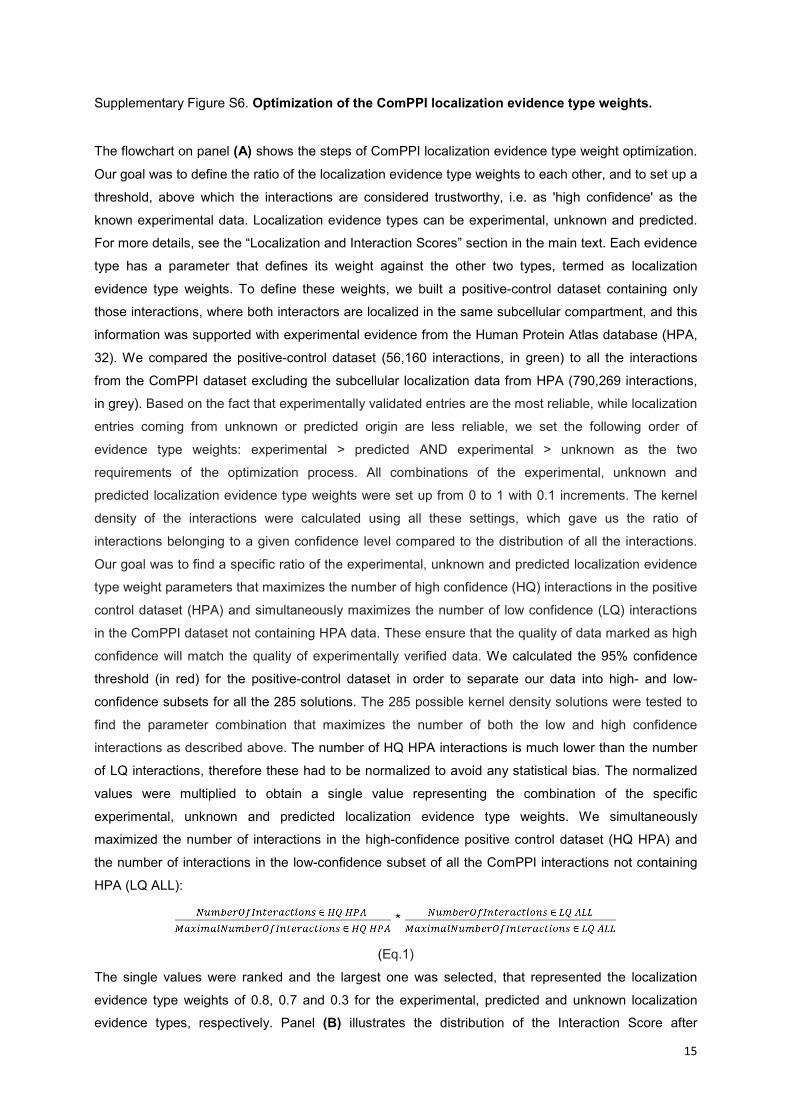
Supplementary Figure S6. Optimization of the ComPPI localization evidence type weights.
The flowchart on panel (A) shows the steps of ComPPI localization evidence type weight optimization.
Our goal was to define the ratio of the localization evidence type weights to each other, and to set up a
threshold, above which the interactions are considered trustworthy, i.e. as 'high confidence' as the
known experimental data. Localization evidence types can be experimental, unknown and predicted.
For more details, see the “Localization and Interaction Scores” section in the main text. Each evidence
type has a parameter that defines its weight against the other two types, termed as localization
evidence type weights. To define these weights, we built a positive-control dataset containing only
those interactions, where both interactors are localized in the same subcellular compartment, and this
information was supported with experimental evidence from the Human Protein Atlas database (HPA,
32). We compared the positive-control dataset (56,160 interactions, in green) to all the interactions
from the ComPPI dataset excluding the subcellular localization data from HPA (790,269 interactions,
in grey). Based on the fact that experimentally validated entries are the most reliable, while localization
entries coming from unknown or predicted origin are less reliable, we set the following order of
evidence type weights: experimental > predicted AND experimental > unknown as the two
requirements of the optimization process. All combinations of the experimental, unknown and
predicted localization evidence type weights were set up from 0 to 1 with 0.1 increments. The kernel
density of the interactions were calculated using all these settings, which gave us the ratio of
interactions belonging to a given confidence level compared to the distribution of all the interactions.
Our goal was to find a specific ratio of the experimental, unknown and predicted localization evidence
type weight parameters that maximizes the number of high confidence (HQ) interactions in the positive
control dataset (HPA) and simultaneously maximizes the number of low confidence (LQ) interactions
in the ComPPI dataset not containing HPA data. These ensure that the quality of data marked as high
confidence will match the quality of experimentally verified data. We calculated the 95% confidence
threshold (in red) for the positive-control dataset in order to separate our data into high- and low-
confidence subsets for all the 285 solutions. The 285 possible kernel density solutions were tested to
find the parameter combination that maximizes the number of both the low and high confidence
interactions as described above. The number of HQ HPA interactions is much lower than the number
of LQ interactions, therefore these had to be normalized to avoid any statistical bias. The normalized
values were multiplied to obtain a single value representing the combination of the specific
experimental, unknown and predicted localization evidence type weights. We simultaneously
maximized the number of interactions in the high-confidence positive control dataset (HQ HPA) and
the number of interactions in the low-confidence subset of all the ComPPI interactions not containing
HPA (LQ ALL):
(Eq.1)
The single values were ranked and the largest one was selected, that represented the localization
evidence type weights of 0.8, 0.7 and 0.3 for the experimental, predicted and unknown localization
evidence types, respectively. Panel (B) illustrates the distribution of the Interaction Score after
15
optimization. The X axis shows the Interaction Score, while the Y axis represents the kernel density of
the interaction distribution. The figure shows that Interaction Score distribution for the positive-control
dataset (56,160 interactions, in green) and for the interactions not containing HPA localizations
(790,269 interactions, in grey), which had the largest value of Eq. 1, i.e. which had the optimal set of
localization evidence type weights out of the possible 285 representations. The number of high-
confidence interactions in the positive-control dataset with a confidence threshold at 95% equalled
48,567, while the number of high-confidence interactions in the ComPPI dataset excluding HPA was
241,076 (30% of total). The optimal distribution shown represented the 0.8, 0.7 and 0.3 localization
evidence type weight set for the experimental, predicted and unknown localization evidence types,
respectively. The relatively low weight (0.8) of the experimental evidence type means that (i) a single
evidence does not result in highly trusted subcellular localization and (ii) at least two pieces of
experimental evidence are required to have a localization score above 95%. The relatively high weight
(0.7) of the predicted evidence type is in agreement with the high reliability of subcellular localization
prediction methods, while the low weight (0.3) of the unknown evidence type highlights the need of the
validation of data origin. These facts taken together highlight the importance of data integration and
allow a strong filtering of the ComPPI dataset resulting in reliable high-confidence interactions.
16
17
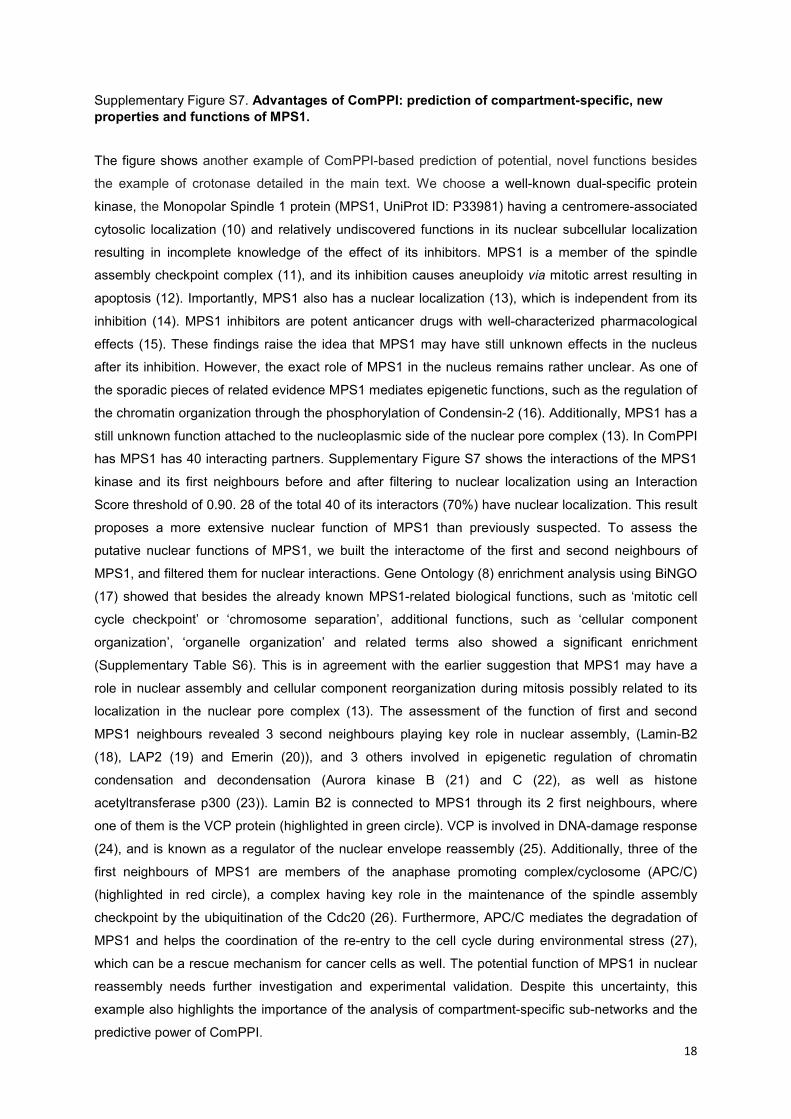
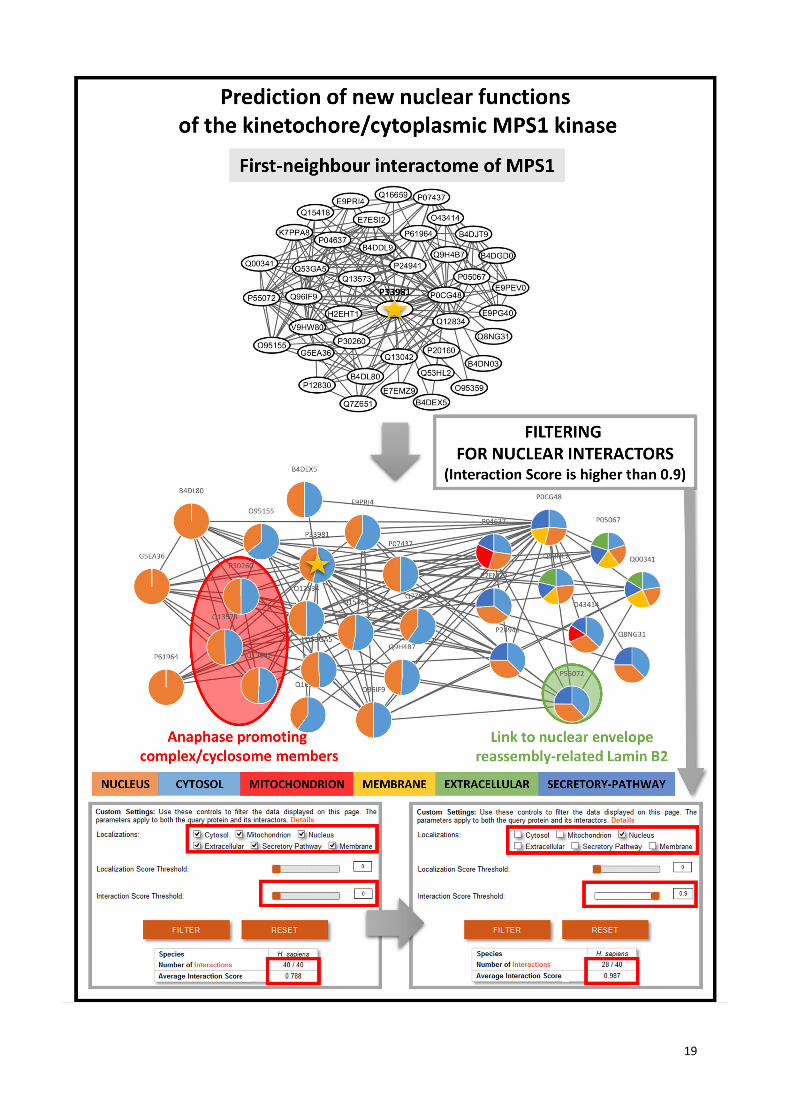
Supplementary Figure S7. Advantages of ComPPI: prediction of compartment-specific, new
properties and functions of MPS1.
The figure shows another example of ComPPI-based prediction of potential, novel functions besides
the example of crotonase detailed in the main text. We choose a well-known dual-specific protein
kinase, the Monopolar Spindle 1 protein (MPS1, UniProt ID: P33981) having a centromere-associated
cytosolic localization (10) and relatively undiscovered functions in its nuclear subcellular localization
resulting in incomplete knowledge of the effect of its inhibitors. MPS1 is a member of the spindle
assembly checkpoint complex (11), and its inhibition causes aneuploidy via mitotic arrest resulting in
apoptosis (12). Importantly, MPS1 also has a nuclear localization (13), which is independent from its
inhibition (14). MPS1 inhibitors are potent anticancer drugs with well-characterized pharmacological
effects (15). These findings raise the idea that MPS1 may have still unknown effects in the nucleus
after its inhibition. However, the exact role of MPS1 in the nucleus remains rather unclear. As one of
the sporadic pieces of related evidence MPS1 mediates epigenetic functions, such as the regulation of
the chromatin organization through the phosphorylation of Condensin-2 (16). Additionally, MPS1 has a
still unknown function attached to the nucleoplasmic side of the nuclear pore complex (13). In ComPPI
has MPS1 has 40 interacting partners. Supplementary Figure S7 shows the interactions of the MPS1
kinase and its first neighbours before and after filtering to nuclear localization using an Interaction
Score threshold of 0.90. 28 of the total 40 of its interactors (70%) have nuclear localization. This result
proposes a more extensive nuclear function of MPS1 than previously suspected. To assess the
putative nuclear functions of MPS1, we built the interactome of the first and second neighbours of
MPS1, and filtered them for nuclear interactions. Gene Ontology (8) enrichment analysis using BiNGO
(17) showed that besides the already known MPS1-related biological functions, such as ‘mitotic cell
cycle checkpoint’ or ‘chromosome separation’, additional functions, such as ‘cellular component
organization’, ‘organelle organization’ and related terms also showed a significant enrichment
(Supplementary Table S6). This is in agreement with the earlier suggestion that MPS1 may have a
role in nuclear assembly and cellular component reorganization during mitosis possibly related to its
localization in the nuclear pore complex (13). The assessment of the function of first and second
MPS1 neighbours revealed 3 second neighbours playing key role in nuclear assembly, (Lamin-B2
(18), LAP2 (19) and Emerin (20)), and 3 others involved in epigenetic regulation of chromatin
condensation and decondensation (Aurora kinase B (21) and C (22), as well as histone
acetyltransferase p300 (23)). Lamin B2 is connected to MPS1 through its 2 first neighbours, where
one of them is the VCP protein (highlighted in green circle). VCP is involved in DNA-damage response
(24), and is known as a regulator of the nuclear envelope reassembly (25). Additionally, three of the
first neighbours of MPS1 are members of the anaphase promoting complex/cyclosome (APC/C)
(highlighted in red circle), a complex having key role in the maintenance of the spindle assembly
checkpoint by the ubiquitination of the Cdc20 (26). Furthermore, APC/C mediates the degradation of
MPS1 and helps the coordination of the re-entry to the cell cycle during environmental stress (27),
which can be a rescue mechanism for cancer cells as well. The potential function of MPS1 in nuclear
reassembly needs further investigation and experimental validation. Despite this uncertainty, this
example also highlights the importance of the analysis of compartment-specific sub-networks and the
predictive power of ComPPI.
18
19
Supplementary Table S1. Comparison of ComPPI with similar tools and databases.
ComPPI is a unique resource, with an integrated protein-protein interaction dataset enriched by the
subcellular localization of the interactors, in order to perform more reliable compartment-specific
analysis of biological processes. We present here only those key examples from the wide set of tools,
databases and scoring algorithms, that had similar purposes to those of ComPPI. Besides a brief
summary some key advantages and disadvantages of the resources, and references to them are
listed. These tools and databases are open source, and mainly use Gene Ontology (8) based
subcellular localization annotations. See Figure 3 in the main text and Supplementary Figures S3 and
S4 for the advantages of the ComPPI structure and the comparison to the integrated source
databases.
20
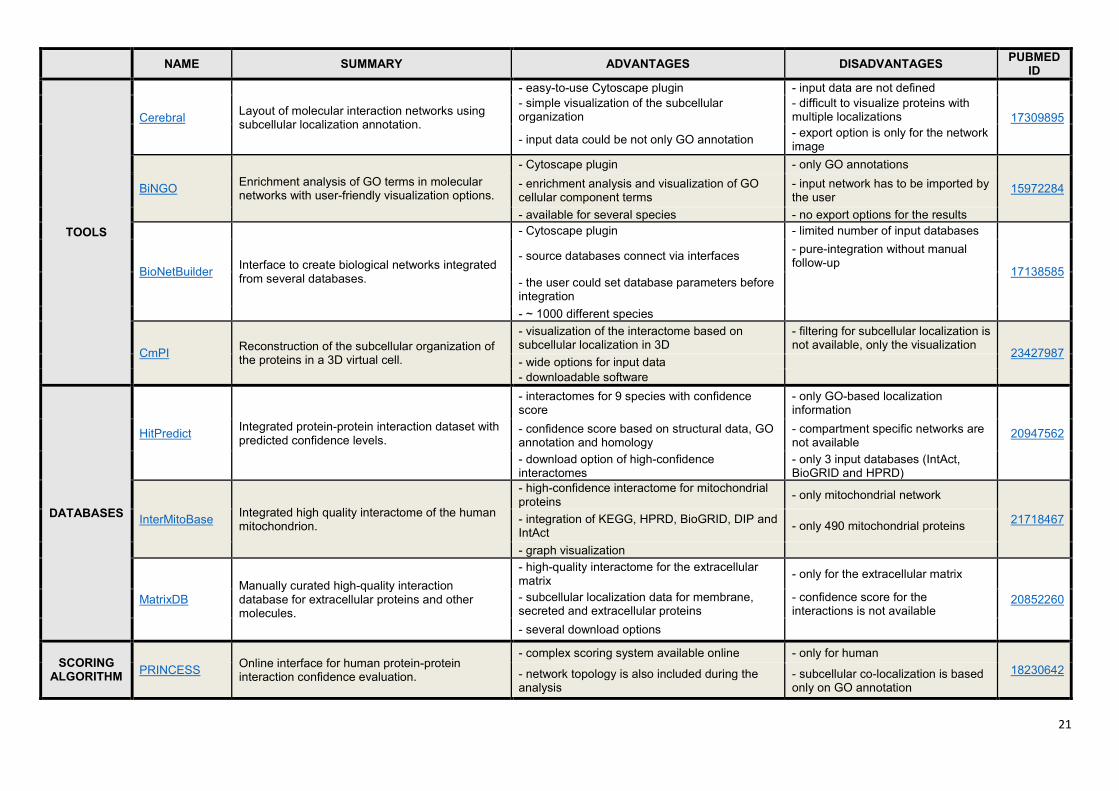
NAME SUMMARY ADVANTAGES DISADVANTAGES PUBMED
ID
TOOLS
Cerebral Layout of molecular interaction networks using subcellular localization annotation.
- easy-to-use Cytoscape plugin - input data are not defined
17309895
- simple visualization of the subcellular organization
- difficult to visualize proteins with multiple localizations
- input data could be not only GO annotation - export option is only for the network image
BiNGO Enrichment analysis of GO terms in molecular networks with user-friendly visualization options.
- Cytoscape plugin - only GO annotations
15972284 - enrichment analysis and visualization of GO cellular component terms
- input network has to be imported by the user
- available for several species - no export options for the results
BioNetBuilder Interface to create biological networks integrated from several databases.
- Cytoscape plugin - limited number of input databases
17138585
- source databases connect via interfaces - pure-integration without manual follow-up
- the user could set database parameters before integration
- ~ 1000 different species
CmPI Reconstruction of the subcellular organization of the proteins in a 3D virtual cell.
- visualization of the interactome based on subcellular localization in 3D
- filtering for subcellular localization is not available, only the visualization
23427987 - wide options for input data
- downloadable software
DATABASES
HitPredict Integrated protein-protein interaction dataset with predicted confidence levels.
- interactomes for 9 species with confidence score
- only GO-based localization information
20947562 - confidence score based on structural data, GO annotation and homology
- compartment specific networks are not available
- download option of high-confidence interactomes
- only 3 input databases (IntAct, BioGRID and HPRD)
InterMitoBase Integrated high quality interactome of the human mitochondrion.
- high-confidence interactome for mitochondrial proteins
- only mitochondrial network
21718467 - integration of KEGG, HPRD, BioGRID, DIP and IntAct
- only 490 mitochondrial proteins
- graph visualization
MatrixDB Manually curated high-quality interaction database for extracellular proteins and other molecules.
- high-quality interactome for the extracellular matrix
- only for the extracellular matrix
20852260 - subcellular localization data for membrane, secreted and extracellular proteins
- confidence score for the interactions is not available
- several download options
SCORING ALGORITHM
PRINCESS Online interface for human protein-protein interaction confidence evaluation.
- complex scoring system available online - only for human
18230642 - network topology is also included during the analysis
- subcellular co-localization is based only on GO annotation
21
Supplementary Table S2. Statistics of the ComPPI database.
The table shows the brief statistics of the ComPPI dataset after the integration of different sources.
ComPPI contains three types of downloadable datasets, (i) the compartmentalized interactome, where
the interacting proteins have at least one common subcellular localization, (ii) the integrated protein-
protein interaction dataset without localization information, and (iii) the integrated subcellular
localization dataset. ‘Summary Statistics’ shows the summary of the dataset for all 4 species. The
detailed statistics of the three dataset are available for each species for all localizations together and
per each major cellular component. Only the average Localization and Interaction Scores are
represented in this table. For more details about the distribution of Localization and Interaction Scores
see Supplementary Figure S5.
22
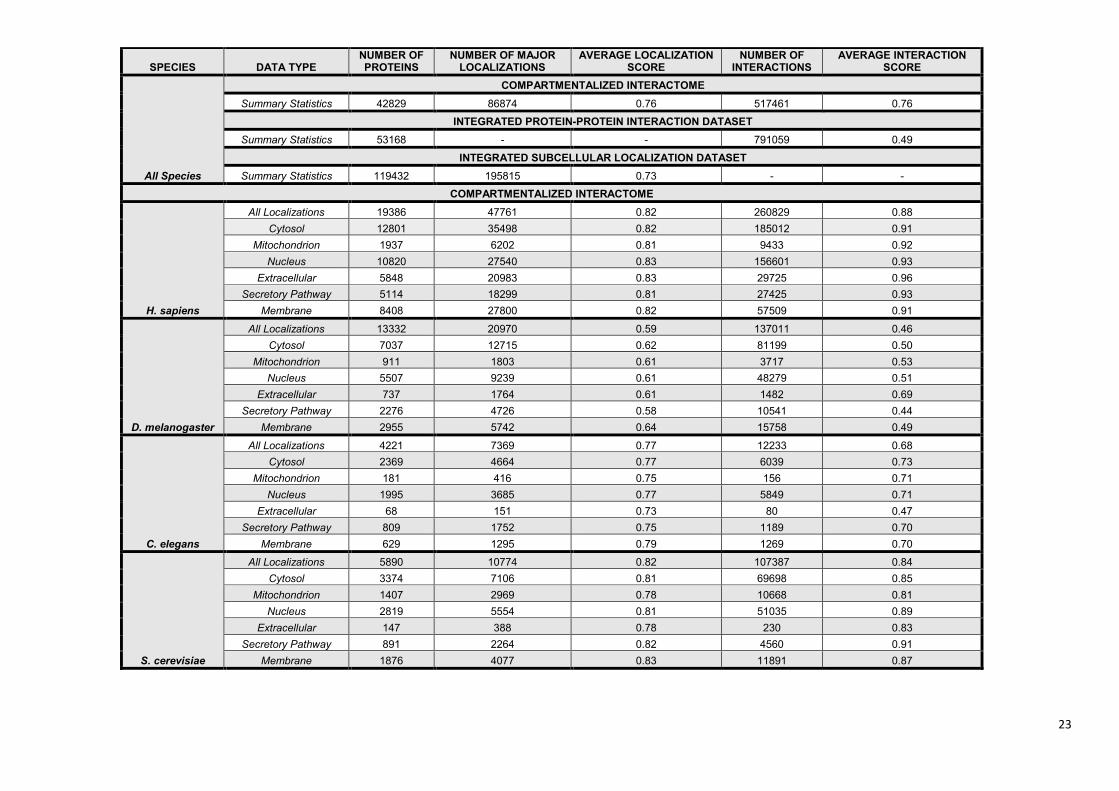
SPECIES DATA TYPE NUMBER OF PROTEINS
NUMBER OF MAJOR LOCALIZATIONS
AVERAGE LOCALIZATION SCORE
NUMBER OF INTERACTIONS
AVERAGE INTERACTION SCORE
All Species
COMPARTMENTALIZED INTERACTOME
Summary Statistics 42829 86874 0.76 517461 0.76
INTEGRATED PROTEIN-PROTEIN INTERACTION DATASET
Summary Statistics 53168 - - 791059 0.49
INTEGRATED SUBCELLULAR LOCALIZATION DATASET
Summary Statistics 119432 195815 0.73 - -
COMPARTMENTALIZED INTERACTOME
H. sapiens
All Localizations 19386 47761 0.82 260829 0.88
Cytosol 12801 35498 0.82 185012 0.91
Mitochondrion 1937 6202 0.81 9433 0.92
Nucleus 10820 27540 0.83 156601 0.93
Extracellular 5848 20983 0.83 29725 0.96
Secretory Pathway 5114 18299 0.81 27425 0.93
Membrane 8408 27800 0.82 57509 0.91
D. melanogaster
All Localizations 13332 20970 0.59 137011 0.46
Cytosol 7037 12715 0.62 81199 0.50
Mitochondrion 911 1803 0.61 3717 0.53
Nucleus 5507 9239 0.61 48279 0.51
Extracellular 737 1764 0.61 1482 0.69
Secretory Pathway 2276 4726 0.58 10541 0.44
Membrane 2955 5742 0.64 15758 0.49
C. elegans
All Localizations 4221 7369 0.77 12233 0.68
Cytosol 2369 4664 0.77 6039 0.73
Mitochondrion 181 416 0.75 156 0.71
Nucleus 1995 3685 0.77 5849 0.71
Extracellular 68 151 0.73 80 0.47
Secretory Pathway 809 1752 0.75 1189 0.70
Membrane 629 1295 0.79 1269 0.70
S. cerevisiae
All Localizations 5890 10774 0.82 107387 0.84
Cytosol 3374 7106 0.81 69698 0.85
Mitochondrion 1407 2969 0.78 10668 0.81
Nucleus 2819 5554 0.81 51035 0.89
Extracellular 147 388 0.78 230 0.83
Secretory Pathway 891 2264 0.82 4560 0.91
Membrane 1876 4077 0.83 11891 0.87
23
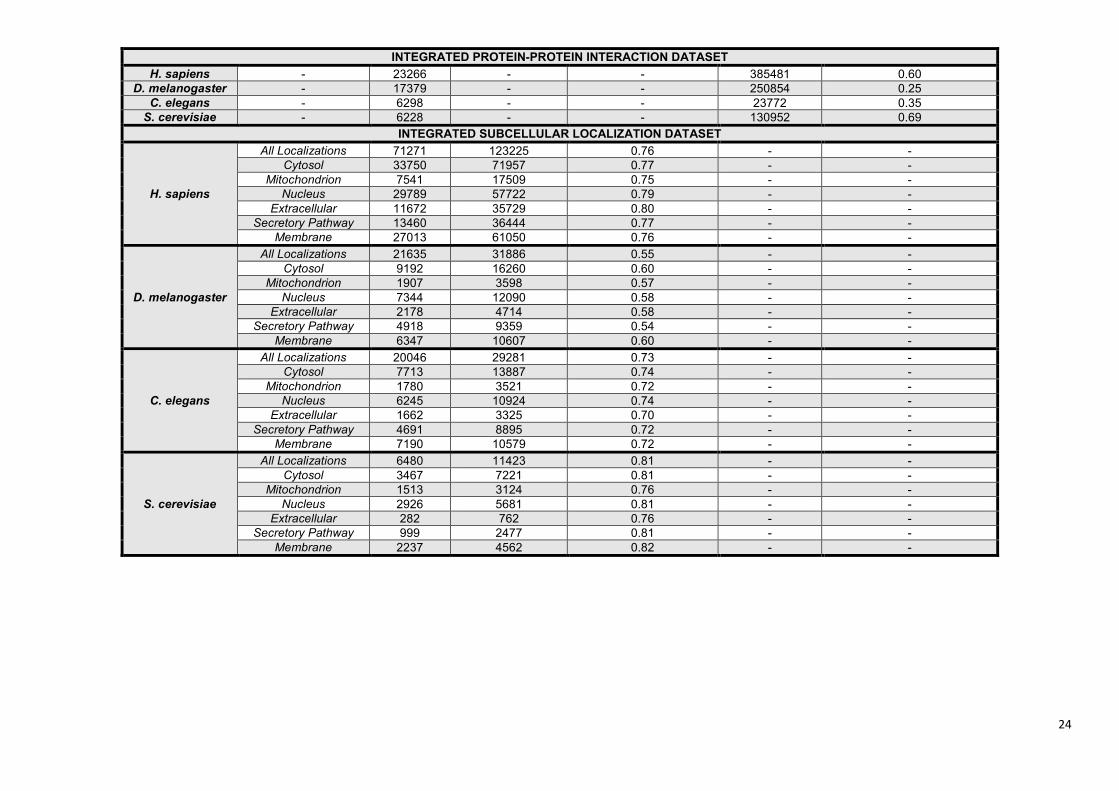
INTEGRATED PROTEIN-PROTEIN INTERACTION DATASET
H. sapiens - 23266 - - 385481 0.60
D. melanogaster - 17379 - - 250854 0.25
C. elegans - 6298 - - 23772 0.35
S. cerevisiae - 6228 - - 130952 0.69
INTEGRATED SUBCELLULAR LOCALIZATION DATASET
H. sapiens
All Localizations 71271 123225 0.76 - -
Cytosol 33750 71957 0.77 - -
Mitochondrion 7541 17509 0.75 - -
Nucleus 29789 57722 0.79 - -
Extracellular 11672 35729 0.80 - -
Secretory Pathway 13460 36444 0.77 - -
Membrane 27013 61050 0.76 - -
D. melanogaster
All Localizations 21635 31886 0.55 - -
Cytosol 9192 16260 0.60 - -
Mitochondrion 1907 3598 0.57 - -
Nucleus 7344 12090 0.58 - -
Extracellular 2178 4714 0.58 - -
Secretory Pathway 4918 9359 0.54 - -
Membrane 6347 10607 0.60 - -
C. elegans
All Localizations 20046 29281 0.73 - -
Cytosol 7713 13887 0.74 - -
Mitochondrion 1780 3521 0.72 - -
Nucleus 6245 10924 0.74 - -
Extracellular 1662 3325 0.70 - -
Secretory Pathway 4691 8895 0.72 - -
Membrane 7190 10579 0.72 - -
S. cerevisiae
All Localizations 6480 11423 0.81 - -
Cytosol 3467 7221 0.81 - -
Mitochondrion 1513 3124 0.76 - -
Nucleus 2926 5681 0.81 - -
Extracellular 282 762 0.76 - -
Secretory Pathway 999 2477 0.81 - -
Membrane 2237 4562 0.82 - -
24
Supplementary Table S3. Comparison of the ComPPI content to the input databases, and the
effects of our filtering algorithms and manual validation steps.
The table shows the number of interaction and localization entries in the source databases and the
number of them loaded into ComPPI. Different input sources are connected to the ComPPI database
structure using source-specific interfaces. During autoloading or manual validation steps (see Figure 1
for more details in the main text) we filtered out those interactions or localizations from the source
databases, that (1) did not the requirements of ComPPI (e.g. genetic interactions in BioGRID or
localizations in PA-GOSUB with a confidence level below 95%), (2) contained errors in their data
structure (e.g. entries with inconsequent nomenclature), or those that (3) turned out to be biologically
unlikely during our manual review process. We also mapped the different subcellular localization
naming conventions to GO (8) cellular component terms for standardization purposes (Supplementary
Figure S2). The source databases have different protein naming conventions, thus we had to map
these protein names to the most reliable naming convention (visit the relevant Help page for more
details: http://comppi.linkgroup.hu/help/naming_conventions). Due to the inconsistencies in protein
naming conventions some protein names may be mapped to multiple other protein names. For
instance, gene IDs could be mapped to several protein IDs, which phenomenon is based on real
biological processes, such as alternative splicing. This may result in more protein names associated
with a given source than the number of proteins taken from the original source. There are some other
cases, where protein names could not be mapped to the strongest protein naming convention. In
these cases we dropped the entry, so it was not incorporated into the database. Another important
point is that we developed an algorithm in order to export the predefined datasets from the ComPPI
database structure. The export module also went through rigorous manual revision in order to ensure
that there are exact matches between the source data and the output data from ComPPI (see
Supplementary Figure S3 and Table S2 for more details about our output data). Relevant information
of the efficiency of manual curation could be gained in those cases, where source databases, such as
MatrixDB and HPRD use matching protein name conventions and have a consequent data structure.
Taking these facts together this table shows the summarized effect of filtering due to the manual
curation protocols, the filtering due to our special requirements of incorporated data, and the effect of
the protein name mapping.
25
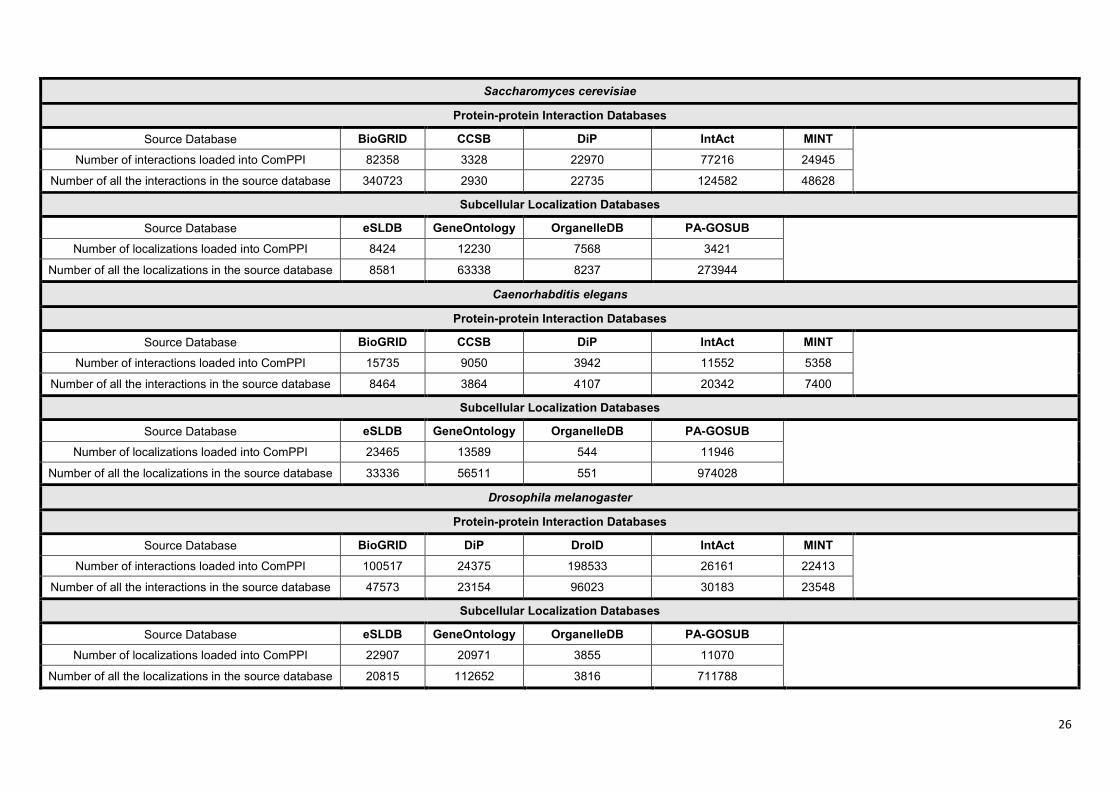
Saccharomyces cerevisiae
Protein-protein Interaction Databases
Source Database BioGRID CCSB DiP IntAct MINT
Number of interactions loaded into ComPPI 82358 3328 22970 77216 24945
Number of all the interactions in the source database 340723 2930 22735 124582 48628
Subcellular Localization Databases
Source Database eSLDB GeneOntology OrganelleDB PA-GOSUB
Number of localizations loaded into ComPPI 8424 12230 7568 3421
Number of all the localizations in the source database 8581 63338 8237 273944
Caenorhabditis elegans
Protein-protein Interaction Databases
Source Database BioGRID CCSB DiP IntAct MINT
Number of interactions loaded into ComPPI 15735 9050 3942 11552 5358
Number of all the interactions in the source database 8464 3864 4107 20342 7400
Subcellular Localization Databases
Source Database eSLDB GeneOntology OrganelleDB PA-GOSUB
Number of localizations loaded into ComPPI 23465 13589 544 11946
Number of all the localizations in the source database 33336 56511 551 974028
Drosophila melanogaster
Protein-protein Interaction Databases
Source Database BioGRID DiP DroID IntAct MINT
Number of interactions loaded into ComPPI 100517 24375 198533 26161 22413
Number of all the interactions in the source database 47573 23154 96023 30183 23548
Subcellular Localization Databases
Source Database eSLDB GeneOntology OrganelleDB PA-GOSUB
Number of localizations loaded into ComPPI 22907 20971 3855 11070
Number of all the localizations in the source database 20815 112652 3816 711788
26
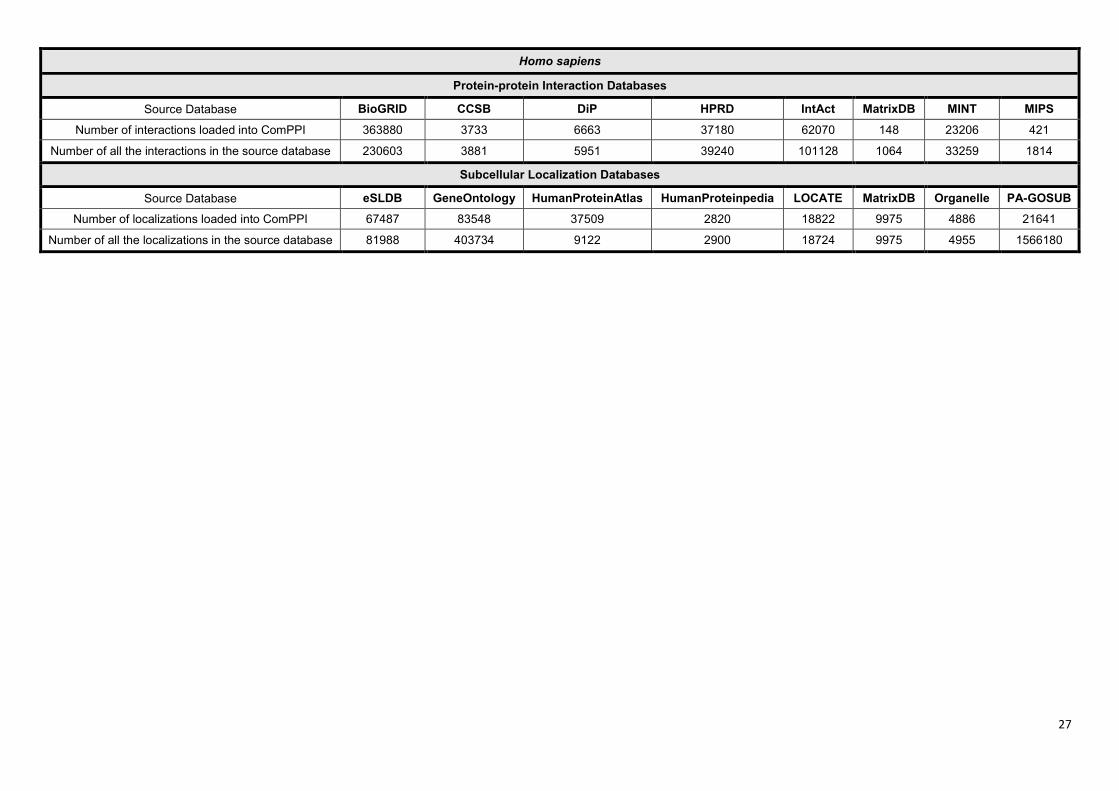
Homo sapiens
Protein-protein Interaction Databases
Source Database BioGRID CCSB DiP HPRD IntAct MatrixDB MINT MIPS
Number of interactions loaded into ComPPI 363880 3733 6663 37180 62070 148 23206 421
Number of all the interactions in the source database 230603 3881 5951 39240 101128 1064 33259 1814
Subcellular Localization Databases
Source Database eSLDB GeneOntology HumanProteinAtlas HumanProteinpedia LOCATE MatrixDB Organelle PA-GOSUB
Number of localizations loaded into ComPPI 67487 83548 37509 2820 18822 9975 4886 21641
Number of all the localizations in the source database 81988 403734 9122 2900 18724 9975 4955 1566180
27
Supplementary Table S4. Mapping of high resolution subcellular localization data into major
cellular components.
Subcellular localization data come from several sources with different resolution. Therefore, the
integration of high resolution data into major cellular components with low resolution is needed. The
high resolution localization data were mapped manually to the possibly largest and most accurate
subcellular localizations based on the hierarchical branches (parent and children branches) of the
localization tree (Supplementary Figure S2). One or more parent branches were associated with one
of the 6 major subcellular components (cytosol, nucleus, mitochondrion, secretory-pathway,
membrane and extracellular) as shown on the table. Thus, using the united, hierarchical localization
tree we gained low resolution major cellular components, in which there is an unambiguous route in
the tree to one major subcellular component. If a given GO term belongs to an included branch, but it
is located in another major cellular component, then this GO term will be excluded during the mapping.
Currently the localization tree contains 1,644 GO cellular component terms. The number of GO terms
belonging to a given major cellular component is also shown in the last column of the table. The
mapping table of major cellular components is available online here:
http://bificomp2.sote.hu:22422/comppi/files/85e7056adb541d5a18c60792457986c71a3a0ab0/databas
es/loctree/largelocs.yml.
28
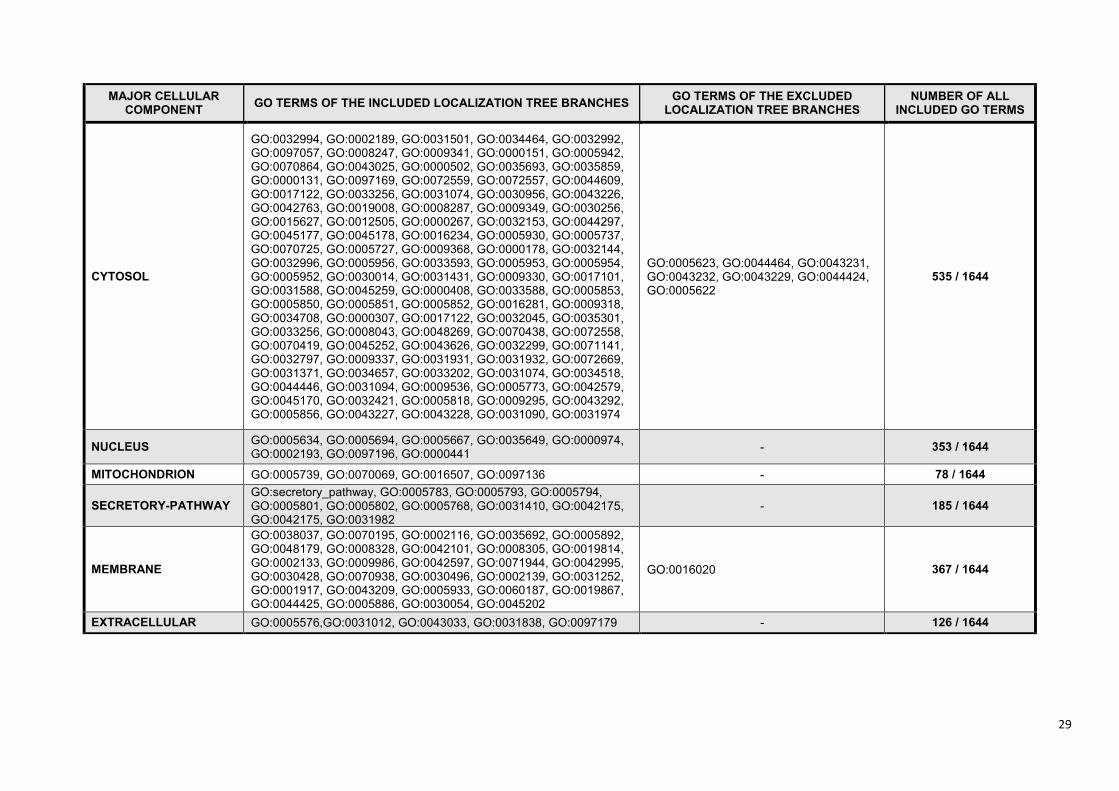
MAJOR CELLULAR COMPONENT
GO TERMS OF THE INCLUDED LOCALIZATION TREE BRANCHES GO TERMS OF THE EXCLUDED
LOCALIZATION TREE BRANCHES NUMBER OF ALL
INCLUDED GO TERMS
CYTOSOL
GO:0032994, GO:0002189, GO:0031501, GO:0034464, GO:0032992, GO:0097057, GO:0008247, GO:0009341, GO:0000151, GO:0005942, GO:0070864, GO:0043025, GO:0000502, GO:0035693, GO:0035859, GO:0000131, GO:0097169, GO:0072559, GO:0072557, GO:0044609, GO:0017122, GO:0033256, GO:0031074, GO:0030956, GO:0043226, GO:0042763, GO:0019008, GO:0008287, GO:0009349, GO:0030256, GO:0015627, GO:0012505, GO:0000267, GO:0032153, GO:0044297, GO:0045177, GO:0045178, GO:0016234, GO:0005930, GO:0005737, GO:0070725, GO:0005727, GO:0009368, GO:0000178, GO:0032144, GO:0032996, GO:0005956, GO:0033593, GO:0005953, GO:0005954, GO:0005952, GO:0030014, GO:0031431, GO:0009330, GO:0017101, GO:0031588, GO:0045259, GO:0000408, GO:0033588, GO:0005853, GO:0005850, GO:0005851, GO:0005852, GO:0016281, GO:0009318, GO:0034708, GO:0000307, GO:0017122, GO:0032045, GO:0035301, GO:0033256, GO:0008043, GO:0048269, GO:0070438, GO:0072558, GO:0070419, GO:0045252, GO:0043626, GO:0032299, GO:0071141, GO:0032797, GO:0009337, GO:0031931, GO:0031932, GO:0072669, GO:0031371, GO:0034657, GO:0033202, GO:0031074, GO:0034518, GO:0044446, GO:0031094, GO:0009536, GO:0005773, GO:0042579, GO:0045170, GO:0032421, GO:0005818, GO:0009295, GO:0043292, GO:0005856, GO:0043227, GO:0043228, GO:0031090, GO:0031974
GO:0005623, GO:0044464, GO:0043231, GO:0043232, GO:0043229, GO:0044424, GO:0005622
535 / 1644
NUCLEUS GO:0005634, GO:0005694, GO:0005667, GO:0035649, GO:0000974, GO:0002193, GO:0097196, GO:0000441
- 353 / 1644
MITOCHONDRION GO:0005739, GO:0070069, GO:0016507, GO:0097136 - 78 / 1644
SECRETORY-PATHWAY GO:secretory_pathway, GO:0005783, GO:0005793, GO:0005794, GO:0005801, GO:0005802, GO:0005768, GO:0031410, GO:0042175, GO:0042175, GO:0031982
- 185 / 1644
MEMBRANE
GO:0038037, GO:0070195, GO:0002116, GO:0035692, GO:0005892, GO:0048179, GO:0008328, GO:0042101, GO:0008305, GO:0019814, GO:0002133, GO:0009986, GO:0042597, GO:0071944, GO:0042995, GO:0030428, GO:0070938, GO:0030496, GO:0002139, GO:0031252, GO:0001917, GO:0043209, GO:0005933, GO:0060187, GO:0019867, GO:0044425, GO:0005886, GO:0030054, GO:0045202
GO:0016020 367 / 1644
EXTRACELLULAR GO:0005576,GO:0031012, GO:0043033, GO:0031838, GO:0097179 - 126 / 1644
29
Supplementary Table S5. Importance of the removal of localization-based biologically unlikely
interactions.
The table demonstrates the importance of the removal of biologically unlikely interactions based on
their localization data. We compared the degree and the betweeness centrality (BC) of the proteins in
the integrated protein-protein interaction (PPI) dataset without subcellular localizations and to the
compartmentalized interactome, where the proteins have at least one common subcellular localization.
The proteins were ranked by the size of the alternations in the degree (Δ Degree (%)) and BC
measures, and only the proteins with UniProt Swiss-Prot (28) name were kept (15,258 proteins out of
19,386) for more reliable further analysis. The table shows the first 20 proteins, ordered by the degree
difference between the compartmentalized dataset and the integrated PPI dataset (Δ Degree). The
subcellular localization of the proteins are also displayed, these can be: (i) subcellular localizations
after the compartmentalization (Compartmentalized Localization), (ii) localizations that were
represented in the first-neighbours of the interactome with less than 5% ratio (Filtered Localizations),
(iii) the predicted localizations, where more than 95% of the first-neighbours are localized in the given
compartment (Possible Localizations), and (iv) the localizations that were represented among the first-
neighbours with a range between 5 and 95% (Uncertain Localizations). The table gives information
about how many proteins have no localization data among the first-neighbours, and gives an average
Interaction Score (IS) for the interactions before and after filtering. Our application example is the
Crotonase (Enoyl-CoA hydratase), which is the first in the list (highlighted in yellow). See Figure 4 in
the main text for more details.
30
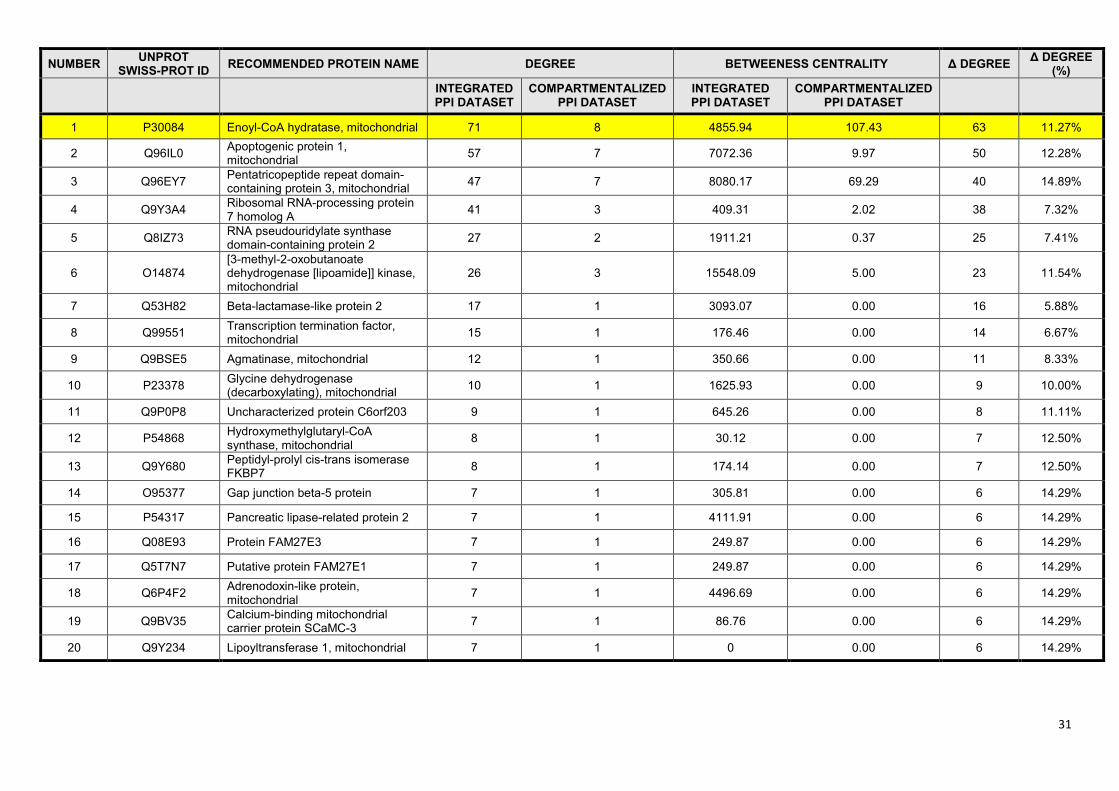
NUMBER UNPROT
SWISS-PROT ID RECOMMENDED PROTEIN NAME DEGREE BETWEENESS CENTRALITY Δ DEGREE
Δ DEGREE (%)
INTEGRATED PPI DATASET
COMPARTMENTALIZED PPI DATASET
INTEGRATED PPI DATASET
COMPARTMENTALIZED PPI DATASET
1 P30084 Enoyl-CoA hydratase, mitochondrial 71 8 4855.94 107.43 63 11.27%
2 Q96IL0 Apoptogenic protein 1, mitochondrial
57 7 7072.36 9.97 50 12.28%
3 Q96EY7 Pentatricopeptide repeat domain-containing protein 3, mitochondrial
47 7 8080.17 69.29 40 14.89%
4 Q9Y3A4 Ribosomal RNA-processing protein 7 homolog A
41 3 409.31 2.02 38 7.32%
5 Q8IZ73 RNA pseudouridylate synthase domain-containing protein 2
27 2 1911.21 0.37 25 7.41%
6 O14874 [3-methyl-2-oxobutanoate dehydrogenase [lipoamide]] kinase, mitochondrial
26 3 15548.09 5.00 23 11.54%
7 Q53H82 Beta-lactamase-like protein 2 17 1 3093.07 0.00 16 5.88%
8 Q99551 Transcription termination factor, mitochondrial
15 1 176.46 0.00 14 6.67%
9 Q9BSE5 Agmatinase, mitochondrial 12 1 350.66 0.00 11 8.33%
10 P23378 Glycine dehydrogenase (decarboxylating), mitochondrial
10 1 1625.93 0.00 9 10.00%
11 Q9P0P8 Uncharacterized protein C6orf203 9 1 645.26 0.00 8 11.11%
12 P54868 Hydroxymethylglutaryl-CoA synthase, mitochondrial
8 1 30.12 0.00 7 12.50%
13 Q9Y680 Peptidyl-prolyl cis-trans isomerase FKBP7
8 1 174.14 0.00 7 12.50%
14 O95377 Gap junction beta-5 protein 7 1 305.81 0.00 6 14.29%
15 P54317 Pancreatic lipase-related protein 2 7 1 4111.91 0.00 6 14.29%
16 Q08E93 Protein FAM27E3 7 1 249.87 0.00 6 14.29%
17 Q5T7N7 Putative protein FAM27E1 7 1 249.87 0.00 6 14.29%
18 Q6P4F2 Adrenodoxin-like protein, mitochondrial
7 1 4496.69 0.00 6 14.29%
19 Q9BV35 Calcium-binding mitochondrial carrier protein SCaMC-3
7 1 86.76 0.00 6 14.29%
20 Q9Y234 Lipoyltransferase 1, mitochondrial 7 1 0 0.00 6 14.29%
31
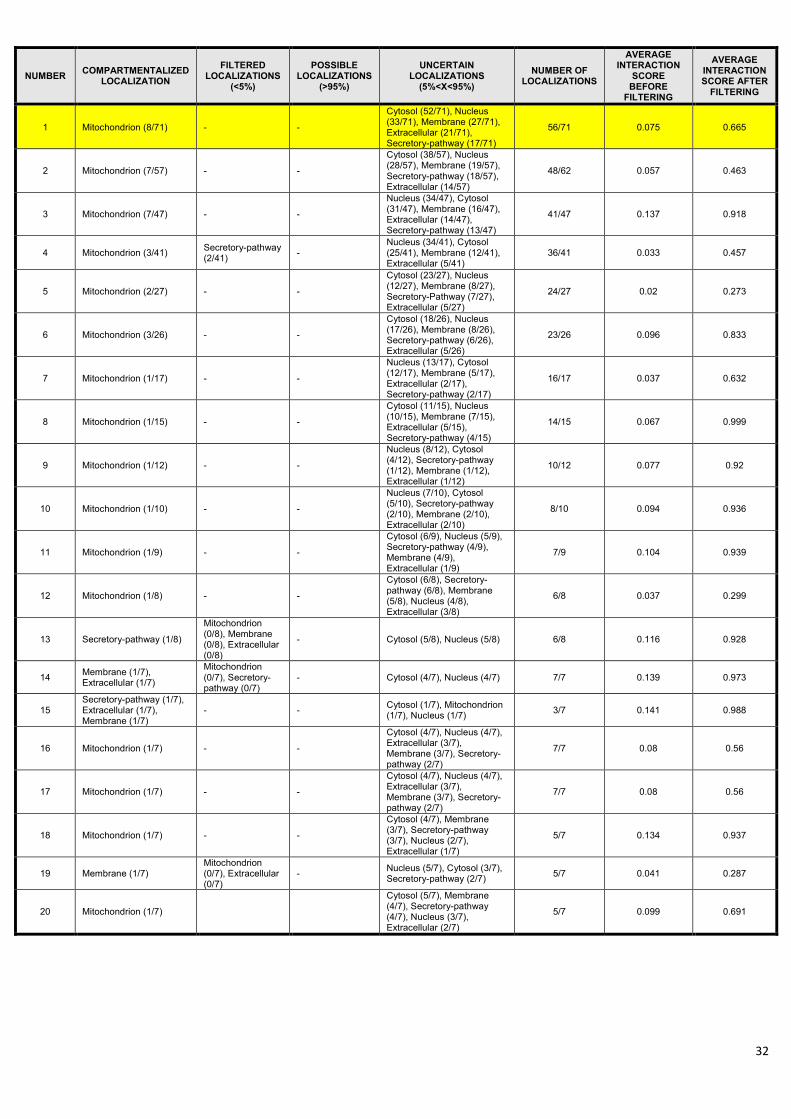
NUMBER COMPARTMENTALIZED
LOCALIZATION
FILTERED LOCALIZATIONS
(<5%)
POSSIBLE LOCALIZATIONS
(>95%)
UNCERTAIN LOCALIZATIONS
(5%<X<95%)
NUMBER OF LOCALIZATIONS
AVERAGE INTERACTION
SCORE BEFORE
FILTERING
AVERAGE INTERACTION SCORE AFTER
FILTERING
1 Mitochondrion (8/71) - -
Cytosol (52/71), Nucleus (33/71), Membrane (27/71), Extracellular (21/71), Secretory-pathway (17/71)
56/71 0.075 0.665
2 Mitochondrion (7/57) - -
Cytosol (38/57), Nucleus (28/57), Membrane (19/57), Secretory-pathway (18/57), Extracellular (14/57)
48/62 0.057 0.463
3 Mitochondrion (7/47) - -
Nucleus (34/47), Cytosol (31/47), Membrane (16/47), Extracellular (14/47), Secretory-pathway (13/47)
41/47 0.137 0.918
4 Mitochondrion (3/41) Secretory-pathway (2/41)
- Nucleus (34/41), Cytosol (25/41), Membrane (12/41), Extracellular (5/41)
36/41 0.033 0.457
5 Mitochondrion (2/27) - -
Cytosol (23/27), Nucleus (12/27), Membrane (8/27), Secretory-Pathway (7/27), Extracellular (5/27)
24/27 0.02 0.273
6 Mitochondrion (3/26) - -
Cytosol (18/26), Nucleus (17/26), Membrane (8/26), Secretory-pathway (6/26), Extracellular (5/26)
23/26 0.096 0.833
7 Mitochondrion (1/17) - -
Nucleus (13/17), Cytosol (12/17), Membrane (5/17), Extracellular (2/17), Secretory-pathway (2/17)
16/17 0.037 0.632
8 Mitochondrion (1/15) - -
Cytosol (11/15), Nucleus (10/15), Membrane (7/15), Extracellular (5/15), Secretory-pathway (4/15)
14/15 0.067 0.999
9 Mitochondrion (1/12) - -
Nucleus (8/12), Cytosol (4/12), Secretory-pathway (1/12), Membrane (1/12), Extracellular (1/12)
10/12 0.077 0.92
10 Mitochondrion (1/10) - -
Nucleus (7/10), Cytosol (5/10), Secretory-pathway (2/10), Membrane (2/10), Extracellular (2/10)
8/10 0.094 0.936
11 Mitochondrion (1/9) - -
Cytosol (6/9), Nucleus (5/9), Secretory-pathway (4/9), Membrane (4/9), Extracellular (1/9)
7/9 0.104 0.939
12 Mitochondrion (1/8) - -
Cytosol (6/8), Secretory-pathway (6/8), Membrane (5/8), Nucleus (4/8), Extracellular (3/8)
6/8 0.037 0.299
13 Secretory-pathway (1/8)
Mitochondrion (0/8), Membrane (0/8), Extracellular (0/8)
- Cytosol (5/8), Nucleus (5/8) 6/8 0.116 0.928
14 Membrane (1/7), Extracellular (1/7)
Mitochondrion (0/7), Secretory-pathway (0/7)
- Cytosol (4/7), Nucleus (4/7) 7/7 0.139 0.973
15 Secretory-pathway (1/7), Extracellular (1/7), Membrane (1/7)
- - Cytosol (1/7), Mitochondrion (1/7), Nucleus (1/7)
3/7 0.141 0.988
16 Mitochondrion (1/7) - -
Cytosol (4/7), Nucleus (4/7), Extracellular (3/7), Membrane (3/7), Secretory-pathway (2/7)
7/7 0.08 0.56
17 Mitochondrion (1/7) - -
Cytosol (4/7), Nucleus (4/7), Extracellular (3/7), Membrane (3/7), Secretory-pathway (2/7)
7/7 0.08 0.56
18 Mitochondrion (1/7) - -
Cytosol (4/7), Membrane (3/7), Secretory-pathway (3/7), Nucleus (2/7), Extracellular (1/7)
5/7 0.134 0.937
19 Membrane (1/7) Mitochondrion (0/7), Extracellular (0/7)
- Nucleus (5/7), Cytosol (3/7), Secretory-pathway (2/7)
5/7 0.041 0.287
20 Mitochondrion (1/7)
Cytosol (5/7), Membrane (4/7), Secretory-pathway (4/7), Nucleus (3/7), Extracellular (2/7)
5/7 0.099 0.691
32
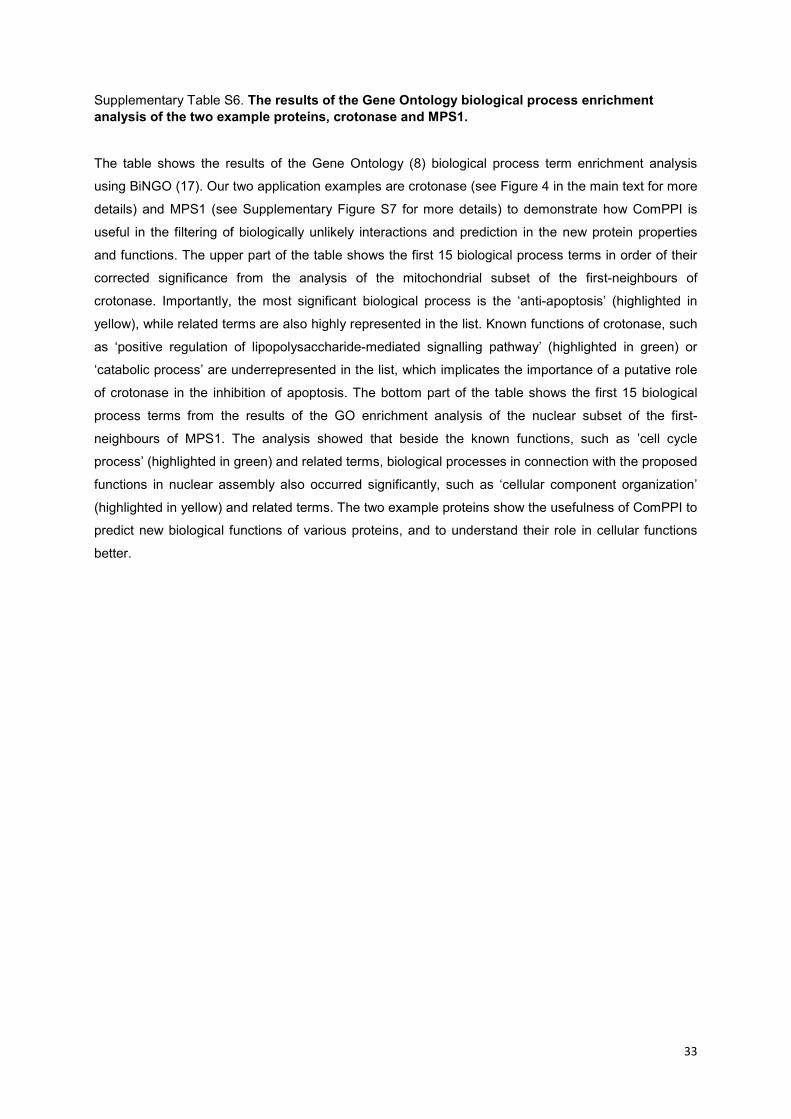
Supplementary Table S6. The results of the Gene Ontology biological process enrichment
analysis of the two example proteins, crotonase and MPS1.
The table shows the results of the Gene Ontology (8) biological process term enrichment analysis
using BiNGO (17). Our two application examples are crotonase (see Figure 4 in the main text for more
details) and MPS1 (see Supplementary Figure S7 for more details) to demonstrate how ComPPI is
useful in the filtering of biologically unlikely interactions and prediction in the new protein properties
and functions. The upper part of the table shows the first 15 biological process terms in order of their
corrected significance from the analysis of the mitochondrial subset of the first-neighbours of
crotonase. Importantly, the most significant biological process is the ‘anti-apoptosis’ (highlighted in
yellow), while related terms are also highly represented in the list. Known functions of crotonase, such
as ‘positive regulation of lipopolysaccharide-mediated signalling pathway’ (highlighted in green) or
‘catabolic process’ are underrepresented in the list, which implicates the importance of a putative role
of crotonase in the inhibition of apoptosis. The bottom part of the table shows the first 15 biological
process terms from the results of the GO enrichment analysis of the nuclear subset of the first-
neighbours of MPS1. The analysis showed that beside the known functions, such as ’cell cycle
process’ (highlighted in green) and related terms, biological processes in connection with the proposed
functions in nuclear assembly also occurred significantly, such as ‘cellular component organization’
(highlighted in yellow) and related terms. The two example proteins show the usefulness of ComPPI to
predict new biological functions of various proteins, and to understand their role in cellular functions
better.
33
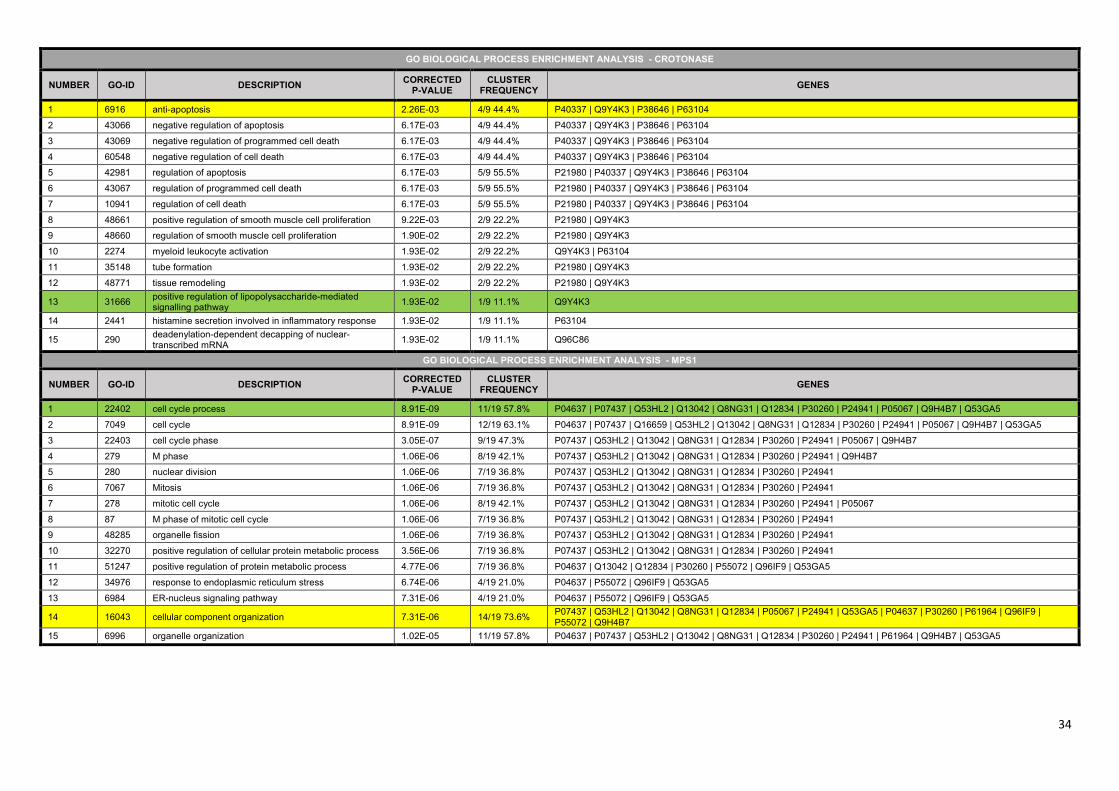
GO BIOLOGICAL PROCESS ENRICHMENT ANALYSIS - CROTONASE
NUMBER GO-ID DESCRIPTION CORRECTED
P-VALUE CLUSTER
FREQUENCY GENES
1 6916 anti-apoptosis 2.26E-03 4/9 44.4% P40337 | Q9Y4K3 | P38646 | P63104
2 43066 negative regulation of apoptosis 6.17E-03 4/9 44.4% P40337 | Q9Y4K3 | P38646 | P63104
3 43069 negative regulation of programmed cell death 6.17E-03 4/9 44.4% P40337 | Q9Y4K3 | P38646 | P63104
4 60548 negative regulation of cell death 6.17E-03 4/9 44.4% P40337 | Q9Y4K3 | P38646 | P63104
5 42981 regulation of apoptosis 6.17E-03 5/9 55.5% P21980 | P40337 | Q9Y4K3 | P38646 | P63104
6 43067 regulation of programmed cell death 6.17E-03 5/9 55.5% P21980 | P40337 | Q9Y4K3 | P38646 | P63104
7 10941 regulation of cell death 6.17E-03 5/9 55.5% P21980 | P40337 | Q9Y4K3 | P38646 | P63104
8 48661 positive regulation of smooth muscle cell proliferation 9.22E-03 2/9 22.2% P21980 | Q9Y4K3
9 48660 regulation of smooth muscle cell proliferation 1.90E-02 2/9 22.2% P21980 | Q9Y4K3
10 2274 myeloid leukocyte activation 1.93E-02 2/9 22.2% Q9Y4K3 | P63104
11 35148 tube formation 1.93E-02 2/9 22.2% P21980 | Q9Y4K3
12 48771 tissue remodeling 1.93E-02 2/9 22.2% P21980 | Q9Y4K3
13 31666 positive regulation of lipopolysaccharide-mediated signalling pathway
1.93E-02 1/9 11.1% Q9Y4K3
14 2441 histamine secretion involved in inflammatory response 1.93E-02 1/9 11.1% P63104
15 290 deadenylation-dependent decapping of nuclear-transcribed mRNA
1.93E-02 1/9 11.1% Q96C86
GO BIOLOGICAL PROCESS ENRICHMENT ANALYSIS - MPS1
NUMBER GO-ID DESCRIPTION CORRECTED
P-VALUE CLUSTER
FREQUENCY GENES
1 22402 cell cycle process 8.91E-09 11/19 57.8% P04637 | P07437 | Q53HL2 | Q13042 | Q8NG31 | Q12834 | P30260 | P24941 | P05067 | Q9H4B7 | Q53GA5
2 7049 cell cycle 8.91E-09 12/19 63.1% P04637 | P07437 | Q16659 | Q53HL2 | Q13042 | Q8NG31 | Q12834 | P30260 | P24941 | P05067 | Q9H4B7 | Q53GA5
3 22403 cell cycle phase 3.05E-07 9/19 47.3% P07437 | Q53HL2 | Q13042 | Q8NG31 | Q12834 | P30260 | P24941 | P05067 | Q9H4B7
4 279 M phase 1.06E-06 8/19 42.1% P07437 | Q53HL2 | Q13042 | Q8NG31 | Q12834 | P30260 | P24941 | Q9H4B7
5 280 nuclear division 1.06E-06 7/19 36.8% P07437 | Q53HL2 | Q13042 | Q8NG31 | Q12834 | P30260 | P24941
6 7067 Mitosis 1.06E-06 7/19 36.8% P07437 | Q53HL2 | Q13042 | Q8NG31 | Q12834 | P30260 | P24941
7 278 mitotic cell cycle 1.06E-06 8/19 42.1% P07437 | Q53HL2 | Q13042 | Q8NG31 | Q12834 | P30260 | P24941 | P05067
8 87 M phase of mitotic cell cycle 1.06E-06 7/19 36.8% P07437 | Q53HL2 | Q13042 | Q8NG31 | Q12834 | P30260 | P24941
9 48285 organelle fission 1.06E-06 7/19 36.8% P07437 | Q53HL2 | Q13042 | Q8NG31 | Q12834 | P30260 | P24941
10 32270 positive regulation of cellular protein metabolic process 3.56E-06 7/19 36.8% P07437 | Q53HL2 | Q13042 | Q8NG31 | Q12834 | P30260 | P24941
11 51247 positive regulation of protein metabolic process 4.77E-06 7/19 36.8% P04637 | Q13042 | Q12834 | P30260 | P55072 | Q96IF9 | Q53GA5
12 34976 response to endoplasmic reticulum stress 6.74E-06 4/19 21.0% P04637 | P55072 | Q96IF9 | Q53GA5
13 6984 ER-nucleus signaling pathway 7.31E-06 4/19 21.0% P04637 | P55072 | Q96IF9 | Q53GA5
14 16043 cellular component organization 7.31E-06 14/19 73.6% P07437 | Q53HL2 | Q13042 | Q8NG31 | Q12834 | P05067 | P24941 | Q53GA5 | P04637 | P30260 | P61964 | Q96IF9 | P55072 | Q9H4B7
15 6996 organelle organization 1.02E-05 11/19 57.8% P04637 | P07437 | Q53HL2 | Q13042 | Q8NG31 | Q12834 | P30260 | P24941 | P61964 | Q9H4B7 | Q53GA5
34
Supplementary References
1. Firth, S.M. and Baxter, R.C. (2002) Cellular actions of the insulin-like growth factor binding proteins. Endocr. Rev., 23, 824–54. 2. Azar,W.J., Zivkovic,S., Werther,G.A. and Russo,V.C. (2014) IGFBP-2 nuclear translocation is mediated by a functional NLS sequence and is essential for its pro-tumorigenic actions in cancer cells. Oncogene, 33, 578–88. 3. So,A.I., Levitt,R.J., Eigl,B., Fazli,L., Muramaki,M., Leung,S., Cheang,M.C.U., Nielsen,T.O., Gleave,M. and Pollak,M. (2008) Insulin-like growth factor binding protein-2 is a novel therapeutic target associated with breast cancer. Clin. Cancer Res., 14, 6944–54. 4. Semenza,G.L. (2009) Regulation of oxygen homeostasis by hypoxia-inducible factor 1. Physiology (Bethesda)., 24, 97–106. 5. Chilov,D., Camenisch,G., Kvietikova,I., Ziegler,U., Gassmann,M. and Wenger,R.H. (1999) Induction and nuclear translocation of hypoxia-inducible factor-1 (HIF-1): heterodimerization with ARNT is not necessary for nuclear accumulation of HIF-1alpha. J. Cell Sci., 112 ( Pt 8), 1203–12. 6. Chachami,G., Paraskeva,E., Mingot,J.-M., Braliou,G.G., Görlich,D. and Simos,G. (2009) Transport of hypoxia-inducible factor HIF-1alpha into the nucleus involves importins 4 and 7. Biochem. Biophys. Res. Commun., 390, 235–40. 7. Yeo,E.-J., Chun,Y.-S. and Park,J.-W. (2004) New anticancer strategies targeting HIF-1. Biochem. Pharmacol., 68, 1061–9. 8. Gene,T. and Consortium,O. (2000) Gene Ontology : tool for the unification of biology. Nat. Genet., 25, 25–29. 9. Orchard,S., Ammari,M., Aranda,B., Breuza,L., Briganti,L., Broackes-Carter,F., Campbell,N.H., Chavali,G., Chen,C., del-Toro,N., et al. (2014) The MIntAct project--IntAct as a common curation platform for 11 molecular interaction databases. Nucleic Acids Res., 42, D358–63. 10. Fisk,H.A., Mattison,C.P. and Winey,M. (2003) Human Mps1 protein kinase is required for centrosome duplication and normal mitotic progression. Proc. Natl. Acad. Sci. U. S. A., 100, 14875–80. 11. Musacchio,A. and Salmon,D. (2007) The spindle-assembly checkpoint in space and time. Nat. Rev. Mol. Cell Biol., 8, 379-93. 12. Kwiatkowski,N., Jelluma,N., Filippakopoulos,P., Soundararajan,M., Manak,M.S., Kwon,M., Choi,H.G., Sim,T., Deveraux,Q.L., Rottmann,S. et al. (2010) Small-molecule kinase inhibitors provide insight into Mps1 cell cycle function. Nat. Chem. Biol., 6, 359-68. 13. Liu,S., Chan,G.K.T., Hittle,J.C., Fujii,G., Lees,E. and Yen,T.J. (2003) Human MPS1 Kinase Is Required for Mitotic Arrest Induced by the Loss of CENP-E from Kinetochores. Mol. Biol. Cell, 14, 1638–51. 14. Zhang,X., Yin,Q., Ling,Y., Zhang,Y., Ma,R., Ma,Q., Cao,C., Zhong H., Liu,X. and Xu,Q. (2011) Two LXXLL motifs in the N terminus of Mps1 are required for Mps1 nuclear import during G2/M transition and sustained spindle checkpoint responses. Cell Cycle, 10, 2742–50. 15. Jemaá,M., Galluzzi,L., Kepp,O., Senovilla,L., Brands,M., Boemer,U., Koppitz,M., Lienau,P., Prechtl,S., Schulze,V. et al. (2013) Characterization of novel MPS1 inhibitors with preclinical anticancer activity. Cell Death Differ., 20, 1532-45. 16. Kagami,Y., Nihira,K., Wada,S., Ono,M., Honda,M. and Yoshida,K. (2014) Mps1 phosphorylation of condensin II controls chromosome condensation at the onset of mitosis. J. Cell Biol., 205, 781–90. 17. Maere,S., Heymans,K. and Kuiper,M. (2005) BiNGO: a Cytoscape plugin to assess
overrepresentation of gene ontology categories in biological networks. Bioinformatics, 21, 3448–9.
18. Dechat,T., Pfleghaar,K., Sengupta,K., Shimi,T., Shumaker,D.K., Solimando,L. and Goldman,R.D. (2008) Nuclear lamins: major factors in the structural organization and function of the nucleus and chromatin. Genes Dev., 22, 832–53. 19. Gant,T.M., Harris,C.A. and Wilson,K.L. (1999) Roles of LAP2 proteins in nuclear assembly and DNA replication: truncated LAP2ß proteins alter lamina assembly, envelope formation, nuclear size, and DNA replication efficiency in Xenopus laevis extracts. J. Cell Biol., 144, 1083–96. 20. Haraguchi,T., Koujin,T., Segura-Totten,M., Lee,K.K., Matsuoka,Y., Yoneda,Y., Wilson,K.L. and Hiraoka,Y. (2001) BAF is required for emerin assembly into the reforming nuclear envelope. J. Cell Sci., 114, 4575–85. 21. Sabbattini,P., Canzonetta,C., Sjoberg,M., Nikic,S., Georgiou,A., Kemball-Cook,G., Auner,H.W. and Dillon,N. (2007) A novel role for the Aurora B kinase in epigenetic marking of silent chromatin in differentiated postmitotic cells. EMBO J., 26, 4657–69. 22. Balboula,A.Z. and Schindler,K. (2014) Selective disruption of aurora C kinase reveals distinct functions from aurora B kinase during meiosis in mouse oocytes. PLoS Genet., 10, e1004194.
35
23. Wu,C. (1997) Chromatin remodeling and the control of gene expression. J. Biol. Chem., 272, 28171–4. 24. Meerang,M., Ritz,D., Paliwal,S., Garajova,Z., Bosshard,M., Mailand,N., Janscak,P., Hübscher,U., Meyer,H. and Ramadan,K. (2011) The ubiquitin-selective segregase VCP/p97 orchestrates the response to DNA double-strand breaks. Nat. Cell Biol., 13, 1376–82. 25. Güttinger,S., Laurell,E. and Kutay,U. (2009) Orchestrating nuclear envelope disassembly and reassembly during mitosis. Nat. Rev. Mol. Cell Biol., 10, 178–91. 26. Nilsson,J., Yekezare,M., Minshull,J. and Pines,J. (2008) The APC/C maintains the spindle assembly checkpoint by targeting Cdc20 for destruction. Nat. Cell Biol., 10, 1411–20. 27. Ostapenko,D., Burton,J.L. and Solomon,M.J. (2012) Identification of anaphase promoting complex substrates in S. cerevisiae. PLoS ONE, 7, e45895. 28. Consortium,T.U. (2014) Activities at the Universal Protein Resource (UniProt). Nucleic Acids
Res., 42, D191–8.
36
Related Documents