DOKUZ EYLÜL UNIVERSITY GRADUATE SCHOOL OF NATURAL AND APPLIED SCIENCES COMPOSTING OF MUNICIPAL SEWAGE SLUDGE USING SEMIFERMENTED SOLID WASTE AND GRASS CUTTINGS by Mahir YÜCEL January, 2006 İZMİR

Welcome message from author
This document is posted to help you gain knowledge. Please leave a comment to let me know what you think about it! Share it to your friends and learn new things together.
Transcript

DOKUZ EYLÜL UNIVERSITY
GRADUATE SCHOOL OF NATURAL AND APPLIED
SCIENCES
COMPOSTING OF MUNICIPAL SEWAGE
SLUDGE USING SEMIFERMENTED SOLID
WASTE AND GRASS CUTTINGS
by
Mahir YÜCEL
January, 2006
İZMİR
COMPOSTING OF MUNICIPAL SEWAGE
SLUDGE USING SEMIFERMENTED SOLID
WASTE AND GRASS CUTTINGS
A Thesis Submitted to the
Graduate School of Natural and Applied Sciences of
Dokuz Eylül University
In Partial Fulfillment of the Requirements
For the Degree of Master of Science in Environmental Engineering,
Environmental Technology Program
by
Mahir YÜCEL
January, 2006
İZMİR

ii
M. Sc THESIS EXAMINATION RESULT FORM
We have read the thesis entitled “COMPOSTING OF MUNICIPAL SEWAGE
SLUDGE USING SEMIFERMENTED SOLID WASTE AND GRASS
CUTTINGS” completed by Mahir YÜCEL under supervision of Prof. Dr.
Ayşegül PALA and we certify that in our opinion it is fully adequate, in scope and in
quality, as a thesis for the degree of Master of Science.
Prof. Dr. Ayşegül PALA
Supervisor
(Jury Member) (Jury Member)
Prof. Dr. Cahit HELVACI Director
Graduate School of Natural and Applied Sciences

iii
ACKNOWLEDGMENTS
This M. Sc. Thesis marks the end of my education at the Graduate School of
Natural and Applied Sciences at Dokuz Eylül University. It is a result of a long and
hard study. So, I want to thank many people.
Firstly, I would like to greatly thank my advisor Prof. Dr. Ayşegül PALA for her
invaluable advice, guidance, and encouragement. Also thanks to Elif ŞENDUR and
Bahar EROL for their valuable helping in this thesis. My friend Mustafa TEKİR
deserves thanks for his help in my thesis. I wish to express my sincere appreciation
Doç. Dr. M. Eşref İRGET and Assist. Mahmut TEPECIK for their warm welcoming
and endless help in every stage of this thesis.
Especially I’m thankful to my family for their spiritually and materially supports
during my education.
Mahir YÜCEL

iv
COMPOSTING OF MUNICIPAL SEWAGE SLUDGE USING
SEMIFERMENTED SOLID WASTE AND GRASS CUTTINGS
ABSTRACT
The awareness of the threat on natural resources have started to impose effects on
the handling of sewage sludge and composting of solid wastes by better
environmentally friendly techniques. The enormous amounts of sludge that result
after the treatment of waste water are a significant economic and environmental issue
to be examined. Difficult techniques are available in the disposal of sewage sludge
like incineration, land filling – dumping, and land application of the composted
material for agricultural purpose. Composting is more beneficial compared to that of
other disposal methods because the sludge volume decrease by 40 – 50 % and is
sterile due to reductions in pathogenic microorganisms. Treatment plant sludges can
be composted alone or along with municipal solid wastes.
The objective of this study was to examine the capability (and possibility) of
sewage sludge and further its agricultural use. Aerobic composting of the sewage
sludge was investigated by two different mechanisms in three different experiments.
In the regard, grass cuttings from university gardens, sewage sludge from İzmir –
Çigli Wastewater Treatment Plant, and semi fermented solid waste which were taken
from İzmir – Uzundere Compost Plant were used. In 1st and 3rd studies, semi
fermented solid waste and sewage sludge were mixed in different rates and systems.
In 2nd study, sewage sludge, semi fermented solid waste and grass cutting were
mixed.
During the study, moisture, organic matter, temperatures, C/N ratio, pHs were
determined. Primary macro (P, K), and secondary plant nutrients (Fe, Cu, Zn, Mn),
heavy metals (Cr, Ni) were also measured to investigate for agricultural use of final
product.

v
Results revealed that the method used in Experiment 1 did not end with the
expected compost product. However, Experiment 2 and Experiment 3 resulted with a
better compost while Experiment 2 being the best in this respect. Effect grass
cuttings used in Experiment 2 on composting was positive. Heavy metal contents of
the final products were also below the standard values given in the Turkish
Regulation of Soil Pollution Control.
Keywords: composting, disposal of sewage sludge, semifermented solid waste,
grass cuttings.

vi
BELEDİYE ATIKSU ARITMA ÇAMURLARININ YARI FERMENTE
OLMUŞ KATI ATIKLAR VE BİÇİLMİŞ ÇİM KULLANILARAK
KOMPOSTLAŞTIRILMASI
ÖZ
Çevresel açıdan dost teknikler kullanılması, katı atıkların kompostlanması ve
arıtma çamurunun yönetiminde, doğal kaynakları farkında olmadan tehdit etmesi
etkilidir. Atıksuların arıtımı sonucu oluşan büyük miktarlardaki arıtma çamurları
ekonomik ve çevresel açıdan ilgi odağı oluşturmaktadır. Arıtma çamurlarının
bertarafı veya değerlendirilmesi için yakma, arazide depolanması, kompost
materyalin tarımsal amaçla kullanımı gibi farklı teknikler uygulanmaktadır.
Kompostlaştırmanın diğer bertaraf yöntemlerine göre atık hacmini %40–50 oranında
azaltarak daha az yere ihtiyaç duyma ve termofilik faz boyunca oluşan ısıyla
patojenleri yok etme gibi önemli avantajları vardır. Arıtma çamurları yalnız
kompostlaştırılabildikleri gibi, kentsel katı atıklarla birlikte de
kompostlaştırılabilirler.
Bu çalışmanın amacı, İzmir–Çiğli Atıksu Arıtma Tesisi’nde oluşan çamurun
kompostlaştırılarak tarımsal amaçla kullanılabilirliğinin incelenmesidir. Arıtma
çamurunun aerobik kompostlaştırılabilirliği, iki farklı düzenekte üç farklı çalışmayla
araştırılmıştır. Bu amaçla; üniversite kampus alanından biçilen çim, İzmir – Çiğli
Atıksu Arıtma Tesisi’nden alınan arıtma çamuru ve İzmir Uzundere Kompost
Fabrikası’ndan alınan yarı fermente katı atık kullanılmıştır. Birinci ve üçüncü
çalışmada, farklı oranlarda arıtma çamuru ve yarı fermente katı atık karıştırılmıştır.
İkinci çalışmada ise arıtma çamuru, yarı fermente katı atık ve çim karıştırılmıştır.
Çalışma boyunca, nem, organik madde, sıcaklık, C/N oranı ve hesaplandı. Elde
edilen son ürünün tarımda kullanılabilirliğini araştırmak için; birincil (P, K) ve
ikincil bitki besin (Fe, Cu, Zn, Mn) maddeleri ile ağır metal (Cr, Ni) miktarları da
ölçülmüştür.

vii
Sonuçlar gösterdi ki birinci Deneydeki yöntem beklenen kompost ürünüyle
sonlanmadı. Bununla birlikte, Deney 2 ve Deney 3, daha iyi bir kompostla sonlandı.
Deney 2, diğerlerine göre daha iyi sonuç verdi. Deney 2’de eklenen çim olumlu
sonuç verdi. Son ürünün ağır metal içeriği Toprak Kirliliği Kontrolü
Yönetmeliği’nde verilen standard değerlerin altında çıkmıştır.
Anahtar kelimeler: Kompostlama, arıtma çamurlarının bertarafı, yarı fermente
katı atık, yeşil atıklar.

viii
CONTENTS
Page
THESIS EXAMINATION RESULT FORM .............................................................. ii
ACKNOWLEDGEMENTS ........................................................................................ iii
ABSTRACT................................................................................................................ iv
ÖZ ............................................................................................................................... vi
CHAPTER ONE – COMPOSTING......................................................................... 1
1.1 Introduction ....................................................................................................... 1
1.2 Objective and Scope.......................................................................................... 3
1.3 Literature Review............................... ..... ..........................................................4
CHAPTER TWO – CHARACTERIZATION OF THE SEWAGE SLUDGE .. 10
2.1 Sewage Sludge ................................................................................................ 10
2.2 Basic Parameters........................ ......................................................................11
2.2.1 Total Solids.............................................................................................. 11
2.2.2 Suspended Solids .................................................................................... 11
2.2.3 Volatile Solids......................................................................................... 11
2.2.4 Type of Sludge ........................................................................................ 11
2.3 Physical Features ............................................................................................. 12
2.4 Chemical Features .......................................................................................... 12
2.4.1 Process Parameters .................................................................................. 12
2.4.1.1 pH and Alkalinity ......................................................................... 13
2.4.1.2 Volatile Fatty Acids...................................................................... 13
2.4.2 Nutrients Content .................................................................................... 14
2.4.3 Pollution Level ........................................................................................ 14
2.5 Biological Features.......................................................................................... 15
2.5.1 Biological Stability.................................................................................. 15
2.5.2 Pathogenic Features................................................................................. 15

ix
CHAPTER THREE – COMPOSTING OF THE SOLID WASTES .................. 16
3.1 Composting ..................................................................................................... 16
3.2 Process Microbiology.......................................................................................18
3.3 Process Description........................................ ..................................................19
3.4 Design Considerations for Aerobic Sludge Composting Process. ...................20
3.4.1 Type of Sludge......................................................................................... 20
3.4.2 Amendments and Bulking Agents .......................................................... 21
3.4.3 Carbon – Nitrogen (C/N) Ratio............................................................... 21
3.4.4 Volatile Solids......................................................................................... 22
3.4.5 Air Requirements .................................................................................... 22
3.4.6 Moisture Content..................................................................................... 23
3.4.7 pH Control............................................................................................... 24
3.4.8 Temperature ............................................................................................ 24
3.4.9 Mixing and Turning ................................................................................ 25
3.4.10 Heavy Metals and Trace Organics ........................................................ 25
3.4.11 Site Constraints ..................................................................................... 25
3.4.12 Control of Pathogens............................................................................. 25
3.5 Operating and Performance Parameters .......................................................... 26
3.5.1 Oxygen Uptake ........................................................................................ 27
3.5.2 Temperature ............................................................................................ 28
3.5.3 Moisture .................................................................................................. 29
3.5.4 pH............................................................................................................ 29
3.5.5 Odor ........................................................................................................ 29
3.5.6 Color........................................................................................................ 29
3.5.7 Destruction of Volatile Solids ................................................................. 30
3.5.8 Stability ................................................................................................... 30
3.6 Composting Systems ...................................................................................... 31
3.6.1 Aerated Static Pile ................................................................................... 31
3.6.2 Windrow.................................................................................................. 32
3.6.3 In-Vessel Composting System ................................................................ 33
3.7 Co-composting with Municipal Solid Wastes................................................. 35

x
CHAPTER FOUR – MATERIAL AND METHOD............................................. 36
4.1 Composting Ingredients .................................................................................. 36
4.1.1 Sewage Sludge ........................................................................................ 36
4.1.2 Semi Fermented Solid Waste.................................................................. 37
4.1.3 Grass Cuttings ......................................................................................... 38
4.2 Experimental Research.................................................................................... 38
4.2.1 Composting at the Static Pile (Experiment 1)......................................... 38
4.2.2 Composting at the Barrels (Experiment 2).............................................. 39
4.2.3 Composting at the Barrels (Experiment 3).............................................. 40
4.3 Experimental Methods .................................................................................... 42
4.3.1 Moisture .................................................................................................. 42
4.3.2 Temperature ........................................................................................... 42
4.3.3 pH............................................................................................................ 42
4.3.4 Organic Carbon ....................................................................................... 42
4.3.5 Total Nitrogen ........................................................................................ 43
4.3.6 Primary (P, K), and Secondary Plant Nutrients (Fe, Zn, Mn, Cu), and .....
Heavy Metals (Cr, Ni)............................................................................. 43
CHAPTER FIVE – RESULTS AND DISCUSSION ............................................ 44
5.1 Experiment 1 ................................................................................................... 44
5.1.1 Moisture .................................................................................................. 44
5.1.2 Temperature............................................................................................. 45
5.1.3 pH............................................................................................................ 46
5.1.4 Organic Carbon ....................................................................................... 47
5.1.5 Total Nitrogen ......................................................................................... 48
5.1.6 C/N Ratio................................................................................................. 48
5.1.7 Primary (P, K), and Secondary Plant Nutrients (Fe, Zn, Mn, Cu), and .....
Heavy Metals (Cr, Ni)............................................................................. 49
5.2 Experiment 2 ................................................................................................... 50
5.2.1 Moisture .................................................................................................. 50
5.2.2 Temperature............................................................................................. 51
5.2.2.1 Temperature at Up of the Piles....................................................... 52

xi
5.2.2.2 Temperature at Middle of the Piles ................................................ 53
5.2.3 pH............................................................................................................ 54
5.2.4 Organic Carbon ....................................................................................... 55
5.2.5 Total Nitrogen ......................................................................................... 56
5.2.6 C/N Ratio................................................................................................. 56
5.2.7 Primary (P, K), and Secondary Plant Nutrients (Fe, Zn, Mn, Cu), and .....
Heavy Metals (Cr, Ni)............................................................................. 57
5.3 Experiment 3 ................................................................................................. 59
5.3.1 Moisture .................................................................................................. 59
5.3.2 Temperature............................................................................................. 60
5.3.2.1 Temperature at Up of the Piles....................................................... 60
5.2.2.2 Temperature at Middle of the Piles ................................................ 61
5.3.3 pH............................................................................................................ 62
5.3.4 Organic Carbon ....................................................................................... 63
5.3.5 Total Nitrogen ......................................................................................... 64
5.3.6 C/N Ratio................................................................................................. 65
5.3.7 Primary (P, K), and Secondary Plant Nutrients (Fe, Zn, Mn, Cu), and .....
Heavy Metals (Cr, Ni)............................................................................. 65
CHAPTER SIX – CONCLUSION ......................................................................... 67
CHAPTER SEVEN – RECOMMENDATION ..................................................... 69
REFERENCES......................................................................................................... 70
APPENDIX I. ........................................................................................................... 74
APPENDIX II. .......................................................................................................... 81

1
CHAPTER ONE
COMPOSTING 1.1 Introduction
As a result of economic growth and increasing number of treatment plants, the
amount of sewage sludge has increased which lead to rise in cost of stabilization and
disposal of sewage sludge and limited capacity of the final disposal lands drastically.
In our country, increasing environmental conscious played an important role in
seeking new ways of reducing sewage sludge. In economically developing our
country difficulties related to economics, technology and qualified personal have
affected the use of treatment and disposal options. Appropriate options include
stabilization, minimization, recycling, incineration, dumping on land or in the sea,
and composting.
Stabilization processes are used to minimize environmental affects of treatment
plant sludges before final disposal. Composting is one of the widely used
stabilization methods. However, because of the lack of regulation and order,
scientific knowledge, exploration and data deficiency, the sludge almost totally has
been stored and removed with sewage sludge in the regular or irregular store lands.
This application is caused environment pollution and decreasing capacity of regular
dumping lands. Additionally, nutrients and inorganic components in the sewage
sludge are squandered by this method. Although there are lots of methods for
disposal of treatment sludges, it has been emphasized earnestly on land application of
these sludges. By applying treatment sludges having proper characteristics as a soil
amendatory and as organic fertilizer on agricultural lands, both sludge disposal and
economical advantage in agricultural production will be achieved.
Composting has gained wide acceptance as a key component of integrated solid
waste management. The capacity of reducing the volume and weight approximately
by 50% and resulting in a stable product that can be beneficial in agriculture made
composting a promising alternative (He et al., 1992). Composting offers a unique

2
opportunity to reduce the overall quantity of waste land filled by converting organic
wastes into a useful product that can be used to enhance the quality of life and solve
of the environmental problems (Vesilind et al., 1990).
Gray & Sherman (1969) stated that composting is the biological decomposition of
organic matter under controlled aerobic conditions. In contrast, fermentation is the
anaerobic decomposition of organic matter. Many factors affect the composting
process; “So many factors are involved, nearly all interrelated, that this complex
ecological process is unlikely to succumb to rigorous scientific analysis for many
years”. According to Epstein (1997), some of these factors play a major role in the
process while other can influence its direction or extent. Since 1969 new chemical
and physical techniques have provided scientists with the tools to examine and
manipulate these factors and to delve into the composting process in a rigorous
manner. Stabilization processes are used to minimize environmental effects of
treatment plant sludges before final disposal. Composting is one of the widely used
stabilization methods. Treatment plant sludges can be composted alone or along with
bio wastes. These bio wastes should contain high organic carbon as wood, grass,
wood shaving, domestic wastes and waste paper etc. Because the C/N ratio in the
mixing most important parameter to mature composting. Bishop and Godfrey (1983)
claims that the initial C/N ratio should be in the range of 20:1 to 35:1 by weight. At
lower ratios, ammonia given off and odor problem occurs. In the case of C/N ratios
exceeding 50:1, the composting process slows because of rapid cell growth and
depletion of available N, resulting in reduced cellular growth. As cells die, their
stored N becomes available to living cells.
In this regard, grass cuttings from university gardens, sewage sludge from İzmir –
Çigli Wastewater Treatment Plant, and semi fermented solid waste which were taken
from İzmir–Uzundere Compost Plant were used. In 1st and 3rd experiments, semi
fermented solid waste and sewage sludge were mixed in different rates and systems.
In 2nd experiment, sewage sludge, semi fermented solid waste and grass cutting were
mixed. The capability and possibility of sewage sludge and further its agricultural
use were investigated by composting.

3
1.2 Objective and Scope
There are so many sludge treatment methods which vary depending on sludge
characteristic, climate and economy. The chosen method needs to be
environmentally friendly and economical. Stabilization processes are used to
minimize environmental effects before final disposal. Composting is one of the
widely used stabilization methods. In this regard, sewage sludge from treatment
plants can be composted either alone or along with municipal solid wastes.
The aim of this study is to investigate the agricultural usage of sewage sludge
which is produced in İzmir – Çiğli Wastewater Treatment Plant. In İzmir – Çiğli
Wastewater Treatment Plant, 12000 m3 sludge is produced and processed per day.
After mechanical dewatering process, the sludge decreases to 600 m3. Annual sludge
production is approximately 43800 tons (dry weight) provided that the sludge
contains 20% dry matter.
Sewage sludge is an inevitable end product of wastewater treatment process.
Composting the sewage sludge is increasingly receiving the interest of many
municipalities throughout the world because it has several advantages over other
disposal strategies. Land application of composts to agricultural soils has many
advantages, which include supplying nutrients to the soil, increasing soil acidity, as
well as beneficial soil organisms, reducing the need for fertilizers and pesticides,
improving soil physical and biological properties, and decreasing the load on
landfills.
The appropriate C/N ratio during composting of sludge should be supplied by
cellulosed carbon containing materials which must be low in cost, plenty and easy to
reach. In İzmir, a composting plant exists in Uzundere and produces compost from
city garbage which can be blended with sludge. This material can regularly be
conveyed to the treatment plant, and mixed in appropriate ratio to produce waste-
sludge compost.

4
Additionally, in order to widen the C/N ratio in treatment sludge, wood, grass,
wood shaving, domestic wastes and waste paper which contain high organic carbon
can be used. In İzmir, there are numerous recreation areas with lawns. For this
purpose, the lawn is mown at least once a month.
Three experiments were performed to examine the usability of treatment sludge in
the agricultural lands. In the 1st experiment; sewage sludge and semi fermented solid
waste which was taken from İzmir Uzundere Compost Plant were used to make
compost by using the method of the static pile. In the 2nd experiment; sewage sludge,
semi fermented solid waste, and grass cutting were used to make compost in the
barrels which of volume 70L. It should be noted that upper surface of barrels was
open. In the 3rd experiment; sewage sludge and semi fermented solid waste were
used to make compost in the barrels.
Moisture, pH, temperature, and organic matter were determined during the study.
Primary macro (P, K), and secondary plant nutrients (Fe, Cu, Zn, Mn), and heavy
metals like Cr, Ni were also examined to investigate for agricultural use of using
final products.
1.3 Literature Review
Zorpas et al. (2002) researched that waste paper and clinoptilolite as a bulking
material with dewatered anaerobically primary sewage sludge (DAPSS) for compost.
The composting process was carried out in the laboratory using an in-vessel reactor
of 1 m3 active volume. The major limitation of land application of sewage sludge
compost is the potential for high heavy metal content in relation to the metal content
of the original sludge. Composting of sewage sludge with natural zeolite
(clinoptilolite) can enhance its quality and suitability for agricultural use. However,
the dewatered anaerobically stabilized primary sewage sludge (DASPSS) contained a
low concentration of humic substances (almost 2 %), the addition of the waste paper
was necessary in order to produce a good soil conditioner with high concentrations of
humics. The final results showed that the compost produced from DASPSS and 40 –

5
50 % w/w of waste paper was a good soil fertilizer. Finally, in order to estimate the
metal leachability of the final compost product, Generalized Acid Neutralization
Capacity (GANC) procedure was used, and it was found that by increasing the
leachate pH, the heavy metal concentration decreased. When the amount of the waste
paper was increased the concentration of the organic matter in the final product
increased. The pH was initially low due to the acid formation, then the pH increased
and at the later stage pH was constant. The C/N ratio for that stabilized compost was
considered very satisfactory for agricultural use. The final product contained a low
concentration of heavy metals and that is not problem for the use of compost for
agricultural purposes. That increases the quality of the compost. Zeolite was helpful
in the uptake of heavy metals. Using the GANC procedure it was found that by
increasing the leachate pH, the heavy metal concentration decreased. The GANC test
procedure showed that in the case of oxic rain the zeolite had the ability to retain the
heavy metals (significant different at P<0.05) and not let them pass to the
groundwater. Using a sequential extraction procedure in the raw sludge (DASPSS)
and final products (compost after 150 days of maturity) it was found that a
significant (P<0.05) amount of sludge metals was bound in the residual fraction, in
an inert form. Clinoptilolite had most readily taken up the metal content bound in the
exchangeable and carbonate fractions.
Amir et al. (2004) researched that sequential extraction of heavy metals during
composting of sewage sludge. The major limitation of soil application of sewage
sludge compost is the total heavy metal contents and their bioavailability to the soil-
plant system. That study was conducted to determine the heavy metal speciation and
the influence of changing the physico-chemical properties of the medium in the
course of composting on the concentrations, bioavailability or chemical forms of Cu,
Zn, Pb and Ni in sewage sludge. Principal physical and chemical properties FTIR
spectroscopical characterization of sludge compost during treatment show the
stability and maturity of end product. The total metal contents in the final compost
were much lower than the limit values of composts to be used as good soil fertilizer.
Furthermore, it was observed by using a sequential extraction procedure in sludge
compost at different steps of treatment, that a large proportion of the heavy metals
6
were associated to the residual fraction (70 – 80%). The agricultural use of sewage
sludge compost implies knowing its degree of stability, as well as its content and
biogeochemical forms of the heavy metals present. Not only are those elements not
biodegradable and become toxic at some concentrations, they tend to accumulate
along the food chain where man is the last link. The determination of total heavy
metal content does not provide useful information about the risks of bioavailability,
the capacity for remobilization and the behavior of the metals in the environment.
While, the chemical forms of a metal or speciation allows the estimation of heavy
metal bioavailability and is related to the different natures of the metals, their
bonding strength, either in free ionic form or complexed by organic matter, or
incorporated in the mineral fraction of the sample. That study is characterized by
C/N ratio of 14 and metal contents of 275; 71; 135; 24 mg/kg–1 respectively for Zn,
Cu, Pb, Ni (the Cd concentration was below the limit of detection). The mixture of
sludge (89%) with straw (11%), increased the C/N ratio to 23.9. the C/N ratio
reached the optimal range of stable compost. The compost can supply all macro-
nutrients necessary for plant growth. The total concentration of Zn, Cu, Ni and Pb
was very low rendering final compost acceptable for agricultural use (Amir et al.,
2004).
In the study which reported by Manios, (2003), materials such as olive cake, olive
tree leaves (OTL) and branches, vine branches (VB), pressed grape skins (PGS), pig
manure (PM), sewage sludge and the organic fraction of municipal solid waste
(OFMSW) have been evaluated for their behavior during composting, their
compatibility in mixtures and quality of the end product. The quality evaluation
included both a detailed physiochemical (pH, electrical conductivity (EC), nutrients
concentration, heavy metal concentration, etc.) and biological analyses (pathogenic
microorganisms). It also included an agronomic evaluation, in which composts were
used either as a soil amendment or as a component for substrates in open air or
covered (greenhouse) cultivation mainly of local vegetables (tomatoes, cucumbers,
etc.). All materials were composted successfully, especially when mixed. The end
products contained large amounts of organic matter, usually combined with increased
EC value. Pressed grape skins should be considered as the ideal raw material,
7
producing high quality compost, with the lowest EC value and the largest organic
matter concentration (84.50%), compared to all other materials. When any of the
produced compost was used in a ratio of 30% by volume (v/v), it increased plant
growth, whereas in larger volumes, it presented phytotoxic behavior, inhibiting both
root and shoot development. The raw materials that can be used to produce high
quality composts are mainly the residues of local cultivations and agricultural
industries. A secondary source, both in amount and quality, is the organic fraction of
municipal solid waste (OFMSW) (when source separated) and sewage sludge, when
mixed with green waste or other bulky organic materials. However, given the bulky
nature of those materials and the large transportation cost, composting should take
place as close as possible to place of waste production to ensure that is an
economically viable and affordable option for growers. Green waste in particular has
a strong insulating ability, allowing energy trapping in the core of pile, resulting in a
higher temperature for a longer period of time. The thermophilic phase of sewage
sludge composting depends on the mixture, especially the ratio of sludge to bulking
agent, but is independent of the nature of the agents. When 1:2 or 1:3 (v/v) mixtures
were used, the thermophilic phase was 6–8 weeks. With a required minimum number
of six turnings. The main problem with sewage sludge was the metal concentration
that high, resulting to a increased metal concentration in the end product. Mixtures
should be used to ensure a good final product. Other advantages include easy
handling of materials during composting and reduced odor emissions, as well as
fewer turning, less need for C/N ratio correction and moisture adding, and a shorter
thermophilic and maturation phase.
Manios et al. (2003) researched that, shredded green wastes were composted in
windrow. Landfill leachates were added twice during the second and fourth week of
the process in two piles. One pile was turned once every week for eight weeks and
the other was turned twice, during the same period. Each time approximately, 2 m3 of
leachate was added, into each pile. The two piles each contained about 45 m3 of
shredded green waste. The effect of adding leachate on the sanitization of the green
waste during composting was evaluated based on the changes in the levels of faecal
streptococci. The results suggested that using leachate as the moisture source had no

8
significant effect (tested with two factors ANOVA test) on the sanitization process
when compared with two similar piles, used as the control, for which tap water was
used for moisture addition. In all four piles sanitization was almost complete and
below the acceptable levels. Additionally, the results indicated that there was no
significant effect on the sanitization process of turning frequency. The results
indicate that partially treated landfill leachate can be reused as a water source during
composting of green waste, since it did not produce any negative effect in the
sanitization process. This use can be supported only when such wastewater is readily
available and can be transported at small cost. In the case considered the site for
leachate collection and treatment was only 800 m away from the composting site and
on the same controlled site as the composting plant. No analyses for heavy metals
and other chemical accumulation in the green waste were carried out. To support the
use of leachate in that way those parameters need to be monitored.
According to Elmacı et al. (2003), the solids wastes of factories, which processes
medicinal and aromatic plants, are analyzed in respect of content and investigated
their suitability to agricultural uses. In the materials, which contains in the majority
wastes of oregano and cumin, moisture, pH, salt (EC), organic matter, organic C and
C/N values were determined. Besides macro (N, P, K, Ca, Mg, and Na) and
micronutrients (Fe, Cu, Zn, Mn, and B), heavy metals like Co, Cd, Cr, Pb and Ni
contents were also obtained. Results were compared with the values of some other
plant wastes. They found that the wastes could be used in agricultural soils after the
composting process and to fit their effect on soil and plant growth, some vegetation
experiments are needed.
According to Tunç & Ünlü (2005) the heavy metal contents and agricultural usage
of sludge of drying beds from Elazığ Wastewater Treatment Plant were investigated.
For this reason, heavy metal contents, the values of pH and organic matter of
samples collected in the sludge drying beds and the final sludge collecting area were
determined and evaluated according to Turkish Regulation of Solid Pollution
Control. To determine the heavy metal concentrations, sludge were digested with
nitric acid. In the result of analyses made, the heavy metal concentrations of sludge

9
were found in the range of 4000–9824.6 for Fe, 686.3–1674.4 for Zn, 157.5–656.3
for Mn, 13.3–167.5 for Cr, 107.6–550 for Cu, 31.10–126.67 for Ni, 31.80–84.81 for
Pb, 0-15.07 for Co and 1.54–6.36 mg/kg dry sludge for Cd. These values were lower
than standard values in Turkish Regulation of Solid Waste Control and Soil Pollution
Control. However, the values of pH and organic matter in sludge were in the range of
6.82–7.62 and in the range of 40–74%, respectively.

10
CHAPTER TWO
CHARACTERIZATION OF THE SEWAGE SLUDGE
2.1 Sewage Sludge
Sewage sludge must be treated before its disposal or utilization. Characterization
of sewage sludge is very important and it must be carefully characterized in order to
make stabilization, dewatering and other processes effective and properly conducted.
Various parameters and measurement values are used for characterization. The
parameters are selected according to physical, chemical and biological features.
Table 2.1 shows a survey of parameters. The list is a selection of the most common
and interesting parameters but, because of the complex nature of sewage sludge, it
cannot be complete.
Table 2.1 Survey of sludge characterization parameters (Kopp & Dichtl, 2002)
Parameter Explanation Process
1. Physical Features
Solid content Basic parameter - solid concentration A - H
Volatile solid content Basic parameter – organic solid concentration A - H
Sludge index Influences clarification and thickening A
Conditioning Demand of conditioning agents C
Particle size Description of solids A,C,E
Capillary suction time Dewatering test C
Water distribution Influences the dewatering result C
Density Influences the dewatering in centrifuges C
Floc strength Influences the dewatering in centrifuges C
Resistance to filtration Influences the dewatering in filters C
Rheology/viscosity Describes pumping processes D
Shear stability Describes stability of landfill polders G
Heat value Influences incineration processes H
2. Chemical Features
pH/alkalinity Describes the stability of digestion B
Fatty acids Describes the stability of digestion B
C,N,P concentration Concentration of sludge and process water with C,N,P E,F
Pollution level Heavy metals, org. Hazardous substances F,G
3. Biological Features
Pathogenic features Describes the hygienic aspects of sludge F
Biological stability Describes the biogas production F,G
Bulking Influences clarification and thickening A
A : settlement properties, B : stabilization, C : conditioning and dewatering, D : pumping E : return sludge liquor, F–H:disposa
11
2.2 Basic Parameters
The solids content, volatile solids content and type of sludge are important
parameters for sludge characterization, particularly when sludge solids balances are
to be calculated. Because of varying standards, it is often difficult to compare
parameters and results. Therefore, it is necessary to relate the parameters to solids
content of the sludge, especially when controlling sludge mass balances.
2.2.1 Total Solids
A large fraction of sludge is water. To determine the total solids (TS) content, the
sample has to be dried at 105oC. Total solids can be divided into dissolved solids
(DS) and suspended solids (SS), as well as into fixed solids (FS) and volatile solids
(VS).
2.2.2 Suspended Solids
Suspended solids (SS) are defined as those solids captured on a filter. The term
suspended solids is often used as a surrogate of active biomass and therefore is
important in sludge stabilization.
2.2.3 Volatile Solids
Volatile solids (VS) generally describe the organic solids content. For
measurement the dried sample will be burned at 550oC. This parameter is used for
controlling stabilization and biogas production. The residues are inorganic minerals
and sand.
2.2.4 Type of Sludge
Sludge characteristics depend on the waste water and the industrial influent and
therefore they vary widely. The two most important sludges produced by municipal

12
treatment plants are primary sludge, which is drawn from the bottom of primary
clarifiers, and waste – activated sludge, which is produced in the activated sludge
system as excess biomass.
Primary sludge is readily biodegradable; the biogas production from digestion is
high and its dewaterability is normally very good. The quality of the primary sludge
depends on the waste water and the retention time in the pre-sedimentation tank.
Biodegradability and dewaterability of waste – activated sludge strongly depend on
the age of the sludge.
Other types of sludge, depending on the treatment plant, are trickling filter sludge
(captured in secondary clarifiers in trickling filter plants) and chemical sludges,
such as aluminum phosphate sludges, formed during chemical nutrient removal or
tertiary treatments.
2.3 Physical Features
The main goal in physical processing is to increase the solids content and to
decrease the volume of the sludge by removing water. They are settlement properties,
conditioning and dewatering, rheology and viscosity, calorific value.
2.4 Chemical Features
The most important chemical parameters are pH, alkalinity, nutrients content and
pollution level.
2.4.1 Process Parameters
Process parameters are primarily used for monitoring the sludge stabilization
process and evaluating its digestibility.

13
2.4.1.1 pH and Alkalinity
In general the pH value of sewage sludge is neutral at 7.0. Digested sludge or
sludge in the methanogenous phase shows a slightly alkaline pH value (7.0–7.5),
while primary sludge or sludge in the acetogenous phase has a slightly acid pH
value (6.0). The sludge pH is, therefore, a good indicator of digestion conditions, as
long as there is no industrial contamination.
Because of the existence of various buffer systems, sewage sludge can neutralize
certain amounts of added acids. The most important buffer system is the carbonate –
hydrocarbonate buffer, which is often described as alkalinity in mg-CaCO3/L. The
carbonate– hydrocarbonate buffer system is connected to the ammonia – ammonium
buffer system, which is very important for maintaining slightly alkaline conditions
during methane fermentation and for the compensation of the volatile fatty acids
generated during digestion. Alkalinity is therefore a better parameter than pH for
monitoring anaerobic digestion.
2.4.1.2 Volatile Fatty Acids
As mentioned above, low molecular carbonic acids are generated as intermediate
products during the digestion process. Concentrations of acetic acid and propionic
acid are often used for the characterization of volatile fatty acids. High
concentrations of propionic acid indicate an overload or a disturbance in the
anaerobic digestion process. According to recent studies, however, the relation of
volatile fatty acids to alkalinity is more important than the absolute quantity of
volatile fatty acids. As long as alkalinity is several 100 mg-CaCO3/L higher than the
amount of volatile fatty acids, the anaerobic digestion process does not seem to be
endangered.

14
2.4.2 Nutrients Content
Sewage sludge contains nutrients which is very important its agricultural use.
Stabilized non-infected sewage sludge is characterized not only by its nutrient
content, but also by its ability to reclaim soil. Land application of sewage sludge is
limited. The criteria for the sludge quality are subject to the relevant legal
regulations. Sewage sludges contain significant amounts of nitrogen and phosphorus
but only small amounts of potassium. Table 2.2 shows the fertilizing value of 6000
analyzed sewage sludges.
Table 2.2 Survey on nutrients in sewage sludges (Teller et al. 1994)
Elements (g/kg-SS) Min. Max. Average
N 0.1 246 38.4
P2O5 0.2 344 36.5
K2O 0.1 95 4.2
MgO 0.1 122 9.7
CaO 0.1 727 73.7
SS (%) 0.1 100 12
2.4.3 Pollution Level
Sewage sludge contains organic and inorganic pollutants, for example heavy
metals such as mercury, copper, cadmium and lead. For the agricultural use of
sewage sludge, it is first of all important to consider its possible toxicity to plants
and the potential health hazard due to transfer in the food chain. When using sewage
sludge as a fertilizer or soil conditioner the maximum heavy metal concentrations
are subject to legal regulations. Organic pollutants in sludge are often
polychlorinated hydrocarbons, including dioxins (PCDD), furans (PCDF),
polychlorinated phenyl benzenes (CB), surfactants and adsorbable organic halogen
compounds (AOX).

15
2.5 Biological Features
In order to assess the biological processes, it is necessary to consider the degree
of degradation involved, and the microbiological parameters in regard to hygienic
aspects.
2.5.1 Biological Stability
When characterizing the biological stability of sewage sludge, it is most important
to monitor the degradation of solids and evaluate the remaining bioactivity of the
sludge to be disposes of.
2.5.2 Pathogenic Features
Primary sludge can contain all pathogenic organisms and worm eggs existent in
human and animal faeces. Therefore, this type of sludge must be considered to be a
possible health hazard. During digestion, pathogenic germs and worm eggs cannot
breed or grow because they are weakened or killed depending on digestion time and
temperature. When sludge is composted according to the rules it is almost
disinfection can only be achieved by pasteurization at more than 70oC or by drying
the sludge (Kopp & Dichtl, 2002).
16
CHAPTER THREE
COMPOSTING OF THE SOLID WASTES
3.1 Composting
Composting is the biological decomposition of organic matter under controlled
aerobic conditions. In contrast, fermentation is the anaerobic decomposition of
organic matter. Composting is a process in which organic material undergoes
biological degradation to a stable end product. Sludge that has been composted
properly is a nuisance – free, humus like material. Approximately 20 to 30 percent of
the volatile solids are converted to carbon dioxide and water. As the organic
material in the sludge decomposes, the compost heats to temperatures in the
pasteurization range of 50 to 70oC (120 to 160
oF), and enteric pathogenic organisms
are destroyed. Properly composted biosolids may be used as soil conditioner in
agricultural or horticultural applications, subject to any limitations based on the
constituents in the composted biosolids. Although composting may be accomplished
under anaerobic or aerobic conditions, essentially all municipal wastewater
biosolids composting applications are under mostly aerobic conditions (composting
is never completely aerobic). Aerobic composting accelerates material
decomposition and result in the higher rise in temperature necessary for pathogen
destruction. Aerobic composting also minimizes the potential for nuisance odors. The
anticipated daily production of biosolids from a wastewater-treatment facility will
have a pronounced effect on the alternate composting systems available for use, as
will the availability of land for the construction of the composting facility. Other
factors affecting the type of composting system are the nature of the biosolids
produced; stabilization, if any, of the biosolids prior to composting; and the type of
dewatering equipment and chemicals used. Biosolids that are stabilized by aerobic
or anaerobic digestion prior to composting may result in reducing the size of the
composting facilities by up to 40 percent (Tchobanoglous et al., 2003).
The basic composting process is depicted in Figure 3.1. The major factors
affecting the decomposition of organic matter by microorganisms are oxygen and
moisture. Temperature is an important factor in composting process; however,

17
temperature is the result of the microbial activity. Other important factors that could
limit the composting process are nutrients and pH. Nutrients, especially carbon and
nitrogen, play an important part in the process as they are essential for microbial
growth and activity. Carbon is the principal source of energy, and nitrogen is needed
for cell synthesis. Phosphorus and sulfur are also important, but less is known about
their role in composting. Microorganisms require the same micronutrients as plants
and compete for available micronutrients (Stevenson, 1991). Micronutrients such as
Cu, Ni, Mo, Fe, Mg, Zn, and Na are necessary for enzymatic functions, but little is
known about their importance to the composting process.
FAST
RATE OF
DECOMPOSITION
SLOW
Figure 3.1 The composting process. (Epstein, 1997)
Most of the self–heating of organic matter is the result of microbial respiration
(Finstein & Morris, 1975). That is, when the mass is insulated, the heat generated
increases the temperature of the mass. An increase in temperature affects the
microbial population through changes in mesophilic and thermophilic organisms,
which in turn affects the rate of decomposition. Microbial respiration can therefore
be used as an indicator of decomposition and the stability of a compost product.
WATER ORGANIC MATTER
CARBOHYDRATES SUGAR
PROTEINS FATS
HEMICELLULOSE CELLULOSE
LIGNIN MINERAL WATER
DECOMPOSITION PRODUCTS
CARBON DIOXIDE
WATER
HEAT COMPOST
MICROORGANISMS
OXYGEN

18
During the process oxygen is consumed, and CO2 and water are released. In the
early days of composting, it was very time consuming or difficult to monitor CO2 or
O2 continuously during large – scale composting. Consequently, most of the data in
the literature are from small – scale or laboratory process.
In addition to CO2, ammonia and other volatile compounds are emitted to the
atmosphere. In comparison to CO2 and H2O these represent very small amounts,
however. Wiley and Pierce (1955) represented the aerobic composting process in the
following chemical equation 3.1:
CPHqOrNs.aH2O + bO2 = CtHuOvNw.cH2O + dH2O + eH2O + CO2 (3.1)
Organic oxygen compost water water carbon
matter consumed evap. prod. dioxide prod.
(The small letter represents constants for different conditions.)
3.2 Process Microbiology
The composting process involves the complex destruction of organic material
coupled with the production of humic acid to produce a stabilized end product. the
microorganisms involved fall into three major categories : bacteria, actinomycetes,
and fungi. Although the interrelationship of these microbial populations is not fully
understood, bacterial activity appears to be responsible for the decomposition of
proteins, lipids, and fats at thermophilic temperatures, as well as for much of the
heat energy produced. Fungi and actinomycetes are also present at varying levels
during the mesophilic and thermophilic stages of composting and appear to be
responsible for the destruction of complex organics and the cellulose supplied in the
form of amendment or bulking agents.
During the composting process, three separate stages of activity and associated
temperatures are observed: mesophilic, thermophilic, and cooling. In the initial
mesophilic stage, the temperature in the compost pile increases from ambient to
approximately 40oC with the appearance of fungi and acid producing bacteria. As

19
the temperature in the composting mass increases to the thermophilic range of 40 to
70oC, these microorganisms are replaced by thermophilic bacteria, actinomycetes,
and thermophilic fungi. It is in the thermophilic temperature range that the maximum
degradation and stabilization of organic material occur. The cooling stage is
characterized by a reduction in microbial activity, and replacement of the
thermophilic organisms with mesophilic bacteria and fungi. During the cooling
period, further release of water from the composted material will occur, as well as
stabilization of humic acid formation.
3.3 Process Description
Most composting operations consist of the following basic steps.
1. Preprocessing, the mixing of dewatered sludge with an amendment and/or a
bulking agent;
2. High – rate decomposition, aerating the compost pile either by addition of
air, by mechanical turning, or by both;
3. Recovery of the bulking agent (at the end of either the high – rate
decomposition or curing phase, if practicable);
4. Further curing and storage, which allows further stabilization and cooling
of the compost;
5. Post processing, screening for the removal of non – biogradable material
such as metals and plastics or grinding for size reduction,
6. Final disposition. A portion of the final product is sometimes recycled to the
preprocessing step to aid in conditioning the compost mixture.
The high rate decomposition stage of composting has been more engineered and
controlled due to the need to reduce odors, supply high aeration rates, and maintain
process control. The curing stage is often less engineered, less controlled, and given
only small consideration in some designs. The curing stage is an integral part of the
system design and operation, both stages need to be designed and operated properly
to produce mature compost.
20
According to Tchobanoglous et al. (1993), the two principal methods of
composting now in use in the United States may be classified as agitated or static. In
the agitated method the material to be composted is agitated periodically to
introduce oxygen, to control the temperature, and to mix the material to obtain a
uniform product. In the static method, the material to be composted remains static
and air is blown through the composting material. The most common agitated and
static methods of composting are known as the windrow and static pile methods,
respectively. Proprietary composting systems in which the composting operation is
carried out in a reactor of some type are known as in–vessel composting systems.
An amendment is an organic material added to the feed substrate primarily to
reduce the bulk weight, reduce moisture content, and increase the air voids for
proper aeration. Amendments can also be used to increase the quantity of
degradable organics in the mixture. Commonly used amendments are sawdust,
straw, recycled compost, and rice hulls. A bulking agent is an organic or inorganic
material that is used to provide structural support and to increase the porosity of the
mixture for effective aeration. Wood chips are the most commonly used bulking
agents and can be recovered and reused.
3.4 Design Considerations for Aerobic Sludge Composting Processes
3.4.1 Type of Sludge
Both untreated sludge and digested biosolids can be composted successfully.
Untreated sludge has a greater potential for odors, particularly for windrow systems.
Untreated sludge has more energy available, will degrade more readily, and has
higher oxygen demand.

21
3.4.2 Amendments and Bulking Agents
Amendments and bulking agent characteristics (i.e., moisture content, particle
size, and available carbon) affect the process and quality of product. Bulking agents
should be readily available.
3.4.3 Carbon – Nitrogen (C/N) Ratio
The initial C/N ratio should be in the range of 20:1 to 35:1 by weight. At lower
ratios, ammonia is given off. Carbon should be checked to ensure it is readily
biodegradable. If C:N ratio lower than 25:1 than odor problem occurs.
The two most important nutrients are carbon and nitrogen. Few other inorganic
chemical reactions have been studied. The C to N ratios during composting affects
the process and the product. As indicated earlier, the important parameter is the
carbon available to microorganisms, not the total carbon in the material. During
microbial growth, approximately 25 to 30 parts of C are needed for every unit of N
(Gotass, 1956; Waksman, 1938). Carbon is provided to the microbial community
from decomposing plants and wastes from animals and humans. The C is utilized for
cellular growth. Some of the microbial biomass returns C to the cycle. During
microbial activity, respiratory CO2 is evolved and emitted to the atmosphere. The
readily available C utilized initially. As the composting process continues, however,
the rate of CO2 evolution decreases as result of decreased metabolic activity and the
decrease of available carbon.
Microorganisms needed N for protein synthesis. Bacteria may contain 7% to 11%
N on dry weight basis and fungi from 4% to 6% (Anderson, 1956). The amount of N
in a waste varies with the type of waste. For example, food wastes and biosolids have
higher N content than yard waste. Microorganisms utilized C and N at ratio of 30:1.
Low C/N ratios in feedstock result in nitrogen volatilization in the form of ammonia.
This is particularly true under alkaline conditions. The imbalance of C/N is
illustrated by problem encountered by many facilities that receive large volumes of

22
grass in the summer and do not have a sufficient carbon source to offset the low C/N
ratio. Anaerobic or partially aerobic conditions can result in ammonia release to the
atmosphere (Knuth, 1970). The loss of N reduces the value of compost as a fertilizer.
According to Bishop & Godfrey (1983), at C/N ratios exceeding 50:1, the
composting process slows because of rapid cell growth and depletion of available N,
resulting in reduced cellular growth. As cells die, their stored N becomes available
to living cells.
3.4.4 Volatile Solids
The volatile solids of the composting mix should be greater than 30 percent of the
total solids content. Dewatered sludge will usually require an amendment or bulking
agent to adjust the solids content.
3.4.5 Air Requirements
O2 is required for metabolisms and respiration of aerobic microorganism and
oxidation of organic molecules in the waste. Initial in the compost pile O2 is 15-20%,
and CO2 is 0.5 – 5. O2 goes down and CO2 goes up when biological activity
progresses. If O2<5% than regional anaerobic conditions occur so aeration is
considered important. O2 inside the pile is 6 – 16 %, and outside the pile 20 % at
compost plant which works well.
Air with at least 50 percent of the oxygen remaining should reach all parts of the
composting material for optimum results, especially in mechanical systems. Oxygen
is essential for the microbial activity in composting since it is an aerobic process.
Three principal aeration methods provide O2 during composting; physical turning of
the mass, convective air flow, and mechanical aeration. Windrow methods use the
former two ways, whereas static systems provide O2 by using blowers or through
convective air flow. The latter, often called passive aeration is highly dependent on
the porosity of the matrix.
23
3.4.6 Moisture Content
Moisture is one of the limiting factors in composting processes. Dominant species
and their growth abilities depend on the relative humidities. Bacteria can be multiply
at relative humidities of 100%, whereas fungi grow at lower humidities. Thus,
moisture enhances the activity of some species and inhibits others at the same time.
In general, at moisture contents below 40% the microbial activity diminishes and
degradation capacity of microbial population ceases. At moisture levels over 60%,
water that fills the pores prevent oxygen transfer in the compost mass and as oxygen
is depleted the aerobic conditions can no longer be dominant. Aerobic species and
their activities depend on the oxygen provided during process (Epstein, 1997).
Moisture in the composting process can affect microbial activity and thus
influence temperature and rate of composition. In addition, moisture can affect the
composition of the microbial population. Moisture is produced as a result of
microbial activity and the biological oxidation of organic matter. In addition water is
lost through evaporation.
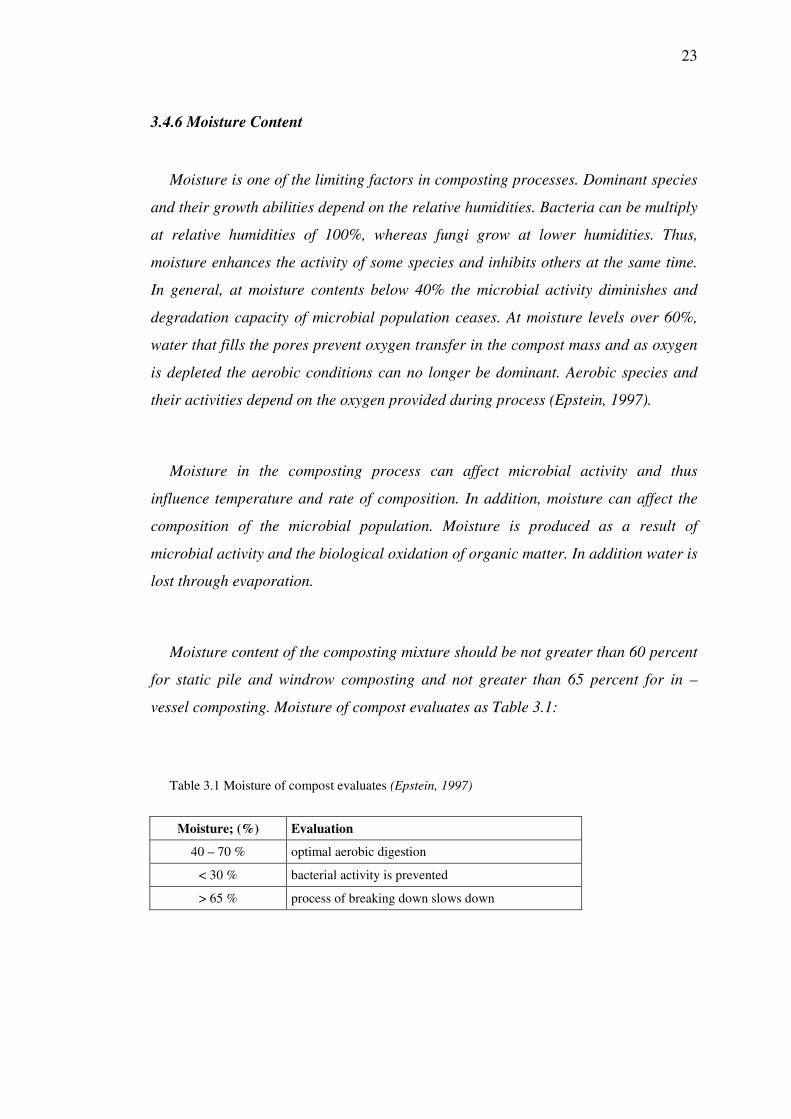
Moisture content of the composting mixture should be not greater than 60 percent
for static pile and windrow composting and not greater than 65 percent for in –
vessel composting. Moisture of compost evaluates as Table 3.1:
Table 3.1 Moisture of compost evaluates (Epstein, 1997)
Moisture; (%) Evaluation
40 – 70 % optimal aerobic digestion
< 30 % bacterial activity is prevented
> 65 % process of breaking down slows down

24
3.4.7 pH Control
pH is a common measure of alkalinity or acidity. The pH value of composting
material drops in association with the acid formation at the early stages of
composting due to the simple organic acids produced at the initial phase of
decomposition as a result of fermentative activity carried on. Organic acids
synthesized serve as substrate for microorganisms while decreasing the pH. The
subsequent rise afterwards is the indication of acid utilization. Buffering is not
necessary and could even have adverse consequences. With the progression of
degradation alkaline characteristics in pH dominate as proteins are attacked an
ammonia is releases. Highly alkaline conditions will lead to excessive loss of
nitrogen as ammonia whereas highly acidic initial conditions may lead to failure in
the warming up of the matrix. Proper adjustments in feed preparation leads to
controlled pH values. Nakasaki et al. (1993) concluded that the degradation rate of
organic matter in the pH–controlled experiments was faster than that without.
Nitrogen loss was enhanced by the control of pH value. High pH values indicate that
anaerobic conditions are present and followed by odors and toxic by-products. On
the other hand, pH value lower than 5 leads to increase in the metal solubility and
corrosion in the equipments used. The pH value indicates the type and intensity of
microbial activity and the corrosiveness of the composting material.
pH of the composting mixture should generally be in the range of 6 to 9. To
achieve optimum aerobic decomposition, pH should remain in the 7 to 7.5 range.
3.4.8 Temperature
Temperature plays a major role in the composting process. At the same time, it is
also a function of the process. Probably the most important aspect of temperature is
its impact on the microbiological community. Thus, other vital reaction and elements
of the composting process are affected and change with temperature. Temperature
also affects the moisture relationships, which in turn affect microbiological activity.
25
The interaction between various parameters and temperature often makes it difficult
to separate cause and effect.
For best results, temperature should be maintained between 50 and 55o C for the
first few days and between 55 and 60o C for the remainder of the active composting
period. If the temperature is allowed to increase beyond 65oC for a significant period
of time, biological activity will be reduced.
3.4.9 Mixing and Turning
To prevent drying, caking, and air channeling, material in the process of being
composted should be mixed or turned on a regular schedule or as required.
Frequency of mixing or turning will depend on the type of composting operation.
3.4.10 Heavy Metals and Trace Organics
Heavy metals and trace organics in the sludge and finished compost should be
monitored to ensure that the concentrations do not exceed the applicable regulations
for end use of the product.
3.4.11 Site Constraints
Factors to be considered in selecting a site include available area, access,
proximity to treatment plant and other land uses, climatic conditions, and
availability of buffer zone.
3.4.12 Control of Pathogens
If properly conducted, it is possible to kill all pathogens, weeds, and seeds during
the composting process. To achieve this level of control, the temperature must be
maintained between 60 and 70o
C for 24 hours. Temperatures and times of exposure

26
required for the destruction of common pathogens and parasites are shown in Table
3.2.
Table 3.2 Temperatures and times of exposure required for the destruction of common pathogens and
parasites (Tchobanoglous et al.; 1993):
Organism Observations
Salmonella typhosa
No growth beyond 46oC; death within 30 min at
55–60oC and within 20 min at 60oC; destroyed in
a short time in compost environment.
Salmonella sp. Death within 1 h at 55oC and within 15 – 20 min
at 60oC
Shigella sp. Death within 1 h at 55oC
Escherichia coli Most die within 1 h at 55oC and within 15 – 20 min
at 60oC
Entamoeba histolytica cysts Death within a few minutes at 45oC and within
a few seconds at 55oC
Taenia saginata Death within a few minutes at 55oC
Trichinella spiralis larvae Quickly killed at 55oC; instantly killed at 60oC
Brucella abortus or Br. Suis Death within 3 min at 62 – 63 oC and within 1 h
at 55oC
Micrococcus pyogenes var. aureus Death within 10 min at 50oC
Streptococcus pyogenes Death within 10 min at 54oC
Mycobacterium tuberculosis var. hominis Death within 15–20 min at 66oC or after
momentary heating at 67oC
Corynebacterium diphtheria Death within 45 minutes at 55oC
Necator americanus Death within 50 minutes at 45oC
Ascaris lumbricoides eggs Death in less than 1 h at temperatures over 50oC
3.5 Operation and Performance Parameters
Commonly used operational parameters include these eight: oxygen uptake,
temperature, moisture content, pH, odor, color, destruction of volatile matter, and
stability. With respect to the first four, the distinction between their status as
environmental factor and that as operational parameter is very difficult to define
because the two overlap in that operational parameters evolve from environmental
factors.

27
3.5.1 Oxygen Uptake
Oxygen uptake is a very useful parameter, because it is a direct manifestation of
oxygen consumption by the microbial population and, hence, of microbial activity.
Microbes use oxygen to obtain the energy to carry on their activities.
A very effective means of monitoring for adequacy of oxygen supply is by way of
the olfactory sense, namely, detection of odors. The emanation of putrefactive odors
from a composting mass is a positive indication of anaerobiosis. The intensity of the
odors is an indication of the extent of anaerobiosis. Attempts to measure odoriferous
constituents (e.g. H2S) have been only indifferently successful. Because of their
anaerobic origin, the malodors soon decrease after aeration is intensified. Although
reliance upon the detection of objectionable odors may seem to be rather primitive,
nevertheless it is a useful supplement in routine monitoring. It does have the
disadvantage of being an “after – the fact” indicator. Therefore, in operations in
which an oxygen probe can be used or the oxygen of input and output airstreams can
be measured, a direct monitoring of oxygen is advisable.
An important operational consideration is that although the input air stream may
be sufficiently great to meet the theoretical microbial oxygen demand and the
discharge air stream may contain some oxygen, localized anaerobic zones may be
present. The zones may be due to inadequate mixing or to short-circuiting of air
through the mass. In practice, the complete prevention or elimination of these zones
would be economically, if not technologically, unfeasible. Fortunately, the complete
elimination is not essential for a nuisance-free operation, provided the number and
size of the zones does not become excessively large.
According to Diaz et al. (1982), four generalizations can be made, despite the
many uncertainties mentioned or implied in the preceding paragraphs. The
generalizations are:

28
1. An oxygen pressure greater than 14 percent of the total indicates that not more
than one-third of the oxygen in the air has been consumed.
2. The optimum oxygen level is 14 to 17 percent.
3. Aerobic composting supposedly ceases if the oxygen concentration drops to 10
percent.
4. If CO2 concentration in the exhaust gas is used as a parameter for oxygen
concentration, then the CO2 in the exhaust gas should be between 3 and 6
percent by volume.
3.5.2 Temperature
Temperature is a very useful parameter because it is a direct indicator of
microbial activity. However, in the application of temperature as an operational
parameter, it must be remembered that in a practical operation, the desired
temperature range should include thermophilic temperatures. The reasons are: (1)
some of the organisms involved in the process have their optimum level in the
thermophilic range; (2) weed seeds and most microbes of pathogen significance
cannot survive exposure to thermophilic temperatures; and (3) unless definite
countermeasures are taken, thermophilic levels will be reached during the active
stage.
In general, any abrupt and unexplained deviation from the normal course of
temperature rise and fall is an indication of an environmental or operational
deficiency that requires attention. An exception to this general rule is the need to
prevent the temperature from exceeding 55 to 60oC (i.e., reaching a level that is
inhibitory to most microbes). Probably the most effective remedial measure is
ventilation.

29
3.5.3 Moisture
The numerical value of the operational parameter, moisture, is the maximum
permissible moisture content. As stated earlier, this value varies from substrate to
substrate. Regardless of substrate, the lowest permissible moisture content for
efficient composting is about 45 percent. Unfavorably low moisture content is a
common problem in compost practice, because conditions in a composting mass are
conducive to evaporation (i.e., water loss). Unless this water is replaced, moisture is
likely to become limiting.
3.5.4 pH
Unless the substrate is unusually acidic, which rarely is the case with Municipal
Solid Waste, pH level has little value as an operational parameter. If the pH level is
lower than 4.5, some buffering may be indicated (e.g., adding lime).
3.5.5 Odor
Odor as an operational parameter received some attention in the discussion of
aeration. Attempts to develop a quantitative standard for odor, based on hydrogen
sulfide concentration, have met with little if any success, because the olfactory nerve
senses H2S concentrations lower than the detection of H2S analytical tests. In waste
treatment practice, all odors are regarded as being objectionable to the public.
3.5.6 Color
Although the color of the composting mass progressively darkness, it is a crude
parameter and at best is roughly qualitative and highly subjective.
30
3.5.7 Destruction of Volatile Solids
In as much as composting is a decomposition process, it is characterized by some
destruction of volatile solids. Complete destruction is neither desirable nor necessary
because the value of the compost product, particularly as a soil conditioner, is
mostly due to its volatile (i.e., organic) solids content. Hence, rate rather than extent
of destruction would be the useful parameter. The problem is in the establishment of
a standard rate. Rates vary with several important factors. The best indicator that is
presently available is to the effect that volatile matter is being destroyed.
3.5.8 Stability
“Stability” is a broad term that may refer to chemical and physical stability
and/or to biological stability. As applied in composting, the composting mass is
judged “stable” when it has reached a state of decomposition at which it can be
stored without giving rise to health or nuisance problems. This excludes the
temporary stability due to dehydration or other condition that inhibits microbial
activity. Despite many claims to the contrary, a satisfactory quantitative method for
determining degree of stability has yet to be developed, at least one that can be used
as a “universally” applicable standard.
The search for a method of determining stability that can be sufficiently
standardized is almost as old as the compost practice. The list of proposed methods
is correspondingly lengthy. It includes final drop in temperature, degree of self-
heating capacity, amount of decomposable and resistant organic matter in the
material, rise in the redox potential, oxygen uptake, growth response of the fungus
Chaetolnium gracillis, and the starch test. Of this array of tests, the final drop in
temperature is the most reliable, because it is a direct consequence of the entire
microbial activity, as well as of the intensity of the activity. The weakness of
temperature decline as a parameter is its time element. Because the decline
represents a trend, it involves a succession of readings taken over a period of days.
The other tests lack the necessary universality. For example, a redox potential that

31
characterizes stability under one set of compost conditions does not necessarily do
so under another set. With certain tests, lack of universality is aggravated by the
difficulty of conducting them (e.g., the Chaetomium test).
Phytoxicity frequently is regarded as being an indication of stability, although it
is true that in the early stages of maturation, composting material often contains a
substance that is inhibitory to plants (phytoxic), and which almost invariably
disappears as maturation progresses. However, the disappearance does not always
coincide with the attainment of the required degree of stability.
3.6 Composting Systems
In general, three types of composting operation systems employed in sludge
stabilization. They include (1) the aerated static pile, (2) the windrow process, and
(3) the mechanical in-vessel systems. Each system varies in operational complexity
and therefore has unique advantages and disadvantages. The final decision about
this system to employ depends on available land area, purchase price
3.6.1 Aerated Static Pile
The aerated static pile system consists of a grid of aeration or exhaust piping over
which a mixture of dewatered sludge and bulking agent is placed as Figure 3.2. In a
typical static pile system, the bulking agent consists of wood chips, which are mixed
with the dewatered sludge by a pug – mill type or rotating – drum mixer or by
movable equipment such as a front – end loader. Material is composted for 21 to 28
days and is typically followed by a curing period of 30 days or longer. Typical pile
heights are about 2 to 2.5 m. A layer of screened compost is often placed on top of
the pile for insulation. Disposable corrugated plastic drainage pipe is commonly
used for air supply and each individual pile is recommended to have an individual
blower for more effective aeration control (Tchobanoglous et al 2003).

32
Figure 3.2 Aerated Static Piles
3.6.2 Windrow
In a windrow system, the mixing and screening operations are similar to those for
the aerated static pile operation. Windrows are constructed from 1 to 2 m high and 2
to 4.5 m at the base. The rows are turned and mixed periodically during the
composting period. Supplemental mechanical aeration is used in some applications.
The composting period is about 21 to 28 days. Under typical operating conditions,
the windrows are turned a minimum of five times while the temperature is
maintained at or above 55oC. In windrow composting, aerobic conditions are
difficult to maintain throughout the cross-sectional area of the windrow. Thus, the
microbial activity within the pile may be aerobic, facultative, anaerobic, or various
combinations thereof, depending on when and how often the pile is turned. Turning
of the windrows is often accompanied by the release of offensive odors. The release
of odors occurs typically when anaerobic conditions develop within the windrow.
Specialized equipment is available to mix the sludge and bulking agent and turn the
composting windrows as Figure 3.3. Some windrow operations are covered or
enclosed, similar to aerated static piles. (Tchobanoglous et al 2003)

33
Figure 3.3 Compost Windrow Systems
3.6.3 In – Vessel Composting Systems
In – vessel composting is accomplished inside an enclosed container or vessel.
Mechanical systems are designed to minimize odors and process time by controlling
environmental conditions such as air flow, temperature, and oxygen concentration.
The advantages of in vessel composting systems are better process and odor control,
faster throughput, lower labor costs, and smaller area requirement. In – vessel
composting systems can be divided into two major categories: plug flow and
dynamic (agitated bed). In plug flow systems, the relationship between particles in
the composting mass stays the same throughout the process, and the system operates
on the basis of a first in, first out principle. In a dynamic system, the composting
material is mechanically mixed during the processing. In vessel systems can be
further categorized based on the geometric shape of the vessels or containers used.
Examples of plug – flow reactors are shown on Figure 3.4, and examples of dynamic
type systems are illustrated on Figure 3.5.

34
Figure 3.4 Plug – Flow in Vessel Composting Reactor
Figure 3.4 Dynamic (Mixed) in Vessel Composting Reactor
35
3.7 Co-Composting with Municipal Solid Wastes
Co-composting of sludge and municipal solid wastes is a possible alternative
where integrated waste disposal facilities are considered. Mixing the sludge with the
organic fraction of municipal solid waste or source separated yard wastes is
beneficial because:
1. Sludge dewatering may not be required,
2. The overall metals content of the composted material will be less than that of
the composted sludge alone.
Liquid treatment plant sludges typically have a solids content ranging from 3 to 8
percent. A 2 to 1 mixture of compostable municipal solid or yard wastes to sludge is
recommended as a minimum. Both static and agitated compost systems have been
tried (Tchobanoglous et al., 1993).

36
CHAPTER FOUR
MATERIAL AND METHOD
4.1 Composting Ingredients
Dewatered sewage sludge were taken from İzmir–Çiğli Waste Water Treatment
Plant from belt – press outlet, semi fermented solid wastes were taken from İzmir –
Uzundere Compost Plant and grass cuttings from university gardens were used in
this study to make a final product as a compost for using in agricultural.
4.1.1 Sewage Sludge
In İzmir – Çiğli Wastewater Treatment Plant, 12000 m3 sludge is produced and
processed per day. After mechanical dewatering process, the amount of sludge
decreases to 600 m3. Annual sludge production is approximately 43800 tons (dry
weight) when provided the sludge contain 20% dry matters.
Due to could inefficient stabilization of sludge by lime as dewatering process in
this plant, in Spring and Summer seasons odor problems occur. As a temporary
solution, a soil layer of 40 – 50 cm is covered over the sludge heap to prevent odor
problems as well as preventing the increasing environmental complaints. Chemical
characterizations of the sewage sludge is shown in Table 4.1
Table 4.1 Characterization of the sewage sludge, (Seyman et all. May, 2005 )
Parameters Values (mg/kg) Parameters Values (mg/kg)
Total-N 38636 B 36
Total-P 5600 Cd 1.5
Fe 123300 Cr 150
Mn 1245 Ni 45
Cu 202 Pb 94
Zn 1312 Mo 4.7
Al 111700 Co 4.3
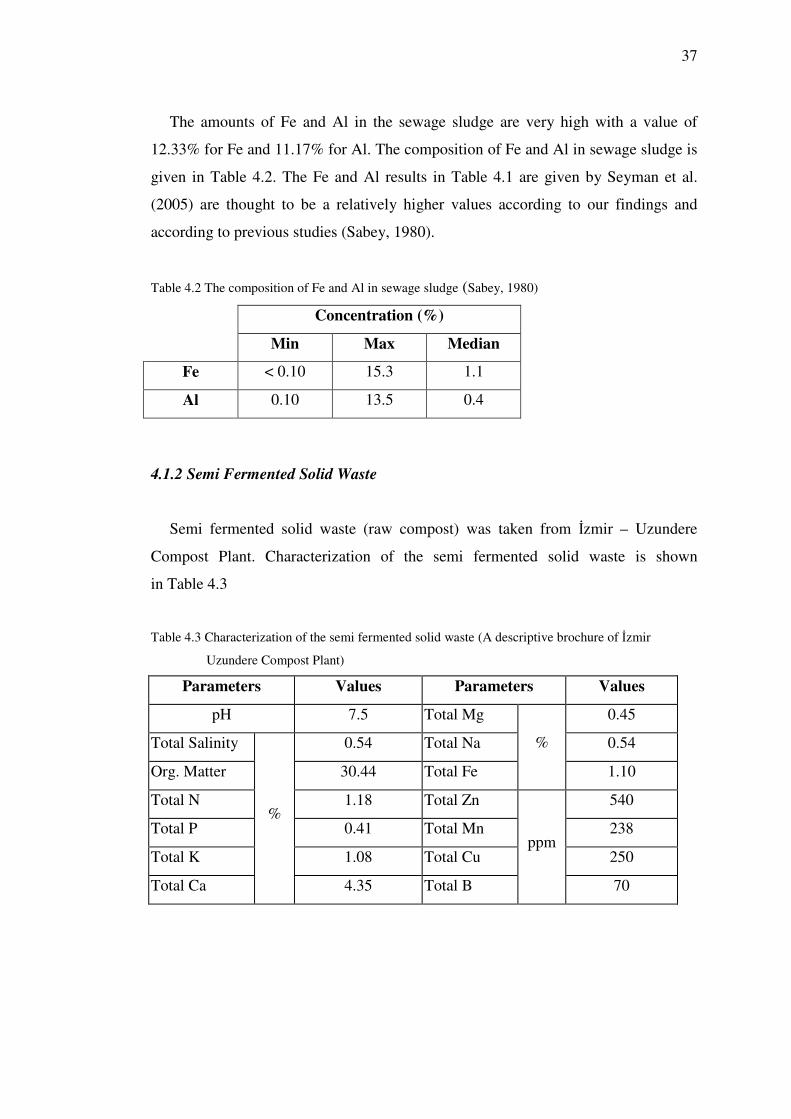
37
The amounts of Fe and Al in the sewage sludge are very high with a value of
12.33% for Fe and 11.17% for Al. The composition of Fe and Al in sewage sludge is
given in Table 4.2. The Fe and Al results in Table 4.1 are given by Seyman et al.
(2005) are thought to be a relatively higher values according to our findings and
according to previous studies (Sabey, 1980).
Table 4.2 The composition of Fe and Al in sewage sludge (Sabey, 1980)
Concentration (%)
Min Max Median
Fe < 0.10 15.3 1.1
Al 0.10 13.5 0.4
4.1.2 Semi Fermented Solid Waste
Semi fermented solid waste (raw compost) was taken from İzmir – Uzundere
Compost Plant. Characterization of the semi fermented solid waste is shown
in Table 4.3
Table 4.3 Characterization of the semi fermented solid waste (A descriptive brochure of İzmir
Uzundere Compost Plant)
Parameters Values Parameters Values
pH 7.5 Total Mg 0.45
Total Salinity 0.54 Total Na 0.54
Org. Matter 30.44 Total Fe
%
1.10
Total N 1.18 Total Zn 540
Total P 0.41 Total Mn 238
Total K 1.08 Total Cu 250
Total Ca
%
4.35 Total B
ppm
70

38
4.1.3 Grass Cuttings
In İzmir City, there is green recreation area of 500 ha. Maintenance of the green
area has been carried out by İzmir City’s Town Hall Directorate of Park and
Gardens. Grasses are cut two times in a month in May, June, July, August and
September and once in the other months. 50 trucks (600 m3) grass are collected after
each cutting process (Seyman, et al, 2005). In this study, the grasses in the university
campus area are harvested for using a waste material to make compost.
4.2 Experimental Research
4.2.1 Composting at the Static Pile (Experiment 1)
In this study, four different piles were constituted. Semi fermented solid waste and
sewage sludge were mixed in different ratios by weights. The static piles were mixed
three times in a week for aeration. Amount of the mixing ratio is shown in Table 4.4
and a picture of the static pile is shown in Figure 4.1.
Table 4.4 Amount of the mixing ratio in the static piles
The Piles Composition of the Solid Waste Amount of Solid
Waste, (kg)
Pile 1 Sewage Sludge
Semi Fermented SW
33.3 %
66.7 %
6
12
Pile 2 Sewage Sludge
Semi Fermented SW
25 %
75%
4
12
Pile 3 Sewage Sludge
Semi Fermented SW
50 %
50 %
7
7
Pile 4 Sewage Sludge 100% 8
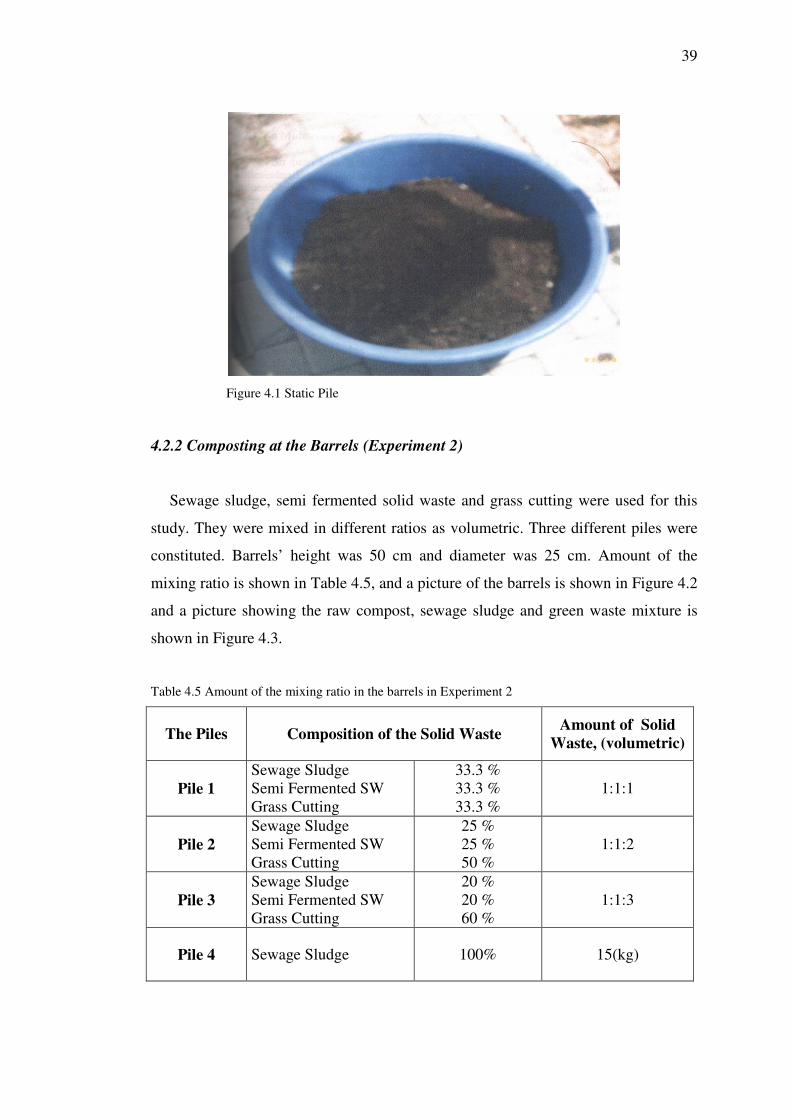
39
Figure 4.1 Static Pile
4.2.2 Composting at the Barrels (Experiment 2)
Sewage sludge, semi fermented solid waste and grass cutting were used for this
study. They were mixed in different ratios as volumetric. Three different piles were
constituted. Barrels’ height was 50 cm and diameter was 25 cm. Amount of the
mixing ratio is shown in Table 4.5, and a picture of the barrels is shown in Figure 4.2
and a picture showing the raw compost, sewage sludge and green waste mixture is
shown in Figure 4.3.
Table 4.5 Amount of the mixing ratio in the barrels in Experiment 2
The Piles Composition of the Solid Waste Amount of Solid
Waste, (volumetric)
Pile 1 Sewage Sludge Semi Fermented SW Grass Cutting
33.3 % 33.3 % 33.3 %
1:1:1
Pile 2 Sewage Sludge Semi Fermented SW Grass Cutting
25 % 25 % 50 %
1:1:2
Pile 3 Sewage Sludge Semi Fermented SW Grass Cutting
20 % 20 % 60 %
1:1:3
Pile 4 Sewage Sludge 100% 15(kg)

40
4.2.3 Composting at the Barrels (Experiment 3)
Four different piles were constituted in this study. Sewage sludge and semi
fermented solid waste were mixed in different ratios in weight. Composition of the
mixing is shown in Table 4.6. A picture of mixed raw compost and sewage sludge is
also shown in Figure 4.4.
Table 4.6 Composition of the mixing in Experiment 3
The Piles Composition of the Solid Waste Amount of Solid
Waste, (kg)
Pile 1 Sewage Sludge
Semi Fermented SW
25 %
75 %
5
15
Pile 2 Sewage Sludge
Semi Fermented SW
33.3 %
67.7 %
7
14
Pile 3 Sewage Sludge
Semi Fermented SW
50 %
50 %
10
10
Pile 4 Sewage Sludge 100 % 15
Figure 4.2 The picture of the barrels

41
Figure 4.3 Picture which is mixing of the semi fermented solid waste, sludge and grass cuttings
Figure 4.4 The picture of mixed semi fermented solid waste and sludge

42
4.3 Experimental Methods
4.3.1 Moisture
Due to difference between vapor pressures of liquid and solid materials, moisture
content is directly related to the total loss of weight a sample is dried at 65oC. (Kacar,
1972). Sample was dried at 65oC because Volatile Solids (VS) must not leave.
4.3.2 Temperature
Temperature was measured periodically by thermometer.
4.3.3 pH
10 gr of dry sample was mixed 100 mL of distilled water and shaked for an hour.
After than it was waited for its settling. The pH value of the previously homogenized
samples were measured and recorded at every sample by using pH meter (Kacar,
1995).
4.3.4 Organic Carbon
Samples were determined by loss ignition. Empirical carbon content was used in
the calculation which is given in equation 4.1.
C(%) = VS(%)/a (4.1)
Where
C = Carbon content,
a = Coefficient of carbon content with respect to the volatile solids (1.72)
(Kacar, 1995).

43
4.3.5 Total Nitrogen
Nitrogen was measured as Total Kjeldahl Nitrogen by wet digestion. (Kacar,
1972)
4.3.6 Primary (P, K), and Secondary Plant Nutrients (Fe, Cu, Zn, Mn), and Heavy
Metals (Cr, Ni)
Samples were prepared by wet digestion procedure. P was analyzed with
Spectrophotometer, K, Fe, Cu, Zn, Mn, Cr, Ni were analyzed by ICP (Kacar, 1972,
and 1995; APHA, 1998).
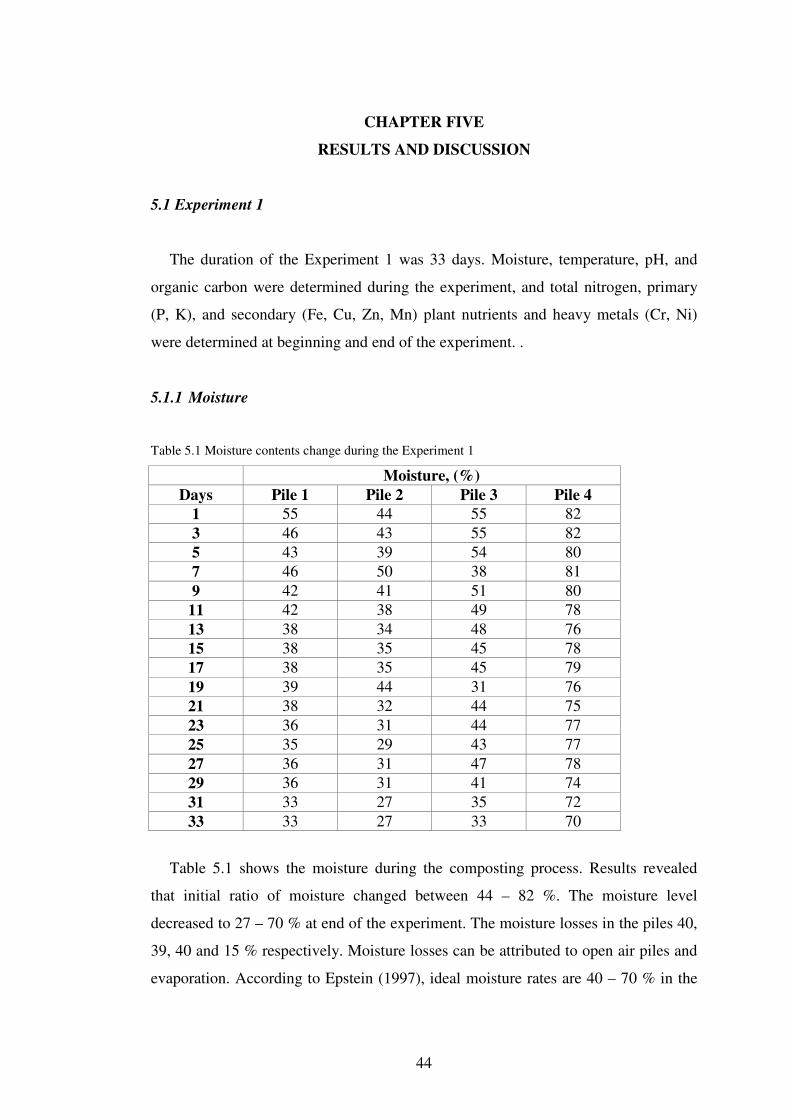
44
CHAPTER FIVE
RESULTS AND DISCUSSION
5.1 Experiment 1
The duration of the Experiment 1 was 33 days. Moisture, temperature, pH, and
organic carbon were determined during the experiment, and total nitrogen, primary
(P, K), and secondary (Fe, Cu, Zn, Mn) plant nutrients and heavy metals (Cr, Ni)
were determined at beginning and end of the experiment. .
5.1.1 Moisture
Table 5.1 Moisture contents change during the Experiment 1
Moisture, (%) Days Pile 1 Pile 2 Pile 3 Pile 4
1 55 44 55 82 3 46 43 55 82 5 43 39 54 80 7 46 50 38 81 9 42 41 51 80
11 42 38 49 78 13 38 34 48 76 15 38 35 45 78 17 38 35 45 79 19 39 44 31 76 21 38 32 44 75 23 36 31 44 77 25 35 29 43 77 27 36 31 47 78 29 36 31 41 74 31 33 27 35 72 33 33 27 33 70
Table 5.1 shows the moisture during the composting process. Results revealed
that initial ratio of moisture changed between 44 – 82 %. The moisture level
decreased to 27 – 70 % at end of the experiment. The moisture losses in the piles 40,
39, 40 and 15 % respectively. Moisture losses can be attributed to open air piles and
evaporation. According to Epstein (1997), ideal moisture rates are 40 – 70 % in the

45
compost materials due to the optimal aerobic digestion occurrence in these ranges.
Because if moisture rate is lower than 30%, bacterial activity is prevented. On the
other hand, when moisture is greater than 65%, the breaking down process slows. If
the above cited informations taken into account, the optimal aerobic digestion
occurred in all Piles except Pile 4 which included only sludge.
5.1.2 Temperature
Table 5.2 Results of the temperature for Experiment 1
Temperature, ( oC) Days Pile 1 Pile 2 Pile 3 Pile 4 Air
1 20 18 19 16 7 3 22 22 21 21 7 5 16 16 16 16 9 7 15 15 15 16 14 9 15 15 15 16 18
11 18 17 17 17 23 13 19 19 19 18 25 15 19 17 17 17 12 17 20 19 19 19 17 19 17 17 18 18 18 21 20 20 20 19 17 23 22 21 23 19 16 25 26 25 26 26 15 27 23 24 22 21 21 29 22 23 20 19 21 31 20 21 21 19 16 33 20 22 20 18 18
Results of the temperature are given in Table 5.2. Temperature plays a major role
in the composting process. Temperature is a major function of composting process
because its impact on the microbiological community is strong. Epstein (1997)
suggests to maintenance the temperature change during composting between 50 -
55oC for ideal fermentation. The initial temperature values changed in the range of
16 – 20oC in the Experiment1. The highest value was 26oC during the composting
process in all Piles except Pile 2 at 25th day. Final temperatures were measured as 20
– 22 – 20 and 18oC respectively. Consequently temperature did not increase
significantly. Despite the fact that it was desired to reach in the range of 50 to 60 oC
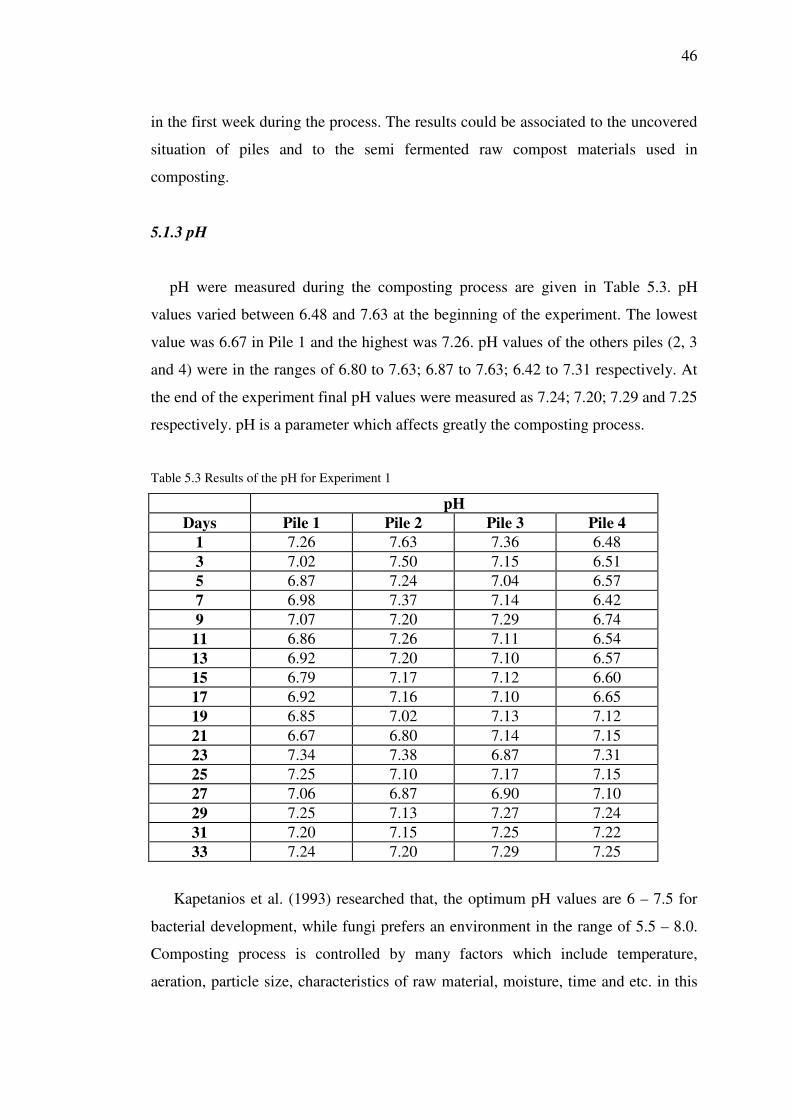
46
in the first week during the process. The results could be associated to the uncovered
situation of piles and to the semi fermented raw compost materials used in
composting.
5.1.3 pH
pH were measured during the composting process are given in Table 5.3. pH
values varied between 6.48 and 7.63 at the beginning of the experiment. The lowest
value was 6.67 in Pile 1 and the highest was 7.26. pH values of the others piles (2, 3
and 4) were in the ranges of 6.80 to 7.63; 6.87 to 7.63; 6.42 to 7.31 respectively. At
the end of the experiment final pH values were measured as 7.24; 7.20; 7.29 and 7.25
respectively. pH is a parameter which affects greatly the composting process.
Table 5.3 Results of the pH for Experiment 1
pH Days Pile 1 Pile 2 Pile 3 Pile 4
1 7.26 7.63 7.36 6.48 3 7.02 7.50 7.15 6.51 5 6.87 7.24 7.04 6.57 7 6.98 7.37 7.14 6.42 9 7.07 7.20 7.29 6.74
11 6.86 7.26 7.11 6.54 13 6.92 7.20 7.10 6.57 15 6.79 7.17 7.12 6.60 17 6.92 7.16 7.10 6.65 19 6.85 7.02 7.13 7.12 21 6.67 6.80 7.14 7.15 23 7.34 7.38 6.87 7.31 25 7.25 7.10 7.17 7.15 27 7.06 6.87 6.90 7.10 29 7.25 7.13 7.27 7.24 31 7.20 7.15 7.25 7.22 33 7.24 7.20 7.29 7.25
Kapetanios et al. (1993) researched that, the optimum pH values are 6 – 7.5 for
bacterial development, while fungi prefers an environment in the range of 5.5 – 8.0.
Composting process is controlled by many factors which include temperature,
aeration, particle size, characteristics of raw material, moisture, time and etc. in this

47
regard, temperature and pH are generally closely associated to the break down of raw
materials. No significant variations in the pH of the piles can be related to the
temperature which did not rise enough as mentioned above.
5.1.4 Organic Carbon, (%)
Results of the Organic Carbon (Org – C) are given in Table 5.4. Initial Organic
Carbon were measured as 32 – 35 – 25 and 20% respectively for four different Piles.
Organic Carbon decreased during the composting process. Final results of Organic
Carbon in the piles were 25, 30, 21 and 16% respectively. The declines in the
Organic Carbon content are a common phenomenon. Hence, the characteristics of the
raw materials and their method fermentation strongly affect the process. as a result,
the degree of decrease indicates a fully aging.
Table 5.4 Results of the Organic Carbon (Org – C) for Experiment 1
Organic Carbon, (%) Days Pile 1 Pile 2 Pile 3 Pile 4
1 32 35 25 20 3 32 35 25 20 5 31 34 24 20 7 30 34 24 18 9 29 33 23 19
11 30 34 24 18 13 30 32 23 18 15 29 33 22 19 17 29 32 23 17 19 28 31 21 18 21 27 30 21 19 23 28 31 22 19 25 26 30 21 18 27 26 29 23 17 29 25 29 24 17 31 26 30 23 15 33 25 30 21 16

48
5.1.5 Total Nitrogen
Results of the nitrogen are shown in Table 5.5. The values changed between 1.2
and 1.1%; 1.4 and 1.3%; 1.4 and 1.3%; 1.5 and 1.6% for piles respectively. It is
possible that the reason of high nitrogen ratios in mixture was due to the high
nitrogen amount of the sewage sludge. Nitrogen variations during the composting are
relates to pH changes. Nitrogen losses as NH3 occur only at higher pHs above 8.0.
On the other hand, if N fractions like NH4+ and NO3
– have been measured, time
changes in N could have been expected.
Table 5.5 Results of the total nitrogen for Experiment 1
Pile 1 Pile 2 Pile 3 Pile 4 Initial Final Initial Final Initial Final Initial Final N (%) 1.2 1.1 1.4 1.3 1.4 1.3 1.5 1.6
5.1.6 C/N Ratio
C/N ratio results are given in Table 5.6. The initial C/N ratios changed between 13
and 27, and final values were between 10 and 23. According to Bishop and Godfrey
(1983), the initial C/N ratio should be in the range of 20:1 and 35:1 by weight.
Results revealed that C/N ratios of Pile 1 and Pile 2 coincided of these values and
Pile 3 is close to the range of 20:1. At C/N ratio lower than 25:1 than ammonia given
off and odor problem occurs. The C/N ratios of Pile 3 and particularly of Pile 4 were
found lower than 20:1, the suggested value which could be related to composition of
sewage sludge.
Table 5.6 C/N ratios for Experiment 1
Pile 1 Pile 2 Pile 3 Pile 4
Initial Final Initial Final Initial Final Initial Final C/N 27 23 25 23 18 16 13 10

49
5.1.7 Primary (P, K), and Secondary Plant Nutrients (Fe, Zn, Mn, Cu), and Heavy
Metals (Ni, Cr)
Results of the analyses are shown in Table 5.7. The initial and final values of
primary, secondary plant nutrients and heavy metals varied between 8467 and 8373
for P; 15524 and 15486 for K; 14143 and 13898 for Fe; 787 and 794 for Zn; 506 and
496 for Mn; 161 and 160 for Cu; 25 and 26 for Ni; 35 and 34 for Cr in Pile 1. In pile
2 these values changed from 4481 to 4488 for P; 16627 to 16742 for K; 13774 to
13548 for Fe; 768 to 786 for Zn; 481 to 465 for Mn; 159 to 161 for Cu; 20 to 24 for
Ni; 38 to 34 for Cr. In the Pile3 these values were between 5090 – 5023 for P; 17854
– 18065 for K; 17254 – 17342 for Fe; 761 – 798 for Zn; 652 – 655 for Mn; 186 – 184
for Cu; 46 – 48 for Ni; 46 – 47 for Cr. In pile 4, these values changed from 5536 to
5499 for P; 19655 to 19641 for K; 19856 to 19964 for Fe; 1125 to 1165 for Zn; 686
to 687 for Mn; 191 to 192 for Cu; 50 to 51 for Ni; 68 to 69 for Cr. The amount of
macro elements, micro nutrients and heavy metals increase from the first Pile to
fourth Pile because of the amount of sludge increase. The above measurements were
the results of total amounts. Therefore, no differences between the initial and final
values could be expected. In spite of measuring the total values, if the extractable or
soluble parts of these elements were analysed, changes would have happened.
Table 5.7 Results of the Primary (P, K), and Secondary Plant Nutrients (Fe, Zn, Mn, Cu), and Heavy
Metals (Ni, Cr) for Experiment 1
Pile 1 Pile 2 Pile 3 Pile 4
Initial Final Initial Final Initial Final Initial Final
P (mg/kg) 8467 8373 4481 4488 5090 5023 5536 5499
K (mg/kg) 15524 15486 16627 16742 17854 18065 19655 19641
Fe (mg/kg) 14143 13898 13774 13548 17254 17342 19856 19964
Zn (mg/kg) 787 794 768 786 761 798 1125 1165
Mn (mg/kg) 506 496 481 465 652 655 686 687
Cu (mg/kg) 161 160 159 161 186 184 191 192
Ni (mg/kg) 25 26 20 24 46 48 50 51
Cr (mg/kg) 35 34 38 34 46 47 68 69

50
When these values are compared with Turkish Regulation of Soil Pollution
Control (in Add II), (Resmi Gazete, 2001), it is seen on Table 5.8, these values are
under this values of regulation.
Table 5.8 Comparing with Turkish Regulation of Solid Waste Control of Experiment 3
mg/kg* Pile 1 Pile 2 Pile 3 Pile 4 Standards
Cr 34 34 47 69 1200
Cu 160 161 184 192 1750
Ni 26 24 48 51 400
Zn 794 786 798 1165 4000
* Dry soil
5.2 Experiment 2
The duration of the Experiment 2 was 25 days. Moisture, temperature, pH, and
organic carbon were determined during the experiment, and nitrogen, primary (N, P,
K), and secondary (Fe, Cu, Zn, Mn) plant nutrients and heavy metals (Cr, Ni) were
determined at beginning and end of the experiment. .
5.2.1 Moisture
Results of the moisture data are shown in Table 5.9. Moisture is one of the
limiting factors in composting process. According to Epstein (1997), at moisture
contents below 40%, the microbial activity diminishes and degradation capacity of
microbial population ceases. At moisture levels over 60%, water that fills the pores
prevent oxygen transfer in the compost mass and as oxygen is depleted the aerobic
conditions can no longer be dominant. Aerobic species and their activities depend on
the oxygen provided during process.

51
Table 5.9 Moisture contents change during the Experiment 2
Moisture; (%) Days Pile 1 Pile 2 Pile 3 Pile 4
1 55 58 60 85 3 53 57 58 85 5 52 56 57 84 7 50 54 56 83 9 44 53 54 83
11 40 52 53 82 13 39 49 50 82 15 36 45 46 84 17 35 44 42 81 19 33 40 40 81 21 32 38 39 80 23 30 35 35 82 25 28 33 31 77
Ratios of moisture are changed between 55 – 85 % initially. As it is seen on Table
5.9, the highest moisture was determined as 85 % in the Pile 4 which contained only
sludge. The moisture ratios decreased to 28 – 77 %. The moisture losses in the piles
were 49, 43, 48 and 9 % respectively. Decreasing of moisture was monitored during
the composting process because of evaporation.
5.2.2 Temperature
Temperature plays a major role in the composting process. At the same time, it is
also a function of the process. Probably the most important aspect of temperature is
its impact on the microbiological community. According to Epstein (1997); for best
results, temperature should be maintained between 50 and 55o C for the first few
days and between 55 and 60o C for the remainder of the active composting period. If
the temperature is allowed to increase beyond 65oC for a significant period of time,
biological activity will be reduced.

52
5.2.2.1 Temperature at Up of the Piles
Table 5.10 Results of the up temperature for Experiment 2
Temperature at Up of the Piles, (oC) Days Pile 1 Pile 2 Pile 3 Pile 4 Air
1 49 49 50 35 17 2 51 51 52 36 20 3 50 51 53 34 21 4 50 52 54 37 21 5 52 52 55 31 22 6 52 52 54 31 23 7 50 50 52 30 22 8 49 51 53 28 21 9 47 48 51 26 20
10 48 49 49 25 22 11 48 48 47 26 23 12 47 47 47 27 22 13 48 45 46 28 22 14 46 45 45 29 22 15 44 44 46 25 19 16 44 44 44 27 22 17 46 45 43 24 22 18 44 43 43 24 24 19 41 41 44 23 25 20 40 40 43 22 24 21 37 38 40 21 24 22 36 36 38 19 25 23 34 36 37 20 26 24 33 34 35 18 26 25 31 33 35 20 27
Results of the temperature which belongs to up of the Piles for Experiment 2 are
given in Table 5.10. Temperature at up of the piles at the beginning was 49oC for
Pile 1, 49oC for Pile 2, 50oC for Pile 3, 35oC for Pile 4. Temperature was observed
over 50oC for six days and the maximum 52oC at the end of the fifth day for Pile 1.
The minimum temperature was measured as 31oC at the end of the study.
Temperature was observed over 50oC for seven days and the maximum 52oC at the
end of the fourth day for Pile 2. The minimum temperature was measured as 33oC
end of the study. The maximum temperature was 55oC for Pile 3. It was measured at
the end of the fifth day. Temperature was observed over 50oC for nine days. The

53
minimum temperature was 35oC measured at the end of the study. Maximum
temperature was observed as 37oC at the end of the fourth day for Pile 4. The
minimum temperature was also measured as 24oC at the end of the study.
The temperatures which were at up of the piles were very high and reached to
thermophilic phase. So, it may be said that the pathogens were inactivate in
thermophilic phase during the composting process.
5.2.2.2 Temperature at Middle of the Piles
Table 5.11 Results of the middle temperature for Experiment 2
Temperature at Middle of the Piles, (oC) Days Pile 1 Pile 2 Pile 3 Pile 4 Air
1 56 55 56 33 17 2 55 54 57 34 20 3 55 54 56 31 21 4 56 55 57 32 21 5 57 56 58 30 22 6 55 54 59 29 23 7 56 54 57 27 22 8 54 55 57 29 21 9 53 54 56 31 20
10 54 54 54 28 22 11 53 54 54 26 23 12 51 53 53 25 22 13 52 53 52 26 22 14 51 52 50 28 22 15 49 51 51 27 19 16 50 51 50 25 22 17 49 52 49 26 22 18 48 49 49 24 24 19 47 47 47 23 25 20 44 47 47 24 24 21 40 45 45 24 24 22 40 45 46 23 25 23 39 44 43 23 26 24 37 42 43 21 26 25 36 40 41 22 27
54
Results of the temperature which belongs to middle of the Piles for Experiment 2
are given in Table 5.11. Temperatures at the middle of the piles at the beginning of
the composting process were 56oC for Pile 1, 55oC for Pile 2, and 56oC for Pile 3,
33oC for Pile 4. Temperature was observed over 50oC for fourteen days and the
maximum 57oC at the end of the fifth day for Pile 1. The minimum temperature was
measured as 36oC end of the Experiment 2. Temperature was generally greater than
50oC during the composting process all piles except Pile 4. Temperature was
observed over 50oC for seventeen days and the maximum 56oC at the end of the fifth
day for Pile 2. The minimum temperature was measured as 40oC at the end of the
study. The maximum temperature was 59oC for Pile 3. It was measured at the end of
the sixth day. Temperature was observed over 50oC for sixteen days. The minimum
temperature was 41oC measured at the end of the study. Maximum temperature was
34oC for Pile 4. The minimum temperature was measured as 21oC in twenty fourth
day. Temperature did not reach to thermophilic phase in Pile 4.
The temperatures at the middle were very high and reached to thermophilic phase.
So, it may be said that the pathogens were inactivate in thermophilic phase during the
composting process.
5.2.3 pH
pH values during the composting process were between 6.80 and 7.10 initially as
it is seen in Table 5.12. The lowest pH value was 6.76 and the highest value was 7.42
in Pile 1. pH values of the other piles were between 7.04 and 7.35; 6.94 and 7.42;
6.95 and 7.64 respectively. At the end of the experiment final pH values were
measured as 7.40; 7.25; 7.42 and 7.45 respectively. pH is parameter which greatly
affects the composting process. Zorpas et al. (2003) reported that, the pH values were
within the optimal range for the development of bacteria 6 – 7.5 and fungi 5.5 – 8.0.
No significant variations in the pH of the piles can be related to the temperature
which did not rise enough as mentioned above.

55
Table 5.12 Results of the pH for Experiment 2
pH Days Pile 1 Pile 2 Pile 3 Pile 4
1 6.80 7.08 7.10 6.95 3 6.76 7.04 7.12 7.16 5 6.83 7.10 7.06 7.15 7 6.98 7.17 6.94 7.32 9 7.11 7.20 7.17 7.34
11 7.19 7.24 7.38 7.21 13 7.38 7.20 7.25 7.26 15 7.41 7.35 7.10 7.64 17 7.36 7.19 7.37 7.42 19 7.38 7.21 7.27 7.49 21 7.42 7.24 7.33 7.48 23 7.39 7.27 7.36 7.41 25 7.40 7.25 7.42 7.45
5.2.4 Organic Carbon; (%)
Results of the Organic Carbon are shown in Table 5.13. Initial Organic Carbon
values were measured as 38 – 40 – 42 – 22% respectively. The amount of Organic
Table 5.13 Results of the organic carbon for Experiment 2
Organic Carbon; (%) Days Pile 1 Pile 2 Pile 3 Pile 4
1 38 40 42 22 3 38 41 41 21 5 37 39 42 21 7 37 39 40 22 9 36 38 41 20
11 37 38 39 20 13 36 39 39 21 15 35 38 38 22 17 36 37 36 21 19 36 37 36 21 21 35 36 34 20 23 34 36 36 20 25 34 35 37 20
Carbon decreased during the experiment. Decreasing of Organic Carbon occurs when
composting process is the progress. Finally, Org – C was 34% in Pile1, 35% in Pile

56
2, 37% in Pile 3 and 20% in Pile 4 respectively. The declines in the Organic Carbon
content are a common phenomenon. Hence, the characteristics of the raw materials
and their method fermentation strongly affect the process. As a result, the degree of
decrease indicates a fully aging.
5.2.5 Total Nitrogen
Results of the nitrogen are given in Table 5.14. It is possible that the reason of
high nitrogen ratios in mixture was due to the high nitrogen amount of the sewage
sludge. The values varied between 1.2 and 1.1%; 1.3 and 1.2%; 1.1 and 1.2%; 1.5
and 1.4% for piles respectively. The total nitrogen is usually affected by the action of
the proteclytic bacteria and by the temperature. At high temperatures the nitrogen is
released to the atmosphere (Wagner et al., 1990). It is obvious, from Piles that the
total nitrogen seemed to decrease during the composting process.
Table 5.14 Results of the nitrogen for Experiment 2
Pile 1 Pile 2 Pile 3 Pile 4 Initial Final Initial Final Initial Final Initial Final N (%) 1.2 1.1 1.3 1.2 1.1 1.2 1.5 1.4
5.2.6 C/N Ratio
C/N ratios are shown in Table 5.15. Bishop and Godfrey (1983) claims that the
initial C/N ratio should be in the range of 20:1 to 35:1 by weight. At lower ratios,
ammonia given off and odor problem occurs. In the case of C/N ratios exceeding
50:1, the composting process slows because of rapid cell growth and depletion of
available N, resulting in reduced cellular growth. As cells die, their stored N
becomes available to living cells.
Table 5.15 C/N ratios for Experiment 2
Pile 1 Pile 2 Pile 3 Pile 4 Initial Final Initial Final Initial Final Initial Final C/N 32 31 31 29 37 31 15 14

57
Initial C/N ratios changed between 15 and 37. Results revealed that C/N ratios of
Pile 1 and Pile 2 were in the range of 20:1 to 35:1 by weight.. It can be said that C/N
ratios were the best for Pile 1 and Pile 2. It may be said that C/N ratios of Pile 3 was
close to the best. Because of it was not higher than C/N:35. Results revealed that the
most important reason of high C/N ratios was that piles were included grass cuttings.
5.2.7 Primary (P, K), and Secondary Plant Nutrients (Fe, Zn, Mn, Cu), and Heavy Metals (Ni, Cr)
Results of the analyses are given in Table 5.16. The initial and final values of
primary, and secondary plant nutrients and heavy metals varied between 8301 and
8442 for P; 14524 and 14652 for K; 10005 and 10093 for Fe; 811 and 816 for Zn;
270 and 286 for Mn; 176 and 187 for Cu; 30 and 29 for Ni; 31 and 29 for Cr in Pile
1. In pile 2, these values changed from 9535 to 9601 for P; 17080 to 19064 for K;
11052 to 11024 for Fe; 746 to 761 for Zn; 275 to 285 for Mn; 150 to 149 for Cu; 29
to 31 for Ni; 23 to 23 for Cr. In the Pile3 these values were between 9316 – 9461 for
P; 16627– 16975 for K; 11424 – 10242 for Fe; 802 – 805 for Zn; 332 – 361 for Mn;
164 – 165 for Cu; 26 – 27 for Ni; 35 – 34 for Cr. In pile 4, these values changed from
5643 to 5716 for P; 16548 to 17120 for K; 22103 to 22212 for Fe; 1216 to 1224 for
Zn; 527 to 537 for Mn; 201 to 203 for Cu; 49 to 52 for Ni; 84 to 87 for Cr. The
amount of macro elements, micro nutrients and heavy metals increase from the first
Pile to fourth Pile because of the amount of sludge increase. The above
measurements were the results of total amounts. Therefore, no differences between
the initial and final values could be expected. In spite of measuring the total values, if
the extractable or soluble parts of these elements were analysed, changes would have
happened.

58
Table 5.16 Results of Primary (P, K), Secondary Plant Nutrients (Fe, Zn, Mn, Cu), Heavy Metals
(Ni, Cr) for Experiment 2
Pile 1 Pile 2 Pile 3 Pile 4
Initial Final Final Initial Initial Final Initial Final
P (mg/kg) 8301 8442 9535 9601 9316 9461 5643 5716
K (mg/kg) 14524 14652 17080 19064 16627 16975 16548 17120
Fe (mg/kg) 10005 10093 11054 11024 11424 10242 22103 22212
Zn (mg/kg) 811 816 746 761 802 805 1216 1224
Mn (mg/kg) 270 286 275 285 332 361 527 537
Cu (mg/kg) 176 187 150 149 164 165 201 203
Ni (mg/kg) 30 29 29 31 26 27 49 52
Cr (mg/kg) 31 29 23 23 35 34 84 87
When these values are compared with Turkish Regulation of Soil Pollution
Control (Add II), (Resmi Gazete, 2001), it is seen on Table 5.17, these values are
under this values of regulation.
Table 5.17 Comparing with Turkish Regulation of Solid Waste Control of Experiment 3
mg/kg* Pile 1 Pile 2 Pile 3 Pile 4 Standards
Cr 29 23 34 87 1200
Cu 187 149 165 203 1750
Ni 29 31 27 52 400
Zn 816 761 805 1224 4000
* Dry Soil

59
5. 3 Experiment 3
The duration of the Experiment 3 was 25 days. Moisture, temperature, pH, and
organic carbon were determined during the experiment, and nitrogen, primary (P, K),
and secondary (Fe, Cu, Zn, Mn) plant nutrients and heavy metals (Cr, Ni) were
determined at beginning and end of the experiment.
5.3.1 Moisture
Results of the moisture during experiment 3 are shown in Table 5.18. Moisture
datas were between 42 and 85 % initially as it is seen on Table 5.16. The moisture
level decreased to 23 – 77% at the end of composting process. It is defined that the
moisture ratios loss in the piles 45 %, 45 %, 49 % and 9 % respectively. The reasons
of the moisture loss are open – air pile and evaporation. Epstein (1997) claims that
ideal moisture rates are 40 – 70 % in the compost materials due to the optimal
aerobic digestion occurrence in these ranges. Because if moisture rate is lower than
30%, bacterial activity is prevented. On the other hand, when moisture is greater than
65%, the breaking down process slows. If the above cited informations taken into
account, the optimal aerobic digestion occurred in all Piles except Pile 4 which
included only sludge.
Table 5.18 Results of the moisture for Experiment 3
Moisture, (%) Days Pile 1 Pile 2 Pile 3 Pile 4
1 42 51 68 85 3 40 49 67 85 5 39 47 65 84 7 37 46 64 83 9 36 45 61 83
11 36 43 57 82 13 34 42 54 82 15 33 40 51 84 17 31 38 48 81 19 30 35 45 81 21 27 33 42 80 23 27 30 37 82 25 23 28 35 77

60
5.3.2 Temperature
Temperature plays a major role in the composting process. At the same time, it is
also a function of the process. According to Epstein (1997), for best results,
temperature should be maintained between 50 and 55o C for the first few days and
between 55 and 60o C for the remainder of the active composting period. If the
temperature is allowed to increase beyond 65o C for a significant period of time,
biological activity will be reduced.
5.3.2.1 Temperature at Up of the Piles
Results of the temperature at up of the piles are shown in Table 5.19.
Temperatures at the up of the piles at the beginning were 43oC, 42oC, 42oC, and 35oC
respectively. Temperature was observed the maximum 47oC at the end of the 4th day
for Pile 1. The minimum temperature was measured as 29oC for Pile 1 at the end of
the Experiment 3. Temperature was observed the maximum 46oC at the end of the 4th
day for Pile 2. In Pile 3, the minimum temperature was recorded as 28oC at the end
of the composting process. Temperature was observed the maximum 46oC at the end
of the 6th day. The minimum temperature was measured as 28oC at the end of the
composting process. Temperature was recorded the maximum 37oC at the end of the
4th day for Pile 4. The minimum temperature was measured as 24oC at the end of the
Experiment 3. The temperatures which were at up of the piles reached to mesophilic
phase.

61
Table 5.19 Results of the temperature at up of the piles for Experiment 3
Temperature at Up of The Piles, (oC) Days Pile 1 Pile 2 Pile 3 Pile 4 Air
1 43 42 42 35 17 2 45 44 44 36 20 3 44 44 43 34 21 4 47 46 45 37 21 5 46 45 45 31 22 6 46 45 46 31 23 7 45 43 44 30 22 8 45 44 45 28 21 9 44 42 43 26 20
10 45 44 45 25 22 11 44 43 43 26 23 12 43 42 43 27 22 13 39 40 40 28 22 14 39 41 41 29 22 15 37 40 37 25 19 16 39 40 38 27 22 17 38 37 36 24 22 18 37 37 36 24 24 19 35 35 34 23 25 20 35 34 34 22 24 21 33 32 33 21 24 22 32 32 32 19 25 23 31 31 30 20 26 24 30 30 30 18 26 25 29 28 28 20 27
5.3.2.2 Temperature at Middle of the Piles
Results of the temperature at middle of the piles are shown in Table 5.20. The
temperatures at middle of the piles at the beginning were 49oC for Pile1, 48oC for
Pile 2, 47oC for Pile 3, and 33oC for Pile 4. Temperature was observed over 50oC for
eight days and the maximum 54oC at the end of the sixth day for Pile 1. The
minimum temperature was measured as 39oC at the end of the composting process.
Temperature was observed over 50oC for eleven days and the maximum 54oC at the
end of the 7th day for Pile 2. The minimum temperature was measured as 38oC at the
end of the Experiment 3. The maximum temperature was 52oC for Pile 3.
Temperature was observed over 50oC for five days. The minimum temperature

62
which was 37oC measured at the end of the composting process. Maximum
temperature was 34oC for Pile 4. The minimum temperature was measured as 21oC
in 24th day. Temperature did not reach to thermophilic phase. The temperatures
which were at middle of the piles reached to mesophilic phase.
Table 5.20 Results of the temperature at middle of the piles for Experiment 3
Temperature at Middle of The Piles, (oC) Days Pile 1 Pile 2 Pile 3 Pile 4 Air
1 49 48 47 33 17 2 51 47 48 34 20 3 50 49 48 31 21 4 52 51 50 32 21 5 51 51 52 30 22 6 53 52 52 29 23 7 51 54 51 27 22 8 50 54 50 29 21 9 50 53 49 31 20
10 48 54 49 28 22 11 49 52 48 26 23 12 48 50 47 25 22 13 47 51 47 26 22 14 47 52 47 28 22 15 47 49 45 27 19 16 48 49 46 25 22 17 45 47 46 26 22 18 46 48 45 24 24 19 45 46 45 23 25 20 44 44 45 24 24 21 43 44 43 24 24 22 44 41 43 23 25 23 43 41 41 23 26 24 40 38 39 21 26 25 39 38 37 22 27
5.3.3 pH
Initial pH values were between 6.95 and 7.37 which are seen on the Table 5.21.
The lowest pH value was 7.12 in Pile 1 and the highest value was 7.42. pH values of
the other piles were between 7.18 and 7.50; 7.20 and 7.44; 6.95 and 7.64
respectively. At the end of the experiment, final pH values were measured as 7.14;

63
7.25; 7.41 and 7.45 respectively. Kapetanios et al. (1993) state that, the optimum pH
values are 6 – 7.5 for bacterial development, while fungi prefer an environment in
the range of 5.5 – 8.0. Composting process is controlled by many factors which
include temperature, aeration, particle size, characteristics of raw material, moisture,
time and etc. In this regard, temperature and pH are generally closely associated to
the break down of raw materials. No significant variations in the pH of the piles can
be related to the temperature which did not rise enough as mentioned above.
Table 5.21 Results of the pH for Experiment 3
pH Days Pile 1 Pile 2 Pile 3 Pile 4
1 7.32 7.37 7.27 6.95 3 7.29 7.40 7.29 7.16 5 7.42 7.44 7.20 7.15 7 7.41 7.42 7.25 7.32 9 7.37 7.39 7.33 7.34
11 7.28 7.50 7.35 7.21 13 7.31 7.29 7.24 7.26 15 7.25 7.18 7.30 7.64 17 7.12 7.19 7.41 7.42 19 7.18 7.25 7.44 7.49 21 7.21 7.27 7.33 7.48 23 7.16 7.21 7.37 7.41 25 7.14 7.25 7.41 7.45
5.3.4 Organic Carbon; (%)
Results of the organic carbon are shown in Table 5.22. Initial Organic Carbon values
were measured 35% – 33% – 27% – 22% respectively. The amount of Organic
Carbon decreased during the study. Decreasing of Organic Carbon occurs when
composting process is in the progress. Finally, Org – C was 30% in Pile1, 28% in
Pile 2, 24% in Pile 3 and 20% in Pile 4 respectively. The decreasing in the Organic
Carbon content is a common phenomenon. Hence, the characteristics of the raw
materials and their method fermentation strongly affect the process. as a result, the
degree of decrease indicates a fully aging.

64
Table 5.22 Results of the organic matter for Experiment 3
Organic Carbon; (%) Days Pile 1 Pile 2 Pile 3 Pile 4
1 35 33 27 22 3 35 32 27 21 5 34 33 26 21 7 34 32 25 22 9 34 31 25 20
11 33 31 26 20 13 32 30 24 21 15 31 30 25 22 17 31 29 26 21 19 30 28 24 21 21 31 29 23 20 23 30 29 25 20 25 30 28 24 20
5.3.5 Total Nitrogen
Results of the Nitrogen are given in Table 5.23. It is possible that the reason of
high nitrogen ratios in mixture was due to the high nitrogen amount of the sewage
sludge. Wagner et al. (1990) claims that the total nitrogen is usually affected by the
action of the proteclytic bacteria and by the temperature. At high temperatures the
nitrogen is released to the atmosphere It is obvious, from Piles, that the total nitrogen
seemed to decreased during the composting process.
Table 5.23 Results of the Nitrogen for Experiment 3
Pile 1 Pile 2 Pile 3 Pile 4 Initial Final Initial Final Initial Final Initial Final N (%) 1.2 1.1 1.4 1.3 1.4 1.2 1.5 1.4

65
5.3.6 C/N Ratio
Table 5.24 C/N ratios for Experiment 3
Pile 1 Pile 2 Pile 3 Pile 4 Initial Final Initial Final Initial Final Initial Final C/N 29 27 24 22 19 20 15 14
C/N ratios are shown in Table 5.24. C/N ratios were changed between 15 and 29
initially. The initial C/N ratio should be in the range of 20:1 and 35:1 by weight
(Bishop and Godfrey, 1983). Results revealed that C/N ratios of Pile 1 and Pile 2
coincided of these values and Pile 3 is close to the range of 20:1. At C/N ratio lower
than 25:1 than ammonia given off and odor problem occurs. The C/N ratios of Pile 3
and particularly of Pile 4 were found lower than 20:1, the suggested value which
could be related to composition of sewage sludge. .
5.3.7 Primary (P, K), Secondary Plant Nutrients (Fe, Zn, Mn, Cu), Heavy
Metals (Ni, Cr)
Results of the analyses are shown in Table 5.25 The initial and final values of
primary, secondary plant nutrients and heavy metals varied between 3580 and 3700
for P; 13546 and 13648 for K; 15943 and 15802 for Fe; 888 and 978 for Zn; 350 and
370 for Mn; 148 and 160 for Cu; 30 and 30 for Ni; 39 and 46 for Cr in Pile 1. In pile
2 these values changed from 5088 to 5120 for P; 15421 to 16024 for K; 15548 to
15154 for Fe; 859 to 888 for Zn; 421 to 426 for Mn; 163 to 172 for Cu; 34 to 37 for
Ni; 46 to 48 for Cr. In the Pile3 these values were between 5463 – 5501 for P; 14651
– 14985 for K; 18112 – 17958 for Fe; 966 – 1000 for Zn; 446 – 416 for Mn; 196 –
193 for Cu; 42 – 44 for Ni; 68 – 70 for Cr. In pile 4, these values changed from 5643
to 5716 for P; 16548 to 17120 for K; 22103 to 22212 for Fe; 1216 to 1224 for Zn;
527 to 537 for Mn; 201 to 203 for Cu; 49 to 52 for Ni; 84 to 87 for Cr. The amount
of primary and secondary plant nutrients and heavy metals increase from the first
Pile to fourth Pile because of the amount of sludge increase. The above
measurements were the results of total amounts. Therefore, no differences between
the initial and final values could be expected. In spite of measuring the total values, if

66
the extractable or soluble parts of these elements were analysed, changes would have
happened.
Table 5.25 Results of Primary (P, K), Secondary Plant Nutrients (Fe, Zn, Mn, Cu), Heavy Metals
(Ni, Cr) for Experiment 3
Pile 1 Pile 2 Pile 3 Pile 4
Initial Final Initial Final Initial Final Initial Final
P (mg/kg) 3580 3700 5088 5120 5463 5501 5643 5716
K (mg/kg) 13546 13648 15421 16024 14651 14985 16548 17120
Fe (mg/kg) 15943 15802 15548 15154 18112 17958 22103 22212
Zn (mg/kg) 888 978 859 888 966 1000 1216 1224
Mn (mg/kg) 350 370 421 426 446 416 527 537
Cu (mg/kg) 148 160 163 172 196 193 201 203
Ni (mg/kg) 30 30 34 37 42 44 49 52
Cr (mg/kg) 39 46 46 48 68 70 84 87
When these values were compared with Turkish Regulation of Soil Pollution
Control (Add II), (Resmi Gazete, 2001), as it is seen on Table 5.26 these values were
under this values of regulation.
Table 5.26 Comparing with Turkish Regulation of Solid Waste Control of Experiment 3
mg/kg* Pile 1 Pile 2 Pile 3 Pile 4 Standards
Cr 46 48 70 87 1200
Cu 160 172 193 203 1750
Ni 30 37 44 52 400
Zn 978 888 1000 1224 4000
* Dry soil

67
CHAPTER SIX
CONCLUSION
The most important technology which can make sewage sludge increase in value
is composting. The compost which is produced by this method was evaluated as
natural fertilizer for agricultural using. It has been committed three searches which
examine usability the treatment sludge composted then implemented into the
agricultural land. Three experiments were made at this scope. In the 1st experiment;
sewage sludge which was taken from İzmir – Çigli Wastewater Treatment Plant and
semi fermented solid waste which was taken from İzmir Uzundere Compost Plant
were used to compost as method of the static pile. In the 2nd Experiment; sewage
sludge, raw compost, and green waste from university gardens were used to compost
in the barrels which volume of 70 L. Upper surfaces of the barrels was open. In the
3rd experiment; sewage sludge and semi fermented solid wastes were used to
compost in the barrels.
In the 1st experiment, increasing of the temperature occurred slowly in the piles.
The highest temperature was 26oC during the experiment. Since thermophilic phase
did not occur, the Experiment 1 was not successful especially for removal of
pathogenic microorganisms. Initial ratio of moisture was fluctuated in 44 – 82 %. pH
values were fluctuated between 6.48 and 7.63. No significant variations in the pH of
the piles can be related to the temperature which did not rise enough as mentioned
above. Initial Org – C values were measured 32 – 35 – 25 – 20% respectively. The
amount of the Organic Carbon values decreased during the experiment 1. The initial
C/N ratios changed between 13 and 27. Results revealed that C/N ratios of Pile 1 and
Pile 2 were in the range of 20:1 and 35:1. Primary and secondary plant nutrients and
heavy metals increase from the first Pile to fourth Pile because of the amount of
sludge increase.
In the 2nd Experiment; temperature reached to thermophilic phase in the barrels
which included sewage sludge, semi fermented solid waste, and grass cutting in

68
different mixing. It can be concluded that reducing pathogens was realized successful
during thermophilic phase. The most important reason of using grass cutting was that
value of organic matter increased. Carbon and nitrogen ratio was ideal for
composting. Final products matured to use of agricultural purpose according to result
of the analyses. Values of heavy metals were low level. Results revealed that
Experiment 2 was completed successfully.
In the 3rd experiment; it can be concluded that temperature reached to
thermophilic phase in the barrels which included sewage sludge and semi fermented
solid waste in different mixing. Final products matured to use of agricultural purpose
according to result of the analyses. Values of heavy metals were found low level.
Results revealed that Experiment 3 was completed successfully. But Pile 4 did not
mature. It contained only sludge.
In the result of the studies; it is thought that composting in the barrels has more
advantage than composting in the static piles. It can be said that advantages of the
composting in the barrels are that increasing temperature to thermophilic phase. Odor
problems did not occur.
Moisture, organic matter, temperature, C/N ratios, pH parameters of composting
were determined. Primary, (P, K), micro nutrients and secondary plant nutrients (Fe,
Cu, Zn, Mn), heavy metals like Cr, Ni contents were also measured to investigate
being able to use agricultural purpose of final product.
Results revealed that the method used in Experiment 1 did not end with the
expected compost product. However, Experiment 2 and Experiment 3 resulted with a
better compost while Experiment 2 being the best in this respect. Effect grass
cuttings used in Experiment 2 on composting was positive.

69
CHAPTER SEVEN
RECOMMENDATION
The present experiments are just the introduction of a more complicated
experiment in the composting organic material. Results can be summarized as
follows and recommended further researches:
• Grass cuttings had positive effect on composting process.
• Sludge composting with bulking agents which are wood, grass, wood
shaving, domestic wastes and waste paper which contain high organic carbon
can be conducted for better handling alternatives.
• N fractions like NH4+ and NO3
– have been measured instead of total nitrogen;
N variation with time could be expected.
• In spite of measuring of the total amounts of metals, if the extractable or
soluble parts of these elements which were primary (P, K), and secondary
plant nutrients (Fe, Zn, Mn, Cu), and heavy metals (Ni, Cr), were analysed,
changes would have happened.

70
REFERENCES
Amir, S. Hafidi M., Merlina, G., & Revel, C., J. (2004). Sequential extraction of
heavy metals during composting of sewage sludge. Chemosphere, 59:801-810.
Anderson, M. S. (1956). Compost as a means of garbage disposal. The soil and crop
sci. soc. of Florida proc. 16:134-144.
APHA, Eaton A. D., Clesceri, L. S., & Greenberg, A. E. (1998). Standard methods
for the examination of water and wastewater, (20th ed.). Washington, DC: APHA
Biowaste, (n.d.), Retrieved August 20, 2005, from
www.strategy.gov.uk/downloads/su/waste/downloads/ah.pdf
Bishop, P. L., & Godfrey, C. (1983). Nitrogen transformations during sludge
composting. BioCycle, 24(4): 34 – 39.
Diaz, L. F.; Savage, G. M., & Golueke, G. M. (1982) Final processing, chap. 11. In
resource recovery from municipal solids wastes. Boca Raton, FL. CRC Press.
Elmacı, L. Ö., Seçer, M., & Ceylan, Ş., (2003). Tıbbi aromatik bitki işletmeleri katı
atıklarının içerik yönünden tanımlanmaları. Ulusal katı atık kongresi, İzmir,1: 9–
15.
Epstein, E. (1997). The science of composting. Lancaster, Basel: Technomic pub. inc.
Finstein, M. S., & Morris, M. L.. (1975). Microbiology of solid waste composting.
Advances in applied microbiology. 19:113-149.
Gray, K.R., & K. Sherman. (1969). Accelerated composting of organic wastes.
Chem. eng. 20(3):64-74.

71
Gotaas, H. B. (1956). Composting – sanitary disposal and reclamation of organic
wastes. Genova, Switzerland: World Health Organization.
He, X. T., Traina, S. J., & Logan, T., (1992). Chemical properties of municipal solid
waste composts. Journal of environmental quality, 21, 318 – 329.
Kacar, B. (1972). Bitki ve toprağın kimyasal analizleri II. Ankara. AÜZF yayınları:
453 Uygulama kılavuzu No:155.
Kacar, B. (1995). Bitki ve toprağın kimyasal analizleri III. Bursa. Toprak analizleri
Uludağ Üniversitesi Ziraat Fak. Güçlendirme Vakfı.
Kapetanios, E.G., Loizidou, M., & Valkanas, G., (1993). Compost production from
Greek domestic refuse. Bioresource technology 43, 13-16.
Kopp, J., & Dichtl, N., (2002). Characterisation. In Spinosa, L., & Vesilind, P. A.,
(Ed.). Sludge into biosolids processing, disposal and utilization (2nd Ed.)(19–39).
USA: IWA pub.
Knuth, D. T. (1970). Nitrogen cycle ecology of solid waste composting. Develop.
Ind. Microbiol. 11:387 – 395.
Manios, T., (2003). The composting potential of different organic solid waste:
experience from the Island of Crete. Environment international, 2003, 1-11.
Manios, T. & Stentiford, I., E., (2003). Sanitary aspect of using partially treated
leachate as a water source in green waste composting. Waste management. 24:107-
110.
Nakasaki, K., Yaguchi, H., Sasaki, Y., & Kubota, H., (1993). Effects of pH control
on composting of garbage. Waste management and research. 11, 117–125.

72
Sabey, B. R., (1980). The use of sludge as a fertilizer. In M. W. M. Bewick, (Ed.).
Handbook of organic waste conservation (72 – 107). New York. Van Nostrand
Reinhold company.
Seyman, N., Eltem, R., & İmamoğlu, Ö., (2005). İzmir Çiğli arıtma tesis çamurunun
aerobik stabilizasyonunda dolgu malzemesi seçenekleri. I. Ulusal arıtma
çamurları sempozyumu, İzmir. 1,171–180.
Spinosa, L. (2005). EU developments in sludge regulation and characterization. I.
Ulusal arıtma çamurları sempozyumu, İzmir. 1: 11–26
Stevenson, F. J. (1991). Organic Matter – Micronutrient Reactions in Soil. In J. J.
Mortvedt et al. (ed.). Micronutrients in Agriculture. (2nd ed.) (145-186). Am.
Madison, WI: Soil sci. soc..
Tchobanoglous, G., Theisen, H., & Vigil. S. (1993). Integrated solid waste
management. New York: Mc Graw – Hill,
Tchobanoglous, G., Burton, F. L., & Stensel, H. D., (2003). Wastewater engineering:
treatment and reuse. NY: Metcalf & Eddy, inc.
Teller, M., Püschel, M., & Wittschen, F (1994). Niedersachsisches Umwelt-
Ministerium; Landesamt für Umwelt und natur Mecklenburg. Vorpommerns,2:98.
Toprak Kirliliğinin Kontrolü Yönetmeliği (2001). 24609 Sayılı Resmi Gazete.
Tunç, S. M., & Ünlü, A. (2005). Evsel atıksu arıtma tesisi çamurlarının ağır metal
bakımından tarımda kullanılabilirliğinin araştırılması. 1. Ulusal arıtma çamurları
sempozyumu, AÇS, İzmir. 1, 365–374.
Vesilind, P. A., Peirce, J. J., & Weiner, R. F., (1990). Environmental pollution and
control. Boston: Butterworth – Heinemann.
73
Waksman, S.A. (1938). Humus. Baltimore, MD: Williams and Wilkins Co..
Wagner, D. J., Bacon, G. D., & Knocke, W. R., Switzenbaum, M. S., (1990).
Changes and variability in concentration of heavy metals in sewage sludge during
composting. Environmental Technology 11, 949 – 960.
Wiley, J. S. & G. W. Pierce. (1955). A preliminary study of high rate composting.
Proc. am. soc. civil eng. Paper no: 846. 81:1–28.
Zorpas, A. A., Arapoglou, D. & Panagiotis, K. (2002), Waste paper and clinoptilolite
as a bulking material with dewatered anaerobically stabilized primary sewage
sludge (DASPSS) for compost production. Waste Management. 23:27 – 35.

74
APPENDIX I
GRAPHICS
Moisture Experiment 1
0
10
20
30
40
50
60
70
80
90
1 3 5 7 9 11 13 15 17 19 21 23 25 27 29 31 33
Days
Moi
stu
re;
(%)
Pile 1 Pile 2 Pile 3 Pile 4
Temperature Experiment 1
0
5
10
15
20
25
30
1 3 5 7 9 11 13 15 17 19 21 23 25 27 29 31 33
Days
Tem
per
atu
re,(o C
)
Pile 1 Pile 2 Pile 3 Pile 4 Air

75
pH Experiment 1
5,8
6
6,2
6,4
6,6
6,8
7
7,2
7,4
7,6
7,8
1 3 5 7 9 11 13 15 17 19 21 23 25 27 29 31 33
Days
pH
Pile 1 Pile 2 Pile 3 Pile 4
Organic Carbon Experiment 1
0
5
10
15
20
25
30
35
40
1 3 5 7 9 11 13 15 17 19 21 23 25 27 29 31 33
Days
Org
anic
Car
bon
, (%
)
Pile 1 Pile 2 Pile 3 Pile 4

76
Moisture Experiment 2
0
10
20
30
40
50
60
70
80
90
1 3 5 7 9 11 13 15 17 19 21 23 25
Days
Moi
stu
re;
(%)
Pile 1 Pile 2 Pile 3 Pile 4
Temperature at Up of the Piles Experiment 2
0
10
20
30
40
50
60
1 3 5 7 9 11 13 15 17 19 21 23 25
Days
Tem
per
atu
re;
( o C)
Pile 1 Pile 2 Pile 3 Pile 4 Air
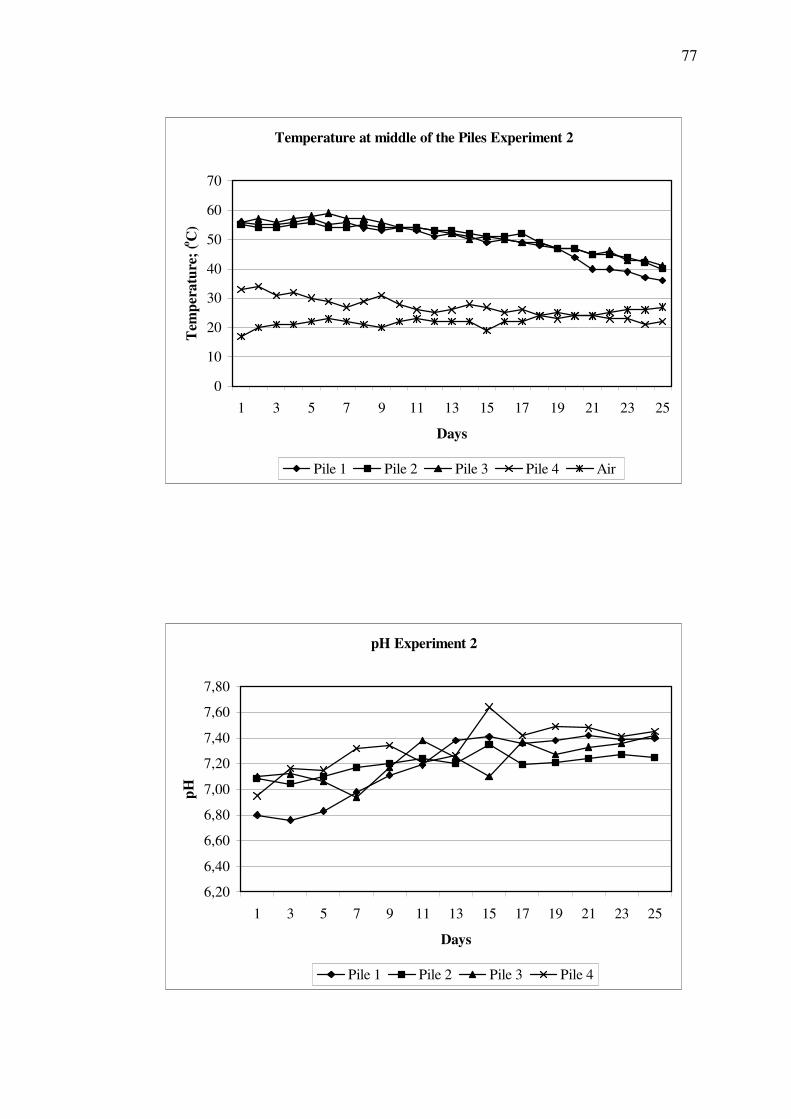
77
Temperature at middle of the Piles Experiment 2
0
10
20
30
40
50
60
70
1 3 5 7 9 11 13 15 17 19 21 23 25
Days
Tem
per
atu
re;
(o C)
Pile 1 Pile 2 Pile 3 Pile 4 Air
pH Experiment 2
6,20
6,40
6,60
6,80
7,00
7,20
7,40
7,60
7,80
1 3 5 7 9 11 13 15 17 19 21 23 25
Days
pH
Pile 1 Pile 2 Pile 3 Pile 4

78
Organic Carbon Experiment 2
0
5
10
15
20
25
30
35
40
45
1 3 5 7 9 11 13 15 17 19 21 23 25
Days
Org
anic
Car
bon
; (%
)
Pile 1 Pile 2 Pile 3 Pile 4
Moisture Experiment 3
0
10
20
30
40
50
60
70
80
90
1 3 5 7 9 11 13 15 17 19 21 23 25
Days
Moi
stur
e; (
%)
Pile 1 Pile 2 Pile 3 Pile 4
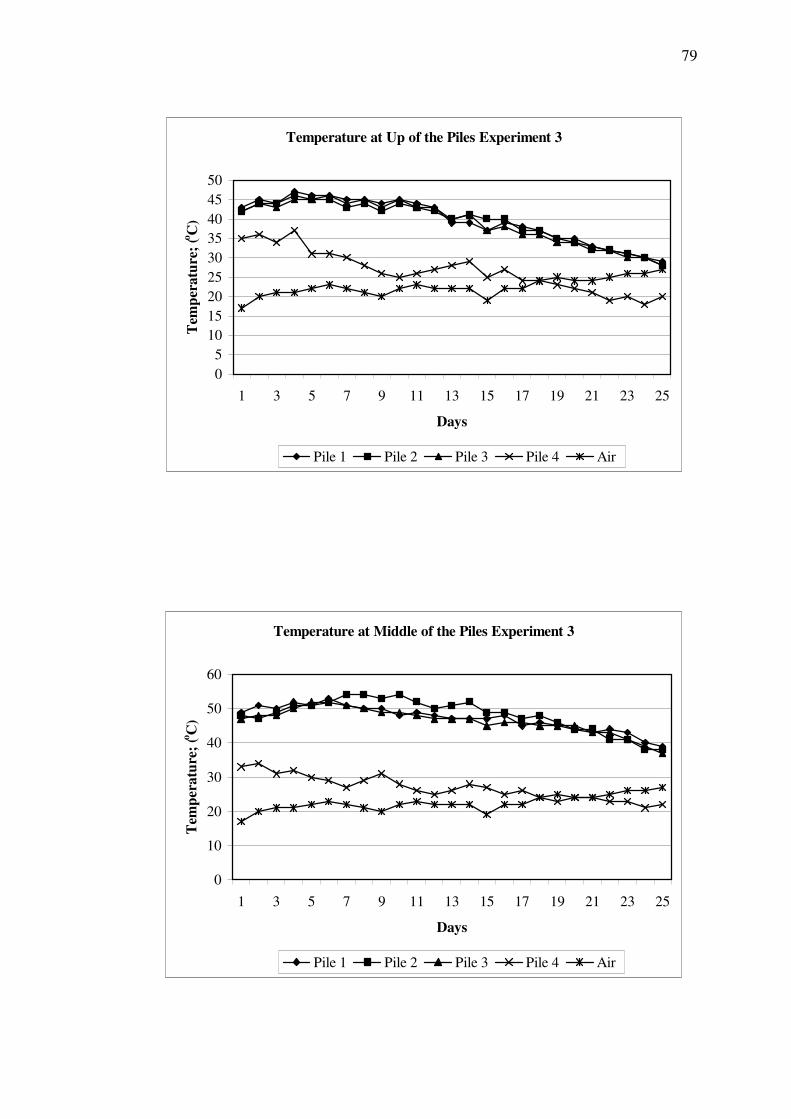
79
Temperature at Up of the Piles Experiment 3
0
5
1015
20
25
30
3540
45
50
1 3 5 7 9 11 13 15 17 19 21 23 25
Days
Tem
per
atu
re;
(o C)
Pile 1 Pile 2 Pile 3 Pile 4 Air
Temperature at Middle of the Piles Experiment 3
0
10
20
30
40
50
60
1 3 5 7 9 11 13 15 17 19 21 23 25
Days
Tem
per
atu
re;
(o C)
Pile 1 Pile 2 Pile 3 Pile 4 Air

80
pH Experiment 3
6,60
6,80
7,00
7,20
7,40
7,60
7,80
1 3 5 7 9 11 13 15 17 19 21 23 25
Days
pH
Pile 1 Pile 2 Pile 3 Pile 4
Organic Carbon Experiment 3
0
5
10
15
20
25
30
35
40
1 3 5 7 9 11 13 15 17 19 21 23 25
Days
Org
anic
Car
bon
; (%
)
Pile 1 Pile 2 Pile 3 Pile 4

81
APPENDIX II
EU DEVELOPMENTS IN COMPOSTING
EU Developments in Sludge Regulation
The shape of sludge regulations in Europe is undergoing a period of great
changes: a new Directive on land applications will revise the previous one almost
completely, and the production of a new Directive generally addressed to “biowaste”
has been undertaken to encourage prevention, reduction, and reuse of sludge.
However, to properly perform sludge management, and correctly fulfill the legal
requirements, the definition of standardized characterization methods and procedures
is necessary. For this reason, the European Committee for Standardization (CEN) has
established the Technical Committee 308 (TC308) whose scope is the
standardization of methods and procedures employed for sludge characterization, and
the production of guidelines for good management practice.
From a general point of view, the sludge management policy is addressed to both:
• The development of treatment methods able to reduce the sludge mass
production,
• The application of reuse options instead of simple disposal ones.
From the EU regulatory point of view, the Directive 91/156 on waste, also
designated as the “Waste Basis Directive”, has been of outstanding significance,
as it is always to be observed even with the application of any other listed
regulations. This means that the particular requirements deriving from other
Directives addressed to particular waste groups, like sludge, apply additionally to
the regulations deriving from above Directive. In particular, sludge must fulfil the
requirements imposed by specific normative, such as the:
• Directive 91/27/EEC on the treatment of urban wastewaters,
• Directive 86/278/EEC on sludge utilization in agriculture,
• Organic Farming Regulation 91/2092/EEC,

82
• Landfill Directive 1999/31/EC,
• Commission Decision 2001/688/EC for the ecolabel for soil improvers and
growing media,
• Normative on incineration of waste (i.e Directives 89/369, 94/67 and 00/76),
when applicable.
It is to be observed that the sludge utilization in agriculture is subjected to great
variability over time, depending on crop type and weather conditions, while sludge
production is continuous. Therefore, sludge composting could become a preferred
option because it has the advantage of producing a material which can be more
easily stored, transported and used on times and sites different from those of
production. Composting also involves the production of a more safe and
hygienic product. Additionally, the more constant and controlled quality of
compost, in comparison to what happens in direct agricultural utilization of
sewage sludge, is of major interest.
To promote the biological treatment of biodegradable waste, including
composting, by harmonizing the national measures concerning its management,
and to prevent or reduce any impact thereof on the environment, a working
document in view of a Directive in this field has been recently drafted by EU.
General principles included into the second draft are, among others:
• The prevention or reduction of biowaste production (e.g. sewage sludge) and
its contamination by pollutants;
• The composting or anaerobic digestion of separately collected biowaste that is
not recycled into the original material;
• The mechanical/biological treatment of biowaste;
• The use of biowaste as a source for generating energy.
Member states are requested to encourage (i) home and on site composting
whenever there are viable up of community composting schemes as a way of

83
involving the general public in the management of their own waste, reducing
transport of waste and increasing awareness in waste recycling practices.
According to this proposal, the composting process has to be carried out in such a
way that a thermophilic temperature range, a high level of biological activity under
favorable conditions with humidity and nutrients, as well as an optimum structure
and optimum air conduction are guaranteed over a period of several weeks. In
particular, in the course of the composting process the entire quantity of biowaste has
to be mixed and exposed to a temperature ≥55oC for at least 2 weeks or ≥65oC for at
least 1 week.
Requirements on location of treatment plants, management of wastewater and
leachate, control of odor, minimization of nuisance and hazards are also included in
the proposal. (Spinosa, 2005)
Soil Strategy
Where biowaste is composted it can be recycled into the soil thus increasing the
soil’s organic matter and nutrient level and enhancing the soils ability yo function.
Soil function at many levels which the draft strategy for England summarizes as (The
Draft Soil Strategy for England – A Consultation Paper DETR/MAFF March 2001):
• Environmental interaction (filtering pollutants, emitting and removing gases,
regulating water flow);
• Food and fibre production;
• Providing a platform for development;
• Support of ecological habitat and biodiversity;
• Providing raw material; and
• Protecting cultural heritage.
In terms of biowaste a contribution can be made to the viability of soil in at least
three of these functions through the return of organic matter. The declining organic

84
content of soil is a key concern. Organic matter maintains a central role in soil
function, in its fertility and its ability to hold water (Flooding is becoming an
increasing issue in Europe, the soil’s capacity to hold water is of economic
significance) and to diffuse pollution, moreover it is the organic matter in soil which
holds its carbon and enables it to act as a carbon sink. Declining organic matter is not
just a problem in the Southern Mediterranean (Although the Southern Mediterranean
is where it is most significant, the UK does nothave a problem on the scale of, for
example, Italy) the EU notes :
“in England and Wales the percentage of soil with less than 3.6% of organic
matter rose from 35% to 42,% in the period 1980-1995 probably due to changing
management practices (EU Soil Strategy COM(2002) 179 Final).”
Intensive farming and inorganic fertilizers have also depleted the soil of carbon
reserves and thereby increased the carbon balance in the atmosphere. This can be
reserved by intensive applications of good quality compost material produced from
organic waste.
Farming
The application of compost to farm land likely to be more complex than these
other outlets, nevertheless there are benefits to further consideration.
Agricultural soils are the highest quality to be productive and are crucial in
looking at a soil strategy. The EU soil strategy states:
“Soil protection policies need to have a special focus on sustainable use and
management of agricultural soils, with a view to safeguarding the fertility and
agronomic value of agricultural land (COM(2002) 179 Final page 8).

85
In fact agricultural land in England is generally good but the point on loss of
organic matter still applies and maintaining and restoring the quality of the soil
remains important.
Benefits may include:
• Improvement of soil quality through an organic process; and
• The possibility that on farm composting can provide a form of farm
diversification – and is already carried out successfully.
There are issues which will need addressing, these include:
• The need to inform farmers about the benefits of the use of compost (its
benefits are more fore the environment then for yield – which is why it would
be appropriate to look at within the context of agri-environment schemes);
• Concerns from farmers about the quality of compost;
• The different requirements and loading tolerances of soil across the UK, for
example the need to protect Nitrate Vulnerable Zones;
• The competing use of land for sewage sludge (important now disposal at sea is
not an option);
• The geographical disparity between waste arisings and suitable receptor
farms;
• The transport and logistical implications, in particular where farms are remote
from waste arisings; and
• The implications of the Animal By Products Order.
In economic terms farmers are seeking to diversify and the processing of compost
is one form of income that could prove successful. The economics can be supported
either through gate fees, where local authorities would otherwise have to pay dispose
or process the material, or form the onward sale of compost.

86
EU Report Recommendation
Recommendation 10; DEFRA to encourage the development of quality standards
for compost. These should inform DEFRA’s position during any negotiations on tan
EU Bio-waste Directive:
Other European countries benefit from the existence of standards for compost that
encourage investment and development of markets. Work has already begun in the
UK on a standard for compost through the work of WRAP and the Composting
Association. Standards are needed for a range of grades of compost and land cover
for a variety different end uses from high grade for food production to land
restoration and landfill cover. As technologies change these standards need to be
output based and they need to take into account the draft EU biowaste working
document in anticipation of it being adopted as a Directive.
This recommendation includes development of a biowaste strategy by DEFRA to
build on the work of the draft Soil Strategy. It should be made available to local
authorities, farmers and strategic planners where soil requires organic replenishment
and where there are nitrate and other loading issues.
The strategy should be include :
• Making available a soil map showing where compost may benefit agricultural
land;
• Provision of advice to farmers on the agricultural land environmental benefits
of compost;
• The contribution compost can make as a carbon sink for the UK climate
change programme; and
• The scope for extending Agri-Environment schemes cover the application of
compost to farmland as an environmental soil improver and as part of climate
change measures.

87
Recommendation 16 ; WRAP should take forward four measures to reduce waste
volumes (including home composting) :
Home composting is a key part of a strategy to reduce waste. It also allows
householders to accept greater responsibility for their waste. Home composting also
reduces the demand for commercially produced compost – often based on peat.
Clearly home composting will not be useful in all areas, households without
gardens or with no interest or commitment to gardening will not home compost.
Those householders prepared to home compost will need support and information,
badly composted material will provide no benefit to the soil, will be a home compost
bins are, equally, simply adding to the waste stream long term.
Recommendation 17; WRAP should take forward two measures to increase
recycling and composting (this includes advice to Las on improvement of collection
particularly for organics, and the expansion of markets for organic e.g. landscaping,
horticulture and agriculture):
Home composting is not the whole answer. even in areas where it is suitable there
will be those who do not wish to compost, cannot and there will be time when there
is too much material for home composting (there are also effective community
composting schemes where groups of residents take communal responsibility and
benefit from composting materials). Local authorities then should look to collection
and central composting. The EU Biowaste Directive defines compost as:
“the stable, sanitised and humus-like material rich in organic matter and free from
offensive odours resulting from the composting process of separately collected
biowaste.”
Which points to compost made from source separated material, and the
Directive may require such separate collection as a basic requirement.

88
To be of benefit to the soil composting must be carried out properly and used
appropriately. Where a simple shredding and spreading of whole waste is carried out
this constitutes landfill, and is of no benefit to the soil and should not be classifield as
recovery composting or recycling. Mixed waste composting (for example as a result
of MBT of residual waste) can be used as landfill cover, or for land remediation,
but this should only be applied to residual waste. Local authorities should seek
separate collection and composting of clean waste streams.
(www.strategy.gov.uk/downloads/su/waste/downloads/ah.pdf)
Related Documents