Compositional Sentiment Analysis Stephen Pulman Dept. of Computer Science, Oxford University and TheySay Ltd [email protected], [email protected] June 3rd 2014

Welcome message from author
This document is posted to help you gain knowledge. Please leave a comment to let me know what you think about it! Share it to your friends and learn new things together.
Transcript

Compositional Sentiment Analysis
Stephen Pulman
Dept. of Computer Science, Oxford Universityand TheySay Ltd
[email protected], [email protected]
June 3rd 2014
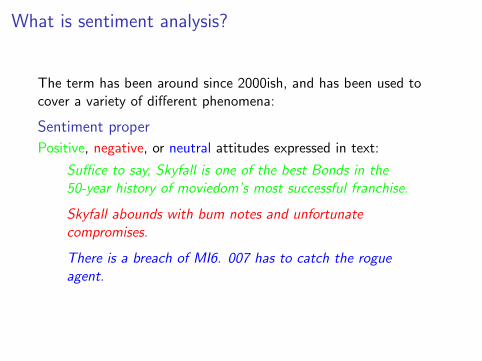
What is sentiment analysis?
The term has been around since 2000ish, and has been used tocover a variety of different phenomena:
Sentiment proper
Positive, negative, or neutral attitudes expressed in text:
Suffice to say, Skyfall is one of the best Bonds in the50-year history of moviedom’s most successful franchise.
Skyfall abounds with bum notes and unfortunatecompromises.
There is a breach of MI6. 007 has to catch the rogueagent.

Sentiment analysis = emotion detection?
EmotionA variety of different theories of emotional state:
Ekman: anger, disgust, fear, happiness, sadness and surprise.
multi-dimensional theories:I Pleasure vs. displeasure (how pleasant?)I Arousal vs. non-arousal (how intense)I Dominance vs. submissiveness (e.g. anger vs. fear)
psychometric measures ‘calmness’, ‘vitality’, etc....
activation, valence, potency, emotion intensity
Typically it is assumed that particular words and phrases areassociated with these categories.

Emotion classification is difficult:
Emotion: human annotation usually gives upper limit on what ispossible. For Ekman emotion labels the results are not good: thistable shows level of agreement between annotators on 1250 newsheadlines drawn from major newspapers such as New York Times,CNN, and BBC News, as well as from the Google News searchengine. Performance of various different types of classifiers on acollection of annotated blog posts is shown in the third column.
Emotions human agreement best classifier F score
anger 49.55 16.77disgust 44.51 4.68fear 63.81 22.8joy 59.91 32.87sadness 68.19 23.06surprise 36.07 14.1
Sentiment analysis = speculation, intent, etc?
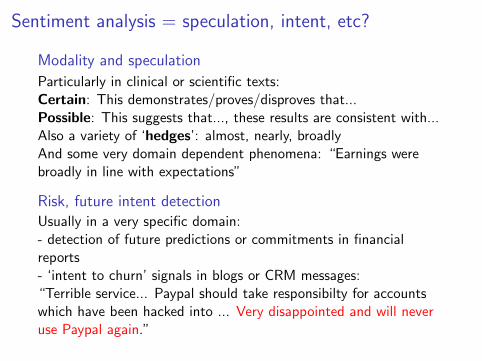
Modality and speculation
Particularly in clinical or scientific texts:Certain: This demonstrates/proves/disproves that...Possible: This suggests that..., these results are consistent with...Also a variety of ‘hedges’: almost, nearly, broadlyAnd some very domain dependent phenomena: “Earnings werebroadly in line with expectations”
Risk, future intent detectionUsually in a very specific domain:- detection of future predictions or commitments in financialreports- ‘intent to churn’ signals in blogs or CRM messages:“Terrible service... Paypal should take responsibilty for accountswhich have been hacked into ... Very disappointed and will neveruse Paypal again.”
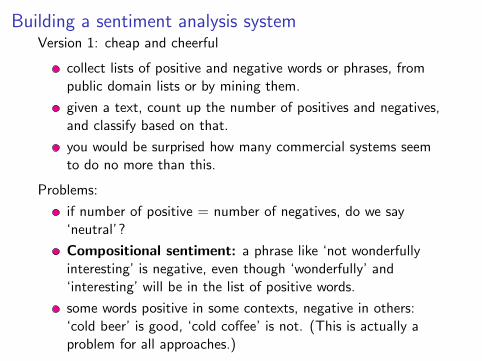
Building a sentiment analysis systemVersion 1: cheap and cheerful
collect lists of positive and negative words or phrases, frompublic domain lists or by mining them.
given a text, count up the number of positives and negatives,and classify based on that.
you would be surprised how many commercial systems seemto do no more than this.
Problems:
if number of positive = number of negatives, do we say‘neutral’?
Compositional sentiment: a phrase like ‘not wonderfullyinteresting’ is negative, even though ‘wonderfully’ and‘interesting’ will be in the list of positive words.
some words positive in some contexts, negative in others:‘cold beer’ is good, ‘cold coffee’ is not. (This is actually aproblem for all approaches.)

Version 2: better (what most commercial systems do)
A bag-of-words classifier:
get a training corpus of texts human annotated for sentiment(e.g. pos/neg/neut).
represent each text as a vector of counts of n-grams1 of(normalised) words, and train your favourite classifier on thesevectors.
should capture some ‘compositional’ effects: e.g.‘very interesting’ likely signal for positivity, whereas ‘not very’a signal for negativity.
will work for any language and domain where you can getaccurately labelled training data.
bag-of-words means structure is ignored:“Knox is found guilty of the murder of Kercher”= “Kercher is found guilty of the murder of Knox”
1n usually <= 3, and as n gets bigger, more training data is required

Problems:
Equally balanced texts will still be problematic,
and richer compositional effects will still be missed:clever, too clever, not too cleverbacteriakill bacteriafail to kill bacterianever fail to kill bacteria
difficult to give sentiment labels accurately to short units likesentences or phrases,
or to pick out mixed sentiment:“The display is amazingly sharp. However, the battery life isdisappointing.”
Complex compositional examples occur quite frequently inpractice:
The Trout Hotel: This newly refurbished hotel could not fail toimpress...BT: it would not be possible to find a worse company to dealwith...
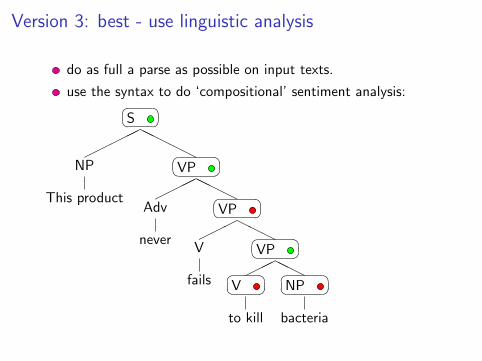
Version 3: best - use linguistic analysis
do as full a parse as possible on input texts.
use the syntax to do ‘compositional’ sentiment analysis:�� ��S
�����
HHH
HH
NP
This product
�� ��VP
����
HHH
H
Adv
never
�� ��VP
���
HHH
V
fails
�� ��VP
���
HHH�� ��V
to kill
�� ��NP
bacteria

Sentiment logic rules2
kill + negative → positive (kill bacteria)
kill + positive → negative (kill kittens)
too + anything → negative (too clever, too red, too cheap)
etc. In our system (www.theysay.io) we have 65,000+ ofsuch rules...
Problems:
still need extra work for context-dependence (‘cold’, ‘wicked’,‘sick’...)
can’t deal with reader perspective: “Oil prices are down” isgood for me, not for Chevron or Shell investors.
can’t deal with sarcasm or irony: “Oh, great, they want it torun on Windows”
2Moilanen and Pulman, 2007
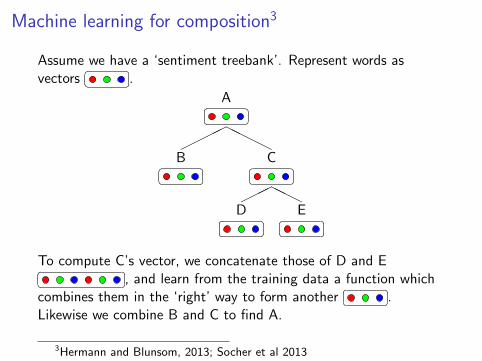
Machine learning for composition3
Assume we have a ‘sentiment treebank’. Represent words asvectors
�� ��.A�� ��
����
HHHH
B�� �� C�� �����
HHH
D�� �� E�� ��To compute C’s vector, we concatenate those of D and E�� ��, and learn from the training data a function whichcombines them in the ‘right’ way to form another
�� ��.Likewise we combine B and C to find A.
3Hermann and Blunsom, 2013; Socher et al 2013

Various composition functions
��
� ×
�
�
�
�=
�� ��
Here the weight matrix represents pairwise word/phrasecombinations, perhaps also with syntactic info. We apply anelement-wise non-linearity to the resulting vector. Weights can belearned via neural network methods.
We then use a ‘softmax’ function to map from the phrase vectorsto a distribution over sentiment labels:�� �� Softmax⇒ {Pos = 0.5, Neg = 0.3, Neut = 0.2}
More complex
�� �� ×
�
�
�
�
�
�
�
�
�
�
�
�×
�
�
�
�=
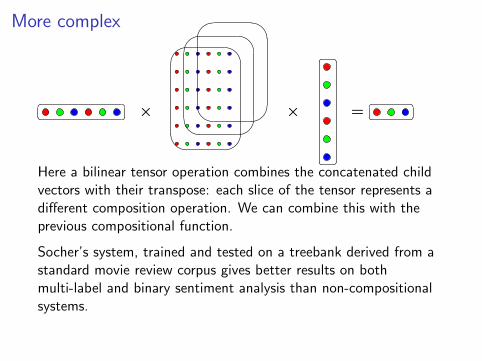
�� ��Here a bilinear tensor operation combines the concatenated childvectors with their transpose: each slice of the tensor represents adifferent composition operation. We can combine this with theprevious compositional function.
Socher’s system, trained and tested on a treebank derived from astandard movie review corpus gives better results on bothmulti-label and binary sentiment analysis than non-compositionalsystems.
Some applications
The most obvious and widely used are in brand and reputationmanagement, typically along these lines:
release a new product
track consumer reaction
find out what are the most/least popular features
get comparisons with rival products
On the consumer side, you could in principle use sentiment analysisto construct a personalised ‘Which?’ report comparing e.g.different cameras.
In some areas, it is possible to predict sales on the basis ofsentiment analysis: e.g. Liu and his team claim to be able topredict box-office revenues for movies.Note that there is a whole sub-industry in generating fake positiveor negative reviews to skew results and damage your rivals...and asub-sub-industry in trying to detect this kind of spam!
Sentiment analysis in dialogue
The Companions project (www.companions-project.org)
e 12m EU-funded project over 4 years with 14 partners (!)
aimed to create a multi-modal ‘companion’.
speech recognition and synthesis, dialogue processing, avatarwith gesture and facial expression.
used text sentiment analysis and speech emotion detection(EmoVoice).
several scenarios: most developed was the ‘How was yourday?’ post-work chat.
system aimed to detect mood and respond appropriately.
system interruptible by user (not as easy as you might think...)

Conversation about the day...
Speech and text sentiment
Process user input for sentiment, both speech and text.
Use this to guide the generation of a response
If very negative, e.g. ‘You seem rather upset’
Or very positive, ‘Great! Glad to hear that.’
We can also invert these polarities to generate ironical or sarcasticreplies:
User:At my performance review I got offered a promotion but it justmeans more hard work and responsibility.
System:
Instead of:Well done: everyone likes getting a promotion. It will further yourcareer - that’s good.We get:Who likes getting a promotion anyway? You will further yourcareer, isn’t that awful?

An experiment we didn’t have time for
Can you recognise sarcasm and irony by exploiting mismatchesbetween speech and text properties?
Positive text + negative speech:
What a wonderful start to the day!Oh, that’s just great!
Negative text + positive speech?
Do we get the opposite? Seems intuitively to be much lesscommon:
Hey, yet another disaster!Absolutely awful screw-up!
Betting on horse racingLarge online betting community, usingTwitter, Betfair.com forums etc.
Hypothesis: profile opinion about particularhorses and riders leading up to a race todetect mismatches between sentiment and bookmakers’ odds.Result: dismal failure, at least using Twitter! Could not separatesignal from noise:
Many horse names (up to 300 per meeting).
Horse names not easily recognisable as such, e.g. ‘GenuineArt’, ‘Beat That’, ‘Talent’, ‘Ask the Boss’, ‘Degenerate’, andeven ‘Say’
Many racing specific phrases: ‘will not like the going’, ‘pullsup’, ‘might not stay’ . . .
Horse specific info: ‘going is soft’ - good for some, not others
Lesson learned: many data sources need sophisticatedpre-processing to get accurate sentiment analyses. . .
Predicting Man of the Match
Method: track player Tweet mentions dur-ing game. Predict that player with highestproportion of positive tweets at end of gamewill be MOTM.
Results: prediction correct about 50% ofthe time. MOTM usually in top 3 players,but events near the end of a match oftenassume greater importance and affect result:
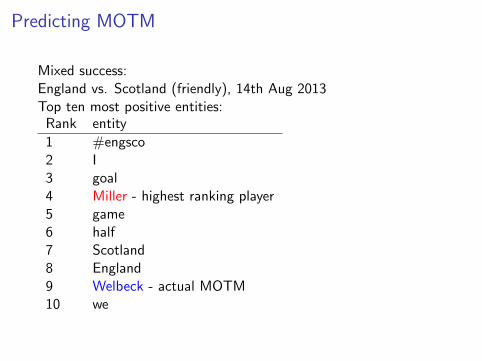
Predicting MOTM
Mixed success:England vs. Scotland (friendly), 14th Aug 2013Top ten most positive entities:
Rank entity
1 #engsco2 I3 goal4 Miller - highest ranking player5 game6 half7 Scotland8 England9 Welbeck - actual MOTM10 we
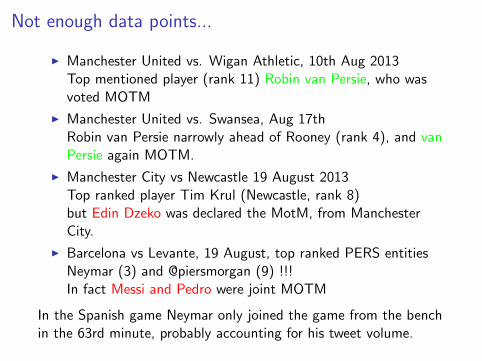
Not enough data points...
I Manchester United vs. Wigan Athletic, 10th Aug 2013Top mentioned player (rank 11) Robin van Persie, who wasvoted MOTM
I Manchester United vs. Swansea, Aug 17thRobin van Persie narrowly ahead of Rooney (rank 4), and vanPersie again MOTM.
I Manchester City vs Newcastle 19 August 2013Top ranked player Tim Krul (Newcastle, rank 8)but Edin Dzeko was declared the MotM, from ManchesterCity.
I Barcelona vs Levante, 19 August, top ranked PERS entitiesNeymar (3) and @piersmorgan (9) !!!In fact Messi and Pedro were joint MOTM
In the Spanish game Neymar only joined the game from the benchin the 63rd minute, probably accounting for his tweet volume.

Predicting election results
Can we eliminate opinion polls?
A very mixed picture, to put it mildly:
Tumasjan et a. 2010 claimed that share of volume on Twittercorresponded to distribution of votes between 6 main partiesin the 2009 German Federal election. (Volume rather thansentiment is also a better predictor of movie success).
Jungherr et al. 2011 pointed out that not all parties runninghad been included and that different results are got withdifferent time windows. Tumasjan et al. replied, toning downtheir original claims.
Tjong et al. found that Tweet volume was NOT a goodpredictor for the Dutch 2011 Senate elections, and thatsentiment analysis was better.

Predicting election results
Skoric et al. 2012 found some correlation between Twittervolume and the votes in the 2011 Singapore general election,but not enough to make accurate predictions.
Bermingham and Smeaton 2011 found that share of Tweetvolume and proportion of positive Tweets correlated best withthe outcome of the Irish General Election of 2011
... but that the mean average error was greater than that oftraditional opinion polls!
So this doesn’t look very promising, although of course othersources than Twitter might give better results - but they aredifficult to get at quickly.

Sentiment Obama vs. Romney (from twitris.knoesis.org)

Emotion Obama vs. Romney
Financial market prediction
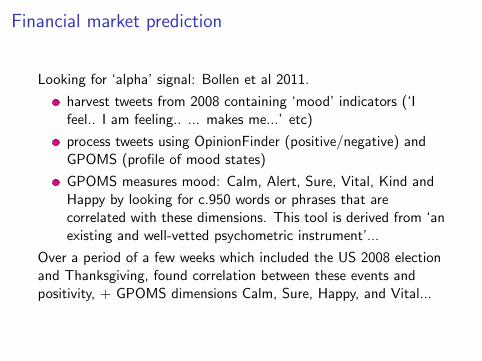
Looking for ‘alpha’ signal: Bollen et al 2011.
harvest tweets from 2008 containing ‘mood’ indicators (‘Ifeel.. I am feeling.. ... makes me...’ etc)
process tweets using OpinionFinder (positive/negative) andGPOMS (profile of mood states)
GPOMS measures mood: Calm, Alert, Sure, Vital, Kind andHappy by looking for c.950 words or phrases that arecorrelated with these dimensions. This tool is derived from ‘anexisting and well-vetted psychometric instrument’...
Over a period of a few weeks which included the US 2008 electionand Thanksgiving, found correlation between these events andpositivity, + GPOMS dimensions Calm, Sure, Happy, and Vital...
Some correlations if you look hard enough...
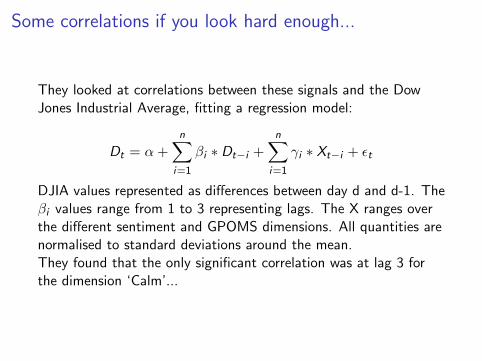
They looked at correlations between these signals and the DowJones Industrial Average, fitting a regression model:
Dt = α +n∑
i=1
βi ∗ Dt−i +n∑
i=1
γi ∗ Xt−i + εt
DJIA values represented as differences between day d and d-1. Theβi values range from 1 to 3 representing lags. The X ranges overthe different sentiment and GPOMS dimensions. All quantities arenormalised to standard deviations around the mean.They found that the only significant correlation was at lag 3 forthe dimension ‘Calm’...

But can you make money?
Financial News, 15 Aug 2011
“A hedge fund that uses Twitter data to drive its trading strategyreturned 1.85% in its first month of trading, according to aninvestor in the fund, in the first sign that social media data can beused successfully to enhance electronic trading techniques.Derwent Capital, which finished its first month of trading at theend of July, beat the S&P 500 which fell 2.2% in July, while theaverage hedge fund made 0.76%, according to Hedge FundResearch...”
Financial Times, May 24, 2012
Last tweet for Derwent’s Absolute ReturnBy James Mackintosh, Investment Editor“The only dedicated “Twitter” hedge fund has shut down afterdeciding to offer its social media indicators to day traders instead.Derwent Capital Markets Absolute Return fund was quietlyliquidated just a month after starting up last year...”

Predicting the US non-farm payroll4
NFP: a monthly economicindex that measures jobgrowth or decay:- a ‘market mover’.
Questions:
Can we predict the direction of the NFP from financialindicators?
Can we predict the direction of the NFP from sentiment intext?
If so, does compositional sentiment perform better than BOWclassifier?
4Joint work with Oxford Man Institute of Quantitative Finance
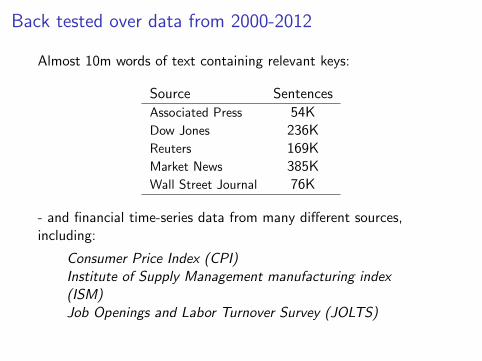
Back tested over data from 2000-2012
Almost 10m words of text containing relevant keys:
Source Sentences
Associated Press 54KDow Jones 236KReuters 169KMarket News 385KWall Street Journal 76K
- and financial time-series data from many different sources,including:
Consumer Price Index (CPI)Institute of Supply Management manufacturing index(ISM)Job Openings and Labor Turnover Survey (JOLTS)

Process text using TheySay’s API:
“The Governor noted that despite jobs being down, there was asurprising bright spot: construction added 1,900 jobs in November- its largest gain in 22 months.”�� ��pos: 0.925, neg: 0.0, neut: 0.075, conf: 0.69
“When I drive down the main street of my little Kansas Citysuburb I see several dark empty storefronts that didn’t used to bethat way.”�� ��pos: 0.0, neg: 0.973, neut: 0.027, conf: 0.674
“We continue to fare better than the nation - our rate has been ator below the national rate for 82 out of the past 83 months - butwe must also recognize that there were 10200 jobs lost at the sametime.” �� ��pos: 0.372, neg: 0.591, neut: 0.037, conf: 0.723

Test bag of words vs. compositional sentiment
Method:
Also train a 1-3gram Support Vector Machine BOWsentiment classifier for comparison.
Train individual logistic regression classifiers on each text andnumerical stream.
Use output sentiment distributions per time-slice as inputfeature for LR classifiers.
Use a novel ‘Independent Bayesian Classifier Combination’method to get best combination of individual classifiers.
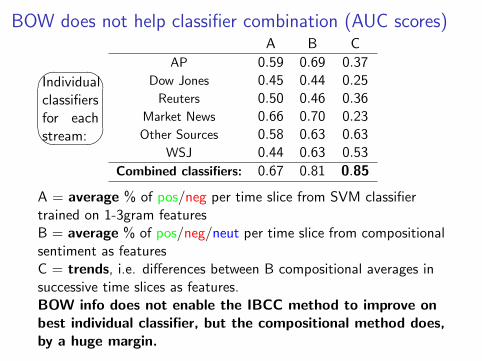
BOW does not help classifier combination (AUC scores)
�
�
�
�Individualclassifiersfor eachstream:
A B C
AP 0.59 0.69 0.37Dow Jones 0.45 0.44 0.25
Reuters 0.50 0.46 0.36Market News 0.66 0.70 0.23Other Sources 0.58 0.63 0.63
WSJ 0.44 0.63 0.53
Combined classifiers: 0.67 0.81 0.85
A = average % of pos/neg per time slice from SVM classifiertrained on 1-3gram featuresB = average % of pos/neg/neut per time slice from compositionalsentiment as featuresC = trends, i.e. differences between B compositional averages insuccessive time slices as features.BOW info does not enable the IBCC method to improve onbest individual classifier, but the compositional method does,by a huge margin.

Text combined with numerical streams
Numerical time series data alone does a good job:
Source AUC
CPI 0.70ISM 0.85JOLTS 0.66LFL 0.71
Combined 0.90
But a combination of text and time series is best!
Source AUC
Time Series + Text Averages 0.94Time Series + Text Trends 0.91

Conclusions
Compositional sentiment methods give a substantialimprovement in accuracy
. . . and finer grained analyses
. . . and in the financial domain at least can yield accuratepredictions, especially when combined with numerical data.
Try it out! �� ��www.theysay.io�� ��http://nlp.stanford.edu:8080/sentiment/rntnDemo.html

References
Karo Moilanen and Stephen Pulman, 2007, Sentiment composition. In Proceedings ofthe Recent Advances in Natural Language Processing International Conference(RANLP-2007), pages 378382, Borovets, Bulgaria, September 27-29 2007.http://www.clg.ox.ac.uk/_media/people:karo:sentcompranlp07final.pdf
Karl Moritz Hermann and Phil Blunsom, 2013, The Role of Syntax in Vector SpaceModels of Compositional Semantics. In Proceedings of the 51st Annual Meeting ofthe Association for Computational Linguistics (Volume 1: Long Papers). pp. 894904.Sofia, Bulgaria.http://aclweb.org/anthology//P/P13/P13-1088.pdf
Richard Socher, Alex Perelygin, Jean Wu, Jason Chuang, Chris Manning, Andrew Ngand Chris Potts, 2013, Recursive Deep Models for Semantic Compositionality Over aSentiment Treebank Conference on Empirical Methods in Natural LanguageProcessing (EMNLP 2013), Seattle, Washington, USA; ACL, pp. 1631-1642.http://aclweb.org/anthology//D/D13/D13-1170.pdf
Abby Levenberg, Stephen Pulman, Karo Moilanen, Edwin Simpson and StephenRoberts, 2014, Predicting Economic Indicators from Web Text Using SentimentComposition, International Journal of Computer and Communication Engineering.Barcelona, Spain. February, 2014. IACSIT Press.http://www.oxford-man.ox.ac.uk/sites/default/files/sentiment_ICICA2014.pdf
Related Documents