COMPOSITION AND MICROSTRUCTURE EFFECTS ON SUPERPLASTICITY IN MAGNESIUM ALLOYS A thesis submitted to the University of Manchester for the degree of Doctor of Philosophy in the Faculty of Engineering and Physical Sciences 2010 Hossain Mohammad Mamun Al Rashed School of Materials

Welcome message from author
This document is posted to help you gain knowledge. Please leave a comment to let me know what you think about it! Share it to your friends and learn new things together.
Transcript
COMPOSITION AND
MICROSTRUCTURE EFFECTS
ON SUPERPLASTICITY IN
MAGNESIUM ALLOYS
A thesis submitted to the University of Manchester
for the degree of Doctor of Philosophy
in the Faculty of Engineering and Physical Sciences
2010
Hossain Mohammad Mamun Al Rashed
School of Materials
Contents
Abstract 11
Declaration 12
Copyright 13
Acknowledgements 14
List of Symbols and Abbreviations 16
1 Introduction 18
2 Literature Review 22
2.1 Magnesium and Its Alloys . . . . . . . . . . . . . . . . . . . . . . . . 22
2.1.1 Classification of Magnesium Alloys . . . . . . . . . . . . . . . 22
2.1.2 Effects of Alloying Elements . . . . . . . . . . . . . . . . . . . 26
2.1.3 Deformation Systems of Magnesium Alloys . . . . . . . . . . . 28
2.1.4 Recrystallization and its Significance . . . . . . . . . . . . . . 34
2.1.5 Thermo-mechanical Treatments . . . . . . . . . . . . . . . . . 37
2.2 Characteristics of Superplasticity . . . . . . . . . . . . . . . . . . . . 37
2.3 Mechanisms of Superplasticity . . . . . . . . . . . . . . . . . . . . . . 42
2.3.1 Diffusion Creep . . . . . . . . . . . . . . . . . . . . . . . . . . 44
2.3.2 Grain Boundary Sliding . . . . . . . . . . . . . . . . . . . . . 46
2.3.3 Dislocation Creep . . . . . . . . . . . . . . . . . . . . . . . . . 54
2.3.4 Constitutive Laws of Superplasticity . . . . . . . . . . . . . . 56
2.3.5 Superplasticity in Magnesium Alloys . . . . . . . . . . . . . . 59
2.4 Dynamic Grain Growth . . . . . . . . . . . . . . . . . . . . . . . . . . 62
2.5 Cavitation in Magnesium Alloys . . . . . . . . . . . . . . . . . . . . . 64
2.5.1 Nucleation of Cavities . . . . . . . . . . . . . . . . . . . . . . 65
2.5.2 Growth of Cavities . . . . . . . . . . . . . . . . . . . . . . . . 69
2.5.3 Coalescence of Cavities . . . . . . . . . . . . . . . . . . . . . . 73
2.5.4 Shapes of Cavities . . . . . . . . . . . . . . . . . . . . . . . . 74
2.5.5 Cavitation in Aluminium and Magnesium Alloys . . . . . . . . 77
2.6 Summary and Potential of the Current Study . . . . . . . . . . . . . 79
2
3 Experimental and Data Analysis Procedures 80
3.1 Materials Characteristics . . . . . . . . . . . . . . . . . . . . . . . . . 80
3.2 Alloy Processing . . . . . . . . . . . . . . . . . . . . . . . . . . . . . 81
3.2.1 Homogenisation Treatment . . . . . . . . . . . . . . . . . . . . 81
3.2.2 Hot Rolling . . . . . . . . . . . . . . . . . . . . . . . . . . . . 82
3.3 Experimental Techniques . . . . . . . . . . . . . . . . . . . . . . . . . 83
3.3.1 Microstructural Observation . . . . . . . . . . . . . . . . . . . 84
3.3.2 Tensile Tests . . . . . . . . . . . . . . . . . . . . . . . . . . . 86
3.3.3 X-Ray Micro-Tomography . . . . . . . . . . . . . . . . . . . . 87
3.4 Data Analysis . . . . . . . . . . . . . . . . . . . . . . . . . . . . . . . 88
3.4.1 Thermodynamic Modelling . . . . . . . . . . . . . . . . . . . . 88
3.4.2 Grain Size Determination . . . . . . . . . . . . . . . . . . . . 89
3.4.3 Measurement of Second Phase Particles and Cavities . . . . . 89
3.4.4 Tomography Data Analysis . . . . . . . . . . . . . . . . . . . 90
3.4.5 Calculations of Stress and Strain . . . . . . . . . . . . . . . . 90
3.4.6 Statistical Analysis . . . . . . . . . . . . . . . . . . . . . . . . 91
3.5 Summary . . . . . . . . . . . . . . . . . . . . . . . . . . . . . . . . . 94
4 Hot Deformation Behaviour of the Alloys 95
4.1 Development of Initial Microstructure . . . . . . . . . . . . . . . . . . 95
4.1.1 Rolling of the As-cast alloys . . . . . . . . . . . . . . . . . . . 95
4.1.2 Particle Analysis . . . . . . . . . . . . . . . . . . . . . . . . . 100
4.1.3 Texture Development . . . . . . . . . . . . . . . . . . . . . . . 105
4.2 Flow Behaviour during Hot Deformation of the Alloys Investigated . 107
4.2.1 Flow Characteristics of the Alloys . . . . . . . . . . . . . . . . 110
4.2.2 Mechanism of Deformation . . . . . . . . . . . . . . . . . . . . 113
4.2.3 Analyses of Strain Rate Sensitivity and Elongation to Failure . 117
4.3 Grain Growth . . . . . . . . . . . . . . . . . . . . . . . . . . . . . . . 121
4.3.1 Grain Growth Trends in the Alloys Investigated . . . . . . . . 121
4.3.2 Variation of Strain Rate Sensitivity during Hot Deformation . 124
4.4 Examination of Fractured Specimens . . . . . . . . . . . . . . . . . . 125
4.5 Summary . . . . . . . . . . . . . . . . . . . . . . . . . . . . . . . . . 129
5 Cavity Controlled Failure Mechanism 131
5.1 Cavity Formation Sites . . . . . . . . . . . . . . . . . . . . . . . . . . 131
5.2 Quantification of Cavities . . . . . . . . . . . . . . . . . . . . . . . . 133
5.3 Determination of Particle-cavity Association by X-ray Tomography . 139
5.3.1 Qualitative Approach . . . . . . . . . . . . . . . . . . . . . . . 140
5.3.2 Estimation of Particle and Cavity Size Distributions . . . . . . 143
5.3.3 Methodology Developed for Particle/Cavity Association . . . . 145
3
5.3.4 Establishment of Particle-cavity Relationships . . . . . . . . . 147
5.4 Probability of Pre-existing Cavities . . . . . . . . . . . . . . . . . . . 150
5.5 Nucleation of Cavities . . . . . . . . . . . . . . . . . . . . . . . . . . 151
5.6 Growth of Cavities . . . . . . . . . . . . . . . . . . . . . . . . . . . . 154
5.6.1 Investigation by SEM . . . . . . . . . . . . . . . . . . . . . . . 154
5.6.2 Investigation by X-ray Micro-Tomography . . . . . . . . . . . 159
5.6.3 Coalescences of Cavities . . . . . . . . . . . . . . . . . . . . . 163
5.7 Continuous Nucleation of Cavities . . . . . . . . . . . . . . . . . . . . 166
5.8 Parameters affecting Cavitation . . . . . . . . . . . . . . . . . . . . . 167
5.9 Summary . . . . . . . . . . . . . . . . . . . . . . . . . . . . . . . . . 168
6 Conclusions 170
References 173
A Parameters used in the Current Study 189
B Methodology for Defining Axes of Regions from 3D Data Set 190
Final Word Count: 48448
4
List of Tables
1.1 Usage of magnesium in western world in 2003 . . . . . . . . . . . . . 19
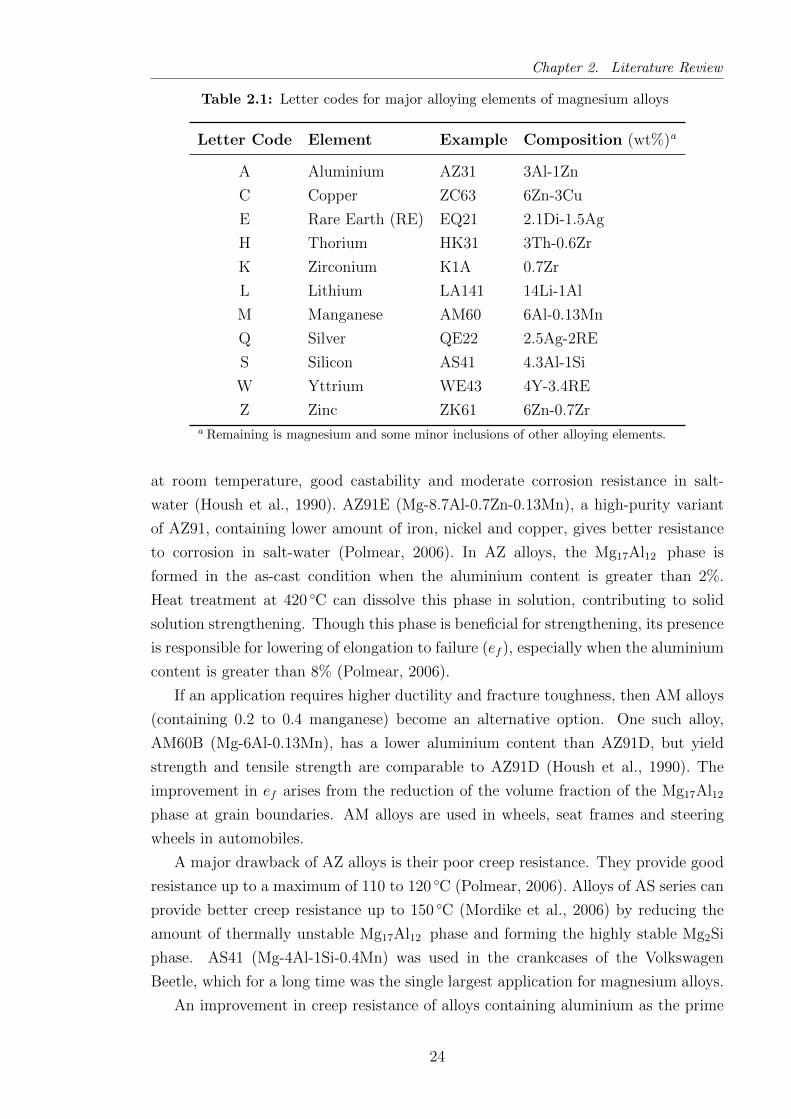
2.1 Letter codes for major alloying elements of magnesium alloys . . . . . 24
2.2 Tensile properties of selected cast magnesium alloys at room temperature 25
2.3 Room temperature tensile properties of selected wrought alloys . . . . 27
2.4 Relative CRSS for pure magnesium, AZ31 and AZ61 . . . . . . . . . 33
2.5 Examples of different superplastic materials . . . . . . . . . . . . . . 39
2.6 Values of n and p . . . . . . . . . . . . . . . . . . . . . . . . . . . . . 59
2.7 A collection of Superplastic Behaviour Observed in AZ31 and AZ61
Alloys . . . . . . . . . . . . . . . . . . . . . . . . . . . . . . . . . . . 61
3.1 Chemical compositions of the sand-cast ingots (wt%). . . . . . . . . . 81
3.2 Chemical compositions of the chill-cast ingots (wt%). . . . . . . . . . 81
3.3 A 22 full factorial design. . . . . . . . . . . . . . . . . . . . . . . . . . 93
3.4 Showing the multiplication of responses (strain rate sensitivity, m) . . 93
4.1 The refining of the grains during the hot rolling of the sand-cast alloys
at 300 C . . . . . . . . . . . . . . . . . . . . . . . . . . . . . . . . . . 97
4.2 Grain sizes of the chill-cast alloys . . . . . . . . . . . . . . . . . . . . 98
4.3 Average particle diameter, dp, of the alloys . . . . . . . . . . . . . . . 106
4.4 Calculation of the average activation energies for the sand-cast alloys 115
4.5 Estimation of the F -distributions of the variables/responses . . . . . 120
5.1 A comparison chart for the fraction (percentage) of the number of
cavities for different size ranges for all alloys . . . . . . . . . . . . . . 138
5.2 Cavity volume fractions obtained from the tomography data . . . . . 145
5.3 Estimation of critical particle diameter . . . . . . . . . . . . . . . . . 152
5.4 A list of groups assigned to different cavity sizes . . . . . . . . . . . . 154
5.5 Estimation of cavity growth rate parameter (η) at a strain rate of
5× 10⁻⁴ s−1 . . . . . . . . . . . . . . . . . . . . . . . . . . . . . . . . 166
5.6 Calculation of dcritp for AZ31HC at different temperatures and strain
rates . . . . . . . . . . . . . . . . . . . . . . . . . . . . . . . . . . . . 168
A.1 Material constants and parameters used in the current project . . . . 189
5
List of Figures
2.1 A schematic diagram of hcp unit cell of magnesium. . . . . . . . . . . 23
2.2 Magnesium rich corner of binary phase diagrams of (a) Mg-Al and (b)
Mg-Zn . . . . . . . . . . . . . . . . . . . . . . . . . . . . . . . . . . . 28
2.3 Mg-rich binary phase diagram of Mg-Mn system . . . . . . . . . . . . 29
2.4 Slip and twinning systems in a magnesium crystal . . . . . . . . . . . 30
2.5 A schematic presentation of critical resolved shear stress (CRSS) of
different slip systems and twinning . . . . . . . . . . . . . . . . . . . 31
2.6 A basal texture developed during hot rolling of AZ31 . . . . . . . . . 34
2.7 A schematic presentation of DRX in magnesium . . . . . . . . . . . . 35
2.8 Strain rate vs elastic modulus (E) compensated flow stress relationship
of AZ61 at different temperatures . . . . . . . . . . . . . . . . . . . . 38
2.9 The strain rate dependency on (a) σ and (b) (m) . . . . . . . . . . . 40
2.10 The effect of grain size on flow stress . . . . . . . . . . . . . . . . . . 41
2.11 Variation of (a) ef and (b) σ at different temperatures . . . . . . . . 42
2.12 Deformation mechanism map of magnesium alloys at 400 C . . . . . 43
2.13 Schematic sketches for (a) Nabarro–Herring Creep and (b) Coble Creep. 46
2.14 A schematic presentation of Lifshitz GBS accommodated diffusion creep 47
2.15 A schematic presentation of GBS during deformation . . . . . . . . . 48
2.16 An schematic presentation of Ball and Hutchiston model. . . . . . . . 49
2.17 A schematic presentation of pile-up of dislocations at triple points. . . 50
2.18 A schematic presentation of core and mantle concept . . . . . . . . . 51
2.19 A schematic representation of GBS by Gifkins model. . . . . . . . . . 52
2.20 A schematic presentation of GBS according to the Ashby and Verrall
model. . . . . . . . . . . . . . . . . . . . . . . . . . . . . . . . . . . . 53
2.21 The instability parameter, I. . . . . . . . . . . . . . . . . . . . . . . . 57
2.22 Effect of m on the growth profile of a neck. . . . . . . . . . . . . . . . 58
2.23 Increase of grain size during deformation . . . . . . . . . . . . . . . . 64
2.24 A schematic presentation of Gifkins mechanism of nucleation of a cavity. 67
2.25 An illustration of Beere and Speight mechanism of cavity growth. . . 70
2.26 Predicted growth rates of cavities by diffusion- or plasticity-controlled
mechanisms . . . . . . . . . . . . . . . . . . . . . . . . . . . . . . . . 73
2.27 Examples of cavity shapes . . . . . . . . . . . . . . . . . . . . . . . . 75
6
2.28 Shape of an elongated cavity. . . . . . . . . . . . . . . . . . . . . . . 76
3.1 A plot of reduction in each pass during rolling of AZ31LS . . . . . . . 84
3.2 A schematic drawing showing a rolled sheet and specimen sectioned
for metallography. . . . . . . . . . . . . . . . . . . . . . . . . . . . . . 84
3.3 A schematic drawing showing the tensile specimen geometry. . . . . . 86
3.4 A schematic drawing showing the X-ray micro-tomography setup. . . 88
4.1 Optical micrographs of the sand-cast microstructures of (a) AZ31LS,
(b) AZ31HS, (c) AZ61LS and (d) AZ61HS. . . . . . . . . . . . . . . . 96
4.2 Optical micrographs of AZ31HS during different passes of the rolling 97
4.3 An optical micrograph of AZ31HS alloy after 24% reduction by rolling. 98
4.4 Optical images of the hot-rolled and refined microstructure of the alloys. 99
4.5 Optical micrographs of the hot rolled chill-cast alloys . . . . . . . . . 99
4.6 SEM micrographs of the sand-cast alloys showing the distributions of
the coarser particles . . . . . . . . . . . . . . . . . . . . . . . . . . . 100
4.7 SEM micrographs of the fine particles observed in the sand-cast alloys 101
4.8 Plots of the probability distribution functions of the particle diameter 102
4.9 Determination of particle compositions . . . . . . . . . . . . . . . . . 103
4.10 Predicted thermodynamic evolution of phases . . . . . . . . . . . . . 104
4.11 A comparison of the experimentally measured and predicted volume
fractions of the particles. . . . . . . . . . . . . . . . . . . . . . . . . . 104
4.12 Determination of particle compositions in chill-cast AZ31LSC and AZ31HC.105
4.13 Determination of particle compositions in AZ61LC and AZ61HC. . . 106
4.14 A bar chart showing the comparison between experimental and model
predicted particle volume fractions. . . . . . . . . . . . . . . . . . . . 107
4.15 Plots of probability distribution functions of the particle diameter (dp)
of chill-cast (a) AZ31LC and AZ31HC and (b) AZ61LC and AZ61HC.
Normalised fraction of number of particles are also included. . . . . . 107
4.16 The pole figures of AZ31LS and AZ31HS. . . . . . . . . . . . . . . . . 108
4.17 The pole figures of AZ61LS and AZ61HS. . . . . . . . . . . . . . . . . 109
4.18 The stress-strain curves of (a) AZ31LS and AZ31HS and (b) AZ61LS
and AZ61HS deformed at 300 C at a strain rate of 5× 10⁻⁴ s−1. . . . 110
4.19 The stress-strain curves of (a) AZ31LS and AZ31HS and (b) AZ61LS
and AZ61HS deformed at 350 C at a strain rate of 5× 10⁻⁴ s−1. . . . 111
4.20 The stress-strain curves of (a) AZ31LS and AZ31HS and (b) AZ61LS
and AZ61HS deformed at 400 C at a strain rate of 5× 10⁻⁴ s−1. . . . 111
4.21 The stress-strain curves of (a) AZ31LS and AZ31HS and (b) AZ61LS
and AZ61HS deformed at 450 C at a strain rate of 5× 10⁻⁴ s−1. . . . 112
7
4.22 The stress-strain curves of (a) AZ31LS and AZ31HS and (b) AZ61LS
and AZ61HS deformed at 300 C at a strain rate of 5× 10⁻³ s−1. . . . 112
4.23 The stress-strain curves of (a) AZ31LS and AZ31HS and (b) AZ61LS
and AZ61HS deformed at 350 C at a strain rate of 5× 10⁻³ s−1. . . . 113
4.24 The stress-strain curves of (a) AZ31LS and AZ31HS and (b) AZ61LS
and AZ61HS deformed at 400 C at a strain rate of 5× 10⁻³ s−1. . . . 113
4.25 The stress-strain curves of (a) AZ31LS and AZ31HS and (b) AZ61LS
and AZ61HS deformed at 450 C at a strain rate of 5× 10⁻³ s−1. . . . 114
4.26 A plot of the strain hardening rate, Θ, against the flow stress. . . . . 115
4.27 Determination of the activation energy . . . . . . . . . . . . . . . . . 116
4.28 The relationship between normalised strain rate and flow stress . . . 117
4.29 The ef of the sand-cast alloys at (a) 300, (b) 350, (c) 400 and (d) 450 C.118
4.30 The strain rate sensitivity (m) values of the sand-cast alloys are shown
for (a) 300, (b) 350, (c) 400 and (d) 450 C deformed at a strain rate
of 5× 10⁻⁴ s−1. . . . . . . . . . . . . . . . . . . . . . . . . . . . . . . 119
4.31 Pareto charts of the calculated half effects of the variables . . . . . . 120
4.32 The growth of the grains in (a) AZ31LS, (b) AZ31HS, (c) AZ61 and
(d) AZ61HS during deformation . . . . . . . . . . . . . . . . . . . . . 121
4.33 The average grain sizes of the grip and gauge sections of the deformed
tensile specimens of (a) AZ31LS and (b) AZ31HS . . . . . . . . . . . 122
4.34 The average dg and dgr of the deformed tensile specimens of (a) AZ61LS
and (b) AZ61HS . . . . . . . . . . . . . . . . . . . . . . . . . . . . . 123
4.35 The average dg of (a) AZ31LS and AZ31HS and (b) AZ61LS and
AZ61HS are plotted as a function of ef . . . . . . . . . . . . . . . . . . 124
4.36 Grain sizes at (a) 350 and (b) 450 C in the gauge and grip regions of
the sand-cast alloys. . . . . . . . . . . . . . . . . . . . . . . . . . . . 124
4.37 The instantaneous strain rate sensitivity (m∗) values are plotted as a
function of strain for the sand-cast (a) AZ31LS and (b) AZ31HS for
350 and 400 C . . . . . . . . . . . . . . . . . . . . . . . . . . . . . . 125
4.38 The instantaneous strain rate sensitivity (m∗) values are plotted as a
function of strain . . . . . . . . . . . . . . . . . . . . . . . . . . . . . 126
4.39 Plots of the variations of the grain size during deformation . . . . . . 126
4.40 The optical micrographs showing the cavities at the gauge section of
AZ31LS deformed at (a) 300 and (b) 350 C . . . . . . . . . . . . . . 128
4.41 The optical micrographs showing the cavities at the gauge section of
AZ31LS deformed at (a) 400 and (b) 450 C . . . . . . . . . . . . . . 128
4.42 The optical micrographs showing the cavities at the gauge section of
the sand-cast AZ31HS deformed at (a) 300 and (b) 350 C . . . . . . 129
8
4.43 The optical micrographs showing the cavities at the gauge section of
the sand-cast AZ31HS deformed at (a) 400 and (b) 450 C . . . . . . 129
4.44 An optical micrograph of the sand-cast AZ31HS showing the positions
of the cavities deformed up to ε = 0.80 at 350 C . . . . . . . . . . . . 130
5.1 SEM images of the gauge surfaces of AZ61HC pre-strained to 0.80–1.05
at 350 C at a constant strain rate of 5× 10⁻⁴ s−1. . . . . . . . . . . . 132
5.2 SEM images of the gauge surfaces of AZ61LC pre-strained to (a) 0.80
and (b) 0.90 at 350 C at a constant strain rate of 5× 10⁻⁴ s−1. . . . 133
5.3 The development of the cavities at strain of a) 1.00 and b) 1.05 for
AZ61LC at temperature 350 C deformed at a strain rate of 5×10⁻⁴ s−1.134
5.4 Plots showing cavity volume fraction (Vc) at different strains for (a)
AZ31LC and AZ31HC and (b) AZ61LC and AZ61HC. . . . . . . . . 134
5.5 Plots of probability distribution functions of dcav of AZ31LC . . . . . 135
5.6 Plots of probability distribution functions of dcav of AZ31HC . . . . . 136
5.7 Plots of probability distribution functions of dcav of AZ61LC . . . . . 136
5.8 Plots of probability distribution functions of cavity diameter (dcav) of
AZ61HC . . . . . . . . . . . . . . . . . . . . . . . . . . . . . . . . . . 137
5.9 A plot showing the comparison of the total number of cavities at
different strain of AZ31LC and AZ61HC. . . . . . . . . . . . . . . . . 138
5.10 A comparison between 2D surface view and 3D volume . . . . . . . . 139
5.11 Reconstructed and rendered 3D sub-volumes of AZ61HC showing a)
the particles and the cavities, and b) only cavities. . . . . . . . . . . . 140
5.12 3D rendered images of AZ61HC at ε = 1.05 showing a) the direction
of two growing cavities and b) the initial process of coalescence. . . . 141
5.13 The complex shapes of the cavities of AZ61HC . . . . . . . . . . . . . 142
5.14 3D rendered images of particles showing different morphologies . . . . 142
5.15 3D rendered images showing a) the agglomeration effect on particles
and b) the effect of agglomeration on cavitation. . . . . . . . . . . . . 143
5.16 3D rendered images of AZ1H showing particle/cavity interfaces. . . . 144
5.17 A semi-log plot of the probability distribution function of the particle
diameter (dp) of AZ61HC from the 3D data set. . . . . . . . . . . . . 145
5.18 A semi-log plot of probability distribution functions of the diameters
of the cavities of AZ61HC . . . . . . . . . . . . . . . . . . . . . . . . 146
5.19 Schematic representations of the methodologies developed for the de-
termination of particle/cavity association using 3D data-set. . . . . . 148
5.20 Plots of the determination of particle/cavity association . . . . . . . . 149
5.21 Determination of the sizes of the particles truly nucleating cavities. . 150
5.22 A plot showing sintering time required for different cavity radii (rcav). 151
9
5.23 Histograms of orientation of the cavities separated based on their sizes
for AZ61HC at ε=0.80. . . . . . . . . . . . . . . . . . . . . . . . . . 155
5.24 Histograms of orientation of the cavities separated based on their sizes
for AZ61HC at ε=0.90. . . . . . . . . . . . . . . . . . . . . . . . . . 155
5.25 Histograms of orientation of the cavities separated based on their sizes
for AZ61HC at ε=1.00. . . . . . . . . . . . . . . . . . . . . . . . . . 156
5.26 Histograms of orientation of the cavities separated based on their sizes
for AZ61HC at ε=1.05. . . . . . . . . . . . . . . . . . . . . . . . . . 156
5.27 Histograms of circularity (shape factor) of the cavities separated based
on their sizes for AZ61HC deformed at ε=0.80. . . . . . . . . . . . . 157
5.28 Histograms of circularity (shape factor) of the cavities separated based
on their sizes for AZ61HC deformed at ε=0.90. . . . . . . . . . . . . 157
5.29 Histograms of circularity (shape factor) of the cavities separated based
on their sizes for AZ61HC deformed at ε=1.00. . . . . . . . . . . . . 158
5.30 Histograms of circularity (shape factor) of the cavities separated based
on their sizes for AZ61HC deformed at ε=1.05. . . . . . . . . . . . . 158
5.31 Cavity growth rates at different cavity radii using different growth
models. . . . . . . . . . . . . . . . . . . . . . . . . . . . . . . . . . . 159
5.32 Histograms of orientation of cavities separated based on their sizes for
AZ61HC at ε=0.80 from the µCT data. . . . . . . . . . . . . . . . . 160
5.33 Histograms of orientation of cavities separated based on their sizes for
AZ61HC at ε=0.90 from the µCT data. . . . . . . . . . . . . . . . . 161
5.34 Histograms of orientation of cavities separated based on their sizes for
AZ61HC at ε=1.00 from the µCT data. . . . . . . . . . . . . . . . . 161
5.35 Histograms of orientation of cavities separated based on their sizes for
AZ61HC at ε=1.05 from the µCT data. . . . . . . . . . . . . . . . . 162
5.36 Plots of aspects ratios, a/b (elongation) vs b/c (flatness), of AZ61HC
at the strain of (a) 0.80, (b) 0.90, (c) 1.00 and (d) 1.05. . . . . . . . . 163
5.37 Histograms of orientation of cavities classified based on their aspect
ratios for AZ61HC, deformed at 350 C at a strain rate of 5× 10⁻⁴
s−1, at the strain of (a) 0.80, (b) 0.90, (c) 1.00 and (d) 1.05. . . . . . 164
5.38 A plot of number of the cavities, classified into spheroids, elliptical and
rod-like shapes. . . . . . . . . . . . . . . . . . . . . . . . . . . . . . . 165
5.39 A plot of cavity growth rate (dr/dε) . . . . . . . . . . . . . . . . . . . 165
5.40 A comparison between theoretical and experimental cavity growth rate
parameter (η) . . . . . . . . . . . . . . . . . . . . . . . . . . . . . . . 166
5.41 A comparison between theoretical and experimental cavity growth rate
parameter (η) . . . . . . . . . . . . . . . . . . . . . . . . . . . . . . . 167
10
Abstract
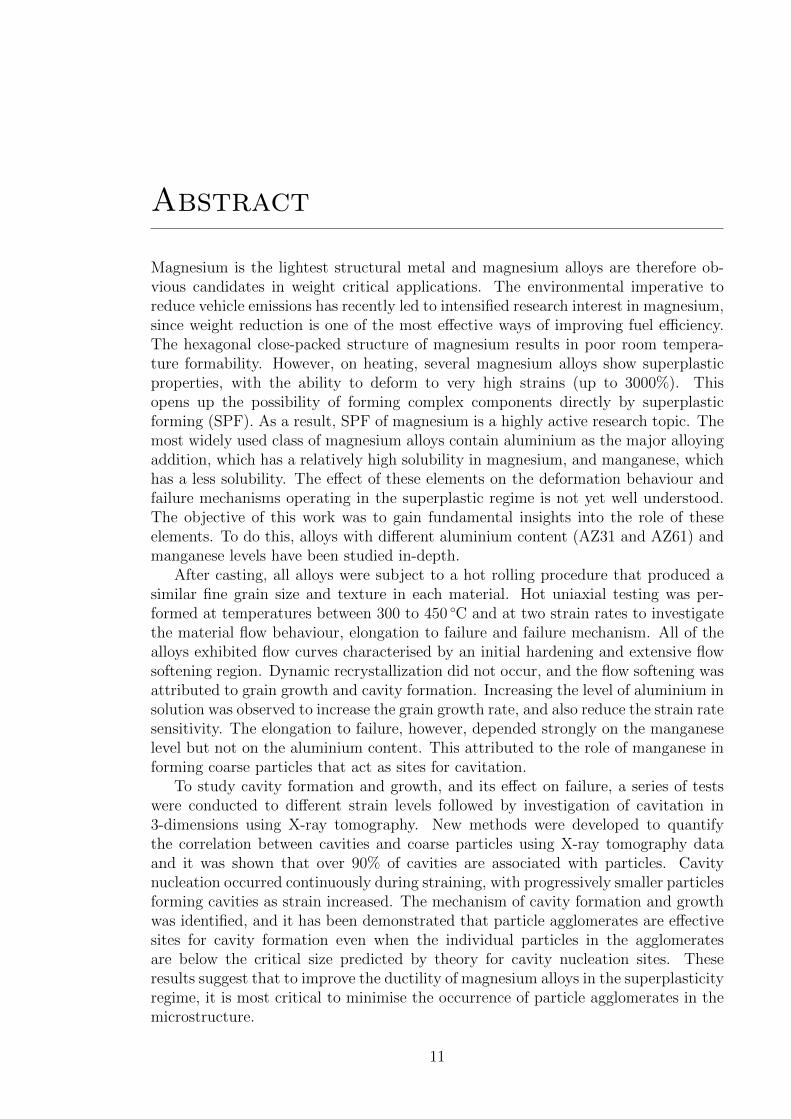
Magnesium is the lightest structural metal and magnesium alloys are therefore ob-vious candidates in weight critical applications. The environmental imperative toreduce vehicle emissions has recently led to intensified research interest in magnesium,since weight reduction is one of the most effective ways of improving fuel efficiency.The hexagonal close-packed structure of magnesium results in poor room tempera-ture formability. However, on heating, several magnesium alloys show superplasticproperties, with the ability to deform to very high strains (up to 3000%). Thisopens up the possibility of forming complex components directly by superplasticforming (SPF). As a result, SPF of magnesium is a highly active research topic. Themost widely used class of magnesium alloys contain aluminium as the major alloyingaddition, which has a relatively high solubility in magnesium, and manganese, whichhas a less solubility. The effect of these elements on the deformation behaviour andfailure mechanisms operating in the superplastic regime is not yet well understood.The objective of this work was to gain fundamental insights into the role of theseelements. To do this, alloys with different aluminium content (AZ31 and AZ61) andmanganese levels have been studied in-depth.
After casting, all alloys were subject to a hot rolling procedure that produced asimilar fine grain size and texture in each material. Hot uniaxial testing was per-formed at temperatures between 300 to 450 C and at two strain rates to investigatethe material flow behaviour, elongation to failure and failure mechanism. All of thealloys exhibited flow curves characterised by an initial hardening and extensive flowsoftening region. Dynamic recrystallization did not occur, and the flow softening wasattributed to grain growth and cavity formation. Increasing the level of aluminium insolution was observed to increase the grain growth rate, and also reduce the strain ratesensitivity. The elongation to failure, however, depended strongly on the manganeselevel but not on the aluminium content. This attributed to the role of manganese informing coarse particles that act as sites for cavitation.
To study cavity formation and growth, and its effect on failure, a series of testswere conducted to different strain levels followed by investigation of cavitation in3-dimensions using X-ray tomography. New methods were developed to quantifythe correlation between cavities and coarse particles using X-ray tomography dataand it was shown that over 90% of cavities are associated with particles. Cavitynucleation occurred continuously during straining, with progressively smaller particlesforming cavities as strain increased. The mechanism of cavity formation and growthwas identified, and it has been demonstrated that particle agglomerates are effectivesites for cavity formation even when the individual particles in the agglomeratesare below the critical size predicted by theory for cavity nucleation sites. Theseresults suggest that to improve the ductility of magnesium alloys in the superplasticityregime, it is most critical to minimise the occurrence of particle agglomerates in themicrostructure.
11

Declaration
No portion of the work referred to in the thesis has been
submitted in support of an application for another degree
or qualification of this or any other university or other
institute of learning.
12

Copyright
i. The author of this thesis (including any appendices and/or schedules to this
thesis) owns certain copyright or related rights in it (the “Copyright”) and s/he
has given The University of Manchester certain rights to use such Copyright,
including for administrative purposes.
ii. Copies of this thesis, either in full or in extracts and whether in hard or
electronic copy, may be made only in accordance with the Copyright, Designs
and Patents Act 1988 (as amended) and regulations issued under it or, where
appropriate, in accordance with licensing agreements which the University has
from time to time. This page must form part of any such copies made.
iii. The ownership of certain Copyright, patents, designs, trade marks and other
intellectual property (the “Intellectual Property”) and any reproductions of
copyright works in the thesis, for example graphs and tables (“Reproductions”),
which may be described in this thesis, may not be owned by the author and may
be owned by third parties. Such Intellectual Property and Reproductions can-
not and must not be made available for use without the prior written permission
of the owner(s) of the relevant Intellectual Property and/or Reproductions.
iv. Further information on the conditions under which disclosure, publication and
commercialisation of this thesis, the Copyright and any Intellectual Property
and/or Reproductions described in it may take place is available in the Uni-
versity IP Policy (see http://www.campus.manchester.ac.uk/medialibrary/policies/
intellectual-property.pdf), in any relevant Thesis restriction declaration deposited
in the University Library, The University Library’s regulations (see http://www.
manchester.ac.uk/library/aboutus/regulations) and in The University’s policy on
presentation of Theses.
13
Acknowledgements
I would like to thank my supervisor, Dr. Joseph D. Robson, for his wonderful guidance
throughout the course of my research work. I am indebted to him for his continual
encouragement and support to carry out the current study.
My appreciation extends to my co-supervisor, Prof Pete S. Bate, who provided
inspiration and helped to understand the critical aspects of the current work. Lessons
learnt from him about looking into problems from different perspectives were invalu-
able.
I would like to thank EPSRC and Magnesium Elektron for the financial support
for the project.
I would like to acknowledge Dr. R. Bradley for his suggestions about tomography.
I greatly appreciate the assistance from M. McDerby, J. S. Perrin and G. Leaver
of Research Computing Services of the University of Manchester. I would also like
to thank Dr. J. Fonseca for his guidance in Matlab and F. Garcia-pastor for his
suggestions about data analysis. Thanks are due to the technical staff S. Dover, K.
Gyves, M. Faulkner and workshop lads, and administrative staff O. Richert and S.
Kershaw for their cooperation.
I would sincerely thank my colleagues in the Light Alloys Processing group for
the enjoyable time I have passed with them. Special thanks go to A. Twier, Dr. O.
Rofman, A. Antonysamy and L. Campbell for their help. I am grateful to my friends
in Manchester, in particular Dr. J. Siddiqui and Dr. M. Tamal, for the wonderful
time throughout the last couple of years.
I am grateful for the support and motivation from my parents and younger brother
and thanks to them for believing in me.
Finally, I would like to thank Tanjila for her patience and support.
This thesis was written in LATEX 2ε typesetting system, using a customised class file (muthesis)originally prepared by G. D. Gough of the School of Computer Science of The University ofManchester.
14

To my Parents
15

List of Symbols and
Abbreviations
ε strain rate
µCT X-ray micro-tomography
DGB grain boundary diffusion coefficient
DL lattice diffusion coefficient
QL activation energy for lattice diffusion
QGB activation energy for grain boundary diffusion
Q activation energy
T absolute temperature
Vc cavity volume fraction
b Burgers vector
σ true/flow stress
ε true strain
d grain size
ef elongation to failure
m strain rate sensitivity
n stress exponent
w strain hardening coefficient
2D 2-dimensional
3D 3-dimensional
ANOVA analysis of variance
BSE back-scattered electron
CCD charge-coupled device
CRSS critical resolved shear stress
DRX dynamic recrystallization
EBSD electron back-scattered diffraction
16

ECAP equal channel angular pressing
EDX energy dispersive x-ray
GBS grain boundary sliding
HPT high pressure torsion
MSB mean square between
MSE mean square error
OPS oxide particle suspension
PDF probability distribution function
RD rolling direction
SE standard error
SEM scanning electron microscopy
TA tensile axis
17
Chapter 1
Introduction
Magnesium was discovered in 1808 by Sir Humphrey Davy, but it started to receive
attention in mid-nineteenth century in Germany and its major use was in aircraft
and military applications. During the post World War I era, magnesium gained
some interest in the automobile industry, but remained mostly limited to military
uses. For many years, magnesium was primarily used as an alloying element in
aluminium alloy production industries and desulphurising of steel, with very limited
use in wrought products, such as sheet, for the space industry. However, partly
owing to the CAFE (Corporate Average Fuel Economy) legislation enacted by the
US government and public interest in fuel-efficient vehicles, the demand of using
magnesium in the automobile industry has increased in the twenty-first century. In
fact, the demand for die-cast parts of magnesium has increased by 11.5% per year
during the period of 1993 to 2003 (King, 2007). Recent increase in magnesium usage
is largely due to the development of more corrosion resistant alloys and the decrease
of magnesium prices by the cheap Chinese production route. Die-cast magnesium
alloys made their way into the automobile arena, at first, in a Volkswagen car for the
crankcases and the transmission housing shortly after World War II (Mordike et al.,
2006). At present, heavy body components such as dashboard supports—made by
steel—are being replaced by magnesium cast alloys. Some examples of other areas
where cast alloys are being used include gearbox housings and engine blocks.
In contrast, wrought magnesium alloys have not yet achieved widespread ap-
plications in the automobile industry. Alloys made by rolling and extrusion were
used from the mid-twentieth century in Samsonite luggage, military aircraft and
space industries. But, in automobiles, the application of wrought alloys is still very
limited (Aghion et al., 2001). The key reason is the poor room temperature formability
due to basal slip and twinning being the only easy deformation modes at room
temperature. Also, anisotropy and asymmetry of properties due to strong texture
of the wrought materials make magnesium alloys difficult to process and design with,
and thus less attractive. However, prototypes are being made from sheet products
18
Chapter 1. Introduction
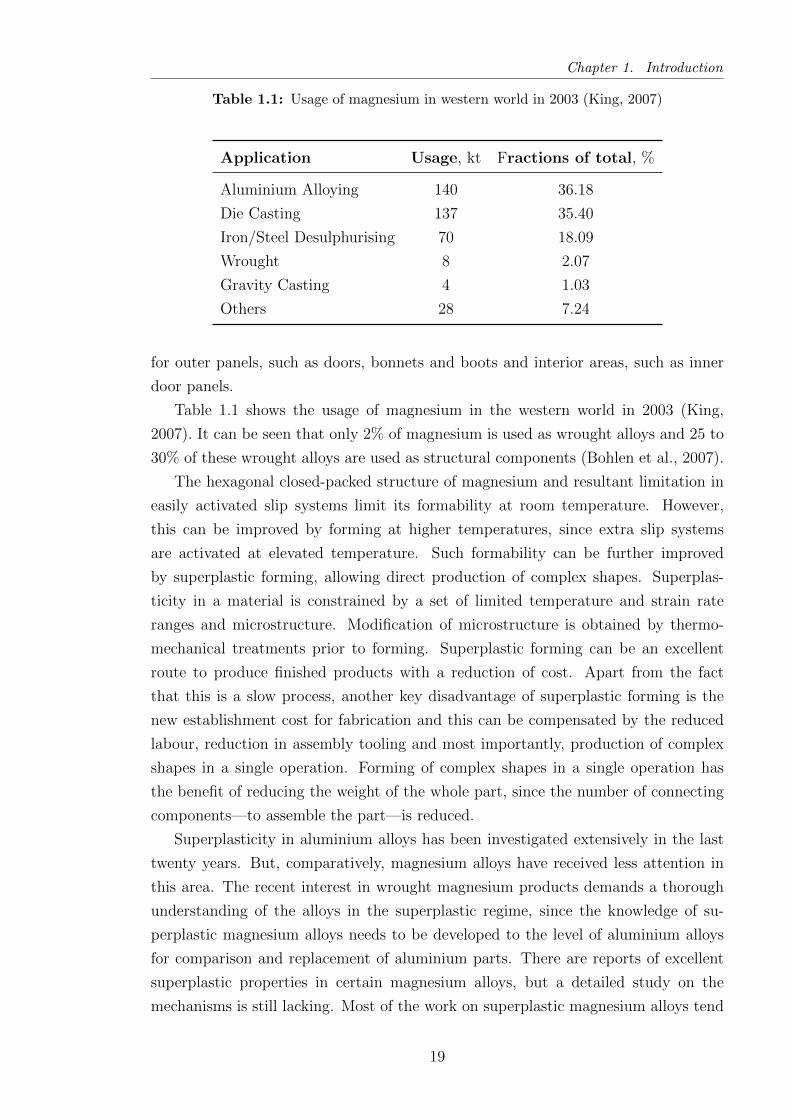
Table 1.1: Usage of magnesium in western world in 2003 (King, 2007)
Application Usage, kt Fractions of total, %
Aluminium Alloying 140 36.18
Die Casting 137 35.40
Iron/Steel Desulphurising 70 18.09
Wrought 8 2.07
Gravity Casting 4 1.03
Others 28 7.24
for outer panels, such as doors, bonnets and boots and interior areas, such as inner
door panels.
Table 1.1 shows the usage of magnesium in the western world in 2003 (King,
2007). It can be seen that only 2% of magnesium is used as wrought alloys and 25 to
30% of these wrought alloys are used as structural components (Bohlen et al., 2007).
The hexagonal closed-packed structure of magnesium and resultant limitation in
easily activated slip systems limit its formability at room temperature. However,
this can be improved by forming at higher temperatures, since extra slip systems
are activated at elevated temperature. Such formability can be further improved
by superplastic forming, allowing direct production of complex shapes. Superplas-
ticity in a material is constrained by a set of limited temperature and strain rate
ranges and microstructure. Modification of microstructure is obtained by thermo-
mechanical treatments prior to forming. Superplastic forming can be an excellent
route to produce finished products with a reduction of cost. Apart from the fact
that this is a slow process, another key disadvantage of superplastic forming is the
new establishment cost for fabrication and this can be compensated by the reduced
labour, reduction in assembly tooling and most importantly, production of complex
shapes in a single operation. Forming of complex shapes in a single operation has
the benefit of reducing the weight of the whole part, since the number of connecting
components—to assemble the part—is reduced.
Superplasticity in aluminium alloys has been investigated extensively in the last
twenty years. But, comparatively, magnesium alloys have received less attention in
this area. The recent interest in wrought magnesium products demands a thorough
understanding of the alloys in the superplastic regime, since the knowledge of su-
perplastic magnesium alloys needs to be developed to the level of aluminium alloys
for comparison and replacement of aluminium parts. There are reports of excellent
superplastic properties in certain magnesium alloys, but a detailed study on the
mechanisms is still lacking. Most of the work on superplastic magnesium alloys tend
19

Chapter 1. Introduction
to report only on producing ultra-fine grained alloys and demonstrating excellent
elongation to failure. This is partly to demonstrate the better performance compared
to aluminium. As will be discussed in the next chapter, strain rate sensitivity is one
of the prime factors controlling superplastic behaviour. It is, therefore, necessary
to understand the effect of aluminium, the common alloying element in wrought
magnesium alloys, on strain rate sensitivity. If higher sensitivity is obtained by
adding aluminium, larger strains to failure are expected.
Despite having a large strain rate sensitivity, an alloy may fail early by cavitation.
Though cavitation in a magnesium alloy during hot deformation was reported ap-
proximately 40 years ago, surprisingly, detailed studies of cavitation are very limited.
The presence of particles is, in general, considered to provide sites for nucleation of
cavities, but their influence on the formation of cavities in magnesium alloys is not yet
understood. Temperature and strain induced grain growth also play important roles
during cavitation. It is therefore necessary to understand the fundamental behaviour
of cavitation during hot deformation of wrought magnesium alloys.
Two wrought alloys, AZ31 (Mg-3%Al-1%Zn) and AZ61 (Mg-6%Al-1%Zn), were
studied at two different manganese contents. The alloys were cast in Magnesium
Elektron, UK, followed by hot rolling to produce a refined microstructure. Uniaxial
tensile tests were carried out at different test conditions from the sheet specimens.
Observation of the failed specimens revealed that cavitation was the failure mode of
the alloys. Consequently, a detailed study was performed on cavitation behaviour
of the alloys by scanning electron microscopy. The inability of scanning electron
microscopy for the determination of particle/cavity association was recognised and
further examination was carried out by X-ray micro-tomography.
The study is divided into four parts. Chapter 2 contains a survey of literature
for superplasticity and cavitation during hot deformation. Different mechanisms of
superplasticity are highlighted and examples of superplasticity in magnesium alloys
are introduced and compared with the known mechanisms of superplasticity. Subse-
quently, a substantial survey of cavitation during hot deformation is presented and
the shortcomings of the limited cavitation studies in magnesium alloys are discussed.
Together with the discussion of magnesium alloys in the superplastic regime and their
cavitation behaviour, a justification is made for the current study.
Chapter 3 gives the experimental procedures applied for hot rolling, hot uniaxial
tests, optical and scanning electron microscopy and X-ray micro-tomography of the
materials. The statistical methods used are also briefly mentioned. Since tomography
is a new field in materials science, a short note on the principles of tomography is
presented and followed by the methodology used for reading raw data from tomog-
raphy.
20
Chapter 1. Introduction
Chapter 4 includes the results of hot deformation behaviour of the alloys inves-
tigated. At first, the refinement of grain size by hot rolling is discussed followed by
flow characteristics of the alloys under different temperatures and strain rates. Gauge
regions of the tensile specimens are shown and the evidence of concurrent grain growth
is outlined. By analysis of variance (ANOVA), the contribution of aluminium and
manganese contents on strain rate sensitivity is also estimated. Together with the
strain rate sensitivity of flow and grain growth observations, a final judgement on the
mechanisms of superplasticity is presented. It is however noteworthy that the alloys
investigated in this project did not show true superplastic properties, such as very
high strains to failure or strain rate sensitivity values typical of superplastic alloys,
in the applied test temperature and strain rate ranges. As the results obtained from
this work did not show true superplastic properties and cavitation was identified to
govern failure of the test materials, the focus of this project was modified to a detailed
cavitation study.
Chapter 5 gives a detailed study on cavitation behaviour of the alloys. Exam-
inations of the gauge regions were performed at different pre-set strains and qual-
itative and quantitative analyses are presented using optical and scanning electron
microscopy. The need for three-dimensional investigation in the cavitation study
is identified and an examination of cavities and particles is performed by X-ray
micro-tomography. Methodologies developed for the determination of particle/cavity
association are outlined and applied to determine the existence of any true par-
ticle/cavity association. Using the raw data from tomography, true particle and
cavity dimensions, their orientations with the stress axis and their shapes are also
determined. Combining the data from scanning electron microscopy and tomography,
the nucleation sites and growth of cavities are investigated in depth.
In the final chapter, the key points, extracted from this study of hot deformation
and cavitation analysis, are presented.
21
Chapter 2
Literature Review
2.1 Magnesium and Its Alloys
Magnesium is an alkaline earth metal having an atomic number of 12. The crystal
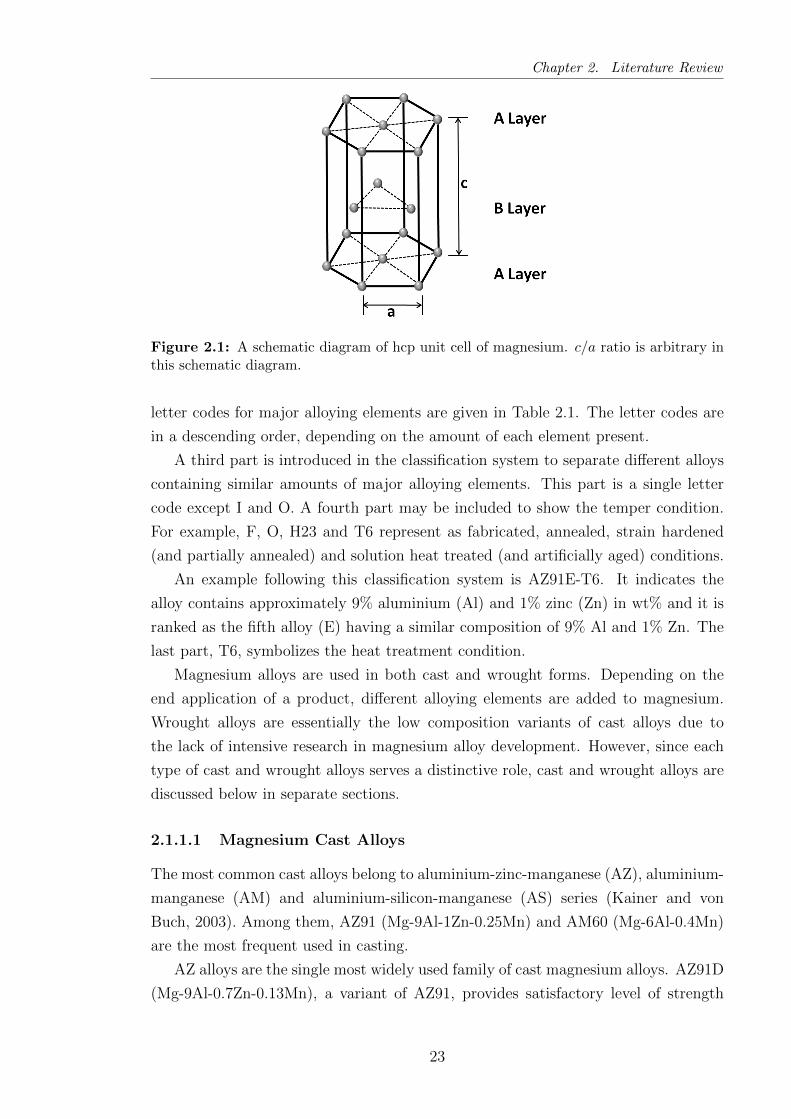
structure of magnesium is hexagonal close-packed (hcp). In Fig. 2.1, a unit cell of
magnesium is shown with the atomic arrangement of alternative atom stacking layers
of ABAB, where the lattice parameters are a = b 6= c. In an ideal stacking of atoms in
ABAB layers in an hcp structure, the c/a ratio is 1.633. The c/a ratio of magnesium is
1.6236 (von Batchelder and Raeuchle, 1957), very close to that of an ideal hexagonal
unit cell. A key advantage of magnesium is the atomic diameter of 0.32 nm which
allows favourable solid solutions with several metals, such as aluminium and zinc.
The low density of magnesium (1.738 g cm−3) makes it the lightest structural metal
(approximately 35% lower density than aluminium).
Inherently, the hcp crystal structure of magnesium restricts the number of inde-
pendent slip systems and hence deformation at room temperature is limited. This
is discussed further in Section 2.1.3. Mechanical properties of pure magnesium are
comparatively poor. Tensile yield strength and elongation to failure (ef ) of a rolled
sheet of 99.90 wt% magnesium are approximately 115 to 140 MPa and 2 to 10%
respectively at room temperature (Erickson, 1990). To enhance such mechanical prop-
erties and deformability, it is therefore necessary to add some alloying elements which
can modify certain characteristics of the pure material by solid solution strengthening,
precipitation hardening or grain size refinement.
2.1.1 Classification of Magnesium Alloys
The ASTM (American Society for Testing Materials) adopted method for designating
magnesium alloys is widely used. The first part of the designation contains letter
codes for two major alloying elements and the second part consists of the nominal
compositions (in wt%) of those major elements, rounded to whole numbers. The
22
Chapter 2. Literature Review
Figure 2.1: A schematic diagram of hcp unit cell of magnesium. c/a ratio is arbitrary inthis schematic diagram.
letter codes for major alloying elements are given in Table 2.1. The letter codes are
in a descending order, depending on the amount of each element present.
A third part is introduced in the classification system to separate different alloys
containing similar amounts of major alloying elements. This part is a single letter
code except I and O. A fourth part may be included to show the temper condition.
For example, F, O, H23 and T6 represent as fabricated, annealed, strain hardened
(and partially annealed) and solution heat treated (and artificially aged) conditions.
An example following this classification system is AZ91E-T6. It indicates the
alloy contains approximately 9% aluminium (Al) and 1% zinc (Zn) in wt% and it is
ranked as the fifth alloy (E) having a similar composition of 9% Al and 1% Zn. The
last part, T6, symbolizes the heat treatment condition.
Magnesium alloys are used in both cast and wrought forms. Depending on the
end application of a product, different alloying elements are added to magnesium.
Wrought alloys are essentially the low composition variants of cast alloys due to
the lack of intensive research in magnesium alloy development. However, since each
type of cast and wrought alloys serves a distinctive role, cast and wrought alloys are
discussed below in separate sections.
2.1.1.1 Magnesium Cast Alloys
The most common cast alloys belong to aluminium-zinc-manganese (AZ), aluminium-
manganese (AM) and aluminium-silicon-manganese (AS) series (Kainer and von
Buch, 2003). Among them, AZ91 (Mg-9Al-1Zn-0.25Mn) and AM60 (Mg-6Al-0.4Mn)
are the most frequent used in casting.
AZ alloys are the single most widely used family of cast magnesium alloys. AZ91D
(Mg-9Al-0.7Zn-0.13Mn), a variant of AZ91, provides satisfactory level of strength
23
Chapter 2. Literature Review
Table 2.1: Letter codes for major alloying elements of magnesium alloys
Letter Code Element Example Composition (wt%)a
A Aluminium AZ31 3Al-1Zn
C Copper ZC63 6Zn-3Cu
E Rare Earth (RE) EQ21 2.1Di-1.5Ag
H Thorium HK31 3Th-0.6Zr
K Zirconium K1A 0.7Zr
L Lithium LA141 14Li-1Al
M Manganese AM60 6Al-0.13Mn
Q Silver QE22 2.5Ag-2RE
S Silicon AS41 4.3Al-1Si
W Yttrium WE43 4Y-3.4RE
Z Zinc ZK61 6Zn-0.7Zra Remaining is magnesium and some minor inclusions of other alloying elements.
at room temperature, good castability and moderate corrosion resistance in salt-
water (Housh et al., 1990). AZ91E (Mg-8.7Al-0.7Zn-0.13Mn), a high-purity variant
of AZ91, containing lower amount of iron, nickel and copper, gives better resistance
to corrosion in salt-water (Polmear, 2006). In AZ alloys, the Mg17Al12 phase is
formed in the as-cast condition when the aluminium content is greater than 2%.
Heat treatment at 420 C can dissolve this phase in solution, contributing to solid
solution strengthening. Though this phase is beneficial for strengthening, its presence
is responsible for lowering of elongation to failure (ef ), especially when the aluminium
content is greater than 8% (Polmear, 2006).
If an application requires higher ductility and fracture toughness, then AM alloys
(containing 0.2 to 0.4 manganese) become an alternative option. One such alloy,
AM60B (Mg-6Al-0.13Mn), has a lower aluminium content than AZ91D, but yield
strength and tensile strength are comparable to AZ91D (Housh et al., 1990). The
improvement in ef arises from the reduction of the volume fraction of the Mg17Al12
phase at grain boundaries. AM alloys are used in wheels, seat frames and steering
wheels in automobiles.
A major drawback of AZ alloys is their poor creep resistance. They provide good
resistance up to a maximum of 110 to 120 C (Polmear, 2006). Alloys of AS series can
provide better creep resistance up to 150 C (Mordike et al., 2006) by reducing the
amount of thermally unstable Mg17Al12 phase and forming the highly stable Mg2Si
phase. AS41 (Mg-4Al-1Si-0.4Mn) was used in the crankcases of the Volkswagen
Beetle, which for a long time was the single largest application for magnesium alloys.
An improvement in creep resistance of alloys containing aluminium as the prime
24
Chapter 2. Literature Review
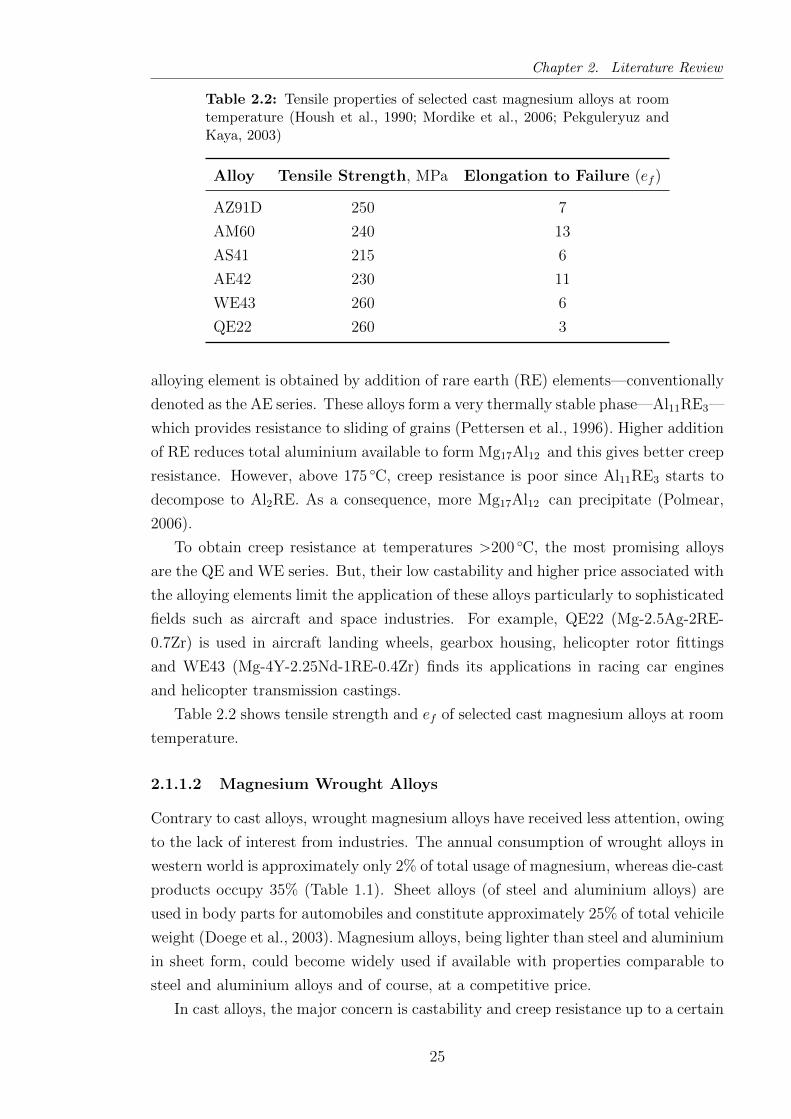
Table 2.2: Tensile properties of selected cast magnesium alloys at roomtemperature (Housh et al., 1990; Mordike et al., 2006; Pekguleryuz andKaya, 2003)
Alloy Tensile Strength, MPa Elongation to Failure (ef )
AZ91D 250 7
AM60 240 13
AS41 215 6
AE42 230 11
WE43 260 6
QE22 260 3
alloying element is obtained by addition of rare earth (RE) elements—conventionally
denoted as the AE series. These alloys form a very thermally stable phase—Al11RE3—
which provides resistance to sliding of grains (Pettersen et al., 1996). Higher addition
of RE reduces total aluminium available to form Mg17Al12 and this gives better creep
resistance. However, above 175 C, creep resistance is poor since Al11RE3 starts to
decompose to Al2RE. As a consequence, more Mg17Al12 can precipitate (Polmear,
2006).
To obtain creep resistance at temperatures >200 C, the most promising alloys
are the QE and WE series. But, their low castability and higher price associated with
the alloying elements limit the application of these alloys particularly to sophisticated
fields such as aircraft and space industries. For example, QE22 (Mg-2.5Ag-2RE-
0.7Zr) is used in aircraft landing wheels, gearbox housing, helicopter rotor fittings
and WE43 (Mg-4Y-2.25Nd-1RE-0.4Zr) finds its applications in racing car engines
and helicopter transmission castings.
Table 2.2 shows tensile strength and ef of selected cast magnesium alloys at room
temperature.
2.1.1.2 Magnesium Wrought Alloys
Contrary to cast alloys, wrought magnesium alloys have received less attention, owing
to the lack of interest from industries. The annual consumption of wrought alloys in
western world is approximately only 2% of total usage of magnesium, whereas die-cast
products occupy 35% (Table 1.1). Sheet alloys (of steel and aluminium alloys) are
used in body parts for automobiles and constitute approximately 25% of total vehicile
weight (Doege et al., 2003). Magnesium alloys, being lighter than steel and aluminium
in sheet form, could become widely used if available with properties comparable to
steel and aluminium alloys and of course, at a competitive price.
In cast alloys, the major concern is castability and creep resistance up to a certain
25

Chapter 2. Literature Review
temperature. On the other hand, the key factor for wrought alloys is their formability.
The intrinsic restriction to plastic deformation of a magnesium alloy comes from the
hcp crystal structure of magnesium, limiting its deformation at room temperature
(see Section 2.1.3).
Due to the lack of commercial interest and research in magnesium alloys, only
a few wrought specific alloys have been developed, which are essentially the lower
alloying element varieties of cast alloys. The major alloying elements in magnesium
alloys form intermetallics at different temperatures, which may result in incipient
melting and hot cracking during thermo-mechanical treatments. This is one of
the reasons for using a lower fraction of aluminium in wrought AZ alloys. To
date, the major consumption of sheet products is in the photoengraving industries
and extruded products find their main usage in electrochemical applications—as a
sacrificial anode (Agnew, 2004).
Commercially used wrought alloys are dominated by the aluminium, zinc and
manganese containing alloys. The two alloy series most widely used are the AZ and
ZK alloys.
Alloys containing zinc and zirconium (ZK series) usually have the highest strength
amongst the commercially used non rare-earth magnesium wrought alloys, but their
failure strain compared to AZ alloys is slightly worse at room temperature. Zirconium
provides grain refinement and hence, strength is comparatively better in ZK series
alloys. One such alloy, ZK60, has received commercial interest.
In the AZ series, AZ31 and AZ61 have received the most interest and research
to improve their processing window and understand their formability. Table 2.3
shows the room temperature tensile properties of some wrought alloys. Increasing
aluminium content improves tensile strength, but a trade-off is required between
strength and forming of the alloy since higher aluminium content needs higher ex-
trusion loads and lower ram speeds (Davies and Barnett, 2004). To produce finished
product from the wrought alloys, superplastic forming is an alternative route and the
standard AZ magnesium alloys can be commercially processed to give a satisfactory
fine grain structure to enable them to show superplastic properties. To date, there
is no single magnesium alloy developed solely to meet the requirements of super-
plastic forming. Hence, commercially used AZ31, AZ61 and ZK60 alloys are being
investigated extensively to understand their superplastic behaviour.
2.1.2 Effects of Alloying Elements
It was mentioned earlier that the atomic diameter of magnesium allows suitable
alloying with different elements. One such example is aluminium (atomic diameter
is 0.282 nm). The atomic mismatch is approximately 13% and aluminium provides a
26

Chapter 2. Literature Review
Table 2.3: Room temperature tensile properties of selectedwrought alloys (Polmear, 1994; Stalmann et al., 2001)
Alloy Tensile Strength, MPa Elongation to Failure, (ef )
AZ31 240 11
AZ61 270 9
ZK60 315 8
MA18 210 30
solid solution strengthening effect when added to magnesium. Another such element
is zinc (atomic diameter is 0.276 nm) which provides even better solute strengthening.
The current study focuses on AZ alloys. The major alloying elements in these alloys
are aluminium, zinc and manganese at variable amounts. The effects of these elements
in alloying with magnesium are discussed below.
Aluminium
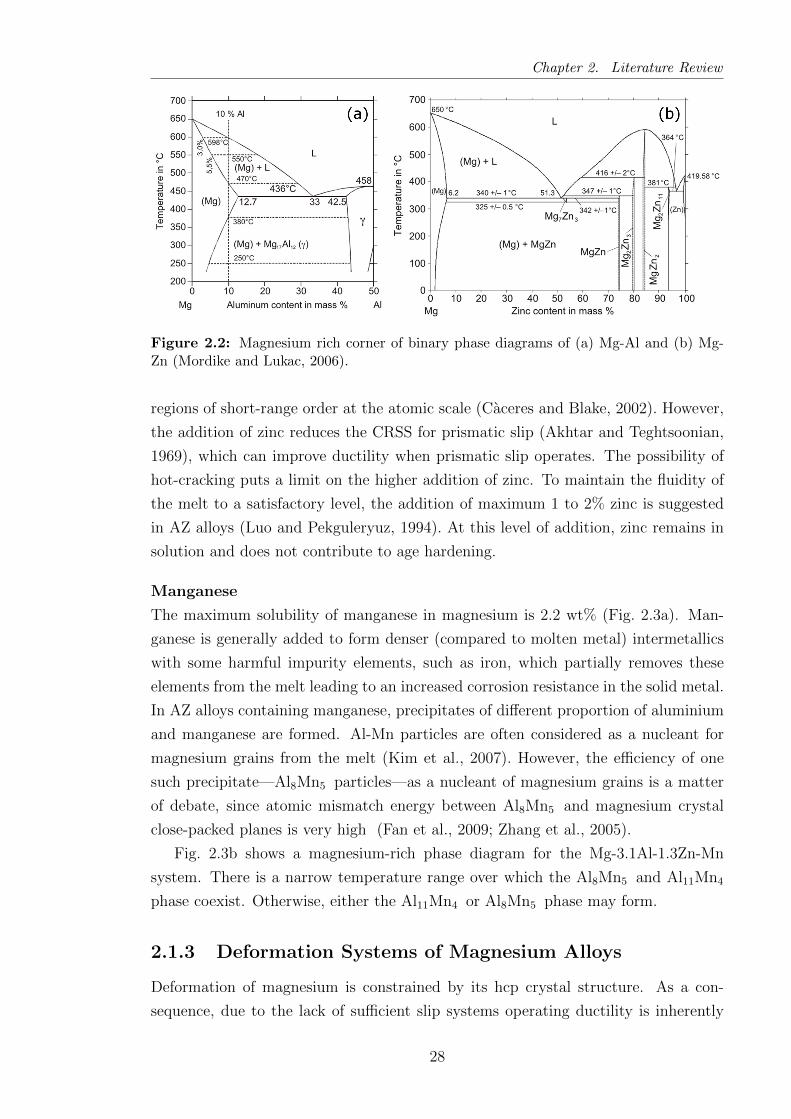
The maximum solubility of aluminium is 12.7 wt% in magnesium (Fig. 2.2a). Casta-
bility is improved with increasing aluminium since it improves fluidity of the melt (Luo
and Pekguleryuz, 1994). In contrast, increasing aluminium content increases the freez-
ing range and thus increases the chances of shrinkage porosity (Luo and Pekguleryuz,
1994). At room temperature, the maximum tensile strength is obtained at 8 to 10
wt% aluminium content (Polmear, 2006).
The solubility of aluminium is reduced from 12.7 wt% to approximately 2 wt%
at room temperature. This causes precipitation of brittle Mg17Al12 (44 wt% Al)
phase which has an adverse effect on properties. This low melting point (437 C)
eutectic phase can reduce creep resistance. This phase may form as a continuous
network around grain boundaries or discontinuous precipitation at boundaries, when
the cooling rate is slow.
The Mg17Al12 phase is precipitated on basal planes during ageing and is not
very effective at blocking basal dislocations (Clark, 1968). Moreover, this phase
precipitates as large laths during ageing and the ageing response is thus poor (Celotto,
2000). For this reason, addition of zinc (discussed below) is sometimes favoured to
strengthen the alloy.
Zinc
The second important alloying element in AZ alloys is zinc. Maximum solubility of
zinc in magnesium is 6.2 wt% (Fig. 2.2b). Like aluminium, it also enhances fluidity
of the melt. Zinc improves strength by solid solution strengthening by increasing
the critical resolved shear stress (CRSS) for basal slip (Polmear, 2006). Zinc is a
more efficient solute solution strengthening element than aluminium, as it forms
27
Chapter 2. Literature Review
Figure 2.2: Magnesium rich corner of binary phase diagrams of (a) Mg-Al and (b) Mg-Zn (Mordike and Lukac, 2006).
regions of short-range order at the atomic scale (Caceres and Blake, 2002). However,
the addition of zinc reduces the CRSS for prismatic slip (Akhtar and Teghtsoonian,
1969), which can improve ductility when prismatic slip operates. The possibility of
hot-cracking puts a limit on the higher addition of zinc. To maintain the fluidity of
the melt to a satisfactory level, the addition of maximum 1 to 2% zinc is suggested
in AZ alloys (Luo and Pekguleryuz, 1994). At this level of addition, zinc remains in
solution and does not contribute to age hardening.
Manganese
The maximum solubility of manganese in magnesium is 2.2 wt% (Fig. 2.3a). Man-
ganese is generally added to form denser (compared to molten metal) intermetallics
with some harmful impurity elements, such as iron, which partially removes these
elements from the melt leading to an increased corrosion resistance in the solid metal.
In AZ alloys containing manganese, precipitates of different proportion of aluminium
and manganese are formed. Al-Mn particles are often considered as a nucleant for
magnesium grains from the melt (Kim et al., 2007). However, the efficiency of one
such precipitate—Al8Mn5 particles—as a nucleant of magnesium grains is a matter
of debate, since atomic mismatch energy between Al8Mn5 and magnesium crystal
close-packed planes is very high (Fan et al., 2009; Zhang et al., 2005).
Fig. 2.3b shows a magnesium-rich phase diagram for the Mg-3.1Al-1.3Zn-Mn
system. There is a narrow temperature range over which the Al8Mn5 and Al11Mn4
phase coexist. Otherwise, either the Al11Mn4 or Al8Mn5 phase may form.
2.1.3 Deformation Systems of Magnesium Alloys
Deformation of magnesium is constrained by its hcp crystal structure. As a con-
sequence, due to the lack of sufficient slip systems operating ductility is inherently
28
Chapter 2. Literature Review
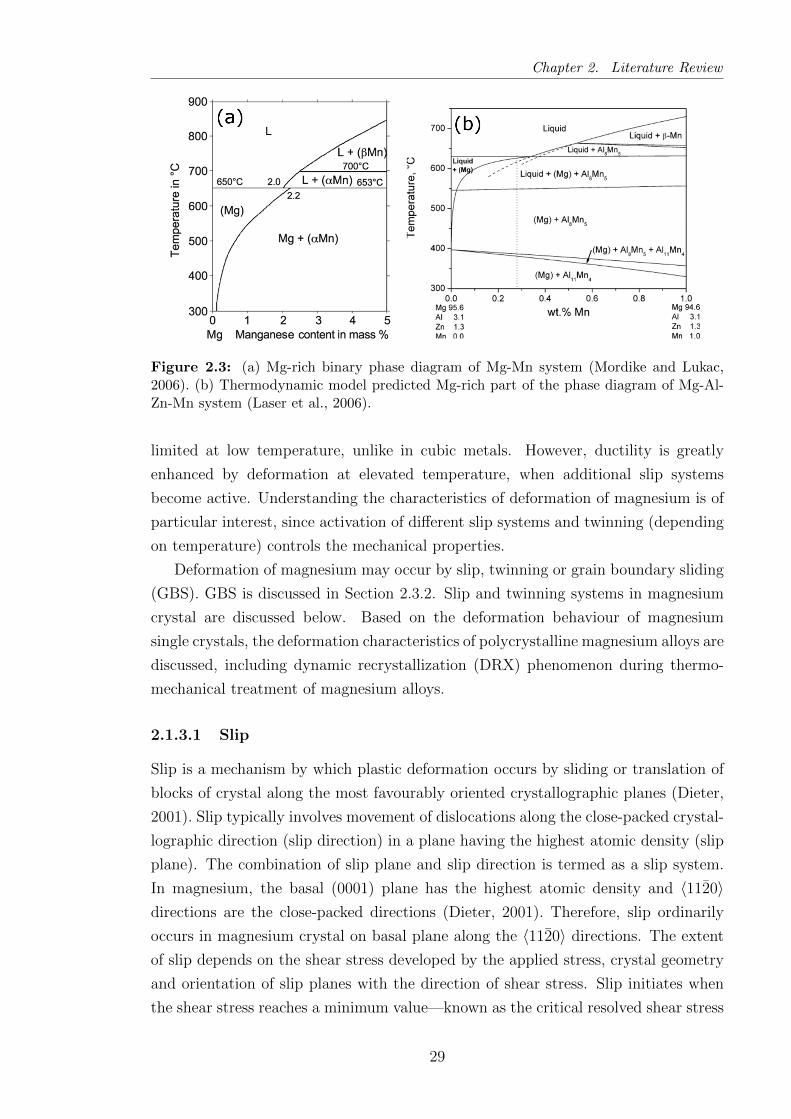
Figure 2.3: (a) Mg-rich binary phase diagram of Mg-Mn system (Mordike and Lukac,2006). (b) Thermodynamic model predicted Mg-rich part of the phase diagram of Mg-Al-Zn-Mn system (Laser et al., 2006).
limited at low temperature, unlike in cubic metals. However, ductility is greatly
enhanced by deformation at elevated temperature, when additional slip systems
become active. Understanding the characteristics of deformation of magnesium is of
particular interest, since activation of different slip systems and twinning (depending
on temperature) controls the mechanical properties.
Deformation of magnesium may occur by slip, twinning or grain boundary sliding
(GBS). GBS is discussed in Section 2.3.2. Slip and twinning systems in magnesium
crystal are discussed below. Based on the deformation behaviour of magnesium
single crystals, the deformation characteristics of polycrystalline magnesium alloys are
discussed, including dynamic recrystallization (DRX) phenomenon during thermo-
mechanical treatment of magnesium alloys.
2.1.3.1 Slip
Slip is a mechanism by which plastic deformation occurs by sliding or translation of
blocks of crystal along the most favourably oriented crystallographic planes (Dieter,
2001). Slip typically involves movement of dislocations along the close-packed crystal-
lographic direction (slip direction) in a plane having the highest atomic density (slip
plane). The combination of slip plane and slip direction is termed as a slip system.
In magnesium, the basal (0001) plane has the highest atomic density and 〈1120〉directions are the close-packed directions (Dieter, 2001). Therefore, slip ordinarily
occurs in magnesium crystal on basal plane along the 〈1120〉 directions. The extent
of slip depends on the shear stress developed by the applied stress, crystal geometry
and orientation of slip planes with the direction of shear stress. Slip initiates when
the shear stress reaches a minimum value—known as the critical resolved shear stress
29
Chapter 2. Literature Review
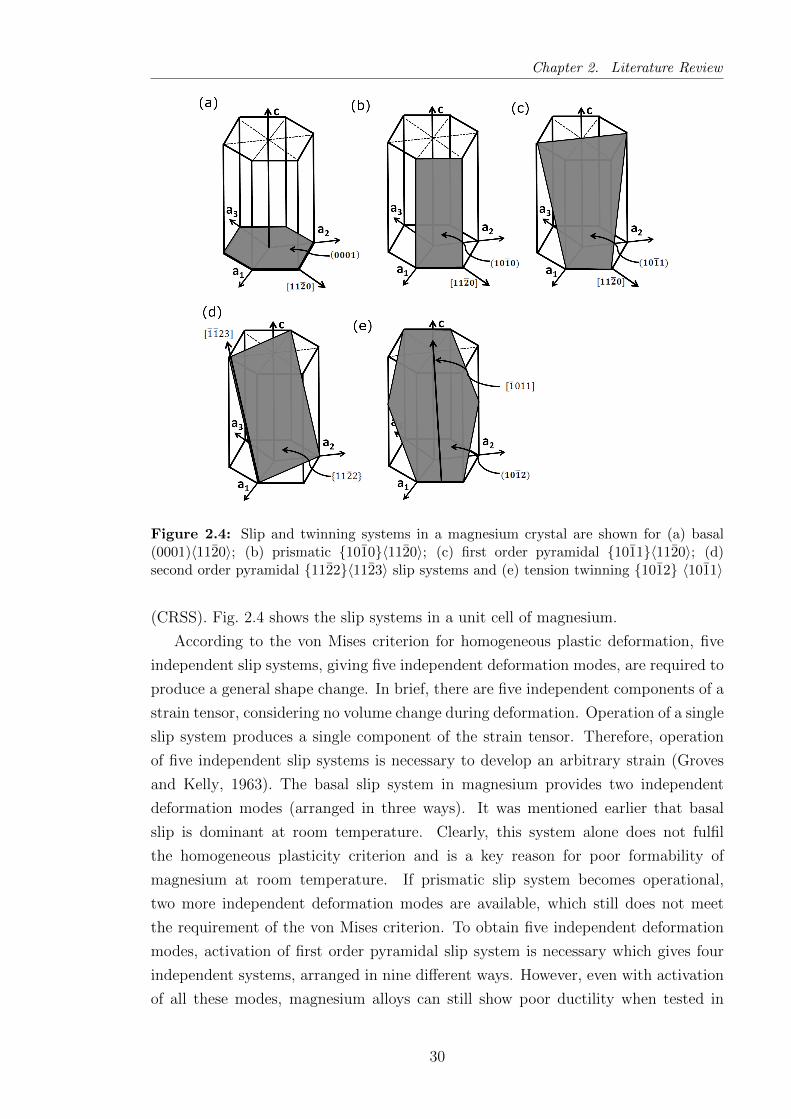
Figure 2.4: Slip and twinning systems in a magnesium crystal are shown for (a) basal(0001)〈1120〉; (b) prismatic 1010〈1120〉; (c) first order pyramidal 1011〈1120〉; (d)second order pyramidal 1122〈1123〉 slip systems and (e) tension twinning 1012 〈1011〉
(CRSS). Fig. 2.4 shows the slip systems in a unit cell of magnesium.
According to the von Mises criterion for homogeneous plastic deformation, five
independent slip systems, giving five independent deformation modes, are required to
produce a general shape change. In brief, there are five independent components of a
strain tensor, considering no volume change during deformation. Operation of a single
slip system produces a single component of the strain tensor. Therefore, operation
of five independent slip systems is necessary to develop an arbitrary strain (Groves
and Kelly, 1963). The basal slip system in magnesium provides two independent
deformation modes (arranged in three ways). It was mentioned earlier that basal
slip is dominant at room temperature. Clearly, this system alone does not fulfil
the homogeneous plasticity criterion and is a key reason for poor formability of
magnesium at room temperature. If prismatic slip system becomes operational,
two more independent deformation modes are available, which still does not meet
the requirement of the von Mises criterion. To obtain five independent deformation
modes, activation of first order pyramidal slip system is necessary which gives four
independent systems, arranged in nine different ways. However, even with activation
of all these modes, magnesium alloys can still show poor ductility when tested in
30
Chapter 2. Literature Review
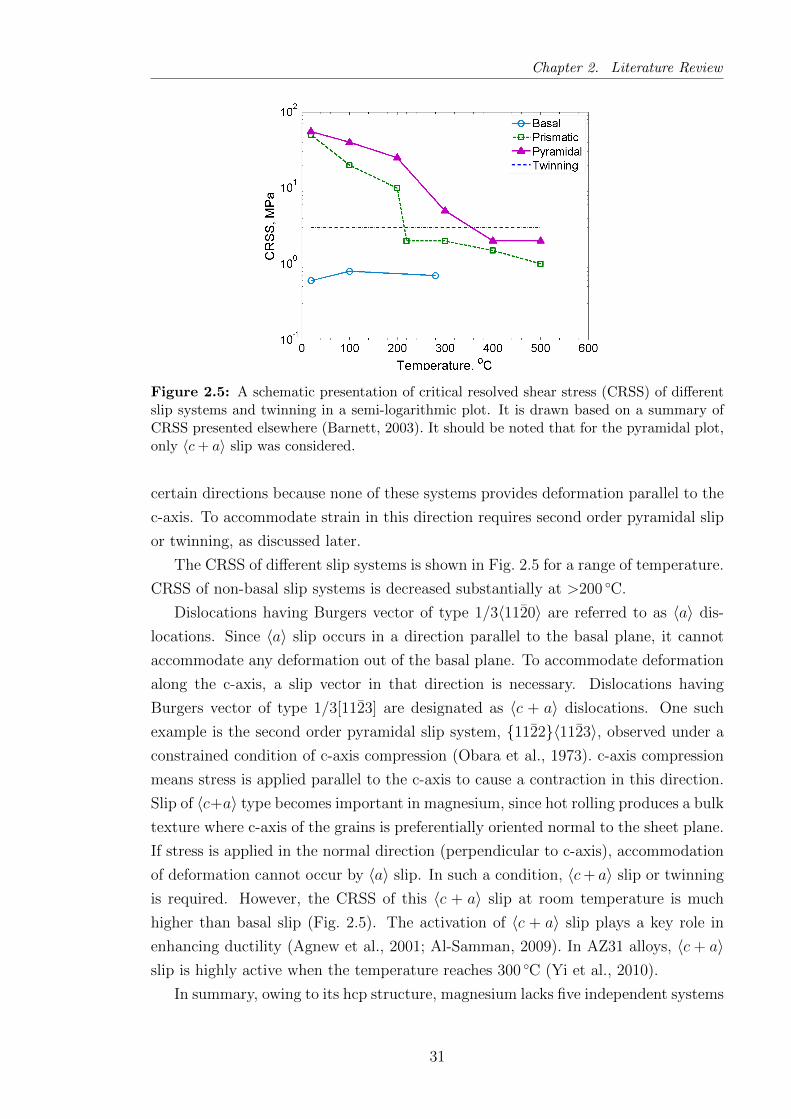
Figure 2.5: A schematic presentation of critical resolved shear stress (CRSS) of differentslip systems and twinning in a semi-logarithmic plot. It is drawn based on a summary ofCRSS presented elsewhere (Barnett, 2003). It should be noted that for the pyramidal plot,only 〈c+ a〉 slip was considered.
certain directions because none of these systems provides deformation parallel to the
c-axis. To accommodate strain in this direction requires second order pyramidal slip
or twinning, as discussed later.
The CRSS of different slip systems is shown in Fig. 2.5 for a range of temperature.
CRSS of non-basal slip systems is decreased substantially at >200 C.
Dislocations having Burgers vector of type 1/3〈1120〉 are referred to as 〈a〉 dis-
locations. Since 〈a〉 slip occurs in a direction parallel to the basal plane, it cannot
accommodate any deformation out of the basal plane. To accommodate deformation
along the c-axis, a slip vector in that direction is necessary. Dislocations having
Burgers vector of type 1/3[1123] are designated as 〈c + a〉 dislocations. One such
example is the second order pyramidal slip system, 1122〈1123〉, observed under a
constrained condition of c-axis compression (Obara et al., 1973). c-axis compression
means stress is applied parallel to the c-axis to cause a contraction in this direction.
Slip of 〈c+a〉 type becomes important in magnesium, since hot rolling produces a bulk
texture where c-axis of the grains is preferentially oriented normal to the sheet plane.
If stress is applied in the normal direction (perpendicular to c-axis), accommodation
of deformation cannot occur by 〈a〉 slip. In such a condition, 〈c+ a〉 slip or twinning
is required. However, the CRSS of this 〈c + a〉 slip at room temperature is much
higher than basal slip (Fig. 2.5). The activation of 〈c + a〉 slip plays a key role in
enhancing ductility (Agnew et al., 2001; Al-Samman, 2009). In AZ31 alloys, 〈c + a〉slip is highly active when the temperature reaches 300 C (Yi et al., 2010).
In summary, owing to its hcp structure, magnesium lacks five independent systems
31
Chapter 2. Literature Review
required for homogeneous deformation. At room temperature, basal slip is the
only easily activated slip systems during deformation, owing to its very low CRSS.
This provides only two independent systems. When deformation is accomplished at
elevated temperatures, non-basal 〈a〉 and pyramidal 〈c + a〉 slips are more active as
the CRSS values are lowered. Operation of 〈c+ a〉 slip is the only slip mode capable
of accommodating strain out of the basal plane.
2.1.3.2 Twinning
Twinning is a deformation mechanism where deformation of a portion of crystal leads
to a symmetric orientation related to the orientation of the undeformed portion of the
crystal (Dieter, 2001). Atoms experience a coordinated shear displacement in such a
way that the twinned region has a mirror-image relationship to the untwinned part of
the lattice. Twinning occurs on certain crystallographic planes and only in a direction
which produces a mirror image of the neighbour lattice. Twinning can only provide
a limited total strain, which depends on the twin shear and orientation. However,
twinning may reorient material in a way that promotes some slip activity (Christian
and Mahajan, 1995) and gives a secondary effect on plasticity.
Due to the lack of sufficient independent slip systems for plasticity at room
temperature, twinning appears as an important deformation mode in magnesium.
Twinning at room temperature in magnesium occurs when deformation cannot be
accommodated by basal slip, and it is particularly important when stress is applied
parallel to the c-axis.
Activation of a twin depends on the direction of the applied stress, in other words,
it depends on the extension or contraction of c-axis of a crystal. 1012〈1011〉 tensile
twins are usually observed, under the condition of c-axis extension (Wang and Huang,
2007). c-axis extension means the stress is applied in a tensile sense parallel to the
c-axis of a crystal. The 1012 twin is the most easily activated twinning mode in
magnesium. Activation of this mode leads to an 86 reorientation of the lattice in
the twin relative to the parent material.
In contrast, 1011−1012 double twins (1012 twins are formed in the interior
of 1011 twins) are observed under a condition of c-axis compression (Nave and
Barnett, 2004). Due to the polar nature of twins, a tension twin cannot accommodate
strain by c-axis compression. There are other possible c-axis compression twins in
magnesium, e.g., 3034〈2023〉 and 1013〈3032〉 (Reed-Hill and Robertson, 1957),
but these are hard to activate and rarely seen. One adverse effect of the compression
double twins is that they reorient the material in the double twin favourably for basal
slip. For an AZ31 rolled sheet, the occurrence of 1011 − 1012 double twins has
been shown to lead to premature failure at room temperature (Ando et al., 2010).
The extent of twinning also depends on grain size. Ecob and Ralph (1983) showed
32

Chapter 2. Literature Review
Table 2.4: Relative CRSS for pure magne-sium, AZ31 and AZ61 (Lou et al., 2007)
Material τtwin/τbasal τprismatic〈a〉/τbasal
Mg 2.5–4.4 48–87
AZ31 3 5.5
AZ61 - 1.5–2
for a zinc alloy that the contribution of twinning increased linearly with grain size,
i.e., a lower fraction of twinning is developed in fine-grained alloys. A transition
from twin dominated flow to slip deformation occurs in magnesium by reducing
the Hall-Petch slope of the yield stress with decreasing grain size and/or increasing
temperature (Barnett et al., 2004).
The relative CRSS for different slip systems and twinning at room temperature
are summarised for pure magnesium, AZ31 and AZ61 alloys in Table 2.4.
In summary, twinning provides an extra independent mode of deformation in
magnesium, but provides only limited strain and is unidirectional. Twinning can
also influence slip by reorienting lattice planes in the twin. The major role played by
twinning during deformation is explained in Section 2.1.4.
2.1.3.3 Texture
Each individual grain has its own crystallographic orientation in terms of the unit
cell in space. During deformation, such as rolling, a preferred orientation (texture)
of grains is developed, where certain planes orient themselves in a preferred way
with respect to the axis of principal strain (Dieter, 2001). The development of a
preferred orientation by a group of grain is not unexpected since slip and twinning
both occur on the most favourable crystallographic planes and directions. During
rolling, the deformation texture is described by a set of crystallographic planes parallel
to the surface of the rolled sheet and a crystallographic direction contained in that
plane having a direction parallel to the rolling direction (RD). Traditionally, texture
is represented by a pole figure. A pole figure is a two-dimensional stereographic
projection, showing the variation of pole orientation for a certain crystallographic
plane.
During rolling of AZ alloys, a strong basal texture is developed (del Valle et al.,
2006; Stanford and Barnett, 2008). This means the (0001) basal planes of most grains
are oriented parallel to RD and c-axis of those grains are parallel to sheet normal
direction (ND). For an AZ31 rolled sheet, orientation of different planes is shown in
Fig. 2.6.
The formation of a basal texture is a result of the basal slip and c-axis tension
33

Chapter 2. Literature Review
Figure 2.6: A basal texture developed during hot rolling of AZ31 (Lou et al., 2007).
twinning as deformation modes. During rolling of magnesium, both basal slip and
dominance of tension twinning reorient the c-axis of grains so that c-axis becomes
approximately parallel to the compression axis (ND or sheet thickness direction) (Ag-
new et al., 2001; Ion et al., 1982). This leads to a favourable alignment of basal planes
parallel to the RD.
The orientation of the applied external stress relative to texture has a profound
effect on the mechanical properties. For instance, in plane-strain compression, if
the basal planes are aligned parallel to the compression stress axis, the operation of
non-basal slip is essential to increase the strain to failure (Gehrmann et al., 2005).
2.1.4 Recrystallization and its Significance
A fine grain size is generally considered essential for superplastic forming (see Sec-
tion 2.2). Fine grains are developed by recrystallization during thermo-mechanical
treatments. The characteristics of recrystallization in magnesium alloys are discussed
briefly below.
During deformation, dynamic recovery may occur to reduce the stored energy of
a material by annihilation and rearrangement of dislocations, leading to subgrain for-
mation (Humphreys and Hatherly, 2004). This metastable state of dynamic recovery
may be consumed and new strain-free grains can be developed during a process known
as recrystallization, leading to more softening of the material. When recrystallization
phenomenon occur during deformation, it is denoted as dynamic recrystallization
(DRX).
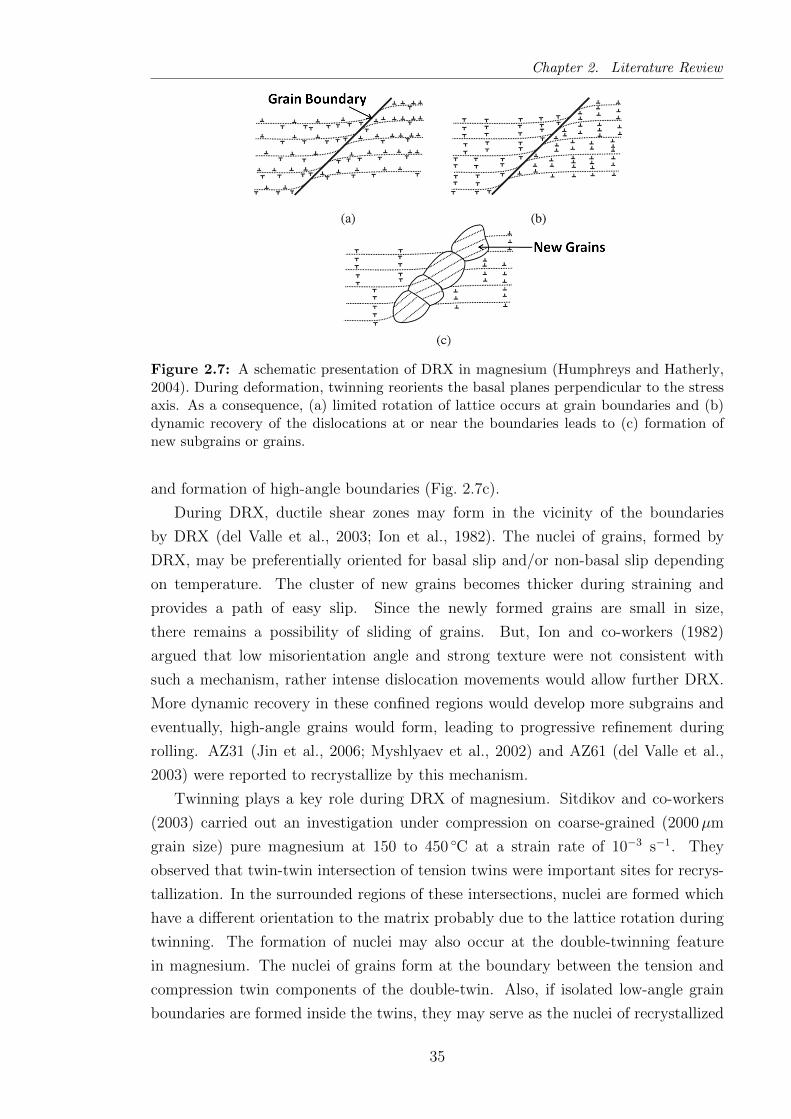
Ion and co-workers (1982) studied DRX in magnesium and suggested a DRX
mechanism by progressive lattice rotation and dynamic recovery. The proposed
mechanism is shown in Fig. 2.7. In brief, during deformation, tensile twinning is
activated, leading to reorientation of the basal planes perpendicular to the stress
axis. As a consequence, basal slip becomes restricted. Lattice rotation at the
grain boundaries (Fig. 2.7a) initiates dynamic recovery (Fig. 2.7b) and subgrains
are formed. The boundaries of the subgrains migrate locally, leading to coalescence
34
Chapter 2. Literature Review
Figure 2.7: A schematic presentation of DRX in magnesium (Humphreys and Hatherly,2004). During deformation, twinning reorients the basal planes perpendicular to the stressaxis. As a consequence, (a) limited rotation of lattice occurs at grain boundaries and (b)dynamic recovery of the dislocations at or near the boundaries leads to (c) formation ofnew subgrains or grains.
and formation of high-angle boundaries (Fig. 2.7c).
During DRX, ductile shear zones may form in the vicinity of the boundaries
by DRX (del Valle et al., 2003; Ion et al., 1982). The nuclei of grains, formed by
DRX, may be preferentially oriented for basal slip and/or non-basal slip depending
on temperature. The cluster of new grains becomes thicker during straining and
provides a path of easy slip. Since the newly formed grains are small in size,
there remains a possibility of sliding of grains. But, Ion and co-workers (1982)
argued that low misorientation angle and strong texture were not consistent with
such a mechanism, rather intense dislocation movements would allow further DRX.
More dynamic recovery in these confined regions would develop more subgrains and
eventually, high-angle grains would form, leading to progressive refinement during
rolling. AZ31 (Jin et al., 2006; Myshlyaev et al., 2002) and AZ61 (del Valle et al.,
2003) were reported to recrystallize by this mechanism.
Twinning plays a key role during DRX of magnesium. Sitdikov and co-workers
(2003) carried out an investigation under compression on coarse-grained (2000µm
grain size) pure magnesium at 150 to 450 C at a strain rate of 10−3 s−1. They
observed that twin-twin intersection of tension twins were important sites for recrys-
tallization. In the surrounded regions of these intersections, nuclei are formed which
have a different orientation to the matrix probably due to the lattice rotation during
twinning. The formation of nuclei may also occur at the double-twinning feature
in magnesium. The nuclei of grains form at the boundary between the tension and
compression twin components of the double-twin. Also, if isolated low-angle grain
boundaries are formed inside the twins, they may serve as the nuclei of recrystallized
35

Chapter 2. Literature Review
grains. After forming the nuclei by any of the above mentioned process, recrystallized
grains are formed by transformation of the low-angle boundaries of nuclei to high-
angle boundaries. The driving force for this transformation is the interaction between
lattice dislocations and twin boundaries and the accumulation of misfit dislocations
formed by the deflection of the basal dislocations upon meeting the twin boundaries.
Ultimately, the developed low-angle boundaries migrate to a stable configuration and
fully developed equiaxed recrystallized grains are evolved.
The mechanisms discussed above are essentially the mechanisms of DRX by the
gradual changes in misorientation of grains (from low-angle subgrain boundaries to
high-angle grain boundaries), and are also commonly termed as continuous DRX.
Recently, several investigations have been performed to understand the effect of
temperature and slip system activity on the onset of DRX. Galiev and co-workers
(2001) studied a ZK60 (Mg-5.8Zn-0.65Zr) alloy having an average grain size of 85µm
under compression. Below 200 C, the authors observed a dominating operation
of basal slip and twinning. This is expected since the CRSS of these modes are
comparatively lower than other slip systems. Between 200 to 250 C, cross-slip
assisted dislocation glide was the major deformation mode and in the temperature
range of 250 to 450 C, dislocation climb was identified. It was argued that if
deformation was dominated by basal slip, twinning or cross-slip, then rearrangement
of dislocations would develop low-angle boundaries, eventually forming high-angle
boundaries by continuous DRX. In contrast, if the deformation was controlled by
dislocation climb which led to low-angle boundary formation, then a different type
of DRX (known as conventional discontinuous DRX) would readily occur.
Discontinuous DRX is a process of recrystallization where separate nucleation and
growth phenomena of grains are observed. In brief, during deformation new grains
may preferentially form at pre-existing high-angle grain boundaries (Humphreys and
Hatherly, 2004). This is initiated by bulging of parts of grain boundaries by strain-
induced boundary migration (SIBM) process. Bulging, a precursor to the newly
formed grains, occurs between two grains having dissimilar stored energy and the
migration of the boundary occurs in the direction towards the grain possessing higher
stored energy. In the bulged region, a new grain is nucleated and this grain is
essentially a dislocation free structure. However, since the material is experiencing
plastic flow, dislocation activity is induced in the new grain and retards growth of the
developed grain leading to a stable grain that ceases to grow further. It is notable
that the orientation of the newly formed grain remains close to the orientation of the
parent grain.
36
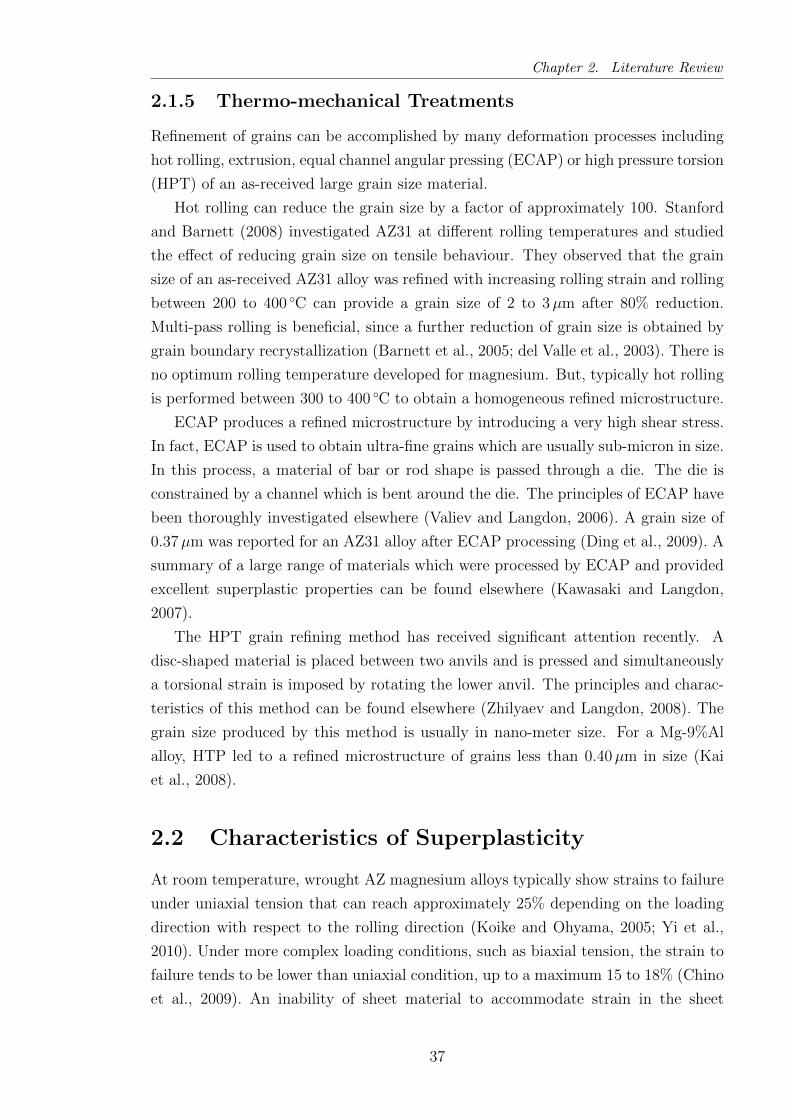
Chapter 2. Literature Review
2.1.5 Thermo-mechanical Treatments
Refinement of grains can be accomplished by many deformation processes including
hot rolling, extrusion, equal channel angular pressing (ECAP) or high pressure torsion
(HPT) of an as-received large grain size material.
Hot rolling can reduce the grain size by a factor of approximately 100. Stanford
and Barnett (2008) investigated AZ31 at different rolling temperatures and studied
the effect of reducing grain size on tensile behaviour. They observed that the grain
size of an as-received AZ31 alloy was refined with increasing rolling strain and rolling
between 200 to 400 C can provide a grain size of 2 to 3µm after 80% reduction.
Multi-pass rolling is beneficial, since a further reduction of grain size is obtained by
grain boundary recrystallization (Barnett et al., 2005; del Valle et al., 2003). There is
no optimum rolling temperature developed for magnesium. But, typically hot rolling
is performed between 300 to 400 C to obtain a homogeneous refined microstructure.
ECAP produces a refined microstructure by introducing a very high shear stress.
In fact, ECAP is used to obtain ultra-fine grains which are usually sub-micron in size.
In this process, a material of bar or rod shape is passed through a die. The die is
constrained by a channel which is bent around the die. The principles of ECAP have
been thoroughly investigated elsewhere (Valiev and Langdon, 2006). A grain size of
0.37µm was reported for an AZ31 alloy after ECAP processing (Ding et al., 2009). A
summary of a large range of materials which were processed by ECAP and provided
excellent superplastic properties can be found elsewhere (Kawasaki and Langdon,
2007).
The HPT grain refining method has received significant attention recently. A
disc-shaped material is placed between two anvils and is pressed and simultaneously
a torsional strain is imposed by rotating the lower anvil. The principles and charac-
teristics of this method can be found elsewhere (Zhilyaev and Langdon, 2008). The
grain size produced by this method is usually in nano-meter size. For a Mg-9%Al
alloy, HTP led to a refined microstructure of grains less than 0.40µm in size (Kai
et al., 2008).
2.2 Characteristics of Superplasticity
At room temperature, wrought AZ magnesium alloys typically show strains to failure
under uniaxial tension that can reach approximately 25% depending on the loading
direction with respect to the rolling direction (Koike and Ohyama, 2005; Yi et al.,
2010). Under more complex loading conditions, such as biaxial tension, the strain to
failure tends to be lower than uniaxial condition, up to a maximum 15 to 18% (Chino
et al., 2009). An inability of sheet material to accommodate strain in the sheet
37
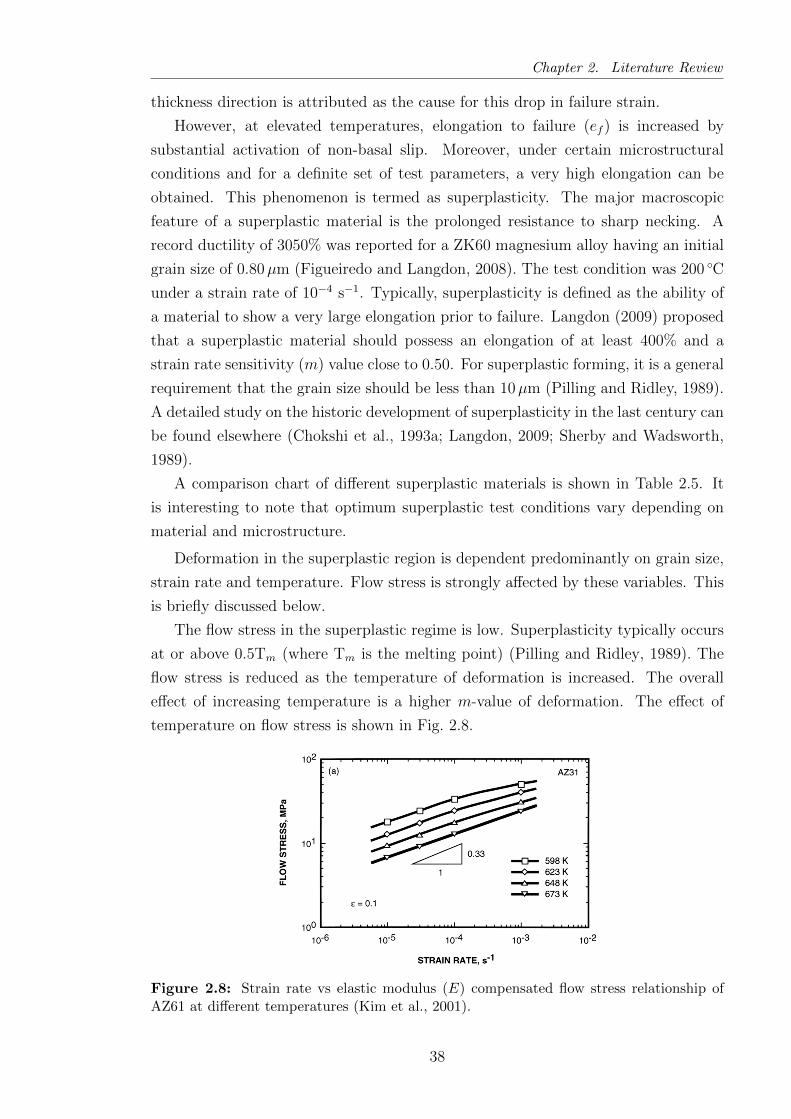
Chapter 2. Literature Review
thickness direction is attributed as the cause for this drop in failure strain.
However, at elevated temperatures, elongation to failure (ef ) is increased by
substantial activation of non-basal slip. Moreover, under certain microstructural
conditions and for a definite set of test parameters, a very high elongation can be
obtained. This phenomenon is termed as superplasticity. The major macroscopic
feature of a superplastic material is the prolonged resistance to sharp necking. A
record ductility of 3050% was reported for a ZK60 magnesium alloy having an initial
grain size of 0.80µm (Figueiredo and Langdon, 2008). The test condition was 200 C
under a strain rate of 10−4 s−1. Typically, superplasticity is defined as the ability of
a material to show a very large elongation prior to failure. Langdon (2009) proposed
that a superplastic material should possess an elongation of at least 400% and a
strain rate sensitivity (m) value close to 0.50. For superplastic forming, it is a general
requirement that the grain size should be less than 10µm (Pilling and Ridley, 1989).
A detailed study on the historic development of superplasticity in the last century can
be found elsewhere (Chokshi et al., 1993a; Langdon, 2009; Sherby and Wadsworth,
1989).
A comparison chart of different superplastic materials is shown in Table 2.5. It
is interesting to note that optimum superplastic test conditions vary depending on
material and microstructure.
Deformation in the superplastic region is dependent predominantly on grain size,
strain rate and temperature. Flow stress is strongly affected by these variables. This
is briefly discussed below.
The flow stress in the superplastic regime is low. Superplasticity typically occurs
at or above 0.5Tm (where Tm is the melting point) (Pilling and Ridley, 1989). The
flow stress is reduced as the temperature of deformation is increased. The overall
effect of increasing temperature is a higher m-value of deformation. The effect of
temperature on flow stress is shown in Fig. 2.8.
Figure 2.8: Strain rate vs elastic modulus (E) compensated flow stress relationship ofAZ61 at different temperatures (Kim et al., 2001).
38
Chapter 2. Literature Review
Table 2.5: Examples of different materials possessing excellent superplastic behaviour
Alloy GrainSize,µm
TestTemper-ature,C
StrainRate,s−1
ElongationtoFailure,%
Reference
Al 1421 2.6 450 1.4× 10⁻² 3000 Kaibyshev andOsipova, 2005
Al 2024 0.50 400 10−2 500 Lee et al., 2003Al 5083 0.30 500 10−2 740 Park et al., 2003Al 7034 0.30 200 3.3× 10⁻² 1110 Xu et al., 2005
Cu-40Zn 1 400 10−2 640 Neishi et al., 2001
AZ31 0.70 150 10−4 460 Lin et al., 2005AZ61 0.60 200 3.3× 10⁻⁴ 1320 Miyahara et al.,
2006AZ91 0.80 300 3× 10⁻³ 570 Chuvil’deev et al.,
2004bZK60 1 260 6.5× 10⁻⁴ 960 Chuvil’deev et al.,
2004aZK60 0.80 200 10−4 3050 Figueiredo and
Langdon, 2008Mg-9Al 0.70 273 3.3× 10⁻⁴ 840 Matsubara et al.,
2003Mg-8Li 1–3 200 1.5× 10⁻⁴ 1780 Furui et al., 2007
Zn-22Al 0.60 260 1 2380 Lee and Langdon,2001
Ti-50Al 0.40 800 8.3× 10⁻⁴ 260 Imayev et al., 2001
Flow stress is also perturbed by strain rate. In the superplastic regime, a sigmoidal
relationship between flow stress and strain rate is observed (Fig. 2.9a). m is defined
as
m =δ lnσ
δ ln ε(2.1)
where σ is the stress and ε is the strain rate. The slope of Fig. 2.9a gives the
corresponding m-value. The consequences of higher m values are discussed in detail
in Section 2.3.4. The effect of strain rate on m is shown in Fig. 2.9b. Based on m, it
is possible to define three distinctive regions. As evident from Fig. 2.9b, in the very
low and very high strain rate regions, i.e., region I and III, typical m-values are less
than 0.30 (Pilling and Ridley, 1989). In the intermediate strain rate region II, the
typical m-value is 0.50.
Grain size also has an important influence on flow stress. In Fig. 2.10a, the
flow stress is shown for different grain sizes for a range of temperature. The curves
39

Chapter 2. Literature Review
Figure 2.9: The strain rate dependency on (a) flow stress and (b) strain rate sensitivity(m) of an Mg-Al eutectic alloy (Edington et al., 1976; Lee, 1969).
cross approximately at room temperature, where the typical Hall-Petch relationship
is observed. But, at higher temperatures, flow stress is increased with increasing
grain size. To be precise, at higher temperature flow stress increases linearly with
grain size (Alden, 1967; Edington et al., 1976). The increase of flow stress with grain
size has some secondary effect on m. If grain size is reduced, the peak in m-value is
shifted towards region III (Edington et al., 1976). Therefore, the strain rate range of
superplastic deformation is increased.
The benefit of a small grain size for superplasticity is two-fold. It decreases the
flow stress at the temperature where superplasticity occurs (Alden, 1967; Hamilton
et al., 1982) and increases the strain rate range of superplasticity by increasing the
contribution from grain boundary sliding (GBS) (Sherby and Wadsworth, 1989). The
dependence of strain rate (ε) on grain size (d) is described by the phenomenological
constitutive law (Sherby and Wadsworth, 1982):
ε = d−p (2.2)
where p describes the dependency of grain size on strain rate (i.e., the grain size
exponent). p is determined by logarithmically plotting strain rate as a function of
reciprocal of grain size. The slope of the line gives the value of p.
The overall effect of grain size and temperature on strain rate and flow stress is
illustrated in Fig. 2.10b. If the grain size is decreased from d1 to d2 at the temper-
ature T1, the superplastic region is shifted towards higher strain rates. Similarly, if
40
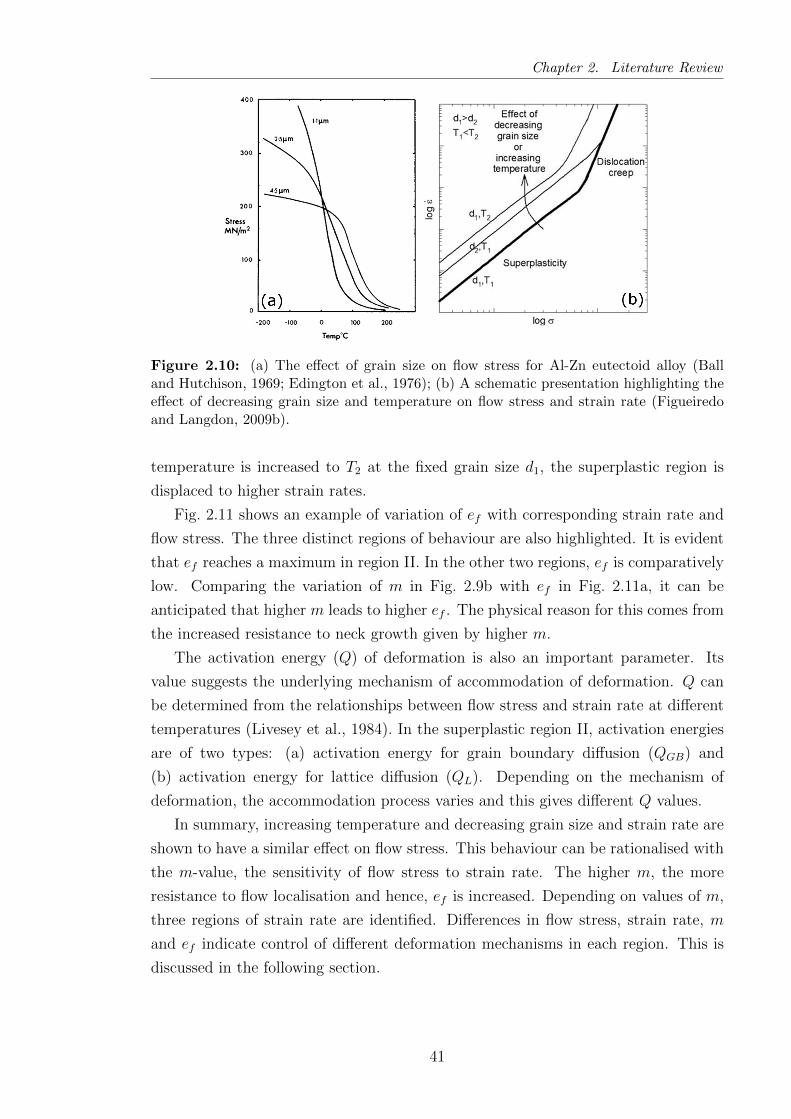
Chapter 2. Literature Review
Figure 2.10: (a) The effect of grain size on flow stress for Al-Zn eutectoid alloy (Balland Hutchison, 1969; Edington et al., 1976); (b) A schematic presentation highlighting theeffect of decreasing grain size and temperature on flow stress and strain rate (Figueiredoand Langdon, 2009b).
temperature is increased to T2 at the fixed grain size d1, the superplastic region is
displaced to higher strain rates.
Fig. 2.11 shows an example of variation of ef with corresponding strain rate and
flow stress. The three distinct regions of behaviour are also highlighted. It is evident
that ef reaches a maximum in region II. In the other two regions, ef is comparatively
low. Comparing the variation of m in Fig. 2.9b with ef in Fig. 2.11a, it can be
anticipated that higher m leads to higher ef . The physical reason for this comes from
the increased resistance to neck growth given by higher m.
The activation energy (Q) of deformation is also an important parameter. Its
value suggests the underlying mechanism of accommodation of deformation. Q can
be determined from the relationships between flow stress and strain rate at different
temperatures (Livesey et al., 1984). In the superplastic region II, activation energies
are of two types: (a) activation energy for grain boundary diffusion (QGB) and
(b) activation energy for lattice diffusion (QL). Depending on the mechanism of
deformation, the accommodation process varies and this gives different Q values.
In summary, increasing temperature and decreasing grain size and strain rate are
shown to have a similar effect on flow stress. This behaviour can be rationalised with
the m-value, the sensitivity of flow stress to strain rate. The higher m, the more
resistance to flow localisation and hence, ef is increased. Depending on values of m,
three regions of strain rate are identified. Differences in flow stress, strain rate, m
and ef indicate control of different deformation mechanisms in each region. This is
discussed in the following section.
41
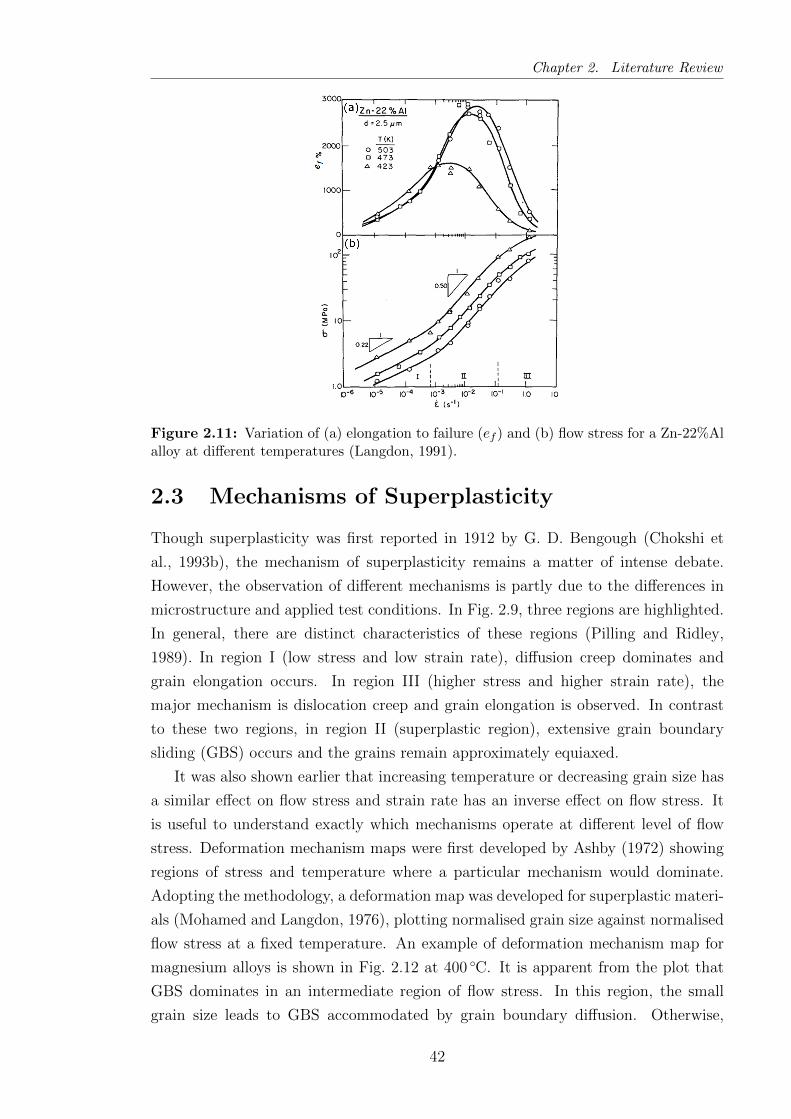
Chapter 2. Literature Review
Figure 2.11: Variation of (a) elongation to failure (ef ) and (b) flow stress for a Zn-22%Alalloy at different temperatures (Langdon, 1991).
2.3 Mechanisms of Superplasticity
Though superplasticity was first reported in 1912 by G. D. Bengough (Chokshi et
al., 1993b), the mechanism of superplasticity remains a matter of intense debate.
However, the observation of different mechanisms is partly due to the differences in
microstructure and applied test conditions. In Fig. 2.9, three regions are highlighted.
In general, there are distinct characteristics of these regions (Pilling and Ridley,
1989). In region I (low stress and low strain rate), diffusion creep dominates and
grain elongation occurs. In region III (higher stress and higher strain rate), the
major mechanism is dislocation creep and grain elongation is observed. In contrast
to these two regions, in region II (superplastic region), extensive grain boundary
sliding (GBS) occurs and the grains remain approximately equiaxed.
It was also shown earlier that increasing temperature or decreasing grain size has
a similar effect on flow stress and strain rate has an inverse effect on flow stress. It
is useful to understand exactly which mechanisms operate at different level of flow
stress. Deformation mechanism maps were first developed by Ashby (1972) showing
regions of stress and temperature where a particular mechanism would dominate.
Adopting the methodology, a deformation map was developed for superplastic materi-
als (Mohamed and Langdon, 1976), plotting normalised grain size against normalised
flow stress at a fixed temperature. An example of deformation mechanism map for
magnesium alloys is shown in Fig. 2.12 at 400 C. It is apparent from the plot that
GBS dominates in an intermediate region of flow stress. In this region, the small
grain size leads to GBS accommodated by grain boundary diffusion. Otherwise,
42
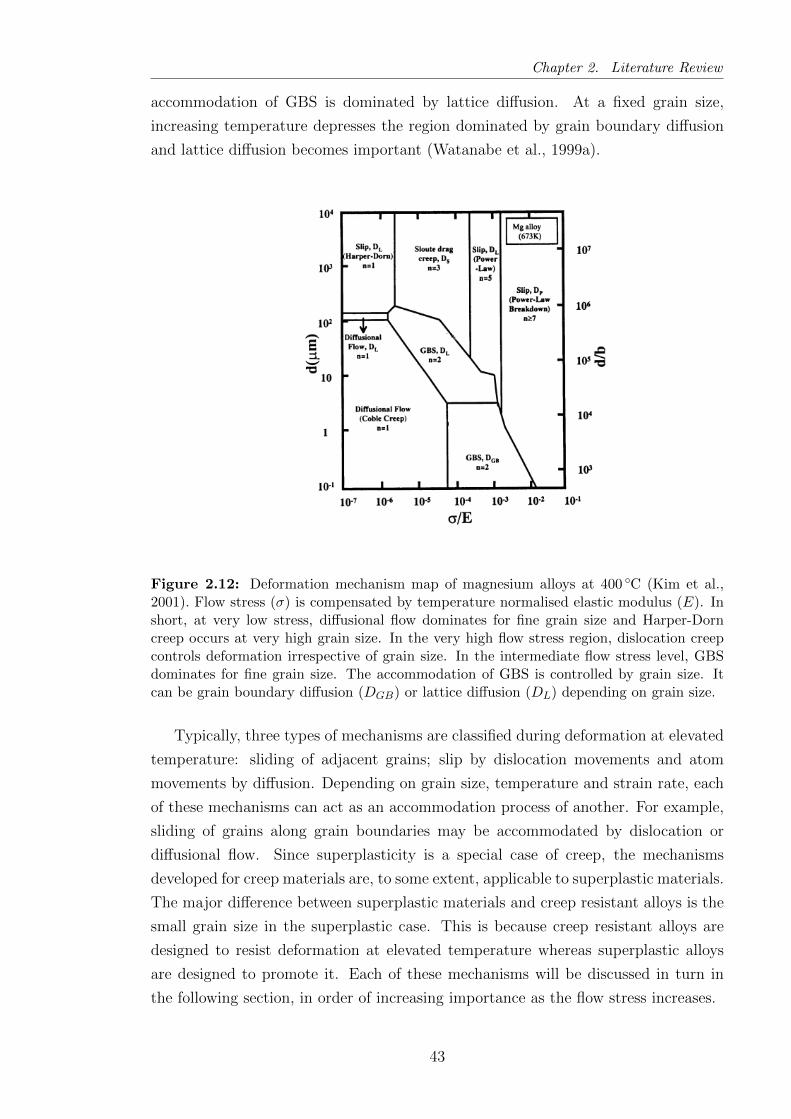
Chapter 2. Literature Review
accommodation of GBS is dominated by lattice diffusion. At a fixed grain size,
increasing temperature depresses the region dominated by grain boundary diffusion
and lattice diffusion becomes important (Watanabe et al., 1999a).
Figure 2.12: Deformation mechanism map of magnesium alloys at 400 C (Kim et al.,2001). Flow stress (σ) is compensated by temperature normalised elastic modulus (E). Inshort, at very low stress, diffusional flow dominates for fine grain size and Harper-Dorncreep occurs at very high grain size. In the very high flow stress region, dislocation creepcontrols deformation irrespective of grain size. In the intermediate flow stress level, GBSdominates for fine grain size. The accommodation of GBS is controlled by grain size. Itcan be grain boundary diffusion (DGB) or lattice diffusion (DL) depending on grain size.
Typically, three types of mechanisms are classified during deformation at elevated
temperature: sliding of adjacent grains; slip by dislocation movements and atom
movements by diffusion. Depending on grain size, temperature and strain rate, each
of these mechanisms can act as an accommodation process of another. For example,
sliding of grains along grain boundaries may be accommodated by dislocation or
diffusional flow. Since superplasticity is a special case of creep, the mechanisms
developed for creep materials are, to some extent, applicable to superplastic materials.
The major difference between superplastic materials and creep resistant alloys is the
small grain size in the superplastic case. This is because creep resistant alloys are
designed to resist deformation at elevated temperature whereas superplastic alloys
are designed to promote it. Each of these mechanisms will be discussed in turn in
the following section, in order of increasing importance as the flow stress increases.
43

Chapter 2. Literature Review
2.3.1 Diffusion Creep
In the low stress regime (region I), diffusion creep dominates (Fig. 2.9a). Diffusion
creep occurs when a material is deformed as a consequence of diffusion of atoms
through grain boundaries or lattice (interior of a grain) driven by stress. Three types
of creep process may occur in this region, namely Nabarro-Herring creep, Coble creep
and Harpor-Dorn creep.
The basic mechanism for diffusion creep is that it occurs by flow of vacancies
from grain boundaries experiencing compression under stress towards the boundaries
experiencing tension (Friedel, 1964). The driving force for this movement is the work
done to restore the equilibrium condition under the applied stress. In diffusion creep,
boundaries play an important role, since they act as the source and sink for vacancies.
Within a grain, vacancies may not be produced, since this would require much higher
thermal energy (Friedel, 1964). There are two ways a flux of vacancies (or a counter-
flow of atoms) can move from the source to the sink—through the lattice or grain
boundary. Grain boundaries are assumed a uniform source and sink for vacancies.
Nabarro suggested that under an applied stress, a material would deform by
transferring excess vacancies from one boundary to another. He proposed that
diffusion of vacancy flow should be directed from the transverse grain boundaries
(normal to applied stress) towards the parallel (to applied stress) boundaries, through
the lattice (Fig. 2.13a). Since the concentration of vacancies at a transverse grain
boundary is higher than the stress-free condition, vacancies travel to the parallel-to-
stress boundaries through the grain and are absorbed. In doing so, a counter-flux
of atoms occurs and this leads to a plating of atoms at transverse boundaries. As a
consequence, grains are elongated. In summary, the driving force for this mechanism
of creep comes from the gradient of vacancies developed by the applied stress and
the gradient is largest at transverse boundaries. Herring (1950) studied this theory
further and this mechanism is now known as Nabarro-Herring creep.
Some important characteristics of this mechanism are (Edington et al., 1976):
• A linear relationship exists between flow stress and strain rate. This means
m = 1.
• Grains elongate during deformation.
• Activation energy of deformation is that of lattice diffusion.
• Usually only dominates at very low stress and at >0.8Tm.
The strain rate for this creep process is given by
ε = B1DLΩ
kT
σ
d2(2.3)
44
Chapter 2. Literature Review
where B1 is a constant and depends on shape of grains, DL is the grain boundary
diffusion coefficient, d is the grain size, k is Boltzmann’s constant, T is the absolute
temperature, σ is the flow stress and Ω is the atomic volume. For magnesium, DL is
given by (Frost and Ashby, 1982)
DL = 1.0× 10⁻⁴ exp
(−QL
RT
)m2 s−1 (2.4)
where QL is the activation energy for lattice diffusion and R is the molar gas constant.
Using Ω = 0.7b3, where b is Burgers vector, Equation 2.3 is reduced to (Langdon
and Mohamed, 1976)
ε = B2DLGb
kT
(b
d
)2 ( σG
)(2.5)
where G is the shear modulus.
Coble (1963) suggested that the diffusion flux might occur along the grain bound-
ary instead of grain interior (Fig. 2.13b). As a consequence, matter would be diffused
rapidly along the boundary compared to the bulk of a grain. Coble creep occurs
when the deformation temperature is approximately 0.4Tm (Edington et al., 1976).
The rate of creep is
ε = B3δDGBΩ
kT
σ
d3(2.6)
where DGB is the grain boundary diffusion coefficient, δ is the grain boundary width
and is equal to 2b. For magnesium, δDGB is determined as (Frost and Ashby, 1982)
δDGB = 5.0× 10⁻¹² exp
(−QGB
RT
)m3 s−1 (2.7)
where QGB is the activation energy for grain boundary diffusion. Using Ω = 0.7b3,
the equation is reduced to
ε = B4DGBGb
kT
(b
d
)3 ( σG
)(2.8)
which shows strain rate varies inversely with the cubic power of the grain size. The
characteristics of this creep are (Edington et al., 1976):
• A linear relationship exists between strain rate and stress, i,e., m = 1.
• Grain elongation occurs.
• The activation energy for deformation is that for grain boundary diffusion.
• Coble creep dominates at a comparatively low temperature compared to Nabarro-
Herring creep.
45
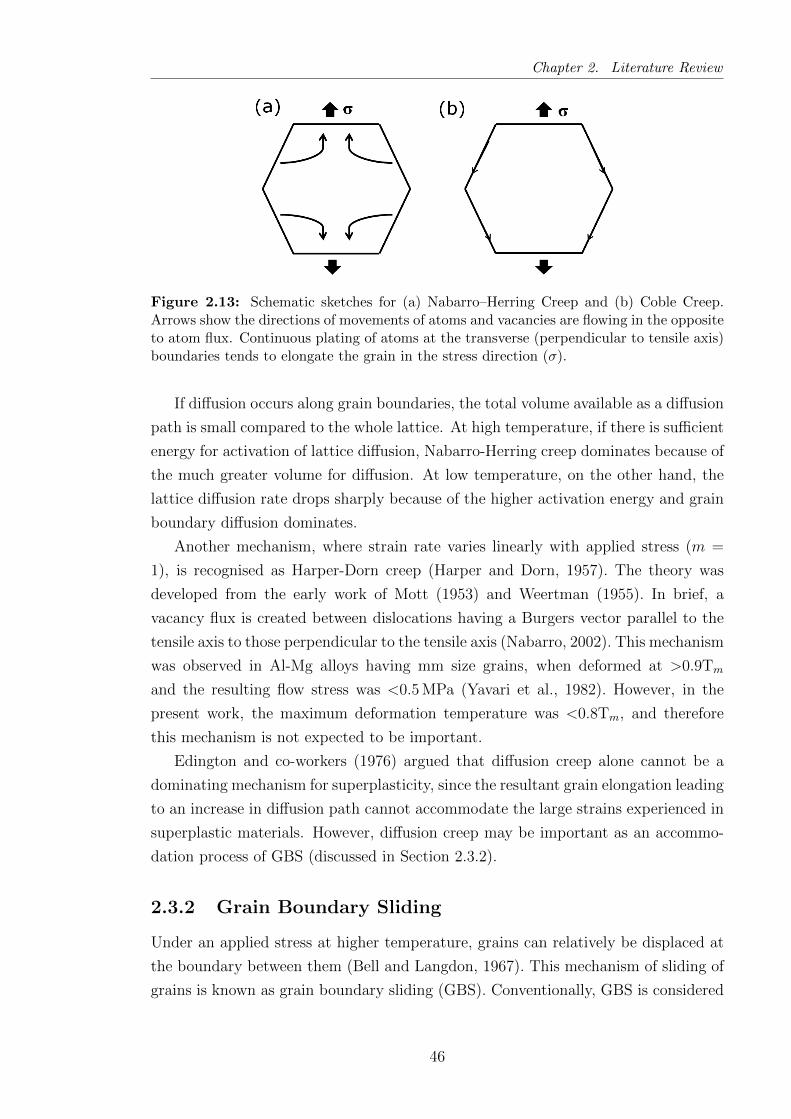
Chapter 2. Literature Review
Figure 2.13: Schematic sketches for (a) Nabarro–Herring Creep and (b) Coble Creep.Arrows show the directions of movements of atoms and vacancies are flowing in the oppositeto atom flux. Continuous plating of atoms at the transverse (perpendicular to tensile axis)boundaries tends to elongate the grain in the stress direction (σ).
If diffusion occurs along grain boundaries, the total volume available as a diffusion
path is small compared to the whole lattice. At high temperature, if there is sufficient
energy for activation of lattice diffusion, Nabarro-Herring creep dominates because of
the much greater volume for diffusion. At low temperature, on the other hand, the
lattice diffusion rate drops sharply because of the higher activation energy and grain
boundary diffusion dominates.
Another mechanism, where strain rate varies linearly with applied stress (m =
1), is recognised as Harper-Dorn creep (Harper and Dorn, 1957). The theory was
developed from the early work of Mott (1953) and Weertman (1955). In brief, a
vacancy flux is created between dislocations having a Burgers vector parallel to the
tensile axis to those perpendicular to the tensile axis (Nabarro, 2002). This mechanism
was observed in Al-Mg alloys having mm size grains, when deformed at >0.9Tm
and the resulting flow stress was <0.5 MPa (Yavari et al., 1982). However, in the
present work, the maximum deformation temperature was <0.8Tm, and therefore
this mechanism is not expected to be important.
Edington and co-workers (1976) argued that diffusion creep alone cannot be a
dominating mechanism for superplasticity, since the resultant grain elongation leading
to an increase in diffusion path cannot accommodate the large strains experienced in
superplastic materials. However, diffusion creep may be important as an accommo-
dation process of GBS (discussed in Section 2.3.2).
2.3.2 Grain Boundary Sliding
Under an applied stress at higher temperature, grains can relatively be displaced at
the boundary between them (Bell and Langdon, 1967). This mechanism of sliding of
grains is known as grain boundary sliding (GBS). Conventionally, GBS is considered
46
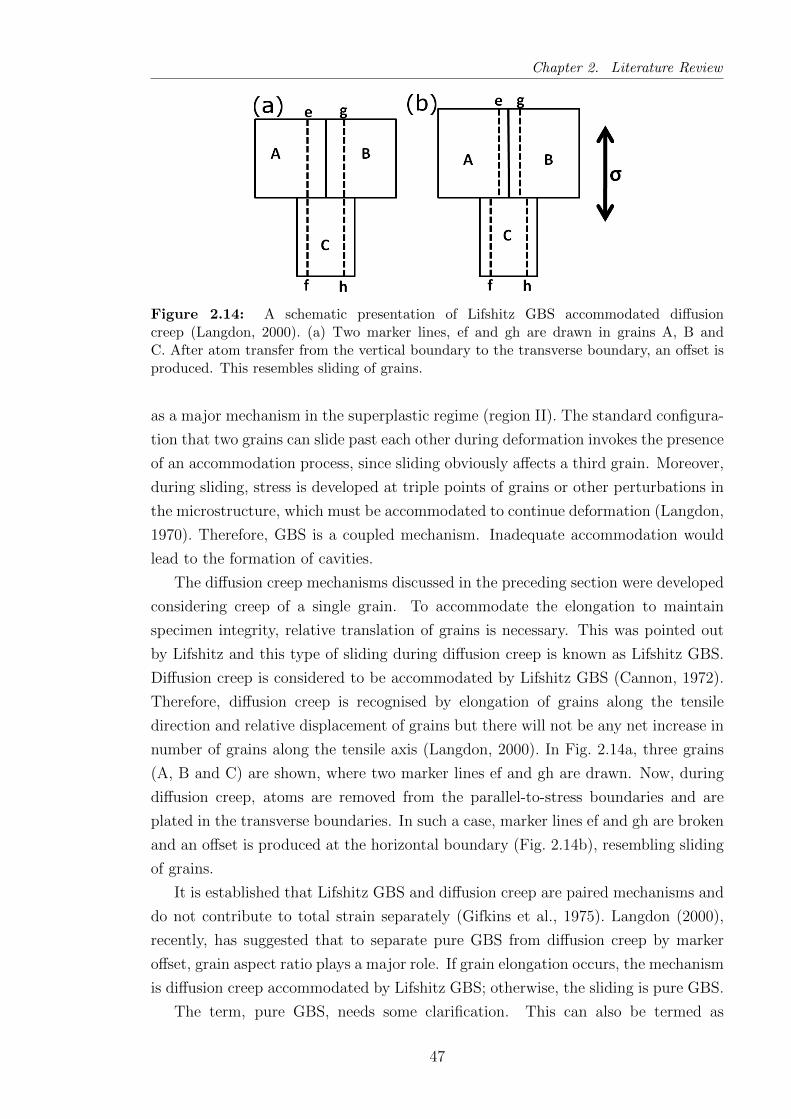
Chapter 2. Literature Review
Figure 2.14: A schematic presentation of Lifshitz GBS accommodated diffusioncreep (Langdon, 2000). (a) Two marker lines, ef and gh are drawn in grains A, B andC. After atom transfer from the vertical boundary to the transverse boundary, an offset isproduced. This resembles sliding of grains.
as a major mechanism in the superplastic regime (region II). The standard configura-
tion that two grains can slide past each other during deformation invokes the presence
of an accommodation process, since sliding obviously affects a third grain. Moreover,
during sliding, stress is developed at triple points of grains or other perturbations in
the microstructure, which must be accommodated to continue deformation (Langdon,
1970). Therefore, GBS is a coupled mechanism. Inadequate accommodation would
lead to the formation of cavities.
The diffusion creep mechanisms discussed in the preceding section were developed
considering creep of a single grain. To accommodate the elongation to maintain
specimen integrity, relative translation of grains is necessary. This was pointed out
by Lifshitz and this type of sliding during diffusion creep is known as Lifshitz GBS.
Diffusion creep is considered to be accommodated by Lifshitz GBS (Cannon, 1972).
Therefore, diffusion creep is recognised by elongation of grains along the tensile
direction and relative displacement of grains but there will not be any net increase in
number of grains along the tensile axis (Langdon, 2000). In Fig. 2.14a, three grains
(A, B and C) are shown, where two marker lines ef and gh are drawn. Now, during
diffusion creep, atoms are removed from the parallel-to-stress boundaries and are
plated in the transverse boundaries. In such a case, marker lines ef and gh are broken
and an offset is produced at the horizontal boundary (Fig. 2.14b), resembling sliding
of grains.
It is established that Lifshitz GBS and diffusion creep are paired mechanisms and
do not contribute to total strain separately (Gifkins et al., 1975). Langdon (2000),
recently, has suggested that to separate pure GBS from diffusion creep by marker
offset, grain aspect ratio plays a major role. If grain elongation occurs, the mechanism
is diffusion creep accommodated by Lifshitz GBS; otherwise, the sliding is pure GBS.
The term, pure GBS, needs some clarification. This can also be termed as
47
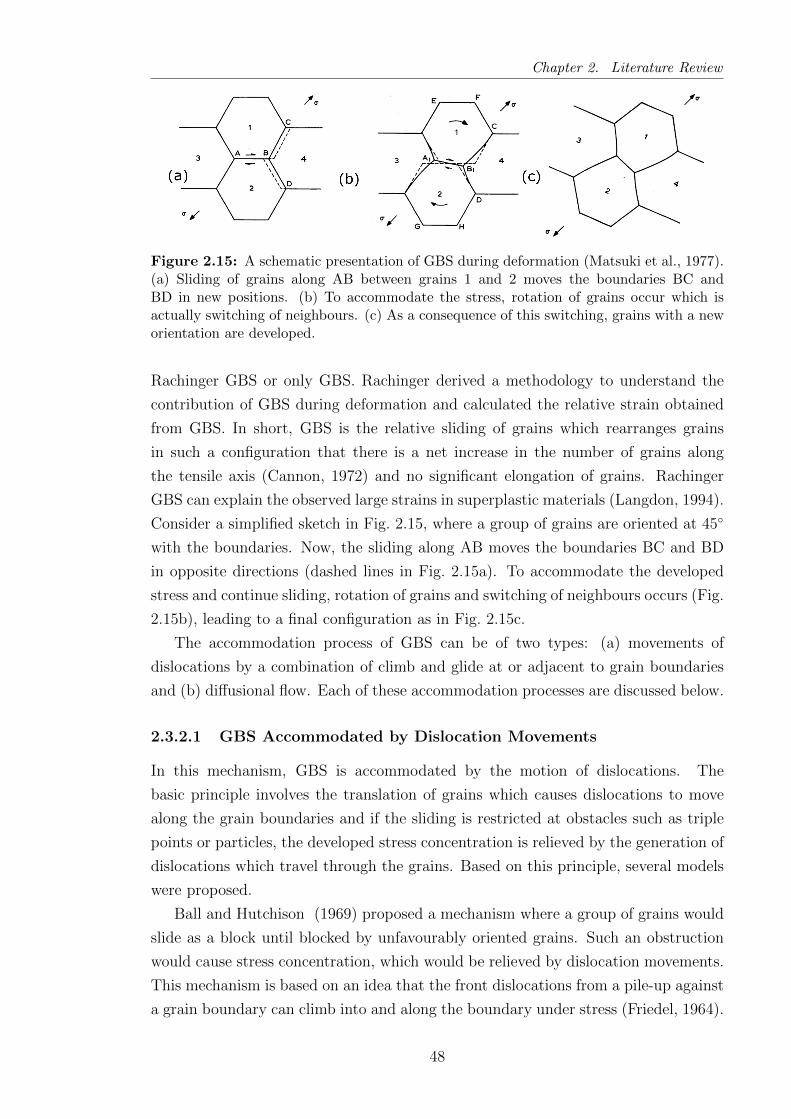
Chapter 2. Literature Review
Figure 2.15: A schematic presentation of GBS during deformation (Matsuki et al., 1977).(a) Sliding of grains along AB between grains 1 and 2 moves the boundaries BC andBD in new positions. (b) To accommodate the stress, rotation of grains occur which isactually switching of neighbours. (c) As a consequence of this switching, grains with a neworientation are developed.
Rachinger GBS or only GBS. Rachinger derived a methodology to understand the
contribution of GBS during deformation and calculated the relative strain obtained
from GBS. In short, GBS is the relative sliding of grains which rearranges grains
in such a configuration that there is a net increase in the number of grains along
the tensile axis (Cannon, 1972) and no significant elongation of grains. Rachinger
GBS can explain the observed large strains in superplastic materials (Langdon, 1994).
Consider a simplified sketch in Fig. 2.15, where a group of grains are oriented at 45
with the boundaries. Now, the sliding along AB moves the boundaries BC and BD
in opposite directions (dashed lines in Fig. 2.15a). To accommodate the developed
stress and continue sliding, rotation of grains and switching of neighbours occurs (Fig.
2.15b), leading to a final configuration as in Fig. 2.15c.
The accommodation process of GBS can be of two types: (a) movements of
dislocations by a combination of climb and glide at or adjacent to grain boundaries
and (b) diffusional flow. Each of these accommodation processes are discussed below.
2.3.2.1 GBS Accommodated by Dislocation Movements
In this mechanism, GBS is accommodated by the motion of dislocations. The
basic principle involves the translation of grains which causes dislocations to move
along the grain boundaries and if the sliding is restricted at obstacles such as triple
points or particles, the developed stress concentration is relieved by the generation of
dislocations which travel through the grains. Based on this principle, several models
were proposed.
Ball and Hutchison (1969) proposed a mechanism where a group of grains would
slide as a block until blocked by unfavourably oriented grains. Such an obstruction
would cause stress concentration, which would be relieved by dislocation movements.
This mechanism is based on an idea that the front dislocations from a pile-up against
a grain boundary can climb into and along the boundary under stress (Friedel, 1964).
48
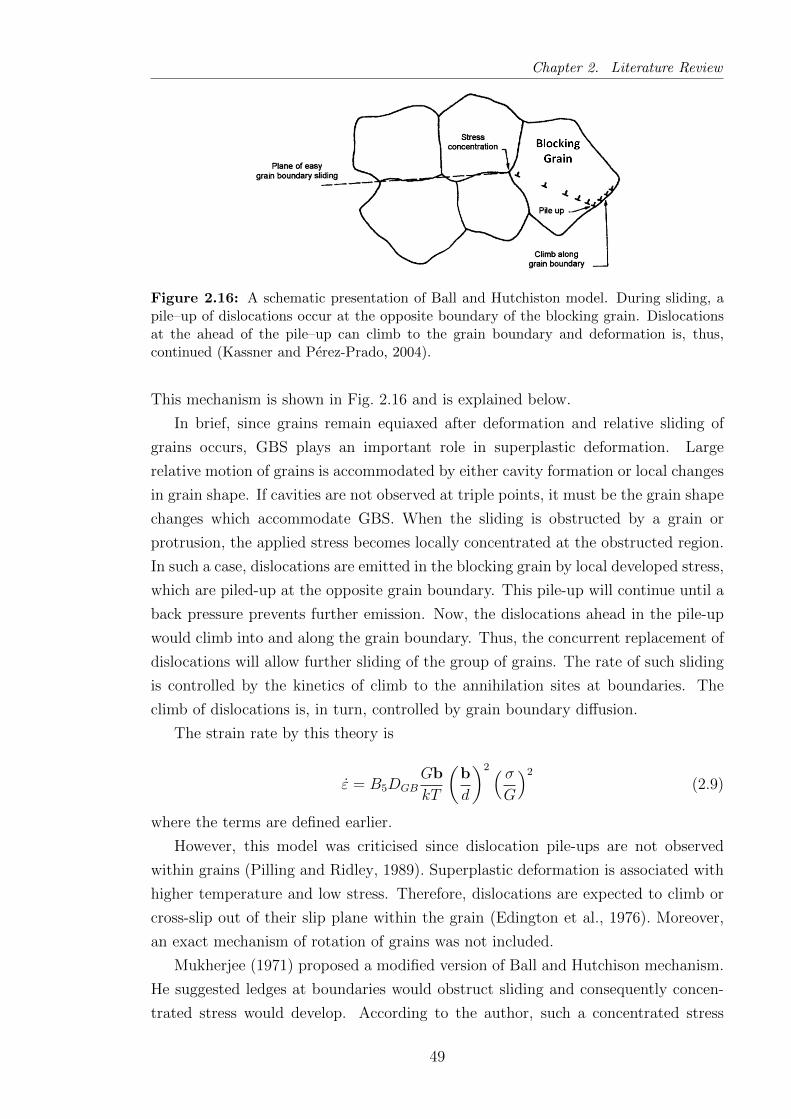
Chapter 2. Literature Review
Figure 2.16: A schematic presentation of Ball and Hutchiston model. During sliding, apile–up of dislocations occur at the opposite boundary of the blocking grain. Dislocationsat the ahead of the pile–up can climb to the grain boundary and deformation is, thus,continued (Kassner and Perez-Prado, 2004).
This mechanism is shown in Fig. 2.16 and is explained below.
In brief, since grains remain equiaxed after deformation and relative sliding of
grains occurs, GBS plays an important role in superplastic deformation. Large
relative motion of grains is accommodated by either cavity formation or local changes
in grain shape. If cavities are not observed at triple points, it must be the grain shape
changes which accommodate GBS. When the sliding is obstructed by a grain or
protrusion, the applied stress becomes locally concentrated at the obstructed region.
In such a case, dislocations are emitted in the blocking grain by local developed stress,
which are piled-up at the opposite grain boundary. This pile-up will continue until a
back pressure prevents further emission. Now, the dislocations ahead in the pile-up
would climb into and along the grain boundary. Thus, the concurrent replacement of
dislocations will allow further sliding of the group of grains. The rate of such sliding
is controlled by the kinetics of climb to the annihilation sites at boundaries. The
climb of dislocations is, in turn, controlled by grain boundary diffusion.
The strain rate by this theory is
ε = B5DGBGb
kT
(b
d
)2 ( σG
)2
(2.9)
where the terms are defined earlier.
However, this model was criticised since dislocation pile-ups are not observed
within grains (Pilling and Ridley, 1989). Superplastic deformation is associated with
higher temperature and low stress. Therefore, dislocations are expected to climb or
cross-slip out of their slip plane within the grain (Edington et al., 1976). Moreover,
an exact mechanism of rotation of grains was not included.
Mukherjee (1971) proposed a modified version of Ball and Hutchison mechanism.
He suggested ledges at boundaries would obstruct sliding and consequently concen-
trated stress would develop. According to the author, such a concentrated stress
49
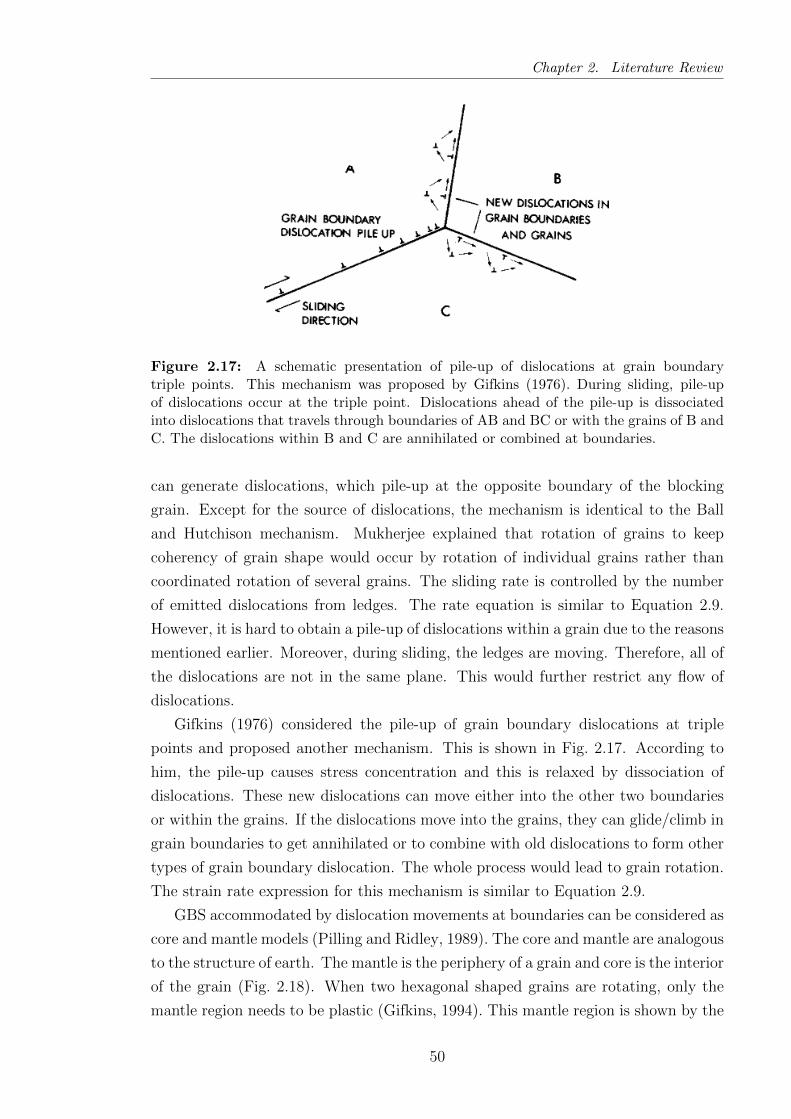
Chapter 2. Literature Review
Figure 2.17: A schematic presentation of pile-up of dislocations at grain boundarytriple points. This mechanism was proposed by Gifkins (1976). During sliding, pile-upof dislocations occur at the triple point. Dislocations ahead of the pile-up is dissociatedinto dislocations that travels through boundaries of AB and BC or with the grains of B andC. The dislocations within B and C are annihilated or combined at boundaries.
can generate dislocations, which pile-up at the opposite boundary of the blocking
grain. Except for the source of dislocations, the mechanism is identical to the Ball
and Hutchison mechanism. Mukherjee explained that rotation of grains to keep
coherency of grain shape would occur by rotation of individual grains rather than
coordinated rotation of several grains. The sliding rate is controlled by the number
of emitted dislocations from ledges. The rate equation is similar to Equation 2.9.
However, it is hard to obtain a pile-up of dislocations within a grain due to the reasons
mentioned earlier. Moreover, during sliding, the ledges are moving. Therefore, all of
the dislocations are not in the same plane. This would further restrict any flow of
dislocations.
Gifkins (1976) considered the pile-up of grain boundary dislocations at triple
points and proposed another mechanism. This is shown in Fig. 2.17. According to
him, the pile-up causes stress concentration and this is relaxed by dissociation of
dislocations. These new dislocations can move either into the other two boundaries
or within the grains. If the dislocations move into the grains, they can glide/climb in
grain boundaries to get annihilated or to combine with old dislocations to form other
types of grain boundary dislocation. The whole process would lead to grain rotation.
The strain rate expression for this mechanism is similar to Equation 2.9.
GBS accommodated by dislocation movements at boundaries can be considered as
core and mantle models (Pilling and Ridley, 1989). The core and mantle are analogous
to the structure of earth. The mantle is the periphery of a grain and core is the interior
of the grain (Fig. 2.18). When two hexagonal shaped grains are rotating, only the
mantle region needs to be plastic (Gifkins, 1994). This mantle region is shown by the
50
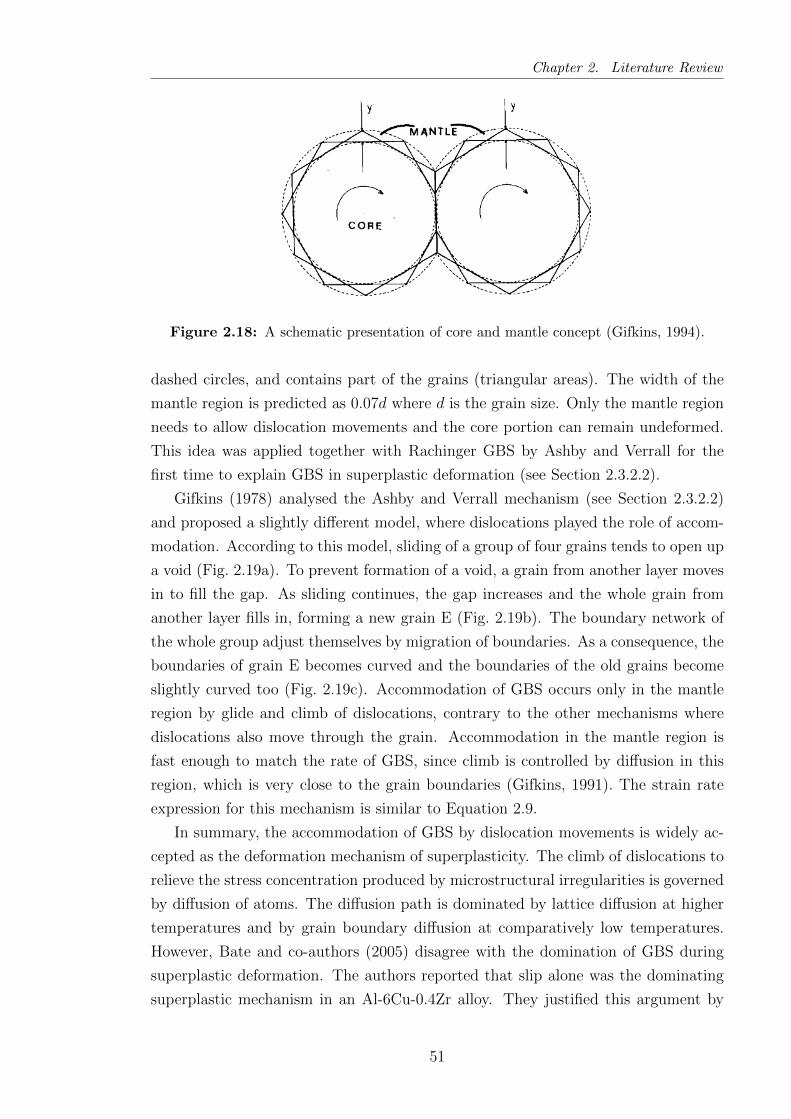
Chapter 2. Literature Review
Figure 2.18: A schematic presentation of core and mantle concept (Gifkins, 1994).
dashed circles, and contains part of the grains (triangular areas). The width of the
mantle region is predicted as 0.07d where d is the grain size. Only the mantle region
needs to allow dislocation movements and the core portion can remain undeformed.
This idea was applied together with Rachinger GBS by Ashby and Verrall for the
first time to explain GBS in superplastic deformation (see Section 2.3.2.2).
Gifkins (1978) analysed the Ashby and Verrall mechanism (see Section 2.3.2.2)
and proposed a slightly different model, where dislocations played the role of accom-
modation. According to this model, sliding of a group of four grains tends to open up
a void (Fig. 2.19a). To prevent formation of a void, a grain from another layer moves
in to fill the gap. As sliding continues, the gap increases and the whole grain from
another layer fills in, forming a new grain E (Fig. 2.19b). The boundary network of
the whole group adjust themselves by migration of boundaries. As a consequence, the
boundaries of grain E becomes curved and the boundaries of the old grains become
slightly curved too (Fig. 2.19c). Accommodation of GBS occurs only in the mantle
region by glide and climb of dislocations, contrary to the other mechanisms where
dislocations also move through the grain. Accommodation in the mantle region is
fast enough to match the rate of GBS, since climb is controlled by diffusion in this
region, which is very close to the grain boundaries (Gifkins, 1991). The strain rate
expression for this mechanism is similar to Equation 2.9.
In summary, the accommodation of GBS by dislocation movements is widely ac-
cepted as the deformation mechanism of superplasticity. The climb of dislocations to
relieve the stress concentration produced by microstructural irregularities is governed
by diffusion of atoms. The diffusion path is dominated by lattice diffusion at higher
temperatures and by grain boundary diffusion at comparatively low temperatures.
However, Bate and co-authors (2005) disagree with the domination of GBS during
superplastic deformation. The authors reported that slip alone was the dominating
superplastic mechanism in an Al-6Cu-0.4Zr alloy. They justified this argument by
51

Chapter 2. Literature Review
Figure 2.19: A schematic representation of GBS by Gifkins model (Gifkins, 1978).Dislocation movements occur in the mantle region.
the observation of a reduction of texture and persistence of a banded microstructure.
2.3.2.2 GBS Accommodated by Diffusion
Ashby and Verrall (1973) proposed a new physical mechanism of superplasticity
based on Rachinger GBS which was, according to their model, accommodated by
diffusion. In this grain switching mechanism, accommodation occurs at triple points
by diffusion. The driving force for diffusion comes from the stress induced transport of
matter from the compressive boundaries to the tensile boundaries (Pilling and Ridley,
1989). Ashby and Verrall argued that grain rotation was inevitable since grains were
not of equal size and did not form a perfect hexagonal array.
The mechanism can be explained in terms of a group of four grains (Fig. 2.20a).
This group of grains moves by GBS and an intermediate stage is developed (Fig.
2.20b). In this stage, the shape of the grains is changed by diffusion in the mantle
region and a quadruple node is formed. Grain boundary migration, together with
GBS and diffusion, develops the final shape of the grains (Fig. 2.20c). After the
completion of switching, two triple points are again developed. The diffusion in the
intermediate stage occurs along the path MQ and matter is transported from the M
region to both N and Q regions (Fig. 2.20d). This mechanism considers the existence
of a threshold stress where the mechanism becomes operating. This threshold stress
arises from the large energy required to change the grain boundary surface area.
The strain rate is described as
ε = B6DeffGb
kT
(b
d
)2(σ − σoG
)(2.10)
where Deff is the effective diffusivity and σo is the threshold stress. Since super-
plastic materials may exhibit activation energies for plastic flow equal to either grain
boundary or lattice diffusion, the use of Deff is suggested to develop a constitutive
law (Sherby and Wadsworth, 1982). Deff is expressed as
52
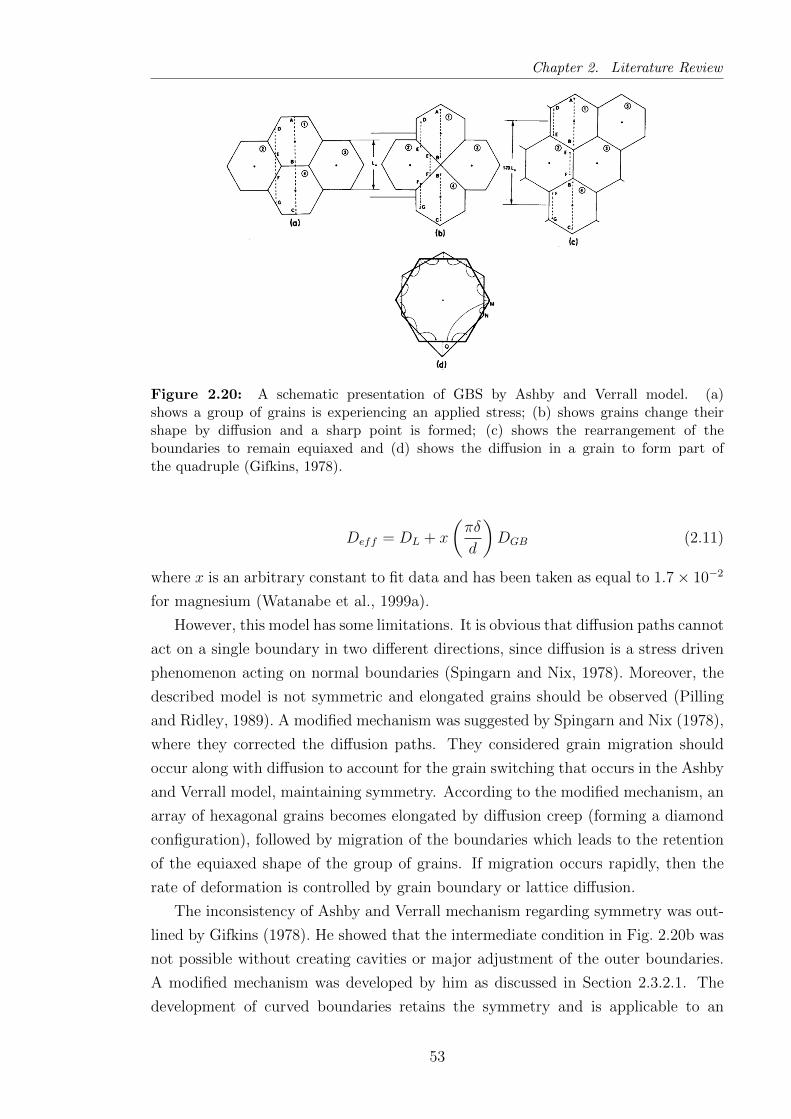
Chapter 2. Literature Review
Figure 2.20: A schematic presentation of GBS by Ashby and Verrall model. (a)shows a group of grains is experiencing an applied stress; (b) shows grains change theirshape by diffusion and a sharp point is formed; (c) shows the rearrangement of theboundaries to remain equiaxed and (d) shows the diffusion in a grain to form part ofthe quadruple (Gifkins, 1978).
Deff = DL + x
(πδ
d
)DGB (2.11)
where x is an arbitrary constant to fit data and has been taken as equal to 1.7× 10⁻²
for magnesium (Watanabe et al., 1999a).
However, this model has some limitations. It is obvious that diffusion paths cannot
act on a single boundary in two different directions, since diffusion is a stress driven
phenomenon acting on normal boundaries (Spingarn and Nix, 1978). Moreover, the
described model is not symmetric and elongated grains should be observed (Pilling
and Ridley, 1989). A modified mechanism was suggested by Spingarn and Nix (1978),
where they corrected the diffusion paths. They considered grain migration should
occur along with diffusion to account for the grain switching that occurs in the Ashby
and Verrall model, maintaining symmetry. According to the modified mechanism, an
array of hexagonal grains becomes elongated by diffusion creep (forming a diamond
configuration), followed by migration of the boundaries which leads to the retention
of the equiaxed shape of the group of grains. If migration occurs rapidly, then the
rate of deformation is controlled by grain boundary or lattice diffusion.
The inconsistency of Ashby and Verrall mechanism regarding symmetry was out-
lined by Gifkins (1978). He showed that the intermediate condition in Fig. 2.20b was
not possible without creating cavities or major adjustment of the outer boundaries.
A modified mechanism was developed by him as discussed in Section 2.3.2.1. The
development of curved boundaries retains the symmetry and is applicable to an
53

Chapter 2. Literature Review
aggregate of grains.
2.3.3 Dislocation Creep
In region III, the dominating deformation mechanism is dislocation creep. In this
mechanism, deformation is controlled by motion of dislocations by glide and climb.
Dislocation tangles are formed by condensation of dislocations, forming subgrains.
Grain elongation is evident in this region and flow stress is comparatively less sen-
sitive to grain size (Edington et al., 1976). Dislocation creep is controlled by the
processes of strain hardening and dynamic recovery. Strain hardening occurs by
the hindrance of dislocation movement during deformation and recovery or softening
depends annihilation and climb of dislocations. Creep deformation in this regime can
be classified as glide and climb controlled mechanisms. Both of them are discussed
below.
Dislocation Glide Controlled Mechanism
If deformation is controlled by interaction of gliding dislocations with solute atoms,
it is commonly termed as viscous glide creep or solute drag creep. No clustering of
dislocation (pile-ups or sub-cells) is observed in this mechanism.
When a crystal contains solute atoms, having dissimilar size to the host/solvent
atoms, the lattice of the latter is distorted. This distortion is minimized if the solute
locates in a favourable position around the dislocation to enable compensation of
the strain fields. This means that solute atoms are drawn towards dislocations as
a net result of the interactions of strain fields (Reed-Hill, 1973). The rate of this
movement is controlled by diffusion of atoms. At sufficiently higher temperature,
diffusion occurs rapidly and the atoms are segregated around a dislocation. As a
consequence, an equilibrium state is developed where the concentration of solute
atoms is higher around dislocations than in the surrounding areas. This phenomenon
is known as a dislocation-solute atmosphere. When such a dislocation glides away
from the solute atmosphere, a stress field is developed to keep the solute atoms in
equilibrium by jumps of atoms from one position to another. The resulting drag
force is, thus, depends on the rate of dislocation movement and diffusion of atoms to
maintain the equilibrium state.
Now, it is necessary to check whether glide or climb of dislocations is rate con-
trolling in the situation mentioned above. Weertman (1957) suggested that pile-
up of dislocations by the mutual interactions is retarded by a back stress. In this
condition, climbing and annihilation of dislocations ahead of the pile-up relieve the
stress. Therefore, climb and glide are sequential processes and slower one determines
the rate. Usually, climb is considered as a rapid process. In solid-solution alloys,
when glide is restricted by the interaction of dislocations and solute atoms (Cottrell
54

Chapter 2. Literature Review
and Jaswon, 1949), the strain rate is (Vagarali and Langdon, 1982)
ε = B7Ds
(Gb
kT
)( σG
)3
(2.12)
where B7 is a constant which depends on solute-solvent size difference, concentration
of solute atoms and normalised values of k, T , G and b. Ds is the solute diffusivity
coefficient. For Mg-Al alloys, Ds is (Vagarali and Langdon, 1982)
Ds = 1.2× 10³ exp (−Qs/RT ) m2 s−1 (2.13)
where Qs is equal to 143 kJ mol−1 for diffusivity of aluminium into magnesium.
Solute drag creep becomes dominating (compared to climb controlled creep) when
solute concentration is increased and stress is below a critical value (Mohamed and
Langdon, 1974). However, increasing solute concentration may not significantly affect
flow characteristics of an alloy. For example, in Al-Mg alloys, increasing magnesium
concentration from 2.8 to 5.5 wt% gave only a subtle increase in strain rate sensitiv-
ity (Taleff et al., 1998). This may be attributed to the saturation effect of magnesium
solute in the dislocation atmosphere (McNelley et al., 1989).
The temperature dependence of solute drag creep is related to solute concentra-
tion (Sherby and Taleff, 2002). At higher temperature, the concentration of solute
atoms in the dislocation atmosphere is decreased. Above a certain temperature,
the concentration may become similar to the matrix. When this occurs, creep is
controlled by dislocation climb.
Dislocation Climb Controlled Mechanism
Climb describes dislocation motion where a dislocation can move out of the slip
plane onto another plane. This process occurs by diffusion of vacancies. When
dislocation climb controls deformation, the activation energy of deformation is equal
to the activation energy for lattice diffusion at higher temperature and pipe diffusion
at low temperature (Sherby and Weertman, 1979). However, in dislocation creep,
the activation energy for magnesium deformation can be as high as 230 kJ mol−1
(larger than that for lattice diffusion) at >0.75Tm, due to the operation of non-basal
slip (Tegart, 1961). In such a case, faster slip by basal or non-basal systems would
control the creep rate (Sherby and Burke, 1968).
The basic model of climb-controlled dislocation creep was developed by Weertman
(1955). The theory was based on Mott’s (1953) suggestion that the stress field of
piled-up dislocations (at an obstacle such as grain boundary) induces dislocations
from other slip systems to join the group and form an immobile dislocation. Under
an applied stress, dislocations glide through the grain until they meet an obstacle,
such as grain boundary. At this configuration, they start to pile-up and immobile
55
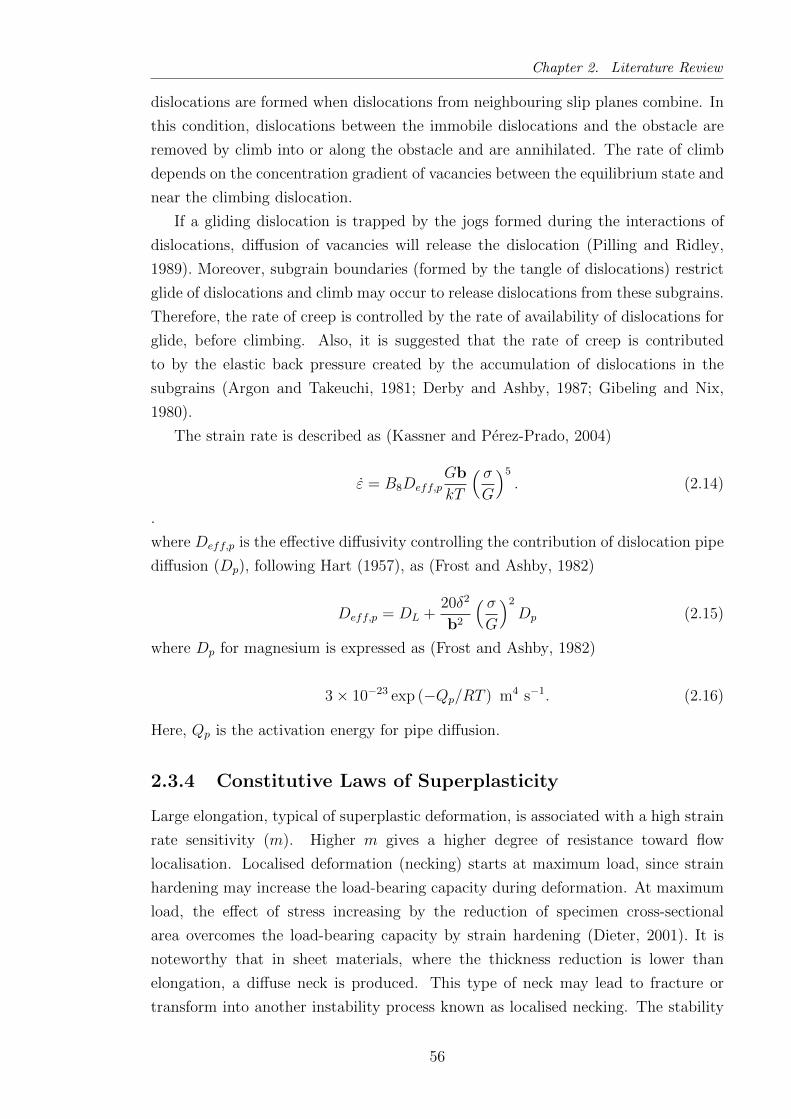
Chapter 2. Literature Review
dislocations are formed when dislocations from neighbouring slip planes combine. In
this condition, dislocations between the immobile dislocations and the obstacle are
removed by climb into or along the obstacle and are annihilated. The rate of climb
depends on the concentration gradient of vacancies between the equilibrium state and
near the climbing dislocation.
If a gliding dislocation is trapped by the jogs formed during the interactions of
dislocations, diffusion of vacancies will release the dislocation (Pilling and Ridley,
1989). Moreover, subgrain boundaries (formed by the tangle of dislocations) restrict
glide of dislocations and climb may occur to release dislocations from these subgrains.
Therefore, the rate of creep is controlled by the rate of availability of dislocations for
glide, before climbing. Also, it is suggested that the rate of creep is contributed
to by the elastic back pressure created by the accumulation of dislocations in the
subgrains (Argon and Takeuchi, 1981; Derby and Ashby, 1987; Gibeling and Nix,
1980).
The strain rate is described as (Kassner and Perez-Prado, 2004)
ε = B8Deff,pGb
kT
( σG
)5
. (2.14)
.
where Deff,p is the effective diffusivity controlling the contribution of dislocation pipe
diffusion (Dp), following Hart (1957), as (Frost and Ashby, 1982)
Deff,p = DL +20δ2
b2
( σG
)2
Dp (2.15)
where Dp for magnesium is expressed as (Frost and Ashby, 1982)
3× 10⁻²³ exp (−Qp/RT ) m4 s−1. (2.16)
Here, Qp is the activation energy for pipe diffusion.
2.3.4 Constitutive Laws of Superplasticity
Large elongation, typical of superplastic deformation, is associated with a high strain
rate sensitivity (m). Higher m gives a higher degree of resistance toward flow
localisation. Localised deformation (necking) starts at maximum load, since strain
hardening may increase the load-bearing capacity during deformation. At maximum
load, the effect of stress increasing by the reduction of specimen cross-sectional
area overcomes the load-bearing capacity by strain hardening (Dieter, 2001). It is
noteworthy that in sheet materials, where the thickness reduction is lower than
elongation, a diffuse neck is produced. This type of neck may lead to fracture or
transform into another instability process known as localised necking. The stability
56
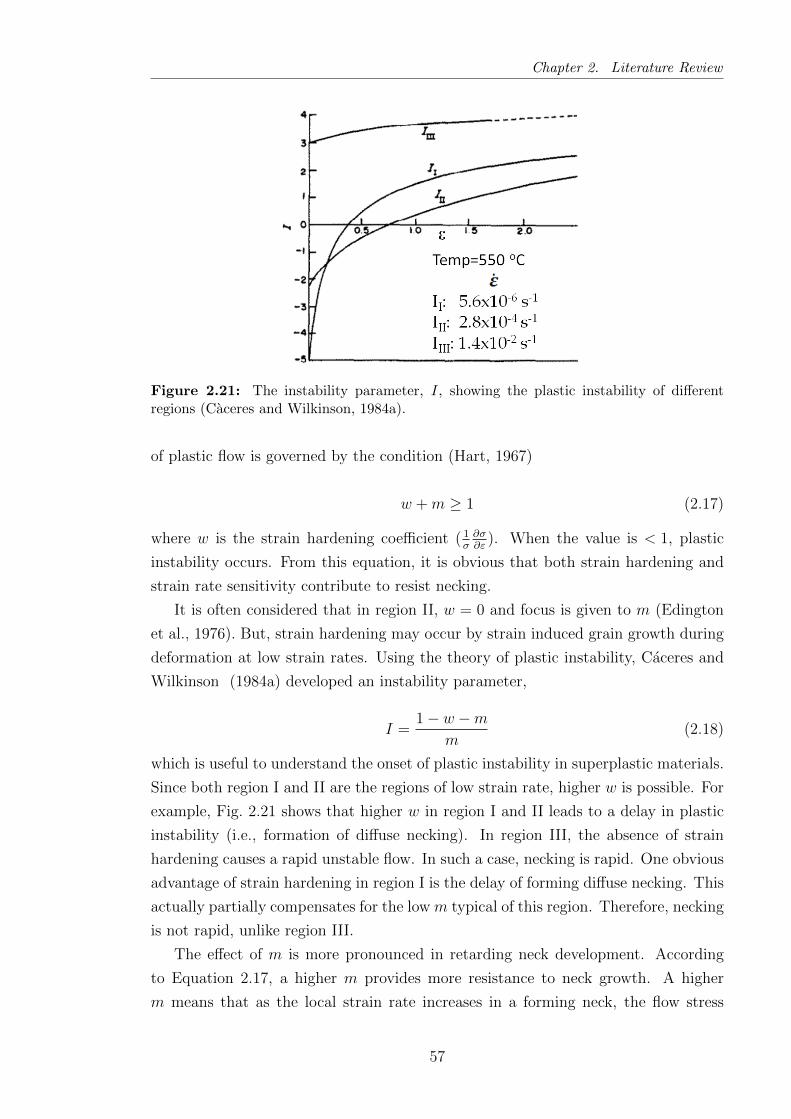
Chapter 2. Literature Review
Figure 2.21: The instability parameter, I, showing the plastic instability of differentregions (Caceres and Wilkinson, 1984a).
of plastic flow is governed by the condition (Hart, 1967)
w +m ≥ 1 (2.17)
where w is the strain hardening coefficient ( 1σ∂σ∂ε
). When the value is < 1, plastic
instability occurs. From this equation, it is obvious that both strain hardening and
strain rate sensitivity contribute to resist necking.
It is often considered that in region II, w = 0 and focus is given to m (Edington
et al., 1976). But, strain hardening may occur by strain induced grain growth during
deformation at low strain rates. Using the theory of plastic instability, Caceres and
Wilkinson (1984a) developed an instability parameter,
I =1− w −m
m(2.18)
which is useful to understand the onset of plastic instability in superplastic materials.
Since both region I and II are the regions of low strain rate, higher w is possible. For
example, Fig. 2.21 shows that higher w in region I and II leads to a delay in plastic
instability (i.e., formation of diffuse necking). In region III, the absence of strain
hardening causes a rapid unstable flow. In such a case, necking is rapid. One obvious
advantage of strain hardening in region I is the delay of forming diffuse necking. This
actually partially compensates for the low m typical of this region. Therefore, necking
is not rapid, unlike region III.
The effect of m is more pronounced in retarding neck development. According
to Equation 2.17, a higher m provides more resistance to neck growth. A higher
m means that as the local strain rate increases in a forming neck, the flow stress
57

Chapter 2. Literature Review
Figure 2.22: (a) A schematic presentation of the effect of strain rate sensitivity (m) on thegrowth profile of a neck. It is a simplified schematic of an actual profile (Ghosh, 1977). Thescale is arbitrary. (b) A plot showing the degree of sharpness of neck during deformationin different regions (Mohamed and Langdon, 1981). Lo represents the initial gauge lengthwhich was segmented in 14 sections and n/nt is the normalised ratio of the number ofsegments having local elongation ratio equal or greater than total elongation ratio. As n/ntapproaches zero, a sharp neck is developed.
increases rapidly. This increment of local strain rate requires a higher local stress
to propagate the neck. Therefore, the growth of the neck is retarded as the applied
stress is insufficient to continue its growth. In Fig. 2.22a, the effect of increasing
m on the growth profile of a neck is shown. The higher the m-value, the lower the
development of neck. The sharpness of neck for superplastic materials was studied
by Mohamed and Langdon (1981). They segmented the gauge length into several
regions and calculated the local elongation in each segment. The number of segments
having similar or higher elongation compared to the total elongation was counted.
The normalised ratio of these segments, n/nt, gives the sharpness of neck. When the
ratio is 1, the developed neck is diffuse and a lower value represents flow localisation.
In Fig. 2.22b, three regions of superplastic deformation are shown. In region II, flow
localisation is resisted for a prolonged time. On the other hand, in region I and
III, shortly after the onset of deformation, flow is localised. This behaviour can be
explained by m. In region II, m is highest and in other two regions, the value is low.
In the previous section, different strain rates are shown for different deformation
mechanisms. The major difference in the expressions for different mechanisms is
the variation of the power of stress and grain size. Using the stress exponent (n =
1/m) and grain size exponent (p), all those equations can be combined into a single
constitutive law as
ε = AGb
kT
(b
d
)p ( σG
)nD exp
(− Q
RT
)(2.19)
where A is a dimensionless constant, D is the appropriate diffusion constant having
58

Chapter 2. Literature Review
Table 2.6: Values of stress exponent (n) and grain size exponent (p) (Niehet al., 1997; Sherby and Wadsworth, 1982)
Deformation Mechanism n p
Diffusion Creep 1 2 (diffusion is lattice controlled)
3 (diffusion is grain boundary
controlled)
Grain Boundary Sliding 2 2 (diffusion is lattice controlled)
3 (diffusion is grain boundary
controlled)
Solute Drag Creep 3 0
Dislocation Creep 5 0
an activation energy Q, G is the shear modulus, d is the grain size, p is the grain size
exponent reflecting the grain size dependency of flow (Equation 2.2). Temperature
dependent G (in MPa) for magnesium was derived by Vagarali and Langdon (1981)
from the estimations made by Slutsky and Garland (1957) as
G =(1.92× 10⁴ − 8.6T
)MPa (2.20)
where T is the absolute temperature.
Now, it is clear that for a particular temperature and microstructure, the unknown
parameters are Q, n, p and A. If they are calculated, then the corresponding strain
rate of deformation can be calculated.
n can be determined from the inverse slope of a stress-strain rate curve. p can be
2 or 3 depending on the diffusion path. Corresponding A-values for magnesuim can
be found elsewhere (Kim et al., 2001). Other parameters are material constants and
can be found in Appendix A. The value of D depends on the diffusion process. It
may correspond to grain boundary diffusion (DGB), lattice diffusion (DL), dislocation
pipe diffusion (DP ) or diffusivity of solute atoms (DS).
Therefore, if the value of n and p are known, the mode of deformation can be
anticipated. The most important application of the constitutive law (Equation 2.19)
is to determine which particular set of experimental conditions and microstructure
gives a certain deformation mechanism. The values of n and p are summarised in
Table 2.6 for different mechanisms.
2.3.5 Superplasticity in Magnesium Alloys
In this section, superplasticity in different magnesium alloys is discussed together
with a summary of the parameters affecting their superplastic properties. In Table
59

Chapter 2. Literature Review
2.7, elongation to failure (ef ) of several AZ magnesium alloys under different test
conditions and with different initial microstructures are shown. Although it is often
difficult to make a direct comparison of results, since temperature, strain rate and
grain size are often all changed between studies, the following broad trends may be
identified.
Strain rate plays an important role in superplasticity. For instance, it is generally
anticipated that extensive dislocation activity occurs at high strain rates (region III)
and low m and grain elongation are common characteristics in this region. However, it
is possible that grains do not elongate during dislocation creep (the typical mechanism
at a higher strain rate condition) (Panicker et al., 2009). This may occur by the
tendency to re-establish dihedral angles of grains by diffusion to get to the equilibrium
condition (Raj and Lange, 1985). Therefore, it is very possible that even at higher
strain rate condition, grains tend to remain equiaxed. n ≈ 5 and Q = QL in the high
strain rate region is consistent with the mechanism of dislocation climb controlled
deformation (del Valle et al., 2005; Panicker et al., 2009). Deformation in the high
strain rate region, typically gives lower ef , due to a rapid flow localisation.
In contrast, in the low strain rate test condition, deformation occurs in the
superplastic region II. In this region, n is typically 2 and Q can be governed by
QGB or QL. In this region, dynamic grain growth (DGG) is quite common and this
gives the initial hardening of the flow curve. For example, in an AZ31 alloy, at a strain
rate of 10−4 s−1, the initial flow stress was increased from 4 to 10 MPa (Panicker et al.,
2009), showing the evidence of hardening. The increase of grain size was attributed to
the annihilation of low-angle boundaries. However, after a certain strain, DGG was
suppressed due to the annihilation of dislocations dynamically in the larger grains.
Since GBS is operating dominantly in region II, larger ef is generally obtained.
Another prominent parameter is temperature. It is noteworthy that a decrease in
grain size compensates for a higher strain rate and lower temperature. Therefore, de-
pending on grain size, dislocation creep or GBS dominates. In relatively fine-grained
alloys, where GBS dominates, the diffusion path for the accommodation process is
found to vary depending on temperature. Following Sherby and Wadsworth’s (1982)
work, Watanabe and co-authors (1999a) developed a map for the dominant diffusion
path as a function of temperature and grain size for magnesium. For example, at
350 C, lattice diffusion dominates above a grain size of 11µm. However, it is not clear
what the consequences of diffusion path are on ef . From the latter authors’ study, it
appears lattice diffusion controlled GBS gave better ef and m was 0.5 irrespective of
diffusion path.
Similarly, if both grain size and temperature are low, GBS is still favoured and
accommodation occurs by grain boundary diffusion. For example, in a ZK60 alloy
of 6.5µm grain size, accommodation of GBS was controlled by grain boundary
60
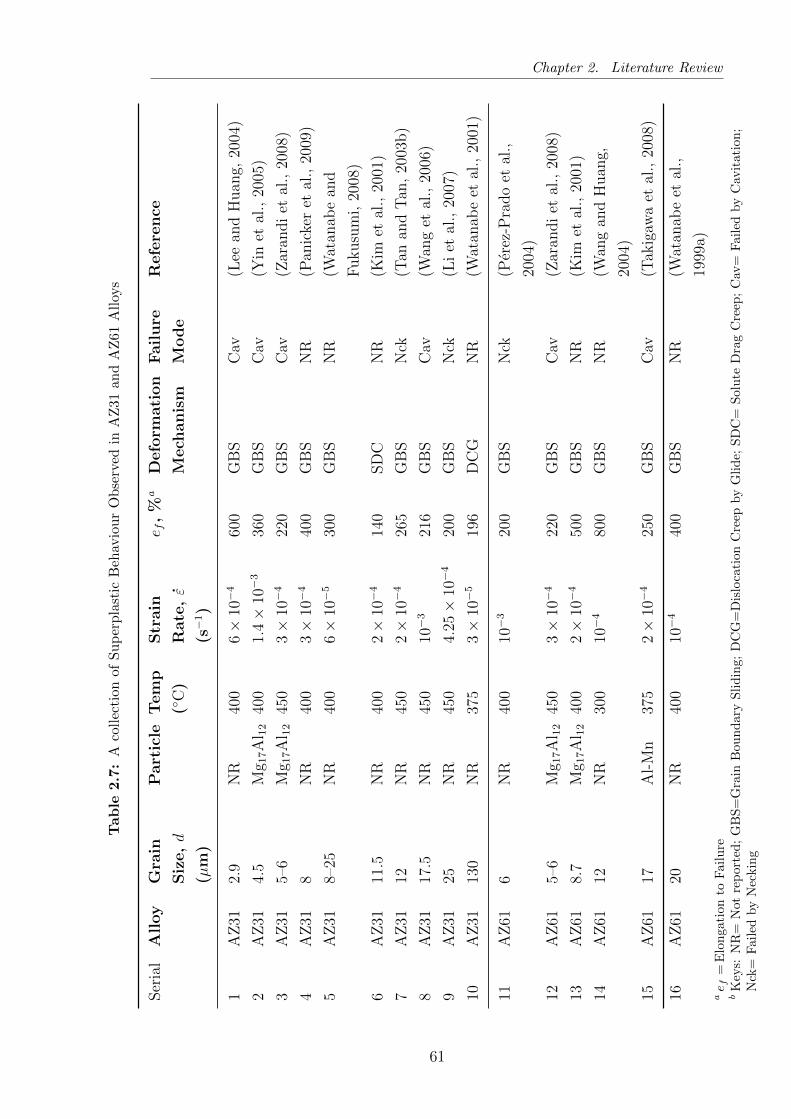
Chapter 2. Literature Review
Tab
le2.7
:A
coll
ecti
onof
Su
per
pla
stic
Beh
avio
ur
Ob
serv
edin
AZ
31an
dA
Z61
All
oys
Ser
ial
Alloy
Gra
in
Siz
e,d
(µm
)
Part
icle
Tem
p
(C
)
Str
ain
Rate
,ε
(s−
1)
e f,
%a
Defo
rmati
on
Mech
anis
m
Fail
ure
Mode
Refe
rence
1A
Z31
2.9
NR
400
6×
10−
460
0G
BS
Cav
(Lee
and
Huan
g,20
04)
2A
Z31
4.5
Mg 1
7A
l 12
400
1.4×
10−
336
0G
BS
Cav
(Yin
etal
.,20
05)
3A
Z31
5–6
Mg 1
7A
l 12
450
3×
10−
422
0G
BS
Cav
(Zar
andi
etal
.,20
08)
4A
Z31
8N
R40
03×
10−
440
0G
BS
NR
(Pan
icke
ret
al.,
2009
)
5A
Z31
8–25
NR
400
6×
10−
530
0G
BS
NR
(Wat
anab
ean
d
Fukusu
mi,
2008
)
6A
Z31
11.5
NR
400
2×
10−
414
0SD
CN
R(K
imet
al.,
2001
)
7A
Z31
12N
R45
02×
10−
426
5G
BS
Nck
(Tan
and
Tan
,20
03b)
8A
Z31
17.5
NR
450
10−
321
6G
BS
Cav
(Wan
get
al.,
2006
)
9A
Z31
25N
R45
04.
25×
10−
420
0G
BS
Nck
(Li
etal
.,20
07)
10A
Z31
130
NR
375
3×
10−
519
6D
CG
NR
(Wat
anab
eet
al.,
2001
)
11A
Z61
6N
R40
010−
320
0G
BS
Nck
(Per
ez-P
rado
etal
.,
2004
)
12A
Z61
5–6
Mg 1
7A
l 12
450
3×
10−
422
0G
BS
Cav
(Zar
andi
etal
.,20
08)
13A
Z61
8.7
Mg 1
7A
l 12
400
2×
10−
450
0G
BS
NR
(Kim
etal
.,20
01)
14A
Z61
12N
R30
010−
480
0G
BS
NR
(Wan
gan
dH
uan
g,
2004
)
15A
Z61
17A
l-M
n37
52×
10−
425
0G
BS
Cav
(Tak
igaw
aet
al.,
2008
)
16A
Z61
20N
R40
010−
440
0G
BS
NR
(Wat
anab
eet
al.,
1999
a)ae f
=E
lon
gati
onto
Fai
lure
bK
eys:
NR
=N
otre
por
ted
;G
BS
=G
rain
Bou
nd
ary
Sli
din
g;
DC
G=
Dis
loca
tion
Cre
epby
Gli
de;
SD
C=
Solu
teD
rag
Cre
ep;
Cav
=F
ailed
by
Cav
itati
on;
Nck
=F
aile
dby
Nec
kin
g
61
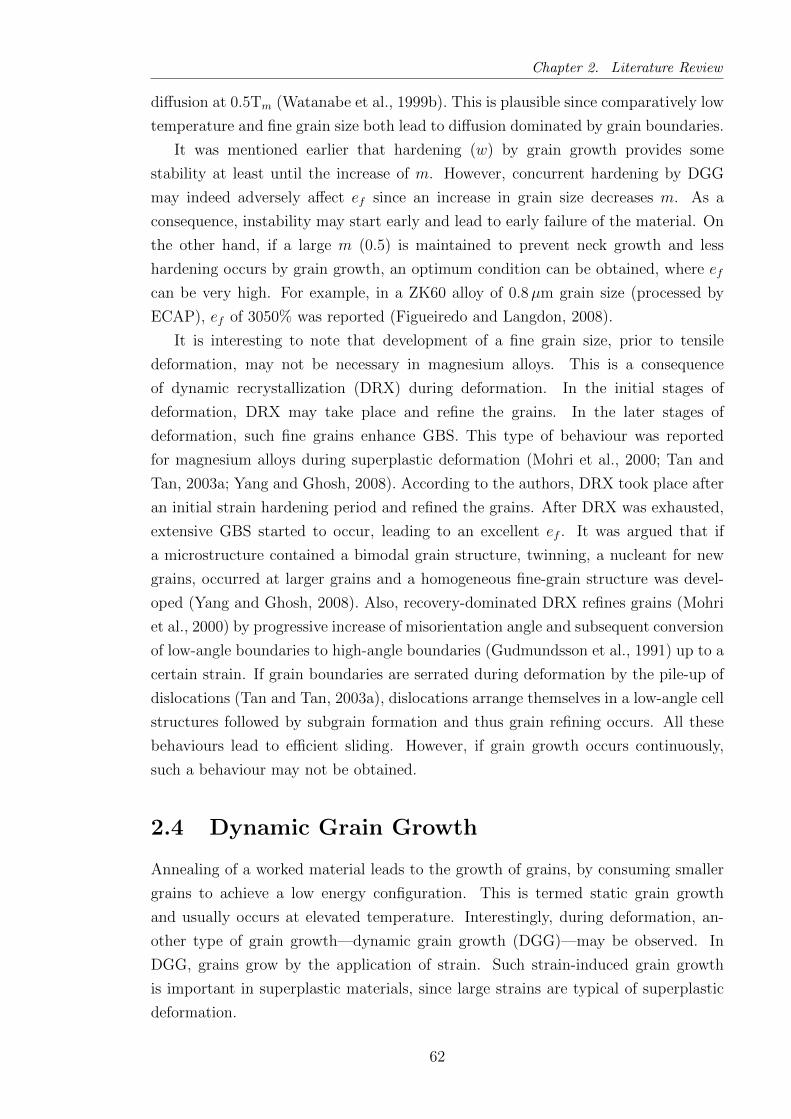
Chapter 2. Literature Review
diffusion at 0.5Tm (Watanabe et al., 1999b). This is plausible since comparatively low
temperature and fine grain size both lead to diffusion dominated by grain boundaries.
It was mentioned earlier that hardening (w) by grain growth provides some
stability at least until the increase of m. However, concurrent hardening by DGG
may indeed adversely affect ef since an increase in grain size decreases m. As a
consequence, instability may start early and lead to early failure of the material. On
the other hand, if a large m (0.5) is maintained to prevent neck growth and less
hardening occurs by grain growth, an optimum condition can be obtained, where ef
can be very high. For example, in a ZK60 alloy of 0.8µm grain size (processed by
ECAP), ef of 3050% was reported (Figueiredo and Langdon, 2008).
It is interesting to note that development of a fine grain size, prior to tensile
deformation, may not be necessary in magnesium alloys. This is a consequence
of dynamic recrystallization (DRX) during deformation. In the initial stages of
deformation, DRX may take place and refine the grains. In the later stages of
deformation, such fine grains enhance GBS. This type of behaviour was reported
for magnesium alloys during superplastic deformation (Mohri et al., 2000; Tan and
Tan, 2003a; Yang and Ghosh, 2008). According to the authors, DRX took place after
an initial strain hardening period and refined the grains. After DRX was exhausted,
extensive GBS started to occur, leading to an excellent ef . It was argued that if
a microstructure contained a bimodal grain structure, twinning, a nucleant for new
grains, occurred at larger grains and a homogeneous fine-grain structure was devel-
oped (Yang and Ghosh, 2008). Also, recovery-dominated DRX refines grains (Mohri
et al., 2000) by progressive increase of misorientation angle and subsequent conversion
of low-angle boundaries to high-angle boundaries (Gudmundsson et al., 1991) up to a
certain strain. If grain boundaries are serrated during deformation by the pile-up of
dislocations (Tan and Tan, 2003a), dislocations arrange themselves in a low-angle cell
structures followed by subgrain formation and thus grain refining occurs. All these
behaviours lead to efficient sliding. However, if grain growth occurs continuously,
such a behaviour may not be obtained.
2.4 Dynamic Grain Growth
Annealing of a worked material leads to the growth of grains, by consuming smaller
grains to achieve a low energy configuration. This is termed static grain growth
and usually occurs at elevated temperature. Interestingly, during deformation, an-
other type of grain growth—dynamic grain growth (DGG)—may be observed. In
DGG, grains grow by the application of strain. Such strain-induced grain growth
is important in superplastic materials, since large strains are typical of superplastic
deformation.
62

Chapter 2. Literature Review
DGG can lead to hardening of the flow curve (Ridley et al., 2005). Watts and
Stowell (1971) argued that hardening during superplastic deformation is different
from typical strain hardening observed in other types of materials. The authors
observed that DGG induced hardening was strain rate sensitive, which is not very
typical in hardening by dislocation interactions. Also, they ruled out hardening by
the local increase of strain rate at the diffuse neck, since this type of hardening is
not important in the early stage of deformation. Therefore, they concluded that
grain coarsening was the reason for hardening of the flow curves. Such a hardening
is important in terms of flow localisation. Since the stress is higher at a diffuse neck
than in other areas of the gauge, the local strain rate is higher at the neck, if grain
size remains the same (Senkov and Likhachev, 1986). As a consequence, growth of
the neck increases (i.e., decrease of cross-sectional area at the neck region) compared
to other areas. Now, if strain-induced grain growth occurs at a different rate in the
higher strain rate region, such as the neck, neck propagation is retarded by flow
strengthening.
Clark and Alden (1973) emphasised the importance of DGG in superplastic de-
formation during a study of Sn-1Bi alloy. According to the authors, grain rotation
during GBS can lead to a configuration where the misorientation between neigh-
bouring boundaries of two grains is eliminated and a single large grain is formed by
coalescence. To maintain local equilibrium, some boundary migration of the coalesced
grain may occur. Mobility of the boundaries is enhanced by the grain boundary
diffusion. Wilkinson and Caceres (1984) considered DGG as the accommodation
process of GBS. According to them, migration of boundaries is required to recover the
damage caused by GBS at the triple points and thus DGG occurs during deformation.
However, recently Bate (2001) suggested that DGG was a special case of Zener pinned
systems, where perturbation of grain structure during straining destroyed the local
equilibrium. As a consequence, DGG occurs, given that boundary migration is rapid
at the temperature and strain rate of concern.
Equation 2.18 includes the term w, which is a DGG induced hardening coefficient.
The contribution of w to stabilise the onset of plastic instability was also discussed
earlier. The effect of hardening, at least at the initial stages of deformation, is
important. The effect of w and m counter each other (Ash and Hamilton, 1988).
Hardening gives the plastic stability to retard growth of neck in the initial stage and
m tends to contribute more in the later stages of deformation. However, since super-
plasticity is largely dependent on GBS, growth of grains will eventually retard sliding
of grains (Li et al., 1997) and result in loss of superplastic properties. Therefore, a
balance is required, at a particular test condition, between grain growth and GBS.
The simplified grain growth equation is (Wilkinson and Caceres, 1984)
63
Chapter 2. Literature Review
Figure 2.23: Increase of grain size during deformation of an Al-4.7Mg-0.7Mn-0.4Cu alloyat 550 C (Kashyap and Tangri, 1987).
d = do exp (αgε) (2.21)
where αg is the grain growth coefficient and depends on the sliding distance and do
is the initial grain size.
At a given strain and in the absence of DRX, grain size increases with a decrease
in strain rate and an increase of strain (Senkov and Myshlyaev, 1986). Fig. 2.23
shows an example of typical grain growth observed during superplastic deformation.
Decreasing strain rate influences the growth of grains. It is interesting to note that
though DGG occurs throughout the deformation, in the later stages it does not
have any effective contribution to stability and a rapid flow softening may occur by
cavitation (Kashyap and Tangri, 1987).
2.5 Cavitation in Magnesium Alloys
A superplastic material fails by two mechanisms: unstable plastic flow followed by
necking to a sharp point or nucleation, growth and coalescence of cavities (Pilling
and Ridley, 1989). If failure occurs by unstable plastic flow, a fine neck is developed,
leading to failure. On the other hand, if cavitation is the failure mode, a rough
fracture surface is obtained. Strain rate sensitivity (m) values are typically very
high (>0.4) in superplastic materials, which provides an excellent resistance towards
necking and ensures large elongation to failure of the material. Another resistance
may come from grain growth which gives some local strain hardening, enhancing
tensile stability of the gauge. However, the development of cavities suppresses the
resistance to failure.
The study of cavity nucleation in magnesium alloys is extremely limited, and the
64
Chapter 2. Literature Review
theories discussed below were developed for creep. These theories were successfully
applied to aluminium-, copper- and iron-based alloys. Since the dislocation glide
in hcp magnesium is very different to these cubic metals, and this is a key part of
some of the theories discussed, it is not yet clear how applicable these equations will
be to magnesium. One aim of this study was to assess the validity in using these
current theories to understand cavitation in magnesium alloys. In this section, at
first, theories related to nucleation and growth of cavities are discussed followed by
a discussion of cavitation investigation in aluminium and magnesium alloys. The
effects of strain rate, temperature, grain size and deformation mechanisms are also
highlighted.
2.5.1 Nucleation of Cavities
Nucleation of a cavity may occur homogeneously or heterogeneously. Homogeneous
cavitation may occur within a grain as a direct consequence of the underlying defor-
mation mechanism. In contrast, heterogeneous cavitation takes place preferentially
at grain boundaries when deformation is perturbed by the offsets produced at grain
boundaries or by obstacles present in the microstructure.
Seitz (1953) showed that a cavity might form by a cluster of vacancies having a
very high concentration. Therefore, it is possible that cavities may form at the interior
of grains during plastic flow, since dislocations can supply vacancies (Bauer and
Wilsdorf, 1973). This leads to a homogeneous distribution of cavities. Vacancies can
be accumulated in a grain interior from the dislocation loops surrounding a stacking
fault or prismatic loops of dislocations surrounding un-faulted material (Sigler and
Kuhlmann-Wilsdorf, 1967).
On the contrary, Balluffi and Seigle (1957) argued that the efficiency of vacancy
accumulation in a grain interior depends on climbing of dislocations and if grain
boundary sliding (GBS) takes place, grain boundaries become potent sites for nucle-
ation of cavities. The chance of cavity formation at boundaries is high, since vacancy
flow between grain boundaries may exist, not in dislocation arrays. In this regard,
a strong support comes from the study of Brinkman (1955). He proposed that a
very high concentration of stress, instead of concentration of excess vacancies in an
order of 100 times greater than the equilibrium values, would cause condensation of
vacancies. Such a high local stress is created by a pile-up of dislocations.
The heterogeneous nucleation of cavities at microstructural irregularities may
occur by particles, triple points, ledges or jogs. Investigation of copper (99.98%
pure), α-brass (70.1% Cu and 29.8% Zn) and magnesium (containing 0.20% Pd
and 0.02% Fe) led Greenwood and co-authors (1954) to suggest that, cavities might
appear at grain boundaries by diffusion of vacancies. Due to dislocation movement
65
Chapter 2. Literature Review
and thermal vibration, the position of vacancies usually does not remain at a certain
location. Condensation of vacancies thus becomes difficult to occur. However, if grain
boundaries act as sink for these vacancies, they may accumulate there and form a
stable cavity. During deformation, more vacancies are clustered at the newly formed
cavity and the cavity grows. Balluffi and Seigle (1957) suggested that vacancies could
migrate between the interface of the nucleated cavity and grain boundary rapidly,
resulting in stable cavities at boundaries transverse to the applied stress.
However, the work of Greenwood, Miller and Suiter was criticised since an ag-
glomeration of vacancies was not kinetically favourable. Instead, cavity formation
at the grain boundary by the impingement of slip is an alternative explanation for
cavity formation (Fisher, 1955). Impingement of slip by the screw dislocations leads
to local high stresses which may become larger than the applied stress, forming a
cavity at the grain boundary.
GBS is a dominating deformation mechanism during superplastic deformation.
Sliding is hindered at obstacles, such as particles, ledges and jogs, resulting in a rise
of local stress. This stress concentration is developed by the pile-up of dislocations
ahead of the obstacle. Such a stress concentration can lead to the formation of a
cavity. This is discussed below for grain boundary ledges and jogs followed by the
effects of particles.
The assumptions of Fisher were modified by Gifkins (1956) and applied to GBS.
Consider sliding occurring between grain 1 and 2 (Fig. 2.24a). Now, a grain boundary
jog may be formed by slip occurring in the grains. The size of the jog depends on
the number of accommodating dislocations passing to grain 1, resulting in a pile-up
of dislocations at grain 2 (Fig. 2.24b). However, boundary migration may annihilate
the jog developed in this way. Before this happens, the local stress concentration
may cause a de-cohesion of the jogged boundary, followed by an open up of the jog
(3) prior to forming a cavity (Fig. 2.24c). If this process is repeated at the adjacent
areas simultaneously, a cavity of stable size may appear.
According to Davies and Dennison (1958), the Gifkins model of cavitation at
offsets produced by dislocations has some serous limitations. One such limitation
is the migration of boundaries, which certainly eliminates the newly formed jog.
The authors proposed a slightly different mechanism of ledge formation. In brief,
a dislocation containing a screw component transverse to the grain boundary forms
a step at the interacting boundary which cannot be removed by grain boundary
migration and this step blocks sliding of grains, leading to the formation of a cavity.
However, these steps are annihilated if cross slip occurs during deformation. Another
modification of Gifkin’s model was made by Chen and Machlin (1956) on the basis
that any irregularity at the boundaries would be able to produce an excessive stress
concentration required to form a cavity.
66
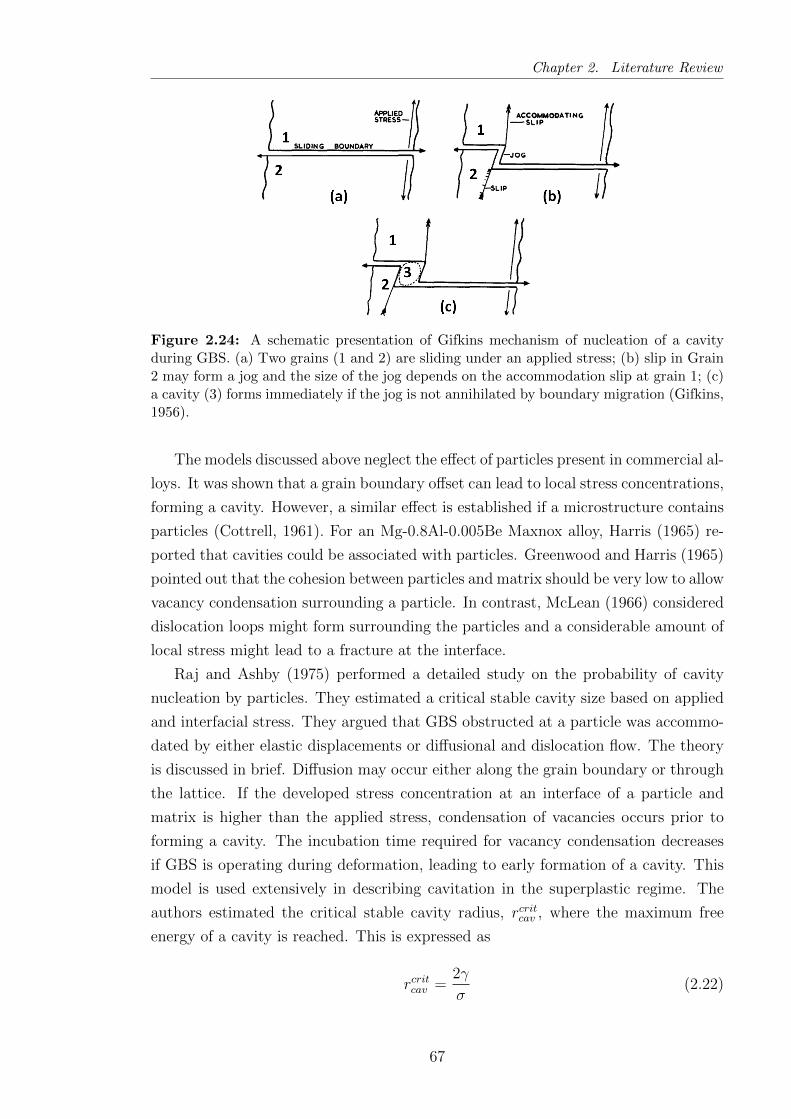
Chapter 2. Literature Review
Figure 2.24: A schematic presentation of Gifkins mechanism of nucleation of a cavityduring GBS. (a) Two grains (1 and 2) are sliding under an applied stress; (b) slip in Grain2 may form a jog and the size of the jog depends on the accommodation slip at grain 1; (c)a cavity (3) forms immediately if the jog is not annihilated by boundary migration (Gifkins,1956).
The models discussed above neglect the effect of particles present in commercial al-
loys. It was shown that a grain boundary offset can lead to local stress concentrations,
forming a cavity. However, a similar effect is established if a microstructure contains
particles (Cottrell, 1961). For an Mg-0.8Al-0.005Be Maxnox alloy, Harris (1965) re-
ported that cavities could be associated with particles. Greenwood and Harris (1965)
pointed out that the cohesion between particles and matrix should be very low to allow
vacancy condensation surrounding a particle. In contrast, McLean (1966) considered
dislocation loops might form surrounding the particles and a considerable amount of
local stress might lead to a fracture at the interface.
Raj and Ashby (1975) performed a detailed study on the probability of cavity
nucleation by particles. They estimated a critical stable cavity size based on applied
and interfacial stress. They argued that GBS obstructed at a particle was accommo-
dated by either elastic displacements or diffusional and dislocation flow. The theory
is discussed in brief. Diffusion may occur either along the grain boundary or through
the lattice. If the developed stress concentration at an interface of a particle and
matrix is higher than the applied stress, condensation of vacancies occurs prior to
forming a cavity. The incubation time required for vacancy condensation decreases
if GBS is operating during deformation, leading to early formation of a cavity. This
model is used extensively in describing cavitation in the superplastic regime. The
authors estimated the critical stable cavity radius, rcritcav , where the maximum free
energy of a cavity is reached. This is expressed as
rcritcav =2γ
σ(2.22)
67
Chapter 2. Literature Review
where γ is the surface energy. According to this equation, if the applied stress is
increased, the stable critical size of a cavity decreases. Cavities having size less than
rcritcav are unstable and sinter out by surface tension (Miller et al., 1979).
It is obvious from the discussion above that grain boundary offsets or obstacles
develop local high stress concentrations and if this stress cannot be accommodated
rapidly by diffusion or dislocation glide into the surrounding grains, a cavity is
developed.
Needleman and Rice (1980) considered the combined effect of diffusion and dislo-
cation glide, based on an early work by Hull and Rimmer (1959) and defined a critical
diffusion length, ΛGB, representing the maximum length over which concentrated
stress can be relaxed quickly along the grain boundary. This length is considered
as the minimum radius of a grain boundary particle in obstructing the relaxation of
stress. Now, for an atomic volume of Ω with energy of kT , diffusivity is δDGB/kT
and the grain size exponent (p) is 3 for grain boundary diffusion. Combining these,
the expression becomes
ΛGB =
(ΩδDGB
kT
σ
ε
)1/3
(2.23)
where the terms are defined earlier.
However, Chokshi and Mukherjee (1989a) argued for the use of an effective
diffusion coefficient, instead of grain boundary diffusion coefficient, and they proposed
a slightly modified version of ΛGB, which involved lattice diffusion (p = 2). The
expression is
ΛL =
(ΩDL
πkT
σ
ε
)1/2
(2.24)
where ΛL is the critical diffusion length.
Stowell (1983) proposed another expression for the critical diffusion length (λS)
including a parameter to incorporate the effect of GBS as
ΛS =
(2.9ΩδDgb
αdkT
σ
ε
)1/2
(2.25)
where α is the fraction of tensile strain accommodated by GBS. Usually, GBS is
considered to contribute 50% of the total strain; hence, α is equal to 0.50. But, this
model was criticised for higher dependency on GBS (Ridley et al., 2007).
Riedel (1987) summarised the reasons that particles can act as preferential cav-
ity nucleation sites: (a) particles resist GBS followed by stress concentration; (b)
they may not be perfectly bonded with the matrix and (c) vacancy condensation is
facilitated at the particle/matrix interfaces.
In summary, formation of a cavity may occur by vacancy accumulation, GBS
68
Chapter 2. Literature Review
or dislocation pile-up. Vacancy condensation requires a high local stress. Stress
concentration can occur by GBS at heterogeneities such as particles and triple points.
Stress concentration can be relieved by diffusion, and so a critical condition is required
to form a growing cavity, such that the accumulation of stress concentration exceeds
the relief by diffusion.
2.5.2 Growth of Cavities
The growth of an individual cavity may be driven by stress induced diffusion or by
dislocation activity during plastic flow. Several mechanisms were proposed in the past
to explain the growth of individual cavities. The growth theories are discussed below
in separate sections focused on stress driven diffusion growth and plasticity controlled
growth. The shape of a cavity is an important factor to identify the operating growth
mechanism, which is also discussed in a separate section.
Stress Induced Cavity Growth Mechanisms
A cavity may grow by diffusional flux of atoms from the edge of the cavity along the
grain boundary. The driving force for the diffusion flux is the gradient of the chemical
potential. Under an applied stress, diffusion flux in the grain boundary is equal to
the gradient of the chemical potential times the atomic mobility (Riedel, 1987):
Jgb =δDGB
kT∇µ (2.26)
where ∇µ is the gradient of chemical potential at the grain boundary. ∇µ along
a grain boundary is formulated as ∇µ = −σnΩ, where σn is the stress acting on
transverse to the boundary. σnΩ is the contribution of σn to the chemical potential
and is the work done by σn to add an atom to the boundary.
A cavity will grow by diffusion only when the applied stress is larger than the
potential of the cavity for losing vacancies (Balluffi and Seigle, 1957). This occurs
when the stress term in Equation 2.22 is greater than 2γ/rcav. Hull and Reamer (1959)
explained this as the critical cavity size for an applied stress below which cavities
would not able to overcome the surface tension. The authors argued that the growth
of a cavity occurs by the accumulation of vacancies, obtained from grain boundaries.
Major assumptions made in the Hull and Reamer model are: (a) grains are assumed
elastic in nature, (b) vacancies are condensed uniformly at boundaries and (c) cavities
are formed at the onset of deformation. In reality, grains do not remain elastic during
deformation involving dislocation movements. Also, since dislocation glide perturbs
the grain structure, a uniform vacancy flux is unlikely to occur along boundaries.
To overcome the limitations of Hull and Rimmer model, Beere and Speight (1978)
69

Chapter 2. Literature Review
Figure 2.25: (a) An illustration of Beere and Speight (1978) mechanism of cavity growthby stress induced diffusion. (b) Stress gradient across different regions near a growingcavity.
proposed a modified model considering grains do not remain elastic during deforma-
tion and the source of vacancies should be close to a growing cavity, unlike the Hull
and Rimmer mechanism. This mechanism is widely used to explain growth of cavities
in superplastic materials.
This mechanism considers that vacancies are not generated uniformly at the
boundary, but more vacancies are created at a close distance to a cavity nucleus.
Beyond this distance, locally no vacancies are created and the surrounding area is
controlled by plastic flow. However, very close to a cavity, a gradient of stress is
developed which accelerates vacancy diffusion between cavity and grain boundary.
The mechanism is illustrated in Fig. 2.25. The whole region is a part of a grain
boundary where the cavity is formed. Region I is the diffusion zone surrounding a
cavity of radius rcav (Fig. 2.25a). In this region, vacancies are uniformly generated
and are diffused to the cavity. Plating of atoms at the boundary moves the boundary
apart from the cavity. In region II, no vacancies are created and displacement from
region I is countered by dislocation movements. In Fig. 2.25b, the gradient of stress
in region I is shown. It is assumed in this model that no gradient exists in region
II and therefore no vacancies are generated in this region of grain boundary. The
low stress gradient in region I is due to the fact that region I is a low stress elastic
volume contained in a plastically deforming region II. In region I, the stress is equal
to 2γ/rcav (see Equation 2.22). A cavity having a radius smaller than rcav will sinter
out (Balluffi and Seigle, 1957). The increase of stress away from the cavity allows
vacancy diffusion until the stress becomes independent of distance.
The simplified equation for cavity growth by stress induced diffusion is
70
Chapter 2. Literature Review
drcavdε
=ΩδDgb
5kTr2cav
σ
ε(2.27)
where the terms are defined earlier. This expression demonstrates that drcav/dε ∝1/r2
cav. Integration of this expression shows the volume fraction of cavities is linearly
related to the strain. As the cavity gets larger, the growth rate decreases parabol-
lically, and this is due to a decrease in vacancy flux. Edward and Ashby (1979)
developed a similar expression, adopting the methodology of Beere and Speight. The
only difference between both models is in size of the diffusion zone and former authors
agreed that the growth rate predicted by both models were similar.
It is very possible that if a growing cavity intersects several grain boundaries, the
growth rate would be different than that of Equation 2.27. This was first observed
by Pilling and co-authors (1984) during a study of cavity sintering in a Ti-6Al-4V
alloy. They noted that if mass transportation occurred by several boundaries due to
the typical fine grain size in superplastic alloys, sintering rate would be increased.
Based on this supposition, Chokshi and Langdon (1987) proposed a cavity growth
mechanism. This is termed superplastic diffusion growth. This is, in fact, very similar
to the early developed expressions for diffusional growth, the only difference is the
incorporation of grain size (d) effect. However, the fundamental requirement of a
very small grain size (<5µm) for this model limits its applicability. The average
grain size investigated in the current study is one and half times greater than the
limiting requirement; hence, this mechanism may not be important for the current
study. However, this does not rule out the idea that intersection of a cavity by several
boundaries influences the growth of cavities by diffusion.
Hull and Rimmer did not consider lattice diffusion in their work, since they showed
that for silver, at 500 C, the contribution of lattice diffusion to the total number of
atoms transferred by diffusion was only 6% to that of grain boundary diffusion. Hence,
they ignored lattice diffusion effect in their mechanism. However, if transfer of atoms
is controlled by lattice diffusion, the expression for cavity growth (Equation 2.27)
needs to be modified. The potential gradient for this type of atom flux (from cavity
surface to the longitudinal grain boundary of a grain of size d) is 2γΩ/rcavd (Burton,
1974). Based on the suggestion by Burton, Chokshi (1986) proposed an expression
for diffusion growth controlled by lattice diffusion. The modified diffusion growth
equation is
dr
dε=
ΩλδDL
5πkT
1
r2
σ
ε(2.28)
where λ is the cavity spacing. The domination of a particular diffusion path depends
on the ratio of Dgbδ/DLλ. It was claimed that if this ratio is greater than one, growth
is controlled by grain boundary diffusion (Shibutani et al., 1998).
71

Chapter 2. Literature Review
Plasticity Induced Cavity Growth Mechanisms
Sagat and Taplin (1976) investigated a 60/40 brass deformed in the superplastic
regime and reported for the first time that a cavity can grow solely by plasticity, not
by vacancy condensation. Hancock (1976) also investigated growth of cavities and
pointed out that plastic flow, not vacancy concentration, was responsible for growth
of a cavity. The deformation of the matrix in close proximity to a cavity in this case
drives the growth of a cavity. It is very possible that plastic flow tends to elongate
a cavity in the applied stress direction, developing an elliptical cavity shape. For a
micron size cavity, Hancock showed that diffusion growth did not remain important
and very large cavities were usually elongated along the tensile stress direction. This
directionality of cavity axis cannot be produced by the vacancy flux and hence it is
attributed to the plasticity controlled growth. The model for the plasticity controlled
growth can be expressed as
drcavdε
= rcav −3γ
2σ(2.29)
where the terms are defined earlier. Simplifying this gives drcav/dε ∝ rcav, i.e.,
growth rate is proportional to the cavity size and volume fraction of cavities increases
exponentially with strain.
Hancock emphasised that for small cavities diffusion growth might remain im-
portant, but for large cavities, growth should be governed by plastic flow. He also
suggested that small cavities lying perpendicular to the applied stress were developed
by joining of small cavities. Apart from the consideration of size of a cavity, the
plasticity controlled mechanism becomes important when local stress concentration
occurs. Hancock identified the importance of the ratio of σ/ε. If this is low, then the
plasticity controlled mechanism is expected to occur in small sized cavities.
Stowell (1980) investigated the cavity growth phenomenon specifically for super-
plastic alloys. He argued that sub-micron size cavities would grow by diffusion and
when the size approaches to one micron (for the iron based alloys), the growth would
be controlled by plasticity. According to him, plasticity controlled growth is faster
for larger cavities and is expressed as
ln
(VcVo
)= ηε (2.30)
where Vo is the pre-existing cavity fraction, i.e., volume fraction of cavities at zero
strain, Vc is the cavity volume fraction at the strain ε. η is cavity growth rate pa-
rameter and is dependent on the applied stress and geometry of deformation (Pilling
and Ridley, 1988b). η can be determined from the following expression
η =3
2
(m+ 1
m
)sinh
(2
(2−m2 +m
))αs3
(2.31)
72
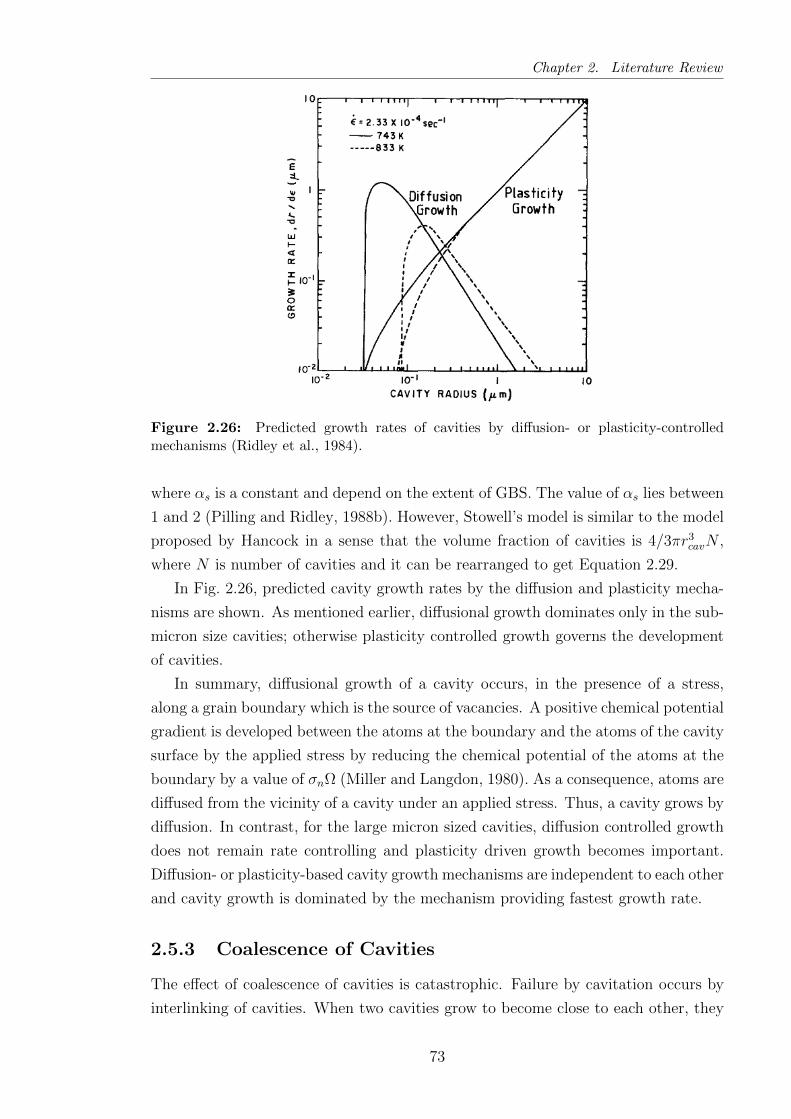
Chapter 2. Literature Review
Figure 2.26: Predicted growth rates of cavities by diffusion- or plasticity-controlledmechanisms (Ridley et al., 1984).
where αs is a constant and depend on the extent of GBS. The value of αs lies between
1 and 2 (Pilling and Ridley, 1988b). However, Stowell’s model is similar to the model
proposed by Hancock in a sense that the volume fraction of cavities is 4/3πr3cavN ,
where N is number of cavities and it can be rearranged to get Equation 2.29.
In Fig. 2.26, predicted cavity growth rates by the diffusion and plasticity mecha-
nisms are shown. As mentioned earlier, diffusional growth dominates only in the sub-
micron size cavities; otherwise plasticity controlled growth governs the development
of cavities.
In summary, diffusional growth of a cavity occurs, in the presence of a stress,
along a grain boundary which is the source of vacancies. A positive chemical potential
gradient is developed between the atoms at the boundary and the atoms of the cavity
surface by the applied stress by reducing the chemical potential of the atoms at the
boundary by a value of σnΩ (Miller and Langdon, 1980). As a consequence, atoms are
diffused from the vicinity of a cavity under an applied stress. Thus, a cavity grows by
diffusion. In contrast, for the large micron sized cavities, diffusion controlled growth
does not remain rate controlling and plasticity driven growth becomes important.
Diffusion- or plasticity-based cavity growth mechanisms are independent to each other
and cavity growth is dominated by the mechanism providing fastest growth rate.
2.5.3 Coalescence of Cavities
The effect of coalescence of cavities is catastrophic. Failure by cavitation occurs by
interlinking of cavities. When two cavities grow to become close to each other, they
73

Chapter 2. Literature Review
may join to form a large cavity, given spheroidisation by surface diffusion is rapid.
Moreover, joining of cavities results in a deficiency of load bearing capacity in the
surrounding area, leading to a higher local cavity growth rate (Caceres and Wilkinson,
1984b). The mechanisms of growth of a cavity discussed in the preceding section do
not incorporate coalescence effect and thus may misinterpret the actual growth rate.
Goods and Nix (1978) artificially implanted bubbles in silver to understand cavi-
tation and confirmed the failure of the material occurred by coalescences of cavities
(bubbles). In superplastic materials, coalescence is an important feature, since large
strains, characteristic of these materials, may allow extensive plasticity controlled
growth of cavities. Therefore, initially widely spaced cavities may become close to
each other and interlink.
Stowell (1984) analysed the coalescence feature of cavities based on his earlier
work (Stowell, 1980) on estimation of the plasticity driven cavity growth rate param-
eter, η. According to him, surface diffusion has to be rapid to allow the coalesced
cavity to become spherical and the growth rate increases significantly if the growth
is governed by plasticity. Moreover, Pilling (1985) argued that coalescence of cavities
depends on strain level and the volume fraction of cavities. If the volume fraction
of cavities is large, then the total number of cavities and their average size should
be high. This, in turn, decreases the inter-cavity spacing and the probability of
coalescence increases. Coalescences thus become important in the later stages of
deformation, where the volume fraction of cavities is, obviously, higher for a material
in which cavitation is occurring.
Pilling also performed numerical analysis to develop an expression for coalescence
but it was limited by the cavity spacing and size. Based on the investigations by
Stowell and Pilling, Nicolaou and Semiatin (1999) proposed a model and considered
that cavity coalescence was possible only at a very high cavity growth rate. In a
following work (Nicolaou and Semiatin, 2000), they concluded that there existed
a critical true strain at which cavity coalescence would commence and coalescence
should occur if the cavity volume fraction approached 1%. However, the presence of
a critical strain for cavitation cannot be justified, since nucleation of cavities is not
uniform throughout the microstructure. Therefore, coalescence cannot depend on a
single critical strain.
2.5.4 Shapes of Cavities
In the preceding sections, the growth of cavities under different mechanisms are
discussed. It may be interesting to identify the shapes of cavities developed by
different mechanisms. It is generally accepted that cavity shape becomes spherical
when diffusion controlled growth dominates and the cavities tend to elongate along
74

Chapter 2. Literature Review
Figure 2.27: (a) An example of cavity shape if deformation occurs by GBS in ironat 650 C (Davies and Williams, 1969). (b) Stringer-like cavity formation in an Al5083aluminium alloy at 450 C (Kulas et al., 2006).
the tensile axis when plasticity driven growth mechanism operates. However, this
simple justification is altered depending on several factors, such as deformation
mechanism, strain level, presence of particles, etc.
If cavities are formed at jogs, they may further grow by repeated action of
plasticity and GBS (Gifkins, 1956). In such a case, long finger shape cavities are
developed (Fig. 2.27a). On the other hand, if the solute drag mechanism is domi-
nating, cavities are coalesced along the tensile axis and a stringer-like distribution
of the cavities (Fig. 2.27b) is formed (Kulas et al., 2006). Stringers are formed when
cavities are aligned in a particular direction in the microstructure.
Stringer-like cavity distribution may develop during deformation of particle con-
taining alloys depending on strain rate and particle position. Stringers of particles
may form during thermo-mechanical treatment which may distribute particles along
the rolling direction. Caceres and Wilkinson (1984b) studied a hot rolled copper-
based alloy containing particles at 550 C. The particles were aligned along the rolling
direction. Under a high strain rate test condition, cavities were formed at the vicinity
of these particles and were elongated along the tensile axis. They were coalesced at
higher strain but remained elongated, probably constrained by particles. When the
strain rate was reduced, the cavities formed at particles were large, having a shape
that was close to spherical. The spherical shape might be misinterpreted as evidence
that diffusion controlled growth dominated at the low strain rate condition. However,
the authors suggested that the spherical shape of the cavities was instead developed
by coalescence.
Similar behaviour was observed in a 5083 aluminium alloy (Kulas et al., 2006),
where large coalesced cavities (slightly oriented normal to tensile stress) were observed
after GBS controlled deformation. Moreover, the cavities did not elongate in the
75
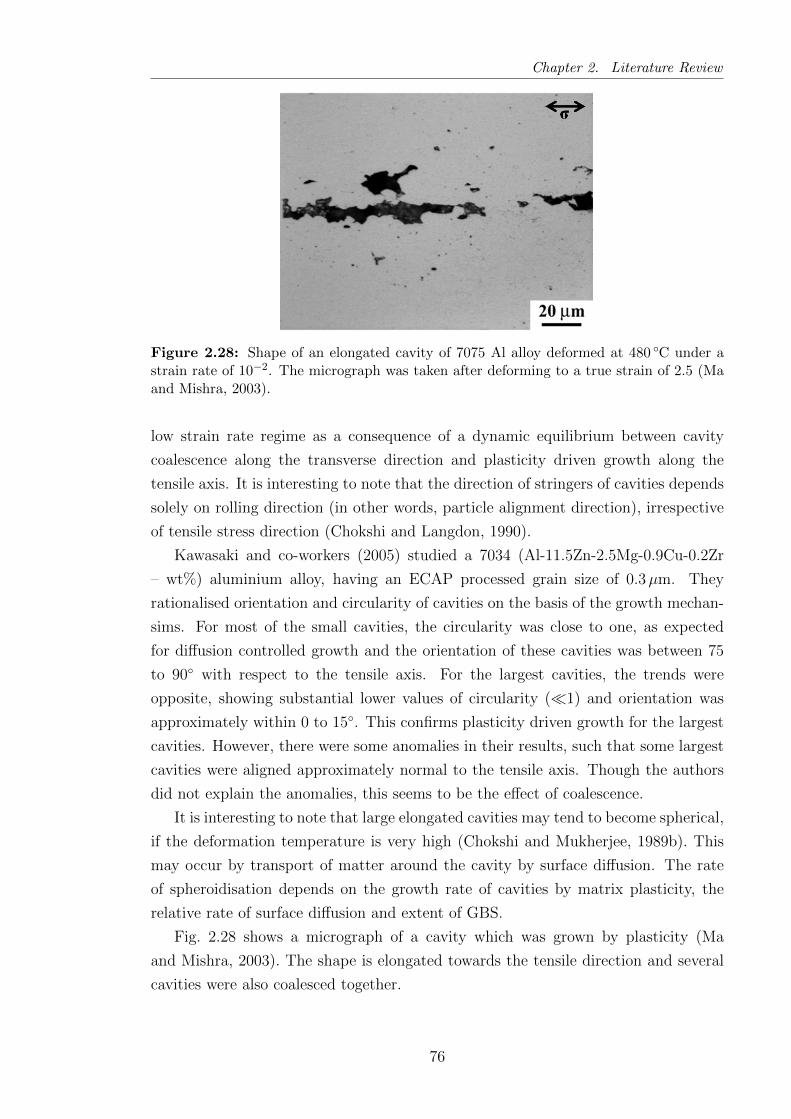
Chapter 2. Literature Review
Figure 2.28: Shape of an elongated cavity of 7075 Al alloy deformed at 480 C under astrain rate of 10−2. The micrograph was taken after deforming to a true strain of 2.5 (Maand Mishra, 2003).
low strain rate regime as a consequence of a dynamic equilibrium between cavity
coalescence along the transverse direction and plasticity driven growth along the
tensile axis. It is interesting to note that the direction of stringers of cavities depends
solely on rolling direction (in other words, particle alignment direction), irrespective
of tensile stress direction (Chokshi and Langdon, 1990).
Kawasaki and co-workers (2005) studied a 7034 (Al-11.5Zn-2.5Mg-0.9Cu-0.2Zr
– wt%) aluminium alloy, having an ECAP processed grain size of 0.3µm. They
rationalised orientation and circularity of cavities on the basis of the growth mechan-
sims. For most of the small cavities, the circularity was close to one, as expected
for diffusion controlled growth and the orientation of these cavities was between 75
to 90 with respect to the tensile axis. For the largest cavities, the trends were
opposite, showing substantial lower values of circularity (1) and orientation was
approximately within 0 to 15. This confirms plasticity driven growth for the largest
cavities. However, there were some anomalies in their results, such that some largest
cavities were aligned approximately normal to the tensile axis. Though the authors
did not explain the anomalies, this seems to be the effect of coalescence.
It is interesting to note that large elongated cavities may tend to become spherical,
if the deformation temperature is very high (Chokshi and Mukherjee, 1989b). This
may occur by transport of matter around the cavity by surface diffusion. The rate
of spheroidisation depends on the growth rate of cavities by matrix plasticity, the
relative rate of surface diffusion and extent of GBS.
Fig. 2.28 shows a micrograph of a cavity which was grown by plasticity (Ma
and Mishra, 2003). The shape is elongated towards the tensile direction and several
cavities were also coalesced together.
76
Chapter 2. Literature Review
2.5.5 Cavitation in Aluminium and Magnesium Alloys
Compared to magnesium alloys, cavitation in aluminium alloys has been investigated
extensively to understand formation and growth kinetics of cavities. In the following
section, cavitation in several aluminium alloys is discussed. Insights into cavitation
behaviour fundamentally obtained from aluminium alloys helps to explain cavitation
behaviour in magnesium, which to date has only received limited attention.
In aluminium alloys, particles are essentially responsible for nucleation of cavi-
ties (Bae and Ghosh, 2002a; Bae and Ghosh, 2002b; Chokshi and Mukherjee, 1989b;
Dupuy and Blandin, 2002; Ma and Mishra, 2003; Ridley et al., 2007). If particles are
fragmented after thermo-mechanical treatments, there is a possibility that cavities
are constrained in the fragmented particles. In such a case, stringer-like cavitation
may occur (Dupuy and Blandin, 2002). Such constrained cavities tend to coalesce
early and may affect the failure behaviour of an alloy. Nucleation of cavities is found
to be continuous, i.e., cavitation occurs throughout the deformation. To nucleate a
cavity, a particle must be located at a grain boundary.
If a microstructure contains both grain boundary particles and intragrannular
particles, then cavities are observed only at the grain boundary particles, even if the
particle size is smaller than the grain interior particles (Jiang et al., 1993).
A major criterion for nucleation of cavities is the size of a particle. Therefore,
if a microstructure contains different types of particles, all of them are expected to
be equally efficient in forming a cavity if they are larger than the critical particle
size. However, for a 5083 aluminium alloy, containing Al6MnFe and Mg2Si particles,
Mg2Si particles were claimed to be more efficient in nucleating cavities (Chang et al.,
2009). The reason for this behaviour is not clear but may be a consequence of the
preferential location of different particle types at grain interiors and boundaries.
The effect of grain size on cavitation has also been established for aluminium
alloys. A fine grain size leads to a lower number of nucleated cavities (Humphries and
Ridley, 1978) as a direct consequence of the decrease of flow stress in the superplastic
regime. For a 7075 (Al-5.6Zn-2.5Mg-1.6Cu-0.23Cr – wt%) aluminium alloy, Ma and
Mishra (2003) confirmed this trend for two alloys having grain sizes of 4 and 8µm.
DGG leads to an increase in cavity formation as a consequence of the lower
accommodation rate by grain boundary diffusion, or grain boundary migration, when
DGG occurs (Livesey and Ridley, 1982). Moreover, an increase in grain size increases
local stress which eventually decreases the critical cavity nucleus size (Equation 2.22).
Therefore, DGG assists in formation of more cavities (Pilling and Ridley, 1988a).
The pile-up of dislocations ahead of a particle may lead to stress concentration,
ultimately forming a cavity. Cavities formed by direct interaction of dislocations at
particles have been observed by several authors in different aluminium alloys (Galano
77

Chapter 2. Literature Review
et al., 2009; Hosokawa et al., 1999; Kawasaki et al., 2005). They estimated critical
particle sizes (see Section 2.5.1) required for the formation of cavities and results were
in a close agreement with the theories discussed earlier.
When a material is deformed under solute drag creep, cavitation may occur.
However, in these materials, usually stringer-like cavities were reported (Chang et
al., 2009; Kulas et al., 2006; Taleff et al., 2001). Typically, those materials failed
by neck formation. Therefore, the extent of cavitation is less severe than the GBS
controlled deformation condition.
It has been shown above that particles play a major role in nucleating cavities in
certain test conditions. In magnesium alloys, the efficiency of particles in nucleating
cavities has not been investigated in detail, although cavitation in magnesium alloys
was reported in 1960s (Harris et al., 1962).
In magnesium alloys, triple points were also reported to nucleate cavities (Aigeltinger
and Gifkins, 1977). The shape of the observed cavities was nearly spherical, suggesting
diffusion controlled growth dominated during deformation.
Lee and Huang (2004) studied cavitation in a fine-grained AZ31 alloy. They
observed that cavities less than 2µm in size were grown by diffusion and remained
spherical. In contrast, large cavities were grown by a plasticity controlled mechanism
and became elongated. The authors concluded that cavity nucleation was not a
continuous phenomenon. However, the nucleation of cavities was vaguely presented.
The nucleation rate of cavities in magnesium alloys can be very low, even with
a large volume fraction of particles. If the size of particles is less than the critical
diameter required to nucleate a cavity, it is very possible that cavitation will be
suppressed. For example, in an AZ91 alloy, a low volume fraction of cavities was
reported (Mussi et al., 2006), despite having approximately 12% of Mg17Al12 particles
of an average size of 0.7µm.
The effect of grain size on cavity growth rate has been studied in AZ61. A lower
growth rate was obtained in a fine-grained microstructure where grain boundary
diffusion dominated over lattice diffusion (Somekawa and Mukai, 2007). On the other
hand, in a coarse-grained alloy, the authors observed a higher cavity growth rate and
accommodation was controlled by lattice diffusion. A similar study was performed
on the same alloy (Takigawa et al., 2008) and it was claimed that the nucleation
of cavities and their growth would be similar, regardless of the accommodation
process. However, the use of a different strain rate and temperature to change the
accommodation path, makes it difficult to come to such a conclusion since cavity
growth is very sensitive to these variables regardless of the accommodation process.
At elevated temperature, the nucleation of cavities is retarded due to the increased
diffusional activity to relax concentrated stress (Bae and Ghosh, 2002b). This can
also be related with the decrease of flow stress at higher temperature which increases
78
Chapter 2. Literature Review
the minimum stable cavity nucleus size. In contrast, the growth of cavities may be
accelerated at higher temperature (Lee and Huang, 2004) due to the rapid diffusion
of atoms. However, depending on microstructural stability, the effect of temperature
varies (Pilling and Ridley, 1988a).
In summary, the presence of particles, having a size range larger than a critical
particle diameter, results in stress concentration forming a cavity. Stringer-like cavi-
ties are formed by aligned particles (formed during thermo-mechanical treatments).
On the other hand, spherical cavities are developed if diffusion controlled growth
dominates. Since superplastic alloys experience large strains, the retention of such
a spherical shape does not usually occur and the growth of cavities is governed by
plasticity, resulting in cavity elongation. Test parameters and grain size influence
the nucleation and growth of cavities. Nucleation of a cavity is accelerated at higher
flow stress and higher strain rate condition and is retarded at higher temperature. In
contrast, growth of cavities is increased at higher temperature, owing to higher dif-
fusional activity. DGG increases grain size, which may increase the cavity nucleation
rate due to an increase of local stress. Also, the lack of accommodation of GBS due
to concurrent grain growth increases cavitation.
2.6 Summary and Potential of the Current Study
Fine-grained magnesium alloys can show superplastic behaviour under a certain
set of temperature and strain rate conditions. Incorporating the advantage of fine
grains to promote grain boundary sliding, the comparatively faster diffusion rates in
magnesium compared to aluminium may make magnesium alloys a suitable candidate
for superplastic forming in automobile industries. The effects of aluminium on flow
properties, such as flow stress and strain rate sensitivity, are yet to be studied in
depth. If aluminium can improve strain rate sensitivity, strains to failure are expected
to increase.
Cavitation has a profound effect on maximum attainable strains to failure during
superplastic deformation. In magnesium alloys, cavitation has not been studied
substantially under different test conditions. Importantly, the effect of particles, e.g.,
particles formed by manganese addition, on nucleation of cavities remains unclear.
Also, dynamic grain growth can provide some resistance to necking. It is necessary
to check whether such grain growth affects cavitation in magnesium alloys.
The work performed here investigates the effect of solute aluminium and particles
on deformation, grain growth and cavitation in AZ alloys deformed in the superplastic
regime. The detailed understanding obtained from this work helps to identify the key
features required to improve the superplastic performance of this class of alloys.
79
Chapter 3
Experimental and Data Analysis
Procedures
To understand the effects of aluminium and manganese on the hot deformation
behaviour of the magnesium alloys, four different materials have been used in this
study. As–cast alloys were homogenised and hot–rolled to develop a uniform and
refined microstructure. These rolled sheets were sectioned to prepare specimens for
optical and scanning electron microscopy (SEM), and for tensile tests at elevated
temperatures. After tensile testing, specimens were taken from gauge and grip
regions of the deformed samples and optical and electron microscopy and X-ray
micro-tomography (µCT) investigations were carried out. The results from these
characterisation techniques, along with the flow curve characteristics obtained from
the tensile tests, were analysed and interpreted in different ways to achieve the goal
of this project. This chapter focuses on the materials used, preparation of the rolled
sheets from the as-cast alloys, sample preparation techniques and the characterisation
procedures. To interpret the results obtained from these characterisation techniques,
this chapter ends with a section discussing the data analysis methodology.
3.1 Materials Characteristics
Two alloys, AZ31 and AZ61, were received as sand-cast ingots of dimensions 200×200×50 mm from Magnesium Elektron, UK, with two different manganese levels: 0.30
and 1.20 wt%. The chemical compositions of these alloys (supplied by Magnesium
Elektron, UK) are given in Table 3.1. AZ31 and AZ61 denote the differences in
aluminium levels (3 and 6 wt% Al) and the designations L and H differentiate the
manganese levels in these alloys. This nomenclature is followed throughout this work.
Magnesium Elektron, UK had also supplied another set of these cast alloys of
dimensions 230×200×25 mm which were chill-cast with similar compositions to the
80
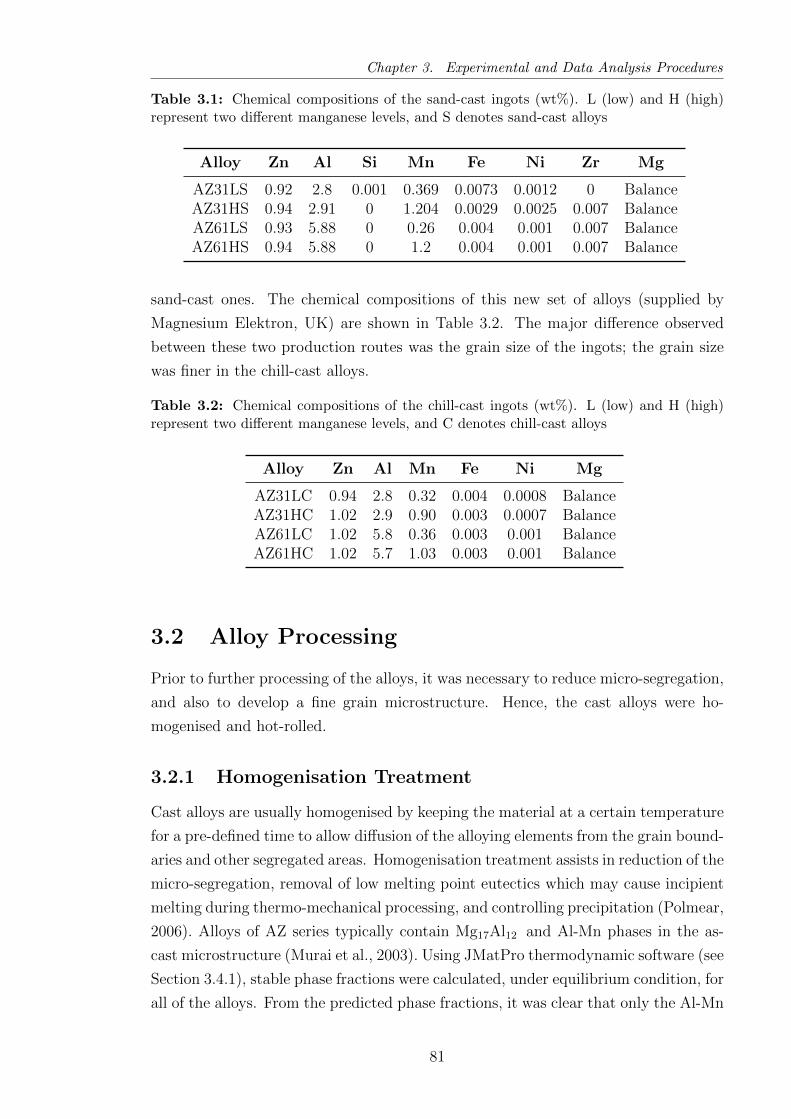
Chapter 3. Experimental and Data Analysis Procedures
Table 3.1: Chemical compositions of the sand-cast ingots (wt%). L (low) and H (high)represent two different manganese levels, and S denotes sand-cast alloys
Alloy Zn Al Si Mn Fe Ni Zr Mg
AZ31LS 0.92 2.8 0.001 0.369 0.0073 0.0012 0 BalanceAZ31HS 0.94 2.91 0 1.204 0.0029 0.0025 0.007 BalanceAZ61LS 0.93 5.88 0 0.26 0.004 0.001 0.007 BalanceAZ61HS 0.94 5.88 0 1.2 0.004 0.001 0.007 Balance
sand-cast ones. The chemical compositions of this new set of alloys (supplied by
Magnesium Elektron, UK) are shown in Table 3.2. The major difference observed
between these two production routes was the grain size of the ingots; the grain size
was finer in the chill-cast alloys.
Table 3.2: Chemical compositions of the chill-cast ingots (wt%). L (low) and H (high)represent two different manganese levels, and C denotes chill-cast alloys
Alloy Zn Al Mn Fe Ni Mg
AZ31LC 0.94 2.8 0.32 0.004 0.0008 BalanceAZ31HC 1.02 2.9 0.90 0.003 0.0007 BalanceAZ61LC 1.02 5.8 0.36 0.003 0.001 BalanceAZ61HC 1.02 5.7 1.03 0.003 0.001 Balance
3.2 Alloy Processing
Prior to further processing of the alloys, it was necessary to reduce micro-segregation,
and also to develop a fine grain microstructure. Hence, the cast alloys were ho-
mogenised and hot-rolled.
3.2.1 Homogenisation Treatment
Cast alloys are usually homogenised by keeping the material at a certain temperature
for a pre-defined time to allow diffusion of the alloying elements from the grain bound-
aries and other segregated areas. Homogenisation treatment assists in reduction of the
micro-segregation, removal of low melting point eutectics which may cause incipient
melting during thermo-mechanical processing, and controlling precipitation (Polmear,
2006). Alloys of AZ series typically contain Mg17Al12 and Al-Mn phases in the as-
cast microstructure (Murai et al., 2003). Using JMatPro thermodynamic software (see
Section 3.4.1), stable phase fractions were calculated, under equilibrium condition, for
all of the alloys. From the predicted phase fractions, it was clear that only the Al-Mn
81
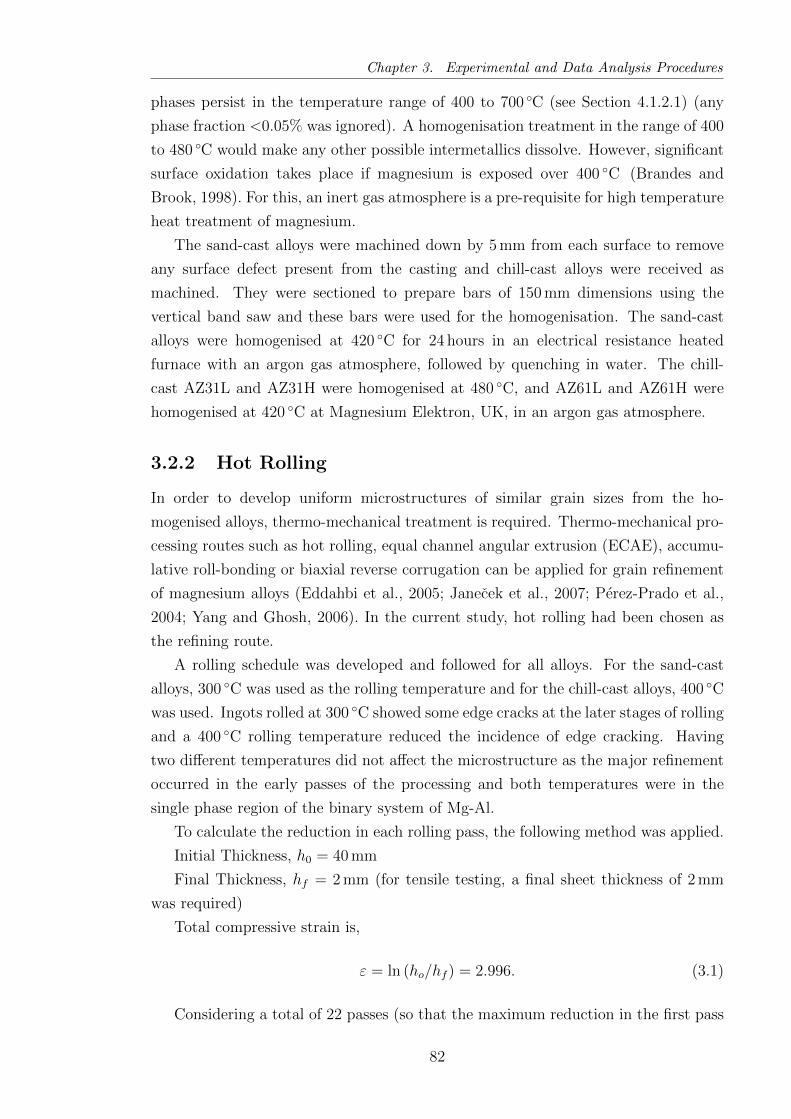
Chapter 3. Experimental and Data Analysis Procedures
phases persist in the temperature range of 400 to 700 C (see Section 4.1.2.1) (any
phase fraction <0.05% was ignored). A homogenisation treatment in the range of 400
to 480 C would make any other possible intermetallics dissolve. However, significant
surface oxidation takes place if magnesium is exposed over 400 C (Brandes and
Brook, 1998). For this, an inert gas atmosphere is a pre-requisite for high temperature
heat treatment of magnesium.
The sand-cast alloys were machined down by 5 mm from each surface to remove
any surface defect present from the casting and chill-cast alloys were received as
machined. They were sectioned to prepare bars of 150 mm dimensions using the
vertical band saw and these bars were used for the homogenisation. The sand-cast
alloys were homogenised at 420 C for 24 hours in an electrical resistance heated
furnace with an argon gas atmosphere, followed by quenching in water. The chill-
cast AZ31L and AZ31H were homogenised at 480 C, and AZ61L and AZ61H were
homogenised at 420 C at Magnesium Elektron, UK, in an argon gas atmosphere.
3.2.2 Hot Rolling
In order to develop uniform microstructures of similar grain sizes from the ho-
mogenised alloys, thermo-mechanical treatment is required. Thermo-mechanical pro-
cessing routes such as hot rolling, equal channel angular extrusion (ECAE), accumu-
lative roll-bonding or biaxial reverse corrugation can be applied for grain refinement
of magnesium alloys (Eddahbi et al., 2005; Janecek et al., 2007; Perez-Prado et al.,
2004; Yang and Ghosh, 2006). In the current study, hot rolling had been chosen as
the refining route.
A rolling schedule was developed and followed for all alloys. For the sand-cast
alloys, 300 C was used as the rolling temperature and for the chill-cast alloys, 400 C
was used. Ingots rolled at 300 C showed some edge cracks at the later stages of rolling
and a 400 C rolling temperature reduced the incidence of edge cracking. Having
two different temperatures did not affect the microstructure as the major refinement
occurred in the early passes of the processing and both temperatures were in the
single phase region of the binary system of Mg-Al.
To calculate the reduction in each rolling pass, the following method was applied.
Initial Thickness, h0 = 40 mm
Final Thickness, hf = 2 mm (for tensile testing, a final sheet thickness of 2 mm
was required)
Total compressive strain is,
ε = ln (ho/hf ) = 2.996. (3.1)
Considering a total of 22 passes (so that the maximum reduction in the first pass
82
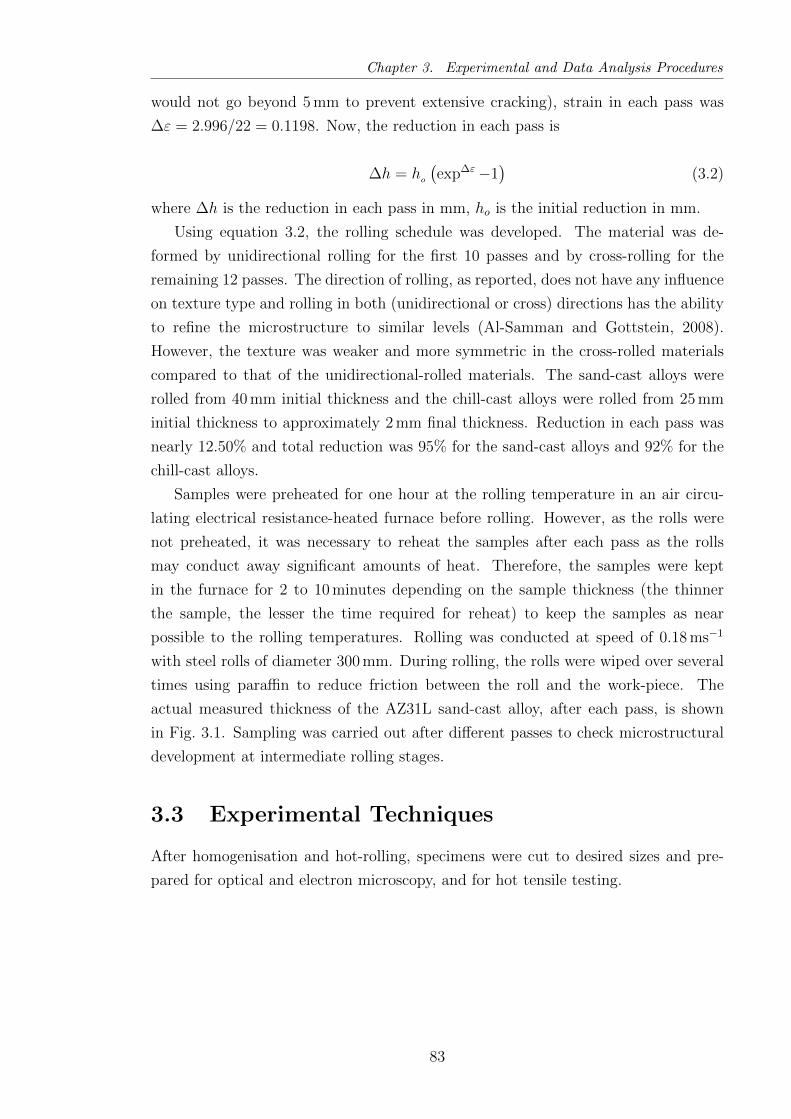
Chapter 3. Experimental and Data Analysis Procedures
would not go beyond 5 mm to prevent extensive cracking), strain in each pass was
∆ε = 2.996/22 = 0.1198. Now, the reduction in each pass is
∆h = ho
(exp∆ε−1
)(3.2)
where ∆h is the reduction in each pass in mm, ho is the initial reduction in mm.
Using equation 3.2, the rolling schedule was developed. The material was de-
formed by unidirectional rolling for the first 10 passes and by cross-rolling for the
remaining 12 passes. The direction of rolling, as reported, does not have any influence
on texture type and rolling in both (unidirectional or cross) directions has the ability
to refine the microstructure to similar levels (Al-Samman and Gottstein, 2008).
However, the texture was weaker and more symmetric in the cross-rolled materials
compared to that of the unidirectional-rolled materials. The sand-cast alloys were
rolled from 40 mm initial thickness and the chill-cast alloys were rolled from 25 mm
initial thickness to approximately 2 mm final thickness. Reduction in each pass was
nearly 12.50% and total reduction was 95% for the sand-cast alloys and 92% for the
chill-cast alloys.
Samples were preheated for one hour at the rolling temperature in an air circu-
lating electrical resistance-heated furnace before rolling. However, as the rolls were
not preheated, it was necessary to reheat the samples after each pass as the rolls
may conduct away significant amounts of heat. Therefore, the samples were kept
in the furnace for 2 to 10 minutes depending on the sample thickness (the thinner
the sample, the lesser the time required for reheat) to keep the samples as near
possible to the rolling temperatures. Rolling was conducted at speed of 0.18 ms−1
with steel rolls of diameter 300 mm. During rolling, the rolls were wiped over several
times using paraffin to reduce friction between the roll and the work-piece. The
actual measured thickness of the AZ31L sand-cast alloy, after each pass, is shown
in Fig. 3.1. Sampling was carried out after different passes to check microstructural
development at intermediate rolling stages.
3.3 Experimental Techniques
After homogenisation and hot-rolling, specimens were cut to desired sizes and pre-
pared for optical and electron microscopy, and for hot tensile testing.
83
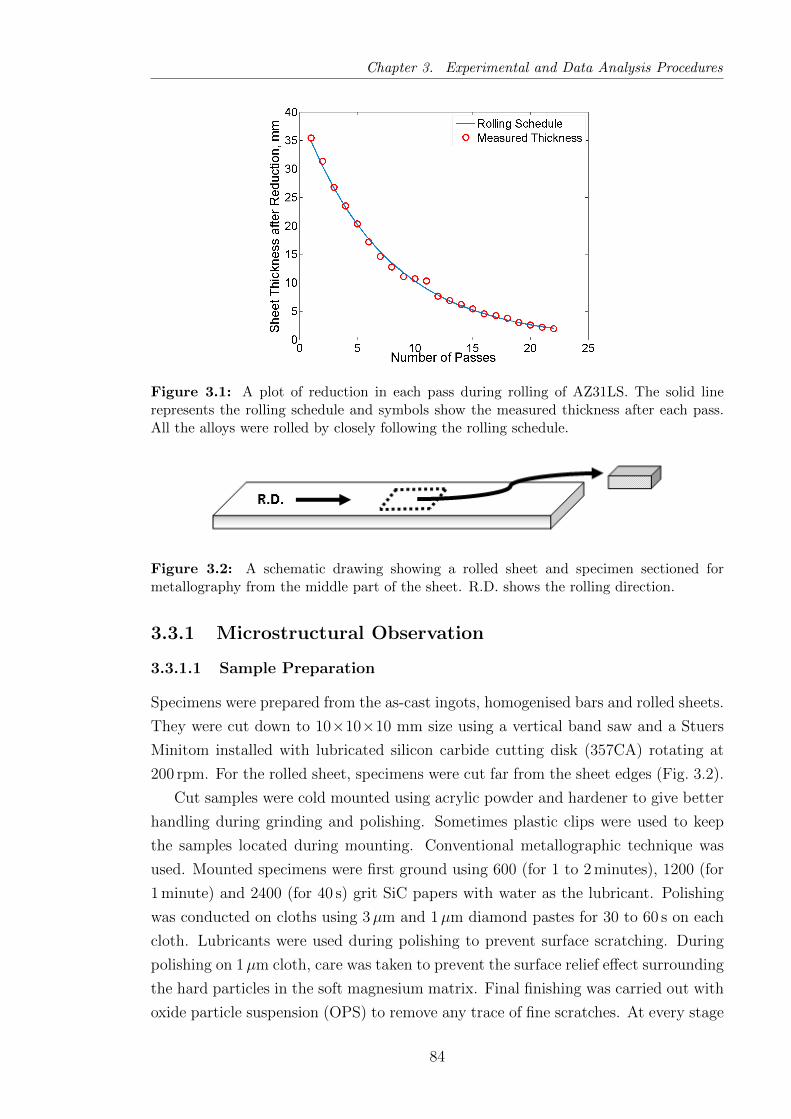
Chapter 3. Experimental and Data Analysis Procedures
Figure 3.1: A plot of reduction in each pass during rolling of AZ31LS. The solid linerepresents the rolling schedule and symbols show the measured thickness after each pass.All the alloys were rolled by closely following the rolling schedule.
Figure 3.2: A schematic drawing showing a rolled sheet and specimen sectioned formetallography from the middle part of the sheet. R.D. shows the rolling direction.
3.3.1 Microstructural Observation
3.3.1.1 Sample Preparation
Specimens were prepared from the as-cast ingots, homogenised bars and rolled sheets.
They were cut down to 10×10×10 mm size using a vertical band saw and a Stuers
Minitom installed with lubricated silicon carbide cutting disk (357CA) rotating at
200 rpm. For the rolled sheet, specimens were cut far from the sheet edges (Fig. 3.2).
Cut samples were cold mounted using acrylic powder and hardener to give better
handling during grinding and polishing. Sometimes plastic clips were used to keep
the samples located during mounting. Conventional metallographic technique was
used. Mounted specimens were first ground using 600 (for 1 to 2 minutes), 1200 (for
1 minute) and 2400 (for 40 s) grit SiC papers with water as the lubricant. Polishing
was conducted on cloths using 3µm and 1µm diamond pastes for 30 to 60 s on each
cloth. Lubricants were used during polishing to prevent surface scratching. During
polishing on 1µm cloth, care was taken to prevent the surface relief effect surrounding
the hard particles in the soft magnesium matrix. Final finishing was carried out with
oxide particle suspension (OPS) to remove any trace of fine scratches. At every stage
84

Chapter 3. Experimental and Data Analysis Procedures
of grinding and polishing, samples were cleaned thoroughly with soap and water
followed by rinsing with ethanol. For automatic grinding and polishing, a Stuers
TegraPol-31 was used with a force of 30 N.
Polished specimens were etched using Picral solution (4.2 gm picric acid, 10 ml
water, 10 ml acetic acid and 70 ml methanol) for 10 to 15 s to reveal grain boundaries.
Some polished specimens were not etched at all, and were observed after OPS
finishing. Specimens used for electron back-scattered diffraction (EBSD) were not
mounted into resin. They were ground and polished by the technique mentioned
above and were then electropolished. Electropolishing smoothes the hills created
during grinding and polishing and also brightens the surface by the formation of a
thin passivating layer (Weidmann, 1993). It was accomplished by submerging the
polished specimens in a magnetically stirred solution consisting of 75 ml nitric acid
(69% concentrated) and 175 ml ethanol (3:7 ratio) cooled to −30 C, using a potential
of 12 V for 30 s.
3.3.1.2 Optical and Scanning Electron Microscopy
Etched and unetched samples were examined, using an Olympus BH2 microscope
fitted with a Zeiss camera, at different magnifications to reveal the grain sizes, particle
distributions and cavities and were saved using the Leica DC View software at a
resolution of 1798×1438. Specimens were mounted on glass slides and specimen
surfaces were kept flat by modelling clay between slides and specimens.
For imaging and Energy dispersive x-ray (EDX) analysis, a Phillips XL30 Field
Emission Gun Scanning Electron Microscope (FEGSEM) was used. Specimens were
ground and polished as mentioned in Section 3.3.1.1 and were kept unetched. They
were mounted on stubs and conductive paths were drawn using Silver DAG paint.
Images were taken at different magnifications using a back-scattered electron (BSE)
detector, as BSE can provide a good average atomic number contrast and distinctively
show the second phases in the alloys investigated. For EDX analysis, Quantax 1.2
software was used to characterise the elements present in the microstructure using
the spot analysis method in FEGSEM with 100 s scanning time. Both atomic and
weight percentages of the elements present at a particular spot and the corresponding
spectrum were saved. Imaging was conducted at 8 kV and 20 kV accelerating voltages
and EDX was conducted at 20 kV, and spot size 3 was used; the spatial resolution
obtained at this size was sufficient for imaging.
The EBSD technique was used to obtain the texture of the rolled sheets. A Cam-
Scan Maxim 2040 FEGSEM was used to acquire backscattered diffraction patterns
using a charge-coupled device (CCD) camera with a sample stage tilt of 70. A
20 kV accelerating voltage, 20 mm working distance and spot size 6 were used. The
acquisition step size was set to 20µm at a magnification of ×250 to allow a sufficient
85
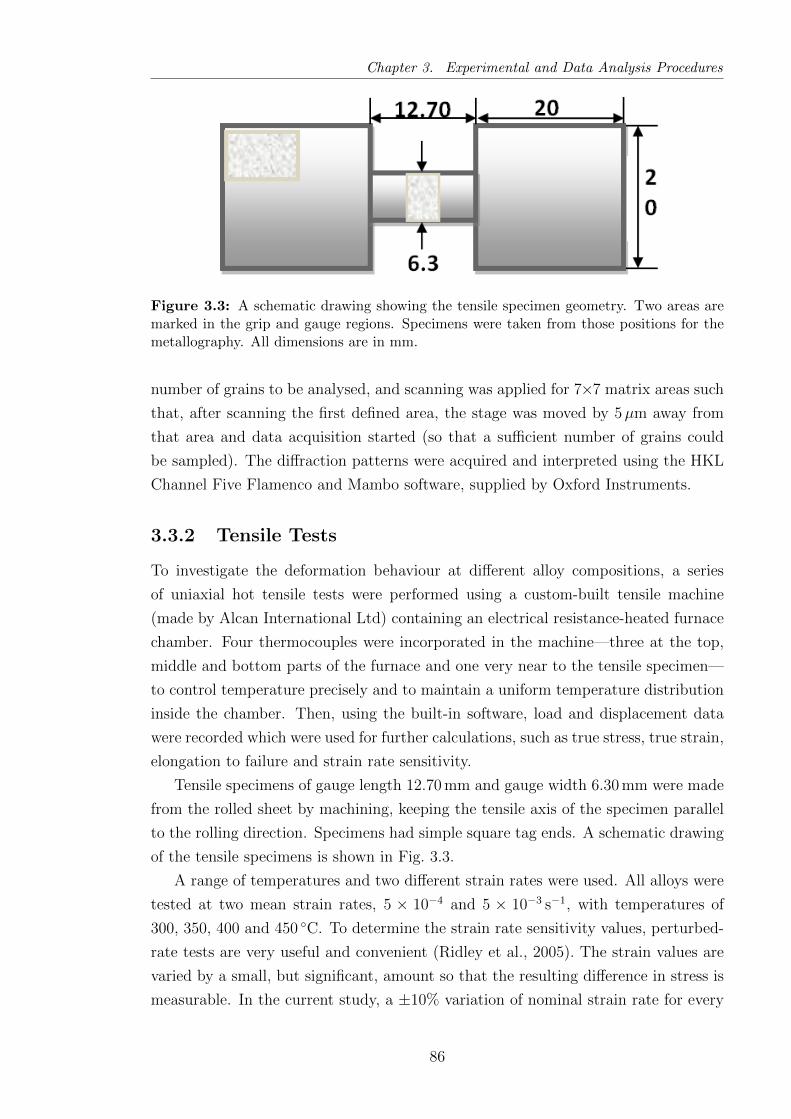
Chapter 3. Experimental and Data Analysis Procedures
Figure 3.3: A schematic drawing showing the tensile specimen geometry. Two areas aremarked in the grip and gauge regions. Specimens were taken from those positions for themetallography. All dimensions are in mm.
number of grains to be analysed, and scanning was applied for 7×7 matrix areas such
that, after scanning the first defined area, the stage was moved by 5µm away from
that area and data acquisition started (so that a sufficient number of grains could
be sampled). The diffraction patterns were acquired and interpreted using the HKL
Channel Five Flamenco and Mambo software, supplied by Oxford Instruments.
3.3.2 Tensile Tests
To investigate the deformation behaviour at different alloy compositions, a series
of uniaxial hot tensile tests were performed using a custom-built tensile machine
(made by Alcan International Ltd) containing an electrical resistance-heated furnace
chamber. Four thermocouples were incorporated in the machine—three at the top,
middle and bottom parts of the furnace and one very near to the tensile specimen—
to control temperature precisely and to maintain a uniform temperature distribution
inside the chamber. Then, using the built-in software, load and displacement data
were recorded which were used for further calculations, such as true stress, true strain,
elongation to failure and strain rate sensitivity.
Tensile specimens of gauge length 12.70 mm and gauge width 6.30 mm were made
from the rolled sheet by machining, keeping the tensile axis of the specimen parallel
to the rolling direction. Specimens had simple square tag ends. A schematic drawing
of the tensile specimens is shown in Fig. 3.3.
A range of temperatures and two different strain rates were used. All alloys were
tested at two mean strain rates, 5 × 10⁻⁴ and 5 × 10⁻³ s−1, with temperatures of
300, 350, 400 and 450 C. To determine the strain rate sensitivity values, perturbed-
rate tests are very useful and convenient (Ridley et al., 2005). The strain values are
varied by a small, but significant, amount so that the resulting difference in stress is
measurable. In the current study, a ±10% variation of nominal strain rate for every
86

Chapter 3. Experimental and Data Analysis Procedures
0.1 strain step was used.
For cavitation analysis, a temperature of 350 C and a strain rate of 5× 10⁻⁴ s−1
were chosen as the test conditions after analysing the results from perturbed-rate
tests. Constant strain rate was used and tests were conducted up to strain levels of
0.8, 0.9, 1.0 and 1.05, so that cavity formation and growth, and grain growth, could
be studied.
The furnace was heated to the required temperature and then the specimen was
placed in the grips and 15 to 20 minutes were allowed to stabilise the temperature
before tests were initiated. Temperature fluctuation was within ±2 C and all tests
were conducted in air.
3.3.3 X-Ray Micro-Tomography
2-dimensional (2D) observations by the optical microscopy and scanning electron
microscopy have some limitations, such that connected components (correlated par-
ticles and cavities, different phases, etc.), complex shapes of the regions of interest,
the actual number of regions in the whole volume, etc. cannot be measured properly.
One cavity region and one particle region may be identified as not connected in 2D
but actually that cavity region may be connected with another particle region just
beneath the surface of observation. X-ray micro-tomography has enabled investiga-
tion through a whole volume of the material so that a true relationship between the
particles and cavities can be determined.
The X-ray system consists of a source, sample holder and a detector coupled by a
caesium-iodide scintillator (to convert X-rays to visible light), magnifying objective
lenses and a cooled CCD (charged-couple device), which collects visible lights from
lenses. X-rays are sent from a cone beam source to the rotating sample and the
transmitted beams are then recorded in the detector. The number of transmitted
photons depends on the attenuation (absorption) coefficient of the material which,
in turn, is dependent on the density and atomic number of the material, and energy
of the incident photons. Full details of the technique are presented elsewhere (Stock,
2008). Fig. 3.4 shows a schematic view of the X-ray micro-tomography system.
An area of approximately 1.3 mm2 from the middle of the gauge sections of
the specimens deformed to different pre-set strains were scanned using a Xradia
MicroXCT tomography machine. The accelerating voltage used was 75 kV, power
was 10 W and an optical lens magnification of ×20 successfully resolved the features
present in the material. Absorption mode was used by keeping the sample stage very
close to the detector. During the rotation of the specimen stage from 0 to 180, a
total of 723 images were acquired, with radiographs (projected profiles) captured at
every 0.25 using a 50 s exposure time for each radiograph. The collected projections
87
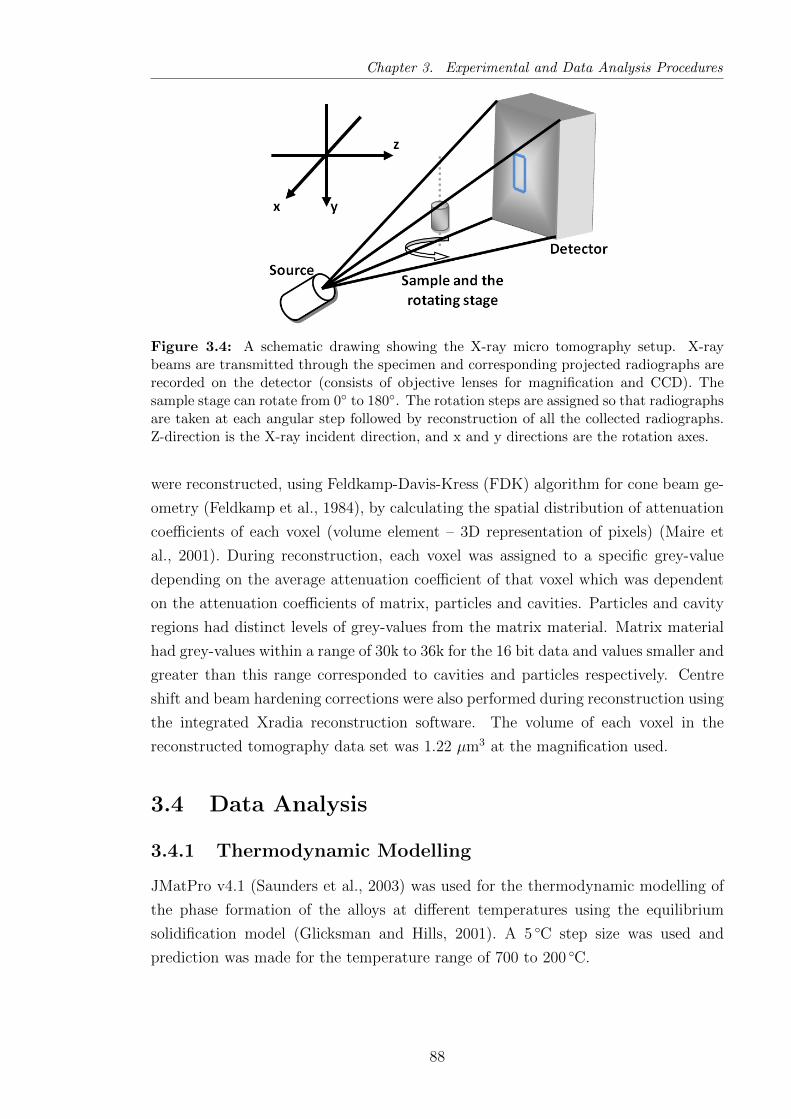
Chapter 3. Experimental and Data Analysis Procedures
Figure 3.4: A schematic drawing showing the X-ray micro tomography setup. X-raybeams are transmitted through the specimen and corresponding projected radiographs arerecorded on the detector (consists of objective lenses for magnification and CCD). Thesample stage can rotate from 0 to 180. The rotation steps are assigned so that radiographsare taken at each angular step followed by reconstruction of all the collected radiographs.Z-direction is the X-ray incident direction, and x and y directions are the rotation axes.
were reconstructed, using Feldkamp-Davis-Kress (FDK) algorithm for cone beam ge-
ometry (Feldkamp et al., 1984), by calculating the spatial distribution of attenuation
coefficients of each voxel (volume element – 3D representation of pixels) (Maire et
al., 2001). During reconstruction, each voxel was assigned to a specific grey-value
depending on the average attenuation coefficient of that voxel which was dependent
on the attenuation coefficients of matrix, particles and cavities. Particles and cavity
regions had distinct levels of grey-values from the matrix material. Matrix material
had grey-values within a range of 30k to 36k for the 16 bit data and values smaller and
greater than this range corresponded to cavities and particles respectively. Centre
shift and beam hardening corrections were also performed during reconstruction using
the integrated Xradia reconstruction software. The volume of each voxel in the
reconstructed tomography data set was 1.22 µm3 at the magnification used.
3.4 Data Analysis
3.4.1 Thermodynamic Modelling
JMatPro v4.1 (Saunders et al., 2003) was used for the thermodynamic modelling of
the phase formation of the alloys at different temperatures using the equilibrium
solidification model (Glicksman and Hills, 2001). A 5 C step size was used and
prediction was made for the temperature range of 700 to 200 C.
88
Chapter 3. Experimental and Data Analysis Procedures
3.4.2 Grain Size Determination
The sizes of the grains were determined from the images taken by the optical mi-
croscope using the linear intercept method. Lines were drawn on the image in
ImageJ 1.43e (Abramoff et al., 2004) and the total number of grain boundaries cutting
through each line was counted. Then, dividing the line length by the number of grain
boundaries, the average grain size was calculated. A total of 5 to 8 images were used
to obtain the final average grain size. The standard deviation of the calculated grain
size is defined as
sr =
(∑(xi − x)2
nt − 1
)1/2
(3.3)
where xi is the mean grain size value from image i, x is the mean grain size calculated
from all the images and nt is the number of images considered. standard errors (SEs)
were calculated from the values of standard deviation. SE provides an indication
of fluctuation of the sample means. It shows the variation of the mean grain size
obtained from the different images and provides a better estimation of data scattering
from the mean where the number of the sample (containing the data population) is
more than one. SE is defined as:
S.E. =sr√nt
(3.4)
where the terms are defined earlier.
3.4.3 Measurement of Second Phase Particles and Cavities
BSE images provided good contrast between the matrix and the second phase par-
ticles for the alloys studied. 10 images were acquired for each alloy. Using ImageJ,
images were converted to 8-bit greyscale images and particle regions were segmented
(i.e., separated and labelled) and examined to get the data of area fractions and sizes
(feret diameter). Feret diameter is the longest distance between two parallel lines
drawn at the tangents of two points within the particle. Particle size distributions
were calculated for each alloy and SEs were also estimated using equations 3.3 and
3.4.
BSE images appeared to provide strong contrast between the particles and cavities
and were more suitable for cavitation studies compared to the optical images, where
the contrast was less obvious. 20 BSE images were taken for each tensile specimen,
tested up to the strains of 0.8 to 1.05, at a constant strain rate of 5× 10⁻⁴ s−1. The
images were segmented and analysed in a similar method to that used for the particle
analysis.
89

Chapter 3. Experimental and Data Analysis Procedures
3.4.4 Tomography Data Analysis
Raw data from tomography was imported as a single binary file for further ex-
amination by Matlab and, also, as a series of image files for volume rendering to
produce a set of 3-dimensional (3D) images of the particles and cavities. Stacks of
image files were loaded in Avizo 5.1 (VSG, 2010) software and 3D images were saved
showing connected particles and cavities, and the clustering of particles at different
enlargements.
For quantitative investigation, Matlab and Fortran software were used. To make
the data readable to these software packages, a few pre-processing steps were carried
out. The binary tomography file was first loaded in ImageJ. Then, only particle
regions were segmented and saved as a binary file. Another binary file was produced
for the cavities in the similar way. Then, a Matlab routine (produced by Dr. T.
J. Marrow, University of Manchester) was used to load the binary files in Matlab.
Then, routines were developed to label (separation and identification of the individual
regions) the voxels using the 26 connected-neighbourhood condition and calculate the
volume fractions, shape and list of coordinates of the connected voxels.
3.4.5 Calculations of Stress and Strain
From the tensile tests, load and extension data were recorded. Linear or engineering
stress and strain were calculated using the following formula:
e =∆L
Lo(3.5)
σs =P
Ao(3.6)
where e and σs are the engineering strain and stress, ∆L is the extension of length, L0
is the original gauge length, P is the load and A0 is the original cross-sectional area
of the gauge (calculated from the width and thickness). From the engineering strain
and stress data, true strain and stress values were calculated. The advantage of using
true strain is that the sum of all instantaneous true strain values is equal to the total
true strain measured. True strain and stress at any instance, n, are described by the
following expressions as:
ε = ln
(LnLo
)= ln (e+ 1) (3.7)
σ =PnAn
= σs(e+ 1) (3.8)
90
Chapter 3. Experimental and Data Analysis Procedures
where ε and σ are the true strain and stress, Ln, An and Pn are the extension, cross-
sectional area and load at the nth step during test and other terms are defined earlier.
Elongation to failure (ef ) was also measured using the formula:
ef =Lf − LoLo
× 100% (3.9)
where Lf is the length after failure and other terms are defined earlier. The ef values
were measured from the direct measurements of Lf from the deformed gauge regions
using callipers. This direct measurement, however, did not vary largely from the
crosshead displacement measurements. A plot was drawn to check the differences
and a fit equation of y = 0.98x + 1.20 was obtained (y = ef by direct measurement
and x = ef by crosshead displacement).
From the perturbed-rate tests, polynomial fitting was applied to the −10% and
+10% strain perturbation segments of stress for each 0.10 strain. Then, strain rate
sensitivity (m) values were calculated using the formula:
m =∆ lnσ
∆ ln ε(3.10)
where ∆ lnσ is the difference between the logarithmic of the upper and lower stress
levels and ∆ ln ε is the difference between the logarithmic of the two applied strain
rates (±10% of the nominal strain rate, i.e., if the nominal strain rate is 5× 10⁻⁴s−1,
then, 4 ln ε = ln [5.5× 10⁻⁴ − 4.5× 10⁻⁴]).
3.4.6 Statistical Analysis
It is important to distinguish the trends in unperfect data obtained from the exper-
imental techniques for better interpretation and understanding of the results. For
size and area fraction data of grains, particles and cavities, SE (Equation 3.4) was
calculated to show the scattering of data.
For the size distribution of the particles and cavities, Probability distribution
functions (PDFs) were evaluated. A PDF illustrates the structural features of a large
data set. A PDF gives the probability density of a random variable in a given interval.
If p(x) is the PDF of x, then the probability that x1 ≤ x ≤ x2 is given by
p (x1, x2) =
x2∫x1
p (x) dx (3.11)
For a data population (x1,x2, . . .xn with a continuous and univariate density f),
a kernel estimator (weighting function) of the PDF is defined as
91

Chapter 3. Experimental and Data Analysis Procedures
f (x) =1
Nh
N∑i=1
Ke
(x− xih
)(3.12)
where x is the value for which the estimation is being made, xi is the independent
variable from the data set, N is the data size, h is the bandwidth (smoothing param-
eter) and Ke is the Kernel estimation function. h is the scaling factor and controls
the width of the probability mass surrounding a point. An improper bandwidth (h)
selection may cause over- or under-smoothing of data. In the current project, the
Epanechnikov kernel (Silverman, 1992) and h = 0.75 were used. The Epanechnikov
kernel is defined as
K (u) =4
3
(1− u2
)for |u |≤ 1 (3.13)
where u =(x−xih
)andKe (u) = 0 if u 1
3.4.6.1 Factorial Design and Analysis of Variance (ANOVA)
In the current study, factorial designs had been used for the tensile test results to
understand the effects of temperature and composition. Factorial design consists of a
set of variables or factors (temperature, composition, etc), levels (represents different
states of the variables; for a 2 level design, levels are usually denoted as high and
low) and responses (values of a certain property or event for each variable and level;
e.g., values of the elongation to failure (ef ) data at two different temperatures). A
2g factorial design represents the 2 level responses of g number of variables. It can
be presented in two steps: Pareto charts of the interactions and analysis of variance
(ANOVA).
Consider a 22 full factorial design. It has two levels: high (+) and low (−), and
2 variables: A and B. This design is shown in Table 3.3. Now, after multiplying the
responses of the variables (e.g., strain rate sensitivity values, m) according to the
design matrix shown in Table 3.4, the sums of the responses (∆/2) are calculated
(Table 3.4). Then, the half-effects (∆/2) are plotted in a Pareto chart to illustrate
the variation of the responses for different interactions with variables.
To understand the significance of the responses, a factorial ANOVA was per-
formed. In factorial ANOVA, the F -distribution (named after R. A. Fisher) is
calculated which compares the spread in the data (mean square error (MSE)) with
the shift in the data (mean square between (MSB)). MSE and MSB are described as:
MSE =
∑r
(nr − 1) s2r∑
r
(nr − 1)(3.14)
92
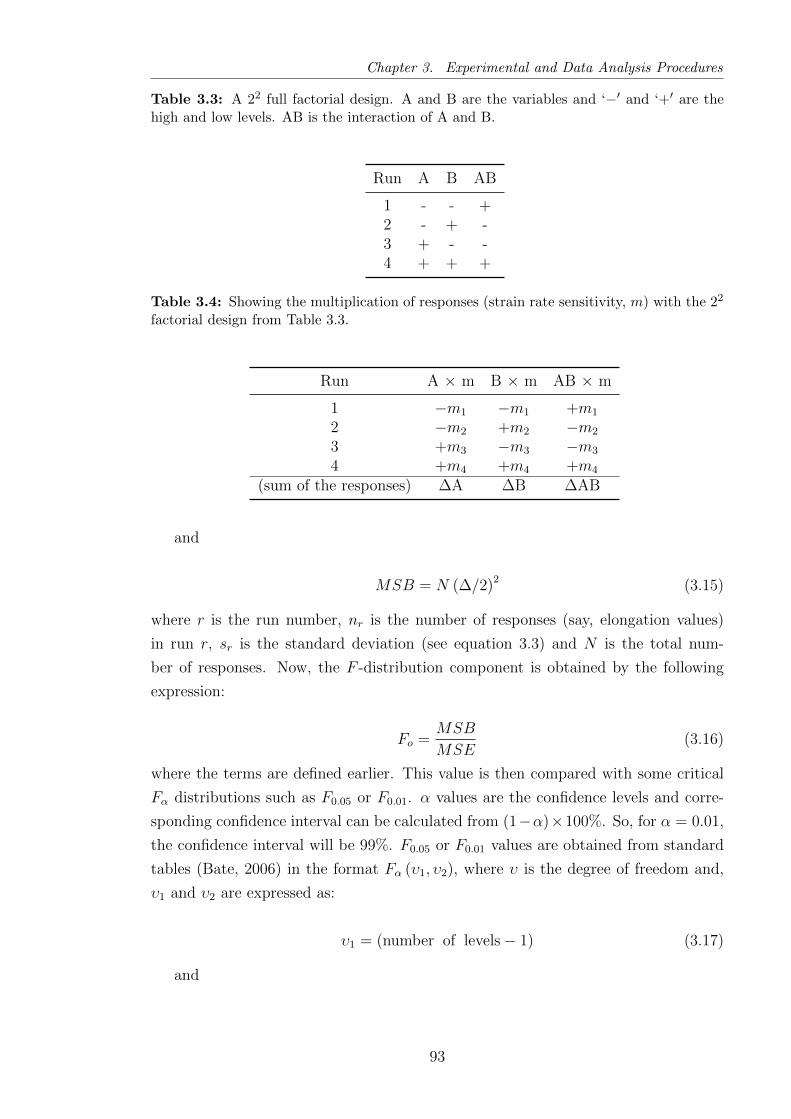
Chapter 3. Experimental and Data Analysis Procedures
Table 3.3: A 22 full factorial design. A and B are the variables and ‘−′ and ‘+′ are thehigh and low levels. AB is the interaction of A and B.
Run A B AB
1 - - +2 - + -3 + - -4 + + +
Table 3.4: Showing the multiplication of responses (strain rate sensitivity, m) with the 22
factorial design from Table 3.3.
Run A × m B × m AB × m
1 −m1 −m1 +m1
2 −m2 +m2 −m2
3 +m3 −m3 −m3
4 +m4 +m4 +m4
(sum of the responses) ∆A ∆B ∆AB
and
MSB = N (∆/2)2 (3.15)
where r is the run number, nr is the number of responses (say, elongation values)
in run r, sr is the standard deviation (see equation 3.3) and N is the total num-
ber of responses. Now, the F -distribution component is obtained by the following
expression:
Fo =MSB
MSE(3.16)
where the terms are defined earlier. This value is then compared with some critical
Fα distributions such as F0.05 or F0.01. α values are the confidence levels and corre-
sponding confidence interval can be calculated from (1−α)×100%. So, for α = 0.01,
the confidence interval will be 99%. F0.05 or F0.01 values are obtained from standard
tables (Bate, 2006) in the format Fα (υ1, υ2), where υ is the degree of freedom and,
υ1 and υ2 are expressed as:
υ1 = (number of levels− 1) (3.17)
and
93
Chapter 3. Experimental and Data Analysis Procedures
υ2 =∑r
(nr − 1) . (3.18)
Now, if Fo>Fα, then the effect of the corresponding variable is statistically significant.
3.5 Summary
Two variants of AZ31 and AZ61 alloys, containing around 0.30 and 1.20 wt% man-
ganese, were received in the as-cast form. They were homogenised at the temperatures
ranging from 420 to 480 C for 24 hours and hot-rolled at 300 C and 400 C by 12%
reduction in each pass to produce a refined and recrystallized microstructure. These
rolled sheets were examined by the optical microscopy for the grain size determina-
tion, by the SEM for the second phase particle composition and size determination
and by EBSD to evaluate the texture. Thermodynamic modelling was carried out to
predict the phases present in these alloys. Tensile specimens were prepared from the
rolled sheets and perturbed-rate tests were conducted at temperatures of 300, 350,
400 and 450 C for two mean strain rates, 5× 10⁻⁴ and 5× 10⁻³ s−1.
Metallographic samples were taken from the gauge and grip regions of the tensile
samples to observe the grain growth that occurred. The elongation to failure values
and strain rate sensitivity values were also determined. Several statistical calculations
were performed on the mechanical results obtained. A series of constant strain rate
tests (at 5 × 10⁻⁴ s−1) were also carried out at 350 C up to different intermediate
strains for cavitation analysis. 20 BSE images were taken for each sample in the
deformed areas and cavity area fractions and size distributions were determined. X-
ray micro-tomography was also carried out for these intermediate strained specimens.
3D images were rendered and further analysis was performed on the raw data from
tomography by using the Matlab and Fortran routines to establish cavity-particle
relationships.
94

Chapter 4
Hot Deformation Behaviour of
the Alloys
This chapter focuses on the flow characteristics of the alloys. Initially, the develop-
ment of the microstructure from the cast materials is presented. Then, the aspects
of the uniaxial tensile test and flow characteristics, at different alloy compositions,
for different test parameters are revealed followed by statistical analyses to check
the effects of the test parameters and compositions of the materials on elongation to
failure (ef ) and strain rate sensitivity (m). After understanding the flow behaviour,
attempts have been made to determine the extent of grain growth that occurred
during deformation. One of the key features identified in the materials is a vary-
ing distribution of second phase particles. An extensive study was carried out to
determine the particle composition and size distribution, and finally, a comparison
has been made with the results of the predicted thermodynamically stable phases.
Combining these information, suggestions have been made as to the failure mode
during deformation.
4.1 Development of Initial Microstructure
4.1.1 Rolling of the As-cast alloys
The alloys were received in as-cast form. The sand-cast alloys (40 mm thickness)
were homogenised at 420 C to remove any effects of segregation and were rolled at
300 C by 22 passes of equal strain (see Section 3.2.2). The cast microstructures are
shown in Fig. 4.1. To understand the evolution of the refined grains, microstructures
were examined after different number of passes of hot rolling. Fig. 4.2 shows the
development of fine grains after different rolling passes. The continuous formation
of smaller grains and concurrent refinement of the larger grains are also highlighted.
The micrographs confirm that dynamic recrystallization (DRX) took place during
95

Chapter 4. Hot Deformation Behaviour of the Alloys
Figure 4.1: Optical images of the sand-cast microstructures of (a) AZ31LS, (b) AZ31HS,(c) AZ61LS and (d) AZ61HS. The precipitation of the second phase particles and thesegregation of alloying elements are quite noticeable in the micrographs. The measuredaverage grain sizes of the alloys are approximately 1000µm.
hot rolling. The micrographs also show DRX to be dominated by nucleation of new
grains at prior grain boundaries along with evidence of intragranular formation at
twins (Fig. 4.3).
Fig. 4.3 shows some interesting features. A few grains have formed in the interior
of a very coarse parent grain. ‘A’ shows an array of the grains at the boundary
of the coarse matrix grain. ‘B’ shows several bands of grains embedded into the
matrix grain. ‘C’ indicates the potential source of this interior grain nucleation as a
deformation twin. Twins thus have assisted in recrystallization during the hot rolling
by acting as a favourable site for new grain initiation. Formation mechanisms of the
recrystallized grains by hot rolling in magnesium alloys has been reported previously
for AZ31 and AZ61 alloys (del Valle et al., 2003; Stanford and Barnett, 2008) and the
present observations are consistent with these works. Table 4.1 shows the measured
refinement in the grain size during hot rolling.
The as-cast grain sizes of all alloys are approximately similar. It was observed
that addition of more manganese did not contribute to any refinement of the cast
structure (Table 4.1). Laser and co-workers (2006) varied the manganese content up
to 0.80% in a conventional AZ31 alloy and had shown this did not achieve any effective
grain refinement in the cast alloys after rolling. The grain refinement by hot rolling
obtained in the current study is approximately by a factor of 125. The microstructure
after complete hot rolling is homogenous as no initial grains are retained (Fig. 4.4).
96

Chapter 4. Hot Deformation Behaviour of the Alloys
Figure 4.2: Optical micrographs of sand-cast AZ31HS during different passes of therolling: (a) after 24% reduction, (b) 34% reduction and (c) 50% reduction. The continuousrefinement of the grains through recrystallization is evident from the images. The rollingtemperature was 300 C. The rolling direction (R.D.) is also shown.
Table 4.1: The refining of the grains during the hot rolling of the sand-cast alloys at300 C
Grain Size, µm
Reduction, %
Alloy Cast 24a 34 50 75 87 95
AZ31LS 1120.03±53.72
17.81±4.17
13.30±2.44
13.83±1.47
9.35±0.82
8.23±0.42
7.03±0.23
AZ31HS 1216.46±145.75
30.10±17.52
19.59±1.50
14.09±4.05
7.16±0.52
7.23±0.23
7.10±0.35
AZ61LS 935.58±59.77
27.34±8.65
12.59±2.55
12.02±2.98
8.73±0.37
8.83±0.54
9.31±0.38
AZ61HS 994.18±102.61
29.72±7.06
12.26±3.35
8.81±1.86
8.13±0.29
8.04±0.40
8.09±0.44
a Grain size calculations at 24% reduction include the recrystallized grains and parent grainsalso. Therefore, the size calculations at 24% contain a large scatter since only a smallnumber of the original very large grains 1000µm were sampled.
97

Chapter 4. Hot Deformation Behaviour of the Alloys
Figure 4.3: An optical micrograph of sand-cast AZ31HS alloy after 24% reduction byrolling. ‘A’ shows one of the refined grains at the boundary of a very large parent grain.‘B’ represents new smaller refined grain formed inside the parent grain preferably at thetwins ‘C’. The rolling temperature was 300 C.
Therefore, the recrystallization can be considered to be complete. Table 4.1 shows,
after 50% reduction, the microstructure becomes fully recrystallized and grains are
less than 20µm in size (average size). Further reduction leads to refining of the small
number of retained coarse grains to produce a more homogeneous microstructure.
The chill-cast alloys (25 mm thickness) with approximately the same compositions
as the sand-cast alloys were rolled at 400 C with a total compressive strain of 0.92.
The rolled microstructures are shown in Fig. 4.5. Table 4.2 shows the average grain
sizes of the chill-cast alloys obtained after the hot rolling. The average grain sizes are
7 to 9µm and are approximately similar to those of the sand-cast alloys. However,
the homogeneity of the recrystallized microstructure appears to be better than those
rolled at 300 C. The effect of the rolling temperature on the final grain size is
apparently negligible. It is also noticeable that the initial thickness is not important
for producing fine grains by hot rolling. The final grain size is almost entirely a
function of the total compressive strain.
Table 4.2: Grain sizes of the chill-cast alloys
Alloy AZ31LC AZ31HC AZ61LC AZ61HC
Grain Size, µm 8.04± 0.44 8.34± 0.80 8.92± 0.65 8.16± 0.92
98
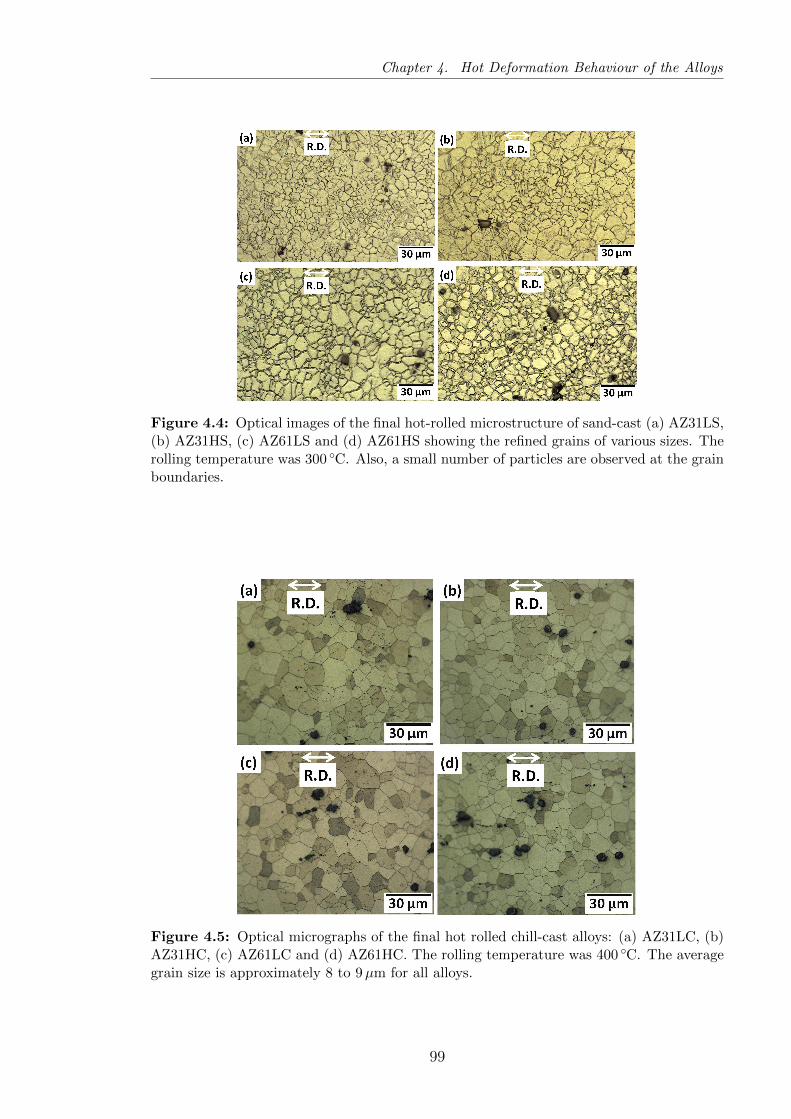
Chapter 4. Hot Deformation Behaviour of the Alloys
Figure 4.4: Optical images of the final hot-rolled microstructure of sand-cast (a) AZ31LS,(b) AZ31HS, (c) AZ61LS and (d) AZ61HS showing the refined grains of various sizes. Therolling temperature was 300 C. Also, a small number of particles are observed at the grainboundaries.
Figure 4.5: Optical micrographs of the final hot rolled chill-cast alloys: (a) AZ31LC, (b)AZ31HC, (c) AZ61LC and (d) AZ61HC. The rolling temperature was 400 C. The averagegrain size is approximately 8 to 9µm for all alloys.
99
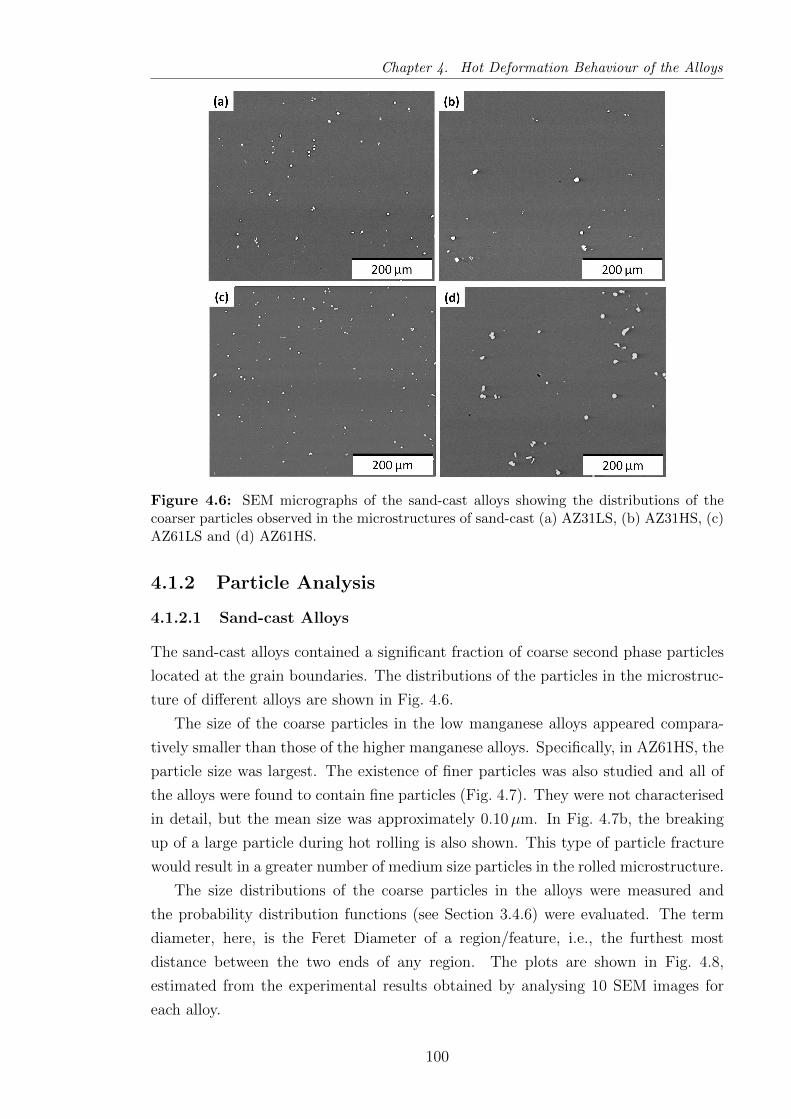
Chapter 4. Hot Deformation Behaviour of the Alloys
Figure 4.6: SEM micrographs of the sand-cast alloys showing the distributions of thecoarser particles observed in the microstructures of sand-cast (a) AZ31LS, (b) AZ31HS, (c)AZ61LS and (d) AZ61HS.
4.1.2 Particle Analysis
4.1.2.1 Sand-cast Alloys
The sand-cast alloys contained a significant fraction of coarse second phase particles
located at the grain boundaries. The distributions of the particles in the microstruc-
ture of different alloys are shown in Fig. 4.6.
The size of the coarse particles in the low manganese alloys appeared compara-
tively smaller than those of the higher manganese alloys. Specifically, in AZ61HS, the
particle size was largest. The existence of finer particles was also studied and all of
the alloys were found to contain fine particles (Fig. 4.7). They were not characterised
in detail, but the mean size was approximately 0.10µm. In Fig. 4.7b, the breaking
up of a large particle during hot rolling is also shown. This type of particle fracture
would result in a greater number of medium size particles in the rolled microstructure.
The size distributions of the coarse particles in the alloys were measured and
the probability distribution functions (see Section 3.4.6) were evaluated. The term
diameter, here, is the Feret Diameter of a region/feature, i.e., the furthest most
distance between the two ends of any region. The plots are shown in Fig. 4.8,
estimated from the experimental results obtained by analysing 10 SEM images for
each alloy.
100
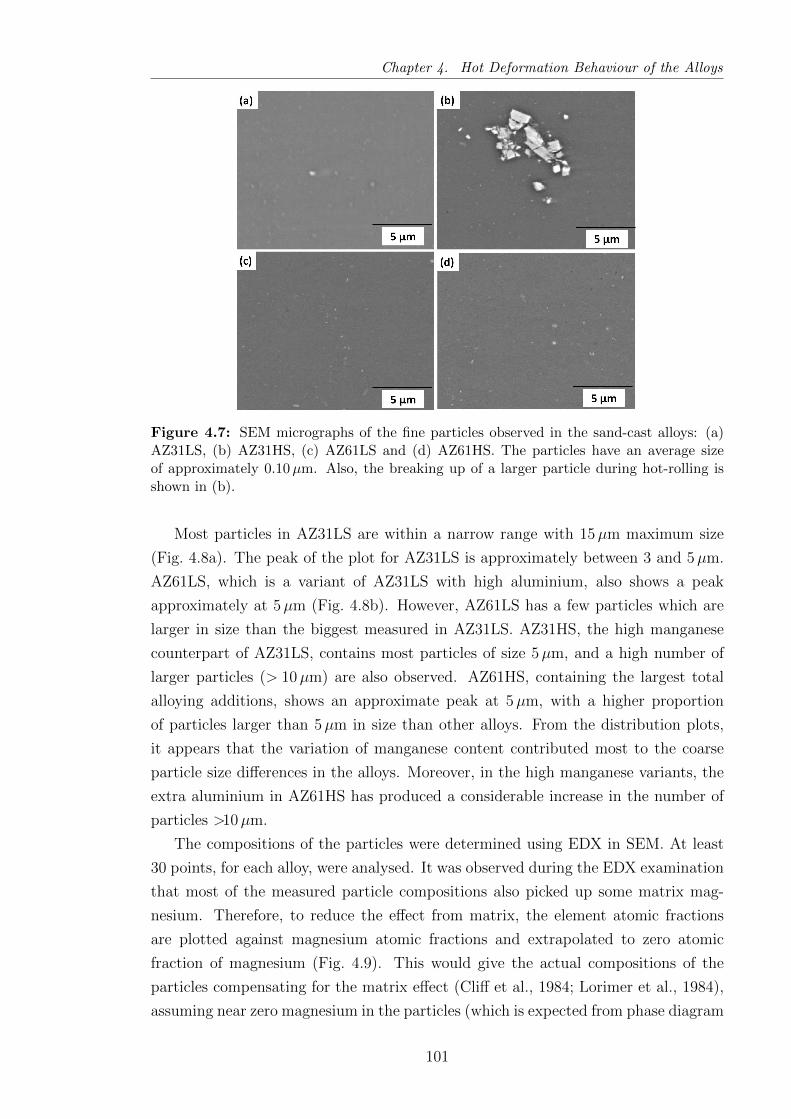
Chapter 4. Hot Deformation Behaviour of the Alloys
Figure 4.7: SEM micrographs of the fine particles observed in the sand-cast alloys: (a)AZ31LS, (b) AZ31HS, (c) AZ61LS and (d) AZ61HS. The particles have an average sizeof approximately 0.10µm. Also, the breaking up of a larger particle during hot-rolling isshown in (b).
Most particles in AZ31LS are within a narrow range with 15µm maximum size
(Fig. 4.8a). The peak of the plot for AZ31LS is approximately between 3 and 5µm.
AZ61LS, which is a variant of AZ31LS with high aluminium, also shows a peak
approximately at 5µm (Fig. 4.8b). However, AZ61LS has a few particles which are
larger in size than the biggest measured in AZ31LS. AZ31HS, the high manganese
counterpart of AZ31LS, contains most particles of size 5µm, and a high number of
larger particles (> 10µm) are also observed. AZ61HS, containing the largest total
alloying additions, shows an approximate peak at 5µm, with a higher proportion
of particles larger than 5µm in size than other alloys. From the distribution plots,
it appears that the variation of manganese content contributed most to the coarse
particle size differences in the alloys. Moreover, in the high manganese variants, the
extra aluminium in AZ61HS has produced a considerable increase in the number of
particles >10µm.
The compositions of the particles were determined using EDX in SEM. At least
30 points, for each alloy, were analysed. It was observed during the EDX examination
that most of the measured particle compositions also picked up some matrix mag-
nesium. Therefore, to reduce the effect from matrix, the element atomic fractions
are plotted against magnesium atomic fractions and extrapolated to zero atomic
fraction of magnesium (Fig. 4.9). This would give the actual compositions of the
particles compensating for the matrix effect (Cliff et al., 1984; Lorimer et al., 1984),
assuming near zero magnesium in the particles (which is expected from phase diagram
101
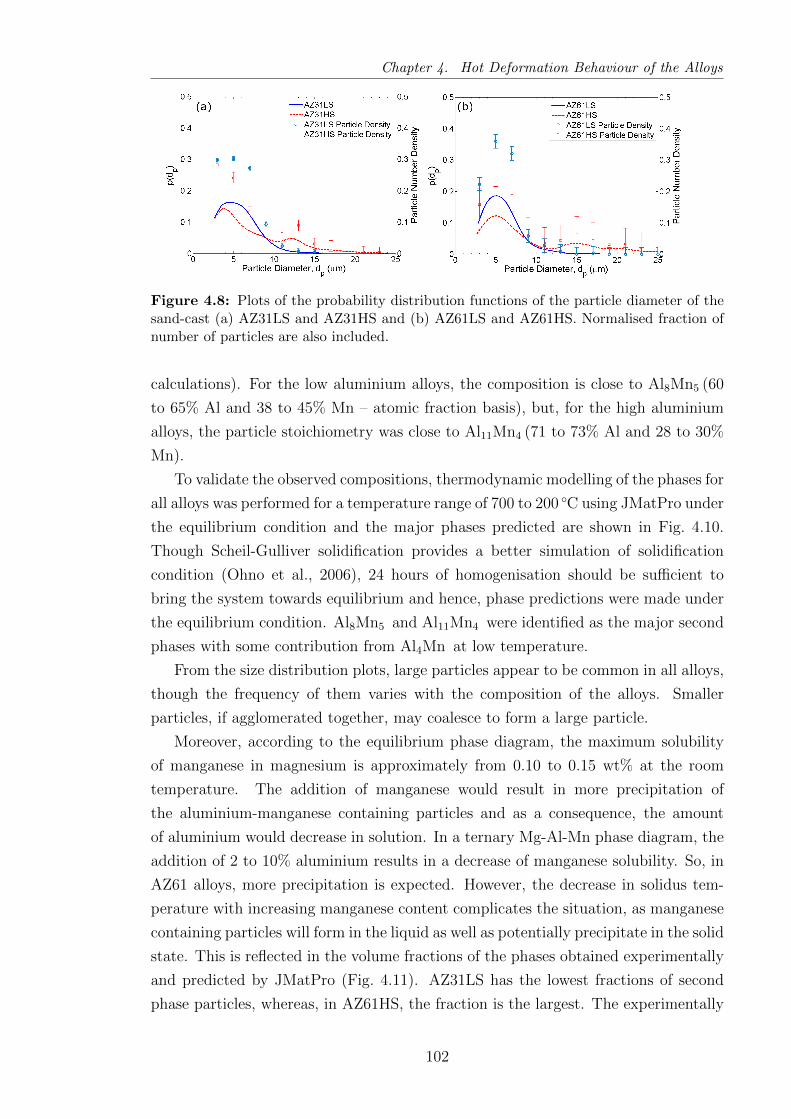
Chapter 4. Hot Deformation Behaviour of the Alloys
Figure 4.8: Plots of the probability distribution functions of the particle diameter of thesand-cast (a) AZ31LS and AZ31HS and (b) AZ61LS and AZ61HS. Normalised fraction ofnumber of particles are also included.
calculations). For the low aluminium alloys, the composition is close to Al8Mn5 (60
to 65% Al and 38 to 45% Mn – atomic fraction basis), but, for the high aluminium
alloys, the particle stoichiometry was close to Al11Mn4 (71 to 73% Al and 28 to 30%
Mn).
To validate the observed compositions, thermodynamic modelling of the phases for
all alloys was performed for a temperature range of 700 to 200 C using JMatPro under
the equilibrium condition and the major phases predicted are shown in Fig. 4.10.
Though Scheil-Gulliver solidification provides a better simulation of solidification
condition (Ohno et al., 2006), 24 hours of homogenisation should be sufficient to
bring the system towards equilibrium and hence, phase predictions were made under
the equilibrium condition. Al8Mn5 and Al11Mn4 were identified as the major second
phases with some contribution from Al4Mn at low temperature.
From the size distribution plots, large particles appear to be common in all alloys,
though the frequency of them varies with the composition of the alloys. Smaller
particles, if agglomerated together, may coalesce to form a large particle.
Moreover, according to the equilibrium phase diagram, the maximum solubility
of manganese in magnesium is approximately from 0.10 to 0.15 wt% at the room
temperature. The addition of manganese would result in more precipitation of
the aluminium-manganese containing particles and as a consequence, the amount
of aluminium would decrease in solution. In a ternary Mg-Al-Mn phase diagram, the
addition of 2 to 10% aluminium results in a decrease of manganese solubility. So, in
AZ61 alloys, more precipitation is expected. However, the decrease in solidus tem-
perature with increasing manganese content complicates the situation, as manganese
containing particles will form in the liquid as well as potentially precipitate in the solid
state. This is reflected in the volume fractions of the phases obtained experimentally
and predicted by JMatPro (Fig. 4.11). AZ31LS has the lowest fractions of second
phase particles, whereas, in AZ61HS, the fraction is the largest. The experimentally
102
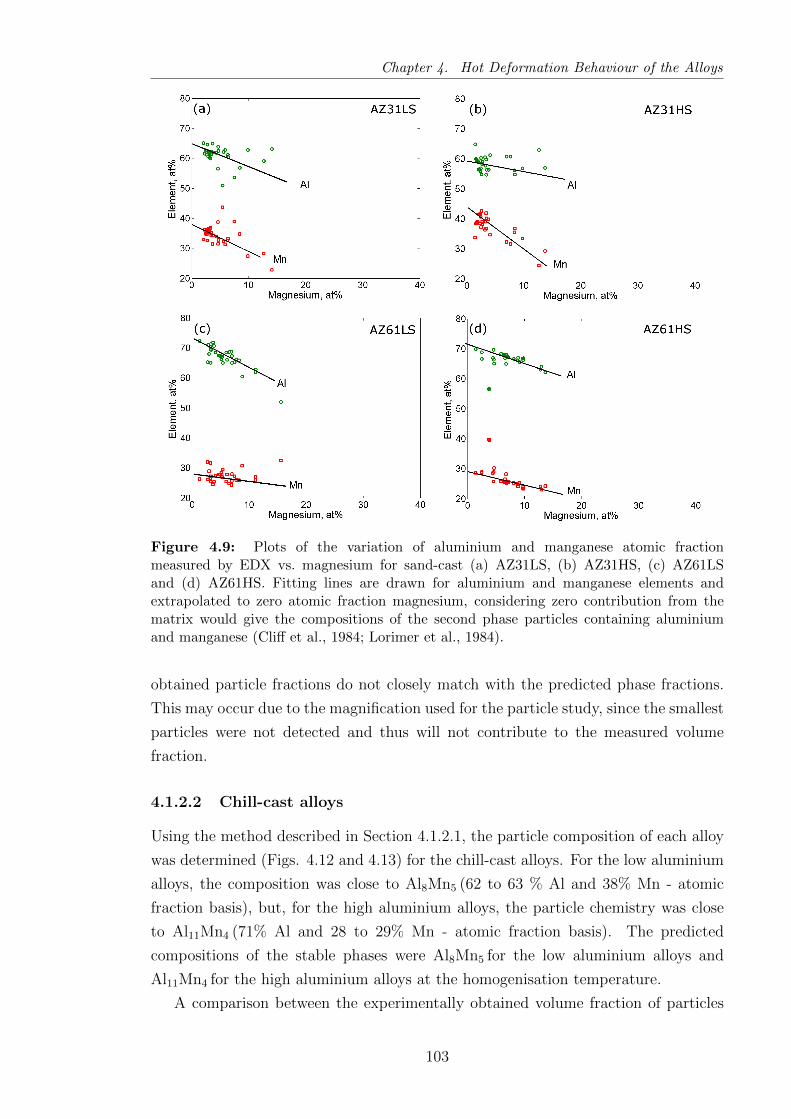
Chapter 4. Hot Deformation Behaviour of the Alloys
Figure 4.9: Plots of the variation of aluminium and manganese atomic fractionmeasured by EDX vs. magnesium for sand-cast (a) AZ31LS, (b) AZ31HS, (c) AZ61LSand (d) AZ61HS. Fitting lines are drawn for aluminium and manganese elements andextrapolated to zero atomic fraction magnesium, considering zero contribution from thematrix would give the compositions of the second phase particles containing aluminiumand manganese (Cliff et al., 1984; Lorimer et al., 1984).
obtained particle fractions do not closely match with the predicted phase fractions.
This may occur due to the magnification used for the particle study, since the smallest
particles were not detected and thus will not contribute to the measured volume
fraction.
4.1.2.2 Chill-cast alloys
Using the method described in Section 4.1.2.1, the particle composition of each alloy
was determined (Figs. 4.12 and 4.13) for the chill-cast alloys. For the low aluminium
alloys, the composition was close to Al8Mn5 (62 to 63 % Al and 38% Mn - atomic
fraction basis), but, for the high aluminium alloys, the particle chemistry was close
to Al11Mn4 (71% Al and 28 to 29% Mn - atomic fraction basis). The predicted
compositions of the stable phases were Al8Mn5 for the low aluminium alloys and
Al11Mn4 for the high aluminium alloys at the homogenisation temperature.
A comparison between the experimentally obtained volume fraction of particles
103
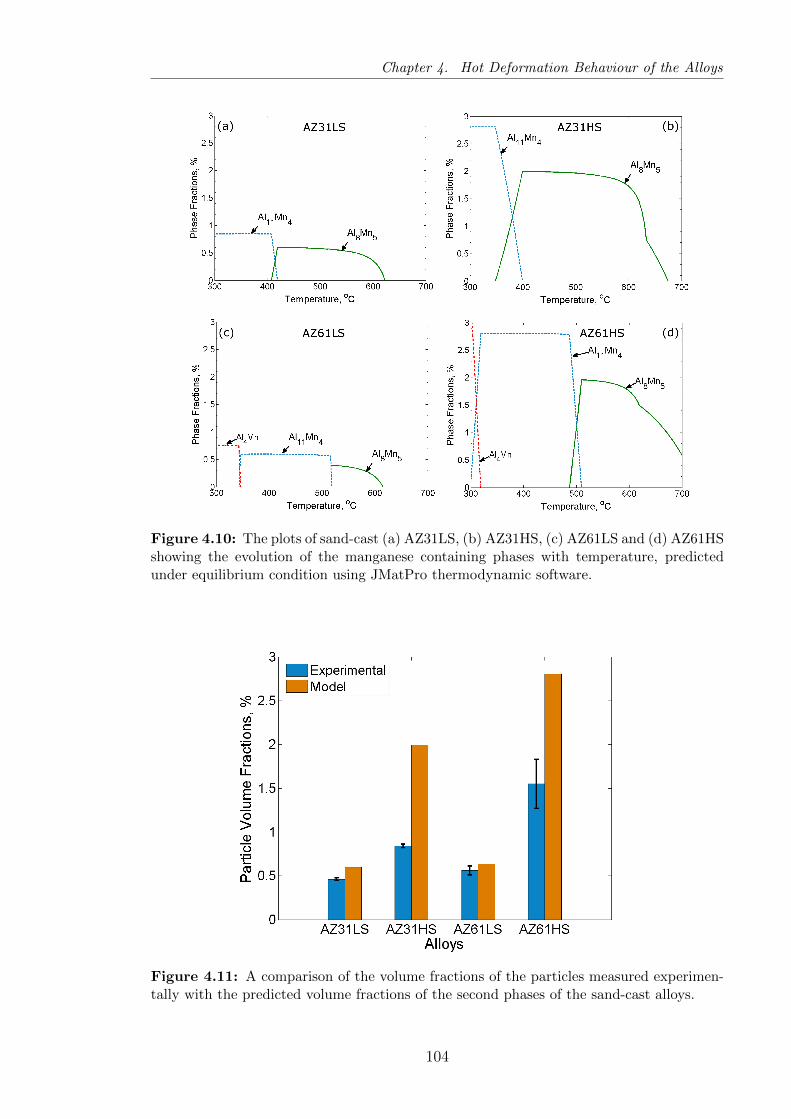
Chapter 4. Hot Deformation Behaviour of the Alloys
Figure 4.10: The plots of sand-cast (a) AZ31LS, (b) AZ31HS, (c) AZ61LS and (d) AZ61HSshowing the evolution of the manganese containing phases with temperature, predictedunder equilibrium condition using JMatPro thermodynamic software.
Figure 4.11: A comparison of the volume fractions of the particles measured experimen-tally with the predicted volume fractions of the second phases of the sand-cast alloys.
104

Chapter 4. Hot Deformation Behaviour of the Alloys
Figure 4.12: The plots of particle compositions showing the variation of aluminium andmanganese atomic fraction against that of matrix, magnesium, of chill-cast (a) AZ31LCand (b) AZ31HC. Fitting lines are drawn for aluminium and manganese data points andextrapolated to zero atomic fraction Mg, since zero contribution from the matrix wouldgive the correct compositions of the particles containing aluminium and manganese.
with the predicted phase fraction is shown in Fig. 4.14. Similar to the sand-cast
alloys, the experimentally obtained volume fractions of particles are comparatively
lower than the model predicted phase fraction, especially for the high manganese
alloys.
Size distributions of the particles are shown in Fig. 4.15. For AZ31LC, most of the
particles are within a range of diameter of 3 to 5µm and AZ31HC contains particles
in a similar size range with more particles in the larger size range of the plot. The
higher aluminium variants contain particles almost within a range of 3 to 6µm. For
the high manganese alloys, the existence of large particles is evident. The modes of
the data sets of particle sizes are 5, 3, 4 and 4µm for AZ31LC, AZ31HC, AZ61LC
and AZ61HC respectively. The fraction of particles, larger than 10µm, are 3.35, 6.62,
4.73 and 8.84% of the total number of particles for AZ31LC, AZ31HC, AZ61LC and
AZ61HC respectively. The average particle sizes are given in Table 4.3 together with
the data from the chill-cast alloys. The average particle sizes are similar in all alloys.
However, the major difference in the sizes lies in the larger size range.
The phase formed and fractions were very similar in the sand-cast and chill-cast
alloys (within 10%). After rolling, the particle size distributions were also very similar.
4.1.3 Texture Development
The pole figures of the rolled alloys were constructed from EBSD data. For hexagonal
metals, the texture is commonly represented by the orientation of the 0001 plane.
The texture obtained for basal 0001, prismatic 1010 and pyramidal 1120 planes
are shown in terms of pole figures in Figs. 4.16 and 4.17.
A strong basal texture is observed in all alloys. Most of the poles are aligned
105
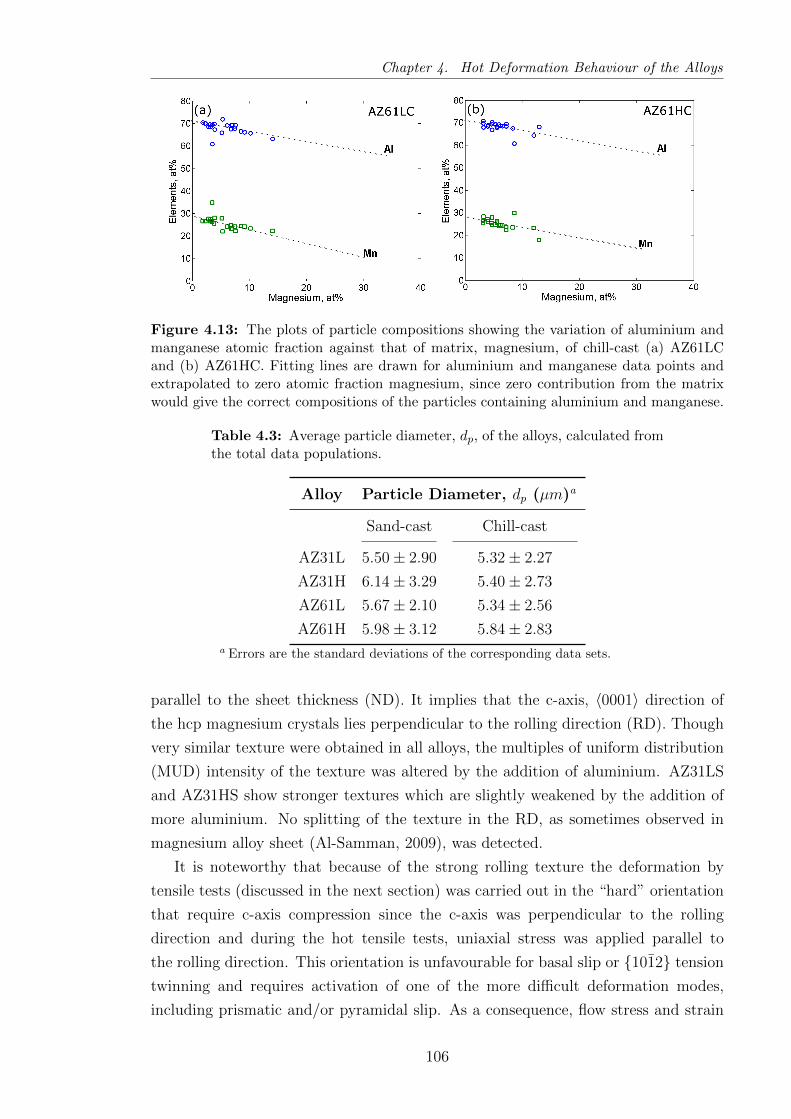
Chapter 4. Hot Deformation Behaviour of the Alloys
Figure 4.13: The plots of particle compositions showing the variation of aluminium andmanganese atomic fraction against that of matrix, magnesium, of chill-cast (a) AZ61LCand (b) AZ61HC. Fitting lines are drawn for aluminium and manganese data points andextrapolated to zero atomic fraction magnesium, since zero contribution from the matrixwould give the correct compositions of the particles containing aluminium and manganese.
Table 4.3: Average particle diameter, dp, of the alloys, calculated fromthe total data populations.
Alloy Particle Diameter, dp (µm)a
Sand-cast Chill-cast
AZ31L 5.50± 2.90 5.32± 2.27
AZ31H 6.14± 3.29 5.40± 2.73
AZ61L 5.67± 2.10 5.34± 2.56
AZ61H 5.98± 3.12 5.84± 2.83a Errors are the standard deviations of the corresponding data sets.
parallel to the sheet thickness (ND). It implies that the c-axis, 〈0001〉 direction of
the hcp magnesium crystals lies perpendicular to the rolling direction (RD). Though
very similar texture were obtained in all alloys, the multiples of uniform distribution
(MUD) intensity of the texture was altered by the addition of aluminium. AZ31LS
and AZ31HS show stronger textures which are slightly weakened by the addition of
more aluminium. No splitting of the texture in the RD, as sometimes observed in
magnesium alloy sheet (Al-Samman, 2009), was detected.
It is noteworthy that because of the strong rolling texture the deformation by
tensile tests (discussed in the next section) was carried out in the “hard” orientation
that require c-axis compression since the c-axis was perpendicular to the rolling
direction and during the hot tensile tests, uniaxial stress was applied parallel to
the rolling direction. This orientation is unfavourable for basal slip or 1012 tension
twinning and requires activation of one of the more difficult deformation modes,
including prismatic and/or pyramidal slip. As a consequence, flow stress and strain
106
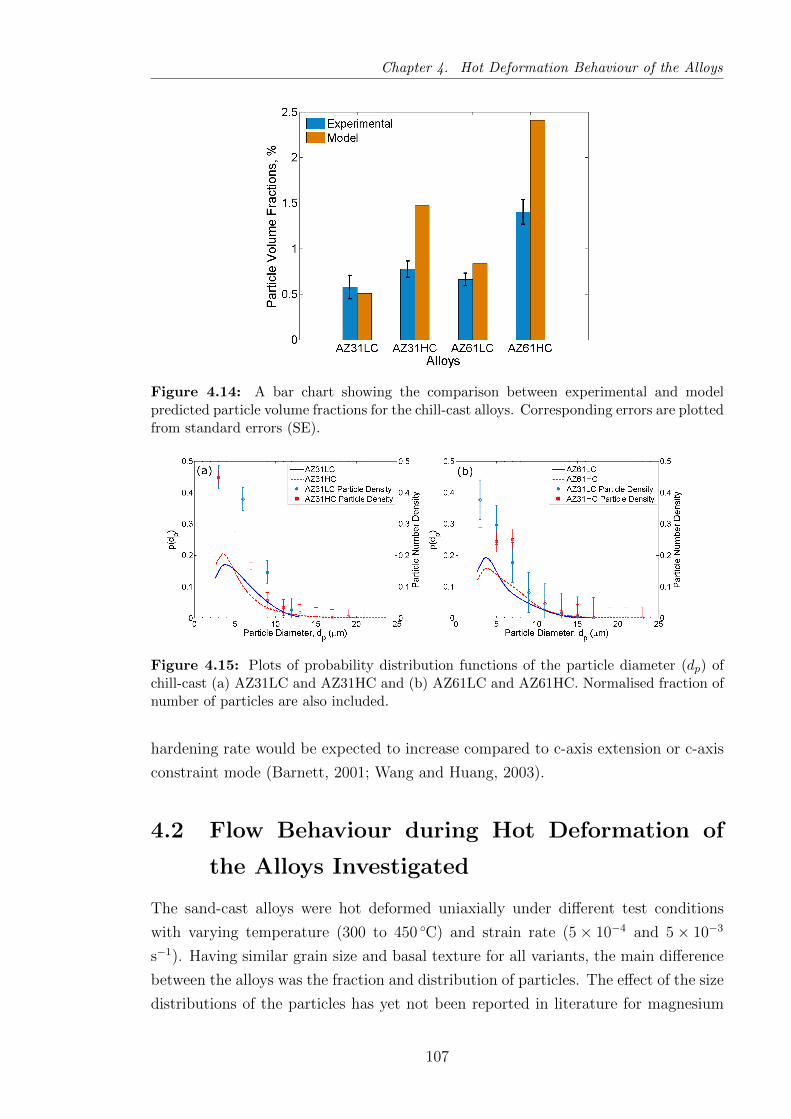
Chapter 4. Hot Deformation Behaviour of the Alloys
Figure 4.14: A bar chart showing the comparison between experimental and modelpredicted particle volume fractions for the chill-cast alloys. Corresponding errors are plottedfrom standard errors (SE).
Figure 4.15: Plots of probability distribution functions of the particle diameter (dp) ofchill-cast (a) AZ31LC and AZ31HC and (b) AZ61LC and AZ61HC. Normalised fraction ofnumber of particles are also included.
hardening rate would be expected to increase compared to c-axis extension or c-axis
constraint mode (Barnett, 2001; Wang and Huang, 2003).
4.2 Flow Behaviour during Hot Deformation of
the Alloys Investigated
The sand-cast alloys were hot deformed uniaxially under different test conditions
with varying temperature (300 to 450 C) and strain rate (5× 10⁻⁴ and 5× 10⁻³
s−1). Having similar grain size and basal texture for all variants, the main difference
between the alloys was the fraction and distribution of particles. The effect of the size
distributions of the particles has yet not been reported in literature for magnesium
107

Chapter 4. Hot Deformation Behaviour of the Alloys
Figure 4.16: The pole figures of 0001,1010 and 1120 planes for AZ31LS andAZ31HS in the final hot rolled condition. The alloys were rolled at 300 C to a strainof 0.95. The maximum intensity for both alloys is very similar. A common basal texture isidentified in both alloys.
108

Chapter 4. Hot Deformation Behaviour of the Alloys
Figure 4.17: The pole figures of 0001, 1010 and 1010 planes for AZ61LS andAZ61HS in the final hot rolled condition. The alloys were rolled at 300 C to a strain of0.95. The maximum intensity for both alloys varies slightly, but, the maximum intensitiesare lower than those of AZ31LS and AZ31HS indicating the weakening of texture, to someextent, by aluminium addition. A common basal texture is identified in both alloys.
109
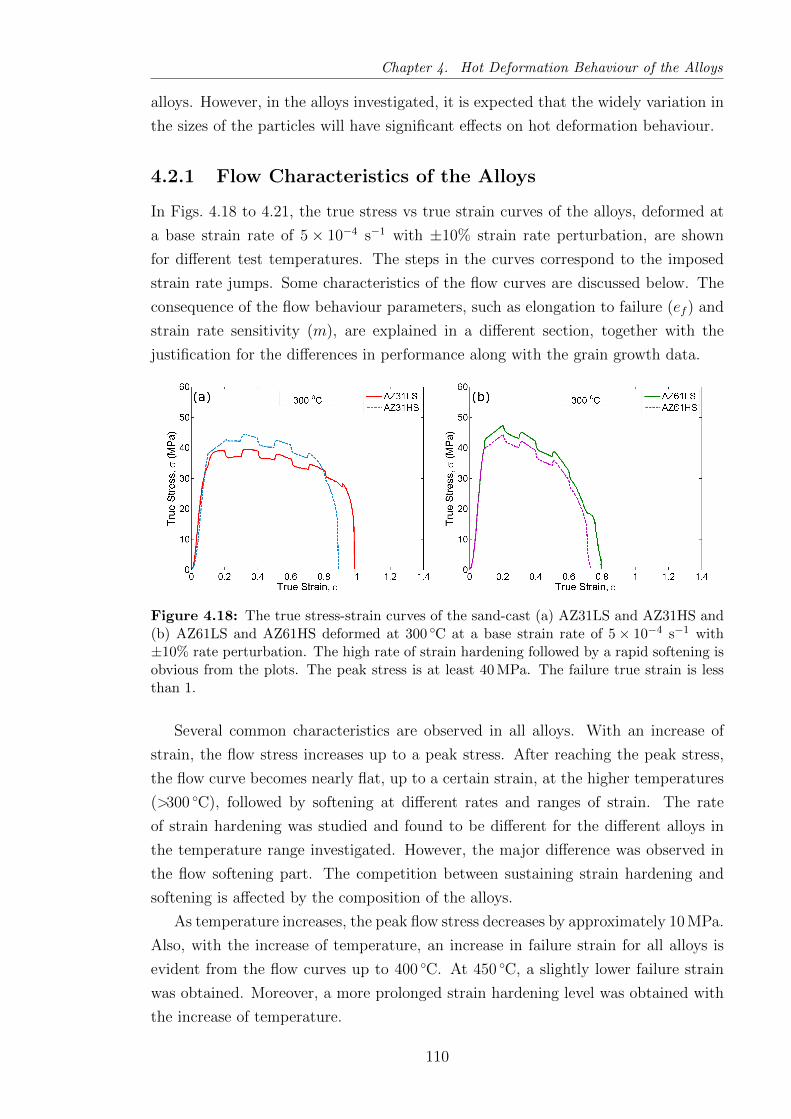
Chapter 4. Hot Deformation Behaviour of the Alloys
alloys. However, in the alloys investigated, it is expected that the widely variation in
the sizes of the particles will have significant effects on hot deformation behaviour.
4.2.1 Flow Characteristics of the Alloys
In Figs. 4.18 to 4.21, the true stress vs true strain curves of the alloys, deformed at
a base strain rate of 5× 10⁻⁴ s−1 with ±10% strain rate perturbation, are shown
for different test temperatures. The steps in the curves correspond to the imposed
strain rate jumps. Some characteristics of the flow curves are discussed below. The
consequence of the flow behaviour parameters, such as elongation to failure (ef ) and
strain rate sensitivity (m), are explained in a different section, together with the
justification for the differences in performance along with the grain growth data.
Figure 4.18: The true stress-strain curves of the sand-cast (a) AZ31LS and AZ31HS and(b) AZ61LS and AZ61HS deformed at 300 C at a base strain rate of 5× 10⁻⁴ s−1 with±10% rate perturbation. The high rate of strain hardening followed by a rapid softening isobvious from the plots. The peak stress is at least 40 MPa. The failure true strain is lessthan 1.
Several common characteristics are observed in all alloys. With an increase of
strain, the flow stress increases up to a peak stress. After reaching the peak stress,
the flow curve becomes nearly flat, up to a certain strain, at the higher temperatures
(>300 C), followed by softening at different rates and ranges of strain. The rate
of strain hardening was studied and found to be different for the different alloys in
the temperature range investigated. However, the major difference was observed in
the flow softening part. The competition between sustaining strain hardening and
softening is affected by the composition of the alloys.
As temperature increases, the peak flow stress decreases by approximately 10 MPa.
Also, with the increase of temperature, an increase in failure strain for all alloys is
evident from the flow curves up to 400 C. At 450 C, a slightly lower failure strain
was obtained. Moreover, a more prolonged strain hardening level was obtained with
the increase of temperature.
110
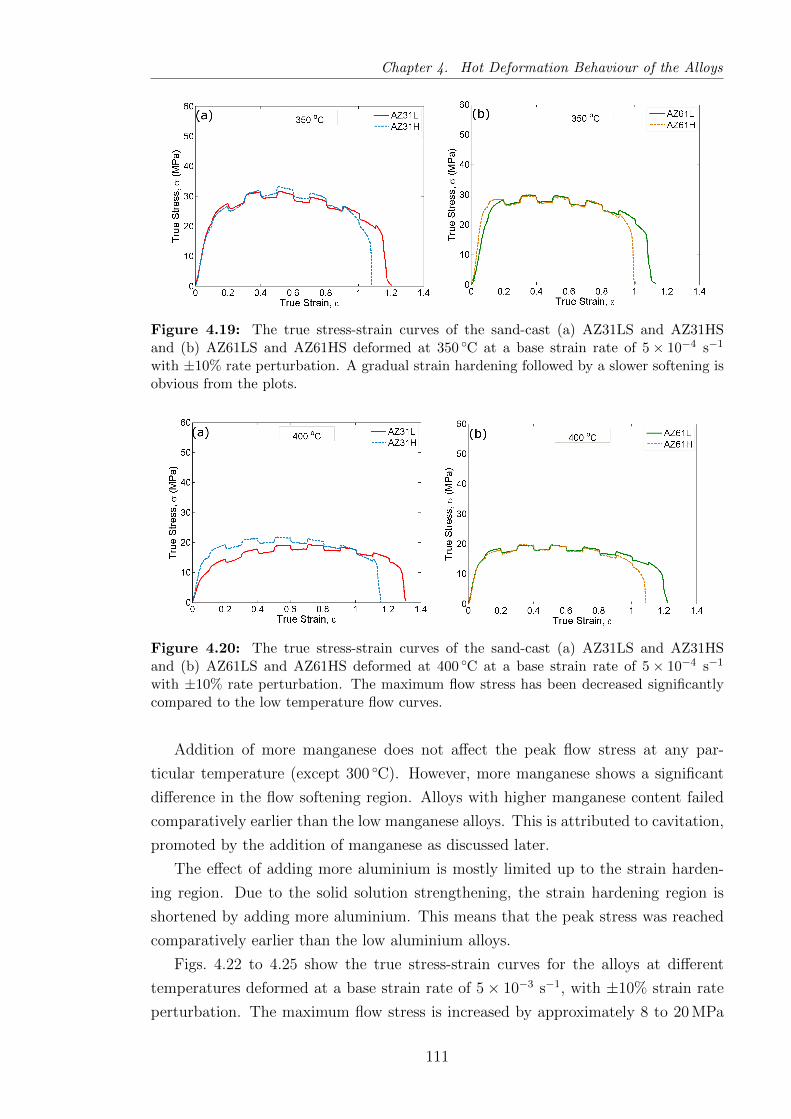
Chapter 4. Hot Deformation Behaviour of the Alloys
Figure 4.19: The true stress-strain curves of the sand-cast (a) AZ31LS and AZ31HSand (b) AZ61LS and AZ61HS deformed at 350 C at a base strain rate of 5× 10⁻⁴ s−1
with ±10% rate perturbation. A gradual strain hardening followed by a slower softening isobvious from the plots.
Figure 4.20: The true stress-strain curves of the sand-cast (a) AZ31LS and AZ31HSand (b) AZ61LS and AZ61HS deformed at 400 C at a base strain rate of 5× 10⁻⁴ s−1
with ±10% rate perturbation. The maximum flow stress has been decreased significantlycompared to the low temperature flow curves.
Addition of more manganese does not affect the peak flow stress at any par-
ticular temperature (except 300 C). However, more manganese shows a significant
difference in the flow softening region. Alloys with higher manganese content failed
comparatively earlier than the low manganese alloys. This is attributed to cavitation,
promoted by the addition of manganese as discussed later.
The effect of adding more aluminium is mostly limited up to the strain harden-
ing region. Due to the solid solution strengthening, the strain hardening region is
shortened by adding more aluminium. This means that the peak stress was reached
comparatively earlier than the low aluminium alloys.
Figs. 4.22 to 4.25 show the true stress-strain curves for the alloys at different
temperatures deformed at a base strain rate of 5× 10⁻³ s−1, with ±10% strain rate
perturbation. The maximum flow stress is increased by approximately 8 to 20 MPa
111
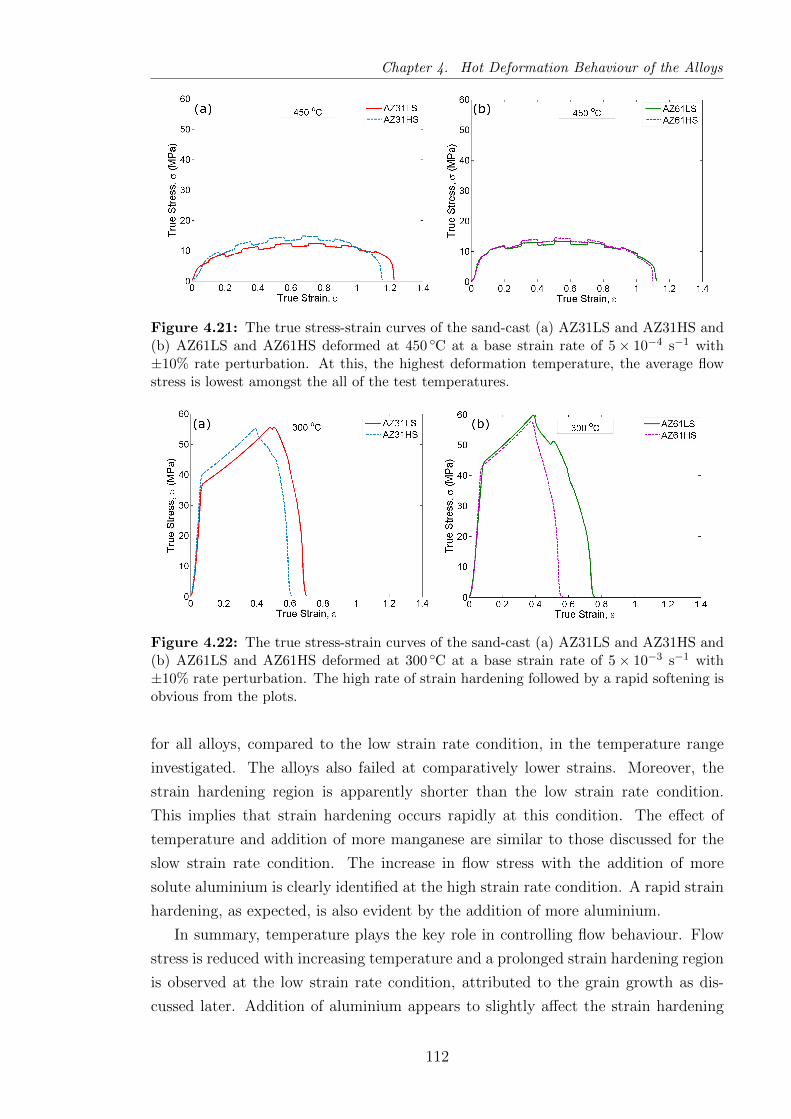
Chapter 4. Hot Deformation Behaviour of the Alloys
Figure 4.21: The true stress-strain curves of the sand-cast (a) AZ31LS and AZ31HS and(b) AZ61LS and AZ61HS deformed at 450 C at a base strain rate of 5× 10⁻⁴ s−1 with±10% rate perturbation. At this, the highest deformation temperature, the average flowstress is lowest amongst the all of the test temperatures.
Figure 4.22: The true stress-strain curves of the sand-cast (a) AZ31LS and AZ31HS and(b) AZ61LS and AZ61HS deformed at 300 C at a base strain rate of 5× 10⁻³ s−1 with±10% rate perturbation. The high rate of strain hardening followed by a rapid softening isobvious from the plots.
for all alloys, compared to the low strain rate condition, in the temperature range
investigated. The alloys also failed at comparatively lower strains. Moreover, the
strain hardening region is apparently shorter than the low strain rate condition.
This implies that strain hardening occurs rapidly at this condition. The effect of
temperature and addition of more manganese are similar to those discussed for the
slow strain rate condition. The increase in flow stress with the addition of more
solute aluminium is clearly identified at the high strain rate condition. A rapid strain
hardening, as expected, is also evident by the addition of more aluminium.
In summary, temperature plays the key role in controlling flow behaviour. Flow
stress is reduced with increasing temperature and a prolonged strain hardening region
is observed at the low strain rate condition, attributed to the grain growth as dis-
cussed later. Addition of aluminium appears to slightly affect the strain hardening
112

Chapter 4. Hot Deformation Behaviour of the Alloys
Figure 4.23: The true stress-strain curves of the sand-cast (a) AZ31LS and AZ31HS and(b) AZ61LS and AZ61HS deformed at 350 C at a base strain rate of 5× 10⁻³ s−1 with±10% rate perturbation. Maximum flow stress level was similar in all alloys.
Figure 4.24: The true stress-strain curves of the sand-cast (a) AZ31LS and AZ31HS and(b) AZ61LS and AZ61HS deformed at 400 C at a base strain rate of 5× 10⁻³ s−1 with±10% rate perturbation.
behaviour. On the other hand, the effect of manganese lies in the flow softening
region, attributed to cavitation as discussed later.
4.2.2 Mechanism of Deformation
The flow behaviour of the alloys is strongly affected by the variation of temperature
and strain rate. The effects of aluminium and manganese are small compared to
the consequence of the test conditions. The flow characteristics of the alloys can be
expressed as:
σ = f (ε, ε, T, S) (4.1)
where ε is the true strain, ε is the strain rate, T is the absolute temperature and S
is a structure parameter related to the dislocation, grain size, alloy composition, etc.
For a fixed temperature and strain rate condition, S and ε remain as the influential
113
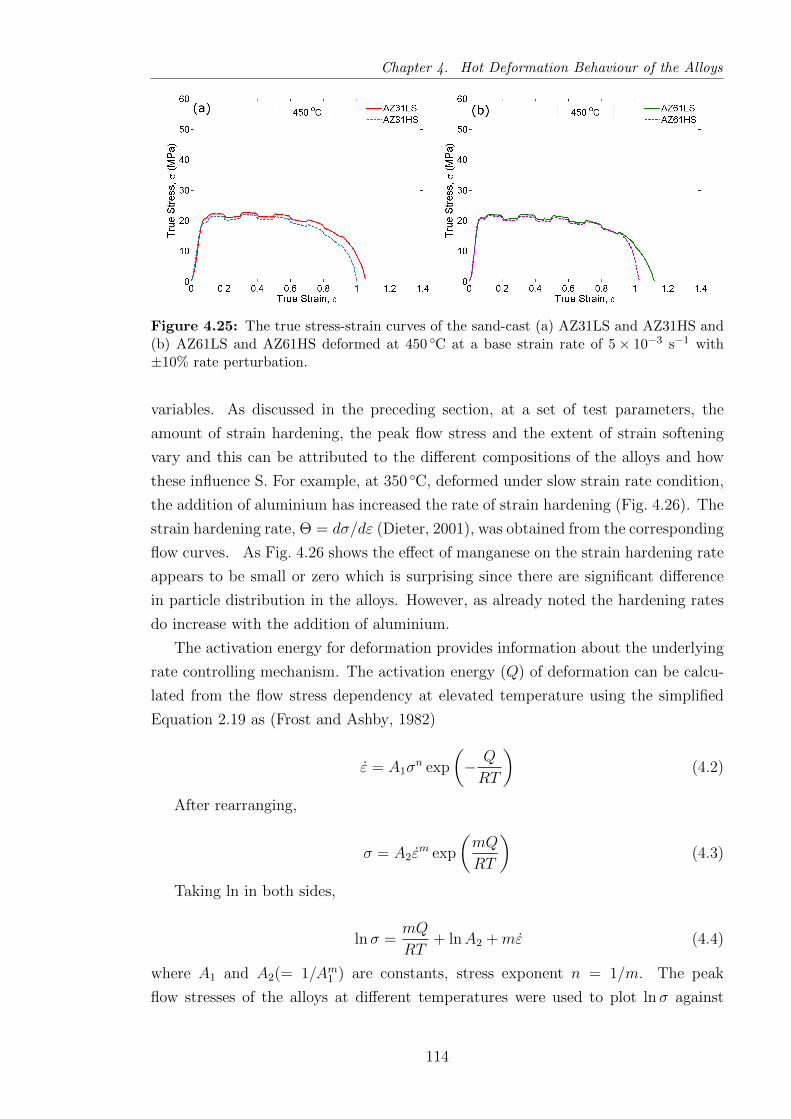
Chapter 4. Hot Deformation Behaviour of the Alloys
Figure 4.25: The true stress-strain curves of the sand-cast (a) AZ31LS and AZ31HS and(b) AZ61LS and AZ61HS deformed at 450 C at a base strain rate of 5× 10⁻³ s−1 with±10% rate perturbation.
variables. As discussed in the preceding section, at a set of test parameters, the
amount of strain hardening, the peak flow stress and the extent of strain softening
vary and this can be attributed to the different compositions of the alloys and how
these influence S. For example, at 350 C, deformed under slow strain rate condition,
the addition of aluminium has increased the rate of strain hardening (Fig. 4.26). The
strain hardening rate, Θ = dσ/dε (Dieter, 2001), was obtained from the corresponding
flow curves. As Fig. 4.26 shows the effect of manganese on the strain hardening rate
appears to be small or zero which is surprising since there are significant difference
in particle distribution in the alloys. However, as already noted the hardening rates
do increase with the addition of aluminium.
The activation energy for deformation provides information about the underlying
rate controlling mechanism. The activation energy (Q) of deformation can be calcu-
lated from the flow stress dependency at elevated temperature using the simplified
Equation 2.19 as (Frost and Ashby, 1982)
ε = A1σn exp
(− Q
RT
)(4.2)
After rearranging,
σ = A2εm exp
(mQ
RT
)(4.3)
Taking ln in both sides,
lnσ =mQ
RT+ lnA2 +mε (4.4)
where A1 and A2(= 1/Am1 ) are constants, stress exponent n = 1/m. The peak
flow stresses of the alloys at different temperatures were used to plot lnσ against
114
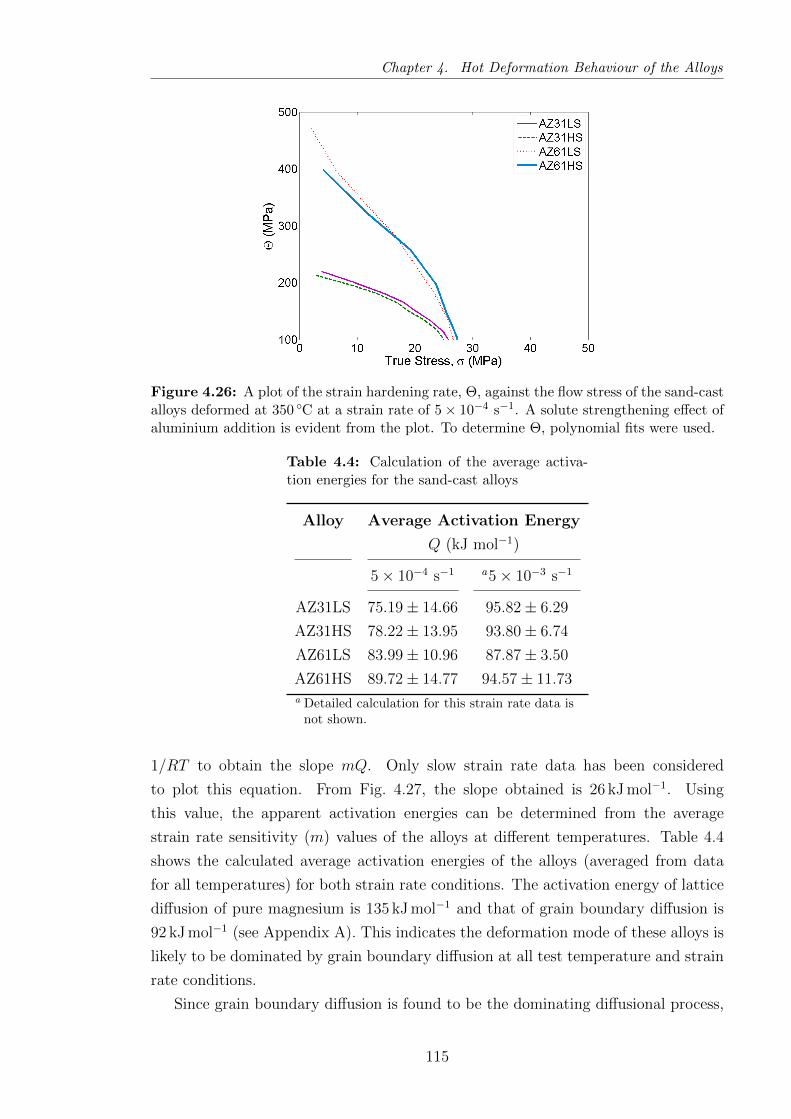
Chapter 4. Hot Deformation Behaviour of the Alloys
Figure 4.26: A plot of the strain hardening rate, Θ, against the flow stress of the sand-castalloys deformed at 350 C at a strain rate of 5× 10⁻⁴ s−1. A solute strengthening effect ofaluminium addition is evident from the plot. To determine Θ, polynomial fits were used.
Table 4.4: Calculation of the average activa-tion energies for the sand-cast alloys
Alloy Average Activation Energy
Q (kJ mol−1)
5× 10⁻⁴ s−1 a5× 10−3 s−1
AZ31LS 75.19± 14.66 95.82± 6.29
AZ31HS 78.22± 13.95 93.80± 6.74
AZ61LS 83.99± 10.96 87.87± 3.50
AZ61HS 89.72± 14.77 94.57± 11.73a Detailed calculation for this strain rate data is
not shown.
1/RT to obtain the slope mQ. Only slow strain rate data has been considered
to plot this equation. From Fig. 4.27, the slope obtained is 26 kJ mol−1. Using
this value, the apparent activation energies can be determined from the average
strain rate sensitivity (m) values of the alloys at different temperatures. Table 4.4
shows the calculated average activation energies of the alloys (averaged from data
for all temperatures) for both strain rate conditions. The activation energy of lattice
diffusion of pure magnesium is 135 kJ mol−1 and that of grain boundary diffusion is
92 kJ mol−1 (see Appendix A). This indicates the deformation mode of these alloys is
likely to be dominated by grain boundary diffusion at all test temperature and strain
rate conditions.
Since grain boundary diffusion is found to be the dominating diffusional process,
115
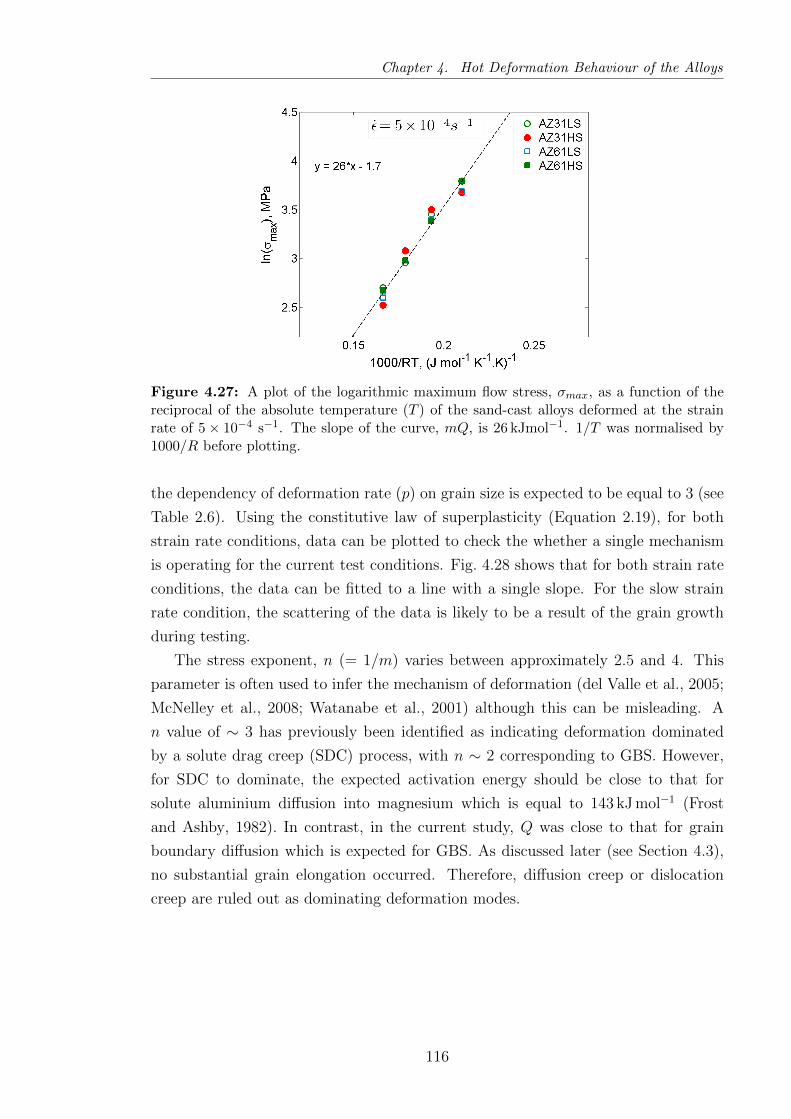
Chapter 4. Hot Deformation Behaviour of the Alloys
Figure 4.27: A plot of the logarithmic maximum flow stress, σmax, as a function of thereciprocal of the absolute temperature (T ) of the sand-cast alloys deformed at the strainrate of 5× 10⁻⁴ s−1. The slope of the curve, mQ, is 26 kJmol−1. 1/T was normalised by1000/R before plotting.
the dependency of deformation rate (p) on grain size is expected to be equal to 3 (see
Table 2.6). Using the constitutive law of superplasticity (Equation 2.19), for both
strain rate conditions, data can be plotted to check the whether a single mechanism
is operating for the current test conditions. Fig. 4.28 shows that for both strain rate
conditions, the data can be fitted to a line with a single slope. For the slow strain
rate condition, the scattering of the data is likely to be a result of the grain growth
during testing.
The stress exponent, n (= 1/m) varies between approximately 2.5 and 4. This
parameter is often used to infer the mechanism of deformation (del Valle et al., 2005;
McNelley et al., 2008; Watanabe et al., 2001) although this can be misleading. A
n value of ∼ 3 has previously been identified as indicating deformation dominated
by a solute drag creep (SDC) process, with n ∼ 2 corresponding to GBS. However,
for SDC to dominate, the expected activation energy should be close to that for
solute aluminium diffusion into magnesium which is equal to 143 kJ mol−1 (Frost
and Ashby, 1982). In contrast, in the current study, Q was close to that for grain
boundary diffusion which is expected for GBS. As discussed later (see Section 4.3),
no substantial grain elongation occurred. Therefore, diffusion creep or dislocation
creep are ruled out as dominating deformation modes.
116
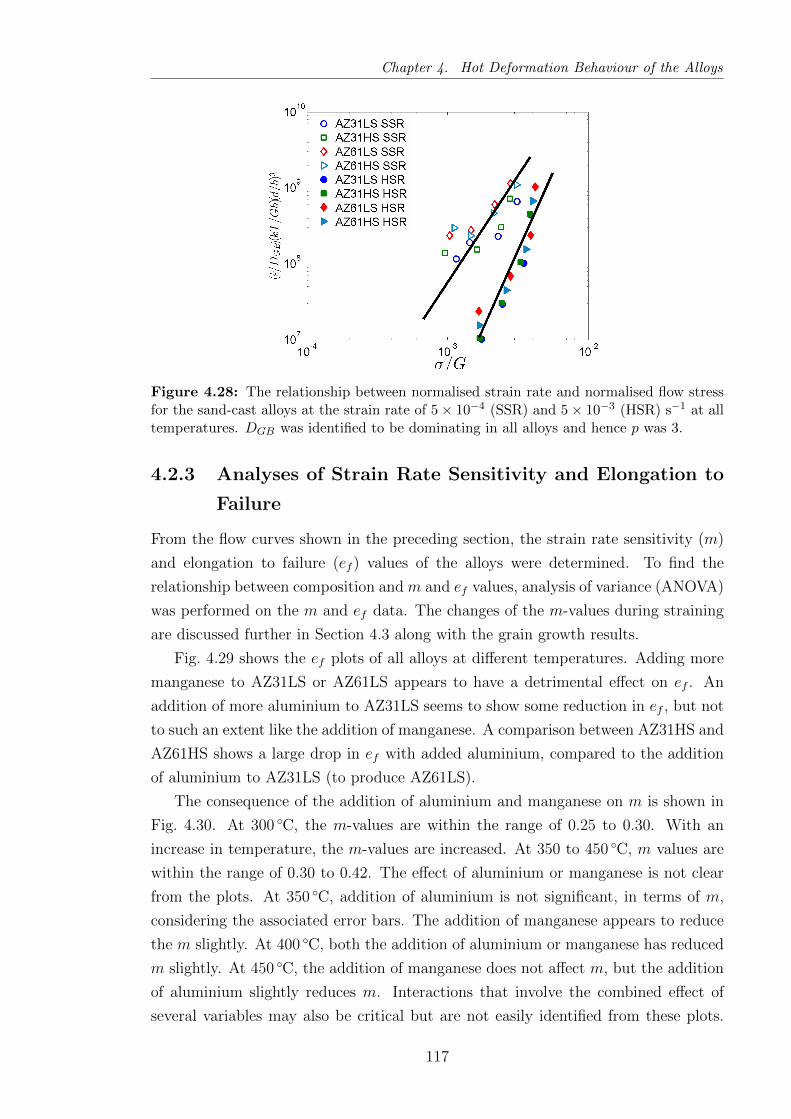
Chapter 4. Hot Deformation Behaviour of the Alloys
Figure 4.28: The relationship between normalised strain rate and normalised flow stressfor the sand-cast alloys at the strain rate of 5× 10⁻⁴ (SSR) and 5× 10⁻³ (HSR) s−1 at alltemperatures. DGB was identified to be dominating in all alloys and hence p was 3.
4.2.3 Analyses of Strain Rate Sensitivity and Elongation to
Failure
From the flow curves shown in the preceding section, the strain rate sensitivity (m)
and elongation to failure (ef ) values of the alloys were determined. To find the
relationship between composition and m and ef values, analysis of variance (ANOVA)
was performed on the m and ef data. The changes of the m-values during straining
are discussed further in Section 4.3 along with the grain growth results.
Fig. 4.29 shows the ef plots of all alloys at different temperatures. Adding more
manganese to AZ31LS or AZ61LS appears to have a detrimental effect on ef . An
addition of more aluminium to AZ31LS seems to show some reduction in ef , but not
to such an extent like the addition of manganese. A comparison between AZ31HS and
AZ61HS shows a large drop in ef with added aluminium, compared to the addition
of aluminium to AZ31LS (to produce AZ61LS).
The consequence of the addition of aluminium and manganese on m is shown in
Fig. 4.30. At 300 C, the m-values are within the range of 0.25 to 0.30. With an
increase in temperature, the m-values are increased. At 350 to 450 C, m values are
within the range of 0.30 to 0.42. The effect of aluminium or manganese is not clear
from the plots. At 350 C, addition of aluminium is not significant, in terms of m,
considering the associated error bars. The addition of manganese appears to reduce
the m slightly. At 400 C, both the addition of aluminium or manganese has reduced
m slightly. At 450 C, the addition of manganese does not affect m, but the addition
of aluminium slightly reduces m. Interactions that involve the combined effect of
several variables may also be critical but are not easily identified from these plots.
117
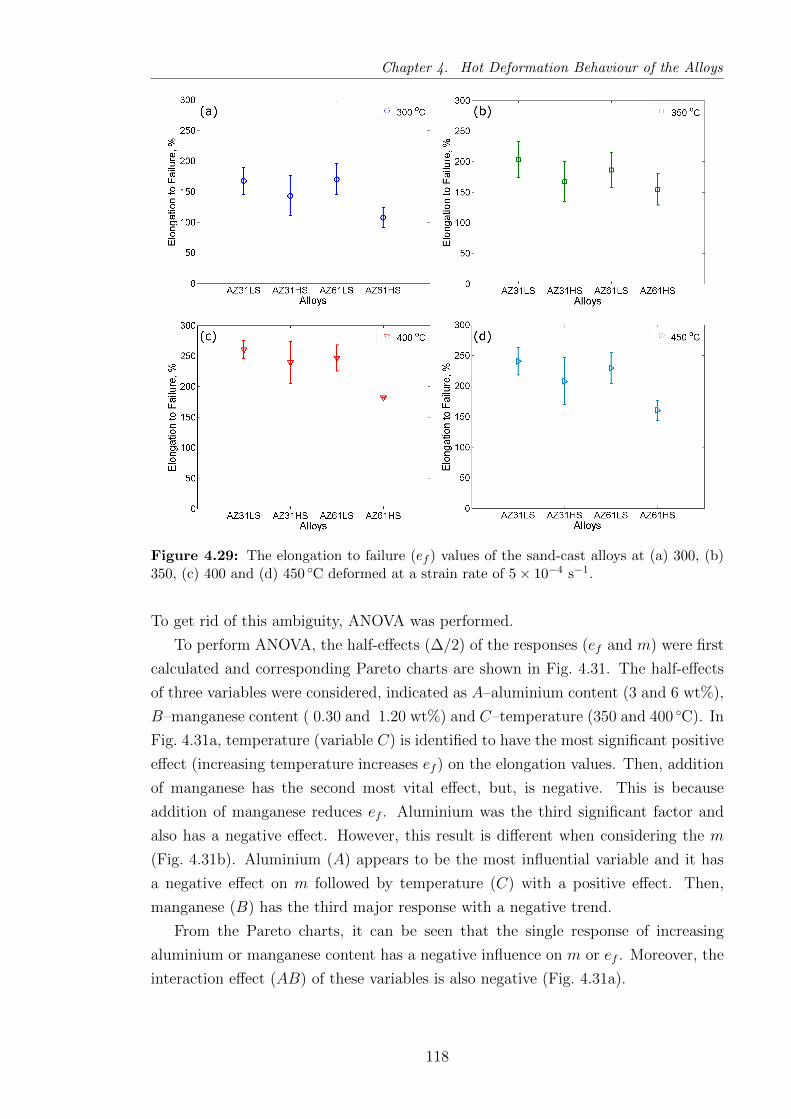
Chapter 4. Hot Deformation Behaviour of the Alloys
Figure 4.29: The elongation to failure (ef ) values of the sand-cast alloys at (a) 300, (b)350, (c) 400 and (d) 450 C deformed at a strain rate of 5× 10⁻⁴ s−1.
To get rid of this ambiguity, ANOVA was performed.
To perform ANOVA, the half-effects (∆/2) of the responses (ef and m) were first
calculated and corresponding Pareto charts are shown in Fig. 4.31. The half-effects
of three variables were considered, indicated as A–aluminium content (3 and 6 wt%),
B–manganese content ( 0.30 and 1.20 wt%) and C–temperature (350 and 400 C). In
Fig. 4.31a, temperature (variable C) is identified to have the most significant positive
effect (increasing temperature increases ef ) on the elongation values. Then, addition
of manganese has the second most vital effect, but, is negative. This is because
addition of manganese reduces ef . Aluminium was the third significant factor and
also has a negative effect. However, this result is different when considering the m
(Fig. 4.31b). Aluminium (A) appears to be the most influential variable and it has
a negative effect on m followed by temperature (C) with a positive effect. Then,
manganese (B) has the third major response with a negative trend.
From the Pareto charts, it can be seen that the single response of increasing
aluminium or manganese content has a negative influence on m or ef . Moreover, the
interaction effect (AB) of these variables is also negative (Fig. 4.31a).
118
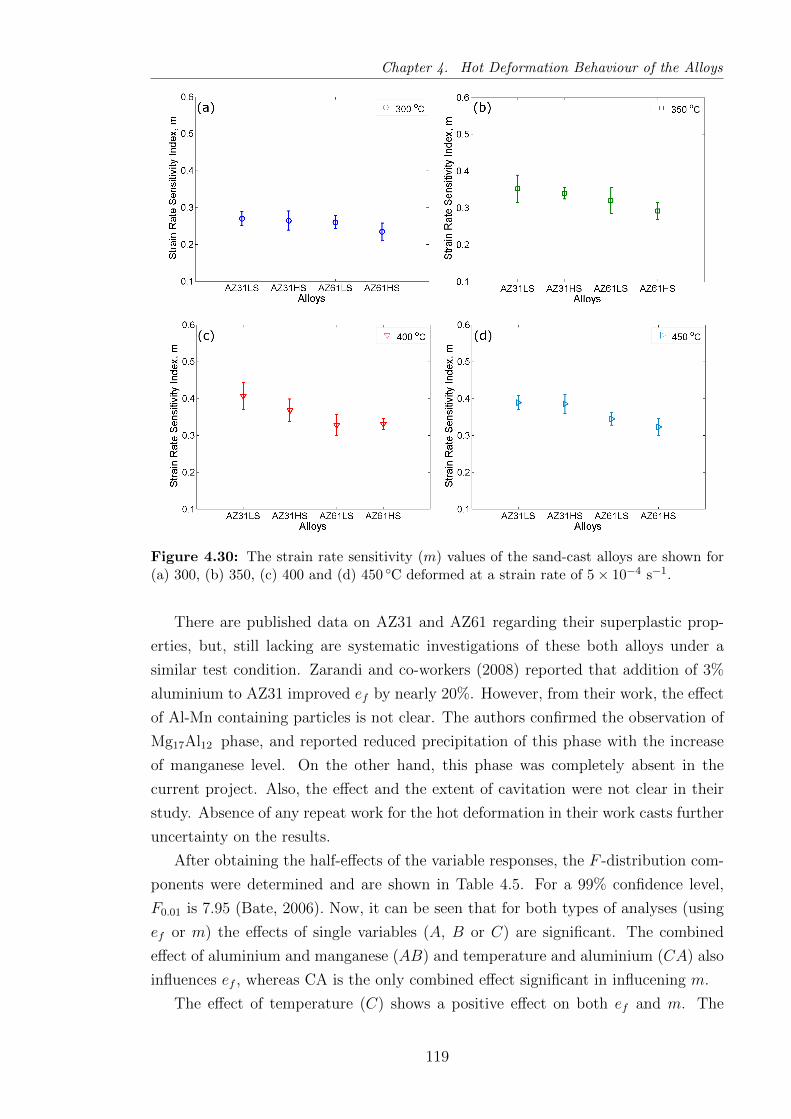
Chapter 4. Hot Deformation Behaviour of the Alloys
Figure 4.30: The strain rate sensitivity (m) values of the sand-cast alloys are shown for(a) 300, (b) 350, (c) 400 and (d) 450 C deformed at a strain rate of 5× 10⁻⁴ s−1.
There are published data on AZ31 and AZ61 regarding their superplastic prop-
erties, but, still lacking are systematic investigations of these both alloys under a
similar test condition. Zarandi and co-workers (2008) reported that addition of 3%
aluminium to AZ31 improved ef by nearly 20%. However, from their work, the effect
of Al-Mn containing particles is not clear. The authors confirmed the observation of
Mg17Al12 phase, and reported reduced precipitation of this phase with the increase
of manganese level. On the other hand, this phase was completely absent in the
current project. Also, the effect and the extent of cavitation were not clear in their
study. Absence of any repeat work for the hot deformation in their work casts further
uncertainty on the results.
After obtaining the half-effects of the variable responses, the F -distribution com-
ponents were determined and are shown in Table 4.5. For a 99% confidence level,
F0.01 is 7.95 (Bate, 2006). Now, it can be seen that for both types of analyses (using
ef or m) the effects of single variables (A, B or C) are significant. The combined
effect of aluminium and manganese (AB) and temperature and aluminium (CA) also
influences ef , whereas CA is the only combined effect significant in influcening m.
The effect of temperature (C) shows a positive effect on both ef and m. The
119

Chapter 4. Hot Deformation Behaviour of the Alloys
Figure 4.31: Pareto charts of the calculated half effects of the variables aluminium (A),manganese (B) and temperature (C) on the responses of (a) elongation to failure values(ef ) and (b) strain rate sensitivity (m) values of the sand-cast alloys. The horizontal lineson top of the bars represent a negative effect of that variable. The alloys were deformed at350 and400 C at a strain rate of 5× 10⁻⁴ s−1.
Table 4.5: Estimation of the F -distributions of the variables/responses
A B C AB BC CA
ef 65 148 296 8 3 12
S S S S NS S
m 197 63 122 5 5 33
S S S NS NS Sa S=Significant; NS=Not Significant
contribution of manganese (B) is negative on ef . This is due to the extensive
cavitation at the temperature range used here and will be discussed in details in
Chapter 5. The effect of aluminium (A) is not very significant in controlling ef ,
but is an influential factor in determining m. Increasing aluminium content has a
strong negative effect on m. As already discussed, addition of solutes increases strain
hardening rate and this may reduce m due to the effect of solute drag (Schmidt and
Miller, 1982). Recently, it was claimed that in magnesium alloys a reduction in m
depended on the mobility of solute atoms (Stanford et al., 2010). Since activation
energy for diffusion of solute aluminium into magnesium is 143 kJ mol−1 (Frost and
Ashby, 1982), any diffusion of aluminium is unlikely to be rate controlling as the
estimated Q was close to 92 kJ mol−1. Moreover, solute structures, such as solute
atmospheres and segregated solutes not attached to dislocations, have an adverse
effect on m (Picu et al., 2006). Therefore, it is probable that with an increase
of aluminium content, more segregation of solutes occurs away from the mobile
120
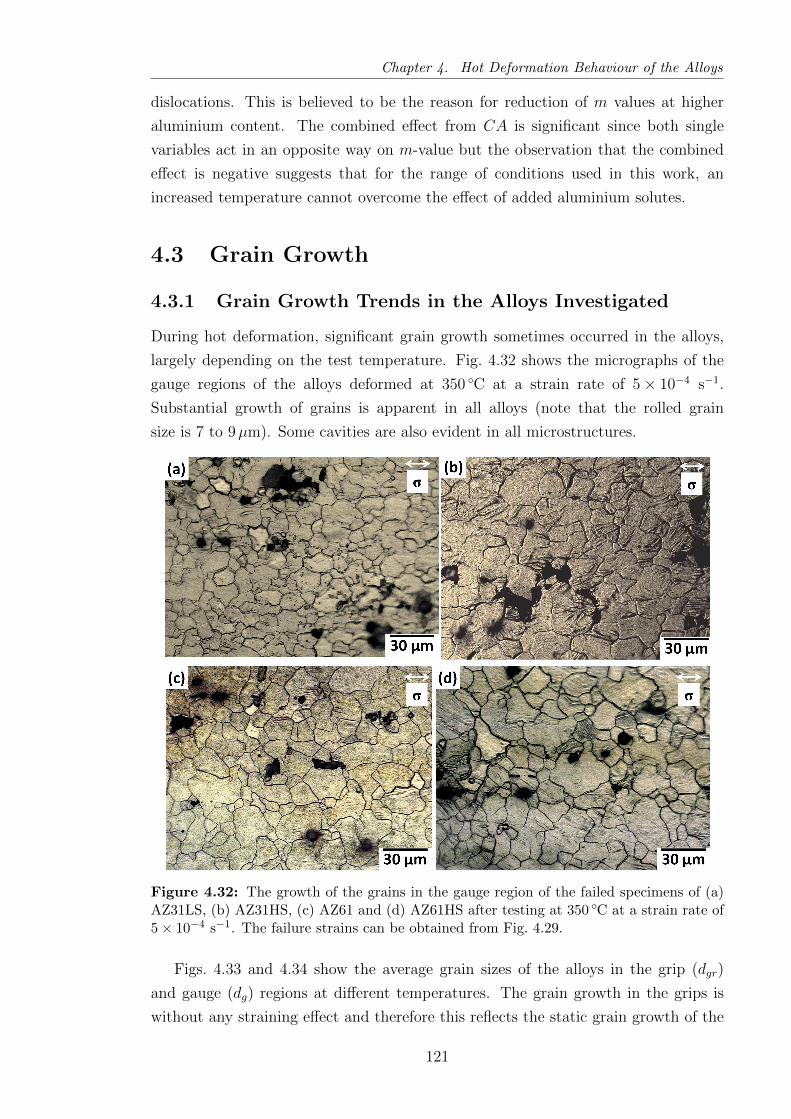
Chapter 4. Hot Deformation Behaviour of the Alloys
dislocations. This is believed to be the reason for reduction of m values at higher
aluminium content. The combined effect from CA is significant since both single
variables act in an opposite way on m-value but the observation that the combined
effect is negative suggests that for the range of conditions used in this work, an
increased temperature cannot overcome the effect of added aluminium solutes.
4.3 Grain Growth
4.3.1 Grain Growth Trends in the Alloys Investigated
During hot deformation, significant grain growth sometimes occurred in the alloys,
largely depending on the test temperature. Fig. 4.32 shows the micrographs of the
gauge regions of the alloys deformed at 350 C at a strain rate of 5× 10⁻⁴ s−1.
Substantial growth of grains is apparent in all alloys (note that the rolled grain
size is 7 to 9µm). Some cavities are also evident in all microstructures.
Figure 4.32: The growth of the grains in the gauge region of the failed specimens of (a)AZ31LS, (b) AZ31HS, (c) AZ61 and (d) AZ61HS after testing at 350 C at a strain rate of5× 10−4 s−1. The failure strains can be obtained from Fig. 4.29.
Figs. 4.33 and 4.34 show the average grain sizes of the alloys in the grip (dgr)
and gauge (dg) regions at different temperatures. The grain growth in the grips is
without any straining effect and therefore this reflects the static grain growth of the
121
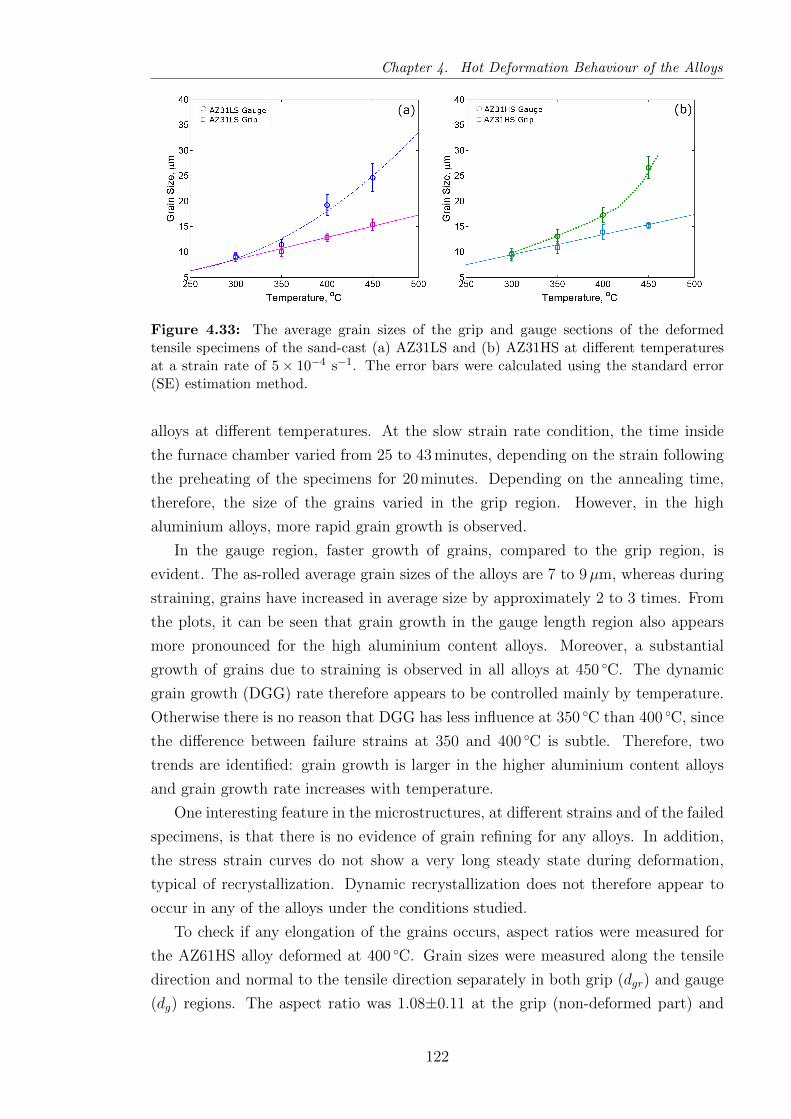
Chapter 4. Hot Deformation Behaviour of the Alloys
Figure 4.33: The average grain sizes of the grip and gauge sections of the deformedtensile specimens of the sand-cast (a) AZ31LS and (b) AZ31HS at different temperaturesat a strain rate of 5× 10⁻⁴ s−1. The error bars were calculated using the standard error(SE) estimation method.
alloys at different temperatures. At the slow strain rate condition, the time inside
the furnace chamber varied from 25 to 43 minutes, depending on the strain following
the preheating of the specimens for 20 minutes. Depending on the annealing time,
therefore, the size of the grains varied in the grip region. However, in the high
aluminium alloys, more rapid grain growth is observed.
In the gauge region, faster growth of grains, compared to the grip region, is
evident. The as-rolled average grain sizes of the alloys are 7 to 9µm, whereas during
straining, grains have increased in average size by approximately 2 to 3 times. From
the plots, it can be seen that grain growth in the gauge length region also appears
more pronounced for the high aluminium content alloys. Moreover, a substantial
growth of grains due to straining is observed in all alloys at 450 C. The dynamic
grain growth (DGG) rate therefore appears to be controlled mainly by temperature.
Otherwise there is no reason that DGG has less influence at 350 C than 400 C, since
the difference between failure strains at 350 and 400 C is subtle. Therefore, two
trends are identified: grain growth is larger in the higher aluminium content alloys
and grain growth rate increases with temperature.
One interesting feature in the microstructures, at different strains and of the failed
specimens, is that there is no evidence of grain refining for any alloys. In addition,
the stress strain curves do not show a very long steady state during deformation,
typical of recrystallization. Dynamic recrystallization does not therefore appear to
occur in any of the alloys under the conditions studied.
To check if any elongation of the grains occurs, aspect ratios were measured for
the AZ61HS alloy deformed at 400 C. Grain sizes were measured along the tensile
direction and normal to the tensile direction separately in both grip (dgr) and gauge
(dg) regions. The aspect ratio was 1.08±0.11 at the grip (non-deformed part) and
122
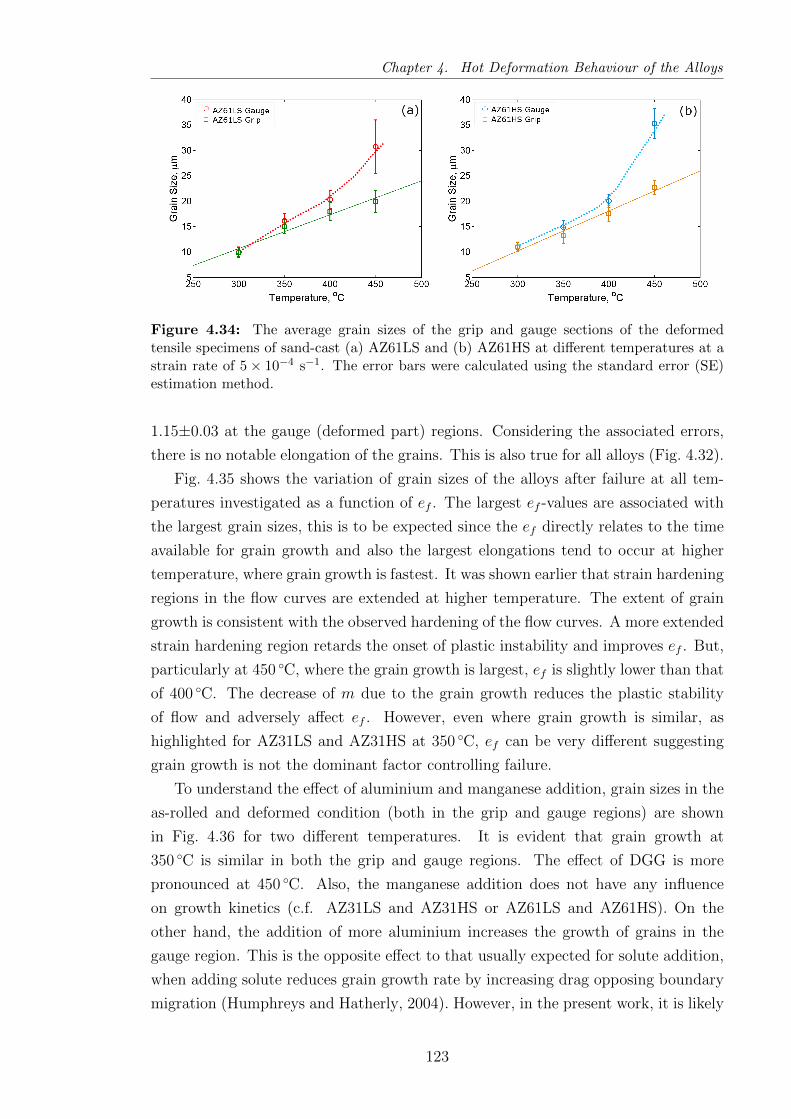
Chapter 4. Hot Deformation Behaviour of the Alloys
Figure 4.34: The average grain sizes of the grip and gauge sections of the deformedtensile specimens of sand-cast (a) AZ61LS and (b) AZ61HS at different temperatures at astrain rate of 5× 10⁻⁴ s−1. The error bars were calculated using the standard error (SE)estimation method.
1.15±0.03 at the gauge (deformed part) regions. Considering the associated errors,
there is no notable elongation of the grains. This is also true for all alloys (Fig. 4.32).
Fig. 4.35 shows the variation of grain sizes of the alloys after failure at all tem-
peratures investigated as a function of ef . The largest ef -values are associated with
the largest grain sizes, this is to be expected since the ef directly relates to the time
available for grain growth and also the largest elongations tend to occur at higher
temperature, where grain growth is fastest. It was shown earlier that strain hardening
regions in the flow curves are extended at higher temperature. The extent of grain
growth is consistent with the observed hardening of the flow curves. A more extended
strain hardening region retards the onset of plastic instability and improves ef . But,
particularly at 450 C, where the grain growth is largest, ef is slightly lower than that
of 400 C. The decrease of m due to the grain growth reduces the plastic stability
of flow and adversely affect ef . However, even where grain growth is similar, as
highlighted for AZ31LS and AZ31HS at 350 C, ef can be very different suggesting
grain growth is not the dominant factor controlling failure.
To understand the effect of aluminium and manganese addition, grain sizes in the
as-rolled and deformed condition (both in the grip and gauge regions) are shown
in Fig. 4.36 for two different temperatures. It is evident that grain growth at
350 C is similar in both the grip and gauge regions. The effect of DGG is more
pronounced at 450 C. Also, the manganese addition does not have any influence
on growth kinetics (c.f. AZ31LS and AZ31HS or AZ61LS and AZ61HS). On the
other hand, the addition of more aluminium increases the growth of grains in the
gauge region. This is the opposite effect to that usually expected for solute addition,
when adding solute reduces grain growth rate by increasing drag opposing boundary
migration (Humphreys and Hatherly, 2004). However, in the present work, it is likely
123

Chapter 4. Hot Deformation Behaviour of the Alloys
Figure 4.35: The average grain sizes in the gauge regions (dg) of sand-cast (a) AZ31LSand AZ31HS and (b) AZ61LS and AZ61HS, deformed between 300 and 450 C at a strainrate of 5× 10⁻⁴ s−1, plotted as a function of the elongation to failure (ef ) of the alloys. Adashed circle is drawn to show the growth data of AZ31LS and AZ31HS at 350 C.
Figure 4.36: Grain sizes at (a) 350 and (b) 450 C in the gauge and grip regions ofthe sand-cast alloys after superplastic testing deformed at a strain rate of 5× 10⁻⁴ s−1.As-rolled grain sizes are also included.
that all the alloys contained sufficient aluminium to saturate the solute drag effect.
The addition of extra aluminium (i.e., in AZ61LS and AZ61HS) does not provide
any extra relaxation, but accelerates grain growth in the gauge region probably as a
result of the increased flow stress with extra aluminium.
4.3.2 Variation of Strain Rate Sensitivity during Hot Defor-
mation
Strain rate sensitivity (m) depends on strain rate, temperature, concurrent grain
growth and strain hardening and softening of flow stress (Pilling and Ridley, 1989).
At a fixed temperature and strain rate condition, grain size becomes the dominating
variable.
Increasing temperature typically increases m. This is evident from Fig. 4.30
124
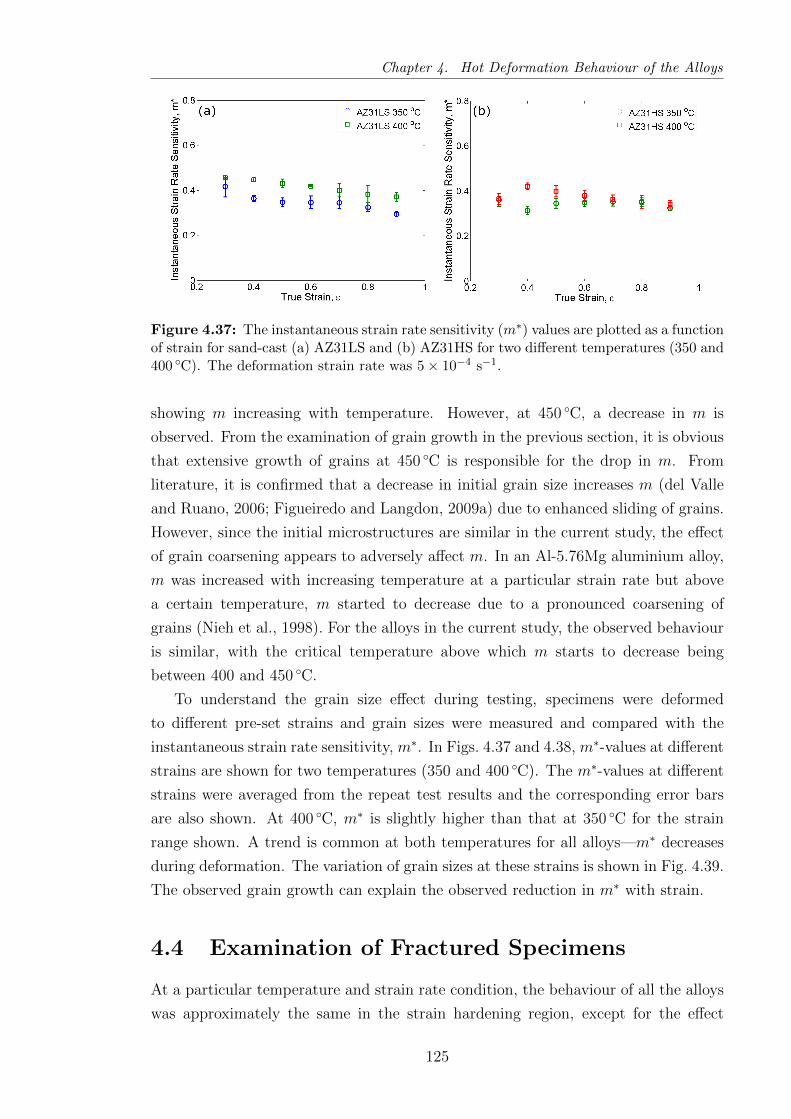
Chapter 4. Hot Deformation Behaviour of the Alloys
Figure 4.37: The instantaneous strain rate sensitivity (m∗) values are plotted as a functionof strain for sand-cast (a) AZ31LS and (b) AZ31HS for two different temperatures (350 and400 C). The deformation strain rate was 5× 10⁻⁴ s−1.
showing m increasing with temperature. However, at 450 C, a decrease in m is
observed. From the examination of grain growth in the previous section, it is obvious
that extensive growth of grains at 450 C is responsible for the drop in m. From
literature, it is confirmed that a decrease in initial grain size increases m (del Valle
and Ruano, 2006; Figueiredo and Langdon, 2009a) due to enhanced sliding of grains.
However, since the initial microstructures are similar in the current study, the effect
of grain coarsening appears to adversely affect m. In an Al-5.76Mg aluminium alloy,
m was increased with increasing temperature at a particular strain rate but above
a certain temperature, m started to decrease due to a pronounced coarsening of
grains (Nieh et al., 1998). For the alloys in the current study, the observed behaviour
is similar, with the critical temperature above which m starts to decrease being
between 400 and 450 C.
To understand the grain size effect during testing, specimens were deformed
to different pre-set strains and grain sizes were measured and compared with the
instantaneous strain rate sensitivity, m∗. In Figs. 4.37 and 4.38, m∗-values at different
strains are shown for two temperatures (350 and 400 C). The m∗-values at different
strains were averaged from the repeat test results and the corresponding error bars
are also shown. At 400 C, m∗ is slightly higher than that at 350 C for the strain
range shown. A trend is common at both temperatures for all alloys—m∗ decreases
during deformation. The variation of grain sizes at these strains is shown in Fig. 4.39.
The observed grain growth can explain the observed reduction in m∗ with strain.
4.4 Examination of Fractured Specimens
At a particular temperature and strain rate condition, the behaviour of all the alloys
was approximately the same in the strain hardening region, except for the effect
125
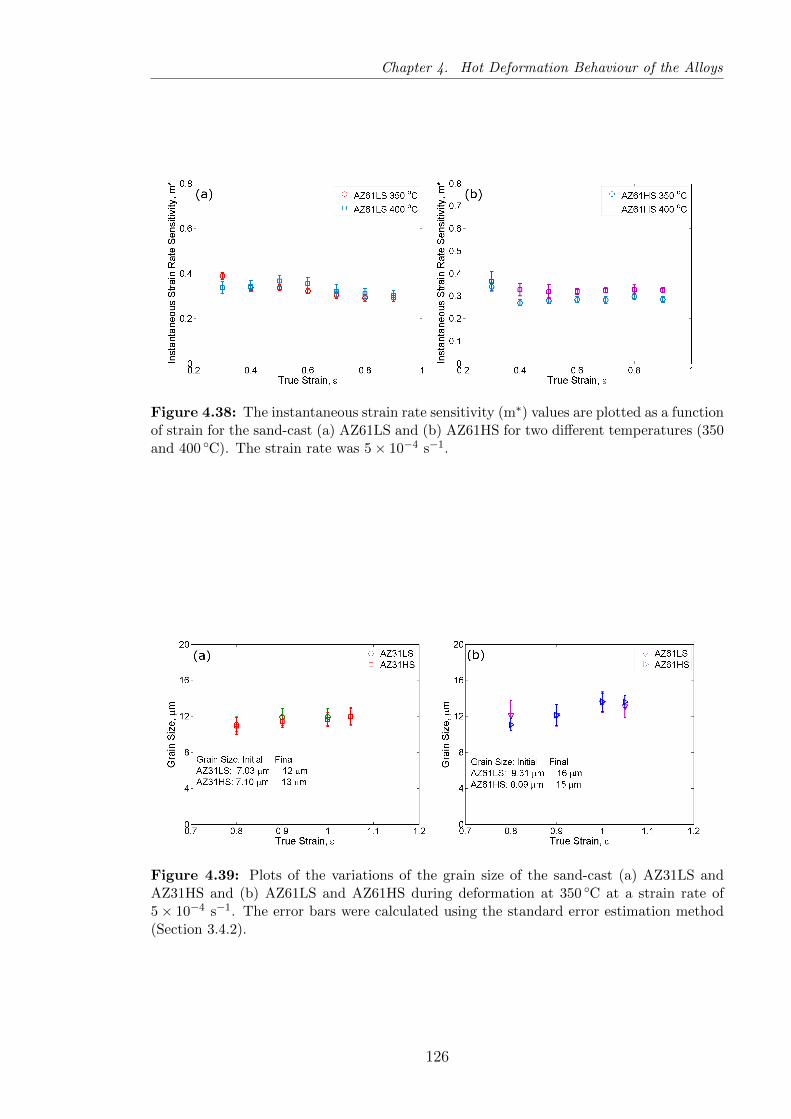
Chapter 4. Hot Deformation Behaviour of the Alloys
Figure 4.38: The instantaneous strain rate sensitivity (m∗) values are plotted as a functionof strain for the sand-cast (a) AZ61LS and (b) AZ61HS for two different temperatures (350and 400 C). The strain rate was 5× 10⁻⁴ s−1.
Figure 4.39: Plots of the variations of the grain size of the sand-cast (a) AZ31LS andAZ31HS and (b) AZ61LS and AZ61HS during deformation at 350 C at a strain rate of5× 10−4 s−1. The error bars were calculated using the standard error estimation method(Section 3.4.2).
126
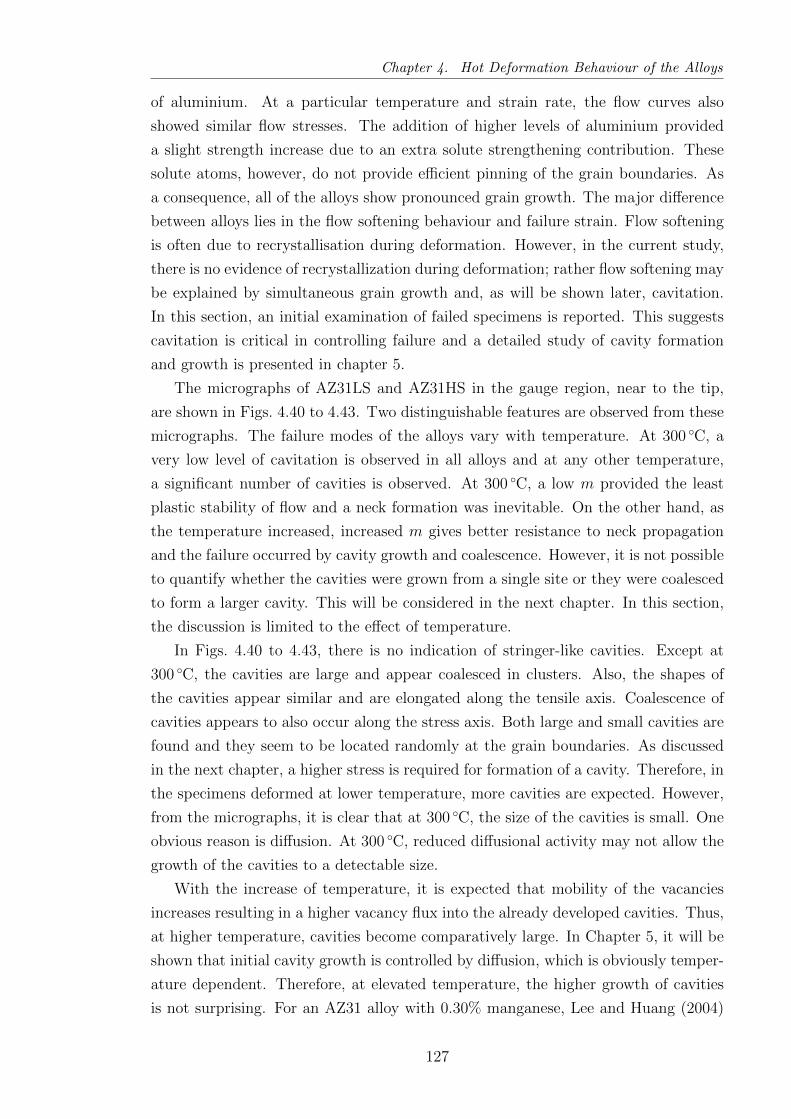
Chapter 4. Hot Deformation Behaviour of the Alloys
of aluminium. At a particular temperature and strain rate, the flow curves also
showed similar flow stresses. The addition of higher levels of aluminium provided
a slight strength increase due to an extra solute strengthening contribution. These
solute atoms, however, do not provide efficient pinning of the grain boundaries. As
a consequence, all of the alloys show pronounced grain growth. The major difference
between alloys lies in the flow softening behaviour and failure strain. Flow softening
is often due to recrystallisation during deformation. However, in the current study,
there is no evidence of recrystallization during deformation; rather flow softening may
be explained by simultaneous grain growth and, as will be shown later, cavitation.
In this section, an initial examination of failed specimens is reported. This suggests
cavitation is critical in controlling failure and a detailed study of cavity formation
and growth is presented in chapter 5.
The micrographs of AZ31LS and AZ31HS in the gauge region, near to the tip,
are shown in Figs. 4.40 to 4.43. Two distinguishable features are observed from these
micrographs. The failure modes of the alloys vary with temperature. At 300 C, a
very low level of cavitation is observed in all alloys and at any other temperature,
a significant number of cavities is observed. At 300 C, a low m provided the least
plastic stability of flow and a neck formation was inevitable. On the other hand, as
the temperature increased, increased m gives better resistance to neck propagation
and the failure occurred by cavity growth and coalescence. However, it is not possible
to quantify whether the cavities were grown from a single site or they were coalesced
to form a larger cavity. This will be considered in the next chapter. In this section,
the discussion is limited to the effect of temperature.
In Figs. 4.40 to 4.43, there is no indication of stringer-like cavities. Except at
300 C, the cavities are large and appear coalesced in clusters. Also, the shapes of
the cavities appear similar and are elongated along the tensile axis. Coalescence of
cavities appears to also occur along the stress axis. Both large and small cavities are
found and they seem to be located randomly at the grain boundaries. As discussed
in the next chapter, a higher stress is required for formation of a cavity. Therefore, in
the specimens deformed at lower temperature, more cavities are expected. However,
from the micrographs, it is clear that at 300 C, the size of the cavities is small. One
obvious reason is diffusion. At 300 C, reduced diffusional activity may not allow the
growth of the cavities to a detectable size.
With the increase of temperature, it is expected that mobility of the vacancies
increases resulting in a higher vacancy flux into the already developed cavities. Thus,
at higher temperature, cavities become comparatively large. In Chapter 5, it will be
shown that initial cavity growth is controlled by diffusion, which is obviously temper-
ature dependent. Therefore, at elevated temperature, the higher growth of cavities
is not surprising. For an AZ31 alloy with 0.30% manganese, Lee and Huang (2004)
127
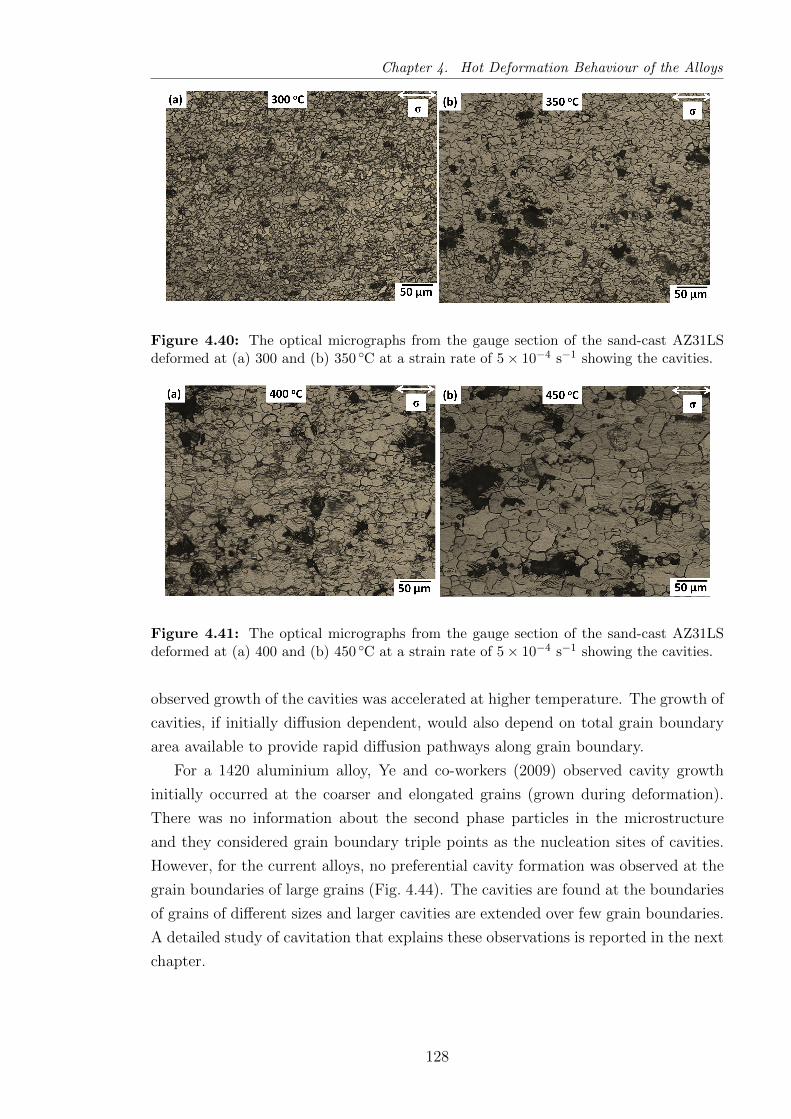
Chapter 4. Hot Deformation Behaviour of the Alloys
Figure 4.40: The optical micrographs from the gauge section of the sand-cast AZ31LSdeformed at (a) 300 and (b) 350 C at a strain rate of 5× 10⁻⁴ s−1 showing the cavities.
Figure 4.41: The optical micrographs from the gauge section of the sand-cast AZ31LSdeformed at (a) 400 and (b) 450 C at a strain rate of 5× 10⁻⁴ s−1 showing the cavities.
observed growth of the cavities was accelerated at higher temperature. The growth of
cavities, if initially diffusion dependent, would also depend on total grain boundary
area available to provide rapid diffusion pathways along grain boundary.
For a 1420 aluminium alloy, Ye and co-workers (2009) observed cavity growth
initially occurred at the coarser and elongated grains (grown during deformation).
There was no information about the second phase particles in the microstructure
and they considered grain boundary triple points as the nucleation sites of cavities.
However, for the current alloys, no preferential cavity formation was observed at the
grain boundaries of large grains (Fig. 4.44). The cavities are found at the boundaries
of grains of different sizes and larger cavities are extended over few grain boundaries.
A detailed study of cavitation that explains these observations is reported in the next
chapter.
128
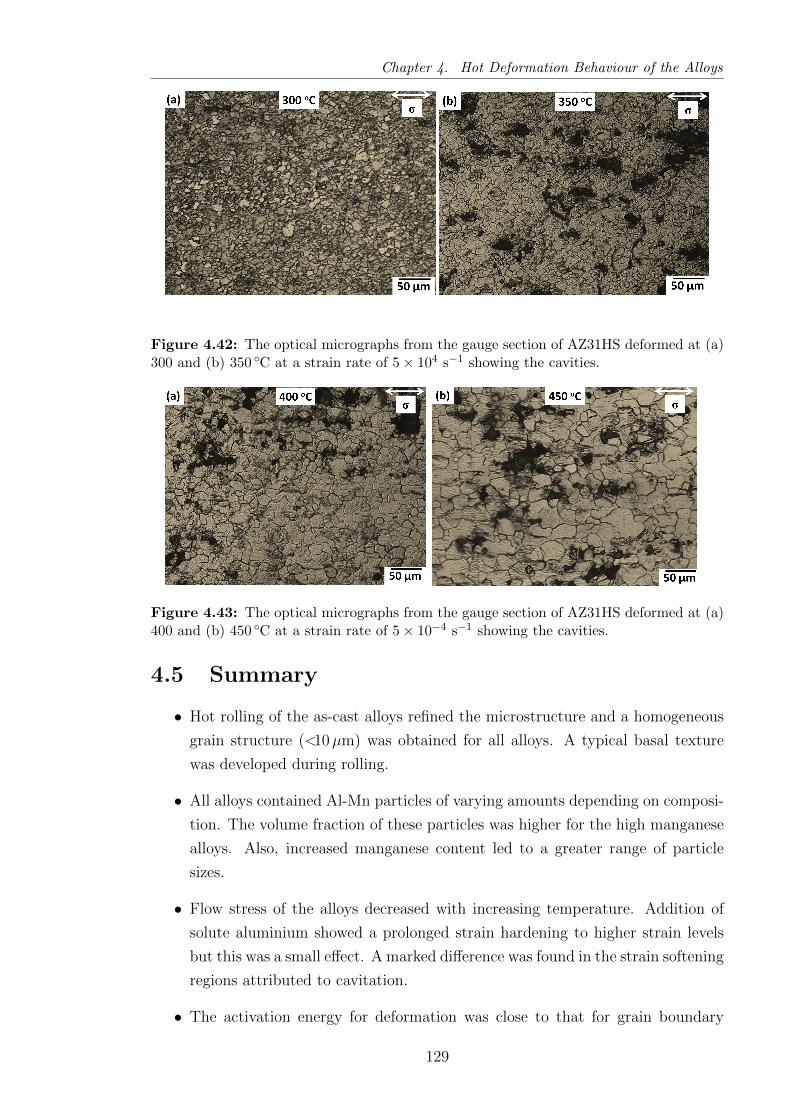
Chapter 4. Hot Deformation Behaviour of the Alloys
Figure 4.42: The optical micrographs from the gauge section of AZ31HS deformed at (a)300 and (b) 350 C at a strain rate of 5× 10⁴ s−1 showing the cavities.
Figure 4.43: The optical micrographs from the gauge section of AZ31HS deformed at (a)400 and (b) 450 C at a strain rate of 5× 10⁻⁴ s−1 showing the cavities.
4.5 Summary
• Hot rolling of the as-cast alloys refined the microstructure and a homogeneous
grain structure (<10µm) was obtained for all alloys. A typical basal texture
was developed during rolling.
• All alloys contained Al-Mn particles of varying amounts depending on composi-
tion. The volume fraction of these particles was higher for the high manganese
alloys. Also, increased manganese content led to a greater range of particle
sizes.
• Flow stress of the alloys decreased with increasing temperature. Addition of
solute aluminium showed a prolonged strain hardening to higher strain levels
but this was a small effect. A marked difference was found in the strain softening
regions attributed to cavitation.
• The activation energy for deformation was close to that for grain boundary
129
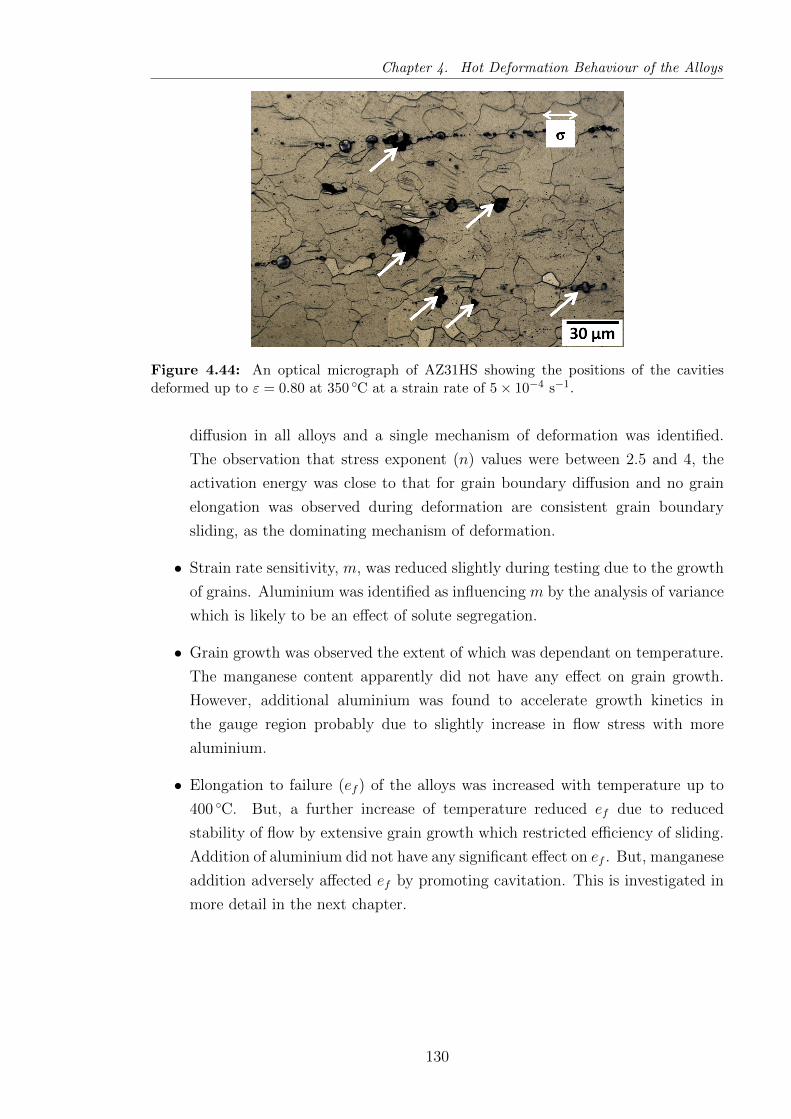
Chapter 4. Hot Deformation Behaviour of the Alloys
Figure 4.44: An optical micrograph of AZ31HS showing the positions of the cavitiesdeformed up to ε = 0.80 at 350 C at a strain rate of 5× 10⁻⁴ s−1.
diffusion in all alloys and a single mechanism of deformation was identified.
The observation that stress exponent (n) values were between 2.5 and 4, the
activation energy was close to that for grain boundary diffusion and no grain
elongation was observed during deformation are consistent grain boundary
sliding, as the dominating mechanism of deformation.
• Strain rate sensitivity, m, was reduced slightly during testing due to the growth
of grains. Aluminium was identified as influencing m by the analysis of variance
which is likely to be an effect of solute segregation.
• Grain growth was observed the extent of which was dependant on temperature.
The manganese content apparently did not have any effect on grain growth.
However, additional aluminium was found to accelerate growth kinetics in
the gauge region probably due to slightly increase in flow stress with more
aluminium.
• Elongation to failure (ef ) of the alloys was increased with temperature up to
400 C. But, a further increase of temperature reduced ef due to reduced
stability of flow by extensive grain growth which restricted efficiency of sliding.
Addition of aluminium did not have any significant effect on ef . But, manganese
addition adversely affected ef by promoting cavitation. This is investigated in
more detail in the next chapter.
130
Chapter 5
Cavity Controlled Failure
Mechanism
In the preceding chapter, it was concluded that the failure of the alloys occurred
predominantly, except at 300 C, by the formation of cavities. Cavitation leads to
flow softening of the alloys during deformation. At different temperatures, different
fractions of cavities were observed. Variation in particle content was identified as the
major difference among the alloys in terms of cavity formation. At 350 C, cavita-
tion was observed as the dominant failure mode and dynamic grain growth (DGG)
occurred to a similar extent in all alloys. Consequently, the former remained as an
explanation for differences in behaviour. Therefore, a detailed study on cavitation
was performed at this temperature at a constant strain rate of 5 × 10⁻⁴ s−1 on the
chill-cast alloys having similar compositions to the sand-cast alloys. The alloys were
deformed to pre-set strains of 0.80 to 1.05 and a study of cavitation was carried
out using optical, scanning electron microscopy (SEM) and X-ray micro-tomography
(µCT). This chapter focuses on the cavity formation sites, growth mechanisms of
cavities and factors promoting cavitation.
5.1 Cavity Formation Sites
Cavity formation sites were investigated qualitatively and quantitatively. In this
section, a qualitative description of the observed cavity formation is presented.
SEM images of AZ61HC, deformed to different pre-set strains—ranging from 0.80
to 1.05—at 350 C under a constant strain rate of 5 × 10⁻⁴ s−1 are shown in Fig.
5.1. These micrographs show the development of the cavities in the gauge regions,
in the unetched SEM images, close to the failed surface. Several characteristics
are common at all strains. There are some single cavities which appear close to the
particles (marked A). However, a similar number of isolated cavities is observed which
131
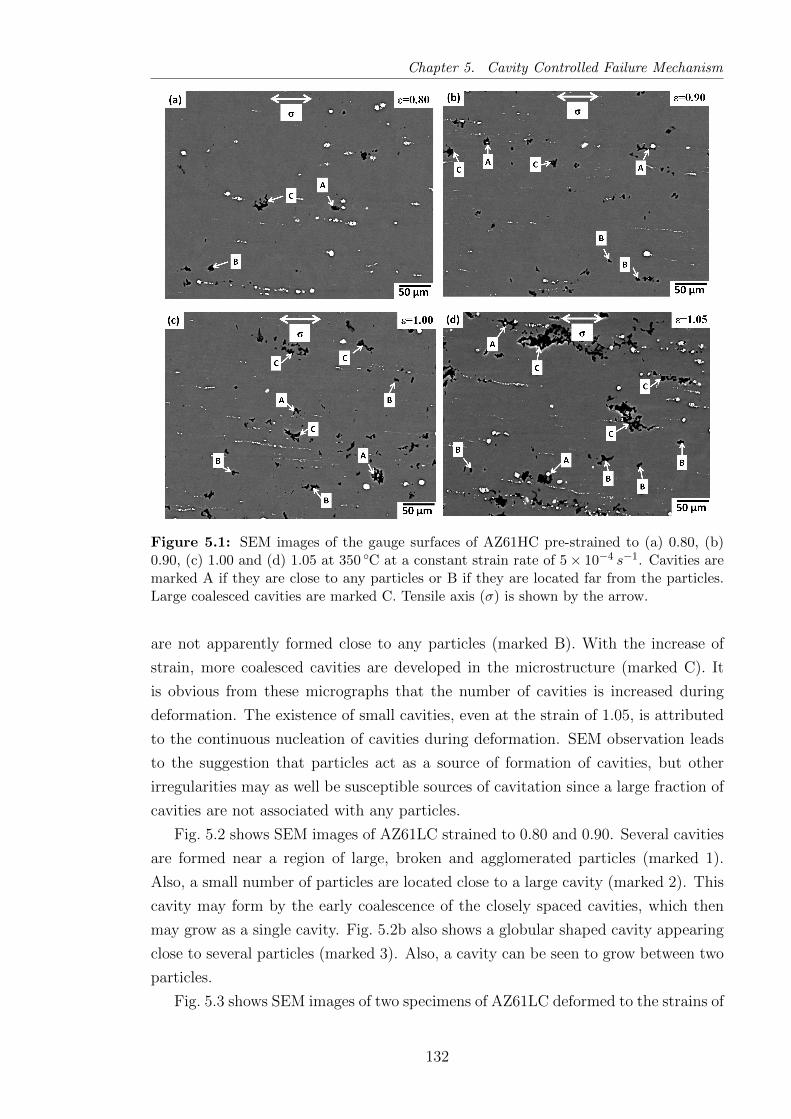
Chapter 5. Cavity Controlled Failure Mechanism
Figure 5.1: SEM images of the gauge surfaces of AZ61HC pre-strained to (a) 0.80, (b)0.90, (c) 1.00 and (d) 1.05 at 350 C at a constant strain rate of 5× 10⁻⁴ s−1. Cavities aremarked A if they are close to any particles or B if they are located far from the particles.Large coalesced cavities are marked C. Tensile axis (σ) is shown by the arrow.
are not apparently formed close to any particles (marked B). With the increase of
strain, more coalesced cavities are developed in the microstructure (marked C). It
is obvious from these micrographs that the number of cavities is increased during
deformation. The existence of small cavities, even at the strain of 1.05, is attributed
to the continuous nucleation of cavities during deformation. SEM observation leads
to the suggestion that particles act as a source of formation of cavities, but other
irregularities may as well be susceptible sources of cavitation since a large fraction of
cavities are not associated with any particles.
Fig. 5.2 shows SEM images of AZ61LC strained to 0.80 and 0.90. Several cavities
are formed near a region of large, broken and agglomerated particles (marked 1).
Also, a small number of particles are located close to a large cavity (marked 2). This
cavity may form by the early coalescence of the closely spaced cavities, which then
may grow as a single cavity. Fig. 5.2b also shows a globular shaped cavity appearing
close to several particles (marked 3). Also, a cavity can be seen to grow between two
particles.
Fig. 5.3 shows SEM images of two specimens of AZ61LC deformed to the strains of
132
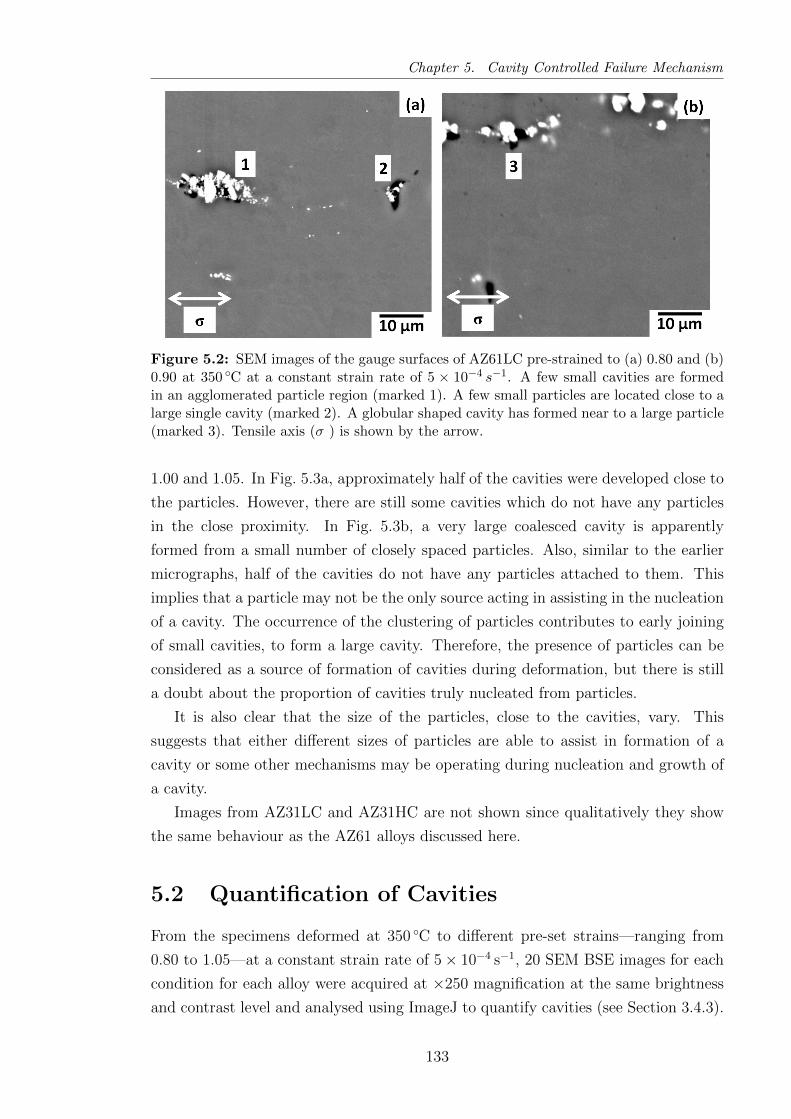
Chapter 5. Cavity Controlled Failure Mechanism
Figure 5.2: SEM images of the gauge surfaces of AZ61LC pre-strained to (a) 0.80 and (b)0.90 at 350 C at a constant strain rate of 5 × 10⁻⁴ s−1. A few small cavities are formedin an agglomerated particle region (marked 1). A few small particles are located close to alarge single cavity (marked 2). A globular shaped cavity has formed near to a large particle(marked 3). Tensile axis (σ ) is shown by the arrow.
1.00 and 1.05. In Fig. 5.3a, approximately half of the cavities were developed close to
the particles. However, there are still some cavities which do not have any particles
in the close proximity. In Fig. 5.3b, a very large coalesced cavity is apparently
formed from a small number of closely spaced particles. Also, similar to the earlier
micrographs, half of the cavities do not have any particles attached to them. This
implies that a particle may not be the only source acting in assisting in the nucleation
of a cavity. The occurrence of the clustering of particles contributes to early joining
of small cavities, to form a large cavity. Therefore, the presence of particles can be
considered as a source of formation of cavities during deformation, but there is still
a doubt about the proportion of cavities truly nucleated from particles.
It is also clear that the size of the particles, close to the cavities, vary. This
suggests that either different sizes of particles are able to assist in formation of a
cavity or some other mechanisms may be operating during nucleation and growth of
a cavity.
Images from AZ31LC and AZ31HC are not shown since qualitatively they show
the same behaviour as the AZ61 alloys discussed here.
5.2 Quantification of Cavities
From the specimens deformed at 350 C to different pre-set strains—ranging from
0.80 to 1.05—at a constant strain rate of 5× 10⁻⁴ s−1, 20 SEM BSE images for each
condition for each alloy were acquired at ×250 magnification at the same brightness
and contrast level and analysed using ImageJ to quantify cavities (see Section 3.4.3).
133
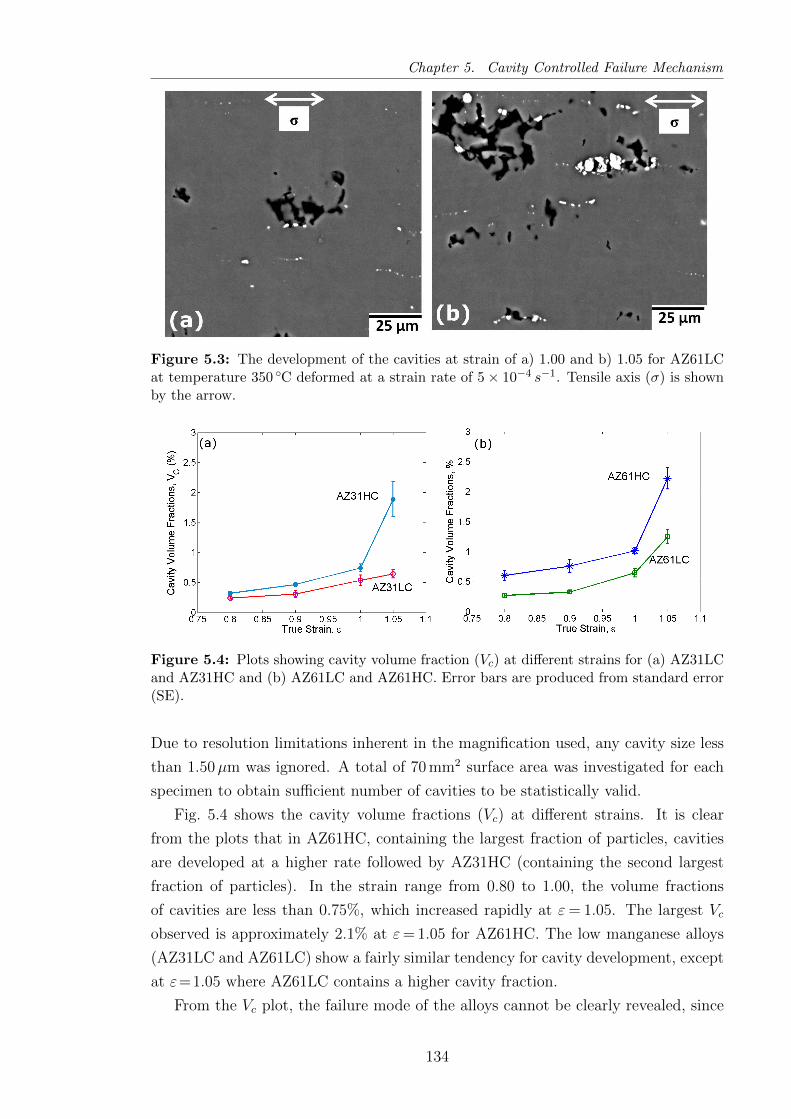
Chapter 5. Cavity Controlled Failure Mechanism
Figure 5.3: The development of the cavities at strain of a) 1.00 and b) 1.05 for AZ61LCat temperature 350 C deformed at a strain rate of 5× 10⁻⁴ s−1. Tensile axis (σ) is shownby the arrow.
Figure 5.4: Plots showing cavity volume fraction (Vc) at different strains for (a) AZ31LCand AZ31HC and (b) AZ61LC and AZ61HC. Error bars are produced from standard error(SE).
Due to resolution limitations inherent in the magnification used, any cavity size less
than 1.50µm was ignored. A total of 70 mm2 surface area was investigated for each
specimen to obtain sufficient number of cavities to be statistically valid.
Fig. 5.4 shows the cavity volume fractions (Vc) at different strains. It is clear
from the plots that in AZ61HC, containing the largest fraction of particles, cavities
are developed at a higher rate followed by AZ31HC (containing the second largest
fraction of particles). In the strain range from 0.80 to 1.00, the volume fractions
of cavities are less than 0.75%, which increased rapidly at ε= 1.05. The largest Vc
observed is approximately 2.1% at ε= 1.05 for AZ61HC. The low manganese alloys
(AZ31LC and AZ61LC) show a fairly similar tendency for cavity development, except
at ε=1.05 where AZ61LC contains a higher cavity fraction.
From the Vc plot, the failure mode of the alloys cannot be clearly revealed, since
134

Chapter 5. Cavity Controlled Failure Mechanism
Figure 5.5: Plots of probability distribution functions of cavity diameter (dcav) of AZ31LCat different strains of (a) 0.80 and 0.90 and (b) 1.00 and 1.05 deformed at 350 C at a strainrate of 5× 10⁻⁴ s−1. Normalised fraction of number of cavities are also included.
the cavity volume fractions appear to be low, even at ε=1.05. But, it is also apparent
that after ε=1.00, the rate of cavity growth is increased substantially and very rapid
coalescence of cavities has taken place. The coalescence of the cavities eventually
leads to the failure of the material even after a small further increment in strain.
Also, the distribution of cavities is not uniform throughout the gauge section. More
cavities were observed near to the fracture surface.
The cavity size distributions are shown in Figs. 5.5 to 5.8. At ε= 0.80, AZ31LC
has most of its cavities in the range 3 to 7µm (Fig. 5.5) and further deformation shifts
the peak slightly to a larger size. An important feature of the plotted distributions
is that at all strains (except 0.80) there are a small number of cavities which have
grown extensively (>20µm). The number of these larger cavities is increased with
straining. With the exception of a few larger cavities, the cavitation trend in this
alloy is similar at all strains. The major difference is observed in the 5 to 10µm size
range and at the 25 to 40µm size range. Approximately 70 to 72% of the cavities are
less than 5µm at all strains and 5 to 7% of the total cavities belong to a size greater
than 10µm.
In AZ31HC (Fig. 5.6), most cavities are in the size range 3 to 8µm up to a strain
of 1.00, but many cavities have considerably increased in size at ε= 1.05. A small
number of cavities have grown extensively up to 30µm at all strain levels with more
coalesced cavities at strains of 1.00 and 1.05. The peak is shifted by few microns to
the larger size end with increasing strain. The major difference between this alloy
and the low manganese variant (AZ31LC) lies in the number of the cavities. The
higher manganese variant, having a comparatively higher number of particles, has
formed more cavities. Also, the sizes of the cavities vary over a wider range than in
AZ31LC.
In AZ61LC (Fig. 5.7), most cavities were found within the range 3 to 6µm at
ε = 0.80, and during deformation the size is increased. Cavities are approximately
135
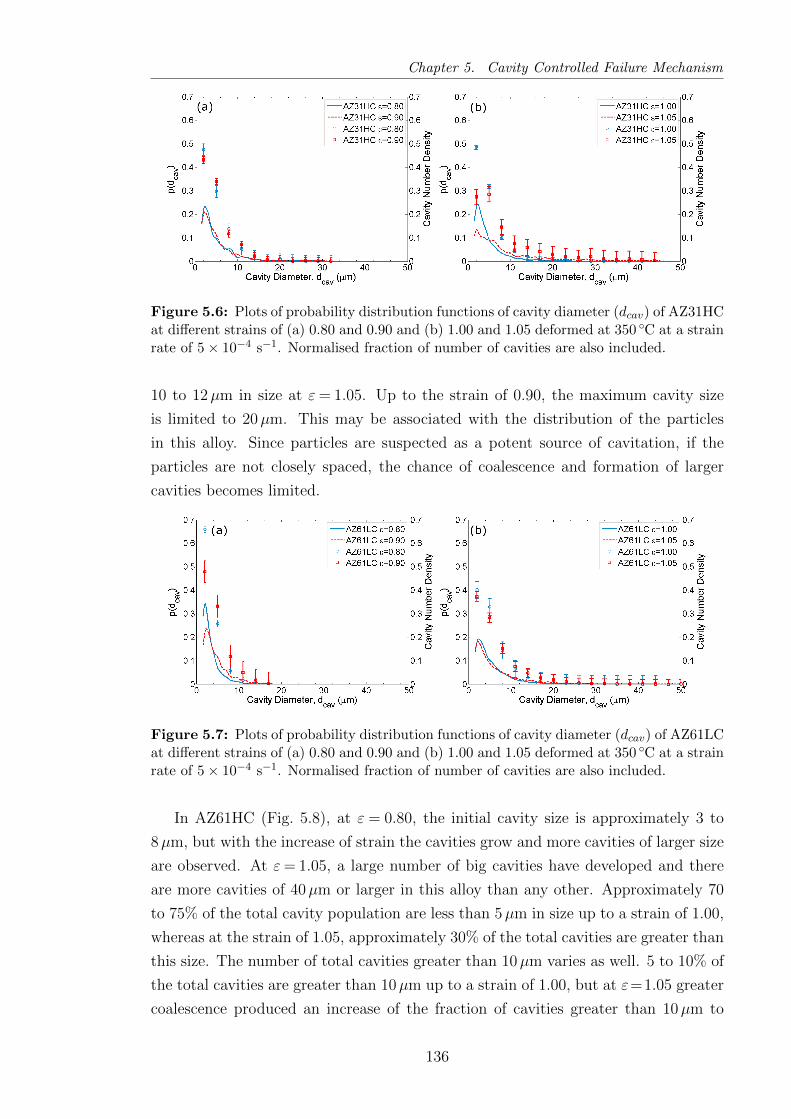
Chapter 5. Cavity Controlled Failure Mechanism
Figure 5.6: Plots of probability distribution functions of cavity diameter (dcav) of AZ31HCat different strains of (a) 0.80 and 0.90 and (b) 1.00 and 1.05 deformed at 350 C at a strainrate of 5× 10⁻⁴ s−1. Normalised fraction of number of cavities are also included.
10 to 12µm in size at ε= 1.05. Up to the strain of 0.90, the maximum cavity size
is limited to 20µm. This may be associated with the distribution of the particles
in this alloy. Since particles are suspected as a potent source of cavitation, if the
particles are not closely spaced, the chance of coalescence and formation of larger
cavities becomes limited.
Figure 5.7: Plots of probability distribution functions of cavity diameter (dcav) of AZ61LCat different strains of (a) 0.80 and 0.90 and (b) 1.00 and 1.05 deformed at 350 C at a strainrate of 5× 10⁻⁴ s−1. Normalised fraction of number of cavities are also included.
In AZ61HC (Fig. 5.8), at ε = 0.80, the initial cavity size is approximately 3 to
8µm, but with the increase of strain the cavities grow and more cavities of larger size
are observed. At ε= 1.05, a large number of big cavities have developed and there
are more cavities of 40µm or larger in this alloy than any other. Approximately 70
to 75% of the total cavity population are less than 5µm in size up to a strain of 1.00,
whereas at the strain of 1.05, approximately 30% of the total cavities are greater than
this size. The number of total cavities greater than 10µm varies as well. 5 to 10% of
the total cavities are greater than 10µm up to a strain of 1.00, but at ε=1.05 greater
coalescence produced an increase of the fraction of cavities greater than 10µm to
136
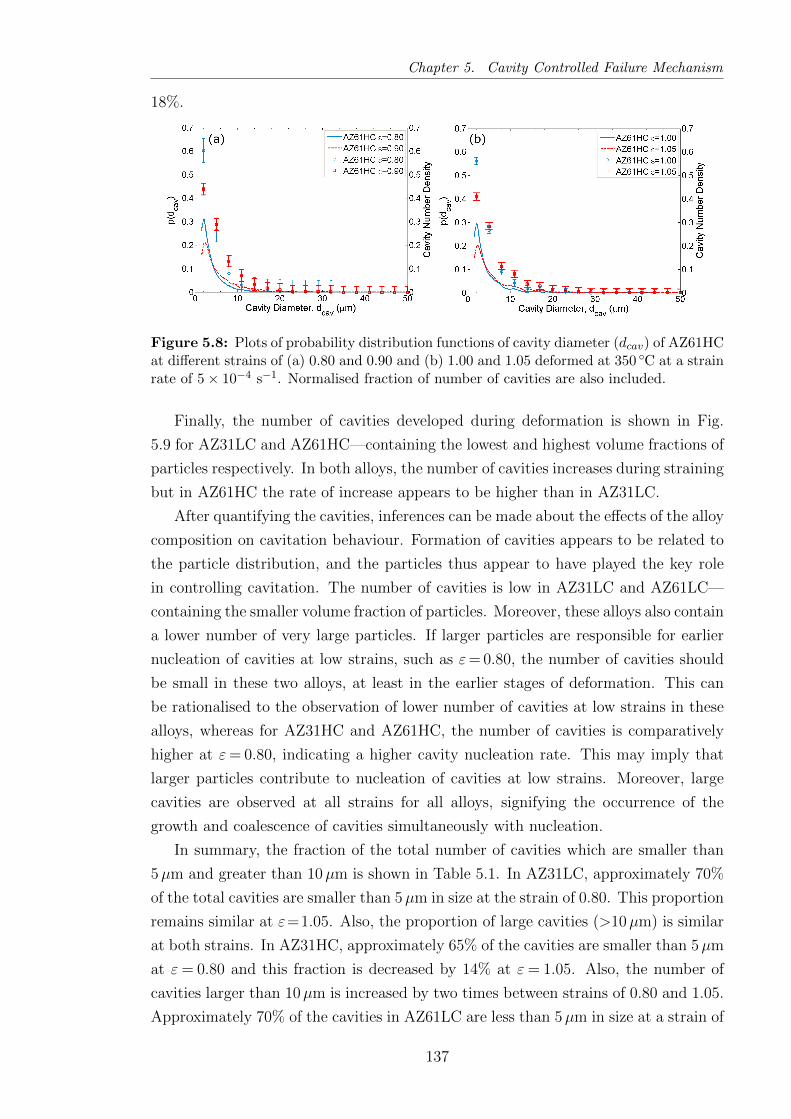
Chapter 5. Cavity Controlled Failure Mechanism
18%.
Figure 5.8: Plots of probability distribution functions of cavity diameter (dcav) of AZ61HCat different strains of (a) 0.80 and 0.90 and (b) 1.00 and 1.05 deformed at 350 C at a strainrate of 5× 10⁻⁴ s−1. Normalised fraction of number of cavities are also included.
Finally, the number of cavities developed during deformation is shown in Fig.
5.9 for AZ31LC and AZ61HC—containing the lowest and highest volume fractions of
particles respectively. In both alloys, the number of cavities increases during straining
but in AZ61HC the rate of increase appears to be higher than in AZ31LC.
After quantifying the cavities, inferences can be made about the effects of the alloy
composition on cavitation behaviour. Formation of cavities appears to be related to
the particle distribution, and the particles thus appear to have played the key role
in controlling cavitation. The number of cavities is low in AZ31LC and AZ61LC—
containing the smaller volume fraction of particles. Moreover, these alloys also contain
a lower number of very large particles. If larger particles are responsible for earlier
nucleation of cavities at low strains, such as ε= 0.80, the number of cavities should
be small in these two alloys, at least in the earlier stages of deformation. This can
be rationalised to the observation of lower number of cavities at low strains in these
alloys, whereas for AZ31HC and AZ61HC, the number of cavities is comparatively
higher at ε= 0.80, indicating a higher cavity nucleation rate. This may imply that
larger particles contribute to nucleation of cavities at low strains. Moreover, large
cavities are observed at all strains for all alloys, signifying the occurrence of the
growth and coalescence of cavities simultaneously with nucleation.
In summary, the fraction of the total number of cavities which are smaller than
5µm and greater than 10µm is shown in Table 5.1. In AZ31LC, approximately 70%
of the total cavities are smaller than 5µm in size at the strain of 0.80. This proportion
remains similar at ε=1.05. Also, the proportion of large cavities (>10µm) is similar
at both strains. In AZ31HC, approximately 65% of the cavities are smaller than 5µm
at ε= 0.80 and this fraction is decreased by 14% at ε= 1.05. Also, the number of
cavities larger than 10µm is increased by two times between strains of 0.80 and 1.05.
Approximately 70% of the cavities in AZ61LC are less than 5µm in size at a strain of
137

Chapter 5. Cavity Controlled Failure Mechanism
Figure 5.9: A plot showing the comparison of the total number of cavities at differentstrains for AZ31LC and AZ61HC deformed at 350 C at a strain rate of 5× 10⁻⁴ s−1, theleast and highest particle containing alloys respectively.
Table 5.1: A comparison chart for the fraction (percentage) of the number of cavities fordifferent size ranges for all alloys
ε = 0.80 ε = 1.05
Strain <5 µm >10 µm <5 µm >10 µm
AZ31LC 72.99 5.39 71.12 5.98
AZ31HC 64.05 8.18 50.74 15.42
AZ61LC 67.13 5.59 53.56 12.72
AZ61HC 77.63 4.65 57.33 17.76
0.80, whereas approximately half of the total cavities belong to that size range at the
higher strain (1.05). The number of cavities larger than 10µm has doubled during
deformation. AZ61HC contains highest proportion of the total cavity number (78%)
at a size below 5µm at ε=0.80. Also, at ε=1.05, approximately 60% of the cavities
are less than 5µm. Except AZ31LC, the similarity in the fractions of cavities with a
size >10µm size for all alloys suggests that a single cavity growth mechanism may
be operating in all cases. In AZ31LC, it is apparent that the extent of growth is low
which is attributed to the smaller volume fraction of particles in this alloy, since a
presence of small volume fraction of particles means particles are less closely spaced
and the chance of coalescence of cavities becomes low.
138

Chapter 5. Cavity Controlled Failure Mechanism
Figure 5.10: a) A 2D surface view of a random area of the 3D volume of AZ61HC deformedto a strain of 1.05 at 350 C at a strain rate of 5× 10⁻⁴ s−1. A, B and C cavity regionsare not connected with any particle. b) But, if the view is transformed into a 3D view byextending the depth of the surface, particles are found attached to the cavity regions of Aand B. C is still observed to be not associated with any particle.
5.3 Determination of Particle-cavity Association
by X-ray Tomography
In the SEM micrographs, approximately half of the cavities observed cannot clearly
be associated with any particles. This type of traditional 2D observation can however
lead to misleading identification of the cavity formation sites. A cavity may appear
without any connection with a particle, but in reality it may have a close neighbour-
hood with a particle beneath the surface. To understand the cavitation behaviour
and determine the true formation sites, X-ray micro-tomography (µCT) was carried
out for the specimens deformed to different pre-set strains—ranging from 0.80 to 1.05.
The ambiguity of the particle/cavity association in a 2D section, shown in Figs.
5.1 to 5.3, can be illustrated with the aid of tomography by creating an imaginary
2D surface in the 3D volume of a specimen. Fig. 5.10 shows a single 2D orthoslice
(the black background) drawn at the back of a random volume-rendered section of
AZ61HC deformed to a strain of 1.05. Three cavities (marked A, B and C) do not
appear to have any association with particles (Fig. 5.10a), resembling the observation
made in the SEM. However, if the orthoslice is moved through the volume thickness
direction, A and B cavity regions can clearly be seen to be associated with particles
(Fig. 5.10b). However, cavity region C is still not attached to any particle. If the
orthoslice is moved further in the thickness direction (not shown), then this region
is also found to be associated with a particle region. Therefore, a 2D study alone,
such as that performed in the SEM, may lead to an incorrect conclusion being drawn
about the particle/cavity correlation.
139
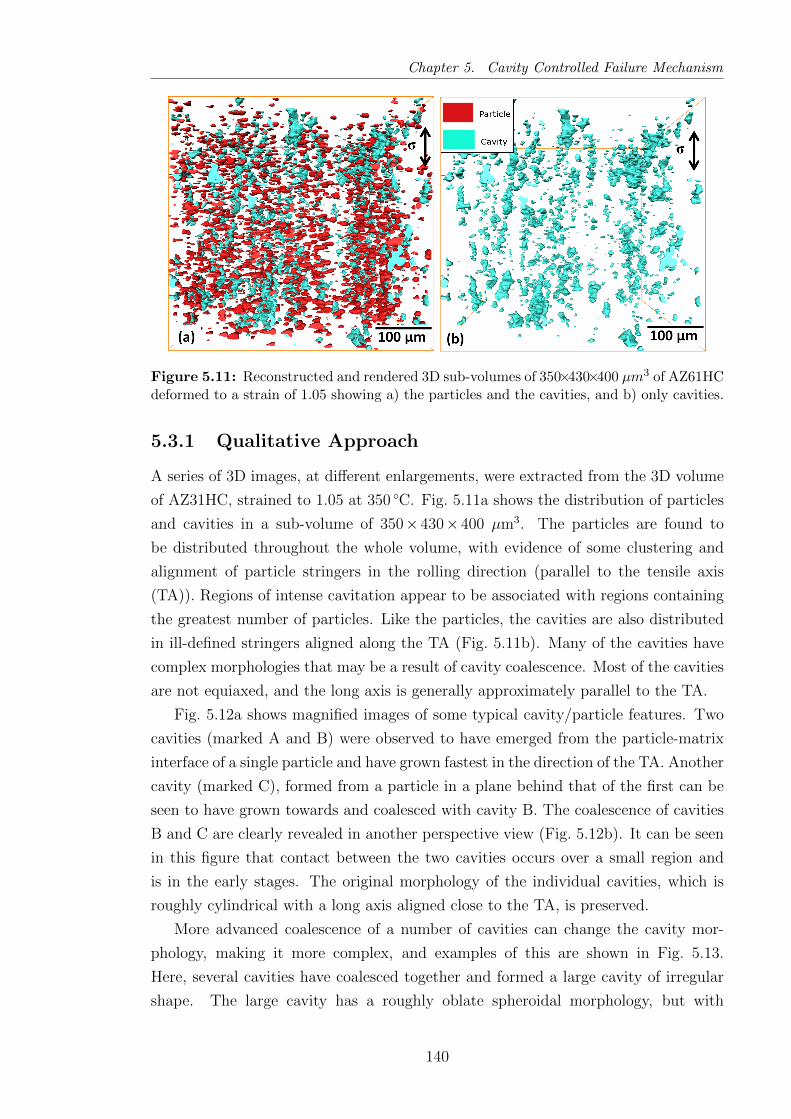
Chapter 5. Cavity Controlled Failure Mechanism
Figure 5.11: Reconstructed and rendered 3D sub-volumes of 350×430×400 µm3 of AZ61HCdeformed to a strain of 1.05 showing a) the particles and the cavities, and b) only cavities.
5.3.1 Qualitative Approach
A series of 3D images, at different enlargements, were extracted from the 3D volume
of AZ31HC, strained to 1.05 at 350 C. Fig. 5.11a shows the distribution of particles
and cavities in a sub-volume of 350×430×400 µm3. The particles are found to
be distributed throughout the whole volume, with evidence of some clustering and
alignment of particle stringers in the rolling direction (parallel to the tensile axis
(TA)). Regions of intense cavitation appear to be associated with regions containing
the greatest number of particles. Like the particles, the cavities are also distributed
in ill-defined stringers aligned along the TA (Fig. 5.11b). Many of the cavities have
complex morphologies that may be a result of cavity coalescence. Most of the cavities
are not equiaxed, and the long axis is generally approximately parallel to the TA.
Fig. 5.12a shows magnified images of some typical cavity/particle features. Two
cavities (marked A and B) were observed to have emerged from the particle-matrix
interface of a single particle and have grown fastest in the direction of the TA. Another
cavity (marked C), formed from a particle in a plane behind that of the first can be
seen to have grown towards and coalesced with cavity B. The coalescence of cavities
B and C are clearly revealed in another perspective view (Fig. 5.12b). It can be seen
in this figure that contact between the two cavities occurs over a small region and
is in the early stages. The original morphology of the individual cavities, which is
roughly cylindrical with a long axis aligned close to the TA, is preserved.
More advanced coalescence of a number of cavities can change the cavity mor-
phology, making it more complex, and examples of this are shown in Fig. 5.13.
Here, several cavities have coalesced together and formed a large cavity of irregular
shape. The large cavity has a roughly oblate spheroidal morphology, but with
140
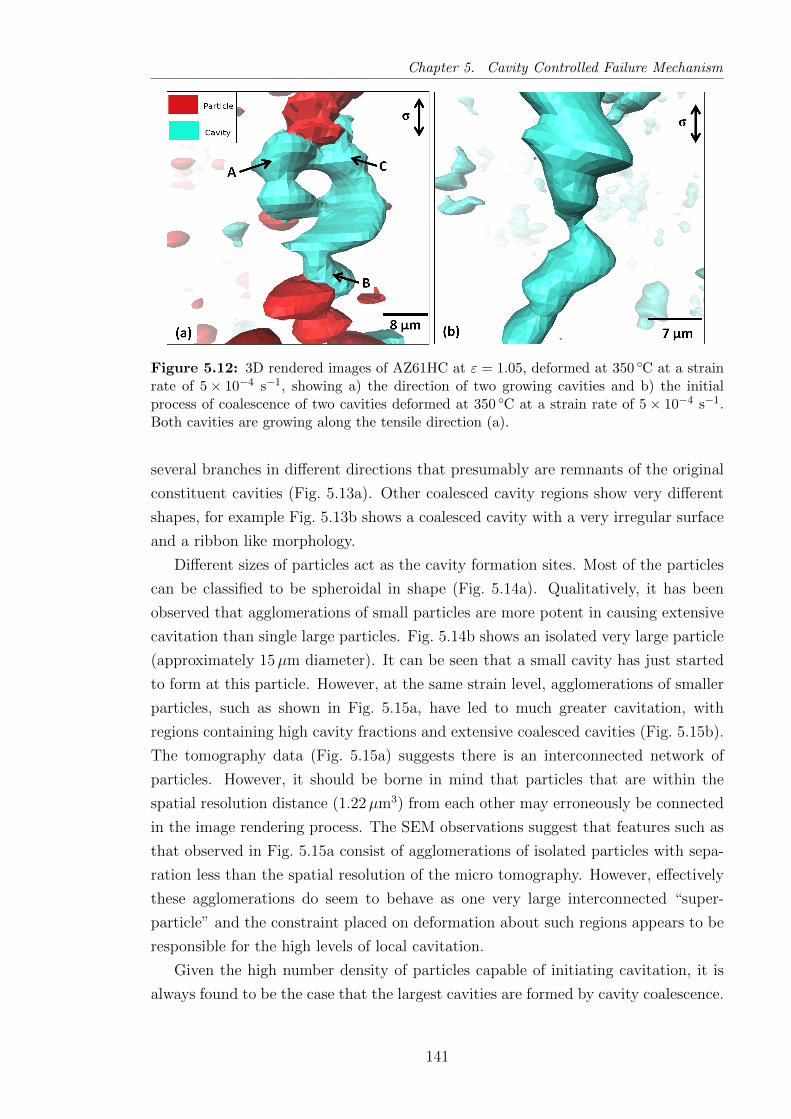
Chapter 5. Cavity Controlled Failure Mechanism
Figure 5.12: 3D rendered images of AZ61HC at ε = 1.05, deformed at 350 C at a strainrate of 5× 10⁻⁴ s−1, showing a) the direction of two growing cavities and b) the initialprocess of coalescence of two cavities deformed at 350 C at a strain rate of 5× 10⁻⁴ s−1.Both cavities are growing along the tensile direction (a).
several branches in different directions that presumably are remnants of the original
constituent cavities (Fig. 5.13a). Other coalesced cavity regions show very different
shapes, for example Fig. 5.13b shows a coalesced cavity with a very irregular surface
and a ribbon like morphology.
Different sizes of particles act as the cavity formation sites. Most of the particles
can be classified to be spheroidal in shape (Fig. 5.14a). Qualitatively, it has been
observed that agglomerations of small particles are more potent in causing extensive
cavitation than single large particles. Fig. 5.14b shows an isolated very large particle
(approximately 15µm diameter). It can be seen that a small cavity has just started
to form at this particle. However, at the same strain level, agglomerations of smaller
particles, such as shown in Fig. 5.15a, have led to much greater cavitation, with
regions containing high cavity fractions and extensive coalesced cavities (Fig. 5.15b).
The tomography data (Fig. 5.15a) suggests there is an interconnected network of
particles. However, it should be borne in mind that particles that are within the
spatial resolution distance (1.22µm3) from each other may erroneously be connected
in the image rendering process. The SEM observations suggest that features such as
that observed in Fig. 5.15a consist of agglomerations of isolated particles with sepa-
ration less than the spatial resolution of the micro tomography. However, effectively
these agglomerations do seem to behave as one very large interconnected “super-
particle” and the constraint placed on deformation about such regions appears to be
responsible for the high levels of local cavitation.
Given the high number density of particles capable of initiating cavitation, it is
always found to be the case that the largest cavities are formed by cavity coalescence.
141

Chapter 5. Cavity Controlled Failure Mechanism
Figure 5.13: The complex shapes of the cavities of AZ61HC, deformed to a strain of1.05 at 350 C at a strain rate of 5× 10⁻⁴ s−1, are shown. a) The large cavity is formedby the coalescence of smaller cavities and the large cavity has some branches in differentdirections. b) The coalesced cavity has a ribbon like morphology.
Figure 5.14: a) The shapes of the particles of AZ61HC at ε = 1.05, deformed at 350 C at astrain rate of 5× 10⁻⁴ s−1, are approximately spherical. b) A large particle of approximately15µm in diameter has nucleated a small cavity.
142

Chapter 5. Cavity Controlled Failure Mechanism
Figure 5.15: 3D rendered images of AZ61HC at ε = 1.05, deformed at 350 C at a strainrate of 5× 10⁻⁴ s−1, showing a) the agglomeration effect on particles and b) the effectof agglomeration on cavitation. The closely-spaced particles appear connected due to theresolution limits of the tomography. These particles nucleated closely-spaced cavities whichcoalesced at low strains, forming a large cavity.
Cavity shape tends to evolve as the cavities grow. The smallest cavities are approxi-
mately spherical in shape, consistent with a diffusion controlled growth mechanism.
Larger cavities tends to become elongated in the direction of the TA, indicative
of plasticity controlled growth. The largest cavities have complex morphologies
associated with coalescence as already discussed.
Particle/cavity contact area at the interface varies depending on the position of
cavity formation with respect to the TA. If the cavity forms in a region of parti-
cle/matrix interface perpendicular to the tensile stress direction, then the cavity is
formed from a small region in the interface and grows without an increase in contact
with the corresponding particle (Fig. 5.16a). On the other hand, if the interface is
broken almost along the tensile stress direction, then the newly formed cavity grows
keeping a close contact with the particle, and with an increase in particle/cavity
contact area (Fig. 5.16b).
5.3.2 Estimation of Particle and Cavity Size Distributions
To determine the diameter of the particle and cavity regions, the moment of inertia
tensor of each region was computed and from the eigenvectors of these matrices
(see Appendix B for details), the principal axes (a, b and c) were determined. The
maximum principal axis was considered as the diameter (dp) of a particular particle
region.
From the tomography data set, a sub-volume of 500×500×700 µm3 was cropped,
and the dp of the particles were measured. This analysis considers only particles
greater than 1.8µm in size due to the resolution limits inherent in the data. Ap-
proximately 31 000 particles of various sizes were detected after refining single voxels
present in the volume to reduce noise of data and the corresponding size distribution
143
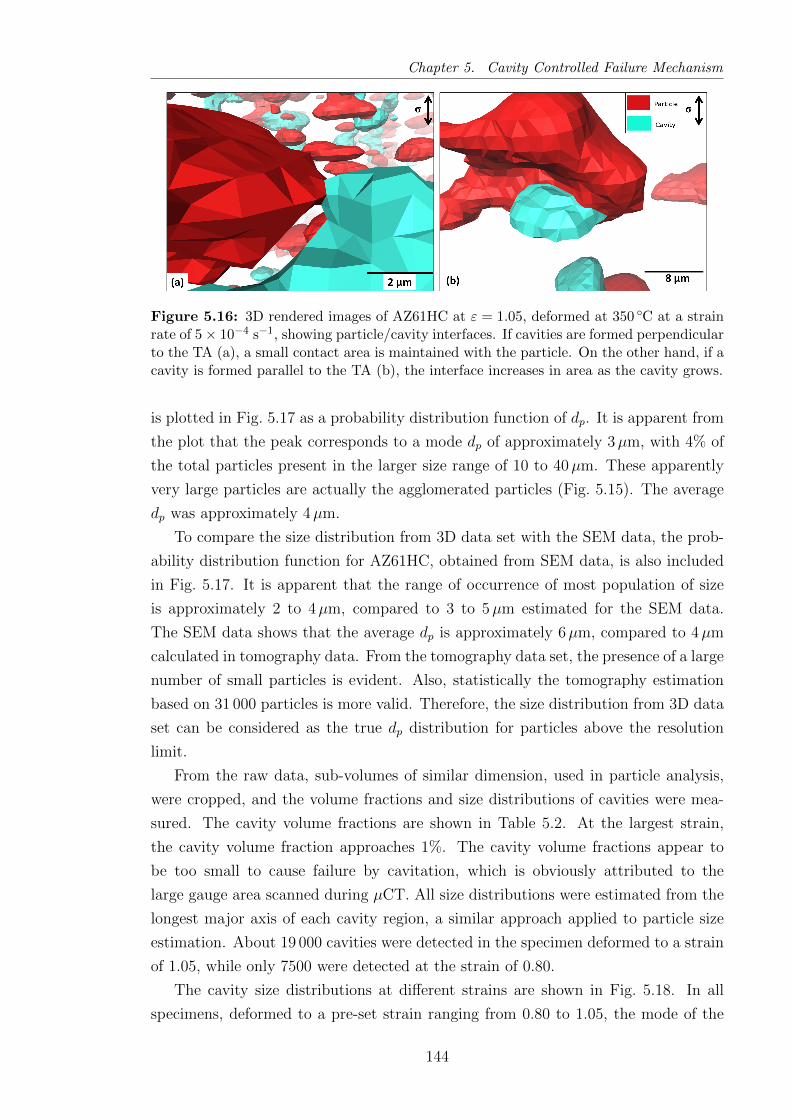
Chapter 5. Cavity Controlled Failure Mechanism
Figure 5.16: 3D rendered images of AZ61HC at ε = 1.05, deformed at 350 C at a strainrate of 5× 10⁻⁴ s−1, showing particle/cavity interfaces. If cavities are formed perpendicularto the TA (a), a small contact area is maintained with the particle. On the other hand, if acavity is formed parallel to the TA (b), the interface increases in area as the cavity grows.
is plotted in Fig. 5.17 as a probability distribution function of dp. It is apparent from
the plot that the peak corresponds to a mode dp of approximately 3µm, with 4% of
the total particles present in the larger size range of 10 to 40µm. These apparently
very large particles are actually the agglomerated particles (Fig. 5.15). The average
dp was approximately 4µm.
To compare the size distribution from 3D data set with the SEM data, the prob-
ability distribution function for AZ61HC, obtained from SEM data, is also included
in Fig. 5.17. It is apparent that the range of occurrence of most population of size
is approximately 2 to 4µm, compared to 3 to 5µm estimated for the SEM data.
The SEM data shows that the average dp is approximately 6µm, compared to 4µm
calculated in tomography data. From the tomography data set, the presence of a large
number of small particles is evident. Also, statistically the tomography estimation
based on 31 000 particles is more valid. Therefore, the size distribution from 3D data
set can be considered as the true dp distribution for particles above the resolution
limit.
From the raw data, sub-volumes of similar dimension, used in particle analysis,
were cropped, and the volume fractions and size distributions of cavities were mea-
sured. The cavity volume fractions are shown in Table 5.2. At the largest strain,
the cavity volume fraction approaches 1%. The cavity volume fractions appear to
be too small to cause failure by cavitation, which is obviously attributed to the
large gauge area scanned during µCT. All size distributions were estimated from the
longest major axis of each cavity region, a similar approach applied to particle size
estimation. About 19 000 cavities were detected in the specimen deformed to a strain
of 1.05, while only 7500 were detected at the strain of 0.80.
The cavity size distributions at different strains are shown in Fig. 5.18. In all
specimens, deformed to a pre-set strain ranging from 0.80 to 1.05, the mode of the
144

Chapter 5. Cavity Controlled Failure Mechanism
Figure 5.17: A semi-log plot of the probability distribution function of the particlediameter (dp) of AZ61HC from the 3D data set, deformed at 350 C at a strain rate of5× 10−4 s−1. The peak corresponds to the maximum occurrence of sizes at approximately2 to 4µm. The size distribution from SEM data is also incorporated in this plot. Normalisedfraction of number of particles are also included.
Table 5.2: Cavity volume fractions obtained from the tomography dataat temperature 350 C at a strain rate of 5× 10⁻⁴ s−1
Strain 0.80 0.90 1.00 1.05
Cavity Volume Fractions, % 0.18 0.47 0.49 0.92
size distribution is 3µm. This is also revealed in the plots. In terms of proportion
of cavities, almost 80% of the total cavities, in the specimen deformed to 0.80, are
less than 5µm in size, whereas 90% of the cavities belong to that size group in the
specimen deformed to a strain of 1.05. This is not unexpected, since the total number
of the cavities is increased by approximately two and half times during deformation
(between strains of 0.80 and 1.05). The major difference observed lies in the size
range of 20 to 30µm, which is attributed to the extensive coalescence of cavities
mostly due to the agglomeration of particles. At a strain of 0.80, approximately 2%
of cavities are greater than 20µm in size, while this number fraction shifts to 4% at
ε=1.05.
5.3.3 Methodology Developed for Particle/Cavity Associa-
tion
Two methods were developed to analyse tomography data and determine the ten-
dency for particle/cavity association: a) the spatial correlation function and b) the
145
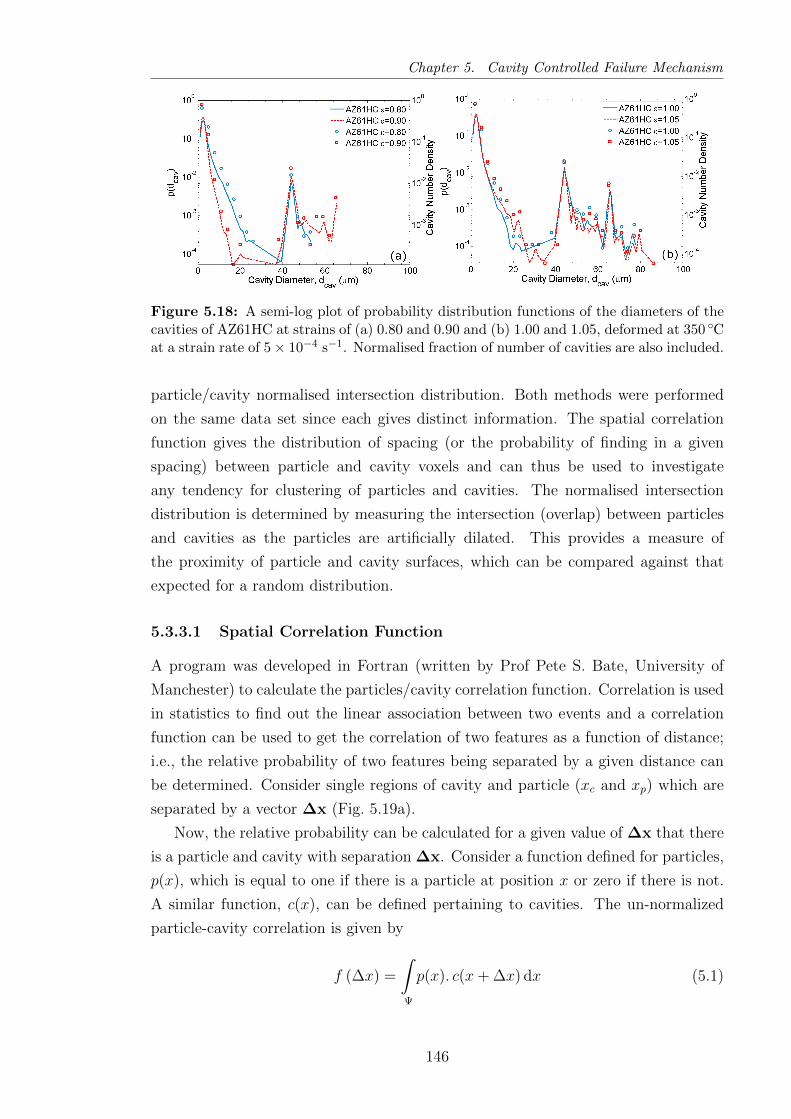
Chapter 5. Cavity Controlled Failure Mechanism
Figure 5.18: A semi-log plot of probability distribution functions of the diameters of thecavities of AZ61HC at strains of (a) 0.80 and 0.90 and (b) 1.00 and 1.05, deformed at 350 Cat a strain rate of 5× 10⁻⁴ s−1. Normalised fraction of number of cavities are also included.
particle/cavity normalised intersection distribution. Both methods were performed
on the same data set since each gives distinct information. The spatial correlation
function gives the distribution of spacing (or the probability of finding in a given
spacing) between particle and cavity voxels and can thus be used to investigate
any tendency for clustering of particles and cavities. The normalised intersection
distribution is determined by measuring the intersection (overlap) between particles
and cavities as the particles are artificially dilated. This provides a measure of
the proximity of particle and cavity surfaces, which can be compared against that
expected for a random distribution.
5.3.3.1 Spatial Correlation Function
A program was developed in Fortran (written by Prof Pete S. Bate, University of
Manchester) to calculate the particles/cavity correlation function. Correlation is used
in statistics to find out the linear association between two events and a correlation
function can be used to get the correlation of two features as a function of distance;
i.e., the relative probability of two features being separated by a given distance can
be determined. Consider single regions of cavity and particle (xc and xp) which are
separated by a vector ∆x (Fig. 5.19a).
Now, the relative probability can be calculated for a given value of ∆x that there
is a particle and cavity with separation ∆x. Consider a function defined for particles,
p(x), which is equal to one if there is a particle at position x or zero if there is not.
A similar function, c(x), can be defined pertaining to cavities. The un-normalized
particle-cavity correlation is given by
f (∆x) =
∫Ψ
p(x). c(x+ ∆x) dx (5.1)
146

Chapter 5. Cavity Controlled Failure Mechanism
where Ψ is the spatial domain over which the integral is being evaluated. To get the
normalised, relative probability of a particle cavity separation of ∆x, the function f
needs to be divided by the product of fractions of particles and cavities. Using Fast
Fourier Transform, the above mentioned convolution integral can be solved efficiently
as
F = P.C∗ (5.2)
where F , P and C are the Fourier transforms of f , p and c, and * denotes the complex
conjugate.
To interpret the result, f can be plotted as a function of radius
r =|∆x|=(∆x2
1 + ∆x22 + ∆x2
3
)1/2(5.3)
where ∆x21, ∆x2
2 and ∆x23 are the components of ∆x in three orthogonal directions
defined as the Euclidian distance between two points in 3D space.
5.3.3.2 Particle/cavity Normalised Intersection Distribution
To determine the fraction of particle and cavity regions in contact, a dilation and
intersection checking routine was developed in Matlab. 3D arrays defining the co-
ordinates of all particle and cavity voxels were first defined. After constructing the
3D arrays, particle regions were dilated by a predefined distance and a check for
cavity regions intersecting the dilated particle regions was performed. The number
of intersected regions was then divided by the total number of cavity regions to get
normalized data for each pre-defined dilation. A schematic presentation of the steps
followed is shown and explained in Fig. 5.19b.
5.3.4 Establishment of Particle-cavity Relationships
Using Matlab and Fortran routines (mentioned in Section 5.3.3), two relationships
between particles and cavities were established for a sub-volume of 500×500×700 µm3
and compared with random sets of particle and cavity regions contained in a sub-
volume of same dimensions. If cavities were not associated with particles, the position
of the cavities would be random. In view of this, random coordinates for the particle
and cavity regions were generated in Matlab followed by tagging, region developing
and analysing in a procedure similar to the one carried out for the experimental
data. The sizes of the random regions were usually one to few microns depending on
neighbourhood of voxel coordinates.
From the correlation plot (Fig. 5.20a), the radial distance between particle and
cavity voxels is shown up to maximum distance of 50µm. A peak was obtained at
147
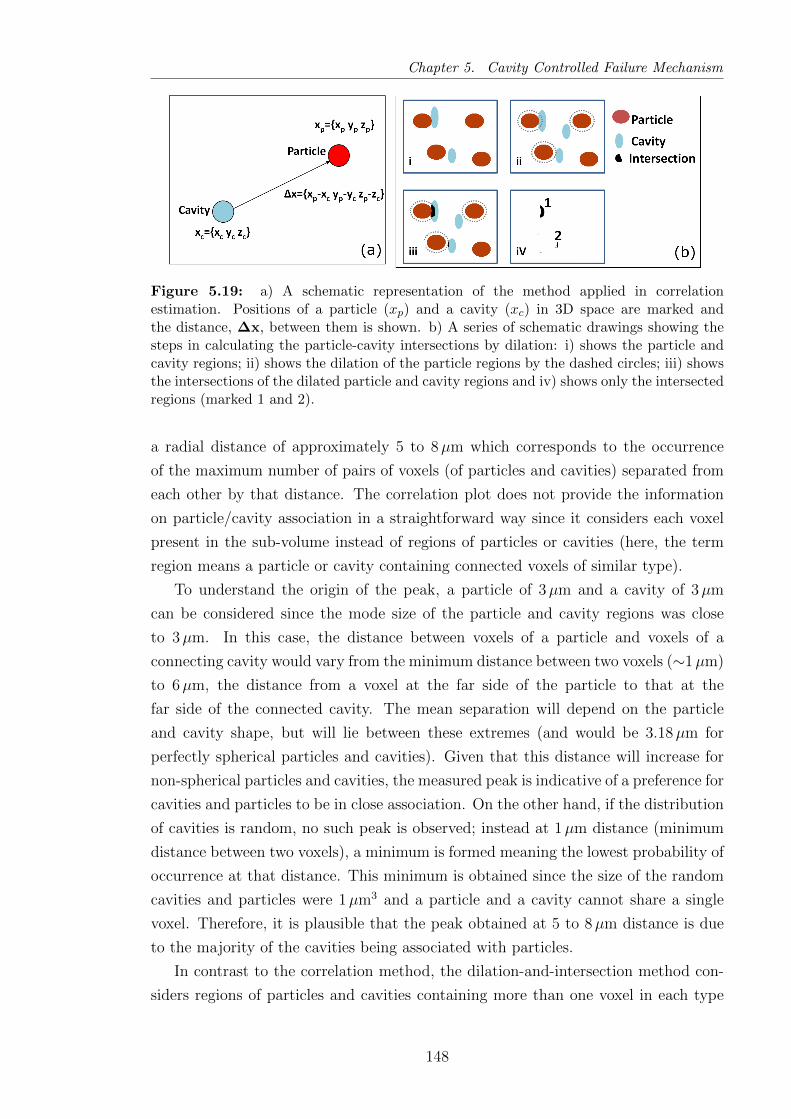
Chapter 5. Cavity Controlled Failure Mechanism
Figure 5.19: a) A schematic representation of the method applied in correlationestimation. Positions of a particle (xp) and a cavity (xc) in 3D space are marked andthe distance, ∆x, between them is shown. b) A series of schematic drawings showing thesteps in calculating the particle-cavity intersections by dilation: i) shows the particle andcavity regions; ii) shows the dilation of the particle regions by the dashed circles; iii) showsthe intersections of the dilated particle and cavity regions and iv) shows only the intersectedregions (marked 1 and 2).
a radial distance of approximately 5 to 8µm which corresponds to the occurrence
of the maximum number of pairs of voxels (of particles and cavities) separated from
each other by that distance. The correlation plot does not provide the information
on particle/cavity association in a straightforward way since it considers each voxel
present in the sub-volume instead of regions of particles or cavities (here, the term
region means a particle or cavity containing connected voxels of similar type).
To understand the origin of the peak, a particle of 3µm and a cavity of 3µm
can be considered since the mode size of the particle and cavity regions was close
to 3µm. In this case, the distance between voxels of a particle and voxels of a
connecting cavity would vary from the minimum distance between two voxels (∼1µm)
to 6µm, the distance from a voxel at the far side of the particle to that at the
far side of the connected cavity. The mean separation will depend on the particle
and cavity shape, but will lie between these extremes (and would be 3.18µm for
perfectly spherical particles and cavities). Given that this distance will increase for
non-spherical particles and cavities, the measured peak is indicative of a preference for
cavities and particles to be in close association. On the other hand, if the distribution
of cavities is random, no such peak is observed; instead at 1µm distance (minimum
distance between two voxels), a minimum is formed meaning the lowest probability of
occurrence at that distance. This minimum is obtained since the size of the random
cavities and particles were 1µm3 and a particle and a cavity cannot share a single
voxel. Therefore, it is plausible that the peak obtained at 5 to 8µm distance is due
to the majority of the cavities being associated with particles.
In contrast to the correlation method, the dilation-and-intersection method con-
siders regions of particles and cavities containing more than one voxel in each type
148

Chapter 5. Cavity Controlled Failure Mechanism
Figure 5.20: a) A semi-log correlation function (f(p − c)) plot showing the distributionbetween particle (p) and cavity (c) voxels of chill-cast AZ61HC at ε = 1.05, deformed at astrain rate of 5× 10⁻⁴ s−1, separated by a pre-defined radial distance, r. b) The numberof overlaps of cavity and particle regions (Nintn) normalised by the total number of cavities(Ncav) in the sub-volume are shown. The dashed lines show probable distributions if theparticles and cavities are randomly located in the sub-volume.
of region. According to this method, approximately 90% of the cavities (Fig. 5.20b)
had their edges connected with particle edges by a single voxel distance. With an
increase of distance from particle edges, the fraction of cavities attached to particles
approaches unity. This implies that though some cavities (approximately 10%) were
not physically attached to any particles, they were located a short distance from
particles. Now, for a random distribution of cavities, a parabolic shape curve is
obtained with only 1% of the total cavities at a distance of 1.22µm from particle edges
compared to the 90% intersections obtained at 1.22µm distance in the experimental
data.
Finally, only the particles with neighbouring cavities were identified in a cropped
sub-volume and their frequencies were recorded for a bin width of 1µm. The esti-
mated number of particles truly attached to cavities (Np−c) for each bin width was
normalised by the number of particles (Np) present in that size range in the cropped
sub-volume. Fig. 5.21 shows two distributions of particles at the strains of 0.90
and 1.05 plotted using this methodology. At a strain of 0.90, a greater fraction of
particles larger than 10µm are associated with cavities compared to small particles
(<10µm). However, not all the large particles have connected cavities. At a strain
of 1.05, however, more than 50% of the large particles are associated with cavities
and the contribution to assist in cavity formation by the small particles (<10µm) is
increased by approximately four times compared to those at the strain of 0.90. These
results confirm that nucleation of cavities is a continuous process and large particles
generally form more cavities prior to small particles. Interestingly, this figure also
shows that even at the highest strain not all the large particles form cavities.
149
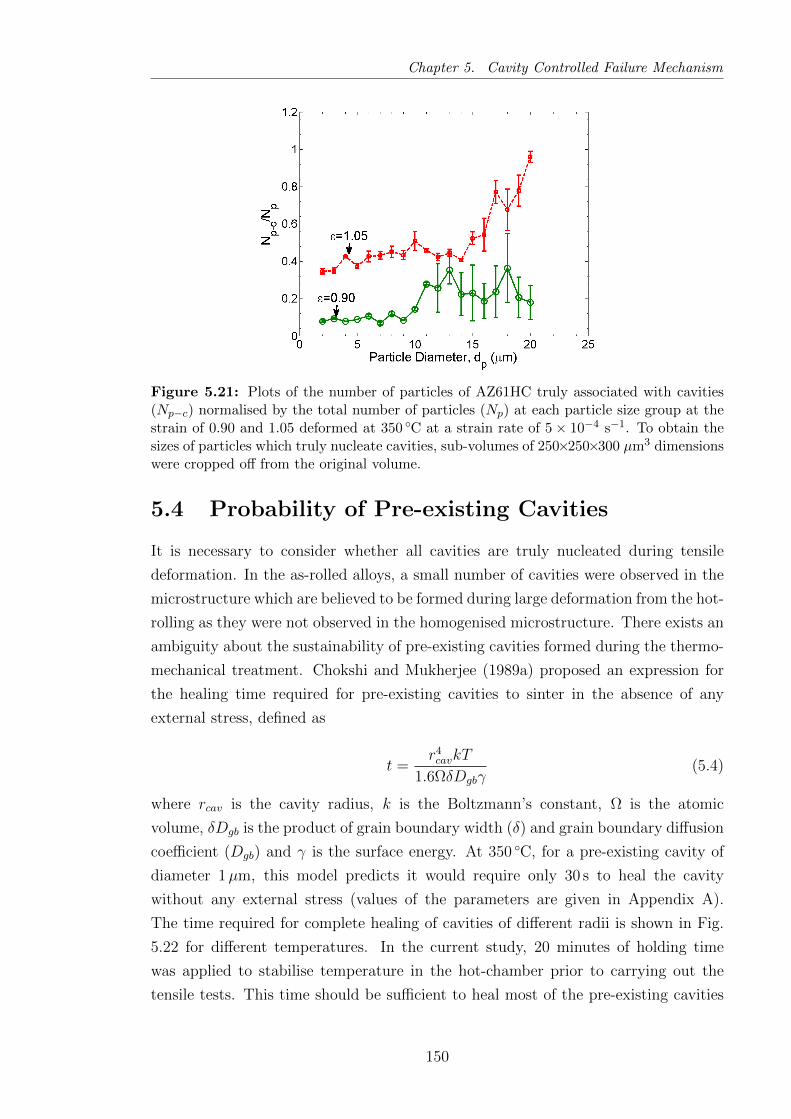
Chapter 5. Cavity Controlled Failure Mechanism
Figure 5.21: Plots of the number of particles of AZ61HC truly associated with cavities(Np−c) normalised by the total number of particles (Np) at each particle size group at thestrain of 0.90 and 1.05 deformed at 350 C at a strain rate of 5× 10⁻⁴ s−1. To obtain thesizes of particles which truly nucleate cavities, sub-volumes of 250×250×300 µm3 dimensionswere cropped off from the original volume.
5.4 Probability of Pre-existing Cavities
It is necessary to consider whether all cavities are truly nucleated during tensile
deformation. In the as-rolled alloys, a small number of cavities were observed in the
microstructure which are believed to be formed during large deformation from the hot-
rolling as they were not observed in the homogenised microstructure. There exists an
ambiguity about the sustainability of pre-existing cavities formed during the thermo-
mechanical treatment. Chokshi and Mukherjee (1989a) proposed an expression for
the healing time required for pre-existing cavities to sinter in the absence of any
external stress, defined as
t =r4cavkT
1.6ΩδDgbγ(5.4)
where rcav is the cavity radius, k is the Boltzmann’s constant, Ω is the atomic
volume, δDgb is the product of grain boundary width (δ) and grain boundary diffusion
coefficient (Dgb) and γ is the surface energy. At 350 C, for a pre-existing cavity of
diameter 1µm, this model predicts it would require only 30 s to heal the cavity
without any external stress (values of the parameters are given in Appendix A).
The time required for complete healing of cavities of different radii is shown in Fig.
5.22 for different temperatures. In the current study, 20 minutes of holding time
was applied to stabilise temperature in the hot-chamber prior to carrying out the
tensile tests. This time should be sufficient to heal most of the pre-existing cavities
150
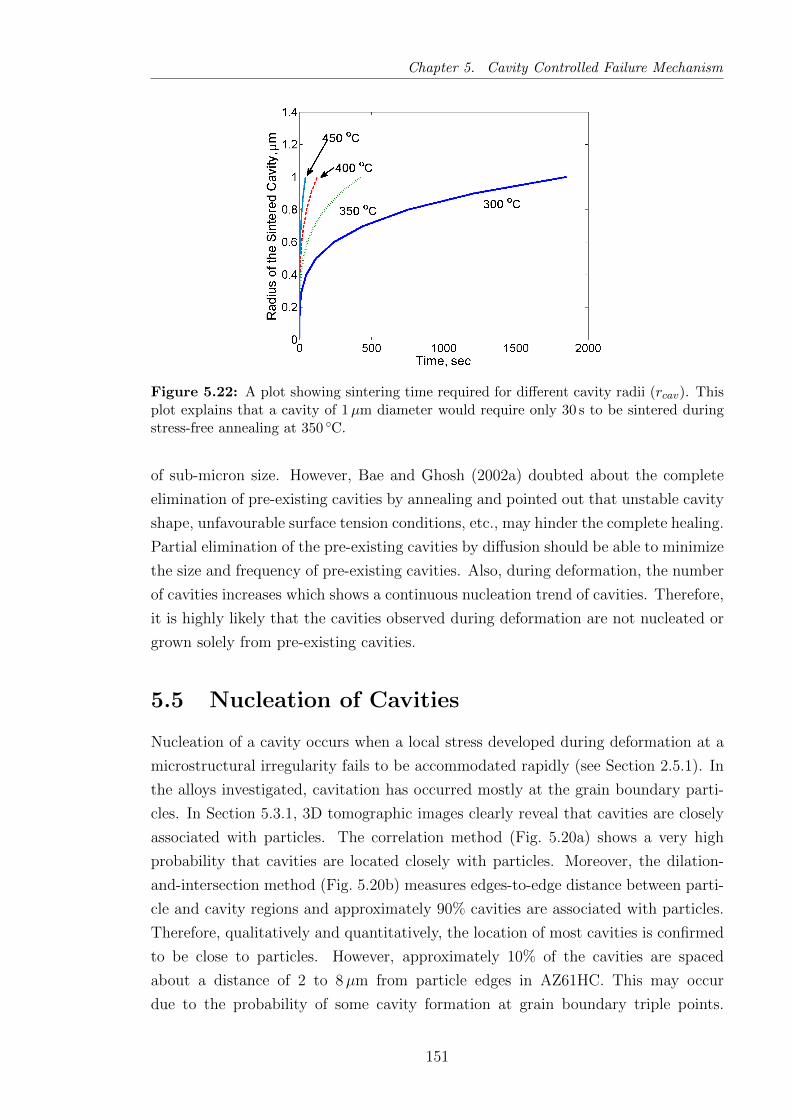
Chapter 5. Cavity Controlled Failure Mechanism
Figure 5.22: A plot showing sintering time required for different cavity radii (rcav). Thisplot explains that a cavity of 1µm diameter would require only 30 s to be sintered duringstress-free annealing at 350 C.
of sub-micron size. However, Bae and Ghosh (2002a) doubted about the complete
elimination of pre-existing cavities by annealing and pointed out that unstable cavity
shape, unfavourable surface tension conditions, etc., may hinder the complete healing.
Partial elimination of the pre-existing cavities by diffusion should be able to minimize
the size and frequency of pre-existing cavities. Also, during deformation, the number
of cavities increases which shows a continuous nucleation trend of cavities. Therefore,
it is highly likely that the cavities observed during deformation are not nucleated or
grown solely from pre-existing cavities.
5.5 Nucleation of Cavities
Nucleation of a cavity occurs when a local stress developed during deformation at a
microstructural irregularity fails to be accommodated rapidly (see Section 2.5.1). In
the alloys investigated, cavitation has occurred mostly at the grain boundary parti-
cles. In Section 5.3.1, 3D tomographic images clearly reveal that cavities are closely
associated with particles. The correlation method (Fig. 5.20a) shows a very high
probability that cavities are located closely with particles. Moreover, the dilation-
and-intersection method (Fig. 5.20b) measures edges-to-edge distance between parti-
cle and cavity regions and approximately 90% cavities are associated with particles.
Therefore, qualitatively and quantitatively, the location of most cavities is confirmed
to be close to particles. However, approximately 10% of the cavities are spaced
about a distance of 2 to 8µm from particle edges in AZ61HC. This may occur
due to the probability of some cavity formation at grain boundary triple points.
151
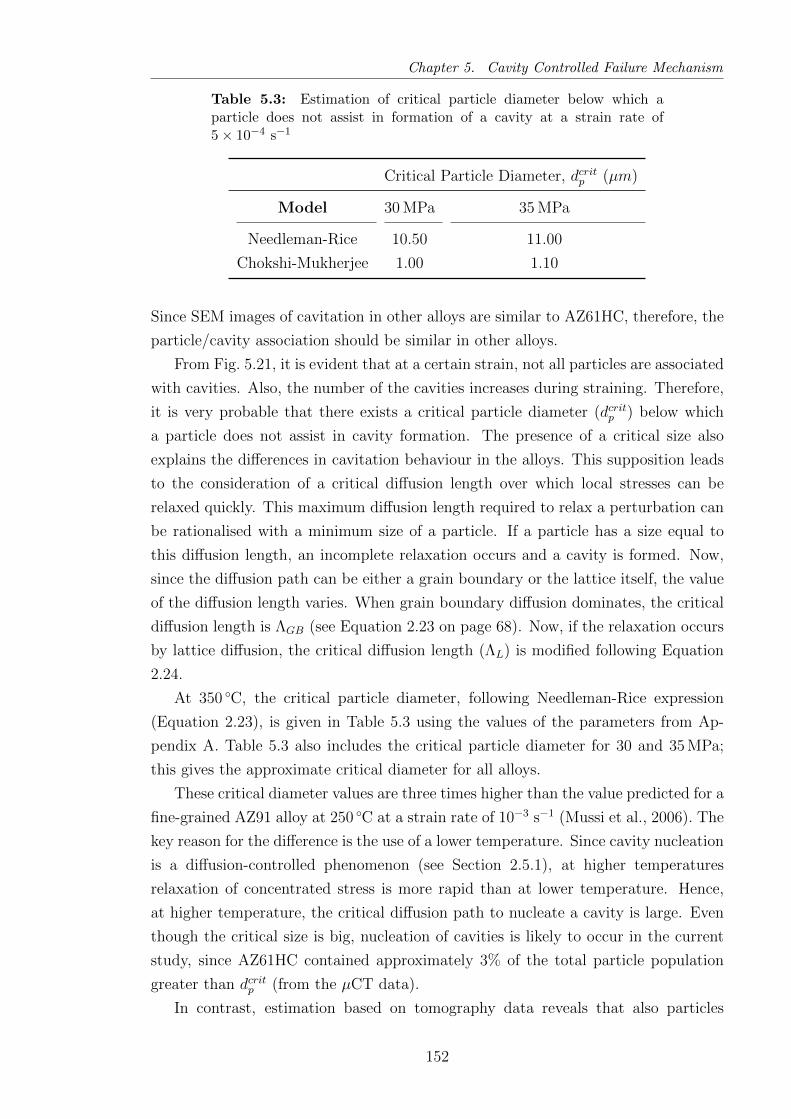
Chapter 5. Cavity Controlled Failure Mechanism
Table 5.3: Estimation of critical particle diameter below which aparticle does not assist in formation of a cavity at a strain rate of5× 10−4 s−1
Critical Particle Diameter, dcritp (µm)
Model 30 MPa 35 MPa
Needleman-Rice 10.50 11.00
Chokshi-Mukherjee 1.00 1.10
Since SEM images of cavitation in other alloys are similar to AZ61HC, therefore, the
particle/cavity association should be similar in other alloys.
From Fig. 5.21, it is evident that at a certain strain, not all particles are associated
with cavities. Also, the number of the cavities increases during straining. Therefore,
it is very probable that there exists a critical particle diameter (dcritp ) below which
a particle does not assist in cavity formation. The presence of a critical size also
explains the differences in cavitation behaviour in the alloys. This supposition leads
to the consideration of a critical diffusion length over which local stresses can be
relaxed quickly. This maximum diffusion length required to relax a perturbation can
be rationalised with a minimum size of a particle. If a particle has a size equal to
this diffusion length, an incomplete relaxation occurs and a cavity is formed. Now,
since the diffusion path can be either a grain boundary or the lattice itself, the value
of the diffusion length varies. When grain boundary diffusion dominates, the critical
diffusion length is ΛGB (see Equation 2.23 on page 68). Now, if the relaxation occurs
by lattice diffusion, the critical diffusion length (ΛL) is modified following Equation
2.24.
At 350 C, the critical particle diameter, following Needleman-Rice expression
(Equation 2.23), is given in Table 5.3 using the values of the parameters from Ap-
pendix A. Table 5.3 also includes the critical particle diameter for 30 and 35 MPa;
this gives the approximate critical diameter for all alloys.
These critical diameter values are three times higher than the value predicted for a
fine-grained AZ91 alloy at 250 C at a strain rate of 10−3 s−1 (Mussi et al., 2006). The
key reason for the difference is the use of a lower temperature. Since cavity nucleation
is a diffusion-controlled phenomenon (see Section 2.5.1), at higher temperatures
relaxation of concentrated stress is more rapid than at lower temperature. Hence,
at higher temperature, the critical diffusion path to nucleate a cavity is large. Even
though the critical size is big, nucleation of cavities is likely to occur in the current
study, since AZ61HC contained approximately 3% of the total particle population
greater than dcritp (from the µCT data).
In contrast, estimation based on tomography data reveals that also particles
152
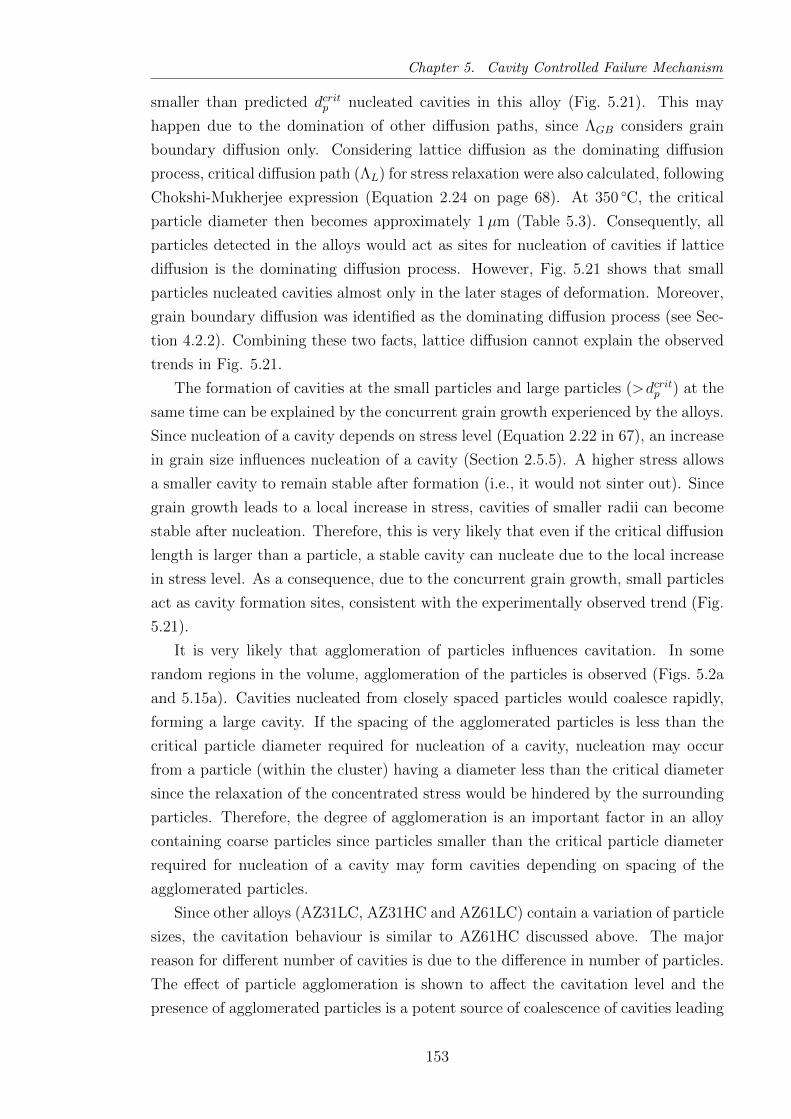
Chapter 5. Cavity Controlled Failure Mechanism
smaller than predicted dcritp nucleated cavities in this alloy (Fig. 5.21). This may
happen due to the domination of other diffusion paths, since ΛGB considers grain
boundary diffusion only. Considering lattice diffusion as the dominating diffusion
process, critical diffusion path (ΛL) for stress relaxation were also calculated, following
Chokshi-Mukherjee expression (Equation 2.24 on page 68). At 350 C, the critical
particle diameter then becomes approximately 1µm (Table 5.3). Consequently, all
particles detected in the alloys would act as sites for nucleation of cavities if lattice
diffusion is the dominating diffusion process. However, Fig. 5.21 shows that small
particles nucleated cavities almost only in the later stages of deformation. Moreover,
grain boundary diffusion was identified as the dominating diffusion process (see Sec-
tion 4.2.2). Combining these two facts, lattice diffusion cannot explain the observed
trends in Fig. 5.21.
The formation of cavities at the small particles and large particles (>dcritp ) at the
same time can be explained by the concurrent grain growth experienced by the alloys.
Since nucleation of a cavity depends on stress level (Equation 2.22 in 67), an increase
in grain size influences nucleation of a cavity (Section 2.5.5). A higher stress allows
a smaller cavity to remain stable after formation (i.e., it would not sinter out). Since
grain growth leads to a local increase in stress, cavities of smaller radii can become
stable after nucleation. Therefore, this is very likely that even if the critical diffusion
length is larger than a particle, a stable cavity can nucleate due to the local increase
in stress level. As a consequence, due to the concurrent grain growth, small particles
act as cavity formation sites, consistent with the experimentally observed trend (Fig.
5.21).
It is very likely that agglomeration of particles influences cavitation. In some
random regions in the volume, agglomeration of the particles is observed (Figs. 5.2a
and 5.15a). Cavities nucleated from closely spaced particles would coalesce rapidly,
forming a large cavity. If the spacing of the agglomerated particles is less than the
critical particle diameter required for nucleation of a cavity, nucleation may occur
from a particle (within the cluster) having a diameter less than the critical diameter
since the relaxation of the concentrated stress would be hindered by the surrounding
particles. Therefore, the degree of agglomeration is an important factor in an alloy
containing coarse particles since particles smaller than the critical particle diameter
required for nucleation of a cavity may form cavities depending on spacing of the
agglomerated particles.
Since other alloys (AZ31LC, AZ31HC and AZ61LC) contain a variation of particle
sizes, the cavitation behaviour is similar to AZ61HC discussed above. The major
reason for different number of cavities is due to the difference in number of particles.
The effect of particle agglomeration is shown to affect the cavitation level and the
presence of agglomerated particles is a potent source of coalescence of cavities leading
153
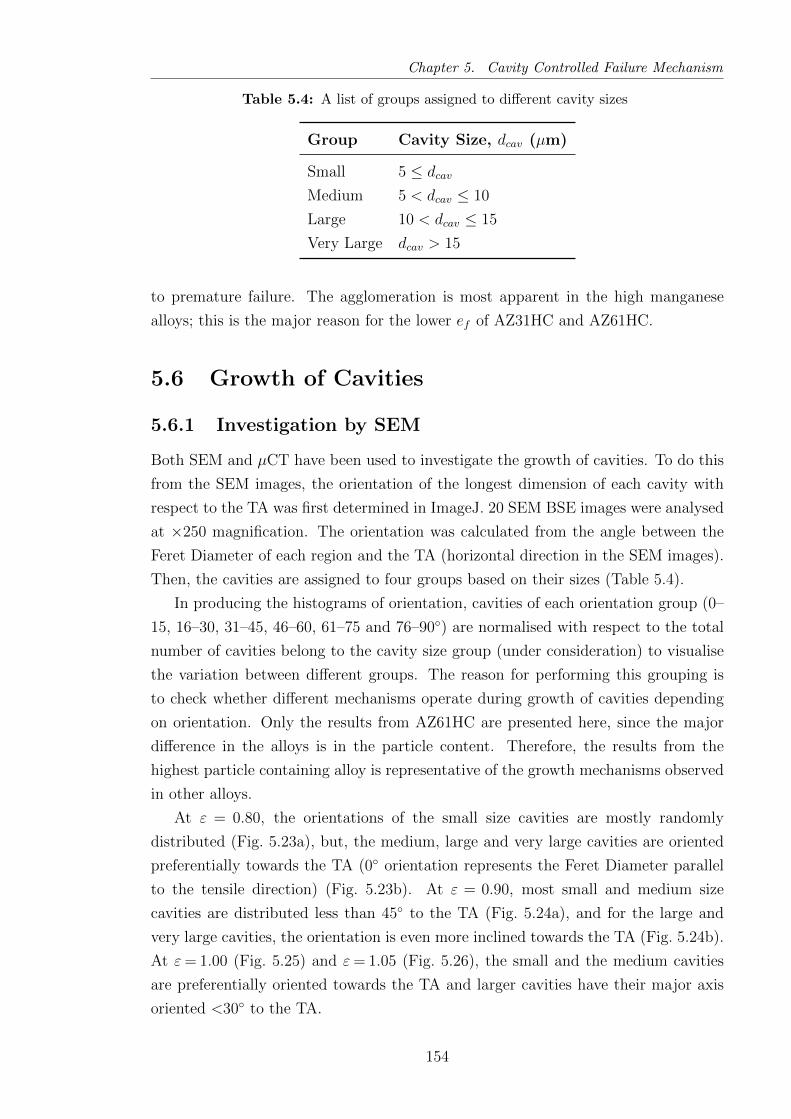
Chapter 5. Cavity Controlled Failure Mechanism
Table 5.4: A list of groups assigned to different cavity sizes
Group Cavity Size, dcav (µm)
Small 5 ≤ dcav
Medium 5 < dcav ≤ 10
Large 10 < dcav ≤ 15
Very Large dcav > 15
to premature failure. The agglomeration is most apparent in the high manganese
alloys; this is the major reason for the lower ef of AZ31HC and AZ61HC.
5.6 Growth of Cavities
5.6.1 Investigation by SEM
Both SEM and µCT have been used to investigate the growth of cavities. To do this
from the SEM images, the orientation of the longest dimension of each cavity with
respect to the TA was first determined in ImageJ. 20 SEM BSE images were analysed
at ×250 magnification. The orientation was calculated from the angle between the
Feret Diameter of each region and the TA (horizontal direction in the SEM images).
Then, the cavities are assigned to four groups based on their sizes (Table 5.4).
In producing the histograms of orientation, cavities of each orientation group (0–
15, 16–30, 31–45, 46–60, 61–75 and 76–90) are normalised with respect to the total
number of cavities belong to the cavity size group (under consideration) to visualise
the variation between different groups. The reason for performing this grouping is
to check whether different mechanisms operate during growth of cavities depending
on orientation. Only the results from AZ61HC are presented here, since the major
difference in the alloys is in the particle content. Therefore, the results from the
highest particle containing alloy is representative of the growth mechanisms observed
in other alloys.
At ε = 0.80, the orientations of the small size cavities are mostly randomly
distributed (Fig. 5.23a), but, the medium, large and very large cavities are oriented
preferentially towards the TA (0 orientation represents the Feret Diameter parallel
to the tensile direction) (Fig. 5.23b). At ε = 0.90, most small and medium size
cavities are distributed less than 45 to the TA (Fig. 5.24a), and for the large and
very large cavities, the orientation is even more inclined towards the TA (Fig. 5.24b).
At ε= 1.00 (Fig. 5.25) and ε= 1.05 (Fig. 5.26), the small and the medium cavities
are preferentially oriented towards the TA and larger cavities have their major axis
oriented <30 to the TA.
154
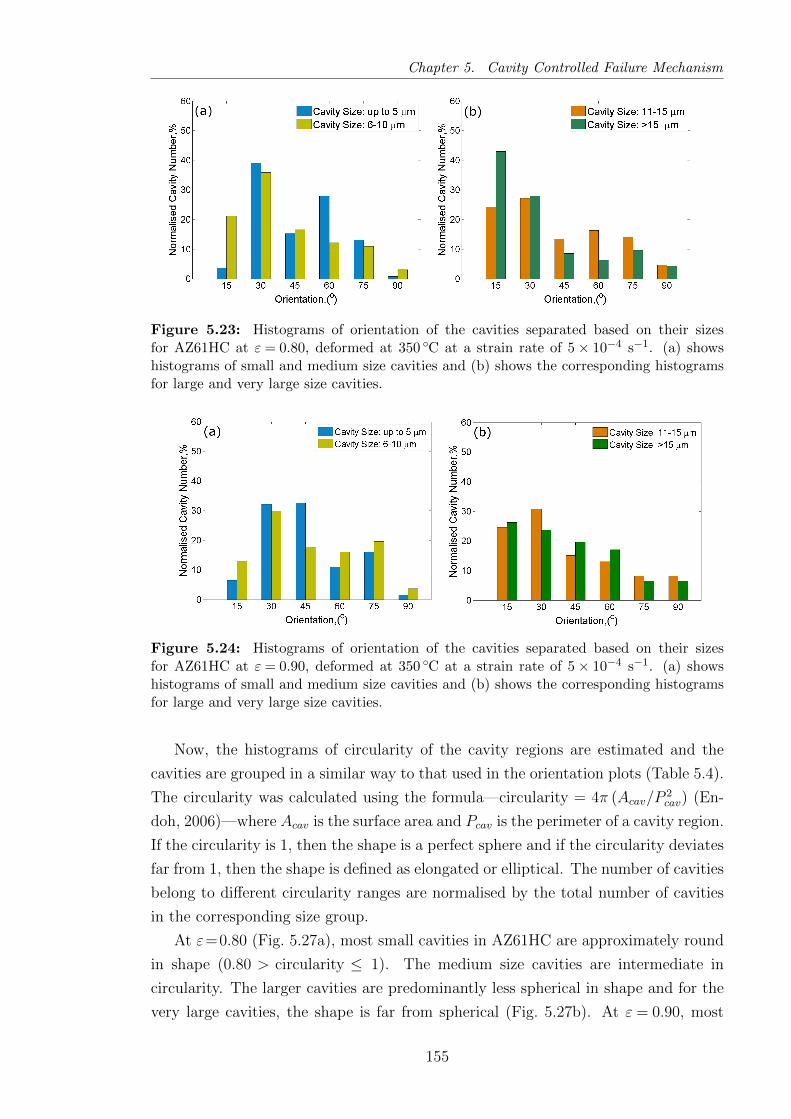
Chapter 5. Cavity Controlled Failure Mechanism
Figure 5.23: Histograms of orientation of the cavities separated based on their sizesfor AZ61HC at ε = 0.80, deformed at 350 C at a strain rate of 5× 10⁻⁴ s−1. (a) showshistograms of small and medium size cavities and (b) shows the corresponding histogramsfor large and very large size cavities.
Figure 5.24: Histograms of orientation of the cavities separated based on their sizesfor AZ61HC at ε = 0.90, deformed at 350 C at a strain rate of 5× 10⁻⁴ s−1. (a) showshistograms of small and medium size cavities and (b) shows the corresponding histogramsfor large and very large size cavities.
Now, the histograms of circularity of the cavity regions are estimated and the
cavities are grouped in a similar way to that used in the orientation plots (Table 5.4).
The circularity was calculated using the formula—circularity = 4π (Acav/P2cav) (En-
doh, 2006)—where Acav is the surface area and Pcav is the perimeter of a cavity region.
If the circularity is 1, then the shape is a perfect sphere and if the circularity deviates
far from 1, then the shape is defined as elongated or elliptical. The number of cavities
belong to different circularity ranges are normalised by the total number of cavities
in the corresponding size group.
At ε=0.80 (Fig. 5.27a), most small cavities in AZ61HC are approximately round
in shape (0.80 > circularity ≤ 1). The medium size cavities are intermediate in
circularity. The larger cavities are predominantly less spherical in shape and for the
very large cavities, the shape is far from spherical (Fig. 5.27b). At ε = 0.90, most
155

Chapter 5. Cavity Controlled Failure Mechanism
Figure 5.25: Histograms of orientation of the cavities separated based on their sizesfor AZ61HC at ε = 1.00, deformed at 350 C at a strain rate of 5× 10⁻⁴ s−1. (a) showshistograms of small and medium size cavities and (b) shows the corresponding histogramsfor large and very large size cavities.
Figure 5.26: Histograms of orientation of the cavities separated based on their sizesfor AZ61HC at ε = 1.05, deformed at 350 C at a strain rate of 5× 10⁻⁴ s−1. (a) showshistograms of small and medium size cavities and (b) shows the corresponding histogramsfor large and very large size cavities.
small cavities are spherical in shape but with the increase of size, the shape becomes
elongated (Fig. 5.28). Similar trends are observed for the cavities at ε=1.00 and 1.05
(Figs. 5.29 and 5.30). Small cavities are close to spherical in shape, but with the
increase of size, most cavities become elongated in shape. It may be concluded that
shape of cavities changes during growth.
From the orientation and circularity histograms, it is obvious that there is a
probability that two different mechanisms operate during the growth of cavities, since
different shapes of cavities are observed at different cavity sizes. Cavity growth may
occur by either stress-induced diffusion (Beere and Speight, 1978) or plasticity (Han-
cock, 1976). Diffusion growth leads to a spherical cavity shape to minimise the surface
area. On the other hand, plasticity driven growth results in an elongated shape (see
Section 2.5.2).
156

Chapter 5. Cavity Controlled Failure Mechanism
Figure 5.27: Histograms of circularity (shape factor) of the cavities separated based ontheir sizes for AZ61HC at ε = 0.80, deformed at 350 C at a strain rate of 5× 10⁻⁴ s−1.(a) shows histograms of small and medium size cavities and (b) shows the correspondinghistograms for large and very large size cavities.
Figure 5.28: Histograms of circularity (shape factor) of the cavities separated based ontheir sizes for AZ61HC at ε = 0.90, deformed at 350 C at a strain rate of 5× 10⁻⁴ s−1.(a) shows histograms of small and medium size cavities and (b) shows the correspondinghistograms for large and very large size cavities.
The initial growth occurs by diffusion of vacancies from the surrounding boundary.
Growth by diffusion depends on diffusion paths. Diffusional growth can be enhanced
if a growing cavity intersects several grain boundaries. In such a case, diffusion along
several boundaries leads to a rapid growth of a cavity.
After a certain critical size, plasticity controlled growth dominates during the
relaxation of the stress concentration. This is evident since elongated cavities are
observed in the circularity plots.
To determine the contribution of different growth models, it is necessary to find
out the critical radius for transition between these mechanisms. Using the values
of the parameters (presented in Appendix A), the growth rates are calculated using
Equations 2.27 and 2.29 and plotted in Fig. 5.31.
From Fig. 5.31, the transition cavity diameter (2rtcav) between the diffusion and
157

Chapter 5. Cavity Controlled Failure Mechanism
Figure 5.29: Histograms of circularity (shape factor) of the cavities separated based ontheir sizes for AZ61HC at ε = 1.00, deformed at 350 C at a strain rate of 5× 10⁻⁴ s−1.(a) shows histograms of small and medium size cavities and (b) shows the correspondinghistograms for large and very large size cavities.
Figure 5.30: Histograms of circularity (shape factor) of the cavities separated based ontheir sizes for AZ61HC at ε = 1.05, deformed at 350 C at a strain rate of 5× 10⁻⁴ s−1.(a) shows histograms of small and medium size cavities and (b) shows the correspondinghistograms for large and very large size cavities.
plasticity controlled growth is calculated as approximately 6µm. If this value is
compared with the orientation and circularity plots, the shape (close to spherical)
and the orientation (less inclined towards TA) of the small cavities (<5µm) fit very
well with the diffusion model. It implies that for the small cavities, the diffusion
process is dominating but once the transition diameter is exceeded, plasticity induced
growth is the controlling factor.
Some inconsistencies are observed such that some smaller cavities are approxi-
mately elliptical and also some larger cavities are almost spherical in shape. There
are several possibilities that may lead to these behaviours. Since, sometimes, a few
particles are agglomerated together, it is possible to have closely spaced smaller
cavities which are found to coalesce together, forming a different shape rather than
the spherical. This also explains the differences in orientation for some cavities.
158

Chapter 5. Cavity Controlled Failure Mechanism
Figure 5.31: Cavity growth rates for AZ61HC at different cavity radii (rcav) using differentgrowth models at 350 C at a strain rate of 5× 10⁻⁴ s−1. A transition radius (rtcav) of 3µmfrom diffusion to plasticity mechanism is obtained.
Moreover, from the circularity plots, for the larger cavity group, a few large cavities
are observed to be spherical in shape. This may occur if the cavities, growing by
the diffusion process, are intersected by several grain boundaries and this results in
a faster diffusion process that leads to a final cavity shape that is approximately
spherical. It is also possible that the coalescence of cavities could lead to a near
spherical shaped cavity by coincidence.
In summary, since most small cavities are circular and randomly distributed,
they have grown by vacancy diffusion. Above a critical size, plasticity controlled
growth dominates and leads to a rapid increase of cavity size. However, some large
cavities may remain spherical due to coalescence and some small cavities deviate from
spherical size due to constraint by particle agglomeration.
5.6.2 Investigation by X-ray Micro-Tomography
From the SEM study on growth of cavities (see Section 5.6.1), two different growth
mechanisms are identified. However, it is important to check whether the sectioning
effect (see Section 5.3) has any consequence on the conclusions made about the growth
of cavities. Using the 3D data set already discussed (see Section 5.3.2), the orientation
and shapes of the cavities were determined. To produce the required information
about particle shape, a custom routine was written in Matlab. Briefly, at first,
each region was considered as an ellipsoid (See Appendix B for details) followed by
estimation of moment of inertia tensor of the ellipsoid to get the major and minor
axes (a and b) and the polar axis (c), where a>b>c. Then, the angle between the
major axis (a) and the tensile direction (z-axis of the 3D data set) was determined.
159
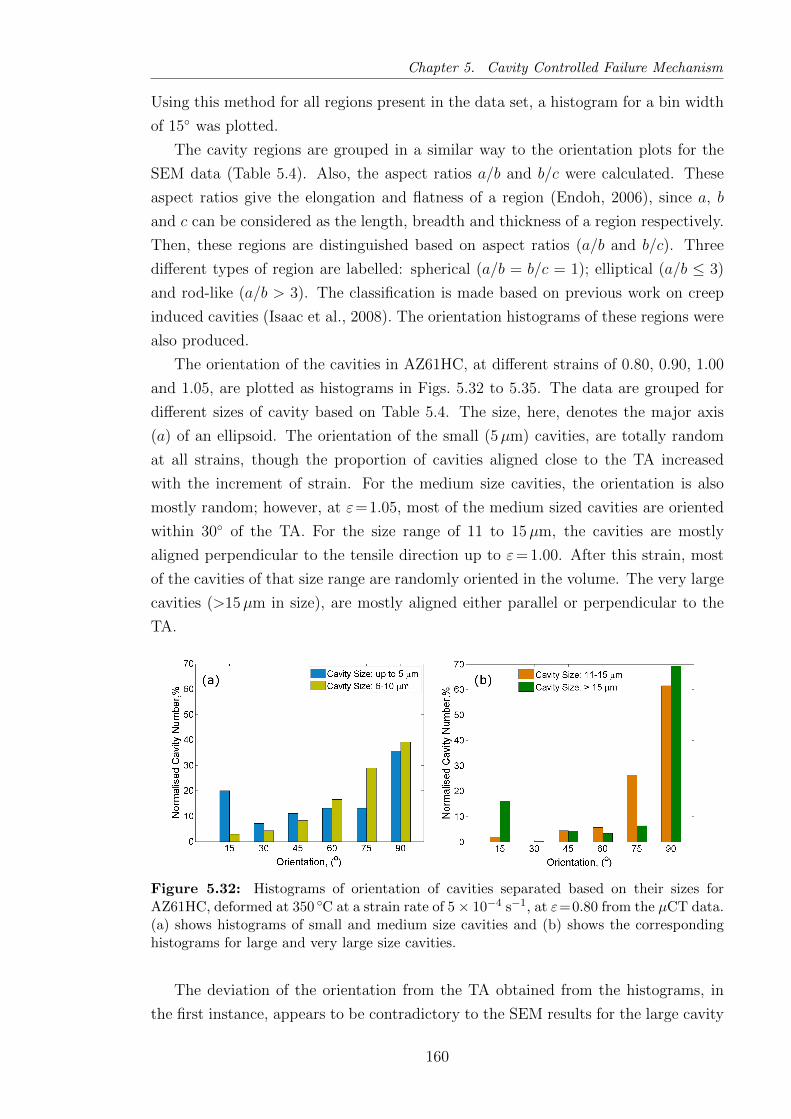
Chapter 5. Cavity Controlled Failure Mechanism
Using this method for all regions present in the data set, a histogram for a bin width
of 15 was plotted.
The cavity regions are grouped in a similar way to the orientation plots for the
SEM data (Table 5.4). Also, the aspect ratios a/b and b/c were calculated. These
aspect ratios give the elongation and flatness of a region (Endoh, 2006), since a, b
and c can be considered as the length, breadth and thickness of a region respectively.
Then, these regions are distinguished based on aspect ratios (a/b and b/c). Three
different types of region are labelled: spherical (a/b = b/c = 1); elliptical (a/b ≤ 3)
and rod-like (a/b > 3). The classification is made based on previous work on creep
induced cavities (Isaac et al., 2008). The orientation histograms of these regions were
also produced.
The orientation of the cavities in AZ61HC, at different strains of 0.80, 0.90, 1.00
and 1.05, are plotted as histograms in Figs. 5.32 to 5.35. The data are grouped for
different sizes of cavity based on Table 5.4. The size, here, denotes the major axis
(a) of an ellipsoid. The orientation of the small (5µm) cavities, are totally random
at all strains, though the proportion of cavities aligned close to the TA increased
with the increment of strain. For the medium size cavities, the orientation is also
mostly random; however, at ε=1.05, most of the medium sized cavities are oriented
within 30 of the TA. For the size range of 11 to 15µm, the cavities are mostly
aligned perpendicular to the tensile direction up to ε= 1.00. After this strain, most
of the cavities of that size range are randomly oriented in the volume. The very large
cavities (>15µm in size), are mostly aligned either parallel or perpendicular to the
TA.
Figure 5.32: Histograms of orientation of cavities separated based on their sizes forAZ61HC, deformed at 350 C at a strain rate of 5× 10⁻⁴ s−1, at ε=0.80 from the µCT data.(a) shows histograms of small and medium size cavities and (b) shows the correspondinghistograms for large and very large size cavities.
The deviation of the orientation from the TA obtained from the histograms, in
the first instance, appears to be contradictory to the SEM results for the large cavity
160
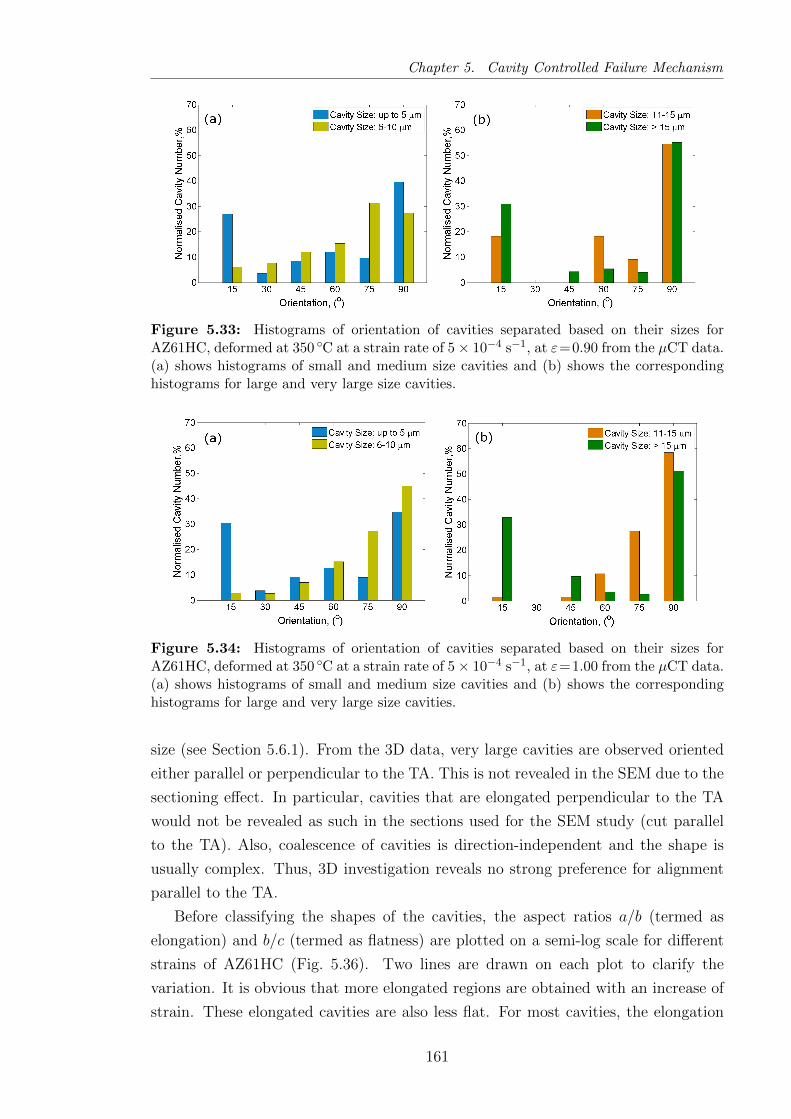
Chapter 5. Cavity Controlled Failure Mechanism
Figure 5.33: Histograms of orientation of cavities separated based on their sizes forAZ61HC, deformed at 350 C at a strain rate of 5× 10⁻⁴ s−1, at ε=0.90 from the µCT data.(a) shows histograms of small and medium size cavities and (b) shows the correspondinghistograms for large and very large size cavities.
Figure 5.34: Histograms of orientation of cavities separated based on their sizes forAZ61HC, deformed at 350 C at a strain rate of 5× 10⁻⁴ s−1, at ε=1.00 from the µCT data.(a) shows histograms of small and medium size cavities and (b) shows the correspondinghistograms for large and very large size cavities.
size (see Section 5.6.1). From the 3D data, very large cavities are observed oriented
either parallel or perpendicular to the TA. This is not revealed in the SEM due to the
sectioning effect. In particular, cavities that are elongated perpendicular to the TA
would not be revealed as such in the sections used for the SEM study (cut parallel
to the TA). Also, coalescence of cavities is direction-independent and the shape is
usually complex. Thus, 3D investigation reveals no strong preference for alignment
parallel to the TA.
Before classifying the shapes of the cavities, the aspect ratios a/b (termed as
elongation) and b/c (termed as flatness) are plotted on a semi-log scale for different
strains of AZ61HC (Fig. 5.36). Two lines are drawn on each plot to clarify the
variation. It is obvious that more elongated regions are obtained with an increase of
strain. These elongated cavities are also less flat. For most cavities, the elongation
161
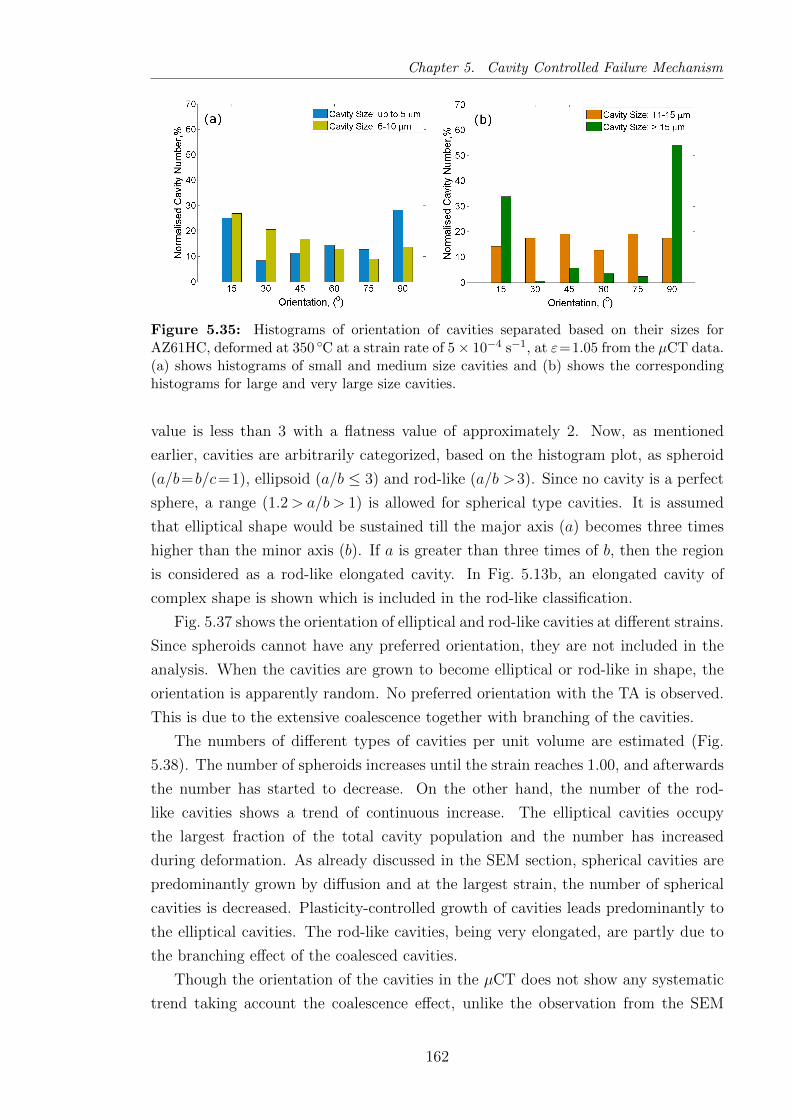
Chapter 5. Cavity Controlled Failure Mechanism
Figure 5.35: Histograms of orientation of cavities separated based on their sizes forAZ61HC, deformed at 350 C at a strain rate of 5× 10⁻⁴ s−1, at ε=1.05 from the µCT data.(a) shows histograms of small and medium size cavities and (b) shows the correspondinghistograms for large and very large size cavities.
value is less than 3 with a flatness value of approximately 2. Now, as mentioned
earlier, cavities are arbitrarily categorized, based on the histogram plot, as spheroid
(a/b=b/c=1), ellipsoid (a/b ≤ 3) and rod-like (a/b >3). Since no cavity is a perfect
sphere, a range (1.2> a/b > 1) is allowed for spherical type cavities. It is assumed
that elliptical shape would be sustained till the major axis (a) becomes three times
higher than the minor axis (b). If a is greater than three times of b, then the region
is considered as a rod-like elongated cavity. In Fig. 5.13b, an elongated cavity of
complex shape is shown which is included in the rod-like classification.
Fig. 5.37 shows the orientation of elliptical and rod-like cavities at different strains.
Since spheroids cannot have any preferred orientation, they are not included in the
analysis. When the cavities are grown to become elliptical or rod-like in shape, the
orientation is apparently random. No preferred orientation with the TA is observed.
This is due to the extensive coalescence together with branching of the cavities.
The numbers of different types of cavities per unit volume are estimated (Fig.
5.38). The number of spheroids increases until the strain reaches 1.00, and afterwards
the number has started to decrease. On the other hand, the number of the rod-
like cavities shows a trend of continuous increase. The elliptical cavities occupy
the largest fraction of the total cavity population and the number has increased
during deformation. As already discussed in the SEM section, spherical cavities are
predominantly grown by diffusion and at the largest strain, the number of spherical
cavities is decreased. Plasticity-controlled growth of cavities leads predominantly to
the elliptical cavities. The rod-like cavities, being very elongated, are partly due to
the branching effect of the coalesced cavities.
Though the orientation of the cavities in the µCT does not show any systematic
trend taking account the coalescence effect, unlike the observation from the SEM
162
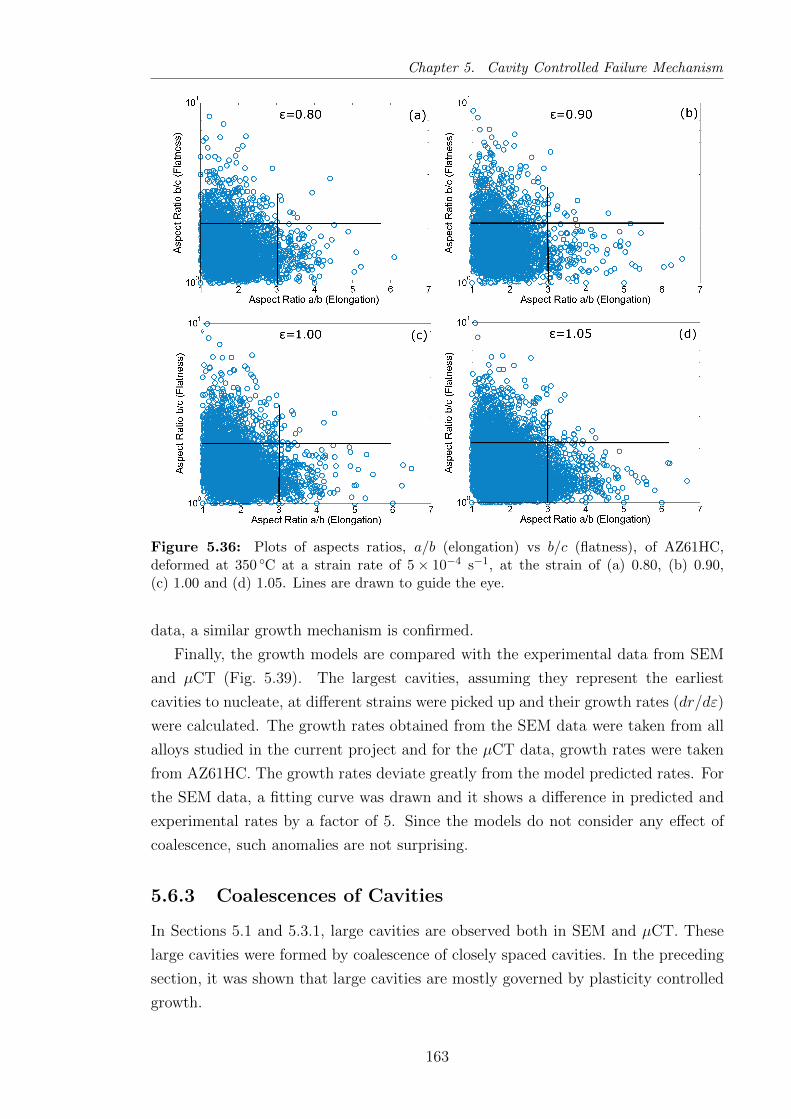
Chapter 5. Cavity Controlled Failure Mechanism
Figure 5.36: Plots of aspects ratios, a/b (elongation) vs b/c (flatness), of AZ61HC,deformed at 350 C at a strain rate of 5× 10⁻⁴ s−1, at the strain of (a) 0.80, (b) 0.90,(c) 1.00 and (d) 1.05. Lines are drawn to guide the eye.
data, a similar growth mechanism is confirmed.
Finally, the growth models are compared with the experimental data from SEM
and µCT (Fig. 5.39). The largest cavities, assuming they represent the earliest
cavities to nucleate, at different strains were picked up and their growth rates (dr/dε)
were calculated. The growth rates obtained from the SEM data were taken from all
alloys studied in the current project and for the µCT data, growth rates were taken
from AZ61HC. The growth rates deviate greatly from the model predicted rates. For
the SEM data, a fitting curve was drawn and it shows a difference in predicted and
experimental rates by a factor of 5. Since the models do not consider any effect of
coalescence, such anomalies are not surprising.
5.6.3 Coalescences of Cavities
In Sections 5.1 and 5.3.1, large cavities are observed both in SEM and µCT. These
large cavities were formed by coalescence of closely spaced cavities. In the preceding
section, it was shown that large cavities are mostly governed by plasticity controlled
growth.
163

Chapter 5. Cavity Controlled Failure Mechanism
Figure 5.37: Histograms of orientation of cavities classified based on their aspect ratiosfor AZ61HC, deformed at 350 C at a strain rate of 5× 10⁻⁴ s−1, at the strain of (a) 0.80,(b) 0.90, (c) 1.00 and (d) 1.05.
Volume fraction of cavities at different strains can be used to calculate the the-
oretical cavity growth rate parameter (η) using Equation 2.31. The growth rate
parameter at different temperatures was estimated and is shown in Table 5.5. It
can be seen that for a particular alloy η is similar at all temperatures. Now, from
the volume fraction data of different alloys for different pre-set strains, η can also
be estimated and compared with the theoretical data. The plots of experimental η
calculations are shown in Figs. 5.40 and 5.41 at 350 C.
Except AZ31LC, the theoretical η is close to the experimental data. The major
difference comes from the level of cavitation in the alloys which directly depends on
number of particles. As a consequence, the cavity growth rate parameter is higher in
the high manganese alloys. During the coalescence process, the local area adjacent
to the cavities suffers load shedding resulting in a local high stress which increases
the local cavity growth rate (Caceres and Wilkinson, 1984a; Wilkinson and Caceres,
1986). This is reflected in the high manganese alloys having a higher η.
The fluctuation between theoretical and experimental growth rate parameters is
attributed to the different coalescence level in the alloys due to differences in particle
164

Chapter 5. Cavity Controlled Failure Mechanism
Figure 5.38: A plot of number of the cavities, classified into spheroids, elliptical androd-like shapes based on their aspect ratios, at different strains for AZ61HC, deformed at350 C at a strain rate of 5× 10⁻⁴ s−1.
Figure 5.39: A plot of average cavity growth rate (dr/dε) showing a comparison betweentheoretical models based on diffusion and plasticity and experimental data from SEM andµCT for the chill-cast alloys deformed at 350 C at a strain rate of 5× 10⁻⁴ s−1.
fraction and spacing. From the µCT, it was confirmed that most cavities originated at
the particle/matrix interfaces. It was also argued that if particles are agglomerated,
the chance of cavitation and coalescence is very high. Therefore, the higher growth
rate in the high manganese alloys is not unexpected. However, it should be borne in
mind that particles act to nucleate cavities. If particles are closely spaced, the chances
of early coalescence increases. Since a large particle fraction means a reduced inter-
particle spacing and particles are the source of cavitation, a larger fraction of particles
eventually leads to more extensive coalescence of cavities. The ηexperimental values for
the low manganese alloys are small which is due to the lower particle fraction (and
lower particle spacing) of these alloys. Moreover, η-values become smaller for a higher
strain rate sensitivity value (Pilling and Ridley, 1988a). Since AZ31LC had the largest
m, a lower η for AZ31LC is not surprising.
165

Chapter 5. Cavity Controlled Failure Mechanism
Table 5.5: Estimation of cavity growth rate parameter (η) at a strainrate of 5× 10⁻⁴ s−1
Temperature, C AZ31LC AZ31HC AZ61LC AZ61HC
300 3.74 3.83 3.90 4.35
350 4.37 4.55 4.88 5.42
400 3.69 4.16 4.75 4.70
450 3.89 3.93 4.48 4.82
Figure 5.40: A comparison between theoretical and experimental cavity growth rateparameter (η) obtained by plotting cavity volume fraction against true strains for (a)AZ31LC and (b) AZ31HC deformed at 350 C at a strain rate of 5× 10⁻⁴ s−1.
5.7 Continuous Nucleation of Cavities
There exists a debate in literature about the occurrence of continuous nucleation of
cavities during deformation. For an AZ31 alloy, Lee and Huang (2004) showed that
a plateau in the number of cavities was observed after a certain strain. Moreover,
Pilling and Ridley (1989) argued that resolution limitation of microscopy might not
detect the very small cavities which might grow during deformation and ultimately
would become visible at a higher strain.
However, in the alloys investigated in the current study, the number of cavities
has increased profoundly during straining. This is confirmed by µCT. In AZ61HC,
tomography data has detected an increase in the number of cavities by a factor of
3 during straining from 0.80 to 1.05. In Fig. 5.21, the actual number of particles
associated with cavities was plotted for two strain levels of AZ61HC at 350 C.
This reveals that at the higher strain, more particles are associated with cavities.
Also, cavities of different shapes and sizes are evident in the microstructure and
spherical cavities are observed even at the largest strain. Moreover, if the cavities
were nucleated at approximately the same time and grown from a small size (not
visible under imaging in SEM and µCT) as argued by Pilling and Ridley, the size of
166
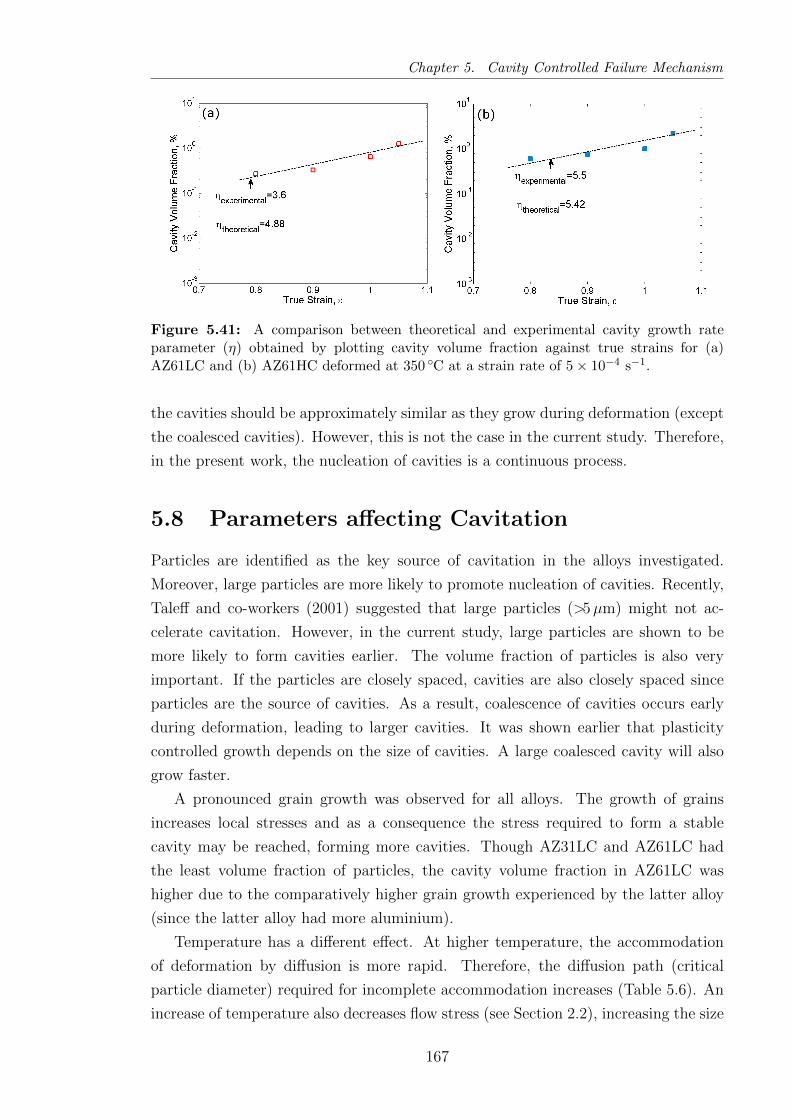
Chapter 5. Cavity Controlled Failure Mechanism
Figure 5.41: A comparison between theoretical and experimental cavity growth rateparameter (η) obtained by plotting cavity volume fraction against true strains for (a)AZ61LC and (b) AZ61HC deformed at 350 C at a strain rate of 5× 10⁻⁴ s−1.
the cavities should be approximately similar as they grow during deformation (except
the coalesced cavities). However, this is not the case in the current study. Therefore,
in the present work, the nucleation of cavities is a continuous process.
5.8 Parameters affecting Cavitation
Particles are identified as the key source of cavitation in the alloys investigated.
Moreover, large particles are more likely to promote nucleation of cavities. Recently,
Taleff and co-workers (2001) suggested that large particles (>5µm) might not ac-
celerate cavitation. However, in the current study, large particles are shown to be
more likely to form cavities earlier. The volume fraction of particles is also very
important. If the particles are closely spaced, cavities are also closely spaced since
particles are the source of cavities. As a result, coalescence of cavities occurs early
during deformation, leading to larger cavities. It was shown earlier that plasticity
controlled growth depends on the size of cavities. A large coalesced cavity will also
grow faster.
A pronounced grain growth was observed for all alloys. The growth of grains
increases local stresses and as a consequence the stress required to form a stable
cavity may be reached, forming more cavities. Though AZ31LC and AZ61LC had
the least volume fraction of particles, the cavity volume fraction in AZ61LC was
higher due to the comparatively higher grain growth experienced by the latter alloy
(since the latter alloy had more aluminium).
Temperature has a different effect. At higher temperature, the accommodation
of deformation by diffusion is more rapid. Therefore, the diffusion path (critical
particle diameter) required for incomplete accommodation increases (Table 5.6). An
increase of temperature also decreases flow stress (see Section 2.2), increasing the size
167
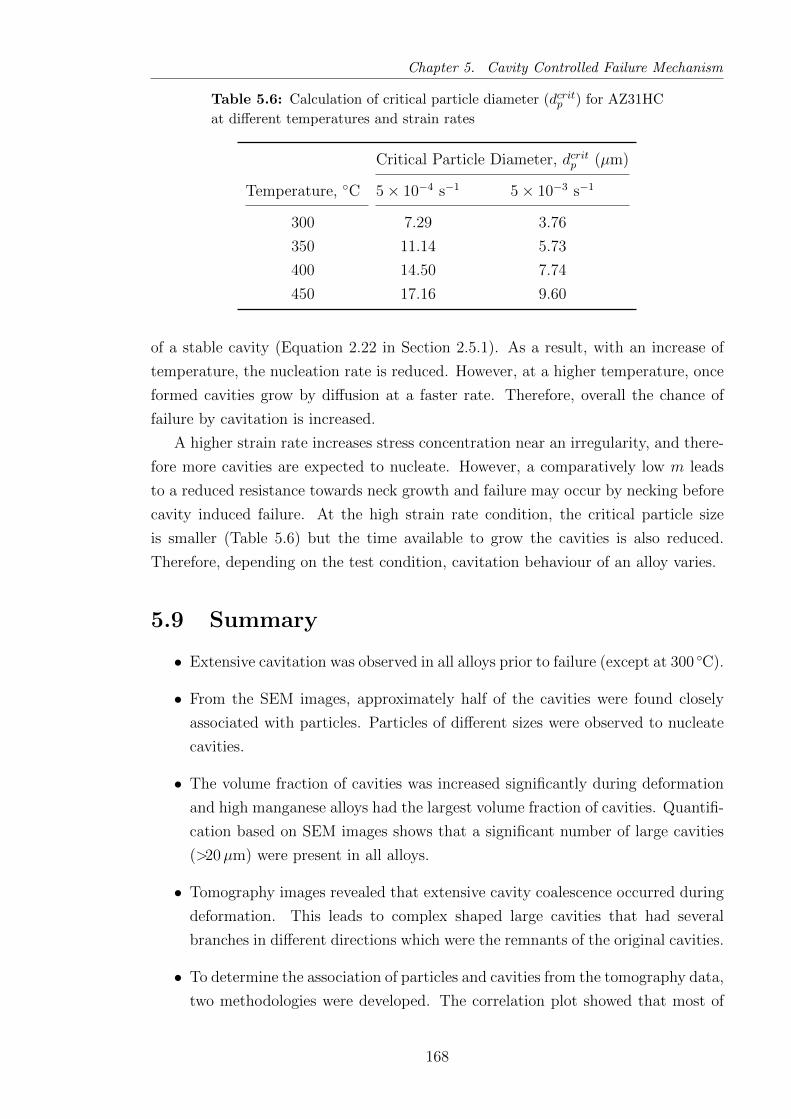
Chapter 5. Cavity Controlled Failure Mechanism
Table 5.6: Calculation of critical particle diameter (dcritp ) for AZ31HC
at different temperatures and strain rates
Critical Particle Diameter, dcritp (µm)
Temperature, C 5× 10⁻⁴ s−1 5× 10⁻³ s−1
300 7.29 3.76
350 11.14 5.73
400 14.50 7.74
450 17.16 9.60
of a stable cavity (Equation 2.22 in Section 2.5.1). As a result, with an increase of
temperature, the nucleation rate is reduced. However, at a higher temperature, once
formed cavities grow by diffusion at a faster rate. Therefore, overall the chance of
failure by cavitation is increased.
A higher strain rate increases stress concentration near an irregularity, and there-
fore more cavities are expected to nucleate. However, a comparatively low m leads
to a reduced resistance towards neck growth and failure may occur by necking before
cavity induced failure. At the high strain rate condition, the critical particle size
is smaller (Table 5.6) but the time available to grow the cavities is also reduced.
Therefore, depending on the test condition, cavitation behaviour of an alloy varies.
5.9 Summary
• Extensive cavitation was observed in all alloys prior to failure (except at 300 C).
• From the SEM images, approximately half of the cavities were found closely
associated with particles. Particles of different sizes were observed to nucleate
cavities.
• The volume fraction of cavities was increased significantly during deformation
and high manganese alloys had the largest volume fraction of cavities. Quantifi-
cation based on SEM images shows that a significant number of large cavities
(>20µm) were present in all alloys.
• Tomography images revealed that extensive cavity coalescence occurred during
deformation. This leads to complex shaped large cavities that had several
branches in different directions which were the remnants of the original cavities.
• To determine the association of particles and cavities from the tomography data,
two methodologies were developed. The correlation plot showed that most of
168
Chapter 5. Cavity Controlled Failure Mechanism
the particle and cavity voxels were within a distance which confirmed their
close association. The dilation and intersection method measured the distance
between particle and cavity regions and 90% cavities were found attached to
particles. Results were compared with generated random data set to check
validity of the methodoligies.
• The particles, truly connected with cavities, were tagged from the tomography
data. At ε = 0.90, mostly large particles were found to nucleate cavities. In
contrast, at ε= 1.05, particles of all sizes nucleated cavities. Moreover, not all
large particles nucleated cavities. Depending on the concurrent grain growth,
different sizes of particles act as cavity nucleation site.
• Cavities up to a diameter of 6µm were grown by stress controlled diffusion
and growth of the larger cavities was governed by plasticity. However, the
commonly used models do not account for coalescence of cavities and hence do
not correctly predict cavity growth rate.
• Agglomeration of particles had a significant effect on cavitation. If particles
are closely spaced, it is possible that smaller particles, generally not nucleating
cavities, can act as a cavity formation site. Moreover, coalescence of these
closely spaced cavities occurs early, leading to large cavities. This is one of the
reasons for higher cavitation in the high manganese alloys.
• Analysis of tomography data showed that most cavities were elliptical in shape
and several other were rod-like (thin and very elongated) due to the effect
of coalescence. A small number of spherical cavities were observed even at
the largest strain which clearly indicated that nucleation of cavities was a
continuous phenomenon. Also, the continuous increase of cavity number during
deformation supported this observation.
• Since particles are the key parameter for cavitation, alloys having a lower
fraction of particles showed fewer cavities. Therefore the low manganese alloys
had the least volume fraction of cavities. However, extensive grain growth in
the high aluminium and low manganese alloy (AZ61LC) increased local stress
which allowed nucleation of cavities with smaller radii. This is one of the reasons
for the increased cavitation in AZ61LC compared to AZ31LC.
• At 300 C, the least formation of cavities was observed which was due to
the lower diffusional growth of cavities. The failure of the alloys occurred
predominantly by cavitation at 350 and 400 C. At 450 C, rapid diffusional
activity prevented extensive nucleation of cavities, but the cavities that did
form grew faster by diffusion.
169
Chapter 6
Conclusions
The hot deformation behaviour and failure mode of four AZ series magnesium alloys
with different levels of aluminium and manganese have been studied over a range of
temperatures and strain rates typical of those used for superplastic forming. Cav-
itation at large aluminium-manganese intermetallic particles has been shown to be
the main failure mechanism with differences between the alloys attributed mainly
to the different distribution of these particles. Only at the lowest test temperature
used (300 C) cavitation was not dominant and in this case failure occurred by diffuse
necking. Below the key findings of this project are highlighted.
• Hot rolling of the alloys with an equal strain of 0.12 in each rolling pass
successfully produced a dynamically recrystallized microstructure having an
average grain size 7 to 9µm and strong basal texture.
• The alloys contained a significant fraction of coarse particles. These were
aluminium-manganese intermetallics with varying stoichiometric formulae de-
pending on alloy composition. The volume fraction of the particles was found
to be higher for the high manganese alloys. The size distribution of the particles
varied significantly, primarily depending on manganese content, and particles
agglomerates greater than 20µm were evident in the higher manganese alloys.
• The flow behaviour of the alloys was similar up to the maximum stress level.
The only difference was found to be a weak effect of aluminium solute which
provided some additional solute solution strengthening and a slight increase in
flow stress in the high aluminium alloys. Flow softening occurred in all alloys,
but a more rapid softening was found for the high manganese alloys. At any
particular test condition, manganese content apparently controlled the strain
to failure.
• The activation energy of deformation was close to that for grain boundary
diffusion for all test conditions and coupled with lack of grain elongation this
170
Chapter 6. Conclusions
suggests the deformation of the alloys was likely to be dominated by sliding of
grains.
• Strain rate sensitivity (m) values increased with increasing temperature but at
450 C, the values were reduced slightly due to extensive grain growth. Using
analysis of variance method, addition of aluminium found to reduce m-values.
• Apart from temperature, the strain to failure (ef ) was most strongly influenced
by the manganese content of the alloys. Manganese forms particles which
appeared to act as cavity formation sites.
• Grain growth occurred at all temperatures. But, at 450 C, substantial growth
was observed leading to an increase in grain size up to a factor of 4. Apart from
temperature, the growth of grains was influenced by the addition of aluminium,
with a higher level of aluminium leading to an increased grain growth rate.
Grain growth during testing decreased m-values gradually.
• The volume fraction of cavities increased during testing and the high manganese
alloys showed a higher cavity volume fraction.
• SEM observation showed that at least half of the cavities were associated with
particles. To confirm the association of particles and cavities, X-ray micro
tomography was carried out and two different methodologies were developed to
quantitatively study the particle/cavity association. Both methods confirmed
that cavities were closely associated with particles and 90% cavities were con-
nected to particles.
• Tomography revealed that at lower strains, cavities formed almost exclusively
at the largest particles only. At larger strains, progressively smaller particles
became cavity formation sites. This is expected since grain growth increased
the local stresses which allowed cavities formed at smaller particles to become
stable.
• Measurement of cavity shape and theoretical calculations suggest that the
growth of cavities of size less than 6µm was controlled by stress-induced dif-
fusional processes and the growth of larger cavities was governed by plasticity.
Tomography data revealed the importance of coalescence of cavities in control-
ling cavity shape and orientation.
• The coalescence of cavities depended on particle volume fraction since particles
were the source of cavitation. The larger the number of particles, the greater
was the chance of coalescence. This was the reason for lower ef of the high
manganese alloys.
171
Chapter 6. Conclusions
• Agglomeration of particles had a significant effect. This allowed smaller par-
ticles to nucleate cavities even if individually they were below the critical size
for cavity formation. Moreover, such closely-spaced cavities coalesced early,
leading to very large cavities.
172

References
Abramoff, M. D., P. J. Magelhaes, and S. J. Ram (2004). “Image Processing withImageJ”. In: Biophotonics International 11.7, pp. 36–42. (Cit. on p. 89).
Aghion, E., B. Bronfin, and D. Eliezer (2001). “The role of the magnesium industryin protecting the environment”. In: Journal of Materials Processing Technology117.3, pp. 381–385. (Cit. on p. 18).
Agnew, S. R. (2004). “Wrought magnesium: A 21st century outlook”. In: JOM 56.5,pp. 20–21. (Cit. on p. 26).
Agnew, S. R., M. H. Yoo, and C. N. Tome (2001). “Application of texture simulationto understanding mechanical behavior of Mg and solid solution alloys containingLi or Y”. In: Acta Materialia 49.20, pp. 4277–4289. (Cit. on pp. 31, 34).
Aigeltinger, E. H. and R. C. Gifkins (1977). “Cavitation during diffusion creep of amagnesium alloy”. In: Journal of Materials Science 12.5, pp. 915–918. (Cit. onp. 78).
Akhtar, A. and E. Teghtsoonian (1969). “Solid solution strengthening of magnesiumsingle crystals–ii the effect of solute on the ease of prismatic slip”. In: ActaMetallurgica 17.11, pp. 1351–1356. (Cit. on p. 28).
Al-Samman, T. (2009). “Comparative study of the deformation behavior of hexagonalmagnesium-lithium alloys and a conventional magnesium AZ31 alloy”. In: ActaMaterialia 57.7, pp. 2229–2242. (Cit. on pp. 31, 106).
Al-Samman, T. and G. Gottstein (2008). “Influence of strain path change on therolling behavior of twin roll cast magnesium alloy”. In: Scripta Materialia 59.7,pp. 760–763. (Cit. on p. 83).
Alden, T. H. (1967). “The origin of superplasticity in the sn-5%bi alloy”. In: ActaMetallurgica 15.3, pp. 469–480. (Cit. on p. 40).
Ando, D., J. Koike, and Y. Sutou (2010). “Relationship between deformation twinningand surface step formation in AZ31 magnesium alloys”. In: Acta Materialia 58.13,pp. 4316–4324. (Cit. on p. 32).
Argon, A. S. and S. Takeuchi (1981). “Internal stresses in power-law creep”. In: ActaMetallurgica 29.11, pp. 1877–1884. (Cit. on p. 56).
Ash, B. A. and C. H. Hamilton (1988). “Strain and strain-rate hardening characteris-tics of a superplastic AlLiCuZr alloy”. In: Scripta Metallurgica 22.2, pp. 277–282.(Cit. on p. 63).
Ashby, M. F. (1972). “A first report on deformation-mechanism maps”. In: ActaMetallurgica 20.7, pp. 887–897. (Cit. on p. 42).
Ashby, M. F. and R. A. Verrall (1973). “Diffusion-accommodated flow and superplas-ticity”. In: Acta Metallurgica 21.2, pp. 149–163. (Cit. on p. 52).
Bae, D. H. and A. K. Ghosh (2002a). “Cavity formation and early growth in asuperplastic Al-Mg alloy”. In: Acta Materialia 50.3, pp. 511–523. (Cit. on pp. 77,151).
— (2002b). “Cavity growth during superplastic flow in an Al-Mg alloy: I. Experi-mental study”. In: Acta Materialia 50.5, pp. 993–1009. (Cit. on pp. 77, 78).
173
References
Ball, A. and M. M. Hutchison (1969). “Superplasticity in the Aluminium ZincEutectoid”. In: Metal Science 3.1, pp. 1–7. (Cit. on pp. 41, 48).
Balluffi, R. W. and L. L. Seigle (1957). “Growth of voids in metals during diffusionand creep”. In: Acta Metallurgica 5.8, pp. 449–454. (Cit. on pp. 65, 66, 69, 70).
Barnett, M. R. (2001). “Influence of deformation conditions and texture on the hightemperature flow stress of magnesium AZ31”. In: Journal of Light Metals 1.3,pp. 167–177. (Cit. on p. 107).
— (2003). “A taylor model based description of the proof stress of magnesiumAZ31 during hot working”. In: Metallurgical and Materials Transactions A 34.9,pp. 1799–1806. (Cit. on p. 31).
Barnett, M. R., Z. Keshavarz, A. G. Beer, and D. Atwell (2004). “Influence of grainsize on the compressive deformation of wrought Mg-3Al-1Zn”. In: Acta Materialia52.17, pp. 5093–5103. (Cit. on p. 33).
Barnett, M. R., Z. Keshavarz, and M. Nave (2005). “Microstructural features of rolledMg-3Al-1Zn”. In: Metallurgical and Materials Transactions A 36.7, pp. 1697–1704.(Cit. on p. 37).
Bate, P. S. (2001). “The effect of deformation on grain growth in Zener pinnedsystems”. In: Acta Materialia 49.8, pp. 1453–1461. (Cit. on p. 63).
— (2006). MSc class notes. (Cit. on pp. 93, 119).Bate, P. S., F. J. Humphreys, N. Ridley, and B. Zhang (2005). “Microstructure and
texture evolution in the tension of superplastic Al-6Cu-0.4Zr”. In: Acta Materialia53.10, pp. 3059–3069. (Cit. on p. 51).
Bauer, R. W. and H. G. F. Wilsdorf (1973). “Void initiation in ductile fracture”. In:Scripta Metallurgica 7.11, pp. 1213–1220. (Cit. on p. 65).
Beere, W. and M. V. Speight (1978). “Creep cavitation by vacancy diffusion inplastically deforming solid”. In: Metal Science 12, pp. 172–176. (Cit. on pp. 69,70, 156).
Bell, R. L. and T. G. Langdon (1967). “An investigation of grain-boundary slidingduring creep”. In: Journal of Materials Science 2.4, pp. 313–323. (Cit. on p. 46).
Bohlen, J., D. Letzig, and K.U. Kainer (2007). “New perspectives for wroughtmagnesium alloys”. In: Materials Science Forum 546-549.PART 1, pp. 1–10. (Cit.on p. 19).
Brandes, E. A. and G. B. Brook (1998). Smithells Light Metals Handbook. Oxford:Elsevier Butterworth-Heinemann, p. 176. (Cit. on p. 82).
Brinkman, J. A. (1955). “Mechanism of pore formation associated with the Kirkendalleffect”. In: Acta Metallurgica 3.2, pp. 140–145. (Cit. on p. 65).
Burton, B. (1974). “On the growth of grain boundary cavities in poiycrystallinematerials”. In: Philosophical Magazine 30.4, pp. 953–956. (Cit. on p. 71).
Caceres, C. H. and A. Blake (2002). “The Strength of Concentrated Mg-Zn SolidSolutions”. In: physica status solidi (a) 194.1, pp. 147–158. (Cit. on p. 28).
Caceres, C. H. and D.S Wilkinson (1984a). “Large strain behaviour of a superplasticcopper alloy–I. Deformation”. In: Acta Metallurgica 32.3, pp. 415–422. (Cit. onpp. 57, 164).
Caceres, C. H. and D.S. Wilkinson (1984b). “Large strain behaviour of a superplasticcopper alloy–II. Cavitation and fracture”. In: Acta Metallurgica 32.3, pp. 423–434.(Cit. on pp. 74, 75).
174
References
Cannon, W. R. (1972). “The contribution of grain boundary sliding to axial strainduring diffusion creep”. In: Philosophical Magazine 25.6, pp. 1489–1497. (Cit. onpp. 47, 48).
Celotto, S. (2000). “TEM study of continuous precipitation in Mg-9 wt%Al-1 wt%Znalloy”. In: Acta Materialia 48.8, pp. 1775–1787. (Cit. on p. 27).
Chang, J., E. Taleff, and P. Krajewski (2009). “Effect of Microstructure on Cavitationduring Hot Deformation of a Fine-Grained Aluminum-Magnesium Alloy asRevealed through Three-Dimensional Characterization”. In: Metallurgical andMaterials Transactions A 40.13, pp. 3128–3137. (Cit. on pp. 77, 78).
Chen, C. W. and E. S. Machlin (1956). “On the mechanism of intelcrystallinecracking”. In: Acta Metallurgica 4.6, pp. 655–656. (Cit. on p. 66).
Chino, Yasumasa, Katsuya Kimura, and Mamoru Mabuchi (2009). “Deformationcharacteristics at room temperature under biaxial tensile stress in textured AZ31Mg alloy sheets”. In: Acta Materialia 57.5, pp. 1476–1485. (Cit. on p. 37).
Chokshi, A. H. and T. G. Langdon (1987). “Model for diffusional cavity growth insuperplasticity”. In: Acta Metallurgica 35.5, pp. 1089–1101. (Cit. on p. 71).
— (1990). “The nucleation and growth of cavities in a superplastic quasi-single phasecopper alloy”. In: Acta Metallurgica et Materialia 38.5, pp. 867–877. (Cit. onp. 76).
Chokshi, A. H. and A. K. Mukherjee (1989a). “An analysis of cavity nucleation insuperplasticity”. In: Acta Metallurgica 37.11, pp. 3007–3017. (Cit. on pp. 68, 150).
— (1989b). “The cavitation and fracture characteristics of a superplastic Al–Cu–Li–Zr alloy”. In: Materials Science and Engineering: A 110, pp. 49–60. (Cit. onpp. 76, 77).
Chokshi, A. H., K. M. A., and T. G. Langdon (1993a). “Superplasticity in advancedmaterials”. In: Materials Science and Engineering: R: Reports 10.6, pp. 237–274.(Cit. on p. 38).
Chokshi, A. H., A. K. Mukherjee, and T. G. Langdon (1993b). “Superplasticityin advanced materials”. In: quoted in Bengough, G.D.: Materials Science andEngineering: R: Reports 10.6, pp. 237–274. (Cit. on p. 42).
Chokshi, Atul H. (1986). “Development of cavity growth maps for superplasticmaterials”. In: Journal of Materials Science 21.6, pp. 2073–2082. (Cit. on p. 71).
Christian, J. W. and S. Mahajan (1995). “Deformation twinning”. In: Progress inMaterials Science 39.1-2, pp. 1–157. (Cit. on p. 32).
Chuvil’deev, V. N., T. G. Nieh, M. Yu. Gryaznov, A. N. Sysoev, and V. I. Kopylov(2004a). “Low-temperature superplasticity and internal friction in microcrys-talline Mg alloys processed by ECAP”. In: Scripta Materialia 50.6, pp. 861–865.(Cit. on p. 39).
Chuvil’deev, V. N., T. G. Nieh, M. Yu. Gryaznov, V. I. Kopylov, and A. N. Sysoev(2004b). “Superplasticity and internal friction in microcrystalline AZ91 and ZK60magnesium alloys processed by equal-channel angular pressing”. In: Journal ofAlloys and Compounds 378.1-2, pp. 253–257. (Cit. on p. 39).
Clark, J. B. (1968). “Age hardening in a Mg-9 wt% Al alloy”. In: Acta Metallurgica16.2, pp. 141–152. (Cit. on p. 27).
Clark, M. A. and T. H. Alden (1973). “Deformation enhanced grain growth in asuperplastic Sn-1% Bi alloy”. In: Acta Metallurgica 21.9, pp. 1195–1206. (Cit. onp. 63).
175
References
Cliff, G., D.J. Powell, R. Pilkington, P.E. Champness, and G.W. Lorimer (1984).“X-ray microanalysis of second phase particles in thin foils”. In: Inst. Phys. Conf.Ser. Electron Microscopy and Analysis, Paper presented at EMAG, Guildford, 30August–2 September 1983. Ed. by P. Doig. Vol. No. 68: Chapter 3. London: TheInstitute of Physics, pp. 63–66. (Cit. on pp. 101, 103).
Coble, R. L. (1963). “A Model for Boundary Diffusion Controlled Creep in Polycrys-talline Materials”. In: Journal of Applied Physics 34.6, pp. 1679–1682. (Cit. onp. 45).
Cottrell, A. H. (1961). “Intercrystalline Creep Fractures”. In: Structural Processesin Creep. Vol. Special Report Number 70. London: The Iron and Steel Institute,pp. 1–18. (Cit. on p. 67).
Cottrell, A. H. and M. A. Jaswon (1949). “Distribution of Solute Atoms Rounda Slow Dislocation”. In: Proceedings of the Royal Society of London. Series A.Mathematical and Physical Sciences 199.1056, pp. 104–114. (Cit. on p. 54).
Davies, C. and M. Barnett (2004). “Expanding the extrusion limits of wroughtmagnesium alloys”. In: JOM 56.5, pp. 22–24. (Cit. on p. 26).
Davies, P. W. and J. P. Dennison (1958). “Void nucleation sites in creep of metals”.In: Nature 182.4628, pp. 131–132. (Cit. on p. 66).
Davies, P. W. and K. R. Williams (1969). “Strain-Induced Cavity Development duringCreep”. In: Metal Science 3, pp. 48–50. (Cit. on p. 75).
Del Valle, J., M. Perez-Prado, and O. Ruano (2005). “Deformation mechanismsresponsible for the high ductility in a Mg AZ31 alloy analyzed by electronbackscattered diffraction”. In: Metallurgical and Materials Transactions A 36.6,pp. 1427–1438. (Cit. on pp. 60, 116).
Del Valle, J. A. and O. A. Ruano (2006). “Influence of the grain size on the strain ratesensitivity in an Mg-Al-Zn alloy at moderate temperatures”. In: Scripta Materialia55.9, pp. 775–778. (Cit. on p. 125).
Del Valle, J. A., M. T. Perez-Prado, and O. A. Ruano (2003). “Texture evolutionduring large-strain hot rolling of the Mg AZ61 alloy”. In: Materials Science andEngineering A 355.1-2, pp. 68–78. (Cit. on pp. 35, 37, 96).
Del Valle, J. A., F. Carreno, and O. A. Ruano (2006). “Influence of texture andgrain size on work hardening and ductility in magnesium-based alloys processedby ECAP and rolling”. In: Acta Materialia 54.16, pp. 4247–4259. (Cit. on p. 33).
Derby, B. and M. F. Ashby (1987). “A Microstructural model for primary creep”. In:Acta Metallurgica 35.6, pp. 1349–1353. (Cit. on p. 56).
Dieter, G. E. (2001). Mechanical Metallurgy. SI Metric. Singapore: McGraw-Hill BookCompany, Chapter 4, 6, 8 and 20. (Cit. on pp. 29, 32, 33, 56, 114).
Ding, S. X., C. P. Chang, and P. W. Kao (2009). “Effects of Processing Parameters onthe Grain Refinement of Magnesium Alloy by Equal-Channel Angular Extrusion”.In: Metallurgical and Materials Transactions A 40.2, pp. 415–425. (Cit. on p. 37).
Doege, E., K. Droder, and St. Janssen (2003). “Deformation of Magnesium”. In:Magnesium - Alloys and Technologies. Ed. by K. U. Kainer. Weinheim: Wiley -VCH Verlag GmbH & Co, pp. 72–89. (Cit. on p. 25).
Dupuy, L. and J. J. Blandin (2002). “Damage sensitivity in a commercial Alalloy processed by equal channel angular extrusion”. In: Acta Materialia 50.12,pp. 3253–3266. (Cit. on p. 77).
176
References
Ecob, N. and B. Ralph (1983). “The effect of grain size on deformation twinningin a textured zinc alloy”. In: Journal of Materials Science 18.8, pp. 2419–2429.(Cit. on p. 32).
Eddahbi, M., J. A. del Valle, M. T. Perez-Prado, and O. A. Ruano (2005). “Com-parison of the microstructure and thermal stability of an AZ31 alloy processedby ECAP and large strain hot rolling”. In: Materials Science and Engineering: A410-411, pp. 308–311. (Cit. on p. 82).
Edington, J. W., K. N. Melton, and C. P. Cutler (1976). “Superplasticity”. In:Progress in Materials Science 21.1-2, pp. 61–170. (Cit. on pp. 40, 41, 44–46, 49,54, 57).
Edward, G.H. and M.F. Ashby (1979). “Intergranular fracture during power-lawcreep”. In: Acta Metallurgica 27.9, pp. 1505–1518. (Cit. on p. 71).
Endoh, S. (2006). Powder Technology Handbook. Edition 3rd. Boca Raton, Florida:CRC Press, Taylor & Francis Group, Chapter 1.3. (Cit. on pp. 155, 160).
Erickson, S. C. (1990). “Pure Metals, Magnesium”. In: Metals Handbook, Propertiesand Selection: Nonferrous Alloys and Special-Purpose Materials. Vol. 2. USA:ASM International. (Cit. on p. 22).
Fan, Z., Y. Wang, M. Xia, and S. Arumuganathar (2009). “Enhanced heterogeneousnucleation in AZ91D alloy by intensive melt shearing”. In: Acta Materialia 57.16,pp. 4891–4901. (Cit. on p. 28).
Feldkamp, L. A., L. C. Davis, and J. W. Kress (1984). “Practical cone-beamalgorithm”. In: Journal of the Optical Society of America A 1.6, pp. 612–619.(Cit. on p. 88).
Figueiredo, R. B. and T. G. Langdon (2008). “Record Superplastic Ductility in aMagnesium Alloy Processed by Equal-Channel Angular Pressing”. In: AdvancedEngineering Materials 10.1-2, pp. 37–40. (Cit. on pp. 38, 39, 62).
— (2009b). “Strategies for achieving high strain rate superplasticity in magnesiumalloys processed by equal-channel angular pressing”. In: Scripta Materialia 61.1,pp. 84–87. (Cit. on p. 41).
— (2009a). “Principles of grain refinement and superplastic flow in magnesium alloysprocessed by ECAP”. In: Materials Science and Engineering: A 501.1-2, pp. 105–114. (Cit. on p. 125).
Fisher, J. C. (1955). “A dislocation model for the origin of fracture cracks in metalcrystals”. In: Acta Metallurgica 3.1, pp. 109–110. (Cit. on p. 66).
Friedel, J. (1964). Dislocations. Vol. 3. Solid State Physics. Oxford: Pergamon PressLtd., pp. 6, 279, 290. (Cit. on pp. 44, 48).
Frost, H. J. and M. F. Ashby (1982). Deformation-Mechanism Maps: The Plasticityand Creep of Metals and Ceramics. Oxford: Pergamon Press, Chapter 2 and 6.(Cit. on pp. 45, 56, 114, 116, 120).
Furui, M., H. Kitamura, H. Anada, and T. G. Langdon (2007). “Influence ofpreliminary extrusion conditions on the superplastic properties of a magnesiumalloy processed by ECAP”. In: Acta Materialia 55.3, pp. 1083–1091. (Cit. onp. 39).
Galano, M., F. Audebert, A. G. Escorial, I. C. Stone, and B. Cantor (2009).“Nanoquasicrystalline Al-Fe-Cr-based alloys. Part II. Mechanical properties”. In:Acta Materialia 57.17, pp. 5120–5130. (Cit. on p. 77).
177
References
Galiyev, A., R. Kaibyshev, and G. Gottstein (2001). “Correlation of plastic deforma-tion and dynamic recrystallization in magnesium alloy ZK60”. In: Acta Materialia49.7, pp. 1199–1207. (Cit. on p. 36).
Gehrmann, R., M. M. Frommert, and G. Gottstein (2005). “Texture effects on plasticdeformation of magnesium”. In: Materials Science and Engineering A 395.1-2,pp. 338–349. (Cit. on p. 34).
Ghosh, A. K. (1977). “Tensile instability and necking in materials with strainhardening and strain-rate hardening”. In: Acta Metallurgica 25.12, pp. 1413–1424.(Cit. on p. 58).
Gibeling, J.G. and W.D. Nix (1980). “A numerical study of long range internalstresses associated with subgrain boundaries”. In: Acta Metallurgica 28.12,pp. 1743–1752. (Cit. on p. 56).
Gifkins, R. C. (1956). “A mechanism for the formation of intergranular cracks whenboundary sliding occurs”. In: Acta Metallurgica 4.1, pp. 98–99. (Cit. on pp. 66,67, 75).
— (1976). “Grain-boundary sliding and its accommodation during creep and super-plasticity”. In: Metallurgical and Materials Transactions A 7.7, pp. 1225–1232.(Cit. on p. 50).
— (1978). “Grain rearrangements during superplastic deformation”. In: Journal ofMaterials Science 13.9, pp. 1926–1936. (Cit. on pp. 51–53).
— (1991). “Ductility and strain-rate control mechanisms in superplasticity”. In:Scripta Metallurgica et Materialia 25.6, pp. 1397–1400. (Cit. on p. 51).
— (1994). “Grain-boundary participation in high-temperature deformation: an his-torical review”. In: Materials Characterization 32.2, pp. 59–77. (Cit. on pp. 50,51).
Gifkins, R. C., T. G. Langdon, and D. McLean (1975). “Grain-Boundary Sliding andAxial Strain during Diffusional Creep”. In: Metal Science 9, pp. 141–144. (Cit. onp. 47).
Glicksman, M. E. and R. N. Hills (2001). “Non-equilibrium segregation duringalloy solidification”. In: Philosophical Magazine A: Physics of Condensed Matter,Structure, Defects and Mechanical Properties 81.1, pp. 153–159. (Cit. on p. 88).
Goods, S.H and W.D Nix (1978). “The coalescence of large grain boundary cavitiesin silver during tension creep”. In: Acta Metallurgica 26.5, pp. 753–758. (Cit. onp. 74).
Greenwood, G.W. and J. E. Harris (1965). “Note on vacancy condensation onparticles”. In: Acta Metallurgica 13.8, pp. 936–936. (Cit. on p. 67).
Greenwood, J. Neill, D. R. Miller, and J. W. Suiter (1954). “Intergranular cavitationin stressed metals”. In: Acta Metallurgica 2.2, pp. 250–258. (Cit. on p. 65).
Groves, G. W. and A. Kelly (1963). “Independent slip systems in crystals”. In:Philosophical Magazine 8.89, pp. 877–887. (Cit. on p. 30).
Gudmundsson, H., D. Brooks, and J.A. Wert (1991). “Mechanisms of continuousrecrystallization in an Al–Zr–Si alloy”. In: Acta Metallurgica et Materialia 39.1,pp. 19–35. (Cit. on p. 62).
Hamilton, C. H., C. C. Bampton, and N. E. Paton (1982). “Superplasticity in HighStrength Aluminum Alloys”. In: Superplastic Forming of Structural Alloys. Ed. byN. E. Paton and C. H. Hamilton. San Diego: The Metallurgical Society of AIME,pp. 173–189. (Cit. on p. 40).
178

References
Hancock, J. W. (1976). “Creep cavitation without a vacancy flux”. In: Metal Science10, pp. 319–325. (Cit. on pp. 72, 156).
Harper, J and J.E Dorn (1957). “Viscous creep of aluminum near its meltingtemperature”. In: Acta Metallurgica 5.11, pp. 654–665. (Cit. on p. 46).
Harris, G. W., V. J. Haddrell, and G. A. Rickards (1962). “Metallographic exami-nation of intergranular creep cavities in two magnesium alloys”. In: Journal ofNuclear Materials 6.1, pp. 144–147. (Cit. on p. 78).
Harris, J. E. (1965). “An analysis of creep ductility of magnox Al80 and itsimplications”. In: Journal of Nuclear Materials 15.3, pp. 201–207. (Cit. on p. 67).
Hart, E. W. (1957). “On the role of dislocations in bulk diffusion”. In: ActaMetallurgica 5.10, pp. 597–597. (Cit. on p. 56).
— (1967). “A theory for flow of polycrystals”. In: Acta Metallurgica 15.9, pp. 1545–1549. (Cit. on p. 57).
Herring, C. (1950). “Diffusional Viscosity of a Polycrystalline Solid”. In: Journal ofApplied Physics 21.5, pp. 437–445. (Cit. on p. 44).
Hosokawa, H., H. Iwasaki, T. Mori, M. Mabuchi, T. Tagata, and K. Higashi (1999).“Effects of Si on deformation behavior and cavitation of coarse-grained Al-4.5Mgalloys exhibiting large elongation”. In: Acta Materialia 47.6, pp. 1859–1867. (Cit.on p. 78).
Housh, S., B. Mikucki, and A. Stevenson (1990). ASM Handbook, Properties andSelection: Nonferrous Alloys and Special-Purpose Materials. Vol. Volume 2.USA: ASM International, Chapter Selection and Application of Magnesium andMagnesium Alloys. (Cit. on pp. 24, 25).
Hull, D. and D. E. Rimmer (1959). “Growth of grain-boundary voids under stress”.In: Philosophical Magazine 4.42, pp. 673–687. (Cit. on pp. 68, 69).
Humphreys, F. J. and M. Hatherly (2004). Recrystallization and Related Phenomena.2nd Edition. Oxford: Elsevier Ltd, Chapter 5 and 13. (Cit. on pp. 34–36, 123).
Humphries, C. W. and N. Ridley (1978). “Cavitation during the superplastic defor-mation of an α/β brass”. In: Journal of Materials Science 13.11, pp. 2477–2482.(Cit. on p. 77).
Imayev, R. M., G. A. Salishchev, O. N. Senkov, V. M. Imayev, M. R. Shagiev,N. K. Gabdullin, A. V. Kuznetsov, and F. H. Froes (2001). “Low-temperaturesuperplasticity of titanium aluminides”. In: Materials Science and Engineering A300.1-2, pp. 263–277. (Cit. on p. 39).
Ion, S. E., F. J. Humphreys, and S. H. White (1982). “Dynamic recrystallisation andthe development of microstructure during the high temperature deformation ofmagnesium”. In: Acta Metallurgica 30.10, pp. 1909–1919. (Cit. on pp. 34, 35).
Isaac, A., F. Sket, W. Reimers, B. Camin, G. Sauthoff, and A. R. Pyzalla (2008). “Insitu 3D quantification of the evolution of creep cavity size, shape, and spatialorientation using synchrotron X-ray tomography”. In: Materials Science andEngineering: A 478.1-2, pp. 108–118. (Cit. on p. 160).
Janecek, M., M. Popov, M. G. Krieger, R. J. Hellmig, and Y. Estrin (2007).“Mechanical properties and microstructure of a Mg alloy AZ31 prepared byequal-channel angular pressing”. In: Materials Science and Engineering A 462.1-2,pp. 116–120. (Cit. on p. 82).
Jiang, Xinggang, Jianzhong Cui, and Longxiang Ma (1993). “The influence ofthe rolling direction on the mechanical behavior and cavity formation during
179
References
superplastic deformation of 7075 A1 alloy”. In: Acta Metallurgica et Materialia41.9, pp. 2721–2727. (Cit. on p. 77).
Jin, Q., S. Shim, and S. Lim (2006). “Correlation of microstructural evolution andformation of basal texture in a coarse grained Mg-Al alloy during hot rolling”. In:Scripta Materialia 55.9, pp. 843–846. (Cit. on p. 35).
Kai, M., Z. Horita, and T. G. Langdon (2008). “Developing grain refinement andsuperplasticity in a magnesium alloy processed by high-pressure torsion”. In:Materials Science and Engineering: A 488.1-2, pp. 117–124. (Cit. on p. 37).
Kaibyshev, R. and O. Osipova (2005). “Superplastic behaviour of an Al-Li-Cu-Mgalloy”. In: Materials Science and Technology 21.10, pp. 1209–1216. (Cit. on p. 39).
Kainer, K. U. and F. von Buch (2003). “The Current State of Technology andPotential for further Development of Magnesium Applications”. In: MagnesiumAlloys and Technology. Ed. by K. U. Kainer. Weinheim: Wiley - VCH VerlagGmbH & Co, pp. 1–22. (Cit. on p. 23).
Kashyap, B. and K. Tangri (1987). “On the contribution of concurrent grain growthto strain”. In: Metallurgical and Materials Transactions A 18.4, pp. 417–424. (Cit.on p. 64).
Kassner, M. E. and M. Perez-Prado (2004). Fundamentals of Creep in Metals andAlloys. Oxford: Elsivier, Chapter 2, 3, 4 and 5. (Cit. on pp. 49, 56).
Kawasaki, M. and T. G. Langdon (2007). “Principles of superplasticity in ultrafine-grained materials”. In: Journal of Materials Science 42.5, pp. 1782–1796. (Cit. onp. 37).
Kawasaki, M., C. Xu, and T. G. Langdon (2005). “An investigation of cavity growthin a superplastic aluminum alloy processed by ECAP”. In: Acta Materialia 53.20,pp. 5353–5364. (Cit. on pp. 76, 78).
Kim, W. J., S. W. Chung, C. S. Chung, and D. Kum (2001). “Superplasticity in thinmagnesium alloy sheets and deformation mechanism maps for magnesium alloysat elevated temperatures”. In: Acta Materialia 49.16, pp. 3337–3345. (Cit. onpp. 38, 43, 59, 61).
Kim, Y. M., C. D. Yim, and B. S. You (2007). “Grain refining mechanism in Mg-Albase alloys with carbon addition”. In: Scripta Materialia 57.8, pp. 691–694. (Cit.on p. 28).
King, J. F. (2007). “Magnesium: commodity or exotic”. In: Materials Science andTechnology 23.1, pp. 1–14. (Cit. on pp. 18, 19).
Koike, J. and R. Ohyama (2005). “Geometrical criterion for the activation of prismaticslip in AZ61 Mg alloy sheets deformed at room temperature”. In: Acta Materialia53.7, pp. 1963–1972. (Cit. on p. 37).
Kulas, M., W. Green, E. Taleff, P. Krajewski, and T. McNelley (2006). “Failuremechanisms in superplastic AA5083 materials”. In: Metallurgical and MaterialsTransactions A 37.3, pp. 645–655. (Cit. on pp. 75, 78).
Langdon, T. G. (1970). “Grain boundary sliding as a deformation mechanism duringcreep”. In: Philosophical Magazine 22.178, pp. 689–700. (Cit. on p. 47).
— (1991). “The physics of superplastic deformation”. In: Materials Science andEngineering: A 137, pp. 1–11. (Cit. on p. 42).
— (1994). “A unified approach to grain boundary sliding in creep and superplastic-ity”. In: Acta Metallurgica et Materialia 42.7, pp. 2437–2443. (Cit. on p. 48).
— (2000). “Identifiying creep mechanisms at low stresses”. In: Materials Science andEngineering A 283.1-2, pp. 266–273. (Cit. on p. 47).
180

References
Langdon, T. G. (2009). “Seventy-five years of superplasticity: historic developmentsand new opportunities”. In: Journal of Materials Science 44.22, pp. 5998–6010.(Cit. on p. 38).
Langdon, T. G. and F. A. Mohamed (1976). “Deformation mechanism maps forceramics”. In: Journal of Materials Science 11.2, pp. 317–327. (Cit. on p. 45).
Laser, T., M. R. Nurnberg, A. Janz, Ch. Hartig, D. Letzig, R. Schmid-Fetzer, andR. Bormann (2006). “The influence of manganese on the microstructure andmechanical properties of AZ31 gravity die cast alloys”. In: Acta Materialia 54.11,pp. 3033–3041. (Cit. on pp. 29, 96).
Lee, C. J. and J. C. Huang (2004). “Cavitation characteristics in AZ31 Mg alloysduring LTSP or HSRSP”. In: Acta Materialia 52.10, pp. 3111–3122. (Cit. onpp. 61, 78, 79, 127, 166).
Lee, D (1969). “The nature of superplastic deformation in the Mg-Al eutectic”. In:Acta Metallurgica 17.8, pp. 1057–1069. (Cit. on p. 40).
Lee, S., M. Furukawa, Z. Horita, and T. G. Langdon (2003). “Developing a super-plastic forming capability in a commercial aluminum alloy without scandium orzirconium additions”. In: Materials Science and Engineering A 342.1-2, pp. 294–301. (Cit. on p. 39).
Lee, S. M. and T. G. Langdon (2001). “High strain rate superplasticity in a Zn -22equal-channel angular pressing”. In: Materials Science Forum 357-359, pp. 321–326. (Cit. on p. 39).
Li, F., D. H. Bae, and A. K. Ghosh (1997). “Grain elongation and anisotropic graingrowth during superplastic deformation in an Al–Mg–Mn–Cu alloy”. In: ActaMaterialia 45.9, pp. 3887–3895. (Cit. on p. 63).
Li, H.B., J. Zhao, J.T. Luo, and M. Hang (2007). “Superplastic Behaviors of CastingAZ31 Magnesium Alloy”. In: Materials Science Forum 551-552, pp. 237–239. (Cit.on p. 61).
Lin, H. K., J. C. Huang, and T. G. Langdon (2005). “Relationship between textureand low temperature superplasticity in an extruded AZ31 Mg alloy processed byECAP”. In: Materials Science and Engineering A 402.1-2, pp. 250–257. (Cit. onp. 39).
Livesey, D. W. and N. Ridley (1982). “Effect of grain size on cavitation in superplasticZn-Al eutectoid”. In: Journal of Materials Science 17.8, pp. 2257–2266. (Cit. onp. 77).
Livesey, D. W., N. Ridley, and A. K. Mukherjee (1984). “Activation energies forsuperplastic tensile and compressive flow in microduplex α/β copper alloys”. In:Journal of Materials Science 19.11, pp. 3602–3611. (Cit. on p. 41).
Lorimer, G. W., G. Cliff, P. E. Champness, C. Dickinson, F. Hasan, and P. Kenway(1984). “In-situ X-ray microanalysis of second phase particles in thin foils”.In: Analytical Electron Microscopy. Ed. by D.B. Williams and D.C. Joy. SanFrancisco: San Francisco Press, pp. 153–156. (Cit. on pp. 101, 103).
Lou, X.Y., M. Li, R. K. Boger, S. R. Agnew, and R. H. Wagoner (2007). “Hardeningevolution of AZ31B Mg sheet”. In: International Journal of Plasticity 23.1, pp. 44–86. (Cit. on pp. 33, 34).
Luo, A. and M. O. Pekguleryuz (1994). “Cast magnesium alloys for elevatedtemperature applications”. In: Journal of Materials Science 29.20, pp. 5259–5271.(Cit. on pp. 27, 28).
181
References
Ma, Z. Y. and R. S. Mishra (2003). “Cavitation in superplastic 7075Al alloys preparedvia friction stir processing”. In: Acta Materialia 51.12, pp. 3551–3569. (Cit. onpp. 76, 77).
Maire, E., J. Y. Buffiere, L. Salvo, J. J. Blandin, W. Ludwig, and J. M. Letang(2001). “On the Application of X-ray Microtomography in the Field of MaterialsScience”. In: Adv. Eng. Mater. 3.8, pp. 539–546. (Cit. on p. 88).
Matsubara, K., Y. Miyahara, Z. Horita, and T. G. Langdon (2003). “Developingsuperplasticity in a magnesium alloy through a combination of extrusion andECAP”. In: Acta Materialia 51.11, pp. 3073–3084. (Cit. on p. 39).
Matsuki, K., H. Morita, M. Yamada, and Y. Murakami (1977). “Relative motion ofgrains during superplastic flow in an Al-9Zn-1 wt.Mg alloy”. In: Metal Science11, pp. 156–163. (Cit. on p. 48).
McLean, D. (1966). “The physics of high temperature creep in metals”. In: Reportson Progress in Physics 29.1, pp. 1–33. (Cit. on p. 67).
McNelley, T. R., D.J. Michel, and A. Salama (1989). “The Mg-concentrationdependence of the strength of A1–Mg alloys during glide-controlled deformation”.In: Scripta Metallurgica 23.10, pp. 1657–1662. (Cit. on p. 55).
McNelley, T. R., K. Oh-Ishi, A. P. Zhilyaev, S. Swaminathan, P. E. Krajewski, and E.M. Taleff (2008). “Characteristics of the Transition from Grain-Boundary Slidingto Solute Drag Creep in Superplastic AA5083”. In: Metallurgical and MaterialsTransactions A 39.1, pp. 50–64. (Cit. on p. 116).
Miller, D. A. and T. G. Langdon (1980). “Independent and sequential cavity growthmechanisms”. In: Scripta Metallurgica 14.1, pp. 143–148. (Cit. on p. 73).
Miller, D. A., F. A. Mohamed, and T. G. Langdon (1979). “An analysis of cavitationfailure incorporating cavity nucleation with strain”. In: Materials Science andEngineering 40.2, pp. 159–166. (Cit. on p. 68).
Miyahara, Y., Z. Horita, and T. G. Langdon (2006). “Exceptional superplasticityin an AZ61 magnesium alloy processed by extrusion and ECAP”. In: MaterialsScience and Engineering: A 420.1-2, pp. 240–244. (Cit. on p. 39).
Mohamed, F. A. and T. G. Langdon (1974). “The transition from dislocation climbto viscous glide in creep of solid solution alloys”. In: Acta Metallurgica 22.6,pp. 779–788. (Cit. on p. 55).
— (1976). “Deformation mechanism maps for superplastic materials”. In: ScriptaMetallurgica 10.8, pp. 759–762. (Cit. on p. 42).
— (1981). “Flow localization and neck formation in a superplastic metal”. In: ActaMetallurgica 29.5, pp. 911–920. (Cit. on p. 58).
Mohri, T., M. Mabuchi, M. Nakamura, T. Asahina, H. Iwasaki, T. Aizawa, and K.Higashi (2000). “Microstructural evolution and superplasticity of rolled Mg-9Al-1Zn”. In: Materials Science and Engineering A 290.1-2, pp. 139–144. (Cit. onp. 62).
Mordike, B. L. and P. Lukac (2006). “Magnesium Technology: Metallurgy, DesignData, Applications”. In: Magnesium Technology: Metallurgy, Design Data, Ap-plications. Ed. by Horst E. Friedrich and Barry L. Mordike. Berlin Heidelberg:Springer-Verlag. Chap. Physical Metallurgy, Chapter 3. (Cit. on pp. 28, 29).
Mordike, B. L., K. Harbodt, Lukac, and H. Westengen (2006). Magnesium Technol-ogy: Metallurgy, Design Data and Applications. Ed. by H. E. Friedrich and B. L.Mordike. Springer-Verlag. Chap. Chapter 1, Chapter 1, 3 and 5. (Cit. on pp. 18,24, 25).
182
References
Mott, N. F. (1953). “Bakerian Lecture. Dislocations, Plastic Flow and Creep”. In:Proceedings of the Royal Society of London. Series A. Mathematical and PhysicalSciences 220.1140, pp. 1–14. (Cit. on pp. 46, 55).
Mukherjee, A. K. (1971). “The rate controlling mechanism in superplasticity”. In:Materials Science and Engineering 8.2, pp. 83–89. (Cit. on p. 49).
Murai, T., S. I. Matsuoka, S. Miyamoto, and Y. Oki (2003). “Effects of extrusionconditions on microstructure and mechanical properties of AZ31B magnesiumalloy extrusions”. In: Journal of Materials Processing Technology 141.2, pp. 207–212. (Cit. on p. 81).
Mussi, A., J. J. Blandin, L. Salvo, and E. F. Rauch (2006). “Resistance to strain-induced damage of an ultrafine-grained magnesium alloy deformed in superplasticconditions”. In: Acta Materialia 54.14, pp. 3801–3809. (Cit. on pp. 78, 152).
Myshlyaev, M. M., H. J. McQueen, A. Mwembela, and E. Konopleva (2002).“Twinning, dynamic recovery and recrystallization in hot worked Mg-Al-Znalloy”. In: Materials Science and Engineering A 337.1-2, pp. 121–133. (Cit. onp. 35).
Nabarro, F. (2002). “Creep at very low rates”. In: Metallurgical and MaterialsTransactions A 33.2, pp. 213–218. (Cit. on p. 46).
Nave, M. K. and M. R. Barnett (2004). “Microstructures and textures of puremagnesium deformed in plane-strain compression”. In: Scripta Materialia 51.9,pp. 881–885. (Cit. on p. 32).
Needleman, A. and J. R. Rice (1980). “Plastic creep flow effects in the diffusivecavitation of grain boundaries”. In: Acta Metallurgica 28.10, pp. 1315–1332. (Cit.on p. 68).
Neishi, K., Z. Horita, and T. G. Langdon (2001). “Achieving superplasticity in a Cu-40plastic deformation”. In: Scripta Materialia 45.8, pp. 965–970. (Cit. on p. 39).
Nicolaou, P. D. and S. L. Semiatin (1999). “Modeling of cavity coalescence duringtensile deformation”. In: Acta Materialia 47.13, pp. 3679–3686. (Cit. on p. 74).
— (2000). “An analysis of the effect of continuous nucleation and coalescence oncavitation during hot tension testing”. In: Acta Materialia 48.13, pp. 3441–3450.(Cit. on p. 74).
Nieh, T. G., J. Wadsworth, and O. D. Sherby (1997). Superplasticity in Metals andCeramics. Cambridge: Cambridge University Press, pp. 32–57. (Cit. on p. 59).
Nieh, T. G., L. M. Hsiung, J. Wadsworth, and R. Kaibyshev (1998). “High strainrate superplasticity in a continuously recrystallized Al-6%Mg-0.3%Sc alloy”. In:Acta Materialia 46.8, pp. 2789–2800. (Cit. on p. 125).
Obara, T., H. Yoshinga, and S. Morozumi (1973). “1122〈1123〉 Slip system inmagnesium”. In: Acta Metallurgica 21.7, pp. 845–853. (Cit. on p. 31).
Ohno, M., D. Mirkovic, and R. Schmid-Fetzer (2006). “Phase equilibria and solidi-fication of Mg-rich Mg-Al-Zn alloys”. In: Materials Science and Engineering: A421.1-2, pp. 328–337. (Cit. on p. 102).
Panicker, R., A. H. Chokshi, R. K. Mishra, R. Verma, and P. E. Krajewski(2009). “Microstructural evolution and grain boundary sliding in a superplasticmagnesium AZ31 alloy”. In: Acta Materialia 57.13, pp. 3683–3693. (Cit. on pp. 60,61).
Park, K., D. Hwang, Y. Lee, Y. Kim, and D. H. Shin (2003). “High strain ratesuperplasticity of submicrometer grained 5083 Al alloy containing scandium
183
References
fabricated by severe plastic deformation”. In: Materials Science and EngineeringA 341.1-2, pp. 273–281. (Cit. on p. 39).
Pekguleryuz, M. O. and A. A. Kaya (2003). “Creep Resistant Magnesium Alloys forPowertrain Applications”. In: Advanced Engineering Materials 5.12, pp. 866–878.(Cit. on p. 25).
Perez-Prado, M. T., J. A. del Valle, and O. A. Ruano (2004). “Effect of sheet thicknesson the microstructural evolution of an Mg AZ61 alloy during large strain hotrolling”. In: Scripta Materialia 50.5, pp. 667–671. (Cit. on pp. 61, 82).
Pettersen, G., H. Westengen, R. Høier, and O. Lohne (1996). “Microstructure of apressure die cast magnesium–4wt.% aluminium alloy modified with rare earthadditions”. In: Materials Science and Engineering A 207.1, pp. 115–120. (Cit. onp. 25).
Picu, R. C., G. Vincze, J. J. Gracio, and F. Barlat (2006). “Effect of solute distributionon the strain rate sensitivity of solid solutions”. In: Scripta Materialia 54.1, pp. 71–75. (Cit. on p. 120).
Pilling, J. (1985). “Effect of coalescence on cavity growth during superplasticdeformation”. In: Materials Science and Technology 1, pp. 461–465. (Cit. on p. 74).
Pilling, J. and N. Ridley (1988a). “Cavitation in Aluminium Alloys during Super-plastic Flow”. In: Superplasticity in Aerospace. Ed. by H. C. Heikkenen and T. R.McNelley. Proceedings of a symposium sponsored by the Shaping and FormingCommittee. The Metallurgical Society, Inc., pp. 183–198. (Cit. on pp. 77, 79, 165).
— (1988b). “Cavitation in Superplastic Alloys and the Effect of Hydrostatic Pres-sure”. In: Res mechanica 23.1, pp. 31–63. (Cit. on pp. 72, 73).
Pilling, J and N. Ridley (1989). Superplasticity in Crystalline Solids. London: TheInstitute of Metals, Chapter 1, 3–6. (Cit. on pp. 38, 39, 42, 49, 50, 52, 53, 56, 64,124, 166).
Pilling, J., D. W. Livesey, J. B. Hawkyard, and N. Ridley (1984). “Solid state bondingin superplastic Ti-6Al-4V”. In: Metal Science 18.3, pp. 117–122. (Cit. on p. 71).
Polmear, I. J. (1994). “Magnesium alloys and applications”. In: Materials Scienceand Technology 10, pp. 1–16. (Cit. on p. 27).
— (2006). Light Alloys: From Traditional Alloys to Nanocrystals. Oxford:Butterworth-Heinemann, Elsevier, Chapter 5. (Cit. on pp. 24, 25, 27, 81).
Raj, R. and M. F. Ashby (1975). “Intergranular fracture at elevated temperature”.In: Acta Metallurgica 23.6, pp. 653–666. (Cit. on p. 67).
Raj, R. and F.F. Lange (1985). “On the retention of equiaxed grain structureafter superplastic and other forms of high temperature deformation”. In: ActaMetallurgica 33.4, pp. 699–703. (Cit. on p. 60).
Reed-Hill, R. E. and W. D. Robertson (1957). “Additional modes of deformationtwinning in magnesium”. In: Acta Metallurgica 5.12, pp. 717–727. (Cit. on p. 32).
Reed-Hill, Robert E. (1973). Physical Metallurgy Principles. New York: D. VanNostrand Company, Chapter 8. (Cit. on p. 54).
Ridley, N., D. W. Livesey, and A. K. Mukherjee (1984). “Effect of strain, strain rateand temperature on cavity size distribution in a superplastic copper-base alloy”.In: Journal of Materials Science 19.4, pp. 1321–1332. (Cit. on p. 73).
Ridley, N., P. S. Bate, and B. Zhang (2005). “Material modelling data for superplasticforming optimisation”. In: Materials Science and Engineering: A 410-411, pp. 100–104. (Cit. on pp. 63, 86).
184
References
Ridley, N., P. S. Bate, and B. Zhang (2007). “Effect of strain rate path on cavitation insuperplastic aluminium alloy”. In: Materials Science and Engineering A 463.1-2,pp. 224–230. (Cit. on pp. 68, 77).
Riedel, H. (1987). Fracture at High Temperatures. Materials Research and Engineer-ing. Heidelberg: Springer-Verlag, Chapter 1–6. (Cit. on pp. 68, 69).
Sagat, S. and D.M.R. Taplin (1976). “Fracture of a superplastic ternary brass”. In:Acta Metallurgica 24.4, pp. 307–315. (Cit. on p. 72).
Saunders, N., Z. Guo, X. Li, A.P. Miodownik, and J.-Ph. Schille (2003). “UsingJMatPro to Model Materials Properties and Behaviour”. In: JOM 55.12, pp. 60–65. (Cit. on p. 88).
Schmidt, C.G. and A. K. Miller (1982). “The effect of solutes on the strength andstrain hardening behavior of alloys”. In: Acta Metallurgica 30.3, pp. 615–625. (Cit.on p. 120).
Seitz, F. (1953). “On the porosity observed in the Kirkendall effect”. In: ActaMetallurgica 1.3, pp. 355–369. (Cit. on p. 65).
Senkov, O. N. and V. A. Likhachev (1986). “The Effect of Grain Growth on thePlastic Instabilities and Uniaxial Tensile Ductilities in Superplastic Alloys”. In:physica status solidi (a) 98.2, pp. 441–452. (Cit. on p. 63).
Senkov, O. N. and M. M. Myshlyaev (1986). “Grain growth in a superplastic Zn-22%Al alloy”. In: Acta Metallurgica 34.1, pp. 97–106. (Cit. on p. 64).
Sherby, O. D. and P. M. Burke (1968). “Mechanical behavior of crystalline solids atelevated temperature”. In: Progress in Materials Science 13, pp. 323–390. (Cit. onp. 55).
Sherby, O. D. and E. M. Taleff (2002). “Influence of grain size, solute atoms andsecond-phase particles on creep behavior of polycrystalline solids”. In: MaterialsScience and Engineering A 322.1-2, pp. 89–99. (Cit. on p. 55).
Sherby, O. D. and J. Wadsworth (1982). “Development and Characterization ofFine-Grain Superplastic Materials”. In: AMS Materials Science Seminar. Ed.by George Krauss. Deformation, Processing, and Structure. St. Louis, Missouri:Deformation, Processing, and Structure, American Society for Metals 1984,pp. 355–389. (Cit. on pp. 40, 52, 59, 60).
— (1989). “Superplasticity–Recent advances and future directions”. In: Progress inMaterials Science 33.3, pp. 169–221. (Cit. on pp. 38, 40).
Sherby, O. D. and J. Weertman (1979). “Diffusion-controlled dislocation creep: adefense”. In: Acta Metallurgica 27.3, pp. 387–400. (Cit. on p. 55).
Shibutani, T., T. Kitamura, and R. Ohtani (1998). “Creep cavity growth under inter-action between lattice diffusion and grain-boundary diffusion”. In: Metallurgicaland Materials Transactions A 29.10, pp. 2533–2542. (Cit. on p. 71).
Sigler, J. A. and D. Kuhlmann-Wilsdorf (1967). “Calculations on the MechanicalEnergy of Vacancy Condensation Loops, Stacking Fault Tetrahedra, and Voids”.In: physica status solidi (b) 21.2, pp. 545–556. (Cit. on p. 65).
Silverman, B. W. (1992). Density Estimation for Statistics and Data Analysis. Mono-graphs on Statistics and Applied Probability. London: Chapman & Hall/CRC,p. 42. (Cit. on p. 92).
Sitdikov, O., R. Kaibyshev, and T. Sakai (2003). “Dynamic recrystallization based ontwinning in coarse-grained Mg”. In: Materials Science Forum 419-422.I, pp. 521–526. (Cit. on p. 35).
185
References
Slutsky, L. J. and C. W. Garland (Aug. 1957). “Elastic Constants of Magnesium from4.2 K to 300 K”. In: Physical Review 107.4, pp. 972–976. (Cit. on p. 59).
Somekawa, H. and T. Mukai (2007). “Effect of dominant diffusion process oncavitation behavior in superplastic Mg-Al-Zn alloy”. In: Scripta Materialia 57.11,pp. 1008–1011. (Cit. on p. 78).
Spingarn, J.R. and W.D. Nix (1978). “Diffusional creep and diffusionally accommo-dated grain rearrangement”. In: Acta Metallurgica 26.9, pp. 1389–1398. (Cit. onp. 53).
Stalmann, A., W. Sebastian, H. Friedrich, S. Schumann, and K. Droder (2001).“Properties and Processing of Magnesium Wrought Products for AutomotiveApplications”. In: Advanced Engineering Materials 3.12, pp. 969–974. (Cit. onp. 27).
Stanford, N. and M. R. Barnett (2008). “Fine grained AZ31 produced by conventionalthermo-mechanical processing”. In: Journal of Alloys and Compounds 466.1-2,pp. 182–188. (Cit. on pp. 33, 37, 96).
Stanford, N., I. Sabirov, G. Sha, A. La Fontaine, S. Ringer, and M. R. Barnett (2010).“Effect of Al and Gd Solutes on the Strain Rate Sensitivity of Magnesium Alloys”.In: Metallurgical and Materials Transactions A 41.3, pp. 734–743. (Cit. on p. 120).
Stock, S. R. (2008). “Recent advances in X-ray microtomography applied to materi-als”. In: International Materials Reviews 53, pp. 129–181. (Cit. on p. 87).
Stowell, M. J. (1980). “Cavity growth in superplastic alloys”. In: Metal Science 14,pp. 267–272. (Cit. on pp. 72, 74).
— (1983). “Failure of superplastic alloys”. In: Metal Science 17, pp. 1–11. (Cit. onp. 68).
Stowell, M. J., D. W. Livesey, and N. Ridley (1984). “Cavity coalescence insuperplastic deformation”. In: Acta Metallurgica 32.1, pp. 35–42. (Cit. on p. 74).
Takigawa, Y., J. V. Aguirre, E. M. Taleff, and K. Higashi (2008). “Cavitation duringgrain-boundary-sliding deformation in an AZ61 magnesium alloy”. In: MaterialsScience and Engineering: A 497.1-2, pp. 139–146. (Cit. on pp. 61, 78).
Taleff, E., G. Henshall, T. Nieh, D. Lesuer, and J. Wadsworth (1998). “Warm-temperature tensile ductility in Al-Mg alloys”. In: Metallurgical and MaterialsTransactions A 29.3, pp. 1081–1091. (Cit. on p. 55).
Taleff, E., P. Nevland, and P. Krajewski (2001). “Tensile ductility of severalcommercial aluminum alloys at elevated temperatures”. In: Metallurgical andMaterials Transactions A 32.5, pp. 1119–1130. (Cit. on pp. 78, 167).
Tan, J. C. and M. J. Tan (2003a). “Dynamic continuous recrystallization character-istics in two stage deformation of Mg-3Al-1Zn alloy sheet”. In: Materials Scienceand Engineering A 339.1-2, pp. 124–132. (Cit. on p. 62).
— (2003b). “Superplasticity and grain boundary sliding characteristics in two stagedeformation of Mg-3Al-1Zn alloy sheet”. In: Materials Science and EngineeringA 339.1-2, pp. 81–89. (Cit. on p. 61).
Tegart, W. J. McG. (1961). “Activation energies for high temperature creep ofpolycrystalline magnesium”. In: Acta Metallurgica 9.6, pp. 614–617. (Cit. onp. 55).
Vagarali, S. S. and T. G. Langdon (1981). “Deformation mechanisms in h.c.p. metalsat elevated temperatures–I. Creep behavior of magnesium”. In: Acta Metallurgica29.12, pp. 1969–1982. (Cit. on p. 59).
186
References
Vagarali, S. S. and T. G. Langdon (1982). “Deformation mechanisms in h.c.p. metalsat elevated temperatures–II. Creep behavior of a Mg-0.8% Al solid solution alloy”.In: Acta Metallurgica 30.6, pp. 1157–1170. (Cit. on p. 55).
Valiev, R. Z. and T. G. Langdon (2006). “Principles of equal-channel angular pressingas a processing tool for grain refinement”. In: Progress in Materials Science 51.7,pp. 881–981. (Cit. on p. 37).
Von Batchelder, F. W. and R. F. Raeuchle (1957). “Lattice Constants and BrillouinZone Overlap in Dilute Magnesium Alloys”. In: Physical Review 105.1, pp. 59–61.(Cit. on p. 22).
VSG (2010). Avizo 5.1 3D Visualization Software User Manual. http://www.vsg3d.
com. Burlington, MA. (Cit. on p. 90).Wang, L., M. Song, and R. Liu (2006). “Superplasticity and superplastic instability
of AZ31B magnesium alloy sheet”. In: Transactions of Nonferrous Metals Societyof China (English Edition) 16.2, pp. 327–332. (Cit. on p. 61).
Wang, Y. and J. Huang (2004). “Transition of dominant diffusion process duringsuperplastic deformation in AZ61 magnesium alloys”. In: Metallurgical andMaterials Transactions A 35.2, pp. 555–562. (Cit. on p. 61).
Wang, Y. N. and J. C. Huang (2003). “Texture analysis in hexagonal materials”. In:Materials Chemistry and Physics 81.1, pp. 11–26. (Cit. on p. 107).
Wang, Y.N. and J.C. Huang (2007). “The role of twinning and untwinning in yieldingbehavior in hot-extruded Mg-Al-Zn alloy”. In: Acta Materialia 55.3, pp. 897–905.(Cit. on p. 32).
Watanabe, H. and M. Fukusumi (2008). “Mechanical properties and texture of asuperplastically deformed AZ31 magnesium alloy”. In: Materials Science andEngineering: A 477.1-2, pp. 153–161. (Cit. on p. 61).
Watanabe, H., T. Mukai, and K. Higashi (1999b). “Superplasticity in a ZK60magnesium alloy at low temperatures”. In: Scripta Materialia 40.4, pp. 477–484.(Cit. on p. 62).
Watanabe, H., T. Mukai, M. Kohzu, S. Tanabe, and K. Higashi (1999a). “Effect oftemperature and grain size on the dominant diffusion process for superplastic flowin an AZ61 magnesium alloy”. In: Acta Materialia 47.14, pp. 3753–3758. (Cit. onpp. 43, 53, 60, 61).
Watanabe, H., H. Tsutsui, T. Mukai, M. Kohzu, S. Tanabe, and K. Higashi(2001). “Deformation mechanism in a coarse-grained Mg-Al-Zn alloy at elevatedtemperatures”. In: International Journal of Plasticity 17.3, pp. 387–397. (Cit. onpp. 61, 116).
Watts, B. M., M. J. Stowell, and D. M. Cottingham (1971). “The variation in flowstress and microstructure during superplastic deformation of the Al-Cu eutectic”.In: Journal of Materials Science 6.3, pp. 228–237. (Cit. on p. 63).
Weertman, J. (1955). “Theory of Steady-State Creep Based on Dislocation Climb”.In: Journal of Applied Physics 26.10, pp. 1213–1217. (Cit. on pp. 46, 55).
— (1957). “Steady-State Creep of Crystals”. In: Journal of Applied Physics 28.10,pp. 1185–1189. (Cit. on p. 54).
Weidmann, E. (1993). Metallography and Microstructure. Vol. 9. ASM International,Electrolyte Polishing. (Cit. on p. 85).
Wilkinson, D. S. and C. H. Caceres (1984). “On the mechanism of strain-enhancedgrain growth during superplastic deformation”. In: Acta Metallurgica 32.9,pp. 1335–1345. (Cit. on p. 63).
187

References
Wilkinson, D. S. and C. H. Caceres (1986). “Mechanism of plastic void growth duringsuperplastic flow”. In: Materials Science and Technology 2, pp. 1086–1092. (Cit.on p. 164).
Xu, C., M. Furukawa, Z. Horita, and T. G. Langdon (2005). “Influence of ECAPon precipitate distributions in a spray-cast aluminum alloy”. In: Acta Materialia53.3, pp. 749–758. (Cit. on p. 39).
Yang, Q. and A. K. Ghosh (2006). “Production of ultrafine-grain microstructure inMg alloy by alternate biaxial reverse corrugation”. In: Acta Materialia 54.19,pp. 5147–5158. (Cit. on p. 82).
— (2008). “Formability of Ultrafine-Grain Mg Alloy AZ31B at Warm Temperatures”.In: Metallurgical and Materials Transactions A 39.11, pp. 2781–2796. (Cit. onp. 62).
Yavari, P., D. A. Miller, and T. G. Langdon (1982). “An investigation of harper-dorncreep–I. Mechanical and microstructural characteristics”. In: Acta Metallurgica30.4, pp. 871–879. (Cit. on p. 46).
Ye, L., X. Zhang, D. Zheng, S. Liu, and J. Tang (2009). “Superplastic behavior ofan Al–Mg–Li alloy”. In: Journal of Alloys and Compounds 487.1-2, pp. 109–115.(Cit. on p. 128).
Yi, S., J. Bohlen, F. Heinemann, and D. Letzig (2010). “Mechanical anisotropy anddeep drawing behaviour of AZ31 and ZE10 magnesium alloy sheets”. In: ActaMaterialia 58.2, pp. 592–605. (Cit. on pp. 31, 37).
Yin, D. L., K. F. Zhang, G. F. Wang, and W. B. Han (2005). “Superplasticity andcavitation in AZ31 Mg alloy at elevated temperatures”. In: Materials Letters59.14–15, pp. 1714–1718. (Cit. on p. 61).
Zarandi, F., G. Seale, R. Verma, E. Essadiqi, and S. Yue (2008). “Effect of Al and Mnadditions on rolling and deformation behavior of AZ series magnesium alloys”. In:Materials Science and Engineering A 496.1-2, pp. 159–168. (Cit. on pp. 61, 119).
Zhang, M. X., P. M. Kelly, M. Qian, and J. A. Taylor (2005). “Crystallography ofgrain refinement in Mg-Al based alloys”. In: Acta Materialia 53.11, pp. 3261–3270.(Cit. on p. 28).
Zhilyaev, A. P. and T. G. Langdon (2008). “Using high-pressure torsion for metalprocessing: Fundamentals and applications”. In: Progress in Materials Science53.6, pp. 893–979. (Cit. on p. 37).
188
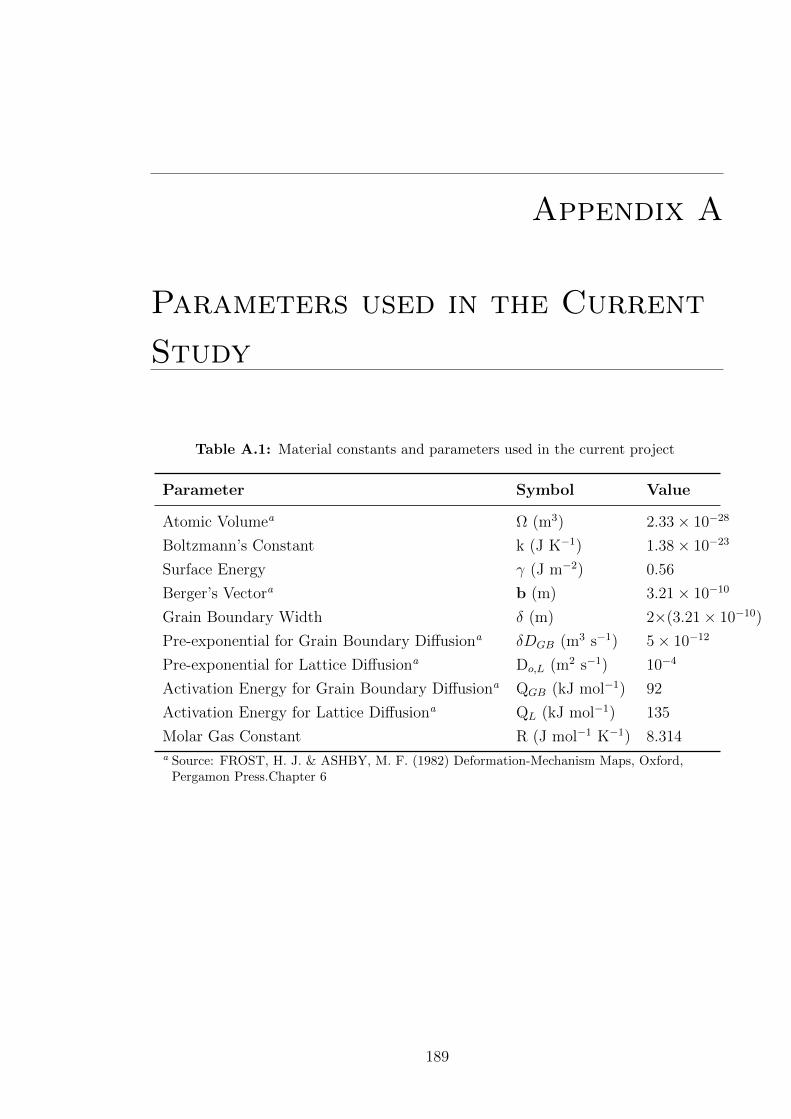
Appendix A
Parameters used in the Current
Study
Table A.1: Material constants and parameters used in the current project
Parameter Symbol Value
Atomic Volumea Ω (m3) 2.33× 10⁻²⁸
Boltzmann’s Constant k (J K−1) 1.38× 10⁻²³
Surface Energy γ (J m−2) 0.56
Berger’s Vectora b (m) 3.21× 10⁻¹⁰
Grain Boundary Width δ (m) 2×(3.21× 10−10)
Pre-exponential for Grain Boundary Diffusiona δDGB (m3 s−1) 5× 10⁻¹²
Pre-exponential for Lattice Diffusiona Do,L (m2 s−1) 10−4
Activation Energy for Grain Boundary Diffusiona QGB (kJ mol−1) 92
Activation Energy for Lattice Diffusiona QL (kJ mol−1) 135
Molar Gas Constant R (J mol−1 K−1) 8.314a Source: FROST, H. J. & ASHBY, M. F. (1982) Deformation-Mechanism Maps, Oxford,
Pergamon Press.Chapter 6
189
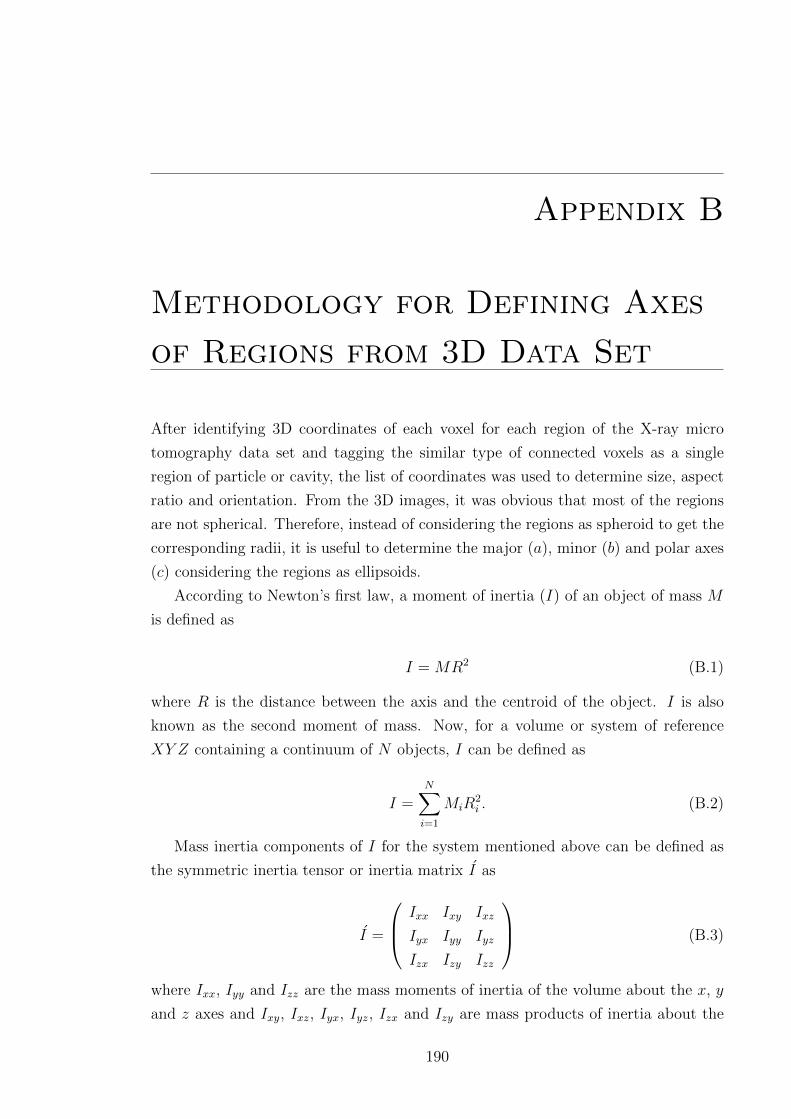
Appendix B
Methodology for Defining Axes
of Regions from 3D Data Set
After identifying 3D coordinates of each voxel for each region of the X-ray micro
tomography data set and tagging the similar type of connected voxels as a single
region of particle or cavity, the list of coordinates was used to determine size, aspect
ratio and orientation. From the 3D images, it was obvious that most of the regions
are not spherical. Therefore, instead of considering the regions as spheroid to get the
corresponding radii, it is useful to determine the major (a), minor (b) and polar axes
(c) considering the regions as ellipsoids.
According to Newton’s first law, a moment of inertia (I) of an object of mass M
is defined as
I = MR2 (B.1)
where R is the distance between the axis and the centroid of the object. I is also
known as the second moment of mass. Now, for a volume or system of reference
XY Z containing a continuum of N objects, I can be defined as
I =N∑i=1
MiR2i . (B.2)
Mass inertia components of I for the system mentioned above can be defined as
the symmetric inertia tensor or inertia matrix I as
I =
Ixx Ixy Ixz
Iyx Iyy Iyz
Izx Izy Izz
(B.3)
where Ixx, Iyy and Izz are the mass moments of inertia of the volume about the x, y
and z axes and Ixy, Ixz, Iyx, Iyz, Izx and Izy are mass products of inertia about the
190
Appendix B. Methodology for Defining Axes of Regions from 3D Data Set
corresponding pair of axes. These moments of inertia and products of inertia can be
obtained from the 3D coordinate list as
Ixx =
∫(y − yo)2 + (z − zo)2 dM (B.4)
Iyy =
∫(x− xo)2 + (z − zo)2 dM (B.5)
Izz =
∫(x− xo)2 + (y − yo)2 dM (B.6)
Ixy = Iyx = −∫
(x− xo)2 + (y − yo)2 dM (B.7)
Ixz = Izx = −∫
(x− xo)2 + (z − zo)2 dM (B.8)
Izy = Iyz = −∫
(y − yo)2 + (z − zo)2 dM (B.9)
where (xo yo zo) is the coordinates of the centroid for a particular object and (x y z)
is the coordinates of position of that object. The symmetric I has positive eigenvalues
and three orthogonal eigenvectors. Using Matlab, these eigenvalues and eigenvectors
of I can be promptly solved. Then, the angle between axis of rotation for each object
in the volume or system and the corresponding eigenvectors can be determined.
Using this methodology for each region of particles and cavities, the orientation
with respect to tensile (z-axis of the 3D data set) can be defined.
Now, using the eigenvalues of the inertia tensor matrix of the regions, a rectangle
of similar dimension containing the ellipsoid can be drawn to obtain the corresponding
dimensions of each region. From this rectangle, a, b and c which belong to the major,
minor and polar axes of an ellipsoid, can be determined.
To determine the eigenvalues and eigenvectors, an existing Matlab script (Dr. T.
J. Marrow, University of Manchester) was modified.
MOON, F. C. (1998) Applied Dynamics: with Applications to Multibody and MechatronicSystems, New York, John Wiley & Sons, Inc., 185
191
Related Documents