Components of the Logistics Information System (LIS) HELP.LOLIS Release 4.6C

Welcome message from author
This document is posted to help you gain knowledge. Please leave a comment to let me know what you think about it! Share it to your friends and learn new things together.
Transcript

Components of the LogisticsInformation System (LIS)
HE
LP
.LO
LIS
Re lease 4 .6C

Components of the Logistics Information System (LIS) SAP AG
2 April 2001
Copyright
© Copyright 2001 SAP AG. All rights reserved.
No part of this publication may be reproduced or transmitted in any form or for any purposewithout the express permission of SAP AG. The information contained herein may be changedwithout prior notice.
Some software products marketed by SAP AG and its distributors contain proprietary softwarecomponents of other software vendors.
Microsoft®, WINDOWS®, NT®, EXCEL®, Word®, PowerPoint® and SQL Server® are registeredtrademarks ofMicrosoft Corporation.
IBM®, DB2®, OS/2®, DB2/6000®, Parallel Sysplex®, MVS/ESA®, RS/6000®, AIX®, S/390®,AS/400®, OS/390®, and OS/400® are registered trademarks of IBM Corporation.
ORACLE® is a registered trademark of ORACLE Corporation.
INFORMIX®-OnLine for SAP and Informix® Dynamic ServerTM
are registered trademarks ofInformix Software Incorporated.
UNIX®, X/Open®, OSF/1®, and Motif® are registered trademarks of the Open Group.
HTML, DHTML, XML, XHTML are trademarks or registered trademarks of W3C®, World WideWeb Consortium,Massachusetts Institute of Technology.
JAVA® is a registered trademark of Sun Microsystems, Inc.
JAVASCRIPT® is a registered trademark of Sun Microsystems, Inc., used under license fortechnology invented and implemented by Netscape.
SAP, SAP Logo, R/2, RIVA, R/3, ABAP, SAP ArchiveLink, SAP Business Workflow, WebFlow,SAP EarlyWatch, BAPI, SAPPHIRE, Management Cockpit, mySAP.com Logo and mySAP.comare trademarks or registered trademarks of SAP AG in Germany and in several other countriesall over the world. All other products mentioned are trademarks or registered trademarks of theirrespective companies.
SAP AG Components of the Logistics Information System (LIS)
April 2001 3
Icons
Icon Meaning
Caution
Example
Note
Recommendation
Syntax
Components of the Logistics Information System (LIS) SAP AG
4 April 2001
Contents
Components of the Logistics Information System (LIS) ...............................10Purchasing Information System ................................................................................................ 11Purchasing Information System: Information Structures....................................................... 12Updating: Purchasing Information System .............................................................................. 13
Events: Purchasing Information System .................................................................................. 14Item Categories and Document Types: Purchasing Information System ................................ 18Updating Standard Analyses for Long-Term Planning: Purchasing Information System ........ 19Type of Updating...................................................................................................................... 21Period Units in Updating: Purchasing Information System ...................................................... 22Update of Quantities and Currency Amounts: Purchasing Information System ...................... 23Updating Check........................................................................................................................ 24
Standard Analyses: Purchasing Information System ............................................................. 25Standard Analyses for Long-term Planning: Comparing Order Values ................................ 28Characteristics and Key Figures: Purchasing Information System....................................... 30
Purchasing Group .................................................................................................................... 31Vendor, Material Group............................................................................................................ 32Material..................................................................................................................................... 34Vendor Evaluation.................................................................................................................... 35Subsequent Settlement............................................................................................................ 36Long-term Planning.................................................................................................................. 37
How the Key Figures are Calculated: Purchasing Information System ................................ 38Quantities/Values ..................................................................................................................... 39Frequency ................................................................................................................................ 40Quantity Delivered/(Scheduled) Delivery Date Deviation, Delivery Time ................................ 42Key Figures Calculated at Runtime ......................................................................................... 44Example: Calculating the Value of Goods Received ............................................................... 47Vendor Evaluation.................................................................................................................... 49Smoothed................................................................................................................................. 51Subsequent Settlement............................................................................................................ 52Subsequent Settlement: Amounts ........................................................................................... 53Examples: Income Final Settlement / Income Condition Record / Total Income ConditionRecord...................................................................................................................................... 56Subsequent Settlement: Quantities ......................................................................................... 58
Inventory Controlling .................................................................................................................. 60Inventory Controlling: Information Structures......................................................................... 61Updating: Inventory Controlling ................................................................................................ 63
Events: Inventory Controlling ................................................................................................... 64Updating Quantities and Currencies: Inventory Controlling..................................................... 65Updating for Standard Analyses: Requirement/Stock and Parameters Controlling ................ 66Period Units in Updating: Inventory Controlling ....................................................................... 68
Standard Analyses: Inventory Controlling ............................................................................... 69Inventory Controlling: Parameters Controlling........................................................................ 72Characteristics and Key Figures: Inventory Controlling ........................................................ 76
Plant/Storage Location/Material/Parameters Controlling......................................................... 77Batches .................................................................................................................................... 80Standard Analyses to Material Groups .................................................................................... 81
SAP AG Components of the Logistics Information System (LIS)
April 2001 5
Standard Analyses on Warehouse Management .................................................................... 85Stock/Requirements - Current and - Long-term Planning....................................................... 89
How the Key Figures are Calculated: Inventory Controlling .................................................. 91Stocks....................................................................................................................................... 92Usage ....................................................................................................................................... 94Receipts ................................................................................................................................... 96Issues ....................................................................................................................................... 98Range of Coverage .................................................................................................................. 99Inventory Turnovers ............................................................................................................... 101Key Figures for Movements ................................................................................................... 103Key Figures From MRP and Long-Term Planning................................................................. 104Key Figures for Warehouse Management ............................................................................. 106
Key Figures for Stock Placement/Removal ...................................................................... 107Key Figures for Flow of Quantities.................................................................................... 109
Inventory Controlling: Detailed Information........................................................................... 111Sales Information System ........................................................................................................ 114Sales Information System: Information Structures ............................................................... 115Updating: Sales Information System ...................................................................................... 116
Events: Sales Information System ......................................................................................... 117Updating in the Sales Information System............................................................................. 126Factors That Influence Updating: Sales Information System................................................. 127Period Units in Updating: Sales Information System ............................................................. 129Updating for Configurable Materials ...................................................................................... 130Special Features of Multi-Level Configurable Materials ........................................................ 131
Standard Analyses: Sales Information System...................................................................... 132Characteristics and Key Figures: Sales Information System............................................... 134
Customer, Material ................................................................................................................. 135Sales Organization................................................................................................................. 137Shipping Point ........................................................................................................................ 139Sales Employee ..................................................................................................................... 140Sales Office............................................................................................................................ 142Variant Configuration ............................................................................................................. 144
How the Key Figures are Calculated: Sales Information System......................................... 146Key Figures for Incoming Orders and Returns ...................................................................... 147Key Figures for Invoiced Sales and Credit Memos................................................................ 148Key Figures for Gross/Net1/Net2/Freight/PrSub5/PrSub6 .................................................... 149Cost ........................................................................................................................................ 150Open Sales Order Value/Open Sales Order Quantity ........................................................... 151Deliveries on Hand................................................................................................................. 152Key Figures for Variant Configuration.................................................................................... 153
Shop Floor Information System............................................................................................... 155Shop Floor Information System: Information Structures ..................................................... 156Updating: Shop Floor Information System............................................................................. 158
Events: Shop Floor Information System ................................................................................ 159Views: Shop Floor Information System.................................................................................. 160Conditions: Shop Floor Information System .......................................................................... 161Updating for Repetitive Manufacturing Analysis: Shop Floor Information System ................ 162Updating Quantities and Currencies: Shop Floor Information System .................................. 163Period Units in Updating: Shop Floor Information System .................................................... 164
Standard Analyses: Shop Floor Information System............................................................ 165

Components of the Logistics Information System (LIS) SAP AG
6 April 2001
Shop Floor Information System: Gantt Diagram.................................................................... 167Shop Floor Information System: Input/Output Diagram ....................................................... 168Characteristics and Key Figures: Shop Floor Information System ..................................... 170
Work Center ........................................................................................................................... 171Operation................................................................................................................................ 173Material................................................................................................................................... 175Production Order.................................................................................................................... 177Material Usage ....................................................................................................................... 179Product Costs......................................................................................................................... 180Run Schedule Header............................................................................................................ 181Reporting Point Statistics ....................................................................................................... 182Kanban ................................................................................................................................... 183
How the Key Figures are Calculated: Shop Floor Information System............................... 185Calculating Material-Based Key Figures (S021, S023) ......................................................... 186Calculating Work-Center-Based Key Figures (S022, S024).................................................. 188Key Figures for Repetitive Manufacturing (S025/S028) ........................................................ 191Key Figures for Material Usage (S026).................................................................................. 192Key Figures for Product Costs (S027) ................................................................................... 193Key Figures for Kanban (S029).............................................................................................. 194
Number of Status Messages in KANBAN......................................................................... 195Sequence of the Status Changes in KANBAN ................................................................. 197Time Sequence of the Process......................................................................................... 198Master Data....................................................................................................................... 200Quantity Control ................................................................................................................ 201
Plant Maintenance Information System .................................................................................. 202Plant Maintenance Information System: Information Structures......................................... 203Updating: Plant Maintenance Information System ................................................................ 204
Events: Plant Maintenance Information System .................................................................... 205Update Group: Plant Maintenance Information System ........................................................ 207Updating Currencies: Plant Maintenance Information System .............................................. 208Period Units in Updating: Plant Maintenance Information System ........................................ 209
Standard Analyses: Plant Maintenance Information System ............................................... 210Characteristics and Key Figures: Plant Maintenance Information System ........................ 211
Object Class and Manufacturer.............................................................................................. 212Location.................................................................................................................................. 214Planning Group ...................................................................................................................... 216Damage Analysis ................................................................................................................... 218Object Statistics ..................................................................................................................... 219Breakdown Analysis............................................................................................................... 220Cost Analysis.......................................................................................................................... 221Customer Notifications ........................................................................................................... 222
Additional Evaluations: Overview ........................................................................................... 223Additional Documentation for Menu Option Environment...................................................... 224MTTR/MTBR Evaluation ........................................................................................................ 225
How the Key Figures are Calculated: Plant Maintenance Information System .................. 227Key Figures for Notifications .................................................................................................. 228Key Figures for Object Statistics ............................................................................................ 229Key Figures for Error Statistics .............................................................................................. 230Key Figures for Damage Description ..................................................................................... 231Key Figures for Breakdown Statistics .................................................................................... 232

SAP AG Components of the Logistics Information System (LIS)
April 2001 7
Key Figures for Order Management ...................................................................................... 235Key Figures for Order Costs .................................................................................................. 236
Quality Management Information System .............................................................................. 239Quality Management Information System: Information Structures ..................................... 240Updating: Quality Management Information System............................................................. 242
Time of the Update................................................................................................................. 243Factors That Influence Updating the Information Structures: Quality Management InformationSystem ................................................................................................................................... 244Updating Quantities: Quality Management Information System ............................................ 246Period Units in Updating: Quality Management Information System..................................... 247
Standard Analyses: Quality Management Information System............................................ 248Characteristics and Key Figures: Quality Management Information System..................... 249
Standard Analyses for Lots .................................................................................................... 250Standard Analyses for Errors ................................................................................................. 252Standard Analyses for Notifications ....................................................................................... 253Standard Analyses for Notification Problems......................................................................... 255Standard Analyses for Inspection Results ............................................................................. 256
How the Key Figures are Calculated: Quality Management Information System............... 258Auxiliary and Supplementary Key Figures ............................................................................. 259Calculating the Supplementary Key Figures for Information Structures S068, S069 and S104............................................................................................................................................... 260Calculating the Supplementary Key Figures for Information Structures S100, S102 and S103............................................................................................................................................... 262Calculating the Supplementary Key Figures for Information Structures S162, S164, S166 . 263
Retail Information System (RIS)............................................................................................... 265RIS Information Structures....................................................................................................... 266Updating - Overview.................................................................................................................. 272
Events .................................................................................................................................... 273Updating Definition................................................................................................................. 274
Update Groups.................................................................................................................. 275Update Rules .................................................................................................................... 276
Updating Control .................................................................................................................... 277Type of Updating.................................................................................................................... 278Period Unit.............................................................................................................................. 279Update Check ........................................................................................................................ 281Cancellations.......................................................................................................................... 282Posting Quantities and Currencies ........................................................................................ 283POS Interface......................................................................................................................... 284
Standard Analyses in RIS......................................................................................................... 285Procedures in Limit Planning ................................................................................................. 287Exceptions.............................................................................................................................. 289
Characteristics and Key Figures ............................................................................................. 290STRPS ................................................................................................................................... 291Purchasing ............................................................................................................................. 293Subsequent Settlement.......................................................................................................... 295Article ..................................................................................................................................... 296Article/Add-On........................................................................................................................ 298Promotion ............................................................................................................................... 299Season ................................................................................................................................... 300Customer/Merchandise Category .......................................................................................... 302

Components of the Logistics Information System (LIS) SAP AG
8 April 2001
Customer/Article..................................................................................................................... 304Article Aggregation - POS...................................................................................................... 306Cashier ................................................................................................................................... 307Sales As Per Receipts ........................................................................................................... 309POS Balancing....................................................................................................................... 311Receipt ................................................................................................................................... 313Receipt/Article ........................................................................................................................ 315Open-To-Buy.......................................................................................................................... 317Perishables............................................................................................................................. 319Physical Inventory .................................................................................................................. 321Additionals.............................................................................................................................. 322Rough Workload Preview: General Overview........................................................................ 323Rough Workload Estimate: Goods Receipt/Put Away ........................................................... 325Rough Workload Estimate: Customer/Store Returns ............................................................ 327Rough Workload Preview: Picking/Goods Issue.................................................................... 329Rough Workload Preview: Vendor Returns ........................................................................... 331Further Selection Criteria ....................................................................................................... 333
Abbreviations............................................................................................................................. 334How Key Figures are Calculated.............................................................................................. 335
Key Figures: Purchasing ........................................................................................................ 336Key Figures: Subsequent Settlement .................................................................................... 338
Income Fin. Settlemt / Cond. Rec'd / Totl Income Cond. Rec'd ....................................... 339Subsequent Settlement: Quantities .................................................................................. 341Subsequent Settlement: Amounts .................................................................................... 343
Key Figures: Inventory Management ..................................................................................... 346Key Figures: Sales and Distribution....................................................................................... 350Key Figures: Sales Audit........................................................................................................ 354Key Figures: Market-Basket Analysis .................................................................................... 358Key Figures Calculated at Runtime ....................................................................................... 360Key Figures: Physical Inventory............................................................................................. 364Key Figures: Additionals ........................................................................................................ 365Key Figures: Rough Workload Estimate ................................................................................ 366Key Figures: Open to Buy...................................................................................................... 368
Transport Information System (TIS)........................................................................................ 373Documentation not Available in Release 4.6B ....................................................................... 374Updating: TIS ............................................................................................................................. 375
Events: TIS............................................................................................................................. 376Updating: TIS ......................................................................................................................... 377Function Enhancements: TIS................................................................................................. 378Factors That Influence Updating: TIS .................................................................................... 379Statistics Groups: TIS ............................................................................................................ 380Update Groups: TIS ............................................................................................................... 381Update Type: TIS ................................................................................................................... 382Period Units in Updating: TIS................................................................................................. 383Special Features: TIS............................................................................................................. 384Updating Check: TIS .............................................................................................................. 386
Standard Analysis: TIS ............................................................................................................. 387Documentation not Available in Release 4.6B ....................................................................... 389
Transport ................................................................................................................................ 390Documentation not Available in Release 4.6B....................................................................... 392Transport method................................................................................................................... 393
SAP AG Components of the Logistics Information System (LIS)
April 2001 9
Documentation not Available in Release 4.6B....................................................................... 395Documentation not Available in Release 4.6B....................................................................... 396Documentation not Available in Release 4.6B....................................................................... 397
Note on Calculating Key Figures............................................................................................. 398Key Figures for Transports..................................................................................................... 399Key Figures for Deliveries ...................................................................................................... 400Entry-dependent Key Figures ................................................................................................ 401Average Key Figures.............................................................................................................. 402

Components of the Logistics Information System (LIS) SAP AG
Components of the Logistics Information System (LIS)
10 April 2001
Components of the Logistics Information System (LIS)Transportinformationssystem [Page 373]
This documentation about the information systems in LIS (Purchasing Information System [Page11], Inventory Controlling [Page 60], Sales Information System [Page 114], Shop FloorInformation System [Page 155], Plant Maintenance Information System [Page 202], QualityManagement Information System [Page 239], Retail Information System [Page 265]) contains thefollowing information:
� Information structures
� Updating
� Standard analyses
� Characteristics and key figures
� How the key figures are calculated
You can also find the following additional information:
� Purchasing Information System
� Standard Analyses for Long-Term Planning [Page 28]
� Inventory Controlling
� Parameters Controlling [Page 72]
� Detailed Information [Page 111]
� Shop Floor Information System
� Gantt Diagram [Page 167]
� Input/Output Diagram [Page 168]
� Plant Maintenance Information System
� Additional Evaluations: Overview [Page 223]
SAP AG Components of the Logistics Information System (LIS)
Purchasing Information System
April 2001 11
Purchasing Information SystemInformation Structures [Page 12]
Updating [Page 13]
Standard Analyses [Page 25]
Standard Analyses for Long-Term Planning [Page 28]
Characteristics and Key Figures [Page 30]
How the Key Figures Are Calculated [Page 38]

Components of the Logistics Information System (LIS) SAP AG
Purchasing Information System: Information Structures
12 April 2001
Purchasing Information System: Information StructuresIn the standard system, the following information structures are available in the PurchasingInformation System:
� S011 “Purchasing group”
This information structure forms the data basis for the purchasing group analysis.
� S012 “Purchasing”
This information structure forms the data basis for the material groups, vendor andmaterial analysis.
The analyses for long-term planning are based on planning data which is updated to aseparate planning version of the information structure S012 from Long-term planning.
� S013 “Vendor evaluation”
This information structure provides the data basis for the standard analysis of vendorevaluation. The information structure is updated when the events goods receipt andpurchase order take place.
� S015 “Subsequent settlement”
This information structure forms the data basis for the standard analyses of subsequentsettlement. The information structure S015 is updated when the events “invoice receiptfor a purchase order” (vendor business volume) or “subsequent settlements of anarrangement (income) by credit memo/billing document” take place.

SAP AG Components of the Logistics Information System (LIS)
Updating: Purchasing Information System
April 2001 13
Updating: Purchasing Information SystemData analysis in the Purchasing Information System is based on the statistical data that isupdated from Purchasing to the information structures.
The following section describes how and when updating occurs.
You can find further information about updating in the Implementation Guide for theLogistics Information System.
Events: Purchasing Information System [Page 14]
Item Categories and Document Types: Purchasing Information System [Page 18]
Updating Standard Analyses for Long-Term Planning: Purchasing Information System [Page 19]
Update of Quantities and Currency Amounts: Purchasing Information System [Page 23]
Type of Updating [Page 21]
Period Units in Updating: Purchasing Information System [Page 22]
Updating Check [Page 24]
Components of the Logistics Information System (LIS) SAP AG
Events: Purchasing Information System
14 April 2001
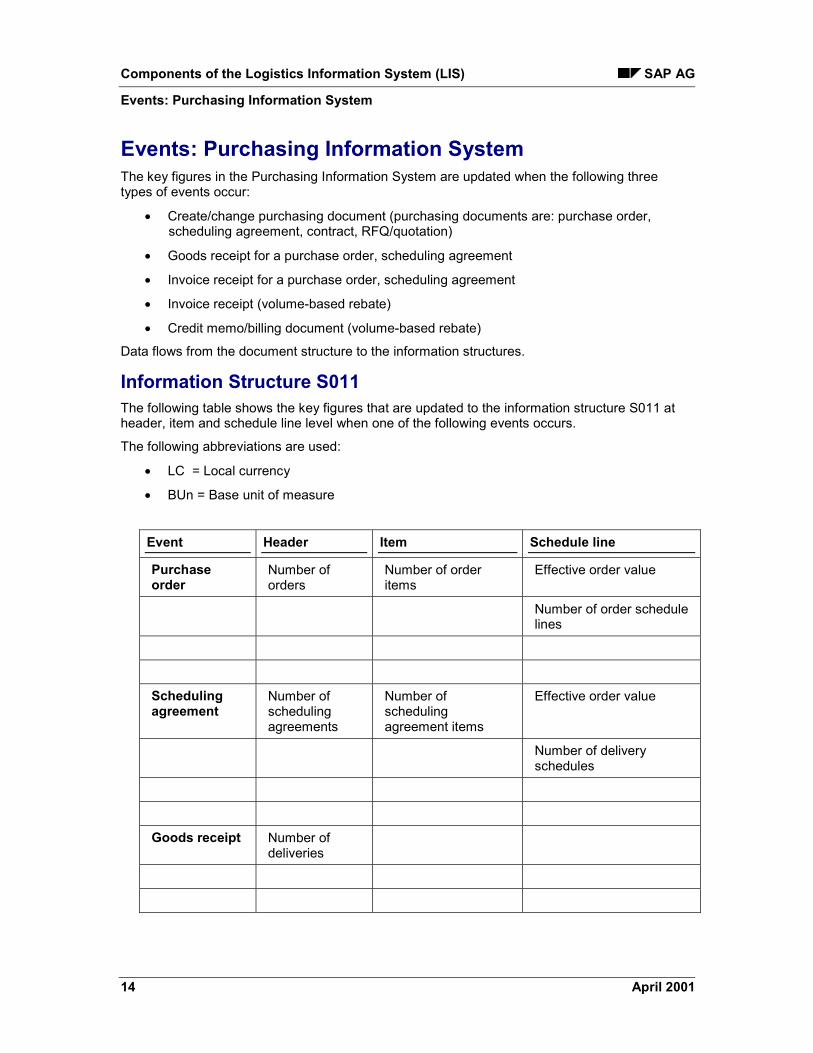
Events: Purchasing Information SystemThe key figures in the Purchasing Information System are updated when the following threetypes of events occur:
� Create/change purchasing document (purchasing documents are: purchase order,scheduling agreement, contract, RFQ/quotation)
� Goods receipt for a purchase order, scheduling agreement
� Invoice receipt for a purchase order, scheduling agreement
� Invoice receipt (volume-based rebate)
� Credit memo/billing document (volume-based rebate)
Data flows from the document structure to the information structures.
Information Structure S011The following table shows the key figures that are updated to the information structure S011 atheader, item and schedule line level when one of the following events occurs.
The following abbreviations are used:
� LC = Local currency
� BUn = Base unit of measure
Event Header Item Schedule line
Purchaseorder
Number oforders
Number of orderitems
Effective order value
Number of order schedulelines
Schedulingagreement
Number ofschedulingagreements
Number ofschedulingagreement items
Effective order value
Number of deliveryschedules
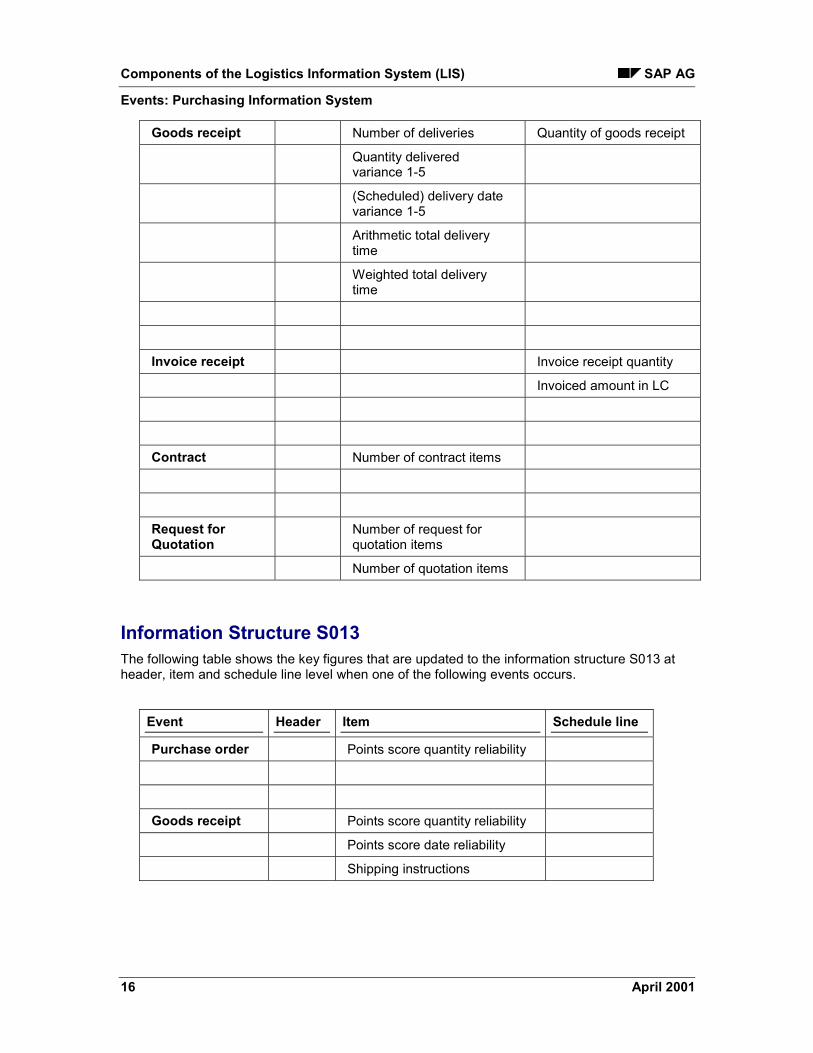
Goods receipt Number ofdeliveries

SAP AG Components of the Logistics Information System (LIS)
Events: Purchasing Information System
April 2001 15
Invoicereceipt
Invoiced amount in LC
Contract Number ofcontracts
Number of contractitems
Request forQuotation
Number ofrequests forquotation
Number of requestsfor quotation
Number of quotationitems
Information Structure S012The following table shows the key figures that are updated to the information structure S012 atheader, item and schedule line level when one of the following events occurs.
The following abbreviations are used:
� LC = Local currency
� BUn = Base unit of measure
Event Header Item Schedule line
Purchase order Number of order items Purchase order quantity
Quantity deliveredvariance 1-5
Required deliveryquantity
Effective order value
Schedulingagreement
Purchase order quantity
Required deliveryquantity
Effective order value
Effective order value
Components of the Logistics Information System (LIS) SAP AG
Events: Purchasing Information System
16 April 2001
Goods receipt Number of deliveries Quantity of goods receipt
Quantity deliveredvariance 1-5
(Scheduled) delivery datevariance 1-5
Arithmetic total deliverytime
Weighted total deliverytime
Invoice receipt Invoice receipt quantity
Invoiced amount in LC
Contract Number of contract items
Request forQuotation
Number of request forquotation items
Number of quotation items
Information Structure S013The following table shows the key figures that are updated to the information structure S013 atheader, item and schedule line level when one of the following events occurs.
Event Header Item Schedule line
Purchase order Points score quantity reliability
Goods receipt Points score quantity reliability
Points score date reliability
Shipping instructions

SAP AG Components of the Logistics Information System (LIS)
Events: Purchasing Information System
April 2001 17
Information Structure S015The following table shows the key figures that are updated to the information structure S015 atheader, item and schedule line level when one of the following events occurs.
Abbreviation used: SS = Subsequent settlement
Event Header Item Schedule line
Invoice receipt (volume-basedrebate)
Provision for income
Invoiced sales (SS)
Number of points (SS)
Invoiced salesquantity (SS)
Gross weight (SS)
Net weight (SS)
Volume (SS)
Credit memo/Billing document(volume-based rebate)
Dissolved provisionfor income
Provisionfinal settlement
Provisioncondition record

Components of the Logistics Information System (LIS) SAP AG
Item Categories and Document Types: Purchasing Information System
18 April 2001
Item Categories and Document Types: PurchasingInformation SystemYou can control whether certain item categories (for example, normal, consignment) anddocument types (for example, a document type for purchase order is a stock transport order) areupdated or not.
You can control this by allocating the item categories and/or the document types to a certainupdate group. An update group consists of a group of rules that determine the requirements forupdating the key figures.
You can use the settings in Customizing under Purchasing. For more information, refer to theImplementation Guide.
SAP AG Components of the Logistics Information System (LIS)
Updating Standard Analyses for Long-Term Planning: Purchasing Information System
April 2001 19
Updating Standard Analyses for Long-Term Planning:Purchasing Information SystemThe data basis for the standard analyses in long-term-planning is provided by data which isupdated from long-term planning to a planning version of information structure S012. Updatingdoes not take place continually and must therefore be initialized via a report that you can findusing the long-term planning menu. This report can also be carried out as a background job.
To initialize the updating for the analyses in long-term planning, proceed as follows:
1. From the R/3 system menu, select Logistics � Production � Master planning �Long-term planning.
The long-term planning menu appears.
2. Select Evaluations � Purch. Info System � Set up data.
The selection screen for the update report appears.
3. In the field Planning scenario, specify the planning scenario you require from long-termplanning. In the field Version, enter the name of the version to which the data is to besaved in the Purchasing information structure S012. Each planning scenario is assignedexactly one version.
In the standard analyses for long-term planning, you can calculate the order value in fourdifferent ways when evaluating a planning scenario:
– Calculation using info record
If a vendor is assigned to the planned order, and if an info record exists, then theorder value is calculated using the purchasing info record price. In the case ofconsignment materials, which do not have a info record price, the system takes thefuture consignment valuation price into account for the calculation, depending uponthe final date of the planned order. If these conditions are not satisfied, no calculationis carried out.
– Calculation using the valuation price
If the standard price is specified in the material master, then the system takes thestandard price or the future standard price into account when calculating the ordervalue. If the movable average price is specified as the price control, then this price isused for calculating the order value.
– Calculation using the new planned price from product costing
– Calculation using the planned price 1, 2, or 3 from product costing
Only one order value can be saved at a time in a version of the information structureS012. If you need to find out how to evaluate a planning scenario for different typesof order value calculation and how to compare the results, refer to StandardAnalyses for Long-term Planning: Comparing Order Values [Page 28]
4. Select Program � Execute, or if you want to use background processing mode, selectProgram � Exec. in background

Components of the Logistics Information System (LIS) SAP AG
Updating Standard Analyses for Long-Term Planning: Purchasing Information System
20 April 2001
If you want to perform an ad hoc standard analysis for long-term planning, and donot want to initialize an update, select the field Ad-hoc evaluation from the selectionscreen of the standard analysis in question. The system then reads the data directlyfrom the planned orders.

SAP AG Components of the Logistics Information System (LIS)
Type of Updating
April 2001 21
Type of UpdatingIn the LIS information systems, updating of statistical data can take place in two ways:
� As a synchronous update (U1)
(Immediate start, i.e., when an event takes place that triggers an update)
� As an asynchronous update (U2)
(Delayed start, i.e., updating is slightly delayed after an event that triggers an update).
You can also turn the updating process off.
If you choose the asynchronous update for the updating of statistical data, a termination of thestatistics update has no effect on the accurate update of the application document.
If you choose the synchronous update, a termination of the statistics update results in failure toupdate the document.
You can find further information about the updating concept in the System Administration Guide.
You can specify the type of updating for each information structure in Customizing. You need tomake the appropriate settings in Customizing for the Logistics Information System. You can finddetailed information in the Implementation Guide for the Logistics Information System.

Components of the Logistics Information System (LIS) SAP AG
Period Units in Updating: Purchasing Information System
22 April 2001
Period Units in Updating: Purchasing InformationSystemIn addition to the type of update, you can also define the period unit to be used in the updatingprocess.
The period unit specifies the intervals in which the statistical data is to be cumulated. You canchoose from the following periods:
� Day
� Week
� Month
� Posting period (you may also need to specify a fiscal year variant)
You can determine the period unit of the update for every standard information structure.
In the SAP standard system, the default period unit for updating all the information structures inthe Purchasing Information System is month. To update the information structure S012 for long-term planning, refer to Updating Standard Analyses for Long-Term Planning: PurchasingInformation System [Page 19].
The prerequisite for changing the period unit is that no actual data has been updatedto the information structure.You can set the period unit for the standard information structures in Customizing forthe Logistics Information System.
SAP AG Components of the Logistics Information System (LIS)
Update of Quantities and Currency Amounts: Purchasing Information System
April 2001 23
Update of Quantities and Currency Amounts:Purchasing Information SystemCurrency AmountsCurrency amounts are always updated in local currency. The local currency is assigned to thecompany code. You can make this assignment in Customizing under Organization.
QuantitiesQuantities are updated in base unit of measure.The base unit of measure is the unit of measure in which the system manages the materialstocks. It is specified in the material master.
Components of the Logistics Information System (LIS) SAP AG
Updating Check
24 April 2001
Updating CheckYou can check updating by displaying an update log, or by simulating the updating. Bothfunctions are available in Customizing for the Logistics Information System.
Update LogYou can monitor the update process by generating a log of the activities. This shows you the flowof data from the Purchasing processes to the information structures in terms of each specific userand event.
Please note that the update log is only generated for the last event which takesplace. Old entries are therefore overwritten as soon as a new event is updated.
This is how you configure the update log:
1. From the R/3 system menu select System � User profile � User parameters.
2. In the PID field enter the parameter MCL and place an X in the Parameter value.
3. Save the entries.
The system load increases when you display an update log. For this reason youshould deactivate the log generation process after successfully checking an update.
SimulationIf you wish to check the update of documents that have already been saved, due to changes youhave made in Customizing, for instance, you can generate update logs from any sales anddistribution documents, without causing an update of the information structures. In this way, youcan check how a document would be updated, if the new settings in Customizing were taken intoaccount. You can also use this type of updating check in the productive system without anyproblems.

SAP AG Components of the Logistics Information System (LIS)
Standard Analyses: Purchasing Information System
April 2001 25
Standard Analyses: Purchasing Information SystemThe following standard analyses are available in the Purchasing Information System:
Purchasing GroupThis analysis enables direct access to information via the purchasing group. You might need ananswer to the question: How large is the order value of a purchasing group in relation to aparticular vendor? The analysis is based on data that is updated to information structure S011.
VendorA vendor analysis is useful if you need direct access to vendor-related data. You might wish toknow, for example, which materials have been ordered from a particular vendor and in whatquantity.
The analysis is based on data that is updated to the information structure S012.
Material GroupThis analysis enables direct access via the material group. It helps you to answer questions suchas: How great is the number of order items for a material group?The analysis is based on data that is updated to the formation structure S012.
MaterialUse this analysis if you want to access statistical data on a material or materials. For example,you may need to know how much of a certain material was ordered. A possible question on thematerial analysis might be: How much was ordered from which material?
The analysis is based on data that is updated to the information structure S012.
Vendor EvaluationThe vendor evaluation standard analysis enables you to evaluate the data from the vendorevaluation in Purchasing. The analysis is based on data that is updated to the informationstructure S013. This standard analysis allows you to find out whether a certain vendor deliversmaterial on time and in the correct quantity required. The key figures that can be evaluated arethe scores for the criteria: quantity reliability, on-time delivery performance, deviation fromshipping notification (keeping the confirmation date), shipping instructions, quality audit (iscurrently not updated).
You can find information on the Vendor Evaluation component in the document MM - MaterialsManagement, under the section on vendor evaluation.
Long-Term PlanningThree standard analyses are available for long-term planning: material, vendor and materialgroup analysis. These standard analyses are based on planning data in long-term planning thatis updated to the information structure S012.
in long-term planning, various planning scenarios can be planned based on independentrequirements. Preliminary planning is thus conducted in order to assess the effects, for example,on the material, capacity or services requirements of the cost center.
The planned material requirement also enables Purchasing to conduct preliminary planning (forpossible negotiations with vendors about outline agreements). If a vendor was also assigned to

Components of the Logistics Information System (LIS) SAP AG
Standard Analyses: Purchasing Information System
26 April 2001
the material, then the vendors and the assigned key figures ‘effective order value’ and ‘orderprice’ can also be displayed in the analyses in addition to the material requirement (orderquantity).
In the standard analyses for long-term planning, you can calculate the order value in fourdifferent ways when evaluating a planning scenario:
� Calculation using info record
If a vendor is assigned to the planned order, and if an info record exists, then the ordervalue is calculated using the purchasing info record price. In the case of consignmentmaterials, which do not have a info record price, the system takes the futureconsignment valuation price into account for the calculation, depending upon the finaldate of the planned order. If these conditions are not satisfied, no calculation is carriedout.
� Calculation using the valuation price
If the standard price is specified in the material master, then the system takes thestandard price or the future standard price into account when calculating the order value.If the movable average price is specified as the price control, then this price is used forcalculating the order value.
� Calculation using the new planned price from product costing
� Calculation using the planned price 1, 2, or 3 from product costing
Only one order value can be saved at a time in a version of the information structure S012. If youneed to find out how to evaluate a planning scenario for different types of order value calculationand how to compare the results, refer to Standard Analyses for Long-term Planning: ComparingOrder Values [Page 28]
No continuous updating takes place for the analyses of long-term planning. In thelong-term planning menu, you can update data to the planned orders of long-termplanning by using the menu sequence Evaluations � Purch. Info System � Setup data.
Here you can assign exactly one version to a planning scenario for the PurchasingInformation System. The selected version is then retained in the planning scenarioand can then be displayed (in the long-term planning menu under the menusequence Scenario � Display).
If you only need one data selection for specific analysis criteria in a standardanalysis, you can initiate this by placing a cross in the Ad-hoc evaluation field in thestandard analysis selection screen. The data is then read directly from the plannedorders. In addition, you need to specify the number of the required planning scenarioin the selection screen. Also refer to Updating Standard Analyses for Long-TermPlanning: Purchasing Information System [Page 19].
You can find detailed information on long-term planning in the WinHelp document PPLong-term planning.
Subsequent SettlementYou can use the standard analysis for subsequent settlement to optimize your businessprocesses with regard to arrangements with vendors. You will be able to detect any

SAP AG Components of the Logistics Information System (LIS)
Standard Analyses: Purchasing Information System
April 2001 27
discrepancies between income from the current year and the previous year at an early stage.Final and intermediate settlement results can be compared with one another, thus enabling youto initiate optimization strategies before problems occur. You can gain an overview of thevendors with the highest bonus, for example, or check the distribution of income at plant level.
The data basis for the standard analysis is provided by data that is updated to the informationstructure S015 at the time of invoice receipt for an order (vendor business volume) or thesubsequent settlement of an agreement (income) by credit memo/billing document.
You can find further information on the functionality of subsequent settlement inPurchasing in the document MM-Purchasing Guide (section “Subsequent Settlementwith Respect to Conditions”).
Exception AnalysisIn the exception analysis, you can display Exceptions [Ext.], which you have defined using theEarly Warning System [Ext.]. The exception analysis acts as a filter, that is, only the exceptionalsituations are displayed. The exceptional situations can be highlighted in color.
See also:Characteristics and Key Figures: Purchasing Information System [Page 30]

Components of the Logistics Information System (LIS) SAP AG
Standard Analyses for Long-term Planning: Comparing Order Values
28 April 2001
Standard Analyses for Long-term Planning: ComparingOrder ValuesOnly one order value can be stored in each version of the information structure S012, which isthe basis for the long-term planning standard analyses. The following example explains how toevaluate a planning scenario for various types of order value calculations and how to comparethe results with one another:
For the planning scenario 100, you would like to calculate and compare the ordervalues in different ways.In one version, you would like to calculate the order value using the purchasing inforecord and in another version, using the valuation price.
Proceed as follows:
1. Carry out the data setup report for the planning scenario 100.
Proceed as follows:
a) In the long-term planning menu, select Evaluations � Purchasing Info System �Set up data.
b) Enter 100 in the Planing scenario field and press Enter. The system automaticallysupplies the name of the version with the same name as the planning scenario. Thename of the version is also 100.
c) Select Valuation price.
2. Copy the version 100 to version 10A.
Version 10A contains the data for the order value calculation via the valuationprice.
Proceed as follows:
a) From the long-term planning menu, select Evaluations � Purchasing info system �Copy version.The ‘Compare info structure version with planning scenario’ screen appears.
b) In the Planning scenario field, enter 100. Since exactly one version is assigned to theplanning scenario (in this case version 100), you do not need to specify the sourceversion.
c) In the field Version, specify the version to which the data is to be copied, i.e. 10A inthis example. Enter an explanatory text in the field Version text.The data is copied from version 100 into version 10A
3. Perform an ad-hoc evaluation of the standard analysis and select Purchasing info recordfor calculating the order value. The data for the standard analysis shows the order valuevia the calculation type purchasing info record.
Proceed as follows:
a) From the Purchasing Information System, select Standard analyses � Long-termplanning � the standard analysis you require. The selection screen for the standardanalysis appears.

SAP AG Components of the Logistics Information System (LIS)
Standard Analyses for Long-term Planning: Comparing Order Values
April 2001 29
b) Select Ad-hoc evaluation and for calculating the order value Purchasing info record.Select Analysis � Execute. The standard analysis list will appear.
Of course you can also carry out the data setup report instead of an ad-hocevaluation (see step 1) and then execute the standard analysis.
4. Perform a planned/actual comparison in the standard analysis and specify the version10A.
Proceed as follows:
a) Position the cursor on the key figure required for the comparison and select Edit �Comparisons � Planned/actual.A dialog box appears.
b) In the Version field, specify 10A.A dialog box appears in which the data of version 100 will be compared to that ofversion 10A.

Components of the Logistics Information System (LIS) SAP AG
Characteristics and Key Figures: Purchasing Information System
30 April 2001
Characteristics and Key Figures: PurchasingInformation SystemPurchasing Group [Page 31]
Vendor, Material Group [Page 32]
Material [Page 34]
Vendor Evaluation [Page 35]
Long-term Planning [Page 37]
Subsequent Settlement [Page 36]
See also:How the Key Figures are Calculated: Purchasing Information System [Page 38]

SAP AG Components of the Logistics Information System (LIS)
Purchasing Group
April 2001 31
Purchasing GroupThe data basis for the purchasing group is data that are updated to the information structureS011.
Characteristics� Purchasing organization
� Purchasing group
� Vendor
Key Figures� Contract items
� Contracts
� Deliveries
� Invoiced amount
� Order item schedule lines
� Order items
� Order value
� Quotation items
� Request for quotation items
� Request for quotations
� Scheduling agreement items
� Scheduling agreements
� Scheduling agreements

Components of the Logistics Information System (LIS) SAP AG
Vendor, Material Group
32 April 2001
Vendor, Material GroupThe data basis for the standard analyses vendor and material group is the data that are updatedin the information structure S012.
CharacteristicsThe following table gives you an overview on the characteristics that are available in the standardanalyses vendor and material group of the Purchasing Information System.
Standard analysis:
Vendor(Info struct. S012)
Material group(Info struct.S012)
Characteristics
Purchasing organization X X
Purchasing group
Country of vendor X
Vendor X
Material group X
Material X
Key Figures� (Scheduled) delivery date deviation 1-5
� Average delivery time
� Contract items
� Deliveries
� Delivery quantities deviation 1-5
� Invoiced amount
� Invoiced price
� Invoiced quantity
� Order item schedule lines
� Order items
� Order price
� Order quantity
� Order value

SAP AG Components of the Logistics Information System (LIS)
Vendor, Material Group
April 2001 33
� Quantity of goods received
� Quotation items
� Request for quotation
� Request for quotation items
� Required delivery quantity
� Scheduling agreement items
� Scheduling agreements
� Value of goods received
� Weighted average delivery time
Components of the Logistics Information System (LIS) SAP AG
Material
34 April 2001
Material The material analysis is based on data that are updated in the information structure S012.
Characteristics� Purchasing organization
� Material
Key Figures� (Scheduled) delivery date deviation 1-5
� Average delivery time
� Contract items
� Deliveries
� Delivery quantity deviation 1-5
� Invoiced amount
� Invoiced price
� Invoiced quantity
� Order item schedule lines
� Order items
� Order price
� Order quantity
� Order value
� Order value
� Quantity of goods received
� Quotation items
� Request for quotation items
� Required delivery quantity
� Scheduling agreement items
� Scheduling agreements
� Value of goods received
� Weighted average delivery time

SAP AG Components of the Logistics Information System (LIS)
Vendor Evaluation
April 2001 35
Vendor EvaluationThe standard analysis vendor evaluation is based on data that are updated in the informationstructure S013.
Characteristics� Purchasing organization
� Vendor
� Material
� Plant
� Purchasing info type
� Purchasing info record
Key FiguresThe key figures that can be evaluated in the standard analysis vendor evaluation, are scores forthe following criterion:
� On-time delivery performance
� Quality audit (currently cannot be updated)
� Quantity reliability
� Shipping instructions
� Shipping notification deviation (keeping the confirmation date)
Components of the Logistics Information System (LIS) SAP AG
Subsequent Settlement
36 April 2001
Subsequent SettlementThe data basis for the standard analysis for subsequent settlement is the data that are updated inthe information structure S015.
Characteristics� Purchasing organization
� Purchasing group
� Plant
� Material group
� Condition granter
� Creditor
� Agreement
� Settlement end
Key Figures� Canceled provision for condition income
� Gross weight to the condition record (agreement) from the order items
� Income from the settlement of the condition record
� Invoiced sales quantity to the condition record (agreement) from the order items
� Invoiced sales to the condition record from the order items
� Net weight to the condition record (agreement) from the order items
� Number of points to the condition record (agreement) from the order items
� Provision for condition income
� Quotient income of the condition record from the final settlement
� Total income of the condition record
� Volume to the condition record (agreement) from the order items
SAP AG Components of the Logistics Information System (LIS)
Long-term Planning
April 2001 37
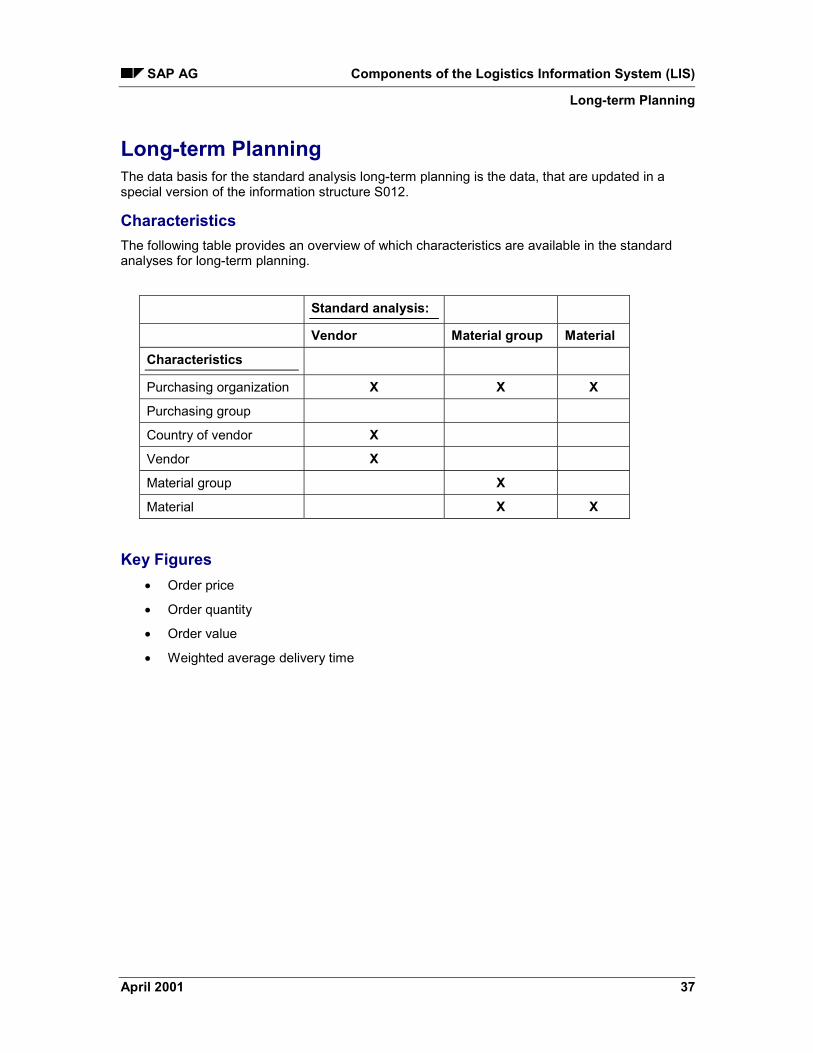
Long-term PlanningThe data basis for the standard analysis long-term planning is the data, that are updated in aspecial version of the information structure S012.
CharacteristicsThe following table provides an overview of which characteristics are available in the standardanalyses for long-term planning.
Standard analysis:
Vendor Material group Material
Characteristics
Purchasing organization X X X
Purchasing group
Country of vendor X
Vendor X
Material group X
Material X X
Key Figures� Order price
� Order quantity
� Order value
� Weighted average delivery time

Components of the Logistics Information System (LIS) SAP AG
How the Key Figures are Calculated: Purchasing Information System
38 April 2001
How the Key Figures are Calculated: PurchasingInformation SystemThe key figures in the Purchasing Information System are updated when the following threetypes of events occur:
� Purchasing document (purchase order, scheduling agreement, contract,inquiry/quotation) create/change
� Goods receipt for a purchase order, scheduling agreement
� Invoice receipt for a purchases order, scheduling agreement
The following are the different types of key figure groups:
� Quantities/Values [Page 39]
� Frequency [Page 40]
� Quantity Delivered/(Scheduled) Delivery Date Deviation, Delivery Time [Page 42]
� Key Figures Calculated at Runtime [Page 44]
� Vendor Evaluation [Page 49]
� Subsequent Settlement [Page 52]

SAP AG Components of the Logistics Information System (LIS)
Quantities/Values
April 2001 39
Quantities/ValuesQuantities
� Purchase order quantityThe purchase order quantity is the quantity of ordered materials from purchase ordersand scheduling agreements. The key figure is updated in base unit of measure when apurchase order or a scheduling agreement is created and changed for the purchaseorder date of the delivery scheduling (information structure S012).In the analyses of long-term planning, the purchase order quantity corresponds to theplanned purchase order quantity from the planned order.
� Required delivery quantityThe required delivery quantity is the quantity that is to be delivered in the current timeperiod, that is, the purchase order quantity according to the statistically-relevant deliverydate. The key figure is updated when a purchase order is created and changed to anorder or a scheduling agreement in base unit of measure to the statistically-relevantdelivery date (information structure S012).
� Quantity of invoice receiptThe invoice receipt quantity is the quantity that is placed in the receipt when an invoicereceipt occurs. The key figure is updated in base unit of measure with an invoice receiptwith a time reference to the order date of the delivery scheduling. (information structureS012).
� Quantity of goods receivedThe quantity of goods received is updated when a goods receipt for a purchase order ofthe delivery scheduling is made (information structure S012). Cancellations are takeninto account.
Values� Effective purchase order value
The effective purchase order value is the value of the purchase order includingdiscounts, surcharges, delivery costs and cash discounts.This key figure is updated when a purchase order or a scheduling agreement is createdand changed for the purchase order date of the delivery scheduling in local currency(information structure S011, S012).In the analyses of long-term planning, the effective order value can only be determinedwhen the vendor is known. The key figure is calculated via the purchase order price inthe purchasing info record.
� Invoiced amountThe invoiced amount is the amount that the vendor placed in the invoice. This key figureis updated in local currency with an invoice receipt for an order date of the deliveryscheduling (information structures S011 and S012).
Components of the Logistics Information System (LIS) SAP AG
Frequency
40 April 2001
FrequencyThe different types of purchasing documents inquiry/quotation, purchase order, contract andscheduling agreement are updated in the following frequencies:
Frequency Inquiry/QuotationWhen an inquiry/quotation is created/changed, the following key figures are updated in thefrequency. The update is done for the order date of the inquiry.
� Number of inquiries(information structure S011)
� Number of all items in the created inquiry(information structures S011 and S012)
� Number of items of the created quotationsWhen a quotation for an inquiry is created, this key figure is also updated to thedocument date of the inquiry.(information structures S011 and S012).
Frequency Purchase OrderWhen a purchase order is created/changed, the following key figures are updated to thefrequency:
� Number of created purchase ordersThe key figure is updated to the document date of the purchase order in informationstructure S011.
� Number of order item schedule linesThe key figure is updated to the purchase order date of the delivery scheduling ininformation structures S011 and S012.
� Number of order itemsThe key figure is updated to the document date of the purchase order informationstructures S011 and S012.
Frequency ContractsWhen a contract is created/changed the following key figures are updated in the frequency. Theupdate occurs to the document date of the contract.
� Number of contracts
� Number of items from all the created contracts
Frequency Scheduling AgreementsWhen a scheduling agreement is created/changed the following key figures are updated:
� Number of scheduling agreementsThe update occurs to the document date of the scheduling agreement in informationstructures S011 and S012.
SAP AG Components of the Logistics Information System (LIS)
Frequency
April 2001 41
� Number of delivery schedulesThe update occurs to the document date of the delivery schedule in informationstructures S011 and S012.
� Number of scheduling agreement itemsThe update occurs to the document date of the scheduling agreement in informationstructures S011 and S012.
Number of DeliveriesThe number of deliveries is updated with a goods receipt for a purchase order to the recordeddate of the goods receipt.

Components of the Logistics Information System (LIS) SAP AG
Quantity Delivered/(Scheduled) Delivery Date Deviation, Delivery Time
42 April 2001
Quantity Delivered/(Scheduled) Delivery Date Deviation,Delivery TimeQuantity to be Delivered Deviation 1-5Included under the quantity to be delivered deviation 1-5 in the Purchasing Information Systemare the number of order items and scheduling agreements, which due to their percentile,quantity to be delivered deviation is assigned the intervals 1 to 5.
The quantity to be delivered deviation is the deviation between the purchase order quantity andthe actual delivered quantity in percent.
The key figures quantity delivered deviation 1-5 are updated to the entry date of the goodsreceipt or the purchase order change in information structure S012 when an order item has beencompleted. An order item is considered complete if:
� The delivered indicator was set
or
� The quantity of goods receipt is larger or the same as the purchase order quantity
or
� The item was deleted.
The quantity to be delivered deviation is valuated by using a grid, whose interval limits can be setin the Customizing function in Logistics Controlling. You can determine a total of four intervals sothat there are a total of five classes for valuation. The grid is determined in connection with thepurchasing organization.
(Scheduled) Delivery Date Deviation 1-5The (scheduled) delivery date deviation 1-5 is the number of deliveries that can be assigned theintervals 1-5, due to their delivery time deviation in days.
The key figures are updated with a goods receipt to the entry date in information structure S012.
The (scheduled) delivery date deviation is valuated by using a grid, whose intervals can be set inthe Customizing function of Logistics Controlling. You can determine a total of four intervals sothat there are a total of five classes for valuation. The grid is determined in connection with thepurchasing organization.
Delivery TimeTo calculate key figures for the delivery time (average delivery time and average weighteddelivery time), use the following help key figures which cannot be given in the standard analysesin the standard:
� Total delivery timeThe total delivery time is the sum of the times in days between order and goods receipt.The key figure is updated with a goods receipt to the entry date of the goods receiptdocument (information structure S012).
� Weighted total delivery timeThe weighted delivery time is the difference in days between goods receipt and order
SAP AG Components of the Logistics Information System (LIS)
Quantity Delivered/(Scheduled) Delivery Date Deviation, Delivery Time
April 2001 43
multiplied by the goods receipt quantity. The key figure is updated with a goods receipt tothe entry date of the goods receipt document. (information structure S012).

Components of the Logistics Information System (LIS) SAP AG
Key Figures Calculated at Runtime
44 April 2001
Key Figures Calculated at RuntimeThe key figures that are described below are calculated when executing the standard analysesand are therefore not saved in any information structure.
Please note that calculating these key figures on an aggregated level (for example,for material groups or purchasing organizations) can only occur if values with thesame currency and quantities are cumulated.
Purchase Order PriceThe average purchase order price is calculated by dividing the effective purchase order value(value of the purchase order including discounts, surcharges, delivery costs, cash discounts) bythe order quantity (quantity of the order materials).
This key figure is calculated when performing the vendors, material groups and material analysis.
The effective purchase order value and the purchase order quantity are updated when an orderor a scheduling agreement is created and changed.
Average Delivery TimeThis key figure is calculated when the vendor, material and material group analysis is performed.
The average delivery time in days is calculated by dividing the total delivery time by the numberof deliveries.
The total delivery time is the total number of times between order and goods receipt in days. It isupdated with a goods receipt to the entry date (information structure S012).
The number of deliveries is updated with a goods receipt for an order to the entry date of thegoods receipt.
Invoice PriceThe average invoice price is calculated by dividing invoice value by invoice receipt quantity. Theinvoice value and the invoice receipt quantity are updated with an invoice receipt to theinformation structure S012.
Value of Goods ReceivedThe value of goods received is calculated in two different ways:
� At data record level of information structure S012
� At aggregated level (totals line and aggregated list levels)
The goods receipt value at data record level is derived from the quantity of goods receivedvaluated with the average order price.
The average order price is calculated by dividing the effective order value by the purchase orderquantity. The effective order value is the value of the purchase order including the discounts,surcharges, delivery costs, and cancellations.

SAP AG Components of the Logistics Information System (LIS)
Key Figures Calculated at Runtime
April 2001 45
The goods receipt value at aggregated level (e.g. totals line or higher list level) is the total of thegoods receipt values of the individual list lines.
Example: Calculating the Value of Goods Received [Page 47]
Influence of the Average Purchase Order Price on the Value of Goods ReceivedThe table below shows how the value of goods received is calculated for two purchase orders. Inone month and for one vendor, 2 purchase orders and the corresponding goods receipts areposted for one material with different purchase order prices. The value of goods received atpurchase order level is derived from the goods receipt quantity valuated with the purchase orderprice.
PO date PO quantity PO value PO price GR quantity GR value
01.97 10 PC $100.00 $10.00 5 PC $50.00
01.97 10 PC $20.00 $12.00 10 PC $120.00
PO = purchase orderGR = goods receiptOnce the purchase orders and the goods receipts have been posted, both purchase orders for01.97 are written to information structure S012, into one data record. The value of goodsreceived for the month 01.97 is derived by multiplying the average purchase order price by thegoods receipt quantity of this one data record. In the vendor analysis, the following list isdisplayed in a drill-down by month.
VendoranalysisVendor:MajorInc.Material:AMonth
Month PO quantity PO value (Average POprice)
GRquantity
GRvalue
Total: 20 PC $220.00 $11.00 15 PC $170.00
01.97 20 PC $220.00 $11.00 15 PC $165.00
This example shows that the value of goods received in the standard analysis does not alwayscorrespond exactly to the value of goods received according to the purchase order price in thepurchase orders. When the purchase orders are updated, multiple purchase orders areaggregated in one info structure data record, so that the value of goods received in the standardanalysis is calculated on the basis of an average purchase order price of the individual purchaseorders.
Components of the Logistics Information System (LIS) SAP AG
Key Figures Calculated at Runtime
46 April 2001
Weighted Average Delivery Time in DaysThis is the delivery time that is weighted with the goods receipt quantity.The delivery time weighted with the quantity is calculated from the cumulated product of deliverytime and goods receipt quantity divided by the cumulated goods receipt quantities:
Total of (delivery time x quantity of goods received)------------------------------------------------------------------Total of (quantity of goods received)
The goods receipt quantity is cumulated without taking the cancellations into account (by usingthe help key figure Total quantity of goods received).
Delivery A: delivery time 5 days, goods receipt quantity 10 piecesDelivery B: delivery time 8 days, goods receipt quantity 20 pieces
The quantity-weighted delivery time, which results from delivery A and B iscalculated as follows:(5 x 10) + (8 x 20)------------------------- = 7
30
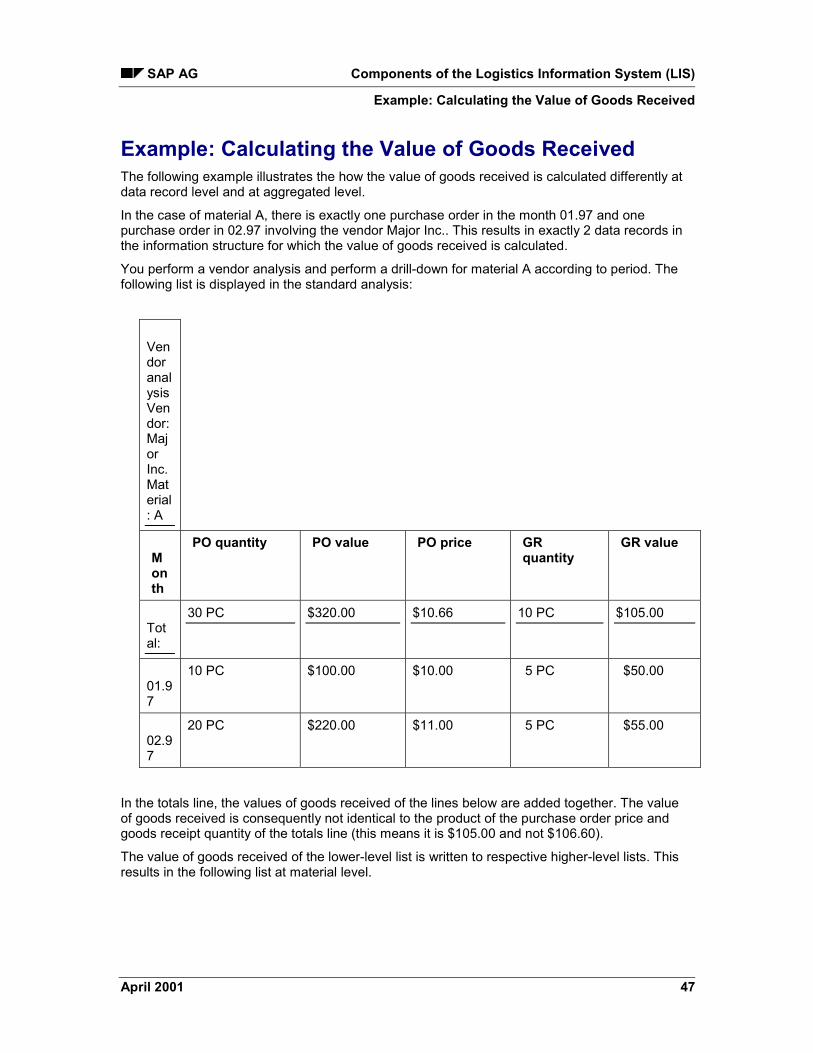
SAP AG Components of the Logistics Information System (LIS)
Example: Calculating the Value of Goods Received
April 2001 47
Example: Calculating the Value of Goods ReceivedThe following example illustrates the how the value of goods received is calculated differently atdata record level and at aggregated level.
In the case of material A, there is exactly one purchase order in the month 01.97 and onepurchase order in 02.97 involving the vendor Major Inc.. This results in exactly 2 data records inthe information structure for which the value of goods received is calculated.
You perform a vendor analysis and perform a drill-down for material A according to period. Thefollowing list is displayed in the standard analysis:
VendoranalysisVendor:MajorInc.Material: A
Month
PO quantity PO value PO price GRquantity
GR value
Total:
30 PC $320.00 $10.66 10 PC $105.00
01.97
10 PC $100.00 $10.00 5 PC $50.00
02.97
20 PC $220.00 $11.00 5 PC $55.00
In the totals line, the values of goods received of the lines below are added together. The valueof goods received is consequently not identical to the product of the purchase order price andgoods receipt quantity of the totals line (this means it is $105.00 and not $106.60).
The value of goods received of the lower-level list is written to respective higher-level lists. Thisresults in the following list at material level.
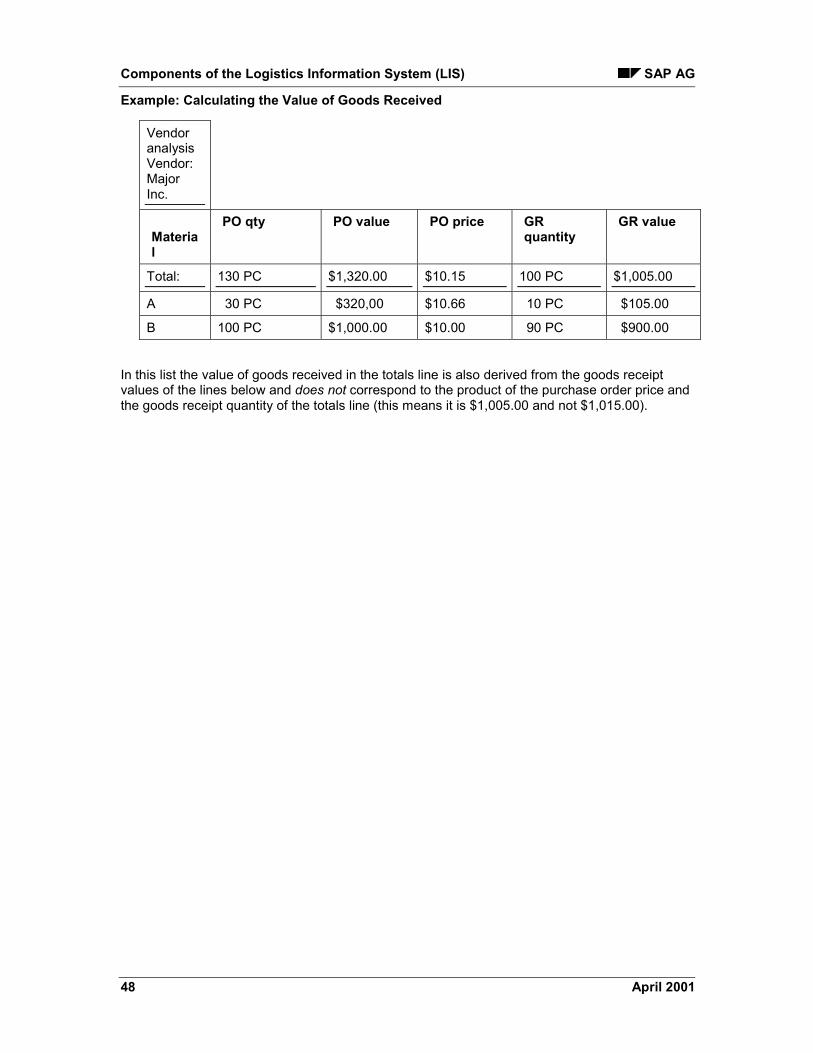
Components of the Logistics Information System (LIS) SAP AG
Example: Calculating the Value of Goods Received
48 April 2001
VendoranalysisVendor:MajorInc.
Material
PO qty PO value PO price GRquantity
GR value
Total: 130 PC $1,320.00 $10.15 100 PC $1,005.00
A 30 PC $320,00 $10.66 10 PC $105.00
B 100 PC $1,000.00 $10.00 90 PC $900.00
In this list the value of goods received in the totals line is also derived from the goods receiptvalues of the lines below and does not correspond to the product of the purchase order price andthe goods receipt quantity of the totals line (this means it is $1,005.00 and not $1,015.00).

SAP AG Components of the Logistics Information System (LIS)
Vendor Evaluation
April 2001 49
Vendor EvaluationThe standard analysis key figures in vendor evaluation are updated in the information structureS013 with a goods receipt and purchase order event. The key figures are scores for the followingcriterion:
� Quantity reliability
� Date reliability
� Deviation shipping notification (keeping confirmation date)
� Shipping instructions
� Quality of service
� Date of service
The following key figures cannot be updated: Shipping notification, points score 1 and 2: Qualityaudit, points score 1 and 2.
For every key figure you will receive points scores 1 and 2, which are each calculated differentlyand are interpreted differently.
This subject will be illustrated with an example using the key figure delivery reliability.
You want to evaluate the key figure delivery reliability points score 1 and 2 for thevendors “Import and Export”. The month January is used as the starting point. In this month, many goods receiptswere made. The key figure value for on-time delivery performance points score 1 and2 is 90.In February a goods receipt is made that is valuated with 20 points. The key figurevalue for the key figure on-time delivery performance points score 1 in the standardanalysis is 20. The key figure value for the key figure on-time delivery performancepoints score 2 is calculated by totaling the point scores for January, multiplied by thesmoothing factor 0.8 and the points score for February, also multiplied by thesmoothing factor (1 - smoothing factor). The smoothing factors are stored inCustomizing of the vendor evaluation. For points score 2, the key figure value is 76.
Points score 1 delivery reliability Points score 2 delivery reliability
January 90 90
February 20 (90 *0.8) + (20 * (1 - 0.8) = 76
Points score 1 shows the valuation for one month, in the example 20 points. Thekey figure shows that the vendor has problems this month with (scheduled) deliverydates. It is thus not taken into account that in January a higher points score wasreached. Should new scores be determined within the current period, then they willbe Smoothed [Page 51] and adopted in the score that was used until now.

Components of the Logistics Information System (LIS) SAP AG
Vendor Evaluation
50 April 2001
Points score 2 shows the cumulated and Smoothed [Page 51] scores of all of theperiods. In this example, the key figure value for points score 2 shows that thevendor reached an average points score over the two months.
Note that in the vendor evaluation, only the points scores 2 is taken into account foran evaluation. The points scores 1 can only be shown in the standard analysis.

SAP AG Components of the Logistics Information System (LIS)
Smoothed
April 2001 51
SmoothedValue, with which the user can control how much a current value, which is used in thecalculation, influences the result.
A high smoothing factor causes a change in the result, a lower one results in a lesser change.
A smoothing factor is used in the vendor evaluation, for example, to calculate the new individualscores that a vendor receives for the goods receipts in the overall score, valid until now, for beingon time. Since the overall score that was valid until now is used for many goods receipts, the newgoods receipt only represents an individual score, the new goods receipt will be calculated with alower value in the overall score, that is, smoothed.
Components of the Logistics Information System (LIS) SAP AG
Subsequent Settlement
52 April 2001
Subsequent SettlementThis section contains information about how the key figures of the subsequent settlementanalysis are calculated.
There are conditions that vendors grant in retail, for example, for:
� The purchase of goods
� Punctual payment of vendor invoices
� Running promotions
� Contribution to the costs incurred in retail (for example, disposal costs)
There are two different groups of conditions: conditions requiring immediate settlement andcondition requiring subsequent settlement. Conditions requiring immediate settlement are takeninto consideration directly with the vendor invoices or when these invoices are settled and aretherefore not part of the subsequent settlement. Conditions requiring subsequent settlement(indicated as subsequent settlement) are to be subsequently settled with the vendor.
The key figures of the subsequent settlement standard analysis are updated to the informationstructure S015 when an invoice is received for a purchase order (vendor business volume) orwhen an arrangement is subsequently settled (income) by credit memo/billing document.
The key figures for subsequent settlement are divided into two groups as follows:
� Subsequent Settlement: Amounts [Page 53]
� Subsequent Settlement: Quantities [Page 58]

SAP AG Components of the Logistics Information System (LIS)
Subsequent Settlement: Amounts
April 2001 53
Subsequent Settlement: AmountsCondition Record Income / Final Settlement Income / TotalCondition Record Income
� Condition record incomeAmount resulting from the settlement of the cumulative business volume relevant to thecondition record.
The income from arrangements that are to be settled once only and the income frominterim settlements of arrangements that are to be settled periodically are updated underthis key figure.
� Final settlement incomeIncome arising from the final settlement of an arrangement that is to be settledperiodically.
This income is based on the total business volume achieved over the validity period (e.g.annual business volume). Income already received from previous interim settlements arecleared in the process.
� Total income from the condition recordThe key figure “total income from the condition record” describes the total incomederived from the settlements, i.e. the sum of the key figures “condition record income”and “final settlement income” (proportion of the income from the final settlement). If nofinal settlement is carried out, the “total income from the condition record” is equal to the“condition record income”.
The income derived from the settlements of an arrangement is updated to information structureS015 when the settlement document is updated in Financial Accounting.
Irrespective of the date of the document, the income is allocated proportionately to all datarecords in the information structure that belong to the condition record for which settlement isdue. The income due on the basis of the final settlements is distributed proportionately betweenall condition records of the various periods. In the same way, the income is divided up betweenall the characteristics in question (purchasing organization, purchasing group, merchandisecategory, plant, month).
By using two income key figures (final settlement income and condition record income) you canalways determine which proportion of the income originates from interim settlements and whichamount is a result of the final settlement (e.g. due to a higher scale level or a business volumecomparison and agreement). You can use this information to create optimization strategies.
In Customizing under the arrangement type, you can determine whether a final arrangementshould be carried out or not. Note the settings that you can make in Customizing under thearrangement type:
1. If you have determined in Customizing under the arrangement type, that the settlementsof the arrangement occur only once at the valid to date of the arrangement, no finalsettlement will occur. Only the key figure “Income condition record” will then be updated;the key figure “Income final settlement” will not be updated in this case.
2. If you have specified in Customizing under the arrangement type that an arrangementshould be settled at regular intervals, then only the key figure “condition record income”

Components of the Logistics Information System (LIS) SAP AG
Subsequent Settlement: Amounts
54 April 2001
is updated with the interim settlements of the arrangement (settlements of the conditionrecords for the various periods).
Examples [Page 56]
Provision for Accrued Condition Income / Dissolved Provisionfor Accrued Condition IncomePayments always occur once the validity period of the arrangement has ended. You thereforehave the opportunity to post provisions for accrued income or for condition records. You firstneed to ensure that the Provision indicator is marked in Customizing for the condition type.
The provision for accrued income enables you to influence the article price valuation on the basisof income that is expected from a later settlement. The provision for accrued income reduces theeffective price, thus affecting the article price valuation.
A purchase order of 10 articles with a unit price of $10 is activated.The following was determined for an end-of-period refund:
� $1 per piece
� $1.50 for purchases of 1000 pieces
The article can only be valuated at $9 per piece, as a subsequent income of at least$1 per piece is expected.
When settlement takes place, the provision for accrued income is dissolved and updated to theinformation structure S015 under the key figure “dissolved provision for accrued income”.
Updating of the key figure “provision for accrued income” takes place during invoice verificationand data is updated to the information structure S015.
Vendor Business VolumeInvoiced sales for the condition record (arrangement) from the purchase order items.
In order for invoiced sales to be updated to a purchase order item, this purchase order item mustbe relevant for the subsequent settlement. This is controlled by the corresponding indicator in thevendor master, in the purchasing info record or in the purchase order item.
In Customizing for the arrangement type, you can specify what is to be updated as vendorbusiness volume:
� The business volume from the order item (in accordance with the condition basis for thestep of the calculation schema)
or
� The net value from invoice verification
In the standard system, the vendor business volume is updated upon invoice receipt to thedocument date. At the same time, the data is allocated to the respective condition record. Thismeans that the data is both available for the condition record, and can also be analyzed on amonthly basis (e.g. in the case of arrangements settled on a quarterly basis).

SAP AG Components of the Logistics Information System (LIS)
Subsequent Settlement: Amounts
April 2001 55
Please note that in the case of arrangements that are settled periodically, data isdetermined for the respective condition record (period) that is valid on the documentdate of invoice verification. The condition record valid at the time of invoiceverification can differ from the condition record valid during price determination(purchase order or goods receipt).
Components of the Logistics Information System (LIS) SAP AG
Examples: Income Final Settlement / Income Condition Record / Total Income ConditionRecord
56 April 2001
Examples: Income Final Settlement / Income ConditionRecord / Total Income Condition RecordAn arrangement is valid from Jan 1, 1996 to Dec. 31, 1996.
Two different scenarios are possible:
� The arrangement is settled once-only.If the arrangement is subject to once-only settlement, you can, for example, agree on acondition stipulating a rebate of 3%. If the vendor business volume amounts to $100,000,this would result in an income of $3,000, which is updated to the key figure “conditionrecord income”. There is no final settlement income in this case, therefore the key figure“final settlement income” is not updated.
� The arrangement is settled periodically.If the arrangement is settled periodically, (e.g. on a quarterly basis), you can, forexample, agree on a condition stipulating a rebate of 3%. On the business volumeachieved during a quarter. The income for the periods is updated to the key figure“condition record income”:
– 1st quarter: vendor business volume $20,000 --> condition record income:$600
– 2nd quarter: vendor business volume $30,000 --> condition record income: $900
– 3rd quarter: vendor business volume $20,000 --> condition record income:$600
– 4th quarter: vendor business volume $30,000 --> condition record income:$900
For the final settlement, you agree on a condition stipulating a rebate of 5% on an annualincome in excess of $75,000.A payment of $3,000 has already been made. The “final settlement income” thereforeamounts to $2,000:
Final settlement income: $100,000 * 0.05 = $5,000 - $3,000 = $2,000The first quarter yields a proportionate income of $400, which is updated to the key figure“final settlement income” and is allocated to the respective period. This proportionateincome is calculated as follows:
1st quarter “Final settlement income”:
Final settlement income------------------------------ * Business volume for 1st quarter=Total business volume
$2,000----------------- * $20,000 = $400$100,000

SAP AG Components of the Logistics Information System (LIS)
Examples: Income Final Settlement / Income Condition Record / Total Income Condition Record
April 2001 57
The key figure “Total income from the condition record” for the first quarter is the sum ofthe condition record income (interim settlement) and the proportionate income from thefinal settlement (1st quarter final settlement income). Therefore, in the above example:
Total income from the condition record (1st quarter): $600 + $400 = $1,000
Here the key figures are also updated at the level of the months involved, so that youcan analyze the key figures on a monthly basis. This means that all income for thefirst quarter is divided up further over the months January, February and March.
Components of the Logistics Information System (LIS) SAP AG
Subsequent Settlement: Quantities
58 April 2001
Subsequent Settlement: QuantitiesThe key figures described below refer to the condition record for the order item. The order itemmust be relevant to the subsequent settlement for these key figures to be updated. This iscontrolled by corresponding indicators in the vendor master, the purchasing info record or in theorder item.
In the standard system, these key figures are updated to the information structure S015 uponinvoice receipt on the document date. At the same time the data is allocated to the correspondingcondition record. The data is then both available for the condition record, and can also beanalyzed on a monthly basis (e.g. in the case of arrangements that are settled quarterly). In orderfor updating to take place, it must be possible to determine a condition record of the arrangementin Subsequent Settlement during price determination (purchase order or goods receipt).
Please note that in the case of arrangements that are settled periodically, data isdetermined for the respective condition record (period) that is valid on the documentdate of invoice verification. The condition record valid at the time of invoiceverification can differ from the condition record valid during price determination(purchase order or goods receipt).
Weights� Net weight
Net weight for the condition record (arrangement) from the purchase order items.
� Gross weight
Gross weight for the condition record (arrangement) from the purchase order items.
Gross/net weight is saved in the material master or in the purchasing info record, or can beentered manually in the order document.
Updating of both these key figures always takes place when the reference magnitude or thecalculation rule refers to the gross or net weight. In the case of agreements settled periodically,this might also be the condition record calculation rule in the final settlement.
Quantity of Vendor Business VolumeQuantitative business volume to the condition record (arrangement) from the order items.
Updating of this key figure always takes place when the reference magnitude or the calculationrule refers to the quantity. In the case of agreements settled periodically, this might also be thecondition record calculation rule in the final settlement. In order for updating to take place, it mustbe possible to convert the quantity into the units of measure in the condition record.
VolumeVolume for the condition record (arrangement) from the purchase order items.
The volume of the material is specified in the material master or in the purchasing info record, orcan be manually entered in the order document.

SAP AG Components of the Logistics Information System (LIS)
Subsequent Settlement: Quantities
April 2001 59
In the case of condition records with no reference to volume, i.e. if the reference magnitude orthe calculation rule in the condition record does not refer to the volume, then the volume isupdated for purposes of information only.
Number of PointsNumber of points for the condition record (arrangement) from the purchase order items.
The number of points of a material is saved in the material master or in the purchasing inforecord, or can be manually entered in the order document.
Updating of this key figure always takes place when the reference size or the calculation rulerefers to points. In the case of agreements settled periodically, this might also be the conditionrecord calculation rule in the final settlement. In order for updating to take place, it must bepossible to convert the quantity into the units of measure in the condition record.

Components of the Logistics Information System (LIS) SAP AG
Inventory Controlling
60 April 2001
Inventory ControllingInformation Structures [Page 61]
Updating [Page 63]
Standard Analyses [Page 69]
Parameters Controlling [Page 72]
Characteristics and Key Figures [Page 76]
How the Key Figures Are Calculated [Page 91]
Detailed Information [Page 111]

SAP AG Components of the Logistics Information System (LIS)
Inventory Controlling: Information Structures
April 2001 61
Inventory Controlling: Information StructuresIn the standard system, the following information structures are available in Inventory Controlling:
� S031 MovementsAll key figures relating to material movements involving current valuated stock andvendor consignment stock are updated to this information structure. In the standardsystem, the period unit in this information structure is ‘month’. You can define your ownperiod unit for the updating of this information structure.
� S032 StocksThe current valuated and vendor consignment stocks are updated to this informationstructure when a goods movement takes place. The stock values are also updated to thisinfo structure when a goods movement and invoice verification/revaluation take place.This information structure does not contain a period unit.
� S033 Movements (individual records)In order to gain specific results from your analysis, such as determining the date of lastconsumption, displaying informative receipts/issues diagrams, or obtaining reliable meanstock values, updating of the statistical data must take place on a daily basis. Theinformation structure S033 satisfies this requirement, as it is supplied with data everyday.
Structurally, the information structure S033 is identical to the information structure S031,yet also includes the characteristic “document number”. Updating is carried out on a dailybasis at document level. The period unit for the updating of this information structurecannot be changed in Customizing.
� S034 Movements (Batches)The key figures relating to material movements at plant, storage location, material andbatch levels are updated to this information structure.
� S035 Stocks (Batches)The current valuated and vendor consignment stocks are updated to this informationstructure when a goods movement takes place. This information structure does not referto any period and is set up in the same way as the information structure S032, yet alsocontains the additional characteristic ‘batch’.
� S039 PlanningThis information structure includes all of the key figures that are available in InventoryControlling, including all of the extra key figures (range of coverage, inventory turnovers,key figures that are calculated using the mean value). No actual data is written to thisinformation structure. This information structure provides the basis for flexible planning.
If you wish to fill the information structure S039 with actual data, then you can usethe report RMCBS039. It is always advisable to fill this information structure withactual data if you want to access actual data for the forecast during planning, or ifyou want use the flexible analyses to evaluate the extra key figures from InventoryControlling.

Components of the Logistics Information System (LIS) SAP AG
Inventory Controlling: Information Structures
62 April 2001
� S094 Stock/Requirements AnalysisThe information structure S094 includes all of the key figures relating to the current stockand requirements situation and forms the data basis for the standard analyses ofstock/requirements. Data relating to requirements and stock situation flows into thisinformation structure from MRP (data basis for the standard analysis of the currentstock/requirements situation), while at the same time data from long-term planning flowsinto a separate planning version (data basis for the standard analysis long-termplanning). Future stock levels are derived from the requirements and future receipts.
Updating of this information structure does not take place on a continual basis forreasons of performance. It can be initialized via a report. For further information, pleaserefer to Updating for Standard Analyses: Requirement/Stock and Parameters Controlling[Page 66].
Information Structures for Warehouse Management� S090 Stock Placements/Removals
Key figures relating to the placement and removal of warehouse stocks are updated tothis information structure. The key figures of stock placement and removal examine theinternal and external warehouse movements from the perspective of a storage section.
The information structure S090 provides the data basis for the standard analyses ofstock placement/removal and stock placement/removal: material. You can activate theupdating of this information structure in Customizing under Logistics Information System.
� S091 Flow of QuantitiesKey figures relating to the flow of quantities between two bin locations flow into thisinformation structure. They form the data basis for the standard analyses of flow ofquantities, material flows and movement types. You can activate updating for thisanalysis in Customizing under Logistics Information System.

SAP AG Components of the Logistics Information System (LIS)
Updating: Inventory Controlling
April 2001 63
Updating: Inventory ControllingData Analysis in Inventory Controlling is based on statistical data that is updated to theinformation structures from inventory management, invoice verification and revaluation.
The following sections tell you how and when data updating takes place.
Events: Inventory Controlling [Page 64]
Updating Quantities and Currencies: Inventory Controlling [Page 65]
Updating for Standard Analyses: Requirement/Stock and Parameters Controlling [Page 66]
Type of Updating [Page 21]
Period Units in Updating: Inventory Controlling [Page 68]
Updating Check [Page 24]

Components of the Logistics Information System (LIS) SAP AG
Events: Inventory Controlling
64 April 2001
Events: Inventory ControllingData is written to the standard information structures S031, S032, and S033 when goodsmovements (also called material movements or stock movements) and invoiceverification/revaluation take place.The data flows from the document structure to the information structures.
Goods movements are divided into the following types:
� Goods receipt
� Goods issue
� Stock transfer
� Transfer posting
� Inventory differences
You can switch off the updating process for specific, individual movement types in inventorymanagement or in one of the subsequent applications in the logistics chain.
Information Structures in Warehouse ManagementIn the analyses for Warehouse Management, the following events trigger updating of theinformation structures:
Event Information structure
Goods movements in Inventory Management (external quantities),stock removal/placement
S090
Create transfer order (stock removal/ placement, return transfers) S090
Confirm transfer order (reporting real and unreal differences) S091
Only the physical movements are taken into account in the updating of the information structures,i.e., no inventory adjustment postings or transfer postings.

SAP AG Components of the Logistics Information System (LIS)
Updating Quantities and Currencies: Inventory Controlling
April 2001 65
Updating Quantities and Currencies: InventoryControllingCurrency AmountsCurrency amounts are always updated in the local currency. The local currency is assigned tothe company code. You make this assignment in Customizing under Organization.
QuantitiesQuantities are updated in base unit of measure.
The base unit of measure is the unit of measure in which the system manages the materialstocks. It is determined in the material master.

Components of the Logistics Information System (LIS) SAP AG
Updating for Standard Analyses: Requirement/Stock and Parameters Controlling
66 April 2001
Updating for Standard Analyses: Requirement/Stockand Parameters ControllingUpdating the key figures for the standard analyses of requirement/stock (current, long-termplanning) and parameters controlling does not take place continually and must therefore beinitialized via a report, which you can find using the menu. This report can also run in thebackground.
The information structure S094 provides the basis for the standard analyses requirement/stock.On the one hand, the data relating to the requirements and stock situation flows from MRP intothis information structure (data basis for the standard analysis of the current stock/requirementssituation) and on the other hand, data flows into a separate planning version from long-termplanning (data basis for the standard analysis long-term planning).
The parameters controlling analysis is based on the data that is updated to the informationstructures S031 and S032. Updating of the information structure S031 must therefore reflect thecurrent status for the key figures Stock at receipt and Value of stock at receipt.
You can activate the update of the standard analysis requirement/stock for long-term planning inthe long-term planning menu. Use the information system menu to update the standard analysesof the current requirement/stock and of parameters controlling.
If you want to carry out an ad hoc standard analysis for requirement/stock orparameters controlling and do not want to initialize an update, select the field Ad-hocevaluation from the selection screen of the standard analysis in question. The data isthen read directly.
Activating the Update for Standard Analyses: Requirement/Stock - Currentand Parameters ControllingTo activate the update for the analysis of stock/requirement - current and parameters controlling,proceed as follows:
1. From the Inventory Controlling menu, select Standard analyses � Parameterscontrolling � Set up data.
or
Stock/requirement � Current � Set up data.
2. The selection screen of the report for updating appears.
3. Specify the selection parameters you require. You can use the system help functions tohelp you.
4. Select Program � Execute, or if you require background processing, Program �Execute in background.
Activating the Update for Standard Analysis: Stock/Requirements - Long-Term Planning1. From the R/3 system menu, select Logistics � Production � Master planning � Long-
term planning.The long-term planning menu appears.

SAP AG Components of the Logistics Information System (LIS)
Updating for Standard Analyses: Requirement/Stock and Parameters Controlling
April 2001 67
2. Select Evaluations � Inventory Controlling � Set up data.The selection screen of the report for updating appears.
3. Specify the desired selection parameters. You can use the system help functions to helpyou.
4. Select Program � Execute or if you want the program to run in the background,Program � Execute in background.

Components of the Logistics Information System (LIS) SAP AG
Period Units in Updating: Inventory Controlling
68 April 2001
Period Units in Updating: Inventory ControllingIn addition to the type of update, you can also define the period units that are used in theupdating process.
The period unit specifies the intervals in which the statistical data is to be cumulated. You canchoose from the following periods:
� Day
� Week
� Month
� Posting period (you may also need to specify a fiscal year variant)
In Inventory Controlling, the standard SAP setting for the period unit is ‘month’ for updating to theinformation structures S031 and S034, and ‘day’ for the information structure S033. In thestandard system, information structure S039 and information structure S031 both have the periodunit ‘month’. No actual data is written to S039, as this information structure provides the basis forplanning.
The standard setting for the information structure S033 cannot be altered. For information aboutupdating the information structure S094, please refer to Updating for Standard Analyses:Requirement/Stock and Parameters Controlling [Page 66]
The standard setting for the Warehouse Management information structures S090 and S091 is‘month’. For reasons of performance, updating does not take place continually and must beinitialized in Customizing for the Logistics Information System.
The prerequisite for changing the period unit is that no actual data has been updatedto the information structure.
You can set the period unit for the standard information structures in Customizing for theLogistics Information System (exception: information structure S033).

SAP AG Components of the Logistics Information System (LIS)
Standard Analyses: Inventory Controlling
April 2001 69
Standard Analyses: Inventory ControllingIn the standard system, the following standard analyses are available in Inventory Controlling:
Plant/Storage Location/MaterialThe information structures S031 and S032 form the data basis for this standard analysis. Dataconcerning goods movements and the current stocks at the time of a goods movement flows intothese information structures.
Batches The batch analysis is based on data that is updated from inventory management to theinformation structures S034 and S035. Stock key figures and movement key figures for batchescan be evaluated (for example, goods issues and receipts).
Material GroupsThe following standard analyses are found under the menu option ‘material group’:
� MRP controller
� Business area
� Material group
� Division
� Material type
The information structures S031 and S032 form the data basis for this standard analysis. Dataconcerning goods movements and the current stocks at the time of a goods movement flow intothese information structures.
Parameters ControllingIn the standard analysis of parameter controlling, five predefined dual classifications areavailable. You can use these to carry out Inventory Controlling with specific reference to cause.Detailed information about the parameters controlling standard analysis can be found inInventory Controlling: Parameters Controlling [Page 72].
Stock/RequirementTwo standard analyses are available for the stock/requirement situation:
� Standard Analysis: “Current”
You can use this standard analysis to evaluate data for the current stock andrequirement situation from MRP. The future stocks are derived from the requirementsand future goods receipts. The standard analysis is based on data that is updated to theinformation structure S094. The updating process for this analysis is not continuous. Youcan use a report to activate updating. This report can be reached via the menu. For anad hoc analysis, however, you can also read the data directly from MRP. Furtherinformation for updating this analysis can be found in Updating for Standard Analyses:Requirement/Stock and Parameters Controlling [Page 66].
� Standard Analysis “Long-Term Planning”

Components of the Logistics Information System (LIS) SAP AG
Standard Analyses: Inventory Controlling
70 April 2001
You can use this standard analysis to evaluate data from long-term planning. The futurestocks are derived from the requirements and future goods receipts.
In long-term planning, dependent requirements (4000 bicycles) are created by a(simulated) MRP run from independent requirements (1000 cars, for example) by using aBOM explosion (again simulated). The adjustment with stocks creates virtual plannedorders or purchase requisitions, and in turn virtual future stocks. These stocks can beevaluated using parameters controlling. Long-term planning can carry out several ofthese simulations in parallel in so-called scenarios. They can then be observed in severalversions of the information structures.
This standard analysis is based on data that is updated to a planning version for theinformation structure S094. The updating process for this analysis is also not continuousfor reasons of performance. It can be activated via a report which you can reach via themenu. For an ad hoc analysis, you can also read the data directly from long-termplanning. Further information for updating this analysis can be found in Updating forStandard Analyses: Requirement/Stock and Parameters Controlling [Page 66].
In both of the standard analyses for the stock/requirement situation, you can use four predefineddual classifications (besides the dual classification Slow-moving items) in the same way as in thestandard analysis for parameters controlling. You can find further information about these dualclassifications and how to use them in Inventory Controlling: Parameters Controlling [Page 72].
Warehouse ManagementThe following five standard analyses are available for warehouse management:
� Stock placements/removals
� Flows of quantities
� Material placements/removals
� Material flows
� Movement types
The key figures that you can evaluate in the standard analyses for stock placement/removal andmaterial placement/removal, provide information from the point of view of a storage area, anddistinguish between internal and external warehouse movements. Both of these standardanalyses are based on data that is updated to the information structure S090 when the eventsgoods movement (external quantities), or stock removals/placements and transfer orders occur.The only difference between these analyses is the predefined standard drilldown path.
You can use the standard analyses ‘flow of quantities’, ‘material flows’ and ‘movement types’ toview the flow of quantities between two warehouse coordinates. These standard analyses arebased on data that is updated to information structure S091. Both of these analyses differ in thestandard drilldown path that was determined for them.
Exception AnalysisIn the exception analysis, you can display Exceptions [Ext.], which you have defined using theEarly Warning System [Ext.]. The exception analysis acts as a filter, that is, only the exceptionalsituations are displayed. The exceptional situations can be highlighted in color.
See also:Characteristics and Key Figures: Inventory Controlling [Page 76]
SAP AG Components of the Logistics Information System (LIS)
Standard Analyses: Inventory Controlling
April 2001 71
Components of the Logistics Information System (LIS) SAP AG
Inventory Controlling: Parameters Controlling
72 April 2001
Inventory Controlling: Parameters ControllingWhat is Parameters Controlling?You can use the parameters controlling standard analysis to gain a quick an overview of thecause of high stock levels Parameters controlling gives you the opportunity to optimize materialparameters on the basis of the statistical data in Inventory Controlling, thus enabling you tooptimize stock levels. Graphics help you in the search for those materials with potential foroptimization with regard to individual material parameters such as lot size and safety stock. Inthis way, you can reduce your stock levels in the long term and avoid stock shortfalls.In a future Release level, parameters controlling will be enhanced to include deviation analysesin which a modification of the parameters can be used.
The parameters controlling standard analysis uses a cause-oriented approach to reaching thegoal of inventory optimization, i.e., the reduction of capital lockup. Cause-oriented means youcan target specific characteristic values which show weaknesses or certain parameters. Thisenables a differentiated view. The possible advantages of high stock levels is also taken intoaccount.
Integration in Inventory ControllingParameters controlling is implemented in the form of 5 predefined dual classifications.In these dual classifications, the characteristic values (materials) are classified with regard to twokey figures. The segments that are thus created can then be inspected more precisely withregard to the characteristic values they contain. This makes interrelationships between keyfigures more apparent and allows possible problem areas can be quickly detected.
The dual classifications available in parameters controlling can also be carried out inthe standard analyses for stock/requirement, except for the dual classification Slow-moving items.
Parameters controlling is based on data that is updated to information structures S031 and S032.
Updating of the key figures Average stock at receipt and Value of the averagestock at receipt in information structure S031 is not continuous and must beactivated.For an Ad hoc analysis, data can be read directly by placing an ‘X’ in the fieldDynamic data selection in the standard analysis selection screen.To initiate the update, start from the Inventory Controlling menu and select: Standardanalyses � Param. controlling � Set up data. A selection screen appears.Specify the characteristics and the period for which the data is to be updated in S031and select Program � Execute. Also read Updating for Standard Analyses:Requirement/Stock and Parameters Controlling [Page 66]
Dual ClassificationsThe five predefined dual classifications in parameters controlling are described below.
You can find the dual classifications in any initial or drilldown list under the menu option Edit.
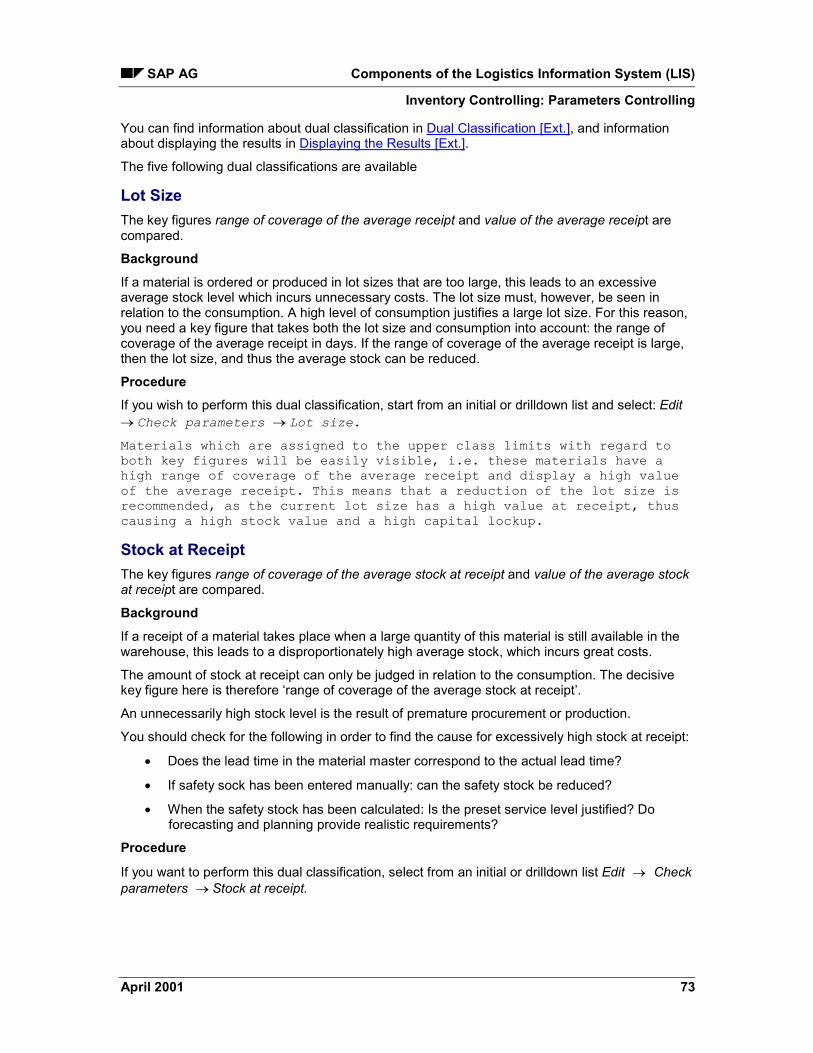
SAP AG Components of the Logistics Information System (LIS)
Inventory Controlling: Parameters Controlling
April 2001 73
You can find information about dual classification in Dual Classification [Ext.], and informationabout displaying the results in Displaying the Results [Ext.].
The five following dual classifications are available
Lot SizeThe key figures range of coverage of the average receipt and value of the average receipt arecompared.
BackgroundIf a material is ordered or produced in lot sizes that are too large, this leads to an excessiveaverage stock level which incurs unnecessary costs. The lot size must, however, be seen inrelation to the consumption. A high level of consumption justifies a large lot size. For this reason,you need a key figure that takes both the lot size and consumption into account: the range ofcoverage of the average receipt in days. If the range of coverage of the average receipt is large,then the lot size, and thus the average stock can be reduced.
ProcedureIf you wish to perform this dual classification, start from an initial or drilldown list and select: Edit��Check parameters ��Lot size.
Materials which are assigned to the upper class limits with regard toboth key figures will be easily visible, i.e. these materials have ahigh range of coverage of the average receipt and display a high valueof the average receipt. This means that a reduction of the lot size isrecommended, as the current lot size has a high value at receipt, thuscausing a high stock value and a high capital lockup.
Stock at ReceiptThe key figures range of coverage of the average stock at receipt and value of the average stockat receipt are compared.
BackgroundIf a receipt of a material takes place when a large quantity of this material is still available in thewarehouse, this leads to a disproportionately high average stock, which incurs great costs.
The amount of stock at receipt can only be judged in relation to the consumption. The decisivekey figure here is therefore ‘range of coverage of the average stock at receipt’.
An unnecessarily high stock level is the result of premature procurement or production.
You should check for the following in order to find the cause for excessively high stock at receipt:
� Does the lead time in the material master correspond to the actual lead time?
� If safety sock has been entered manually: can the safety stock be reduced?
� When the safety stock has been calculated: Is the preset service level justified? Doforecasting and planning provide realistic requirements?
Procedure
If you want to perform this dual classification, select from an initial or drilldown list Edit � Checkparameters ��Stock at receipt.

Components of the Logistics Information System (LIS) SAP AG
Inventory Controlling: Parameters Controlling
74 April 2001
Materials which show both a large range of coverage of average stock at receipt and a high valueof the average receipt, have high warehouse stocks at receipt, in relation to consumption, andshould therefore be examined more closely.
The average stock at receipt cannot be updated automatically at plant level. You canactivate the updating of these key figures yourself at regular intervals. You can findthe report for setting up the average stock at receipt under Standard analyses �Param. controlling � Set up data.
Safety StockThe key figures value of the average stock at receipt and stock factor are compared.
BackgroundThe key figure stock factor is calculated by dividing the average stock at receipt by safety stockand should ideally be 1.
In order to optimize stock levels, and at the same time observe the safety factor, it is advisable toreduce the average stock at receipt to correspond with the safety stock. The optimum level isreached when the average stock at receipt and the safety stock are equal. If the average stock atreceipt is larger than the safety stock, this leads to an unnecessarily high stock level, if it issmaller, then there is a danger of a shortage. If you wish to optimize the average stock at receipt,you should ask the following questions:
� Does the lead time in the material master correspond to the actual lead time?
� Do forecasting and planning provide realistic requirements?
In reorder point planning, a purchase order is always triggered when the reorder point has beenexceeded. The reorder point consists of the safety stock and the consumption in the deliverytime. If the average stock at receipt is always higher then the safety stock, for example, then thismight indicate that the delivery times have been incorrectly estimated, orders have been placedprematurely, or that the safety stock level is too high.
ProcedureIf you want to perform this dual classification, start from an initial or drilldown list and select Edit� Check parameters � Safety stock.
You need to look out for materials that deviate greatly with regard to both key figures and thatshow a stock factor which is clearly higher than 1.There is potential for improvement in the consumption forecast or in the delivery time setting.
Safety Stock BufferThe key figures range of coverage of the average receipt and range of coverage of the averagestock at receipt are compared. Both of these key figures represent the safety stock buffer.
BackgroundAvoiding shortfalls is one of the key aims of inventory management. You can make use of twostrategies to achieve this aim:
– A high safety stock and thus a high average stock at receipt
– A large lot size and thus a high range of coverage at receipt
SAP AG Components of the Logistics Information System (LIS)
Inventory Controlling: Parameters Controlling
April 2001 75
If you decide on a high safety stock, you should check whether the lot size and thus the averagestock at receipt can be reduced.
If you decide on a large lot size, for reasons of cost, then you should consider making a reductionto the safety stock and thus the average stock.
ProcedureIf you want to execute this dual classification, start from an initial or drilldown list and select: Edit� Check parameters � Safety stock buffer.
You should pay particular attention to characteristic values that are in the upper class limits forboth key figures. The combination of a high lot size (represented by the key figure range ofcoverage of the average receipt) and a high safety stock (range of coverage of the average stockat receipt) indicates that MRP has been conducted incorrectly. If you are aiming for a high lotsize, then a small safety stock is sufficient as a rule. If, on the other hand, you are aiming for ahigh safety stock, the smaller lot sizes are sufficient. Therefore, you are recommended to useone strategy only, i.e. either a high lot size or a high safety stock.
The average stock at receipt cannot be automatically updated at plant level. You canactivate the updating of this key figure yourself at regular intervals. You can find thereport for setting up the average stock at receipt under Standard analyses � Param.controlling � Set up data
Slow-Moving ItemsThe key figures value of the last consumption and days without consumption are compared.
The key figure ‘days without consumption’ is derived from the time difference between the date ofthe last consumption and the current date.
BackgroundSlow-moving items are those materials whose last consumption was a long time ago. Slow-moving items incur costs without being of any use. Identification for these materials helps to cutcosts.
Procedure
If you want to perform this dual classification, select from an initial or drilldown list, Edit �Check parameters ��Slow-moving item.
You need to take action in the case of materials which show high values for both key figures.
Components of the Logistics Information System (LIS) SAP AG
Characteristics and Key Figures: Inventory Controlling
76 April 2001
Characteristics and Key Figures: Inventory ControllingPlant/Storage Location/Material/Parameters Controlling [Page 77]
Batches [Page 80]
Standard Analyses to Material Groups [Page 81]
Stock/Requirements - Current and - Long-term Planning [Page 89]
Standard Analyses on Warehouse Management [Page 85]
See also:How the Key Figures are Calculated: Inventory Controlling [Page 91]
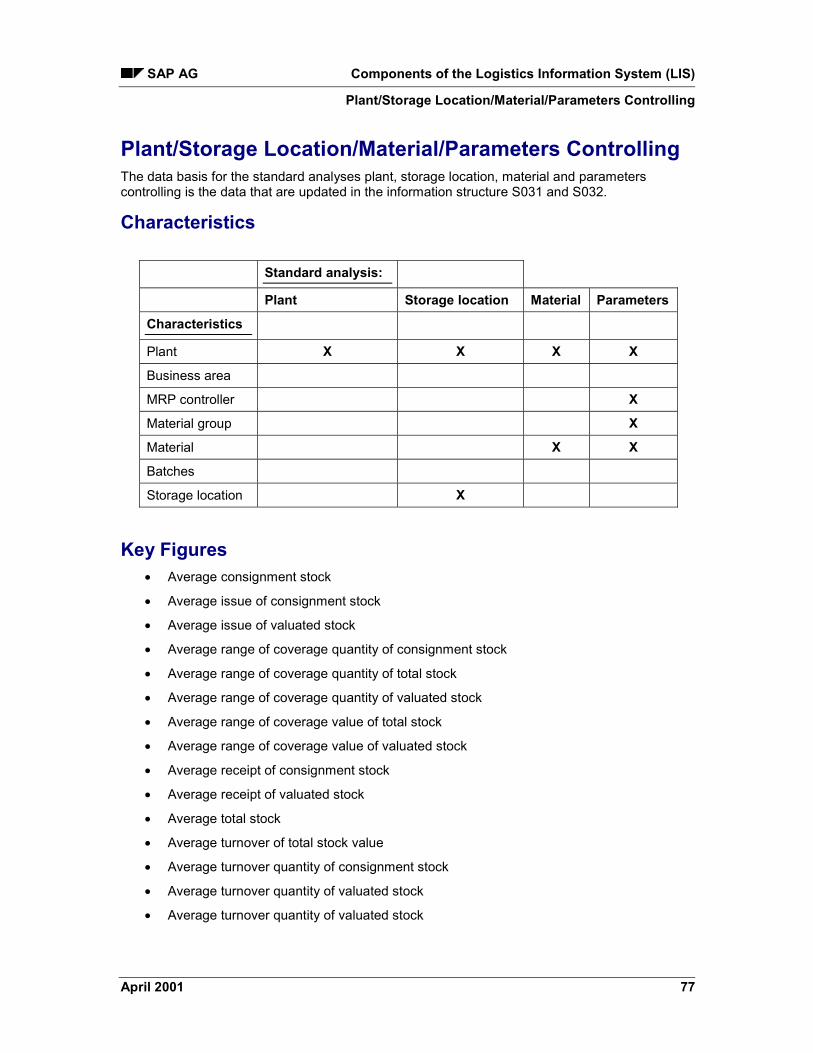
SAP AG Components of the Logistics Information System (LIS)
Plant/Storage Location/Material/Parameters Controlling
April 2001 77
Plant/Storage Location/Material/Parameters ControllingThe data basis for the standard analyses plant, storage location, material and parameterscontrolling is the data that are updated in the information structure S031 and S032.
Characteristics
Standard analysis:
Plant Storage location Material Parameters
Characteristics
Plant X X X X
Business area
MRP controller X
Material group X
Material X X
Batches
Storage location X
Key Figures� Average consignment stock
� Average issue of consignment stock
� Average issue of valuated stock
� Average range of coverage quantity of consignment stock
� Average range of coverage quantity of total stock
� Average range of coverage quantity of valuated stock
� Average range of coverage value of total stock
� Average range of coverage value of valuated stock
� Average receipt of consignment stock
� Average receipt of valuated stock
� Average total stock
� Average turnover of total stock value
� Average turnover quantity of consignment stock
� Average turnover quantity of valuated stock
� Average turnover quantity of valuated stock

Components of the Logistics Information System (LIS) SAP AG
Plant/Storage Location/Material/Parameters Controlling
78 April 2001
� Average turnover value of valuated stock
� Average unplanned usage
� Average unplanned usage value
� Average usage
� Average valuated stock
� Average value of total usage
� Average value of valuated stock
� Consignment stock
� Inventory turnover quantity of consignment
� Inventory turnover quantity of consignment stock per year
� Inventory turnover quantity of total stock per year
� Inventory turnover quantity of valuated stock per year
� Inventory turnover value of total stock
� Inventory turnover value of total stock per year
� Inventory turnover value of valuated stock
� Inventory turnover value of valuated stock
� Inventory turnover value of valuated stock per year
� Last issue
� Last receipt
� Last transaction
� Last usage
� Number of cancellations
� Number of consignment stocks at zero
� Number of issues of consignment stock
� Number of issues of valuated stock
� Number of material transactions
� Number of receipts of consignment stock
� Number of receipts of valuated stock
� Number of total stock at zero
� Number of total usage
� Number of unplanned usage
� Number of valuated stock at zero
� Output of consignment stock
SAP AG Components of the Logistics Information System (LIS)
Plant/Storage Location/Material/Parameters Controlling
April 2001 79
� Output of valuated stock
� Output value of valuated stock
� Range of coverage quantity of consignment stock
� Range of coverage quantity of total stock
� Range of coverage quantity of valuated stock
� Range of coverage value of total stock
� Range of coverage value of valuated stock
� Receipt consignment stock
� Receipt valuated stock
� Receipt value of valuated stock
� Safety stock
� Stock at receipt
� Total stock
� Total usage
� Total usage value
� Unplanned usage quantity
� Unplanned usage value
� Valuated stock
� Value of stock at receipt
� Value of the average issue of valuated stock
� Value of the average receipt of valuated stock
� Value of valuated stock

Components of the Logistics Information System (LIS) SAP AG
Batches
80 April 2001
BatchesThe data basis for the batches analysis is the data that are updated in the information structureS038.
Characteristics� Plant
� Storage location
� Material
� Batches
Key Figures� Consignment stock
� Input of consignment stock
� Input of valuated stock
� Input value of valuated stock
� Number of inputs of valuated stock
� Number of cancellations
� Number of inputs of consignment stock
� Number of material transactions
� Number of outputs of consignment stock
� Number of outputs of valuated stock
� Number of total usage
� Number of unplanned usage
� Output of consignment stock
� Output of valuated stock
� Output value of valuated stock
� Total usage
� Total usage value
� Unplanned usage quantity
� Unplanned usage value
� Valuated stock
� Value of valuated stock

SAP AG Components of the Logistics Information System (LIS)
Standard Analyses to Material Groups
April 2001 81
Standard Analyses to Material GroupsCharacteristics
Standard analyses:Material groups (Infostruct. S031/32)
MRPcontroller
Businessarea
Materialgroup
Division Materialtype
Characteristics
Plant X X X X X
Business area
X
MRPcontroller
X
MRPtype
Materialtype
X
Division X X
Materialgroup
Material
Batches
Storagelocation
Key Figures� Average consignment stock
� Average issue of consignment stock
� Average issue of valuated stock
� Average range of coverage quantity of consignment stock

Components of the Logistics Information System (LIS) SAP AG
Standard Analyses to Material Groups
82 April 2001
� Average range of coverage quantity of total stock
� Average range of coverage quantity of valuated stock
� Average range of coverage value of total stock
� Average range of coverage value of valuated stock
� Average receipt of consignment stock
� Average receipt of valuated stock
� Average total stock
� Average turnover of total stock value
� Average turnover quantity of consignment stock
� Average turnover quantity of valuated stock
� Average turnover quantity of valuated stock
� Average turnover value of valuated stock
� Average unplanned usage
� Average unplanned usage value
� Average usage
� Average valuated stock
� Average value of total usage
� Average value of valuated stock
� Consignment stock
� Inventory turnover quantity of consignment
� Inventory turnover quantity of consignment stock per year
� Inventory turnover quantity of total stock per year
� Inventory turnover quantity of valuated stock per year
� Inventory turnover value of total stock
� Inventory turnover value of total stock per year
� Inventory turnover value of valuated stock
� Inventory turnover value of valuated stock
� Inventory turnover value of valuated stock per year
� Last issue
� Last receipt
� Last transaction
� Last usage
� Number of cancellations

SAP AG Components of the Logistics Information System (LIS)
Standard Analyses to Material Groups
April 2001 83
� Number of consignment stock at zero
� Number of issues of consignment stock
� Number of issues of valuated stock
� Number of material transactions
� Number of receipts of consignment stock
� Number of receipts of valuated stock
� Number of total stock at zero
� Number of total usage
� Number of unplanned usage
� Number of valuated stock at zero
� Output of consignment stock
� Output of valuated stock
� Output value of valuated stock
� Range of coverage quantity of consignment stock
� Range of coverage quantity of total stock
� Range of coverage quantity of valuated stock
� Range of coverage value of total stock
� Range of coverage value of valuated stock
� Receipt consignment stock
� Receipt valuated stock
� Receipt value of valuated stock
� Safety stock
� Stock at receipt
� Total stock
� Total usage
� Total usage value
� Unplanned usage quantity
� Unplanned usage value
� Valuated stock
� Value of stock at receipt
� Value of the average issue of valuated stock
� Value of the average receipt of valuated stock
� Value of valuated stock

Components of the Logistics Information System (LIS) SAP AG
Standard Analyses to Material Groups
84 April 2001
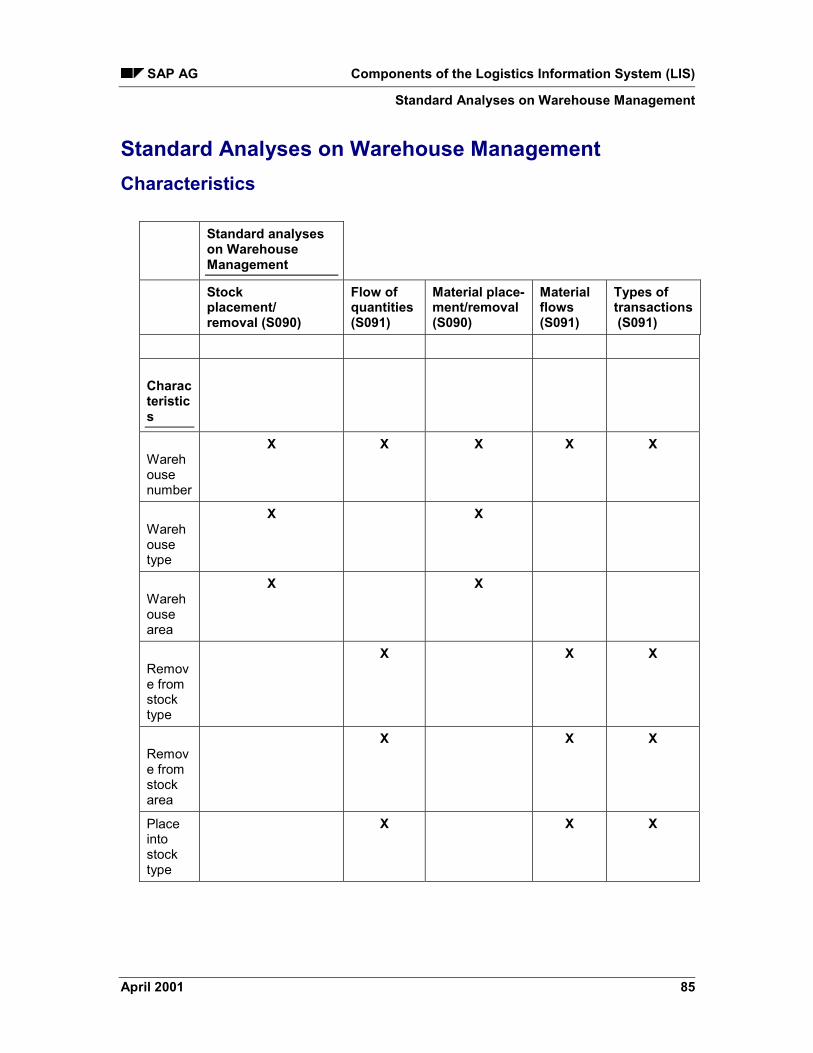
SAP AG Components of the Logistics Information System (LIS)
Standard Analyses on Warehouse Management
April 2001 85
Standard Analyses on Warehouse ManagementCharacteristics
Standard analyseson WarehouseManagement
Stockplacement/removal (S090)
Flow ofquantities(S091)
Material place-ment/removal(S090)
Materialflows(S091)
Types oftransactions (S091)
Characteristics
Warehousenumber
X X X X X
Warehousetype
X X
Warehousearea
X X
Remove fromstocktype
X X X
Remove fromstockarea
X X X
Placeintostocktype
X X X
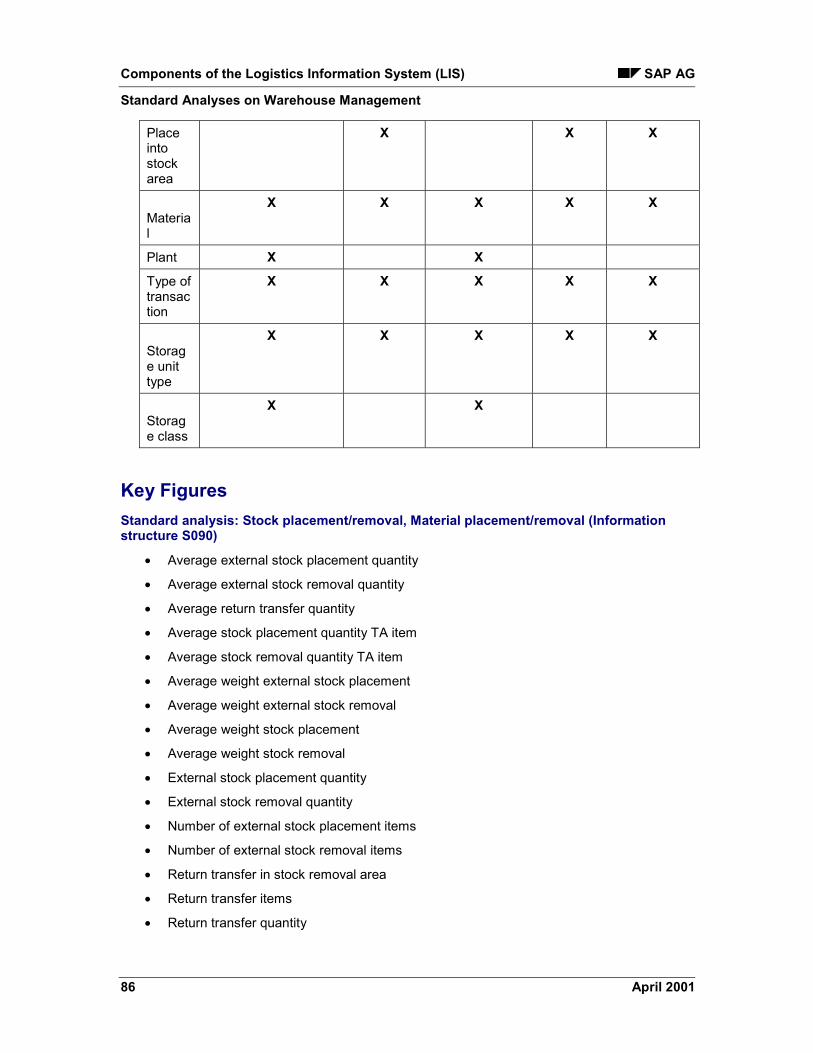
Components of the Logistics Information System (LIS) SAP AG
Standard Analyses on Warehouse Management
86 April 2001
Placeintostockarea
X X X
Material
X X X X X
Plant X X
Type oftransaction
X X X X X
Storage unittype
X X X X X
Storage class
X X
Key FiguresStandard analysis: Stock placement/removal, Material placement/removal (Informationstructure S090)
� Average external stock placement quantity
� Average external stock removal quantity
� Average return transfer quantity
� Average stock placement quantity TA item
� Average stock removal quantity TA item
� Average weight external stock placement
� Average weight external stock removal
� Average weight stock placement
� Average weight stock removal
� External stock placement quantity
� External stock removal quantity
� Number of external stock placement items
� Number of external stock removal items
� Return transfer in stock removal area
� Return transfer items
� Return transfer quantity

SAP AG Components of the Logistics Information System (LIS)
Standard Analyses on Warehouse Management
April 2001 87
� Stock placement items
� Stock placement quantity
� Stock removal items
� Stock removal quantity
� Weight of external stock placement
� Weight of external stock removal
� Weight of return transfers
� Weight of stock placement
� Weight of stock removal
Standard analysis: Flow of quantities, Material flows, Types of transactions (Informationstructure S091)
� Average moving quantity
� Average moving weight
� Average time between creation of the transport order and confirmation of the transportorder
� Average time between creation of the transport requirement and creation of the transportorder
� Average time between the delivery date and creation of the transport order
� Average time between transport requirement planning schedule and creation of thetransport order
� Moving quantity
� Moving quantity
� Number of real transport order items
� Number of transactions
� Number of transfer order items with calculation of time difference between creation andconfirmation of the transport orders
� Number of transfer order items with calculation of time difference between creation oftransport requirement and creation of transport orders
� Number of transfer order items with calculation of time difference between planningschedule of transport requirement and creation of transport orders
� Number of transfer order items with calculation of time difference between delivery notecommission date and creation of the transport orders
� Number of transfer order items with difference, that was posted back to the sourcestorage bin
� Number of transport order items where return transfers occurred in the source storagebin
Components of the Logistics Information System (LIS) SAP AG
Standard Analyses on Warehouse Management
88 April 2001
� Number of transport order items with delivery note reference
� Number of transport order items with reference to material reservation
� Number of transport order items with reference to reference number
� Number of transport order items with reference to transport requirement
� Number of zero stock checks
� Quantities transport order items with differences on source storage bin
� Real difference quantity
� Time between delivery note commissioning date and creation of transport order
� Total time between creation and confirmation of the transport orders
� Total time between creation of transport requirement and creation of transport order
� Total time between planning schedule of the transport requirement and creation of thetransport order

SAP AG Components of the Logistics Information System (LIS)
Stock/Requirements - Current and - Long-term Planning
April 2001 89
Stock/Requirements - Current and - Long-term PlanningThe standard analyses stock/requirement - current and long-term planning is based on data thatare updated in the information structure S094.
Characteristics� Plant
� MRP
� MRP type
� Material
Key Figures� ATP quantity
� Cumulated ATP quantity
� Issue (MRP)
� Issue value (MRP)
� Non available receipts
� Number of receipts
� Planning requirement
� Receipt quantity (MRP)
� Receipt value (MRP)
� Requirements
� Safety stock
� Stock at receipt
� Stock quantity (MRP)
� Stock value (MRP)
� Total issue quantity
� Total stock
� Value of ATP quantity
� Value of cumulated ATP quantity
� Value of safety stock
� Value of stock receipt
� Value total issue
� Value total receipt
� Value total stock
Components of the Logistics Information System (LIS) SAP AG
Stock/Requirements - Current and - Long-term Planning
90 April 2001
SAP AG Components of the Logistics Information System (LIS)
How the Key Figures are Calculated: Inventory Controlling
April 2001 91
How the Key Figures are Calculated: InventoryControllingYou will find out how to calculate and update the key figures in Inventory Controlling in thefollowing topics. The key figures are grouped together.
Please note that key figures for quantities such as additional key figures (inventoryturnover, range of coverage, average values) can only be correctly shown on anaggregated level (for example, on the plant or material group level), if the same unitsare cumulated. Otherwise, “***” is shown as the unit in the standard of InventoryControlling.
Stocks [Page 92]
Usage [Page 94]
Receipts [Page 96]
Issues [Page 98]
Range of Coverage [Page 99]
Inventory Turnovers [Page 101]
Key Figures for Movements [Page 103]
Key Figures From MRP and Long-Term Planning [Page 104]
Key Figures for Warehouse Management [Page 106]

Components of the Logistics Information System (LIS) SAP AG
Stocks
92 April 2001
StocksIn Inventory Controlling you can evaluate key figures for the stock types, valuated stock andconsignment stock (vendor consignment goods).
The entire valuated stock of a material is a result of the sum of:
� Stocks that can be used in any way
� Stock in quality inspection
� Stock in transfer on the storage location and plant level
� Blocked stocks
� Customer consignment stocks
� Customer returnable packaging
� Subcontracting
Total StockTotal stock is the sum of valuated stock and consignment stock.
QuantitiesThe following key figures can be evaluated:
� Quantity of valuated stock
� Quantity of the consignment stock
� Safety stock
� Stock at receipt
Values� Value of valuated stock
� Value of stock at receipt
Zero StockZero stock shows how often the stock quantity reaches zero.
With regard to zero stock, here are key figures which you can evaluate:
� Number of valuated stocks at zero
� Number of total stocks at zero
� Number of consignment stocks at zero
Average Key FiguresThe average values are calculated when the standard analysis for the designated time period iscarried out.
With regard to the quantities, the following average key figures can be evaluated:
SAP AG Components of the Logistics Information System (LIS)
Stocks
April 2001 93
� Average valuated stock
� Average total stock
� Average consignment stock
The average stock is calculated from the sum of beginning stock and ending stock within the timeframe of the analysis divided by two.
With regard to values, the key figure Average stock value of valuated stock can be evaluated.The average stock value of the valuated stock is the sum of beginning stock and ending stockwithin the time frame of the analysis divided by two.
Components of the Logistics Information System (LIS) SAP AG
Usage
94 April 2001
UsageThere are two different types of usage in Inventory Management: unplanned and planned usage.The planned usage is updated when material is taken from the warehouse as a result of areservation. Unplanned usage is updated when material is taken without a reservation being onhand.Total usage is the sum of planned and unplanned usage.
The following key figures can be evaluated with regard to usage:
Frequency� Total number of times used
� Number of times for unplanned usage
Quantities� Total usage quantity
� Unplanned usage quantity
Values� Unplanned usage value
� Total usage value
Average Key FiguresThe average values are calculated when the standard analysis for the designated time period iscarried out.
Quantities
� Average usageThe average usage is calculated by dividing the total usage quantity by the total numberof times used.
� Average unplanned usage quantityThe average unplanned usage quantity is calculated by dividing the unplanned usagequantity and the number of times used.
Values
� Average total usage valueThe average total usage value is calculated by dividing the total usage value and thetotal number of times used.
� Average unplanned usage valueThe average unplanned usage value is calculated by dividing the unplanned usage valueand the number of time for unplanned usage.

SAP AG Components of the Logistics Information System (LIS)
Usage
April 2001 95
Others� Last usage
Date when last usage took place. This key figure is updated in the standard to thecurrent status in information structure S032.
Components of the Logistics Information System (LIS) SAP AG
Receipts
96 April 2001
ReceiptsFrequency
� Number of receipts of valuated stock
� Number of receipts of consignment stock
Updating these key figures occurs on the posting date.
Quantities� Quantity of goods received of valuated stock
� Quantity of goods received of consignment stock
Updating these key figures occurs on the posting date.
Values� Receipts value of valuated stock
The receipts value of valuated stock is calculated from the delivery quantity of valuatedstock valuated with the standard price or the average moving price. When a goodsreceipt for a purchase order is made it results in the receipt value, which is derived fromthe quantity of valuated stock that was valuated with the net order price. If an invoice wasposted for a purchase order before the goods receipt, then the invoice price is taken intoaccount for valuation.
Average Key FiguresThese key figures are calculated when the standard analysis is carried out for the period toanalyze, which is shown on the screen.
Quantities
� Average receipts of valuated stockThe average receipts of the valuated stock is derived by dividing the quantity of goodsreceived by the number of receipts of valuated stock.
� Average receipts of consignment stockThe average receipts of consignment stock is derived by dividing the quantity of receiptsconsignment stock by the number of receipts of consignment stock.
Values
� Value of average receipts of valuated stockThe value of the average receipts of valuated stock is calculated by dividing the receiptsvalue by the number of receipts.
Others� Last receipt
Date of the last receipt.
SAP AG Components of the Logistics Information System (LIS)
Receipts
April 2001 97

Components of the Logistics Information System (LIS) SAP AG
Issues
98 April 2001
IssuesFrequency
� Number of issues of valuated stock
� Number of issues of consignment stock
Updating these key figures is done on the posting date.
Quantities� Issue quantity of valuated stock
� Issue quantity of consignment stock
Updating these key figures is done on the posting date.
Values� Issue value of valuated stock
The issue value of valuated stock is derived from the current price (purchase order price,invoice price or the price from the material master) of the valuated issues quantity ofvaluated stock. This also applies to materials with a standard price as for materials with amoving average price. This key figure is updated on the posting date.
Average Key FiguresThese key figures are calculated for the time period that is designated for the analysis and isshown on the selection screen for the standard analysis when it is carried out.
Quantities
� Average issues of valuated stockThis key figure is derived by dividing the issues values of valuated stock by the numberof issues of valuated stock.
� Average issues of consignment stockThis key figure is derived by dividing the quantity issued of consignment stock by thenumber of issues of consignment stock.
Values
� Value of average issues of valuated stockThis key figure is calculated by dividing the issues values of valuated stock by thenumber of issues of valuated stock.
Others� Last goods issued
Date of the last goods issued. In the standard, this key figure is updated in informationstructure S032.

SAP AG Components of the Logistics Information System (LIS)
Range of Coverage
April 2001 99
Range of CoverageThe range of coverage and average range of coverage are calculated when the standardanalyses are carried out.
Range of CoverageQuantitiesThe range of coverage of a particular stock is calculated as follows:
stock-------------------------------------------average total usage/day
The average total usage is derived by dividing the total usage quantity and the number of periodsthat are used in the time period to be analyzed.
The following key figures can be evaluated:
� Range of coverage of valuated stock
� Range of coverage of total stock
� Range of coverage of consignment stock
ValuesThe range of coverage of a particular stock value is calculated as follows:
value of the stock---------------------------------------------------value of the average total usage/day
The average total usage value is calculated by dividing the total usage value by the number ofdays within the designated time period to analyze.
The following key figures can be evaluated.
� Range of coverage value of valuated stock
� Range of coverage of total stock value
Average Range of CoverageQuantitiesThe average range of coverage of a stock is calculated as follows:
average stock----------------------average total usage/day
Average stock is calculated by adding together the beginning and ending stock in the period toanalyze divided by 2. The average total usage is calculated by dividing the total usage and thenumber of days in the time period to analyze.
The following key figures can be evaluated:
Components of the Logistics Information System (LIS) SAP AG
Range of Coverage
100 April 2001
� Average range of coverage of valuated stock
� Average range of coverage of total stock
� Average range of coverage of consignment stock
ValuesThe average range of coverage of a stock value is calculated as follows:
Value of the stock----------------------------------------------------Value of the average total stock usage/day
The value of the average total usage is calculated by dividing the cumulated total usage value bythe number of days in the period to analyze.
The following key figures can be evaluated:
� Average range of coverage value of valuated stock
� Average range of coverage of total stock value

SAP AG Components of the Logistics Information System (LIS)
Inventory Turnovers
April 2001 101
Inventory TurnoversThe inventory turnovers and average inventory turnovers are calculated when the standardanalyses are carried out.
Inventory TurnoversQuantitiesThe inventory turnover of a particular stock is calculated as follows: Total usage
------------------------
Average stock
The average stock is calculated by adding the beginning stock and the ending stock in the periodto analyze and dividing by two.
The following key figures can be evaluated:
� Inventory turnover of valuated stock
� Inventory turnover of consignment stock
� Inventory turnover of total stock
ValuesThe inventory turnover of a stock value is calculated as follows:
Total usage value-------------------------------Value of the average stock
The value of the average stock is calculated by adding the beginning and ending stock in theperiod to analyze and dividing by two.
The following key figures can be evaluated:
� Inventory turnover of valuated stock
� Inventory turnover of total stock value
Average Inventory TurnoversQuantitiesThe average inventory turnover of a particular stock is calculated as follows:
Average total usage/day-----------------------------------------Average stock
The average total usage is derived by dividing the total usage by the number of days in theperiod to analyze.
The following key figures can be evaluated:
� Average inventory turnover of valuated stock
� Average inventory turnover of total stock

Components of the Logistics Information System (LIS) SAP AG
Inventory Turnovers
102 April 2001
� Average inventory turnover of consignment stock
ValuesThe average inventory turnover of stock value is calculated as follows:
Average total usage value/day------------------------------------------------Value of the average stock
The value of the average stock is derived by adding the beginning stock and the ending stockand dividing by two.
The following key figures can be evaluated:
� Average inventory turnover value of valuated stock
� Average inventory turnover of total stock value
Annual Inventory TurnoverQuantitiesThe inventory turnover of a particular stock per year is derived by dividing the total usage by theaverage stock over one year. The average stock is derived by adding the beginning stock andthe ending stock in the time period to analyze divided by two.
The following key figures can be evaluated:
� Inventory turnover of valuated stock per year
� Inventory turnover of consignment stock per year
� Inventory turnover of total stock per year
ValuesThe inventory turnover of a particular stock value per year is calculated by dividing the totalusage value by the value of the average stock over one year. The value of the average stock iscalculated by adding the beginning stock value and the ending stock value in the time period toanalyze divided by two.
The following key figures can be evaluated:
� Inventory turnover value of valuated stock per year
� Inventory turnover of total stock value per year

SAP AG Components of the Logistics Information System (LIS)
Key Figures for Movements
April 2001 103
Key Figures for MovementsThe following key figures can be evaluated:
� Number of material movementsNumber of events (goods receipt, goods issue, stock transfer, transfer posting), thatresult in a stock change.
� Number of cancellationsNumber of canceled goods movements with and without reference to a document. Thiskey figure is updated to the posting date when a cancellation occurs.
� Last movementDate of the last material movement.
Components of the Logistics Information System (LIS) SAP AG
Key Figures From MRP and Long-Term Planning
104 April 2001
Key Figures From MRP and Long-Term PlanningThe following key figures can be valuated from MRP and long-term planning.
These key figures are updated in information structure S094 and can be valuated in the standardanalyses for requirements/stock (current and long-term planning). Future inventory, that is, theavailable quantities, is derived from the requirements and the future goods receipts.
StocksQuantities
� Future stockPlanned warehouse stock by including all of the MRP valid receipts and issues. InInventory Controlling, future inventory is the available quantity.
� Total stockThe total stock is calculated by adding the available quantity and the safety stock.
� Stock at receiptQuantity of the total stock before a receipt arrives.
� Safety stockQuantity, which should always be in the warehouse in order to satisfactorily cover anunexpected high requirement in the stocking up period.
ATP QuantityWith the ATP quantity (ATP = Available to Promise) the MRP can determine whether all of thereceipts are covered by the master plan and which part of the warehouse stock or master plan isstill available for new receipts.
The value of the ATP quantity is the sum of the ATP quantity and current price.
The following key figures can be evaluated for the ATP quantity:
� Cumulated ATP quantity
� Value of the ATP quantity
� Value of cumulated ATP quantity
Values
� Value of future total stockDifference from the vendor-consignment stock and quantity of future stock valuated withthe current price.
� Value of safety stockSafety stock valuated with the current price.
� Value of stock at receiptQuantity of the valuated stock before the receipt arrives, valuated with the current price.
� Value of future stockIn Inventory Controlling, the future stock is derived from the total of available quantity(ATP quantity) and safety stock. This future stock is valuated with the current price.

SAP AG Components of the Logistics Information System (LIS)
Key Figures From MRP and Long-Term Planning
April 2001 105
Receipts� Total quantity of future receipts
Sum of all planned MRP-valid receipts for all MRP views (gross planning, net planning,separate and connected storage location) and non-available receipts.
� Future MRP-valid quantity of receiptsSum of all planned MRP-valid quantity of receipts for gross and net planning.
� Unavailable receiptsUnavailable receipts are only shown in the MRP, but are not MRP-valid (for example,customer orders with anonymous production by lot size).
� Value of total quantity of receiptsSum of all planned MRP-valid quantities of receipts for the gross and net planning and allunavailable receipts, valuated with the current price.
� Value of future MRP-valid receiptsSum of all planned MRP-valid receipts quantities for the gross and net planning, valuatedwith the current price.
� Number of future receipts
Issues/Requirements� Total quantity of future issues
Sum taken from the planned independent requirements, dependent requirements for allMRP views (gross planning, net planning, independent storage location, adjoiningstorage location) and unavailable issues.
� Future quantity of MRP-valid issuesSum of all planned quantities of MRP-valid receipts for the gross and net planning.
� Future value of MRP-valid issuesSum of all planned MRP-valid issue quantities for the gross and net planning, valuatedwith the current price.
� Value of total issues quantityTotal of future quantity of issues, valuated with the current price.
� RequirementsNecessary quantity for reservations and customer orders.
� Planned independent requirementsQuantity, which was determined by the forecast function or the demand program and isnecessary for planning purposes.
Components of the Logistics Information System (LIS) SAP AG
Key Figures for Warehouse Management
106 April 2001
Key Figures for Warehouse ManagementThe following section describes the information about the key figures that you can use in thestandard analysis for Warehouse Management. The key figures for Warehouse Management canbe divided up into two large groups:
� Key Figures for Stock Placement/Removal [Page 107]
� Key Figures for Flow of Quantities [Page 109]
SAP AG Components of the Logistics Information System (LIS)
Key Figures for Stock Placement/Removal
April 2001 107
Key Figures for Stock Placement/RemovalThe key figures for stock placement and removal illustrate external and internal warehousemovements from the point of view of a storage section.
Key Figures from External Warehouse MovementsThe key figures from this group are updated when an external warehouse movement takes place,caused by a goods receipt or issue in Inventory Management. Updating is done on the date ofthe material document.
The following key figures can be evaluated for external stock removal:
� Weight of the external stock removal
� Quantity of external stock removal
� Number of external stock removal items
When executing the standard analyses for stock placement/removal, the following key figures arecalculated:
� Average weight of the external stock removalProduct of dividing the Weight of the external stock removal quantities by the Number ofexternal stock removal items.
� Average quantity of external stock removalProduct of dividing the Quantity of external stock removal by the Number of externalstock removal items.
The following key figures can be evaluated for external stock placement:
� Number of external stock placement items
� Weight of external stock placements
� Quantity of external stock placement
When executing the standard analyses for stock placement/removal, you can use the followingkey figures:
� Average weight of external stock placementsProduct of dividing Weight of external stock placement quantities by the Number ofexternal stock placement items.
� Average quantity of external stock placementsProduct of dividing the External stock removal quantities by the Number of external stockremoval items.
Key Figures from the Internal Warehouse Movements Updating these key figures occurs with internal warehouse movements via transfer orders withreference to their date of creation either when the TO was created or when it was confirmed.
The following key figures for internal warehouse stock removal are available:
� Weight of the stock removal
� Quantity of stock removals of transfer order items

Components of the Logistics Information System (LIS) SAP AG
Key Figures for Stock Placement/Removal
108 April 2001
� Number of stock removal items
The following key figures are calculated when executing the standard analyses for stockplacement/removal:
� Average weight of stock removal(Product of dividing Weight of the stock removals by Number of stock removal items)
� Average stock removal quantity of the transfer order items(Product of dividing Stock removal quantities of the transfer order items by Number ofstock removal items).
The following key figures for internal warehouse stock placement are available:
� Number of stock placement items
� Stock placement quantity of the transfer order items
� Weight of the stock placement item
The following key figures are calculated when the standard analyses for stock placement/removalare executed:
� Average weight of stock placement(Product of dividing Weight of stock placement quantities by the Number of stockplacement items)
� Average stock placement quantity of the transfer order items(Product of dividing Stock placement quantities of the transfer order items by the Numberof stock placement items)
The following key figures are available for return transfers:
� Number of return transfer items
� Number of return transfers that occurred in the issuing point
� Return transfer quantity of the transfer order items
� Weight of the return transfer
The following key figures are calculated when the standard analyses for stock placement/removalare carried out:
� Average weight of the return transfer(Product of dividing Weight of return transfers by the Number of return transfer items)
� Average return transfer quantity of the transfer order items(Product of dividing Return transfer quantity of the transfer order items by the Number ofreturn transfer items)

SAP AG Components of the Logistics Information System (LIS)
Key Figures for Flow of Quantities
April 2001 109
Key Figures for Flow of QuantitiesIn contrast to the first group, which illustrated the stock placement and removal movement, theflow of quantities between two warehouse points will now be looked at.
Updating the key figures of this group is carried out when a transfer order is either created orconfirmed to the creation date of the transfer order.
Frequency� Number of transfer order items between stock placement type and stock removal type
(number of transactions)
� Number of items with a zero stock check
� Number of transfer order items where the time difference between creating andconfirming the transfer orders was calculated (number OCr-OCo)
� Number of transfer order items where the time difference between creating the transferrequirement and creating the transfer orders was calculated (number RCr-OCr)
� Number of transfer order items where the time difference between the planning date ofthe transfer requirement and creating the transfer order was calculated (number RP-OCr)
� Number of transfer order items where the time difference between the delivery notepicking date and creating the transfer orders was calculated (number DP-OCr)
� Number of transfer order items with a difference, which was posted back to the sourcestorage bin (number of diff.)
� Number of transfer order items, for which “real” differences occurred. Real differencesare those which as a result of the difference indicator were not posted to the sourcestorage bin.
� Number of transfer order items with a reference to a delivery note
� Number of transfer order items with a reference to a reference number
� Number of transfer order items with a reference to a material reservation
� Number of transfer order items with a reference to a transfer requirement
� Number of transfer order items, where the return transfer occurred in the source storagebin.
Quantities� Moving quantity
Quantity of material transactions between stock removal type and stock placement type.
� Quantity difference source storage binQuantities of the transfer order items with differences on the source storage bin
� Quantities with real differencesReal differences are those that as a result of the difference indicator were not postedback to the source storage bin.

Components of the Logistics Information System (LIS) SAP AG
Key Figures for Flow of Quantities
110 April 2001
� Average moving quantityAverage quantity of the material transaction of a transfer item between stock removaltype and stock placement type (is calculated when standard analysis is executed)
Weights� Transaction weight
Quantity of the material transactions between stock removal type and stock placementtype.
� Average transaction weight of the material transaction of a transfer order item betweenthe stock removal type and the stock placement type (calculated when standard analysisis carried out).
Time� Total time between creating and confirming the transfer order
� Total time between planning date of the transfer requirement and creating the transferorder
� Total time between creating the transfer requirement and creating the transfer order
� Total time between the delivery note picking date and creating the transfer order
The following key figures are calculated when the standard analysis is carried out for flow ofquantities. They are obtained by dividing the total time by the total items for which this timeperiod was calculated.
� Average time which expires between creating and confirming the transfer order
� Average time between creating the transfer requirement and the transfer order
� Average time, which expires between the transfer requirement-planning date andcreating the transfer order
� Average time which expires between the delivery note picking date and creating thetransfer order

SAP AG Components of the Logistics Information System (LIS)
Inventory Controlling: Detailed Information
April 2001 111
Inventory Controlling: Detailed InformationFrom an initial or drilldown list in Inventory Controlling, you can call up detailed information on aday-to-day basis for a specific characteristic value for the following key figures:
� Total stock
� Stock quantity
� Consignment stock
� Stock value
The data basis for detailed information consists of data which is updated to information structureS033 on a daily basis with reference to the specific document number.
The detailed information can be displayed graphically or in a table. In addition, you can branchinto the stock overview of inventory management.
� Graphical display
You can display a receipts diagram, an issues diagram and a diagram of the stocklevel for one characteristic value with regard to the above key figures. The diagramshows the receipts and issues quantities or the warehouse stock for the selected keyfigure on the time axis.
The receipts/issues diagram gives you a graphical overview of the stock level and thecumulated issues and receipts data for each material.
In order to get a quick overview of the stock situation, these three diagrams (receipts,issues and stock level) can also be shown as a graphic.
You can also display these three diagrams (receipts, issues and stock level) in onegraphic in order to gain a quick overview of the stock situation.
� Display as a table
you can display a table containing the stock movements for one characteristic valuewith regard to the above key figures. The table shows the movements that took placeduring the period to analyze of the standard analysis. By double clicking on a particularday you can get the individual movements which took place that day along with thecorresponding document number. If you double click on the document number you canbranch into the document.
If you perform a detailed analysis of the above key figures, you can also display thefollowing key figures in the form of a table:
– Average range of coverage
– Closing stock
– Inventory turnover
– Last consumption
– Maximum
– Mean value
– Minimum
– Opening stock
Components of the Logistics Information System (LIS) SAP AG
Inventory Controlling: Detailed Information
112 April 2001
– Percentage of dead stock
– Zero stock
Displaying Receipts/Issues and Stock Level DiagramsTo display a receipts, issues or a stock level diagram, proceed as follows:
1. Position the cursor on the characteristic value in the initial or drilldown list for which youwant a diagram.
2. Select Extras � Detailed info � Receipts diagram or Extras � Detailed info � Issues diagramor Extras � Detailed info � Stock level
and then the key figure for which the diagram is to be shown (total stock, stock quantity,consignment stock, stock value).
If you want to display a graphic in which all three diagrams (receipts, issues, stock level)are shown together, select Extras � Detailed info � Receipts/issues diagr. � thekey figure for which the diagram is to be shown (total stock, stock quantity, consignmentstock, stock value).
Displaying Stock MovementsTo display the stock movements for the key figures total stock, stock quantity, consignmentstock, stock value for one characteristic value, proceed as follows:
1. In the initial or drilldown list, position the cursor on the characteristic value for which you wantto display the stock movements.
2. Select Extras � Detailed info � Stock movements and the key figure for which thestock movements are to be displayed (total stock, stock quantity, consignment stock,stock value).A dialog box appears with an up-to-date table of the stock movements.
3. If you want to display the individual movements for a specific day, position the cursor onthe date you require and select the function Daily movements.A dialog box appears with the individual movements and the corresponding documentnumber for the selected day.If you want to branch into the document, position the cursor on the document numberand select the function Display document. This takes you to the document display.
Displaying Key FiguresIf you want to display additional key figures for the key figures total stock, stock quantity,consignment stock, stock value, proceed as follows:
1. In the initial or drilldown list, position the cursor on the characteristic value for which you wantto display the additional key figures.
2. Select Extras � Detailed info � Key figures and the key figure for which theadditional key figures should be displayed (total stock, stock quantity, consignment stock,stock value).A dialog box appears with the additional key figure values.

SAP AG Components of the Logistics Information System (LIS)
Inventory Controlling: Detailed Information
April 2001 113
Branching into the Stock OverviewIn order to branch into the stock overview of inventory management, select Edit � Detailed info� Stock overview.

Components of the Logistics Information System (LIS) SAP AG
Sales Information System
114 April 2001
Sales Information SystemInformation Structures [Page 115]
Updating [Page 116]
Standard Analyses [Page 132]
Characteristics and Key Figures [Page 134]
How the Key Figures Are Calculated [Page 146]

SAP AG Components of the Logistics Information System (LIS)
Sales Information System: Information Structures
April 2001 115
Sales Information System: Information StructuresIn the standard system, the following information structures are available in the Sales InformationSystem:
� S001 “Customer”
� S002 “Sales office”
� S003 “Sales organization”
� S004 “Material”
� S005 “Shipping point”
� S006 “Sales employee ”
These information structures form the data basis for the respective standard analysis of the samename.
In addition to the above information structures, the standard shipment also includes informationstructures that are used internally (S066/67 Credit Management, S060 rebate processing andS009/14 sales support).
You can find information about the information structures for Variant Configuration in Updatingfor Configurable Materials [Page 130]
Components of the Logistics Information System (LIS) SAP AG
Updating: Sales Information System
116 April 2001
Updating: Sales Information SystemData analysis in the Sales Information System is based on statistical data that has been updatedfrom Sales and Distribution to the information structures.
The following sections describe how and when the updating of data is performed.
Events: Sales Information System [Page 117]
Updating in the Sales Information System [Page 126]
Factors That Influence Updating: Sales Information System [Page 127]
Type of Updating [Page 21]
Period Units in Updating: Sales Information System [Page 129]
Updating Check [Page 24]
Updating for Configurable Materials [Page 130]

SAP AG Components of the Logistics Information System (LIS)
Events: Sales Information System
April 2001 117
Events: Sales Information SystemThe following data from the sales and distribution processes update the information structures:
� Sales documents (for example: orders, returns, requests for quotation, quotations)
� Deliveries
� Billing documents (debit memos, credit memos, cancellations)
The data flows from the document structure to the information structures.
The following tables show, for each information structure, the update group and the key figuresthat are updated when the events occur in the operative application. A distinction is madebetween header data and item data.
S001Event: Order
Update group Key Figure
000001 Net value incoming orders
000001 Gross incoming orders
000001 Net incoming orders 1
000001 Net incoming orders 2
000001 Incoming orders (freight)
000001 Incoming orders PrSub 5
000001 Incoming orders PrSub 6
000001 Number of order items
000001 Quantity of incoming orders
000001 Cost of incoming orders
000001 Net value of open orders
000001 Open orders quantity
000002 Net value of returns
000002 Gross returns
000002 Net returns 1
000002 Net returns 2
000002 Returns PrSub 5
000002 Returns PrSub 6
000002 Number of returns items
000002 Returns quantity

Components of the Logistics Information System (LIS) SAP AG
Events: Sales Information System
118 April 2001
000002 Cost of returns
Event: Delivery
Update Group Key Figure
Item:000001
000001
Open orders quantity
Net value of open orders
Event: Billing document
Update Group Key Figure
Item:000001 Net invoiced sales value
000001 Gross invoiced sales
000001 Net invoiced sales 1
000001 Net invoiced sales 2
000001 Invoiced sales (freight)
000001 Invoiced sales PrSub 5
000001 Invoiced sales PrSub 6
000001 Invoiced sales quantity
000001 Cost of invoiced sales
000002 Net value of credit memos
000002 Gross credit memos
000002 Net credit memos 1
000002 Net credit memos 2
000002 Credit memos (freight)
000002 Credit memos PrSub 5
000002 Credit memos PrSub 6
000002 Credit memos quantity
000002 Cost of credit memos

SAP AG Components of the Logistics Information System (LIS)
Events: Sales Information System
April 2001 119
S002Event: Order
Update Group Key Figure
Header:000001
000002
Number of orders
Number of returns and credit memo requests
Item:
000001 Net value of incoming orders
000001 Gross incoming orders
000001 Net incoming orders 1
000001 Net incoming orders 2
000001 Incoming orders (freight)
000001 Incoming orders PrSub 5
000001 Incoming orders PrSub 6
000001 Cost of incoming orders
000001 Number of orders
000002 Net value of returns
000002 Gross returns
000002 Net returns 1
000002 Net returns 1
000002 Returns (freight)
000002 Returns PrSub 5
000002 Returns PrSub 6
000002 Cost of returns
Event: Delivery
Update Group Key Figure
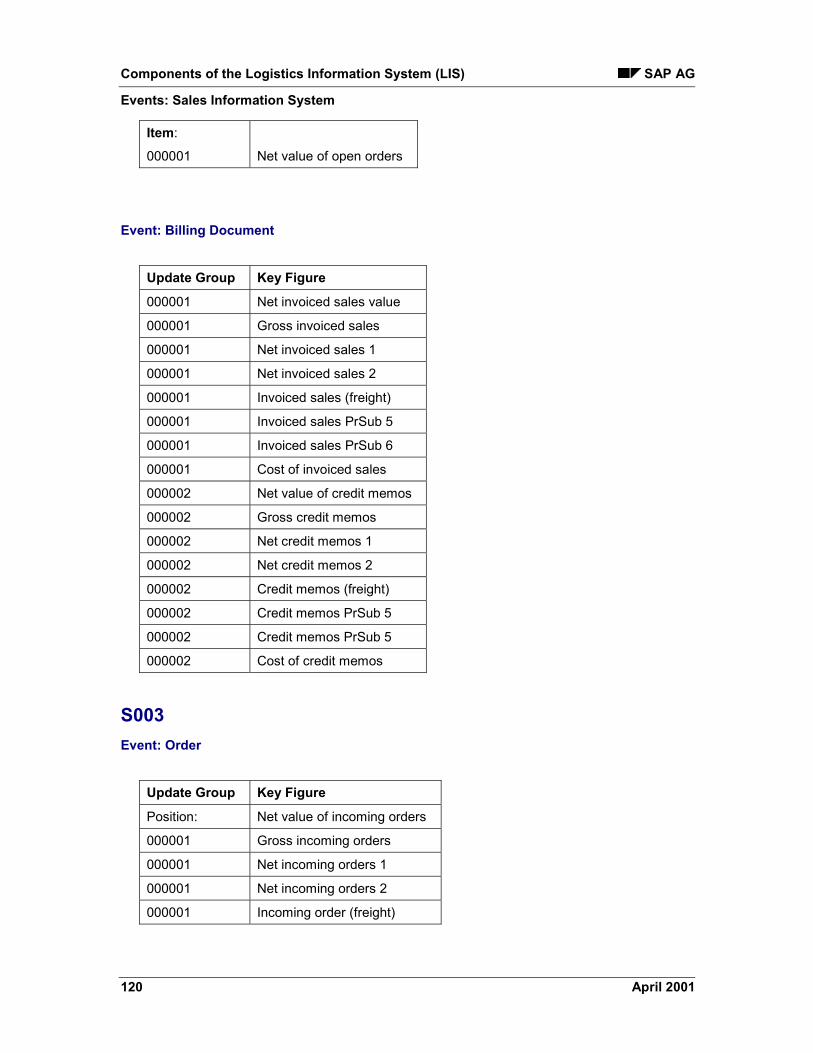
Components of the Logistics Information System (LIS) SAP AG
Events: Sales Information System
120 April 2001
Item:
000001 Net value of open orders
Event: Billing Document
Update Group Key Figure
000001 Net invoiced sales value
000001 Gross invoiced sales
000001 Net invoiced sales 1
000001 Net invoiced sales 2
000001 Invoiced sales (freight)
000001 Invoiced sales PrSub 5
000001 Invoiced sales PrSub 6
000001 Cost of invoiced sales
000002 Net value of credit memos
000002 Gross credit memos
000002 Net credit memos 1
000002 Net credit memos 2
000002 Credit memos (freight)
000002 Credit memos PrSub 5
000002 Credit memos PrSub 5
000002 Cost of credit memos
S003Event: Order
Update Group Key Figure
Position: Net value of incoming orders
000001 Gross incoming orders
000001 Net incoming orders 1
000001 Net incoming orders 2
000001 Incoming order (freight)

SAP AG Components of the Logistics Information System (LIS)
Events: Sales Information System
April 2001 121
000001 Incoming orders PrSub 5
000001 Incoming orders PrSub 6
000001 Number of order items
000001 Incoming orders quantity
000001 Cost of incoming orders
000002 Net value of returns
000002 Gross returns
000002 Net returns 1
000002 Net returns 2
000002 Returns (freight)
000002 Returns PrSub 5
000002 Returns PrSub 6
000002 Number of returns items
000002 Returns quantity
000002 Cost of returns
Event: Billing Document
Update Group Key Figure
Item: Net invoiced sales value
000001 Gross invoiced sales
000001 Net invoiced sales 1
000001 Net invoiced sales 2
000001 Invoiced sales (freight)
000001 Invoiced sales PrSub 5
000001 Invoiced sales PrSub 6
000001 Invoiced sales quantity
000001 Cost of invoiced sales
000002 Net value of credit memos
000002 Gross credit memos
000002 Net credit memos 1
000002 Net credit memos 2

Components of the Logistics Information System (LIS) SAP AG
Events: Sales Information System
122 April 2001
000002 Credit memos (freight)
000002 Credit memos PrSub 5
000002 Credit memos PrSub 6
000002 Credit memos quantity
000002 Cost of credit memos
S004Event: Order
Update Group Key Figure
Item: Net value of incoming orders
000001 Gross incoming orders
000001 Net incoming orders 1
000001 Net incoming orders 2
000001 Incoming orders (freight)
000001 Incoming orders PrSub 5
000001 Incoming orders PrSub 6
000001 Number of order items
000001 Order quantity
000001 Cost of incoming orders
000001 Value of open orders
000001 Open orders quantity
000002 Net value of returns
000002 Gross returns
000002 Net returns 1
000002 Net returns 2
000002 Returns (freight)
000002 Returns PrSub 5
000002 Returns PrSub 6
000002 Number of returns items
000002 Returns quantity
000002 Cost of returns
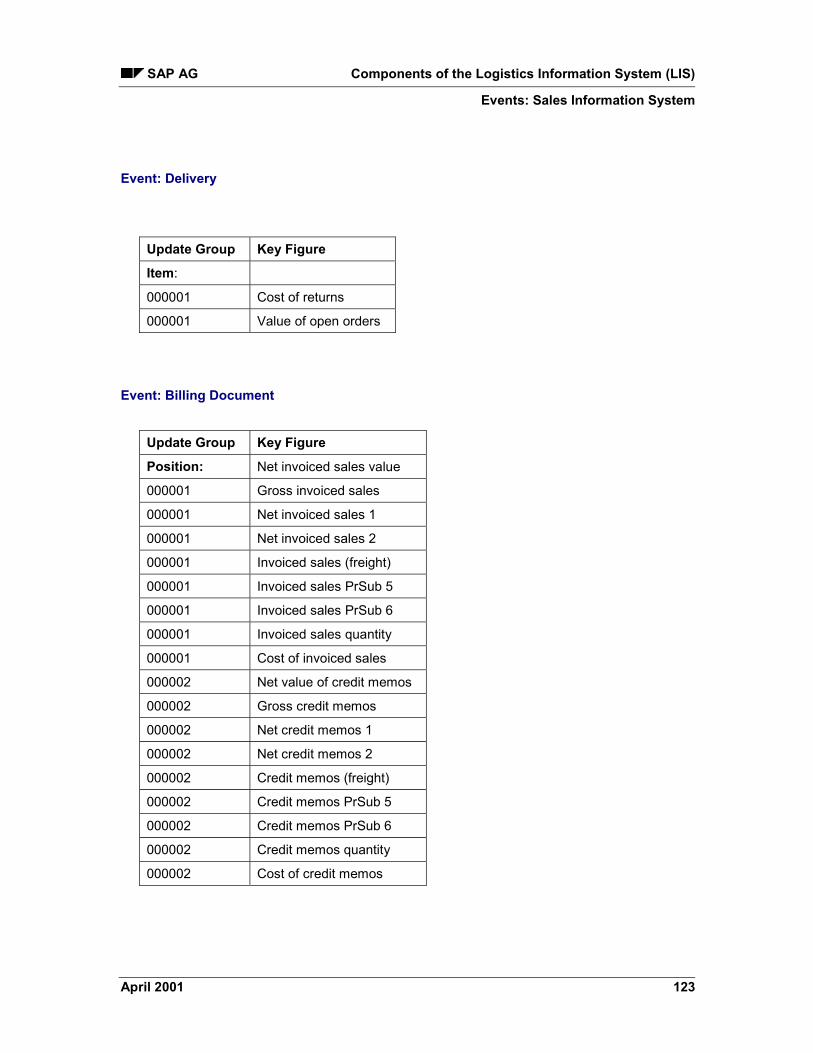
SAP AG Components of the Logistics Information System (LIS)
Events: Sales Information System
April 2001 123
Event: Delivery
Update Group Key Figure
Item:
000001 Cost of returns
000001 Value of open orders
Event: Billing Document
Update Group Key Figure
Position: Net invoiced sales value
000001 Gross invoiced sales
000001 Net invoiced sales 1
000001 Net invoiced sales 2
000001 Invoiced sales (freight)
000001 Invoiced sales PrSub 5
000001 Invoiced sales PrSub 6
000001 Invoiced sales quantity
000001 Cost of invoiced sales
000002 Net value of credit memos
000002 Gross credit memos
000002 Net credit memos 1
000002 Net credit memos 2
000002 Credit memos (freight)
000002 Credit memos PrSub 5
000002 Credit memos PrSub 6
000002 Credit memos quantity
000002 Cost of credit memos
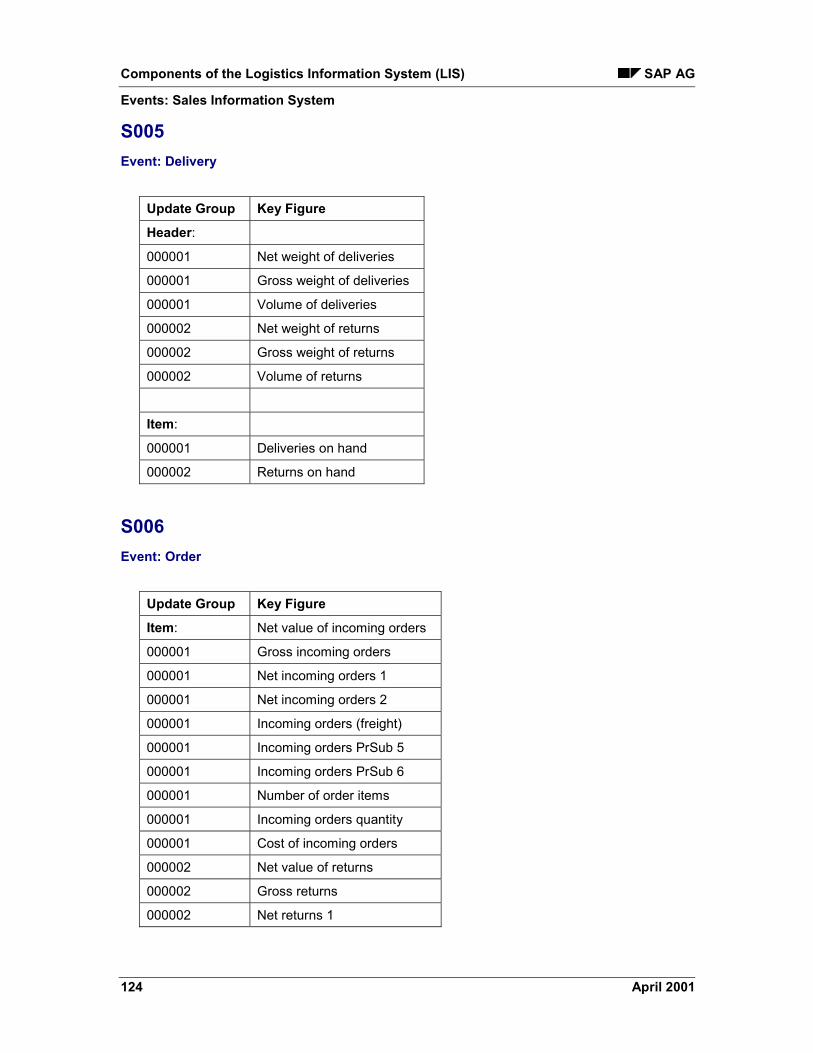
Components of the Logistics Information System (LIS) SAP AG
Events: Sales Information System
124 April 2001
S005Event: Delivery
Update Group Key Figure
Header:
000001 Net weight of deliveries
000001 Gross weight of deliveries
000001 Volume of deliveries
000002 Net weight of returns
000002 Gross weight of returns
000002 Volume of returns
Item:
000001 Deliveries on hand
000002 Returns on hand
S006Event: Order
Update Group Key Figure
Item: Net value of incoming orders
000001 Gross incoming orders
000001 Net incoming orders 1
000001 Net incoming orders 2
000001 Incoming orders (freight)
000001 Incoming orders PrSub 5
000001 Incoming orders PrSub 6
000001 Number of order items
000001 Incoming orders quantity
000001 Cost of incoming orders
000002 Net value of returns
000002 Gross returns
000002 Net returns 1

SAP AG Components of the Logistics Information System (LIS)
Events: Sales Information System
April 2001 125
000002 Net returns 2
000002 Returns (freight)
000002 Returns PrSub 5
000002 Returns PrSub 6
000002 Number of returns items
000002 Number of returns items
000002 Cost of returns
Event: Billing Document
Update Group Key Figure
Position: Net invoiced sales value
000001 Gross invoiced sales
000001 Net invoiced sales 1
000001 Net invoiced sales 2
000001 Invoiced sales (freight)
000001 Invoiced sales PrSub 5
000001 Invoiced sales PrSub 6
000001 Invoiced sales quantity
000001 Cost of invoiced sales
000001 Net value of credit memos
000002 Gross credit memos
000002 Net credit memos 1
000002 Net credit memos 2
000002 Credit memos (freight)
000002 Credit memos PrSub 5
000002 Credit memos PrSub 6
000002 Credit memos quantity
000002 Cost of credit memos

Components of the Logistics Information System (LIS) SAP AG
Updating in the Sales Information System
126 April 2001
Updating in the Sales Information SystemCurrenciesCurrency amounts are always updated in the statistics currency. The statistics currency isassigned to the sales organization. Thus, SIS allows you to analyze and compare the data ofseveral sales organizations that do not belong to the same company code and could thereforehave differing local currencies.
You specify the statistics currency of a sales organization in Customizing for Sales andDistribution.
QuantitiesQuantities are updated in the base unit of measure. The base unit of measure is the unit ofmeasure in which the system manages the material stocks. It is specified in the material masterrecord.
Weights and VolumesWeights are updated in kg, volumes in dm3.
CancellationsIf a sales event is reversed (that is, canceled) the statistics are automatically adjusted to reflectthis change.
Returns/credit memosReturns and credit memos are updated in their own fields.

SAP AG Components of the Logistics Information System (LIS)
Factors That Influence Updating: Sales Information System
April 2001 127
Factors That Influence Updating: Sales InformationSystemIn addition to specifying the updating type (synchronous/asynchronous) and the period unit inwhich values are cumulated, you have other options for filtering and varying the updating thedata from Sales and Distribution processes.
You might require further differentiation for the following reasons:
� You only want the system to update statistical data for a selected number of customersor products.
� You want the statistical update for certain types of sales documents to be different fromothers.
The factors which influence the filtering and variation of the statistical updates are explainedbelow.
These factors relate to:
� Master data (material master record, customer master record)
� Sales and distribution document types
� Item categories
Statistics GroupsThe "Statistics group" indicator appears in the material master record and customer masterrecord and allows you to influence the statistics update with reference to your master data.
The statistics group is a freely definable group key. You can group together materials orcustomers to make a common statistics group for which the same type of updating applies. Thisgrouping can be used, for example, to exclude certain customers or materials from the updatingprocess completely, or to make a distinction between important customers and materials andless important customers and materials.
You can also define statistics groups at sales and distribution document level, by definingstatistics groups for your sales and distribution documents and then assigning them to thedocument types and item categories in sales, shipping, and billing.
You define statistics groups in Customizing for the Logistics Information System.
For more details, please refer to the Implementation Guide for the LogisticsInformation System.
Update GroupYou need to integrate the statistics group into the update control process by allocating it to anupdate group. The statistics groups for the master data and the sales documents are assigned toa specific update group on the basis of the sales organization, distribution channel, and division.A particular type of updating is therefore assigned to a particular business transaction.
When a transaction is updated, the statistical data is then updated in accordance with therequirements that have been assigned to it.

Components of the Logistics Information System (LIS) SAP AG
Factors That Influence Updating: Sales Information System
128 April 2001
You can make these assignments to update groups in Customizing for the Logistics InformationSystem.
For more details, please refer to the Implementation Guide for the LogisticsInformation System.

SAP AG Components of the Logistics Information System (LIS)
Period Units in Updating: Sales Information System
April 2001 129
Period Units in Updating: Sales Information SystemIn addition to the type of update, you can also define the period unit to be used in the updatingprocess.
The period unit specifies the intervals in which the statistical data is to be cumulated. You canchoose from the following periods:
� Day
� Week
� Month
� Posting period (you may also need to specify a fiscal year variant)
You can determine the period unit for the updating of every standard information structure.
The SAP default setting for the period unit in all the SIS information structures is posting period.
The prerequisite for changing the period unit is that no actual data has been writtento the information structure.
You can set the period unit for the standard information structures in Customizing for theLogistics Information System.

Components of the Logistics Information System (LIS) SAP AG
Updating for Configurable Materials
130 April 2001
Updating for Configurable MaterialsIn the Sales Information System, the variant configuration standard analysis allows you toevaluate configurable materials. You need to observe certain special features in the statisticsupdate in order to ensure that the updating of data is consistent and has a high level ofperformance. These are described below:
BasicsThe configuration data of a material is not stored in the document, e.g. in the sales order, butrather in separate configuration tables. In the document, only a reference is made to theconfiguration for the order item.
The following problems arise during the statistics update:
� As the configuration data is not in the document, it has to be subsequently read or enhanced.This causes a sharp increase in the system load.
� All data that is additionally read by means of a statistical data enhancement endangers theconsistency of the statistics update because the system cannot always determine the originaldata from the enhancement if changes have been made to the document. This data doesneed to be determined, however, in order to correct the original statistics update whencreating the document.
For this reason, there is a specific logical procedure for updating. Refer to:
Variant Configuration: Information Structures [Ext.]
Special Features of Multi-Level Configurable Materials [Page 131]
The updating of configurable material was revised for different releases. Refer to thecentral composite note 173756.

SAP AG Components of the Logistics Information System (LIS)
Special Features of Multi-Level Configurable Materials
April 2001 131
Special Features of Multi-Level Configurable MaterialsIn sales order processing, it is possible to configure materials with more than one level, i.e. onecomponent in a configuration is, in turn, a configurable material (please refer to the WinHelpdocument LO - Variant Configuration). These multi-level configurations are not taken into accountin the methods described above.
In the sales order processes of SD, it is also possible to divide multi-levelconfigurable materials up into additional order items. This results in new order itemscontaining configurable materials that are subordinate in the configuration, in additionto the actual order item with the configurable material.
These new order items can now be updated in exactly the same way.
Updating of these additional order items containing the dependent materials takesplace in the same way as for the normal items containing the basic material. Sincethe quantity correlation is taken into account when during sales order explosion, thesystem also writes a corresponding totals record here. The statistics then behave asif the dependent material has been included in the order independently of the basicmaterial.
This leads to problems for those key figures that convey a value. Due to the fact thatthe values of the dependent materials are already included in the value of the basicmaterial, the values are only correct on the drilldown level of the materials in thiscase.
For further information, please refer to Variant Configuration: Information Structures[Ext.]

Components of the Logistics Information System (LIS) SAP AG
Standard Analyses: Sales Information System
132 April 2001
Standard Analyses: Sales Information SystemIn the standard system, the following standard analyses are available in the Sales InformationSystem:
CustomerA customer analysis is always useful if you want to access data directly from the customerstatistics. Direct access via customer is possible and is not dependent on the sales organization.
MaterialThis analysis should be used if you want to access specific statistical data that is directly linked toa material. You can use this analysis to answer questions such as: What quantity of a particularmaterial was sold?
Sales OrganizationThis analysis make it possible for you to view data from the perspective of sales organization.
Shipping PointThe shipping point analysis is based on data that has been updated from the creation of thedelivery note. You can use this analysis to answer questions such as: Who delivers in what way(freight forwarding) and to where (route)?
Sales EmployeeThis analysis enables direct access via the sales employee. You can use this analysis to answerquestions such as: What sales volume has a specific sales employee achieved with regard to aspecific customer? You can use the information from this analysis as the basis for a commissionsettlement.
Sales OfficeThis analysis enables direct access via the sales office. You can use this analysis to answerquestions such as: What sales volume has a certain sales group achieved in a certain division?
Variant ConfigurationThis analysis enables you to evaluate data for configurable materials. In the case of theconfigurable material car, for instance, you can analyze the following questions: How many carswith the color red were sold? How high is the number of incoming orders for cars with a particularengine power?
In order to ensure that data is updated consistently and with a high level of performance, youneed to observe certain special features during the statistics update. Please refer to Updating forConfigurable Materials [Page 130].
Exception AnalysisIn the exception analysis, you can display Exceptions [Ext.], which you have defined using theEarly Warning System [Ext.]. The exception analysis acts as a filter; this means, only theexceptional situations are displayed. The exceptional situations can be highlighted in color.
See also:

SAP AG Components of the Logistics Information System (LIS)
Standard Analyses: Sales Information System
April 2001 133
Characteristics and Key Figures: Sales Information System [Page 134]
Components of the Logistics Information System (LIS) SAP AG
Characteristics and Key Figures: Sales Information System
134 April 2001
Characteristics and Key Figures: Sales InformationSystemCustomer, Material [Page 135]
Sales Organization [Page 137]
Shipping Point [Page 139]
Sales Employee [Page 140]
Sales Office [Page 142]
Variant Configuration [Page 144]
See also:How the Key Figures are Calculated: Sales Information System [Page 146]

SAP AG Components of the Logistics Information System (LIS)
Customer, Material
April 2001 135
Customer, MaterialThe customer analysis is based on data that are updated in the information structure S001; thematerial analysis is based on data that are updated in information structure S004.
Characteristics
Standard analysis:
Customer Material
Characteristics
Sales organization X X
Distribution channel X X
Division X
Sales district
Sold-to party X
Material X X
Key Figures� Billing document (freight)
� Billing document PrSub 5
� Billing document PrSub 6
� Billing document quantity
� Credit memo
� Credit memo (cost)
� Credit memo (freight)
� Credit memo net 1
� Credit memo PrSub 5
� Credit memo PrSub 6
� Credit memo quantity
� Gross incoming orders
� Gross invoiced sales
� Gross returns
� Incoming order items
� Incoming orders

Components of the Logistics Information System (LIS) SAP AG
Customer, Material
136 April 2001
� Incoming orders (freight)
� Incoming orders cost
� Incoming orders PrSub 5
� Incoming orders PrSub 6
� Invoice receipt PrSub 5
� Invoice receipt PrSub 6
� Invoiced sales
� Invoiced sales (cost)
� Invoiced sales net 2
� Net credit memo
� Net incoming orders 1
� Net incoming orders 2
� Net invoiced sales 1
� Net invoiced sales 2
� Net returns 1
� Net returns 2
� Open order quantity
� Open orders
� Quantity of incoming orders
� Returns
� Returns (cost)
� Returns (freight)
� Returns items
� Returns quantity

SAP AG Components of the Logistics Information System (LIS)
Sales Organization
April 2001 137
Sales Organization The sales organization analysis is based on data that are updated in information structure S003.
Characteristics� Sales organization
� Distribution channel
� Division
� Sales district
� Sold-to party
� Material
Key Figures� Billing document (freight)
� Billing document PrSub 5
� Billing document PrSub 6
� Billing document quantity
� Credit memo quantity
� Credit memos
� Credit memos (cost)
� Credit memos (freight)
� Credit memos PrSub 5
� Credit memos PrSub 6
� Gross credit memos
� Gross incoming orders
� Gross invoiced sales
� Gross returns
� Incoming order items
� Incoming order quantity
� Incoming orders
� Incoming orders (freight)
� Incoming orders cost
� Incoming orders PrSub 5
� Incoming orders PrSub 6
� Invoice receipt PrSub 5

Components of the Logistics Information System (LIS) SAP AG
Sales Organization
138 April 2001
� Invoice receipt PrSub 6
� Invoiced sales
� Invoiced sales (cost)
� Net credit memos 1
� Net credit memos 2
� Net incoming orders 1
� Net incoming orders 2
� Net invoiced sales 1
� Net invoiced sales 2
� Net returns 1
� Net returns 2
� Returns
� Returns (cost)
� Returns (freight)
� Returns items
� Returns quantity

SAP AG Components of the Logistics Information System (LIS)
Shipping Point
April 2001 139
Shipping PointThe standard analysis shipping point is based on data that are updated in information structureS005.
Characteristics� Shipping point
� Route
� Carrier
� Destination country
Key Figures� Delivery volume
� Delivery work load
� Gross weight delivery
� Gross weight returns delivery
� Net weight delivery
� Net weight returns delivery
� Returns delivery work load
� Unit of weight
� Volume returns delivery

Components of the Logistics Information System (LIS) SAP AG
Sales Employee
140 April 2001
Sales EmployeeThe standard analysis sales employee is based on data that are updated in the informationstructure S006.
Characteristics� Sales organization
� Distribution channel
� Division
� Sales employee
� Sold-to party
� Material
Key Figures� Billing document (freight)
� Billing document PrSub 5
� Billing document PrSub 6
� Billing document quantity
� Credit memo net 1
� Credit memo net 2
� Credit memo quantity
� Credit memos
� Credit memos (cost)
� Credit memos (freight)
� Credit memos PrSub 5
� Credit memos PrSub 6
� Gross credit memos
� Gross incoming orders
� Gross invoiced sales
� Gross returns
� Incoming order items
� Incoming order quantity
� Incoming orders
� Incoming orders (freight)
� Incoming orders cost

SAP AG Components of the Logistics Information System (LIS)
Sales Employee
April 2001 141
� Incoming orders PrSub 5
� Incoming orders PrSub 6
� Invoice receipt PrSub 5
� Invoice receipt PrSub 6
� Invoiced sales
� Invoiced sales (cost)
� Net incoming orders 1
� Net incoming orders 2
� Net invoiced sales 1
� Net invoiced sales 2
� Net returns 1
� Net returns 2
� Returns
� Returns (cost)
� Returns (freight)
� Returns items
� Returns quantity

Components of the Logistics Information System (LIS) SAP AG
Sales Office
142 April 2001
Sales OfficeThe standard analysis sales office is based on data that are updated in the information structureS002.
Characteristics� Sales organization
� Sales group
� Sales office
� Distribution channel
� Division
Key Figures� Billing document PrSub 5
� Billing document PrSub 6
� Credit memos
� Credit memos (cost)
� Credit memos (freight)
� Credit memos PrSub 5
� Credit memos PrSub 6
� Gross credit memos
� Gross incoming orders
� Gross invoiced sales
� Gross returns
� Incoming orders
� Incoming orders (freight)
� Incoming orders cost
� Incoming orders PrSub 5
� Incoming orders PrSub 6
� Invoice receipt PrSub 5
� Invoice receipt PrSub 6
� Invoiced sales
� Invoiced sales (cost)
� Net credit memos 1
� Net credit memos 2
SAP AG Components of the Logistics Information System (LIS)
Sales Office
April 2001 143
� Net incoming orders 1
� Net incoming orders 2
� Net invoiced sales 1
� Net invoiced sales 2
� Net returns 1
� Net returns 2
� Open orders
� Orders
� Returns
� Returns (cost)
� Returns (freight)
� Returns quantity
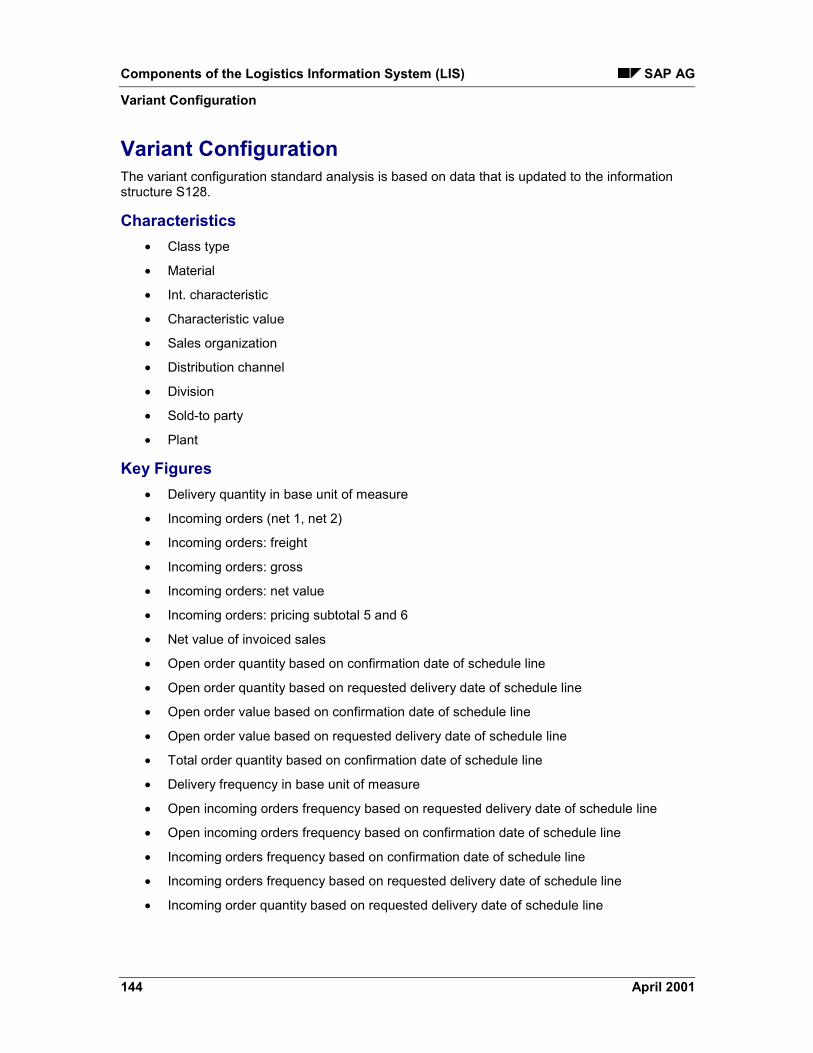
Components of the Logistics Information System (LIS) SAP AG
Variant Configuration
144 April 2001
Variant ConfigurationThe variant configuration standard analysis is based on data that is updated to the informationstructure S128.
Characteristics� Class type
� Material
� Int. characteristic
� Characteristic value
� Sales organization
� Distribution channel
� Division
� Sold-to party
� Plant
Key Figures� Delivery quantity in base unit of measure
� Incoming orders (net 1, net 2)
� Incoming orders: freight
� Incoming orders: gross
� Incoming orders: net value
� Incoming orders: pricing subtotal 5 and 6
� Net value of invoiced sales
� Open order quantity based on confirmation date of schedule line
� Open order quantity based on requested delivery date of schedule line
� Open order value based on confirmation date of schedule line
� Open order value based on requested delivery date of schedule line
� Total order quantity based on confirmation date of schedule line
� Delivery frequency in base unit of measure
� Open incoming orders frequency based on requested delivery date of schedule line
� Open incoming orders frequency based on confirmation date of schedule line
� Incoming orders frequency based on confirmation date of schedule line
� Incoming orders frequency based on requested delivery date of schedule line
� Incoming order quantity based on requested delivery date of schedule line

SAP AG Components of the Logistics Information System (LIS)
Variant Configuration
April 2001 145
Components of the Logistics Information System (LIS) SAP AG
How the Key Figures are Calculated: Sales Information System
146 April 2001
How the Key Figures are Calculated: Sales InformationSystemYou will find out how to calculate and update the key figures in the Sales Information System inthe following topics. In some cases, the key figures could be grouped together.
� Key Figures for Incoming Orders and Returns [Page 147]
� Key Figures for Invoiced Sales and Credit Memos [Page 148]
� Key Figures for Gross/Net1/Net2/Freight/PrSub5/PrSub6 [Page 149]
� Cost [Page 150]
� Open Sales Order Value/Open Sales Order Quantity [Page 151]
� Deliveries on Hand [Page 152]
� Key Figures for Variant Configuration [Page 153]
SAP AG Components of the Logistics Information System (LIS)
Key Figures for Incoming Orders and Returns
April 2001 147
Key Figures for Incoming Orders and ReturnsIn customer order processing a difference is made between "normal" orders and returns.
From a business standpoint, the returns reduce the incoming order figures, which have been setup by the "normal" orders.
In the Sales Information System, the values/quantities that are caused by the returns, areseparately identified. As a result, the incoming order figures are not reduced by the returns. Theinformation for the returns are cumulated in special fields and are shown as a key figure. In thisway, there is always a group of key figures for the returns in addition to the group of key figuresfor incoming order information. The net value and the quantity are updated for both groups of keyfigures from the Order item.
UpdatingIn order to separate both of the key figure groups the updating process is controlled via variousupdate groups. Update group 000001 is assigned to the key figure group for incoming orderinformation and update group 000002 to the group of returns key figures.
Assigning the business transactions to a certain update of statistics data takes place in twosteps.In the first step, you compile certain characteristics of the business transactions such ascustomer, material, document type into statistics groups. In the second step, you assign thestatistics groups to the various update groups.
In the special case incoming order/returns, all of the returns order types are assigned to statisticsgroup 02 and all other order types to statistics group 01. These different statistics groups areassigned to different update groups and thus key figure groups.
You can assign an update group to certain business transactions using the Customizing functionin Sales.

Components of the Logistics Information System (LIS) SAP AG
Key Figures for Invoiced Sales and Credit Memos
148 April 2001
Key Figures for Invoiced Sales and Credit MemosThe two types of key figure groups used in the Sales Information System are invoice values andcredit memo values. These key figure groups are differentiated by the different update groups(000001/000002).Assigning certain types of invoices to the update group 000001 and types of credit memos toupdate group 000002 is done automatically by the types of orders belonging to them.

SAP AG Components of the Logistics Information System (LIS)
Key Figures for Gross/Net1/Net2/Freight/PrSub5/PrSub6
April 2001 149
Key Figures for Gross/Net1/Net2/Freight/PrSub5/PrSub6In addition to the net values for the key figure groups on incoming orders, returns, invoiced salesand credit memos, other information is also available as key figures.
These values are determined from the pricing procedure for the pricing function. It sets theconditions that are allowed per document and defines their sequence in the document.With the definition of the pricing procedure, up to six different subtotals can be assigned, whosecontents are saved in the document, which therefore makes the statistics update also available.All six subtotals are available in the information structures as key figures and can therefore beupdated from the documents.
The following four subtotals are permanently assigned in the SAP standard version of the pricingprocedure:
� Subtotal 1 - Gross
� Subtotal 2 - Net 1
� Subtotal 3 - Net 2
� Subtotal 4 - Freight
The subtotals 5 and 6 can be used individually by the customer.
If you have assigned new steps to the intermediate steps in the pricing procedure,the averaging of the subtotals, which were used in the standard, can change. In thiscase, the original texts and the documentation of the subtotals have also lost theirvalidity. Texts and documentation of the subtotals must as a result be adapted. Thesame applies if you want to use the subtotal 5 and 6, which have not been assignedin the standard.In order to change the texts and documentation for the subtotals, maintain thefollowing data elements in the Data Dictionary according to the new averaging:
- Incoming orders - MC_AEKZWI1..6
- Returns - MC_REKZWI1..6
- Invoiced sales - MC_UMKZWI1..6
- Credit memos - MC_GUKZWI1..6
Components of the Logistics Information System (LIS) SAP AG
Cost
150 April 2001
CostIn addition to the subtotals 1-6 of the pricing procedure that were described in the above section,there is an additional subtotal B. The subtotal B includes the cost of one unit of the material,which was determined in the material master as a standard or moving average price. Valuatingthe cost of one unit of a particular order/invoice quantity gives it the value.
The cost can be taken into account when calculating a profit margin (DB I), in that it is subtractedfrom the invoiced sales (profit margin = invoiced sales - value).
SAP AG Components of the Logistics Information System (LIS)
Open Sales Order Value/Open Sales Order Quantity
April 2001 151
Open Sales Order Value/Open Sales Order QuantityThe open sales order value is the value for which customer orders were recorded, but no deliverywas yet made. Similarly, the quantity is the order quantity for which orders have been recorded,but again no delivery was yet made.
Updating the key figures for the open sales order value and open sales order quantity isinfluenced by two events:
- The open sales order value, i.e., the open sales order quantity increases when customerorders are recorded.
- The open sales order value, i.e., the open sales order quantity is reduced whendeliveries are recorded which refer to the customer orders.
In an ideal case, the open sales order value, i.e., the open sales order quantity is alwayscompletely reduced through deliveries.
There are always two different update rules in the update definition for the open sales ordervalues/open sales order quantity. An update rule describes the set up of the open sales ordervalue, i.e., the open sales order quantity. The second update rule describes the reduction of opensales order value, i.e., the open sales order quantity by the corresponding deliveries.

Components of the Logistics Information System (LIS) SAP AG
Deliveries on Hand
152 April 2001
Deliveries on HandThe key figure deliveries on hand describes the setup time that is involved in the recordeddelivery items for processing. The deliveries on hand is a result of adding the setup processingtimes of a particular material.
You can maintain the setup and processing times in the material master under the sales/plantdata view.
SAP AG Components of the Logistics Information System (LIS)
Key Figures for Variant Configuration
April 2001 153
Key Figures for Variant ConfigurationIn the standard system, the key figures for the variant configuration analysis sometimes have adifferent setup to those with the same names in the other standard analyses. The reason for thisis due to a different view of the data. In variant configuration, the key figures for incoming orders,for instance, are to be viewed from the perspective of delivery.
Incoming Orders� Values (gross, net, pricing subtotals)
In variant configuration, updating of the total order value takes place on the delivery daterequested by the customer from the schedule line.
Due to the fact that values are only available at item level, and not at schedule linelevel, formulas are used to distribute the item values across the schedule lines.
� Quantity
The total order quantity is determined in two different ways and appears as two different keyfigures:
– Updating based on the delivery date requested by the customer from the scheduleline
– Updating based on the confirmation date from the schedule line
Open OrdersThe quantity and value of the open orders are determined in two different ways and appear astwo different key figures.Updating takes place first on the confirmation date of the schedule line and second on therequested delivery date of the schedule line.
Delivery QuantityUpdating of the delivery quantity takes place on the date of goods issue and only when a goodsissue has been posted.
Key figures that represent values and quantities are only available at material level.They are therefore expressed in terms of totals. The contents of these key figurescorrespond to the information that is also available in the sales and distributiondocuments.
Selection FrequenciesIn the Copy Management method where characteristics and characteristic values from theconfiguration are added to the data, quantity/value correlation is not available. For this reason, itis not possible to supply quantity or value key figures with data at individual record level. Theinformation on quantities can, however, be copied from the totals record to the individual record

Components of the Logistics Information System (LIS) SAP AG
Key Figures for Variant Configuration
154 April 2001
and can there be interpreted as a frequency. These frequencies are expressed in separate keyfigures and should only be displayed as individual information.

SAP AG Components of the Logistics Information System (LIS)
Shop Floor Information System
April 2001 155
Shop Floor Information SystemInformation Structures [Page 156]
Updating [Page 158]
Standard Analyses [Page 165]
Gantt Diagram [Page 167]
Input/Output Diagram [Page 168]
Characteristics and Key Figures [Page 170]
How the Key Figures Are Calculated [Page 185]
Components of the Logistics Information System (LIS) SAP AG
Shop Floor Information System: Information Structures
156 April 2001
Shop Floor Information System: Information StructuresIn the standard system, the following information structures are available in the Shop FloorInformation System:
Information Structures for Production and Process OrdersThe information structures S021 through S024 are only updated when production and processorders take place.
� S021 Production OrderThis information structure contains the item data from the production order for material. Itforms the data basis for the standard analysis of production order.
� S022 OperationThe operation data from the production order for work center is updated to thisinformation structure. This information structure provides the data basis for the standardanalysis of operation.
� S023 MaterialThe information structure S023 contains the totals records for material and forms thedata basis for the standard analysis of material.
� S024 Work CenterThis information structure contains the totals records for work center and provides thedata basis for the standard analysis of work center.
Information Structures for Run Schedule HeadersUpdating of the information structures S025 and S028 is only triggered by repetitivemanufacturing.
� S025 Run Schedule HeaderThe key figures for run schedule header are updated to this information structure. Thisinformation structure also provides goods receipt statistics in repetitive manufacturing.The system updates all goods receipts to this information structure. It is also possible toupdate planned quantities to this info structure.
S025 forms the data basis for the standard analysis of run schedule header.
� S028 Reporting Point StatisticsThe key figures for reporting point statistics from the run schedule header are updated tothis information structure. This provides the data basis for the standard analysis ofreporting point statistics.
Information Structures for All OrdersUpdating of the information structures S026 and S027 is triggered by production and processorders and by run schedule headers.
� S026 Material Usage

SAP AG Components of the Logistics Information System (LIS)
Shop Floor Information System: Information Structures
April 2001 157
This information structure includes key figures for material usage and provides the databasis for the standard analysis of material usage. You can use the information structureto gain an overview of the components used.
� S027 Product CostsThis Information structure forms the basis for the standard analysis of product costs. Inthe case of production and process orders, the system updates both planned and actualcosts for the product costs. The planned costs are updated at exactly the same time asthe release of the order; the actual costs are updated when completion confirmations andgoods issues take place.
Information Structure for Kanban� S029 Kanban
Important key figures from the Kanban system are updated to this information structure.This structure forms the data basis for the Kanban standard analysis.

Components of the Logistics Information System (LIS) SAP AG
Updating: Shop Floor Information System
158 April 2001
Updating: Shop Floor Information SystemData analysis in the Shop Floor Information System is based on statistical data that is updated tothe information structures from shop floor control.
The following sections tell you how and when data updating takes place.
Events: Shop Floor Information System [Page 159]
Views: Shop Floor Information System [Page 160]
Conditions: Shop Floor Information System [Page 161]
Updating for Repetitive Manufacturing Analysis: Shop Floor Information System [Page 162]
Updating Quantities and Currencies: Shop Floor Information System [Page 163]
Type of Updating [Page 21]
Period Units in Updating: Shop Floor Information System [Page 164]
Updating Check [Page 24]

SAP AG Components of the Logistics Information System (LIS)
Events: Shop Floor Information System
April 2001 159
Events: Shop Floor Information SystemThe following table shows which events from the operative application trigger the update of whichinformation structures.
Events and their Update
Event Update
Production order (Create, Change, Release) S022 (Operation), S021 (Production order)
Confirm operation:
- Partial confirmation
- Final confirmation
S022 (Operation), S024 (Work center),S027 (Product costs)
S022 (Operation), S024 (Work center),S027 (Product costs)
Confirm production order:
- Partial confirmation (for first confirmedoperation)
- Final confirmation (for last operation finalconfirmation)
S021 (Production order)
S021 (Production order), S021 (Material),S026 (Material usage), S027 (Productcosts)
Goods receipt posting for order:
- Partial delivery
- Final delivery
S021 (Production order), S027 (Productcosts)
S021 (Production order) S023 (Material),S026 (Material usage), S027 (Productcosts)
Goods issue S026 (Material usage), S027 (Productcosts)
Run schedule header S025 (Run schedule header),S026 (Material usage), S027 (Productcosts)
Recording point notification S028 (Recording point statistics)
Kanban S029 (Kanban)

Components of the Logistics Information System (LIS) SAP AG
Views: Shop Floor Information System
160 April 2001
Views: Shop Floor Information SystemThe system needs to take two views of the production order during the calculation of the keyfigures. This means that a key figure can have two different values, depending on the view.
A distinction is made between the following two views:
� Order view or material-specific view
The whole order is used to calculate the key figures. The data is taken from header anditem level of the production order (see the diagram below).
The key figures are calculated from this view in Order analysis and Material analysis.
� Work center view
The key figures are calculated from the operation data (see the figure below).
The key figures are calculated from this view in Operation analysis and Work centeranalysis.
The following illustration shows the views on the production order in the Shop Floor Information.
10 20 30
10
10 20 30 40
20 30
50
40
60
Work center view- Schedule deviation: input- Schedule deviation: output- Lead time- Execution time- Queue time- Quantity- Scrap
Order view- Schedule deviation- Lead time- Execution time- Queue time- Quantity- Scrap
Key Figures Views

SAP AG Components of the Logistics Information System (LIS)
Conditions: Shop Floor Information System
April 2001 161
Conditions: Shop Floor Information SystemDepending on the order type, you can determine whether data should be updated. You canmaintain this setting in Customizing. (under: Updating control � Settings: Production �Activate update and release version for each order).

Components of the Logistics Information System (LIS) SAP AG
Updating for Repetitive Manufacturing Analysis: Shop Floor Information System
162 April 2001
Updating for Repetitive Manufacturing Analysis: ShopFloor Information SystemIn order to ensure that planning data is also evaluated in repetitive manufacturing, you mustinitiate the update of the planned quantity before you carry out the standard analysis. Thisfunction should be scheduled to run at regular intervals as a background job. The time interval inwhich the data is to be updated can be determined in Customizing for repetitive manufacturingunder Global settings.
You can updating of the planned quantities from the Shop Floor Information System menu.Proceed as follows:
1. From the menu of the Shop Floor Information System, select Repetitive manufacturing� Run schedule header � Update planned quantitiesThe selection screen appears.
2. Specify a plant and the production lines, and if necessary, also the planning IDs, to whichplanning quantities are to be updated, and press EXECUTE.
The system will update the planning quantities in the background.

SAP AG Components of the Logistics Information System (LIS)
Updating Quantities and Currencies: Shop Floor Information System
April 2001 163
Updating Quantities and Currencies: Shop FloorInformation SystemQuantitiesQuantities are posted in base unit of measure.
The base unit of measure is the unit of measure in which the system manages the materialstocks. It is determined in the material master.
Currency AmountsCurrency amounts are always updated in the local currency. The local currency is assigned tothe company code. You can set this allocation in Customizing under Organization.
Components of the Logistics Information System (LIS) SAP AG
Period Units in Updating: Shop Floor Information System
164 April 2001
Period Units in Updating: Shop Floor InformationSystemIn addition to the type of update, you can also define the period unit to be used in the updatingprocess.
The period unit specifies the intervals at which the statistical data is cumulated. You can choosefrom the following:
� Day
� Week
� Month
� Posting period (you may also need to specify a fiscal year variant)
You can define a period unit for every standard information structure. Only in informationstructures S021 and S022 is the period unchangeable and fixed to ‘day’.
The standard SAP time period setting in the Shop Floor Information System is ‘day’ forinformation structures S021, S022, S025, S026, S027, S028 and S029, and ‘month’ forinformation structures S023 and S024.
The prerequisite for changing the period unit is that no actual data has been updatedin the information structure.
You make settings for the period unit for the standard information structures inCustomizing for the Logistics Information System.
SAP AG Components of the Logistics Information System (LIS)
Standard Analyses: Shop Floor Information System
April 2001 165
Standard Analyses: Shop Floor Information SystemIn the standard system, the following standard analyses are available in the Shop FloorInformation System:
Work CenterYou can use the work center standard analysis to evaluate data from the area of work centers.The information structure S024 provides the data basis.
OperationIn the standard analysis ‘operation’ you can evaluate the data from the operation. The data basisis provided by data updated to information structure S022.
MaterialThe material standard analysis allows you to evaluate the data for material. The data basis isformed by data that is updated to information structure S023.
Production OrderIn this analysis you can evaluate the data for production orders. The data basis is the dataupdated to information structure S021.
Material UsageIn the material usage analysis, you can analyze data from the production orders, run scheduleheaders and process orders. You can use the material usage analysis to answer the followingquestions: What components were used for a material in total? Which individual componentswere affected by the material usage? What was the original requirements quantity and what wasactually taken? The basis of this analysis is provided by data that is updated to informationstructure S026.
Run Schedule HeaderThe run schedule header analysis enables you to evaluate the key figures from the run scheduleheader. The data basis for this analysis is provided by the information structure S025.
Product CostsData from production orders, run schedule headers and process orders can be evaluated in theproduct cost analysis. Both planned and actual costs for production and process orders areupdated to product costs. The planned costs are updated at the exact time of release, the actualcosts are updated at the point of completion confirmations and goods issues. The data basis ofthis analysis is provided by data that is updated to information structure S027.
Reporting Point StatisticsThe standard analysis ‘reporting point statistics’ is used to evaluate the data from repetitiveplanning. Here, the number of units for so-called reporting points (comparable with events in theproduction order) are determined and updated. The data basis of the analysis is provided by theconfirmed quantities and the confirmed scrap for the reporting point, which are updated ininformation structure S028.

Components of the Logistics Information System (LIS) SAP AG
Standard Analyses: Shop Floor Information System
166 April 2001
KanbanThe Kanban standard analysis is based on the data from the Kanban component, that is updatedto the information structure S029.
Kanban is a procedure for production control whereby the material flow control is event-driven.The advantages of Kanban is that processes are simple and production-specific. The goal ofKanban is that the production itself controls the production process and that accountingexpenses are kept to a minimum. Self regulation demands a reduction in lead time and thereduction of stocks.
Further information on Kanban can be found in the documentation on how to use Kanban.
Exception AnalysisIn the exception analysis, you can display Exceptions [Ext.], which you have defined using theEarly Warning System [Ext.]. The exception analysis acts as a filter, that is, only the exceptionalsituations are displayed. The exceptional situations can be highlighted in color.
See also:Characteristics and Key Figures: Shop Floor Information System [Page 170]
SAP AG Components of the Logistics Information System (LIS)
Shop Floor Information System: Gantt Diagram
April 2001 167
Shop Floor Information System: Gantt DiagramYou can also use a Gantt diagram to evaluate the results of your operation analysis andproduction order analysis.
The Gantt diagram shows you the production orders for a selected characteristic value andgraphically compares the target and the actual lead times on the time axis.
In the work center view, you can illustrate the production orders according to target and actualdates, earliest and latest dates and schedule deviations. The Gantt diagram can only be used inanalyses of the information structures S021 and S022.
To call up a Gantt diagram, proceed as follows:
1. Position the cursor on one of the characteristic values in the list.
2. Select Edit � Gantt diagram.
In the case of production orders that have not yet been confirmed, the bars for thetarget and the actual lead times are identical and are displayed in the same color.

Components of the Logistics Information System (LIS) SAP AG
Shop Floor Information System: Input/Output Diagram
168 April 2001
Shop Floor Information System: Input/Output DiagramIn addition to the Gantt diagram, you also can use an input/output diagram in the operationanalysis and a production order analysis. The input/output diagram is only possible for thevery detailed information structures S021 and S022.
You can use the input/output diagram to gain a quick overview of the production process of aparticular work center.
In the input/output diagram, the actual input curve and the actual output curve are compared withthe target input curve and the target output curve. The input and output curves consist of acumulation of the capacity requirements of incoming and outgoing production orders and areshown on the time axis.
The input/output diagram gives you a clear view of the supply and delivery process of a workcenter for production. If the difference between input and output is very large, this points toineffective control of the work center. The closer the logistical frequencies are to each other, themore effective the order flow.
For a more detailed analysis, you can drill down on the input/output diagram according tocapacity.
You can also branch from the input/output diagram to the Gantt diagram. The Gantt diagramshows the production orders for the selected work center and compares the target and actualflow times on the time axis.
You can only call up the input/output diagram if you have already selected a workcenter, i.e. this graphic can only be called up for one characteristic value of thecharacteristic ‘work center’.
ProcedureIf you want to call up an input/output diagram, proceed as follows:
1. In an initial or drilldown list, position the cursor on the characteristic value for which youwant to display an input/output diagram.
2. Select Edit ��Input/output diagram.
The input/output diagram appears for the work center on which the selectedcharacteristic value is based.
From the input/output diagram you can:
– Drill down according to the capacity
To do this, select from the menu of the graphic View � Capacity.In order to scroll between the individual capacity types, click on the arrow button inthe toolbar of the graphic.
– Branch into the Gantt diagram
The Gantt diagram appears when you double-click on one of the curves that isshown in the input/output diagram.
SAP AG Components of the Logistics Information System (LIS)
Shop Floor Information System: Input/Output Diagram
April 2001 169
Components of the Logistics Information System (LIS) SAP AG
Characteristics and Key Figures: Shop Floor Information System
170 April 2001
Characteristics and Key Figures: Shop FloorInformation SystemWork Center [Page 171]
Operation [Page 173]
Material [Page 175]
Production Order [Page 177]
Material Usage [Page 179]
Product Costs [Page 180]
Run Schedule Header [Page 181]
Reporting Point Statistics [Page 182]
Kanban [Page 183]
See also:
How the Key Figures are Calculated: Shop Floor Information System [Page 185]

SAP AG Components of the Logistics Information System (LIS)
Work Center
April 2001 171
Work CenterThe data basis for the work center analysis is the data that are updated in the informationstructure S024.
Characteristics� Plant
� Planning group
� Work center
Key Figures� Actual execution time
� Actual execution time
� Actual lead time
� Actual lead time
� Actual queue time
� Actual queue time
� Capacity quotation
� Capacity quotation
� Capacity requirement
� Capacity requirement
� Capacity utilization
� Capacity utilization
� Event quantity
� Lead time deviation
� Lead time deviation
� Lot size delivered
� Lot size delivered
� Number of production orders
� Number of production orders
� Queue time deviation
� Scrap deviation
� Scrap deviation

Components of the Logistics Information System (LIS) SAP AG
Work Center
172 April 2001
SAP AG Components of the Logistics Information System (LIS)
Operation
April 2001 173
OperationThe data basis for the operation analysis is the data that is updated to the information structureS022.
Characteristics� Plant
� Work center
� Material
� Order
� Operation
Key Figures� Actual execution time
� Actual lead time
� Actual queue time
� Capacity quotation
� Capacity requirement
� Capacity utilization
� Confirmed quantity
� Confirmed scrap
� Event quantity
� Lead time deviation
� Lot size delivered
� Move time
� Processing time
� Quantity deviation
� Queue time
� Queue time deviation
� Relative scheduling deviation
� Schedule deviation issue
� Schedule deviation receipt
� Schedule deviation receipt/issue
� Scrap deviation

Components of the Logistics Information System (LIS) SAP AG
Operation
174 April 2001
� Scrap quantity
� Setup time
� Target execution time
� Target lead time
� Target processing time
� Target queue time
� Target setup time
� Target tear down
� Tear down
� Wait time

SAP AG Components of the Logistics Information System (LIS)
Material
April 2001 175
MaterialThe data basis for the material analysis is the data that are updated in the information structureS023.
Characteristics� Plant
� MRP controller
� Material
Key Figures� Actual execution time
� Actual lead time
� Actual queue time
� Actual scrap quantity
� Fixed scrap quantity
� Item quantity
� Item scrap
� Number of production orders
� Planned/actual scrap deviation
� Planned/actual lead time deviation
� Planned/actual quantity deviation
� Planned/actual release date deviation
� Planned/actual start date deviation
� Planned/target delivery date deviation
� Planned/target quantity deviation
� Planned/target release date deviation
� Planned/target scrap deviation
� Planned/target start date deviation
� Planned lead time
� Planned order quantity
� Processing time
� Quantity of goods received
� Queue time deviation

Components of the Logistics Information System (LIS) SAP AG
Material
176 April 2001
� Target/actual delivery date deviation
� Target/actual lead time deviation
� Target/actual quantity deviation
� Target/actual release date deviation
� Target/actual scrap deviation
� Target/actual start date deviation
� Target execution time
� Target queue time
SAP AG Components of the Logistics Information System (LIS)
Production Order
April 2001 177
Production OrderThe data basis for the production order standard analysis is the data that are updated in theinformation structure S021.
Characteristics� Plant
� Material
� Order
Key Figures� Actual execution time
� Actual lead time
� Actual queue time
� Actual scrap quantity
� Capacity requirement
� Fixed scrap quantity
� Item scrap
� Planned lead time
� Planned order quantity
� Planned/actual delivery date deviation
� Planned/actual lead time deviation
� Planned/actual quantity deviation
� Planned/actual release date deviation
� Planned/actual scrap deviation
� Planned/actual start date deviation
� Planned/target delivery date deviation
� Planned/target quantity deviation
� Planned/target release date deviation
� Planned/target scrap deviation
� Planned/target start date deviation
� Quantity item
� Quantity of goods received
� Queue time deviation

Components of the Logistics Information System (LIS) SAP AG
Production Order
178 April 2001
� Target execution time
� Target lead time
� Target queue time
� Target/actual delivery date deviation
� Target/actual lead time deviation
� Target/actual quantity deviation
� Target/actual scrap deviation
� Target/actual start date deviation

SAP AG Components of the Logistics Information System (LIS)
Material Usage
April 2001 179
Material UsageThe data basis for the material usage standard analysis is the data that are updated in theinformation structure S026.
Characteristics� Plant
� Material number
� Components
� Order
Key Figures� Removed quantity
� Removed value
� Requirements quantity

Components of the Logistics Information System (LIS) SAP AG
Product Costs
180 April 2001
Product CostsThe data basis for the standard analysis for product costs is the data that are updated in theinformation structure.
Characteristics� Plant
� Material number
� Components
� Service type
� Order
Key Figures� Fixed planned value in controlling area currency
� Fixed value in controlling area currency
� Total planned value in controlling area currency
� Total value controlling area currency
� Variable planned value in controlling area currency
� Variable value controlling area currency

SAP AG Components of the Logistics Information System (LIS)
Run Schedule Header
April 2001 181
Run Schedule HeaderThe data basis for the standard analysis run schedule header is the data that are updated in theinformation structure S025.
Characteristics� Plant
� MRP controller
� Material
� Production version
� Production line
� Run schedule header
Key Figures� Actual scrap quantity
� Planned quantity
� Planned scrap quantity
� Quantity of goods received

Components of the Logistics Information System (LIS) SAP AG
Reporting Point Statistics
182 April 2001
Reporting Point StatisticsThe data basis for the standard analysis reporting point statistics is the data that are updated ininformation structure S028.
Characteristics� Plant
� MRP controller group
� Material number
� Production version
� Production line
� Run schedule header
� Reporting point
Key Figures� Confirmed quantity
� Confirmed scrap
� Event quantity
� Scrap quantity
SAP AG Components of the Logistics Information System (LIS)
Kanban
April 2001 183
KanbanThe data basis for the standard analysis Kanban is the data that are updated in the informationstructure S029.
Characteristics� Plant
� Supply area
� Storage location
� Material
� Responsible
Key Figures� Average error time
� Average refilling time
� Average replenishment time
� Average transport time
� Average triggering time
� Average wait time
� Number of containers
� Number of errors
� Number of external procurement operations
� Number of in-house production operations
� Number of refilling operations
� Number of replenishment operations
� Number of replenishment operations on the same day
� Number of stock transfer operations
� Number of transports
� Number of triggering operations
� Number of wait operations
� Quantity of each container
� Total actual quantity
� Total error time
� Total refilling times

Components of the Logistics Information System (LIS) SAP AG
Kanban
184 April 2001
� Total replenishment time
� Total target quantity
� Total transport time
� Total wait time

SAP AG Components of the Logistics Information System (LIS)
How the Key Figures are Calculated: Shop Floor Information System
April 2001 185
How the Key Figures are Calculated: Shop FloorInformation SystemThe following section discusses the key figures in the Shop Floor Information System.
Calculating Material-Based Key Figures (S021, S023) [Page 186]
Calculating Work-Center-Based Key Figures (S022, S024) [Page 188]
Key Figures for Repetitive Manufacturing (S025/S028) [Page 191]
Key Figures for Material Usage (S026) [Page 192]
Key Figures for Product Costs (S027) [Page 193]
Key Figures for Kanban (S029) [Page 194]

Components of the Logistics Information System (LIS) SAP AG
Calculating Material-Based Key Figures (S021, S023)
186 April 2001
Calculating Material-Based Key Figures (S021, S023)The following topic describes how the Shop Floor Information System calculates the key figuresused in material-based analyses (production order analysis, material analysis). The key figuresare taken from the information structures S021 (Production order) and S023 (Material).
The majority of the key figures in the Shop Floor Information System are average values.
In a material-based analysis, the objects are classified in a period according to delivery date. If agoods receipt has not been posted or if a final completion confirmation has been entered, thedelivery date is automatically set to '00000000'. It is therefore possible to include these types oforders in the production order analysis.
Lead TimeThe lead time for an order begins with the start date and finishes with the delivery date.
The planned lead time is the difference in factory calendar days between the start and finishdates. The start and delivery dates are included in this time.
The following diagram demonstrates how weekdays are converted into factory calendar days.The planned lead time is calculated as 7 factory calendar days.
Factory calendar days
Weekday Fr5/31
Mo5/27
Tu5/28
We5/29
Th5/30
Th5/23
Fr5/24
Sa5/25
So5/26
Sa6/1
Mo6/3
So6/2
P.LDTM
1 2 3 4 5 6 7
PFPS
A production order analysis (S021) includes orders that do not have a goods receiptposting, but have the status "Completely confirmed". The final confirmation date ofthe last operation is used as the delivery date.
Lead Time DeviationLead time deviation is the average value of the differences between, for example, planned leadtime and actual lead time.
Planned/actual lead time deviation = Planned lead time - Actual lead timeA negative lead time deviation indicates that the actual process took longer than expected, whilea positive lead time deviation indicates that the actual lead time was shorter than the plannedlead time.

SAP AG Components of the Logistics Information System (LIS)
Calculating Material-Based Key Figures (S021, S023)
April 2001 187
Execution TimeThe execution time of an operation is calculated by adding together the setup time, processingtime, and teardown time and then dividing the total by the operating time of the work center. Theexecution time of the production order is calculated by totaling the execution times of alloperations.
Queue TimeThe queue time is the difference between the lead time and the execution time. Any other timesin the lead time that are not classed as execution time are called queue time.
Queue Time DeviationThe queue time deviation is the difference between the target queue time and the actual queuetime.
Queue time deviation = Target queue time - Actual queue time
Schedule DeviationThe schedule deviation analysis compares the dates from basic date planning, lead timescheduling, and goods receipt posting. A comparison is made for release dates, start dates, anddelivery dates.
For example, the planned/actual start date deviation is the average value of the differencesbetween the start dates in the planned orders and the actual start dates.
Quantities and ScrapIn a production order, a distinction is made between quantities and scrap from the planned order,the production order, and the goods receipt posting. A quantity deviation analysis comparesthese quantities. The key figures for quantity deviations, quantities, and scrap are all averagevalues.
In the case of production orders that are created without a planned order, the planned quantity isthe same as the quantity in the production order.
Capacity RequirementsThe key figure "Capacity requirements" is calculated from the total capacity requirements of alloperations for setup, processing, and teardown for capacities that are used as the basis forscheduling.
Components of the Logistics Information System (LIS) SAP AG
Calculating Work-Center-Based Key Figures (S022, S024)
188 April 2001
Calculating Work-Center-Based Key Figures (S022,S024)The following will describe how to calculate the key figures for the work center- based analyses(operation analysis, work center analysis) in the Shop Floor Information System. These keyfigures originate from the information structures (S022 (operation) and S024 (work center). Thekey figures are for the most part arithmetic average values.
With the work center-based analyses, arranging into a period is done according to theconfirmation schedule.
Lead TimeThe lead time of an operation begins with the input date at the work center and ends with theoutput date, that is, the completion confirmation date. The input date is determined from thecompletion confirmation date for the preceding work center minus the minimum wait time for thepreceding operation.
Lead Time DeviationThe lead time deviation is the average value of the differences between the target lead time andthe actual lead time.
Lead time deviation = Target lead time - Actual lead time deviationA negative lead time deviation indicates that the actual process took longer than expected,whereas a positive lead time indicates that the actual lead time was shorter than the target leadtime.
Execution TimeThe execution time is calculated by adding together the setup time, processing time, andteardown time. The result is then divided by the operating time of the work center. This gives theexecution time in days.
Queue TimeQueue time is the difference between the lead time and the execution time. Any other times inthe lead time that are not classed as execution time are called queue time.
Queue Time DeviationQueue time deviation is the difference between the target queue time and the actual queue time.
Queue time deviation = Target queue time - Actual queue timeIn an operation analysis, you can evaluate other scheduled times:
� Queue time
� Setup time
� Processing time
� Teardown time
� Move time

SAP AG Components of the Logistics Information System (LIS)
Calculating Work-Center-Based Key Figures (S022, S024)
April 2001 189
Schedule DeviationAn analysis of the schedule date deviation for output compares the actual finish date and thescheduled finish date.
An analysis of the schedule date deviation for input compares the actual finish date andscheduled finish date of the preceding work center. Input date deviation is calculated from theschedule deviations for orders received at the work center in the period to analyze.
You must also consider whether an order was received in the period under analysis orbeforehand. The key figure “input/output schedule deviation” represents the input scheduledeviation of the orders during the period under analysis.
The difference between input/output schedule deviation and input schedule deviation in a periodis shown in the following illustration. The upper production order in the illustration is in the periodunder consideration with the confirmation schedule, but the input schedule is not. If you want tosee whether a work center has contributed to the acceleration or slow down of the processing ofan order by comparing schedule deviations in output and input, then the exact schedule deviationin output/input must be used even if the input schedule is in the distant past.
Conversely, the schedule deviation in input in the period would then be calculated using thesecond production order in the illustration. This would occur if no confirmation was yet made, asthe question here is about the input schedule. The input schedule is, however, in the notedperiod.
TS TF
TFTS AFAS
AS = Actual Start, TS = Target Start, AF = Actual Finish, TF = Target Finish

Components of the Logistics Information System (LIS) SAP AG
Calculating Work-Center-Based Key Figures (S022, S024)
190 April 2001
Relative Schedule DeviationThe key figure "Relative schedule deviation" determines whether a work center has processed anorder quickly or slowly.
Relative schedule deviation = Deviation from scheduled input date - Schedule deviation"input/output"A negative result indicates that the work center was slow in processing the order.
The schedule deviation from the scheduled input date of an event amounts to 2days, i.e. the target input date (scheduled finish date) was exceeded by 2 days. Theschedule deviation “input/output” amounts to - 1 day, i.e. the target input date of theprevious work center was exceeded by one day.Relative schedule deviation = - 2 - (-1) = - 1
Quantities and ScrapThe Shop Floor Information System also allows you to calculate average values and averagedeviations for quantities and scrap.
Capacity RequirementsThe key figure "Capacity requirements" is calculated by adding together the capacityrequirements for setup, processing, and teardown.
Capacity utilization in % = Capacity requirements--------------------------------- x 100 Available capacity
The schedule deviation for output of a transaction is -2 days, that is, the target output(schedule finish) was exceeded by 2 days. The schedule deviation input for output is-1 day, that is, the target output of the previous work center was exceeded by oneday.relative schedule deviation = -2 - (-1) = -1

SAP AG Components of the Logistics Information System (LIS)
Key Figures for Repetitive Manufacturing (S025/S028)
April 2001 191
Key Figures for Repetitive Manufacturing (S025/S028)Key Figures for Run Schedule HeaderThe following key figures are updated for the run schedule header (information structure S025):
� Quantity of goods receivedThe quantity of goods received is updated when creating the actual data within the scopeof the repetitive manufacturing.
� Actual scrap quantity order item
� Planned quantity, planned scrap quantityBoth of these key figures are updated from the run schedule quantity of repetitivemanufacturing.
Key Figures for Reporting Point StatisticsThe following key figures are updated for the reporting point statistics of the run schedule header(S028):
� Transaction quantity
� Scrap quantity transaction
� Confirmed lot size
� Confirmed scrap

Components of the Logistics Information System (LIS) SAP AG
Key Figures for Material Usage (S026)
192 April 2001
Key Figures for Material Usage (S026)The key figures for S026 (Material usage) can be created for production orders and for repetitivemanufacturing.
When creating/changing a production order material reservations are produced for the materialcomponents from the bill of materials, that is, a requirements quantity is determined.
When creating actual data in repetitive manufacturing, the bill of material parts are updated as arequirement quantity before making a change.
With a goods issue for a production order or creating actual data in repetitive manufacturing, thematerial usage is updated for the components.

SAP AG Components of the Logistics Information System (LIS)
Key Figures for Product Costs (S027)
April 2001 193
Key Figures for Product Costs (S027)When a production order is released, the planning costs for the activity types and material parts(fixed, total, variable costs) are determined. The actual costs are updated with a goods issue andthe confirmation.
In repetitive manufacturing, the standard costs for the activity types and material components(fixed, total, variable costs) are determined by creating a standard cost estimate. When the actualdata are created the standard costs are updated.
Components of the Logistics Information System (LIS) SAP AG
Key Figures for Kanban (S029)
194 April 2001
Key Figures for Kanban (S029)The following section covers information about how to calculated the key figures for KANBAN.The key figures for KANBAN are updated to information structure S029, that is they arecalculated from the key figures that are updated to the information structure S029.
Information on how to use KANBAN is in the document PP -KANBAN.
The key figures for using KANBAN are compiled into the following groups:
� Number of Status Messages in KANBAN [Page 195]
� Time Sequence of the Process [Page 198]
� Master Data [Page 200]
� Quantity Control [Page 201]

SAP AG Components of the Logistics Information System (LIS)
Number of Status Messages in KANBAN
April 2001 195
Number of Status Messages in KANBANThe illustration to Sequence of the Status Changes in KANBAN [Page 197] provides you with anoverview of the status changes and will help you in understanding the key figures for the statusmessages.
Further information about the meaning of the status in KANBAN is in the documentPP - KANBAN in the section “Status changes”.
The following key figures can be evaluated for the number of status messages in the run:
� Number of refilling operationsNumber of status changes whereby the status of a Kanban container was changed fromEMPTY to IN TRANSIT.
� Number of triggering operationsNumber of replenishment operations that were triggered after the status for a containerwas changed from WAIT to EMPTY.
This key figure is only needed if the container status is EMPTY and the trigger toreplenish by using the indicator Independent source, are not linked to one another inthe control cycle.
� Number of transportsNumber of status changes whereby the status of a Kanban container was changed fromIN TRANSIT to FULL.
� Number of replenishment operationsNumber of completed replenishment operations for Kanban containers, that is, thenumber of status changes whereby the status of a Kanban container changes fromEMPTY to FULL, regardless of whether or not a different status was set in the meantime.
� Number of errorsNumber of errors that occur while processing the Kanban container.Example for an error: a particular material was saved for a vendor, who was blocked inthe meantime. Because of this, an order cannot be created and the container is given theERROR status.
� Number of wait operationsNumber of status changes, whereby the status of a Kanban container was changed fromFULL or IN USE to a different status.
The following key figures are only useful when aggregating over more than one control cycle:
� Number of external procurement operationsNumber of external procurement operations that have been triggered.
� Number of in-house production operationsNumber of in-house production operations that have been triggered.
Components of the Logistics Information System (LIS) SAP AG
Number of Status Messages in KANBAN
196 April 2001
� Number of stock transfer operationsNumber of stock transfer operations that have been triggered.

SAP AG Components of the Logistics Information System (LIS)
Sequence of the Status Changes in KANBAN
April 2001 197
Sequence of the Status Changes in KANBANThis illustration gives you an overview of the sequence of the status changes in KANBAN.
New Kanban
Kanban status sequences
Wait
Inprocess
Intransit
In useError
Empty
Full

Components of the Logistics Information System (LIS) SAP AG
Time Sequence of the Process
198 April 2001
Time Sequence of the ProcessThe key figures for the time sequence of the process are determined per control cycle for aKanban container and can therefore be aggregated upwards. The average value can bedetermined for each key figure.
The illustration Sequence of the Status Changes in KANBAN [Page 197] gives you an overviewof the status changes.
Refill timeThe refill time is the time that the Kanban container spends in between the EMPTY and INTRANSIT status, that is, the time needed to refill the container.
The average refill time is calculated by dividing the Total refill times by the Number of refilloperations.
Trigger timeThe trigger time is the time between the WAIT and EMPTY status, that is, the time in which thereplenishment is triggered. The trigger time can only be calculated if the WAIT status is used.
The average trigger time is calculated by dividing the Total trigger times by the Number of triggertimes.
In transit timeThe in transit time is the time that the Kanban container spends in between the IN TRANSIT andFULL status, that is, the time needed for transit.
The in transit time can only be calculated if the IN TRANSIT status is used.
The average in transit time is calculated by dividing the Total in transit times by the Number of intransits.
(Total) Replenishment lead timeThe replenishment lead time is the time spent between the EMPTY and FULL status, that is, thetime needed to replenish the container. The replenishment lead time is calculated by adding thetotal refill and in transit time.
The average wait time is calculated by dividing the Total replenishment lead times by the Numberof replenishment lead operations.
Error timeThe error time is the time that the Kanban container spends in the error status.
The average error time is calculated from the Total error times and the Number of errors.
Wait timeThe wait time is the time that the Kanban container spends with the user, that is the total time thecontainer spends in FULL, then IN USE and finally WAIT or EMPTY.
The average wait time is calculated by dividing the Total wait time by the Number of waitoperations.

SAP AG Components of the Logistics Information System (LIS)
Time Sequence of the Process
April 2001 199
Number of replenishment operations on the same dayThe key figure No. repl. ops. same day is also used for evaluating the time, because in KANBAN,the time is measured on a daily basis, that is, a status change on the same day is not taken intoaccount.
The key figure No. repl. ops. same day supplies the number of replenishment operations thattake place on the same day, on which the container status was set on EMPTY.

Components of the Logistics Information System (LIS) SAP AG
Master Data
200 April 2001
Master DataThe following key figures for master data can be evaluated:
� Number of containersNumber of containers that are determined for the control cycle.
� Quantity per containerMaterial quantity (target quantity) that has been determined for a container.

SAP AG Components of the Logistics Information System (LIS)
Quantity Control
April 2001 201
Quantity ControlThe following key figures can be evaluated for quantity control:
� Total target quantityTotal material quantities that would be created in KANBAN if with every goods receipt thetarget quantity had been posted for a container in the control cycle.
� Total actual quantityTotal quantity of materials that were actually acquired in KANBAN, that is, for which agoods receipt was recorded.

Components of the Logistics Information System (LIS) SAP AG
Plant Maintenance Information System
202 April 2001
Plant Maintenance Information SystemInformation Structures [Page 203]
Updating [Page 204]
Standard Analyses [Page 210]
Characteristics and Key Figures [Page 211]
Additional Analyses: Overview [Page 223]
How the Key Figures Are Calculated [Page 227]

SAP AG Components of the Logistics Information System (LIS)
Plant Maintenance Information System: Information Structures
April 2001 203
Plant Maintenance Information System: InformationStructuresIn the standard system, the following information structures are available in the PlantMaintenance Information System:
� S061 Location and Planning
� S062 Object Class and Manufacturer
� S063 Damage Analysis
� S065 Object Statistics
� S070 Breakdown Statistics
� S115 Cost Evaluation
� S116 Sales Notification Analysis
They each provide the data basis for the respective standard analysis of the same name.
Components of the Logistics Information System (LIS) SAP AG
Updating: Plant Maintenance Information System
204 April 2001
Updating: Plant Maintenance Information SystemData analysis in the Plant Maintenance Information System is based on statistical data that hasbeen updated from Plant Maintenance into the information structures.
You can read about how and when data updating is carried out in the following sections.
Events: Plant Maintenance Information System [Page 205]
Update Group: Plant Maintenance Information System [Page 207]
Updating Currencies: Plant Maintenance Information System [Page 208]
Type of Updating [Page 21]
Period Units in Updating: Plant Maintenance Information System [Page 209]
Updating Check [Page 24]

SAP AG Components of the Logistics Information System (LIS)
Events: Plant Maintenance Information System
April 2001 205
Events: Plant Maintenance Information SystemThe following events are defined in the Plant Maintenance Information System:
� Create/change notification
� Create/change equipment
� Create/change functional location
� Create/change/confirm PM orders
The following table displays which events in the operative application update which informationstructures.
Event Update
Notification: Create, change S061, S062, S063, S065, S070, S116
Equipment: Create, change S065
Functional location: Create, change S065
PM orders: Create, change, confirm S061, S062, S065, S115
The following table displays the date on which the individual key figures are updated.
Key Figure Date
Notification information:Number of notifications createdNumber of notifications completed
Number of processing days
Number of breakdowns recorded
Downtime
Mean Time To Repair (downtime reported/number of breakdowns recorded)
Notification date
Date of completion
Date of completion
Start of malfunction
Start of malfunction
Start of malfunction
Error statistics:Number of damages
Number of causes of damage
Number of activities
Reference date
Reference date
Reference date
Error information:Number of damage codes
Number of causes of damage
Number of activities
Reference date
Reference date
Reference date
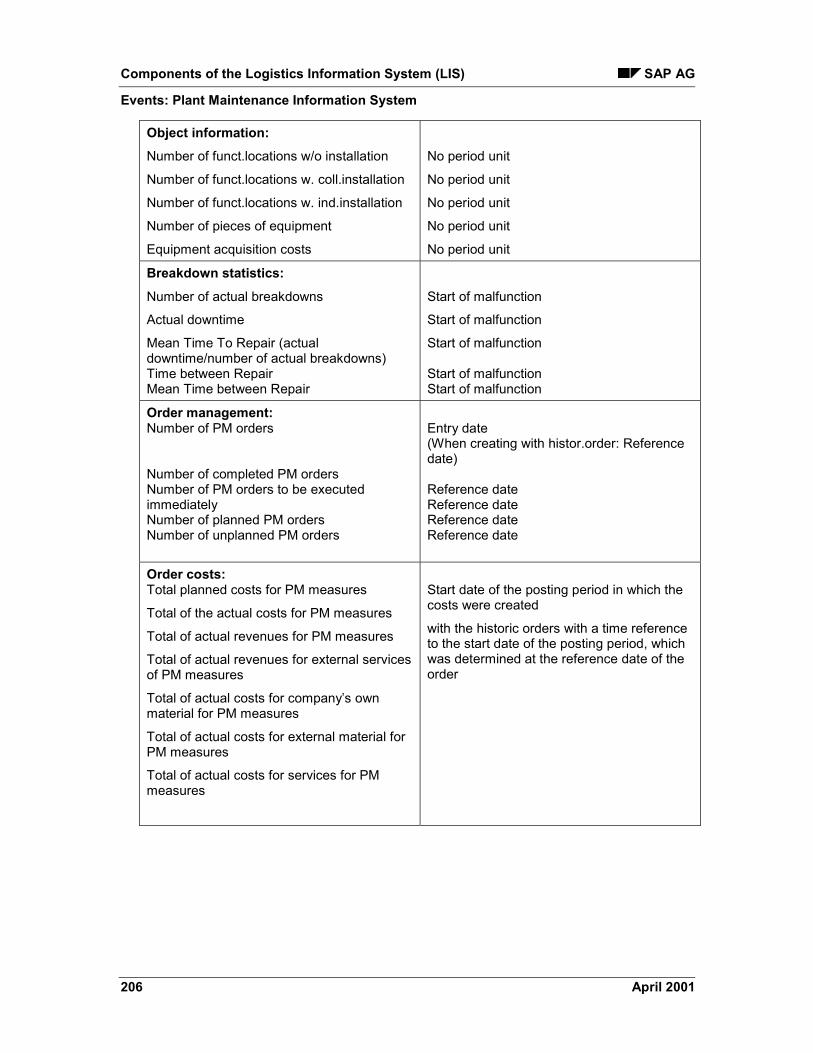
Components of the Logistics Information System (LIS) SAP AG
Events: Plant Maintenance Information System
206 April 2001
Object information:Number of funct.locations w/o installation
Number of funct.locations w. coll.installation
Number of funct.locations w. ind.installation
Number of pieces of equipment
Equipment acquisition costs
No period unit
No period unit
No period unit
No period unit
No period unit
Breakdown statistics:Number of actual breakdowns
Actual downtime
Mean Time To Repair (actualdowntime/number of actual breakdowns)Time between RepairMean Time between Repair
Start of malfunction
Start of malfunction
Start of malfunction
Start of malfunctionStart of malfunction
Order management:Number of PM orders
Number of completed PM ordersNumber of PM orders to be executedimmediatelyNumber of planned PM ordersNumber of unplanned PM orders
Entry date(When creating with histor.order: Referencedate)
Reference dateReference dateReference dateReference date
Order costs:Total planned costs for PM measures
Total of the actual costs for PM measures
Total of actual revenues for PM measures
Total of actual revenues for external servicesof PM measures
Total of actual costs for company’s ownmaterial for PM measures
Total of actual costs for external material forPM measures
Total of actual costs for services for PMmeasures
Start date of the posting period in which thecosts were created
with the historic orders with a time referenceto the start date of the posting period, whichwas determined at the reference date of theorder
SAP AG Components of the Logistics Information System (LIS)
Update Group: Plant Maintenance Information System
April 2001 207
Update Group: Plant Maintenance Information SystemThe update group determines the rules for updating the statistical data.
The update group 000026 is used for the Plant Maintenance Information System.
An update group can be defined for each type of notification in Customizing. If no update grouphas been defined for a type of notification, the notification will not be updated.

Components of the Logistics Information System (LIS) SAP AG
Updating Currencies: Plant Maintenance Information System
208 April 2001
Updating Currencies: Plant Maintenance InformationSystemYou can define a statistics currency for the Plant Maintenance Information System inCustomizing. When you have decided on the statistics currency, the currencies in the documentwill be converted and updated to the statistics currency. The statistics currency is defined inCustomizing for Plant Maintenance.

SAP AG Components of the Logistics Information System (LIS)
Period Units in Updating: Plant Maintenance Information System
April 2001 209
Period Units in Updating: Plant Maintenance InformationSystemIn addition to the type of update, you can also define the period units for the updating process.
The period unit specifies the intervals at which the statistical data is cumulated. You can choosefrom the following:
� Day
� Week
� Month
� Posting period (you may also need to specify a fiscal year variant)
You can define a period unit for every standard information structure.
The information structures S061, S062, S063 and S070 are updated on a monthly basis in thePlant Maintenance Information System. The information structure S065 (Object statistics) doesnot have a period unit. The period unit of updating for the information structures which containthe cost key figures should not be changed.
The prerequisite for changing the period unit is that no actual data has been updatedto the information structure.
You can set the period unit for the standard information structures in Customizing for theLogistics Information System.
Components of the Logistics Information System (LIS) SAP AG
Standard Analyses: Plant Maintenance Information System
210 April 2001
Standard Analyses: Plant Maintenance InformationSystemIn the standard system, the following standard analyses are available in the Plant MaintenanceInformation System:
� Object class
� Manufacturer
� Location
� Planner group
� Damage analysis
� Object statistics
� Breakdown
� Costs
� Customer notifications
These analyses are based on the information structures with the same name (S061 “Locationand Planning”; S062 “Object class and Manufacturer”; S063 “Damage Analysis”; S065 “ObjectStatistics”, S015 “Costs evaluation”, S070 “Breakdown Statistics” and S116 “Customernotification analysis”).
Exception AnalysisIn the exception analysis, you can display Exceptions [Ext.], which you have defined using theEarly Warning System [Ext.]. The exception analysis acts as a filter, that is, only the exceptionalsituations are displayed. The exceptional situations can be highlighted in color.
See also:Characteristics and Key Figures: Plant Maintenance Information System [Page 211]

SAP AG Components of the Logistics Information System (LIS)
Characteristics and Key Figures: Plant Maintenance Information System
April 2001 211
Characteristics and Key Figures: Plant MaintenanceInformation SystemObject Class and Manufacturer [Page 212]
Location [Page 214]
Planning Group [Page 216]
Damage Analysis [Page 218]
Object Statistics [Page 219]
Breakdown Analysis [Page 220]
Cost Analysis [Page 221]
Customer Notifications [Page 222]
See also:How the Key Figures are Calculated: Plant Maintenance Information System [Page 227]

Components of the Logistics Information System (LIS) SAP AG
Object Class and Manufacturer
212 April 2001
Object Class and ManufacturerThe basis for the standard analyses object class and manufacturer is the data that are updated inthe information structure S062.
Characteristics� Object class
� Material
� Manufacturer
� Year of production
� Assembly group
Key Figures� Activities
� Cause of damage
� Completed notifications
� Completed orders
� Damage
� Entered breakdown duration
� Entered breakdowns
� Entered notifications
� Entered orders
� External material costs
� External material rate
� External personnel rate
� External wages costs
� Immediacy rate
� Immediate orders
� Internal material costs
� Internal material rate
� Internal personnel rate
� Internal wages costs
� Mean Time To Repair
� Other costs
SAP AG Components of the Logistics Information System (LIS)
Object Class and Manufacturer
April 2001 213
� Planned orders
� Planning degree
� Processing days
� Service costs
� Service rate
� Total costs actual
� Total costs planned
� Total revenues actual
� Unplanned orders

Components of the Logistics Information System (LIS) SAP AG
Location
214 April 2001
LocationThe basis for the location is the data that are updated in the information structure S061.
Characteristics� Maintenance plant
� Plant section
� Location
� PM planning plant
� PM planning group
� Functional location
� Equipment
� Assembly group
Key Figures� Activities
� Cause of damage
� Completed notifications
� Completed orders
� Damage
� Entered breakdown duration
� Entered breakdowns
� Entered notifications
� Entered orders
� External material costs
� External material rate
� External personnel rate
� External wages costs
� Immediacy rate
� Immediate orders
� Internal material costs
� Internal material rate
� Internal personnel rate
� Internal wages costs
SAP AG Components of the Logistics Information System (LIS)
Location
April 2001 215
� Mean Time To Repair
� Other costs
� Planned orders
� Planning degree
� Processing days
� Service costs
� Service rate
� Total costs actual
� Total costs planned
� Total revenues actual
� Unplanned orders
Components of the Logistics Information System (LIS) SAP AG
Planning Group
216 April 2001
Planning GroupThe basis for the planning group analysis is the data that are updated in the information structureS061.
Characteristics� PM planning plant
� PM planning group
� Location plant
� Plant section
� Location
� Functional location
� Equipment
� Assembly group
Key Figures� Activities
� Cause of damage
� Completed notifications
� Completed orders
� Damage
� Entered breakdown duration
� Entered breakdowns
� Entered notifications
� Entered orders
� External material costs
� External material rate
� External personnel rate
� External wages costs
� Immediacy rate
� Immediate orders
� Internal material costs
� Internal material rate
� Internal personnel rate

SAP AG Components of the Logistics Information System (LIS)
Planning Group
April 2001 217
� Internal wages costs
� Mean Time To Repair
� Other costs
� Planned orders
� Planning degree
� Processing days
� Service costs
� Service rate
� Total costs actual
� Total costs planned
� Total revenues actual
� Unplanned orders
Components of the Logistics Information System (LIS) SAP AG
Damage Analysis
218 April 2001
Damage AnalysisThe basis for damage analysis is the data that are updated in information structure S063.
Characteristics� Type of notification
� Functional location
� Equipment
� Code group damage
� Damage
� Code group cause of damage
� Code group activity
� Activity
Key Figures� Cause of damage
� Damage
� Activities
SAP AG Components of the Logistics Information System (LIS)
Object Statistics
April 2001 219
Object StatisticsThe basis for the standard analysis object statistics is the data that are updated in the informationstructure S065.
Characteristics� Object class
� Material
� Manufacturer
� Assembly year
Key Figures� Acquisition value
� Number of pieces of equipment
� Number of functional locations
� Number of functional locations with collective installation
� Number of functional locations with separate installation
� Number of functional locations without equipment installation

Components of the Logistics Information System (LIS) SAP AG
Breakdown Analysis
220 April 2001
Breakdown AnalysisThe basis for the breakdown analysis is the data that are updated in the information structureS070.
Characteristics� Object class
� Functional location
� Equipment
Key Figures� Effective breakdowns
� Mean Time between Repair
� Mean Time to Repair
� Time between Repair
� Time to Repair

SAP AG Components of the Logistics Information System (LIS)
Cost Analysis
April 2001 221
Cost AnalysisThe basis for the cost analysis is the data that are updated in the information structure S115.
Characteristics� Object class
� Material
� Manufacturer
� Assembly year
� Assembly group
Key Figures� Completed orders
� External costs for wages
� External material costs
� External material rate
� External personnel rate
� Immediacy rate
� In-house costs for wages
� In-house material costs
� In-house material rate
� In-house personnel rate
� Other costs
� Planned orders
� Planning degree for immediate orders
� Recorded orders
� Service costs
� Service rate
� Total costs actual
� Total revenues actual

Components of the Logistics Information System (LIS) SAP AG
Customer Notifications
222 April 2001
Customer NotificationsData that is updated to information structure S116 forms the basis for the customer notificationanalysis.
Characteristics� Sales organization
� Distribution channel
� Division
� PM planning plant
� Type of notification
� Customer
� Functional location
� Equipment
� Assembly
Key Figures� Activities
� Completed notifications
� Damage
� Days for processing
� Number of cause of damage codes
� Recorded breakdown duration
� Recorded notifications
SAP AG Components of the Logistics Information System (LIS)
Additional Evaluations: Overview
April 2001 223
Additional Evaluations: OverviewYou use the Environment menu in the Plant Maintenance Information System to findmaintenance information such as master data and document information regarding pieces ofequipment/functional locations, as well as information on notifications, orders, and regularmaintenance.
This means that you can branch directly from the PMIS menu into important maintenancetransactions and reports, which for the most part are documented in the other PM guides.
Using the Environment menu, you can also display evaluations for the key figures "Mean TimeTo Repair" and "Mean Time Between Repair" for both equipment and functional locations. Fromhere you can also regenerate the statistics for information structure S070.
This section tells you
� Which guides contain information on the options in the Environment menu
� How to carry out an evaluation on the key figures "Mean Time To Repair" and "MeanTime Between Repair" for pieces of equipment and functional locations, and what furtherdetailed information you can display within the evaluation.
Additional Evaluations: Overview [Page 223]
Additional Documentation for Menu Option Environment [Page 224]
MTTR/MTBR Evaluation [Page 225]

Components of the Logistics Information System (LIS) SAP AG
Additional Documentation for Menu Option Environment
224 April 2001
Additional Documentation for Menu Option EnvironmentThe following topic describes where you can find documentation on the options in theEnvironment menu:
Documentation on Technical ObjectsThe guide PM Structuring Technical Systems contains information on the following menu entries:
Environment ��Technical objects � Equipment � Display/Equipment list/Structural display
and
Environment ��Technical objects � Functional location � Display/Funct.location list/Structuraldisplay
The guide PM Object Networks contains information on the following menu entries:
Environment � Technical objects � Equipment � Object link
and
Environment � Technical objects � Functional location � Object link.
Documentation on Maintenance TasksThe guide PM Maintenance Notifications contains information on the following menu entries:
Environment � Maintenance tasks � PM notification � Display/PM notification list
– The guide PM Maintenance Orders contains information on the following menu entries:
Environment � Maintenance tasks � PM order � Display/PM order list/Compl. confirmation
Documentation on Planned MaintenanceThe guide PM Maintenance Plans contains information on all the menu entries contained inEnvironment � Planned maintenance.

SAP AG Components of the Logistics Information System (LIS)
MTTR/MTBR Evaluation
April 2001 225
MTTR/MTBR EvaluationUsing the Environment menu, you can carry out an evaluation for pieces of equipment andfunctional locations regarding the key figures "Mean Time to Repair" and "Mean Time betweenRepair". This is useful if, for example, statistical updating of information structure S070, whichcontains these key figures, has been switched off for performance reasons. You can also updateinformation structure S070 within this evaluation.
The key figure values are read directly from the notification database. In this way it is possible toobtain detailed information on a breakdown for each period, for example, the notification numberor the start/end of the malfunction. In addition, the key figures "number of breakdowns reported'"and "total downtime" are displayed; these cannot be evaluated using the standard breakdownstatistics analysis (information structure S070). In the standard analyses, the "number of actualbreakdowns" is displayed, which is for example not the same as the "number of breakdownsreported" where two breakdowns overlap (see also How the Key Figures are Calculated: PlantMaintenance Information System [Page 227]).
You can also branch to the corresponding notification in a further step within the evaluation.
What To DoIf you want to carry out an evaluation for pieces of equipment or functional locations, proceed asfollows:
1. From the Plant Maintenance Information System, select
Environment � Technical objects � Equipment � MTTR/MTBR Equipment
or
Environment � Technical objects � Functional location � MTTR/MTBR Funct Loc.
A selection screen appears.
2. Enter the required selection criteria and select Program � Execute.
For each technical object entered in the selection screen, you obtain the
- Number of breakdowns
- Length of downtime
- Mean Time To Repair
- Mean Time Between Repair
Furthermore, the sum of the key figure values over the periods is displayed.
Using this list as a starting point, you can perform the following functions:
� Carry out an update of information structure S070.To do this, select the pushbutton Update Info structure.
� Call up further detailed information on a period.
To do this, place the cursor on the desired period of the technical object and selectthe pushbutton Choose.
You obtain a list with the notification number for the breakdown, date and time of themalfunction start/end, and the downtime.

Components of the Logistics Information System (LIS) SAP AG
MTTR/MTBR Evaluation
226 April 2001
The second part of the list comprises a monthly statistic for the following key figures:
- First/last start of malfunction that month
- Number of breakdowns recorded
- Time Between Repair
- Number of actual breakdowns
- Mean Time Between Repair
- Total downtime that month
- Mean Time To Repair that month
Select the Disp.notification pushbutton to branch to the notification.

SAP AG Components of the Logistics Information System (LIS)
How the Key Figures are Calculated: Plant Maintenance Information System
April 2001 227
How the Key Figures are Calculated: Plant MaintenanceInformation SystemThe following topics cover the description of the key figures in the Plant Maintenance InformationSystem.
Key Figures for Notifications [Page 228]
Key Figures for Object Statistics [Page 229]
Key Figures for Error Statistics [Page 230]
Key Figures for Damage Description [Page 231]
Key Figures for Breakdown Statistics [Page 232]
Key Figures for Order Management [Page 235]
Key Figures for Order Costs [Page 236]

Components of the Logistics Information System (LIS) SAP AG
Key Figures for Notifications
228 April 2001
Key Figures for NotificationsThe following key figures exist for notifications:
� Number of maintenance notifications created
� Number of completed maintenance notifications
� Number of processing days (creation to completion)
This group of key figures refers to the maintenance notifications to be processed. A maintenancenotification is the averages by which you can perform the following functions in the PM System:
� Describe the condition of a technical object
� Request the maintenance department to carry out a required task
� Document an activity that has been carried out

SAP AG Components of the Logistics Information System (LIS)
Key Figures for Object Statistics
April 2001 229
Key Figures for Object StatisticsThis group of key figures refers to the technical objects in Plant Maintenance:
� Functional locationsSystem areas, at which a piece of equipment can be installed
� EquipmentPhysical objects which need to be maintained individually
Key Figures for Functional LocationsPieces of equipment can be installed at functional locations on a 1:1 basis (individual installation)or on a 1:n basis (collective installation). This results in the following key figures:
� Total number of functional locations
� Number of functional locations with no equipment installed
� Number of functional locations with a single piece of equipment installed
� Number of functional locations with collective installation
Key Figures for Pieces of EquipmentThe standard PMIS comes with the following key figures:
� Total pieces of equipment
� Acquisition value of the pieces of equipment
On the basis of these key figures you can obtain further information on the maintenance process(with respect to maintenance notifications, maintenance costs incurred, equipment downtimes,and so on).
When you analyze the object statistics, you should remember to set the "Statisticscurrency" conversion in Customizing. You can find further information on this functionin "Updating Statistical Data" under Updating Currencies: Plant MaintenanceInformation System [Page 208].

Components of the Logistics Information System (LIS) SAP AG
Key Figures for Error Statistics
230 April 2001
Key Figures for Error StatisticsA maintenance notification contains items which describe the damage or the activity to beperformed in greater detail. The information listed here forms the basis of the following keyfigures:
� Number of damages
� Number of causes of damage
� Number of activities

SAP AG Components of the Logistics Information System (LIS)
Key Figures for Damage Description
April 2001 231
Key Figures for Damage DescriptionThe various damages, causes, and activities listed in a notification are broken down in this groupof key figures at the level of the individual codes and code groups. This results in the followingkey figures:
� Number of damage codes
� Number of cause of damage codes
� Number of activity codes
The damage description refers to the values of the damage or malfunction in the maintenancenotification, in other words, to the damage, cause of damage, and activity. These values areidentified by particular codes, which in turn are grouped from various views in code groups. Thecodes ensure that one and the same content is always entered in the same format, and can beusefully evaluated.
You can find further information on the damage description in the guide PMMaintenance Notifications.
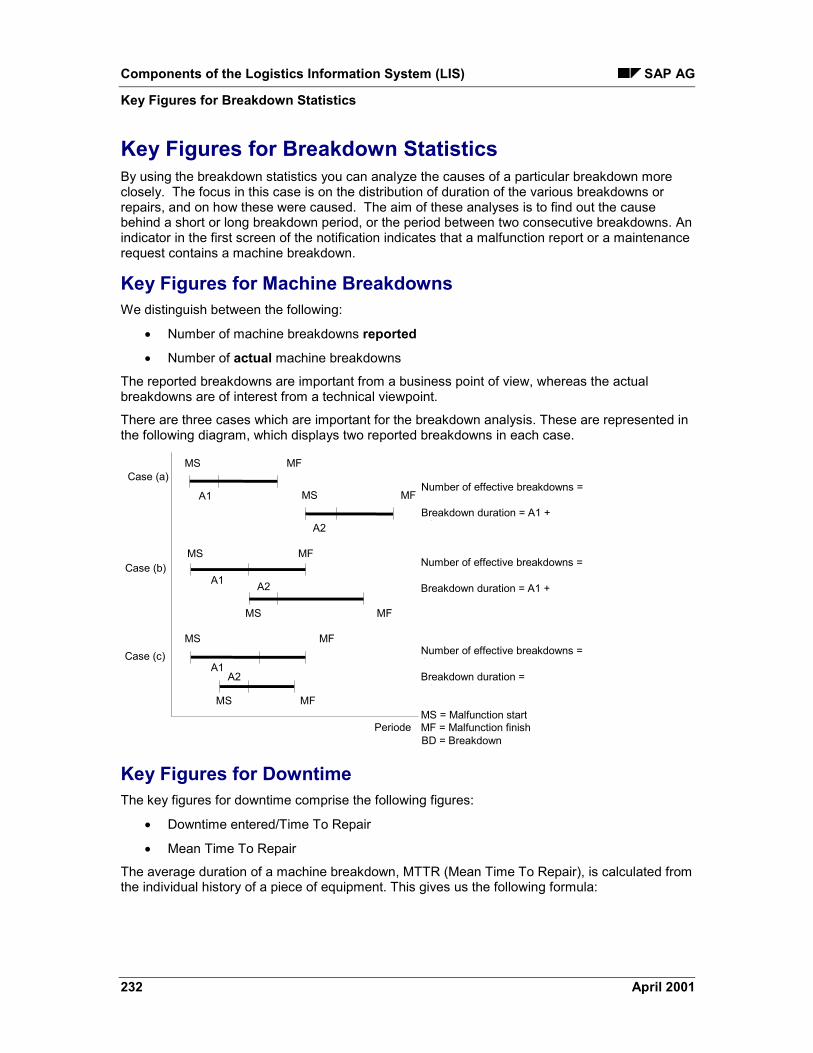
Components of the Logistics Information System (LIS) SAP AG
Key Figures for Breakdown Statistics
232 April 2001
Key Figures for Breakdown StatisticsBy using the breakdown statistics you can analyze the causes of a particular breakdown moreclosely. The focus in this case is on the distribution of duration of the various breakdowns orrepairs, and on how these were caused. The aim of these analyses is to find out the causebehind a short or long breakdown period, or the period between two consecutive breakdowns. Anindicator in the first screen of the notification indicates that a malfunction report or a maintenancerequest contains a machine breakdown.
Key Figures for Machine BreakdownsWe distinguish between the following:
� Number of machine breakdowns reported
� Number of actual machine breakdowns
The reported breakdowns are important from a business point of view, whereas the actualbreakdowns are of interest from a technical viewpoint.
There are three cases which are important for the breakdown analysis. These are represented inthe following diagram, which displays two reported breakdowns in each case.
Case (c)
A1
A2
MS MF
MS MF
MS
A1
MS MF
A2
MS MF
MS MF
A1A2
Number of effective breakdowns =1Breakdown duration = A1 +
2
Number of effective breakdowns =1Breakdown duration =
1
MS = Malfunction startMF = Malfunction finishPeriode
Case (a)
Case (b)
BD = Breakdown
MF
Number of effective breakdowns =2Breakdown duration = A1 +
2
Key Figures for DowntimeThe key figures for downtime comprise the following figures:
� Downtime entered/Time To Repair
� Mean Time To Repair
The average duration of a machine breakdown, MTTR (Mean Time To Repair), is calculated fromthe individual history of a piece of equipment. This gives us the following formula:

SAP AG Components of the Logistics Information System (LIS)
Key Figures for Breakdown Statistics
April 2001 233
MTTR = Duration of the (1+...+n)thb kd / Number ofb kd
The key figure MTTR is calculated in hours.
First breakdown 10 hoursSecond breakdown 05 hoursNumber of breakdowns 02
MTTR = 10 + 5 / 2 = 7.5 hours
To calculate the key figure Mean Time To Repair, in the breakdown analysis(information structure S070) the effective breakdowns and the number of effectivebreakdowns are taken into account. In all other analyses (and the underlyinginformation structures) the noted breakdown duration and the number of notedbreakdowns are taken into account.
Key Figures for Duration Between Machine BreakdownsThe key figures for the duration between machine breakdowns comprise the following ratios:
� Time Between Repair
� Average Time Between Repair
The average duration between two machine breakdowns, MTBR for short (Average Timebetween Repair), is calculated from the individual history of the equipment. This gives thefollowing formula:
MTBR = (Time of the nthb kd - Time of the (n-1)thb kd - Breakdown duration of the (n-1)thb kd ) / Number ofb kd
The key figure MTBR is calculated in hours.
The following example shows how the MTBR is calculated:
Acquisition date of pump A 01/01/94
First breakdown 01/10/94
Downtime 10 hours
Second breakdown 01/20/94
Downtime 5 hours
Number of breakdowns 2

Components of the Logistics Information System (LIS) SAP AG
Key Figures for Breakdown Statistics
234 April 2001
MTBR = (19 * 24 - 10) / 2 or X + Y (St) / 2
= (456 - 10) / 2 or (216 + 240 - 10) / 2
= 223 hours
includepictureC:/TEMP/iwbprint0005/Templat
es/achtung.gif \d \bmc When calculating the key figure MeanTime between Repair, only the start-update can be taken into account if theindicator Start-up was set in the masterdata for equipment or functionallocations. If the indicator was not setthen the end date of the first malfunctionmessage will be taken into account. Inthis case, the first malfunction message
will not be used when calculating the key figure MTBR (refer to the following illustration).
x y
t1 t2 t3
t
MTBR =x + y
2
MTTR = 2t2 t3+
MalfunctionStartFirstNotification
MalfunctionStartSecondNotification
MalfunctionEndFirstNotification
Malfunction EndSecondNotification
Start-up-Datederived from here
01/01 01/10 01/20
10 hrs. 5 hrs.
A1 A2X Y
Period
SAP AG Components of the Logistics Information System (LIS)
Key Figures for Order Management
April 2001 235
Key Figures for Order ManagementKey Figures that are updatedThe following key figures for order management are updated:
� Number of created Plant Maintenance orders (sum of all created PM orders)
� Number of completed PM orders (sum of PM orders that have been completed)
� Number of PM orders that are to be immediately carried out (sum of PM orders that arecharacterized as immediate orders)
� Number of planned PM orders (sum of PM orders that were characterized as planned)
� Number of unplanned PM orders (sum of PM orders that are characterized asunplanned)
The key figure Number of created PM orders is updated when creating a PM order with a timereference to the entry date and when creating a historical order with time reference to thereference date.
The Number of completed PM orders is updated to the reference date when a PM order with timereference has been completed.
The key figures Number of PM orders to be immediately carried out, Number of planned PMorders and Number of unplanned PM orders are updated to the reference date when a PM orderand a historical order with time reference are created and changed.The following should be noted: a PM order can only take on one of the characteristics planned,unplanned or immediately. A suggestion can be stored for each order type in Customizing, sothat orders of this type are characterized as immediate, unplanned or planned. This suggestioncan be changed at any time up during order processing (creating, changing) up to ordercompletion. When a PM order is complete, the planning indicator can no longer be changed.
Key Figures that are determined for the runtimeThe following key figures are determined when the analysis is run:
� PM order urgency rate
The urgency rate shows the ratio of the immediate orders to the total number of PMorders in percent.
Formula: Number of PM orders to be immediately executed---------------------------------------------------------------------- * 100Number of created PM orders
� PM order planning rate
This key figure shows the ratio of the planned orders to the total number of PM orders inpercent.
Formula: Number of planned PM orders------------------------------------------- * 100Number of created PM orders

Components of the Logistics Information System (LIS) SAP AG
Key Figures for Order Costs
236 April 2001
Key Figures for Order CostsKey Figures that are updatedThe following key figures are updated for order costs:
� Sum of planning costs for PM measuresThis key figure will be updated when a PM order with a time reference is created andchanged at the starting date of the posting period, in which the costs were created.
� Sum of the actual costs for PM measuresThis key figure is updated with every cost-relevant transaction for a PM order (forexample, completion confirmation, material withdrawal) for the beginning date of theposting period, in which the costs were created. For historical orders, the key figure isupdated when creating and changing a historical order with a time reference to thestarting date of the posting period which was determined for the reference date of theorder. The key figure update is important for business reasons only when a completionconfirmation is made.
� Sum of the actual revenues of the PM measuresThis key figure is updated with every revenue posting (for example billing document) fora PM order to the starting date of the posting period, in which the costs were created. Forhistorical orders, the key figure is updated when creating and changing a historical orderwith a time reference to the starting date of the posting period which was determined forthe reference date of the order.
� Sum of the actual costs for internal activities of PM measuresThis key figure is updated with every cost-relevant transaction for a PM order (forexample, completion confirmation, material withdrawal) for the beginning date of theposting period, in which the costs were created. For historical orders, the key figure isupdated when creating and changing a historical order with a time reference to thestarting date of the posting period, which was determined for the reference date of theorder.The key figure update is important from a business point of view only when a completionconfirmation is made.
� Sum of the actual costs for external activities of the PM measuresThis key figure is updated with every cost-relevant transaction for a PM order (forexample, completion confirmation, material withdrawal) for the beginning date of theposting period, in which the costs were created. For historical orders, the key figure isupdated when creating and changing a historical order with a time reference to thestarting date of the posting period which was determined for the reference date of theorder.The key figure update is important from a business point of view only when completionconfirmation of an external activity (goods/invoice receipt), which was given based onwage hours, was made.
� Sum of the actual costs for the company’s own material of the PM measuresThis key figure is updated with every cost-relevant transaction for a PM order (forexample, completion confirmation, material withdrawal).For historical orders, the key figure is updated when creating and changing a historicalorder with a time reference to the starting date of the posting period which wasdetermined for the reference date of the order. The key figure update is important from abusiness point of view only when a material removal is made.

SAP AG Components of the Logistics Information System (LIS)
Key Figures for Order Costs
April 2001 237
� Sum of the actual costs for external material of the PM measuresThis key figure is updated with every cost-relevant transaction for a PM order (forexample, completion confirmation, material withdrawal) for the beginning date of theposting period, in which the costs were created.For historical orders, the key figure is updated when creating and changing a historicalorder with a time reference to the starting date of the posting period which wasdetermined for the reference date of the order. The key figure update is important from abusiness point of view only goods/invoice receipt for purchased parts (non-warehousecomponents).
� Sum of the actual costs for services of the PM measuresThis key figure is updated with every cost-relevant transaction for a PM order (forexample, completion confirmation, material withdrawal,...)for a PM order to the beginningdate of the posting period, in which the costs were created.For historical orders, the key figure is updated when creating and changing a historicalorder with a time reference to the starting date of the posting period which wasdetermined for the reference date of the order.The key figure update is important from a business point of view only with completionconfirmation of an external activity (goods/invoice receipt), which was given based ontotal service.
� Sum of other actual costs of the PM measuresThe key figure shows the sum of other actual costs for PM orders, which do not fall underinternal personnel, company’s own material, external personnel, external material orservices.This key figure is updated with every cost-relevant transaction for a PM order (forexample, completion confirmation, material withdrawal) for the beginning date of theposting period, in which the costs were created. The key figure update is important froma business point of view when there are possible surcharges.
For the key figures Sum of the actual costs for internal activities, external activities, thecompany’s own material, external material, actual costs for services and sum of the other actualcosts from PM measures, please note the following:
The allocation of the actual costs from a cost-relevant transaction for a PM order (completionconfirmation, material removal) is carried out in two steps. The costs are fundamentally shown inthe CO under a cost type (for example, -400000- material usage, -615000- internal activities).In the first step, allocation of the cost types to value categories are carried out in Customizing ofthe project system.
Value category Cost type (from-to)
400 Warehouse issue 400000-499999
600 Internal activity 600000-615000
The value categories are allocated to the cost key figures of the PM order in Customizing underPlant Maintenance.
Key Figure Value category

Components of the Logistics Information System (LIS) SAP AG
Key Figures for Order Costs
238 April 2001
Sum of actual costs for internal material 400
Sum of actual costs for internal activities 600
With the setting from the second example, the actual costs from the completion confirmation for aPM order would enter the value category 600 and the key figure Sum of the actual costs forinternal activities are updated. The actual costs from the material removal would be entered intothe value category 400 and the key figure Sum of the actual costs for internal material is updated.With a historical order the costs are manually created on the level of value categories. Even here,the cost key figures that are to be updated are determined via the above-described allocation tothe value categories.
Key Figures Calculate at RuntimeWhen the analysis is run, the following key figures are calculated:
� The in-house personnel cost rate for PM ordersThis key figure shows the ratio of costs for in-house services and the total costs for PMorders in percentage
Formula: Sum of actual costs for in-house services----------------------------------------------------------- * 100Sum of actual costs for PM orders
� External personnel cost rate for PM ordersThis key figure shows the ratio of costs for external services and the total costs for PMorders in percent.
Formula: Sum of actual costs for external services----------------------------------------------------------- * 100Sum of actual costs for PM orders
� In-house material cost rate for PM ordersThe key figure shows the ratio of costs for in-house material and the total costs for PMorders in percent.
Formula: Sum of actual costs for in-house material----------------------------------------------------------- * 100Sum of actual costs for PM orders
� External material cost rate for PM ordersThe key figure shows the ratio of the costs for external material and the total costs forPM orders in percent.
Formula: Sum of actual costs for external material--------------------------------------------------------- * 100Sum of actual costs for PM orders
� Services cost rate for PM ordersThe key figure shows the ratio of costs for services and the total costs for PM orders.
Formula:Sum of actual costs for external personnel + Sum of the actual costs for services-----------------------------------------------------------------------------------------------------------------* 100Sum of actual costs for PM orders

SAP AG Components of the Logistics Information System (LIS)
Quality Management Information System
April 2001 239
Quality Management Information SystemInformation Structures [Page 240]
Updating [Page 242]
Standard Analyses [Page 248]
Characteristics and Key Figures [Page 249]
How the Key Figures Are Calculated [Page 258]

Components of the Logistics Information System (LIS) SAP AG
Quality Management Information System: Information Structures
240 April 2001
Quality Management Information System: InformationStructuresIn the standard system, the following ten information structures are available in the QualityManagement Information System:
Reference to Inspection Lot:
� S068 "Vendor"
This information structure contains the aggregated data from inspection lot and usagedecision for the vendor analysis.
� S069 "Material"
This information structure contains the aggregated data from inspection lot and usagedecision for the material analysis. The information structure S069 is identical in structureto the information structure S068, but does not, however, include the characteristic"Vendor" and the key figure "Quantity returned to vendor".
� S104 “Customer”
This information structure contains the aggregated data from inspection lot and usagedecision for the customer analysis. The information structure S104 is identical instructure to the information structure S068, but does not, however, include the key figure"Quantity returned to vendor". It also contains the characteristic “Customer” instead ofthe characteristic “Vendor”,
� S072 "Inspection Lot Individual Records"
This information structure is available in the standard system, but is for internal use only.
Reference to Quality Notifications:
� S098 “QM Notifications: Vendor Analysis”
This information structure contains the aggregated data from the quality notifications(notification headers and measures) for the vendor analysis.
� S097 “QM Notifications: Material Analysis
This information structure contains the aggregated data from the quality notifications(notification headers and measures) for the material analysis. The information structureS097 is structurally identical to the information structure S098, but does not, however,contain the characteristic "Vendor".
� S099 “QM Notifications: Customer Analysis”
This information structure includes the aggregated data from the quality notifications(notification headers and measures) for the customer analysis. The information structureS099 is structurally identical to the information structure S098, but it contains thecharacteristic “Customer” instead of the characteristic “Vendor”.
Reference to Problems/Errors:
� S102 “Problems/Errors: Vendor Analysis”
This information structure contains the aggregated data from the problem level (i.e., errorlevel) of the quality notifications for the vendor analysis.

SAP AG Components of the Logistics Information System (LIS)
Quality Management Information System: Information Structures
April 2001 241
� S100 “Problems/Errors: Material Analysis”
This information structure Contains the aggregated data from the problem level (i.e.,error level) for the quality notifications for the material analysis. The information structureS100 is structurally identical to the information structure S102, but does not contain thecharacteristic "Vendor".
� S103 “Problems/Errors: Customer Analysis”
This information structure contains the aggregated data from the problem level (i.e., errorlevel) of the quality notifications for the customer analysis. The information structureS103 is structurally identical to the information structure S102, yet contains thecharacteristic “Customer” instead of the characteristic “Vendor”.
Please note that a period unit is assigned to each information structure. You canchoose from day, week and month.
A period unit is allocated during the material-, vendor- and customer analyses:
– When a reference is made to inspection lots after the lot date of origin
– When a reference is made to notifications and problems/errors after thenotification date of origin.
Components of the Logistics Information System (LIS) SAP AG
Updating: Quality Management Information System
242 April 2001
Updating: Quality Management Information SystemThe data basis in the Quality Management Information System is the statistical data that isupdated from the inspection and notification processing in the information structures.
The following sections will tell you how and when the data update occurs.
Time of the Update: Quality Management Information System [Page 243]
Factors That Influence Updating the Information Structures: Quality Management InformationSystem [Page 244]
Updating Quantities: Quality Management Information System [Page 246]
Type of Updating [Page 21]
Period Units in Updating: Quality Management Information System [Page 247]
Updating Check [Page 24]
SAP AG Components of the Logistics Information System (LIS)
Time of the Update
April 2001 243
Time of the UpdateData from inspection processing is updated when the usage decision is made in QMIS. Then,when the usage decision is changed, for example when stocks are posted, the update occursautomatically.
The data from notification processing is updated whenever it is saved. Since data from defectsrecording is saved as a notification, any defects that arise can be statistically evaluatedimmediately after the recording.
The data from the following movement data is aggregated to make the following key figures:
� Inspection lot
� Usage decision
� Notification
� Problems and defects
� Results for inspection characteristics

Components of the Logistics Information System (LIS) SAP AG
Factors That Influence Updating the Information Structures: Quality ManagementInformation System
244 April 2001
Factors That Influence Updating the InformationStructures: Quality Management Information SystemIn addition to the type of updating (immediate or delayed) and the period unit in which the valuesare cumulated, there are other options for filtering and varying the updating of data from theinspection processes.
Inspection ProcessingClassification of Quality ScoresInspection lots are valuated according to the quality score and the usage decision. Generally, ananalysis of quality scores over a specific period is based on classed values. For this reason youcan reduce classed quality scores.
You can define quality score classes that meet your specific requirements in Customizing for theQuality Management system. You can define up to five quality score classes.
Assigning Quality Score Classes to an Information StructureIn Customizing for the Quality Management system, you can then assign the quality scoreclasses that you have defined (see previous topic) to the individual information structures used inthe QMIS.
Assigning an Update Group to an Inspection Lot OriginDuring inspection processing, you can use the Inspection Lot Origin to distinguish between theinspection lots. The inspection lot origin helps you to determine whether an inspection lot is fromproduction or goods receipt.
Since the inspection lot origin works in conjunction with various key figures, the inspection lotorigin must be integrated in updating control. You can do this by the assigning an update groupto the inspection lot origin. If no assignment is made, no data is updated to the QMIS for theinspection lot origin.
You can assign an update group to an inspection lot origin in Customizing for QualityManagement. In the standard SAP System, the appropriate update groups are already assignedto all the inspection lot origins in question.
Notification ProcessingIn notification processing, there are different of notification types. The notification type helps youto differentiate between a notification from defects recording or a notification from the customer.
Assigning an Update Group to a Type of Notification You can assign an update group to a notification type in the Customizing for the QualityManagement Information System. In the standard SAP System, the appropriate update groupsare already assigned to all the notification types in question.
Update GroupThe update group determines which information structures will be updated. The followingstandard update groups are available:

SAP AG Components of the Logistics Information System (LIS)
Factors That Influence Updating the Information Structures: Quality Management Information System
April 2001 245
� 00020: Inspection lot aggregation for vendor analysis
� 00021: Inspection lot aggregation for material analysis
� 00022: Inspection lot aggregation for vendor- and material analysis
� 00035: Inspection lot aggregation for customer analysis
� 00032: Notification aggregation for customer analysis
� 00033: Notification aggregation for vendor analysis
� 00034: Notification aggregation for material analysis
For example: if you have assigned the update group 20 to an inspection lot origin, the data fromthe inspection lot and the usage decision will be aggregated to the information structure for thevendor analysis.

Components of the Logistics Information System (LIS) SAP AG
Updating Quantities: Quality Management Information System
246 April 2001
Updating Quantities: Quality Management InformationSystemQuantities are updated in base unit of measure.
The base unit of measure is the unit of measure in which the system manages the materialstocks. It is determined in the material master.

SAP AG Components of the Logistics Information System (LIS)
Period Units in Updating: Quality Management Information System
April 2001 247
Period Units in Updating: Quality ManagementInformation SystemYou can also define the period units that are used in the updating process.
The period unit specifies the intervals at which the statistical data is cumulated. You can choosefrom the following:
� Day
� Week
� Month
� Posting period (you may also need to specify a fiscal year variant)
You can define a period unit for every standard information structure.
In the Quality Management Information System the standard time interval of the update forinformation structures S068, S069, S097, S098, S099, S100, S102, S103 and S104 is ‘month’.The inspection lot origin date is used to assign the inspection lot to the period unit in theinformation structure. You use the notification date to assign the notifications, problems anddefects.
The prerequisite for changing the period unit is that no actual data has been updatedto the information structure.
You can set the period unit for the standard information structures in Customizing forthe Logistics Information System.

Components of the Logistics Information System (LIS) SAP AG
Standard Analyses: Quality Management Information System
248 April 2001
Standard Analyses: Quality Management InformationSystemThe following standard analyses are available in the standard Quality Management InformationSystem. These analyses allow you to evaluate data from the inspection lot process and the QMnotifications:
� Lots
� Inspection result
� Notification overview
� Notification problems
� Defects
These analyses can be carried out from three views: from the vendor view, from the materialview, and from the customer view. In the exception analysis, you can display Exceptions [Ext.], which you have defined using theEarly Warning System [Ext.]. The exception analysis acts as a filter, that is, only the exceptionalsituations are displayed. The exceptional situations can be highlighted in color.
See also:Characteristics and Key Figures: Quality Management Information System [Page 249]

SAP AG Components of the Logistics Information System (LIS)
Characteristics and Key Figures: Quality Management Information System
April 2001 249
Characteristics and Key Figures: Quality ManagementInformation SystemStandardanalysen zu Losen
Standardanalyse zu Prüfergebnissen [Page 256]
Standard Analyses for Lots [Page 250]
Standard Analyses for Errors [Page 252]
Standard Analyses for Notifications [Page 253]
Standard Analyses for Notification Problems [Page 255]
See also:How the Key Figures are Calculated: Quality Management Information System [Page 258]

Components of the Logistics Information System (LIS) SAP AG
Standard Analyses for Lots
250 April 2001
Standard Analyses for LotsCharacteristicsThe following table gives you an overview on the characteristics that are available to you in thestandard analyses for lots with regard to the three views material, vendor and customer in theQM Information System.
Views:
Material(Infostruct. S069)
Vendor(Infostruct. S068)
Customer(Info struct. S104)
Characteristics
Vendor X
Customer X
Material X X X
Inspection type X X X
Plant X X X
Key FiguresThe following table provides you with an overview of the key figures that you can evaluate for lotswith regard to the three views of material, vendor, and customer in the QM Information System.
Views:
Material(Infostruct.S069)
Vendor(Infostruct.S068)
Customer(Info struct.S104)
Key Figures X
Number of faulty units X X X
Lots w/ Q-key figure in Cl. A X X X
Lots w/ Q-key figure in Cl. B X X X
Lots w/ Q-key figure in Cl. C X X X
Lots w/ Q-key figure in Cl. D X X X
Lots w/ Q-key figure in Cl. E X X X
Lots usage decision in order X X X

SAP AG Components of the Logistics Information System (LIS)
Standard Analyses for Lots
April 2001 251
Lots usage decision not inorder
X X X
Total lots X X X
Skipped lots X X X
Lots w/check for abnormal termination X X X
Lots w/open long-term characteristics X X X
Quantities of all lots X X X
Quantity of accepted lots X X X
Quantity of skipped lots X X X
Quantity of returned lots X X X
Average lead time X X X
Average value quality key figure X X X
Quantity appropriations X X
Quantity of scrap X X
Quantity of inspection sample X X
Quantity that was posted to another material X X
Quantity that was posted to free stock X X
Quantity of blocked stock X X
Quantity returned to vendor X
Sample quantity actual X X X
Sample quantity target X X X
Quota sample quantity X X X
Quota rejected quantity X X X
Quota skipped lots X X X
Quota skipped quantity X X X
Quota returned lots X X X
Quota returned quantity X X X
Rejected quantity X X X
Standard deviation lead time X X X
Standard deviation Q-key figure X X X
Standard deviation of the portion of faulty units X X X
Total lead time X X X

Components of the Logistics Information System (LIS) SAP AG
Standard Analyses for Errors
252 April 2001
Standard Analyses for ErrorsCharacteristicsThe following table provides you with an overview of the characteristics that you can evaluate forerrors with regard to the three views of material, vendor, and customer in the QM InformationSystem.
Views:
Material(Infostruct.S100
Vendor(Infostruct.S102
Customer(Info struct.S103)
Characteristics
Vendor X
Customer X
Material X X X
Notification type X X X
Catalog type/code group
X X X
Problem X X X
Report type X X X
Plant for material X X X
Key Figures (all views)� Average value of the error evaluation
� Problem frequency
� Problem items
� Total error evaluation

SAP AG Components of the Logistics Information System (LIS)
Standard Analyses for Notifications
April 2001 253
Standard Analyses for NotificationsCharacteristicsThe following table provides you with an overview of the characteristics that are available to youfor notifications with regard to the three views of material, vendor, and customer in the QMInformation System.
Views:
Material(Infostruct.S097)
Vendor(Infostruct.S098
Customer(Info struct.S099)
Characteristics
Vendor X
Customer X
Material X X X
Notification type X X X
Plant for material X X X
Key Figures (all views)� Measures successful
� Measures completed
� Measures total
� Measures open
� Notifications returned
� Notifications completed
� Notifications total
� Notifications in process
� Notifications open
� Total quantity quotient of faulty recorded quantities (recognized)
� Total quantity quotient of faulty recorded quantities (not recognized)
� Reclaimed quantity
� Returned quantity
Components of the Logistics Information System (LIS) SAP AG
Standard Analyses for Notifications
254 April 2001

SAP AG Components of the Logistics Information System (LIS)
Standard Analyses for Notification Problems
April 2001 255
Standard Analyses for Notification ProblemsCharacteristics The following table provides you with an overview of the characteristics that are available to youin the standard analyses for notification problems with regard to the three views of material,vendor, and customer in the QM Information System.
Views:
Material(Infostruct.S100)
Vendor (Infostruct.S102)
Customer(Info struct.S103)
Characteristics
Vendor X X
Customer
Material X X X
Notification type X X X
Catalog type/code group
X X X
Problem X X X
Report type X X X
Plant for material X X X
Key Figure (all views)� Problem frequency

Components of the Logistics Information System (LIS) SAP AG
Standard Analyses for Inspection Results
256 April 2001
Standard Analyses for Inspection Results
CharacteristicsThe following table provides you with an overview of the characteristics available in the QMInformation System standard analyses for inspection results with regard to the three viewsmaterial, vendor and customer.
Views:
Material(infostructures S161andS162)
Vendor(infostructures S163andS164)
Customer(infostructuresS165 andS166)
Characteristics
Vendor X
Customer X
Material X X X
Work center X X X
Master inspection characteristic X X X
Task list group X X X
Task list node X X X
Inspection characteristic X X X
Plant X X X
Key Figures for Master Inspection Characteristic / PlannedInspection Characteristic (S161, S163, S165)
� n No. of checked and completed samples
� nA No. of accepted samples
� nR No. of rejected samples
� nF No. of defects
� nFEh No. of nonconforming units
� ntolu No. of values under tolerance
� ntolo No. of values over tolerance
� nStpf Sample size (no. of valid values in sample)

SAP AG Components of the Logistics Information System (LIS)
Standard Analyses for Inspection Results
April 2001 257
Key Figures for Quantitative Characteristics (S162, S164, S166)Statistical values (additional key figures):
– s Standard deviation (1)
– x Mean value (1)
– cp Process capability index (1)
– cpk Process capability index (1)

Components of the Logistics Information System (LIS) SAP AG
How the Key Figures are Calculated: Quality Management Information System
258 April 2001
How the Key Figures are Calculated: QualityManagement Information SystemThe following topics will show you How to Calculate the key figures in the Quality ManagementInformation System.
Auxiliary and Supplementary Key Figures [Page 259]
Calculating the Supplementary Key Figures for Information Structures S068, S069 and S104[Page 260]
Calculating the Supplementary Key Figures for Information Structures S100, S102 and S103[Page 262]
SAP AG Components of the Logistics Information System (LIS)
Auxiliary and Supplementary Key Figures
April 2001 259
Auxiliary and Supplementary Key FiguresIn addition to the key figures that can be directly called up, the information structures S068,S069, S104, S100, S102 and S103 use technical auxiliary key figures. These auxiliary keyfigures are part of the information structures and are physically located in the database. They arelisted in the following tables together with the other key figures of the information structures.
By using the auxiliary key figures, dynamic supplementary key figures (such as averages valueand standard deviation for lead time, quality key figures and part of nonconforming units). Thesesupplementary key figures are not physically located in the database. They are calculateddynamically during runtime from data in both information structures with the help of internalconversion programs. The supplementary key figures are listed separately and their calculationwill be described in greater detail.
Calculating the Supplementary Key Figures for Information Structures S068, S069 and S104[Page 260]
Calculating the Supplementary Key Figures for Information Structures S100, S102 and S103[Page 262]
Calculating the Supplementary Key Figures for Information Structures S161, S162, S163, S164,S165, S166 [Page 263]

Components of the Logistics Information System (LIS) SAP AG
Calculating the Supplementary Key Figures for Information Structures S068, S069 andS104
260 April 2001
Calculating the Supplementary Key Figures forInformation Structures S068, S069 and S104The following information shows you how to dynamically calculate the supplementary key figuresof the vendor, customer and material analysis with a reference to inspection lot in the QualityManagement Information System during runtime. The key figures originate from the informationstructures S068 (Vendor) and S069 (Material) and S104 (Customer).
Lead TimeThe lead time of an inspection begins with the date on which the inspection lot was created andends with the date on which the usage decision is made. The lead time is also the difference infactory calendar days between these two basic dates (inspection lot creation and the usagedecision) while taking the time into account.
If the usage decision is made on the same day that the inspection lot is created (a skipped lot, forexample), then the lead time is > 1.
In QMIS the average and standard deviation are calculated for the lead time (LT).
� Average lead time
The average lead time is the quotient from the sum of the lead time and the number ofinspection lots.
Average LT = � LT / Number of inspection lots
� Standard deviation of the lead time
StdDev. LT = � (� LT2 - (� LT)2/n) / (n-1)
Share of Non-Conforming UnitsThe share of non-conforming units and the number of defects per 100 units are used in thesampling system for an inspection based on qualitative characteristics and for formulation ofsampling plans as the quality level.
In QMIS the average and standard deviation are calculated for the share of non-conforming unitsin the inspection lot (SHR).
� Average share of non-conforming units
Average SHR = SHR / Number of inspection lots * 100
� Standard deviation of the share of non-conforming units
StdDev. SHR = � (� SHR2 - (� SHR)2/n) / (n-1) * 100
Quality Key FiguresThe quality score is a relative or standardized statistical value that describes the valuation of thequality.
In QMIS the average and the standard deviation are calculated for the quality score (QSc).

SAP AG Components of the Logistics Information System (LIS)
Calculating the Supplementary Key Figures for Information Structures S068, S069 and S104
April 2001 261
� Average quality score
Average QSC = � QSC / number of inspection lots
� Standard deviation of the quality score
StdDev. QSc = � (� QSc2 - (� QSc)2/n) / (n-1)
RatesIn QMIS, a rate refers to a quantity-related or a number-related ratio expressed as a percent.
� The rate of rejected lots represents the ratio of the number of rejected lots to the total numberof lots.
Rate of rejected lots =(Lots not OK / Total lots) * 100
� The rate of skipped lots represents the ratio of the number of skipped lots to the total numberof lots.
Rate of skipped lots =(Lots skipped / total lots) * 100
� The rate of the rejected quantity represents the ratio of the rejected quantity to the totallot quantity.
Rate of rejected qty =(Rejected qty / all lots qty) * 100
� The rate of the skipped quantity represents the ratio of the skipped quantity to the total lotquantity.
Rate of skipped qty =(Skipped qty / all lots qty) * 100
� The rate of the sample quantity represents the ratio of the sample quantity to the total lotquantity.
Rate of sample qty =(Smpl qty (trgt) / All lots qty) * 100
The quantity of all lots and the total number of lots include the skipped inspections.
Components of the Logistics Information System (LIS) SAP AG
Calculating the Supplementary Key Figures for Information Structures S100, S102 andS103
262 April 2001
Calculating the Supplementary Key Figures forInformation Structures S100, S102 and S103The following information shows you how to dynamically calculate during runtime thesupplementary key figures of the vendor, customer and material analysis with a reference toerrors in the Quality Management Information System. The supplementary key figure originatesfrom the information structures S100 (problems/errors material analysis) S102 (problems/errors,vendor analysis) and S103 (problems/errors, customer analysis).
The supplementary key figure is only available in the standard analyses withreference to errors and not in the standard analyses with reference to notificationproblems.
Average Error ValuationIn the QM system you can individually determine the type of error valuation. You thereforequantitatively calculate the errors by using the error results. In addition, you can determine ascale for the error calculation such as a scale for the damage effects. This scale can be providedwith a unit of measurement.
Whether an error calculation should be carried out, which scale and which unit should be usedcan be determined in Customizing for each type of report.
The average value of error evaluation is used as the supplementary key figure for analyses in theQM Information System. The average error valuation is the product of dividing the sum of theerror valuation and the number of problem items:
Average error valuation = � error valuation / Number of problem items
SAP AG Components of the Logistics Information System (LIS)
Calculating the Supplementary Key Figures for Information Structures S162, S164, S166
April 2001 263
Calculating the Supplementary Key Figures forInformation Structures S162, S164, S166The statistics x , s , cp, cpk are each contained once only in the information structure. The algorithmfor calculating x , s , cp, cpk is dependent on the respective process model.
The possible process models and the calculation procedure are as follows:
� Model 1:
Mean value is derived from the mean value of the individual values.
Standard deviation is derived from inner dispersion.
� Model 2:
Mean value is derived from the mean value of the individual values.
Standard deviation is derived from average dispersion.
� Model 3:
Mean value is derived from the mean value of the mean values.
Standard deviation is derived from mean quadratic dispersion.
Depending on the model on which the calculation is based, the mean value �x contains either the
total mean value xgesamt or the mean value of the mean values � x .
The corresponding values for dispersion are the inner dispersion �sin, the mean dispersion �s or themean quadratic dispersion �sq. These values are included in the subsequent calculation of cp, cpk.
The default calculation algorithm for the statistics comprises the inner dispersion �sin and the totalmean value xgesamt . The process model can be switched at runtime and saved as a user parameter.
Calculation algorithms and source key figures:
– nStat No. of valid single values (2)
– n No. of samples
Mean values:
– xgesamt Mean value of single values� ni.xi. / nStat
– x Mean value of mean values �.xi. /n
– nxi i� Total of single values (2)
– xii
n
�
�1
Total of mean values (2)

Components of the Logistics Information System (LIS) SAP AG
Calculating the Supplementary Key Figures for Information Structures S162, S164, S166
264 April 2001
Standard deviation:
– sinVar
n nin
Stat
��
Inner dispersion
– s Mean dispersion � si /n
– sq Mean quadratic dispersion
Varn
�
Source key figures:
– �Varin Total variance of single values( * ( ))Var ni stat� � 1
– �si Total dispersions of samples
– �Var Total variances of samples
Process capability values: – tolun Last tolerance below
– tolob Last tolerance above
– cp Process capability index (1)( tolob - tolun ) / 6 �s
– cpk Process capability index (1)( tolob - �x ) / 3 �s
or( �x - tolun) / 3 �s
Key: (1) Key figures calculated at runtime
(2) Technical key figures (only used to calculate key figures at runtime)

SAP AG Components of the Logistics Information System (LIS)
Retail Information System (RIS)
April 2001 265
Retail Information System (RIS)This section contains information on the following topics in the Retail Information System:
Information Structures [Page 266]
Updating: Overview [Page 272]
Standard Analyses [Page 285]
Characteristics and Key Figures [Page 290]
How Key Figures Are Calculated [Page 335] [Page 335]

Components of the Logistics Information System (LIS) SAP AG
RIS Information Structures
266 April 2001
RIS Information StructuresData from the operational applications in SAP Retail is updated to the RIS Information Structures[Ext.].
The RIS occasionally uses information structures that serve only as auxiliarystructures for the purposes of adjustment between movement and stock data and inwhich data cannot be updated. When standard analyses that access an auxiliarystructure are executed, data is read from an information structure containingmovement data and one containing stock data. The system performs a backcalculation for stock, and thus determines the calculated key figures. The data fromthe auxiliary structure forms the basis for planning.
This procedure applies to the following information structures:
Auxiliary Structure Movement Data Stock Data
S079 (STRPS) S077 S078
S082 (Purchasing) S080 S081
S085 (Article) S083 S084
S107 (Article) S105 S106
The conversion of the corresponding update rules could look like this for informationstructure S082:
Goods receipt (Receipt: Z) 100Goods Issue (Issue: A) 10
Stock: B_x 100
B_x + Z - A = B_y 190Goods issue (Issue: A)
StockStock
S081S081
MovementMovement
S080S080
MovementMovementandand Stock Stock
S082S082
The standard R/3 System provides the following information structures in the Retail InformationSystem:
� S079 STRPS (Short-term retail profitability statement)
This information structure contains the data basis for creating short-term retail profitabilitystatements and thus also forms the basis for the STRPS standard analysis.

SAP AG Components of the Logistics Information System (LIS)
RIS Information Structures
April 2001 267
The information structure S079 is the central information structure of the RetailInformation System and represents the sales view.
The lowest data aggregation level is the merchandise category. The informationstructures for the article provide more detailed data.
� S082 PurchasingThis information structure provides data relevant to Purchasing. It therefore provides thedata basis for the Purchasing standard analysis. The lowest data aggregation level is themerchandise category. The information structures for the article provide more detaileddata.
� S085 ArticleThis information structure provides data, which enables you to analyze data right down toarticle level from the perspective of Sales and of Purchasing, and also to determinecause and effect. It provides the data basis for the article standard analysis.
� S086 PromotionThe information structure S086 provides the data basis for the promotion standardanalysis. It provides data concerning the logistics processes and the sale of promotionalmerchandise and thus forms the basis for analyzing promotion transactions.
� S087 Article/Add-onThis information structure provides the data basis for the article/add-on standardanalysis. It contains additional, detailed information that is not available in the informationstructure S085. S087 provides the basis for analyzing inventory differences or increasedgoods clearing.
� S107 SeasonThe information structure S107 provides the data basis for the season standard analysis,and supplies information that supports the purchase/sale of fashionable articles. Thisinformation structure only provides data concerning articles that are either seasonallyfashionable or limited by season. The purpose of this information structure is toconcentrate on supporting the area of textiles (size and color evaluations). For thisreason, key figures and characteristic criteria are added to the characteristics section ofthe information structure as additional selection and drill-down parameters. In this way,you can obtain additional information about the characteristics of the informationstructure. This also enables you to select articles which have a specific color, size, orfashion ID.
� S108 AdditionalsThe information structure S108 is used for updating articles that have been provided withadditionals. In this way, it is possible to analyze the costs incurred due to the fixing ofthese additionals.
� S110 Open-to-BuyThe information structure S110 is chiefly used in LIS Flexible Planning (planning of open-to-buy) and can be used for the planning of seasonal articles and fast-moving articles. Ithelps you to determine the open volume of the purchasing budget (open-to-buy).
This information structure contains key figures which are planned with the help of flexibleplanning, as well as key figures which are updated from the operative application. Youcan use the information structure S110 to create Exceptions [Ext.] with the help of the

Components of the Logistics Information System (LIS) SAP AG
RIS Information Structures
268 April 2001
Early Warning System. In this way you can accurately check for weak points between theplanned seasonal budget and the actual seasonal budget.
Information about how to use the Early Warning System can be found in the general LISdocumentation under Early Warning System [Ext.]
Additional information about open-to-buy can be found in the R/3 Retail Documentationin the section on the planning system under Open-To-Buy (OTB) [Ext.]
� S015 Subsequent SettlementThis information structure forms the data basis for the standard analyses of subsequentsettlement. The information structure S015 is updated when the events “invoice receiptfor a purchase order” (vendor business volume) or “subsequent settlements of anarrangement (income) by credit memo/billing document” take place.
� S123 Customer/Merchandise Category and S124 Customer/ArticleThe main characteristic of these information structures is the customer. Both informationstructures are therefore particularly relevant to the wholesale trade and also the retailsector, if the customer is known (in the furniture sector, for example). The key figures arederived from sales and distribution processes, and include key figures such as sales(absolute) and key figures referring to third-party orders.
S123 is filled with data up to the aggregation level merchandise category. S124 enablesdetailed analyses and provides data up to the aggregation level article.
� S150 Rough Workload Estimate - Overall StructureThis information structure is used by the standard analyses of the rough workloadpreview. It contains the data basis for performing workload considerations for allwarehouse processes.
The overall structure for rough workload estimate constitutes the upper level of the dual-level design of rough workload estimate.
This is a general structure that comprises all warehouse processes and only containsthose characteristics that can be interpreted in the same way for all warehouseprocesses.
The period unit of this information structure is Day and cannot be changed. If required,you can copy this information structure to create a self-defined information structure.
� S152 Rough Workload Estimate - Goods Issue StructureThis information structure is used by the standard analyses of the rough workloadestimate. It contains the data basis for performing workload considerations for thewarehouse processes picking/goods issue and returns to vendor.
The goods issue structure for rough workload estimate constitutes the lower level of thedual-level design of rough workload estimate.
This is a general structure that only contains data from the warehouse processespicking/goods issue and returns to vendor. All characteristics and key figures from theoverall structure are also contained in this information structure. It also containscharacteristics that are only of relevance for the two warehouse processes picking/goodsissue and returns to vendor.
The period unit of this information structure is Day and cannot be changed. If required,you can copy this information structure to create a self-defined information structure.
SAP AG Components of the Logistics Information System (LIS)
RIS Information Structures
April 2001 269
� S160 PerishablesInformation structure S160 serves as the basis for the operative application componentPerishables Planning. This supplementary component of the standard system enablesyou to control the process flow for perishables. It covers the requirements of both theretail sector and of wholesale trade.
The period unit of this information structure is Day and cannot be changed. If required,you can copy this information structure to create a self-defined information structure.
� S200 Physical Inventory in StoresThis information structure enables you to build up a collection of key figures whichprovide you with the following two options for analyzing physical inventories with respectcounting results and difference results for articles and merchandise categories:
� The analysis can take place directly after the transfer of the counting results.
For the time before posting of the physical inventories, information structure S200acts as a tool which you can use to search the perpetual inventory procedures up toarticle level to ascertain the differences that may be expected. This is possible fromthe initial counts onwards.
The Early Warning System can also be used to analyze this information structure.This means that you can detect and avert possible errors in the logistical processbefore the inventory differences finally defined.
The list of inventory differences that already exists is not replaced by informationstructure S200!
If differences do occur for physical inventory items, you can branch to the list ofinventory differences from the standard analysis of S200. This will provide you withmore detailed information on the differences.
� The analysis can take place after the inventory differences have been posted.
After the inventory differences have been posted, you can use information structureS200 to create evaluations on recurring inventory differences and the reason whythey occur. You can create periodic evaluations for articles, merchandise categoriesor sites.
Information Structures for the Sales AuditThe following information structures allow you to analyze POS data. They are all updated on adaily basis in the standard system and provide the data basis for the standard analysis of thesame name.
� S120 Sales As Per ReceiptsThe information structure S120 provides data relating to sales at the POS which can beused as the basis for performing shopping basket analyses and for planning shifts forcashiers. This structure enables analysis of the average sales per transaction or of pricereductions, via a variety of characteristics such as cashier, article, store, customer, orhour of sale. This information structure therefore provides detailed data on the lowestaggregation level and contains an immense volume of data.
S120 also enables you to perform detailed analyses, based on the data provided by thetwo information structures S121 and S122.
� S121 Article Aggregation: POS

Components of the Logistics Information System (LIS) SAP AG
RIS Information Structures
270 April 2001
This information structure provides aggregated POS data at the aggregation level ofarticle and store. It allows you to access the sales analysis at POS level. This means thatyou can compare articles and merchandise categories store-by-store and then branchdirectly to information structure S120 to perform a detailed analysis if you find deviations,for example.
� S122 CashierThe POS-specific information structure S122 concentrates on the POS and the cashier.S122 therefore contains data concerning POS differences, void transactions andcancellations throughout the different stores.
This information structure has two purposes:
� It enables you to compare stores according to the POS data such as POSdifferences, void transactions or cancellations, in order to identify deviations.
� It provides you with aggregated sales data for each cashier/POS and store. This dataenables you to perform a sales analysis. If you find deviations, you can then branchdirectly to information structure S120 (sales as per receipts) to perform a detailedanalysis.
In order to minimize the system load for information structures S121 and S122, youshould create an index for the data selection of the characteristics you require foryour specific situation.
You can find further information about updating these information structures and about the POSinterface in RIS under POS Interface [Page 284].
Information Structures for Market-Basket AnalysisYou can use information structures S117 and S119 to evaluate transaction data.
Both information structures are supplied with data via Copy Management from the POSinformation structure S120.
The information structure S117 is generated from S120 in an initial Copy Management (CM) run.S117 supplies the information structure S119 with data.
Use the following SAP methods to supply the information structures S117 and S119with data:
� R001 (S117 from S120)
� R002 (S119 from S117)
� S117 Receipt/ArticleThe information structure S117 delivers data on the market-basket level, that is, on thelevel of the receipt or article. It enables you to analyze the composition of shoppingbaskets. For example, this could involve the analysis of companion sales or a check onthe effectiveness of advertising.
� S119 Receipt

SAP AG Components of the Logistics Information System (LIS)
RIS Information Structures
April 2001 271
S119 delivers data on the cumulated shopping basket level, in other words, a data recordrepresents a complete transaction or purchasing activity of a customer . This informationstructure enables you to analyze the purchasing behavior of customers.
Exception reporting enables you to perform a self-defined grouping of customers, forexample, based on master data or customers who prefer special offers.
You can perform a more detailed analysis of this customer group by switching to thedetailed shopping basket level (S117) using Change info structure.
In addition, the "key figure matrix" function enables you to perform a meaningfulcustomer frequency analysis.
A full list of the characteristics and key figures of the standard analyses in the RetailInformation System can be found in Characteristics and Key Figures: RetailInformation System [Page 290].
You can find notes relating to the calculation of key figures in How Key Figures AreCalculated [Page 335].
Components of the Logistics Information System (LIS) SAP AG
Updating - Overview
272 April 2001
Updating - OverviewAnalysis of data in the Retail Information System is based on statistical data which is updatedfrom the operative application to the RIS information structures.
This section deals with the way the flow of data from the operative application to the informationstructures is defined and subsequently controlled.
You can find detailed information about the definition and control of updating in theImplementation Guide for the Logistics Information System. You can find the relevantchapter under Logistics General �� Logistics Information System �� Logistics DataWarehouse �� Updating.

SAP AG Components of the Logistics Information System (LIS)
Events
April 2001 273
EventsThe following table shows which events in the operative application update which informationstructures.
Note that information structures S079, S082, S085 and S107 are not updated. Theyact as auxiliary structures. During the respective standard analysis, data is read fromthe following information structures, stock levels are calculated back to a certainpoint and the values of the calculated key figures are determined:
S079: S077 and S078
S082: S080 and S081
S085: S083 and S084
S107: S105 and S106
Application Area Event Information Structures
Purchasing Purchase order S077, S080, S083, S086, S105, S106,S108, S110
Goods receipt S105, S106, S108, S110, S160, S150,S152
Invoice verification (rebate) S015
Billing document /Credit memo (rebate)
S015
InventoryManagement
Inventory Management(changes involving stocks)
S077, S078, S080, S081, S083, S084,S086, S087, S105, S106, S108, S110,S160
Revaluation (at cost) S077, S078, S080, S081, S083, S084S087, S105, S106, S110
Physical Inventory S200
Sales andDistribution
Order/Returns order S123, S124, S160, S150, S152
Delivery/Return delivery S123, S124, S160, S150, S152
Billing document/Creditmemo
S077, S080, S083, S086, S105, S110,S123, S124, S160
Retailing External POS data S120, S121, S122
Special Revaluation (at retail) S077, S078, S080, S081, S083, S084S087, S105, S106, S110
Components of the Logistics Information System (LIS) SAP AG
Updating Definition
274 April 2001
Updating DefinitionTo control the flow of statistic data from the application to the information system, you mustmaintain an updating definition in Customizing. In this updating definition, you create updategroups and update rules.
You will find further information on updating definition in the IMG for the LogisticsInformation System under Logistics Information System � Logistics DataWarehouse � Updating � Updating Definition.
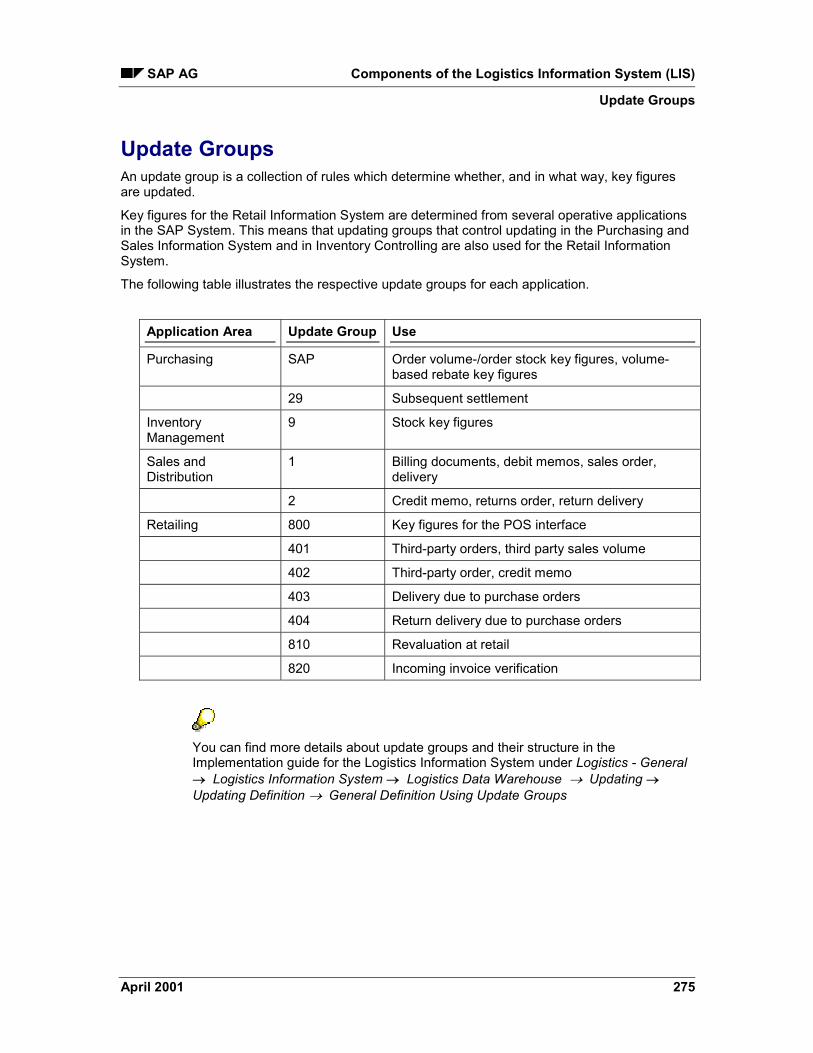
SAP AG Components of the Logistics Information System (LIS)
Update Groups
April 2001 275
Update GroupsAn update group is a collection of rules which determine whether, and in what way, key figuresare updated.
Key figures for the Retail Information System are determined from several operative applicationsin the SAP System. This means that updating groups that control updating in the Purchasing andSales Information System and in Inventory Controlling are also used for the Retail InformationSystem.
The following table illustrates the respective update groups for each application.
Application Area Update Group Use
Purchasing SAP Order volume-/order stock key figures, volume-based rebate key figures
29 Subsequent settlement
InventoryManagement
9 Stock key figures
Sales andDistribution
1 Billing documents, debit memos, sales order,delivery
2 Credit memo, returns order, return delivery
Retailing 800 Key figures for the POS interface
401 Third-party orders, third party sales volume
402 Third-party order, credit memo
403 Delivery due to purchase orders
404 Return delivery due to purchase orders
810 Revaluation at retail
820 Incoming invoice verification
You can find more details about update groups and their structure in theImplementation guide for the Logistics Information System under Logistics - General�� Logistics Information System �� Logistics Data Warehouse �� Updating ��Updating Definition �� General Definition Using Update Groups
Components of the Logistics Information System (LIS) SAP AG
Update Rules
276 April 2001
Update RulesThe update rules define whether and how each key figure is to be updated to the RetailInformation System.
The update rules define:
� to which characteristics combination a key figure is updated, if one of the events that triggerupdating occurs,
� from which source data fields in the application documents the information should be taken,
You can use requirements to define whether or not a key figure is updated at all. You can alsodefine a formula for calculating the key figure.
You will find a detailed description of the significance of update rules and theirmaintenance in the IMG for the Logistics Information System under Logistics -General � Logistics Information System � Logistics Data Warehouse � Updating� Updating Definition � Specific Definition Using Update Rules.
SAP AG Components of the Logistics Information System (LIS)
Updating Control
April 2001 277
Updating ControlUpdating Control in Customizing is used to activate updating, to maintain specific settings forupdating in the Retail Information System (for Data Enhancement, for example), and to controlupdating of statistical data using the update log.
You will find further information on updating control in the IMG for the LogisticsInformation System under Logistics - General�� Logistics Information System �Logistics Data Warehouse � Updating � Updating Control.

Components of the Logistics Information System (LIS) SAP AG
Type of Updating
278 April 2001
Type of UpdatingIn the LIS information systems, updating of statistical data can take place in two ways:
� As a U1 update (immediate start, i.e. when an event takes place that triggers an update)
� As a U2 update (delayed start, i.e. updating is delayed and takes place slightly after an eventthat triggers an update)
� As a U3 update (start must be triggered manually via Customizing, data will be saved in theclipboard until the update has started)
You can also turn the updating process off; this means that statistical data is no longer written tothe information structure.
You can find further information about the updating concept in the System Administration Guide.
You can specify the type of updating for each information structure in Customizing. You need tomake the appropriate settings in Customizing for the Logistics Information System. You can finddetailed information in the Implementation Guide for the Logistics Information System.
In the standard Retail Information System, updating is always deactivated, becauseit could have a negative effect on performance in the case of the standard modules.You first have to activate updating in order to ensure that information is written to theretail-specific information structures, so that you can use the respective analyses.

SAP AG Components of the Logistics Information System (LIS)
Period Unit
April 2001 279
Period UnitAs well as the type of updating required, you can also define the period unit.
The period unit defines the time level at which the statistical data is to be cumulated. You canselect the following period units:
� Day
� Week
� Month
� Posting period (with business year variants if necessary)
You can define the period unit for updating for each information structure that is supplied in thestandard system.
The following table gives you an overview of the period units used for updating those informationstructures of the Retail Information System that are supplied as standard.
Information structure Period unit used in updating
S077 Month
S078 None
S080 Month
S081 None
S083 Month
S084 None
S086 Week
S087 Month
S105 Week
S106 None
S108 Month
S110 Month
S115 Month
S117 Day
S119 Day
S121 Day
S120 Day
S122 Day
S123 Month
S124 Month

Components of the Logistics Information System (LIS) SAP AG
Period Unit
280 April 2001
S150 Day (fixed)
S152 Day (fixed)
S160 Day (fixed)
S200 Month
Note:No data is updated to information structures S079, S082, S085 and S107. Standardanalyses read data from the following information structures:
S079: S077 (movement), S078 (stock)
S082: S080 (movement), S081 (stock)
S085: S083 (movement), S084 (stock)
S107: S105 (movement), S106 (stock)
Information structures S079, S082, S085 and S107 always have the same period unit as thecorresponding information structure containing the movement data. If the period unit for theinformation structure containing the movement data changes, the period unit of the informationstructures named above will also change.
No data is written to information structures S117 and S119 either. These information structuresare supplied with data from S120 using Copy Management. The period unit for these informationstructures is Day.
The period unit can only be changed if no actual data has been updated to theinformation structure.
You set the period unit for the information structures that are supplied as standard inCustomizing for the Logistics Information System.
SAP AG Components of the Logistics Information System (LIS)
Update Check
April 2001 281
Update CheckYou can perform an update check in two ways: have the system generate an update log or carryout an update simulation. Both functions are available in Customizing for the LogisticsInformation System.
Update LogYou can have the system log all updating activities so that you can monitor them. This update logshows you the data flow from Purchasing to the information structures, irrespective of theprocess or user involved.
Note that the update log is created only for the last process performed. The oldentries in the update log are thus overwritten as soon as a new process is updated.
To make the settings for update logs, proceed as follows:
1. Choose System � User defaults � User parameters from the system menu.
2. Enter MCL in the PID field and put an X in the Parameter value field.
3. Save your entries.
4. To display the update log, choose Logistics Information System � Logistics Data Warehouse� Data Basis � Updating � Updating Control � Update Check � Display Update Log.
Generating an update log increases the load on the system. You should thereforedeactivate the log settings once you have performed an update check.
SimulationTo check the updating of documents that have already been posted (in cases where changeshave been made in Customizing, for example), you can generate update logs from any sales anddistribution document without triggering updating for information structures. This method allowsyou to check how a document would be updated taking the new Customizing settings intoaccount. This type of update log can also be used in productive systems without any problems.

Components of the Logistics Information System (LIS) SAP AG
Cancellations
282 April 2001
CancellationsIt may sometimes be necessary to cancel an existing posting (due to errors entering data, forexample). In RIS, this results in a reduction in the key figure affected.
The following processes reduce the original key figure:
� Cancellation of article document
� Cancellation of movement type
A good receipt is without a previous purchase order is posted with an externalvendor (movement type 501). If the article document is cancelled or a goods receiptis posted with the cancellation movement type 502, the key figure "Goods receipt(external vendor)" in RIS is reduced.
Any changes to conditions that are made while you are using the cancellation movement type willresult in incorrect value reductions in RIS. In cases such as this, you must cancel the materialdocument.
Physical return deliveries must never be performed using a cancellation movementtype, as this reduces key figures (such as Goods Receipt) without updating thecomplementary key figures (such as Returns).

SAP AG Components of the Logistics Information System (LIS)
Posting Quantities and Currencies
April 2001 283
Posting Quantities and CurrenciesQuantitiesQuantities are posted in the base unit of measure (this enables key figures to be compared).
The base unit of measure is the unit of measure that the system uses to manage the articlestocks. This unit of measure is defined in the article master record.
� Sales quantities are generally converted to the base unit of measure.
� Different base units of measure can occur within a merchandise category. Forinformation structures that have Merchandise Category as the lowestcharacteristic level, then, the last access determines the content of the base unitof measure field.
� If key figures that all have the same unit of measure are to be modeled (forexample, sales in sales unit), this can be done using self-defined informationstructures
In such cases, you must include the unit of measure concerned in thecharacteristics part (key) of the information structure.
CurrenciesCurrencies are always posted in the local currency. The local currency is stored in the companycode. You make this setting in the Customizing menu under Organization.

Components of the Logistics Information System (LIS) SAP AG
POS Interface
284 April 2001
POS InterfaceThe POS (Point of Sale interface) transfers POS data to the R/3 System. The POS data from thePOS upload is posted to the operative system using billing. The communication structures areused to transfer this data to the information structures of the Retail Information System.
This data is generally aggregated at store/article level in order to keep the operational documentsas small as possible. Data in this form is not suitable for detail analyses. You can use them fortarget/actual variances, but more detailed data is required for more precise analyses. For thisreason, the POS interface can be used to transfer detailed data (either per transaction oraggregated) and cashier data to the information structures of the POS interface.
POS data is thus transferred in aggregated form to information structures S077-S087, S107 andS110 using the documents (billing, goods issue, and so on), while POS data per transaction istransferred to the information structures of the POS statistics (S120, S121, S122). This is shownby the following graphic.
Articleagg.-posSales
BasedOn
Receipts
POS-Data
InformationStructures forPOS Statistics
InformationStructuresTranslator
BillingDocument
InboundIDoc
Cashier
Article
GoodsIssue
STRPS
Statistical setup cannot be performed for data that is transferred to the informationstructures of the POS statistics using the POS interface, as no documents aregenerated.

SAP AG Components of the Logistics Information System (LIS)
Standard Analyses in RIS
April 2001 285
Standard Analyses in RIS
The Retail Information System contains a number of Standard Analyses [Ext.] to evaluate datafrom different perspectives. You can usually evaluate data at the merchandise categoryaggregation level in SAP Retail.
Information Structures [Page 266] form the basis for the standard analyses. During a standardanalysis, data from the information structures is read, stock levels are calculated and thecalculated key figures are determined.
You can use the Switch Information Structure [Ext.] function to execute a detail analysis at otherlevels. You can, for example, display all the articles for a merchandise category and use thisfunction to change to the Article information structure (S085) or to Article/Add-On (S087), thusperforming evaluations at a lower aggregation level.
You can use the Early Warning System for all standard analyses to set an Exception [Page 289]and display this in the exception analysis. The exception analysis acts as a filter; this means, onlythe exceptional situations are displayed. These can be highlighted in color. More informationabout the Early Warning System [Ext.] and other tools of the Logistics Information System can befound in the SAP Menu under Info Systems � Logistics � Retail � Tools in the documentationfor LIS.
You can use the following standard analyses in the Retail Information System:
Retail-specific standard analyses
Business area Standard analysis
Purchasing Purchasing [Ext.]
Open to Buy (Open-to-Buy) [Ext.]
Subsequent Settlement [Ext.]
Sales STRPS (Short-Term Retail Profitability Statement) [Ext.]
Customer/Merchandise Category [Ext.]
Article Article [Ext.]
Article/Add-On [Ext.]
Customer/Article [Ext.]
Special Processes Promotion [Ext.]
Season [Ext.]
Perishables [Ext.]
Physical Inventory [Ext.]
Additionals [Ext.]
Sales Audit Cashier [Ext.]
Sales as per Receipts [Ext.]
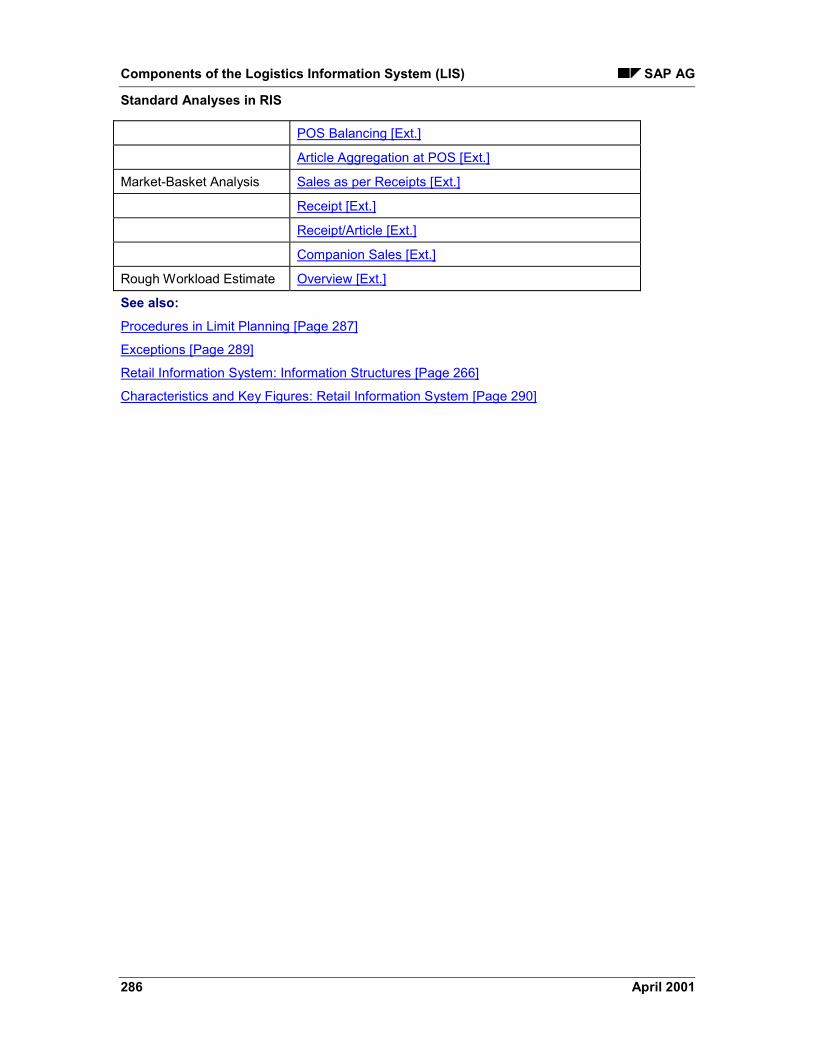
Components of the Logistics Information System (LIS) SAP AG
Standard Analyses in RIS
286 April 2001
POS Balancing [Ext.]
Article Aggregation at POS [Ext.]
Market-Basket Analysis Sales as per Receipts [Ext.]
Receipt [Ext.]
Receipt/Article [Ext.]
Companion Sales [Ext.]
Rough Workload Estimate Overview [Ext.]
See also:Procedures in Limit Planning [Page 287]
Exceptions [Page 289]
Retail Information System: Information Structures [Page 266]
Characteristics and Key Figures: Retail Information System [Page 290]

SAP AG Components of the Logistics Information System (LIS)
Procedures in Limit Planning
April 2001 287
Procedures in Limit PlanningThe open-to-buy function can be divided into three phases:
� Planning phase
� Purchasing phase
� Business phase
Planning phaseThe season budget and the budget already released are calculated on the basis of monthlyplanning figures, sales, closing stock, markdowns and physical inventory differences.
If stock needs to be built up prior to the start of the actual selling period, then theplanning period should also include the relevant periods prior to the start of theseason. For these periods, you only plan the key figure “Closing stock.”
Purchasing phaseLong before the start of the actual planning period, you can enter purchase orders that have adelivery date during the planning period. The planned released budget is available for this. Allpurchase orders reduce the open-to-buy so that it always corresponds to the portion of thereleased budget which has not yet been spent.
Business phaseThe updated actual figures for sales, stock and so on can now be compared with the plannedfigures. OTB in this phase is calculated using the planned and actual figures available. This helpsto prevent strong planned/actual variances occurring. The goal is always to achieve the plannedclosing stock for the current period, so that discrepancies between planned and actual values donot affect the following periods.
If the actual sales for a period are more than the planned sales, then you will need to purchasemore stock to reach the planned opening stock for the following period. If, on the other hand, theplanned sales volume is not reached, you need to block further buying and stockpiling, and, ifnecessary, reduce the existing stock by creating a sales promotion or an inventory clearance.
Note the following:
� If the total quantity of goods actually received deviates from the total quantity contained in thepurchase orders creating during the purchasing phase, then the OTB will be adjusted by thedifference between these amounts.
� If the good receipt time differs from the planned delivery time, the goods receipt quantityis posted to the corresponding period. As a result, only the outstanding purchase ordersare taken into account for the delivery date, while goods receipts are included in the OTBcalculation for the posting date.
If goods receipt occurs earlier than planned, part of the OTB becomes available in theplanned period and the goods receipt period is debited.
If goods receipt occurs later than planned, OTB becomes available in the planneddelivery period, which has already passed. This is not transferred into the subsequent

Components of the Logistics Information System (LIS) SAP AG
Procedures in Limit Planning
288 April 2001
period because the amount has already been cleared by the lower opening stock at thestart of the subsequent period (caused by the missed delivery).
� Whether and by what amount the actual sales volume deviates from the planned salesvolume during the current period, can only be determined at the end of the period. For thisreason, the sales volume at the end of the period is extrapolated for the OTB calculation ofthe current period. Also, the differences between the planned and actual values caused bythe change in opening stock take effect, at the latest, in the subsequent period.
� Markdowns and physical inventory differences:
If actual markdowns and inventory differences exceed the planned values, thedifferences are taken into account in the OTB calculation in the current period.
If actual markdowns and inventory differences are less than planned, then the resultingdifferences in the planned and actual values only become effective in the subsequentperiod, in the form of higher opening stock.
� All actual goods movements that were not planned and were therefore not included in thebudget calculation (for example, inventory clearances) affect OTB in the current period. Forexample, if merchandise is transferred to another store, then the OTB in the issuing store isincreased so that the stock that is now lacking can be replaced.
With the above considerations, the unused OTB of completed periods is transferred to periods asfar in the future as possible to prevent the planned and actual amounts from drifting apart overseveral periods.

SAP AG Components of the Logistics Information System (LIS)
Exceptions
April 2001 289
ExceptionsThis function allows you to define an exception in the Early Warning System. An exceptionconsists of characteristics (or characteristic values), such as vendor or article, and requirements.Requirements can be created as threshold values (for example, article/vendor with an ordervalue of more than 5000 euros), as trends (for example, positive trends in order values) or asplanned/actual comparisons.

Components of the Logistics Information System (LIS) SAP AG
Characteristics and Key Figures
290 April 2001
Characteristics and Key FiguresThe following section lists in detail the characteristics and key figures of all standard analyses inthe Retail Information System.
Note that virtually all key figures in the Retail Information System have more thanone version. For example, the key figure Sales can appear in the following versions:
� Sales at cost without tax (cost)
� Sales at retail with tax (rtlT)
� Sales at retail without tax (rtl)
� Sales quantity
Those additional values that are exclusive to the Retail Information System can befound in brackets after the respective key figure.
For more information on the abbreviations used, see Abbreviations [Page 334].
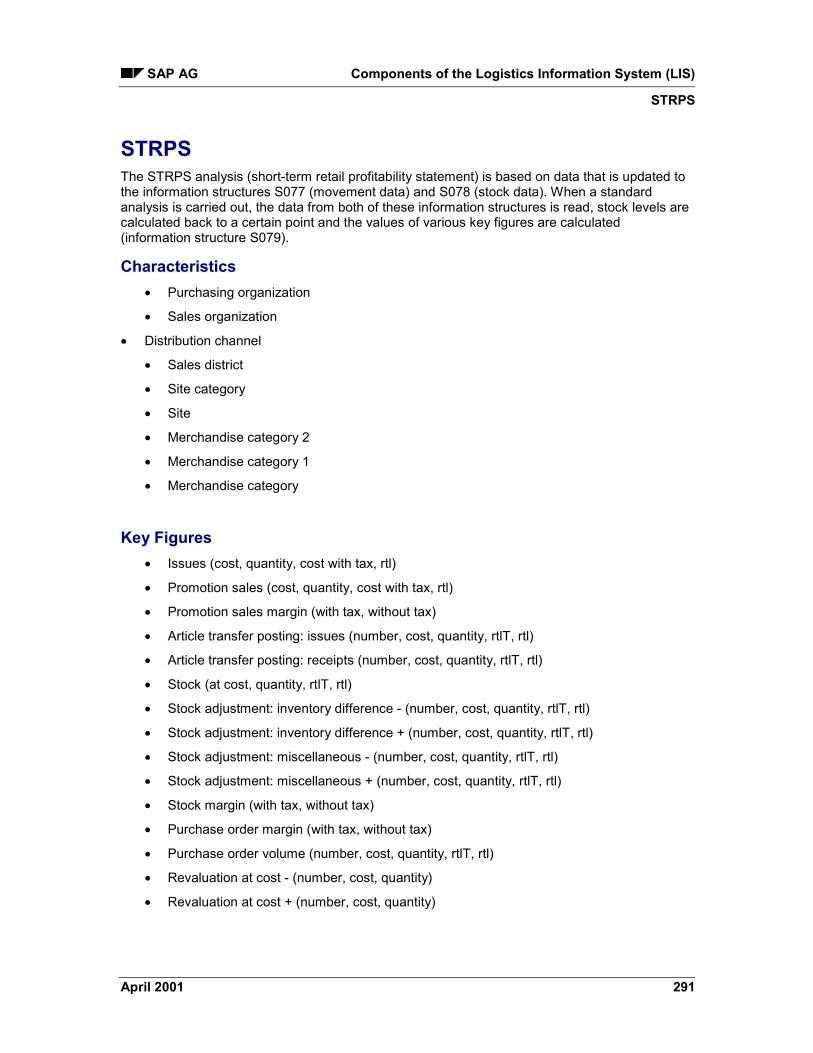
SAP AG Components of the Logistics Information System (LIS)
STRPS
April 2001 291
STRPSThe STRPS analysis (short-term retail profitability statement) is based on data that is updated tothe information structures S077 (movement data) and S078 (stock data). When a standardanalysis is carried out, the data from both of these information structures is read, stock levels arecalculated back to a certain point and the values of various key figures are calculated(information structure S079).
Characteristics� Purchasing organization
� Sales organization
� Distribution channel
� Sales district
� Site category
� Site
� Merchandise category 2
� Merchandise category 1
� Merchandise category
Key Figures� Issues (cost, quantity, cost with tax, rtl)
� Promotion sales (cost, quantity, cost with tax, rtl)
� Promotion sales margin (with tax, without tax)
� Article transfer posting: issues (number, cost, quantity, rtlT, rtl)
� Article transfer posting: receipts (number, cost, quantity, rtlT, rtl)
� Stock (at cost, quantity, rtlT, rtl)
� Stock adjustment: inventory difference - (number, cost, quantity, rtlT, rtl)
� Stock adjustment: inventory difference + (number, cost, quantity, rtlT, rtl)
� Stock adjustment: miscellaneous - (number, cost, quantity, rtlT, rtl)
� Stock adjustment: miscellaneous + (number, cost, quantity, rtlT, rtl)
� Stock margin (with tax, without tax)
� Purchase order margin (with tax, without tax)
� Purchase order volume (number, cost, quantity, rtlT, rtl)
� Revaluation at cost - (number, cost, quantity)
� Revaluation at cost + (number, cost, quantity)

Components of the Logistics Information System (LIS) SAP AG
STRPS
292 April 2001
� GMROI (with tax, without tax)
� Annual inventory turn (quantity/value)
� Price reduction
� Range of coverage (quantity/value)
� Returns (number, cost, quantity, rtlT, rtl)
� Revaluation at retail - (number, quantity, rtlT, rtl)
� Revaluation at retail - (number, quantity, rtlT, rtl)
� Sales (at cost, quantity, rtlT, rtl)
� Sales margin (with tax, without tax)
� Inventory turn (quantity/value)
� Goods issue: distribution center (number, cost, quantity, rtlT, rtl)
� Goods clearing: issue (number, quantity, rtlT, rtl)
� Goods clearing: receipt (number, quantity, rtlT, rtl)
� Goods receipt: vendor (number, cost, quantity, rtlT, rtl)
� Goods receipt: distribution center (quantity, number, cost, rtlT, rtl)
� Goods receipt margin (with tax, without tax)
� Receipts (at cost, quantity, rtlT, rtl)

SAP AG Components of the Logistics Information System (LIS)
Purchasing
April 2001 293
PurchasingThe purchasing analysis is based on data that is updated to the information structures S080(movement data) and S081 (stock data). When a standard analysis is carried out, the data fromboth of these information structures is read, stock levels are calculated back to a certain pointand the values of various key figures are calculated (information structure S082).
Characteristics� Purchasing organization
� Purchasing area
� Purchasing group
� Vendor
� Site category
� Site
� Merchandise category 2
� Merchandise category 1
� Merchandise category
Key Figures� Issues (cost, quantity, cost with tax, rtl)
� Promotion sales (cost, quantity, cost with tax, rtl)
� Promotion sales margin (with tax, without tax)
� Stock (at cost, quantity, rtlT, rtl)
� Stock margin (with tax, without tax)
� Purchase order volume (number, cost, quantity, rtlT, rtl)
� Purchase order margin (with tax, without tax)
� GMROI (with tax, without tax)
� Annual inventory turn (quantity/value)
� Range of coverage (quantity/value)
� Sales (at cost, quantity, rtlT, rtl)
� Sales margin (with tax, without tax)
� Sales deviation
� Inventory turn (quantity/value)
� Revaluation at retail - (number, quantity, rtlT, rtl)
� Revaluation at retail - (number, quantity, rtlT, rtl)

Components of the Logistics Information System (LIS) SAP AG
Purchasing
294 April 2001
� Goods issue: distribution center (number, cost, quantity, rtlT, rtl)
� Goods receipt: vendor (number, cost, quantity, rtlT, rtl)
� Goods receipt: distribution center (quantity, number, cost, rtlT, rtl)
� Goods receipt margin (with tax, without tax)
� Receipts (at cost, quantity, rtlT, rtl)

SAP AG Components of the Logistics Information System (LIS)
Subsequent Settlement
April 2001 295
Subsequent SettlementThe data basis for the standard analysis for Subsequent Settlement is the data that is updated toinformation structure S015.
Characteristics� Purchasing organization
� Purchasing group
� Site
� Merchandise category
� Condition granter
� Creditor
� Arrangement
� Settlement end
Key Figures� Number of points to the condition record (arrangement) from the order items
� Gross weight to the condition record (arrangement) from the order items
� Quotient income of the condition record from the final settlement
� Income from the settlement of the condition record
� Total income of the condition record
� Net weight to the condition record (arrangement) from the order items
� Provision for condition income
� Sales to the condition record from the order items
� Sales quantity to the condition record (arrangement) from the order items
� Volume to the condition record (arrangement) from the order items
� Canceled provision for condition income
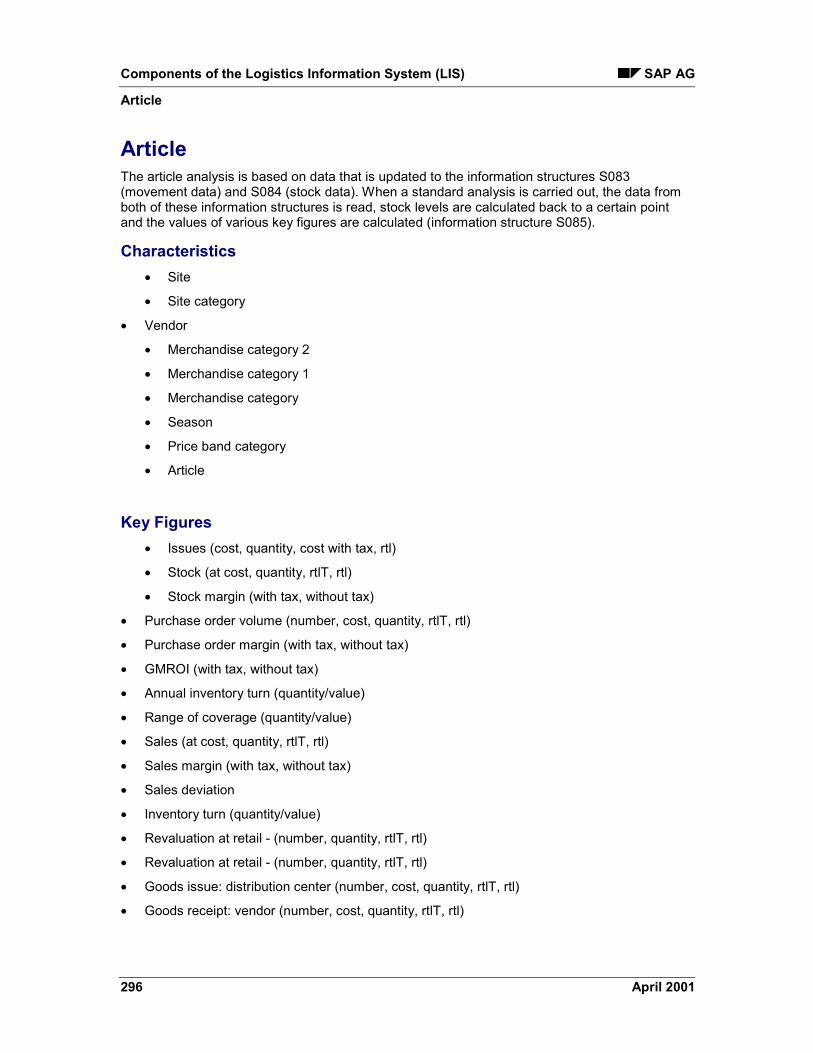
Components of the Logistics Information System (LIS) SAP AG
Article
296 April 2001
ArticleThe article analysis is based on data that is updated to the information structures S083(movement data) and S084 (stock data). When a standard analysis is carried out, the data fromboth of these information structures is read, stock levels are calculated back to a certain pointand the values of various key figures are calculated (information structure S085).
Characteristics� Site
� Site category
� Vendor
� Merchandise category 2
� Merchandise category 1
� Merchandise category
� Season
� Price band category
� Article
Key Figures� Issues (cost, quantity, cost with tax, rtl)
� Stock (at cost, quantity, rtlT, rtl)
� Stock margin (with tax, without tax)
� Purchase order volume (number, cost, quantity, rtlT, rtl)
� Purchase order margin (with tax, without tax)
� GMROI (with tax, without tax)
� Annual inventory turn (quantity/value)
� Range of coverage (quantity/value)
� Sales (at cost, quantity, rtlT, rtl)
� Sales margin (with tax, without tax)
� Sales deviation
� Inventory turn (quantity/value)
� Revaluation at retail - (number, quantity, rtlT, rtl)
� Revaluation at retail - (number, quantity, rtlT, rtl)
� Goods issue: distribution center (number, cost, quantity, rtlT, rtl)
� Goods receipt: vendor (number, cost, quantity, rtlT, rtl)

SAP AG Components of the Logistics Information System (LIS)
Article
April 2001 297
� Goods receipt: distribution center (quantity, number, cost, rtlT, rtl)
� Goods receipt margin (with tax, without tax)
� Receipts (at cost, quantity, rtlT, rtl)
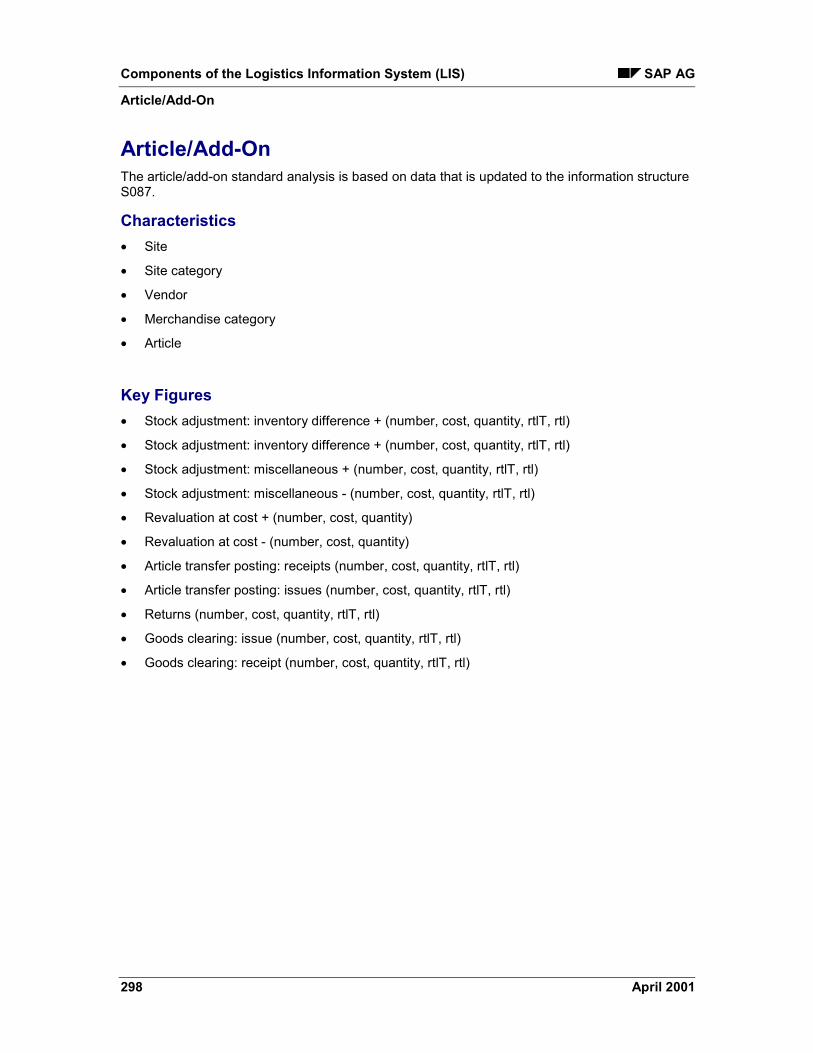
Components of the Logistics Information System (LIS) SAP AG
Article/Add-On
298 April 2001
Article/Add-OnThe article/add-on standard analysis is based on data that is updated to the information structureS087.
Characteristics� Site
� Site category
� Vendor
� Merchandise category
� Article
Key Figures� Stock adjustment: inventory difference + (number, cost, quantity, rtlT, rtl)
� Stock adjustment: inventory difference + (number, cost, quantity, rtlT, rtl)
� Stock adjustment: miscellaneous + (number, cost, quantity, rtlT, rtl)
� Stock adjustment: miscellaneous - (number, cost, quantity, rtlT, rtl)
� Revaluation at cost + (number, cost, quantity)
� Revaluation at cost - (number, cost, quantity)
� Article transfer posting: receipts (number, cost, quantity, rtlT, rtl)
� Article transfer posting: issues (number, cost, quantity, rtlT, rtl)
� Returns (number, cost, quantity, rtlT, rtl)
� Goods clearing: issue (number, cost, quantity, rtlT, rtl)
� Goods clearing: receipt (number, cost, quantity, rtlT, rtl)
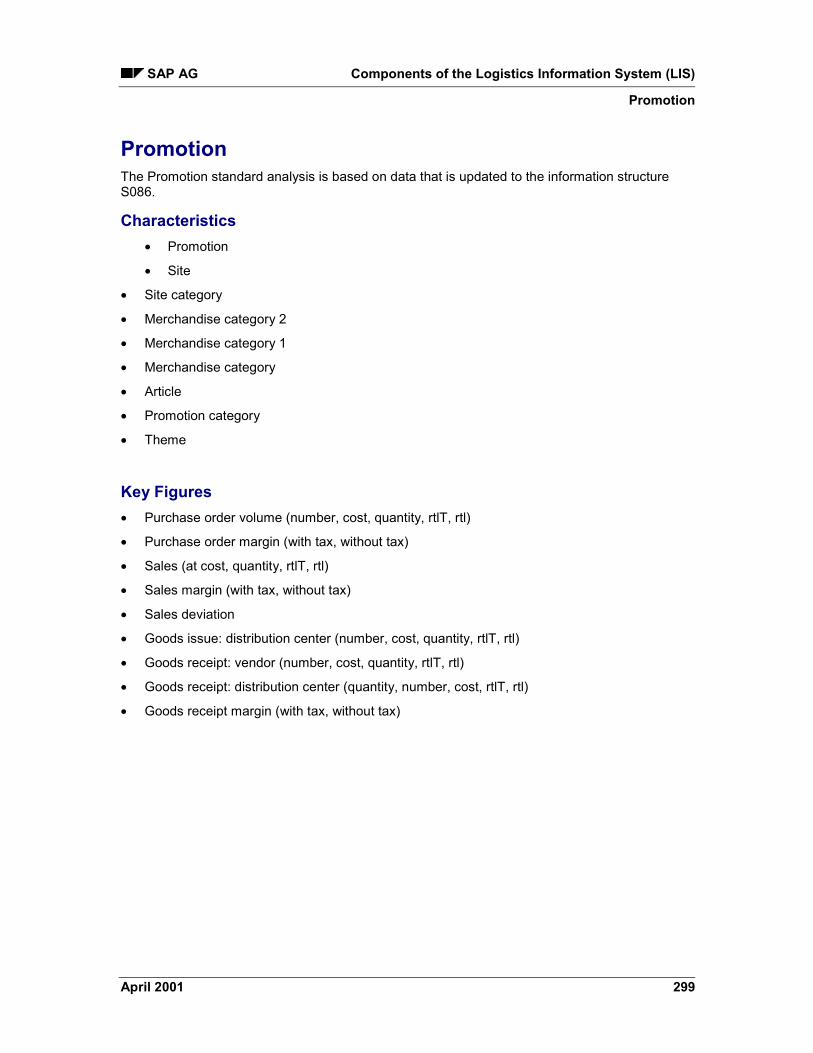
SAP AG Components of the Logistics Information System (LIS)
Promotion
April 2001 299
PromotionThe Promotion standard analysis is based on data that is updated to the information structureS086.
Characteristics� Promotion
� Site
� Site category
� Merchandise category 2
� Merchandise category 1
� Merchandise category
� Article
� Promotion category
� Theme
Key Figures� Purchase order volume (number, cost, quantity, rtlT, rtl)
� Purchase order margin (with tax, without tax)
� Sales (at cost, quantity, rtlT, rtl)
� Sales margin (with tax, without tax)
� Sales deviation
� Goods issue: distribution center (number, cost, quantity, rtlT, rtl)
� Goods receipt: vendor (number, cost, quantity, rtlT, rtl)
� Goods receipt: distribution center (quantity, number, cost, rtlT, rtl)
� Goods receipt margin (with tax, without tax)

Components of the Logistics Information System (LIS) SAP AG
Season
300 April 2001
SeasonThe Season analysis is based on data that is updated to information structures S105 (movementdata) and S106 (stock data). When a standard analysis is carried out, the data from both of theseinformation structures is read, stock levels are calculated back to a certain point and the valuesof various key figures are calculated (information structure S107).
Characteristics� Purchasing group
� Site
� Vendor
� Merchandise category
� General configurable article
� Article
� Season year
� Season
� Price band category
Further Selection CriteriaFor more information, see Further Selection Criteria [Page 333]
� Characteristic 1
� Characteristic 2
� Characteristic 3
� Merchandise category 1
� Merchandise category 2
Key Figures� Issues Open Purchase Order Quantity (at cost, quantity, rtlT, rtl)
� Issues (cost, quantity, cost with tax, rtl)
� Sales quota (quantity, value)
� Promotion sales (cost, quantity, cost with tax, rtl)
� Promotion sales margin (with tax, without tax)
� Stock (at cost, quantity, rtlT, rtl)
� Stock margin (with tax, without tax)

SAP AG Components of the Logistics Information System (LIS)
Season
April 2001 301
� First receipt
� Fictitious stock
� Fictitious sales
� GMROI (with tax, without tax)
� Annual inventory turn (quantity/value)
� Characteristic (1, 2, 3)
� Open on-order stock (at cost, rtlT, rtl)
� Open on-order stock margin (with tax, without tax)
� Range of coverage (quantity/value)
� End of season stock (at cost, quantity, rtlT, rtl)
� Number of days on sale
� Sales (at cost, quantity, rtlT, rtl)
� Sales deviation
� Sales margin (with tax, without tax)
� Inventory turn (quantity, cost, rtl, rtlT)
� Original retail price
� Revaluation at retail - (number, quantity, rtlT, rtl)
� Revaluation at retail - (number, quantity, rtlT, rtl)
� Goods issue: distribution center (number, at cost, quantity, rtlT)
� Goods clearing: issue (number, cost, quantity, rtlT, rtl)
� Goods clearing: receipt (number, cost, quantity, rtlT, rtl)
� Merchandise category 1, 2
� Receipt on-order stock (cost, quantity, rtlT, rtl)
� Receipts (at cost, quantity, rtlT, rtl)
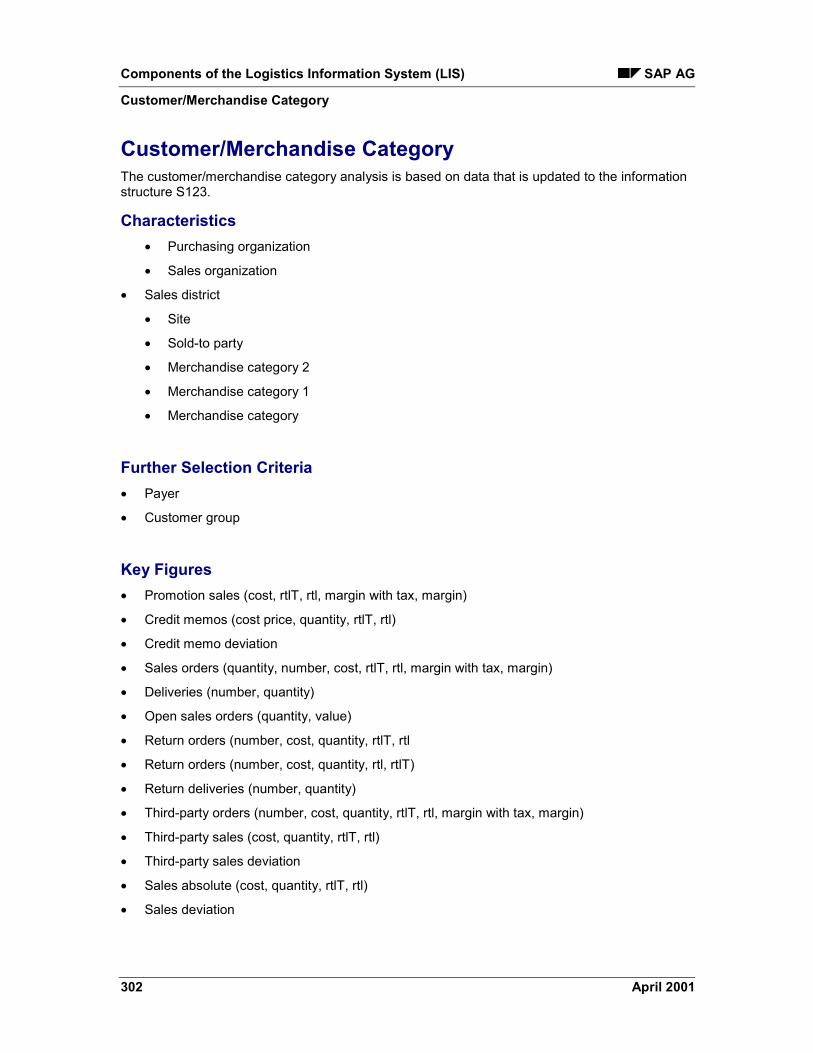
Components of the Logistics Information System (LIS) SAP AG
Customer/Merchandise Category
302 April 2001
Customer/Merchandise CategoryThe customer/merchandise category analysis is based on data that is updated to the informationstructure S123.
Characteristics� Purchasing organization
� Sales organization
� Sales district
� Site
� Sold-to party
� Merchandise category 2
� Merchandise category 1
� Merchandise category
Further Selection Criteria� Payer
� Customer group
Key Figures� Promotion sales (cost, rtlT, rtl, margin with tax, margin)
� Credit memos (cost price, quantity, rtlT, rtl)
� Credit memo deviation
� Sales orders (quantity, number, cost, rtlT, rtl, margin with tax, margin)
� Deliveries (number, quantity)
� Open sales orders (quantity, value)
� Return orders (number, cost, quantity, rtlT, rtl
� Return orders (number, cost, quantity, rtl, rtlT)
� Return deliveries (number, quantity)
� Third-party orders (number, cost, quantity, rtlT, rtl, margin with tax, margin)
� Third-party sales (cost, quantity, rtlT, rtl)
� Third-party sales deviation
� Sales absolute (cost, quantity, rtlT, rtl)
� Sales deviation

SAP AG Components of the Logistics Information System (LIS)
Customer/Merchandise Category
April 2001 303
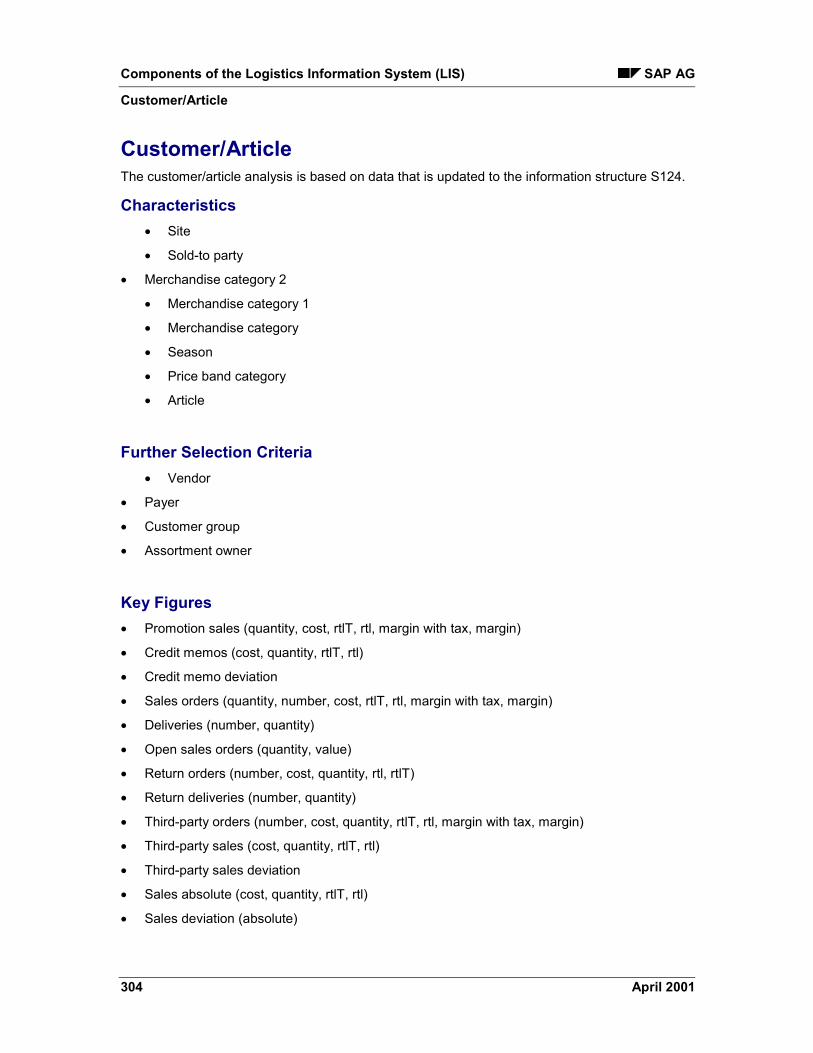
Components of the Logistics Information System (LIS) SAP AG
Customer/Article
304 April 2001
Customer/ArticleThe customer/article analysis is based on data that is updated to the information structure S124.
Characteristics� Site
� Sold-to party
� Merchandise category 2
� Merchandise category 1
� Merchandise category
� Season
� Price band category
� Article
Further Selection Criteria� Vendor
� Payer
� Customer group
� Assortment owner
Key Figures� Promotion sales (quantity, cost, rtlT, rtl, margin with tax, margin)
� Credit memos (cost, quantity, rtlT, rtl)
� Credit memo deviation
� Sales orders (quantity, number, cost, rtlT, rtl, margin with tax, margin)
� Deliveries (number, quantity)
� Open sales orders (quantity, value)
� Return orders (number, cost, quantity, rtl, rtlT)
� Return deliveries (number, quantity)
� Third-party orders (number, cost, quantity, rtlT, rtl, margin with tax, margin)
� Third-party sales (cost, quantity, rtlT, rtl)
� Third-party sales deviation
� Sales absolute (cost, quantity, rtlT, rtl)
� Sales deviation (absolute)
SAP AG Components of the Logistics Information System (LIS)
Customer/Article
April 2001 305

Components of the Logistics Information System (LIS) SAP AG
Article Aggregation - POS
306 April 2001
Article Aggregation - POSThe article aggregation - POS standard analysis is based on data that is updated to theinformation structure S121.
Characteristics� Merchandise category
� Article
� Site
� Promotion
� Condition type
Further Selection CriteriaFor more information, see Further Selection Criteria [Page 333]
� Sales district
Key Figures� Price difference SAP System --> POS
� Price reduction
� Sales (cost, rtlT, rtl, quantity)
� Sales margin without tax
SAP AG Components of the Logistics Information System (LIS)
Cashier
April 2001 307
CashierThe cashier analysis is based on data that is updated to the information structure S122.
Characteristics� Site
� Cashier number
� POS number
� POS group
� Condition type
� Operation
Further Selection CriteriaFor more information, see Further Selection Criteria [Page 333]
� Cashier name
� Condition type ID
� Sales district
� Sales organization
� Distribution channel
Key Figures� Number of scanned articles
� Number of terminations
� Number of transactions
� Number of cancelled transactions
� Number of immediate cancellations
� Number of line cancellations
� Number of merchandise category article sales
� Actual POS amount
� Target POS amount
� POS difference negative
� POS difference positive
� Price difference POS
� Price reduction
Components of the Logistics Information System (LIS) SAP AG
Cashier
308 April 2001
� Transaction cancellation quota
� Line cancellation quota
� Immediate cancellation quota
� Scanning rate
� Value of transaction cancellations
� Value of immediate cancellations
� Value of line cancellations
� Value of terminations
� Value of scan articles
� Value check > limit
� Value of merchandise group sales
� Value of terminations
� Logon time
� Number of times cash drawer was opened
� Number of conditions
� Number of incorrect logons
� Number of items
� Sales rtlT
� Sales rtl
� Register time
� Bank sales
� Sales removed
� Number of reports

SAP AG Components of the Logistics Information System (LIS)
Sales As Per Receipts
April 2001 309
Sales As Per ReceiptsThe standard analysis of sales based on receipts is based on data that is updated to theinformation structure S120.
Characteristics� Site
� POS group
� POS number
� Transaction number
� Article
� EAN/UPC code
� Condition type
� Operation
� Condition number
Further Selection CriteriaFor more information, see Further Selection Criteria [Page 333]
� Promotion number
� Merchandise category
� Hour of sale
� Payment method
� Customer
� Sales organization
� Distribution channel
� Sales district
� Payment card number
� Payment card type
� Cashier name
� Cashier number
� Sales group
� Vendor number
Components of the Logistics Information System (LIS) SAP AG
Sales As Per Receipts
310 April 2001
Key Figures� Number of transaction items
� Number of transactions
� Average sales per transaction
� Average number of items per transaction
� Price difference POS
� Price reduction (total)
� Sales (cost, quantity, rtlT, rtl)
� Sales margin (with/without tax)
� Number of conditions
� Commission amount
� Sales per means of payment

SAP AG Components of the Logistics Information System (LIS)
POS Balancing
April 2001 311
POS BalancingThe POS Balancing standard analysis is based on data in the information structure S122.
Characteristics� Site
� Cashier number
� POS number
� POS group
� Condition type
� Operation
Further Selection CriteriaFor more information, see Further Selection Criteria [Page 333]
� Cashier name
� Condition type ID
� Sales district
� Sales organization
� Distribution channel
Key Figures� Cashier:
� Sales (rtlT, rtl)
� Number of receipts
� Number of items
� Number of conditions
� Price difference POS
� Price reduction (total)
� Receipt:
� Sales (rtlT, rtl)
� Number of receipts
� Number of items
� Number of conditions
� Price difference POS

Components of the Logistics Information System (LIS) SAP AG
POS Balancing
312 April 2001
� Price reduction (total)
� Difference:
� Sales (rtlT, rtl)
� Number of receipts
� Number of items
� Number of conditions
� Price difference POS
� Price reduction (total)
� Actual POS amount
� Absolute POS difference
� POS difference negative
� POS difference positive
� Sales by means of payment

SAP AG Components of the Logistics Information System (LIS)
Receipt
April 2001 313
ReceiptCharacteristics� Transaction number
� Site
� Sales promotion ID
� Calendar week
� Weekday
� Time of day class
� Hour of sale
Further Selection CriteriaFor more information, see Further Selection Criteria [Page 333]
� Customer ID
� Customer
� Card number
� Time
� Month
� Quarter
� Year
Key Figures� Sales (quantity/value)
� Total value of sales
� Price reduction (total)
� Number of transactions
� Number of items
� Number of merchandise categories
� Number of sales promotion items
� Number of known customers
� Number of anonymous customers (with card)
� Number of anonymous customers (without card)
� Average price

Components of the Logistics Information System (LIS) SAP AG
Receipt
314 April 2001
� Average price reduction
� Average number of items
� Average number of merchandise categories
� Proportion of promotion sales
� Usage intensity
� Average transaction sales
� Scanning rate
� Proportion of known customers
� Proportion of anonymous customers (with card)
� Proportion of anonymous customers (without card)
SAP AG Components of the Logistics Information System (LIS)
Receipt/Article
April 2001 315
Receipt/ArticleThe standard analysis is based on the information structure S117.
CharacteristicsTransaction number
Site
Merchandise category
Article
Sales promotion ID
Calendar week
Weekday
Time of day class
Hour of sale
Further Selection CriteriaFor more information, see Further Selection Criteria [Page 333]
Article category
Article type
Price band
Season category
Season year
General configurable article
Article short text
Promotion
Promotion category
Promotion theme
Catalog
Customer ID
Customer
Credit card number
Month
Quarter
Year
Time

Components of the Logistics Information System (LIS) SAP AG
Receipt/Article
316 April 2001
Key FiguresSales (quantity/value)
Price reduction (total)
Number of items
Number of sales promotion items
Average price
Average price reduction
Proportion of promotion sales

SAP AG Components of the Logistics Information System (LIS)
Open-To-Buy
April 2001 317
Open-To-BuyThe open-to-buy analysis is based on data in information structure S110. In addition to updatedactual figures, planning figures from flexible planning can also be included in this standardanalysis
CharacteristicsSeason
Purchasing organization
Sales organization
Distribution channel
Merchandise category 2
Merchandise category 1
Merchandise category
Price band category
Site
The information structure S110 contains the characteristics Season and Price bandin the characteristics section. The system writes ‘dummy values’ to the informationstructure for those articles that are not assigned to a season or price band in thearticle master.
Key Figures
Key Figure Comment
Sales volume As a planned figure and updated actual figure
Price reduction As an updated actual figure
Closing stock As a planned figure and a calculated actualfigure
Inventory difference As a planned figure and an updated actualfigure
Markdown As a planned figure and an updated actualfigure
Total budget Calculated from the planned figures
Pre-order quota As a planned figure
Pre-order budget Calculated from the planned figures
Reserve budget Calculated from the planned figures

Components of the Logistics Information System (LIS) SAP AG
Open-To-Buy
318 April 2001
Outstanding order volume (vendor) As an updated actual figure
Outstanding stock transfer order volume(receiving site)
As an updated actual figure
Outstanding stock transfer order volume(delivering site)
As an updated actual figure
Receipts As an updated actual figure
Issues As an updated actual figure
OTB relating to the total budget (OTB_T) Calculated from planned and actual figures
OTB relating to the pre-order budget(OTB_P)
Calculated from planned and actual figures
Average price band price Imported from an external table

SAP AG Components of the Logistics Information System (LIS)
Perishables
April 2001 319
PerishablesThis standard analysis is based on data that is updated to information structure S160.
CharacteristicsPurchasing group
Site
Site category
Vendor
Merchandise category
General configurable article
Article
Further Selection CriteriaSales department
Characteristic 1
Characteristic 2
Characteristic 3
Key FiguresOrder volume (cost, quantity, rtlT, rtl)
Goods receipt (cost, quantity, rtlT, rtl)
Returns (cost, quantity, rtlT, rtl)
Stock transport order (cost, quantity, rtlT, rtl)
Stock transport order 2 (cost, quantity, rtlT, rtl)
Goods issue: distribution center (cost, quantity, rtlT, rtl)
Goods receipt: distribution center (cost, quantity, rtlT, rtl)
Goods clearing: issue (cost, quantity, rtlT, rtl)
Goods clearing: receipt (cost, quantity, rtlT, rtl)
Stock adjustment: miscellaneous (cost, quantity, rtlT, rtl)
Sales orders (cost, quantity, rtlT, rtl)
Deliveries (quantity)
Sales (cost, quantity, rtlT, rtl)
Sales deviation
Purchase order margin (with tax, without tax)

Components of the Logistics Information System (LIS) SAP AG
Perishables
320 April 2001
Stock transport order margin (with tax, without tax)
Goods receipt margin (with tax, without tax)
Sales margin (with tax, without tax)
Sales order margin (with tax, without tax)
See also:
Characteristics and Key Figures: Retail Information System [Page 290]

SAP AG Components of the Logistics Information System (LIS)
Physical Inventory
April 2001 321
Physical InventoryThis standard analysis is based on data that is updated to information structure S200.
CharacteristicsPhysical inventory number
Site
Storage location
Merchandise category
Article
Batch
Special stock
Stock type
Status of inventory
Further Selection CriteriaGeneral configurable article
Site category
Sales department
Value-only article - key figure
Key FiguresBook inventory balance (cost, quantity, rtlT, rtl)
Counted stock (cost, quantity, rtlT, rtl)
Inventory difference - (cost, quantity, rtlT, rtl)
Inventory difference + (cost, quantity, rtlT, rtl)
See also:
Characteristics and Key Figures: Retail Information System [Page 290]
Components of the Logistics Information System (LIS) SAP AG
Additionals
322 April 2001
AdditionalsThe Additionals standard analysis is based on data in information structure S108.
CharacteristicsSite
Site ID
Vendor
Customer
Merchandise category
General configurable material
Article
Application
Further Selection CriteriaFor more information, see Further Selection Criteria [Page 333]
Additional 1
Additional 2
Additional 3
Key FiguresAdditional (quantity, number, cost, rtlT, rtl)
Processing time
Base costs (material costs)
Labor costs
Proportion of additionals costs in cost
Average number of additionals
Total cost of additionals
Margin with regard to additionals
Margin without regard to additionals
SAP AG Components of the Logistics Information System (LIS)
Rough Workload Preview: General Overview
April 2001 323
Rough Workload Preview: General OverviewThis standard analysis is based on data that is updated to information structure S150.
CharacteristicsDay on which workload is expected
Warehouse number
Warehouse process
Goods category (normal or promotional merchandise)
Document category (purchase order, sales order, delivery, stock transport order andcorresponding returns)
Unit of measure load category
Shipping material type (only when customer enhancement exists)
Time slot (only when customer enhancement exists)
Key FiguresQuantity
Increase
Reduction
Delta
Weight
Increase
Reduction
Delta
Volume
Increase
Reduction
Delta
Processing time
Increase
Reduction
Delta
Number of Document Items/Schedule Lines
Increase
Reduction

Components of the Logistics Information System (LIS) SAP AG
Rough Workload Preview: General Overview
324 April 2001
Delta
Shipping Material
Increase
Reduction
Delta
See also:Characteristics and Key Figures: Retail Information System [Page 290]

SAP AG Components of the Logistics Information System (LIS)
Rough Workload Estimate: Goods Receipt/Put Away
April 2001 325
Rough Workload Estimate: Goods Receipt/Put AwayThis standard analysis is based on data that is updated to information structure S150.
CharacteristicsDay on which workload is expected
Warehouse number
Warehouse process
Goods category (normal or promotional merchandise)
Document category (purchase order, sales order, delivery, stock transport order andcorresponding returns)
Unit of measure load category
Shipping material type (only when customer enhancement exists)
Time slot (only when customer enhancement exists)
Key FiguresQuantity - increase
Quantity - reduction
Quantity - delta
Weight - increase
Weight - reduction
Weight - delta
Volume - increase
Volume - reduction
Volume - delta
Processing time - increase
Processing time - reduction
Processing time - delta
Number of document items/schedule lines - increase
Number of document items/schedule lines - reduction
Number of document items/schedule lines - delta
Shipping material - increase
Shipping material - reduction
Shipping material - delta

Components of the Logistics Information System (LIS) SAP AG
Rough Workload Estimate: Goods Receipt/Put Away
326 April 2001
See also:
Characteristics and Key Figures: Retail Information System [Page 290]
SAP AG Components of the Logistics Information System (LIS)
Rough Workload Estimate: Customer/Store Returns
April 2001 327
Rough Workload Estimate: Customer/Store ReturnsThis standard analysis is based on data that is updated to information structure S150.
CharacteristicsDay on which workload is expected
Warehouse number
Warehouse process
Goods category (normal or promotional merchandise)
Document category (purchase order, sales order, delivery, stock transport order and correspondingreturns)
Unit of measure load category
Shipping material type (only when customer enhancement exists)
Time slot (only when customer enhancement exists)
Key FiguresQuantity
Increase
Reduction
Delta
Weight
Increase
Reduction
Delta
Volume
Increase
Reduction
Delta
Processing time
Increase
Reduction
Delta
Number of Document Items/Schedule Lines
Increase
Reduction

Components of the Logistics Information System (LIS) SAP AG
Rough Workload Estimate: Customer/Store Returns
328 April 2001
Delta
Shipping Material
Increase
Reduction
Delta
See also:Characteristics and Key Figures: Retail Information System [Page 290]

SAP AG Components of the Logistics Information System (LIS)
Rough Workload Preview: Picking/Goods Issue
April 2001 329
Rough Workload Preview: Picking/Goods IssueThis standard analysis is based on data that is updated to information structure S152.
CharacteristicsDay on which workload is expected
Warehouse number
Warehouse process
Goods category (normal or promotional merchandise)
Document category (purchase order, sales order, delivery, stock transport order andcorresponding returns)
Unit of measure load category
Shipping material type (only when customer enhancement exists)
Time slot (only when customer enhancement exists)
Planned storage type
Planned picking area
Delivery priority
Key FiguresQuantity
Increase
Reduction
Delta
Weight
Increase
Reduction
Delta
Volume
Increase
Reduction
Delta
Processing time
Increase
Reduction
Delta
Number of Document Items/Schedule Lines
Components of the Logistics Information System (LIS) SAP AG
Rough Workload Preview: Picking/Goods Issue
330 April 2001
Increase
Reduction
Delta
Shipping Material
Increase
Reduction
Delta
See also:Characteristics and Key Figures: Retail Information System [Page 290]
SAP AG Components of the Logistics Information System (LIS)
Rough Workload Preview: Vendor Returns
April 2001 331
Rough Workload Preview: Vendor ReturnsThis standard analysis is based on data that is updated to information structure S152.
CharacteristicsDay on which workload is expected
Warehouse number
Warehouse process
Goods category (normal or promotional merchandise)
Document category (purchase order, sales order, delivery, stock transport order andcorresponding returns)
Unit of measure load category
Shipping material type (only when customer enhancement exists)
Time slot (only when customer enhancement exists)
Planned storage type
Planned picking area
Delivery priority
Key FiguresQuantity
Increase
Reduction
Delta
Weight
Increase
Reduction
Delta
Volume
Increase
Reduction
Delta
Processing time
Increase
Reduction
Delta

Components of the Logistics Information System (LIS) SAP AG
Rough Workload Preview: Vendor Returns
332 April 2001
Number of Document Items/Schedule Lines
Increase
Reduction
Delta
Shipping Material
Increase
Reduction
Delta
See also:Characteristics and Key Figures: Retail Information System [Page 290]
SAP AG Components of the Logistics Information System (LIS)
Further Selection Criteria
April 2001 333
Further Selection CriteriaIn LIS it is possible to add additional selection and drill-down parameters to the characteristicsection of the information structures (a maximum of nine characteristics). If a standard analysis isbased on an information structure that makes use of this function, you will see additionalselection criteria in the standard analysis selection screen.
This allows you to gain additional information about the characteristics in the informationstructure during the standard analysis. For example, you restrict your selection to characteristicswith specific criteria, such as articles with the color red, or articles with a specific fashionindicator.

Components of the Logistics Information System (LIS) SAP AG
Abbreviations
334 April 2001
AbbreviationsAbbreviation Definition
No.Tr. Number of transactions
BUn Base unit of measure
CP Cost price
Cost with tax Cost price with tax
Cost Cost price without tax
MAP Moving average price
GMROI Gross margin return on inventory investment
ID Inventory difference
STRPS Short-term retail profitability statement
Margin with tax Margin with tax
Margin Margin without tax
Tax Tax
OTB Open-To-Buy
POS Point of sale (POS)
RIS Retail Information System
Rtl Retail price
RtlT Retail price with tax
Rtl Retail price without tax
DC Distribution center
GI Goods issue
GR Goods receipt
See also:How Key Figures Are Calculated [Page 335]
SAP AG Components of the Logistics Information System (LIS)
How Key Figures are Calculated
April 2001 335
How Key Figures are CalculatedThis section contains information about how key figures are calculated in the Retail InformationSystem. In this section, the key figures are divided into the following categories:
Key Figures: Purchasing [Page 336]
Key Figures: Subsequent Settlement [Page 338]
Key Figures: Inventory Management [Page 346]
Key Figures: Sales and Distribution [Page 350]
Key Figures: Sales Audit (POS Statistics) [Page 354]
Key Figures: Market-Basket Analysis [Page 358]
Key Figures Calculated at Runtime [Page 360]
Key Figures: Physical Inventory [Page 364]
Key Figures: Additionals [Page 365]
Key Figures: Rough Workload Estimate [Page 366]
Key Figures: Planning of Open to Buy (Open-to-Buy) [Page 368]
Information on the key figures is also available via the F1 Help key, directly in thesystem. You can call up the F1 Help in the standard analyses in all of the key figuresin the initial or drill-down lists. You can also call up the F1 Help for key figures in thescreens All key figures or Select key figures for each key figure.
For more information on the abbreviations used, see Abbreviations [Page 334].
Components of the Logistics Information System (LIS) SAP AG
Key Figures: Purchasing
336 April 2001
Key Figures: PurchasingOrder VolumeOrder volume comprises all orders in Purchasing involving external vendors. The periodallocation is usually based on the purchase order date.
This key figure is displayed in a variety of versions (quantity, cost, rtlT, rtl, number oftransactions).
Stock transport orders (internal orders) are not included in the key figure. In the case of cross-company code stock transport orders, the site that issues the stock is updated as the vendor.
Order Stock: IssuesThis key figure basically shows the goods receipts resulting from purchase orders involvingexternal vendors.
Updating takes place on the delivery date of the respective purchase order.
This key figure is displayed in a variety of versions (number, quantity, cost, rtlT, rtl).
The issue of order stock causes the open order stock to be reduced. Internal goods receipts dueto stock transfers are not taken into account.
Order Stock: ReceiptsReceipts of purchase orders from external vendors.
This key figure is displayed in a variety of versions (number, quantity, cost, rtlT, rtl).
Updating takes place in accordance with the delivery date.
The receipt of order stock causes the open order stock to increase.Internal orders (for example, stock transfer orders) are not taken into account.
Original Retail PriceThe original retail price is the retail price of an article (including tax) at the time of the firstpurchase order or the first receipt/issue in the respective store. This retail price does not changeagain.
The original sales price is calculated from the sales price of the goods received or the purchaseorder divided by the quantity. The key figure value for the retail price always includes tax.
Note that in the standard analyses, a store and an article need to be specified for thiskey figure.
This key figure is included in the calculation of the key figures “fictitious stock” and “fictitioussales”.
Stock Transport OrderThis key figure represents the order volume that consists of all the purchase orders of one site(usually a store) at other sites.
Updating of this key figure is based on a stock transport order.

SAP AG Components of the Logistics Information System (LIS)
Key Figures: Purchasing
April 2001 337
Here, the ordering site and the supplying site (usually a distribution center) are both sites in thesame company code.
This key figure is expressed on terms of the following: number of transactions, cost, quantity inBUn, rtl, rtlT, volume, weight.
The key figure “stock transport order 2” is, as a rule (see information structure S160"Perishables"), updated in parallel to this key figure and represents the transaction from theperspective of the supplying site.
Stock Transport Order 2 (Supplying Site View)This key figure represents the order volume that consists of all the purchase orders of sites atone site (usually a distribution center).
Updating of this key figure is based on a stock transport order. Here, the ordering sites(distribution center, store) and the supplying site are all sites in one company code.
This key figure is expressed in terms of the following: number of transactions, cost, quantity inBUn, rtl, rtlT, volume, weight.
The key figure “stock transport order” is, as a rule (see information structure S160 "Perishables"),updated in parallel to this key figure and represents the transaction from the perspective of theordering site.
See also:How Key Figures Are Calculated [Page 335]

Components of the Logistics Information System (LIS) SAP AG
Key Figures: Subsequent Settlement
338 April 2001
Key Figures: Subsequent SettlementThis section contains information about how the key figures of the subsequent settlementanalysis are calculated.
There are conditions that vendors grant retailers, for example, for:
The purchase of goods
Punctual payment of vendor invoices
Running promotions
Contribution to the costs incurred in retail (for example, disposal costs)
There are two types of conditions: conditions requiring immediate settlement and conditionsrequiring subsequent settlement. Conditions requiring immediate settlement are taken intoconsideration directly with the vendor invoices or when these invoices are settled and aretherefore not part of the subsequent settlement. Conditions requiring subsequent settlement(indicated as subsequent settlement) are to be subsequently settled with the vendor.
The key figures of the subsequent settlement standard analysis are updated to the informationstructure S015 when an invoice is received for a purchase order (vendor business volume) orwhen an arrangement is subsequently settled (income) by credit memo/billing document.
The key figures for subsequent settlement are divided into two groups as follows:
Subsequent Settlement: Amounts [Page 343]
Quantities [Page 341]
See also:How Key Figures Are Calculated [Page 335]
SAP AG Components of the Logistics Information System (LIS)
Income Fin. Settlemt / Cond. Rec'd / Totl Income Cond. Rec'd
April 2001 339
Income Fin. Settlemt / Cond. Rec'd / Totl Income Cond.Rec'dAn arrangement is valid from 01.01 to 31.12.
Two different scenarios are possible:
The arrangement is settled once only.If the arrangement is subject to once-only settlement, you can, for example, agree on acondition stipulating a rebate of 3%. If the vendor business volume amounts to $100,000,this would result in an income of $3,000, which is updated to the key figure “conditionrecord income”. There is no final settlement income in this case, therefore the key figure“final settlement income” is not updated.
The arrangement is settled periodically.If the arrangement is settled periodically, (e.g. on a quarterly basis), you can, forexample, agree on a condition stipulating a rebate of 3%. The income for the periods isupdated to the key figure “condition record income”:
1. quarter: vendor business volume $20,000 --> condition record income: $600
2. quarter: vendor business volume $30,000 --> condition record income: $900
3. quarter: vendor business volume $20,000 --> condition record income: $600
4. quarter: vendor business volume $30,000 --> condition record income: $900
For final settlement, you agree a condition of 5% as of $75,000 annual sales.
$3 000 have already been paid out. The “final settlement income” therefore amounts to$2,000:
Final settlement income: $100 000 * 0,05 = $5 000 - $3 000 = $2 000The first quarter yields a proportionate income of $400, which is updated to the key figure“final settlement income” and is allocated to the respective period. This proportionateincome is calculated as follows:
1. 1st quarter “Final settlement income”:
Final Settlement Income
------------------------------ * Business volume for 1st quarter=
Total business volume
$2,000
----------------- * $20,000 = $400$100,000
The key figure “Total income from the condition record” for the first quarter is the sum ofthe condition record income (interim settlement) and the proportionate income from thefinal settlement (1st quarter final settlement income). Therefore, in the above example:
Total income condition record (1st quarter): $600 + $400 = $1000
Components of the Logistics Information System (LIS) SAP AG
Income Fin. Settlemt / Cond. Rec'd / Totl Income Cond. Rec'd
340 April 2001
Here the key figures are also updated at the level of the months involved, so that youcan analyze the key figures on a monthly basis. This means that all income for thefirst quarter is divided up further over the months January, February, and March.

SAP AG Components of the Logistics Information System (LIS)
Subsequent Settlement: Quantities
April 2001 341
Subsequent Settlement: QuantitiesThe key figures described below refer to the condition record for the order item. The order itemmust be relevant for subsequent settlement for these key figures to be updated. This is controlledby the corresponding indicator in the vendor master, in the purchasing info record or in thepurchase order item.
In the standard system, these key figures are updated to the information structure S015 uponinvoice receipt on the document date. At the same time, the data is allocated to the respectivecondition record. This means that the data is available for the condition record, and can also beanalyzed on a monthly basis (for arrangements settled on a quarterly basis, for example). Inorder for updating to take place, it must be possible to determine a condition record of thearrangement in Subsequent Settlement during price determination (purchase order or goodsreceipt).
Note that for arrangements that are settled periodically, data is determined for therespective condition record (period) that is valid on the document date of invoiceverification. The condition record valid at the time of invoice verification can differfrom the condition record valid during price determination (purchase order or goodsreceipt).
WeightsNet weight
Net weight for the condition record (arrangement) from the purchase order items.
Gross weight
Gross weight for the condition record (arrangement) from the purchase order items.
Gross/net weight is saved in the article master or in the purchasing info record, or can be enteredmanually in the order document.
Updating of both these key figures always takes place when the reference magnitude or thecalculation rule refers to the gross or net weight. In the case of arrangements that requireperiodic settlement, the calculation rule concerned may be the calculation rule defined for finalsettlement.
Quantity of Vendor Business VolumeQuantitative business volume to the condition record (arrangement) from the order items.
This key figure is always updated when the reference magnitude or the calculation rule refers tothe quantity. In order for updating to take place, it must be possible to convert the quantity intothe units of measure in the condition record. In order for updating to take place, it must bepossible to convert the quantity into the units of measure in the condition record.
VolumeVolume for the condition record (arrangement) from the purchase order items.
The volume of the material is specified in the material master or in the purchasing info record, orcan be manually entered in the order document.

Components of the Logistics Information System (LIS) SAP AG
Subsequent Settlement: Quantities
342 April 2001
If the reference magnitude or the calculation rule in a condition record does not refer to thevolume, then the volume is updated for purposes of information only.
Number of PointsNumber of points for the condition record (arrangement) from the purchase order items.
The number of points of an article is saved in the purchasing info record, or can be manuallyentered in the order document.
This key figure is always updated when the reference magnitude or the calculation rule refers tothe points. For arrangements that are settled periodically, this can also be the calculation rule ofthe condition record in final settlement.

SAP AG Components of the Logistics Information System (LIS)
Subsequent Settlement: Amounts
April 2001 343
Subsequent Settlement: AmountsCondition Record IncomeAmount resulting from the settlement of the cumulative business volume relevant to the conditionrecord.
The income from arrangements that are to be settled once only and the income from interimsettlements of arrangements that are to be settled periodically are updated under this key figure.
Final Settlement IncomeIncome arising from the final settlement of an arrangement that is to be settled periodically.
This income is based on the total business volume achieved over the validity period (for example,annual business volume). Income already received from previous interim settlements are clearedin the process.
Total Income from the Condition RecordThe key figure “total income from the condition record” describes the total income derived fromthe settlements, i.e. the sum of the key figures “condition record income” and “final settlementincome” (proportion of the income from the final settlement). If no final settlement is carried out,the “total income from the condition record” is equal to the “condition record income”.
Settlement Documents and ArrangementsThe income derived from the settlements of an arrangement is updated to information structureS015 when the settlement document is updated in Financial Accounting.
Irrespective of the date of the document, the income is allocated proportionately to all datarecords in the information structure that belong to the condition record for which settlement isdue. The income due on the basis of the final settlements is distributed proportionately betweenall condition records of the various periods. In the same way, the income is divided up betweenall the characteristics in question (purchasing organization, purchasing group, merchandisecategory, plant, month).
By using two income key figures (final settlement income and condition record income) you canalways determine which proportion of the income originates from interim settlements and whichamount is a result of the final settlement (e.g. due to a higher scale level or a business volumecomparison and arrangement). You can use this information to create optimization strategies.
In Customizing under the arrangement type, you can determine whether final settlementaccounting should be carried out or not. Note the settings that you can make in Customizingunder the arrangement type:
If you have determined in Customizing under the arrangement type that the settlements of thearrangement occur only once the 'valid to' date of the arrangement has been reached, nofinal settlement will occur. Only the key figure “Income condition record” will then be updated;the key figure “Income final settlement” will not be updated in this case.
If you have specified in Customizing under the arrangement type that an arrangement should besettled periodically, then only the key figure “condition record income” is updated using theinterim settlement data of the arrangement (settlement accounting of the condition recordsfor the various periods).
Examples [Page 339]
Components of the Logistics Information System (LIS) SAP AG
Subsequent Settlement: Amounts
344 April 2001
Provision for Accrued Condition Income / Dissolved Provision for AccruedCondition IncomeAs payments always occur once the validity period of the arrangement has ended, you have theoption of posting provisions for accrued condition income for condition records. You first need toensure that the Provision indicator is marked in Customizing for the condition type.The provision for accrued income enables you to influence price valuation on the basis of incomethat is expected from a later settlement. The provision for accrued income reduces the effectiveprice, thus affecting the price valuation.
A purchase order of 10 articles with a unit price of 10 USD is activated.
The following has been determined for an end-of-period refund:
1 USD per piece
1.50 USD for purchases of 1000 pieces
The article can only be valuated at 9 USD per piece, as a subsequent income of atleast 1 USD per piece is expected.
When settlement takes place, the provision for accrued income is dissolved and updated to theinformation structure S015 under the key figure “dissolved provision for accrued income”.
Updating of the key figure “provision for accrued income” takes place during invoice verificationand data is updated to the information structure S015.
Vendor Business VolumeSales for the condition record (arrangement) from the purchase order items.
In order for sales to be updated to a purchase order item, this purchase order item must berelevant for Subsequent Settlement. This is controlled by the corresponding indicator in thevendor master, in the purchasing info record or in the purchase order item.
In Customizing for the arrangement type, you can specify what is to be updated as vendorbusiness volume:
The business volume from the order item (in accordance with the condition basis for the level ofthe calculation schema)
or
The net value from invoice verification
In the standard system, the vendor business volume is updated to the document date uponinvoice receipt. At the same time, the data is allocated to the respective condition record. Thismeans that the data is available for the condition record, and can also be analyzed on a monthlybasis (for arrangements settled on a quarterly basis, for example).
Note that in the case of arrangements that are settled periodically, data isdetermined for the respective condition record (period) that is valid on the documentdate of invoice verification. The condition record valid at the time of invoiceverification can differ from the condition record valid during price determination(purchase order or goods receipt).

SAP AG Components of the Logistics Information System (LIS)
Subsequent Settlement: Amounts
April 2001 345

Components of the Logistics Information System (LIS) SAP AG
Key Figures: Inventory Management
346 April 2001
Key Figures: Inventory ManagementStockThe stock that is available on a particular key date.
The valuated stock is established, that is, stock categories such as the vendor consignment stockare not contained in this key figure.
The stock is balanced on a higher aggregation level.
This key figure is displayed in a variety of versions (cost, rtlT, rtl, number of transactions).
Goods Receipt from External VendorsGoods receipt that refers to a purchase order for an external vendor.
The system automatically proposes this key figure for goods receipts for which no purchase orderexists, but which are posted under Goods receipts Miscellaneous and for which a vendor hasbeen entered. This is also valid when transferring stock from vendor consignment stock tounrestricted-use stock.
The system also proposes this key figure for goods receipt posting of cross-company codepurchase orders.
Updating is performed on the basis of the posting date.
This key figure is displayed in a variety of versions in the standard analyses (quantity, cost, rtlT,rtl, number of transactions).
This key figure is calculated in differently in the RIS and Purchasing Information System(PURCHIS). In PURCHIS, only goods receipts based on purchase orders from the Purchasingapplication are updated as goods receipts.
If the vendor is known at the time of goods receipt, this goods receipt is automaticallyproposed for this vendor during updating. In order to ensure consistent inventorymanagement, receipt of stock is automatically attributed to the regular vendor.
Returns (to External Vendors)Returns from a store or a distribution center to an external vendor. Updating is performed on theposting date in the standard system.
This key figure is displayed in a variety of versions (quantity, cost, rtlT, rtl, number oftransactions).
Returns are updated in the standard system for the vendor, and the resulting issuesor inventory update is performed for the regular vendor in order to ensure consistentinventory management.
SAP AG Components of the Logistics Information System (LIS)
Key Figures: Inventory Management
April 2001 347
Stock TransfersGoods Issue/Receipt from Distribution CenterThis key figure contains all goods receipts and issues originating from a distribution center. Nodistinction is made between the different types of goods movement (sorting of storage section,assignment to distribution center, transit goods receipts). In contrast to the merchandisingclearing, this refers to planned stock transfers between sites.
Goods receipts and issues are caused by the following business transactions:
Receipt of transit goods intended for another site
Regular requirements from sites (for example, automatic subsequent buying)
Special requirements from sites (for example, MDE subsequent claims)
Assignments to sites from the distribution center (planned and unplanned)
Goods receipts in a store differ from the goods receipts of external vendors in that the supplyingplant is a distribution center.
Goods issues and goods receipts postings from the distribution center automatically trigger agoods receipt and goods issue posting. Updating is performed on the basis of the posting date.The key figure is displayed in a variety of ways: number of transactions, cost, rtlT, rtl, quantity.
Merchandise Clearing (Goods Receipt/Issue)Merchandise clearing is the unplanned moving of articles from one store to another, or to adistribution center. The key figure offers a overview of logistical "incorrect estimates" within anarea of responsibility.
This movement causes two stock changes:
Reduction in the stores returning goods (merchandise clearing: goods issue)
Increase in the sites receiving goods (merchandise clearing: goods receipt)
This key figure is displayed in a variety of versions (quantity, cost, rtlT, rtl, number oftransactions) and updated at the posting date.
Article Transfer PostingTransfer posting refers to the unplanned movement of merchandise within a site. Two articles arealways affected by a transfer posting. Article transfer postings may be necessary whenassortment transfer postings are performed. For example, a six-pack of beer may be opened,because the articles are to be sold separately.
Article transfer postings are divided into two categories according to whether they are:
Receipt (inward movement of an article)
Issue (outward movement of an article)
This key figure is displayed in a variety of versions (quantity, cost, rtlT, rtl, number) and updatedfor the posting date.
An article transfer posting always results in a receipt and an issue posting.
Stock AdjustmentStock adjustments are adjustments within a site with reference to an article. There are two typesof stock adjustments:
Components of the Logistics Information System (LIS) SAP AG
Key Figures: Inventory Management
348 April 2001
Inventory differenceQuantity and value-related adjustment of the existing stock, where the reason for thisadjustment is unknown and it is therefore viewed as an inventory difference. Theadjustment can be either upwards (+) or downwards (-).
Inventory differences are updated for the posting date during physical inventorymanagement.
This key figure exists in different forms in the RIS for both positive and negative inventorydifferences (sales, rtl, rtlT, quantity, number of items).
OthersQuantity and value-related adjustment of the existing stock, where the reason for thisadjustment is known. A possible reason for such an adjustment is the breakage,spoilage, or scrapping of an article. The adjustment can be either upwards (+) ordownwards (-).
This key figure exists in different forms in the RIS for both positive and negativemiscellaneous stock adjustments (cost, rtl, rtlT, quantity, number of items).
Miscellaneous stock adjustments are updated for the posting date when you enter thegoods issue via scrapping. Note that the field Reason for adjustment must be filled with avalue, otherwise the system assigns either receipts or issues.
At the moment, it is not possible to enter values for the key figure Upward stockadjustment (miscellaneous), as a corresponding stock adjustment processing doesnot exist.
Revaluation at CostA revaluation based on a change in the cost price of an article. There are two reasons for a costprice revaluation:
Manual cost price adjustments
The cost price of the stock is revalued when a cost price is changed manually. This inturn leads to a change in the stock margin.
Caution:
The article must be valuated according to the principle of the moving average price.
If several storage locations are affected, each revaluation per storage location counts as atransaction.
Subsequent changes in cost price from invoice verification
An adjustment of the goods receipt cost price entered may take place during invoiceverification. In this way, the system determines whether the initial stock receipts andissues were too high or too low. The stock cost price, and consequently the stockmargin, are adjusted as a result of the invoice verification process. Adjustments are alsoupdated to the key figure PP revaluation.
Caution:
The article must be valuated according to the principle of the moving average price.

SAP AG Components of the Logistics Information System (LIS)
Key Figures: Inventory Management
April 2001 349
If several storage locations are affected, each revaluation per storage location counts as atransaction.
The goods receipt cost price is not adjusted, as the system cannot differentiate between manualrevaluation and revaluation from invoice verification.
Information regarding quantities is currently not possible.
If the invoice is entered before the goods receipt, neither the stocks nor the cost price revaluationare updated, as the goods receipt is then updated with the invoice conditions.
A cost price can be revalued upwards (+) or downwards (-). The cost price revaluation is issuedin different forms in the RIS for both positive and negative revaluations (number of transactions,quantity, cost, rtl, rtlT). The key figures are updated for the posting date.
Revaluation at RetailA revaluation based on changes to the retail price of an article (markdown/markup). Therevaluation is caused by manual adjustment to the retail price at the end of the season or formarketing reasons. Retail price revaluations are important control variables in retail, andinfluence both the sales margin and profit margin. This automatically leads to a change in thestock margin.
Caution:
Partial stocks can also be revalued.
A retail price revaluation can be performed so that it does not affect margins. In other words, thecost price is also adjusted accordingly.
A retail price can be revalued upwards (+) or downwards (-). The retail price revaluations canhave different values in the RIS for both positive and negative revaluations (number oftransactions, quantity, cost, rtl, rtlT). The key figures are updated for the validity date.
Stock ChangesStock changes are postings for which no particular key figure is proposed. Only the stock isaffected by this change. The key figure receipt and/or issue may be filled with a value (forexample, for a posting from unrestricted-use stock in the vendor consignment stock).
Caution:
Postings within the valuated stock do not have any effect on the stock ( for example, a posting ofunrestricted-use stock to stock in quality inspection) and is not represented in the RIS.
�Values are assigned to the key figures Receipt and Issue in the case of ineffective stockpostings within the valuated stock.
If you do not wish to falsify these key figures, you must exclude the correspondingmovement type from the statistics update.
The key figures Receipt and Issue are updated for the posting date. In the standardanalyses, the key figures are expressed in terms of the following: cost, rtlT, rtl, quantity.
See also:How Key Figures Are Calculated [Page 335]

Components of the Logistics Information System (LIS) SAP AG
Key Figures: Sales and Distribution
350 April 2001
Key Figures: Sales and DistributionSales VolumeThere are a number of ways in which data relating to sales is written to the information structuresof the Retail Information System. (For more information, see POS Interface [Page 284].)
Information structures S077-S086, S105-S106, S110, S123, S124
Sales data is written to these information structures either in aggregated form via thePOS interface by means of the billing document, or via the normal Sales and Distributionprocesses (order, delivery, billing).
Information structures for the POS interface
Sales data is written to these information structures by means of the POS interface. Nodocuments are generated here.
Sales in the Information Structures S077-S086, S105-S106, S110, S123, S124Note that the use of billing documents via the POS interface causes a stock reduction in theInventory Management interface in the SAP System.
You need to keep to an appropriate pricing schema in order for sales figures to be updatedcorrectly.
This key figure can have a number of different values (quantity, cost, rtlT, rtl).
Sales in the Information Structures for the POS InterfaceSales quantity
Quantities sold at the POS. In RIS, values for this key figure are displayed in terms of thesales unit and the base unit of measure. Here the quantity is transferred withoutchanging the POS. The quantity is always posted for a transaction item.
Sales: rtlT, rtl
Net sales including/excluding tax. The sales value without tax is calculated on the basisof the sales including tax. The sales volume is always posted for a transaction item.
Sales: cost
Sales at cost price excluding tax. The sales value is determined by the billing process.
Prerequisite :
The condition type VPRS (transfer price) must be set in the pricing procedure.
The following is true for this sales audit key figure:
If an information structure has the characteristic condition and a transaction item withtwo or more conditions, then the following special feature applies:
When drilling down the characteristic condition, the quantity is distributedproportionately between the respective conditions.
The distribution rule is as follows:
SAP AG Components of the Logistics Information System (LIS)
Key Figures: Sales and Distribution
April 2001 351
Proportional quantity = (Condition price reduction / Total price reduction) *Quantity
Average sales/transaction
Averages sales per POS transaction. The key figure is calculated by dividing the sales atcost price including tax by the number of transactions.
This key figure cannot be calculated if an article-dependent drill-down (for example,merchandise category, article, condition) or an article-dependent selection has takenplace. If you, for instance, drill down by article, the POS transaction is distributedamong the articles. This changes the view of the data, which means that the systemis unable to calculate the key figure.
Promotion SalesPromotion sales means those sales that are linked to a promotion. In RIS, the promotion sales isexpressed in terms of the following: cost, rtl, rtlT, quantity.
Sales (Absolute)The absolute sales comprises all sales to customers.
Sales are a result of POS sales or from Sales and Distribution processes. This key figureexpresses the absolute sales, that is, POS returns or credit memos from Sales and Distributiondo not reduce this key figure.
Internal sales (for example, when the distribution center delivers goods to a site) are not takeninto account.
In RIS, the absolute sales is expressed in terms of the following: cost, rtlT, rtl, quantity.
Third-Party SalesThird-party sales refer to sales resulting from third-party order processing.
This key figure expresses the balanced sales, that is, credit memos from third-party orderprocessing reduce this key figure. This key figure is expressed as a separate entity and does notincrease the actual sales involving the customer, as no delivery of goods takes place. This keyfigure has particular significance for the wholesale trade.
The third-party sales is expressed in terms of the following: cost, rtlT, rtl, quantity.
The customer orders directly from the vendor and the invoice goes to the wholesaler.The wholesaler then bills the customer. The sales from these third-party transactionsare written to the key figure ‘third-party sales’.
Sales DeviationSales deviation means the deviation in price between the price charged at the POS includingdiscounts and the price designated in the R/3 System. The price deviation is determined by thebilling process.
This key figure can only be supplied with values, if the total price deviation has been transferredto the field KZW13 in the pricing procedure. In the SAP standard system, the sales deviation can
Components of the Logistics Information System (LIS) SAP AG
Key Figures: Sales and Distribution
352 April 2001
be found in the information structures article/add-on and STRPS, and is the sum of the keyfigures ‘price reduction’ and ‘price difference’ from the information structures for the sales audit.
Third-Party OrdersOrder volumes resulting from customer orders in Sales and Distribution sales order processingthat should be processed per third-party. A third-party order exists when the customer places anorder directly with the vendor, and settlement is performed by the assigned wholesaler.
Third-party orders are expressed as a separate entity from sales orders. The allocation of periodunits is based on the entry date.
In RIS, the third-party orders are expressed in terms of the following: number of transactions,cost, rtlT, rtl, quantity.
Sales OrdersTotal sales orders resulting from purchase orders made by customers in Sales and Distributionorder processing.
Updating is performed on the basis of the entry date.
In RIS, the sales orders are expressed in terms of the following: number of transactions, cost,rtlT, rtl, quantity.
Open OrdersThe volume of sales orders is determined at regular intervals, that is, the volume of open ordersis calculated and displayed for each period.
The volume of open orders increases when a sales order is created in Sales and Distribution andis then reduced accordingly when the delivery is created.Updating takes place on the entry date.
In the standard analyses, the open orders are expressed in terms of quantity and value.
Return OrdersTotal volume of orders resulting from customer return orders from Sales and Distributionprocessing.
Updating is performed on the basis of the entry date.
In the standard analyses, the return orders are expressed in terms of the following: number oftransactions, cost, rtlT, rtl, quantity.
Credit MemosCredit memos given to the customer due to the return of goods to the point of sale or from Salesand Distribution processing.
The billing document needs to be used to carry out pricing, so that this key figure is updatedcorrectly in all its various forms. Updating takes place on the billing date.
In the standard analyses, the credit memos are expressed in terms of the following: cost, rtlT, rtl,quantity.

SAP AG Components of the Logistics Information System (LIS)
Key Figures: Sales and Distribution
April 2001 353
Credit memo deviationThe credit memo deviation shows the difference between the potential credit memos and thosecredit memos granted.
DeliveriesVolume of deliveries to the customer resulting from sales orders from Sales and Distributionprocessing.
Updating takes place on the date of goods issue. Value determination is not performed for thedelivery.
In the standard analyses, the deliveries are expressed in terms of quantity and value.
Return DeliveriesVolume of deliveries returned by customers resulting from sales orders from Sales andDistribution processing.
Updating takes place on the date of goods issue. The volume of return deliveries is expressed inbase unit of measure or as the number of delivery items. Value determination is not performedfor the return delivery.
In the standard analyses, the return deliveries are expressed in terms of quantity and value.
See also:How Key Figures Are Calculated [Page 335]
Components of the Logistics Information System (LIS) SAP AG
Key Figures: Sales Audit
354 April 2001
Key Figures: Sales AuditSales volume
Information about how the sales data in the POS interface is calculated can be foundin Key Figures: Sales and Distribution [Page 350].
Number of TransactionsNumber of transactions generated for a characteristic.
Depending on the characteristic, this key figure has varying degrees of importance:
The characteristic is article-independent
This is the case, for instance, if you display the key figure for sites or cashiers. In thiscase, the key figure represents the number of transactions generated for each store orfor each cashier.
The characteristic is material-dependent
This is the case, for instance, if you display the key figure for articles, merchandisecategories or conditions. In this case, the key figure represents the number oftransactions that contain the article, the merchandise category or the condition.
Number of Article Items per TransactionNumber of generated transaction items. Depending on the characteristics for which this keyfigure is displayed, the key figure has varying degrees of importance:
The characteristic is article-independent
This is the case, for instance, if you display the key figure for sites or transactions. Thekey figure shows the number of transaction items generated for each site or receipt.
The characteristic is article-dependent
This is the case, for instance, if you display the key figure for articles, merchandisecategories or conditions. In this case, the key figure represents the number of transactionitems in which the article, the merchandise category or the condition appear.
Average Number of Items per TransactionAverage number of items per POS transaction. This key figure is calculated during the standardanalysis.
The key figure is calculated by dividing the number of transaction items by the number oftransactions.
The system can only calculate this key figure in standard analyses which have notincluded article-dependent drill-downs or article-dependent selections.
If you drill down according to article, merchandise category or condition, then thetransaction is distributed over the articles. This changes the view of the data, whichmeans that the system is unable to calculate the key figure.

SAP AG Components of the Logistics Information System (LIS)
Key Figures: Sales Audit
April 2001 355
Average Sales per TransactionThis key figure is calculated during the standard analysis. It is derived by dividing the sales by thenumber of transactions.
The system can only calculate this key figure in standard analyses which have notincluded article-dependent drill-downs or article-dependent selections.
If you drill down according to article, merchandise category or condition, thetransaction is distributed over the articles. This changes the view of the data, whichmeans that the system is unable to calculate the key figure.
Price DifferenceDifference in price between the price charged at the POS without discount and the price stated inthe SAP System. The price difference is determined by the billing procedure.
The key figure is only calculated if:
The total price difference in the pricing schema is transferred to the field KZWI6.
The retail price revaluation profile is set to No revaluation at this site.
The billing document is saved at the same time.
Number of Scanned ArticlesNumber of article items that are created via the scanner. The value is transferred to the POS.
Number of TerminationsNumber of transactions ended by the cashier pressing the CANCEL button.
Number of Transaction CancellationsNumber of transactions canceled by the cashier. The value is transferred to the POS.
Number of Immediate CancellationsNumber of items that are canceled by the cashier using an immediate cancellation. The value istransferred to the POS.
Number of Line CancellationsNumber of lines in the transaction that are canceled by the cashier. The value is transferredunchanged to the POS.
Number of Merchandise Category Article SalesNumber of transaction items that are activated at the POS by pressing the merchandise categorybutton. The value is transferred unchanged to the POS.
POS Difference NegativeSales deficit at the POS, that is, the amount in the POS (actual POS amount) is less than theamount expected (target POS amount). The value is transferred to the POS.
Components of the Logistics Information System (LIS) SAP AG
Key Figures: Sales Audit
356 April 2001
POS Difference PositiveSales surplus, that is, the amount in the POS (actual POS amount) exceeds the expectedamount (target POS amount). The value is transferred to the POS.
Actual POS AmountActual amount in POS after it has been counted.
Target POS AmountAmount in POS according to the POS information.
Transaction Cancellation QuotaThe transaction cancellation quota shows the relationship between the number of transactioncancellations and the number of transactions.
This key figure is calculated as follows:
Transaction cancellation quota = Number of transaction cancellations /Number of transactions
The best case scenario is when the key figure equals 0.
Immediate Cancellation QuotaThis key figure shows the relationship between the number of immediate cancellations and thenumber of transaction items.
The line cancellation quota is calculated as follows:
Immediate cancellation quota= Number of immediate cancellations / Number oftransaction items
The best case scenario is when the key figure equals 0.
Line Cancellation QuotaNumber of line cancellations compared to the number of transaction items.
This key figure is calculated as follows:
Line cancellation quota = Number of line cancellations / Number oftransaction items
The best case scenario is when the key figure value equals zero.
Scanning RateProportion of the articles scanned to the sum total of articles
The key figure is calculated as follows:
Scanning rate = Number of scanned articles / Total number of articlesThe best case scenario is when the scanning rate equals 100.
Value of Transaction CancellationsValue of transaction cancellations.

SAP AG Components of the Logistics Information System (LIS)
Key Figures: Sales Audit
April 2001 357
The value is the sum of the canceled sales at retail price. The value is transferred unchanged tothe POS.
Value of Immediate CancellationsValue of the sales transactions canceled immediately at the POS.
This value is the sum of those sales which did not take place at retail price.
The value is transferred unchanged to the POS.
Value of Line CancellationsValue of the lines canceled in the transaction.
The value is the sum of the canceled sales at retail price.
The value is transferred unchanged to the POS.
Value of TerminationsValue of the sales transactions terminated at the POS.
The value, which is transferred unchanged to the POS, is the sum of those sales that did not takeplace at the retail price.
See also:How Key Figures Are Calculated [Page 335]

Components of the Logistics Information System (LIS) SAP AG
Key Figures: Market-Basket Analysis
358 April 2001
Key Figures: Market-Basket AnalysisSales quantity
Quantity sold in sales and base unit of measure
Sales value
Retail value in local currency
In the standard system, this field is the sales with tax. Should this field contain thesales without tax, you should adjust the copying method accordingly.
Price reduction (total)
Difference between the target price and the actual retail price
Number of transactions
Number of sales documents at POS
Number of items
Number of items (articles) in transaction
Number of sales promotion items
Number of items in transaction that relate to a sales promotion
Number of merchandise categories
Number of merchandise categories in the transaction
Number of known customers
Number of customers available for a customer master
Number of anonymous customers (with card)
Number of anonymous customers who have paid by credit card and for whom nocustomer master exists
Number of anonymous customers
Number of customers who cannot be identified
Average price
Calculated on the base value of the sales unit and base unit of measure
Formula: Sales (value) / Sales (quantity)
Average number of items
Formula: Number of transaction items / Number of transactions
Average number of merchandise categories
Formula: Number of merchandise categories / Number of transactions
Proportion of promotion sales

SAP AG Components of the Logistics Information System (LIS)
Key Figures: Market-Basket Analysis
April 2001 359
Formula: Number of promotion items / Total number of items
Usage intensity
Is determined according to the base value of the sales unit and base unit of measure
Formula: Quantity / Number of transactions
Average transaction sales
Formula: Sales (value) / Number of transactions
Scanning rate
Formula: 100 x Number of known customers / Number of transactions
Proportion of anonymous customers (with card)
Formula: 100 x Number of anonymous customers (with card) / Number of transactions
Proportion of anonymous customers
Formula: 100 x Number of anonymous customers / Number of transactions
See also:How Key Figures Are Calculated: Retail Information System [Page 335]
Components of the Logistics Information System (LIS) SAP AG
Key Figures Calculated at Runtime
360 April 2001
Key Figures Calculated at RuntimeThe key figures that are described below are calculated when executing the standard analysesand are therefore not saved in any information structure.
MarginsA margin is the percentage difference between the retail and cost prices, in relation to the salesvalue.
The margin is calculated as follows:
Margin in % = 100 *(Sales value - purchasing value)/ Sales value
The following margins can be evaluated in the Retail Information System:
Order margin
On-order stock margin
Goods receipt margin
Sales margin
Promotion sales margin
Stock margin
Sales order margin
Third-party order margin
Third-party sales margin
Stock transfer margin
Transport order margin
The margin always has two values:
Margin with tax
The retail price with tax is used to calculate this margin.
Margin without tax
The retail price without tax is used to calculate this margin.
Range of CoverageThe range of coverage shows the stock left at the end of the period selected compared to theaverage issues in that period. It is calculated as follows:
Range of coverage in days = stock at end of period selected/ average issues inperiod selected
The average issues are calculated as follows:
Average issues = (Sales + DC goods receipt) / Number of days in period selected

SAP AG Components of the Logistics Information System (LIS)
Key Figures Calculated at Runtime
April 2001 361
In RIS, the range of coverage is calculated on the basis of the quantity and value(retail price with tax).
Inventory TurnThe inventory turn is calculated from the quotient of the sum of the issues in the period selectedand the average stock in the period selected.
Inventory turn = sum of issues in period selected / average stock in periodselected
The issues are calculated as follows:
Issues = Sales + Goods issues from DC
The average stock is calculated as follows:
Average stock = Total of closing stocks / Number of selection periods
In RIS, the inventory turn is calculated on the basis of the quantity and value (retailprice with tax).
Annual Inventory TurnThe annual inventory turn is calculated as follows:
Annual inventory turn = (Inventory turn x Number of periods in calendar year) /Number of selected periods
If you choose a year as your selection period, then the inventory turn is identical to the annualinventory turn.
The annual inventory turn is calculated on the basis of the quantity and value (retailprice with tax).
GMROI (Gross Margin Return on Investment)The GMROI key figure represents the relationship between the value-based annual inventoryturn and the issue margin achieved:
GMROI = (Annual inventory turn on a value basis x Issues margin) / 100The issues are calculated as follows:
Issues = Sales + Goods issues from DC
This key figure aids the weighting of the inventory turn and margin of an article and helps you toascertain that the article is not necessarily successful, despite the high margin achieved, if only aminimal annual inventory turn is reached.

Components of the Logistics Information System (LIS) SAP AG
Key Figures Calculated at Runtime
362 April 2001
The retail price with tax forms the basis for calculating the value-based annual inventory turn.
Number of days on saleKey figure that shows how many days an article has already been in the valuated stock of astore.
The key figure is calculated as follows:
Days on sale = Day of valuation - Date of first receiptThe receipt date is recorded when the article is first issued/received in the respective store andremains unchanged.
The highest value of the key figure “Days on sale” is displayed on aggregation levelsabove that of article.
Fictitious Sales/StockThis key figure shows what sales/stocks would have been reached if the original retail price withtax had been adhered to.
This key figure is calculated by multiplying the sales quantity/valuated stock quantity by theoriginal retail price.
The original retail price is the retail price of the first purchase order or change involving stocks inthe store in question.
Sales QuotaThis key figure is calculated as follows:
Sales quota = 100 * Issues / (Issues + Stock)The sales quota can be displayed in terms of quantity and value (retail price with tax).
The sales quota for seasonal articles is between 0% and 100%.
End of Season StockKey figure that shows what stock is available at the end of the season. The end of the season isdetermined by the end of the selection period at the start of the analysis.
Note that in analyses of the current season, the end date lies in the future.
This key figure is displayed in a variety of versions (volume, quantity, weight, cost, rtlT, rtl).
The end of season stock is calculated as follows:
End of season stock = (Stock + on-order stock) - (Issues up to end of selectionperiod)
The on-order stock is the sum of all open purchase orders involving external vendors.
SAP AG Components of the Logistics Information System (LIS)
Key Figures Calculated at Runtime
April 2001 363
The issues up to the end of the selection period are calculated as follows:
Issues to end of selection period = (Today’s date - End of selection period date) xAverage issue
The issues (Sales, GI DC) from the start of the selection period up until the evaluation date areused in the calculation of the average issue.
You can find information on other key figures that are also calculated at runtime,such as average number of transaction items per transaction, transactioncancellation quota, line cancellation quota and scanning rate in Key Figures:Sales Audit (POS Statistics) [Page 354].
See also:How Key Figures Are Calculated [Page 335]
Components of the Logistics Information System (LIS) SAP AG
Key Figures: Physical Inventory
364 April 2001
Key Figures: Physical InventoryBook Inventory BalanceThis is the stock that exists in the system at the start of the physical inventory.
This key figure is displayed in terms of the following: quantity (in base unit of measure), cost, rtlT,rtl.
Counted StockThis key figure expresses the stock that was counted during the physical inventory.
This key figure is displayed in terms of the following: quantity (in base unit of measure), cost, rtlT,rtl.
Inventory Difference -This key figure expresses the difference between the counted stock and the book inventorybalance.
A negative inventory difference occurs when the counted stock is smaller than the book inventorybalance.
This key figure is displayed in terms of the following: quantity (in base unit of measure), cost, rtlT,rtl.
Inventory Difference +This key figure expresses the difference between the book inventory balance and the countedstock.
A positive inventory difference occurs when the counted stock is larger than the book inventorybalance.
See also:How Key Figures Are Calculated [Page 335]
SAP AG Components of the Logistics Information System (LIS)
Key Figures: Additionals
April 2001 365
Key Figures: AdditionalsArticle with additionals, quantity
Article with additionals, in base unit of measure
Article with additionals, cost
Article with additionals, rtl
Article with additionals, rtlT
Article with additionals, rtl
Number of additionals
Number of additionals in base unit of measure
Processing Time
Processing time for fixing additionals
Base costs
Material costs of additionals
Labor costs
Labor costs for fixing additionals
Total costs
Formula: Base costs + labor costs
Average number of additionals
Formula: Number of additionals / Article with additional quantity
Proportion of additionals costs in costs price
Formula: 100 * total costs / Article with additionals, cost
Margin with regard to additionals
Formula: 100 * (Article with additionals, cost – Article with additionals, rtl) / Article withadditionals, rtl
Margin without regard to additionals
Formula: 100 * (Article with additionals, cost – Article with additionals, rtl - total costs) /Article with additionals, rtl
See also:How Key Figures Are Calculated: Retail Information System [Page 335]

Components of the Logistics Information System (LIS) SAP AG
Key Figures: Rough Workload Estimate
366 April 2001
Key Figures: Rough Workload EstimateThe key figures used to analyze the workload are mostly updated from the applicationcomponents Purchasing and Sales and Distribution.
The expected workload during workload processing (for example, from goods issue up to goodsreceipt) is the key feature of this procedure.
All key figures that refer to the workload are contained in the information structures for roughworkload estimate and are expressed in terms of the following:
Increase
Creation of a purchase order
Creation of a sales order
Reduction
Goods receipt posting
Goods issue posting
Delta (calculated key figure)
Difference between increase and reduction of workload
This key figure is not updated!
QuantityWorkload in terms of quantity (increase / reduction / delta).
This key figure is to be viewed in connection with the unit-of-measure load category.
WeightWorkload in terms of weight (increase / reduction / delta).
You can set the weight unit in Customizing for rough workload estimate.
VolumeWorkload in terms of volume (increase / reduction / delta).
You can set the volume unit in Customizing for rough workload estimate.
Processing TimeWorkload in terms of processing time (increase / reduction / delta)
The processing unit is Hour. The processing time is always stored in this unit.
You can use this key figure to plan staffing levels, for example.

SAP AG Components of the Logistics Information System (LIS)
Key Figures: Rough Workload Estimate
April 2001 367
Number of Document Items/Schedule LinesWorkload in terms of the number of transactions (increase / reduction / delta)
Shipping MaterialWorkload in terms of numbers (increase / reduction / delta)
This key figure (increase, reduction) needs to be updated by means of a customer exit. You canset the unit in Customizing for rough workload estimate.
See also:How Key Figures are Calculated: Retail Information System [Page 335]

Components of the Logistics Information System (LIS) SAP AG
Key Figures: Open to Buy
368 April 2001
Key Figures: Open to BuyIn addition to updated actual figures, planned figures from flexible planning can also be includedin the open-to-buy standard analysis.
Actual FiguresOpening StockThis key figure is calculated as follows during execution of the standard analysis :
Opening stock = Opening stock of previous period + Actual receipts - Actual issues
The opening stock for the first planning period is calculated using what is known as stockinitialization. Stock initialization is performed by a report which helps to determine and establishthe opening stocks for a specific key date.
The planned opening stock is used as the initial stock at the start of planning. When the openingstock is calculated, all receipts and issues which have occurred from the start of planning up tothe current period are added to the planned opening stock.
Issues/ReceiptsFor more information on how to calculate the key figures Receipts and Issues, refer to the sectionon changes involving stocks in Key Figures: Inventory Management [Page 346].
Stock Adjustment: Inventory DifferenceFor more information on how to calculate the key figures for stock adjustment, see Key Figures:Inventory Management [Page 346].
Open Order StockFor more information on how to calculate this key figure, see Key Figures Calculated at Runtime[Page 360].
Sales/Sales DeviationFor more information on how to calculate this key figure, see Key Figures: Sales and Distribution[Page 350].
Revaluation at RetailFor more information on how to calculate this key figure, see Key Figures: InventoryManagement [Page 346].
Open Stock Transport OrdersOpen order volume in stock transport orders.
This key figure refers to the supplying plant and with reference to the ordering plant. It is updatedon the delivery date.
Planning FiguresPlanned Opening StockThe planned opening stock for each period corresponds to planned closing stock of the previousperiod. The so-called ‘stock initialization’ is used to determine the planned opening stock for the

SAP AG Components of the Logistics Information System (LIS)
Key Figures: Open to Buy
April 2001 369
first planning period. The ‘stock initialization’ is a report which helps to determine and establishthe opening stocks for a specific key date.
You can find additional information about setting stocks for Planning in the R/3 librarydocumentation in PP Sales and Operations Planning under Mass Processing �How to Set Opening Stock Levels with Mass Processing).
Planned StockPlanned closing stock per period.
Initial Purchasing Quota as %Percentage of the seasonal budget already released for purchasing. The rest of the budget isreserved for later purchases.
The seasonal budget (purchasing budget) is calculated from the following elements:
Planned sales volume
Planned stock
Planned markdowns
Planned inventory differences
This budget is subdivided into a budget already released and a reserve budget. This subdivisionis controlled by the initial purchasing quota. On the basis of the purchasing or seasonal budgetand the budget already released, the key figure ‘open-to-buy’ is calculated and expressed interms of two values (see below). In the standard analysis, the initial purchasing quota is requiredto calculate the OTB for the budget already released.
Open-To-BuyThis key figure represents the main scope of the standard analysis of the same name. It tells youwhether it is still possible to make further purchases or whether the stipulated purchasing volumehas already been reached for the respective period. The system also calculates the budget stillavailable as the difference between the planned budget and the expenditure that has alreadybeen reached.
The entire purchasing budget is made up from the partial budgets of more detailed planninglevels. It is therefore possible to specify, for example, which budget is available for eachmerchandise category, price band, store, and so on.
The total budget defined for a planning level is split into a budget that has already been releasedand a reserve budget.
The budget already released is available to buyers for future periods, while the reserve budget iswithheld to enable the organization to react to unforeseen trends in the short term.
Calculating Budgets per PeriodSeasonal budget = Planned closing stock - Planned opening stock + Planned sales
+ Planned markdowns + Planned inventory differences
Pre-order budget = Seasonal budget * Pre-order quota
Reserve budget = Seasonal budget - Pre-order budget
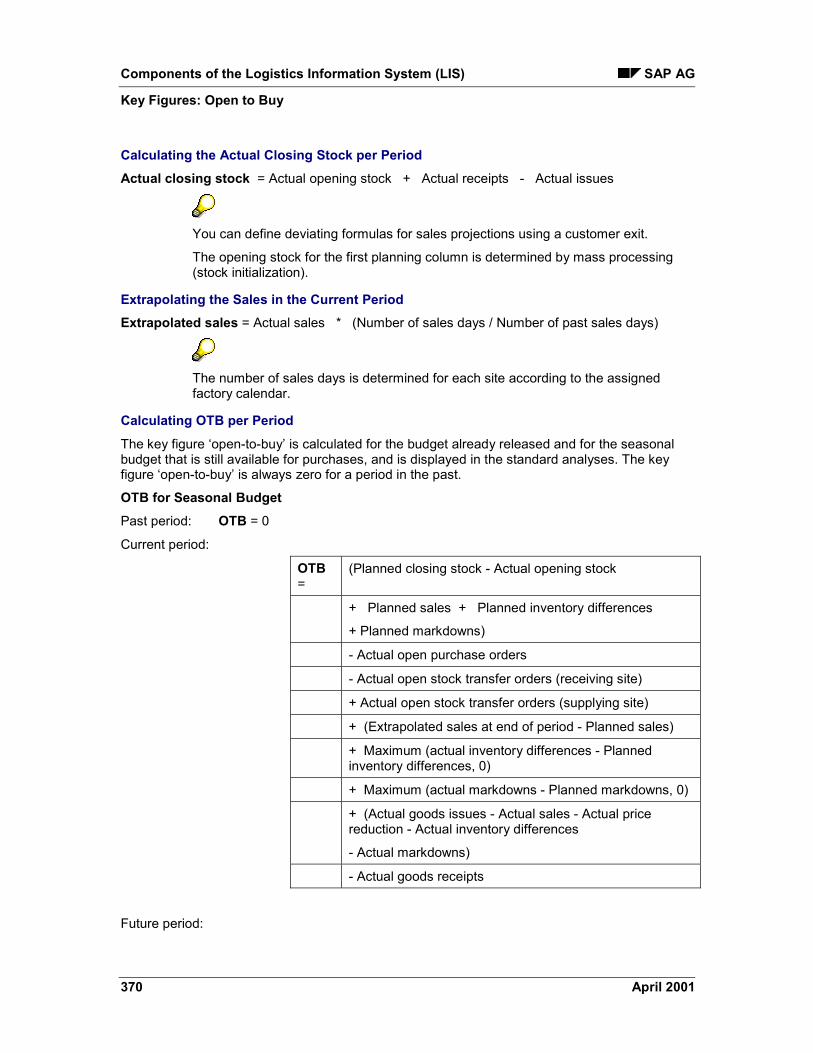
Components of the Logistics Information System (LIS) SAP AG
Key Figures: Open to Buy
370 April 2001
Calculating the Actual Closing Stock per PeriodActual closing stock = Actual opening stock + Actual receipts - Actual issues
You can define deviating formulas for sales projections using a customer exit.
The opening stock for the first planning column is determined by mass processing(stock initialization).
Extrapolating the Sales in the Current PeriodExtrapolated sales = Actual sales * (Number of sales days / Number of past sales days)
The number of sales days is determined for each site according to the assignedfactory calendar.
Calculating OTB per PeriodThe key figure ‘open-to-buy’ is calculated for the budget already released and for the seasonalbudget that is still available for purchases, and is displayed in the standard analyses. The keyfigure ‘open-to-buy’ is always zero for a period in the past.
OTB for Seasonal BudgetPast period: OTB = 0
Current period:
OTB=
(Planned closing stock - Actual opening stock
+ Planned sales + Planned inventory differences
+ Planned markdowns)
- Actual open purchase orders
- Actual open stock transfer orders (receiving site)
+ Actual open stock transfer orders (supplying site)
+ (Extrapolated sales at end of period - Planned sales)
+ Maximum (actual inventory differences - Plannedinventory differences, 0)
+ Maximum (actual markdowns - Planned markdowns, 0)
+ (Actual goods issues - Actual sales - Actual pricereduction - Actual inventory differences
- Actual markdowns)
- Actual goods receipts
Future period:

SAP AG Components of the Logistics Information System (LIS)
Key Figures: Open to Buy
April 2001 371
OTB=
(Planned closing stock - Planned opening stock
+ Planned sales + Planned inventory differences +Planned markdowns
- Actual open purchase orders
- Actual open stock transfer orders (receiving site)
+ Actual open stock transfer orders (supplying site)
OTB for Budget Already ReleasedPast period: OTB = 0
Current period:
OTB=
(Planned closing stock - Actual opening stock
+ Planned sales + Planned inventory differences
+ Planned markdowns) * Initial purchasing quota
- Actual open purchase orders
- Actual open stock transfer orders (receiving site)
+ Actual open stock transfer orders (supplying site)
+ (Extrapolated sales at end of period - Planned sales)
+ Maximum (actual inventory differences - Plannedinventory differences, 0)
+ Maximum (actual markdowns - Planned markdowns, 0)
+ (Actual goods issues - Actual sales - Actual pricereduction - Actual inventory differences
- Actual markdowns)
- Actual goods receipts
Future period:
OTB=
(Planned closing stock - Planned opening stock
+ Planned sales + Planned inventory differences +Planned markdowns)* Initial purchasing quota
- Actual open purchase orders
- Actual open stock transfer orders (receiving site)
+ Actual open stock transfer orders (supplying site)

Components of the Logistics Information System (LIS) SAP AG
Key Figures: Open to Buy
372 April 2001
The key figure OTB is calculated from planned and actual figures during the standardanalysis.
.
You can find further information about open-to-buy in the R/3 Retail Documentationin the section on the planning system under Open-To-Buy (OTB) [Ext.]
See also:How Key Figures Are Calculated [Page 335]

SAP AG Components of the Logistics Information System (LIS)
Transport Information System (TIS)
April 2001 373
Transport Information System (TIS)Information Structures: TIS [Page 374]
Update [Page 375]
Standard analysis [Page 387]
Characteristics and Key Figures [Page 389]
Note on Calculating Key Figures [Page 398]
Components of the Logistics Information System (LIS) SAP AG
Documentation not Available in Release 4.6B
374 April 2001
Documentation not Available in Release 4.6B

SAP AG Components of the Logistics Information System (LIS)
Updating: TIS
April 2001 375
Updating: TISData analysis in the Transport Information System is based on the statistical data that is updatedfrom Transport and delivery documents to the information structures.
You can read about how and when data updating is carried out in the following sections.
Events: Transport Information System [Page 376]
Updating: Transport Information System [Page 377]
Factors That Influence Updating: Transport Information System [Page 379]
Type of Updating [Page 382]
Period unit for updating: Transport Information System [Page 383]
Updating Check [Page 386]
Special Features [Page 384]
Components of the Logistics Information System (LIS) SAP AG
Events: TIS
376 April 2001
Events: TISUseThe key figures in the Transport Information System are updated during transport processing.
Data flows from the document structure to the information structures.
The transport data and delivery data are transferred to the information structures dependent onthe completion status:
The delivery data and information structures are transferred when the transport is completed.The delivery data is cleared if the completion status is reset.

SAP AG Components of the Logistics Information System (LIS)
Updating: TIS
April 2001 377
Updating: TISUseQuantities
Quantities are updated in the base unit of measure. The base unit of measure is the unitof measure in which the system manages the material stocks. It is determined in thematerial master.
Weights, volumes and distancesStatistical units must be set up in Customizing for each transportation planning point forweights, volumes, and distances.
Time periodTime period is updated in minutes and can therefore be added to easily.
Canceling/deleting documentsIf transport procedures are reversed (that is, canceled) the statistics are automaticallyadjusted to reflect this change.
Components of the Logistics Information System (LIS) SAP AG
Function Enhancements: TIS
378 April 2001
Function Enhancements: TISUseYou can use two function enhancements for key figure and customer-specific data that allow youto add to update and communication structures for the transport header (structure MCVTTKUSR)and transport sections (structure MCVTTSUSR).
The function enhancement is defined in the enhancement MCST0001.
Delivery element data for the transport are in the transport header in a compressed form(summarized information for the most important delivery elements of the transport such as “Maindelivery element”). Further key figures for delivery elements can be derived in the customerfunctions because this data is now available.
You access the function enhancements using Tools � Business Engineer � Customizing �Implem. projects � SADisplay SAP Refer. IMG � Logistics general � Logistic InformationSystem � Develop Function Enhancements � Function Enhancements - Logistics DataWarehouse � TIS: Statistics update transport documents

SAP AG Components of the Logistics Information System (LIS)
Factors That Influence Updating: TIS
April 2001 379
Factors That Influence Updating: TISUseIn addition to specifying the updating type (synchronous/asynchronous/collective update) and theperiod unit in which values are cumulated, you have other options for filtering and varying theupdating the data from transport processes.
You might require further differentiation for the following reasons:
You only want to update specific MRP statistic data or you want to update statistics in differentways dependent on the MRP.
You only want to update specific transport data statistic data or you want to update statistics indifferent ways dependent on the transport type.
You only want to update certain service agents.
The factors that influence the filtering and variation of the statistical updates are explained below.
These factors relate to:
Transport MRP
Transport type
Transport service agent

Components of the Logistics Information System (LIS) SAP AG
Statistics Groups: TIS
380 April 2001
Statistics Groups: TISUseThe "Statistics group service agents" indicator appears in the vendor master record and allowsyou to influence the statistics update with reference to master data.
The statistics group is a freely definable group key. You can group together service agents tomake a common statistics group for which the same type of updating applies. This grouping canbe used, for example, to exclude certain service agents from the updating process completely, orto make a distinction between important service agents and less important service agents.
This grouping can be done at the transport document level. You define statistics groups andassign transport types to the statistics groups.
You define statistics groups in Customizing for the Logistics Information System.
For more details, please refer to the Implementation Guide for the Logistics Information System.

SAP AG Components of the Logistics Information System (LIS)
Update Groups: TIS
April 2001 381
Update Groups: TISUseYou need to integrate the statistics group into the update control process. You can do this by theassigning an update group to the inspection lot origin. A particular type of updating is thereforeassigned to a particular business transaction.
When a transaction is updated, the statistical data is then updated in accordance with therequirements that have been assigned to it.
You can make these assignments to update groups in Customizing for the Logistics InformationSystem.
For more details, please refer to the Implementation Guide for the Logistics Information System.

Components of the Logistics Information System (LIS) SAP AG
Update Type: TIS
382 April 2001
Update Type: TISIn the LIS information systems, updating of statistical data can take place in three ways:
As a synchronous update (U1)
(Immediate start, that is when an event takes place that triggers an update)
As an asynchronous update (U2)
(Delayed start, i.e., updating is slightly delayed after an event that triggers an update).
As collective update (V3)
(Start delayed that means the update is done at done at any point after the event thattriggers the update )
You can also turn the updating process off.
If you choose the asynchronous update for the updating of statistical data, a termination of thestatistics update has no effect on the accurate update of the application document.
If you choose the synchronous update, a termination of the statistics update results in failure toupdate the document.
With Collective updates the update of the statistic data can take place anytime after thedocument update. The update of the statistics data can also be done outside of the dialog times.
A termination of the statistics update has no effect on the accurate update of the applicationdocument.
You can find further information about the updating concept in the System Administration Guide.
You can specify the type of updating for each information structure in Customizing. You need tomake the appropriate settings in Customizing for the Logistics Information System. You can finddetailed information in the Implementation Guide for the Logistics Information System.
SAP AG Components of the Logistics Information System (LIS)
Period Units in Updating: TIS
April 2001 383
Period Units in Updating: TISIn addition to the Types for Updates [Page 382] you can also define the period units that areused in the updating process.
The period unit specifies the intervals at which the statistical data is cumulated. You can choosefrom the following:
Day
Week
Month
Posting period (you may also need to specify a fiscal year variant)
You can define a period unit for every standard information structure.
The SAP default setting for the period unit in all the SIS information structures in the transportinformation system in Month.
You can now change the time period when no Is-data has been updated in theinformation structure.
You can set the period unit for the standard information structures in Customizing for theLogistics Information System. You can set the period unit for the standard information structuresin Customizing for the Logistics Information System.

Components of the Logistics Information System (LIS) SAP AG
Special Features: TIS
384 April 2001
Special Features: TISUpdating delivery dataTo avoid changing delivery data without notice by the transport information system the deliverydata is only updated when the transport has the status completed.
When this status is set the delivery can no longer be changed. This ensures that TISis using the most up-to-date delivery data.
Updating fields that are calculated in the standard analysisSome fields of the information structure are not updated. These fields are necessary to make thekey figures available at the analysis point in time. These fields are listed under Characteristicsand Key Figures [Page 389].
Real and virtual transport legsA virtual transport leg was necessary for correct processing of delivery and leg data duringupdating. Because deliveries (hierarchy level F) is linked over (hierarchy level E) on the transportheader, header related updates (updates that influence the whole transport) required a “0” thatdoes not exist in the transport document but represents the entire transport.
The leg “0” must be included when updating deliveries for the whole transport or on a leg by legbasis. Also the leg “0” must not be counted when cumulating the leg data at the header level.Under the following conditions:
Condition 200:
Delivery at the complete transport level:
The delivery data is now calculated for the whole transport. That is once for eachtransport. Example: Total weight of all deliveries in the transport.
Condition 201:
Delivery at the leg level:
The delivery data are not calculated for the whole transport that is only for all legs but notfor the virtual leg “0” (complete transport).
Example: Total weight of all deliveries on one leg.
Condition 202:
Real transport leg:
The virtual leg “0” (complete transport) is not processed.
Example: Number of legs for each transport.

SAP AG Components of the Logistics Information System (LIS)
Special Features: TIS
April 2001 385

Components of the Logistics Information System (LIS) SAP AG
Updating Check: TIS
386 April 2001
Updating Check: TISFor updating checks you can:
Having an update log displayed
Simulating the updating.
Both functions are available in Customizing for the Logistics Information System.
Update LogYou can monitor the update process by generating a log of the activities. This shows you the flowof data from the transport processes to the information structures in terms of each specific userand event.
Note that the update log is only generated for the last event that takes place. Old entries aretherefore overwritten as soon as a new event is updated.
ProcedureThis is how you configure the update log:
In the R/3 System menu, select System �� User profile �� User parameters.
In the PID field enter the parameter MCL and highlight Parameter value.
Save the entries.
To display the update log, go to the Customizing menu and select: Logistics Information System�� Logistics Data Warehouse �� Data Basis �� Updating �� Updating Control �� UpdateLog �� Display update log.
The system load increases when you display an update log. For this reason you shoulddeactivate the log generation process after successfully checking an update.
SimulationIf you wish to check the update of documents that have already been saved, due to changesyou have made in Customizing, for instance, you can generate update logs from any salesand distribution documents, without causing an update of the information structures.
In this way, you can check how a document would be updated, if the new settings inCustomizing were taken into account. You can also use this type of updating check in theproductive system without any problems.

SAP AG Components of the Logistics Information System (LIS)
Standard Analysis: TIS
April 2001 387
Standard Analysis: TISIn the transport information system, the following standard analyses are available in the SalesInformation System:
TransportThe transport analysis displays information from the transport header and delivery header. Thekey figures for the complete transport (such as distance, delivery time, weight) are updated inrelation to the transport MRP, transport type, service agent, starting point, and target point.
Transport routesUse this analysis to display information about transport routes. The key figures for the completetransport are updated in relation to the transport MRP, transport type, and service agent.
Transport methodThis analyzes the transport processes based on the main transport MRP. Key figures fordimensions and utilization of MRPs are displayed.
Transport SendThe send analysis makes evaluation of data for deliveries of transport s possible from (transportMRP, delivery type, and sending point).
Transport SectionsThis analysis allows for evaluations ate the transport leg level. The key figures for the transportsections (such as distance, delivery time, weight) are updated in relation to the transport MRP,transport type, service agent, starting point, and target point.
Transport MaterialThis analysis gives you information for the transport of certain materials.
Exception analysisYou can use the Early Warning System [Ext.] defined Displaying Exceptions [Ext.] in theexception analysis. The exception analysis acts as a filter; this means, only the exceptionalsituations are displayed. The exceptional situations can be highlighted in color.
See also:Characteristics and Key Figures: Transport Information System [Page 389]

Components of the Logistics Information System (LIS) SAP AG
Standard Analysis: TIS
388 April 2001

SAP AG Components of the Logistics Information System (LIS)
Documentation not Available in Release 4.6B
April 2001 389
Documentation not Available in Release 4.6B

Components of the Logistics Information System (LIS) SAP AG
Transport
390 April 2001
TransportCharacteristicsTransport MRP
Transport type
Service agents
Land transport start
Zone transport start
Land transport end
Zone transport end
Key FiguresTransport distance
Sum of delivery gross weight
Sum of delivery net weight
Sum of delivery volume
Number of transports
Number of transport sections
Number of same main send elements
Gross weight of the main send element
Net weight of the main send element
Net volume of the main send element
Maximum weight of the main send element
Maximum volume of the main send element
Number of deliveries
Number of packages
Sum of volume utilization of the main send element in %
Sum of weight utilization of the main send element in %
Planned loading time
Current loading time
Timed-out for the planned loading time
Planned transport duration
Current transport duration
Timed-out for the planned transport duration
Late registration

SAP AG Components of the Logistics Information System (LIS)
Transport
April 2001 391
Late loading start
Late transport start
Late transport end
Planned delivery time
Delivery duration
Planned total duration
Total duration
Further key figures that are calculated during the standard analysis:Average delay in late loading start
Average current loading duration
Average planned loading duration
Average timed-out for the planned loading time
Average delay in late registration
Average delay in late transport start
Average delay in late transport end
Average current transport duration
Average planned transport duration
Average timed-out for the planned transport duration
Average planned total duration
Average total duration
Average planned delivery time
Average delivery time
Average weight utilization in %
Average volume utilization in %
Components of the Logistics Information System (LIS) SAP AG
Documentation not Available in Release 4.6B
392 April 2001
Documentation not Available in Release 4.6B
SAP AG Components of the Logistics Information System (LIS)
Transport method
April 2001 393
Transport methodCharacteristicsTransport MRP
Transport type
Main send utilities
Transport route
Key FiguresNumber of same main send elements
Number of transports
Number of deliveries
Gross weight of the main send element
Net weight of the main send element
Start weight of the main send element
Maximum weight of the main send element
Gross volume of the main send element
Net volume of the main send element
Start volume of the main send element
Maximum volume of the main send element
Sum of weight utilization of the main send element in %
Sum of volume utilization of the main send element in %
Sum of delivery gross weight
Sum of delivery net weight
Sum of delivery volume
Transport distance
Planned loading time
Current loading time
Timed-out for the planned loading time
Planned transport length
Current transport duration
Timed-out for the planned transport duration
Further key figures that are calculated during the standard analysis:Average current loading duration

Components of the Logistics Information System (LIS) SAP AG
Transport method
394 April 2001
Average planned loading duration
Average timed-out for the planned loading time
Average current transport duration
Average planned transport duration
Average timed-out for the planned transport duration
Average weight utilization in %
Average volume utilization in %
SAP AG Components of the Logistics Information System (LIS)
Documentation not Available in Release 4.6B
April 2001 395
Documentation not Available in Release 4.6B

Components of the Logistics Information System (LIS) SAP AG
Documentation not Available in Release 4.6B
396 April 2001
Documentation not Available in Release 4.6B

SAP AG Components of the Logistics Information System (LIS)
Documentation not Available in Release 4.6B
April 2001 397
Documentation not Available in Release 4.6B

Components of the Logistics Information System (LIS) SAP AG
Note on Calculating Key Figures
398 April 2001
Note on Calculating Key FiguresYou will find out how to calculate and update the key figures in the Sales Information System inthe following sections. In some cases, the key figures could be grouped together.
Key Figures for Transports [Page 399]
Key Figures for Deliveries [Page 400]
Unit-dependent Key Figures [Page 401]
Average Key Figures [Page 402]

SAP AG Components of the Logistics Information System (LIS)
Key Figures for Transports
April 2001 399
Key Figures for TransportsYou want to differentiate between incoming and outgoing transports. Only key figures fromoutgoing transports were updated.
Components of the Logistics Information System (LIS) SAP AG
Key Figures for Deliveries
400 April 2001
Key Figures for DeliveriesDelivery key figures are updated when the transport is completed.

SAP AG Components of the Logistics Information System (LIS)
Entry-dependent Key Figures
April 2001 401
Entry-dependent Key FiguresNote that unit-dependent key figures are updated with the same units.
Key Figure Unit
Quantities Base unit of measure
Weights Statistics weight unit
Distance Statistics distance unit
Volume Statistics volume unit
Duration Minutes
The statistics weight unit, distance unit and volume unit can be specified in Customizing for eachMRP.
Components of the Logistics Information System (LIS) SAP AG
Average Key Figures
402 April 2001
Average Key FiguresThe average key figures are calculated during the standard analysis. This means that theaverage key figures are always in ZERO value in the information structure.
In addition the average key figures is calculated by dividing the number of items in the standardanalysis.
Related Documents