Received 1 JUL 0 1 2010 SJVUAPCD San Joaquin Valley Air Pollution Control District Compliance Source Test Report Panoche Energy Center Panoche Facility Turbine 1 Prepared by Aeros Environmental, Inc. Determination of Concentrations and Emissions of Particulate, NOx, CO, VOC, NH 3 , Fuel Sulfur (S0x as SO 2 ) and Relative Accuracy Test Audit (RATA) Project 280-6747A Tested May 11, 2010

Welcome message from author
This document is posted to help you gain knowledge. Please leave a comment to let me know what you think about it! Share it to your friends and learn new things together.
Transcript
Received 1JUL 0 1 2010
SJVUAPCD
San Joaquin Valley Air Pollution Control District
Compliance Source Test Report
Panoche Energy Center
Panoche FacilityTurbine 1
Prepared byAeros Environmental, Inc.
Determination of Concentrations and Emissions ofParticulate, NOx, CO, VOC, NH 3, Fuel Sulfur (S0x as SO2) and Relative
Accuracy Test Audit (RATA)
Project 280-6747A
Tested May 11, 2010
Table of Contents
I. Project Information 2
ii. Certification 3
I. SJVAPCD — Appendix G Spreadsheet 4
II. Summary of Results 9
III. Introduction 12
IV. EPA Methods 1 - 5; Particulate 14
V. Relative Accuracy 17
A. RATA Summary 18B. Reference Method (N0x/C0/02) 20C. CEM Data 30
VI. EPA Method 18; VOC 66
VII. BAAQMD Method ST-1B; Ammonia Data 69
VIII. EPA Method 19; Sulfur Emissions and Fuel Analysis 72
IX. Methodology 75
X. Raw Data 98
XI. Lab Data 116
XII. Historical Process Data (supplied by Panoche Energy Center) 120
XIII. Data Acquisition 125
XIV. Instrument Strip Charts 135
XV. VOC Chromatograms 143
XVI. Quality Assurance 147
A. Chain of Custody 148B. Meter Calibrations 152C. Instrument QA Checklist 158D. Cal Gas Certificates 164E. EPA Methods 1 - 5 Reagent and Method Blank 171F. EPA Method 18 Calibrations 176
XVII. Source Test Protocol (Partial)/Correspondence 184
Appendix; Hazardous Air Pollutants supplied by Panoche Energy Center 197
Project Information
Permit Holder: Panoche Energy Center43883 W Panoche Rd.•Firebaugh, CA 93622(559) 859-2270 Cell (559) 829-7644
Attention: Roy Campbell
Source: Turbine 1Permit No. C-7220-1-0
Independent Contractor:
Agency Administrator:
Aeros Environmental, Inc.18828 Highway 65Bakersfield, CA 93308(661) 391-0112 FAX (681) 391-0153
Attention: Mike Gray
San Joaquin Valley APCD1990 E. Gettysburg AvenueFresno, CA 93726-0244(559) 230-5951 FAX (559) 230-6062
Attention: John Copp
Page 2

Environmental Inc.
Certification
June 25, 2010
Roy CampbellPanoche Energy Center43883 W Panoche Rd.Firebaugh, CA 93622
RE: Source Test Project 280-6747APanoche FacilityTurbine 1Permit No. C-7220-1-0
Dear Roy:
I, Chase Holsonbake, as Project Supervisor and on-site director, of the testing program referredto above and described in this report, do hereby certify the sampling, analytical procedures, and resultspresented in this report are authentic . and accurate according to the methods and procedures used.
Ahase olsonbake
Regarding the source test project referred to above, I certify that I have reviewed the sampling,analytical procedures, and results reported herein, and have found them to be accurate and trueaccording to the methods and procedures used.
/ScotDavis
SJVAPCD Appendix G Spreadsheet
Effective for source tests using CARB Method 100, performed on or after August 24, 2007,SJVAPCD (District) requires each report to include a completed Appendix G spreadsheet. Thespreadsheet template is prepared and password protected by the District. Source test contractors arerequired to input; (1) certain data generated during the test and, (2) other historical source datamaintained by the source owner/operator, if applicable as determined by the source owner/operator.
This spreadsheet applies formulas and calculations to the input data and evaluates the results.Aeros Environmental, Inc. cannot certify the accuracy of the spreadsheet results or appropriateness ofthose results as they are interpreted and applied to the methodology and/or our presentation of thesource test results. Any historical data is supplied by, and its accuracy is the • responsibility of theowner/operator.
"Professional Air Emissions Testing and Analytical Services"18828 Highway 85 • Bakersfield, CA 93308
(681) 391 .0112 • (661) 391-0153 Fax
Page 3
SJVAPCDAppendix G Spreadsheet
Page 4

SJVAPCD - Appendix G
Three Run Review Sheet
DRAFT COPY - San Joaquin Valley Air Pollution Control District - Testing Contractor's CARR Method 100 Quality Assurance Worksheet
" All supporting data for this worksheet must also be clearly indicated and labeled on the emission trace chart
" A copy of a this completed worksheet Is required for every unit tested and must be included In the Summary Section of the Source Test Report
Company Name: Panoche Energy Cenb Permit Number C-7220-1-0 Il I Test Date: 5/11/2010Unit Name: Turbine 1 Average Fuel Rate MSCFD: 21530 Was muttipoint sampling required by the District policy? Yes
Select Test Type: RATA Fuel BTU/CF, dry, gross(% vet): 1014 Highest point for all pollutants above the Run 1 Cavg.%: 31.8%
Permitted MMBtu/hr. N/A Fuel Ffactor (fil 68: 8626 Lowest point for at pollutants below the Run 1 Cavg %: 23.9%
Testing Company: Aeros Environmental, Estimated Qsd DSCFM: 345978 From above does subsequent runs require muttipoint?. >10%, M100 4.5: Yes
Name of Tester: Chase Holsenbake Estimated MMI3tu/hr, firing percent : 909.64 —I OK I Is a PM or EPA Method 6 test included in this test report? Yes
2.2 Gas Analyzers 02 NOx CO SO2Limit equivalent (LE)as uncorrected ppm: 3 8Range, Limit equivalent %: 25 10 34% 10 81%
Non RATA: R1 Cowl (0-95%) of r_
N/A N/A N/A N/A N/A N/ARATA, Run 1 Cavg (10%-95%) of r. M100 1.5.1: 52% OK 26% OK 26% OK
3 Calibration Gases
Was EPA Method 205 gas dilution used?. Thenidentify gas with division symbol M100 3.2: YesIt Yes' above, select the mid-levet cal. gas ppm or 'II),+/-2%. EPA 205: + 02 OK + + +
Nigh-range: (ti11-1UU%) Of r, (Am, sin (X.1 J.1.1;
select if divider used: 22.690 90.8% OK 9.000 90.0% OK 9.040 90.4% OK — —High-ran e cylinder #, M100 3.1.1: CA03686 OK ...../. CC37890 OK ,,,..--". CC60475 Ol< .....--'- — .......-----High-range expiration date: 03/11113 OK ..../ 12/29/11 OK ..- OK ,...---"- _Mid-range: (40-60%) of r, Cmcal. M100 3.1.2;indicate if divider used: 13.480 53.9% OK + 4.910 49.1% OK 4.520 45.2% Ol< ÷ — —
Mid-range cylinder #, M100 3.1.2: CA03686 OK ../ CC28133 OK ....---"- CC60475 OK „...-' — ......---.-.......----"Mid-range expiration date: 03/11/13 OK 08/15/10 OK _....----- 07/30/11 OK „----". _
Zero cylinder #, M100 3.1.3: CA03282 OK
-13coCD
cn Copy of C0M2030 Appendix G turbine 1.xls ver. 1.0 Page 1 of 4
Printed on 6125/2010

SJVAPCD - Appendix G
Three Run Review Sheet
Pollutant 02 NOx CO SO24.2 Calibration of Continuous Analyzers
NO2 converter efficiency, EfP%, >90%, M100 2.2.5: 97.09 OK ......--"-- 03, • 1 ppm: -0.50High-range response (+1-2%) of r, Cauh, M100 4.2: 22.65 -0.16% OK 8.97 -0.30% OK 9.10 0.60% OK - -Mid-range response (+/-2%) of r Caum M100 4 Z 13.40 -0.32% OK 4.93 0.20% OK 4.50 -0.20% OK - -Zero gas response (+/- 2%) of r, Caz. M100 4.2: -0.04 -0.16% OK 0.02 0.20% OK -0.01 -0.10% OK - -
4.3 Pre-Test Leak CheckTime of leak check, M100 4.3: I 7:20:00 AM! I OK I
4.4 Pre-Test System Bias Check (Suggest usingboth mid and high gases if unsure of emissionconcentration)Initial high-gas (+1-5%) Cibu,M100 6.2,Eq100-2: - N/A - N/A - N/A - -Initial mid-gas (41-5%) Cibu M100 6.2 Eq100-2: 13.42 -0.08% OK 4.75 1.80% OK 4.48 0.20% OK - -initial zero gas (+/-5 A) Can, M100 6.2,Eq100-2. 0.01 -0.20% OK 0.02 0.00% OK 0.03 -0.40% OK - -
Run 1Run 1 start time: 9:07:00 AM OKVan's voltage. VAC RMS, per policy: 119.00 OK
6 Sample CollectionRaw avg, ppm or %. Cavg: 12.92 12.92 2.55 2.55 2.61 2.61 -Raw highest, ppm or %. Cmax: 12.94 0.15% 3.36 31.76% 3.33 27.59% -Raw lowest, ppm or % Cmin: 12.90 0.15% 1.94 23.92% 2.09 19.92% -
Runl Cava as a % of r, M1004.4: -Select Cheat or Cmcal to become Cm! M100 4.4: 13.480 13.48 OK I 4.910 4.91 OK I 4.520 4.52 OK I - - I
Cau, M100 6.2: 13.40 4.93 4.50 -6.1 Zero and Calibration Drift
Final upscale (+/-3%),Cfbu,Eg 100-1: 13.42 0.00% OK 4.75 0.00% OK 4.48 0.00% OK - -Final zero (+/-3%),Cfbu,Eq 100-1: 0.01 0.00% OK 0.02 0.00% OK 0.04 -0.10% OK - -
6.2 Post-Test System Bias CheekFinal upscale (+/-5%),Cfbu.Eq 100-2: -0.08% OK 1.80% OK 0.20% OK - -
Final zero (+/-5%),Clhz.Eg 100-2: -0.20% OK 0.00% OK -0.50% OK -7.1 Pollutant Concentration
1.5.1 Range (10%-95%): 51.68% OK 25.50% OK 26.10% OK - -Avg. of Cibu and Cfbu, Cbcal: 13.42 4.75 4.48 -
Avg. of Cibz and Cfbz, Co: 0.01 0.02 0.04 -Cgas. ppm or %:, 12.98 2.83 2.62 -
Eq 100-5 Cgas(613%: 5.94 5.92 -Cgas©15%; 1.96 1.95 -
Copy of C0M2030 Appendix G turbine 1.xls ver. 1.0
Page 2 of 4
Printed on 6/25/2010
SJVAPCD - Appendix G
Three Run Review Sheet
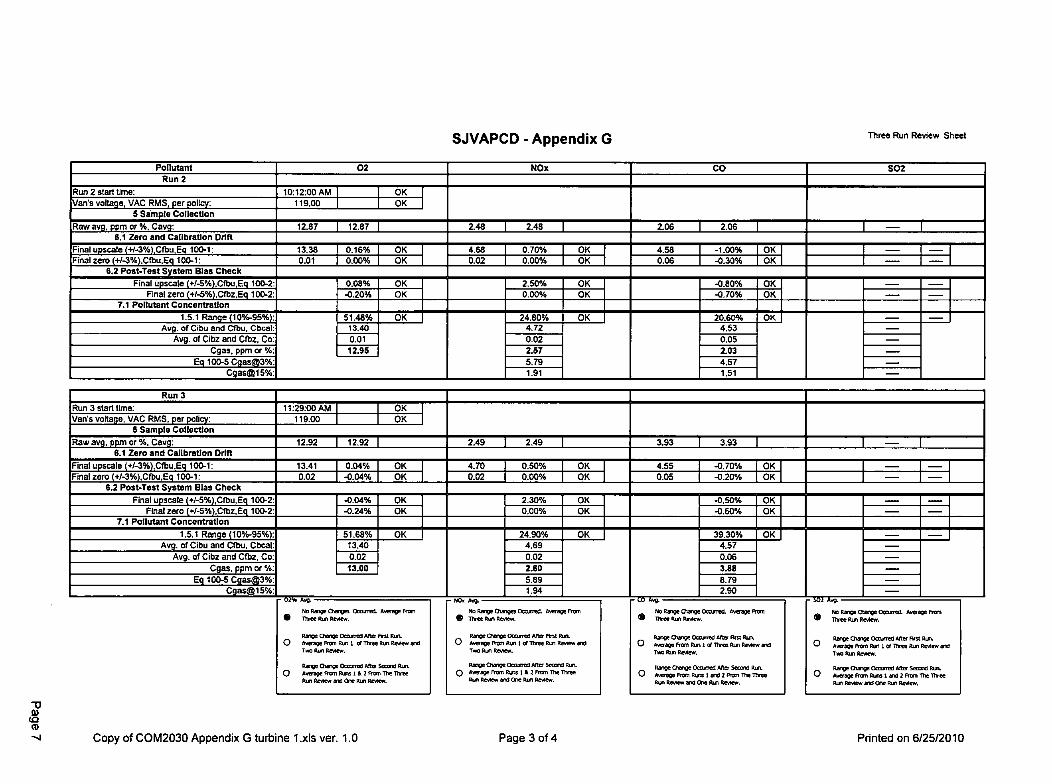
Pollutant 02 NOx CO SO2Run 2
Run 2 start time: 10:12:00 AM OKVan's voltage, VAC RMS, per policy: 119.00 OK
5 Sample CollectionRaw avq, ppm or %, Cavg: 12.87 I 12.87 I 2.48 I 2.48 I 2.06 I 2.06 I I - I
6.1 Zero and Calibration DriftFinal upscale (+/-3%),Cfbu,Eq 100-1: 13.38 0.16% OK 4.68 0.70% OK 4.58 -1.00% OK I - -Final zero (+/-3%).Cfbu.Eq 100-1: 0.01 0.00% OK 0.02 0.00% OK 0.06 -0.30% OK - -
6.2 Post-Test System Bias CheckFinal upscale (+/-5%),Cfbu,Eq 100-2: 0.08% OK 2.50% OK -0.80% OK - -
Final zero (+/-5%),Ctbz,Eq 100-2: -0.20% OK 0.00% OK -0.70% OK -7.1 Pollutant Concentration
1.5.1 Range (10%-95%): 51.48% OK 24.80% OK 20.60% OK - -Avg. of Cibu and Cfbu. Cbcal: 13.40 4.72 4.53 -
Avg. of Cibz and Cfbz. Co: 0.01 0.02 0.05 -Cgas, ppm or 'A: 12.95 2.57 2.03 -
Eq 100-5 Cgas(293%* 5.79 4.57 -Cgase15%: 1.91 1.51 -
Run 3Run 3 start time: 11:29:00 AM OKVan's volta e. VAC RMS. per policy: 119.00 OK
5 Sample CollectionRaw avq, ppm or %, Cavq: 12.92 I 12.92 I 2.49 I 2.49 I 3.93 I 3.93 I I - I
Si Zero and Calibration DriftFinal upscale (+I-3%) Clbu Eq 100-1' 13.41 0.04% OK 4.70 0.50% OK 4.55 -0.70% OK - -Final zero (+/-3%),C1bu,Eq 100-1: 0.02 -0.04% OK 0.02 0.00% OK 0.05 -0.20% OK - -
6.2 Post-Test System Bias CheckFinal upscale (+/-5%) Cfbu Eq 100-2'1 -0.04% OK 2.30% OK -0.50% OK - -
Final zero (+/-5%),Cfbz,Eq 100-2: -0.24% OK 0.00% OK -0.60% OK - -7.1 Pollutant Concentration
1.5.1 Range (10%-95%): 51.68% OK 24.90% OK 39.30% OK - -Avg. of Cibu and Cfbu, Cbcal: 13.40 4.69 4.57 -
Avg. of Cibz and Cfbz. Co: 0.02 0.02 0.06 -Cgas. ppm or %:, 13.00 2.60 3.88 -
Et) 100-5 Cgasn3%: 5.89 8.79 -Cgas@15%: 1.94 2.90 -
tICht Avg. - Lu sig. - 101 Aug.
No RAMP OMMOM Mama. Inerene From No Rane OnnOn Maned Awrape Fenn Pape Marne 00Sned. Average Ran oe. No Rana Mane 0Corred. AVITIMG Ran• Tree RIM
Reene °nine Oconee Me First kn.
• Tree MM FMMOVO,
Range Orme Marred Ma First RLML
• Thee fen Renew.
Range Ovine Oogared Ms First Ran
nir Thine RIO, RMAMII.
Range (Tana °awed Ma Rs( Rin.0 Average Ran ran 1 or Tann Rim Review and 0 Average Ran Rkri 1 of Ron Fan Review an V Average From {ILM I Of TVIM Rim FILMMM 0 MInge Rom Ron 101 Ihree Oa, Renew an
Two Rim Review. Two Ruri Renew. Two Ian Renew. Two Ran Renew
Range Oxeye Ozanne Ma Second 14n. Rage Owen ocnered Me Stand RM. Rage &bane Owned Me &son kn. Range Mane Maned Ma Sewed RIM0 Average Ran Run 111 FIST Re Owe
Rim Renew end One fen Renew.0 AVIMM[From Run 1 & 2 Rom The Tire,
Ron Renew aret Os WI Renew.V Average Fran nna I MO 2 Ran The Three
MAI Review ard One Ren Renew0 Iverax if an era 1 arn 2 Fran The Tree
RUM Renew and One inn Renew.
Copy of C0M2030 Appendix G turbine 1.xls ver. 1.0 Printed on 6/2512010Page 3 of 4

SJVAPCD - Appendix G
Three Run Review Sheet
Pollutant 02 NOx CO SO2
Est. avg. from 3 runs (not to be used forcompliance determination)
Cgas. ppm or %: I 13.0 2.6 2.8Eq 100-5 Cgas(f43%: 5.9 6.4
Cgaseli15%: 1.9 2.1Eq 100-4 Itts/hr. 6.45 4.23
EPA Eq 19-1 lbs/MMEitu: 0.007 0.005g/Bhp-hr: 0.027 0.018
If permit conditions require source to maintain daily, monthly, quarterly or annual fuel, production or sulfur records then enter the data below. Include copies or a printout of these records In the Operating Data section ofthe test report.
Fuel or production rate nearest to the day of the test. Units Fuel sulfur concentration rate nearest to the day of the test. Units
Fuel or production rate nearest to 3-months prior to the day of test. Fuel sulfur concentration rate nearest to 3-months prior to the day of the test.
Fuel or production rate nearest to 6-months prior to the day of test. Fuel sulfur concentration rate nearest to 6-months prior to the day of the test.
Fuel or production rate nearest to 9-months prior to the day of test. Fuel sulfur concentration rate nearest to 9-months prior to the day of the test.
Tester's comment area, explain each "X" mark and what actions will be taken to prevent reoccurrence.
See Historical Process Data. Section XI.
District Review Code:I 3
Copy of C0M2030 Appendix G turbine 1.xls ver. 1.0
Page 4 of 4
Printed on 6/25/2010
Summary of Results
Page 9
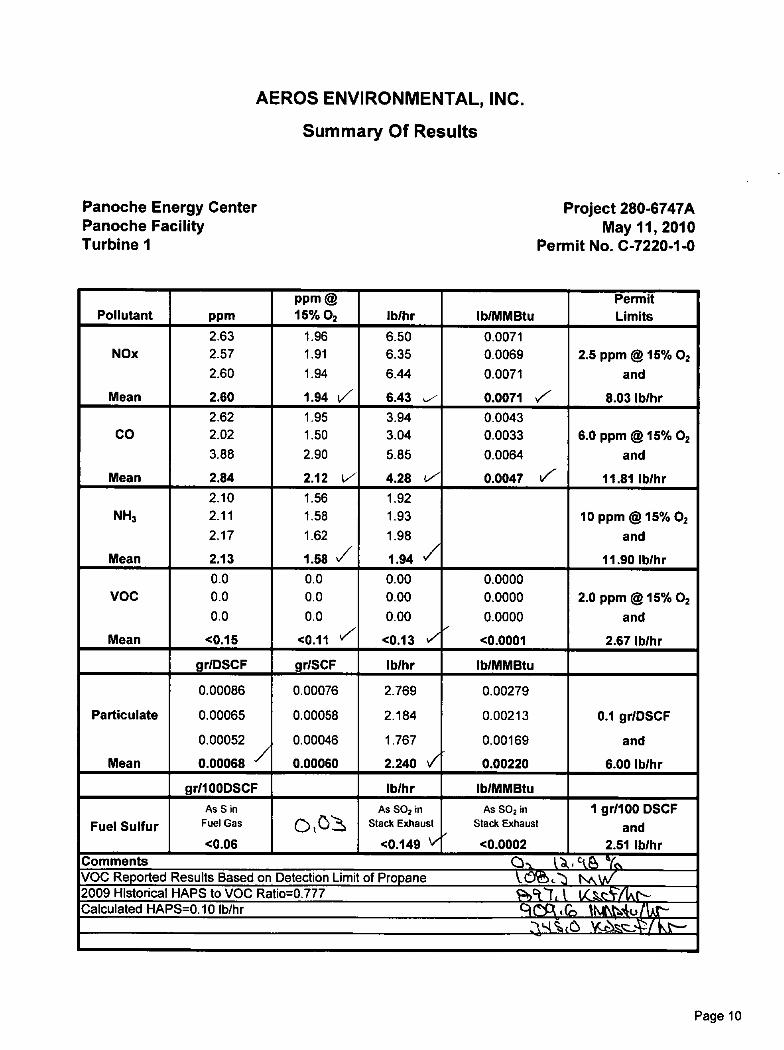
AEROS ENVIRONMENTAL, INC.
Summary Of Results
Panoche Energy Center Project 280-6747APanoche Facility May 11, 2010Turbine 1
Permit No. C-7220-1-0
PPm @ PermitPollutant ppm 15% 02 lb/hr lb/MMBtu Limits
2.63 1.96 6.50 0.0071NOx 2.57 1.91 6.35 0.0069 2.5 ppm @ 15% 02
2.60 1.94 6.44 0.0071 and
Mean 2.50 1.94 t/ 6.43 ..v 0.0071 ,./ 8.03 lb/hr2.62 1.95 3.94 0.0043
CO 2.02 1.50 3.04 0.0033 6.0 ppm @15% 023.88 2.90 5.85 0.0064 and
Mean 2.84 2.12 1.7 , 4.28 t, 0.0047 7 11.81 lb/hr2.10 1.56 1.92
NH3 2.11 1.58 1.93 10 ppm @15% 022.17 1.62 1.98 and
Mean 2.13 1.58 / 1.94 / 11.90 lb/hr0.0 0.0 0.00 0.0000
VOC 0.0 0.0 0.00 0.0000 2.0 ppm @ 15% 020.0 0.0 0.00 0.0000 and
Mean <0.15 <0.11 V <0.13 V <0.0001 2.67 lb/hr
gr/DSCF gr/SCF lb/hr lb/MMBtu
0.00086 0.00076 2.769 0.00279
Particulate 0.00065 0.00058 2.184 0.00213 0.1 gr/DSCF
0.00052 0.00046 1.767 0.00169 and
Mean 0.00068 / 0.00060 2.240 V 0.00220 6.00 lb/hr
gr/100DSCF lb/hr lb/MMBtuAsSin As SO2 in As SO2 in 1 gr/100 DSCF
Fuel Sulfur Fuel GasCiltC Stack Exhaust Stack Exhaust and
<0.06 <0.149 \// <0.0002 2.51 lb/hrComments 0-?... l. , ctS Ys.VOC Reported Results Based on Detection Limit of Propane k.DIdain ,.." tnAW2009 Historical HAPS to VOC Ratio=0.777 i=t)etsit t 14. CW1k-Calculated HAPS=0.10 lb/hr ACICRA, ttn Wtu /X--
ZL4 %O K r* V--- I KI--
Page 10

AEROS ENVIRONMENTAL, INC.
Summary Of Results
Panoche Energy Center Project 280-6747APanoche Facility
May 11, 2010Turbine 1
Permit No. C-7220-1-0
RATA Results Part 60Instrument Aeros Client RM AS Difference Difference+CC Limits
02 % 12.95 13.00 0.45 N/A 0.05 N/A 1% Difference
NOx g 15% 1.95 1.98 2.43 1.90 0.03 N/A 20% RM or 10% AS
CO @ 15% 2.85 2.46 16.17 7.67 0.39 0.4610% RM or 5% AS orDifference+CC<5ppm
RATA Results Part 75Instrument Aeros Client RM Difference Bias Adjustment Annual Limits
02 % 12.95 13.00 0.45 0.05 N/A 7.5% RM or 0.7% Difference
NOx lb/MMBtu 0.0071 0.0072 2.25 0.00009 1.007.5% RM or
0.015 lb/MMBtu Difference

Introduction
Page 12

Introduction
On May 11, 2010, Aeros Environmental, Inc. performed compliance source testing for PanocheEnergy Center at their Panoche facility. Testing was to determine concentrations and emissions of NOx,CO, VOC, NH 3 , fuel sulfur (S0x as SO2) and particulate from one gas-fired turbine. In addition, a relativeaccuracy test audit (RATA) was conducted on Panoche Energy Center's CEM system for NOx, CO and02 . The unit was tested while operating under normal operating conditions using the following methods.
Parameter Method Analysis Method Test Runs
NOxEPA Method 7E1
GARB 100Performance Spec 2
ChemiluminescentAnalyzer Compliance
332 minute
RATA
COEPA Method 10/
GARB 100Performance Spec 4A
Gas Filter CorrelationAnalyzer
02EPA Method 3A/
CARB 100Performance Spec 3
Micro Fuel CellAnalyzer
OrParamagnetic
6 additional32 minute
VOCas Methane
EPA Method18
GC-FID;Analysis for C 1 -C6+
3plus blank
Particulate EPA Method5
Gravimetric analysis of frontand back half fractions
32 hour
Volume Flow EPA Method19
Based on fuel ratesand fuel analysis 1 per run
Volume Flow EPA Methods1 - 4
Velocity traverse andcondensation train simultaneous
with Method 5
32 hour
NH3 BAAQMD ST-1BHCL Impingers
EPA Method 350B;Specific Ion Electrode
332 minute
Fuel Sulfur(S0x as SO2)
Fuel Analysis;Double GC
GC-FPD;Total sulfur referenced
to an H2S standard1
Fuel AnalysisF-factor and
Calorific Value
EPA Method 19ASTM
0-1945 & 0-3588
GC-TCD;C1— Cg+ 02, CO2, N2
& Btu/lb1
All testing was conducted by Chase Holsonbake, Kevin Sanchez, Jordan Winger and Mike Grayof Aeros Environmental, Inc. The VOC, particulate and fuel samples were analyzed by Lisa Marriott-Smith at Aeros Environmental's Bakersfield facility. Operation of the unit was supervised by RoyCampbell of Panoche Energy Center. The testing was not witnessed by the San Joaquin Valley AirPollution Control District.
Discussion:
Testing proceeded smoothly and in accordance with the District approved Source Test Protocol.As required, a concentration traverse was performed during test Run 1. Concentration gradients weredetected; therefore, all subsequent test runs were also traversed.
Page 13
EPA Methods 1 - 5
Page 14
Panoche Energy Center
Project 280-6747APanoche Facility
May 11, 2010Turbine 1
EPA Method 1-5Field Data
@ sr F & 29.92 "Hg
Data Input
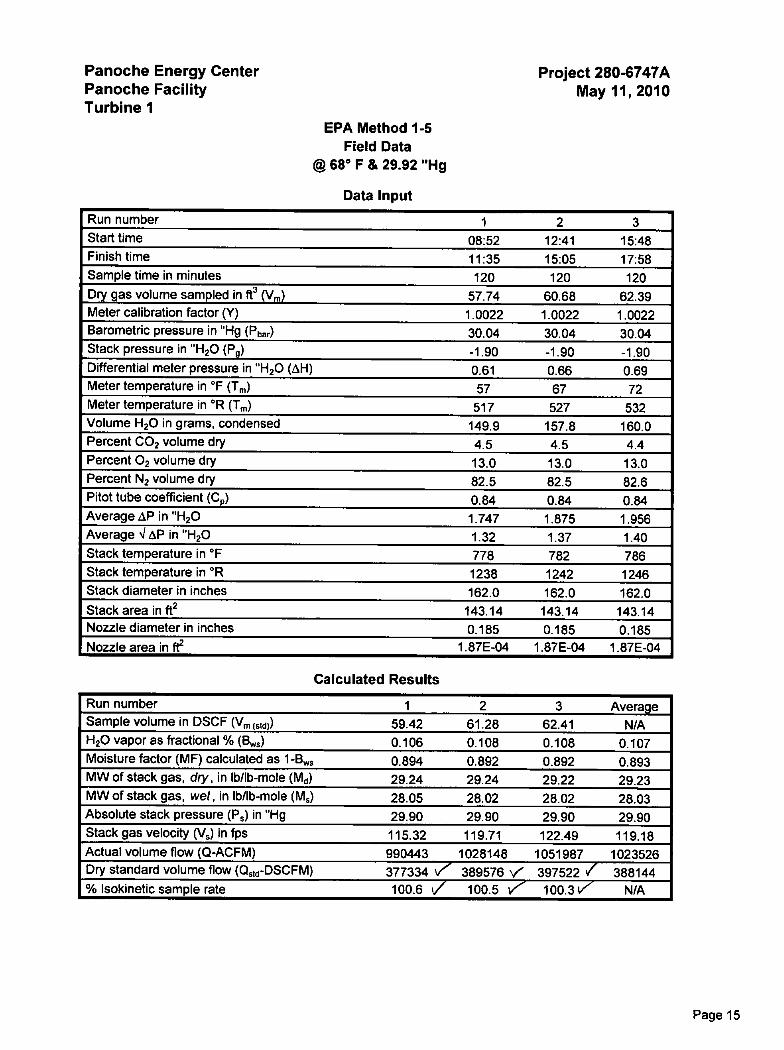
Run number 1 2 3Start time 08:52 12:41 15:48Finish time 11:35 15:05 17:58Sample time in minutes 120 120 120Dry gas volume sampled in ft 3 (Vs) 57.74 60.68 62.39Meter calibration factor (Y) 1.0022 1.0022 1.0022Barometric pressure in "Hg (Pbar) 30.04 30.04 30.04Stack pressure in "H 20 (Ps) -1.90 -1.90 -1.90Differential meter pressure in "H 20 (AH) 0.61 0.66 0.69Meter temperature in °F (T,) 57 67 72Meter temperature in °R ("1",) 517 527 532Volume H20 in grams, condensed 149.9 157.8 160.0Percent CO2 volume dry 4.5 4.5 4.4Percent 02 volume dry 13.0 13.0 13.0Percent N2 volume dry 82.5 82.5 82.6Pitot tube coefficient (Cs) 0.84 0.84 0.84Average AP in "H20 1.747 1.875 1.956Average 1,1AP in "H20 1.32 1.37 1.40Stack temperature in °F 778 782 786Stack temperature in °R 1238 1242 1246Stack diameter in inches 162.0 162.0 162.0Stack area in ft 2 143.14 143.14 143.14Nozzle diameter in inches 0.185 0.185 0.185
, Nozzle area in ft2 1.87E-04 1.87E-04 1.87E-04
Calculated Results
Run number 1 2 3 AverageSample volume in DSCF (Vm(std)) 59.42 61.28 62.41 N/AH20 vapor as fractional % (Bws) 0.106 0.108 0.108 0.107Moisture factor (MF) calculated as 1 -Bws 0.894 0.892 0.892 0.893MW of stack gas, city, in lb/lb-mole (Md) 29.24 29.24 29.22 29.23MW of stack gas, wet, in lb/lb-mole (Ms) 28.05 28.02 28.02 28.03Absolute stack pressure (Ps) in "Hg 29.90 29.90 29.90 29.90Stack gas velocity (Vs) in fps 115.32 119.71 122.49 119.18Actual volume flow (Q-ACFM) 990443 1028148 1051987 1023526Dry standard volume flow (Qstd-DSCFM) 377334 V 389576 V 397522 / 388144% Isokinetic sample rate 100.6 7 100.5 V 100.3 / N/A
Page 15

Panoche Energy Center
Project 280-6747APanoche Facility
May 11, 2010Turbine 1
EPA Method 1-5Particulate Gravimetric Results
@ 68° F & 29.92 "Hg
Run 1Netmg gr/dscf gr/scf lb/MMBtu lb/hr
Probe & nozzle wash 1.2 0.00031 0.00028 0.00101 1.007Filter 0.6 0.00016 0.00014 0.00051 0.503
Total front half 1.8 0.00047 0.00042 0.00152 1.510Condensables (back half) 1.5 0.00039 0.00035 0.00127 1.259Total front & back half 3.3 0.00086 V 0.00076 0.00279 2.769
Run 2Netmg gr/dscf gr/scf lb/MMBtu lb/hr
Probe & nozzle wash 1.4 0.00035 0.00031 0.00115 1.176Filter 0.0 0.00000 0.00000 0.00000 0.000
Total front half 1.4 0.00035 0.00031 0.00115 1.176Condensables (back half) 1.2 0.00030 0.00027 0.00098 1.008Total front & back half 2.6 0.00065 / 0.00058 0.00213 2.184
Run 3Netmg gr/dscf gr/scf lb/MMBtu lb/hr
Probe & nozzle wash 1.0 0.00025 0.00022 0.00081 0.842Filter 0.8 0.00020 0.00018 0.00064 0.673
Total front half 1.8 0.00044 0.00040 0.00145 1.515Condensables (back half) 0.3 0.00007 /0.00007 0.00024 0.252Total front & back half 2.1 0.00052 I/ 0.00046 0.00169 1.767
Supporting Data
TimeRun Start Finish %02 F-Factor %H20 Vm (std) DSCFM
1 08:52 11:35 13.0 8626 10.61 59.42 3773342 12:41 15:05 13.0 8626 10.81 61.28 3895763 15:48 17:58 13.0 8626 10.77 62.41 397522
Page 16

Relative Accuracy
Page 17
Panoche Energy Center
Project 280-6747APanoche Facility
May 11, 2010Turbine 1
Relative AccuracyEPA Performance Specifications
Analyzer 02 NOx CO
Spec 3 2 4AUnit % Vol Dry ppm ® 15% 02 PPm @ 15% 02
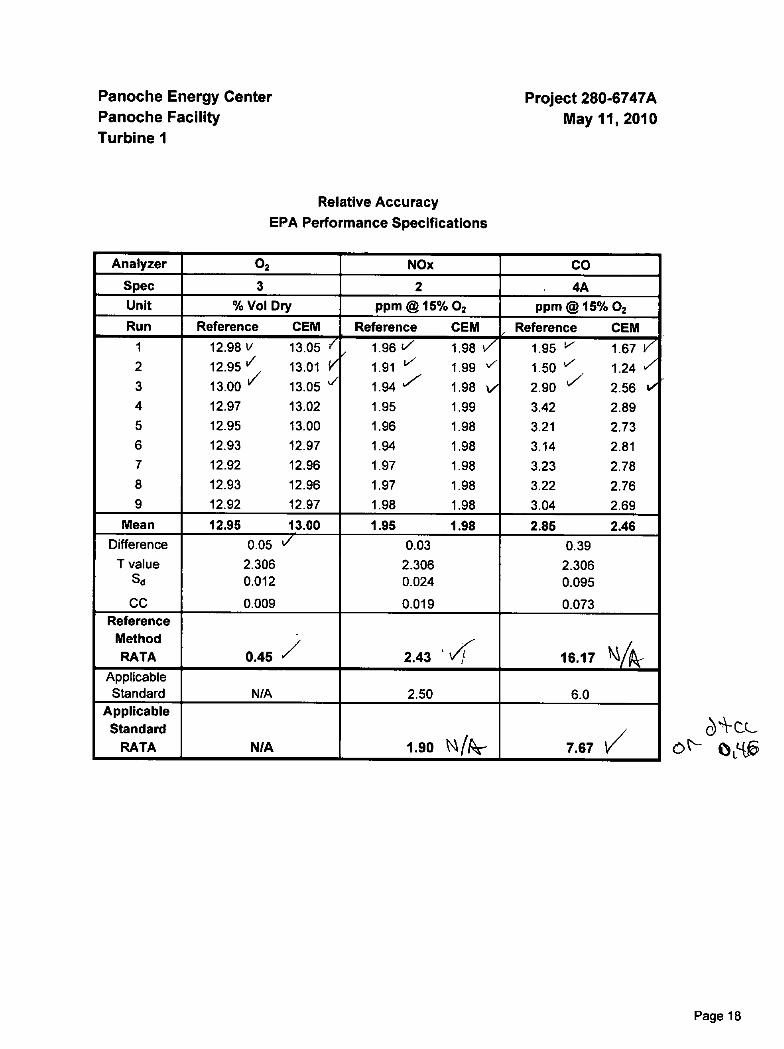
Run Reference CEM Reference CEM ( Reference CEM1 12.98 v 13.05 17/ 1.96 V 1.98 V 1.95 v 1.67 V2 12.95 17 13.01 i/ 1.91 V 1.99 v 1.50 V 1.24 V3 13.00 17 13.05 '7 1.94 V 1.98 V 2.90 / 2.56 V4 12.97 13.02 1.95 1.99 3.42 2.895 12.95 13.00 1.96 1.98 3.21 2.736 12.93 12.97 1.94 1.98 3.14 2.817 12.92 12.96 1.97 1.98 3.23 2.788 12.93 12.96 1.97 1.98 3.22 2.769 12.92 12.97 1.98 1.98 3.04 2.69
Mean 12.95 13.00 1.95 1.98 2.85 2.46Difference 0.05 1/ 0.03 0.39
T value 2.306 2.306 2.306Sd 0.012 0.024 0.095
CC 0.009 0.019 0.073Reference
MethodRATA 0.45 / 2.43 ' 71 16.17
ApplicableStandardStandard N/A 2.50 6.0
ApplicableStandard
RATA N/A 1.90 Nfk- 7.67 /
Page 18
Panoche Energy Center Project 280-6747APanoche Facility May 11, 2010Turbine 1
Relative AccuracyEPA Performance Specifications
,
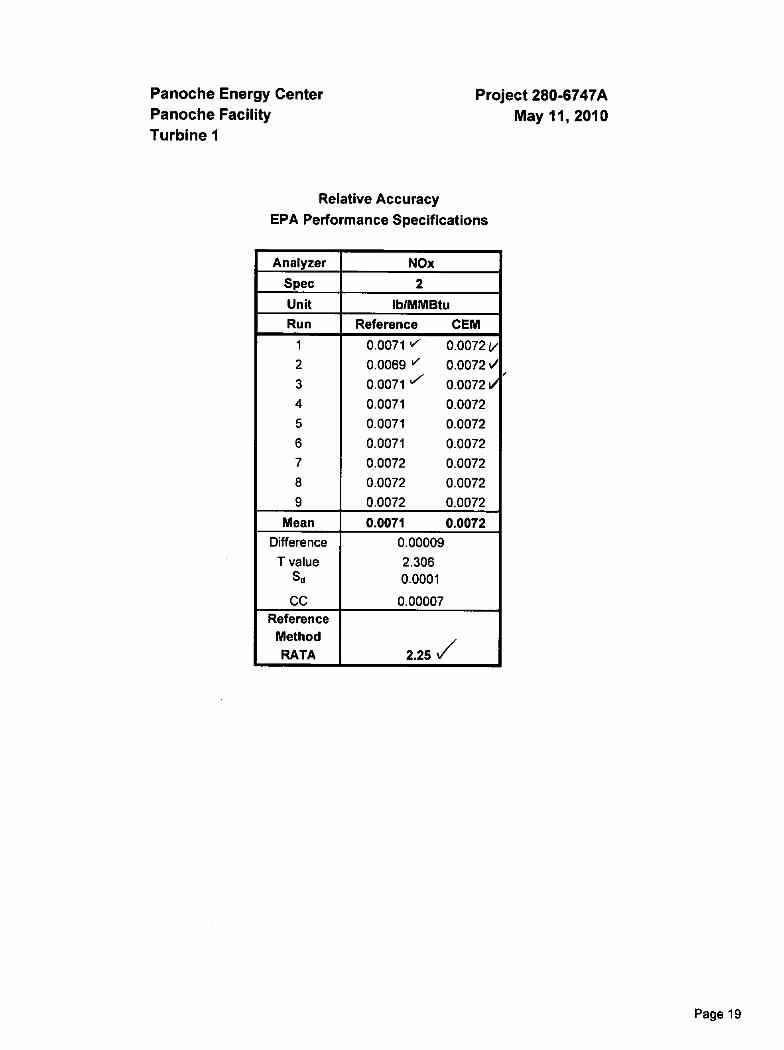
Analyzer NOx
Spec 2
Unit lb/MMBtuRun Reference CEM
1 0.0071 v 0.0072 V2 0.0069 v 0.007213 0.0071 V 0.007214 0.0071 0.00725 0.0071 0.00726 0.0071 0.00727 0.0072 0.00728 0.0072 0.00729 0.0072 0.0072
Mean 0.0071 0.0072Difference 0.00009
T value 2.306Sd 0.0001
CC 0.00007Reference
MethodRATA 2.25 /
Page 19
Panoche Energy Center
Project 280-6747APanache Facility
May 11, 2010Turbine 1
Run 1NOx/C0/02
@ 68° F
Emission Data
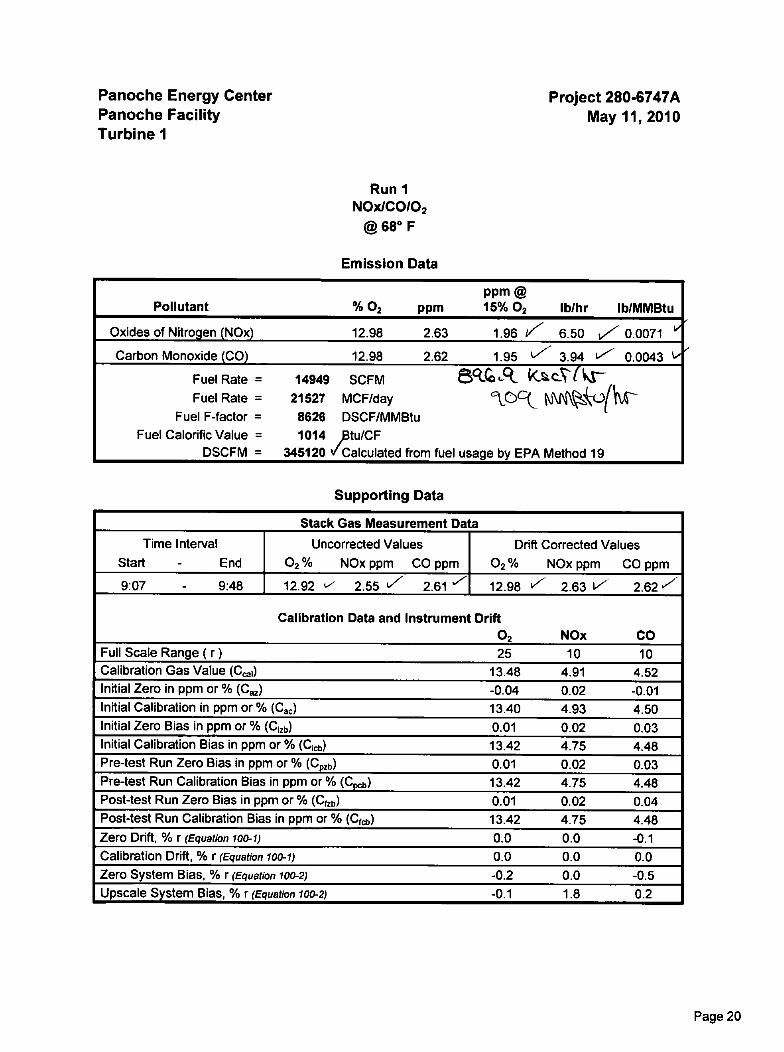
Pollutant % 02 PPmPPm @15% 02 lb/hr lb/MMBtu
Oxides of Nitrogen (N0x) 12.98 2.63 1.96 17 6.50 V 0.0071 v
Carbon Monoxide (CO) 12.98 2.62 1.95 V- 3.94 t-' 0.0043
Fuel Rate =Fuel Rate =
Fuel F-factor =Fuel Calorific Value =
DSCFM =
14949 SCFM e3,q_C:A, k.S. C.Mr.
21527 MCF/day ck,(Ct ift[\*-0A-
8626 DSCF/MMBtu1014 ptu/CF
345120 /Calculated from fuel usage by EPA Method 19
Supporting Data
Stack Gas Measurement Data
Time Interval
Start - End
Uncorrected Values02% NOx ppm CO ppm
Drift Corrected Values02% NOx ppm CO PPm
9:07 - 9:48 12.92 n-' 2.55 V 2.61 ''' 12.98 V- 2.63 V 2.62 V
Calibration Data and instrument Drift02 NOx CO
Full Scale Range ( r ) 25 10 10Calibration Gas Value (C 1 ) 13.48 4.91 4.52Initial Zero in ppm or % (Cm) -0.04 0.02 -0.01Initial Calibration in ppm or % (Coo) 13.40 4.93 4.50Initial Zero Bias in ppm or % (C izb) 0.01 0.02 0.03Initial Calibration Bias in ppm or % (Ch,b) 13.42 4.75 4.48Pre-test Run Zero Bias in ppm or % (Cpzb) 0.01 0.02 0.03Pre-test Run Calibration Bias in ppm or % (Cimb ) 13.42 4.75 4.48Post-test Run Zero Bias in ppm or °/ /C 1,0 s-fzb, 0.01 0.02 0.04Post-test Run Calibration Bias in ppm or % (Cfcp) 13.42 4.75 4.48Zero Drift, % r (Equation 100-1) 0.0 0.0 -0.1Calibration Drift, % r (Equation 100-1) 0.0 0.0 0.0Zero System Bias, % r (Equation 100-2) -0.2 0.0 -0.5Upscale System Bias, % r (Equation 100-2) -0.1 1.8 0.2
Page 20
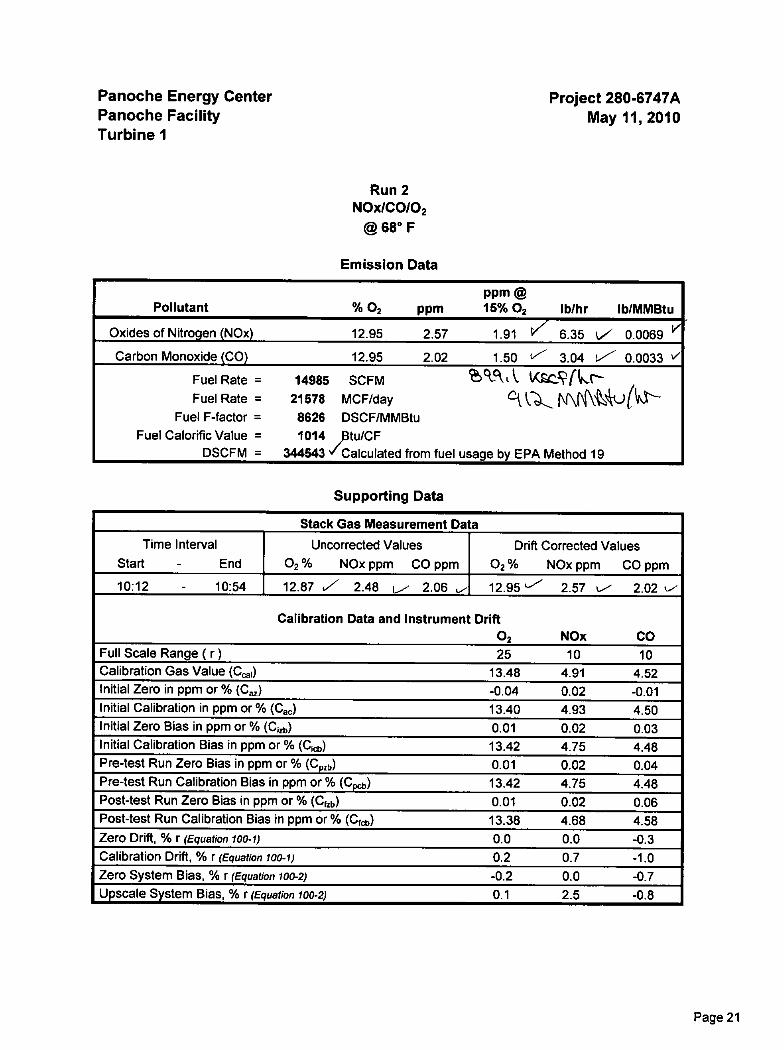
Panoche Energy Center Project 280-6747APanache Facility May 11, 2010Turbine 1
Run 2NOx/C0/02
@ 68° F
Emission Data
Pollutant % 02ppmPPm @16% 02 lb/hr lb/MMBtu
Oxides of Nitrogen (N0x) 12.95 2.57 1.91 V 6.35 k./ 0.0069 V
Carbon Monoxide (CO) 12.95 2.02 1.50 t ' 3.04 t, -0.0033
Fuel Rate =Fuel Rate =
Fuel F-factor =Fuel Calorific Value =
DSCFM =
14985 SCFM 'ilk-elt 1. tA.. f L-r- ,21578 MCF/day Ck. Nr\fai0( W-8626 DSCF/MMBtu1014 "tu/CF
344543 ki Calculated from fuel usage by EPA Method 19
Supporting Data
Stack Gas Measurement Data
Time Interval
Start - End
Uncorrected Values02% NOx ppm CO ppm
Drift Corrected Values02% NOx ppm CO PPm
10:12 - 10:54 12.87 vz2.48 1....,., 2.06 ,....., 12.95 '- l/ 2.02 k..--
Calibration Data and Instrument Drift02 NOx CO
Full Scale Range ( r ) 25 10 10Calibration Gas Value (Ccal) 13.48 4.91 4.52Initial Zero in ppm or % (Caz) -0.04 0.02 -0.01Initial Calibration in ppm or % (Cac) 13.40 4.93 4.50Initial Zero Bias in ppm or % (C izb) 0.01 0.02 0.03Initial Calibration Bias in ppm or % (Ccb ) 13.42 4.75 4.48Pre-test Run Zero Bias in ppm or % (Cpzb) 0.01 0.02 0.04Pre-test Run Calibration Bias in ppm or % (Cpcb ) 13.42 4.75 4.48Post-test Run Zero Bias in ppm or % (Crzt,) 0.01 0.02 0.06Post-test Run Calibration Bias in ppm or % (Cfd,) 13.38 4.68 4.58Zero Drift, % r (Equation 100-1) 0.0 0.0 -0.3Calibration Drift, % r (Equation 100-1) 0.2 0.7 -1.0Zero System Bias, % r (Equation 100-2) -0.2 0.0 -0.7Upscale System Bias, % r (Equation 100-2) 0.1 2.5 -0.8
Page 21

Panoche Energy Center
Project 280-6747APanoche Facility
May 11, 2010Turbine 1
Run 3NOx/C0/02
@ 68° F
Emission Data
Pollutant % 02 PP mPPm @15% 02 lb/hr lb/MMBtu
Oxides of Nitrogen (N0x) 13.00 2.60 1.94 V 6.44 ` --". 0.0071 v
Carbon Monoxide (CO) 13.00 3.88 2.90 V 5.85 t -- 0.0064 V
Fuel Rate =
Fuel Rate =Fuel F-factor =
Fuel Calorific Value =
DSCFM =
14920 SCFM .-'_ nkX,c- ( CT: n _21485 MCF/day ctOS iN\A.1. \ Ir
8626 DSCF/MMBtu1014 Btu/CF
345512 ‘/Calculated from fuel usage by EPA Method 19
Supporting Data
Stack Gas Measurement Data
Time Interval
Start - End
Uncorrected Values
02% NOx ppm CO ppm
Drift Corrected Values
02 % NOx ppm CO ppm
11:29 - 12:14 12.92 V 2.49 '1/ 3.93 t'v 13.00 'v" 2.60 ,--'- 3.88 V
Calibration Data and Instrument Drift02 NOx CO
Full Scale Range ( r ) 25 10 10Calibration Gas Value (Cca l) 13.48 4.91 4.52Initial Zero in ppm or % (C„) -0.04 0.02 -0.01Initial Calibration in ppm or % (C„) 13.40 4.93 4.50Initial Zero Bias in ppm or % (C,,p) 0.01 0.02 0.03Initial Calibration Bias in ppm or % (Ca,) 13.42 4.75 4.48Pre-test Run Zero Bias in ppm or % (Cpzb) 0.01 0.02 0.06Pre-test Run Calibration Bias in ppm or % (Cpcp) 13.38 4.68 4.58Post-test Run Zero Bias in ppm or % (Cf,p) 0.02 0.02 0.05Post-test Run Calibration Bias in ppm or % (Cm,) 13.41 4.70 4.55Zero Drift, % r (Equation 100-1) 0.0 0.0 -0.2Calibration Drift, % r (Equation 100-1) 0.0 0.5 -0.7Zero System Bias, % r (Equation 100-2) -0.2 0.0 -0.6
z Upscale System Bias, % r (Equation 100-2) 0.0 2.3 -0.5
Page 22

Panoche Energy Center
Project 280-6747APanoche Facility
May 11, 2010Turbine 1
Run 4NOWC0/02
@ 68 F
Emission Data
PPm @Pollutant % 02 PPm 15% 02lb/hr lb/MMBtu
Oxides of Nitrogen (N0x) 12.97 2.62 1.95 6.47 0.0071
Carbon Monoxide (CO) 12.97 4.60 3.42 6.91 0.0076
Fuel Rate = 14960 SCFMFuel Rate = 21628 MCF/day
Fuel F-factor = 8626 DSCF/MMBtuFuel Calorific Value = 1014 Btu/CF
DSCFM = 344573 Calculated from fuel usage by EPA Method 19
Supporting Data
Stack Gas Measurement Data
Time IntervalStart - End
Uncorrected Values02% NOx ppm CO ppm
Drift Corrected Values02% NOx ppm CO PPm
12:44 - 13:27 12.90 2.52 4.61 12.97 2.62 4.60
Calibration Data and Instrument Drift02 NOx CO
Full Scale Range ( r ) 25 10 10Calibration Gas Value (C cal) 13.48 4.91 4.52Initial Zero in ppm or % (Ca) -0.04 0.02 -0.01Initial Calibration in ppm or % (C8c) 13.40 4.93 4.50Initial Zero Bias in ppm or % (C,,b) 0.01 0.02 0.03Initial Calibration Bias in ppm or % (Cid)) 13.42 4.75 4.48Pre-test Run Zero Bias in ppm or % (Cpzb) 0.02 0.02 0.05Pre-test Run Calibration Bias in ppm or % (Cpcb) 13.41 4.70 4.55Post-test Run Zero Bias in ppm or % (Cfzb) 0.01 0.02 0.07Post-test Run Calibration Bias in ppm or % (Cu)) 13.40 4.70 4.50Zero Drift, % r (Equation 100-1) 0.0 0.0 -0.4Calibration Drift, % r (Equation 100-1) 0.1 0.5 -0.2Zero System Bias, % r (Equation 100-2) -0.2 0.0 -0.8Upscale System Bias, % r (Equation 100-2) 0.0 2.3 0.0
Page 23
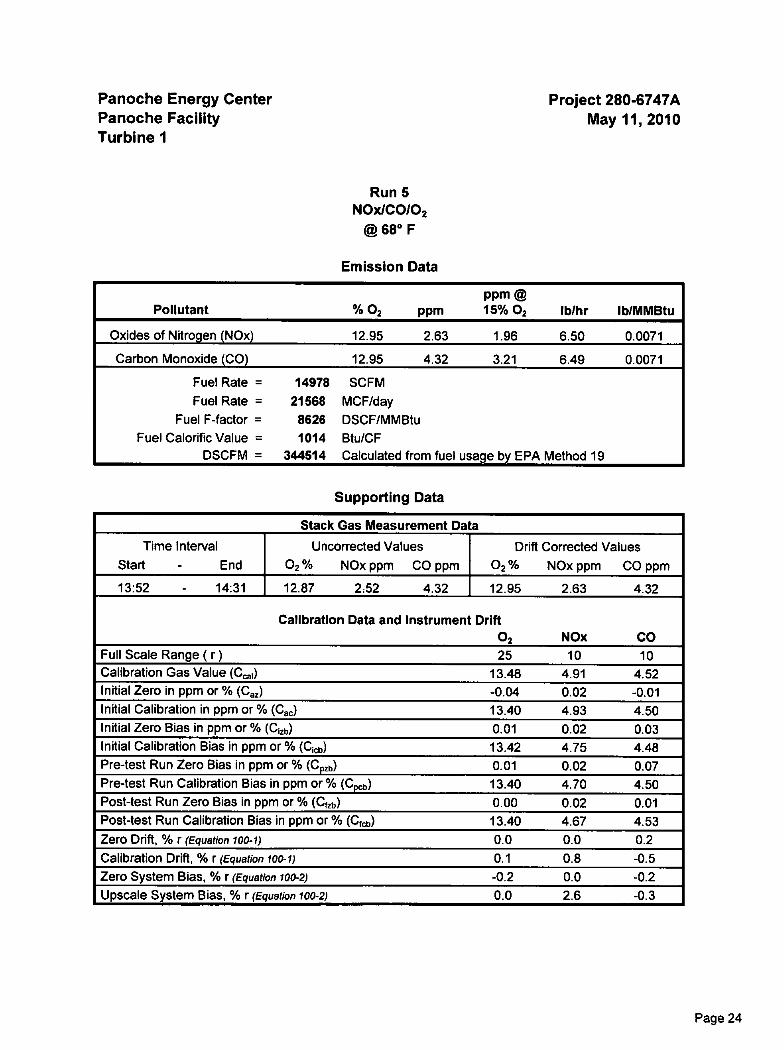
Panoche Energy Center Project 280-6747APanoche Facility May 11, 2010Turbine 1
Run 5NOx/C0102
@ 68° F
Emission Data
PPm @Pollutant % 02 PPm 15% 02 lb/hr lb/MMBtu
Oxides of Nitrogen (N0x) 12.95 2.63 1.96 6.50 0.0071
Carbon Monoxide (CO) 12.95 4.32 3.21 6.49 0.0071
Fuel Rate = 14978 SCFMFuel Rate = 21568 MCF/day
Fuel F-factor = 8626 DSCF/MMBtuFuel Calorific Value = 1014 Btu/CF
DSCFM = 344514 Calculated from fuel usage by EPA Method 19
Supporting Data
Stack Gas Measurement DataTime Interval
Start - EndUncorrected Values
02% NOx ppm CO ppmDrift Corrected Values
02% NOx ppm CO PPm
13:52 - 14:31 12.87 2.52 4.32 12.95 2.63 4.32
Calibration Data and Instrument Drift02 NOx CO
Full Scale Range ( r ) 25 10 10Calibration Gas Value (Ccat) 13.48 4.91 4.52Initial Zero in ppm or % (Caz) -0.04 0.02 -0.01Initial Calibration in ppm or % (Cac) 13.40 4.93 4.50Initial Zero Bias in ppm or % (Cizb) 0.01 0.02 0.03Initial Calibration Bias in ppm or % (Cid,) 13.42 4.75 4.48Pre-test Run Zero Bias in ppm or % (Cp,b) 0.01 0.02 0.07Pre-test Run Calibration Bias in ppm or % (Cpcb ) 13.40 4.70 4.50Post-test Run Zero Bias in ppm or "/o (Cub) 0.00 0.02 0.01Post-test Run Calibration Bias in ppm or % (Cfcb) 13.40 4.67 4.53Zero Drift, % r (Equation 100-1) 0.0 0.0 0.2Calibration Drift, % r (Equation 100-1) 0.1 0.8 -0.5Zero System Bias, % r (Equation 100-2) -0.2 0.0 -0.2Upscale System Bias, % r (Equation 100-2) 0.0 2.6 -0.3
Page 24
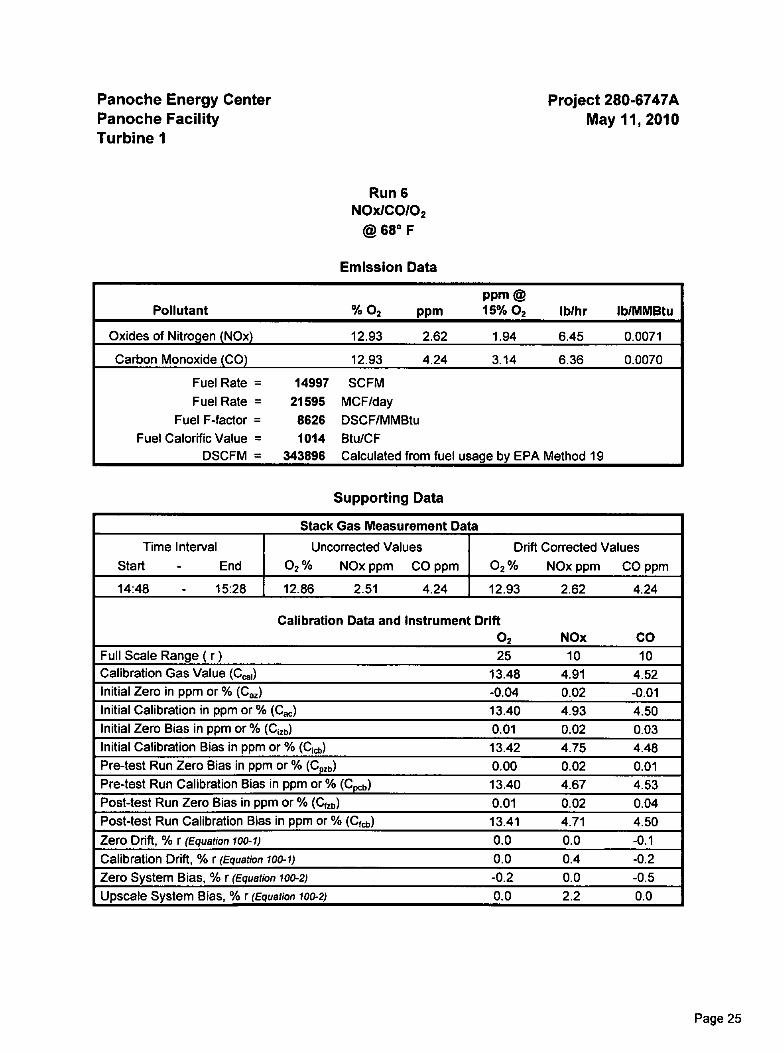
Panoche Energy Center Project 280-6747APanoche Facility
May 11, 2010Turbine 1
Run 6NOx/C0/02
@ 68° F
Emission Data
PollutantPPm @
% 02 PP m 15% 02lb/hr lb/MMBtu
Oxides of Nitrogen (N0x) 12.93 2.62 1.94 6.45 0.0071
Carbon Monoxide (CO) 12.93 4.24 3.14 6.36 0.0070
Fuel Rate = 14997 SCFMFuel Rate = 21595 MCF/day
Fuel F-factor = 8626 DSCF/MMBtuFuel Calorific Value = 1014 Btu/CF
DSCFM = 343896 Calculated from fuel usage by EPA Method 19
Supporting Data
Stack Gas Measurement Data
Time IntervalStart - End
Uncorrected Values02% NOx ppm CO ppm
Drift Corrected Values02% NOx ppm CO PPm
14:48 - 15:28 12.86 2.51 4.24 12.93 2.62 4.24
Calibration Data and Instrument Drift02 NOx CO
Full Scale Range ( r ) 25 10 10Calibration Gas Value (Cul) 13.48 4.91 4.52Initial Zero in ppm or % (Cu) -0.04 0.02 -0.01Initial Calibration in ppm or % (Cu) 13.40 4.93 4.50Initial Zero Bias in ppm or % (Cizb) 0.01 0.02 0.03Initial Calibration Bias in ppm or % (Cid)) 13.42 4.75 4.48Pre-test Run Zero Bias in ppm or % (Cpzi3) 0.00 0.02 0.01Pre-test Run Calibration Bias in ppm or % (0b) 13.40 4.67 4.53Post-test Run Zero Bias in ppm or % (Cf,b ) 0.01 0.02 0.04Post-test Run Calibration Bias in ppm or % (Cfcb) 13.41 4.71 4.50Zero Drift, % r (Equation 100-1) 0.0 0.0 -0.1Calibration Drift, % r (Equation 100-1) 0.0 0.4 -0.2Zero System Bias, % r (Equation 100-2) -0.2 0.0 -0.5Upscale System Bias, % r (Equation 100-2) 0.0 2.2 0.0
Page 25
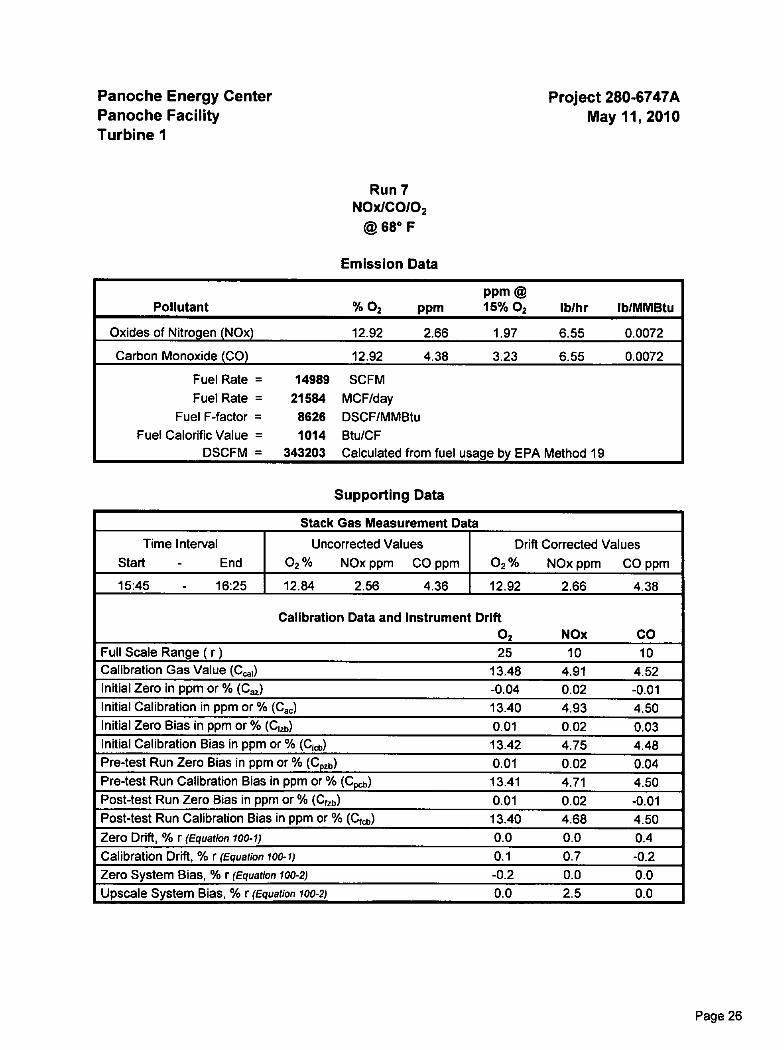
Panoche Energy Center
Project 280-6747APanoche Facility
May 11, 2010Turbine 1
Run 7NOx/C0/02
@ 68° F
Emission Data
PollutantPPm @
% 02PPm 15% 02lb/hr lb/MMBtu
Oxides of Nitrogen (N0x) 12.92 2.66 1.97 6.55 0.0072
Carbon Monoxide (CO) 12.92 4.38 3.23 6.55 0.0072
Fuel Rate = 14989 SCFMFuel Rate = 21584 MCF/day
Fuel F-factor = 8626 DSCF/MMBtuFuel Calorific Value = 1014 Btu/CF
DSCFM = 343203 Calculated from fuel usage by EPA Method 19
Supporting Data
Stack Gas Measurement Data
Time IntervalStart - End
Uncorrected Values02% NOx ppm CO ppm
Drift Corrected Values02% NOx ppm CO PPm
15:45 - 16:25 12.84 2.56 4.36 12.92 2.66 4.38
Calibration Data and instrument Drift02 NOx CO
Full Scale Range ( r ) 25 10 10Calibration Gas Value (C ad) 13.48 4.91 4.52Initial Zero in ppm or % (Cu) -0.04 0.02 -0.01Initial Calibration in ppm or % (Cap) 13.40 4.93 4.50Initial Zero Bias in ppm or % (Cizb) 0.01 0.02 0.03Initial Calibration Bias in ppm or % (C,a,) 13.42 4.75 4.48Pre-test Run Zero Bias in ppm or % (Cpzb) 0.01 0.02 0.04Pre-test Run Calibration Bias in ppm or % (Cpcp) 13.41 4.71 4.50Post-test Run Zero Bias in ppm or % (Cith) 0.01 0.02 -0.01Post-test Run Calibration Bias in ppm or % (Ckb) 13.40 4.68 4.50Zero Drift, % r (Equation 100-1) 0.0 0.0 0.4Calibration Drift, % r (Equation 100-1) 0.1 0.7 -0.2Zero System Bias, % r (Equation 100-2) -0.2 0.0 0.0Upscale System Bias, % r (Equation 100-2) 0.0 2.5 0.0
Page 26
Panoche Energy Center
Project 280-6747APanoche Facility
May 11, 2010Turbine 1
Run 8NOx/C0/02
@ 68° F
Emission Data
PollutantPPm @
% 02 PPm 15% 02 lb/hr lb/MMBtu
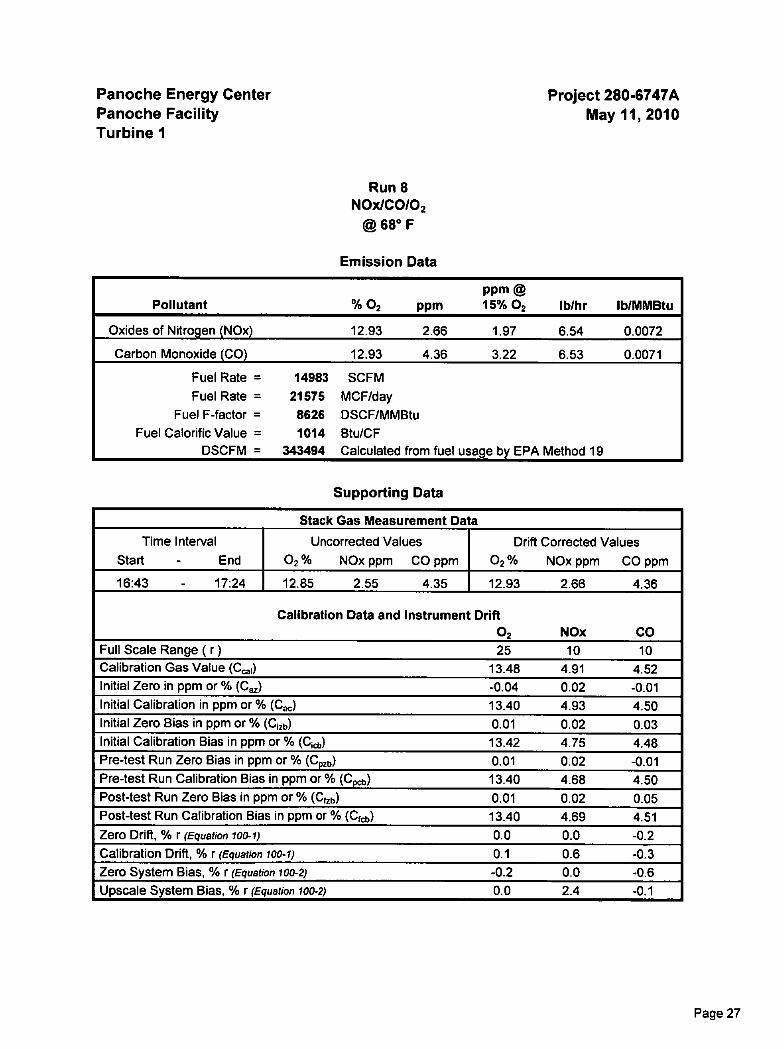
Oxides of Nitrogen (N0x) 12.93 2.66 1.97 6.54 0.0072
Carbon Monoxide (CO) 12.93 4.36 3.22 6.53 0.0071
Fuel Rate = 14983 SCFMFuel Rate = 21575 MCF/day
Fuel F-factor = 8626 DSCF/MMBtuFuel Calorific Value = 1014 Btu/CF
DSCFM = 343494 Calculated from fuel usage by EPA Method 19
Supporting Data
Stack Gas Measurement Data
Time IntervalStart - End
Uncorrected Values
02% NOx ppm CO ppm
Drift Corrected Values02% NOx ppm CO PPm
16:43 - 17:24 12.85 2.55 4.35 12.93 2.66 4.36
Calibration Data and Instrument Drift02 NOx CO
Full Scale Range ( r ) 25 10 10Calibration Gas Value (Ccal) 13.48 4.91 4.52Initial Zero in ppm or % (Cu) -0.04 0.02 -0.01Initial Calibration in ppm or % (Cm) 13.40 4.93 4.50Initial Zero Bias in ppm or % (Cub) 0.01 0.02 0.03Initial Calibration Bias in ppm or % (Cid)) 13.42 4.75 4.48Pre-test Run Zero Bias in ppm or % (Cpzb) 0.01 0.02 -0.01Pre-test Run Calibration Bias in ppm or % (Cpbb ) 13.40 4.68 4.50Post-test Run Zero Bias in ppm or % (Cub) 0.01 0.02 0.05Post-test Run Calibration Bias in ppm or % (Cf,n) 13.40 4.69 4.51Zero Drift, % r (Equation 100-1) 0.0 0.0 -0.2Calibration Drift, % r (Equation 100-1) 0.1 0.6 -0.3Zero System Bias, % r (Equation 100-2) -0.2 0.0 -0.6Upscale System Bias, % r (Equation 100-2) 0.0 2.4 -0.1
Page 27
Panoche Energy Center
Project 280-6747APanoche Facility
May 11, 2010Turbine 1
Run 9NOx/C0/02
@ 68° F
Emission Data
PPm @Pollutant % 02PPm 15% 02 lb/hr lb/MMBtu
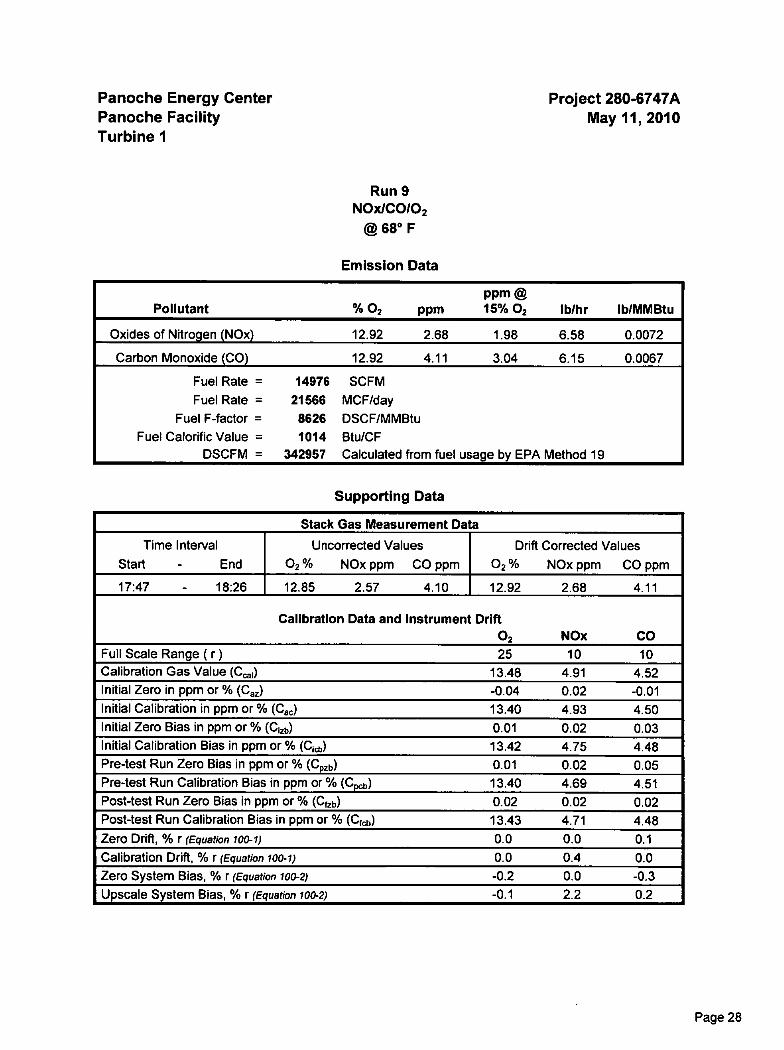
Oxides of Nitrogen (N0x) 12.92 2.68 1.98 6.58 0.0072
Carbon Monoxide (CO) 12.92 4.11 3.04 6.15 0.0067
Fuel Rate = 14976 SCFMFuel Rate = 21566 MCF/day
Fuel F-factor = 8626 DSCF/MMBtuFuel Calorific Value = 1014 Btu/CF
DSCFM = 342957 Calculated from fuel usage by EPA Method 19
Supporting Data
Stack Gas Measurement Data
Time IntervalStart - End
Uncorrected Values02% NOx ppm CO ppm
Drift Corrected Values02% NOx pPm CO PPm
17:47 - 18:26 12.85 2.57 4.10 12.92 2.68 4.11
Calibration Data and instrument Drift02 NOx CO
Full Scale Range ( r ) 25 10 10Calibration Gas Value (C cal) 13.48 4.91 4.52Initial Zero in ppm or % (Caz) -0.04 0.02 -0.01Initial Calibration in ppm or % (Cac) 13.40 4.93 4.50Initial Zero Bias in ppm or % (Cizb) 0.01 0.02 0.03Initial Calibration Bias in ppm or % (Ckp) 13.42 4.75 4.48Pre-test Run Zero Bias in ppm or % (Cpzb) 0.01 0.02 0.05Pre-test Run Calibration Bias in ppm or % (Cpcb ) 13.40 4.69 4.51Post-test Run Zero Bias in ppm or % (Ctzb) 0.02 0.02 0.02Post-test Run Calibration Bias in ppm or % (Cfcp) 13.43 4.71 4.48Zero Drift, % r (Equation 100-1) 0.0 0.0 0.1Calibration Drift, % r (Equation 100-1) 0.0 0.4 0.0Zero System Bias, % r (Equation 100-2) -0.2 0.0 -0.3Upscale System Bias, % r (Equation 100-2) -0.1 2.2 0.2
Page 28

Panoche Energy Center Project 280-6747APanoche Facility
May 11, 2010Turbine 1
Panache Energy CenterNOx, CO, & 02 @ 68° F
Run Time % 02
NOx
PPm @ 15% 02
NOx
lb/MMBtu
CO
PPm @15% 02
1 09:07 - 09:48 13.05 1.98 0.0072 1.67
2 10:12 - 10:54 13.01 1.99 0.0072 1.24
3 11:29 - 12:14 13.05 1.98 0.0072 2.56
4 12:44 - 13:27 13.02 1.99 0.0072 2.89
5 13:52 - 14:31 13.00 1.98 0.0072 2.73
6 14:48 - 15:28 12.97 1.98 0.0072 2.81
7 15:45 - 16:25 12.96 1.98 0.0072 2.78
8 16:43 - 17:24 12.96 1.98 0.0072 2.76
9 17:47 - 18:26 12.97 1.98 0.0072 2.69
Average 13.00 1.98 0.0072 2.46
Page 29
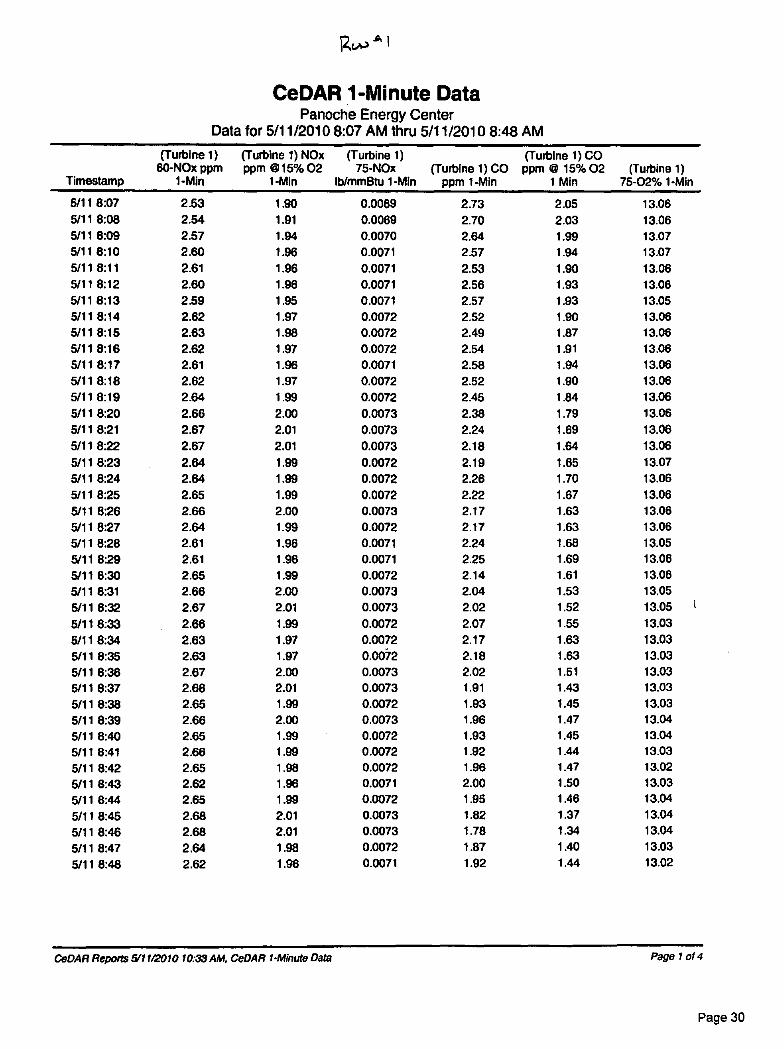
CeDAR 1-Minute DataPanoche Energy Center
Data for 5/11/20108:07 AM thru 5/11/2010 8:48 AM
Timestamp
(Turbine 1)60-NOx ppm
1-Min
(Turbine 1) NOxppm @15% 02
1-Min
(Turbine 1)75-NOx
lb/mmBtu 1-Mh(Turbine 1)C0
ppm 1-Min
(Turbine 1) COppm @ 15% 02
1 Min(Turbine 1)
75-02% 1-Min
5/11 8:07 2.53 1.90 0.0069 2.73 2.05 13.065/11 8:08 2.54 1.91 0.0069 2.70 2.03 13.065/11 8:09 2.57 1.94 0.0070 2.64 1.99 13.075/11 8:10 2.60 1.96 0.0071 2.57 1.94 13.075/11 8:11 2.61 1.96 0.0071 2.53 1.90 13.065/11 8:12 2.60 1.96 0.0071 2.56 1.93 13.065/11 8:13 2.59 1.95 0.0071 2.57 1.93 13.055/11 8:14 2.62 1.97 0.0072 2.52 1.90 13.065/11 8:15 2.63 1.98 0.0072 2.49 1.87 13.065/11 8:16 2.62 1.97 0.0072 2.54 1.91 13.065/11 8:17 2.61 1.96 0.0071 2.58 1.94 13.065/11 8:18 2.62 1.97 0.0072 2.52 1.90 13.065/11 8:19 2.64 1.99 0.0072 2.45 1.84 13.065/11 8:20 2.66 2.00 0.0073 2.38 1.79 13.06
5/11 8:21 2.67 2.01 0.0073 2.24 1.69 13.065/11 8:22 2.67 2.01 0.0073 2.18 1.64 13.06
5/11 8:23 2.64 1.99 0.0072 2.19 1.65 13.07
5/11 8:24 2.64 1.99 0.0072 2.26 1.70 13.06
5/11 8:25 2.65 1.99 0.0072 2.22 1.67 13.06
5/11 8:26 2.66 2.00 0.0073 2.17 1.63 13.06
5/11 8:27 2.64 1.99 0.0072 2.17 1.63 13.06
5/11 8:28 2.61 1.96 0.0071 2.24 1.68 13.05
5/11 8:29 2.61 1.96 0.0071 2.25 1.69 13.06
5/11 8:30 2.65 1.99 0.0072 2.14 1.61 13.06
5/11 8:31 2.66 2.00 0.0073 2.04 1.53 13.05
5/11 8:32 2.67 2.01 0.0073 2.02 1.52 13.05
5/11 8:33 2.66 1.99 0.0072 2.07 1.55 13.03
5/11 8:34 2.63 1.97 0.0072 2.17 1.63 13.03
5/11 8:35 2.63 1.97 0.0072 2.18 1.63 13.03
5/11 8:38 2.67 2.00 0.0073 2.02 1.51 13.035/11 8:37 2.68 2.01 0.0073 1.91 1.43 13.03
5/11 8:38 2.65 1.99 0.0072 1.93 1.45 13.03
5/11 8:39 2.66 2.00 0.0073 1.96 1.47 13.04
5/11 8:40 2.65 1.99 0.0072 1.93 1.45 13.04
5/11 8:41 2.66 1.99 0.0072 1.92 1.44 13.03
5/11 8:42 2.65 1.98 0.0072 1.96 1.47 13.02
5/11 8:43 2.62 1.96 0.0071 2.00 1.50 13.03
5/11 8:44 2.65 1.99 0.0072 1.95 1.46 13.04
5/11 8:45 2.68 2.01 0.0073 1.82 1.37 13.04
5/11 8:46 2.68 2.01 0.0073 1.78 1.34 13.04
5/11 8:47 2.64 1.98 0.0072 1.87 1.40 13.03
5/11 8:48 2.62 1.96 0.0071 1.92 1.44 13.02
CeDAR Reports 5/11/201010:33 AM, DeDAR 1-Minute Data Page 1 014
Page 30

(Turbine 1)60-NOx ppm
(Turbine 1) NOxppm (@)15% 02
(Turbine 1)75-NOx (Turbine 1) CO
(Turbine 1) COppm @ 15% 02 (Turbine 1)
Timestamp 1-Min 1-Min lb/mmBtu 1-Mh ppm 1-Min 1 Min 75-02% 1-Min
Average (all) 2.63 1.98 t/ 0.0072 2.22 1.67 1/ 13.05Total (all) -- -- —
Minimum (all) 2.53 1.90 0.0069 1.78 1.34 13.02Maximum (all) 2.68 2.01 0.0073 2.73 2.05 13.07Average (validvalues only)
2.63 1.98 0.0072 2.22 1.67 13.05
Total (validvalues only)
—
Count (validvalues only)
42 42 42 42 42 42
CeDAR Reports 5/11/2010 10:33AM. CeDAR 1-Minute Data Page 2 014
Page 31

guo-n 1
CeDAR 1-Minute DataPanoche Energy Center
Data for 5/11/20108:07 AM thru 5/11/20108:48 AM
Timestamp
(Turbine 1) CTGas Flow
scf/min 1-Min
(Turbine 1) CTGas Flow
kscf/lir 1-Min
(Turbine 1) NH3Injection Flow -
1-Min lb/hr
(Turbine 1) CTMegawatts
1-Min
(Turbine 1)Water Injection
gpm - 1-Min
5/11 8:07 14946.1 896.8 197.125 108.1 0.7245/11 8:08 14930.0 895.8 195.802 108.1 0.7255/11 8:09 14899.0 893.9 195.102 107.7 0.7275/11 8:10 14943.0 898.6 195.956 108.2 0.7185/11 8:11 14936.7 896.2 195.289 108.1 0.7215/11 8:12 14909.6 894.6 194.229 108.2 0.7255/11 8:13 14952.1 897.1 194.870 108.1 0.7225/11 8:14 14953.9 897.2 195.573 108.3 0.7245/11 8:15 14905.7 894.3 194.352 108.0 0.7255/11 8:16 14947.7 896.9 194.602 108.2 0.7275/118:17 14962.5 897.8 194.659 108.2 0.7245/11 8:18 14920.3 895.2 194.255 108.3 0.7215/118:19 14949.0 896.9 194.307 108.0 0.7245/11 8:20 14984.1 897.8 195.794 108.3 0.7225/118:21 14949.5 897.0 195.227 108.2 0.7245/11 8:22 14924.2 895.5 193.841 108.3 0.7255/11 8:23 14952.9 897.2 195.013 108.0 0.7225/11 824 14957.3 897.4 195.531 108.3 0.7225/11 8:25 14923.2 895.4 193.946 108.3 0.7275/11 8:26 14931.0 895.9 194.539 108.2 0.7255/11 8:27 14955.2 897.3 195.339 108.2 0.7285/11 8:28 14947.2 898.8 195.719 108.3 0.7275/11 829 14926.3 895.6 194.755 108.3 0.7265/11 8:30 14967.4 898.0 194.737 108.4 0.724
5/11 8:31 14948.7 896.9 195.000 108.4 0.725
5/11 8:32 14930.0 895.8 194.607 108.4 0.724
5/11 8:33 14984.1 899.0 196.190 108.0 0.727
5/11 8:34 14975.8 898.5 196.073 108.5 0.7225/11 8:35 14938.8 896.3 194.867 108.5 0.7255/11 8:38 14957.8 897.5 195.300 108.8 0.7215/11 8:37 14977.4 898.6 196.211 108.5 0.724
5/11 8:38 14959.4 897.6 196.513 108.2 0.727
5/11 8:39 14925.3 895.5 195.383 108.4 0.730
5/11 8:40 14962.8 897.8 195.563 108.3 0.719
5/118:41 14966.4 898.0 195.846 108.3 0.730
5/118:42 14965.1 897.9 196.597 108.6 0.730
5/11 8:43 14979.7 898.8 196.154 108.6 0.724
5/11 8:44 14970.6 898.2 195.820 108.0 0.725
5/11 8:45 14931.0 895.9 196.414 108 2 0.727108.45/11 8:46 14993.5 899.6 196.511 0.725
5/11 8:47 14973.2 898.4 197.169 108 2 0.728108.45/11 8:48 14969.8 898.2 195.852 0.731
CeDAR Reports 5/11/2910 10:33 AM, CeDAR 1-Minute Data
Page 3014
Page 32

14949.1 896.9 195.396— — --
14899.0 893.9 193.84114993.5 899.6 197.16914949.1 896.9 195.396
42 42 42
Average (all)Total (all)
Minimum (all)Maximum (all)Average (valid
values only)Total (validvalues only)Count (validvalues only)
108.3 0.725-- --
107.7 0.718108.8 0.731108.3 0.725
42 42
12.Q.J' (CD,J4-
(Turbine 1) CT (Turbine 1) CT (Turbine 1) NH3 (Turbine 1) CT (Turbine 1)Gas Flow Gas Flow Injection Flow .Megawatts Water Injection
Timestarnp scf/min 1-Min kscf/hr 1-Min 1-Min lb/hr 1-Mln gpm - 1-Mln
t_o NMI
CeDAR Reports 5/11/2010 10:33 AM, CeDAR 1-Minute Data Page 4 014
Page 33
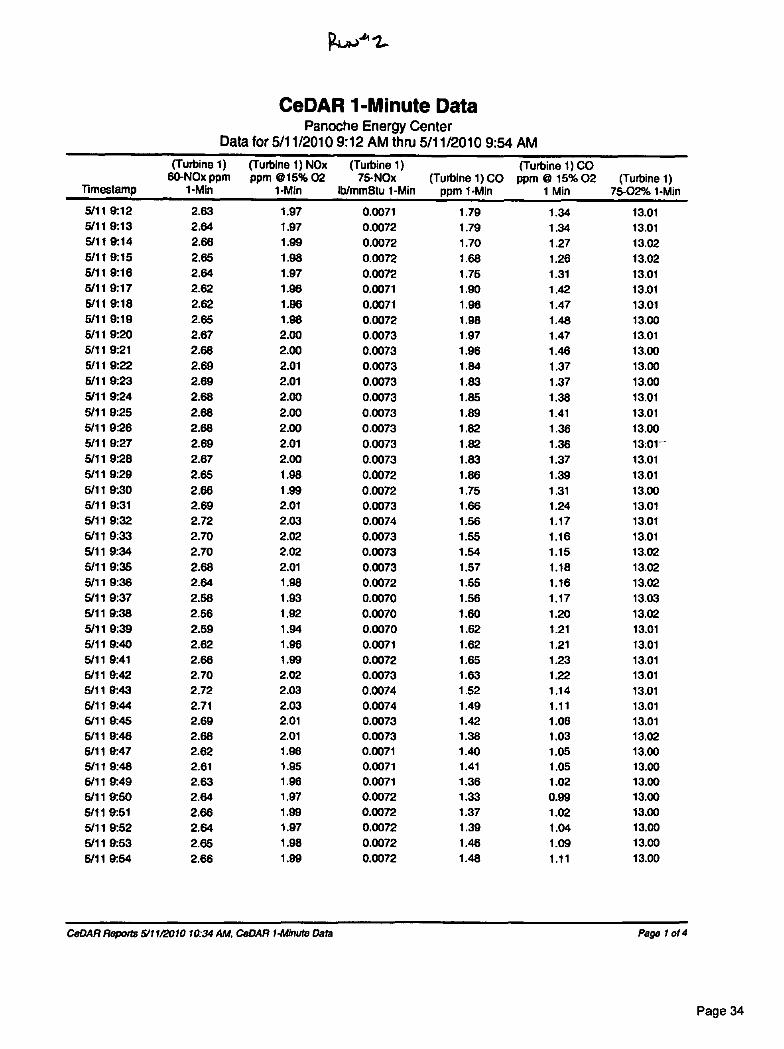
CeDAR 1-Minute DataPanoche Energy Center
Data for 5/11/20109:12 AM thru 5/11/2010 9:54 AM
Ttmestamp
(Turbine 1)60-NOx ppm
1-Min
(Turbine 1) NOxppm @lb% 02
1-Min
(Turbine 1)75-NOx
lb/mmBtu 1-Min(Turbine 1) CO
ppm 1-Min
(Turbine 1) COppm @ 15%02
1 Min(Turbine 1)
75-02% 1-Min
5/119:12 2.63 1.97 0.0071 1.79 1.34 13.015/119:13 2.64 1.97 0.0072 1.79 1.34 13.015/119:14 2.68 1.99 0.0072 1.70 1.27 13.026/11 9:15 2.65 1.98 0.0072 1.68 1.26 13.025/119:16 2.64 1.97 0.0072 1.76 1.31 13.015/119:17 2.62 1.98 0.0071 1.90 1.42 13.015/119:18 2.62 1.96 0.0071 1.96 1.47 13.015/119:19 2.65 1.98 0.0072 1.88 1.48 13.006/11 9:20 2.67 2.00 0.0073 1.97 1.47 13.015/11 9:21 2.68 2.00 0.0073 1.96 1.46 13.005/11 9:22 2.69 2.01 0.0073 1.84 1.37 13.005/11 9:23 2.69 2.01 0.0073 1.83 1.37 13.005/11 9:24 2.68 2.00 0.0073 1.85 1.38 13.015/11 9:25 2.68 2.00 0.0073 1.89 1.41 13.015/11 9:26 2.68 2.00 0.0073 1.82 1.36 13.005/11 9:27 2.69 2.01 0.0073 1.82 1.38 13.01-5/11 9:28 2.87 2.00 0.0073 1.83 1.37 13.015/11 9:29 2.65 1.98 0.0072 1.86 1.39 13.015/11 9:30 2.66 1.99 0.0072 1.75 1.31 13.005/11 9:31 2.69 2.01 0.0073 1.66 1.24 13.015/11 9:32 2.72 2.03 0.0074 1.56 1.17 13.015/11 9:33 2.70 2.02 0.0073 1.56 1.16 13.015/11 9:34 2.70 2.02 0.0073 1.54 1.15 13.025/11 9:35 2.68 2.01 0.0073 1.57 1.18 13.025/11 9:36 2.64 1.98 0.0072 1.55 1.16 13.025I11 9:37 2.58 1.93 0.0070 1.56 1.17 13.035/11 9:38 2.56 1.92 0.0070 1.60 1.20 13.025/11 9:39 2.59 1.94 0.0070 1.62 1.21 13.015/11 9:40 2.62 1.96 0.0071 1.62 1.21 13.015/11 9:41 2.68 1.99 0.0072 1.65 1.23 13.015/11 9:42 2.70 2.02 0.0073 1.63 1.22 13.015/11 9:43 2.72 2.03 0.0074 1.52 1.14 13.016/11 9:44 2.71 2.03 0.0074 1.49 1.11 13.015/11 9:45 2.69 2.01 0.0073 1.42 1.06 13.015/11 9:48 2.68 2.01 0.0073 1.38 1.03 13.026/11 9:47 2.62 1.96 0.0071 1.40 1.05 13.005/11 9:48 2.61 1.95 0.0071 1.41 1.05 13.005/11 9:49 2.63 1.96 0.0071 1.36 1.02 13.005/11 9:50 2.64 1.97 0.0072 1.33 0.99 13.005/11 9:51 2.66 1.99 0.0072 1.37 1.02 13.005/11 9:62 2.64 1.97 0.0072 1.39 1.04 13.005/11 9:53 2.65 1.98 0.0072 1.48 1.09 13.005/119:54 2.66 1.99 0.0072 1.48 1.11 13.00
CeDAR Reports 5/11/2010 10:34 AM, CeDAR 1-Minute Data Page 1 of 4
Page 34

r2ui ( c_o
(Turbine 1)60-NOx ppm
(Turbine 1) NOxppm 4D15% 02
(Turbine 1)75-NOx (Turbine 1) CO
(Turbine 1) COppm @ 15% 02 (Turbine 1)
Timestamp 1-Min 1-Min lb/mmBtu 1-Min ppm 1-Min 1 Min 75-02% 1-Min
Average (all) 2.66 1.99 / 0.0072 / 1.65 1.24 %./ 13.01 le"-Total (all) - -- -- --
Minimum (all) 2.56 1.92 0.0070 1.33 0.99 13.00Maximum (all) 2.72 2.03 0.0074 1.98 1.48 13.03Average (valid
values only)2.66 1.99 0.0072 1.65 1.24 13.01
Total (validvalues only)Count (validvalues only)
43 43 43 43 43 43
CeDAR Reports 5111/2010 10:34 AM, CeDAR 1-Minute Data Page 2 of 4
Page 35

Vown4-1,
CeDAR 1-Minute DataPanoche Energy Center
for 5/11/2010 9:12 AM thru 5/11/2010 9:54 AM
Timestamp
(Turbine 1) CTGas Flow
Scl/min 1-Min
(Turbine 1) CTGas Row
icsehr 1-Min
(Turbine 1) NH3Injection Flow -
1-Min lb/hr
(Turbine 1) CT (Turbine 1)Megawatts Water Injection
1-Min gpm - 1-Min
5/11 9:12 15022.9 901.4 199.292 108.6 0.724
5/11 9:13 14972.9 898.4 196.865 108.4 0.7335/11 9:14 14970.3 898.2 197.320 108.2 0.7285/11 9:15 16008.1 900.5 198.320 108.4 0.728
5/11 9:16 14980.5 898.8 198.018 108.3 0.733
5/11 9:17 14985.7 899.1 197.721 108.6 0.735
5/119:18 15001.6 900.1 198.701 108.5 0.730
5/11 9:19 14957.3 897.4 196.651 108.3 0.727
5/11 9:20 15019.0 901.1 198.458 108.0 0.727
5/11 9:21 14967.7 898.1 197.636 108.2 0.728
5/119:22 14999.8 900.0 197.430 108.6 0.728
5/11 9:23 15014.6 900.9 198.847 108.2 0.725
5/119:24 14963.0 897.8 197.982 108.2 0.730
5/119:25 15016.9 901.0 199.065 108.3 0.728
5/11 9:26 14960.2 897.8 198.503 1082 0.733
5/119:27 15010.4 900.6 198.643 108.2 0.730
5/11 9:28 14952.1 897.1 197.703 108.3 0.733
5/119:29 14998.1 899.8 198.451 108.1 0.730
5/11 9:30 14968.3 898.1 198.084 1082 0.730
5/119:31 14975.0 898.5 197.656 108.0 0.733
5/11 9:32 15013.0 900.8 199.138 108.0 0.727
5/11 9:33 14948.4 898.9 198.693 108.3 0.731
5/11 9:34 15005.2 900.3 199.005 108.0 0.730
5/11 9:35 14979.9 898.8 199.826 108.2 0.725
5/11 9:36 14982.8 899.0 199.498 108.1 0.730
5/11 9:37 15018.8 901.1 200282 108.4 0.730
5/11 9:38 14983.9 899.0 198.927 108.3 0.725
5/11 939 14950.3 897.0 197.100 108.1 0.732
5/11 9:40 14983.6 899.0 198.235 108.2 0.731
5/11 9:41 14977.9 898.7 198.326 108.1 0.730
5/119:42 14962.2 897.7 198.083 108.0 0.731
5/11 9:43 14991.4 899.5 198.732 108.1 0.727
5/11 9:44 14986.0 899.2 198.815 108.0 0.728
5/11 9:45 14978.4 898.7 199.221 108.5 0.730
5/11 9:48 15006.5 900.4 200.023 108.3 0.732
5/11 9:47 14985.7 899.1 198.930 108.4 0.727
5/11 9:48 14979.4 898.8 198.982 108.1 0.730
5/11 9:49 15003.4 900.2 199.673 108.4 0.728
5/11 9:50 14992.5 899.6 198.922 108.0 0.724
6/11 9:51 14958.4 897.5 198.651 108.1 0.731
5/11 9:52 14988.5 899.3 199.404 108.0 0.728
6/11 9:63 14992.2 899.5 199.542 108.2 0.725
5/11 9:54 14937.8 896.3 197.589 107.8 0.728
CeDAR Repotts 5/11/2010 10:34 AM, CeDAR 1-Minute Data Page 3 of 4
Data
Page 36
124)1-)A 7(exia4-)
(Tull)he 1) CT (Turbine 1) CT (Turbine 1) NH3 (Turbine 1) CT (Turbine 1)Gas Flow Gas Flow Injection Flow . Megawatts Water Injection
Timestamp scf/min 1-Min Itscf/hr 1-Min 1-Mh lb/hr 1-Min gpm - 1-Min
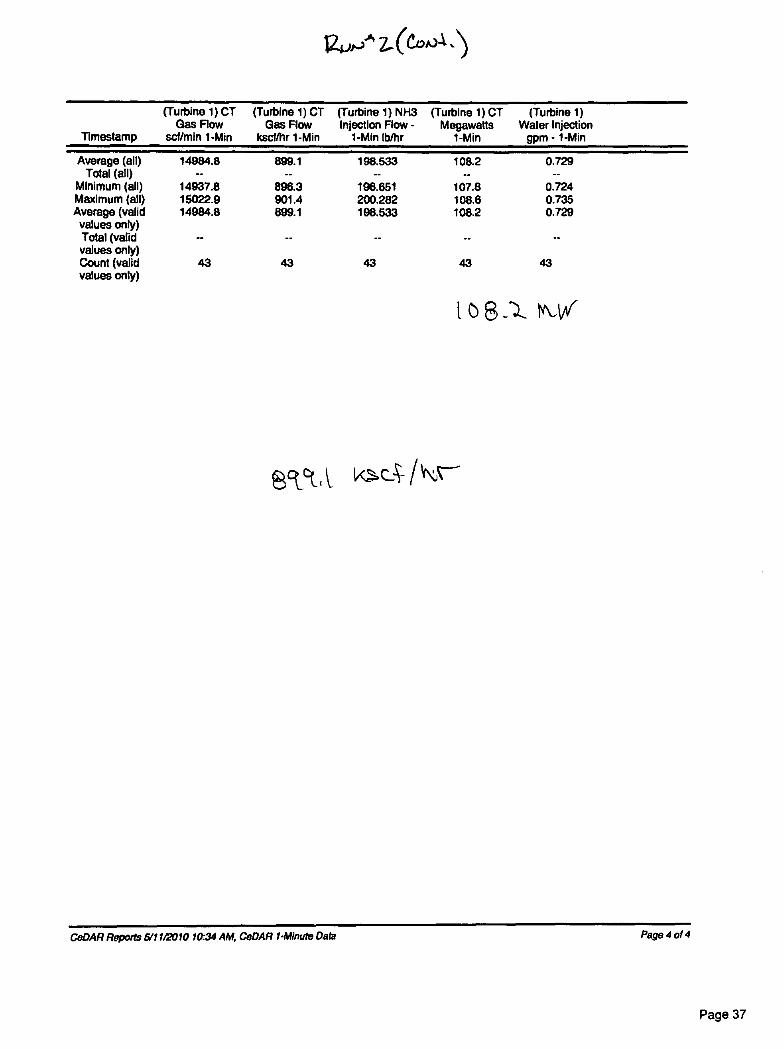
Average (all)
14984.8
899.1
198.533
108.2 0.729Total (all)
-- --Minimum (all)
14937.8
896.3
196.651
107.8 0.724Maximum (all)
15022.9
901.4
200.282
108.6 0.735Average (valid
14984.8
899.1
198.533
108.2 0.729values only)Total (validvalues only)Count (valid
43 43 43 43 43values only)
t 0 8 IsklAr
ectccA tkab\c---
CeDAR Reports 6/11/2010 10:34 AM, CeDAR 1-Minute Data Page 4 014
Page 37
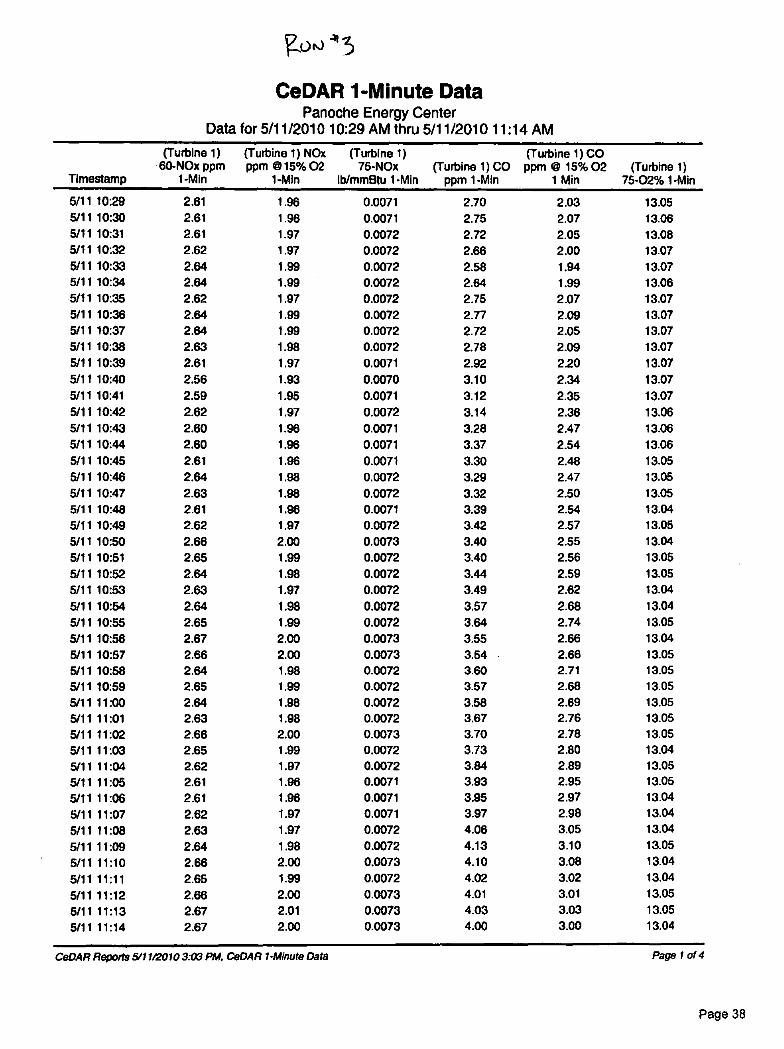
CeDAR 1-Minute DataPanache Energy Center
Data for 5/11/2010 10:29 AM thru 5/11/2010 11:14 AM
Timestamp
(Turbine 1)60-NOx ppm
1-Min
(Turbine 1) NOxppm @15% 02
1-Min
(Turbine 1)75-NOx
lb/mmBtu 1-Min(Turbine 1) CO
ppm 1-Min
(Turbine 1) COppm @ 15% 02
1 Min(Turbine 1)
75-02% 1-Min
5/11 10:29 2.61 1.96 0.0071 2.70 2.03 13.055/11 10:30 2.61 1.96 0.0071 2.75 2.07 13.065/11 10:31 2.61 1.97 0.0072 2.72 2.05 13.085/11 10:32 2.62 1.97 0.0072 2.66 2.00 13.075/11 10:33 2.64 1.99 0.0072 2.58 1.94 13.075/11 10:34 2.64 1.99 0.0072 2.64 1.99 13.065/11 10:35 2.62 1.97 0.0072 2.75 2.07 13.075/11 10:36 2.64 1.99 0.0072 2.77 2.09 13.075/1110:37 2.64 1.99 0.0072 2.72 2.05 13.075/11 10:38 2.63 1.98 0.0072 2.78 2.09 13.075/11 10:39 2.61 1.97 0.0071 2.92 220 13.075/11 10:40 2.56 1.93 0.0070 3.10 2.34 13.075/1110:41 2.59 1.95 0.0071 3.12 2.35 13.075/11 10:42 2.62 1.97 0.0072 3.14 2.38 13.065/11 10:43 2.60 1.96 0.0071 3.28 2.47 13.065/11 10:44 2.60 1.96 0.0071 3.37 2.54 13.065/1110:45 2.61 1.96 0.0071 3.30 2.48 13.055/11 10:46 2.64 1.98 0.0072 3.29 2.47 13.055/11 10:47 2.63 1.98 0.0072 3.32 2.50 13.055/11 10:48 2.61 1.96 0.0071 3.39 2.54 13.045111 10:49 2.62 1.97 0.0072 3.42 2.57 13.05
5/11 10:50 2.68 2.00 0.0073 3.40 2.55 13.04
5/11 10:51 2.65 1.99 0.0072 3.40 2.56 13.05
5/11 10:52 2.64 1.98 0.0072 3.44 2.59 13.055/11 10:53 2.63 1.97 0.0072 3.49 2.62 13.04
5/11 10:54 2.64 1.98 0.0072 3.57 2.68 13.045/11 10:55 2.65 1.99 0.0072 3.64 2.74 13.05
5/11 10:56 2.67 2.00 0.0073 3.55 2.66 13.045/1110:57 2.66 2.00 0.0073 3.54 2.66 13.05
5/11 10:58 2.64 1.98 0.0072 3.60 2.71 13.055/1110:59 2.65 1.99 0.0072 3.57 2.68 13.05
5/11 11:00 2.64 1.98 0.0072 3.58 2.69 13.055/1111:01 2.63 1.98 0.0072 3.67 2.76 13.05
5/11 11:02 2.66 2.00 0.0073 3.70 2.78 13.05
5/11 11:03 2.65 1.99 0.0072 3.73 2.80 13.04
5/11 11:04 2.62 1.97 0.0072 3.84 2.89 13.05
5/11 11:05 2.61 1.96 0.0071 3.93 2.95 13.05
5/11 11:06 2.61 1.96 0.0071 3.95 2.97 13.04
5/1111:07 2.62 1.97 0.0071 3.97 2.98 13.04
5/11 11:08 2.63 1.97 0.0072 4.06 3.05 13.04
5/1111:09 2.64 1.98 0.0072 4.13 3.10 13.05
5/11 11:10 2.66 2.00 0.0073 4.10 3.08 13.04
5/1111:11 2.65 1.99 0.0072 4.02 3.02 13.04
5/11 11:12 2.68 2.00 0.0073 4.01 3.01 13.05
5/1111:13 2.67 2.01 0.0073 4.03 3.03 13.05
5/11 11:14 2.67 2.00 0.0073 4.00 3.00 13.04
CeDAR Reports 5/11/2010 3:03 PM, CeDAR 1-Minute Data Page 1 014
Page 38

(24,f./43 (Co"
(Turbine 1)60-NOx ppm
(Turbine 1) NOxppm @15% 02
(Turbine 1)75-NOx (Turbine 1)C0
(Turbine 1) COppm @15% 02 (Turbine 1)
Timestamp 1-Min 1-Min lb/mmBtu 1-Min ppm 1-Min 1 Min 75-02% 1-Min
Average (all) 2.63 1.98 V 0.0072 3.41 2.56 t./- 13.05 r"Total (all) — -- --
Minimum (all) 2.56 1.93 0.0070 2.58 1.94 13.64Maximum (all) 2.67 2.01 0.0073 4.13 3.10 13.08Average (validvalues only)
2.63 1.98 0.0072 3.41 2.56 13.05
Total (validvalues only)
—
Count (validvalues only)
46 46 46 46 46 46
CeDAR Reports 5/11/2010 3:03 PM, CeDAR 1-Minute Data Page 2 of 4
Page 39
t2.urss' s
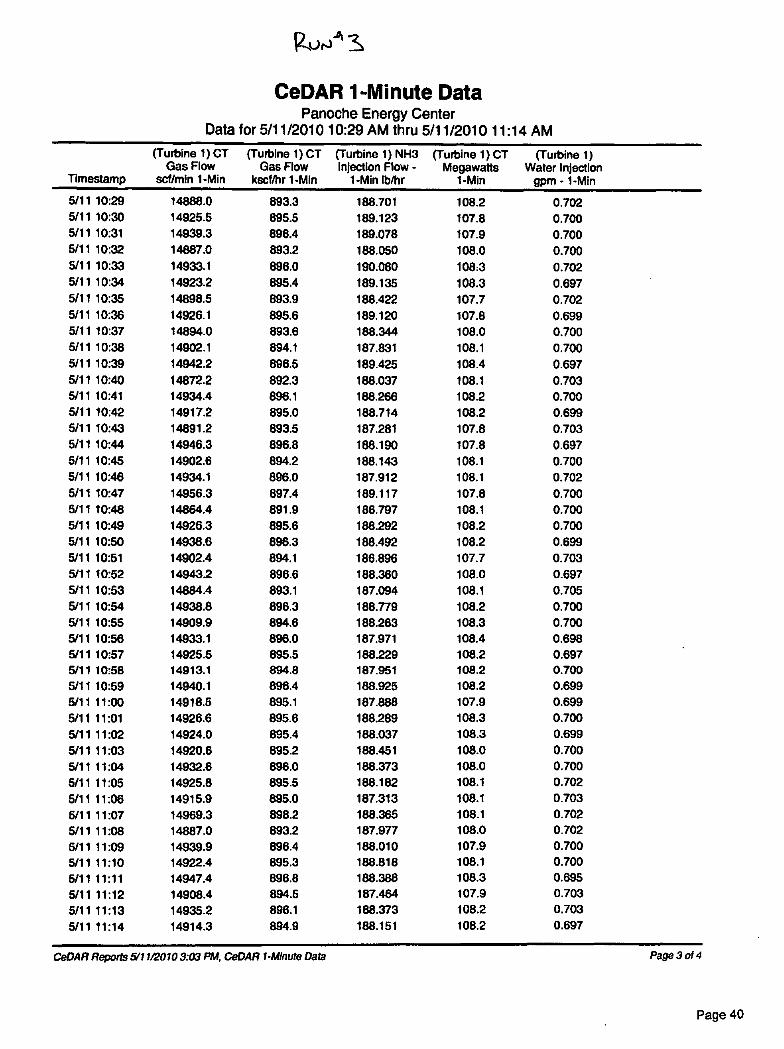
CeDAR 1-Minute DataPanoche Energy Center
Data for 5/11/2010 10:29 AM thru 5/11/2010 11:14 AM
Timestamp
(Turbine 1) CTGas Flow
scf/min 1-Min
(Turbine 1) CTGas Flow
kscf/hr 1-Min
(Turbine 1) NH3Injection Flow -
1-Min lb/hr
(Turbine 1) CTMegawatts
1-Min
(Turbine 1)Water Injection
gpm - 1-Min
5/11 10:29 14888.0 893.3 188.701 108.2 0.7025111 10:30 14925.5 895.5 189.123 107.8 0.7005/11 10:31 14939.3 896.4 189.078 107.9 0.7005/11 10:32 14887.0 893.2 188.050 108.0 0.7005/11 10:33 14933.1 896.0 190.0130 108.3 0.7025/11 10:34 14923.2 895.4 189.135 108.3 0.6975111 10:35 14898.5 893.9 188.422 107.7 0.7025/11 10:36 14928.1 895.6 189.120 107.8 0.6995/1110:37 14894.0 893.6 188.344 108.0 0.7005/11 10:38 14902.1 894.1 187.831 108.1 0.7005/11 10:39 14942.2 898.5 189.425 108.4 0.6975/11 10:40 14872.2 892.3 188.037 108.1 0.7035/1110:41 14934.4 896.1 188.266 108.2 0.7005/1110:42 14917.2 895.0 188.714 108.2 0.6995/11 10:43 14891.2 893.5 187.281 107.8 0.7035/11 10:44 14946.3 896.8 188.190 107.8 0.6975/11 10:45 14902.8 894.2 188.143 108.1 0.7005/11 10:48 14934.1 896.0 187.912 108.1 0.702511110:47 14956.3 897.4 189.117 107.8 0.700511110:48 14864.4 891.9 186.797 108.1 0.7005/11 10:49 14926.3 895.6 188.292 108.2 0.700511110:50 14938.6 896.3 188.492 108.2 0.6995/1110:51 14902.4 894.1 188.896 107.7 0.7035/1110:52 14943.2 896.6 188.360 108.0 0.6975/11 10:53 14884.4 893.1 187.094 108.1 0.7055/11 10:54 14938.8 896.3 188.779 108.2 0.7005/11 10:55 14909.9 894.6 188.263 108.3 0.7005/1110:56 14933.1 898.0 187.971 108.4 0.6985/1110:57 14925.5 895.5 188.229 108.2 0.6975/11 10:58 14913.1 894.8 187.951 108.2 0.7005/1110:59 14940.1 896.4 188.925 108.2 0.6995/11 11:00 14918.5 895.1 187.888 107.9 0.6995/1111:01 14926.6 895.6 188.289 108.3 0.700
5/11 11:02 14924.0 895.4 188.037 108.3 0.699
5/1111:03 14920.6 895 2 188.451 108.0 0.700896.05/11 11:04 14932.6 188.373 108.0 0.700
5/11 11:05 14925.8 895.6 188.182 108.1 0.702
5/11 11:06 14915.9 895.0 187.313 108.1 0.703
5/1111:07 14969.3 898.2 188.365 108.1 0.702
5/1111:08 14887.0 893.2 187.977 108.0 0.702
6/11 11:09 14939.9 896.4 188.010 107.9 0.700
5/11 11:10 14922.4 895.3 188.818 108.1 0.700
6/11 11:11 149474 896.8 188.388 108.3 0.695
5/1111:12 14908.4 894.5 187.484 107.9 0.703
5/11 11:13 14935.2 896.1 188.373 106.2 0.703
5/11 11:14 14914.3 894.9 188.151 108.2 0.697
CeDAR Reports 511 mow 3:03 PM, CeDAR 1-Minute Data
Page 3 of 4
Page 40
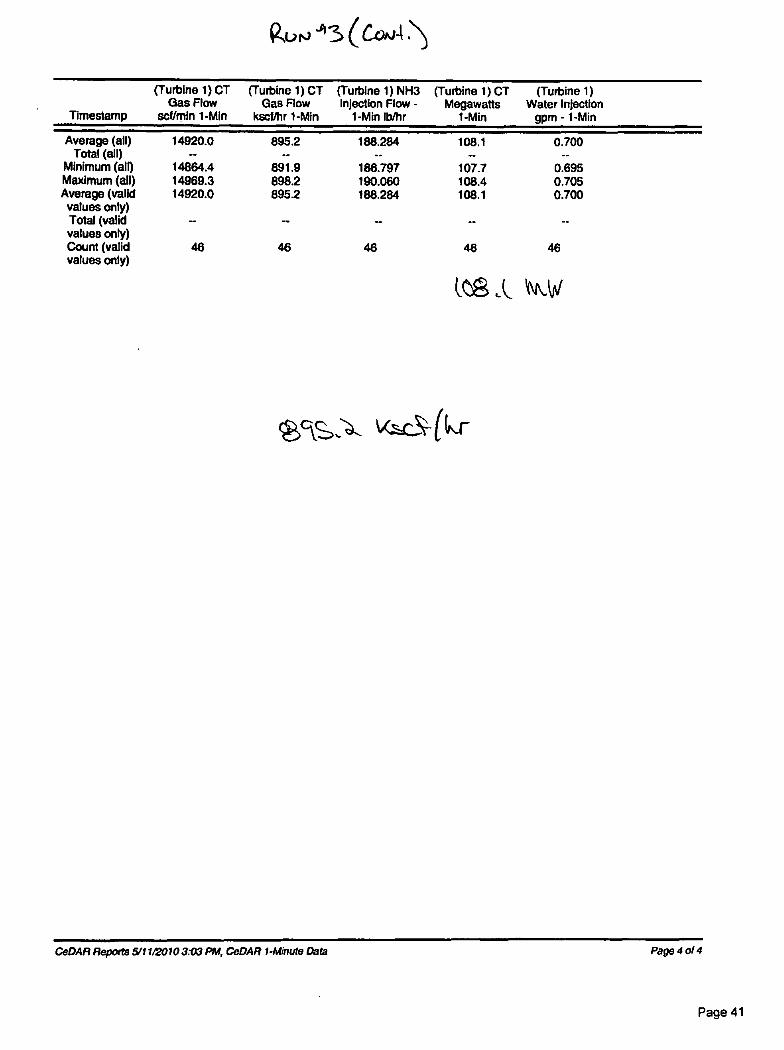
(Turbine 1) CT (Turbine 1) CT (Turbine 1) NH3Gas Flow Gas Flow Injection Flow -
Timestamp scf/mIn 1-Min kscf/hr 1-Mh 1-Min lb/hr
Average (all) 14920.0 895 2 188.284Total (all) -- -- --
Minimum (all) 14864.4 891.9 188.797Maximum (all) 14969.3 898.2 190.060Average (valid 14920.0 895.2 188.284values only)Total (valid —values only)Count (valid 46 46 46values only)
(Turbine 1) CTMegawatts
1-Min
(Turbine 1)Water Injection
gpm - 1-Min
108.1 0.700-- --
107.7 0.695108.4 0.705108.1 0.700
—
48 46
Rut.) it 5 ( Co/44
(06 Vklpf
q3cnS, ,
CeDAR Reports 5/1 mow 3:03 PM, CeDAR 1-Minute Data Page 4 of 4
Page 41
Pax%) 4(1
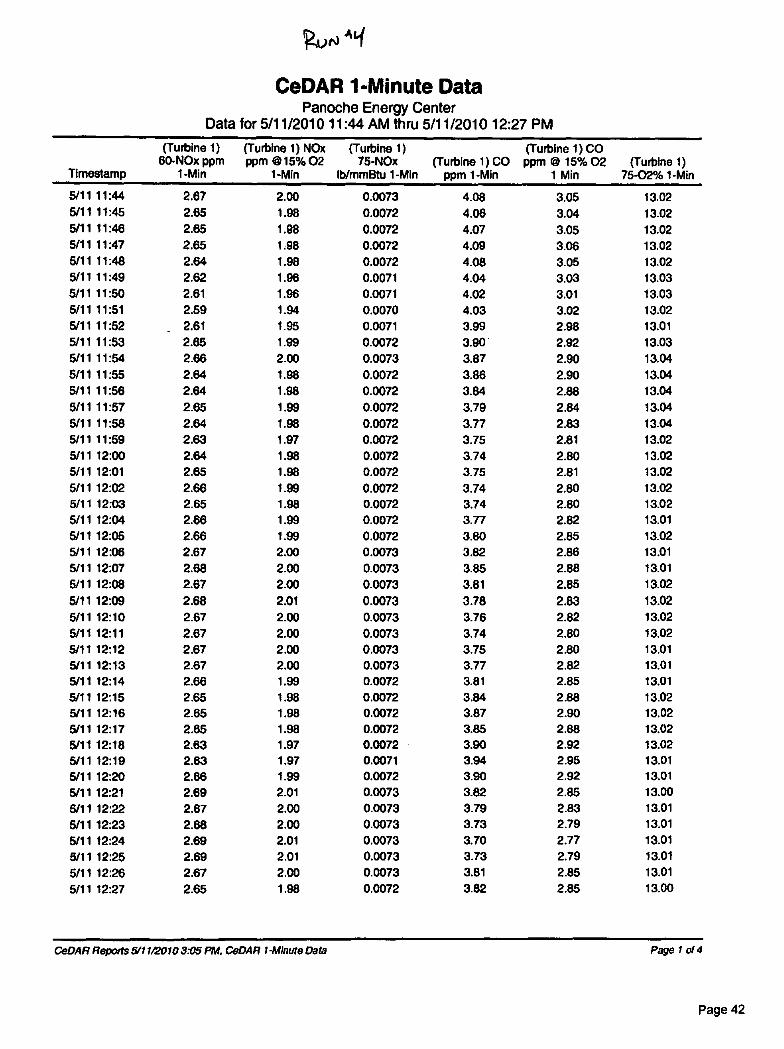
CeDAR 1-Minute DataPanoche Energy Center
Data for 5/11/2010 11:44 AM thru 5/11/2010 12:27 PM
Timestamp
(Turbine 1)60-NOx ppm
1-Min
(Turbine 1) NOxppm 4)15%02
1-Min
(Turbine 1)75-NOx
lb/mmBtu 1-Min(Turbine 1) CO
ppm 1-Min
(Turbine 1) COppm @ 15% 02
1 Min(Turbine 1)
75-02% 1-Min
5/11 11:44 2.67 2.00 0.0073 4.08 3.05 13.025/11 11:45 2.65 1.98 0.0072 4.06 3.04 13.025/11 11:46 2.65 1.98 0.0072 4.07 3.05 13.025/11 11:47 2.65 1.98 0.0072 4.09 3.06 13.025/11 11:48 2.64 1.98 0.0072 4.08 3.05 13.025/11 11:49 2.62 1.96 0.0071 4.04 3.03 13.035/1111:50 2.61 1.96 0.0071 4.02 3.01 13.035/11 11:51 2.59 1.94 0.0070 4.03 3.02 13.025/1111:52 2.61 1.95 0.0071 3.99 2.98 13.015/1111:53 2.65 1.99 0.0072 3.90 2.92 13.035/11 11:54 2.66 2.00 0.0073 3.67 2.90 13.045/11 11:55 2.64 1.98 0.0072 3.86 2.90 13.045/11 11:56 2.64 1.98 0.0072 3.84 2.88 13.045/11 11:57 2.65 1.99 0.0072 3.79 2.84 13.045/11 11:58 2.64 1.98 0.0072 3.77 2.83 13.045/11 11:69 2.63 1.97 0.0072 3.75 2.81 13.025/11 12:00 2.64 1.98 0.0072 3.74 2.80 13.025/11 12:01 2.65 1.98 0.0072 3.75 2.81 13.025/11 12:02 2.68 1.99 0.0072 3.74 2.80 13.025/11 12:03 2.65 1.98 0.0072 3.74 2.80 13.025/11 12:04 2.66 1.99 0.0072 3.77 2.82 13.015/1112:06 2.66 1.99 0.0072 3.80 2.65 13.025/11 12:06 2.67 2.00 0.0073 3.82 2.86 13.015/1112:07 2.68 2.00 0.0073 3.85 2.88 13.015/1112:08 2.67 2.00 0.0073 3.81 2.85 13.02
5/11 12:09 2.68 2.01 0.0073 3.78 2.83 13.025/11 12:10 2.67 2.00 0.0073 3.76 2.82 13.025/1112:11 2.87 2.00 0.0073 3.74 2.80 13.025/1112:12 2.87 2.00 0.0073 3.75 2.80 13.015/1112:13 2.67 2.00 0.0073 3.77 2.82 13.015/1112:14 2.66 1.99 0.0072 3.81 2.85 13.015/1112:15 2.65 1.98 0.0072 3.84 2.88 13.025/1112:16 2.65 1.98 0.0072 3.87 2.90 13.025/1112:17 2.65 1.98 0.0072 3.85 2.88 13.025/1112:18 2.83 1.97 0.0072 3.90 2.92 13.025/1112:19 2.63 1.97 0.0071 3.94 2.95 13.016/11 12:20 2.86 1.99 0.0072 3.90 2.92 13.01
5/11 12:21 2.69 2.01 0.0073 3.82 2.85 13.005/11 12:22 2.87 2.00 0.0073 3.79 2.83 13.01
5/1112:23 2.68 2.00 0.0073 3.73 2.79 13.01
5/11 12:24 2.69 2.01 0.0073 3.70 2.77 13.01
5/1112:25 2.69 2.01 0.0073 3.73 2.79 13.01
5/11 12:26 2.67 2.00 0.0073 3.81 2.85 13.01
5/11 12:27 2.65 1.98 0.0072 3.82 2.85 13.00
CeDAR Reports 5/11/2010 3:05 PM, CeDAR 1-Minute Data Page 1 o14
Page 42

Ruomq (Cowl (Turbine 1)
60-NOx ppm(Turbine 1) NOxppm E015% 02
(Turbine 1)75-NOx (Turbine 1) CO
(Turbine 1) COppm @ 15% 02 (Turbine 1)
Timestamp 1-Min 1-Min lb/mmEttu 1-Min ppm 1-Min 1 Min 75-02% 1-Min
Average (all) 2.65 1.99 0.0072 3.85 2.89 13.02Total (all) -- -- -- — --
Minimum (all) 2.59 1.94 0.0070 3.70 2.77 13.00Maximum (all) 2.69 2.01 0.0073 4.09 3.08 13.04Average (validvalues only)
2.65 1.99 0.0072 3.85 2.89 13.02
Total (validvalues only)Count (validvalues only)
44 44 44 44 44 44
CeDAR Repotts 5/11/20103:05 PM, CeDAR 1-Minute Data Page 20/4
Page 43
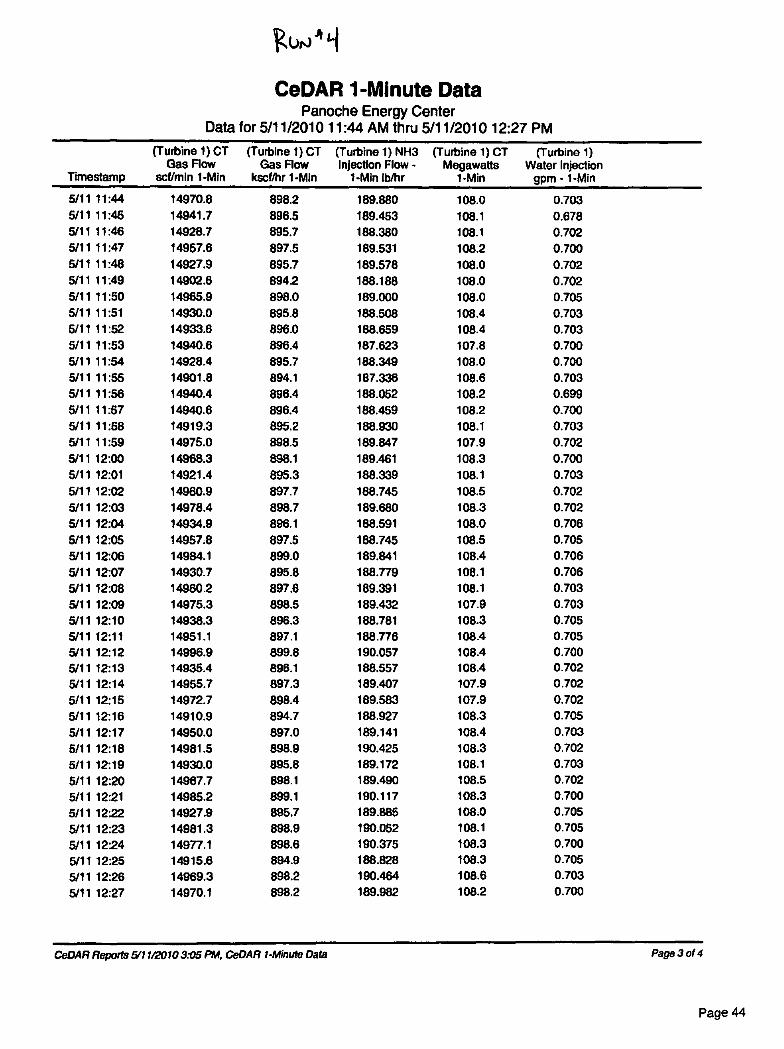
CeDAR 1-Minute DataPanoche Energy Center
Data for 5/11/2010 11:44 AM thru 5/11/2010 12:27 PM
Timestamp
(Turbine 1) CTGas Flow
scf/min 1-Mh
(Turbine 1) CTGas Flow
lcscf/hr 1-MM
(Turbine 1) NH3Injection Flow -
1-Mh lb/hr
(Turbine 1) CTMegawatts
1-Mh
(Turbine 1)Water Injection
gpm - 1-Min
5/11 11:44 14970.8 898.2 189.880 108.0 0.7035/11 11:46 14941.7 896.5 189.463 108.1 0.6785/11 11:46 14928.7 895.7 188.380 108.1 0.7025/11 11:47 14957.6 897.5 189.531 108.2 0.7005/11 11:48 14927.9 895.7 189.578 108.0 0.7025/11 11:49 14902.6 8942 188.188 108.0 0.7025/11 11:50 14965.9 898.0 189.000 108.0 0.7055/11 11:51 14930.0 895.8 188.508 108.4 0.7035/11 11:52 14933.6 898.0 188.659 108.4 0.7035/1111:53 14940.6 896.4 187.623 107.8 0.7005/11 11:54 14928.4 895.7 188.349 108.0 0.7005/11 11:55 14901.8 894.1 187.336 108.6 0.7035/11 11:56 14940.4 896.4 188.052 108.2 0.6995/11 11:57 14940.6 896.4 188.459 108.2 0.7005/11 11:68 14919.3 895.2 188.930 108.1 0.7035/11 11:59 14975.0 898.5 189.847 107.9 0.7025/11 12:00 14968.3 898.1 189.461 108.3 0.7005/1112:01 14921.4 895.3 188.339 108.1 0.7035/11 12:02 14960.9 897.7 188.745 108.5 0.7025/11 12:03 14978.4 898.7 189.680 108.3 0.7025/11 12:04 14934.9 896.1 188.591 108.0 0.706
5/11 12:05 14957.8 897.5 188.745 108.5 0.7055/1112:08 14984.1 899.0 189.841 108.4 0.706
5/1112:07 14930.7 895.8 188.779 108.1 0.7065/1112:08 14960.2 897.6 189.391 108.1 0.703
5/11 12:09 14975.3 898.5 189.432 107.9 0.7035/1112:10 14938.3 896.3 188.781 108.3 0.7055/1112:11 14951.1 897.1 188.776 108.4 0.7055/1112:12 14996.9 899.8 190.057 108.4 0.7005/1112:13 14935.4 896.1 188.557 108.4 0.702
511112:14 14955.7 897.3 189.407 107.9 0.702
5/11 12:15 14972.7 898.4 189.583 107.9 0.702
5/11 12:16 14910.9 894.7 188.927 108.3 0.705
5/1112:17 14950.0 897.0 189.141 108.4 0.703
5/11 12:18 14981.5 898.9 190.425 108.3 0.702
5/11 12:19 14930.0 895.8 189.172 108.1 0.703
5/11 12:20 14987.7 898.1 189.490 108.5 0.702
5/11 12:21 14985.2 899.1 190.117 108.3 0.700
5/11 1222 14927.9 895.7 189.885 108.0 0.705
5/1112:23 14981.3 898.9 190.052 108.1 0.705
5/11 12:24 14977.1 898.6 190.375 108.3 0.700
5/1112:25 14915.6 894.9 188.828 108.3 0.705
5/11 12:26 14969.3 898.2 190.484 108.6 0.703
5/1112:27 14970.1 898.2 189.982 108.2 0.700
CeDAR Reports 5111/20103:05 PM, CeDAR 1-Minute Data Page 3 of 4
Page 44
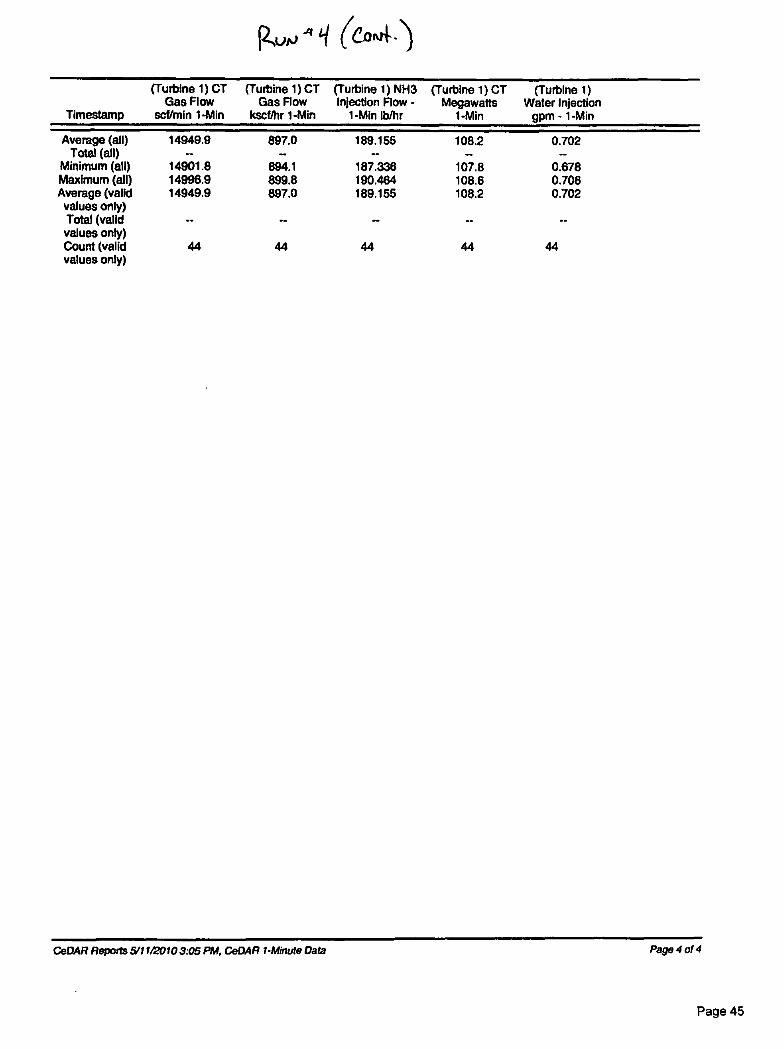
(Turbine 1) CTMegawatts
1-Min
(Turbine 1)Water Injection
gpm - 1-Min
108.2 0.702— --
107.8 0.678108.6 0.706108.2 0.702
44 44
(Turbine 1) CT (Turbine 1) CT (Turbine 1) NH3Gas Flow Gas Flow Injection Flow -
Timestamp scf/mln 1-Mh kscf/hr 1-Mh 1-Mh lb/hr
Average (all) 14949.9 897.0 189.155Total (all) — — --
Minimum (all) 14901.8 894.1 187.336Maximum (all) 14996.9 899.8 190.464Average (valid 14949.9 897.0 189.155values only)Total (valid —values only)Count (valid 44 44 44values only)
p,,„ q (e-orut
CeDAR Repasts 5/11/2010 3:05 PM, CeDAR 1-Minute Data Page 4 of 4
Page 45
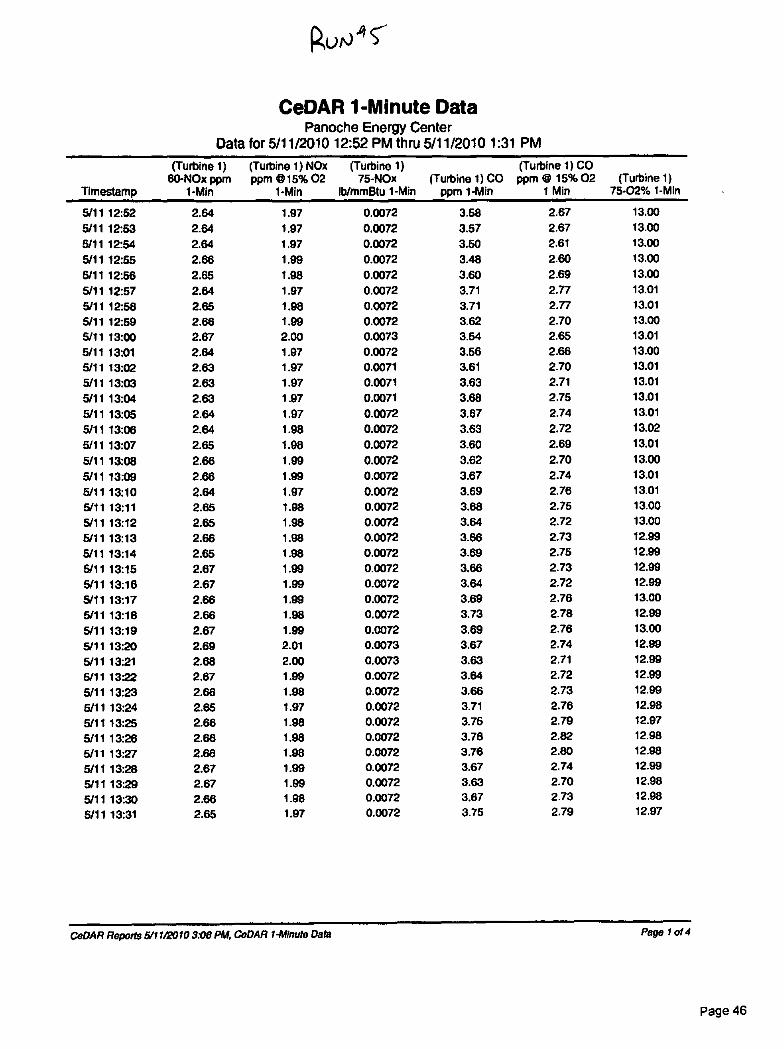
Ruio c
CeDAR 1-Minute DataPanoche Energy Center
Data for 5/11/2010 12:52 PM thru 5/11/2010 1:31 PM
Timestan,
(Turbine 1)60-NOx ppm
1-Min
(Turbine 1) NOxppm 015% 02
1-Min
(Turbine 1)75-NOx
lb/mmBtu 1-Min(Turbine 1) CO
ppm 1-Min
(Turbine 1) COppm @ 15% 02
1 Min 75-02%(Turbine 1)
1-Min
5/11 12:52 2.64 1.97 0.0072 3.58 2.67 13.005/11 12:53 2.64 1.97 0.0072 3.57 2.67 13.006/11 12:54 2.84 1.97 0.0072 3.50 2.81 13.005/11 12:65 2.66 1.99 0.0072 3.48 2.60 13.005/11 12:56 2.65 1.98 0.0072 3.60 2.69 13.005/11 12:57 2.64 1.97 0.0072 3.71 2.77 13.015/11 12:58 2.85 1.98 0.0072 3.71 2.77 13.015/1112:59 2.66 1.99 0.0072 3.62 2.70 13.005/11 13:00 2.67 2.00 0.0073 3.64 2.65 13.015/11 13:01 2.64 1.97 0.0072 3.56 2.66 13.005/11 13:02 2.63 1.97 0.0071 3.61 2.70 13.01
5/11 13:03 2.63 1.97 0.0071 3.63 2.71 13.015/11 13:04 2.63 1.97 0.0071 3.68 2.75 13.01
5/11 13:05 2.64 1.97 0.0072 3.67 2.74 13.01
5/11 13:06 2.64 1.98 0.0072 3.63 2.72 13.02
5/11 13:07 2.65 1.98 0.0072 3.60 2.69 13.01
5/11 13:08 2.66 1.99 0.0072 3.62 2.70 13.00
5/11 13:09 2.66 1.99 0.0072 3.67 2.74 13.01
5/1113:10 2.64 1.97 0.0072 3.69 2.76 13.015/1113:11 2.65 1.98 0.0072 3.88 2.75 13.005/1113:12 2.65 1.98 0.0072 3.64 2.72 13.00
5/1113:13 2.66 1.98 0.0072 3.66 2.73 12.99
5/1113:14 2.65 1.98 0.0072 3.69 2.75 12.99
5/1113:15 2.67 1.99 0.0072 3.66 2.73 12.99
5/1113:16 2.67 1.99 0.0072 3.64 2.72 12.99
5/1113:17 2.66 1.99 0.0072 3.69 2.76 13.00
5/1113:18 2.66 1.98 0.0072 3.73 2.78 12.99
5/1113:19 2.67 1.99 0.0072 3.69 2.76 13.00
5/11 13:20 2.69 2.01 0.0073 3.67 2.74 12.99
5/1113:21 2.68 2.00 0.0073 3.63 2.71 12.99
5/11 13:22 2.67 1.99 0.0072 3.84 2.72 12.99
5/1113:23 2.68 1.98 0.0072 3.66 2.73 12.99
5/1113:24 2.65 1.97 0.0072 3.71 2.78 12.98
5/11 13:25 2.66 1.98 0.0072 3.75 2.79 12.97
5/11 13:26 2.88 1.98 0.0072 3.78 2.82 12.98
5/11 13:27 2.66 1.98 0.0072 3.76 2.80 12.98
5/11 13:28 2.67 1.99 0.0072 3.67 2.74 12.99
5/11 13:29 2.67 1.99 0.0072 3.63 2.70 12.98
5/11 13:30 2.66 1.98 0.0072 3.67 2.73 12.98
5/1113:31 2.65 1.97 0.0072 3.75 2.79 12.97
CeDAR Reports 5/11/2010 308 PM, CeDAR 1-Minute Data Page 1 o14
Page 46

NA)( CONi
(Turbine 1)60-NOx ppm
(Turbine 1) NOxppm @15% 02
(Turbine 1)75-NOx (Turbine 1) CO
(Turbine 1) COppm @ 15% 02 (Turbine 1)
Timestamp 1-Min 1-Min lb/mmBtu 1-Min ppm 1-Min 1 Min 75-02% 1-Min
Average (all) 2.65 1.98 0.0072 3.65 2.73 13.00Total (all) -- -- -- -- --
Minimum (all) 2.63 1.97 0.0071 3.48 2.60 12.97Maximum (all) 2.69 2.01 0.0073 3.78 2.82 13.02Average (validvalues only)
2.65 1.98 0.0072 3.65 2.73 13.00
Total (validvalues only)
—
Count (validvalues only)
40 40 40 40 40 40
CeDAR Reports 5/11/20103.06 PM, CeDAR 1-Minute Data Page 2 of 4
Page 47
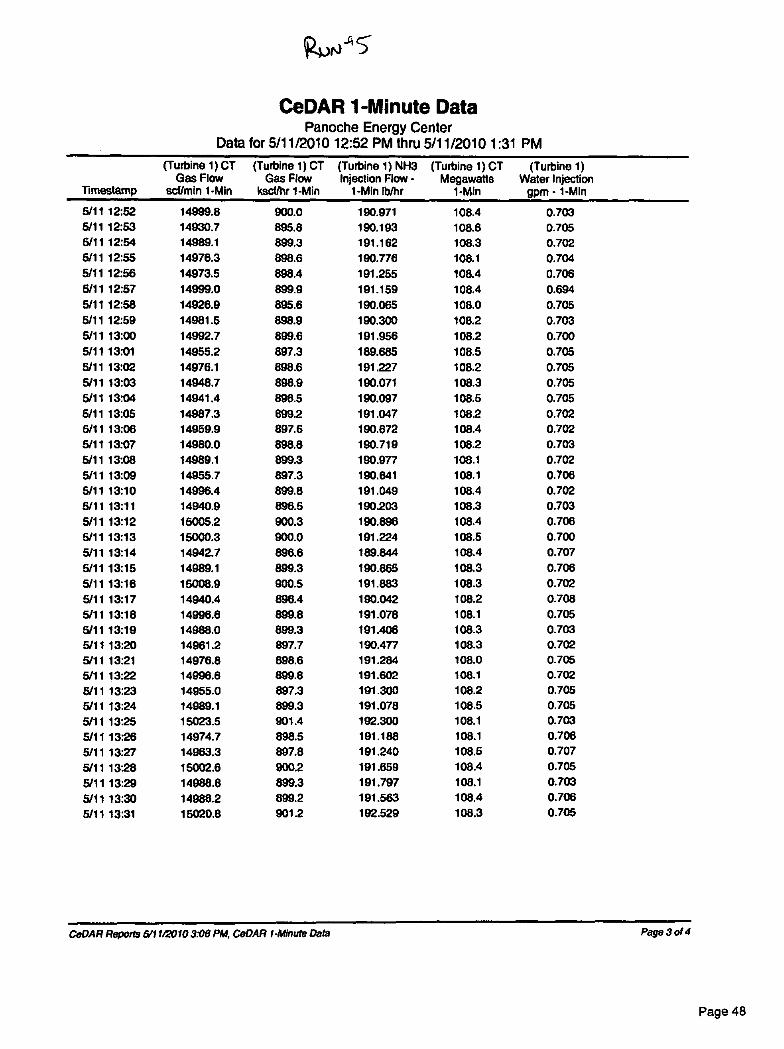
P4)0'5
CeDAR 1-Minute DataPanoche Energy Center
for 5/11/2010 12:52 PM thru 5/11/2010 1:31 PM
Thnestamp
(Turbine 1) CTGas Flow
act/min 1-Min
(Turbine 1) CTGas Flow
ksct/hr 1-Min
(Turbine 1) NH3Injection Flow -
1-Min lb/hr
(Turbine 1) CTMegawatts
1-Min
(Turbine 1)Water Injection
gpm - 1-Min
5/11 12:52 14999.8 900.0 190.971 108.4 0.7035/11 12:53 14930.7 895.8 190.193 108.6 0.7055/11 12:54 14989.1 899.3 191.162 108.3 0.7026/11 12:55 14976.3 898.6 190.776 1081 0.7045/11 12:56 14973.5 898.4 191.255 108.4 0.7085/11 12:57 14999.0 899.9 191.159 108.4 0.6945/11 12:58 14926.9 895.6 190.085 108.0 0.7055/11 12:59 14981.5 898.9 190.300 108.2 0.7035/11 13:00 14992.7 899.6 191.956 108.2 0.7005/11 13:01 14955.2 897.3 189685 108.5 0.7055/11 13:02 14976.1 698.6 191.227 108.2 0.7055/11 13:03 14948.7 898.9 190.071 108.3 0.7055/11 13:04 14941.4 896.5 190.097 108.5 0.7055/11 13:05 14987.3 899.2 191.047 108.2 0.7026/11 13:06 14959.9 897.6 190.672 108.4 0.7025/1113:07 14980.0 898.8 190.719 108.2 0.7035/11 13:08 14989.1 899.3 190.977 108.1 0.7025/11 13:09 14955.7 897.3 190.641 108.1 0.7085/1113:10 14996.4 899.8 191.049 108.4 0.7025/1113:11 14940.9 898.5 190.203 108.3 0.7035/1113:12 16005.2 900.3 190.896 108.4 0.7065/1113:13 15000.3 900.0 191.224 108.5 0.7005/1113:14 14942.7 896.6 189.844 108.4 0.7075/1113:15 14989.1 899.3 190.865 108.3 0.7065/1113:16 15008.9 900.5 191.883 108.3 0.7025/1113:17 14940.4 896.4 190.042 108.2 0.7085/1113:18 14996.8 899.8 191.078 108.1 0.7055/1113:19 14988.0 899.3 191.406 108.3 0.7035/11 13:20 14961.2 897.7 190.477 108.3 0.7025/1113:21 14976.8 898.6 191.284 108.0 0.7055/11 13:22 14996.8 899.8 191.602 108.1 0.7025/1113:23 14955.0 897.3 191.300 108.2 0.7055/1113:24 14989.1 899.3 191.078 108.5 0.7055/1113:25 15023.5 901.4 192.300 108.1 0.7035/11 13:26 14974.7 898.5 191.188 108.1 0.706
5/11 13:27 14963.3 897.8 191.240 108.5 0.707
5/11 13:28 15002.6 900.2 191.659 108.4 0.705
5/11 1329 14988.8 899.3 191.797 1081 0.703
5/11 13:30 14986.2 899.2 191.563 108.4 0.706
5/1113:31 16020.8 901.2 192.529 108.3 0.705
CeDAR Reports 6/11/2010 3:06 PM, CeDAR I-Minute Data
Page 3 of 4
Data
Page 48
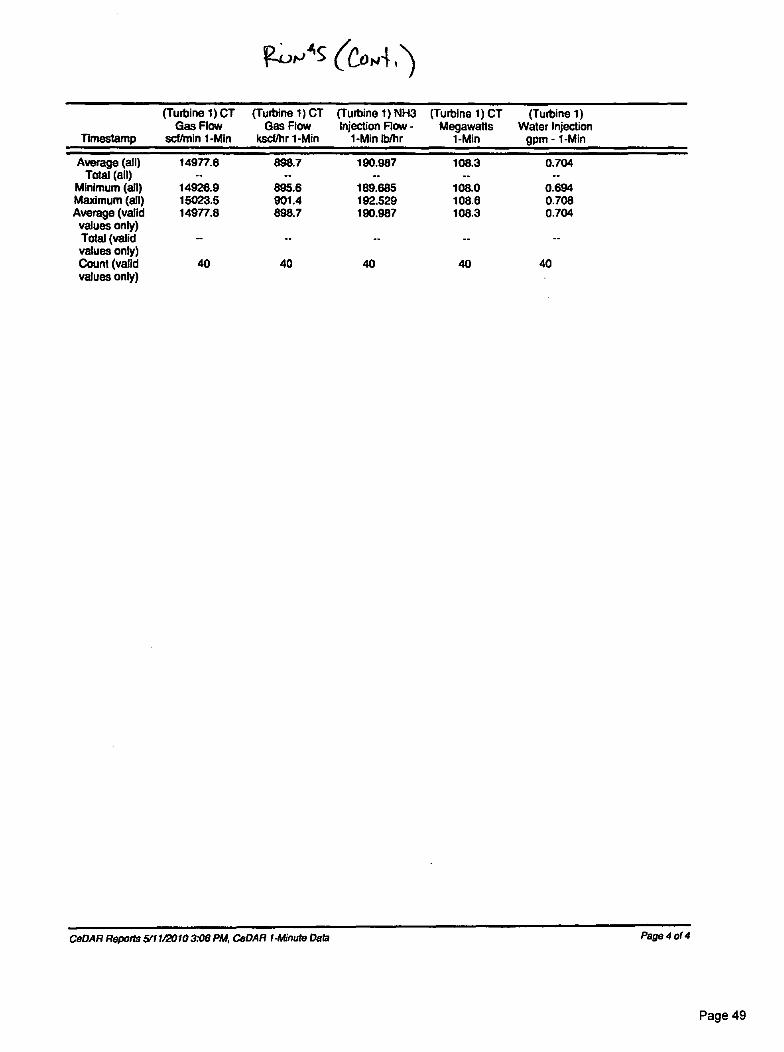
(Turbine 1) CT (Turbine 1) CT (Turbine 1) NH3 (Turbine 1) CT (Turbine 1)Gas Flow Gas Flow Injection Row - Megawatts Water Injection
Timestarnp sctimin 1-Min kscf/hr 1-Min 1-Min lb/hr 1-Min gpm - 1-Min
Average (all) 14977.8 898.7 190.987 108.3 0.704Total (all) — — -- -- --
Minimum (all) 14926.9 895.6 189.685 108.0 0.694Maximum (all) 15023.5 901.4 192.529 108.6 0.708Average (valid 14977.8 898.7 190.987 108.3 0.704
values only)Total (valid —values only)Count (valid ao 40 40 40 aovalues only)
CeDAR Reports 5/11/2010 3:08 PM, CeDAR 1-Minute Data
Page 4 014
Page 49

Rtio.A; (to
CeDAR 1-Minute DataPanoche Energy Center
Data for 5/11/2010 1:48 PM thru 5/11/20102:28 PM
Timestamp
(Turbine 1)60-NOx ppm
1-Min
(Turbine 1) NOxppm 41015% 02
1-Min
(Turbine 1)75-NOx
lb/mmBtu 1-MM(Turbine 1) CO
ppm 1-Min
(Turbine 1) COppm @ 15% 02
1 Min(Turbine 1)
75-02% 1-Min
5/1113:48 2.87 1.99 0.0072 3.67 2.73 12.985/11 13:49 2.69 2.00 0.0073 3.66 2.73 12.985/11 13:50 2.68 2.00 0.0073 3.67 2.73 12.985/11 13:51 2.66 1.98 0.0072 3.74 2.79 12.985/1113:52 2.65 1.97 0.0072 3.77 2.81 12.985/11 13:53 2.66 1.98 0.0072 3.77 2.80 12.975/11 13:64 2.66 1.98 0.0072 3.73 2.78 12.975/11 13:65 2.68 1.99 0.0072 3.72 2.77 12.975/11 13:58 2.68 1.99 0.0072 3.72 2.77 12.975/11 13:57 2.68 1.98 0.0072 3.73 2.78 12.975/11 13:58 2.66 1.98 0.0072 3.71 2.76 12.975/1113:59 2.65 1.97 0.0072 3.61 2.69 12.975/11 14:00 2.66 1.98 0.0072 3.61 2.69 12.975/1114:01 2.66 1.98 0.0072 3.71 2.76 12.985/11 14:02 2.66 1.97 0.0072 3.75 2.79 12.975/11 14:03 2.85 1.97 0.0072 3.70 2.75 12.975/11 14:04 2.65 1.97 0.0072 3.67 2.73 12.975/11 14:05 2.64 1.97 0.0071 3.75 2.79 12.985/11 14:06 2.62 1.95 0.0071 3.83 2.85 12.975/1114:07 2.61 1.94 0.0071 3.85 2.86 12.975/11 14:08 2.62 1.96 0.0071 3.86 2.87 12.975/11 14:09 2.65 1.97 0.0072 3.82 2.84 12.965/1114:10 2.68 1.99 0.0072 3.70 2.75 12.965/1114:11 2.69 2.00 0.0073 3.69 2.75 12.975/1114:12 2.67 1.99 0.0072 3.72 2.77 12.985/1114:13 2.66 1.98 0.0072 3.76 2.80 12.975/11 14:14 2.67 1.99 0.0072 3.83 2.85 12.975/11 14:15 2.68 1.99 0.0072 3.80 2.83 12.975/11 14:16 2.69 2.00 0.0073 3.78 2.81 12.975/1114:17 2.68 1.99 0.0072 3.82 2.84 12.975/1114:18 2.67 1.98 0.0072 3.91 2.91 12.985/1114:19 2.69 2.00 0.0073 3.91 2.91 12.985/11 14:20 2.68 2.00 0.0073 3.86 2.88 12.985/11 1421 2.66 1.98 0.0072 3.83 2.85 12.985/11 14:22 2.85 1.97 0.0072 3.88 2.88 12.985/11 14:23 2.64 1.96 0.0071 3.69 2.89 12.975/1114:24 2.65 1.97 0.0072 3.90 2.90 12.966/11 14:25 2.87 1.99 0.0072 3.90 2.90 12.975/11 14:26 2.88 1.99 0.0072 3.95 2.94 12.975/1114:27 2.67 1.98 0.0072 3.96 2.94 12.965/11 14:28 2.68 1.99 0.0072 3.89 2.89 12.95
CeDAR Reports 5/11/2010 3:08 PM, CeDAR 1-Minute Data Page 1 of 4
Page 50

(24.204 Cf. (co 1.14
(Turbine 1)60-NOx ppm
(Turbine 1) NOxppm (415% 02
(Turbine 1)75-NOx (Turbine 1) CO
(Turbine 1) COppm @ 15% 02 (Turbine 1)
Timestamp 1-Min 1-Min lb/mm8tu 1-Min ppm 1-Min 1 Min 75-02% 1-Min
Average (all) 2.66 1.98 0.0072 3.78 2.81 12.97Total (all) -- -- -- -- -
Minimum (all) 2.61 1.94 0.0071 3.61 2.69 12.95Maximum (all) 2.69 2.00 0.0073 3.96 2.94 12.98Average (validvalues only)
2.66 1.98 0.0072 3.78 2.81 12.97
Total (validvalues only)
-
Count (validvalues only)
41 41 41 41 41 41
CeDAR Reports 5/11/2010 306 PM, CeDAR 1-Minute Data Page 2 of 4
Page 51
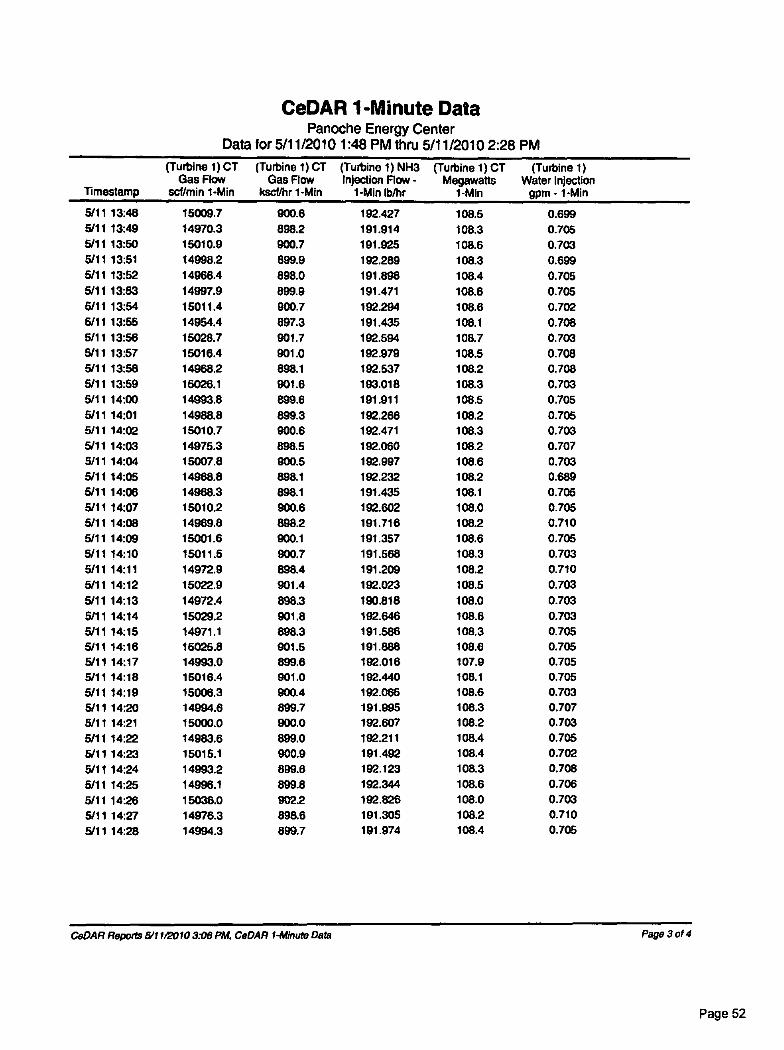
CeDAR 1-Minute DataPanoche Energy Center
Data for 5/11/2010 1:48 PM thru 5/11/20102:28 PM
Timestamp
(Turbine 1) CTGas Flow
sct/min 1-Min
(Turbine 1) CTGas Flow
kscVhr 1-Mh
(Turbine 1) NH3Injection Flow -
1-Mh lb/hr
(Turbine 1) CTMegawatts
1-Min
(Turbine 1)Water Injection
gpm - 1-Min
5/11 13:48 15009.7 900.6 192.427 108.5 0.6995/11 13:49 14970.3 898.2 191.914 108.3 0.7055/11 13:50 15010.9 900.7 191.925 108.6 0.7036/11 13:51 14998.2 899.9 192.289 108.3 0.6995/11 13:52 14966.4 898.0 191.898 108.4 0.7055/11 13:63 14997.9 899.9 191.471 108.6 0.7056/11 13:54 15011.4 900.7 192.294 108.6 0.7026/11 13:55 14964.4 897.3 191.435 108.1 0.7086/11 13:56 15028.7 901.7 192.594 108.7 0.703511113:57 15016.4 901.0 192.979 108.5 0.7085/11 13:58 14968.2 898.1 192.537 108.2 0.7085/1113:59 15026.1 901.6 193.018 108.3 0.7035/11 14:00 14993.8 899.6 191.911 108.5 0.7055/1114:01 14988.8 899.3 192.266 108.2 0.7055/11 14:02 15010.7 900.6 192.471 108.3 0.7035/11 14:03 14975.3 898.5 192.060 108.2 0.7075/11 14:04 16007.8 900.5 192.997 108.6 0.7035/11 14:05 14968.8 898.1 192.232 108.2 0.6895/11 14:06 14968.3 898.1 191.435 108.1 0.7055/1114:07 15010.2 900.6 192.602 108.0 0.7055/11 14:08 14969.8 898.2 191.716 108.2 0.7105/11 14:09 15001.6 900.1 191.357 108.6 0.7055/11 14:10 15011.5 900.7 191.588 108.3 0.7035/1114:11 14972.9 898.4 191.209 108.2 0.7105/1114:12 15022.9 901.4 192.023 108.5 0.7035/1114:13 14972.4 898.3 190.818 108.0 0.7035/1114:14 15029.2 901.8 192.646 108.6 0.7035/1114:15 14971.1 898.3 191.586 108.3 0.7055/1114:16 16025.8 901.5 191.888 108.6 0.7055/1114:17 14993.0 899.6 192.016 107.9 0.7055/1114:18 15016.4 901.0 192.440 108.1 0.7055/1114:19 15006.3 900.4 192.066 108.6 0.7036/11 14:20 14994.6 899.7 191.995 108.3 0.7075/1114:21 15000.0 900.0 192.607 108.2 0.7036/11 14:22 14983.6 899.0 192.211 108.4 0.7056/11 14:23 15015.1 900.9 191.492 108.4 0.7025/11 14:24 14993.2 899.6 192.123 108.3 0.7086/11 14:25 14996.1 899.8 192.344 108.6 0.7065111 14:26 15038.0 902.2 192.826 108.0 0.7035/1114:27 14976.3 898.6 191 305 108.2 0.710
191.9745/11 14:28 14994.3 899.7 108.4 0.705
CeDAR Reports 5/11/2010 3:08 PM, CeDAR 1-Allnute Data
Page 3 of 4
Page 52
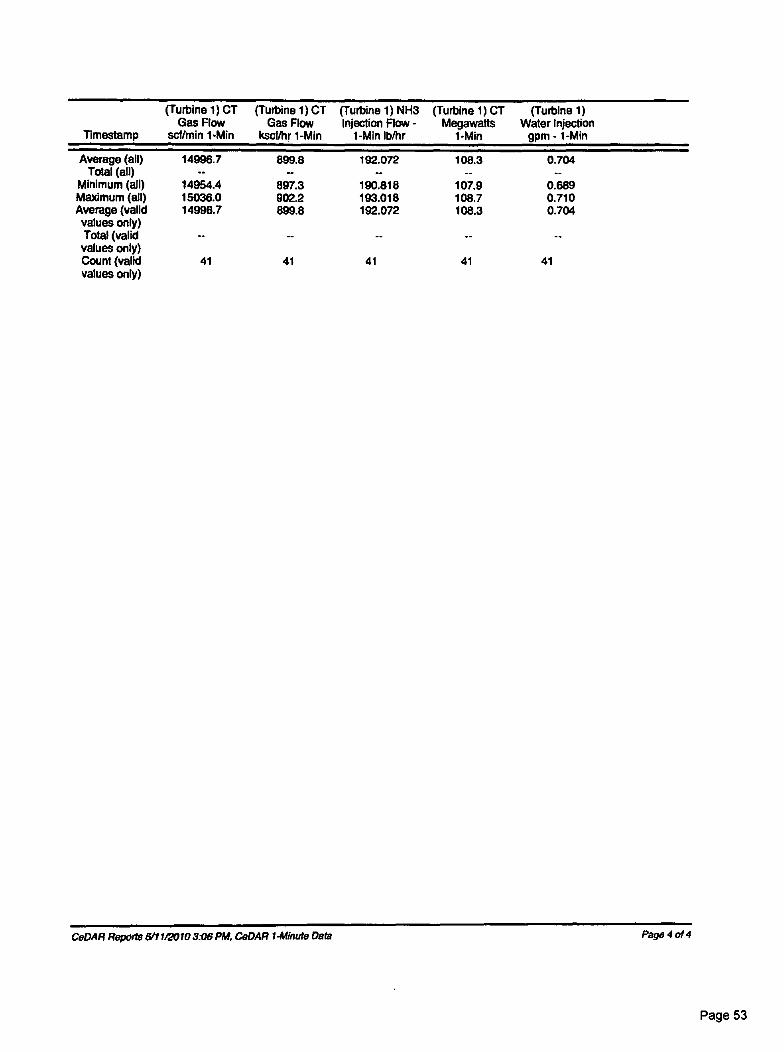
(Turbine 1) CT (Turbine 1) CT (Turbine 1) NH3 (Turbine 1) CT (Turbine 1)Gas Flow Gas Flow injection Flow - Megawatts Water Injection
Timestamp scf/min 1-Min kscf/hr 1-Min 1-Min lb/hr 1-Min gpm - 1-Min
Average (all) 14996.7 899.8 192.072 108.3 0.704Total (all) -- — — __ --
Minimum (all) 14954.4 897.3 190.818 107.9 0.689Maximum (all) 15036.0 902.2 193.018 108.7 0.710Average (valid 14996.7 899.8 192.072 108.3 0.704values only)Total (validvalues only)Count (valid 41 41 41 41 41values only)
CeDAR Repotte 5/11120103:06 PM, CeDAR 1-Minute Data Page 4 of 4
Page 53
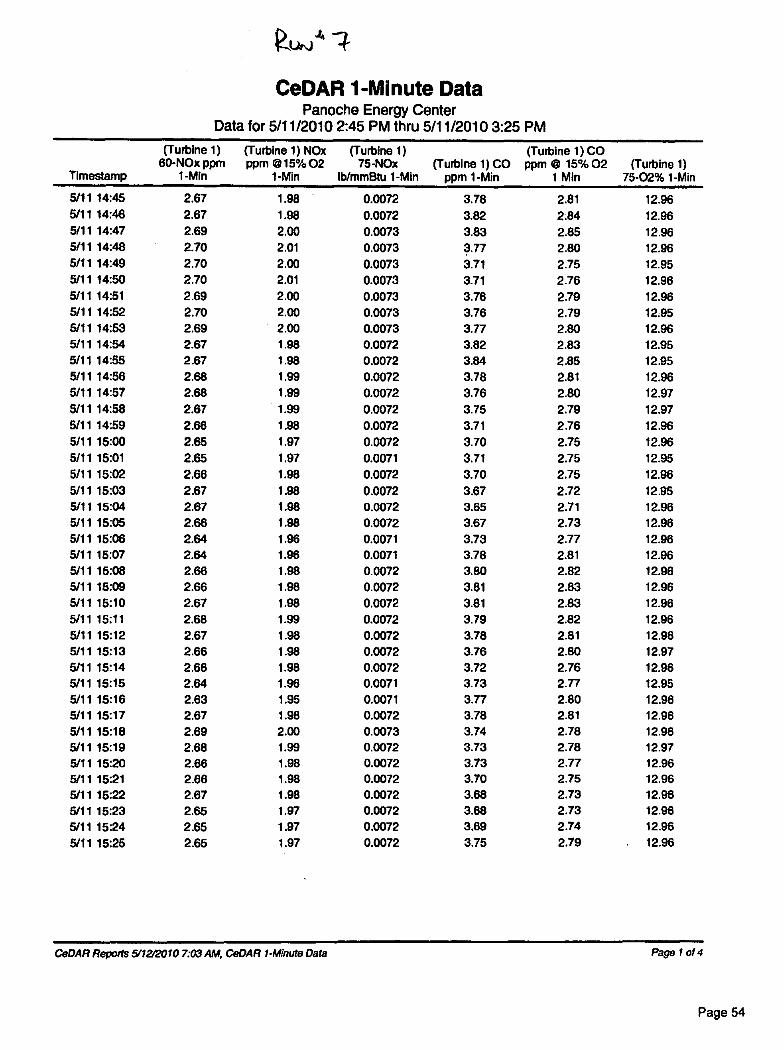
CeDAR 1-Minute DataPanoche Energy Center
Data for 5/11/20102:45 PM thru 5/11/20103:25 PM
Timestamp
(Turbine 1)60-NOx ppm
1-Min
(Turbine 1) NOxppm @ 15% 02
1-Min
(Turbine 1)75-NOx
lb/mmBtu 1-Min(Turbine 1) CO
ppm 1-Min
(Turbine 1) COppm @ 15%02
1 Min(Turbine 1)
75-02% 1-Min
5/11 14:45 2.67 1.98 0.0072 3.78 2.81 12.965/11 14:46 2.67 1.98 0.0072 3.82 2.84 12.965/11 14:47 2.69 2.00 0.0073 3.83 2.85 12.965111 14:48 2.70 2.01 0.0073 3.77 2.80 12.965/11 14:49 2.70 2.00 0.0073 3.71 2.75 12.955/11 14:50 2.70 2.01 0.0073 3.71 2.76 12.965/1114:51 2.69 2.00 0.0073 3.76 2.79 12.965/1114:52 2.70 2.00 0.0073 3.76 2.79 12.955/11 14:53 2.69 2.00 0.0073 3.77 2.80 12.965/11 14:54 2.67 1.98 0.0072 3.82 2.83 12.955/11 14:55 2.67 1.98 0.0072 3.84 2.85 12 955/11 14:56 2.68 1.99 0.0072 3.78 2.81 12.965/1114:57 2.68 1.99 0.0072 3.76 2.80 12.975/11 14:58 2.87 1.99 0.0072 3.75 2.79 12.975/11 14:59 2.66 1.98 0.0072 3.71 2.76 12.965/11 15:00 2.65 1.97 0.0072 3.70 2.75 12.965/11 15:01 2.65 1.97 0.0071 3.71 2.75 12.955/11 15:02 2.66 1.98 0.0072 3.70 2.75 12.965/1115:03 2.67 1.98 0.0072 3.67 2.72 12.955/11 15:04 2.67 1.98 0.0072 3.65 2.71 12.965/11 15:05 2.66 1.98 0.0072 3.67 2.73 12.965/11 15:06 2.64 1.96 0.0071 3.73 2.77 12.985/1115:07 2.64 1.96 0.0071 3.78 2.81 12.965/11 15:08 2.66 1.98 0.0072 3.80 2.82 12.965/11 15:09 2.66 1.98 0.0072 3.81 2.83 12.965/1115:10 2.67 1.98 0.0072 3.81 2.83 12.965/11 15:11 2.68 1.99 0.0072 3.79 2.82 12.965/1115:12 2.67 1.98 0.0072 3.78 2.81 12.965/1115:13 2.66 1.98 0.0072 3.76 2.80 12.975/1115:14 2.66 1.98 0.0072 3.72 2.76 12.965/1115:15 2.64 1.96 0.0071 3.73 2.77 12.955/11 16:16 2.63 1.95 0.0071 3.77 2.80 12.985/1115:17 2.67 1.98 0.0072 3.78 2.81 12.965/1115:18 2.69 2.00 0.0073 3.74 2.78 12.965/1115:19 2.68 1.99 0.0072 3.73 2.78 12.975/11 15:20 2.66 1.98 0.0072 3.73 2.77 12.965/11 15:21 2.66 1.98 0.0072 3.70 2.75 12.965/11 15:22 2.67 1.99 0.0072 3.68 2.73 12.965/1115:23 2.65 1.97 0.0072 3.68 2.73 12.965/1115:24 2.65 1.97 0.0072 3.69 2.74 12.96
5/1115:25 2.65 1.97 0.0072 3.75 2.79 12.96
CeDAR Reports 5/12/2010 7:03 AM, CeDAR 1-Minute Data Page 1 of 4
Page 54
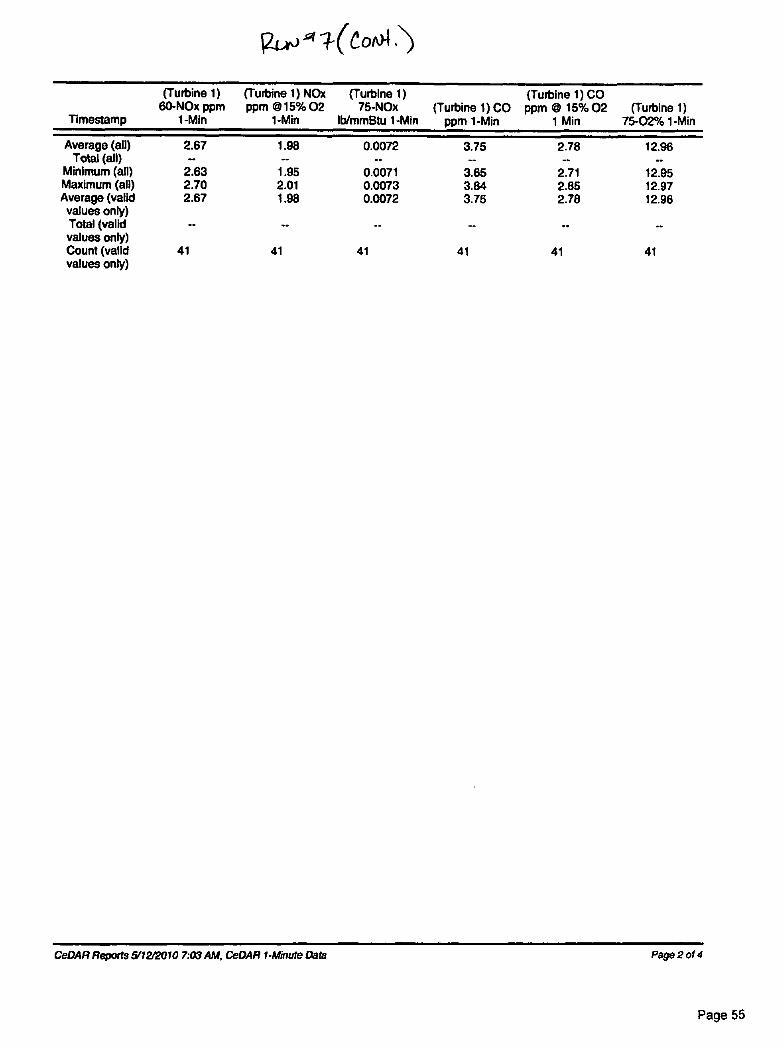
124.40 A2' 4- (Coo-t,
(Turbine 1)60-NOx ppm
(Turbine 1) NOxppm @15%02
(Turbine 1)75-NOx (Turbine I) CO
(Turbine 1) COppm @ 15% 02 (Turbine 1)
Timestamp 1-Min 1-Min lb/mmBtu 1-Min ppm 1-Min 1 Min 75-02% 1-Min
Average (all) 2.67 1.98 0.0072 3.75 2.78 12.96Total (all) -- -- -- -- -- --
Minimum (all) 2.63 1.95 0.0071 3.65 2.71 12.95Maximum (all) 2.70 2.01 0.0073 3.84 2.65 12.97Average (validvalues only)
2.67 1.98 0.0072 3.75 2.78 12.98
Total (validvalues only)Count (validvalues only)
41 41 41 41 41 41
CeDAR Reports 5/12/2010 7:03 AM, CeDAR 1-Minute Data Page 2 of 4
Page 55
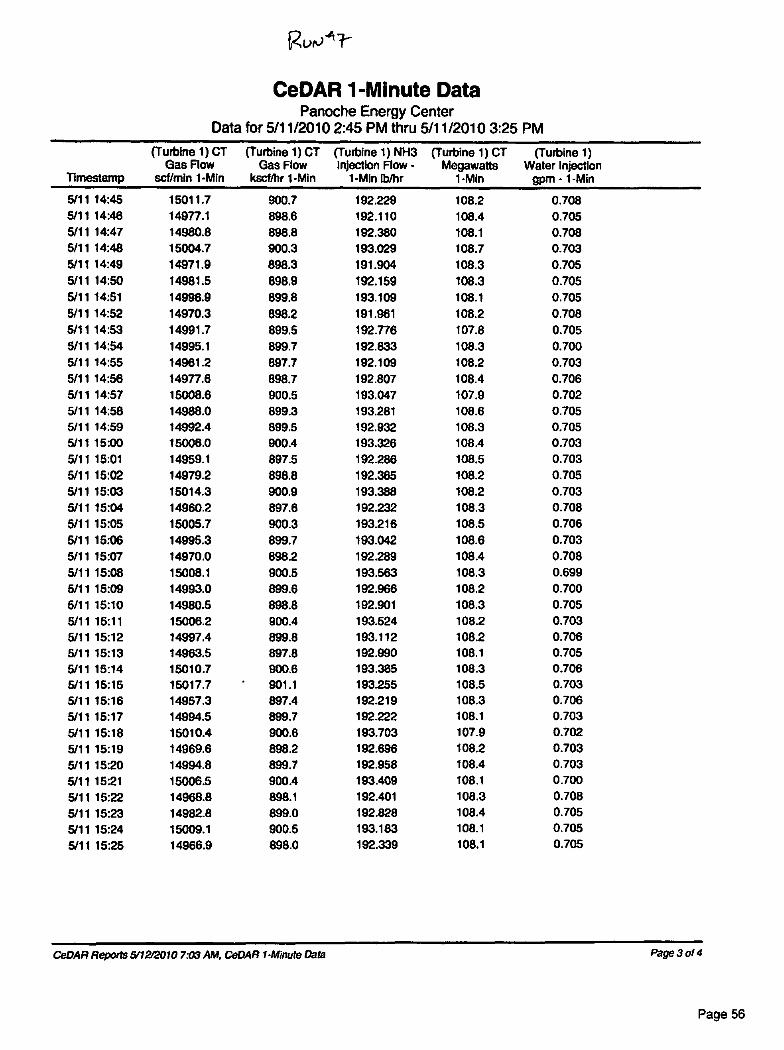
Rt)(04T-
CeDAR 1-Minute DataPanoche Energy Center
Data for 5/11/20102:45 PM thru 5/11/20103:25 PM
Timestamp
(Turbine 1) CTGas Flow
scf/min 1-Min
(Turbine 1) CTGas Flow
kscf/hr 1-Min
(Turbine 1) NH3Injection Flow -
1-Min lb/hr
(Turbine 1) CTMegawatts
1-Min
(Turbine 1)Water Injection
gpm - 1-Min
5/11 14:45 15011.7 900.7 192.229 108.2 0.7085/11 14:48 14977.1 898.6 192.110 108.4 0.7055/11 14:47 14980.8 898.8 192.380 108.1 0.7085/11 14:48 15004.7 900.3 193.029 108.7 0.7035/11 14:49 14971.9 898.3 191.904 108.3 0.7055/11 14:50 14981£ 898.9 192159 108.3 0.7055/11 14:51 14996.9 899.8 193.109 108.1 0.7055/11 14:52 14970.3 898.2 191.961 108.2 0.7085/11 14:53 14991.7 899.5 192.776 107.8 0.7055/11 14:54 14995.1 899.7 192.833 108.3 0.7005/11 14:55 14961.2 897.7 192.109 108.2 0.7035/11 14:56 14977.6 898.7 192.807 108.4 0.7065/11 14:57 15008.6 900.5 193.047 107.9 0.7025/11 14:58 14988.0 899.3 193.281 108.6 0.7055/11 14:59 14992.4 899.5 192.932 108.3 0.7055/11 15:00 15008.0 900.4 193.326 108.4 0.7035/1115:01 14959.1 897.5 192.286 108.5 0.7035/11 15:02 14979.2 898.8 192.365 108.2 0.705
5/11 15:03 15014.3 900.9 193288 108.2 0.7035/11 15:04 14960.2 897.6 192232 108.3 0.708
5/11 15:05 15005.7 900.3 193 216 108.5 0.706
193.0425/11 15:06 14995.3 899.7 108.6 0.7035/11 15:07 14970.0 898.2 192289 108.4 0.708
5/11 15:08 15008.1 900.5 193.563 108.3 0.699
5/11 15:09 14993.0 899.6 192.966 108.2 0.7006/11 15:10 14980.5 898.8 192.901 108.3 0.705
6/11 15:11 15006.2 900.4 193.524 108.2 0.7035/11 15:12 14997.4 899.8 193.112 108.2 0.7065/11 15:13 14963.5 897.8 192.990 108.1 0.7055/1115:14 15010.7 900.6 193.385 108.3 0.706
5/11 16:15 15017.7 901.1 193.255 108.5 0.703
5/11 15:16 14957.3 897.4 192.219 108.3 0.7065/1115:17 14994.5 899.7 192.222 108.1 0.703
5/1115:18 15010.4 900.8 193.703 107.9 0.702
5/11 15:19 14969.6 898.2 192.696 108.2 0.703
5/11 15:20 14994.8 899.7 192.958 108.4 0.703
5/1115:21 15006.5 900.4 193.409 108.1 0.700
5/11 15:22 14968.8 898.1 192.401 108.3 0.708
5/11 15:23 14982.8 899.0 192.828 108.4 0.705
5/1115:24 15009.1 900.5 193.183 108.1 0.705
5/11 15:26 14966.9 898.0 192.339 108.1 0.705
CeDAR Reports 5/12/2010 7:08 AM, CeDAR 1-Minute Data Page 3014
Page 56

RtIff`• -q- (Cinvi-,
(Turbine 1) CT (Turbine 1) CT (Turbine 1) NH3 (Turbine 1) CT (Turbine 1)Gas Flow Gas Flow Injection Flow - Megawatts Water Injection
Tlmestamp scf/min 1-Min kscf/hr 1-Min 1-Mh lb/hr 1-Min gpm - 1-Min
Average (all) 14988.7 899.3 192.791 108.3 0.704Total (all) -- -- -- --
Minimum (all) 14957.3 897.4 191.904 107.8 0.699Maximum (all) 15017.7 901.1 193.703 108.7 0.708Average (valid 14988.7 899.3 192.791 108.3 0.704values only)Total (valid --values only)Count (valid 41 41 41 41 41values only)
CeDAR Reports 5/1212010 7:03 AM, CeDAR 1-Minute Data Page 4 014
Page 57
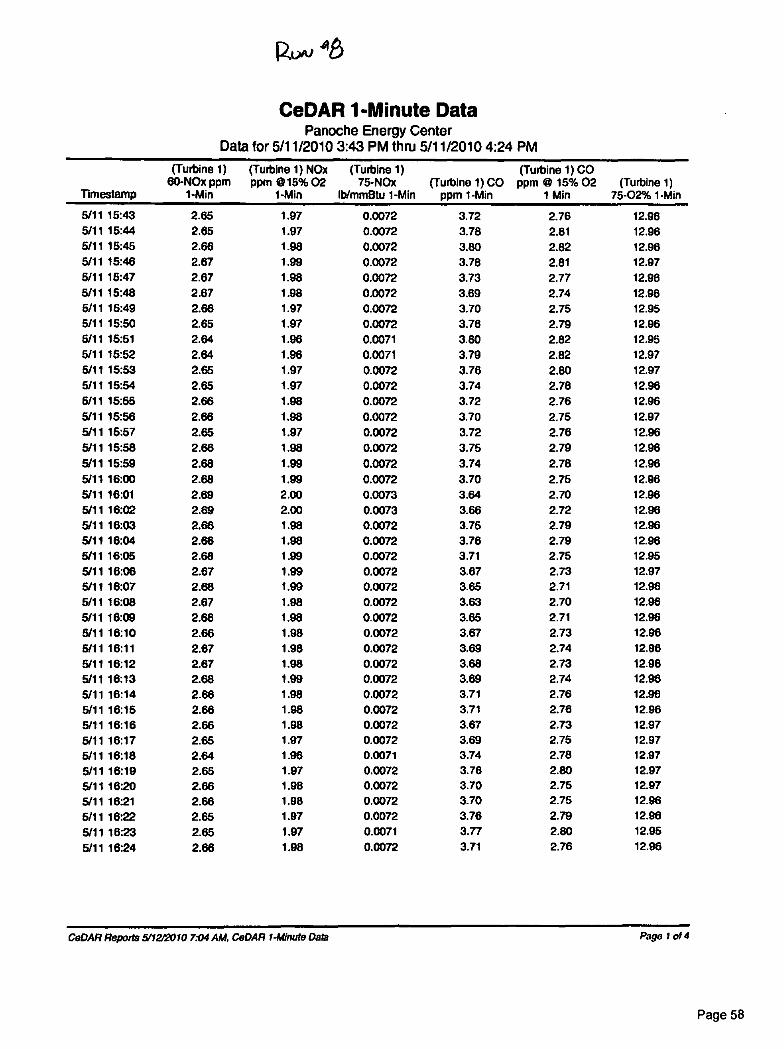
Roou 4'81
CeDAR 1-Minute DataPanoche Energy Center
Data for 5/11/2010 3:43 PM thru 5/11/20104:24 PM
Timestamp
(Turbine 1)60-NOx ppm
1-Min
(Turbine 1) NOxppm 015% 02
1-Min
(Turbine 1)75-NOx
IblmmBtu 1-Min(Turbine 1) CO
ppm 1-Min
(Turbine 1) COppm @ 15% 02
1 Min(Turbine 1)
75-02% 1-Min
5/11 15:43 2.65 1.97 0.0072 3.72 2.76 12.965/11 15:44 2.65 1.97 0.0072 3.78 2.81 12.965/11 16:45 2.66 1.98 0.0072 3.80 2.82 12.965/11 15:46 2.67 1.99 0.0072 3.78 2.81 12.975/1115:47 2.67 1.98 0.0072 3.73 2.77 12.965/11 15:48 2.67 1.98 0.0072 3.69 2.74 12.965/11 16:49 2.66 1.97 0.0072 3.70 2.75 12.956/11 15:50 2.65 1.97 0.0072 3.76 2.79 12.966111 15:51 2.64 1.96 0.0071 3.80 2.82 12 95
12.975/11 15:52 2.64 1.96 0.0071 3.79 2.825/11 15:53 2.65 1.97 0.0072 3.76 2.80 12.975/11 15:54 2.65 1.97 0.0072 3.74 2.78 12.966/11 15:55 2.66 1.98 0.0072 3.72 2.76 12.965/11 15:56 2.68 1.98 0.0072 3.70 2.75 12.975/11 15:57 2.65 1.97 0.0072 3.72 2.76 12.965/11 15:58 2.66 1.98 0.0072 3.75 2.79 12.965/1115:59 2.68 1.99 0.0072 3.74 2.78 12.985/11 16:00 2.68 1.99 0.0072 3.70 2.75 12.965/1116:01 2.69 2.00 0.0073 3.64 2.70 12.965/11 16:02 2.69 2.00 0.0073 3.66 2.72 12.965/11 16:03 2.66 1.98 0.0072 3.75 2.79 12.965/11 16:04 2.66 1.98 0.0072 3.76 2.79 12.965/11 16:05 2.68 1.99 0.0072 3.71 2.75 12.955/1116:06 2.67 1.99 0.0072 3.67 2.73 12.975/1116:07 2.68 1.99 0.0072 3.65 2.71 12.965/11 16:08 2.67 1.98 0.0072 3.63 2.70 12.985/11 16:09 2.66 1.98 0.0072 3.65 2.71 12.985/1116:10 2.66 1.98 0.0072 3.67 2.73 12.965/11 16:11 2.67 1.98 0.0072 3.69 2.74 12.865/1116:12 2.67 1.98 0.0072 3.68 2.73 12.965/1116:13 2.68 1.99 0.0072 3.69 2.74 12.965/1116:14 2.66 1.98 0.0072 3.71 2.76 12.985/1116:16 2.68 1.98 0.0072 3.71 2.76 12.965/11 16:16 2.66 1.98 0.0072 3.67 2.73 12.975/1116:17 2.65 1.97 0.0072 3.69 2.75 12.975/1116:18 2.64 1.98 0.0071 3.74 2.78 12.975/1116:19 2.65 1.97 0.0072 3.78 2.80 12.975/11 18:20 2.66 1.98 0.0072 3.70 2.75 12.975/1116:21 2.68 1.98 0.0072 3.70 2.75 12.965/11 18:22 2.65 1.97 0.0072 3.76 2.79 12.965/11 1623 2.65 1.97 0.0071 3.77 2.80 12.955/1116:24 2.66 1.98 0.0072 3.71 2.76 12.96
CeDAR Reports 5/12/2010 7.O4 AM, CeDAR 1-Minute Data Page 1 of 4
Page 58
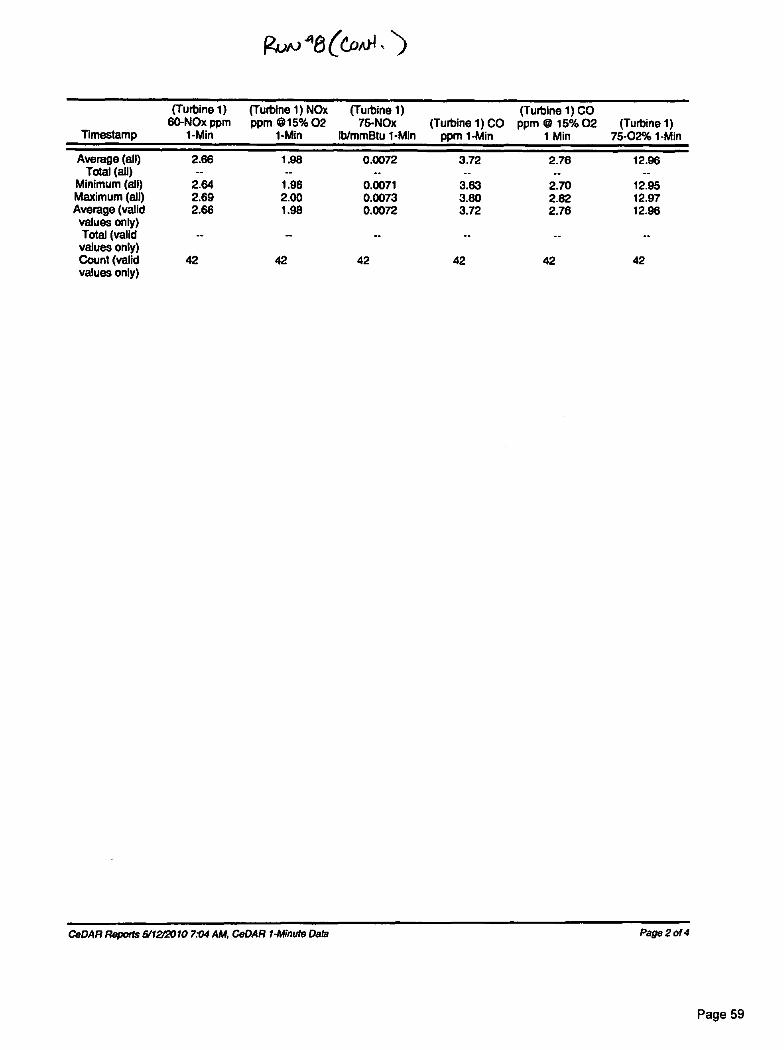
øA)
(Turbine 1)60-NOx ppm
(Turbine 1) NOxppm 015% 02
(Turbine 1)75-NOx (Turbine 1) CO
(Turbine 1) COppm 0 15% 02 (Turbine 1)
Timestamp 1-Min 1-Min lb/mmBtu 1-Min ppm 1-Min 1 Min 75-02% 1-Min
Average (all) 2.66 1.98 0.0072 3.72 2.76 12.96Total (all) _ -- -- -- --
Minimum (all) 2.64 1.96 0.0071 3.63 2.70 12.95Maximum (all) 2.69 2.00 0.0073 3.80 2.82 12.97Average (validvalues only)
2.66 1.98 0.0072 3.72 2.76 12.98
Total (validvalues only)Count (validvalues only)
42 42 42 42 42 42
CeDAR Repotts &'12t2010 7:04 AM, CeDAR 1-Minute Data Page 2 of 4
Page 59
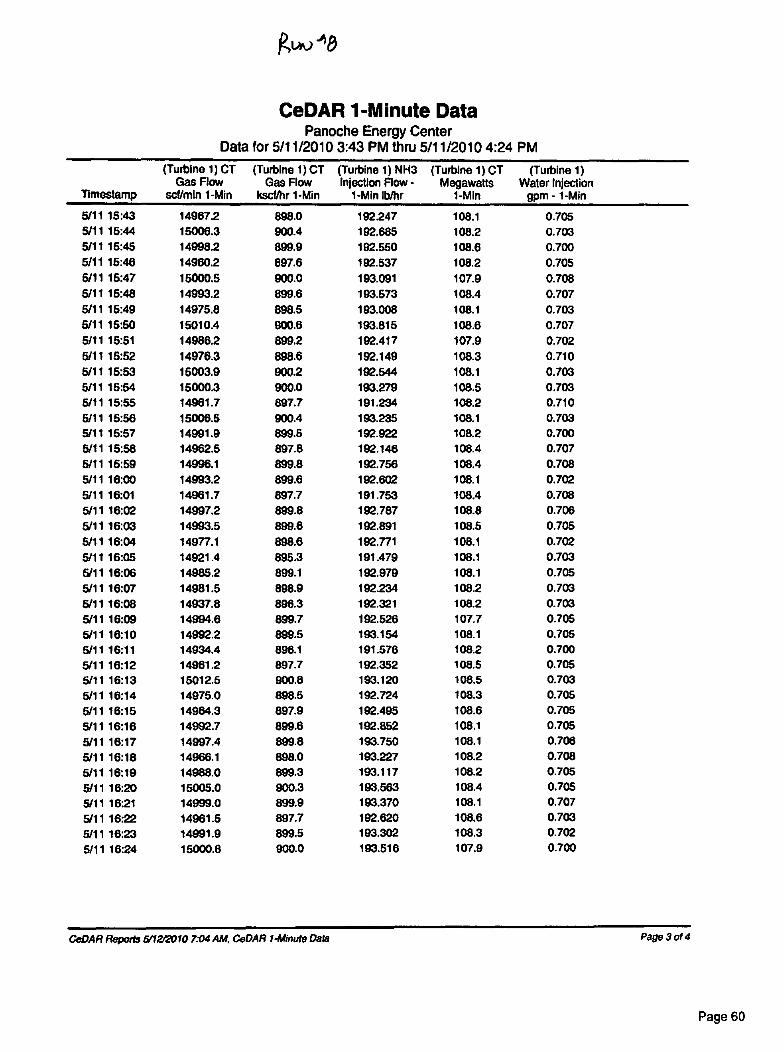
CeDAR 1-Minute DataPanoche Energy Center
for 5/11/2010 3:43 PM thru 5/11/20104:24 PM
Timestamp
(Turbine 1) CTGas Flow
sct/min 1-Min
(Turbine 1) CTGas Flow
kscf/hr 1-Min
(Turbine i) NH3Injection Flow -
1-MM lb/hr
(Turbine 1) CTMegawatts
1-Min
(Turbine 1)Water Injection
gpm - 1-Min
5/11 15:43 14967.2 898.0 192.247 108.1 0.7055/11 15:44 15006.3 900.4 192.685 108.2 0.7035/11 15:45 14998.2 899.9 192.550 108.6 0.7005/11 15:46 14960.2 897.6 192.537 108.2 0.7055/11 16:47 16000.5 900.0 193.091 107.9 0.7085/11 16:48 14993.2 899.6 193.673 108.4 0.7075/11 15:49 14975.8 898.5 193.008 108.1 0.7036/11 15:50 15010.4 900.6 193.815 108.6 0.7075/11 15:61 14986.2 899.2 192.417 107.9 0.7025/11 15:52 14976.3 898.6 192.149 108.3 0.7105/11 15:53 15003.9 900.2 192.544 108.1 0.7035/11 15:64 15000.3 900.0 193.279 108.5 0.7035/11 15:55 14961.7 897.7 191.234 108.2 0.7105/11 15:56 15006.5 900.4 193.235 108.1 0.7035/1115:57 14991.9 899.6 192.922 108.2 0.7006/11 15:58 14962.5 897.8 192.146 108.4 0.7075/11 15:59 14996.1 899.8 192.756 108.4 0.7085/11 16:00 14993.2 899.6 192.602 108.1 0.7025/1116:01 14961.7 897.7 191.753 108.4 0.7085/11 16:02 14997.2 899.8 192.787 108.8 0.7065/11 16:03 14993.5 899.6 192.891 108.5 0.7055/11 16:04 14977.1 898.6 192.771 108.1 0.7025/11 16:05 14921.4 895.3 191.479 108.1 0.7035/11 16:06 14985.2 899.1 192.979 108.1 0.7055/1116:07 14981.5 898.9 192.234 108.2 0.7035/11 16:08 14937.8 898.3 192.321 108.2 0.7035/11 16:09 14994.6 899.7 192.526 107.7 0.7055/1116:10 14992.2 899.5 193.154 108.1 0.7055/1116:11 14934.4 896.1 191.576 108.2 0.7005/1116:12 14961.2 897.7 192.352 108.5 0.7055/1116:13 15012.5 900.8 193.120 108.5 0.7035/1116:14 14975.0 898.5 192.724 108.3 0.7055/1116:15 14984.3 897.9 192.495 108.6 0.7055/1116:16 14992.7 899.6 192.852 108.1 0.705
5/1116:17 14997.4 899.8 193.750 108.1 0.7065/1116:18 14966.1 898.0 193.227 108.2 0.7085/1116:19 14988.0 899.3 193.117 108.2 0.705
5/11 16:20 15005.0 900.3 193.563 108.4 0.705
5/1116:21 14999.0 899.9 193.370 108.1 0.707
5/11 16:22 14961.5 897.7 192.620 108.6 0.703
5/11 16:23 14991.9 899.5 193.302 108.3 0.702
5/1116:24 15000.8 900.0 193.516 107.9 0.700
CeDAR Reports 5/12/2010 7:04 AM, CeDAR 1-Minute Data Page 3 of 4
Data
Page 60

Kt,v '15( eakit )
(Turbine 1) CT (Turbine 1) CT (Turbine 1) NH3 (Turbine 1) CT (Turbine 1)Gas Flow Gas Flow Injection Flow - Megawatts Water Injection
Timestamp scf/min 1-Min ksehr 1-Min 1-Min lb/hr 1-Min gpm - 1-Min
Average (all) 14982.9 899.0 192.745 108.3 0.705Total (all) -- -- -- -- --
Minimum (all) 14921.4 895.3 191.234 107.7 0.700Maximum (all) 15012.5 000.8 193.815 108.8 0.710Average (valid 14982.9 899.0 192.745 108.3 0.705values only)Total (validvalues only)Count (valid 42 42 42 42 42values only)
CeDAR Reports 5/1212010 7:04 AM, CeDAR 1-Minute Data Page 4 of 4
Page 61
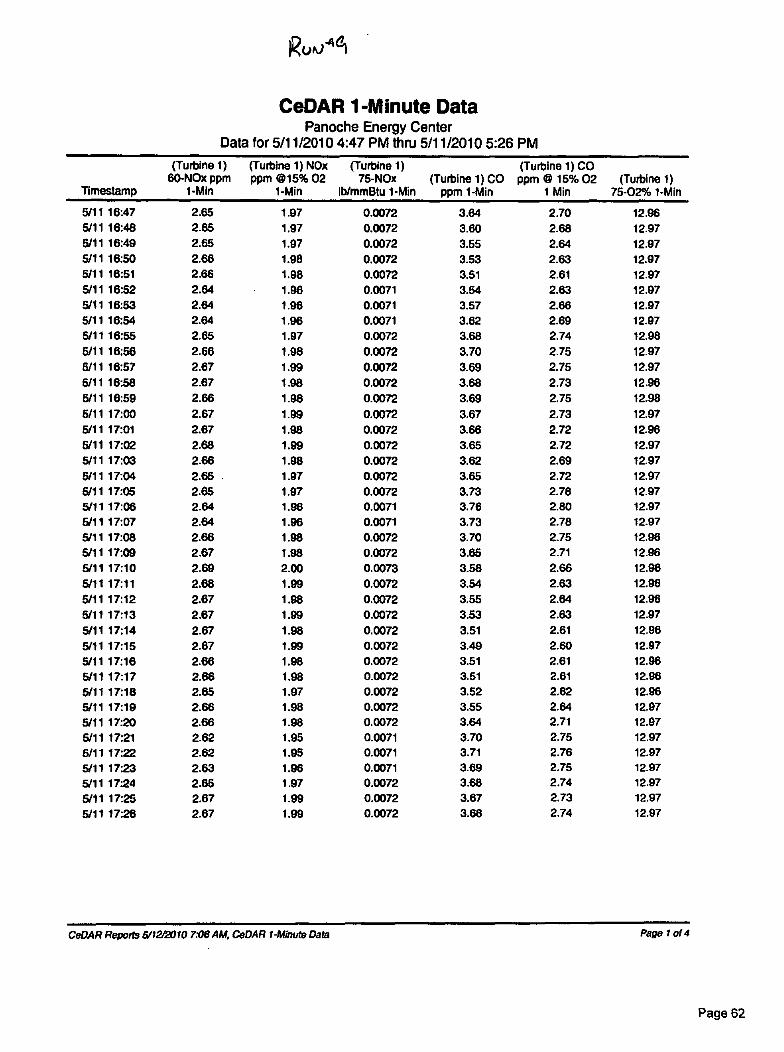
Runi461
CeDAR 1-Minute DataPanoche Energy Center
Data for 5/11/20104:47 PM thru 5/11/20105:26 PM
Timestamp
(Turbine 1)60-NOx ppm
1-Min
(Turbine 1) NOxppm 42)15% 02
1-Min
(Turbine 1)75-NOx
lb/mmBtu 1-Min(Turbine 1) CO
ppm 1-Min
(Turbine 1) COppm @ 16% 02
1 Min(Turbine 1)
75-02% 1-Min
5/11 16:47 2.65 1.97 0.0072 364 2/0 12.965/11 16:48 2.65 1.97 0.0072 160 2.68 12.975/11 16:49 2.65 1.97 0.0072 3.55 2.64 12.975/11 16:50 2.66 1.98 0.0072 3.53 2.63 12.975/11 16:51 2.66 1.98 0.0072 3.51 2.61 12.975/11 16:52 2.64 1.96 0.0071 154 2.63 12.975/11 16:53 2.64 1.96 0.0071 157 2.66 12.975/11 16:54 2.64 1.96 0.0071 3.62 2.69 12.975/11 16:55 2.65 1.97 0.0072 3.68 2.74 12.986/11 16:56 2.66 1.98 0.0072 3.70 2.75 12.976/11 16:57 2.67 1.99 0.0072 3.69 2.75 12.976/11 16:58 2.67 1.98 0.0072 3.68 2.73 12.965/1116:59 2.66 1.98 0.0072 3.69 2.75 12.986/11 17:00 2.67 1.99 0.0072 3.67 2.73 12.975/1117:01 2.67 1.98 0.0072 3.66 2.72 12.986/11 17:02 2.68 1.99 0.0072 3.65 2.72 12.975/11 17:03 2.66 1.98 10072 3.62 2.69 12.975/11 17:04 2.65 127 0.0072 3.65 2.72 12.975/11 17:05 2.65 1.97 0.0072 3.73 2.78 12.975/11 17:06 2.64 1.96 0.0071 3.76 2.80 12.975/1117:07 2.64 1.96 0.0071 3.73 2.78 12.975/11 17:08 2.66 1.98 0.0072 3.70 2.76 12.965/11 17:09 2.67 1.98 0.0072 3.65 2.71 12.985/1117:10 2.69 2.00 0.0073 158 2.66 12.965/1117:11 2.68 1.99 0.0072 3.54 2.63 12.965/1117:12 2.67 1.98 0.0072 3.55 2.64 12.965/1117:13 2.67 1.99 0.0072 3.53 2.63 12.975/1117:14 2.67 1.98 0.0072 3.51 2.61 12.965/1117:15 2.87 1.99 0.0072 3.49 2.60 12.975/1117:16 2.66 1.98 0.0072 3.51 2.61 12.965/1117:17 2.66 1.98 0.0072 3.51 2.61 12.965/11 17:18 2.65 1.97 10072 3.52 2.62 12.965/1117:19 2.66 1.98 00072 3.55 2.84 12.975/11 17:20 2.66 1.98 0.0072 3.64 2.71 12.975/1117:21 2.62 1.95 0.0071 3.70 2.75 12.975/11 17:22 2.62 1.95 0.0071 3.71 2.76 12.975/11 17:23 2.63 1.96 0.0071 3.69 2.75 12.975/11 1724 2.65 1.97 0.0072 3.68 2.74 12.975/11 17:25 2.67 129 0.0072 3.67 2.73 12.975/11 17:28 2.67 1.99 0.0072 3.68 2.74 12.97
CeDAR Reports 5/12/2010 706 AM, CeDAR 1-Minute Data Page 1 014
Page 62
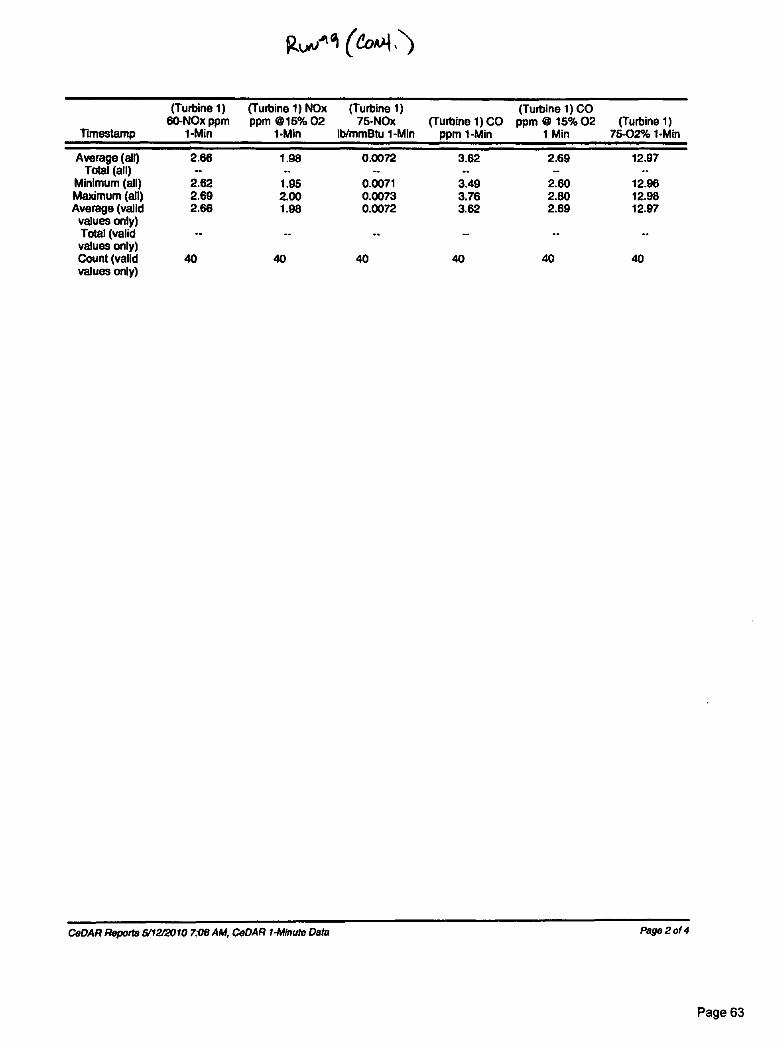
guAti (e0Ax4
(Turbine 1)60-NOx ppm
(Turbine 1) NOxppm (t15% 02
(Turbine 1)75-NOx (Turbine 1) CO
(Turbine 1) COppm @ 15% 02 (Turbine 1)
Timestamp 1-Min 1-Min lb/mmBtu 1-Mh ppm 1-Min 1 Min 75-02% 1-Min
Average (all) 2.66 1.98 0.0072 3.62 2.69 12.97Total (all) — -- -- -- ..
Minimum (all) 2.62 1.95 0.0071 3.49 2.60 12.96Maximum (an) 2.69 2.00 0.0073 3.76 2.80 12.98Average (valid
values only)2.68 1.98 0.0072 3.62 2.69 12.97
Total (validvalues only)
—
Count (validvalues only)
40 40 40 40 ao ao
CeDAR Reports 5/12/2010 7:06 AM, CeDAR 1-Minute Data Page 201 4
Page 63

CeDAR 1-Minute DataPanoche Energy Center
Data for 5/11/20104:47 PM thru 5/11/20105:26 PM
Tlmestamp
(Turbine 1) CTGas Flow
scf/mIn 1-Min
(Turbine 1) CTGas Flow
kscf/hr 1-Min
(Turbine 1) NH3Injection Flow -
1-Min lb/hr
(Turbine 1) CTMegawatts
1-Min
(Turbine 1)Water Injection
gpm - 1-Min
5/11 16:47 14935.4 898.1 191.685 108.8 0.7055/11 16:48 15010.4 900.6 193.373 108.6 0.6986/11 16:49 14969.8 898.2 192.768 108.3 0.7065/11 16:50 14978.6 898.6 192.591 108.1 0.7065/11 16:51 14991.2 899.6 193.503 108.2 0.7075/11 16:52 14968.2 898.0 192.833 108.4 0.7085/11 16:53 15004.2 900.3 193.719 108.2 0.7036/11 10:54 14951.8 897.1 192.294 108.4 0.7035/11 16:55 14999.5 900.0 192.438 108.2 0.7025/11 16:56 14985.2 899.1 193.242 108.4 0.7025/11 18:57 14967.5 898.1 192.276 108.4 0.7035/11 18:58 14984.3 897.9 191.701 108.5 0.7055/11 18:59 14995.8 8997 193.445 108.4 0.7035/1117:00 14954.7 897.3 192.750 108.8 0.7035/1117:01 14996.1 899.8 193.670 108.9 0.7025/1117:02 15002.1 900.1 193.716 108.3 0.7075/11 17:03 14941.7 898.5 191.909 108.3 0.7085/11 17:04 15010.4 900.8 193.198 108.2 0.7055/11 17:05 14951.8 897.1 192.198 108.2 07115/1117:06 14954.4 897.3 192.044 108.4 0.7065/1117:07 14992.2 899.5 192.740 108.2 0.7055/1117:08 14952.3 897.1 192.029 108.1 0.7025/11 17:09 15003.4 900.2 192.318 108.3 0.7035/1117:10 14973.2 898.4 192.953 108.2 0.7035/1117:11 14978.1 898.7 191.909 108.3 0.7085/1117:12 14981.5 898.9 192.808 108.3 0.7025/1117:13 14956.8 897.4 192.089 108.3 0.7065/1117:14 15003.4 900.2 193.887 108.1 0.7055/1117:15 14969.8 898.2 193.986 108.3 0.7035/1117:16 14964.6 897.9 192.896 108.1 0.7035/1117:17 15001.0 900.1 193.422 108.3 0.7055/1117:18 14949.5 897.0 192.839 108.3 07065/1117:19 14988.5 899.2 193.055 108.4 0.7005111 17:20 14980.2 898.8 193.081 108.5 0.7025/1117:21 14964.6 897.9 191.990 108.5 0.705
5/11 17:22 14988.6 899.3 193.037 108.4 0.705
5/11 1723 14957.8 897.6 191.391 108.2 0.700
5/1117:24 14980.5 898.8 192.604 108.4 0.702
5/11 17:26 14987.8 899.3 192.399 108.2 0.703
5/11 17:26 14954.7 897.3 192.320 108.5 0.708
CeDAR Repolts 5/12/2010 706 AM, CeDAR 1-Minute Data Page 3 of 4
Page 64
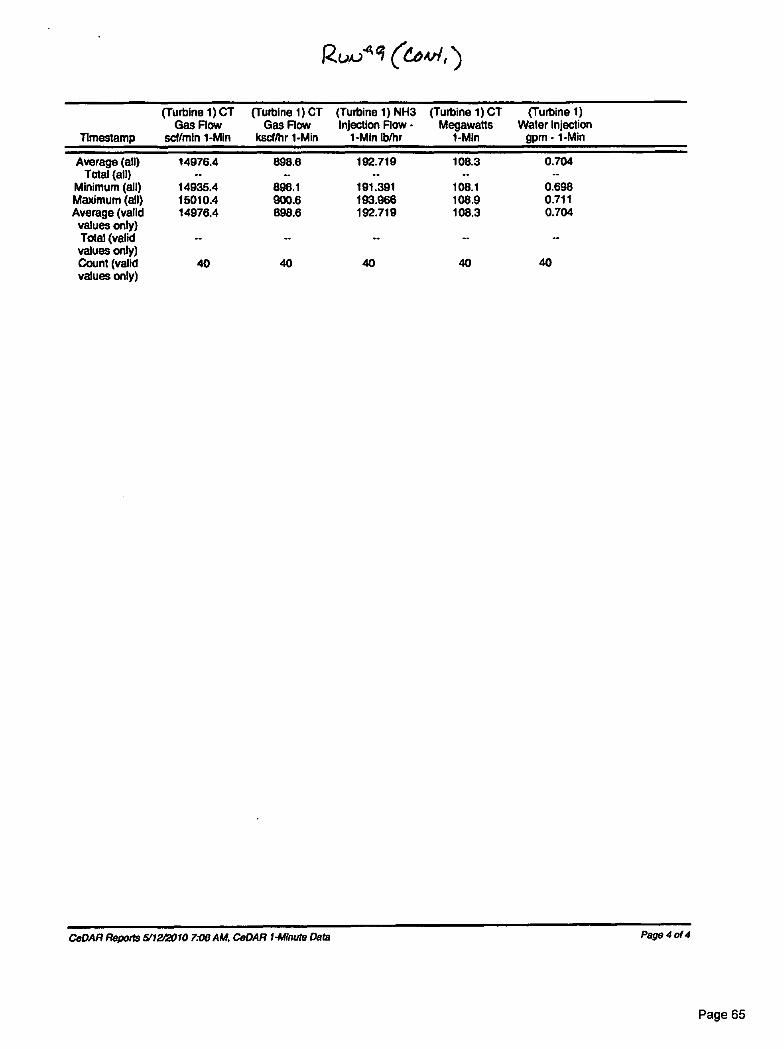
RuA)4 (r.o.inc
(Turbine 1) CT (Turbine 1) CT (Turbine 1) NH3 (Turbine 1) CT (Turbine 1)Gas Flow Gas Flow Injection Flow - Megawatts Water Injection
Timestamp samin 1-Mh kscf/hr 1-Min 1-Mh lb/hr 1-Min gpm - 1-Min
Average (all) 14976.4 898.6 192.719 108.3 0.704Total (all) -- -- -- -- --
Minimum (all) 14935.4 896.1 191.391 108.1 0.698Maximum (all) 15010.4 900.6 193.966 108.9 0.711Average (valid 14976.4 898.6 192.719 108.3 0.704values only)Total (validvalues only)Count (valid 40 40 40 40 40values only)
CeDAR Reports 5/12/2010 7.1:16 AM, CeDAR I-Minute Data Page 4 of 4
Page 65
EPA Method 18
Page 66
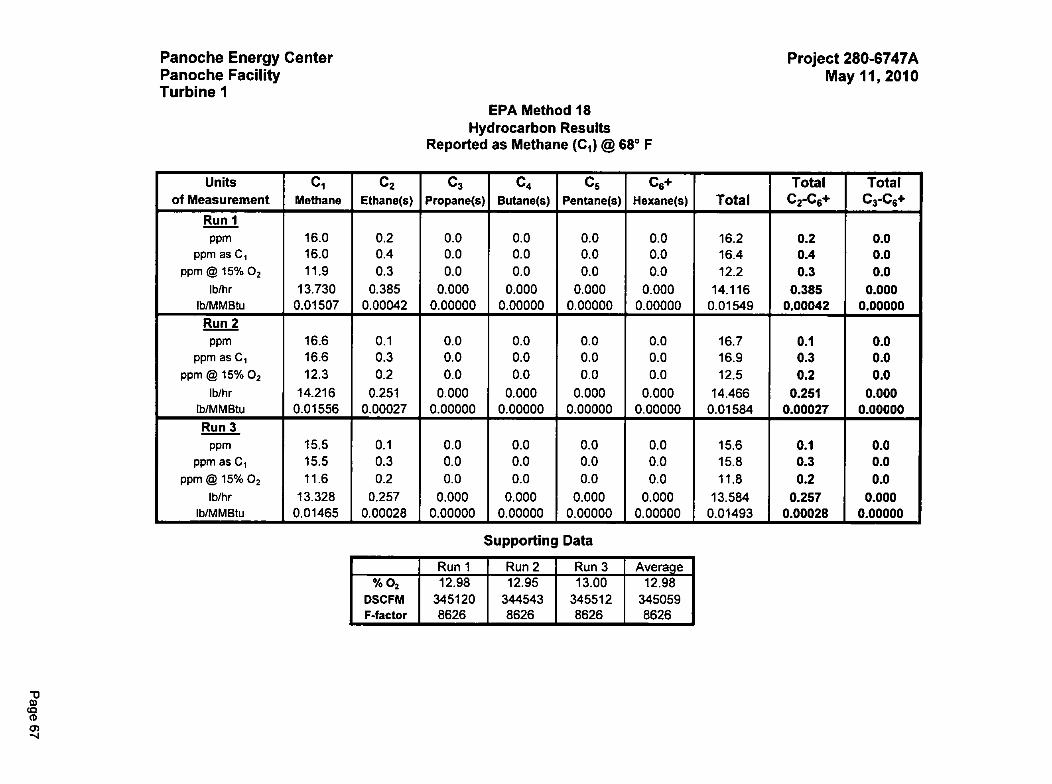
Panoche Energy Center
Project 280-6747APanoche Facility
May 11, 2010Turbine 1
EPA Method 18Hydrocarbon Results
Reported as Methane (C 1 ) @ 68° F
Units
of Measurement
C1Methane
C2
Ethane(s)
C3
Propane(s)
C4
Butane(s)
C5
Pentane(s)
Cs+
Hexane(s) TotalTotal
C2-C6+Total
C3-C6+
Run 1
ppm 16.0 0.2 0.0 0.0 0.0 0.0 16.2 0.2 0.0ppm as C, 16.0 0.4 0.0 0.0 0.0 0.0 16.4 0.4 0.0
PPm @ 15% 02 11.9 0.3 0.0 0.0 0.0 0.0 12.2 0.3 0.0lb/hr 13.730 0.385 0.000 0.000 0.000 0.000 14.116 0.385 0.000
lb/MMBtu 0.01507 0.00042 0.00000 0.00000 0.00000 0.00000 0.01549 0.00042 0.00000
Run 216.6 0.1 0.0 0.0 0.0 0.0 16.7 0.1 0.0ppm
ppm as C, 16.6 0.3 0.0 0.0 0.0 0.0 16.9 0.3 0.0
PPm @ 15% 02 12.3 0.2 0.0 0.0 0.0 0.0 12.5 0.2 0.0
lb/hr 14.216 0.251 0.000 0.000 0.000 0.000 14.466 0.251 0.000lb/MMBtu 0.01556 0.00027 0.00000 0.00000 0.00000 0.00000 0.01584 0.00027 0.00000
Run 315.5 0.1 0.0 0.0 0.0 0.0 15.6 0.1 0.0ppm
ppm as C 1 15.5 0.3 0.0 0.0 0.0 0.0 15.8 0.3 0.0
PPm @ 15% 02 11.6 0.2 0.0 0.0 0.0 0.0 11.8 0.2 0.0
lb/hr 13.328 0.257 0.000 0.000 0.000 0.000 13.584 0.257 0.000lb/MMBtu 0.01465 0.00028 0.00000 0.00000 0.00000 0.00000 0.01493 0.00028 0.00000
Supporting Data
Run 1 Run 2 Run 3 Average% 02 12.98 12.95 13.00 12.98
DSCFM 345120 344543 345512 345059F-factor 8626 8626 8626 8626

Panoche Energy Center
Project 280-6747APanoche Facility
May 11, 2010Turbine 1
EPA Method 18Hydrocarbon Results
Method Blank and Detection Limits for Runs 1-3
Detection LimitC1
MethaneC2
Ethane(s)
C3
Propane(s)
C4Butane(s)
Cs
Pentane(s)
C6+Hexane(s) Total
TotalC2-C6+
TotalC3-C6+
Area Counts (AC)
Response Factor (RF)
50
0.003038
50
0.001492
50
0.000989
50
0.000746
50
0.000601
50
0.000483
ppm (AC*RF) 0.15 0.07 0.05 0.04 0.03 0.02 0.37 0.22 0.14
PPm as C 1 (AC*RF*Ci) 0.15 0.15 0.15 0.15 0.15 0.15 0.89 0.74 0.59
PPm as C l @ 3% 02 0.34 0.34 0.34 0.34 0.34 0.33 2.02 1.68 1.34
PPm as C i @ 1 5% 02 0.11 0.11 0.11 0.11 0.11 0.11 0.67 0.55 0.44
lb/hr as C i 0.1301 0.1278 0.1270 0.1278 0.1286 0.1242 0.765 0.635 0.5076
lb/MMBtu as C 1 0.0001 0.0001 0.0001 0.0001 0.0001 0.0001 0.001 0.001 0.0006DSCFM 345059 average of uns 1-3
average of runs 1-3% Oxygen 12.98F-factor @ 68°F 8626
Method Blank
C1
Methane
C2
Ethane(s)
C3
Propane(s)
C4
Butane(s)
Cs
Pentane(s)
C6+
Hexane(s) TotalTotal
C2-C6+
TotalC3 -C6+
ppm 0.24 0.00 0.00 0.00 0.00 0.00 0.24 0.00 0.00

BAAQMD Method ST-1B
Page 69
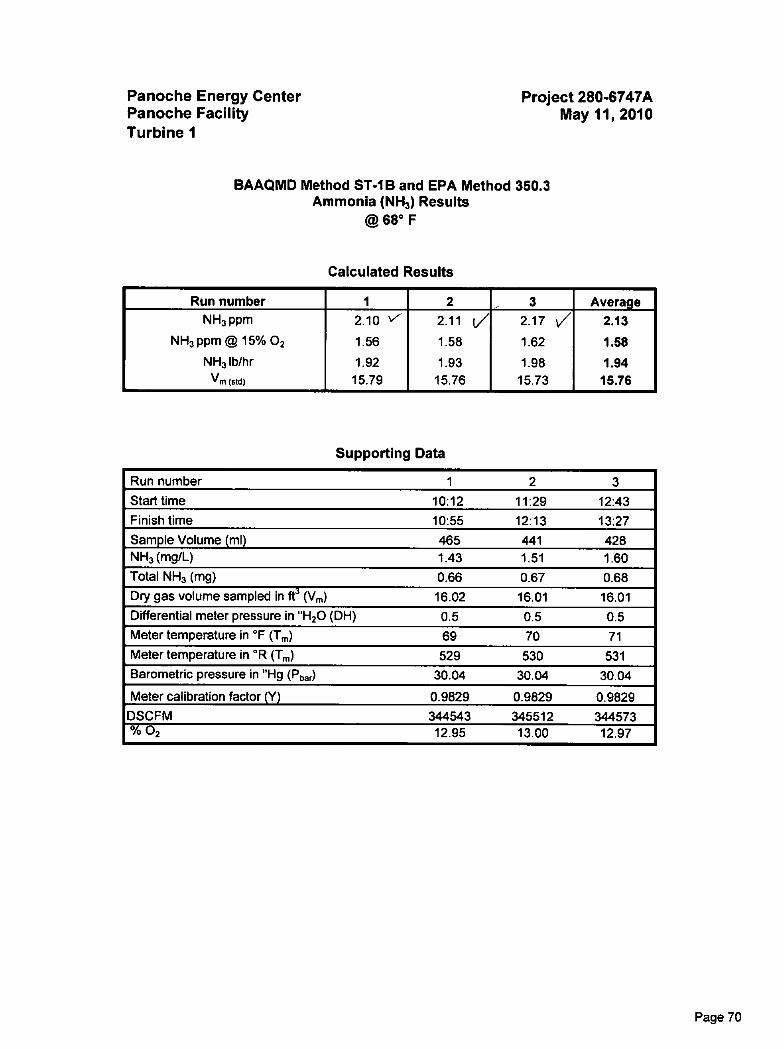
Panache Energy Center
Project 280-6747APanache Facility
May 11, 2010Turbine 1
BAAQMD Method ST-1B and EPA Method 350.3Ammonia (NH3) Results
© 68° F
Calculated Results
Run number 1 2 3 AverageNH3 ppm 2.10 ‘, 2.11 i/ 2.17 V 2.13
NH3 ppm @ 15% 02 1.56 1.58 1.62 1.58141-13 1b/hr 1.92 1.93 1.98 1.94V, (std) 15.79 15.76 15.73 15.76
Supporting Data
Run number 1 2 3Start time 10:12 11:29 12:43Finish time 10:55 12:13 13:27Sample Volume (ml) 465 441 428NH3 (mg/L) 1.43 1.51 1.60Total NH3 (mg) 0.66 0.67 0.68Dry gas volume sampled in ft 3 (V,) 16.02 16.01 16.01Differential meter pressure in "H20 (DH) 0.5 0.5 0.5Meter temperature in °F (T,) 69 70 71Meter temperature in °R (T,) 529 530 531Barometric pressure in "Hg (Pbar) 30.04 30.04 30.04
Meter calibration factor (Y) 0.9829 0.9829 0.9829DSCFM 344543 345512 344573%02 12.95 13.00 12.97
Page 70
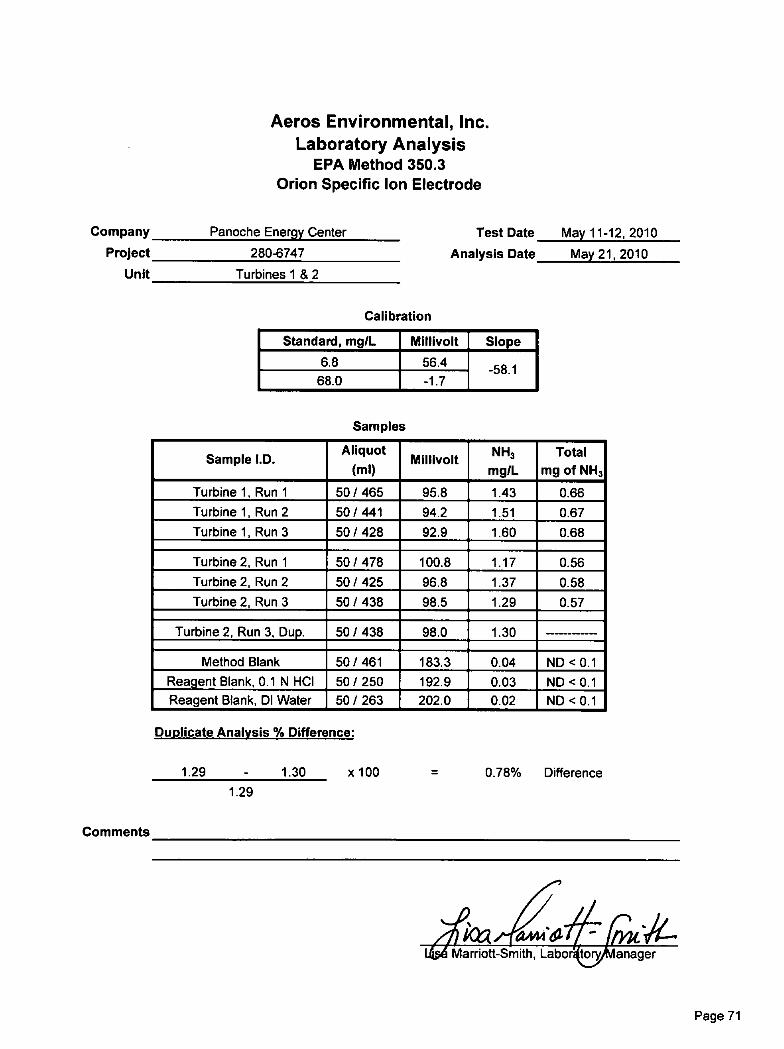
Aeros Environmental, Inc.Laboratory Analysis
EPA Method 350.3Orion Specific Ion Electrode
Company Panoche Energy Center
Project 280-6747
Unit Turbines 1 & 2
Test Date
May 11-12, 2010
Analysis Date
May 21, 2010
Calibration
Standard, mg/L Millivolt Slope
6.8 56.4 58.168.0 -1.7
Samples
Sample I.D.Aliquot
(ml)Millivolt
NH3mg/L
Totalmg of NH3
Turbine 1, Run 1 50 / 465 95.8 1.43 0.66Turbine 1, Run 2 50/ 441 94.2 1.51 0.67Turbine 1, Run 3 50/ 428 92.9 1.60 0.68
Turbine 2, Run 1 50 / 478 100.8 1.17 0.56Turbine 2, Run 2 50 / 425 96.8 1.37 0.58Turbine 2, Run 3 50 / 438 98.5 1.29 0.57
Turbine 2, Run 3, Dup. 50 / 438 98.0
Method Blank 50/ 461 183.3 0.04 ND <0.1Reagent Blank, 0.1 N HCI 50/ 250 192.9 0.03 ND < 0.1Reagent Blank, DI Water 50 / 263 202.0 0.02 ND < 0.1
Duplicate Analysis % Difference:
1.29 1.30 x 100 0.78% Difference1.29
Comments
Marriott-Smith, Labo anager
Page 71

EPA Method 19
Page 72
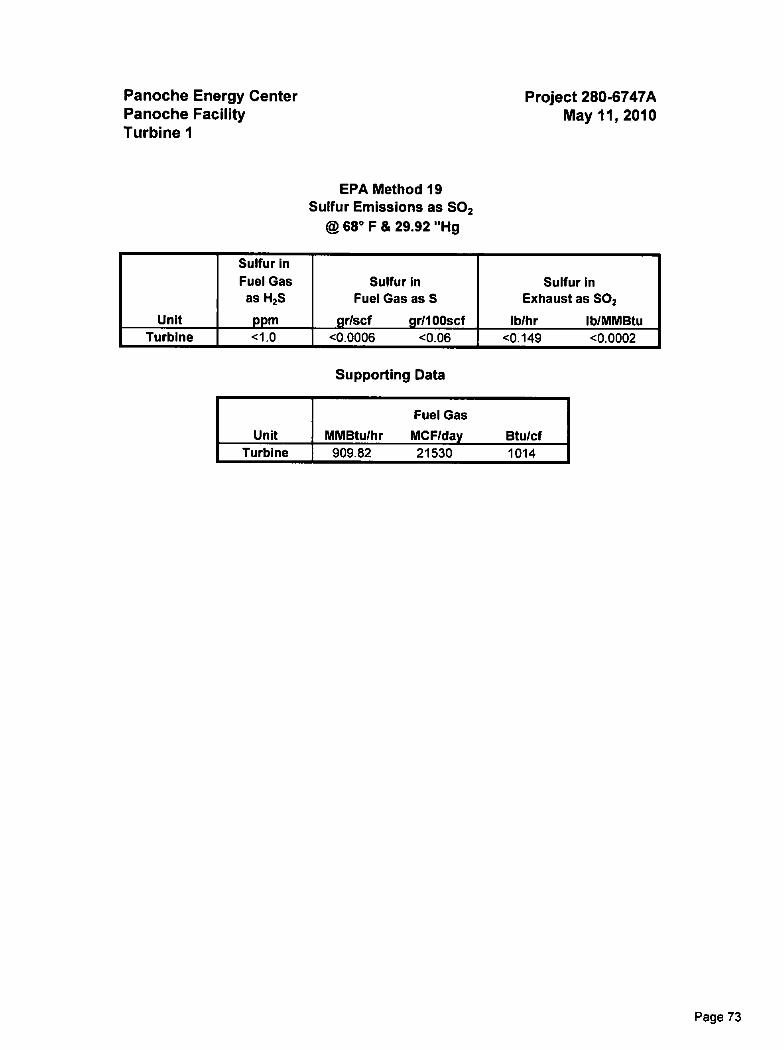
Panoche Energy Center
Project 280-6747APanoche Facility
May 11, 2010Turbine 1
EPA Method 19Sulfur Emissions as SO2
68° F & 29.92 "Hg
Unit
Sulfur inFuel Gasas H2S
ppm
Sulfur InFuel Gas as S
gr/scf gr/100scf
Sulfur InExhaust as SO2
lb/hr lb/MMBtuTurbine <1.0 <0.0006 <0.06 <0.149 <0.0002
Supporting Data
Unit MMBtu/hr
Fuel Gas
MCF/day Btu/cfTurbine 909.82 21530 1014
Page 73
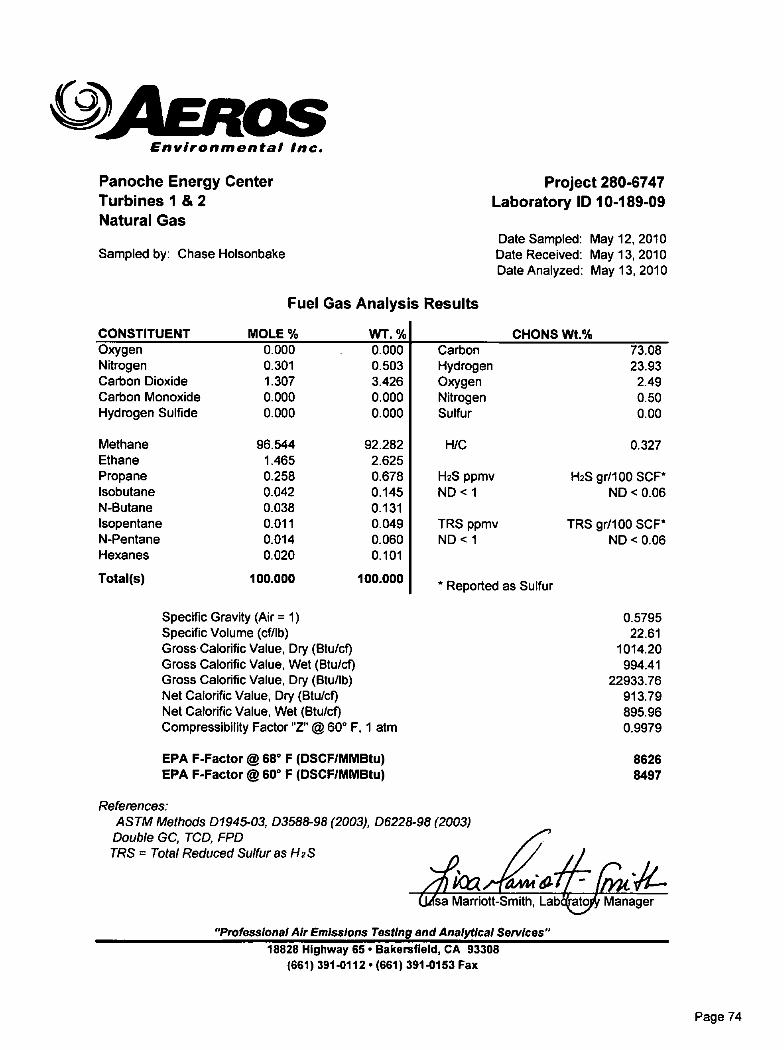
References:ASTM Methods D1945-03, D3588-98 (2003), D6228-98 (2003)Double GC, TCD, FPDTRS = Total Reduced Sulfur as H2S
IAMarriott-Smith, Lab Manager
Environmental Inc.
Panoche Energy Center
Project 280-6747Turbines 1 & 2
Laboratory ID 10-189-09Natural Gas
Sampled by: Chase Holsonbake
Fuel Gas Analysis
CONSTITUENT MOLE % WT. %
Date Sampled: May 12, 2010Date Received: May 13, 2010Date Analyzed: May 13, 2010
Results
CHONS Wt.%Oxygen 0.000 0.000 Carbon 73.08Nitrogen 0.301 0.503 Hydrogen 23.93Carbon Dioxide 1.307 3.426 Oxygen 2.49Carbon Monoxide 0.000 0.000 Nitrogen 0.50Hydrogen Sulfide 0.000 0.000 Sulfur 0.00
Methane 96.544 92.282 H/C 0.327Ethane 1.465 2.625Propane 0.258 0.678 H2S ppmv H2S gr/100 SCF*Isobutane 0.042 0.145 ND < 1 ND < 0.06N-Butane 0.038 0.131Isopentane 0.011 0.049 TRS ppmv TRS gr/100 SCF*N-Pentane 0.014 0.060 ND < 1 ND < 0.06Hexanes 0.020 0.101
Total(s) 100.000 100.000* Reported as Sulfur
Specific Gravity (Air = 1) 0.5795Specific Volume (cf/lb) 22.61Gross Calorific Value, Dry (Btu/cf) 1014.20Gross Calorific Value, Wet (Btu/cf) 994.41Gross Calorific Value, Dry (Btu/lb) 22933.76Net Calorific Value, Dry (Btu/cf) 913.79Net Calorific Value, Wet (Btu/cf) 895.96Compressibility Factor "Z" @ 60° F, 1 atm 0.9979
EPA F-Factor 68° F (DSCF/MMBtu) 8626EPA F-Factor @ 60° F (DSCF/MMBtu) 8497
"Professional Air Emissions Testing and Analytical Services"18828 Highway 65 • Bakersfield, CA 93308
(661) 391-0112 • (661) 391-0153 Fax
Page 74
Methodology
Page 75
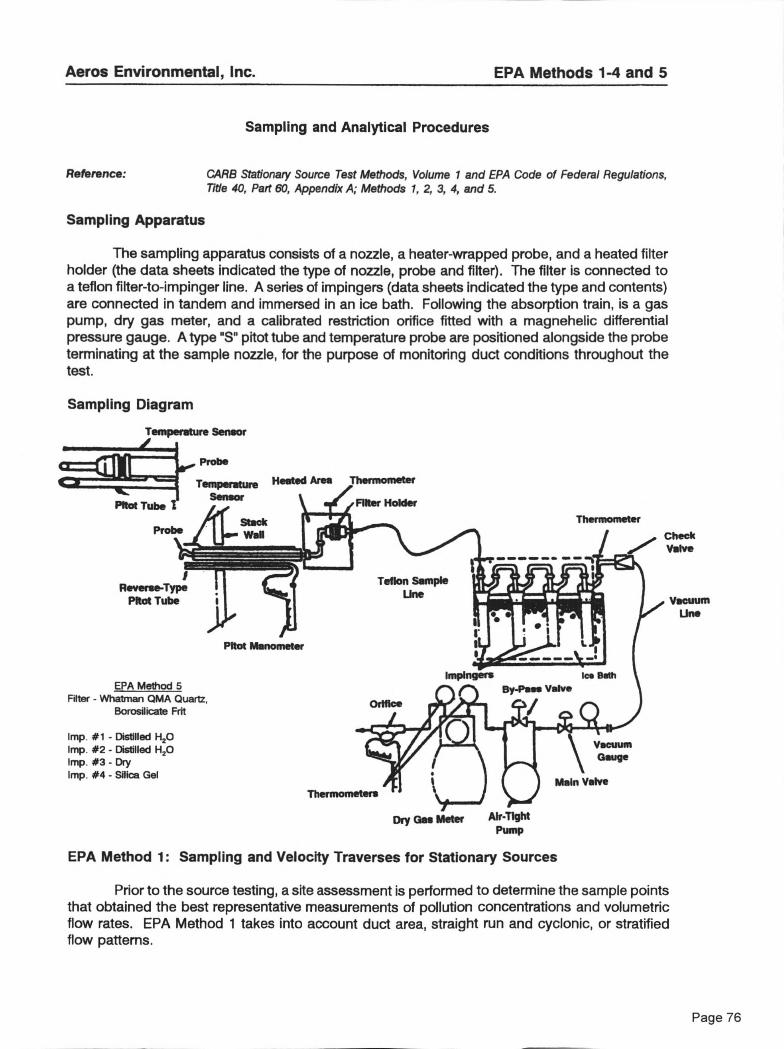
Air-TightPump
• Dry Gas Meter
lirom.s. Probe
Temperature Heated Area Thermometer
SensorPltot Tube I Filter Holder
Stack ThermometerProbe Wall Check
•,..... Valven•••• nnnnn
Reverse-TypePltot Tube
Teflon SampleUne ijIJL
' .--1
111••••11 .-11N•Ill • VacuumUne
Pitot Manometer
EPA Method 5Filter - Whatrnan DMA Quartz,
Borosilicate Frit
1mi:fingers Ice Beth
By-Pass Valve
Imp #1 - Distilled H20Imp #2- Distilled H20Imp #3 - DryImp. #4- Silica Gel
Thermometers
VacuumGauge
Main Valve
Orifice
Aeros Environmental, Inc. EPA Methods 1-4 and 5
Sampling and Analytical Procedures
Reference: CARB Stationary Source Test Methods, Volume 1 and EPA Code of Federal Regulations,Title 40, Part 60, Appendix A; Methods 1, 2, 3, 4, and 5.
Sampling Apparatus
The sampling apparatus consists of a nozzle, a heater-wrapped probe, and a heated filterholder (the data sheets indicated the type of nozzle, probe and filter). The filter is connected toa teflon filter-to-impinger line. A series of impingers (data sheets indicated the type and contents)are connected in tandem and immersed in an ice bath. Following the absorption train, is a gaspump, dry gas meter, and a calibrated restriction orifice fitted with a magnehelic differentialpressure gauge. A type "S" pitot tube and temperature probe are positioned alongside the probeterminating at the sample nozzle, for the purpose of monitoring duct conditions throughout thetest.
Sampling Diagram
Temperature Sensor
EPA Method 1: Sampling and Velocity Traverses for Stationary Sources
Prior to the source testing, a site assessment is performed to determine the sample pointsthat obtained the best representative measurements of pollution concentrations and volumetricflow rates. EPA Method 1 takes into account duct area, straight run and cyclonic, or stratifiedflow patterns.
Page 76
Aeros Environmental, Inc. EPA Methods 1-4 and 5
Sampling and Analytical Procedures(Continued)
EPA Method 2: Velocity and Volumetric Flow Rates
A computer is used in selection of suitable sample/traverse points. The calibrated pitottube is connected to a magnehelic gauge and leak checked. A temperature and AP are thenrecorded at each traverse point and a duct static pressure is measured and recorded. A volumeflow rate is calculated from the measured traverse points.
EPA Method 3: % CO2, % 02, Dry Molecular Weight
Concurrent with each particulate sampling, an Integrated gas sample is withdrawn fromthe summation of the traverse points, through the train and collected at the outlet of the meterinto a sample bag. The contents of the sample bladder are analyzed by Orsat for fixed gascomposition.
EPA Method 4: Percent Water
Tare weights of the charged individual impingers are recorded prior to sampling. Aftersampling, the final weights are recorded and percent water calculated from the weight of watercollected and the dry gas volume sampled.
EPA Method 5: Particulate Emissions
A series of preliminary measurements are made prior to conducting the particulate test.EPA Methods 1, 2, and 3 are performed to determine location and number of traverse points,average gas velocity, and pressure and gas molecular weight. Percent water is determined bya psychometric chart or from combustion analysis of the fixed gases. The results of thesemeasurements are entered Into the field computer for the purpose of determining an appropriatenozzle size for isokinetic sampling.
The Method 5 apparatus is then prepared on-site in the mobile laboratory. The absorptiontrain is charged with freshly prepared chemicals, weighted on a calibrated digital balance to thenearest 0.1 grams, and assembled. The probe is brushed out and rinsed with distilled water andacetone, then the fitter holder is charged. The sampling apparatus is sealed and transported tothe sampling site where it is assembled and leak tested at 15 inches mercury vacuum.
The probe, filter and impinger line heaters are set at 250° F and the probe is positionedinto the duct at the first traverse point with the nozzle out of the flow.
The nozzle is positioned into the gas flow and the vacuum pump is started immediatelyand adjusted to obtain an isokinetic sample rate. A complete traverse is performed whilesampling at a minimum of two minutes per sample point.
Upon completion of the traverse, the vacuum pump is turned off and the probe transferredinto the next sample EPA port where an identical sample-traverse is then performed. Ductconditions (temperature, AP) and sampling conditions (meter temperature, volume and pressure,probe, filter, sample line, impInger temperatures, and absorption train vacuum) are monitored andrecorded regularly for each sample point.
Page 77
Aeros Environmental, Inc. EPA Methods 1-4 and 5
Sampling and Analytical Procedures(Continued)
EPA Method 5 (Continued):
Upon completion of sampling, the apparatus is leak tested at a vacuum greater than thehighest observed vacuum. The leak is recorded and the apparatus then sealed and transportedto the mobile laboratory. The heated fitter-to-impinger line is rinsed with a known amount ofdistilled water into the first impinger.
The filter and any loose particulate are carefully removed from the filter holder withtweezers. It is then placed in a labeled petri dish and transported to the laboratory. The nozzle,probe, and filter top housing is rinsed and brushed three times with distilled water and acetone.The sample fractions are combined, bottled, labeled, and the fluid level marked for transportationto the laboratory. Aliquots of distilled water and acetone are similarly treated for blank analysis.
The absorption train is inspected for abnormalities and disassembled. The impingers areweighed on a digital balance for a percent moisture determination. The contents of the impingersare quantitatively transferred into separate bottles, sealed, labeled, and fluid level marked fortransportation to the laboratory for analysis. Aliquots of the reagent grade impinger contents aresaved for blank analysis.
The filter is transferred to an oven and heated at 225° F for 3 hours and then placed ina desiccator for 24 hours. The filter is then weighed on a Mettler digital balance to the nearest0.01mg. Additional six hour desiccations and weighings are then performed until the differencebetween consecutive weighings are less than 0.5 mg or one percent of the total filtrate weight(weighed to a constant weight).
The nozzle/probe/filter top wash is examined for any leakage during transportation andtransferred to a tared evaporation dish. The wash is then evaporated at an elevated temperature,below the boiling point of the wash, with occasional swirling. The dish and wash residue arethen desiccated and weighed to a constant weight.
The net weight of particulate is calculated from the two fractions (three fractions includingthe impinger contents). Concentrations (gr/DSCF) and emissions (lbs/hr) or other applicableunits are then calculated and repotted.
Page 78
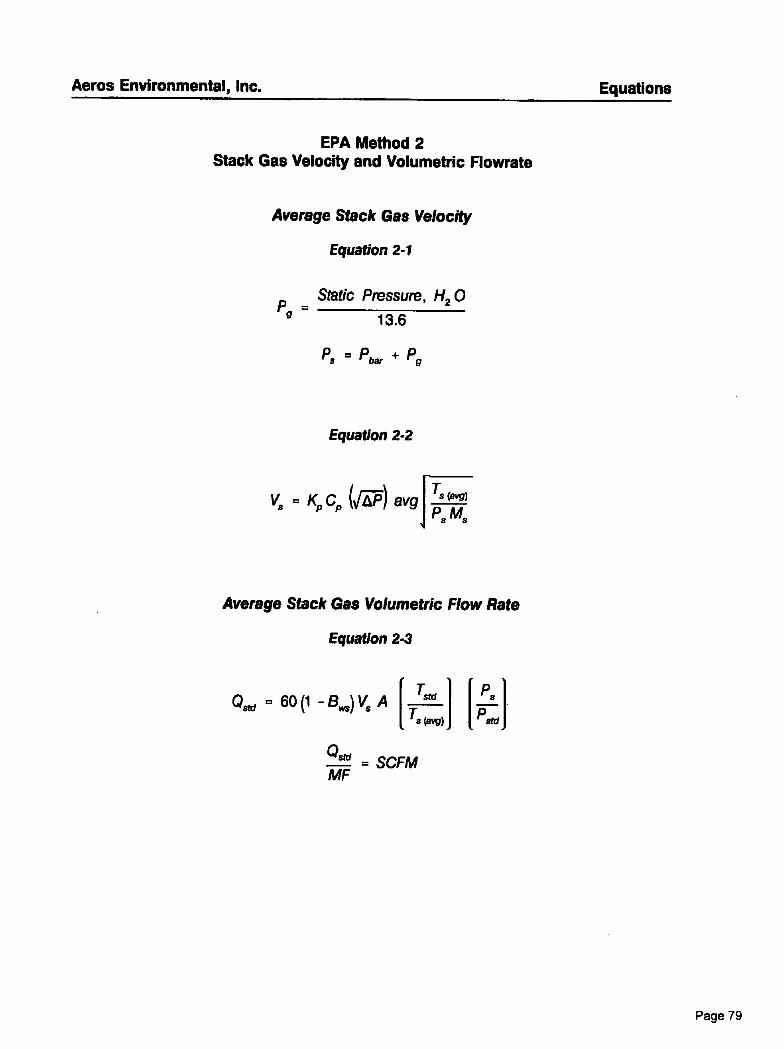
Aeros Environmental, Inc. Equations
EPA Method 2Stack Gas Velocity and Volumetric Flowrate
Average Stack Gas Velocity
Equation 2-1
Static Pressure, H20Pg —
13.6
Ps = P bar + Pg
Equation 2-2
Vs = KCp ( r—v LIP) avg F4-1—eZsT )
Average Stack Gas Volumetric Flow Rate
Equation 2-3
std I 1Q861 = 60(1 — Bw3) vs AT Ps
[Tsovg)Pstd
I
QS1C1 = SCFMmF
Page 79
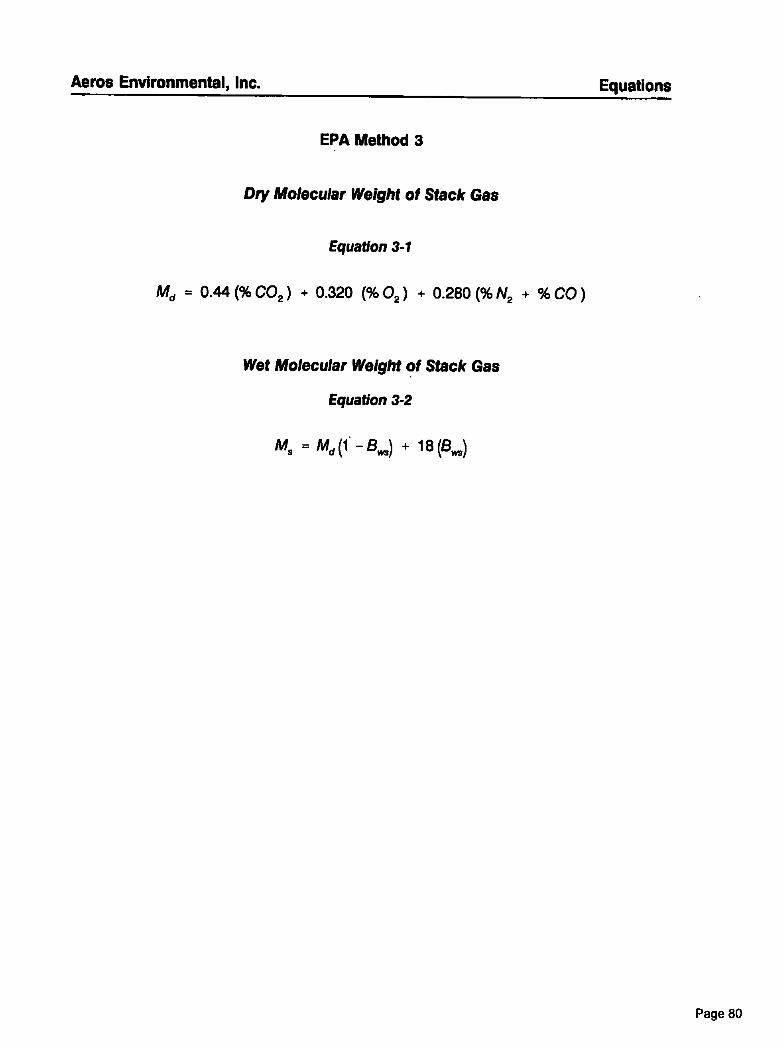
Aeros Environmental, Inc. Equations
EPA Method 3
Dry Molecular Weight of Stack Gas
Equation 3-1
Md = 0.44 (% CO2 ) + 0.320 (% 02 ) + 0.280 (% N2 + %CO)
Wet Molecular Weight of Stack Gas
Equation 3-2
Mt, = Md (1 - B) + 18 (Bws)
Page 80
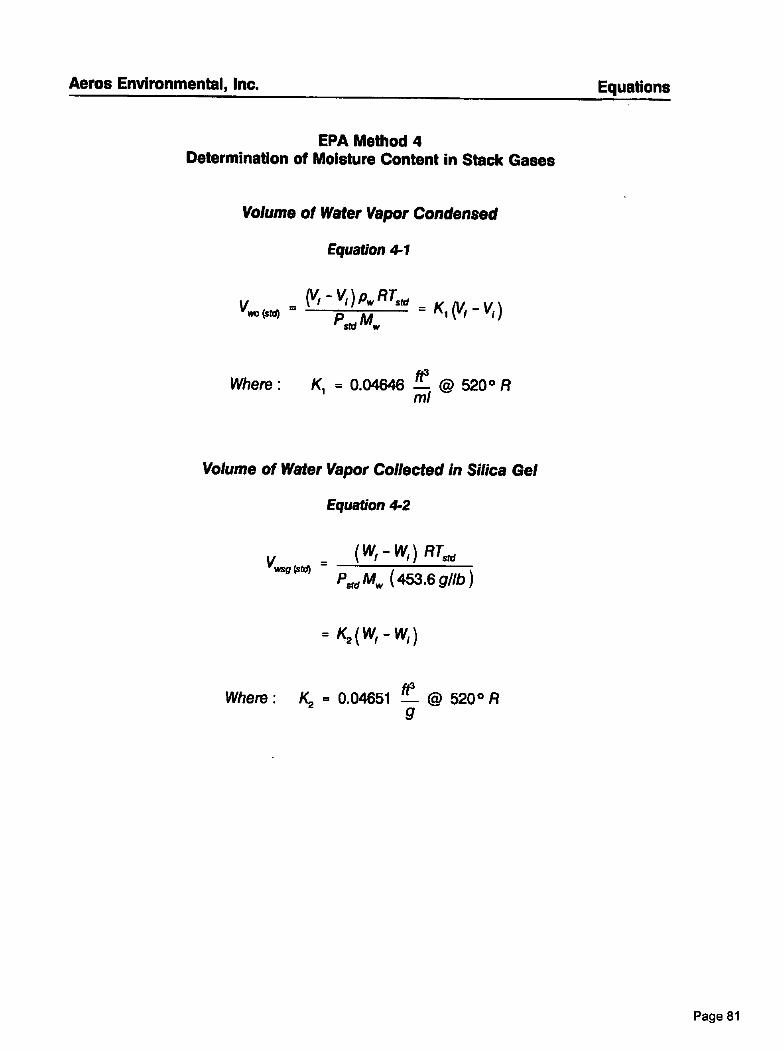
Aeros Environmental, Inc. Equations
EPA Method 4Determination of Moisture Content in Stack Gases
Volume of Water Vapor Condensed
Equation 4-1
(V, - VI ) p.RTstdV = - (Vi - Vi)wo (sten
Pstd Mw
Where : ft30.04646 @ 520 0 Rml
Volume of Water Vapor Collected in Silica Gel
Equation 4-2
WI ) RTedVwsr (se) —
P ed Mw (453.6 glib)
= K2 (Wf —WI)
ft3Where : 1(2 0.04651 @ 520° R
Page 81
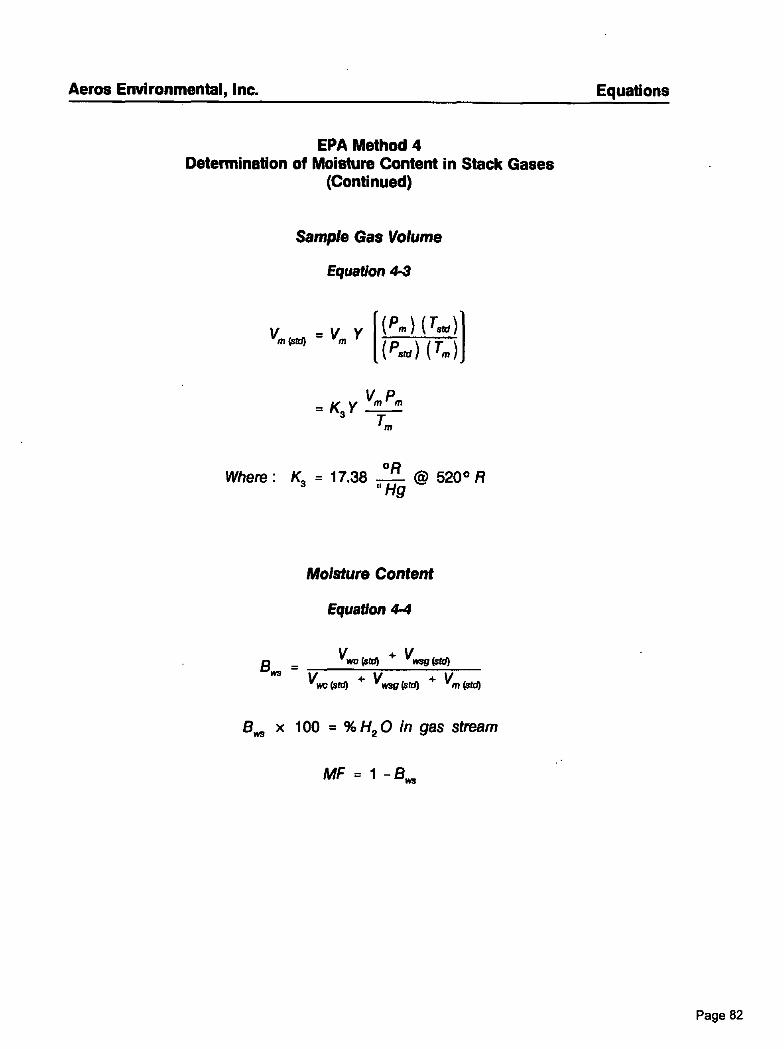
Aeros Environmental, Inc. Equations
EPA Method 4Determination of Moisture Content in Stack Gases
(Continued)
Sample Gas Volume
Equation 4-3
V ise = V Y I(Pm) (T,,.41
r m 1(P8d) (Tap ) j
= K3 Y Vm Pm
Tm
Where: K3 = 17.38 °R @ 520 0 R"Hg
Moisture Content
Equation 4-4
V
B + V
. - we WO WV CCM
KW WO Vwsg + Vmow)
x 100 = % H2 0 in gas stream
MF = 1 -
Page 82
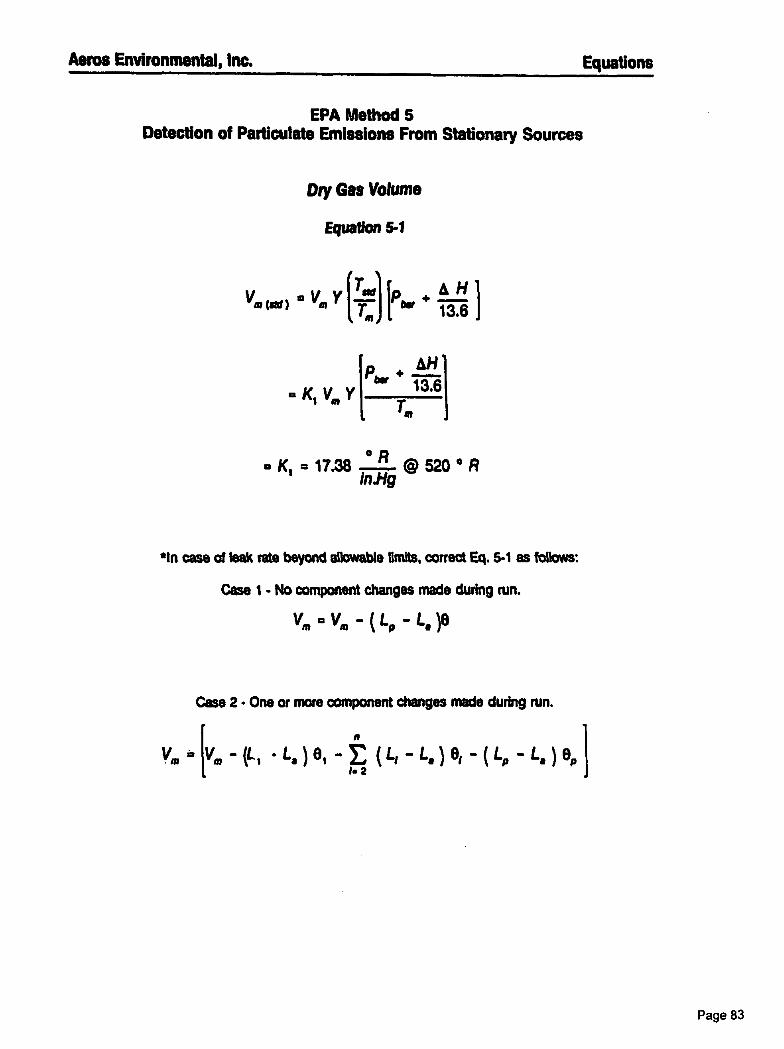
Aeros Environmental, Inc. Equations
EPA Method 5Detection of Particulate Emissions From Stationary Sources
Dty Gas Volume
Equation 5-1
vv grail ip + Htt) I I"
Pbu * 13.61K1 V, YT,
= 17.38 ° @ 520 ° Rin.Hg
*In case of leak rate beyond allowable limits. correct Eq. 5-1 as foliows:
Case 1- No component changes made during run.
Vm = Vm ( L0 - L,
Case 2 • One or more component changes made during run.
il/41 - (L I L, ) 0, - ( - L,) 0, - ( L9 - L, ) 0,1
Page 83
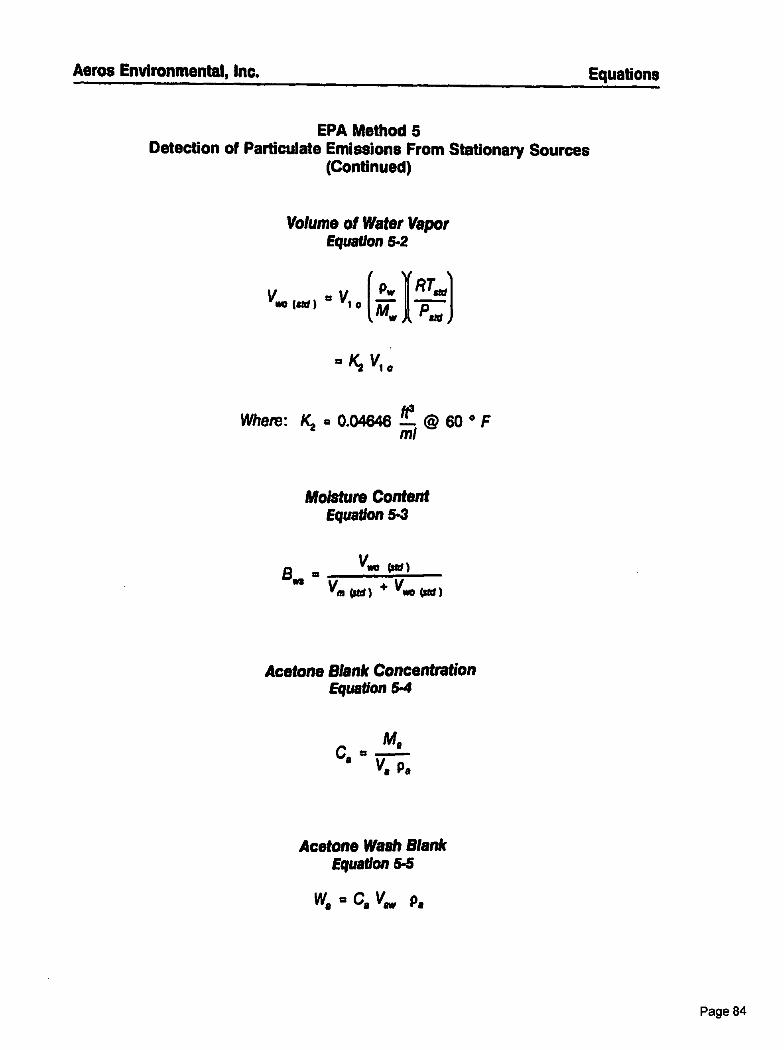
Aeros Environmental, Inc. Equations
EPA Method 5Detection of Particulate Emissions From Stationary Sources
(Continued)
Volume of Water VaporEquation 5-2
s-
P., RT.,.V.. (ad ) = Vi . ri—
m= A Ped
cs K2 Vi ii
ft3Where: K2 = 0.04646 - @ 60 ° F
ml
Moisture ContentEquation 5-3
Bin ..V + V
m istd ) t41) ON )
Acetone Blank ConcentrationEquation 5-4
M.C. =
V. pa
Acetone Wash BlankEquation 5-5
W. = C. V.. pa
Vwe old )
Page 84

Aeros Environmental, Inc. Equations
EPA Method 5Detection of Particulate Emissions From Stationary Sources
(Continued)
Particulate ConcentrationsEquation 54
a Ad
gr ( 0 001 - I n )15 434Cs 81 d-ra . vz—.) .
grldscf (MF) a scgrf
Corrected to 12 % COI
gr
x
12 % CO2gr @ 12% CO2 =
dscf % CO2 (dry)
Mass Emission RateEquation 5-7
lbs gr X dscfm X 60 1 !bx 7000 gr
hr dscf
isokinetic VariationEquation 6-8
% I = 100 x
Ts I VI ic ;ti ( Pb + *6)1
60 0 A, Vs Ps
Where: K3 = 0.002669
Page 85
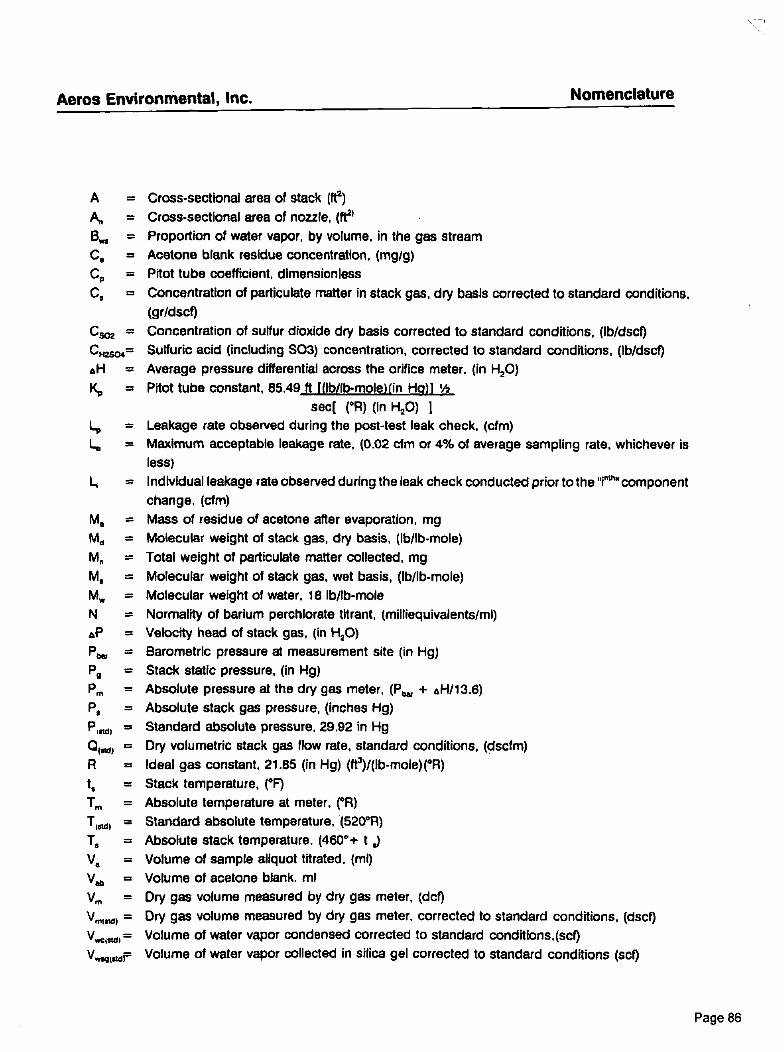
Aeros Environmental, Inc. Nomenclature
A = Cross-sectional area of stack (ft2)
An = Cross-sectional area of nozzle, (le
• = Proportion of water vapor, by volume, in the gas stream
C, Acetone blank residue concentration. (mg/g)
Cp= Pitot tube coefficient, dimensionless
C, = Concentration of particulate matter in stack gas. dry basis corrected to standard conditions,(gr/dscf)
Caw = Concentration of sulfur dioxide dry basis corrected to standard conditions, (lb/dscf)
Sulfuric acid (including S03) concentration, corrected to standard conditions, (lb/dscf)
AH = Average pressure differential across the orifice meter. (in H20)
• Pitot tube constant, 85.49 ft I (1b/lb-mole)(in
sec( (°R) (In H20) I
= Leakage rate observed during the post-test leak check, (cfm)▪ = Maximum acceptable leakage rate, (002 cfm or 4% of average sampling rate, whichever is
less)
= Individual leakage rate observed during the leak check conducted prior to the "r um componentchange. (cfm)
M, = Mass of residue of acetone after evaporation, mg
Md = Molecular weight of stack gas, dry basis, (lb/lb-mole)
ket„ = Total weight of particulate matter collected, mg
M, = Molecular weight of stack gas, wet basis, (lb/lb-mole)
M„, = Molecular weight of water, 18 lb/lb-mole
N = Normality of barium perchlorate trent. (milliequivalents/ml)AP = Velocity head of stack gas, (in H20)• =4 Barometric pressure at measurement site (in Hg)
Pg= Stack static pressure, (in Hg)P rn = Absolute pressure at the dry gas meter, (P„,, + AH/13.6)
P, = Absolute stack gas pressure, (inches Hg)
Pled) =t Standard absolute pressure, 29.92 in Hg
00„„) = Dry volumetric stack gas flow rate, standard conditions, (dscfm)
R = Ideal gas constant. 21.85 (in Hg) (ft3)/(lb-mole)(°R)
t, = Stack temperature, (°F)
T„ = Absolute temperature at meter, (°R)
Two = Standard absolute temperature, (520°R)
T, = Absolute stack temperature. (460°+ t ,)
V, = Volume of sample aliquot titrated. (ml)
V„ = Volume of acetone blank. ml
V,„ = Dry gas volume measured by dry gas meter, (dcf)
• = Dry gas volume measured by dry gas meter. corrected to standard conditions, (dscf)
Volume of water vapor condensed corrected to standard conditions,(scf)
Volume of water vapor collected in silica gel corrected to standard conditions (so)VvagisidF
Page 86
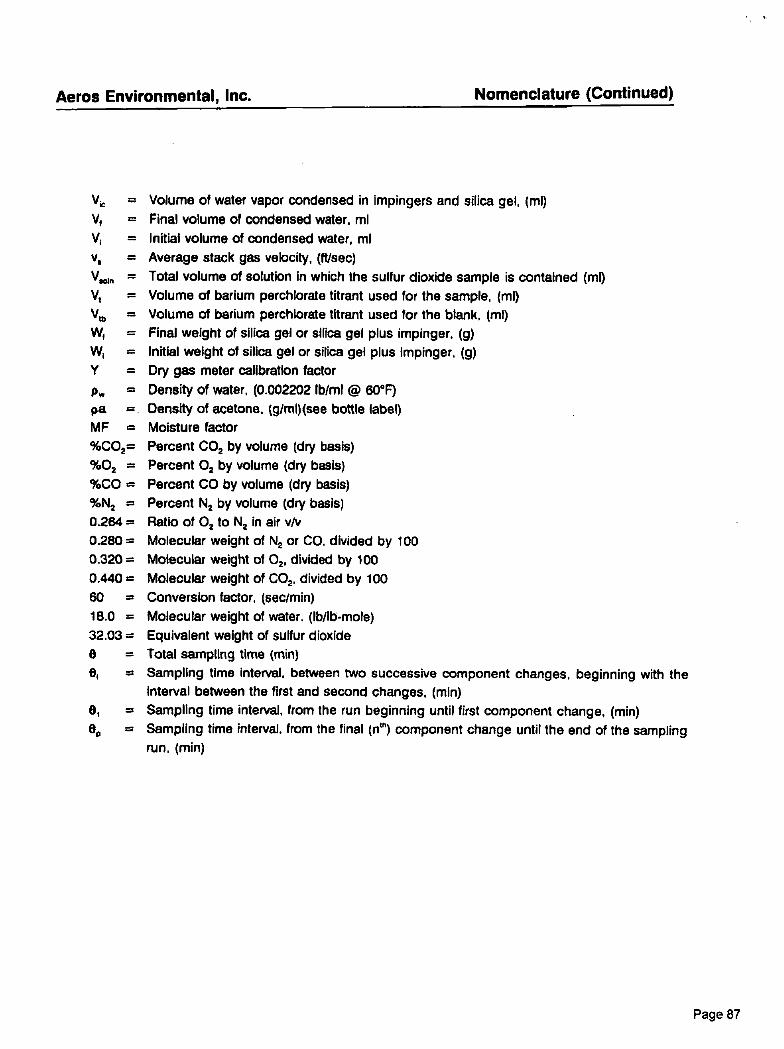
Aeros Environmental, Inc. Nomenclature (Continued)
= Volume of water vapor condensed in impingers and silica gel, (ml)V, Final volume of condensed water, ml
V, = Initial volume of condensed water, mlv, = Average stack gas velocity, (ft/sec)V, Total volume of solution in which the sulfur dioxide sample is contained (ml)V, = Volume of barium perchlorate titrant used for the sample, (ml)Vtb = Volume of barium perchlorate titrant used for the blank. (ml)W, = Final weight of silica gel or silica gel plus impinger, (g)W, = Initial weight of silica gel or silica gel plus impinger. (g)
Y = Dry gas meter calibration factor
= Density of water, (0.002202 lb/m1 @ 60°F)
pa = Density of acetone. (g/mI)(see bottle label)MF = Moisture factor
%CO2= Percent CO2 by volume (dry basis)
%02 = Percent 02 by volume (dry basis)
%CO = Percent CO by volume (dry basis)
%N2 = Percent N2 by volume (dry basis)
0.264 = Ratio of 0 2 to N2 in air v/v
0.280 = Molecular weight of N2 or CO. divided by 1000.320 = Molecular weight of 02 , divided by 100
0.440 = Molecular weight of CO 2 , divided by 100
60 = Conversion factor, (sec/min)
18.0 = Molecular weight of water. (lb/lb-mole)
32.03= Equivalent weight of sulfur dioxide
o = Total sampling time (min)0, = Sampling time interval, between two successive component changes, beginning with the
interval between the first and second changes, (min)
= Sampling time interval, from the run beginning until first component change, (min)OD= Sampling time interval, from the final (e) component change until the end of the sampling
run. (min)
Page 87
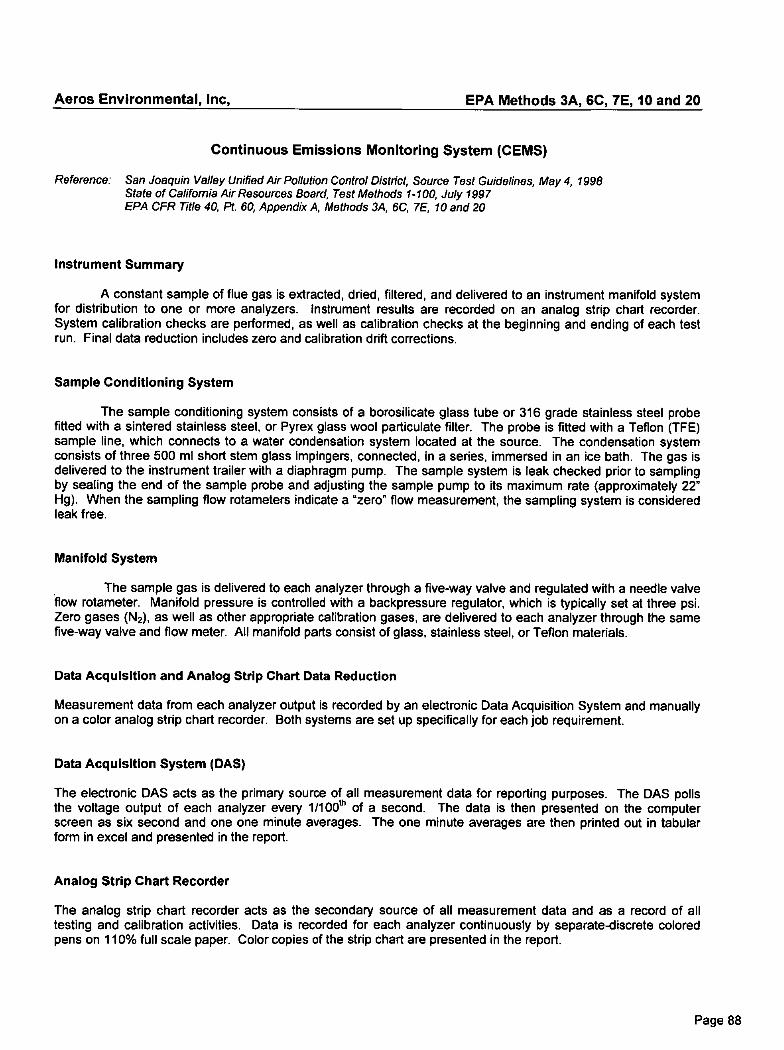
Aeros Environmental, Inc, EPA Methods 3A, 6C, 7E, 10 and 20
Continuous Emissions Monitoring System (GEMS)
Reference: San Joaquin Valley Unified Air Pollution Control District, Source Test Guidelines, May 4, 1998State of California Air Resources Board, Test Methods 1-100, July 1997EPA CFR Title 40, Pt. 60, Appendix A, Methods 3A, 6C, 7E, 10 and 20
Instrument Summary
A constant sample of flue gas is extracted, dried, filtered, and delivered to an instrument manifold systemfor distribution to one or more analyzers. Instrument results are recorded on an analog strip chart recorder.System calibration checks are performed, as well as calibration checks at the beginning and ending of each testrun. Final data reduction includes zero and calibration drift corrections.
Sample Conditioning System
The sample conditioning system consists of a borosilicate glass tube or 316 grade stainless steel probefitted with a sintered stainless steel, or Pyrex glass wool particulate filter. The probe is fitted with a Teflon (TFE)sample line, which connects to a water condensation system located at the source. The condensation systemconsists of three 500 ml short stem glass impingers, connected, in a series, immersed in an ice bath. The gas isdelivered to the instrument trailer with a diaphragm pump. The sample system is leak checked prior to samplingby sealing the end of the sample probe and adjusting the sample pump to its maximum rate (approximately 22"Hg). When the sampling flow rotameters indicate a "zero" flow measurement, the sampling system is consideredleak free.
Manifold System
The sample gas is delivered to each analyzer through a five-way valve and regulated with a needle valve.flow rotameter. Manifold pressure is controlled with a backpressure regulator, which is typically set at three psi.Zero gases (N 2), as well as other appropriate calibration gases, are delivered to each analyzer through the samefive-way valve and flow meter. All manifold parts consist of glass, stainless steel, or Teflon materials.
Data Acquisition and Analog Strip Chart Data Reduction
Measurement data from each analyzer output is recorded by an electronic Data Acquisition System and manuallyon a color analog strip chart recorder. Both systems are set up specifically for each job requirement.
Data Acquisition System (DAS)
The electronic DAS acts as the primary source of all measurement data for reporting purposes. The DAS pollsthe voltage output of each analyzer every 11100111 of a second. The data is then presented on the computerscreen as six second and one one minute averages. The one minute averages are then printed out in tabularform in excel and presented in the report.
Analog Strip Chart Recorder
The analog strip chart recorder acts as the secondary source of all measurement data and as a record of alltesting and calibration activities. Data is recorded for each analyzer continuously by separate-discrete coloredpens on 110% full scale paper. Color copies of the strip chart are presented in the report.
Page 88
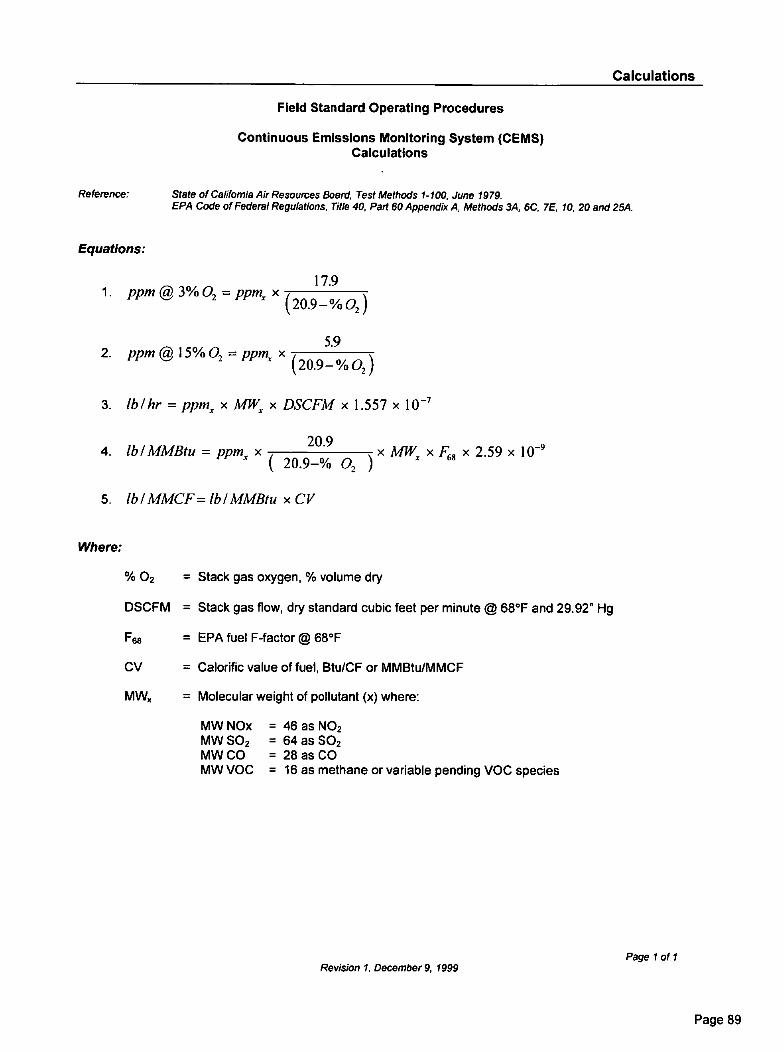
Calculations
Field Standard Operating Procedures
Continuous Emissions Monitoring System (CEMS)Calculations
Reference: State of California Air Resources Board, Test Methods 1-100, June 1979.EPA Code of Federal Regulations, Title 40, Part 60 Appendix A, Methods 3A, 6C, 7E, 10, 20 and 25.4.
Equations:
17.9 PPm @ 3% 02 = PPm. X (20.9 — % 02)
5.9 PPm @ 15%02 = PPM,
X (20.9—% 02 )
3. lb 1 hr = ppm„ x MW., x DSCFM x 1.557 x 10⁻⁷
X MW, X F684. lbl MMBtu = ppm., X (
20.9—% 02 )X 2.59 x 10⁻⁹
5. lbl MMCF = 1bl MMBtu x CV
Where:
% 02= Stack gas oxygen, % volume dry
DSCFM = Stack gas flow, dry standard cubic feet per minute @ 68°F and 29.92" Hg
F68 = EPA fuel F-factor @ 68°F
CV = Calorific value of fuel, Btu/CF or MMBtu/MMCF
MWx = Molecular weight of pollutant (x) where:
MW NOx = 46 as NO2MW SO 2 = 64 as SO2MW CO = 28 as COMW VOC = 16 as methane or variable pending VOC species
Page 1 of 1Revision 1, December 9, 1999
1.
2.
20.9
Page 89
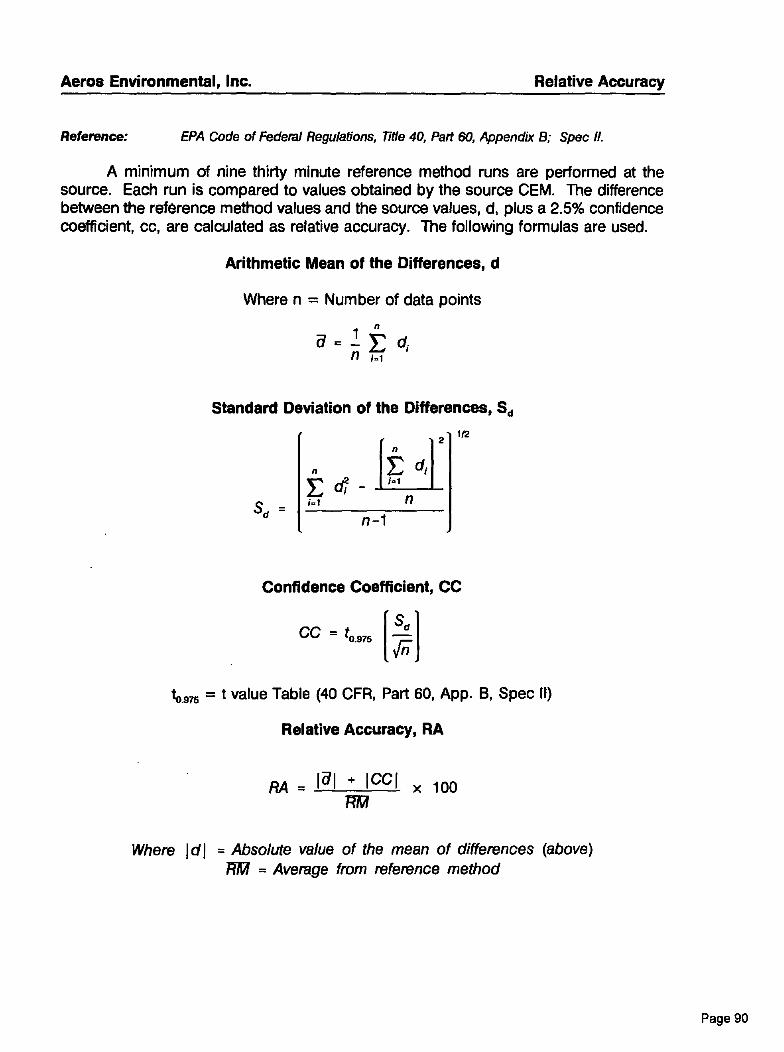
Aeros Environmental, Inc. Relative Accuracy
Reference: EPA Code of Federal Regulations, Title 40, Part 60, Appendix B; Spec
A minimum of nine thirty minute reference method runs are performed at thesource. Each run is compared to values obtained by the source GEM. The differencebetween the reference method values and the source values, d, plus a 2.5% confidencecoefficient, cc, are calculated as relative accuracy. The following formulas are used.
Arithmetic Mean of the Differences, d
Where n = Number of data points
1n
Standard Deviation of the Differences, Sd
i=I
n-1Sd
112
Confidence Coefficient, CC
CC = to.975
to.975 = t value Table (40 CFR, Part 60, App. B, Spec II)
Relative Accuracy, RA
RA= 161 + ICC1 x looRM
Where VII = Absolute value of the mean of differences (above)R191 = Average from reference method
Page 90
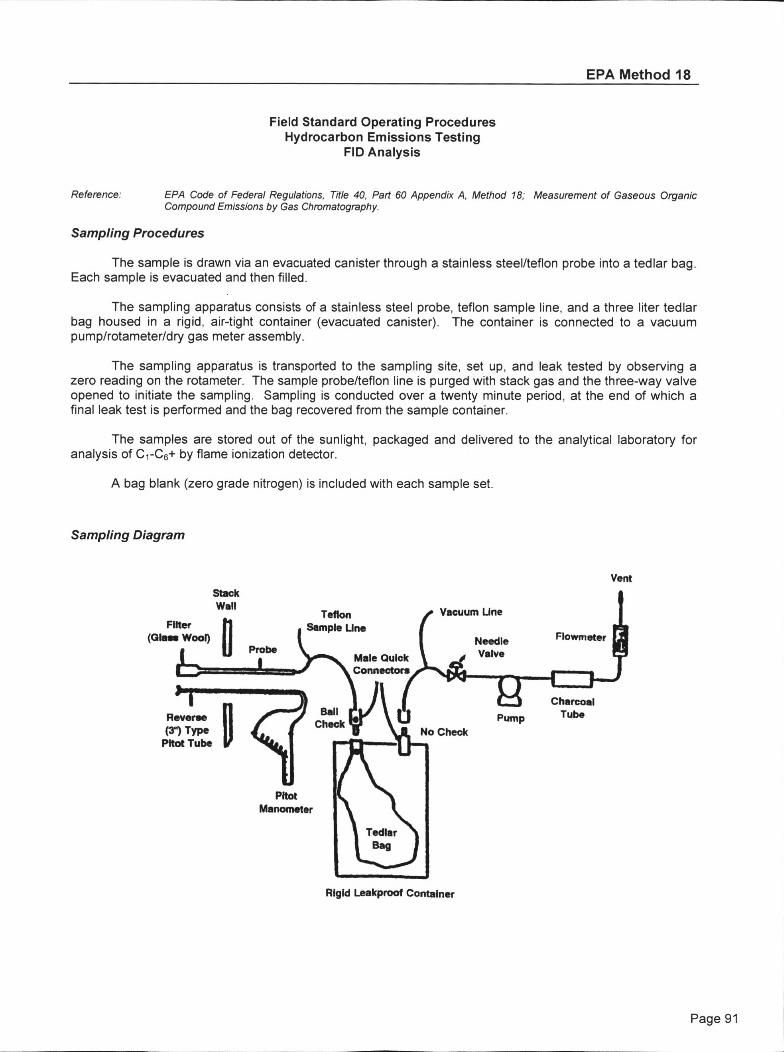
Vacuum Line
FlowmeterNeedleValve
Reverse(T) Type
Mot Tube
BallCheck
No CheckPump
CharcoalTube
PitotManometer
StackWall
TeflonFilter fl Sample Line
(alass Wool)Probe
Male QuickConnectors
EPA Method 18
Field Standard Operating ProceduresHydrocarbon Emissions Testing
FD Analysis
Reference: EPA Code of Federal Regulations, Title 40, Part 60 Appendix A, Method 18; Measurement of Gaseous OrganicCompound Emissions by Gas Chromatography.
Sampling Procedures
The sample is drawn via an evacuated canister through a stainless steel/teflon probe into a tedlar bag.Each sample is evacuated and then filled.
The sampling apparatus consists of a stainless steel probe, teflon sample line, and a three liter tedlarbag housed in a rigid, air-tight container (evacuated canister). The container is connected to a vacuumpump/rotameter/dry gas meter assembly.
The sampling apparatus is transported to the sampling site, set up, and leak tested by observing azero reading on the rotameter. The sample probe/teflon line is purged with stack gas and the three-way valveopened to initiate the sampling. Sampling is conducted over a twenty minute period, at the end of which afinal leak test is performed and the bag recovered from the sample container.
The samples are stored out of the sunlight, packaged and delivered to the analytical laboratory foranalysis of C 1 -C6+ by flame ionization detector.
A bag blank (zero grade nitrogen) is included with each sample set.
Sampling Diagram
Vent
Rigid Leakproof Container
Page 91
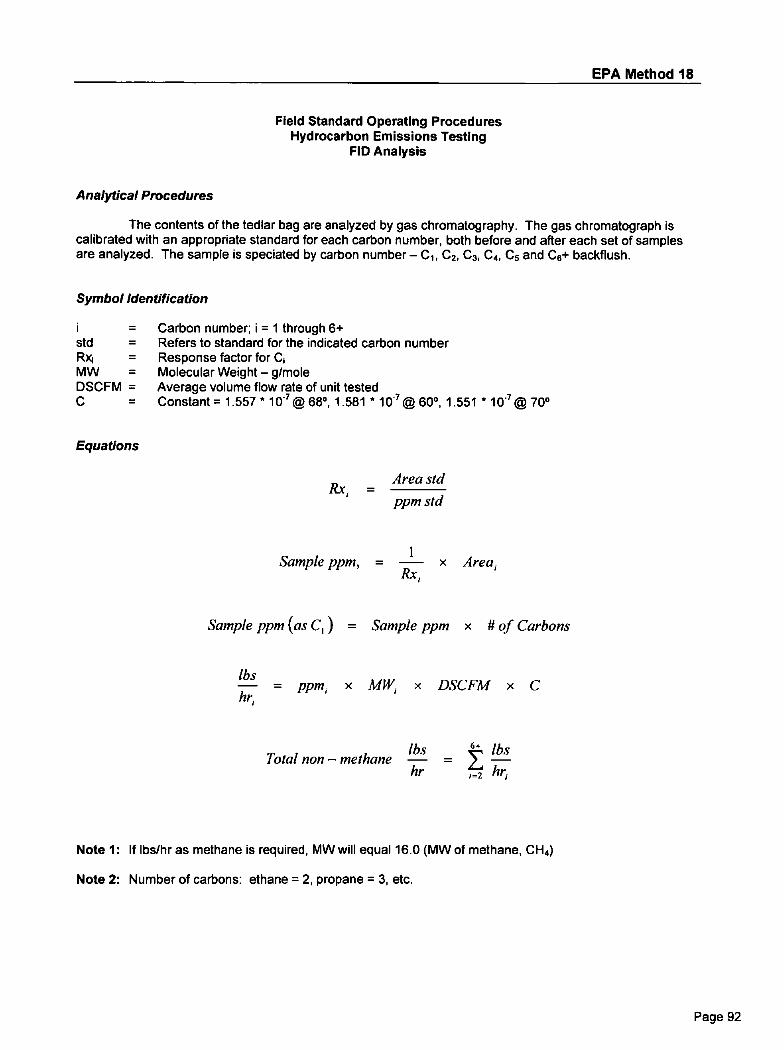
EPA Method 18
Field Standard Operating ProceduresHydrocarbon Emissions Testing
FID Analysis
Analytical Procedures
The contents of the tedlar bag are analyzed by gas chromatography. The gas chromatograph iscalibrated with an appropriate standard for each carbon number, both before and after each set of samplesare analyzed. The sample is speciated by carbon number — C1, C2, C3, C4, Cg and Cg+ backflush.
Symbol Identification
Carbon number; i = 1 through 6+std = Refers to standard for the indicated carbon numberRx = Response factor for CiMW = Molecular Weight — g/moleDSCFM = Average volume flow rate of unit tested
Constant = 1.557 * i0@ 68°, 1.581 * 104 @ 600 , 1.551 * 10 -7 @ 70°
Equations
Area stdppm std
12x, =
1Sample ppm, = — x Area,
Rx,
Sample ppm(as C,) = Sample ppm x # of Carbons
lbshr =
ppm, x MW, x DSCFM x C
lbs lbsTotal non— methane — = y —
hr hr,=2
Note 1: If lbs/hr as methane is required, MW will equal 16.0 (MW of methane, CH4)
Note 2: Number of carbons: ethane = 2, propane = 3, etc.
Page 92
Aeros Environmental, Inc. BAAQMD ST-1B
Source Test ProcedureAmmonia, Integrated Sampling
Applicability
This method is used to quantity emissions of ammonia.
Principle
Sample gas is drawn through a solution of 0.1 N hydrochloric acid which absorbs theammonia. The ammonia is then analyzed according to Analytical Procedure EPA 350.3.
Range
The minimum measurable concentration of ammonia is 1 ppm at the sample volumespecified in this procedure.
Elevated concentrations of ammonia may be determined by increasing the concentrationof the absorbing reagent, hydrochloric acid solution. The concentration of reagent to be usedmay be determined by stoichiometry, allowing a 50% excess.
Interference
Refer to EPA Method 350.3.
Apparatus
Probe. The probe is constructed of stainless steel or borosilicate glass tubing fitted witha glass wool filter in the nozzle.
Condensers. Three Greenberg-Smith impingers are used as absorber/condensers. Thefinal impinger has a thermometer attached to the inlet stem.
Cooling system. An ice bath is used to contain the impingers.
Sample pump. A leak-free vacuum pump capable of maintaining a 14.3 liter/min (0.5CFM) flow rate at 15 inches of mercury, is used. The pump has a flow control valve and vacuumgauge attached to the inlet.
Silica Ge/ Tube. Approximately 500cc of silica gel is used (with a Drierite indicator) toinsure that the gas entering the dry test meter is dry.
Dry Test Meter. A dry gas test meter is used that is accurate within + 2% of the truevolume and equipped with a thermometer to measure the outlet temperature.
Connections. Teflon tubing is used in making all connections that come in contact withthe sample. Tygon tubing is used for all other connections.
Barometer. A barometer that is accurate to within + 0.2 inches of mercury is used.
Page 93
Aeros Environmental, Inc. BAAQMD ST-1B (Continued)
Source Test ProcedureAmmonia, Integrated Sampling
Reagents
0.1N of Hydrochloric acid is used. 7.30 ml concentrated HCI is dissolved in sufficientwater to make a 1.0 liter solution.
Pre-test Procedures
100 ml of the HCI solution is added to each of two impingers. The impingers then arestoppered. 100 ml of the HCI solution is retained to be analyzed as a blank. The sampling trainis assembled as shown in the Sampling Diagram. The sampling train is leak-tested by startingthe pump, plugging the probe, and adjusting the pump inlet vacuum to 10 inches Hg. The leakrate must not exceed 0.6 liter/min (0.02 CFM) through the dry test meter. Before stopping thepump, the plug in the sampling probe is carefully released to avoid back flow of the impingersolution.
The initial dry test meter reading and barometric pressure are recorded on the samplingdata sheet. If there is evidence of concentration stratification, the sampling traverse points areselected accordingly. Otherwise, sampling is at a single point.
Sampling
Each test run shall be a minimum of thirty minute duration when testing emissions fromcontinuous operations. Each test run at batch process operation shall be for 90% of the batchtime or thirty minutes, whichever is less.
The probe is positioned at the sampling point and the pump started. Sampling is at aconstant rate of 14.3 liter/min (0.5 CFM) during the test as determined by the dry gas meter.
The following information is recorded at five minute intervals.A. Dry test meter temperatureB. Impinger outlet temperatureC. Dry test meter volumeD. Dry test meter orifice A H.
Ice is added as necessary to maintain impinger temperatures at 7 °C (45 °F) or less. Atthe conclusion of each run, the pump is stopped, the probe removed from the stack, and thefinal meter reading recorded. The probe is pointed upward and the sample train purged withambient air.
Three consecutive samples will be taken.
Post-test Procedures
The impinger contents, including rinsings, are recovered into a 500m1 nalgene bottle. Thehydrochloric acid solutions and blank are individually analyzed for total ammonia contentaccording to analytical procedure.
Page 94
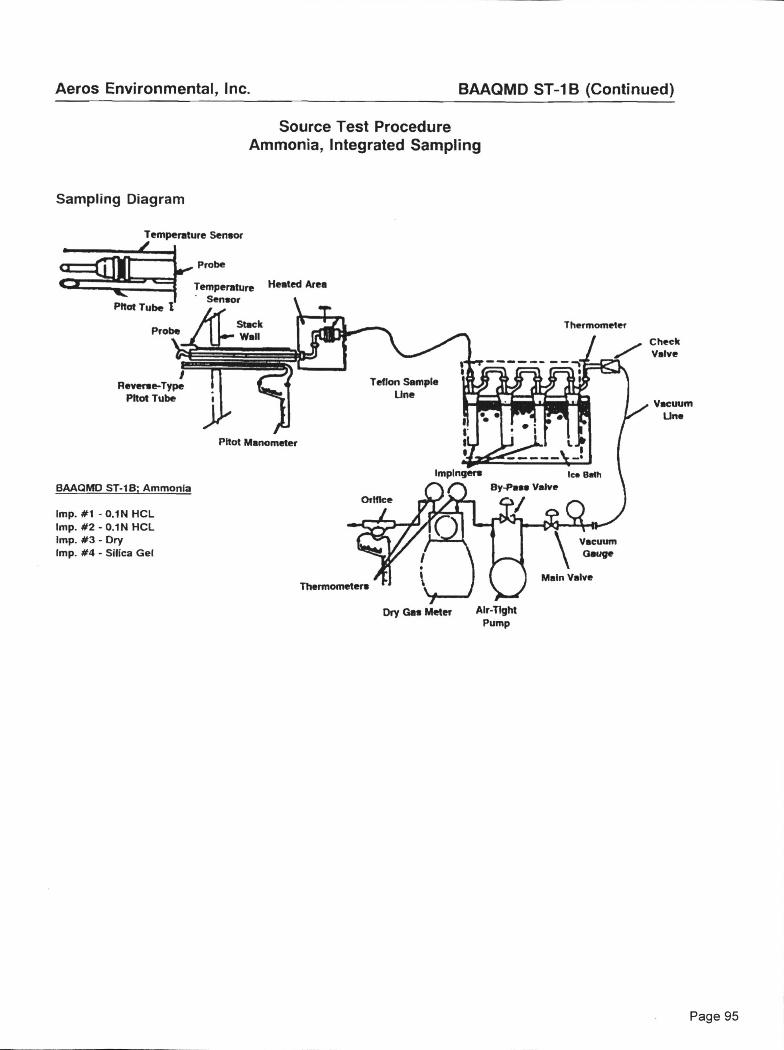
ImpInger, lc. Bath
By-Paes Valve
VacuumGauge
Sampling Diagram
Temperature Sensor
Probe
Pltot Tube I
Probe
Temperature Heated AreaSensor
Stack4em Wall
Reverse-TypePltot Tube
Pitot Manometer
Main ValveThermometers
Dry Gas Meter Air-TightPump
CheckValve
VacuumlJne
Thermometer
BAAGMO ST-1B; Ammonia
Imp. #1 - 0.1N HCLImp. #2 - 0.1N HCLImp. #3 - DryImp. #4 - Silica Gel
Teflon SampleLine
Orifice
Aeros Environmental, Inc. BAAQMD ST-1B (Continued)
Source Test ProcedureAmmonia, Integrated Sampling
Page 95
Aeros Environmental, Inc. EPA Method 350.3
Nitrogen, AmmoniaPotentiometric, Ion Selective Electrode
Scope and Application
This method is applicable to the measurement of ammonia-nitrogen in drinking, surface,and saline waters, as well as domestic and industrial wastes.
The method covers the range from 0.03 to 1400 mg NH 3-N/II. Color and turbidity haveno effect on the measurements, thus distillation may not be necessary.
Summary
The ammonia is determined pantentiometrically using an ion selective ammonia electrodeand a pH meter having an expanded milli-volt scale or specific ion meter.
The ammonia electrode uses a hydrophobic gas-permeable membrane to separate thesample solution from an ammonia chloride internal solution. Ammonia in the sample diffusesthrough the membrane and alters the pH of the internal solution, which is sensed by a pHelectrode. The constant level of chloride in the internal solution is sensed by a chloride selectiveion electrode which acts as the reference electrode.
Sample Handling and Preservation
Samples are preserved with 2 ml of conc. 1-12SO4 per liter and stored at 4° C.
Interferences
Volatile amines will act as a positive interference.
Apparatus
The unknown sample is diluted, volumetrically to 500 mls. A 100 ml aliquot is removedand added to a 150 ml beaker. The 100 ml beaker is placed unto a magnetic stirrer. 1 ml of10N sodium hydroxide is added to the sample while recording the stabilized electronic potentialvalue of the specific ion electrode.
A series of standards (0.01, 0.05, 0.1, 0.5, 1.0 mg/ml NH 3) are analyzed by the proceduredescribed above. The values obtained with the standards are plotted on semi logarithmic graphpaper as electronic potential vs. NH 3 concentrations.
The unknown sample is compared to the standard curve generated in the above section.The concentration of ammonia, mg/li, in the unknown sample is recorded.
If necessary, serial dilutions may be performed on the unknown sample to bring it into therange of the standard calibration curve.
Page 96
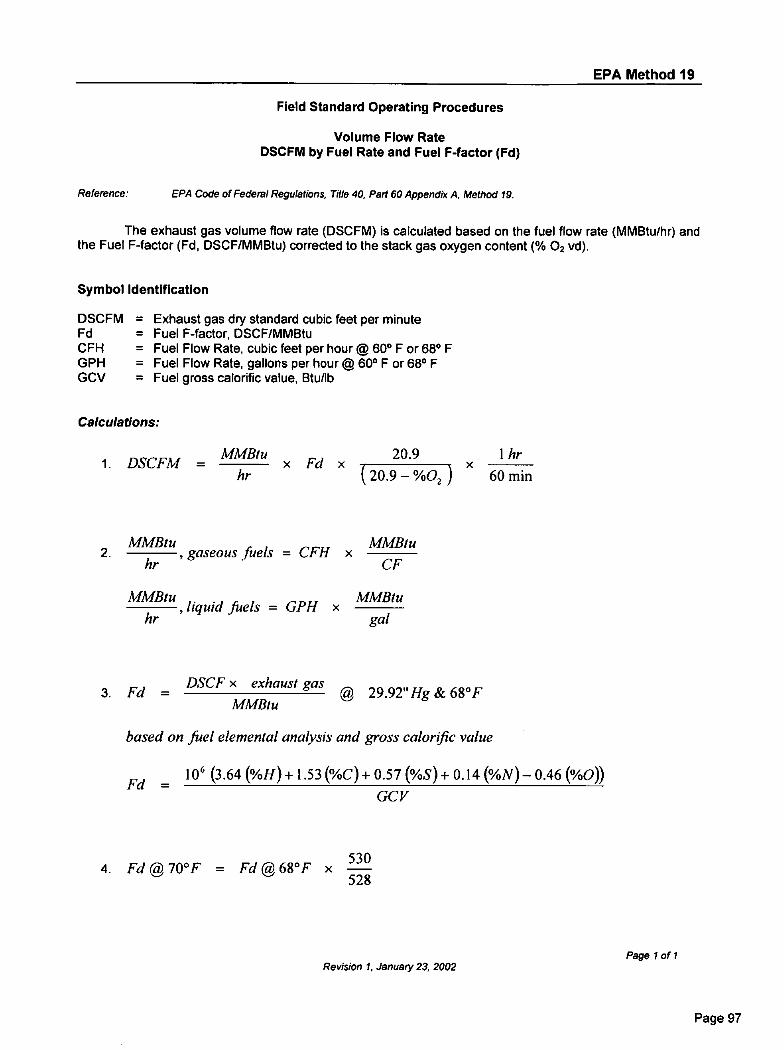
EPA Method 19
Field Standard Operating Procedures
Volume Flow RateDSCFM by Fuel Rate and Fuel F-factor (Fd)
Reference: EPA Code of Federal Regulations, Title 40, Part 60 Appendix A. Method 19.
The exhaust gas volume flow rate (DSCFM) is calculated based on the fuel flow rate (MMBtu/hr) andthe Fuel F-factor (Fd, DSCF/MMBtu) corrected to the stack gas oxygen content (% 02 vd).
Symbol Identification
DSCFM = Exhaust gas dry standard cubic feet per minuteFd = Fuel F-factor, DSCF/MMBtuCFH = Fuel Flow Rate, cubic feet per hour @ 60° F or 68° FGPH = Fuel Flow Rate, gallons per hour @ 60° F or 68° FGCV = Fuel gross calorific value, Btu/lb
MMBtu 20.9 1 hr x Fd x , xhr k 20.9 - %02 ) 60 min
Calculations:
1. DSCFM =
2.MMBtu
, gaseous fuels = CFH x MMBtuhr CF
MMBtu, liquid fuels = GPH x
hr gal
DSCF x exhaust gas3. Fd —
@ 29.92"Hg & 68°FMMBiu
based on fuel elemental analysis and gross calorific value
10 6 (3.64 (%H)+ 1.53 NO + 0.57 (%s) + 0.14 (%N)- 0.46 NODFd =
GCV
5304. Fd @ 70°F = Fd @ 68°F x
MMBtu
528
Page 1 of 1Revision 1, January 23, 2002
Page 97
Raw Data
Page 98
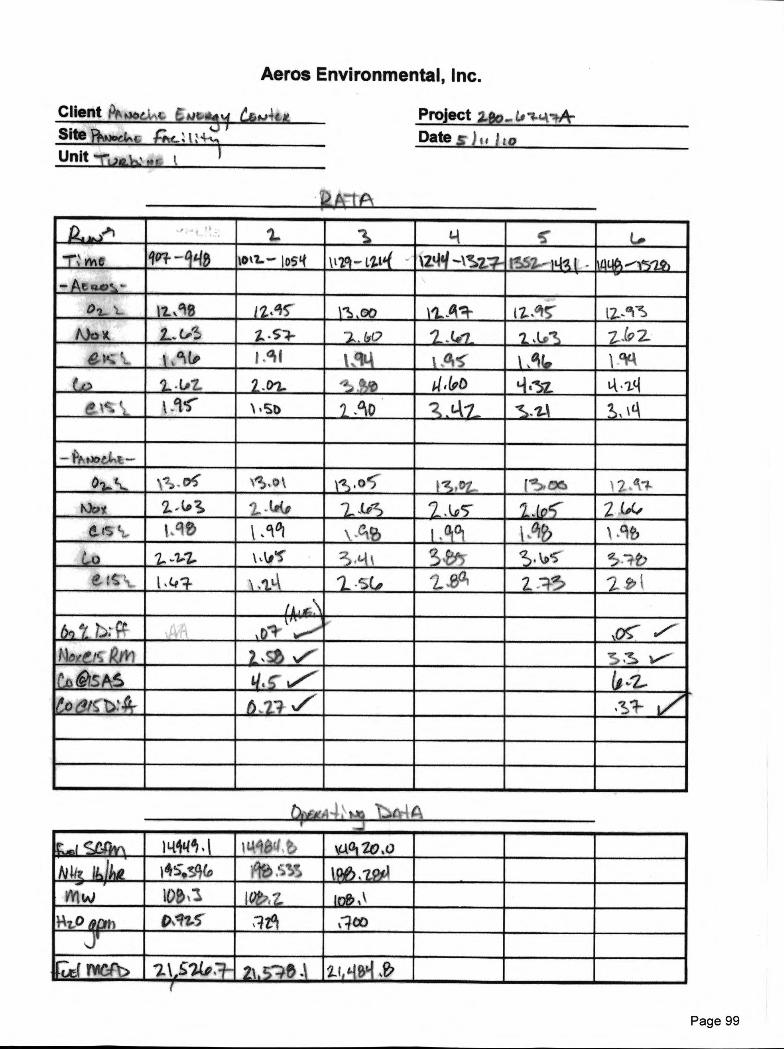
Aeros Environmental, Inc.
Client Oft 006,NL c.4.4txSite R‘kprati.nc AC_. 1:4
Unit
Project leo_
Date .5- hi Ito
prt
P..A1s) 2 -', L-k L.-1-; rA c qv-4- — 1 14D ma-- 1054 .2.Ct1 "-1iti.( VALI ---1 2...7-- IS.S2 - HI ( - vit--Iym- At c%-o-
0 1-- "- tt.9f3 /2.4C l'S ,00 0.....A1- [7-.4"" [2__EVS/Q0 x 2_,. v.:: Z -CI- ' ,. tvt2 2. -.41_ '2_. As; 119 2-
ev:. .. Ole, ',cif 134 1 .0,1 Of,Co 2._ -tit 2_D-2- .. iio 4-1,(90 Li.--z 4 .1c1
e Ii.-.. `, k -iT. n ,st) / .°0 '2) .41.
- illk NOGieq. —
al.., tl,„ \ .7.) - (25- ‘ ?,, o k e1-2, . 0 j
tOrA y 2.-6)3 . 6{,, 7- 16 eZ . L75– 1,(05- 2 (0(.-a n , 1 cIS k , VI \ •7-1$ I 191°1 ,clib ), %
t'„u 2- -I-7- 1.4'1 3 . l- ‘3 ,?.."5
€ t s . L( \ .1A/ -SCV L PP Z
b--) ,0C- .v.'Môic. kw 4,s,!5 ne' . 1,---
AI Oks tS LS
/0 el's ti-Or 6 , 23 %Z. ‘1,1- V
Orr" 1-
ct 4h'\ ii-tiVi 1 ILA f i Pe., gAai20,0
/\)(3 ii,iiig 1454% t50.191)"rw 108,1 10?",-i.: in& ,‘
A -1...0 p,/2.5" ,-3c0ye)
fi,-ei rfier--.) 7_Als-vav:i--- 2\ 2j, 1-1131 .g.
Page 99
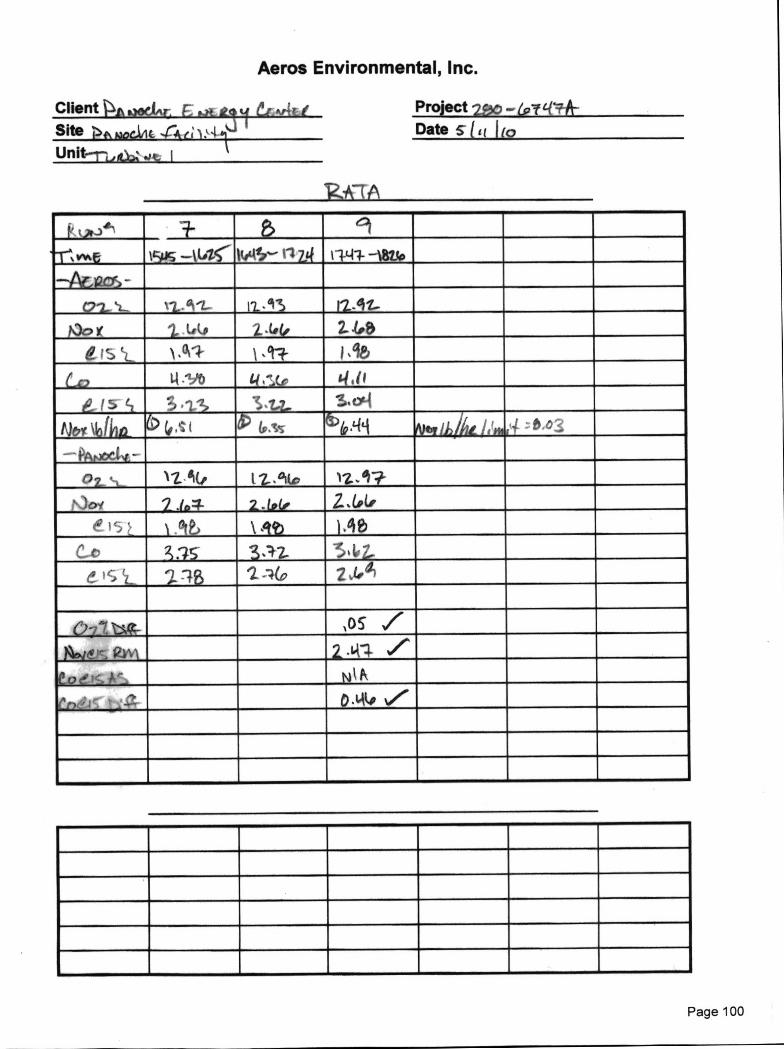
Aeros Environmental, Inc.
Client „,ve,JATI F, bArit Site IN\ NoclAt, ,; Unit-17,4:x); at, 1
Project 2$30 (97 Date s(
RA-11\
P z)e--).' -÷ 8 9
'1-r-asmE Irsps —kuiC Ktos— Di ri-L-1-4- —‘atto
—Ar,i2cr, -az, ,-, ri.. °11- 12.93
P00 e -2, LA. 1--6(, 2. 4.80
e I s'L 0\1- 1 , 11- 1 Ae)
Lo Li lib LCUir q , ti
8 15 ti S I:2) .1‘Z-2- S'°`1tjbY kbilli2 b VI I IP tr :c`; 1)/0'`41 Nviikkt 1/'l
-- PANte-Lt.-0 z , , 12. (t l j. . 01(t., )2...1?-.
-' Jo.? 9 .104- 2._ tpc. 2 stiAr
e ' 5 1.1P., \ It 1 di 0
1.."..t 35 3:42- .5 . L, Z-
; 'S (z -4g 2 :wo 2 ,i•A
,o 5 7
7
toenc V, N ik
rn '- •,'-:-*- 0 . 1,1k41 %,
Page 100
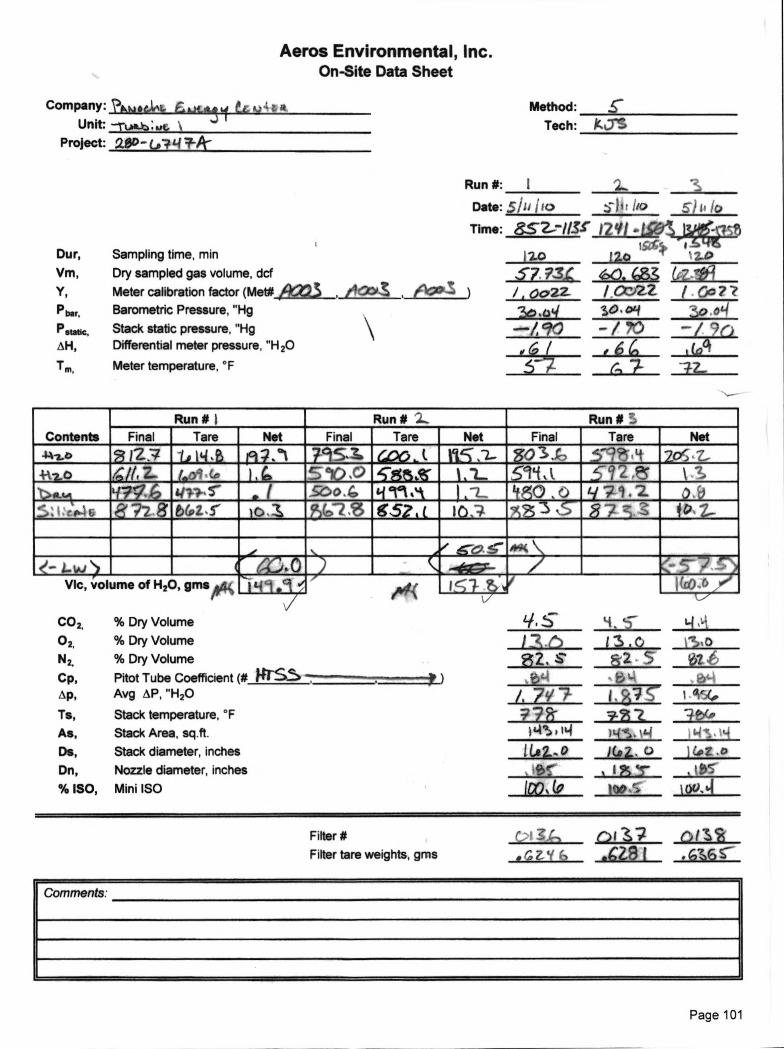
Aeros Environmental, Inc.On-Site Data Sheet
Company: f,,,2LA, 4)4 t aUnit: --ruky,;,,,t,
Project: 280 - ID? Li TA"
Method: Tech: KY'S
Run #:
Date: Sill o s- jl! //C) 5)11 iCk
Du r,Vm,Y,
P bar,
Patabc,
Tm
AH,
Sampling time, minDry sampled gas volume, dcfMeter calibration factor (Met#23 A0V-S f./0"-1 Barometric Pressure, "HgStack static pressure, "HgDifferential meter pressure, "H20
Meter temperature, °F
Time: 852--/a-C121 •UE601,131t5eg4,
IZO '2.0 57 73,4 640. 683 lkz •
aozz cozz / Go??
D.04 Sa °LI Oq — / `Y) — 1r)
5-7 A 7 -42_
ContentsRun # 1 Run # -..:.... Run #
Final Tare Net Final Tare Net Final Tare Net
447--b 127 1, 1 4-1.B fa 9:1 795. 6,00,.( l'2 go3.,c- 315'5. , Li, 20; z,..)//, Z- (&N 'G, I , 4, 510,0 cF55.% I .1-. 594 , k 5 9 2 k 1
b,0_,A '177 , 6 4474- 5-- •i Sc)o. ‘, ii 99,A I ,L if 5, C) , (2) il 71.2. 0.D77 3 bcpz , 5- 0 1 ii, 6-2 ,`6 85 1. 3 - 1 3 .5 ;-;2 0,
NINE Mall- LA) °-ErAIWID IMIOLIPIMIMMIll
_
Vic, volume
CO2,
02.
of H 20, gmsfi444I*4<
I (co -6
% Dry Volume% Dry Volume% Dry Volume
1 -2,n t
F2. S" 8'2 5 a.Cp, Ib‘-Pitot Tube Coefficient (#
Avg AP, "H20 /. 7v 7Ts,
As,
Ds,Dn,% ISO,
Stack temperature, °FStack Area, sq.ft.Stack diameter, inchesNozzle diameter, inchesMini ISO
77 Fs1 ,4
1 La..
_1oz
`r
1 10 . % Of). LA
Filter # tl:N1 r)117
Filter tare weights, gms SZY .429 I GU, C
Page 101
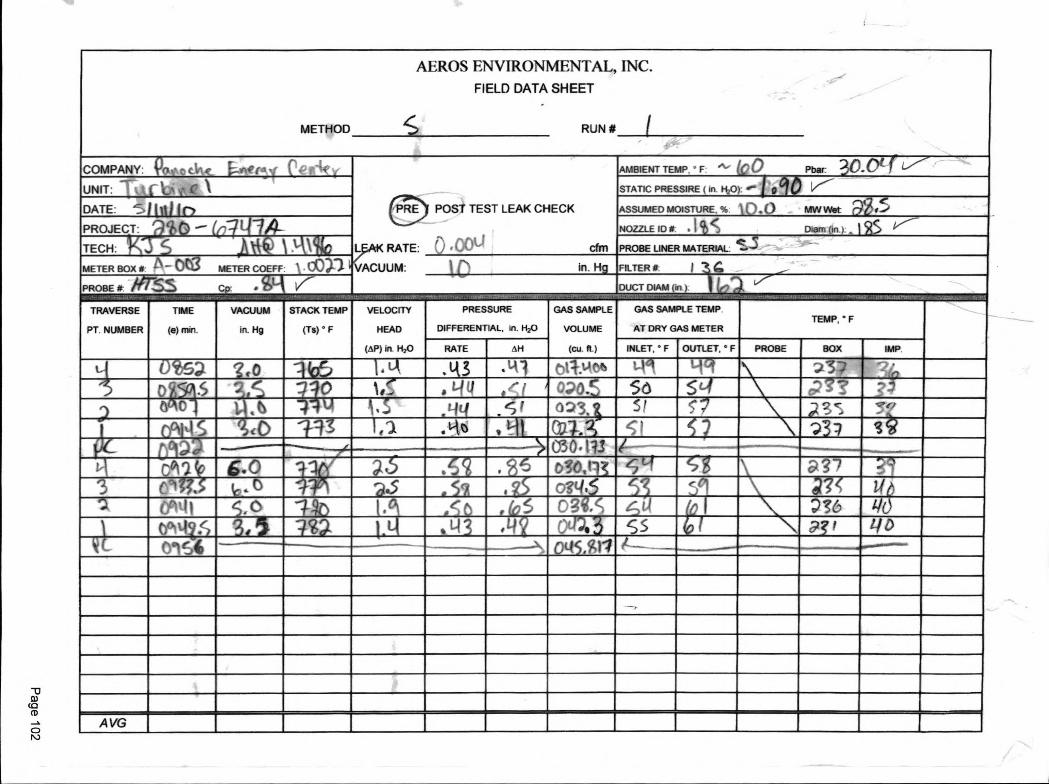
METHOD
AEROS ENVIRONMENTAL,FIELD DATA
<
SHEET
RUN #
INC.
I
COMPANY: Igo e di\ • vle(et t)r-4(
00L RATE:
VACUUM:
POST TEST LEAK CHECK
. 00U CfM
AMBIENT TEMP • F ".`" • 0 Pbar C.O.t _.
UNIT: t STATIC PRESSIRE ( in NO) -- 17----
DATE: 5 •em
ASSUMED MOISTURE. % . 0 MIN wet: p .. r .."
PROJECT: • 0 — • L 4 1 . <NOZZLE ID # , i • , Dorn (#1) . A S fr-------
TECH: liMMIIIIMMORM f•PROBE LINER MATERIAL. ..
METER BOX # A — M3 METER COEFF. OM- in. H FILTER # I C•
PROBE # SS Cp • d-. .-- _
DUCT DIAM on )..4-. -..... .,
TRAVERSE
PT NUMBER
TIME
(e) min.
VACUUM
in. Hg
STACK TEMP
(Ts) ° F
VELOCITY
HEAD
(AP) in. 1170
PRESSURE
DIFFERENTIAL. in. H20GAS SAMPLE
VOLUME
(Cu. ft.)
GAS SAMPLE TEMP
AT DRY GAS METERTEMP, ° F
RATE AH INLET, ° F OUTLET. ° F PROBE BOX IMP
L- EIM# 0 EMMEN= .43 .‘-41 ,'.um IIEMIKEIMM ') D -
0 i6 EtiMMEMEINIE • 1-1 0 -,,x).c. 56 IMMOIREMMIll .. -,MI= 6 C Mil . 15 lailliMIKIMMEN . I NM 5! MIZIM `'"
01 ,i tO RIM c a • EOM 03 . SI ISM E1111111Eill•FrAMIILVI nIIIM milmesa 030 , Ill
L, cov2 6.0 RETMINIPMMMIIIEW 030.11 frIMOMIll ?-'' MEI.-2_, EMI .0 IREMMESIIIMMINBIll o v4. 11111111 ILI=EMMIZIM
MN oclq ) =NW=Mira
rii o? . 4,0 mom= 3,/..1 40
oc+1 4 WWII g ME
,0111112E5 ss rIMII 9 ' li 0
C 01E4 0-1 Si,)1 "---- -
A VG
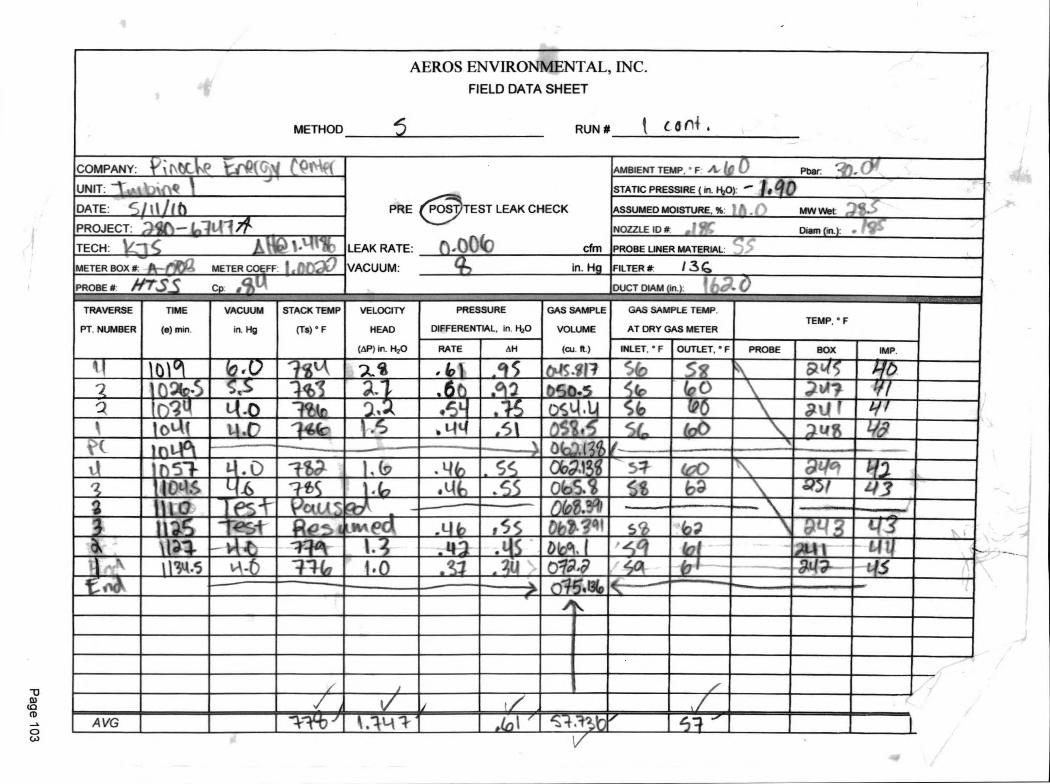
METHOD
AEROS ENVIRONMENTAL,FIELD DATA
.5
SHEET
RUN #
INC.
t ( 0 Of ,
COMPANY: / 1' t\ II_VP iii?(G4 tom4-1
PRE
LEAK RATE:
VACUUM:
-.,POST TEST LEAK CHECK
(-).0063 cfm
AMBIENT TEMP 'F A. (p 0 Pear:
UNIT: 1- 00,Ang 1 STATIC PRESSIRE ( in. H20) -- tooDATE: clill(t) ASSUMED MOISTURE, IC , MW Wet 7 4S
PROJECT: 91)-- 10/1-4/ 7 NOZZLE ID # Diam On.).
TECH: Voc AV OM c 4.PROBE LINER MATERIAL: •
METER BOX tt A-061:4 METER COEFF: 1 . nO. q", in. Hg FILTER e I 3 PROBE # #7.S.Cp ; DUCT DIAM On I
TRAVERSE
PT. NUMBER
TIME
(e) min
VACUUM
in. Hg
STACK TEMP VELOCITY
(Ts) ° F HEAD
(AP) in. 1.120
PRESSURE
DIFFERENTIAL, in. 1120
GAS SAMPLE
VOLUME
(cu. It.)
GAS SAMPLE TEMP
AT DRY GAS METERTEMP, ° F
RATE AN INLET. ° F OUTLET. • F PROBE BOX IMP
1 IIMMIIRLOSIMI 7,- % , b NM •IP EM181Mn111111ifilniallailErgel -01- MENRIUM1IME1111 (,9 0 II=1 .? IA/ EfIM
9 IMEMBIUMENEMINMEN MISIMILII S6 MM.= 'J' I/1 0 ( IMMEMiniirM 0-1 1( 5 MiriMiiirMIMMMEri g
t' ( - 1 0 Licl OkZln =NowNM M Mt= dti 11/11
MS alb t NM/ .11 NMI 065. i 0 MINIM= 432 I 0 irniKEBBMIEM OS. I .. ‘
€91 WZiir w e t NEUIRM o ?.?4INFAIIIEN/IMMUSEEM1111121MIN I cn IIISMINEFINEM 61 cl ‘=MIME FIMM
34 .5 ot MiiiiiiMMENENEM oV,9 ei -- gil?- MEMf 0 6 k----
/AVG :ILA -4. WaINEIMMIIIMMI

f,
, METHODAP4 %
AEROS ENVIRONMENTAL,FIELD DATA
r
SHEET
RUN #
INC.
---: ---
AMBIENT TEMP - F -"."-- .1::) Pbar yo-1-:-'1COMPANY: -41ak {\ Ot-V4 ..-T\ y (optc;
40 POST TEST LEAK CHECK
0 - OCC) CfM
UNIT: 1 -vulq bkf' p 1 STATIC PRESSIRE ( ;n NO --• 00DATE: c I I 1 11 p ASSUMED MOISTURE. % 10 MW VVet
PROJECT: alo- (0-4- 0 -2 71- NOZZLE ID # • ric Dam On )
LEAK RATE:
VACUUM:
TECH: )1--3-5' Ali& '••)* PROBE LINER MATERIAL. 5-
METER BOX* "k -10c3 METER COEFF t • K2 2 10 in. Hg FILTER # 1 3, IPROBE # .<, , r I ,f; .s- Op .' r- DUCT DIAM On j
TRAVERSE
PT. NUMBER
TIME
(e) min.
VACUUM
in. Hg
STACK TEMP
(Ts) ° F
VELOCITY
HEAD
(AP) in. 1-120
PRESSURE
DIFFERENTIAL, in. F120GAS SAMPLE
VOLUME
(Cu. ft.)
GAS SAMPLE TEMP.
AT DRY GAS METERTEMP, ° F
RATE AH INLET, ° F OUTLET, ° F PROBE BOX IMP.
1-1 igt-11 3.6 1 "3" . (-1) •A 07344 1:, " (K?3 Q1-1q•5 0 Thg.) 11 • 0 •i otn.c 031 37D Ob ;_ D 71)6 1 l' 4
Liu ,L i og ottot
is PS? 3 g13036 '5.0 -1.-,e{ _rib . q? 001 .2 6-,;(4 '''i t 3?
i f.-- 131 c ofo.a9 l—- ________
3.0 1, M) .(03, . 017-- Uto..ai3 (pq 407 ,;IR ),Ig13 di.5 '2 e) 19:2 . Q .613 loq to% .24i/
1-0 1-1) i till; .57 .$1ect-1
0". (0 U (47 °! P Li& ? i
A 131136 . c. -41,3 1.1- .1-1$ .5/ ID ._,. (OS (.-44 \ .Li 71.) 1;c1
I
AVG

METHOD
AEROS ENVIRONMENTAL,FIELD DATA SHEET
RUN #
INC.
COMPANY: v %4 4AciiVe trwtel tatkAvr
PRE
LEAK RATE:
VACUUM:
/ OST EST LEAK CHECK
0 . ° 0 0 CfM
AMBIENT TEMP. °F •Aw (20 Pba 3(D ' 6LW
UNIT: -1- Ls.tlIA:1,(2_ 1 STATIC PRESSIRE ( In KO): • n• I •ett
DATE: (7 1 am ASSUMED MOISTURE, %. ID MW Wet. S6
PROJECT: _ Icr )1 71- NOZZLE ID #I 1, <. -• Diam tin ) . 'Vro
TECH: ViZ jAtk ).1464(,,n. c
PROBE LINER MATERIAL: '•'..)METER BOX #: Pr-I)03 METER CO FF: 1.00?2 (40
,Q in. Hg FILTER /5k_PROBE Cp • DUCT DtAM in ) i2g,iii,‘
(p•MIIIRIMMS11
TRAVERSE
PT, NUMBER
TIME
(e) mb.
h..
_......GAS SAMPLE
'
ao‘ n . 1IPtaov s INffillIMPIPMITal 0
Q • ILMIE71111111=MS11111EMISINIMMINMn•1111EIIMMINILIMMEMENIIIIIMIIIPMEREMIIMISIMIIIIIMIIIMIIIMI‘ I 433
I( Li IM111....M1FZ PS.lo5 FAII"'"LI 3.4) WEINIFF WilliiiM ? 17 ' ORMI VI kallMLEMIEril
1-1 I-Ps - 0 1:111EINIMMISZIIRESWOMSMIIILIIIIMEIMMII LI • %,0 IIEBEIPLIMMENIMEIN EiriMNISZ MM ‘,7z NgI AC .. /ISIMIEPPMENINEEMIIIHNI ELOIDEMININ 36 WM/! () mow=
1)7,,
A V G =MEN= . ( 9 k INMEIMIltiV IIi I
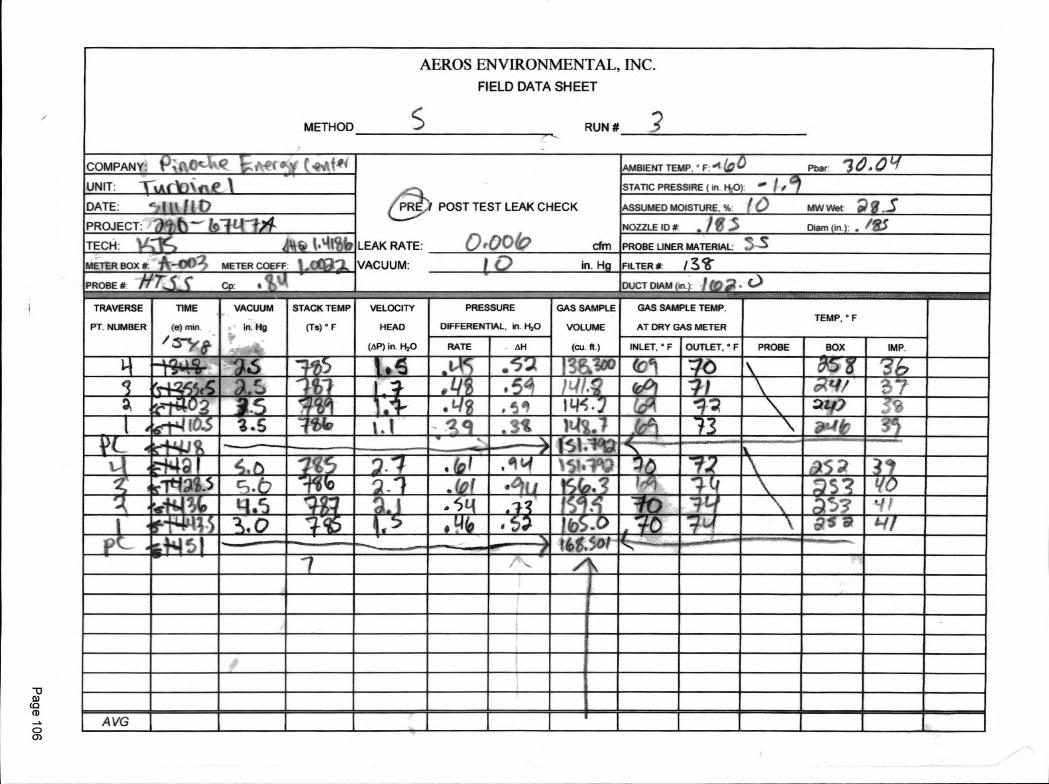
METHOD
AEROS ENVIRONMENTAL,FIELD DATA SHEET
S RUN #
INC.
?
COMPANY: P;4\0tAAR iPt44-001 (40''
LEAK RATE:
VACUUM:
POST TEST LEAK CHECK
0,0049 cfm
AMBIENT TEMP, ° F: 't 0 0 Pbar 3a.oi-fUNIT: Tukir)M. In e 1 STATIC PRESSIRE ( in 1-4-0) ". I,
DATE: 511‘ II D ASSUMED MOISTURE. % ( C) MW Wet
PROJECT: actb- (911-1-171- NOZZLE ID* . / fg .5 Dam(.):TECH: VOS z4i, oral PROBE LINER MATERIAL: 53METER BOX ft A-00 -2, METER COEFF: 1,0032, 1 0 in. Hg FILTER* / S q
'-2 ' 1PROBE ft 1-/7-ds Cp • - DUCT DIAM on ) I 1,f) fn • (Z)
TRAVERSE TIME
PT NUMBER (e) rnrn
VACUUM STACK TEMP VELOCITY
in. Hg (Ts) ° F HEAD
( p) in. H20
GAS SAMPLE
VOLUME
ft)
TEMP. ° F
(cu. ii.iL PROBE BOX IMP.
Ir'r ffitS11111k1MENCIN t. Mil o MNIIIIIMIIM:..?StiglIPM111 '0 111111EMINEMENNIEWHIMMEMILIIIIIMII 775.1*IlliCAIMEWIMEUR . 5 4 11121P1Mill '1* 1nn z/-2 ?=E1I 3.5 MN , 3 41 IBERMIR1111. 1111/111 a
11.41/..CMI 5118'0 WM.......................M--14 IMINIKIMMIMIIFI11 . '1 {4 \ 1 •161; EIMIWEMMIIIIISEI
rias-5 11121MigkillIMIEFINNEIIIMMIIIIIIIIMIWWIPM1 •PLMIIIMMINFOIRMINIMINEL91111111116LIIKMIlligaINEMEM '4'71:211 IMMIIMIL11111VIIIIREM 149 lir
9 "...%7E1 =Cr: LIMMI NIFZMIAMOIMIMI/91
I\
AVG
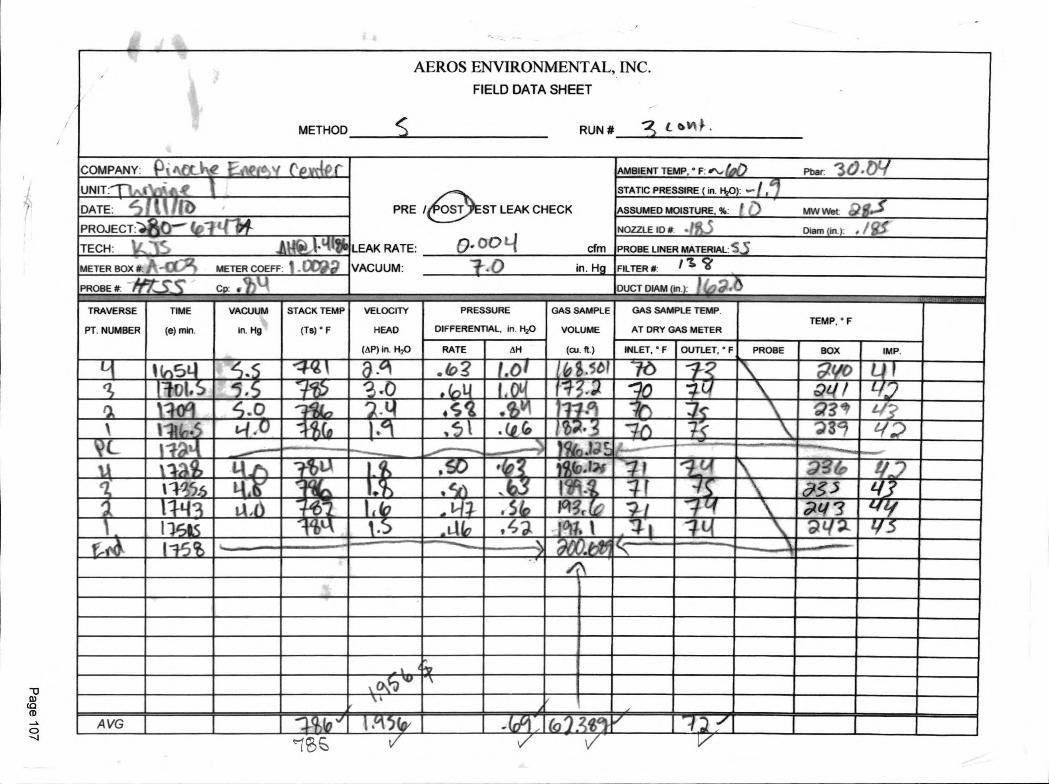
METHOD
AEROS ENVIRONMENTAL,FIELD DATA
<
SHEET
RUN #
INC.
-. t 6/1 •
COMPANY. p,Aot he EL,lefe, ' t (pvd( (
PRE
LEAK RATE:
VACUUM:
/ OST ST LEAK CHECK
0. 00 1-1 Cfrn
AMBIENT TEMP, F. ••\• 620 Pbar- 3 a tY1uNIT:-Tlikf 1 STATIC PRESS1RE ( in. H20): •-• /
DATE: 6 fib ASSUMED MOISTURE, %: 1 -. MW Wet. co)i.i.PROJECT: vitns NOZZLE 1D# Dam (in.) • / V
TECH: v., -If,. IA, I. ti ltig PROBE LINER MATERIAL: 's,5METER BOX #. ,A -4I A METER COEFF. 1 .0Dri -4: 3 • 0 in. Hg FILTER #. I 1 S.
PROBE # 'piss- Cp • iI
DUCT DIAM (in )
TRAVERSE
PT. NUMBER
TIME
(e) nun.
VACUUM
in. Hg
STACK TEMP
(Ts) ° F
VELOCITY
HEAD
(AP) in. H 70
PRESSURE
DIFFERENTIAL, in. H20
GAS SAMPLE
VOLUME
(Cu. ft.)
GAS SAMPLE TEMP
AT DRY GAS METERTEMP. ° F
RATE PH INLET, ° F OUTLET, ° F PROBE BOX IMP
1 5 1431 Jo? f.OI 76 2 h. 9y0 0 I101 . Icsmatimi .0 mumermantammierma.n ga / IV
041 .0 ENNINEMIIIENIMII EZEWZ=IMM g3 4' Li;)I I M9DZIETHEMIFIIIIIIIMINUEN • ETM*1==115 9 /-/
% . 111 ,...1nM11.111 RIFER,-=--- 11 j
. • . wramani:mwtzszalu 67."111111111BWIMIEZZIE1196 IIMMEDIMINIMMIKIMIUM I5h- EIMIELI•111W93 5 111/
ii =MINN _. 1111MMONIMINII Inc 411MMEINIMMIlaq? e11 MAIIMIMIWHI °II. 1 EBEIM • .
ffrAvArgil. wwwin......—;
1111Blill•Illn
A V G litrallaWS MGM NIMIIIIMItIss
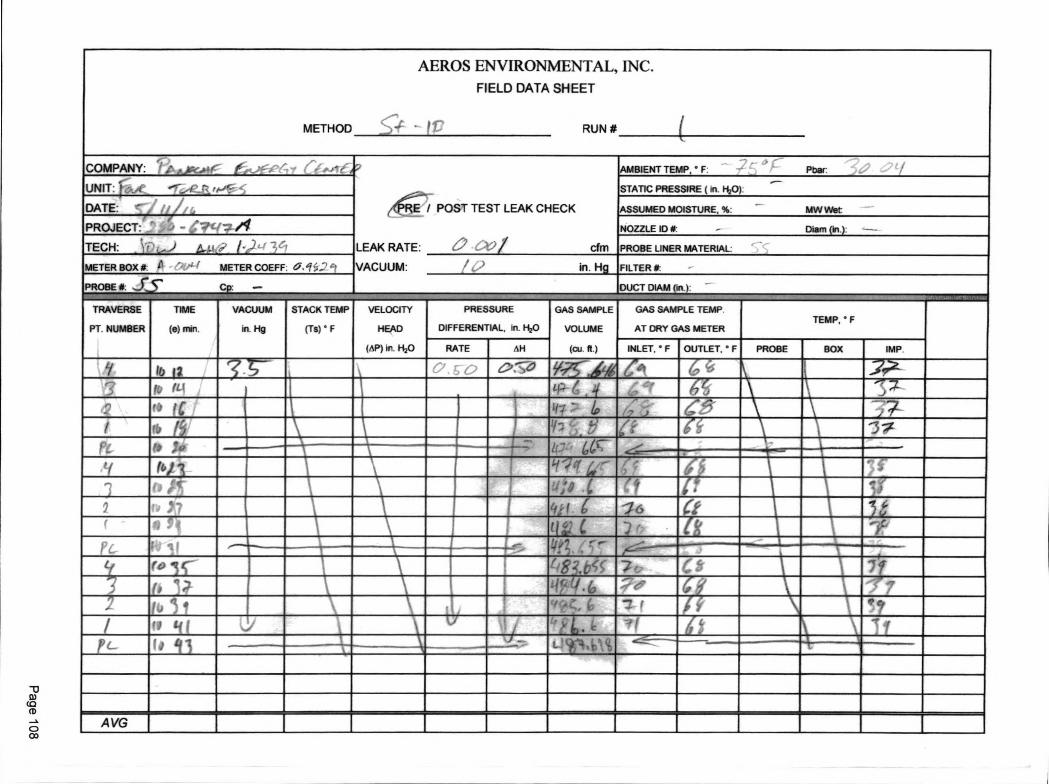
METHOD
AEROS ENVIRONMENTAL, INC.
FIELD DATA SHEET
cit: - if RUN #(
COMPANY: "i- i „pc...fr 6......-4, i'd ...,- .
A i; POST TEST LEAK CHECK
0 .(X)/ cfm
'AMBIENT TEMP, • F •Ir "' r_ Pbar /
UNIT: ioiX . -7-....e_p_ rok4 45 STATIC PRESSIRE ( tn. H20)--
DATE: ' . 41, ASSUMED MOISTURE, %: MW Wet
PROJECT: r-, - "7747:4
LEAK RATE:
VACUUM:
NOZZLE ID # Diam (in.)
TECH: \i'L......i C,..krP 1- 3 ' 114 PROBE LINER MATERIAL
METER BOX A 4- - 004 i METER COEFF. a./..::.:.-- /(;) in. Hg FILTER*
PROBE # _ST Cd". Cp. —nin,,
DUCT DIAM (in))it,
TRAVERSE
PT. NUMBER
TIME
(e) min
VACUUM
in. Hg
STACK TEMP
(Ts) ° F
VELOCITY
HEAD
(AP) in. H2O
PRESSURE
DIFFERENTIAL, tn. H20GAS SAMPLE
VOLUME
(Cu. ft.)
GAS SAMPLE TEMP
AT DRY GAS METERTEMP, ° F
RATE AH INLET, • F OUTLET ° F PROBE BOX IMP
dr/ lb 12 , •:7, ; 0 C'rC-0 7 c - At* .4i 6 (; _7.,,
I
Lp- 4 .4 4'S \
') f C !ii-1 .:7- & : 7 ,I ‘(•
\
I /5\
ill S. / (5• , 1,0 ,To --4=c 11-7.-"' La:
ft' i 1 \11'7 tr
1 (id ,• ,
) ' ,' )7 to t 1 o a4 9
1 1 1 112 4 --)4 ,, aPC
\
—f -
r a IC , 4;87..&ti5- cc( • '7
,,,,,,,,(2 e5
, 1411 •Irfo, F: 7' f 1
I if I ‘../ 744 :.+ ,
P e— 2 `fl \/ . .,.._r_—
A VG
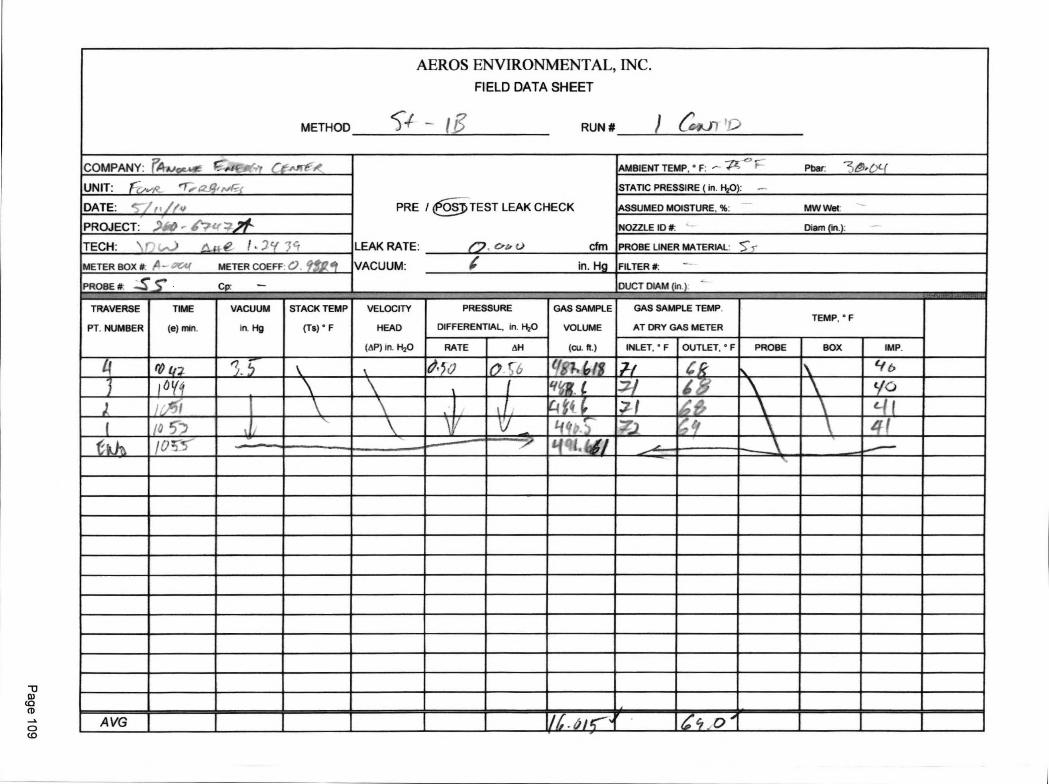
METHOD
AEROS ENVIRONMENTAL,
FIELD DATA
9 - IE
SHEET
RUN #
INC.
) rc-xii 1
COMPANY. F7,4 ,,,,c,, ,,e F..7.0. , rt ,
PRE
LEAK RATE:
VACUUM:
/ TEST LEAK CHECK
(7 c.,. .,, ...) CfM
AMBIENT TEMP, ° F r --- le." Pbar 7e).6:44
UNIT: rc,,,,,,,e_ "F. alf mg./ STATIC PRESSIRE (in. I-120):
DATE: c711/4, ASSUMED MOISTURE, %: MW Wet
PROJECT: NV - e7if :7- .ME" NOZZLE ID # Dram (in.)
TECH: N r ......) 4..0 le f • 2d1 "3r PROBE LINER MATERIAL 77,METER BOX # A- OW METER COEFE a fjp ,-. I in. Hg FILTER #.
PROBE # —TS" Cpr — DUCT DIAM On 1
1•010.-
TRAVERSE
PT. NUMBER
TIME
(e) min
VACUUM
In Hg
STACK TEMP
(Ts) ° F
VELOCITY
HEAD
(AP) in. H .20
PRESSURE
DIFFERENTIAL, in. 1120
GAS SAMPLE
VOLUME
(Cu. ft.)
GAS SAMPLE TEMP
AT DRY GAS METERTEMP. ° F
RATE dig INLET, ° F OUTLET, ° F PROBE BOX IMP
if ra ti; ..,_;,. e•,(2 0 6 (IP-.61 71 I i b
3 o vii ge;gz. ...1 5/c)
; .51
\I
(-4 P .7 f\
c i I
( ia 5---),
1-140 ) .7) III
t 0,.., I A-5- q til• 407 -,...
AVG ilif-i45--- 4/ ‘ . 0 1
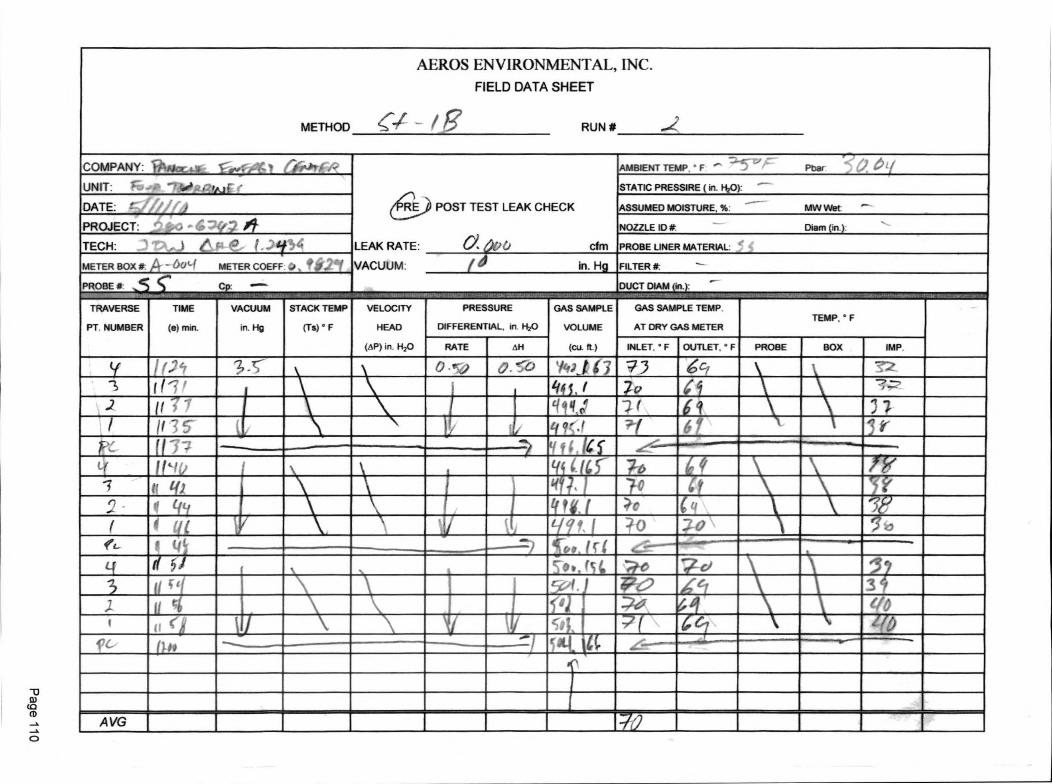
METHOD
AEROS ENVIRONMENTAL,FIELD DATA
_ / FSHEET
RUN #
INC.
...i
COMPANY: Thoce,s4 Ve..fACV ri.-...- .
LEAK RATE:
VACUUM:
POST TEST LEAK CHECK
O. 000 CfM
- -, ,. AAMBIENT TEMP ° F °— --;-5 Ploat v 1":1
UNIT: C;, ..., iimaiRIAJ E c STATIC PRESSIRE ( in 1i20):
DATE: VI/ d ASSUMED MOISTURE, %---
MW Wet -
PROJECT' 6 We :2 Al NOZZLE ID # Diam (in)
TECH: .1 •*),,,,) 6 P - 1...)114 PROBE LINER MATERIAL.
METER BOX #. A - OCP-f METER COEFF 0 , ft: f d in. Hg FILTER #:
PROBE # Co DUCT DIAM on.).
TRAVERSE
PT NUMBER
TIME
(e) min
VACUUM
in. Hg
STACK TEMP
(Ts) ° F
VELOCITY
HEAD
(AP) in. H 20
PRESSURE
DIFFERENTIAL. in 1-120GAS SAMPLE
VOLUME
(cu. ft.)
GAS SAMPLE TEMP
AT DRY GAS METERTEMP • F
RATE n1-I INLET, ° F OUTLET, ° F PROBE BOX IMP
cf 1 t . 2 ,7 ; - ) O-) 0.770 1 ',),, t 17 -q 3 7:2'1, f ( .--:, f 116 5. I ; 1 7 4:7
.2 if 7 1 q cl ii; -.3 ( 6. I '; 7I il ls-
! tifi,l4i. .,---—1' ( ff'fil
\tqlv 76
I it 1(1 ill ''? 1 76`74
el . If (piIf tfi. 1 ?c. ( (1
I 4 iii \,, 1/9tI (',1 3' 0
(41...._
or. i C. I l
14 t( 5_
. (44 ;ô- 70--...,
2 ii ..t I • PO e,t 3 .'41r
ll .2 4 4 41 li^
V Ii
11 IV ri X-I la--- ,—.
1
AVG 172 I
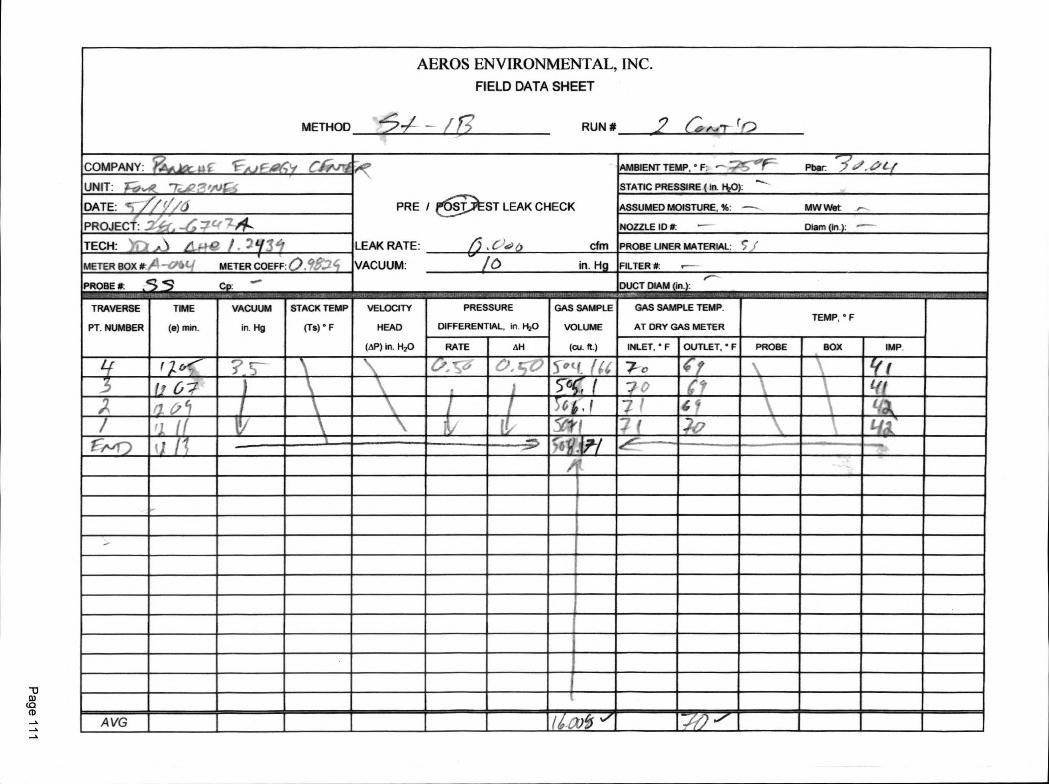
METHOD
AEROS ENVIRONMENTAL,FIELD DATA
.5-1 / FSHEET
RUN #
INC.
li;e4er r0...2
COMPANY; tn v u x wi VAJFAKY Cf"rfev '
PRE
LEAK RATE:
VACUUM:
I ST LEAK CHECK
, C).0 6) CfM
—IAMBIENT TEMP, ° F: *--- c Pbar: 7:' .j.,% t /
UNIT: .i-ros.4Z_ 7422',VrIU-S--.
STATIC PRESSIRE ( in. RIO):
DATE: "cljr/e) ASSUMED MOISTURE, %: -- MW Wat: .-•
PROJECT: :2-A'", —6 .:-7fr 7 19- NOZZLE ID #: Dam (in ): —
TECH:.'7), .J3 L. • :' 7 `'.. PROBE LINER MATERIAL:
METER BOX #: A —0104 METER COEFF:0.98:2 4 /6 in. Hg FILTER #: .--
PROBE #: 5 Cp...-
DUCT DIAM (in.).
TRAVERSE
PT. NUMBER
TIME
(e) min.
VACUUM
in. Hg
STACK TEMP
(Ts) ° F
VELOCITY
HEAD
(dP) in. H20
PRESSURE
DIFFERENTIAL, in. H)0
GAS SAMPLE
VOLUME
(Cu. ft.)
GAS SAMPLE TEMP
AT DRY GAS METERTEMP, ° F
RATE All INLET, ° F OUTLET, • F PROBE BOX IMP. .....
7o 0W 5 ° ( 1. f‘a 7 ,- 6, f(111 6 :.71 • 5-6‘7 / 7/ ) ( t ta
Ar ;r: 6 k , 7 1 6 4
\\
(.1-k
/ 1 li I,/ 91'? 7 ( )30 L it'4,
r---",f-,- , I I' ."--
AVG
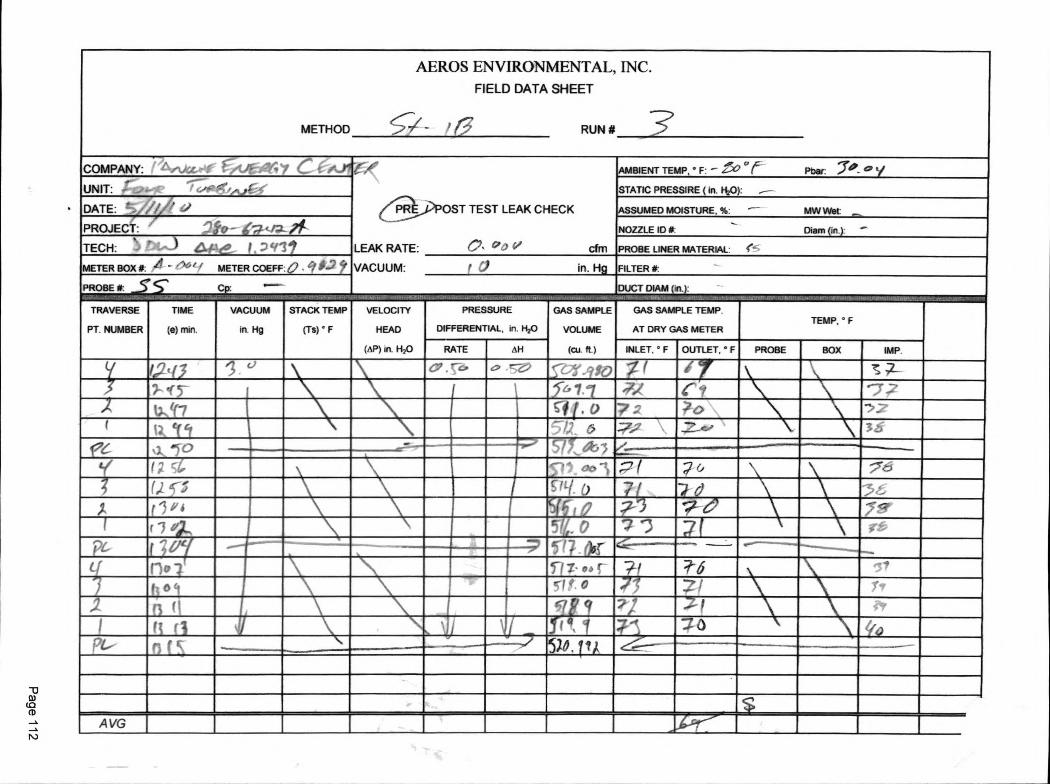
METHOD
AEROS ENVIRONMENTAL, INC.FIELD DATA SHEET
c7/. - 't RUN # 3
COMPANY: ' nNet1z-o4f Gt/rp416/ c e e rA9(.„POST
LEAK RATE:
VACUUM:
TEST LEAK CHECK
0 - 0 ' V cfnn
AMBIENT TEMP ° F7 --- 1-." " ( Pbar- t0*---
UNIT: . e t641,,,,,,C2( STATIC PRESSIRE ( in. RA:
DATE: - ,/1,0 =I ASSUMED MOISTURE, 96: --- MW Wet: ..._
PROJECT: / .f?,fer,- dw--,-/-4- X NOZZLE ID-
Diam (in ) -
TECH: ' ) 466re I. , etil PROBE LINER MATERIAL:
METER BOX #: METER COEFF: 0 . 4/ P..2 ,' .9 in. Hg F ILTER
PROBE it . _S C Cp DUCT DIAM ( n.).—
TRAVERSE
PT. NUMBER
TIME
(e) mm.
VACUUM
in. Hg
VELOCITY
HEAD
(AP) in. 11,0
PRESSURE GAS SAMPLE GAS SAMPLE TEMP.
DIFFERENTIAL, in. H2O VOLUME AT DRY GAS METERTEMP, ° F
RATE All (Cu. ft) INLET. ° F OUTLET, ° F PROBE BOX IMP
./1 ' - c., C, 7. ai Z ( /
BUM &MUM= C '7`7Min IIIEIIIMAM CE , 0 7 2
NIIMM->7tMEM 111.11111. 3
1111
..... 577
Let \MI
NENE _.
t '3 P4 MMI VI MAMMA. 7 e% MI11n11111 - 7 9EMI MIIINIMIIII 5 . 0 '7 "3 M Mil rfPL
moo 7 0,cf
111111111. ii mi.
ISMINIE ENIIIMMIE 7 ' 1 2 . e) Li= IIMINaMil itIIIMINEI INLIMMIIMIll 11M111129=12=11111.1111MM, 111111•11111 11=1111111111MEIMIMIMMEM -.....? 0 IMUM11 •
Pt- 9 ( % IMO _ 90 rti
AVG _

METHOD
AEROS ENVIRONMENTAL,FIELD DATA SHEET
571- - / 75 RUN #
INC.
--$' (.;,,_,7 ',..,...--•
_
COMPANY: / /1„,k,e.c. f 4 r,S. fAloaticy C‘ootivoi‘ .
PRE
LEAK RATE:
VACUUM:
SLjST LEAK CHECK
CfMoe"ti
AMBIENT TEMP, ' F — OC . '----- Pbar 70. Off /
UNIT: Aele- 73-ie A PoJr5 STATIC PRESSIRE ( in H20)-
DATE: 7/ //la ASSUMED MOISTURE. 9,01 MW Wet.
PROJECT: 1 g'a - 6. -7 ' fD lit NOZZLE ID It Darn( )
TECH: pi,...) 4 (i I, -2(13'47 PROBE LINER MATERIAL 5 47-
METER BOX /4 0.4r1 METER COEFF-6), f,;.,-...,,, 1,1 in. Hq FILTER*
PROBE # 5 C Cp — DUCT DIAM (in.)
TRAVERSE
PT. NUMBER
TIME
(e) min.
VACUUM
in. Hg
STACK TEMP
(Ts) ° F
VELOCITY
HEAD
(AP) in. H20
PRESSURE
DIFFERENTIAL, in. 1420GAS SAMPLE
VOLUME
(cu. ft )
GAS SAMPLE TEMP
AT DRY GAS METERTEMP ° F
RATE AH INLET, ° F OUTLET, ° F PROBE BOX IMP
1—(f 3 0 so cy • if.gii 72 3-711
3 i 1)1 7; 1.1 - -Li2 13;7 T.11, 1 7 -.2
I , i; f g23., - -4-/!
if019 f1 .1 .7.- - 5.,N VI( ...z_
T
i 1l
id I '/
11,AVG
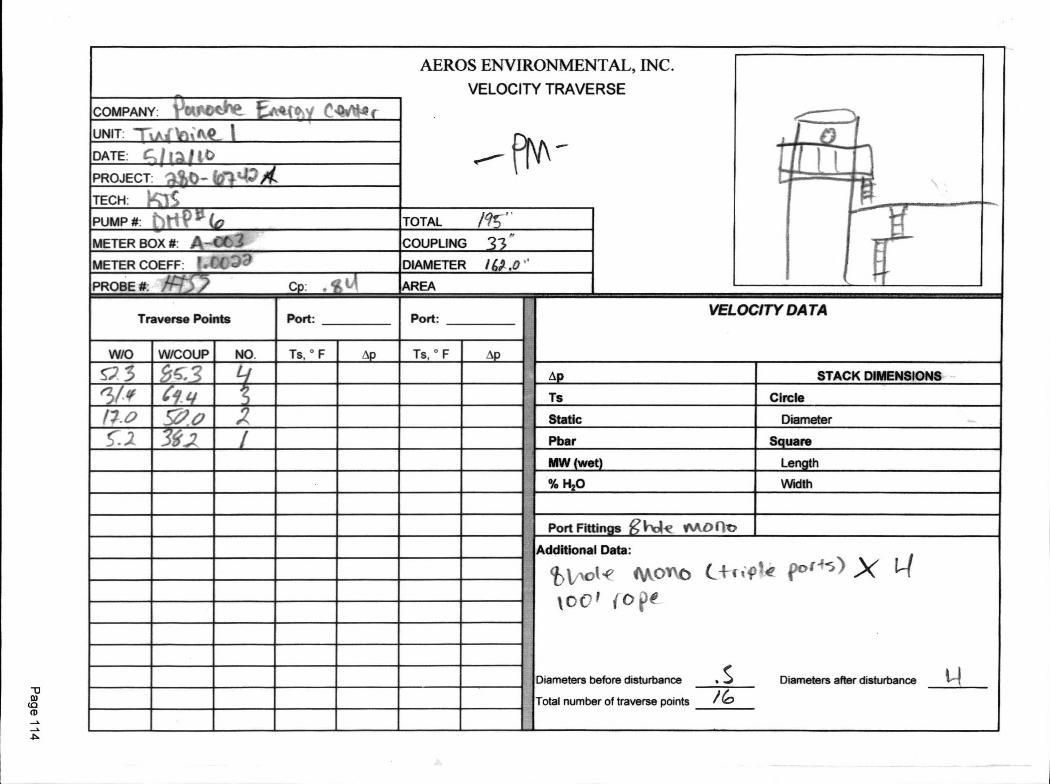
_
AEROS ENVIRONMENTAL,
VELOCITY TRAVERSE
.----"" 9\1\ —
INC.
COMPANY: yotobefrt- tik44 (ply C4A4(UNIT: T,Atini Af 1
111 1DATE: C- pi it)
PROJECT: ao-...
TECH: 1-^k1S
PUMP #: 1:..)ttl" (6 TOTAL /9S . •
iiIIi
METER BOX #: A-063 COUPLING 33 -METER COEFF: f.etDR DIAMETER /0.0 '
PROBE #: AL--:' '-2 Cp. AREA
Traverse Points Port: Port:VELOCITY DATA
W/O W/COUP NO. Ts, ° F Ap Ts. ° F .Ap
V3 55,3 i. Ap STACK DIMENSIONS
'3/' ef 4. Ts Circle
/70 _ a.0 .2 Static Diameter
.2 3.,2 i Pbar Square
MW (wet) Length
% H20 Width
Port Fittings gholv moor,Additional
if VAO( *e
k oo t
Diameters before
Total number
Data:
(MYAC) C-Ff if 1 4)0 [45) X 14
(ope-
disturbance . S Diameters after disturbance I-Iof traverse points /G
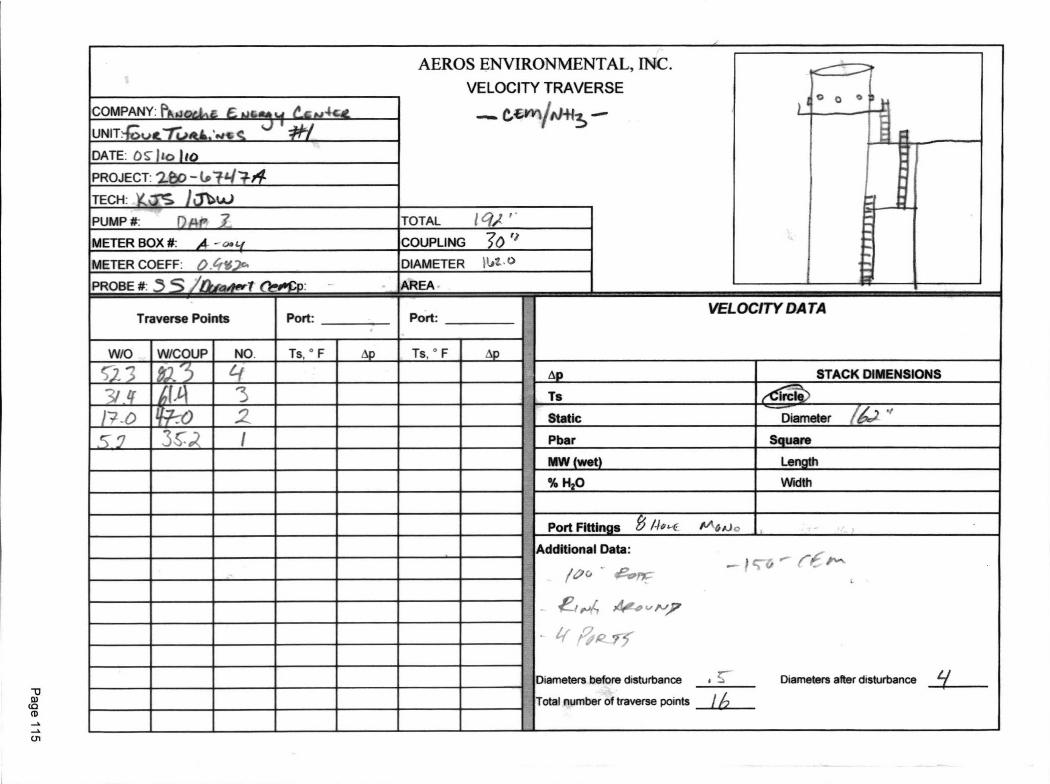
AEROS ENVIRONMENTAL,
VELOCITY TRAVERSE
_.. C,{"ini-H .s
INC.
--toO
COMPANY: Pp„J oti,,z, E, ,,, i,,,,i1 LEN4ctUNIT,-1c -,) L., tit+ alb:* t s c #1
DATE: OS- ilo 110
PROJECT- 260 - ic714.7-711
TECH: Ko-c I tytm.a.)
PUMP #- ?At, 3 TOTAL 1 qi
METER BOX #: A - oe 1 COUPLING 7o '1METER COEFF: 0.4V..7c. DIAMETER 1,J2.0
PROBE # 5 5 ova4pri ei-ecp AREA
Traverse Points Port: Port:VELOCITY DATA
W/0 W/COUP NO. Ts, ° F Ap Ts. ' F .1p
eT2 3 V.'3 (4 Ap STACK DIMENSIONS
61A,.-..... Ts EdirTh.59,
/ 7 -0 .7. •() .2 Static Diameter
e; 5 3S.02 I Pbar Square
MW (wet) Length
% H 20 Width
Port Fittings /40,--e it'IG,J.,
Additional
/ac.
et,44
11 ( "
Diameters
Total number
Data:— /
' e--orE
40,k,7
1 i 2_ _rc
before disturbance a S.--
cO "" re "••,.
Diameters after disturbance 1-/
of traverse points / k
Lab Data
Page 116

Marriott-Smith, Labor anager
AEROS ENVIRONMENTAL, INC.LABORATORY ANALYSIS
METHOD 5- GRAVIMETRIC ANALYSIS
COMPANY: Panoche Energy Center PROJECT: 280-6747
UNIT: Turbine 1 ANALYSIS DATE: 05/14/2010TEST DATE: 05/11/2010 RUN #: 1
PROBE AND NOZZLE WASHDISH #: 22 ALIQUOT: 1571157m1
WEIGHT: #1 #2 AVERAGEFINAL WEIGHT (q) 66.0440 66.0442 66.0441
INITIAL WEIGHT (g) 66.0429 66.0429
NET WEIGHT (g) 0.0012
FILTERFILTER #: 0136
WEIGHT: #1 #2 AVERAGEFINAL WEIGHT (q) 0.6254 0.6252 0.6253
INITIAL WEIGHT (g) 0.6247 0.6247
NET WEIGHT (g) 0.0006
CON DENSABLES - AQUEOUSDISH #: 178 ALIQUOT: 522/522mI
WEIGHT: #1 #2 AVERAGEFINAL WEIGHT (g) 66.6539 66.6542 66.6541
INITIAL WEIGHT (g) 66.6526 66.6526
NET WEIGHT (g) 0.0015
Page 117
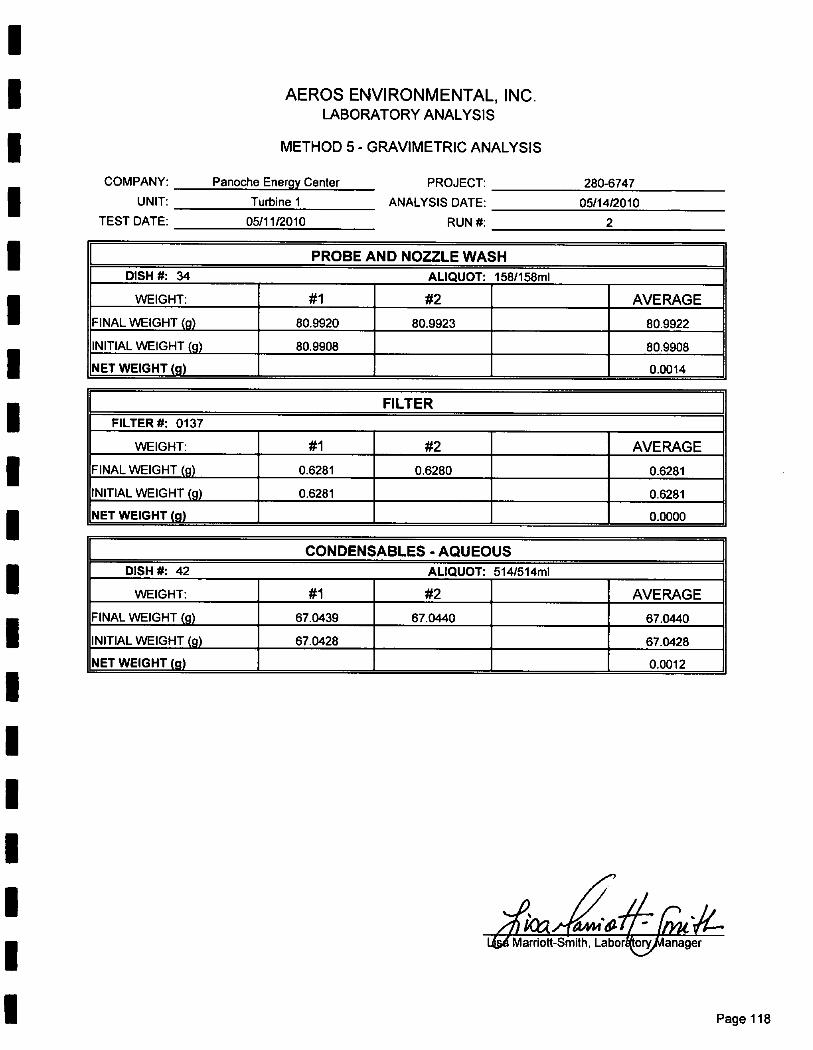
Marriott-Smith, Labo anager
AEROS ENVIRONMENTAL, INC.LABORATORY ANALYSIS
METHOD 5- GRAVIMETRIC ANALYSIS
COMPANY: Panoche Energy Center PROJECT: 280-6747
UNIT: Turbine 1 ANALYSIS DATE: 05/14/2010
TEST DATE: 05/11/2010 RUN #: 2
PROBE AND NOZZLE WASHDISH #: 34 ALIQUOT: 158/158m1
WEIGHT: #1 #2 AVERAGE
FINAL WEIGHT (g) 80.9920 80.9923 80.9922
INITIAL WEIGHT (g) 80.9908 80.9908
NET WEIGHT (g) 0.0014
FILTERFILTER #: 0137
WEIGHT: #1 #2 AVERAGE
FINAL WEIGHT (g) 0.6281 0.6280 0.6281
INITIAL WEIGHT (g) 0.6281 0.6281
NET WEIGHT (g) 0.0000
CONDENSABLES - AQUEOUSDISH #: 42 ALIQUOT: 5141514mI
WEIGHT: #1 #2 AVERAGEFINAL WEIGHT (g) 67.0439 67.0440 67.0440
INITIAL WEIGHT (g) 67.0428 67.0428
NET WEIGHT (g) 0.0012
Page 118
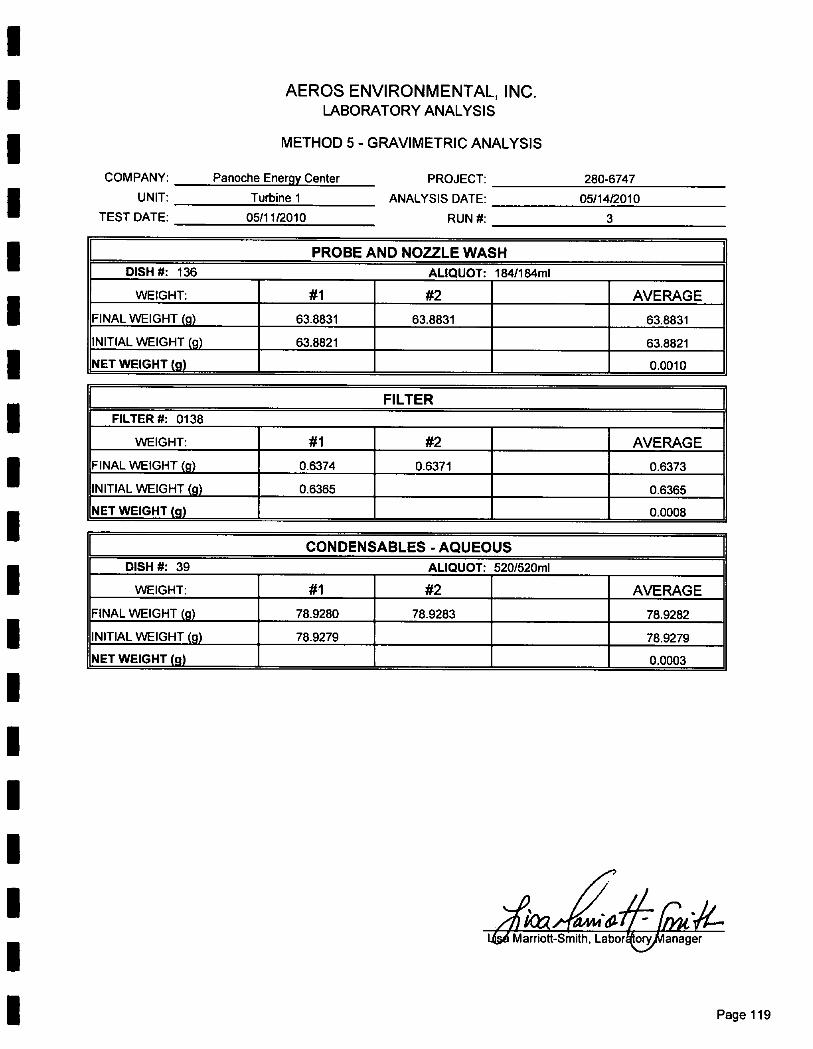
Marriott-Smith, Labor .VII anager
1
AEROS ENVIRONMENTAL, INC.LABORATORY ANALYSIS
METHOD 5- GRAVIMETRIC ANALYSIS
COMPANY: Panoche Energy Center PROJECT: 280-6747
UNIT: Turbine 1 ANALYSIS DATE: 05/14/2010
TEST DATE: 05/11/2010 RUN #: 3
PROBE AND NOZZLE WASHDISH #: 136 ALIQUOT: 1841184m1
WEIGHT: #1 #2 AVERAGEFINAL WEIGHT (g) 63.8831 63.8831 63.8831
INITIAL WEIGHT (g) 63.8821 63.8821
NET WEIGHT (g) 0.0010
FILTERFILTER #: 0138
WEIGHT: #1 #2 AVERAGEFINAL WEIGHT (g) 0.6374 0.6371 0.6373
INITIAL WEIGHT (g) 0.6365 0.6365
NET WEIGHT (g) 0.0008
CON DENSABLES - AQUEOUSDISH #: 39 ALIQUOT: 520/520m1
WEIGHT: #1 #2 AVERAGEFINAL WEIGHT (g) 78.9280 78.9283 78.9282
INITIAL WEIGHT (q) 78.9279 78.9279
NET WEIGHT (g) 0.0003
Page 119

Historical Process Data(Supplied by Panoche Energy Center)
Page 120
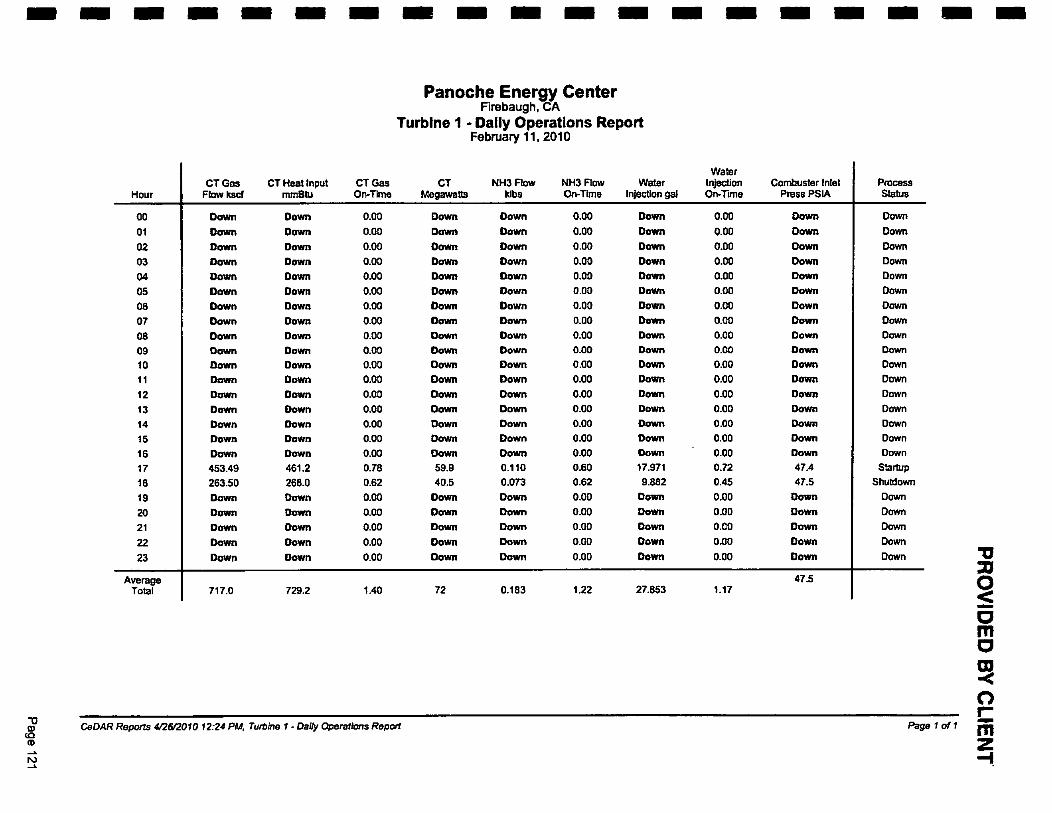
I= MI MN MN MI MN MI •III • MI MI MN MN I= I= MI OM NM
HourCT Gas
Flow ItscfCT Heat Input
mmlitu
Panoche Energy CenterFirebaugh, CA
Turbine 1 - Daily Operations ReportFebruary 11, 2010
CT Gas CT NH3 Flow NH3 Flow WaterOn-lime Megawatts klbs On-Time Injection gal
WaterInjectionOn-Time
Combustor InletPress PSIA
PrOCEMS
Status
0
00010203
0508070809101112131415161718192021
2223
Down
DownDownDown
DownDownDown
DownDownDownDownDownDown
DownDownDownDown453.49263.50DownDown
DownDown
Down
Down
DownDownDownDown
DownDownDownDownDownDownDownDownDownDownDownDown461.2268.0Down
DownDown
Down
Down
0.00
0.00
0.000.000.000.000.00
0.000.000.000.000.000.000.000.000.000.000.780.620.00
0.000.000.00
0.00
Down
Dawn
DownDown
DownDownDownDownDownDownDownDownDown
DownDownDownDown59.940.5
DownDownDown
DownDown
Down
DownDownDownDown
DownDownDownDownDownDownDownDownDownDownDownDown0.1100.073DownDownDown
Down
Down
0.00
0.000.000.000.000.00
0.000.000.000.000.000.000.000.000.000.000.000.600.620.000.000.000.00
0.00
Down
DownDownDownDownDownDownDownDownDownDownDownDownDown
DownDownDown17.9719.882
Down
DownDown
Down
Down
0.00
0.000.000.000.000.00
0.000.00
0.000.000.000.000.000.000.000.000.000.720.450.000.000.00
0.00
0.00
Down
DownDownDownDown
DownDownDownDownDownDownDown
DownDownDownDownDown47.447.5
DownDownDownDown
Down
DownDownDownDownDownDownDownDownDownDown
DownDownDownDownDownDownDown
StartupShutdown
DownDownDownDownDown
AverageTotal 717.0 729.2 1.40 72 0.183 1.22 27.853 1.17
47.5
a
0
0
Page 1 of 1CeDAR Reports 4t2612010 12:24 PM, Turbine 1 - Daily Operations Report
IIIIIII Section II: PG & E Fuel Sulfur ReportIIIIIIIIIIII Page 122
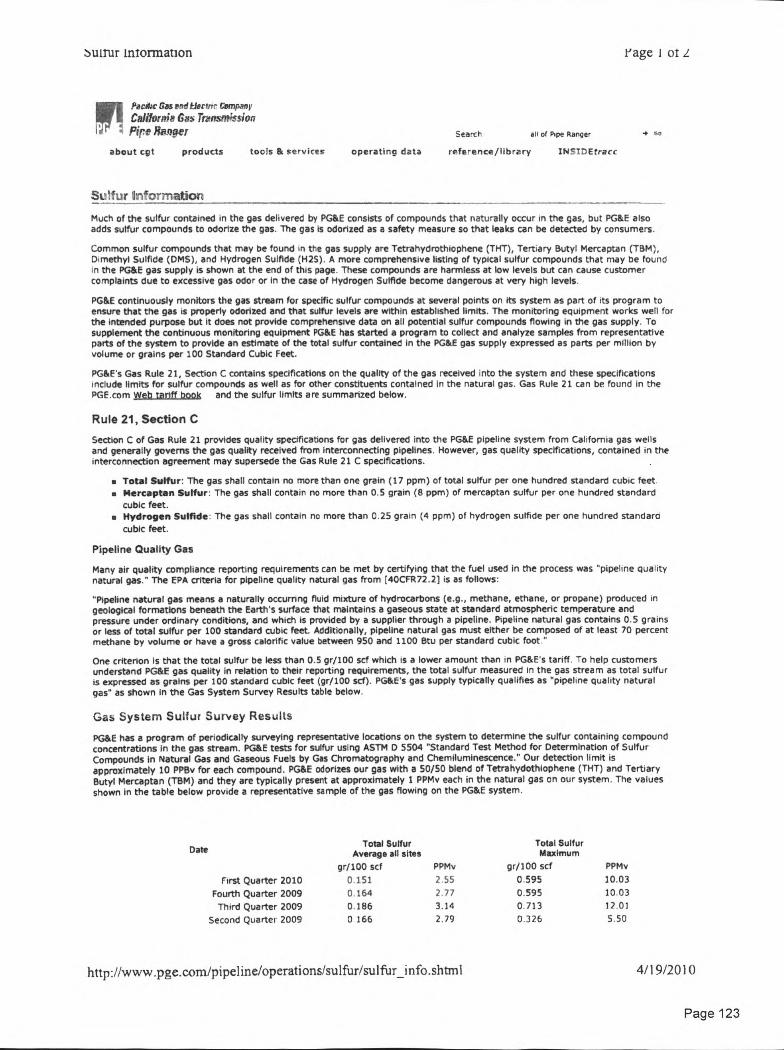
suitur information rage I ot 2
ri Paurkr gas rfl tlerfrrr CompanyCalifornim Gas Transmission
' Z Pie Hanger Search all of Pipe Ranger •about cgt products toots & services operating data reference/library INSIDEtrarc
Selfur information
Much of the sulfur contained in the gas delivered by PG&E consists of compounds that naturally occur in the gas, but PG&E alsoadds sulfur compounds to odorize the gas. The gas is odorized as a safety measure so that leaks can be detected by consumers.
Common sulfur compounds that may be found in the gas supply are Tetrahydrothiophene (THT), Tertiary Butyl Mercaptan (TBM),Dimethyl Sulfide (DMS), and Hydrogen Sulfide (H25). A more comprehensive listing of typical sulfur compounds that may be foundin the PG&E gas supply is shown at the end of this page. These compounds are harmless at low levels but can cause customercomplaints due to excessive gas odor or in the case of Hydrogen Sulfide become dangerous at very high levels.
PG&E continuously monitors the gas stream for specific sulfur compounds at several points on its system as part of its program toensure that the gas is properly odorized and that sulfur levels are within established limits. The monitoring equipment works well forthe intended purpose but it does not provide comprehensive data on all potential sulfur compounds flowing in the gas supply. Tosupplement the continuous monitoring equipment PG&E has started a program to collect and analyze samples from representativeparts of the system to provide an estimate of the total sulfur contained in the PG&E gas supply expressed as parts per million byvolume or grains per 100 Standard Cubic Feet.
PG&E's Gas Rule 21, Section C contains specifications on the quality of the gas received into the system and these specificationsinclude limits for sulfur compounds as well as for other constituents contained in the natural gas. Gas Rule 21 can be found in thePGE.com Web tariff book and the sulfur limits are summarized below.
Rule 21, Section C
Section C of Gas Rule 21 provides quality specifications for gas delivered into the PG&E pipeline system from California gas wellsand generally governs the gas quality received from interconnecting pipelines. However, gas quality specifications, contained in theinterconnection agreement may supersede the Gas Rule 21 C specifications.
• Total Sulfur: The gas shall contain no more than one grain (17 ppm) of total sulfur per one hundred standard cubic feet.• Mercaptan Sulfur: The gas shall contain no more than 0.5 grain (8 ppm) of mercaptan sulfur per one hundred standard
cubic feet.• Hydrogen Sulfide: The gas shall contain no more than 0.25 grain (4 ppm) of hydrogen sulfide per one hundred standard
cubic feet.
Pipeline Quality Gas
Many air quality compliance reporting requirements can be met by certifying that the fuel used in the process was "pipeline qualitynatural gas." The EPA criteria for pipeline quality natural gas from (40CFR72.2] is as follows:
"Pipeline natural gas means a naturally occurring fluid mixture of hydrocarbons (e.g., methane, ethane, or propane) produced ingeological formations beneath the Earth's surface that maintains a gaseous state at standard atmospheric temperature andpressure under ordinary conditions, and which is provided by a supplier through a pipeline. Pipeline natural gas contains 0.5 grainsor less of total sulfur per 100 standard cubic feet. Additionally, pipeline natural gas must either be composed of at least 70 percentmethane by volume or have a gross calorific value between 950 and 1100 Btu per standard cubic foot."
One criterion is that the total sulfur be less than 0.5 gr/100 scf which is a lower amount than in PG&E's tariff. To help customersunderstand PG&E gas quality in relation to their reporting requirements, the total sulfur measured in the gas stream as total sulfuris expressed as grains per 100 standard cubic feet (gr/100 scf). PG&E's gas supply typically qualifies as "pipeline quality naturalgas" as shown in the Gas System Survey Results table below.
Gas System Sulfur Survey Results
PG&E has B program of periodically surveying representative locations on the system to determine the sulfur containing compoundconcentrations in the gas stream. PG&E tests for sulfur using ASTM D 5504 "Standard Test Method for Determination of SulfurCompounds in Natural Gas and Gaseous Fuels by Gas Chromatography and Chemiluminescence." Our detection limit isapproximately 10 PPBv for each compound. PG&E odorizes our gas with a 50/50 blend of Tetrahydothiophene (THT) and TertiaryButyl Mercaptan (TBM) and they are typically present at approximately 1 PPMv each in the natural gas on our system. The valuesshown in the table below provide a representative sample of the gas flowing on the PG&E system.
Total Sulfur Total SulfurAverage all sites Maximum
gr/100 scf PPMv gr/100 scf PPMv
First Quarter 2010 0.151 2.55 0.595 10.03
Fourth Quarter 2009 0.164 2.77 0.595 10.03
Third Quarter 2009 0.186 3.14 0.713 17.01Second Quartet 2009 0.166 2.79 0.326 5.50
http://www.pge.mn/pipeline/operations/sulfur /sulfur_info.shtm l4/19/2010
Date
Page 123
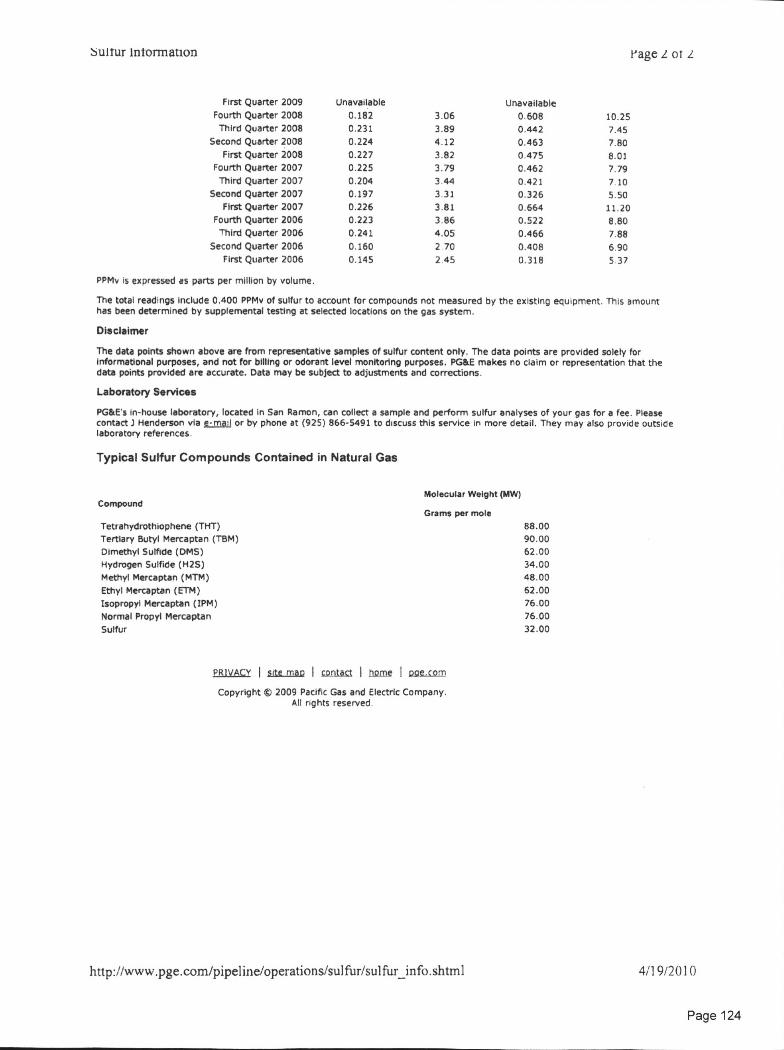
Sulfur Information rage 2 or 2
First Quarter 2009 Unavailable UnavailableFourth Quarter 2008 0.182 3.06 0.608 10.25
Third Quarter 2008 0.231 3.89 0.442 7.45Second Quarter 2008 0.224 4.12 0.463 7.80
First Quarter 2008 0.227 3.82 0 475 8.01Fourth Quarter 2007 0.225 3.79 0.462 7.79
Third Quarter 2007 0.204 3.44 0.421 7.10Second Quarter 2007 0.197 3.31 0.326 5.50
First Quarter 2007 0.226 3.81 0.664 11.20Fourth Quarter 2006 0.223 3.86 0.522 8.80Third Quarter 2006 0.241 4.05 0.466 7.88
Second Quarter 2006 0.160 2 70 0.408 6.90First Quarter 2006 0.145 2 45 0.318 5.37
PPMv is expressed as parts per million by volume.
The total readings include 0.400 PPMv of sulfur to account for compounds not measured by the existing equipment This amounthas been determined by supplemental testing at selected locations on the gas system.
Disclaimer
The data points shown above are from representative samples of sulfur content only. The data points are provided solely forInformational purposes, and not for billing or odorant level monitoring purposes. PG&E makes no claim or representation that thedata points provided are accurate. Data may be subject to adjustments and corrections.
Laboratory Services
PG&E s in-house laboratory, located in San Ramon, can collect a sample and perform sulfur analyses of your gas for a fee, Pleasecontact Henderson via e-ma:1 or by phone at (925) 866-5491 to discuss this service in more detail. They may also provide outsidelaboratory references.
Typical Sulfur Compounds Contained in Natural Gas
Molecular Weight (MW)Compound
Grams per moleTetrahydrothlophene (THT) 88.00Tertiary Butyl Mercaptan (TBM) 90.00Dimethyl Sulfide (DMS) 62.00Hydrogen Sulfide (H2S) 34.00Methyl Mercaptan (MTM) 48.00Ethyl Mercaptan (ETM) 62.00Isopropyl Mercaptan (1PM) 76.00Normal Propyl Mercaptan 76.00Sulfur 32.00
PRIVACY I Site maL1 I Ctin_ta.C1 I 0.001e I pee.com
Copyright © 2009 Pacific Gas and Electric Company.All rights reserved
http://www.pge.com/pipeline/operations/sulfuesulfur_info.shtml 4/19/2010
Page 124
Data Acquisition
Page 125
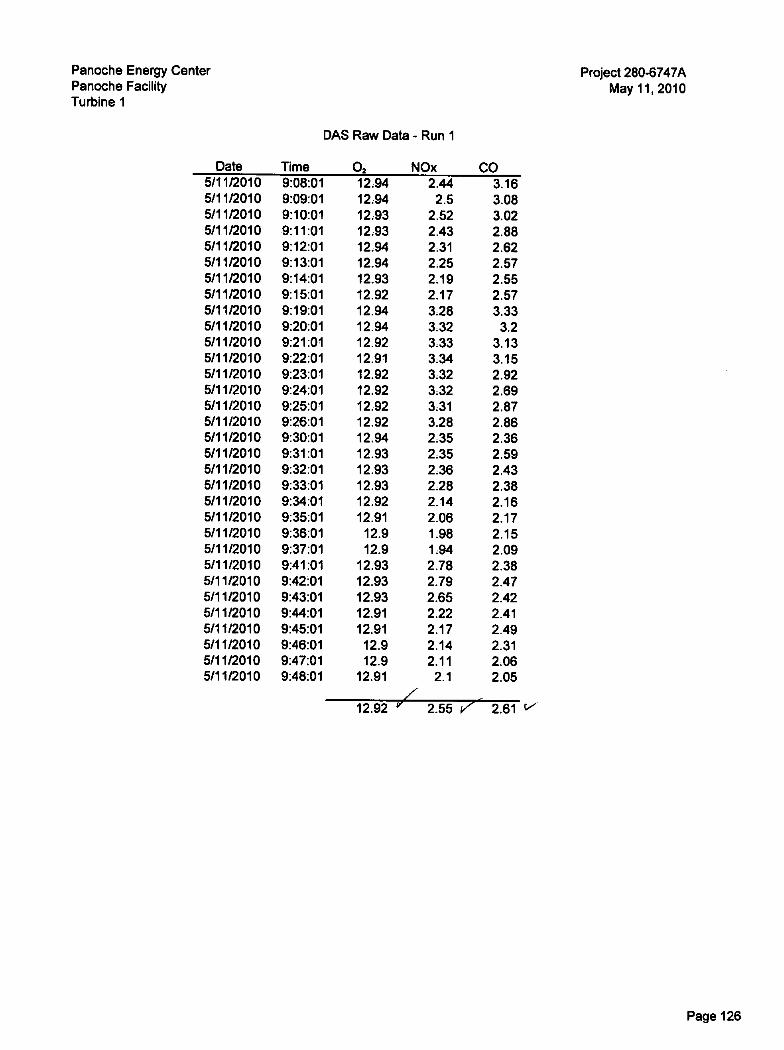
Panoche Energy Center Project 280-6747APanoche Facility
May 11, 2010Turbine 1
DAS Raw Data - Run 1
Date Time 02 NOx CO5/11/2010 9:08:01 12.94 2.44 3.165/11/2010 9:09:01 12.94 2.5 3.085/11/2010 9:10:01 12.93 2.52 3.025/11/2010 9:11:01 12.93 2.43 2.885/11/2010 9:12:01 12.94 2.31 2.625/11/2010 9:13:01 12.94 2.25 2.575/11/2010 9:14:01 12.93 2.19 2.555/11/2010 9:15:01 12.92 2.17 2.575/11/2010 9:19:01 12.94 3.28 3.335/11/2010 9:20:01 12.94 3.32 3.25/11/2010 9:21:01 12.92 3.33 3.135/11/2010 9:22:01 12.91 3.34 3.155/11/2010 9:23:01 12.92 3.32 2.925/11/2010 9:24:01 12.92 3.32 2.695/11/2010 9:25:01 12.92 3.31 2.875/11/2010 9:26:01 12.92 3.28 2.865/11/2010 9:30:01 12.94 2.35 2.365/11/2010 9:31:01 12.93 2.35 2.595/11/2010 9:32:01 12.93 2.36 2.435/11/2010 9:33:01 12.93 2.28 2.385/11/2010 9:34:01 12.92 2.14 2.165/11/2010 9:35:01 12.91 2.06 2.175/11/2010 9:36:01 12.9 1.98 2.155/11/2010 9:37:01 12.9 1.94 2.095/11/2010 9:41:01 12.93 2.78 2.385/11/2010 9:42:01 12.93 2.79 2.475/11/2010 9:43:01 12.93 2.65 2.425/11/2010 9:44:01 12.91 2.22 2.415/11/2010 9:45:01 12.91 2.17 2.495/11/2010 9:46:01 12.9 2.14 2.315/11/2010 9:47:01 12.9 2.11 2.065/11/2010 9:48:01 12.91
/2.1 2.05
12.92 2.55 V-- 2.61 V
Page 126
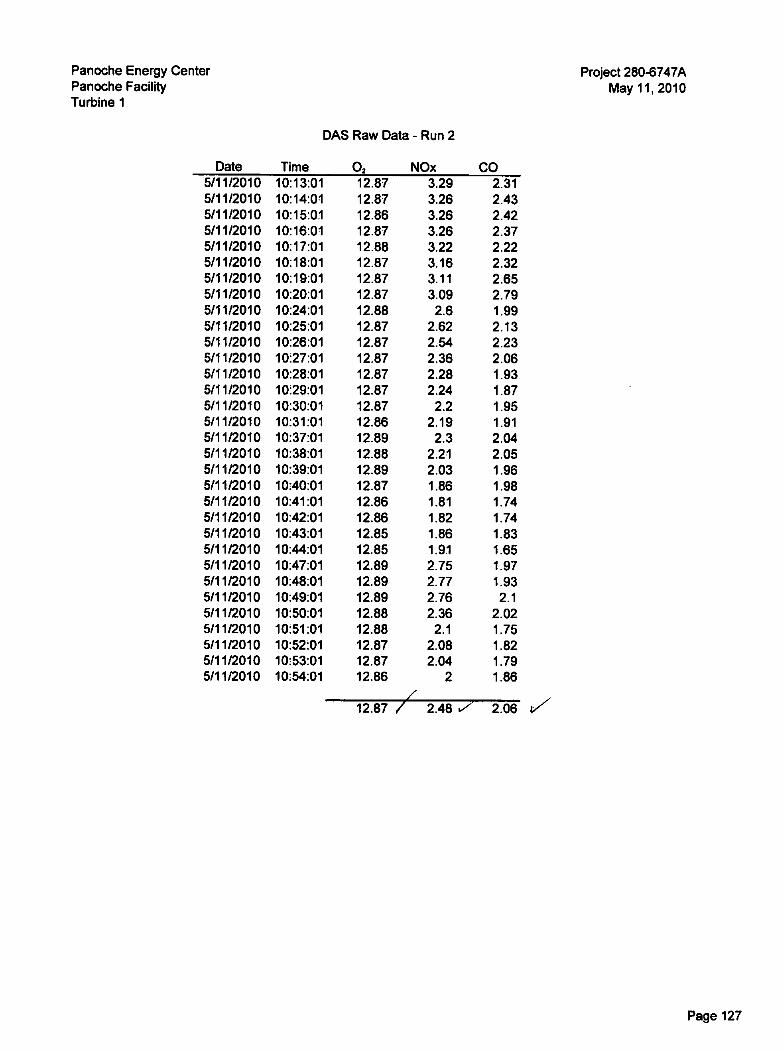
Panoche Energy CenterPanoche FacilityTurbine 1
Date
DAS Raw Data - Run 2
Time 02 NOx
Project 280-6747AMay 11, 2010
CO5/11/2010 10:13:01 12.87 3.29 2.315/11/2010 10:14:01 12.87 3.26 2.435/11/2010 10:15:01 12.86 3.26 2.425/11/2010 10:16:01 12.87 3.26 2.375/11/2010 10:17:01 12.88 3.22 2.225/11/2010 10:18:01 12.87 3.16 2.325/11/2010 10:19:01 12.87 3.11 2.655/11/2010 10:20:01 12.87 3.09 2.795/11/2010 10:24:01 12.88 2.6 1.995/11/2010 10:25:01 12.87 2.62 2.135/11/2010 10:26:01 12.87 2.54 2.235/11/2010 1027:01 12.87 2.36 2.065/11/2010 10:28:01 12.87 2.28 1.935/11/2010 1029:01 12.87 2.24 1.875/11/2010 10:30:01 12.87 2.2 1.955/11/2010 10:31:01 12.86 2.19 1.915/11/2010 10:37:01 12.89 2.3 2.045/11/2010 10:38:01 12.88 2.21 2.055/11/2010 10:39:01 12.89 2.03 1.965/11/2010 10:40:01 12.87 1.86 1.985/11/2010 10:41:01 12.86 1.81 1.745/11/2010 10:42:01 12.86 1.82 1.745/11/2010 10:43:01 12.85 1.86 1.835/11/2010 10:44:01 12.85 1.91 1.655/11/2010 10:47:01 12.89 2.75 1.975/11/2010 10:48:01 12.89 2.77 1.935/11/2010 10:49:01 12.89 2.76 2.15/11/2010 1050:01 12.88 2.36 2.025/11/2010 1051:01 12.88 2.1 1.755/11/2010 10:52:01 12.87 2.08 1.825/11/2010 10:53:01 12.87 2.04 1.795/11/2010 10:54:01 12.86 2 1.86
12.87 7 2.48 V 2.06 V
Page 127
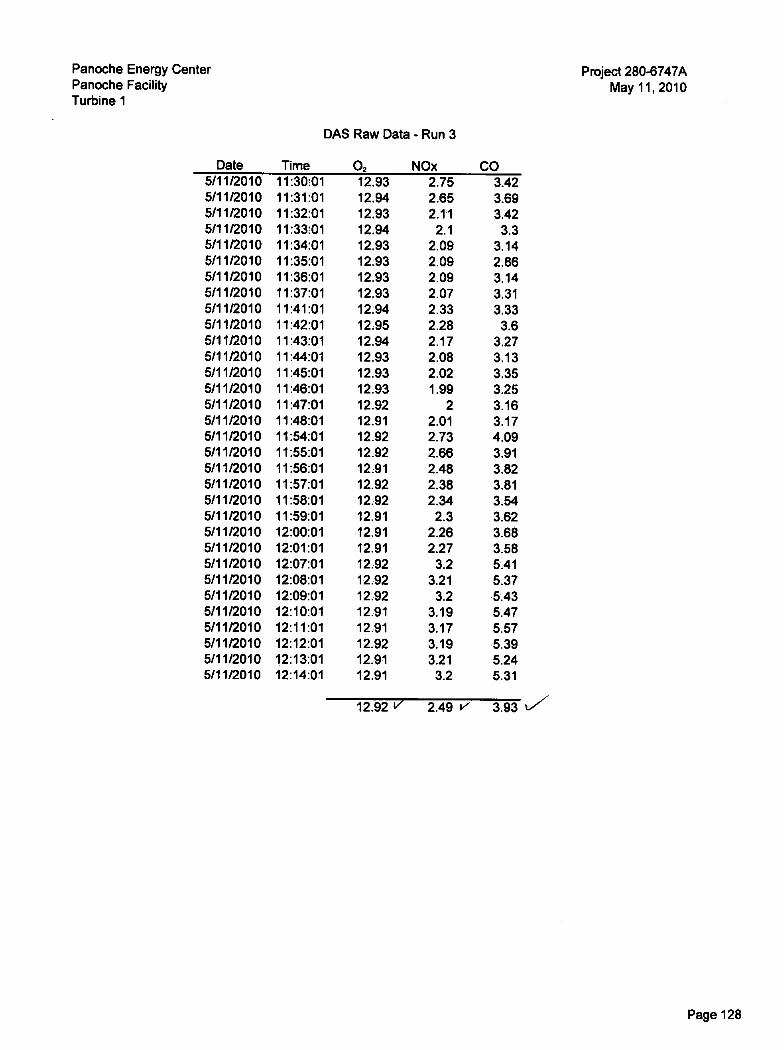
Panoche Energy Center Project 280-6747APanoche Facility May 11, 2010Turbine 1
DAS Raw Data - Run 3
Date Time 02 NOx CO5/11/2010 11:30:01 12.93 2.75 3.425/11/2010 11:31:01 12.94 2.65 3.695/11/2010 11:32:01 12.93 2.11 3.425/11/2010 11:33:01 12.94 2.1 3.35/11/2010 11:34:01 12.93 2.09 3.145/11/2010 11:35:01 12.93 2.09 2.865/11/2010 11:36:01 12.93 2.09 3.145/11/2010 11:37:01 12.93 2.07 3.315/11/2010 11:41:01 12.94 2.33 3.335/11/2010 11:42:01 12.95 2.28 3.65/11/2010 11:43:01 12.94 2.17 3.275/11/2010 11:44:01 12.93 2.08 3.135/11/2010 11:45:01 12.93 2.02 3.355/11/2010 11:46:01 12.93 1.99 3.255/11/2010 11:47:01 12.92 2 3.165/11/2010 11:48:01 12.91 2.01 3.175/11/2010 11:54:01 12.92 2.73 4.095/11/2010 11:55:01 12.92 2.66 3.915/11/2010 11:56:01 12.91 2.48 3.825/11/2010 11:57:01 12.92 2.38 3.815/11/2010 11:58:01 12.92 2.34 3.545/11/2010 11:59:01 12.91 2.3 3.625/11/2010 12:00:01 12.91 2.26 3.685/11/2010 12:01:01 12.91 2.27 3.585/11/2010 12:07:01 12.92 3.2 5.415/11/2010 12:08:01 12.92 3.21 5.375/11/2010 12:09:01 12.92 3.2 5.435/11/2010 12:10:01 12.91 3.19 5.475/11/2010 12:11:01 12.91 3.17 5.575/11/2010 12:12:01 12.92 3.19 5.395/11/2010 12:13:01 12.91 3.21 •5.245/11/2010 12:14:01 12.91 3.2 5.31
12.92 17 2.49 V 3.93 t,
Page 128

Panoche Energy Center
Project 280-6747APanoche Facility May 11, 2010Turbine 1
Date
DAS Raw Data - Run 4
Time 02 NOx CO5/11/2010 12:45:01 12.9 3.24 5.425/11/2010 12:46:01 12.89 3.23 5.525/11/2010 12:47:01 12.9 3.22 5.55/11/2010 12:48:01 12.9 3.2 5.555/11/2010 12:49:01 12.89 3.19 5.665111/2010 12:50:01 12.9 3.19 5.675/11/2010 12:51:01 12.9 3.17 5.645/11/2010 12:52:01 12.91 3.15 5.715/11/2010 12:57:01 12.92 2.6 4.295/11/2010 12:58:01 12.92 2.61 4.175/11/2010 12:59:01 12.92 2.58 4.215/11/2010 13:00:01 12.9 2.46 3.965/11/2010 13:01:01 12.9 2.33 3.885/11/2010 1302:01 12.89 2.28 3.815/11/2010 1303:01 12.88 2.27 3.735/11/2010 13:04:01 12.89 2.27 3.755/11/2010 13:09:01 12.89 2.42 4.325/11/2010 13:10:01 12.89 2.32 4.225/11/2010 13:11:01 12.89 2.2 3.95/11/2010 13:12:01 12.89 2.09 3.815/11/2010 13:13:01 12.89 2.04 3.745/11/2010 13:14:01 12.88 2.02 3.755/11/2010 13:15:01 12.87 2.02 3.695/11/2010 13:16:01 12.87 2 3.765/11/2010 13:20:01 12.93 2.51 4.965/11/2010 13:21:01 12.91 2.5 5.045/11/2010 13:22:01 12.91 2.5 4.945/11/2010 13:23:01 12.89 2.38 5.075/11/2010 13:24:01 12.89 2.23 5.035/11/2010 13:25:01 12.88 2.17 4.915/11/2010 13:26:01 12.89 2.12 4.865/11/2010 13:27:01 12.89 2.11 4.93
12.90 2.52 4.61
Page 129
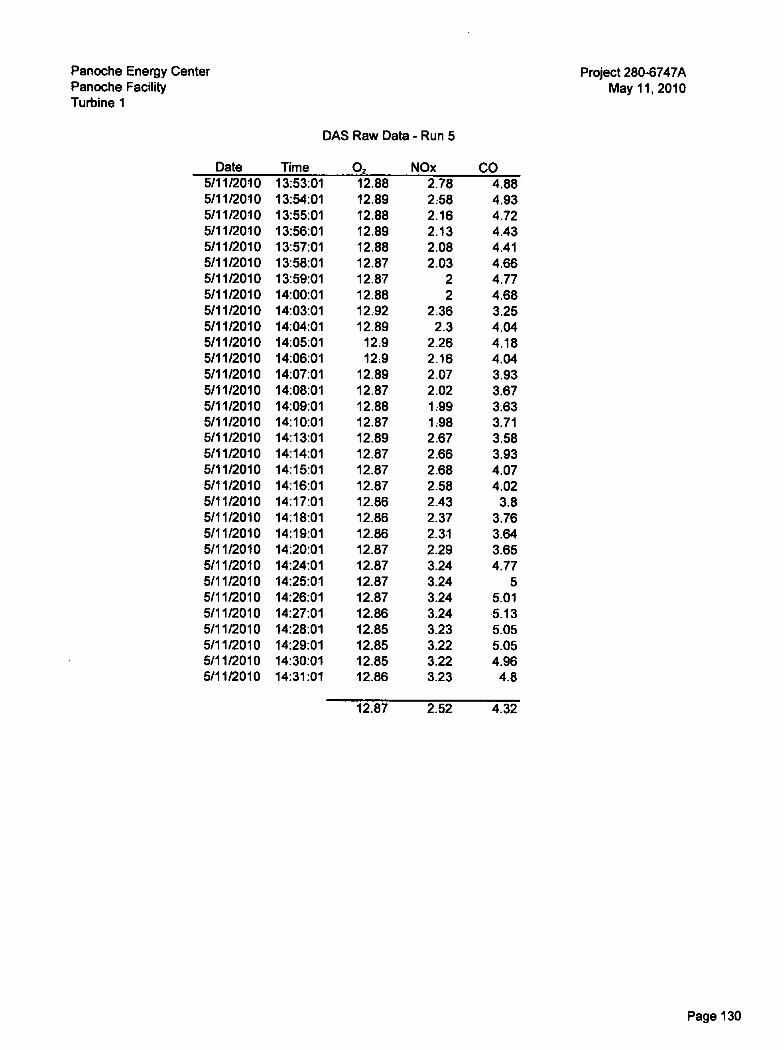
Panoche Energy Center
Project 280-6747APanoche Facility
May 11, 2010Turbine 1
Date
DAS Raw Data - Run 5
Time 02 NOx CO5/11/2010 13:53:01 12.88 2.78 4.885/11/2010 13:54:01 12.89 2:58 4.935/11/2010 13:55:01 12.88 2.16 4.725/11/2010 13:56:01 12.89 2.13 4.435/11/2010 13:57:01 12.88 2.08 4.415/11/2010 13:58:01 12.87 2.03 4.665/11/2010 13:59:01 12.87 2 4.775/11/2010 14:00:01 12.88 2 4.685/11/2010 14:03:01 12.92 2.36 3.255/11/2010 14:04:01 12.89 2.3 4.045/11/2010 14:05:01 12.9 2.26 4.185/11/2010 14:06:01 12.9 2.16 4.045/11/2010 14:07:01 12.89 2.07 3.935/11/2010 14:08:01 12.87 2.02 3.675/11/2010 14:09:01 12.88 199 3.635/11/2010 14:10:01 12.87 1.98 3.715/11/2010 14:13:01 12.89 2.67 3.585/11/2010 14:14:01 12.87 2.66 3.935/11/2010 14:15:01 12.87 2.68 4.075/11/2010 14:16:01 12.87 2.58 4.025/11/2010 14:17:01 12.86 2.43 3.85/11/2010 14:18:01 12.86 2.37 3.765/11/2010 14:19:01 12.86 2.31 3.645/11/2010 1420:01 12.87 2.29 3.655/11/2010 14:24:01 12.87 3.24 4.775/11/2010 14:25:01 12.87 3.24 55/11/2010 14:26:01 12.87 3.24 5.015/11/2010 14:27:01 12.86 3.24 5.135/11/2010 14:28:01 12.85 3.23 5.055/11/2010 14:29:01 12.85 3.22 5.055/11/2010 14:30:01 12.85 3.22 4.965/11/2010 14:31:01 12.86 3.23 4.8
12.87 2.52 4.32
Page 130
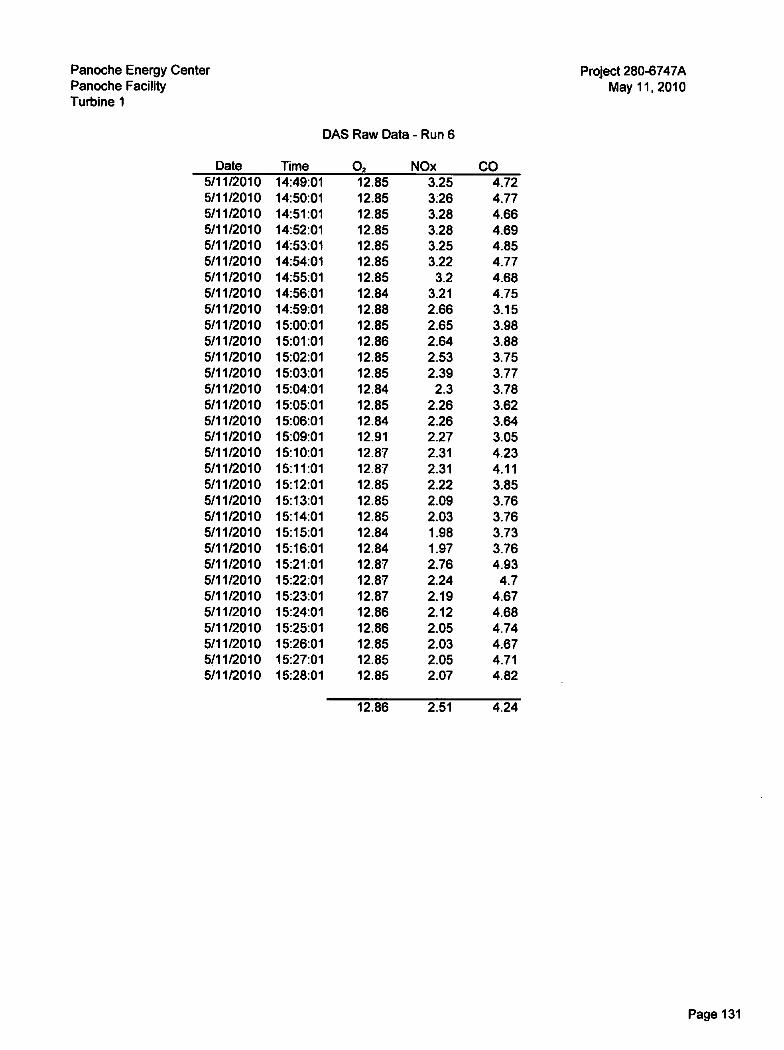
Panoche Energy Center
Project 280-6747APanoche Facility
May 11, 2010Turbine 1
Date
DAS Raw Data - Run 6
Time 02 NOx CO5/11/2010 14:49:01 12.85 3.25 4.725/11/2010 14:50:01 12.85 3.26 4.775/11/2010 14:51:01 12.85 3.28 4.665/11/2010 14:52:01 12.85 3.28 4.695/11/2010 14:53:01 12.85 3.25 4.855/11/2010 14:54:01 12.85 3.22 4.775/11/2010 14:55:01 12.85 3.2 4.685/11/2010 14:56:01 12.84 3.21 4.755/11/2010 14:59:01 12.88 2.66 3.155/11/2010 15:00:01 12.85 2.65 3.985/11/2010 15:01:01 12.86 2.64 3.885/11/2010 15:02:01 12.85 2.53 3.755/11/2010 15:03:01 12.85 2.39 3.775/11/2010 15:04:01 12.84 2.3 3.785/11/2010 15:05:01 12.85 2.26 3.625/11/2010 15:06:01 12.84 2.26 3.645/11/2010 15:09:01 12.91 2.27 3.055/11/2010 15:10:01 12.87 2.31 4.235/11/2010 15:11:01 12.87 2.31 4.115/11/2010 15:12:01 12.85 2.22 3.855/11/2010 15:13:01 12.85 2.09 3.765/11/2010 15:14:01 12.85 2.03 3.765/11/2010 15:15:01 12.84 1.98 3.735/11/2010 15:16:01 12.84 1.97 3.765/11/2010 15:21:01 12.87 2.76 4.935/11/2010 15:22:01 12.87 2.24 4.75/11/2010 15:23:01 12.87 2.19 4.675/11/2010 15:24:01 12.86 2.12 4.685/11/2010 15:25:01 12.86 2.05 4.745/11/2010 15:26:01 12.85 2.03 4.675/11/2010 15:27:01 12.85 2.05 4.715/11/2010 15:28:01 12.85 2.07 4.82
12.86 2.51 4.24
Page 131
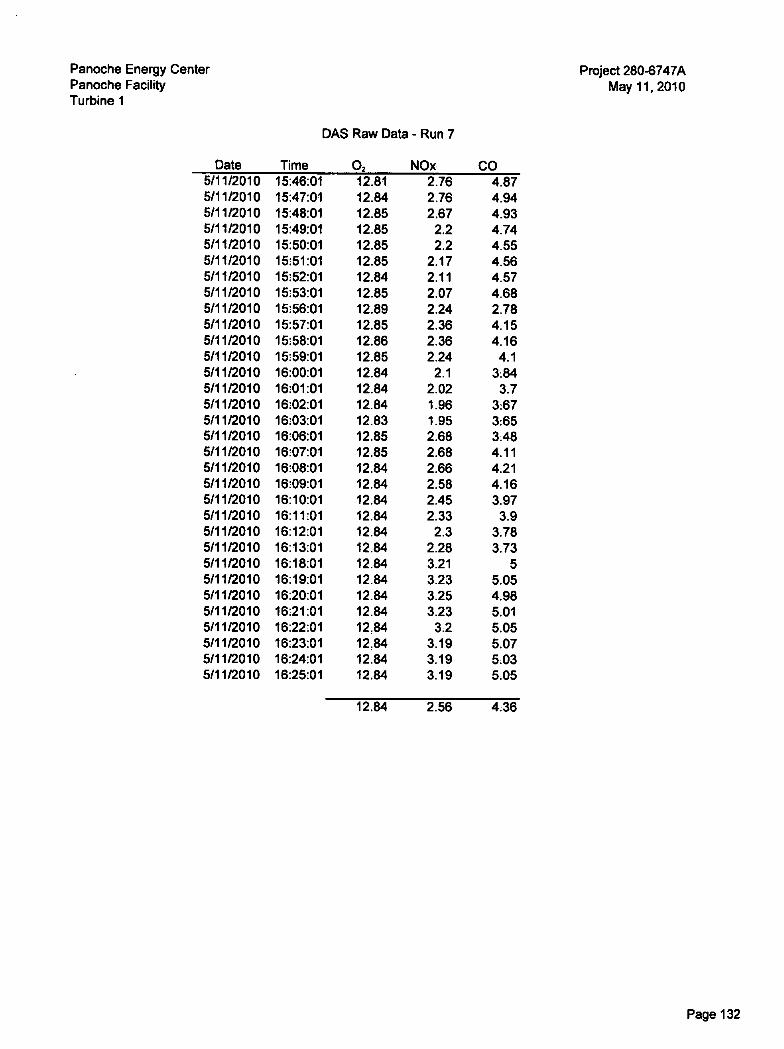
Panoche Energy Center
Project 280-6747APanoche Facility
May 11, 2010Turbine 1
Date
DAS Raw Data - Run 7
Time 02 NOx CO5/11/2010 15:46:01 12.81 2.76 4.875/11/2010 15:47:01 12.84 2.76 4.945/11/2010 15:48:01 12.85 2.67 4.935/11/2010 15:49:01 12.85 2.2 4.745/1112010 15:50:01 12.85 2.2 4.555/11/2010 15:51:01 12.85 2.17 4.565/11/2010 15:52:01 12.84 2.11 4.575/11/2010 15:53:01 12.85 2.07 4.685/11/2010 15:56:01 12.89 2.24 2.785/11/2010 15:57:01 12.85 2.36 4.155/11/2010 15:58:01 12.86 2.36 4.165/11/2010 15:59:01 12.85 2.24 4.15/11/2010 16:00:01 12.84 2.1 3:845/11/2010 16:01:01 12.84 2.02 3.75/11/2010 16:02:01 12.84 1.96 3:675/11/2010 16:03:01 12.83 1.95 3:655/11/2010 16:06:01 12.85 2.68 3.485/11/2010 16:07:01 12.85 2.68 4.115/11/2010 16:08:01 12.84 2.66 4.215/11/2010 16:09:01 12.84 2.58 4.165/11/2010 16:10:01 12.84 2.45 3.975/11/2010 16:11:01 12.84 2.33 3.95/11/2010 16:12:01 12.84 2.3 3.785/11/2010 16:13:01 12.84 2.28 3.735/11/2010 16:18:01 12.84 3.21 55/11/2010 16:19:01 12.84 3.23 5.055/11/2010 16:20:01 12.84 3.25 4.985/11/2010 16:21:01 12.84 3.23 5.015/11/2010 16:22:01 12.84 3.2 5.055/11/2010 16:23:01 12.84 3.19 5.075/11/2010 16:24:01 12.84 3.19 5.035/11/2010 16:25:01 12.84 3.19 5.05
12.84 2.56 4.36
Page 132
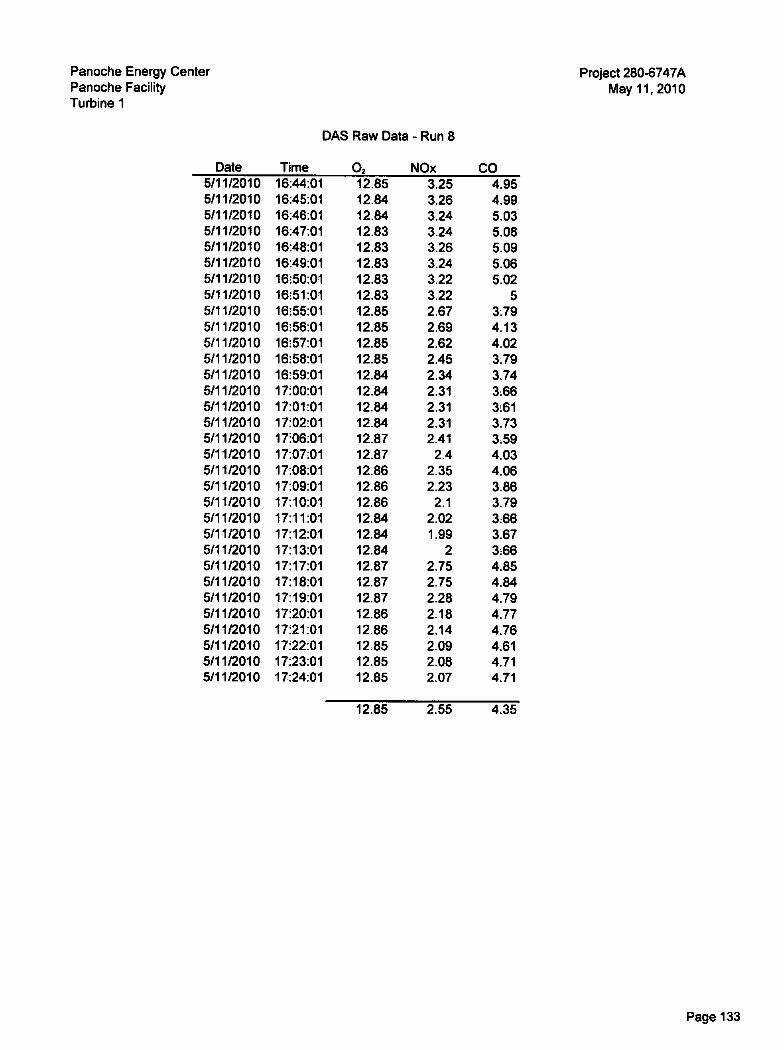
Panoche Energy Center
Project 280-6747APanoche Facility
May 11, 2010Turbine 1
Date
DAS Raw Data - Run 8
Time 02 NOx CO5/11/2010 16:44:01 12.85 3.25 4.955/11/2010 16:45:01 12.84 3.26 4.995/11/2010 16:46:01 12.84 3.24 5.035/11/2010 16:47:01 12.83 3.24 5.085/11/2010 16:48:01 12.83 3.26 5.095/11/2010 16:49:01 12.83 3.24 5.065/11/2010 1650:01 12.83 3.22 5.025/11/2010 16:51:01 12.83 3.22 55/11/2010 16:55:01 12.85 2.67 3.795/11/2010 16:56:01 12.85 2.69 4.135/11/2010 16:57:01 12.85 2.62 4.025/11/2010 16:58:01 12.85 2.45 3.795/11/2010 16:59:01 12.84 2.34 3.745/11/2010 1700:01 12.84 2.31 3.665/11/2010 17:01:01 12.84 2.31 3615/11/2010 17:02:01 12.84 2.31 3.735/11/2010 1706:01 12.87 2.41 3.595/11/2010 1707:01 12.87 2.4 4.035/11/2010 17:08:01 12.86 2.35 4.065/11/2010 17:09:01 12.86 2.23 3.865/11/2010 17:10:01 12.86 2.1 3.795/11/2010 17:11:01 12.84 2.02 3:665/11/2010 17:12:01 12.84 1.99 3.675/11/2010 17:13:01 12.84 2 3665/11/2010 17:17:01 12.87 2.75 4.855/11/2010 17:18:01 12.87 2.75 4.845/11/2010 17:19:01 12.87 2.28 4.795/11/2010 1720:01 12.86 2.18 4.775/11/2010 1721:01 12.86 2.14 4.765/11/2010 1722:01 12.85 2.09 4.615/11/2010 1723:01 12.85 2.08 4.715/11/2010 17:24:01 12.85 2.07 4.71
12.85 2.55 4.35
Page 133

Panoche Energy Center
Project 280-6747APanoche Facility
May 11, 2010Turbine 1
Date
DAS Raw Data - Run 9
Time 02 NOx CO5/11/2010 17:48:01 12.86 2.79 4.685/11/2010 17:49:01 12.86 2.81 4.645/11/2010 17:50:01 12.86 2.56 4.65/11/2010 17:51:01 12.86 2.2 4.415/11/2010 17:52:01 12.86 2.2 4.345/11/2010 17:53:01 12.85 2.13 4.375/11/2010 17:54:01 12.85 2.08 4.375/11/2010 17:55:01 12.85 2.07 4.45/11/2010 1758:01 12.89 2.38 3.415/11/2010 17:59:01 12.87 2.38 3.965/11/2010 1800:01 12.87 2.28 3.955/11/2010 18:01:01 12.86 2.14 3.795/11/2010 18:02:01 12.86 2.04 3.65/11/2010 1803:01 12.85 2.02 3.615/11/2010 1804:01 12.84 2 3.475/11/2010 1805:01 12.85 1.99 3.495/11/2010 1808:01 12.86 2.65 3.625/11/2010 1809:01 12.85 2.67 4.075/11/2010 18:10:01 12.85 2.67 3.985/11/2010 18:11:01 12.85 2.6 3.775/11/2010 18:12:01 12.85 2.47 3.55/11/2010 18:13:01 12.84 2.37 3.555/11/2010 18:14:01 12.84 2.32 3.465/11/2010 18:15:01 12.85 2.32 3.445/11/2010 18:19:01 12.86 3.3 4.155/11/2010 18:20:01 12.85 3.3 4.415/11/2010 18:21:01 12.85 3.29 4.495/11/2010 18:22:01 12.85 3.28 4.715/11/2010 1823:01 12.85 327 4.755/11/2010 18:24:01 12.85 3.25 4.695/11/2010 18:25:01 12.85 3.24 4.695/11/2010 18:26:01 12.85 3.26 4.88
12.85 2.57 4.10
Page 134
Instrument Strip Charts
Page 135
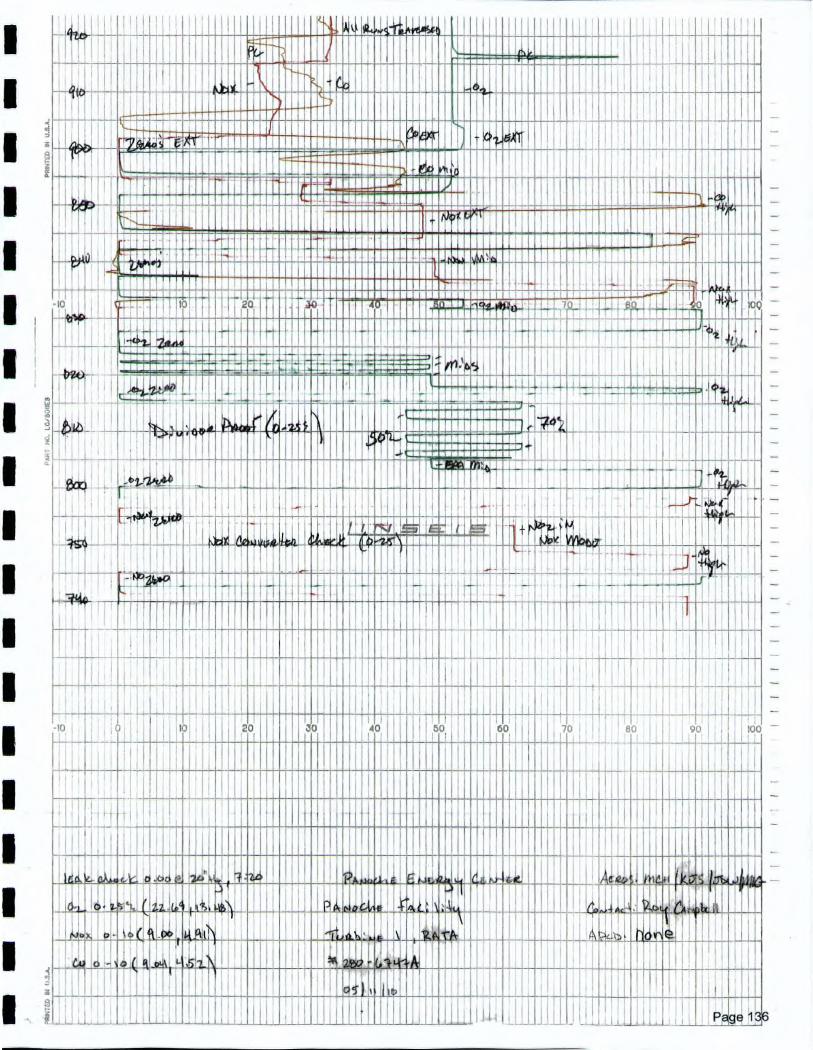
f,CIO
3St
,,,,,,,H,11„,,,,,w,,,,,„ww..„,,„„miiii,iiiiiiiiii„„„wwwwmmufficommikmommummmimmummonmilmo
111011111NEMEMMIMMINSIEHMEHIMMIUPILImomeMINOMMIONAINMINIMMINMEMMINIfit
ummmelititgEMIREEMINMESEMMIMMEMINHifil
aiNidantIOMMINNUMMU MINIMME111IMMILIMINIEF=MONSIMMUMEMOMMIIPMEN
9 lompihniimilmmilimmiummummusaimmuumur-m_VigiiiiiiiiiiiiiiiiERIMINI.unruirminurummuumumam. es.
difidlirnidlliiiiiiiiiiEzangareNIFASIplommulmomprammou so mak PI.. _ vernmremqnsimpro mum,niallilikiLibli94191t_ec liisni,67:7:::_ .Ammo I Elm um
• trg" goliegumilommummaium I ng uzsom.11191AMIlill IMMINNIE IMI 1 11 MIEN-,, .. MUM I MUMNIMMEMINI
Mil• 11111111111111111,... INEXE:111 APPIIIIIIIMMOMIN
. _ MEM MI MEMUNOMMUM
IMIMMIMMINIMMIN IMIAIIIMMOMII i I I DIME=M NONIMIMMN , 1 t
IMMIIIIIIIIMMIIIMI 1 1 im1 7--
20 II 4o 1hhl11h I 11 ôo l '70 80.900
1110111111MMNIMINIMIIMPIIMI 111111111IMIMIMIIIMMIIIMMIIIIIIIIIMMIN MEIN
11111111111MMIIHMOIMMINIMINIMMIMIUMMONNIMMIIIIMMMIUMENUMEMINUMNIMMMENIMIN1111
d L. IMMINIMMIMMIMPIRIMPIRMIIMPEPERN •IIIMMEMPIIMPRIMINIMIIMIOMMINIMOM
. WINIMMIIMINIMMIWINOMIWOMMENNINNEMINIMINIMIMIMPIRMIMUMEMIRMIMMIMIMIMMIMI
MffillIMMOMENIMMIIIMMEMMMIIMIMMEN IIIi HI II, I I il IIH ,i1 II i liL,11LL ,
111J111111111111111
1 1 1
qto
NtiK-00a4u4.:414rdi
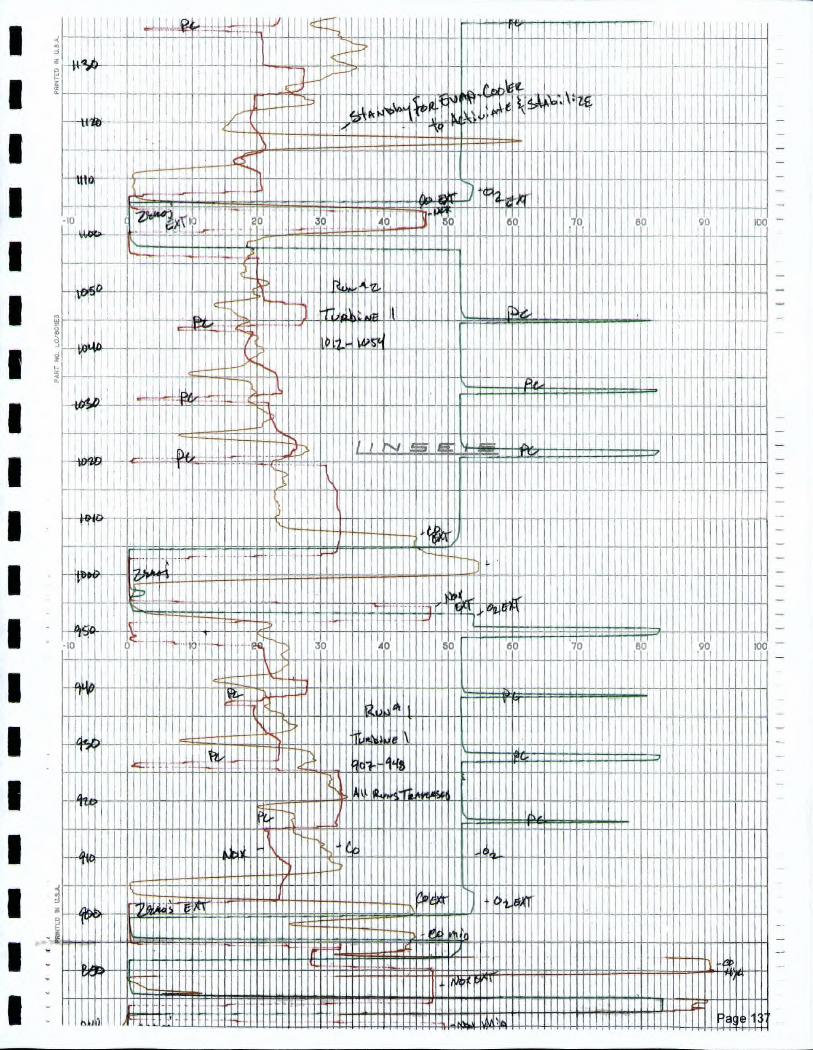
070&>
'111-U-111-1-41'1- I !
All14V, MI , IrEkai liOli
...g.ffirminmum Iiiiimummiliiiiimmmummummo.4 mumkli- mummom
iiiiiiraillinillinniumsmemffinnumemmumluminormommumi
smommommonmagni
, lammomou mei -zimi"L._ism= dill
_. miRMINIIIMM.7---7-Eir9M-----' 1 11110011MINIMIMMI1111111111
11111111"Pmminiiiiiiiiiiiiimwirmm. ummumm11111M1111111M111111111
hi'—flb..1-1
"TiliiiiiiiiiirilinlliAL.11.11111:1110%
i1111111M11
30 50I
_ , I . 14 , EMIR 1 60 70 901 100
__......1011111011141111111 NE ilNrmillilll mmnpion immemillIC MLIIIMMIIIINIMMIRE111111111111M1=21111111111111
11111111111111111111015111101 1MNIN ' 1 11111111111111niviiimlimillin 1oul —..:11-simullipindirdummffirmurimififfilIN 1 11 11111, . olmiiiiiiumulmmilimokihoi , . .ii lilonmuliMI1111101011111M1111 1111111101 II 11111
111111111011EMINIMMINE:::::11111511111111 1111111101111111M11.11111iiiwilimIMMIIMIIIIIIIIimaimum pulidaimuimmum 1 11=11111in 1911110111111111111MINIMINIMMINNIIIMMIlimLIT
11111 I 40'
ii
Fa
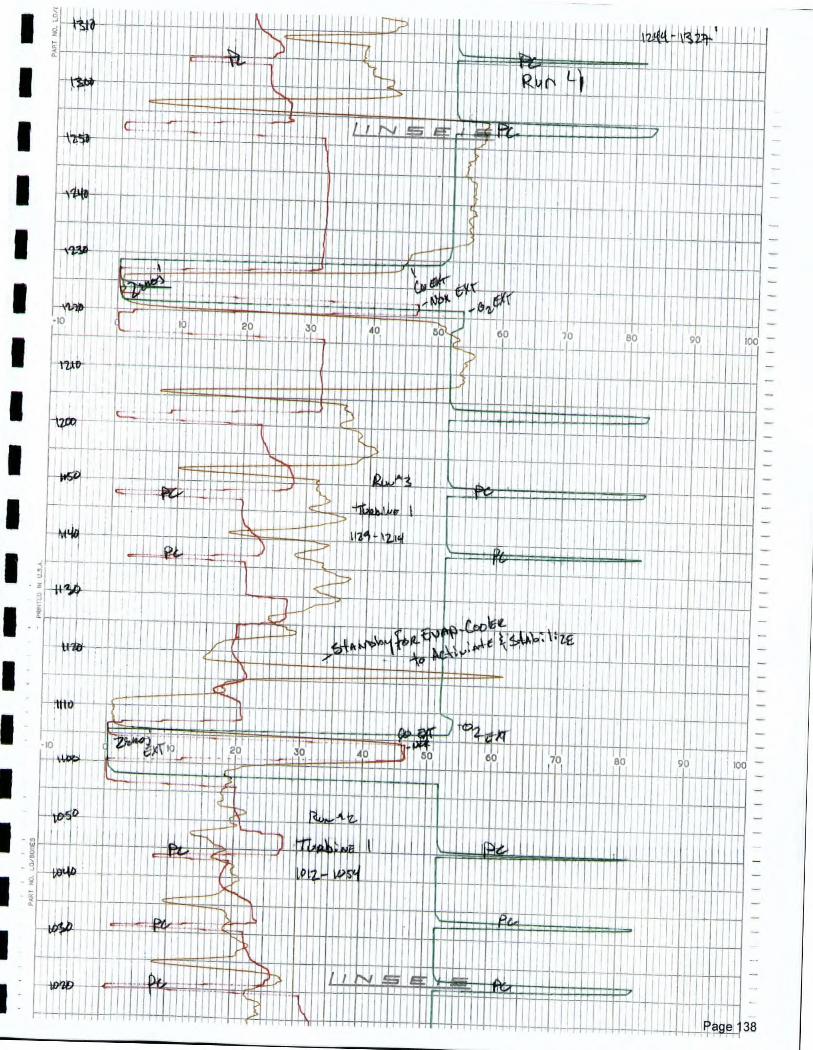
-ID%)1
11' " Wil lkillilWir 11111111filwri •
.-
--mmummummena
01011.11110MEntliiii""
INIMMUM411:11111111kmainorglifill.ihmimempmmommlnenifiiiiiiiiiiiiiii11111111111ffintinimmuummil
mummunummumbi
MN+
24,!+
Vt.*,
MI!
n 1!
Hi
1110
- 7-- AllrnIl
-
0 3° 40 5° 01110011331INSIONMENEEMINIMMOMSIMENPIEM111111111111111111110„„ INEMPIMMIMINIMNIlid 11011mummommuummir
L. ...NormEnzarivrt immummii
1 TT-
0-11)
_ !
I i I111
11
dskidIIIi i I E i iiiiiio
1ta56°
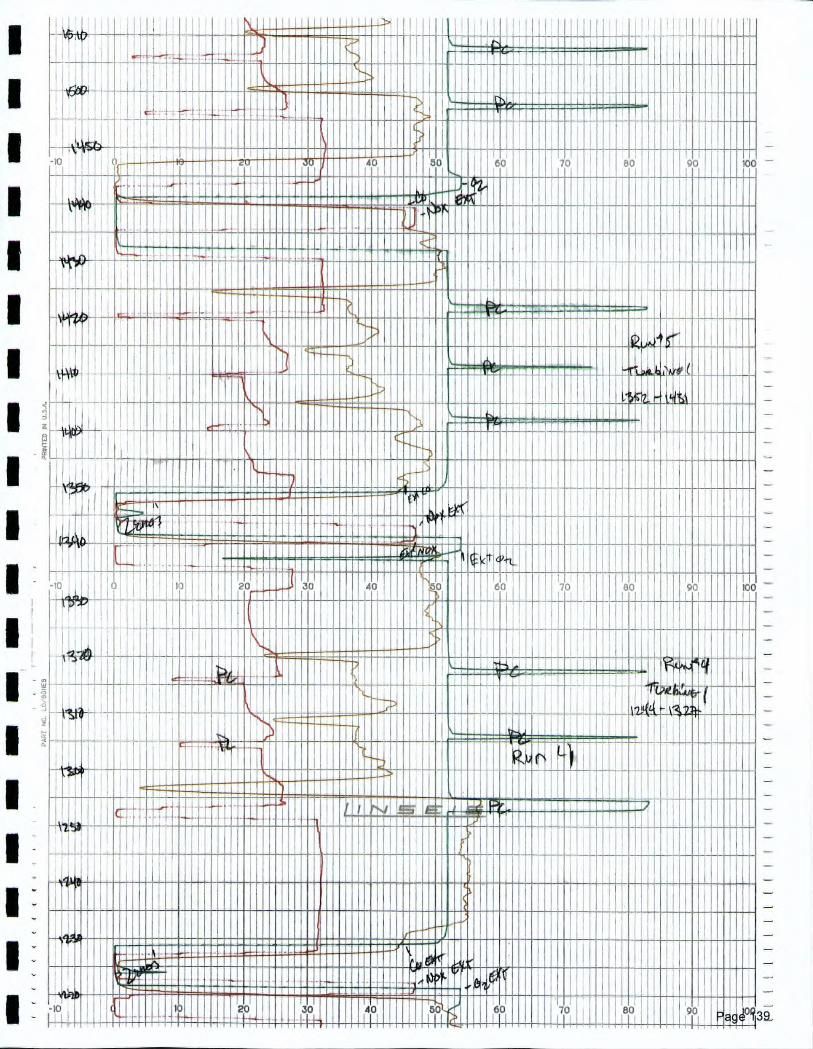
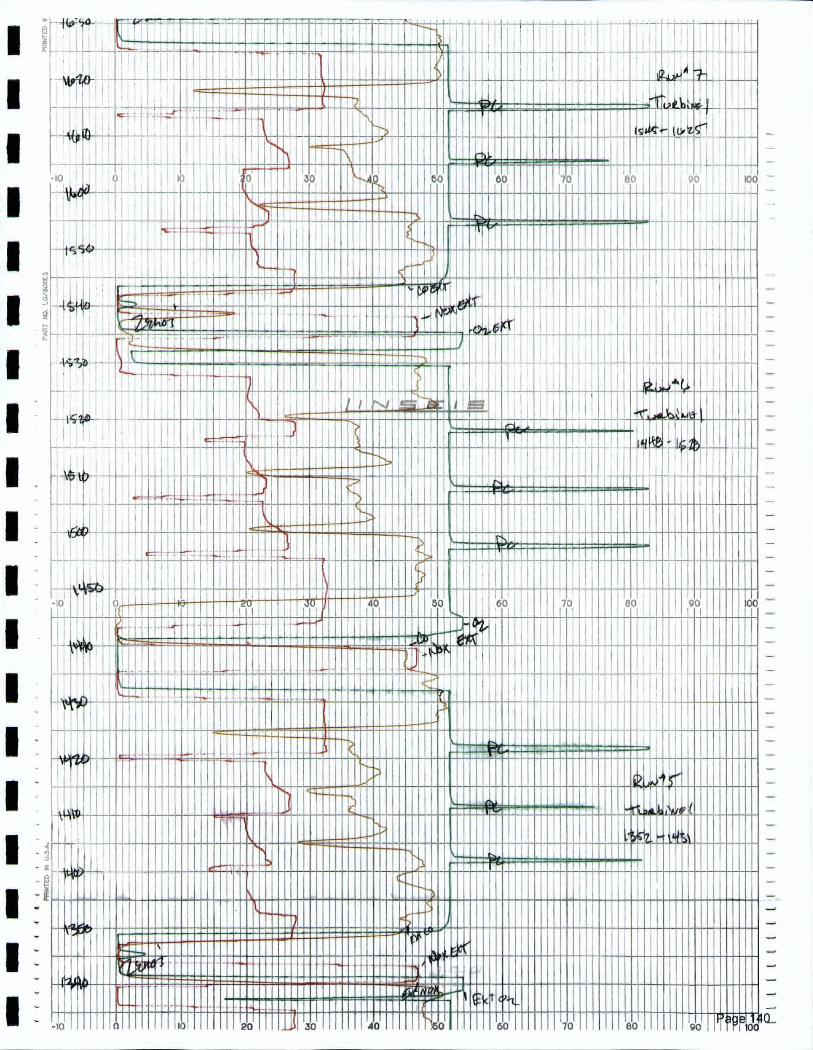
I . ' JENNETAIHMIE 1i IIMEMMEINIK: MIMI I _I M11111
II nmardiediNEMMILERL______ __I I=
I' - 1111111MEMEIMI li 111.111111111PC
1M
111701111111111 P I III_IIIIMIN I111111111110110M1 12 MI= I
I FIFEEMEMON INIEMMINIMME i
1 011111111111111111111101111111;;;;Iiiiiiiiiiiiiiiiiii . .P1 111111111111111111111111111II MIMIriu
EMIli MEM
ININIMMIMIN
I i 41111111101116111111111.
„v., IMPIIIIIIII iiiiiiMillirfilileiliiiMP5° ,. I ' lir„,.1 , plimommaimitimmum rimI -*A) 1 mormmiummenummirmmumma 1 1 momI moommobommounimillifill !iiiiiiiingilmffimm ig 1 11110_____,_ II ,., mmumuumumnimommom wig EIMINEIMM
1111111111111MMIMMINMEM i MielaVVERIMMII i 1_1 11 I ,_ INIMPREMINMIrnummilME iiii,iii-EL--LINIMINifill
1 I 11110111111110111111111 I IIIII 1111111111110 .=.,- R- I 1 ' , i 1Ifi - L 1 1:411 I MIMMUMMillIMMMillie 1 IMIll 11111111111111M111111• immgaimmiumummuimmimmism mmimmumgmommonommummssmilibilLw1C 1 nommummum "li-
. Ion 110 20 30 i 10 I I 1 1 i II 1I 1601 I INF!! I .80'11 90 II
H 1
1
I . Millummumumummansumm...q_ III Ell
112111111 11111111111111111111111
INEPffillnillmrs-7 I 3111111111111111111111111111111 I idamrmn1111111
• 1
HI 1 1 .111
I "11 I
1.11
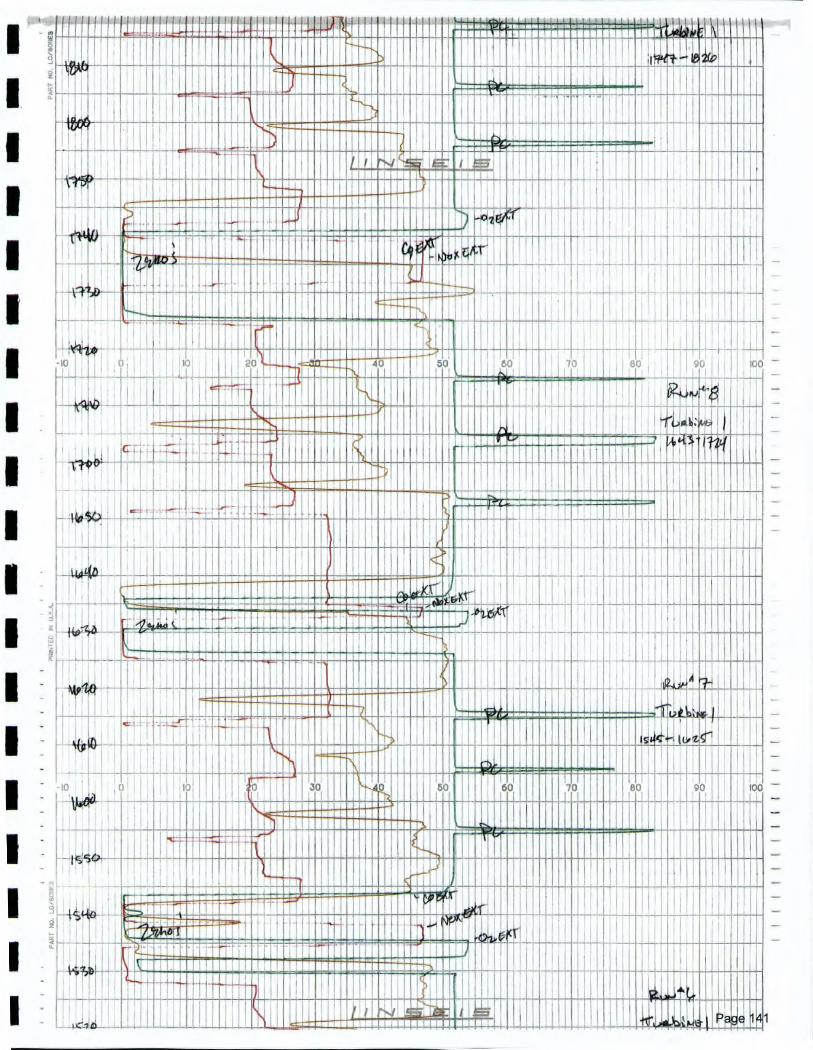
•
1
t-41,0
444,
4st?
SO-
413
!MIL ..J. egmb nolli sualasimiNNIUNNIBUIIMMINIII, 1 I 1
•I "Nor 111 1.1.1.11iiihm, IL L....J....is... in- umminummi 1111 I MEElliiiiiiiiiiiiiiiMEL=. ms MUMNIMIMMOMMXim- EN_,_mmermoni a i
MELIIIMPAPII•I ijilldiummiiiMIMIE
II imi111
!!PE - ' Ema
L ,rnimmona mmommEms. ,illIMINIMINE
50 1O I 3 10
17, 01,491MOIMI M
h 1jumENIIIIENNIMI erill BMwimm . IMINNEMOINOMINNIMIN glagillE1 ilifffiffirilffilffiffirdiummomommmimffillid 11
z.MINNIMMINENOMIEWIMIMMINE
IMININFININUMI INTHITZMIlljMEMEINIE NEMIMINEMI MEW EN=
ir EFITOR11,11 El IMMINIKENii ir ' NM 1 1 4 MIME
Miiii% MEW i MIMEiii MINIM MEM MN=•
EZIgunurmilliiiiinumm.11111MMIMMENWIEMn - I. liNIEWINiMMINIMMIIMPOEME
i inummomumuummulmommWM HIMINIUMIll 80 MUM
ihmangspullAMENIENNINIE1
IIIPTIONIIIMI••‘maimpsm iiiihmmuddiPMEMMEMINEMME1
LaMar IMMffiffigglinifiltIMMENEMMENE--rilmin I 16.1"11"""uniNMEMMENMEMEMildiniiiiiiiiiiiiiiiiiiiifimmmumwromommu
MEIMMINEMENNIIIMMIREPWRIELE
V)402cc
cc-
114,1>b
•n••••
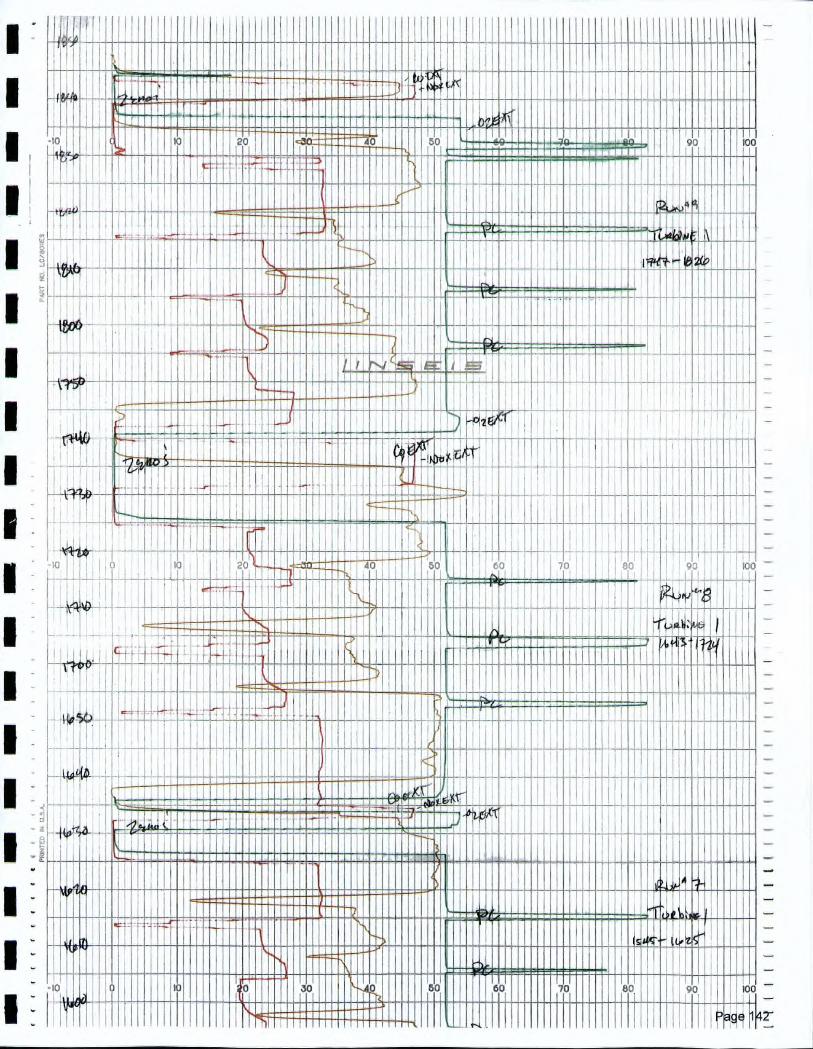

VOC Chromatograms
Page 143
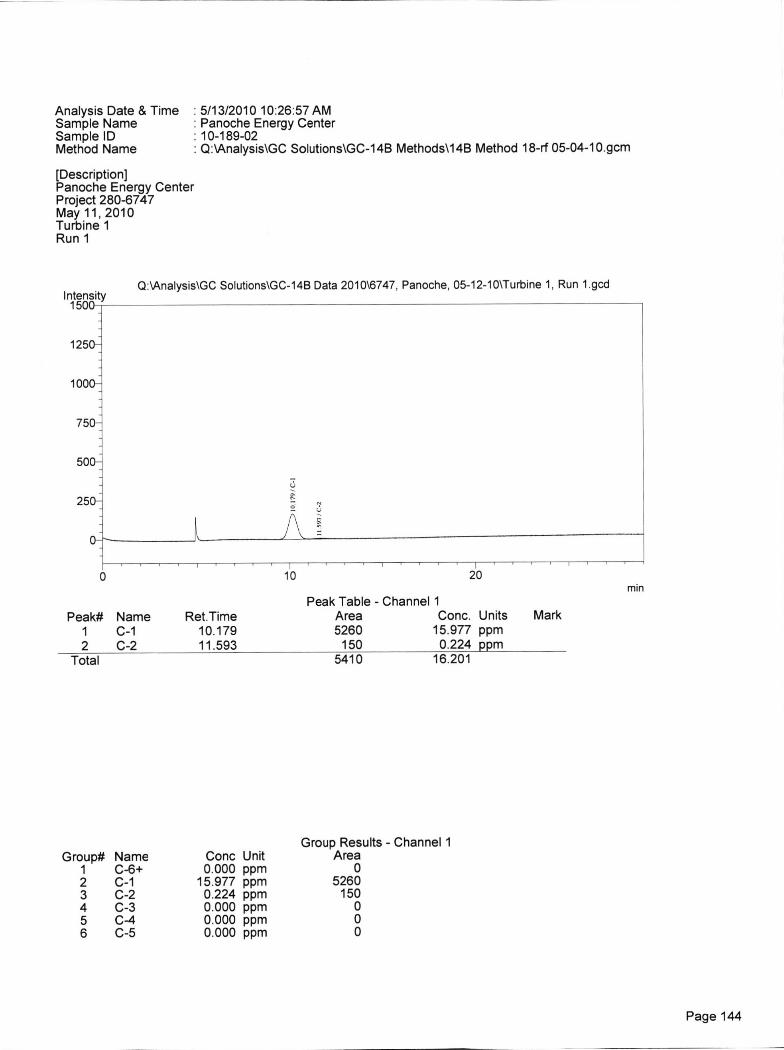
Q:\Analysis\GC Solutions\GC-14B Data 2010\6747, Panoche, 05-12-10\Turbine 1, Run 1.gcdIntensity
150
125
100
75
50
25
Analysis Date & TimeSample NameSample IDMethod Name
[Description]Panoche Energy CenterProject 280-6747May 11, 2010Turbine 1Run 1
5/13/2010 10:26:57 AMPanoche Energy Center10-189-02Q: \Analysis \GC Solutions\GC-14B Methods\14B Method 18-rf 05-04-10.gcm
10 20min
Peak Table - Channel 1Peak# Name Ret.Time Area Conc. Units Mark
1 C-1 10.179 5260 15.977 ppm2 C-2 11.593 150 0.224 ppm
Total 5410 16.201
Group Results - Channel 1Group# Name Conc Unit Are
1 C-6+ 0.000 ppm2 C-1 15.977 ppm 5263 C-2 0.224 ppm 154 C-3 0.000 ppm5 C-4 0.000 ppm6 C-5 0.000 ppm
Page 144
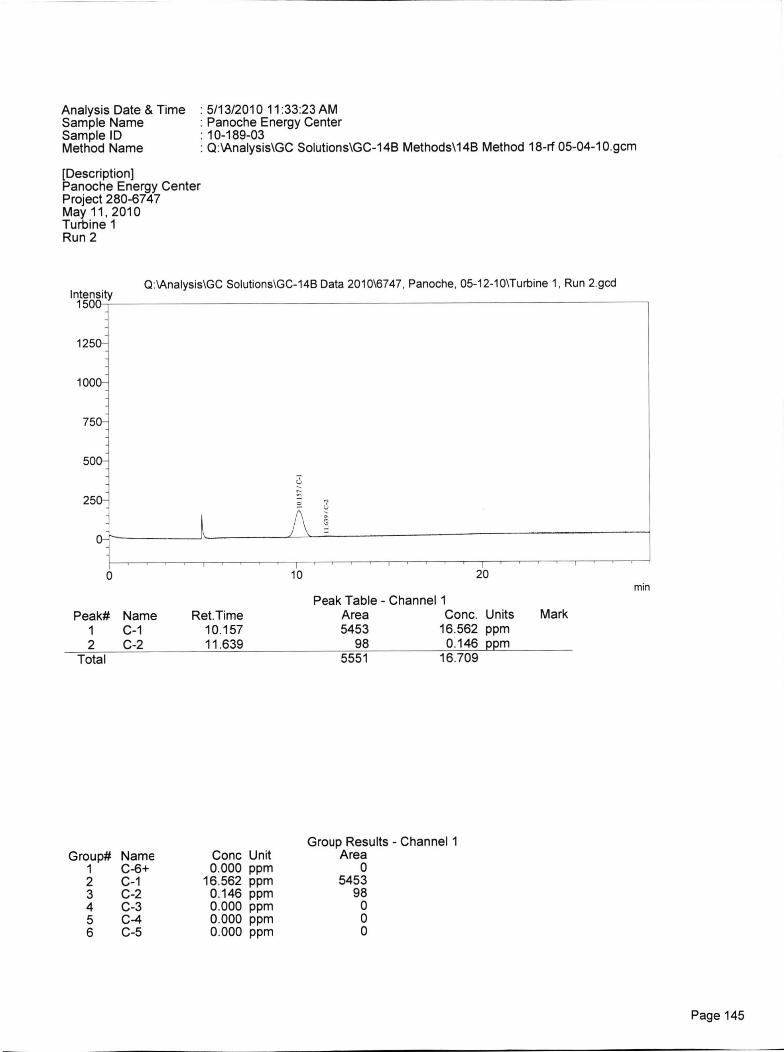
Intensity1500
1250—
1000—
750:
500—
250—
Peak# Name1 C-12 C-2
Total
Ret.Time10.15711.639
Conc. Units Mark16.562 ppm0.146 ppm
Area5453
985551 16.709
Analysis Date & TimeSample NameSample IDMethod Name
5/13/2010 11:33:23 AMPanoche Energy Center
: 10-189-03: a \Analysis\GC Solutions\GC-148 Methods\14B Method 18-rf 05-04-10.gcm
[Description]Panoche Energy CenterProject 280-6747May 11, 2010Turbine 1Run 2
Q:\Analysis\GC Solutions\GC-14B Data 2010\6747, Panoche, 05-12-10\Turbine 1, Run 2.gcd
10
20min
Peak Table - Channel 1
Group Results - Channel 1Area
05453
980
Group# Name1 C-6+2 C-13 C-24 C-35 C-46 C-5
Conc Unit0.000 ppm
16.562 ppm0.146 ppm0.000 ppm0.000 ppm0.000 ppm
Page 145
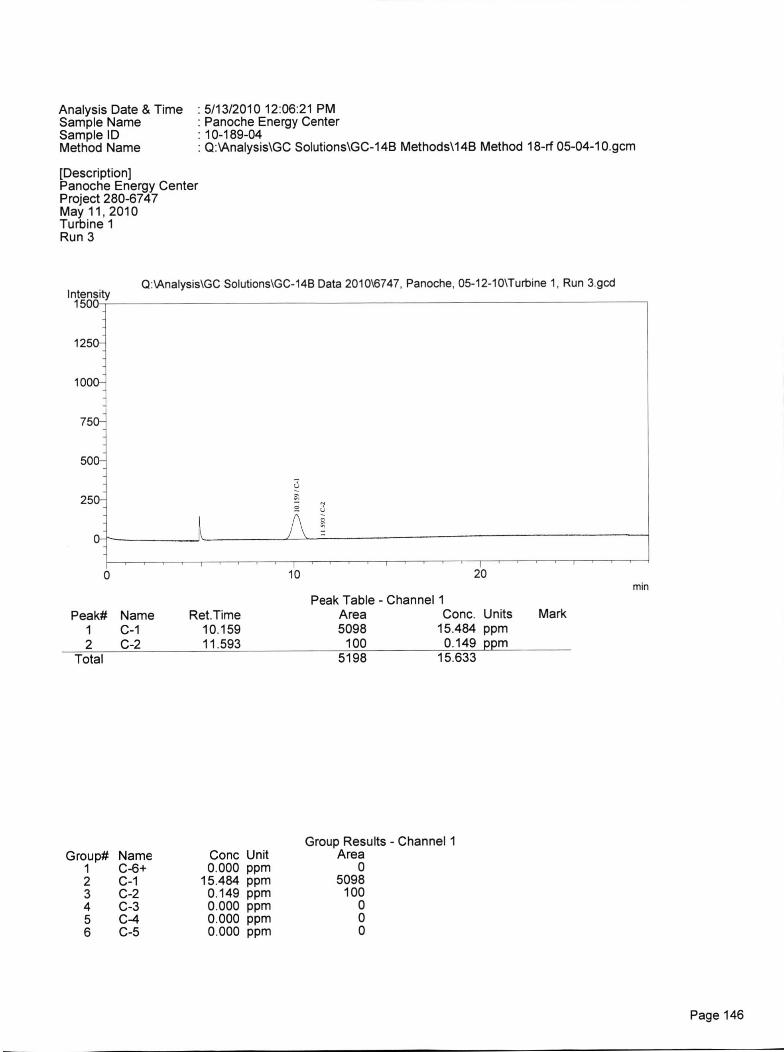
Intensity1500
1250-
250"
Analysis Date & TimeSample NameSample IDMethod Name
5/13/2010 12:06:21 PMPanoche Energy Center
. 10-189-04Q:\Analysis\GC Solutions\GC-14B Methods\14B Method 18-rf 05-04-10.gcm
[Description]Panoche Energy CenterProject 280-6747May 11, 2010Turbine 1Run 3
Q:\Analysis\GC Solutions\GC-148 Data 2010\6747, Panoche, 05-12-10\Turbine 1, Run 3.gccl
10 20
Peak Table - Channel 1min
Peak# Name Ret.Time Area Conc. Units Mark1 C-1 10.159 5098 15.484 ppm2 C-2 11.593 100 0.149 ppm
Total 5198 15.633
Group Results - Channel 1Group# Name Conc Unit Are
1 C-6+ 0.000 ppm2 C-1 15.484 ppm 5093 C-2 0.149 ppm 104 C-3 0.000 ppm5 C-4 0.000 ppm6 C-5 0.000 ppm
Page 146

Quality Assurance
Page 147
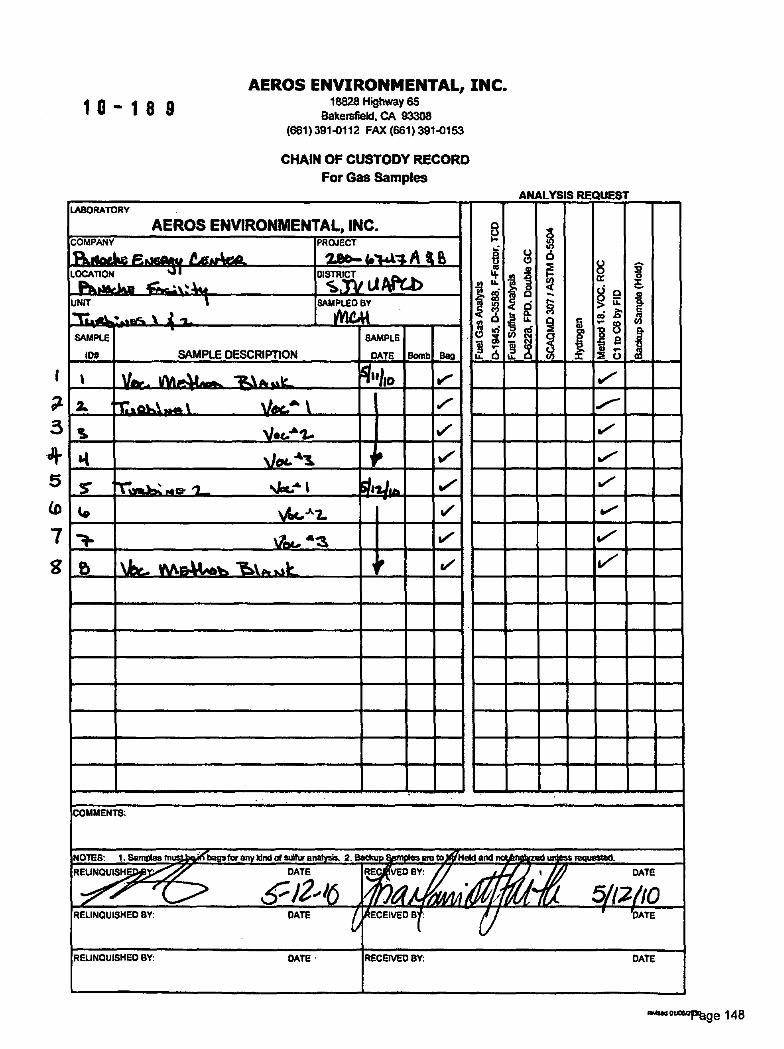
1 0 - 1 8 9AEROS ENVIRONMENTAL, INC.
18828 Highway 65Bakersfield, CA 93308
(661) 391-0112 FAX (661) 391-0163
CHAIN OF CUSTODY RECORD
For Gas SamplesANALYSIS REQUEST
LABORATORY
AEROS ENVIRONMENTAL, INC. 00I-
gItis:...
1 2A6en .
8 iiI.! lit;
82
.0
p
a &8 g1 2
I6
I •
;-..:g31 2f
?C
g 9> u-a .g.- 8I!2 0
Ic.a1
I
COMPANY
iNNotie R4803/ &VAC&
PROJECT
2.eo— 4144 A it 8LOCATION
PlkiOatil chic-101DISTRICTs TV LI WU)
UNIT
T;46,;,,.gc. t 4SAMPLED BY
MC*SAMPLE
IDS , SAMPLE DESCRIPTION
SAMPLE
DATE Bomb Bag
Va. tAc* -SI pa la_ Sli I VP.
1
1/...
2. a-rkwOlp. ta.k t Vitc.a• I ..- ..---
Vog. 41 If , ..•-
V .rrellk,Z 14 G. 1__ qac.:` 1 41210 V V
10 Vec.-&-L I/ be'
1- VIOL. 'Z V iv
\kr- wicAtiek) 16%4"A_ ir v"
•
-1
COMMENTS:
NOTES: I. Samples for kIncl of stew a 2. • • • •a • — ore bo NM and • .,11, • • • . —reqoesd.REUNOUISH
•Id .007 DATE
&/2.0 / 1711'DATE
A. , 5 a loRELINQUISHED BY: DATE 0 I • TEECEIVED B .
REUNOUISHED BY: DATE • RECEIVED BY: DATE
'°12Ptige 148
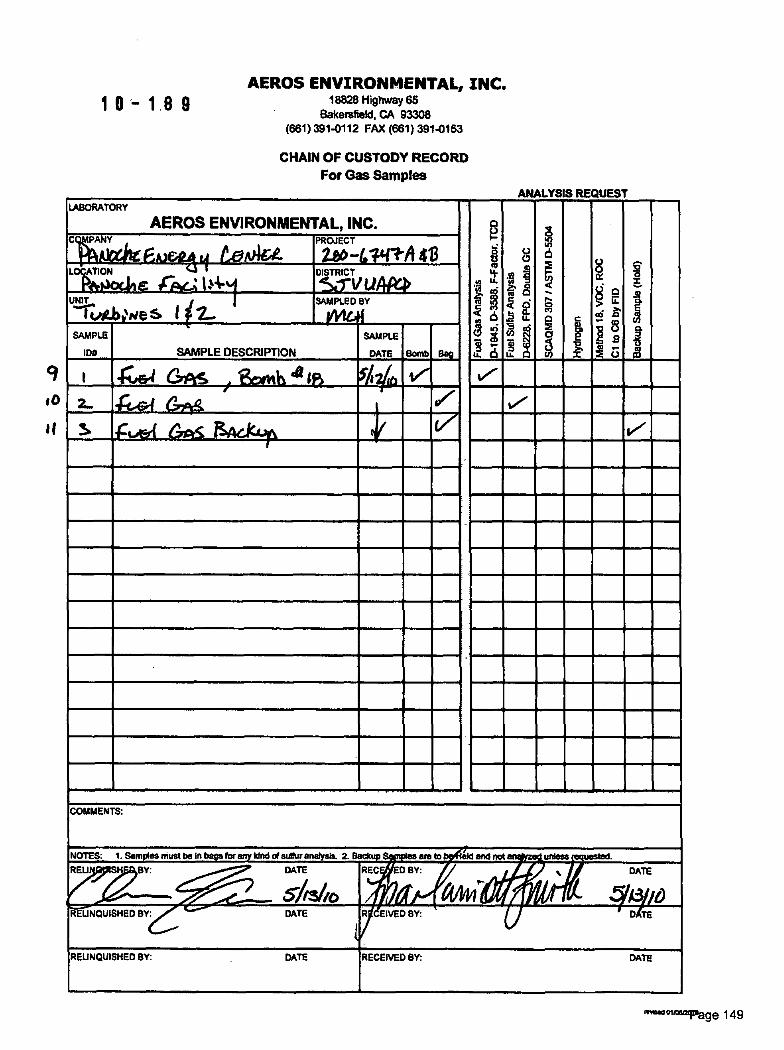
LABORATORY
AEROS ENVIRONMENTAL, INC.0
-1
uo
1 1
8diu.
g2a
5E
isEn
c
1.
8.§. 2
v gi 25'
g..
1
4(I
16, Pri rA ;Id te
FJJEZA 6.1 teAAC4-
PROJECT
20-1,44a-A 413LOCATION
P#610414 AC-A iD o.,STRICTv olio
ii,„t v ,1
SAMPLED
yvitABY
SAMPLE
IDS
i
SAMPLE DESCRIPTION Bag
I ct•Ed GAS in, 11f3t1115 4 51 2A) 17 V
2-
I
464 ang I,
A.Asef ewts Mackie% ti(SVi V
_
. _
_
IMMAVImemanlberwww•
COMMENTS:
7NOTES: 1. Samples must be in bags for any Land of surtur analysis. 2. Backup are to and not . --.,.- • .
BY. 44000.100-RELI DATE
. ' -. 5-tsbo
REC -/ 0 BY:jounless
DATE
t
14lir 4 Add liffati
REUNOUISHED BY: DATE R ' EIVED BY:,
D TE
RELINQUISHED BY: DATE RECEIVED BY: DATE
960
II
1 0 - 1 8 9AEROS ENVIRONMENTAL, INC.
18828 Highway 65Bakersfield, CA 93308
(661 ) 391-0112 FAX (661) 391-0153
CHAIN OF CUSTODY RECORDFor Gas Samples
mt"dmwirtge 149

10-189 AEROS ENVIRONMENTAL, INC.18828 Highway 65
Bakersfield, CA 93308(661) 391-0112 FAX (661) 391-0153
CHAIN OF CUSTODY RECORDFor Liquid/Solid Samples
ANALYSISLABORATORY
AEROS ENVIRONMENTAL, INC. §a
i g.F) gi
a
LI 2ii"g6
§a
49 ic).fp
o
8 g
c°
1 • 8§
, Am2 53
g cl;
. g aS
i-• 2
.i
.2 a
g co'sU QS..6-illi= 2
COMPANY
PAI..14t6 6 1N1(.PROJECT
220- 4141 AOLOCATION
PAsJor4ia 4,6 t 9. 4.)TNT
UNITTool.:0es 1 42.
SAINIATD
SAMPLE
IDS SAMPLE DESCRIPTION
SAMPLE
DATE Fliter
i *12.0 42EirAtri. IS kA tat- 1146 v /
2. k•te.t.. 12410144 'EWA. V." V'
3 r4,& ME41440 Binok VI' 1
4 X-rups-ruab;g0 I AN A I 1,/ 7
5-v. • a
gu,442, .7& 'b 0 Atm, 43 17 A.1
?.. Ilieb4,tr 2-. ,rmiptS & INA 1 51,740 .7V
e•/. a
Pod 42- / .7
A tm 43,11
i/ .---
..
n
COMMENTS:
NOTES. 1 z - • - must be In • - - for any kind at sulfur analysis, 2. :- • : •.7 RELIN • ED BY:
41109r....10"'
DATE
5/13 0
Fr, 0 BY.,
DATE
1i, 1 I I itr.# P • /3 /11-
- 1 NQUISHED BY: DATEIr. CEfVED BY. a
RELINQUISHED BY: DATE RECEIVED BY: DATE
"m""w2npage 150
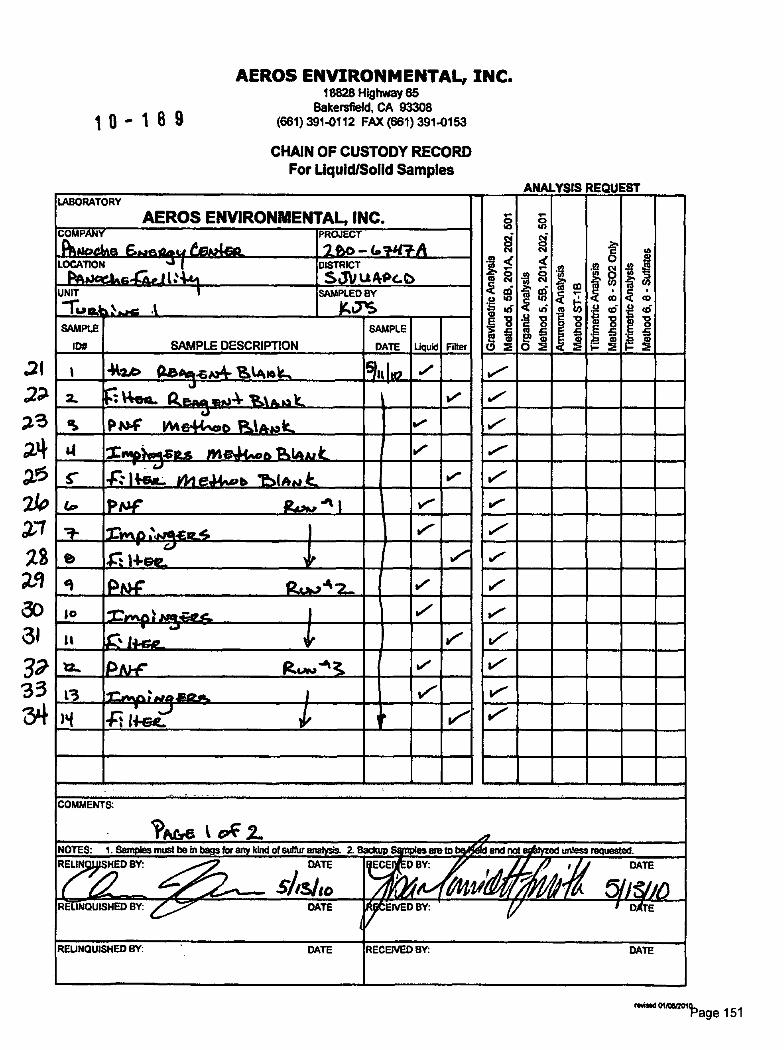
1 0 - 1 8 9
AEROS ENVIRONMENTAL, INC.18828 Highway 65
Bakersfield, CA 93308(661) 391-0112 FAX (661) 391-0153
CHAIN OF CUSTODY RECORDFor Liquid/Solid Samples
.21
2?
AB
2.6
2140
2:7
22,
30
31
3?3334
IS REQUESTLABORATORY
AEROS ENVIRONMENTAL, INC. Eg
-M GC
.; 2"
.0 @
.b wf
i s1
0 2
F2g.4
I2 ERrt ui
.g sEt t
40 2
.g.
.11 2fo. 8
c::,
t .c146
1= g
e
.4 i
t u)c;,
1 (14E 61= g
COMPANY
Phmocine 6,46L4 EJh4ER.PROJECT
lbo-cpwriltDISTRICT
Sal/ U4PC.t•LOCATION
PAOcCIAGAel 1:UNIT
-run, , 1SAMPLED BY
KanSAMPLE
ID*SAMPLE
SAMPLE DESCRIPTION DATE Liquid Filter
I 42,0 O. 4 9111,0 , ..--2. vt.ea.. ft re.14- Vt.1a.i3 k. v*
g& PNC VK — ;,- I :, ge" V
Li v". •/".
C re LNIP,VIMM.M11U vMIIIIIIII II v.111)ffi llI v121FAMINIIIIMIII ..- „--
es 1 .1 . 11. 11 pe v.-to IFIRWM111111111111111111111111111111 le' se'.
II PIWIIIMIMMIHIMI V V
tr.- MaillillEMMIIII be. V
L3 Lillj LIIIIMFM1=111. V 1,"
)4 -Fi 11-ec V V
,COMMENTS:
?Acre t PC 2.NOTES: 1. Samples must be in bags for any kind of sulfbr analysis. 2. Backup am to end not : • unless requested.RELIN SHED BY: DATE
Sh5/10
ECE D BY: DATE,
It idiRELINQUISHED BY: DATE IVED BY: f .
REUNOUISHED BY: DATE RECEIVED BY: DATE
`"" "cw2"ta a g e 151
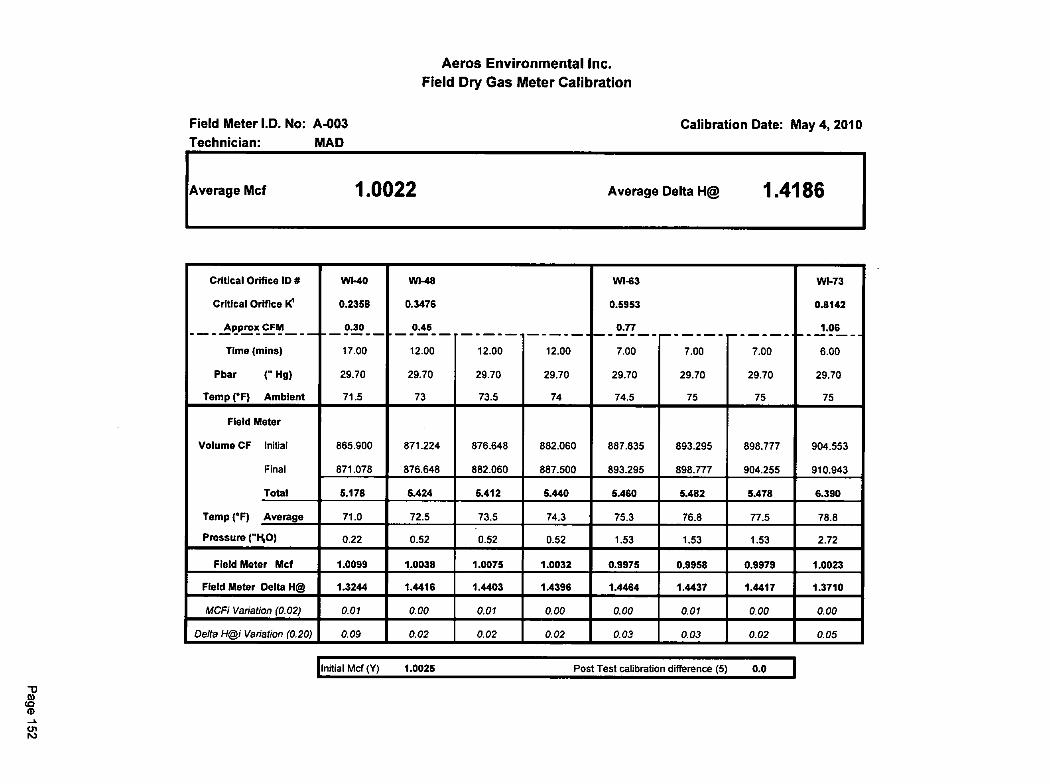
Aeros Environmental Inc.Field Dry Gas Meter Calibration
Field Meter I.D. No: A-003
Calibration Date: May 4, 2010Technician: MAD
Average Mcf
1.0022
Average Delta El@ 1.4186
Critical Orifice ID # WI-40 WI-48 WI-63 WI-73
Critical Orifice HI 0.2358 0.3476 0.5953 0.8142
Appros CFM _ 0.30_ 0.45_ 0.77 1.06
Time (mins) 17.00
.
12.00
_ _ _ _
12.00
_ _
12.00
_ _
7.00
_ _ _
7.00
_ _ _
7.00
_
6.00
Pbar (" Hg) 29.70 29.70 29.70 29.70 29.70 29.70 29.70 29.70
Temp rn Ambient 71.5 73 73.5 74 74.5 75 75 75
Field Meter
Volume CF Initial 865.900 871.224 876.648 882.060 887.835 893.295 898.777 904.553
Final 871.078 876.648 882.060 887.500 893.295 898.777 904.255 910.943
Total 5.178 5.424 6.412 5.440 5.460 5.482 5.478 6.390
Temp ("F) Average 71.0 72.5 73.5 74.3 75.3 76.8 77.5 78.8
Pressure ("KO) 0.22 0.52 0.52 0.52 1.53 1.53 1.53 2.72
Field Meter Mcf 1.0099 1.0038 1.0075 1.0032 0.9975 0.9958 0.9979 1.0023
Field Meter Delta H@ 1.3244 1.4416 1.4403 1.4396 1.4464 1.4437 1.4417 1.3710
MCFi Variation (0.02) 0.01 0.00 0.01 0.00 0.00 0.01 0.00 0.00
, Delta H@i Variation (0.20) _ 0.09 0.02 0.02 0.02 0.03 0.03 0.02 _ 0.05
'Initial Mcf (Y)
1.0025 Post Test calibration difference (5) 0.0 I
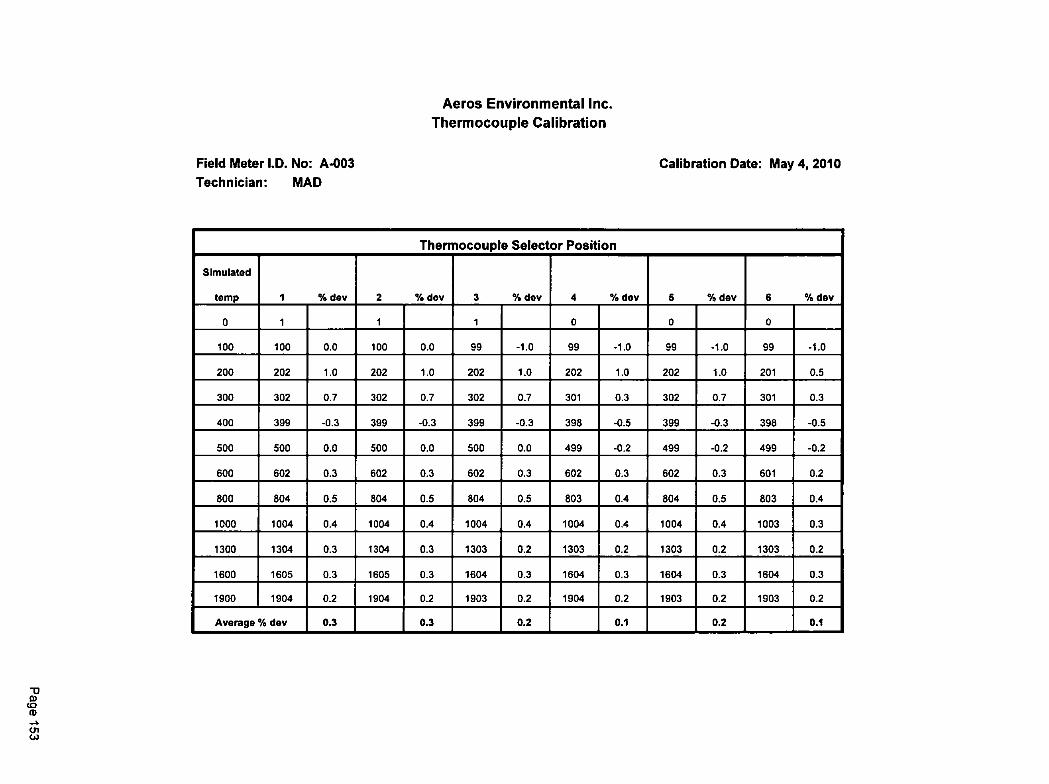
Aeros Environmental Inc.Thermocouple Calibration
Field Meter I.D. No: A-003
Calibration Date: May 4, 2010Technician: MAD
Thermocouple Selector Position
Simulated
temp 1 % dev 2 % dev 3 *A dev 4 % dev 5 % dev 6 % dev
0 1 1 1 0 0 0
100 100 0.0 100 0.0 99 -1.0 99 -1.0 99 -1.0 99 -1.0
200 202 1.0 202 1.0 202 1.0 202 1.0 202 1.0 201 0.5
300 302 0.7 302 0.7 302 0.7 301 0.3 302 0.7 301 0.3
400 399 -0.3 399 -0.3 399 -0.3 398 -0.5 399 -0.3 398 -0.5
500 500 0.0 500 0.0 500 0.0 499 -0.2 499 -0.2 499 -0.2
600 602 0.3 602 0.3 602 0.3 602 0.3 602 0.3 601 0.2
800 804 0.5 804 0.5 804 0.5 803 0.4 804 0.5 803 0.4
1000 1004 0.4 1004 0.4 1004 0.4 1004 0.4 1004 0.4 1003 0.3
1300 1304 0.3 1304 0.3 1303 0.2 1303 0.2 1303 0.2 1303 0.2
1600 1605 0.3 1605 0.3 1604 0.3 1604 0.3 1604 0.3 1604 0.3
1900 1904 0.2 1904 0.2 1903 0.2 1904 0.2 1903 0.2 1903 0.2
Average % dev 0.3 0.3 0.2 0.1 0.2 01
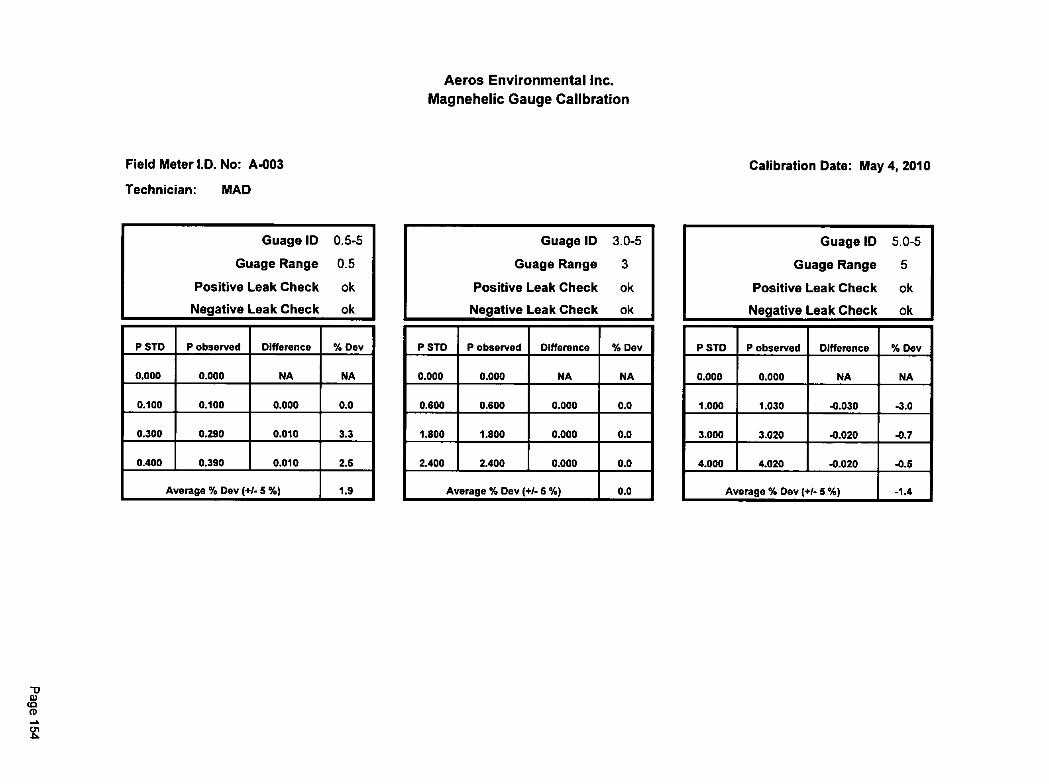
Aeros Environmental Inc.Magnehelic Gauge Calibration
Field Meter I.D. No: A-003
Calibration Date: May 4, 2010
Technician: MAD
Guage ID 0.5-5
Guage Range 0.5
Positive Leak Check ok
Negative Leak Check ok
P STD P observed Difference % Dev
0.000 0.000 NA NA
0.100 0.100 0.000 0.0
0.300 0.290 0.010 3.3
0.400 0.390 0.010 2.6
Average % Dev (+/- 6 %) 1.9
Guage ID 3.0-5
Guage Range 3
Positive Leak Check ok
Negative Leak Check ok
P STD P observed Difference % Dev
0.000 0.000 NA NA
0.600 0.600 0.000 0.0
1.800 1.800 0.000 0.0
2.400 2.400 0.000 0.0
Average % Deo (+/- 5 %) 0.0
Guage ID 5.0-5
Guage Range 5
Positive Leak Check ok
Negative Leak Check ok
P STD P observed Difference % Dev
0.000 0.000 NA NA
1.000 1.030 -0.030 -3.0
3.000 3.020 -0.020 -0.7
4.000 4.020 -0.020 -0.5
Average % Dov (+/- 5 %) -1.4
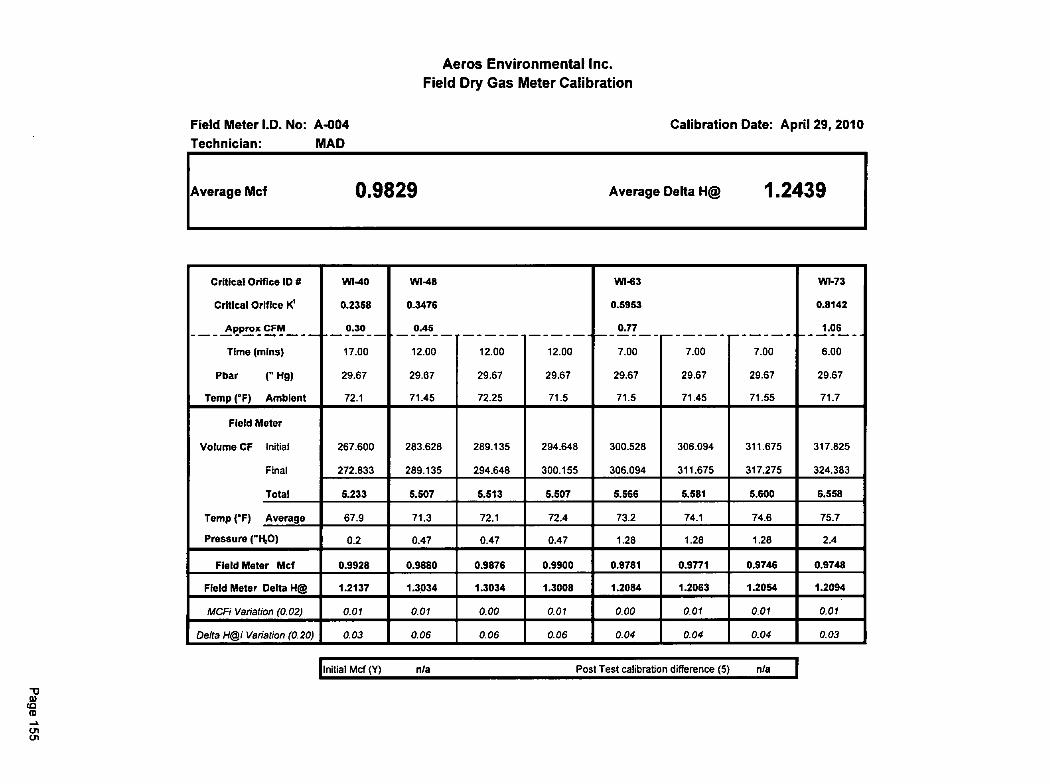
Aeros Environmental Inc.Field Dry Gas Meter Calibration
Field Meter I.D. No: A-004
Calibration Date: April 29, 2010
Technician: MAD
Average Mcf
0.9829
Average Delta I-1@ 1.2439
Critical Orifice ID # WI-40 WI-48 IA11-63 WI-73
Critical Orifice K1 0.2358 0.3476 0.5953 0.8142
Approx CFM 0.30_ 0.45_ 0.77 1.06_
Time (mins) 17.00 12.00
. _ _ _
12.00
_ _
12.00
_ _
7.00
_ . .
7.00
_ _ .
7.00
_ ..
6.00
Pbar (" Hg) 29.67 29.67 29.67 29.67 29.67 29.67 29.67 29.67
Temp ('F) Ambient 72.1 71.45 72.25 71.5 71.5 71.45 71.55 71.7
Field Meter
Volume CF Initial 267.600 283.628 289.135 294.648 300.528 306.094 311.675 317.825
Final 272.833 289.135 294.648 300.155 306.094 311.675 317.275 324.383
Total 5.233 5.507 5.513 5.507 5.566 5.581 5.600 6.558
Temp (°F) Average 67.9 71.3 72.1 72.4 73.2 74.1 74.6 75.7
Pressure ("14,0) 0.2 0.47 0.47 0.47 1.28 1.28 1.28 2.4
Field Meter MCI 0.9928 0.9880 0.9876 0.9900 0.9781 0.9771 0.9746 0.9748
Field Meter Delta H@ 1.2137 1.3034 1.3034 1.3008 1.2084 1.2063 1.2054 1.2094
MCFi Variation (0.02) 0.01 0.01 0.00 0.01 0.00 0.01 0.01 0.01
Delta H@i Variation (0.20) 0.03 0.06 0.06 0.06 0.04 0.04 0.04 0.03
'Initial Mc-f (Y) n/a
Post Test calibration difference (5) n/a
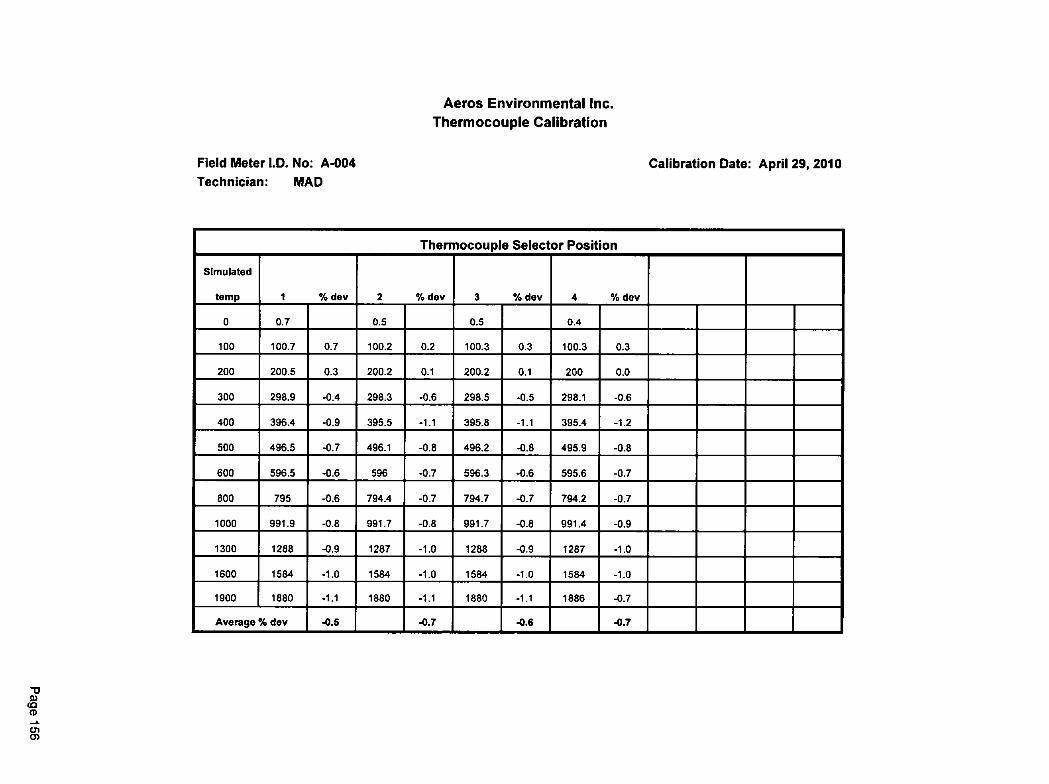
Aeros Environmental Inc.Thermocouple Calibration
Field Meter I.D. No: A-004
Calibration Date: April 29, 2010Technician: MAD
Thermocouple Selector Position
Simulated
temp 1 % dev 2 % dev 3 % dev 4 % dev
0 0.7 0.5 0.5 0.4
100 100.7 0.7 100.2 0.2 100.3 0.3 100.3 0.3
200 200.5 0.3 200.2 0.1 200.2 0.1 200 0.0
300 298.9 -0.4 298.3 -0.6 298.5 -0.5 298.1 -0.6
400 396.4 -0.9 395.5 -1.1 395.8 -1.1 395.4 -1.2
500 496.5 -0.7 496.1 -0.8 496.2 -0.8 495.9 -0.8
600 596.5 -0.6 596 -0.7 596.3 -0.6 595.6 -0.7
800 795 -0.6 794.4 -0.7 794.7 -0.7 794.2 -0.7
1000 991.9 -0.8 991.7 -0.8 991.7 -0.8 991.4 -0.9
1300 1288 -0.9 1287 -1.0 1288 -0.9 1287 -1.0
1600 1584 -1.0 1584 -1.0 1584 -1.0 1584 -1.0
1900 1880 -1.1 1880 -1.1 1880 -1.1 1886 -0.7
Average% dev -0.5 -0.7 -0.6 -0.7
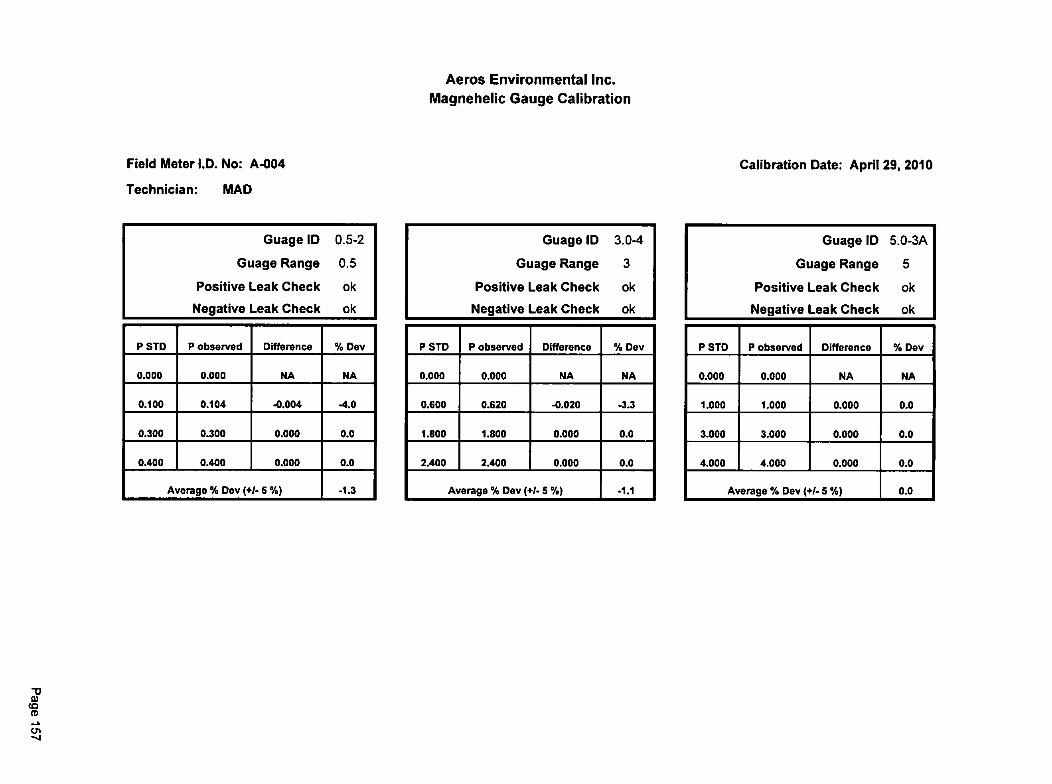
Aeros Environmental Inc.Magnehelic Gauge Calibration
Field Meter ID. No: A-004
Calibration Date: April 29, 2010
Technician: MAD
Guage ID 0.5-2
Guage Range 0.5
Positive Leak Check ok
Negative Leak Check ok
P STD P observed Difference % Dev
0.000 0.000 NA NA
0.100 0.104 -0.004 -4.0
0.300 0.300 0.000 0.0
0.400 0.400 0.000 0.0
Average % Dev OA 5 %) -1.3
Guage ID 3.0-4
Guage Range 3
Positive Leak Check ok
Negative Leak Check ok
P STD P observed Difference % Dev
0.000 0.000 NA NA
0.600 0.620 -0.020 -3.3
1.800 1.800 0.000 0.0
2.400 2.400 0.000 0.0
Average % Dev (+/- 5 %) -1.1
Guage ID 5.0-3A
Guage Range 5
Positive Leak Check ok
Negative Leak Check ok
P STD P observed Difference % Dev
0.000 0.000 NA NA
1.000 1.000 0.000 0.0
3.000 3.000 0.000 0.0
4.000 4.000 0.000 0.0
Average % Dev (+/- 5 %) 0.0
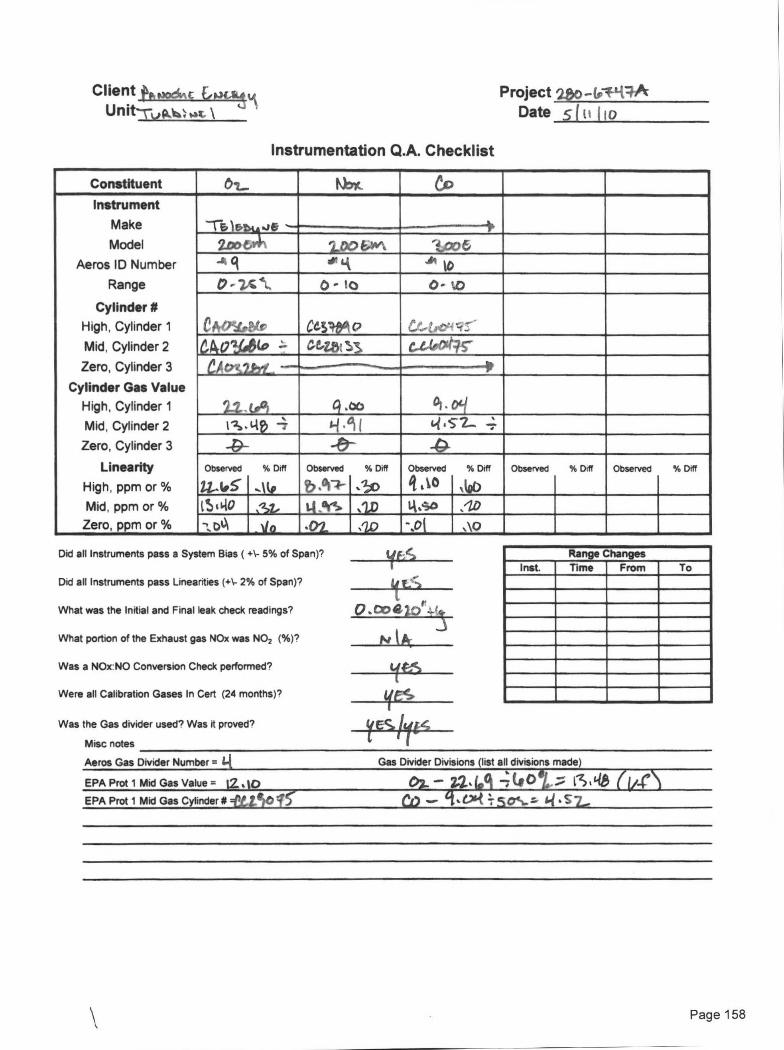
Project 21300-&-T-44ADate 5 (11(10
Instrumentation Q.A. Checklist
Constituent OR-. Nktrir, 6C)Instrument
Make
Model
Aeros ID Number
Range
Cylinder #High, Cylinder 1
Mid, Cylinder 2
Zero, Cylinder 3
Cylinder Gas ValueHigh, Cylinder 1
Mid, Cylinder 2
Zero, Cylinder 3
Linearity
High, ppm or %Mid, ppm or %
Zero, ppm or %
2170 Vii 'Lon E.w. ' too 6al" 14, -AI
tO
I,- 7-s 41, 0 - !0
e Air-1,V c CaSW O C.C.,10ei firC4e2V064, Ge4..BII,..3, e-arpoitqc
CA croilt., —ip
2-2-- tA q .06 or • oil
l'%. 4i) 4 1-1 ‘''i I f-i , 52.- ;-&- -e-- -4
Observed
2-1,..105
% Ore
..Me
ObServed
b A -4-
% DM
,' ;')
Observed
ti ,10% Duff
'LobObserved % Off Observed % DI?
I,'S (4 ,V. 14 ,°r6. s'w 4.so ,lo-,,EA Vo 1,0 - .0 1 ,\O
Did all Instruments pass a System Bias ( •)- 5% of Span)? re-4 Range Changes
Did all Instruments pass Linearities (*\- 2% of Span), uSInst. Time From To
What was the Initial and Final leak check readings?
What portion of the Exhaust gas NOx was NO, (%)? tAt
Was a NOx:NO Conversion Check performed?Lff':5
Were all Calibration Gases In Ced (24 months)?1(6-s
Was the Gas divider used ? Was it proved? rSiitz„MIsc notes
Aeros Gas Divider Number = Gas Divider Divisions (list all divisions made)
EPA Prot 1 Mid Gas Value = tZ .to Op- - 2-2401 (Ot z (1/-nEPA Prot 1 Mid Gas Cylinder # pu.°1015" - ct.t.>4 = sot= 1-1•52.-
Client il306,,E Unit-
Page 158
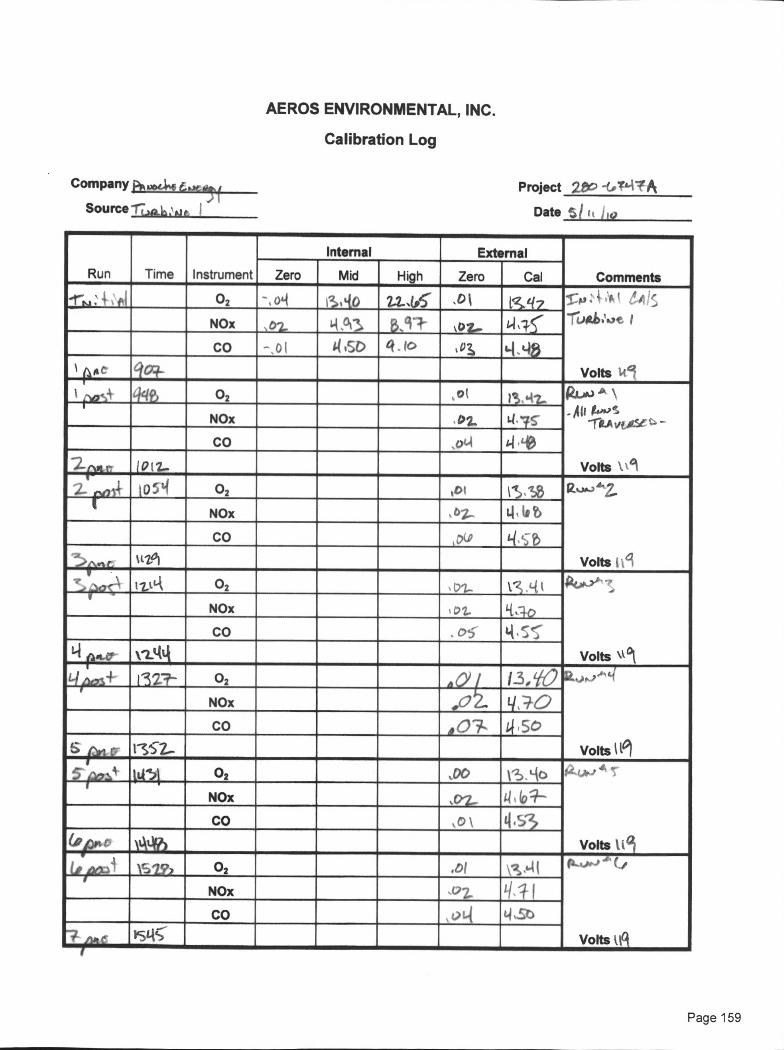
AEROS ENVIRONMENTAL, INC.
Calibration Log
Company p4, 6.,t,,,f Project 28f) -(...T44/A
Source -17,0_6: IE I
Date 51 It )10
Run Time Instrument
Internal External
CommentsZero Mid High Zero Cal
t 02 -, 04 13,qo 12_45 .0 i t,z,_,{7
Tual:oe I
Volts II
NOx tn. N se'l 5,1.1- \ 0 z_ L,1, 3,_c
Li qbco -.01 g ist) q . lo ,U1
pile co-+
1 tw)4 (-MP) 02 of 13,.-12., P4A-*J A \-Al' 1.0.PS
-r-e-Avutse-
Volts lx1
NOx 02. 4.75
CO
-2-pa t IP [ 2-
I o.54 02 ID!
Volts hi
NOx , 07_ 4. tit)
co 0)(1) I-( , 5
%tic)
tak l-k 02 , DI- 1.- .41
Volts \051
NOx '02- q•74-0CO . 05
I-1-(10...t., V2-q14
147)01 4 [32:7- 02 A 01 /3.V0 ".-
Volts lia)
NOx ,O?. 14,40
CO 4 ()-- 0,50.
1-SS-2-
5 - lac, ' 10.% 02 sop v2,. go Peq.op-P 4' 5-
Volts
NOx ,02_ 4 n (04—
CO •01 4.53Al-kh
1%221 02 .ot .\-2) „.41 ra-,,,,A'c,,
111
NOx 'ul 1-1, q ICO , oq 14,..e.,-b
PS
Page 159

Company PAr40(ttc, t rot 1141
Source-rufi.h,t km 1
Project 2249- li741-4.4.
Date';';
AEROS ENVIRONMENTAL, INC.
Calibration Log
Run Time , Instrument
Internal External
CommentsZero Mid High Zero Cal
ylsi- 1 te15" 02 .17,1 13. 140 Kum.' 7-
volts to/
NOx .07 14•(°5CO -,ot 14.56
$ etc 14 413
02 ,o( yz,.,4c• 12.4,,J .1 $
Volts \\(31
INOx ,02.. 1-4 VI
co ,c)S" 14.S
GI re c+-1-11—
gpust lb742 02 ,02. [3 tt'l r&uk)4 d1
Volts 01
NOx %(?1 14'3-(
61,148CO tO2-
02
Volts
NOx
CO
02
Volts
NOx
CO
02
Volts
NOx
CO
02
Volts
NOx
CO
Page 160

Panoche Energy Center
Project 280-6747APanache Facility
May 11, 2010
EPA Method 205Verification of Gas Dilution Systems for Field Instrument Calibrations
Field Evaluation of Divider 4
Evaluation Criteria
Instrument Oxygen AnalyzerTeledyne 200EM
Instrument ID # 9Instrument Range 0-25%High-level Cal Gas Concentration 22.69High-level Gas - Cylinder ID # CA03686Mid-level Calibration Gas Concentration 12.1Mid-level Gas - Cylinder ID # CC29075
Field Evaluation Results
ProcedurePredicted
ConcentrationValue 1
ActualInstrumentResponse
% Differencefrom Average
Response
Average Response% Difference from
Predicted Value
MethodAllowable
% Difference
DilutionSystem Meets
Criteria
50% DilutionDilution Injection 1 11.21 11.16 -0.1% - ±2% YesDilution Injection 2 11.21 11.15 0.0% - ±2% YesDilution Injection 3 11.21 11.14 0.1% - ±2% YesAverage Dilution 11.21 11.15 0.5% ±2% Yes
70% DilutionDilution Injection 1 15.77 15.71 0.0% - ±2% YesDilution Injection 2 15.77 15.71 0.0% - ±2% YesDilution Injection 3 15.77 15.70 0.1% - ± 2% YesAverage Dilution 15.77 15.71 - 0.4% ±2% Yes
Mid-level Gas InjectionsMid-level Gas Injection 1 12.10 12.15 - - - -Mid-level Gas Injection 2 12.10 12.13 - - - -Mid-level Gas Injection 3 12.10 12.13 - - - -Average Mid-level Gas 12.10 12.14 - -0.3% ± 2% Yes
1. Predicted concentration is corrected for viscosity effect of calibration gas
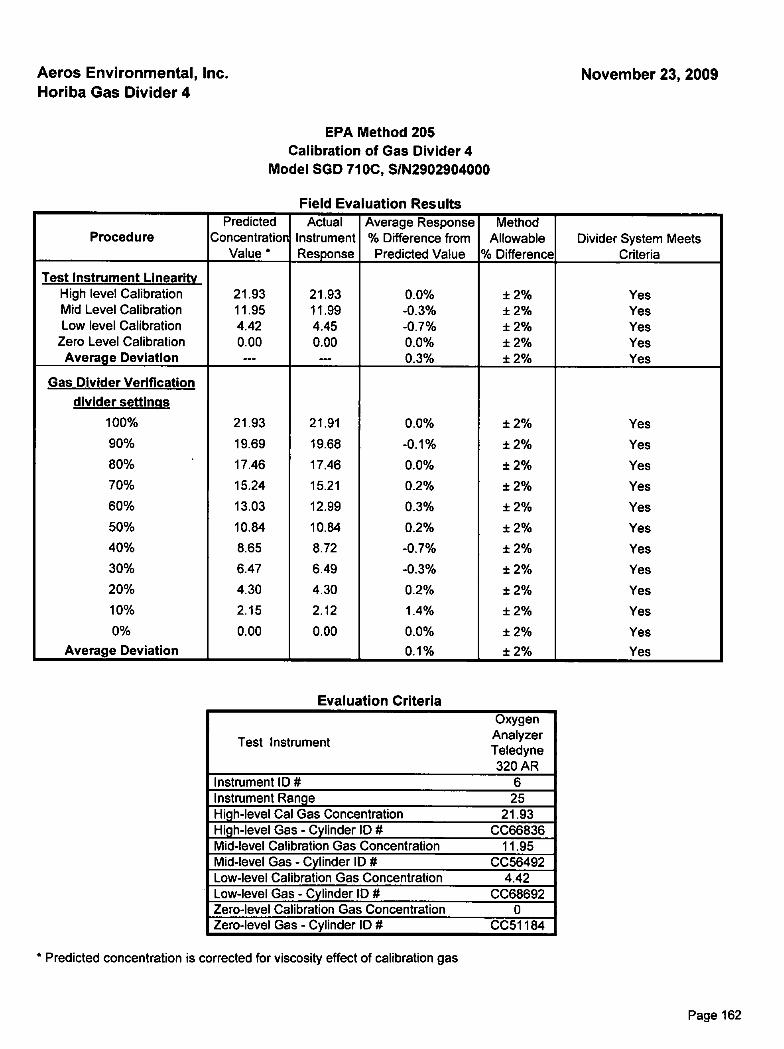
Aeros Environmental, Inc. November 23, 2009Horiba Gas Divider 4
EPA Method 205Calibration of Gas Divider 4
Model SOD 710C, S/N2902904000
Field Evaluation Results
ProcedurePredicted
ConcentrationValue *
ActualInstrumentResponse
Average Response% Difference fromPredicted Value
MethodAllowable
% DifferenceDivider System Meets
Criteria
Test Instrument Linearity21.9311.954.420.00---
21.9311.994.450.00-
0.0%-0.3%-0.7%0.0%0.3%
± 2%± 2%± 2%± 2%± 2%
YesYesYesYesYes
High level CalibrationMid Level CalibrationLow level Calibration
Zero Level CalibrationAverage Deviation
Gas Divider Verification
21.93
19.69
17.46
15.24
13.03
10.84
8.65
6.47
4.30
2.15
0.00
21.91
19.68
17.46
15.21
12.99
10.84
8.72
6.49
4.30
2.12
0.00
0.0%
-0.1%
0.0%
0.2%
0.3%
0.2%
-0.7%
-0.3%
0.2%
1.4%
0.0%
0.1%
±2%
± 2%
±2%
±2%
± 2%
± 2%
± 2%
± 2%
± 2%
±2%
± 2%
± 2%
Yes
Yes
Yes
Yes
Yes
Yes
Yes
Yes
Yes
Yes
Yes
Yes
divider settings
100%
90%
80%
70%
60%
50%
40%
30%
20%
10%
0%
Average Deviation
Evaluation Criteria
Test Instrument
OxygenAnalyzerTeledyne320 AR
Instrument ID # 6Instrument Range 25High-level Cal Gas Concentration 21.93High-level Gas - Cylinder ID # CC66836Mid-level Calibration Gas Concentration 11.95Mid-level Gas - Cylinder ID # CC56492Low-level Calibration Gas Concentration 4.42Low-level Gas - Cylinder ID # CC68692Zero-level Calibration Gas Concentration 0Zero-level Gas - Cylinder ID # CC51184
* Predicted concentration is corrected for viscosity effect of calibration gas
Page 162
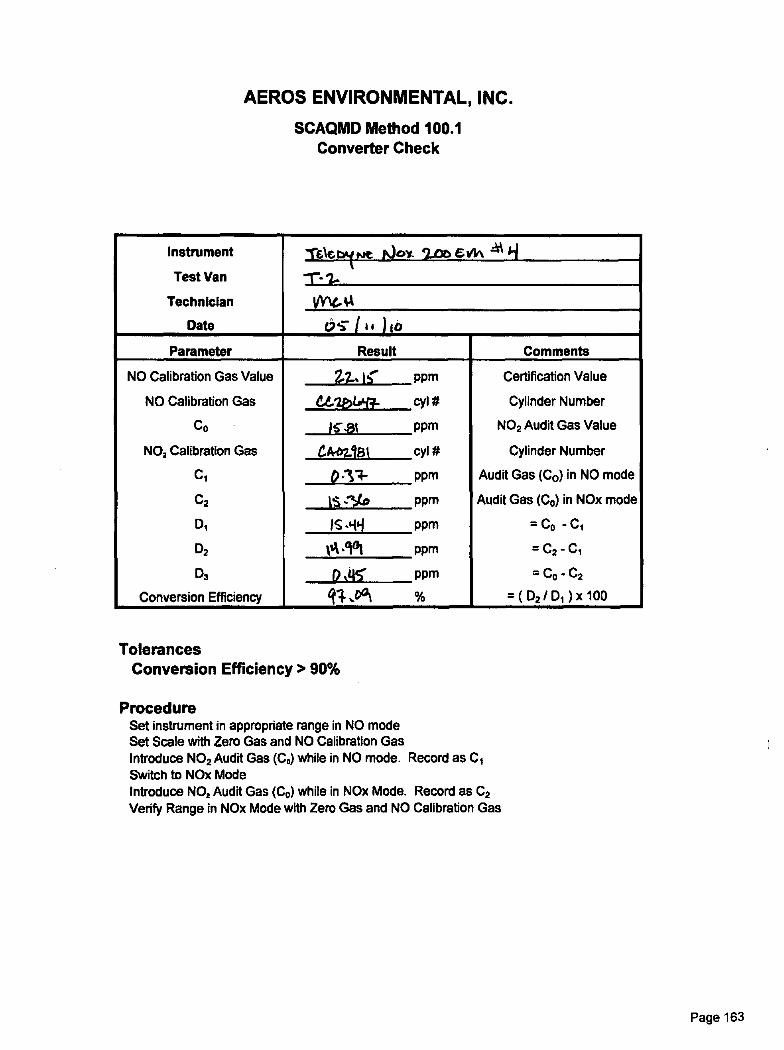
AEROS ENVIRONMENTAL, INC.
SCAQMD Method 100.1Converter Check
Instrument
Test Van
Technician
Date
Teleti we 100v- 2.0a CM 4 Pi
1-- 2-
WV-0
Os- 11# he,
Parameter Result Comments
NO Calibration Gas Value
NO Calibration Gas
Co
NO2 Calibration Gas
C,
C2
D,
D2
D3
Conversion Efficiency
Z7-. S* PPm Certification Value
Cylinder Number
NO2 Audit Gas Value
Cylinder Number
Audit Gas (Co) in NO mode
Audit Gas (Co) in NOx mode
= Co - Ci
= C2 - C1
= Co - C2
_ =(02/D1)x 100
el-abtAr+ cyl #
16-431 ppm
CA-61-98l cyl #
011- PPm
IS `.. OCO ppm
IS •4441 ppm
IA .i°1 PPm
DAT PPm
(0- .C41 %
TolerancesConversion Efficiency > 90%
ProcedureSet instrument in appropriate range in NO modeSet Scale with Zero Gas and NO Calibration GasIntroduce NO2 Audit Gas (C0) while in NO mode. Record as C,Switch to NOx ModeIntroduce NO2 Audit Gas (Co) while in NOx Mode. Record as C2Verify Range in NOx Mode with Zero Gas and NO Calibration Gas
Page 163
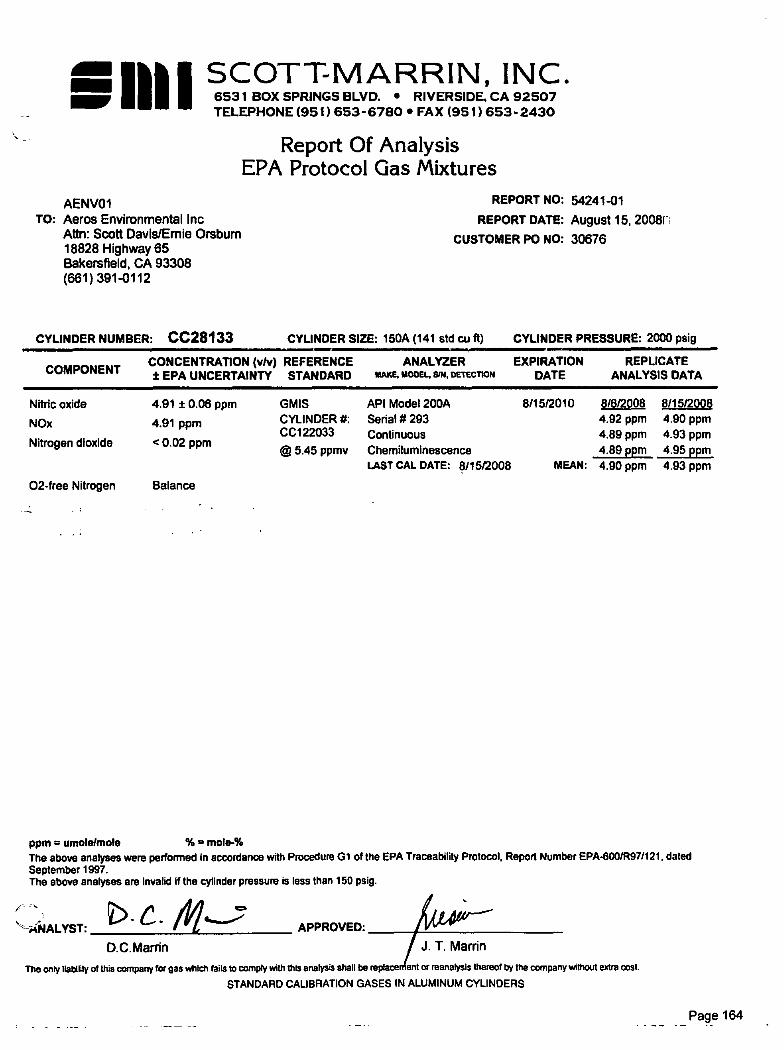
AENVO1TO: Aeros Environmental Inc
Attn: Scott Davis/Ernie Orsbum18828 Highway 65Bakersfield, CA 93308(661) 391-0112
REPORT NO: 54241-01
REPORT DATE: August 15, 20081-i
CUSTOMER PO NO: 30676
SCOTT-MARRIN, INC.IMF mn" 6531 BOX SPRINGS BLVD. • RIVERSIDE, CA 92507
TELEPHONE (951) 653-6780 • FAX (951) 653-2430
Report Of AnalysisEPA Protocol Gas Mixtures
CYLINDER NUMBER: CC28133
CYLINDER SIZE: 150A (141 std cu ft) CYLINDER PRESSURE: 2000 psig
COMPONENTCONCENTRATION (v/v) REFERENCE± EPA UNCERTAINTY STANDARD
ANALYZER EXPIRATION REPLICATEMAKE, MODE., 8/N, DETECTION DATE ANALYSIS DATA
Nitric oxide 4.91 ± 0.08 ppm
NOx 4.91 ppm
Nitrogen dioxide <0.02 ppm
02-free Nitrogen Balance
GMIS API Model 200A 811512010 8/812008 8/1512008CYLINDER #: Serial # 293 4.92 ppm 4.90 ppmCC122033 Continuous 4.89 ppm 4.93 ppm(4) 5.45 ppmv Chemiluminescence 4.89 ppm 4.95 ppm
LAST CAL DATE: 8/15/2008 MEAN: 4.90 ppm 4.93 ppm
ppm umole/mole % mole-%The above analyses were performed in accordance with Procedure G1 of the EPA Traceability Protocol, Report Number EPA-600/R97/121, dated
September 1997.The above analyses are invalid if the cylinder pressure is less than 150 psig.
c. 44,.; APPROVED:
D.C.Marrin J. T. Marrin
The only Itatdlity of this company for gas which fails to comply with this analysis shall be replace ant or reanalysis thereof by the company without extra cost.
STANDARD CALIBRATION GASES IN ALUMINUM CYLINDERS
Page 164
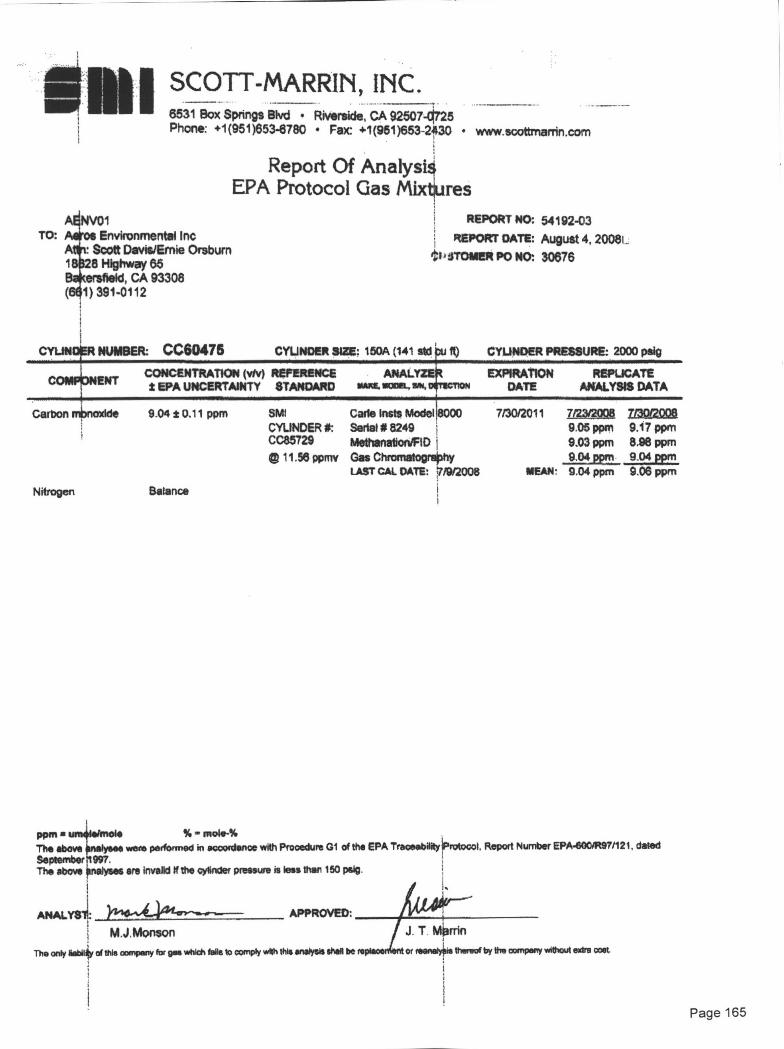
SDI SCOTT-MARRIN, INC.
mi 6531 Box Springs Blvd • Riverside, CA 92507-0725Phone: + 1(951)653-8780 • Fax: +1(951)653-2430 • www.scottmanin.com
AENVO1TO: Aeros Environmental Inc
Att Scott Day is/Emie Orsburn1828 Highway 65Bacersfield, CA 93308
Report Of AnalysisEPA Protocol Gas Mixtpres
REPORT NO: 54192-03
REPORT DATE: August 4, 20081.aTONIER PO NO: 30676
(U
CYLINDER
1) 391-0112
NUMBER: CC60475 CYUNDER SIZE: 150A (141 std ft) CYUNDER PRESSURE: 2000 psig
CONCENTRATION (v/v) REFERENCECOMF1ONENT EPA UNCERTAINTY STANDARDANALYZE
'MAC *OM, IlnriEXPIRATION
DATEREPLICATE
ANALYSIS DATA
Carbon mbnoxide 9.04 ± 0.11 ppm
Nitrogen Balance
SMICYLINDER*:CC85729
11.56 ppmv
Carle lasts ModelSerial # 8249MethanationiFIDGas ChromatographyLAST CAL DATE:
8000
I7/9/2008
7/30/2011
MEAN.
7/23/2M 7/30/20089.05 ppm9.03 ppm9.04ppm
9.17 ppm8.98 ppm9.04 ppm
6.04 ppm 9.06 PPrn
ppm umIs/mol V.- mole-%
The above anslysee were performed in accordance with Procedure 01 of the EPA Traceability iProtocol, Report Number EPA-600R97/12l, datedSeptember II 997.The above analyses are invalid a' the cylinder pressure is less than 150 paig
•
ANALYST!: )144-4-344'••-•-- APPROVED:
I M.J.Monson J. T. Miarrin
The onty Sabi* of this company for gas which falls lo comply with this analysts Own be aoar6nt or retina/yrs thereof by the company Ynthout ortre coat
Page 165

AENVO1TO: Aeros Environmental Inc
Attn: Scott Davis18828 Highway 65Bakersfield, CA 93308(661) 391-0112
REPORT NO: 56845-01
REPORT DATE: January 6, 20100CUSTOMER PO NO: 30842
CONCENTRATION (v/v) REFERENCE ANALYZERI EPA UNCERTAINTY STANDARD MAKE, MODEL. SIN, DETECTlog
EXPIRATION REPLICATEDATE ANALYSIS DATACOMPONENT
I HI SCOTT-MARRIN INC.6531 BOX SPRINGS BLVD. • RIVERSIDE, CA 92507TELEPHONE (951) 653-6780 • FAX (951) 653-2430
Report Of AnalysisEPA Protocol Gas Mixtures
CYLINDER NUMBER: CC37890
CYUNDER SIZE: 150A(141 std cu ft)
CYUNDER PRESSURE: 2000 psig
GMISCYLINDER #:CC63477
© 9.79 ppmv
Nitric oxide
9.00 ± 0.09 ppm
NOx
9.00 ppm
Nitrogen dioxide
<0.04 ppm
02-free Nitrogen Balance
API Model 200ASerial #293ContinuousChemilumlnescenceLAST CAL DATE: 12/28/2009
12/29/2011 12/10/2009 12/29/20098.97 ppm 8.98 ppm8.96 ppm 9.01 ppm8.97 ppm 9.00 ppm
MEAN: 8.97 ppm 9.00 ppm
ppm = umoleirnole % = mole-%The above analyses were performed in accordance with Procedure GI of the EPA Traceability Protocol, Report Number EPA-600/R97/121. datedSeptember 1997.The above analyses are invalid if the cylinder pressure Is less than 150 psig.
ANALYST: APPROVED:
D.C.Marrin J. T. Marrin
The only liability of this company for gas which fails to comply with this analysts shall be re ment or reanalysis thereof by the company without extra cost.
STANDARD CALIBRATION GASES IN ALUMINUM CYLINDERS
Page 166
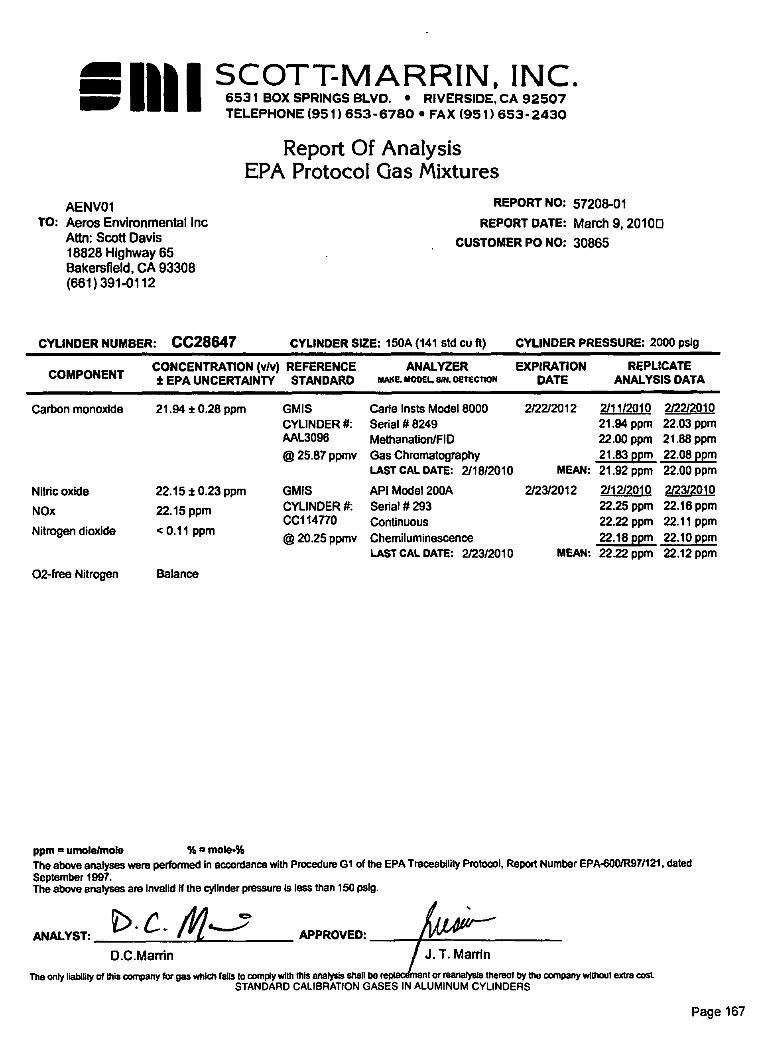
AENVO1TO: Aeros Environmental Inc
Attn: Scott Davis18828 Highway 65Bakersfield, CA 93308(661) 391-0112
REPORT NO: 57208-01
REPORT DATE: March 9, 20100CUSTOMER PO NO: 30865
CONCENTRATION (v/v) REFERENCE ANALYZER
EPA UNCERTAINTY STANDARD MAKE, MODEL, SIN. oerEcnoeEXPIRATION REPLICATE
DATE ANALYSIS DATACOMPONENT
•4111. HI SCOTT-MARRIN, INCImpr I 6531 BOX SPRINGS BLVD. • RIVERSIDE, CA 92507
TELEPHONE (951) 653-6780 • FAX (951) 653- 2430
Report Of AnalysisEPA Protocol Gas Mixtures
CYLINDER NUMBER: CC28647
CYLINDER SIZE: 150A (141 std Cu ft) CYUNDER PRESSURE: 2000 psig
GMISCYLINDER #:AAL3096
© 25.87 ppmv
GMISCYLINDER #:CC114770
@ 20.25 ppmv
Carbon monoxide 21.94 t 0.28 ppm
Nitric oxide
22.15 t 0.23 ppm
NOx
22.15 ppm
Nitrogen dioxide
<0.11 ppm
02-free Nitrogen Balance
Cade Insts Model 8000Serial # 8249Methanation/FIDGas ChromatographyLAST CAL DATE: 2/1812010
API Model 200ASerial # 293ContinuousChemiluminescenceLAST CAL DATE: 2/23/2010
2/22/2012 2/11/2010 2/22/201021.94 ppm 22.03 ppm22.00 ppm 21.88 ppm21.83 ppm 22.08 ppm
MEAN: 21.92 ppm 22.00 ppm
2/23/2012 2/12/2010 7/23/201022.25 ppm 22.16 ppm22.22 ppm 22.11 ppm22.18 ppm 22.10 ppm
MEAN: 22.22 ppm 22.12 ppm
ppm umole/mole %12 mole-%The above analyses were performed In accordance with Procedure G1 of the EPA Traceability Protocol, Report Number EPA-600112971121, datedSeptember 1997.The above analyses are Invalid if the cylinder pressure Is less than 150 psIg.
I,'
D.C.Marrin J. T. MartinANALYST: APPROVED:
The only liability of this company for gas which falls to comply with this analysts Shall be ment or reanalysis thereof by the company without extra cost.STANDARD CALIBRATION GASES IN ALUMINUM CYLINDERS
Page 167
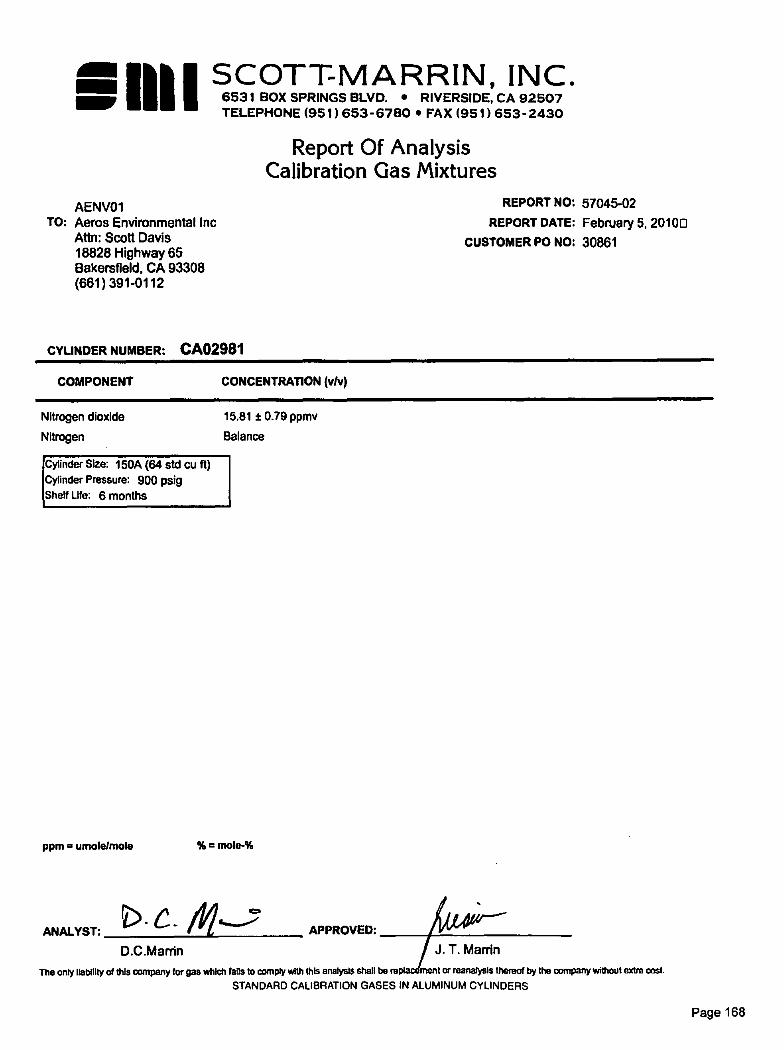
AENVO1TO: Aeros Environmental Inc
Attn: Scott Davis18828 Highway 65Bakersfield, CA 93308(681) 391-0112
REPORT NO: 57045-02
REPORT DATE: February 5, 20100CUSTOMER PO NO: 30861
I HI SCOTT-MARRIN, INC.6531 BOX SPRINGS BLVD. • RIVERSIDE, CA 92507TELEPHONE (951)653-6780 • FAX (951) 653-2430
Report Of AnalysisCalibration Gas Mixtures
CYUNDER NUMBER: CA02981
COMPONENT CONCENTRATION (v/v)
Nitrogen dioxide
15.81 ± 0.79 ppmv
Nitrogen
Balance
Cylinder Size: 150A (64 std Cu ft)Cylinder Pressure: 900 psigShelf Life: 6 months
ppm umole/mote % mote-%
•
ANALYST: c. APPROVED:
D.C.Marrin J. T. Martin
The only liability of this company for gas which fans to comply with this analysis shall bore mentor reanalysis thereof by the company without extra cost.STANDARD CALIBRATION GASES IN ALUMINUM CYLINDERS
Page 168
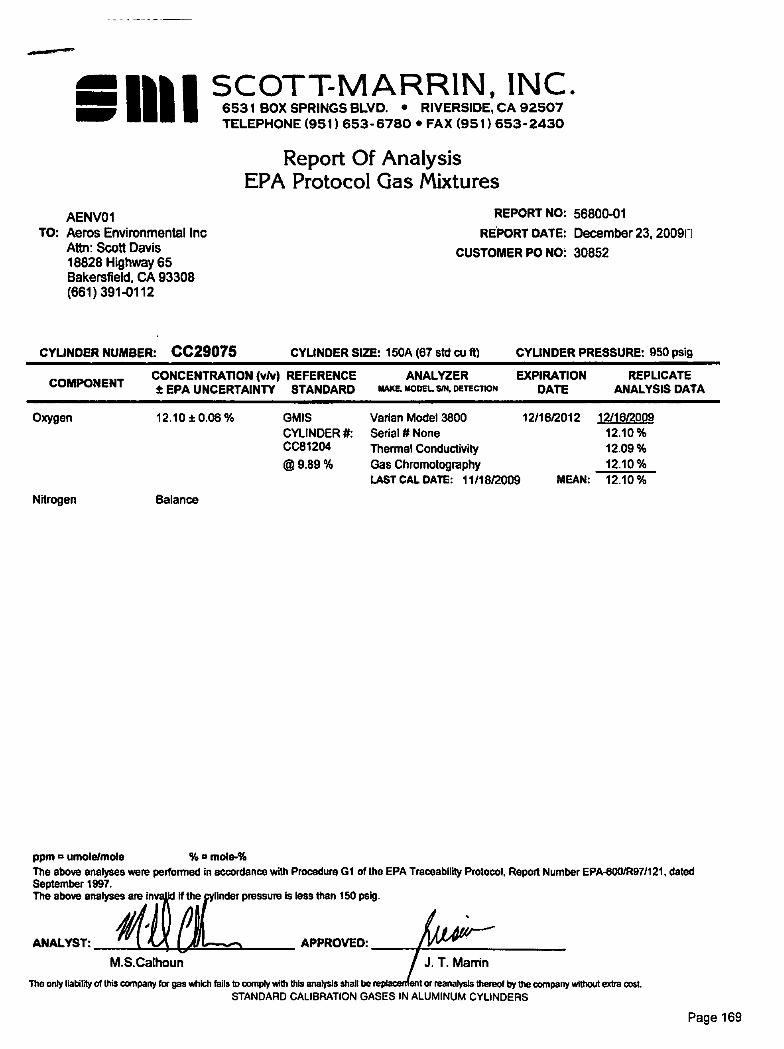
AENVO1TO: Aeros Environmental Inc
Attn: Scott Davis18828 Highway 65Bakersfield, CA 93308(661) 391-0112
REPORT NO: 56800-01
REPORT DATE: December 23, 200911
CUSTOMER PO NO: 30852
CONCENTRATION (v/v) REFERENCE ANALYZER EXPIRATION REPLICATEt EPA UNCERTAINTY STANDARD MAKE. MODEL sm. Derscnon DATE ANALYSIS DATACOMPONENT
ANALYST:
41IMMOO"'""ffl,
"I'III
SCOTT-MARRIN, INC.IIINI 6531 BOX SPRINGS BLVD. • RIVERSIDE, CA 92507
TELEPHONE (951) 653-6780 • FAX (951) 653-2430
Report Of AnalysisEPA Protocol Gas Mixtures
CYLINDER NUMBER: CC29075
CYUNDER SIZE: 150A (67 std cu ft) CYUNDER PRESSURE: 950 psig
Varian Model 3800Serial # NoneThermal ConductivityGas ChromotographyLAST CAL DATE: 11/18/2009
12/16/2012 12/16/200912.10%12.09%12.10%
MEAN: 12.10%
Oxygen
12.10 ± 0.06 % GMISCYLINDER #:CC81204
@ 9.89 %
Nitrogen Balance
ppm = umolermole % mole-%The above analyses were performed in accordance with Procedure GI of the EPA Traceability Protocol, Report Number EPA-8001R971121, datedSeptember 1997.The above analyses are lnvald if the cylinder pressure is less than 150 psig.
M.S.Calhoun J. T. Marvin
APPROVED:
The only liability of this company for gas which fails to comply with this analysis shall be re ant or reanalysis thereof by the company without extra cost
STANDARD CALIBRATION GASES IN ALUMINUM CYLINDERS
Page 169

AENVO1TO: Aeros Environmental Inc
Attn: Scott Davis18828 Highway 65Bakersfield, CA 93308(661) 391-0112
REPORT NO: 57278-04
REPORT DATE: March 18, 20100CUSTOMER PO NO: 30876
•III
SCOTT-MARRIN' INC
ow 6531 BOX SPRINGS BLVD. • RIVERSIDE, CA 92507TELEPHONE (951) 653- 6780 • FAX (951)653- 2430
Report Of AnalysisEPA Protocol Gas Mixtures
CYLINDER NUMBER: CA03686 CYUNDER SIZE: 150A (141 std Cu ft) CYLINDER PRESSURE: 2000 psig
COMPONENTCONCENTRATION (v1v) REFERENCE ANALYZER EXPIRATION REPUCATE± EPA UNCERTAINTY STANDARD MAKE, MODEL, SIN, DETECTION DATE ANALYSIS DATA
Varian Model 3800Serial # NoneThermal ConductivityGas ChromotographyLAST CAL DATE: 3/1/2010
3/11/2013 3/11/201022.68%22.70%22.69%
MEAN: 22.69 %
Oxygen
22.69 0.23 % GMISCYLINDER #:ALM031591
© 24.35 %
Nitrogen Balance
ppm umole/mote %ctmole-%The above analyses were performed in accordance with Procedure G1 of the EPA Traceability Protocol, Report Number EPA-600/R97/121, datedSeptember 1997.The above analyses are inv d if the cylinder pressure is less than 150 psig.
.14M.S.Calhoun J. T. Marrin
ANALYST: APPROVED:
The only liability of this company for gas which fails to comply with this analysis shall be rep/ -mant or reanalysis thereof by the company without extra cost.STANDARD CALIBRATION OASES IN ALUMINUM CYLINDERS
Page 170

COMPANY: Panache Energy Center
UNIT:
Turbines 1 & 2
TEST DATE:
05/11-12/2010
PROJECT:
ANALYSIS DATE:
Marriott-Smith, Labor anager
AEROS ENVIRONMENTAL, INC.LABORATORY ANALYSIS
METHOD 5- GRAVIMETRIC ANALYSIS
280-6747
05/14/2010
Method Blank
PROBE AND NOZZLE WASHDISH #: 56 ALIQUOT: 92/92m1
WEIGHT: #1 #2 AVERAGE
FINAL WEIGHT (g) 70.0581 70.0581 70.0581
INITIAL WEIGHT (g) 70.0581 70.0581
NET WEIGHT (g) 0.0000
FILTERFILTER #: 0140
WEIGHT: #1 #2 AVERAGE
FINAL WEIGHT (g) 0.6272 0.6272 0.6272
INITIAL WEIGHT (g) 0.6272 0.6272
NET WEIGHT (g) 0.0000
CONDENSABLES - AQUEOUSDISH #: 20 ALIQUOT: 4201420m1
WEIGHT: #1 #2 AVERAGE
FINAL WEIGHT (g) 77.7268 77.7270 77.7269
INITIAL WEIGHT (g) 77.7269 77.7269
NET WEIGHT (g) 0.0000
Page 171
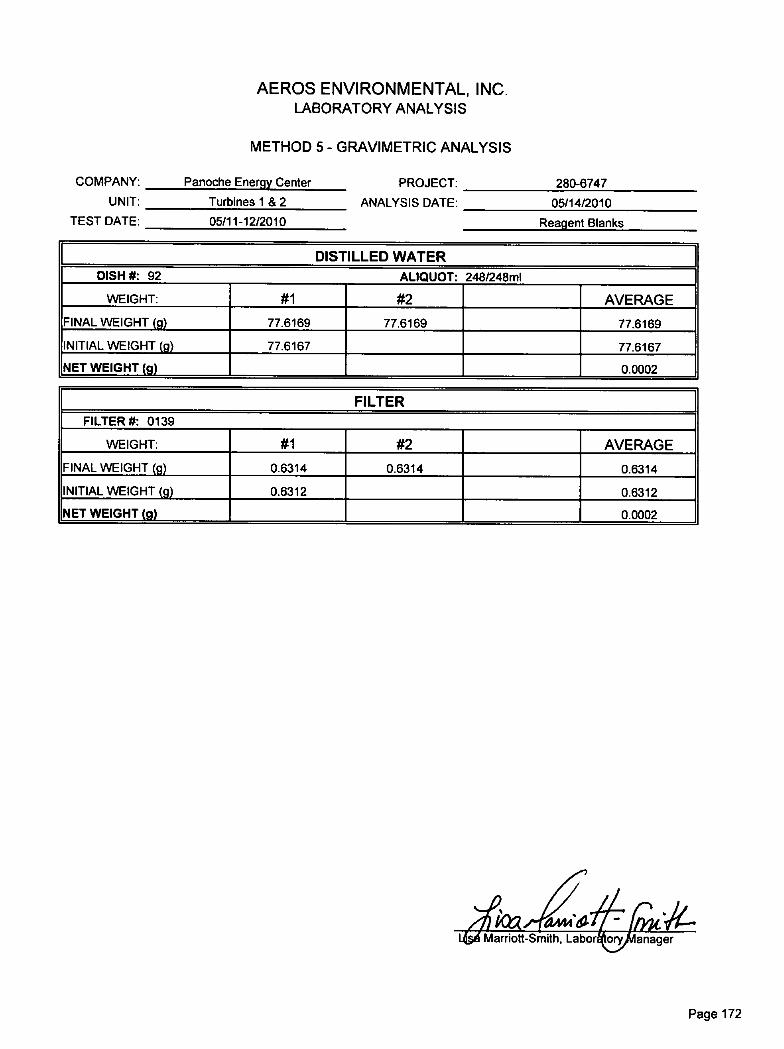
COMPANY: Panoche Energy Center
UNIT:
Turbines 1 & 2
TEST DATE: 05/11-12/2010
PROJECT:
ANALYSIS DATE:
280-6747
05/14/2010
Reagent Blanks
AEROS ENVIRONMENTAL, INC.LABORATORY ANALYSIS
METHOD 5- GRAVIMETRIC ANALYSIS
DISTILLED WATERDISH #: 92 ALIQUOT: 2481248m1
WEIGHT: #1 #2 AVERAGE
FINAL WEIGHT (g) 77.6169 77.6169 77.6169
INITIAL WEIGHT (p) 77.6167 77.6167
NET WEIGHT (g) 0.0002
FILTERFILTER #: 0139
WEIGHT: #1 #2 AVERAGE
FINAL WEIGHT (q) 0.6314 0.6314 0.6314
INITIAL WEIGHT (g) 0.6312 0.6312
NET WEIGHT (g) 0.0002
44#14.4r: jMarriott-Smith, Labor-q1 ianager
Page 172
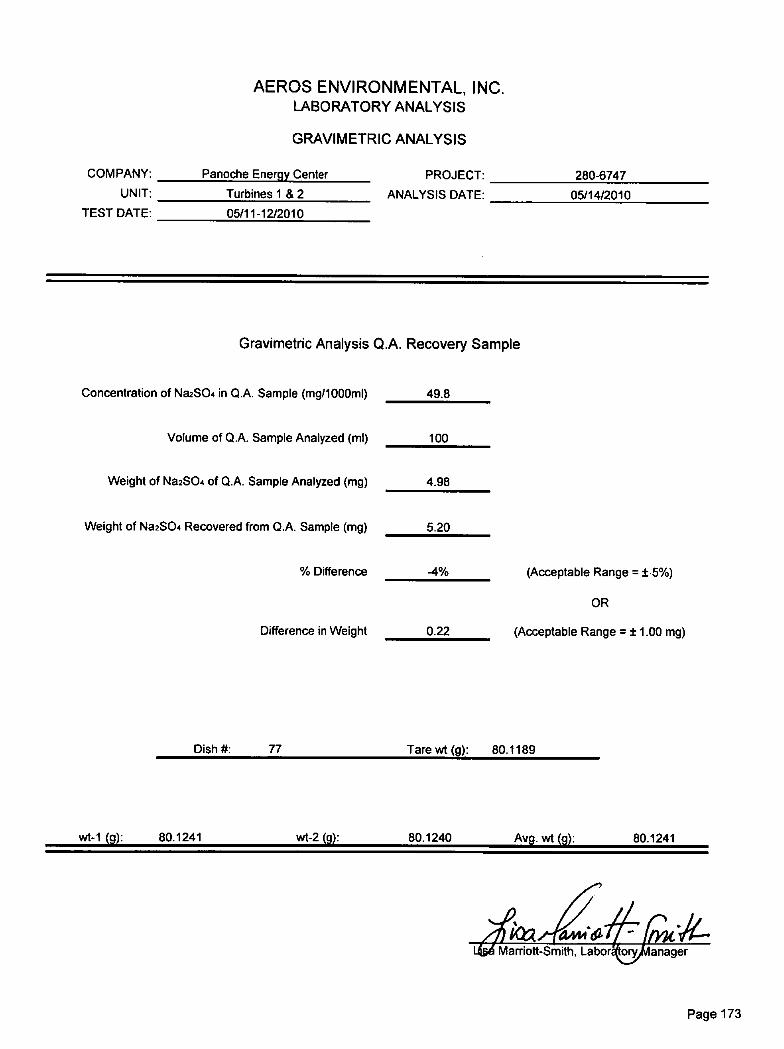
Marriott-Smith, Labor. anager
AEROS ENVIRONMENTAL, INC.LABORATORY ANALYSIS
GRAVIMETRIC ANALYSIS
COMPANY:
Panoche Energy Center
PROJECT: 280-6747
UNIT:
Turbines 1 & 2
ANALYSIS DATE: 05/14/2010
TEST DATE:
05/11-12/2010
Gravimetric Analysis Q.A. Recovery Sample
Concentration of Na2SO4 in Q.A. Sample (mg/1000m1) 49.8
Volume of Q.A. Sample Analyzed (ml) 100
Weight of Na2SO4 of Q.A. Sample Analyzed (mg) 4.98
Weight of Na2SO4 Recovered from Q.A. Sample (mg) 5.20
% Difference -4% (Acceptable Range = ± 5%)
OR
Difference in Weight 0.22 (Acceptable Range = ± 1.00 mg)
Dish #: 77 Tare wt (g): 80.1189
wt-1 (g): 80.1241 wt-2 (g): 80.1240 Avg. wt (g): 80.1241
Page 173
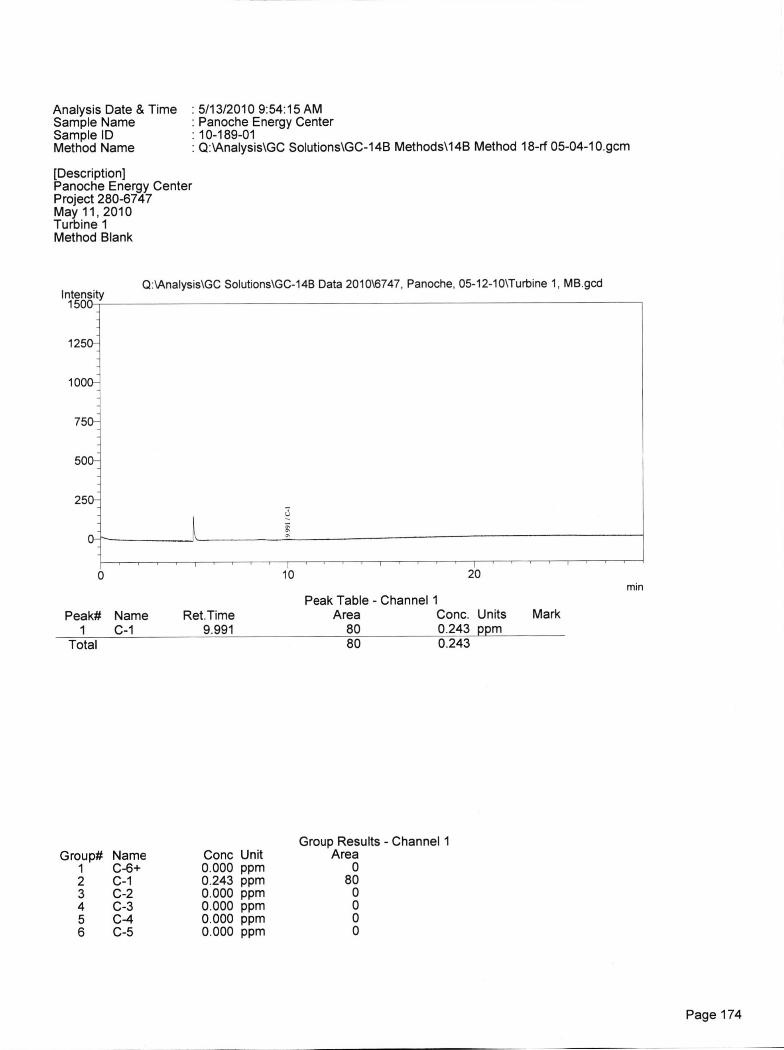
Q:\Analysis\GC Solutions\GC-14B Data 2010\6747, Panoche, 05-12-1 0 \Turbine 1, MB.gcdIntensity
1500
1250-
1000:
750:'
500"
250-
Analysis Date & TimeSample NameSample IDMethod Name
5/13/2010 9:54:15 AMPanoche Energy Center
: 10-189-01: Q:\Analysis\GC Solutions\GC-14B Methods\14B Method 18-rf 05-04-10.gcm
[Description]Panoche Energy CenterProject 280-6747May 11, 2010Turbine 1Method Blank
0 10 20min
Peak Table - Channel 1Peak# Name Ret.Time Area Conc. Units Mark
1_ _C-1 9.991 80 0.243 ppmTotal 80 0.243
Group Results - Channel 1Group# Name Conc Unit Are
1 C-6+ 0.000 ppm2 C-1 0.243 ppm 83 C-2 0.000 ppm4 C-3 0.000 ppm5 C-4 0.000 ppm6 C-5 0.000 ppm
Page 174
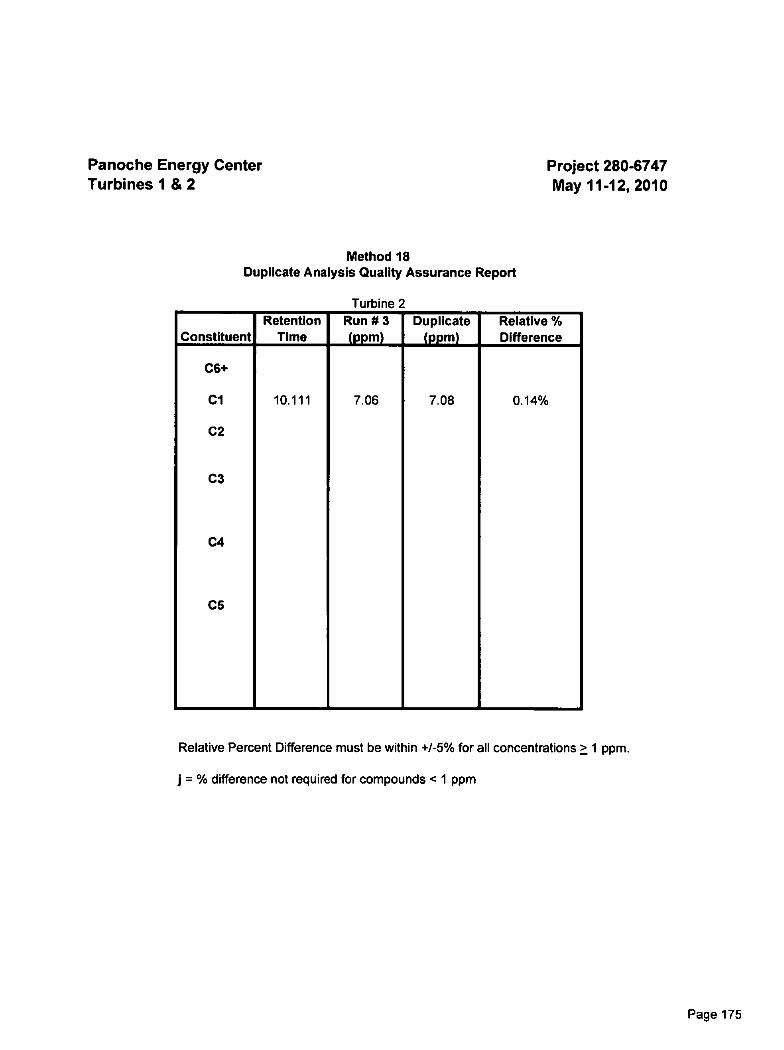
Panoche Energy Center Project 280-6747Turbines 1 & 2
May 11-12, 2010
Method 18Duplicate Analysis Quality Assurance Report
Turbine 2
ConstituentRetention
TimeRun # 3(PPrn)
Duplicate(PPIn)
Relative %Difference
C6+
Cl
C2
C3
C4
CS
10.111 7.06 7.08 0.14%
Relative Percent Difference must be within +/-5% for all concentrations > 1 ppm.
j = % difference not required for compounds < 1 ppm
Page 175
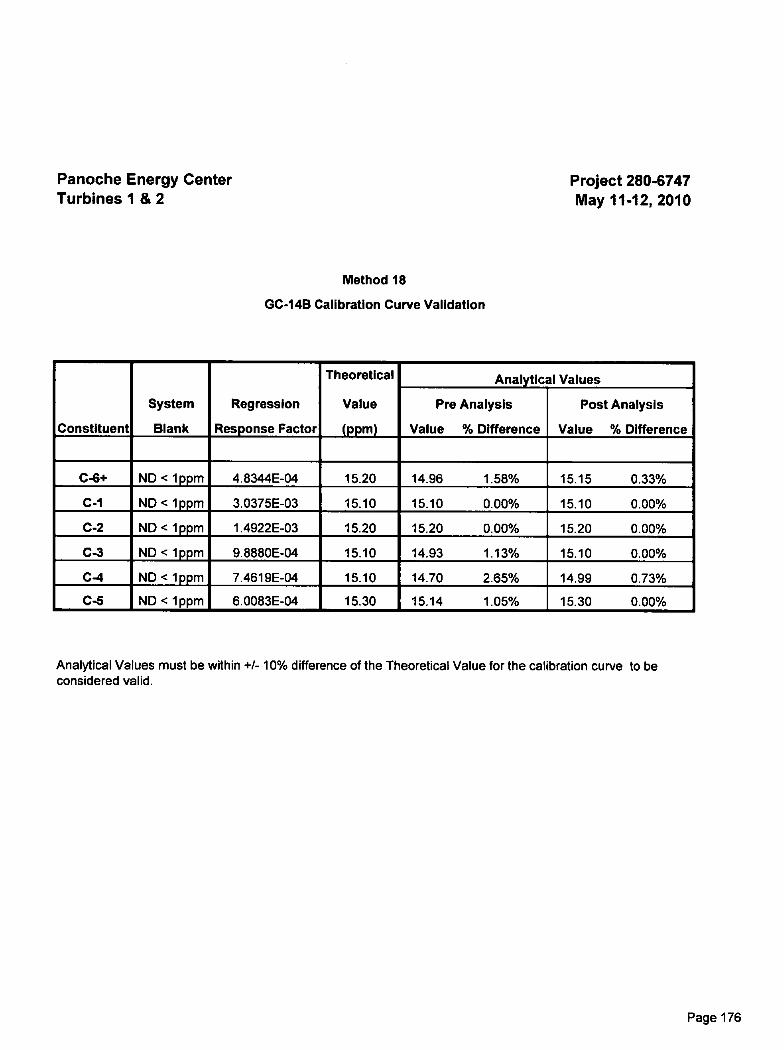
Panoche Energy Center Project 280-6747Turbines 1 2
May 11-12, 2010
Method 18
GC-14B Calibration Curve Validation
Constituent
System
Blank
Regression
Response Factor
Theoretical
Value
(ppm)
Analytical Values
Pre Analysis
Value % Difference
Post Analysis
Value % Difference
C-6+ ND < 1ppm 4.8344E-04 15.20 14.96 1.58% 15.15 0.33%
C-1 ND < 1ppm 3.0375E-03 15.10 15.10 0.00% 15.10 0.00%
C-2 ND < 1ppm 1.4922E-03 15.20 15.20 0.00% 15.20 0.00%
C-3 ND < 1ppm 9.8880E-04 15.10 14.93 1.13% 15.10 0.00%
C-4 ND < 1ppm 7.4619E-04 15.10 14.70 2.65% 14.99 0.73%
C-5 ND < 1ppm 6.0083E-04 15.30 15.14 1.05% 15.30 0.00%
Analytical Values must be within +/- 10% difference of the Theoretical Value for the calibration curve to beconsidered valid.
Page 176
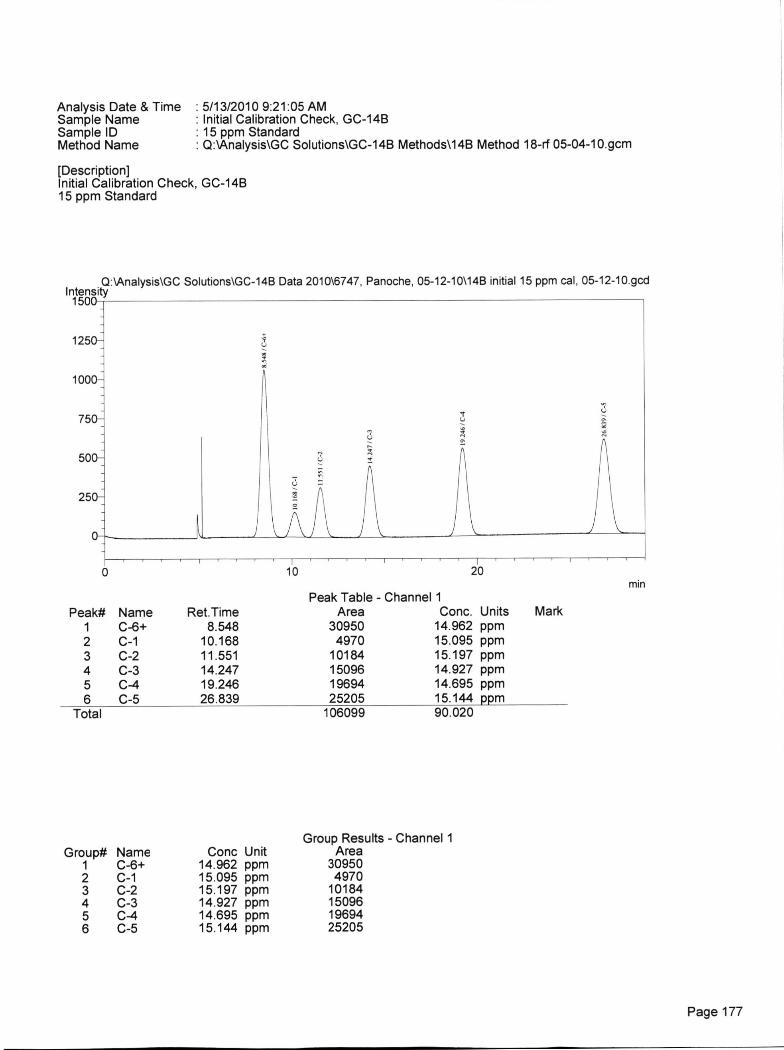
10 20
Analysis Date & TimeSample NameSample IDMethod Name
5/13/2010 9:21:05 AMInitial Calibration Check, GC-14B
. 15 ppm Standard: Q:\Analysis\GC Solutions\GC-14B Methods\14B Method 18-rf 05-04-10.gcm
[Description]Initial Calibration Check, GC-14B15 ppm Standard
Q:\Analysis\GC Solutions\GC-14B Data 2010\6747, Panoche, 05-12-10\14B initial 15 ppm cal, 05-12-10.gcdIntensity
150
125
100
75
50
25
min
Peak Table - Channel 1Peak# Name Ret.Time Area Conc. Units Mark
1 C-6+ 8.548 30950 14.962 ppm2 C-1 10.168 4970 15.095 ppm3 C-2 11.551 10184 15.197 ppm4 C-3 14.247 15096 14.927 ppm5 C-4 19.246 19694 14.695 ppm6 C-5 26.839 25205 15.144 ppm
Total 106099 90.020
Group Results - Channel 1Group# Name Conc Unit Area
1 C-6+ 14.962 ppm 309502 C-1 15.095 ppm 49703 C-2 15.197 ppm 101844 C-3 14.927 ppm 150965 C-4 14.695 ppm 196946 C-5 15.144 ppm 25205
Page 177

Analysis Date & TimeSample NameSample IDMethod Name
5/13/2010 2:53:49 PM: Final Calibration Check, GC-14B: 15 ppm Standard: Q:\Analysis\GC Solutions\GC-14B Methods \14B Method 18-rf 05-04-10.gcm
[Description]Final Calibration Check, GC-14B15 ppm Standard
Q:\Analysis\GC Solutions\GC-1413 Data 2010\6747, Panoche, 05-12-10\1413 final 15 ppm cal, 05-12-10.gcdIntensity
1500
1250—
1000—
750—
500—
250—
Peak#123456
Name0-6+C-1C-2C-3C-4C-5
10
Ret.Time8.566
10.13811.52314.18419.15626.718
20
Peak Table - Channel 1Area Conc Units
31329 15.145 ppm4971 15.100 ppm
10189 15.203 ppm15269 15.098 ppm20084 14.986 ppm25468 15.302 ppm
min
Mark
Total 107310 90.835
Group Results - Channel 1Group# Name Conc Unit Area
1 C-6+ 15.145 ppm 313292 C-1 15.100 ppm 49713 C-2 15.203 ppm 101894 C-3 15.098 ppm 152695 C-4 14.986 ppm 200846 C-5 15.302 ppm 25468
Page 178

Analysis Date & TimeSample NameSample IDMethod Name
5/20/2010 10:21:42 AMInitial Calibration Check, GC-14B
: 15 ppm Standard: Q:\Analysis\GC Solutions\GC-14B Methods\14B Method 18-rf 05-04-10.gcm
[Description]Initial Calibration Check, GC-14B15 ppm Standard
Q:\Analysis\GC Solutions\GC-1413 Data 2010\6747, Panoche, 05-19-10\14B initial 15 ppm cal, 5-19-10.gcdIntensity1500,
1250-
1000-
750-
500-
250-_
10 20
Peak Table - Channel 1min
Peak# Name Ret.Time Area Conc. Units Mark1 C-6+ 8.561 31433 15.196 ppm2 C-1 10.191 4970 15.098 ppm3 C-2 11.596 10187 15.200 ppm4 C-3 14.270 15275 15.104 ppm5 C-4 19.266 20239 15.102 ppm6 C-5 26.872 25468 15.302 ppm
Total 107572 91.001
Group Results - Channel 1Group# Name Conc Unit Area
1 C-6+ 15.196 ppm 314332 C-1 15.098 ppm 49703 C-2 15.200 ppm 101874 C-3 15.104 ppm 152755 C-4 15.102 ppm 202396 C-5 15.302 ppm 25468
Page 179
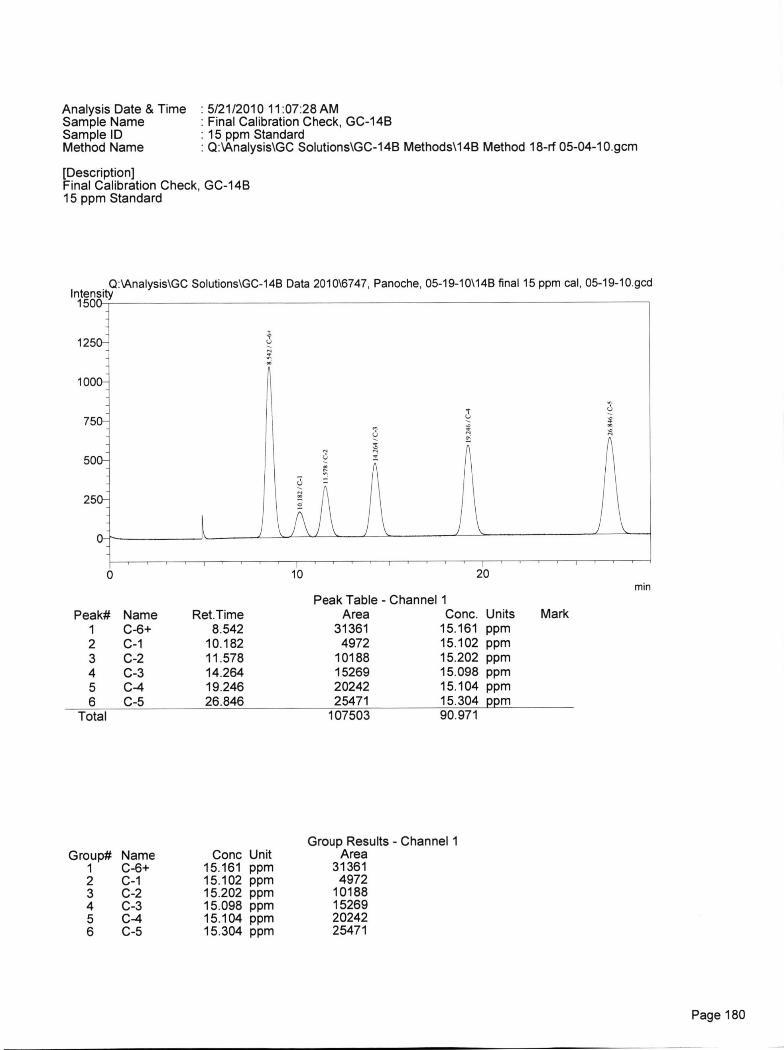
10 20
Analysis Date & Time
5/21/2010 11:07,28 AMSample Name
Final Calibration Check, GC-14BSample ID
15 ppm StandardMethod Name
QAAnalysis\GC Solutions\GC-14B Methods\143 Method 18-rf 05-04-10.gcm
[Description]Final Calibration Check, GC-14B15 ppm Standard
Q:\Analysis\GC Solutions\GC-14B Data 2010\6747, Panoche, 05-19-10\1413 final 15 ppm cal, 05-19-10.gcdIntensity
150
125
100
75
50
25
Peak Table - Channel 1min
Peak# Name Ret.Time Area Conc. Units Mark1 C-6+ 8.542 31361 15.161 ppm2 C-1 10.182 4972 15.102 ppm3 C-2 11.578 10188 15.202 ppm4 C-3 14.264 15269 15.098 ppm5 C-4 19.246 20242 15.104 ppm6 C-5 26.846 25471 15.304 ppm
Total 107503 90.971
Group Results - Channel 1Group# Name Conc Unit Area
1 C-6+ 15.161 ppm 313612 C-1 15.102 ppm 49723 C-2 15.202 ppm 101884 C-3 15.098 ppm 152695 C-4 15.104 ppm 202426 C-5 15.304 ppm 25471
Page 180
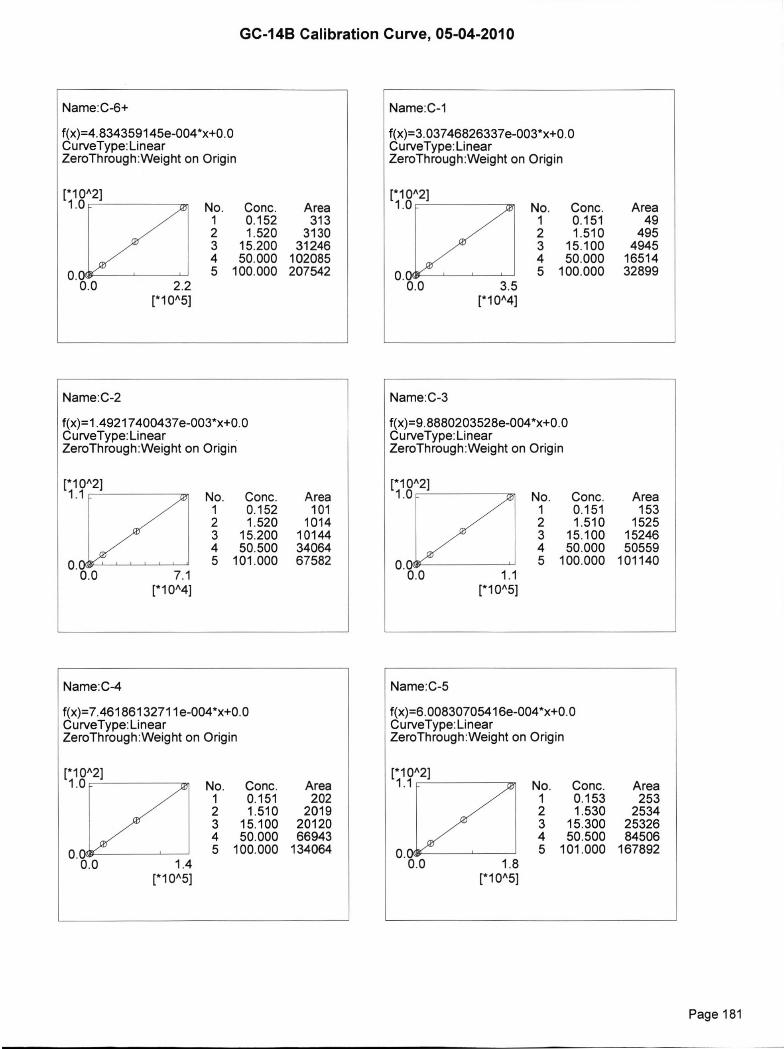
Name:C-6+
f(x)=4.834359145e-004*x+0.0CurveType:LinearZeroThrough:Weight on Origin
No. Conc. Area1 0.152 3132 1.520 31303 15.200 312464 50.000 1020855 100.000 207542
Name: C-1
f(x)=3.03746826337e-003*x+0.0CurveType:LinearZeroThrough:Weight on Origin
No. Conc. Area1 0.151 492 1.510 4953 15.100 49454 50.000 165145 100.000 32899
Name:C-3
f(x)=9.8880203528e-004*x+0.0CurveType:LinearZeroThrough:VVeight on Origin
Area101
10141 0144
r10^211.0 No. Conc.
1 0.1512 1.5103 15.100
Area153
152515246
34064 4 50.000 5055967582 5 100.000 101140o.
00 1.1[*10^5]
Name:C-5
f(x)=6.00830705416e-004*x+0.0CurveType:LinearZeroThrough:Weight on Origin
r10^21Area 1.1 No. Conc. Area202 1 0.153 253
2019 2 1.530 253420120 3 15.300 2532666943 4 50.500 84506
134064 0. 5 101.000 16789200 1.8
[*10^5]
Name:C-4
[*10^5]
f(x)=7.46186132711e-004*x+0.0CurveType:LinearZeroThrough:Weight on Origin
No. Conc.1 0.1512 1.5103 15.1004 50.0005 100.000
Name:C-2
f(x)=1.49217400437e-003*x+0.0CurveType:LinearZeroThrough:Weight on Origin
No. Conc.1 0.1522 1.5203 15.2004 50.5005 101.000
[*10^4]
GC-14B Calibration Curve, 05-04-2010
Page 181
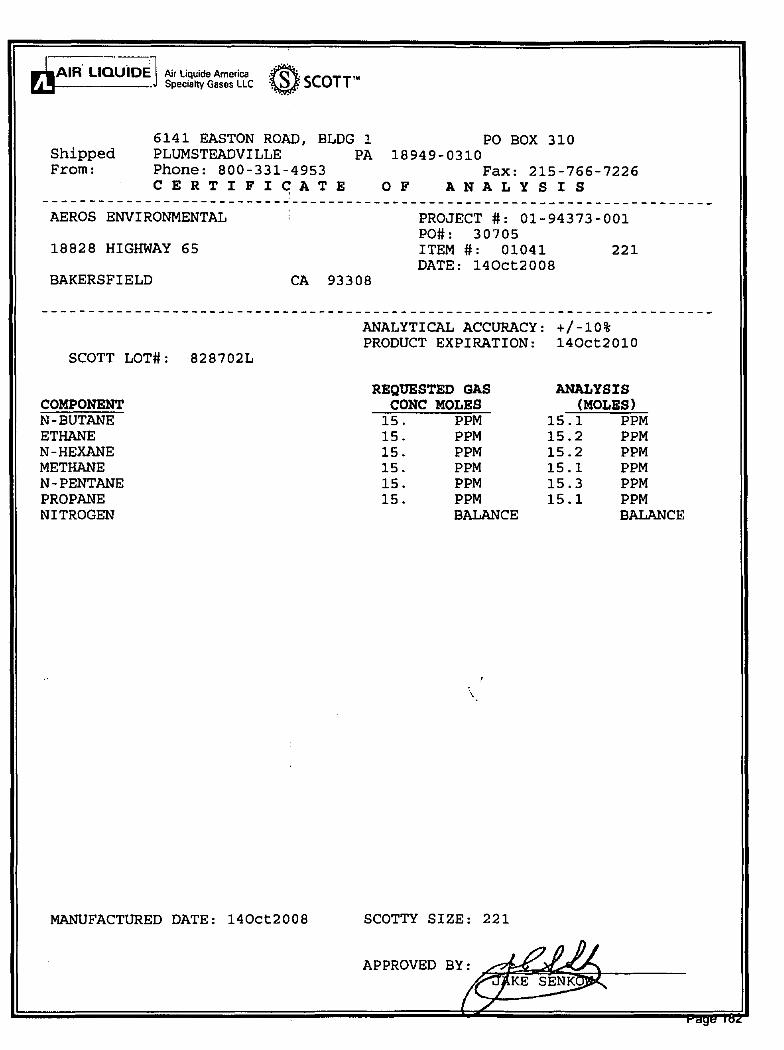
AIR LIQUIDE1 AirLiquideAmerica : SCOTT SpeciadyGasesLLC -•..•
ShippedFrom:
6141 EASTON ROAD, BLDG 1 PO BOX 310PLUMSTEADVILLE PA 18949-0310Phone: 800-331-4953 Fax: 215-766-7226CERTIFICATE OF ANALYSIS
AEROS ENVIRONMENTAL
PROJECT #: 01-94373-001PO#: 30705
18828 HIGHWAY 65
ITEM #: 01041
221DATE: 140ct2008
BAKERSFIELD
CA 93308
SCOTT LOT#: 828702L
ANALYTICAL ACCURACY:PRODUCT EXPIRATION:
REQUESTED OAS
+/-10%140ct2010
ANALYSISCOMPONENT CONC MOLES (MOLES)N-BUTANE 15. PPM 15.1 PPMETHANE 15. PPM 15.2 PPMN-HEXANE 15. PPM 15.2 PPMMETHANE 15. PPM 15.1 PPMN-PENTANE 15. PPM 15.3 PPMPROPANE 15. PPM 15.1 PPMNITROGEN BALANCE BALANCE
MANUFACTURED DATE: 140ct2008 SCOTTY SIZE: 221
APPROVED BY:KE SENK
rage oz
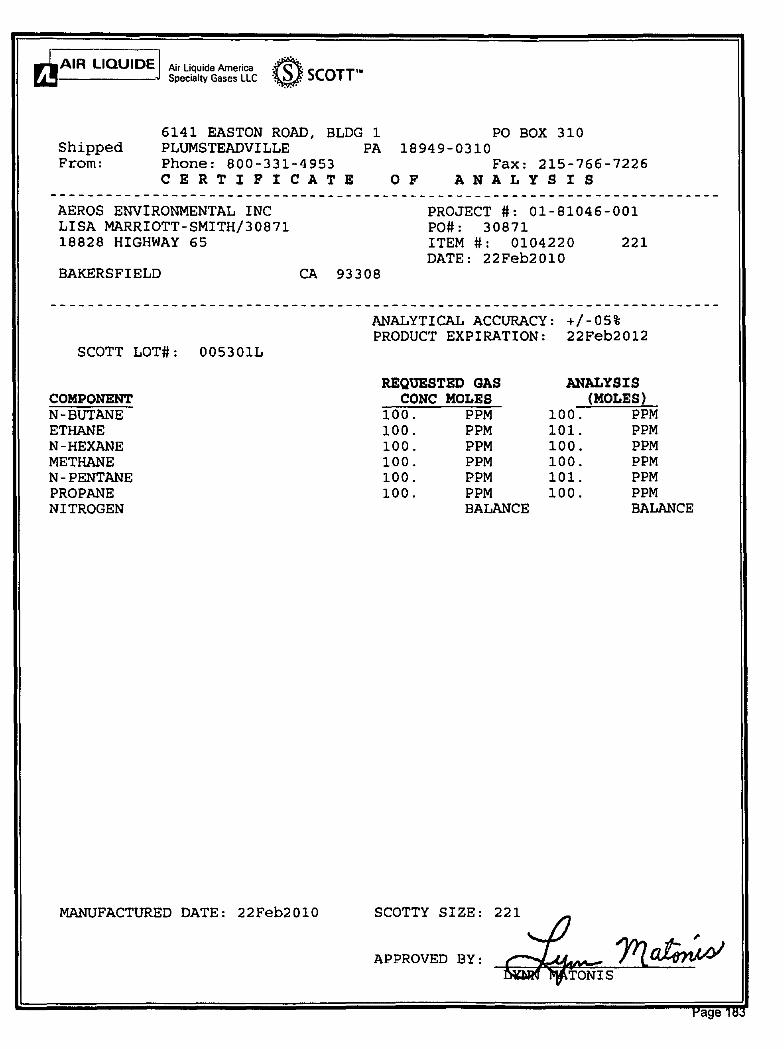
100. PPM 100. PPM100. PPM 101. PPM100. PPM 100. PPM100. PPM 100. PPM100. PPM 101. PPM100. PPM 100. PPM
BALANCE BALANCE
ANALYSIS(MOLES)
REQUESTED GASCONC MOLESCOMPONENT
N-BUTANEETHANEN-HEXANEMETHANEN-PENTANEPROPANENITROGEN
MANUFACTURED DATE: 22Feb2010 SCOTTY SIZE: 221
aten:i4/APPROVED BY:
AIR LIQUIDE j Air Liquide America 0 SCOTT'Ira
Specialty GGasesGasesLLC %• • • • .,
6141 EASTON ROAD, BLDG 1 PO BOX 310Shipped
PLUMSTEADVILLE PA 18949-0310From: Phone: 800-331-4953 Fax: 215-766-7226
CERTIFICATE OF ANALYSIS
AEROS ENVIRONMENTAL INC
PROJECT #: 01-81046-001LISA MARRIOTT-SMITH/30871
PO4: 3087118828 HIGHWAY 65
ITEM #: 0104220 221DATE: 22Feb2010
BAKERSFIELD CA 93308
ANALYTICAL ACCURACY: +1-05%PRODUCT EXPIRATION: 22Feb2012
SCOTT LOT#: 005301L
Page 13
Source Test Protocol (Partial)/ Correspondence
Page 184
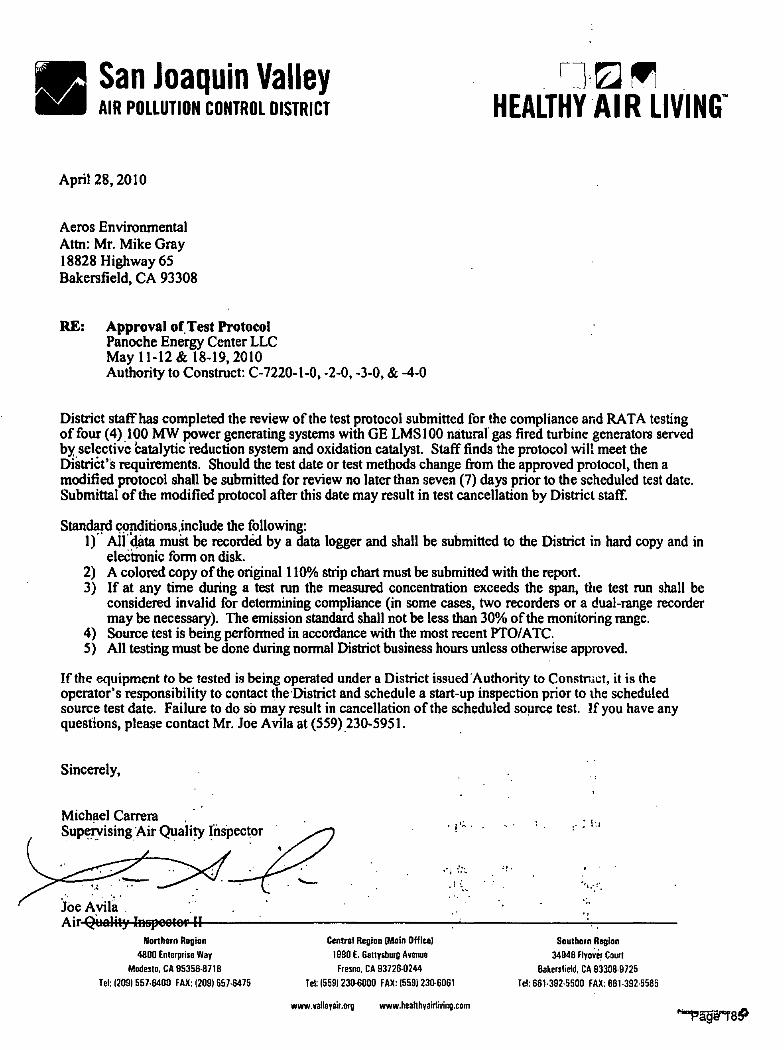
Michael CarreraSupervising AirQuality Inspector
.1Oe AvilaAir Quality Inopeotor II
•
rAi San Joaquin Valleymg AIR POLLUTION CONTROL DISTRICT HEALTHY AIR LIVING'
April 28, 2010
Aeros EnvironmentalAttn: Mr. Mike Gray18828 Highway 65Bakersfield, CA 93308
RE: Approval of Test ProtocolPanoche Energy Center LLCMay 11-12& 18-19,2010Authority to Construct: C-7220-1-0, -2-0, -3-0, & -4-0
District staff has completed the review of the test protocol submitted for the compliance and RATA testingof four (4) 100 MW power generating systems with GE LMS100 natural gas fired turbine generators servedby selective Catalytic reduction system and oxidation catalyst. Staff finds the protocol will meet theDistrict's requirements. Should the test date or test methods change from the approved protocol, then amodified protocol shall be submitted for review no later than seven (7) days prior to the scheduled test date.Submittal of the modified protocol after this date may result in test cancellation by District staff.
Standard conditions include the following:1) AlIdata muit be recorded by a data logger and shall be submitted to the District in hard copy and in
electronic form on disk.2) A colored copy of the original 110% strip chart must be submitted with the report.3) If at any time during a test run the measured concentration exceeds the span, the test run shall be
considered invalid for determining compliance (in some cases, two recorders or a dual-range recordermay be necessary). The emission standard shall not be less than 30% of the monitoring range.
4) Source test is being performed in accordance with the most recent PTO/ATC.5) All testing must be done during normal District business hours unless otherwise approved.
If the equipment to be tested is being operated under a District issued Authority to Construct, it is theoperator's responsibility to contact the -District and schedule a start-up inspection prior to the scheduledsource test date. Failure to do so may result in cancellation of the scheduled source test. If you have anyquestions, please contact Mr. Joe Avila at (559) 230-5951.
Sincerely,
Northern Region
4800 Enterprise Way
Modesto, CA 95356.8718
Tel: (209) 557-6400 FAX: (209) 551.6475
Central Region (Main Office)
1990 E. Gettysburg Avenue
Fresno, CA 93126.0244
Tel: (559) 230-6000 FAX: (559) 2306061
Southern Region
34946 Flyover Court
Bakersfield, CA 93308.9125
Tel: 661-392-5500 FAX: 661-392.5585
www.vallayair.org www.heahhyainiving.com
'13afirl'861
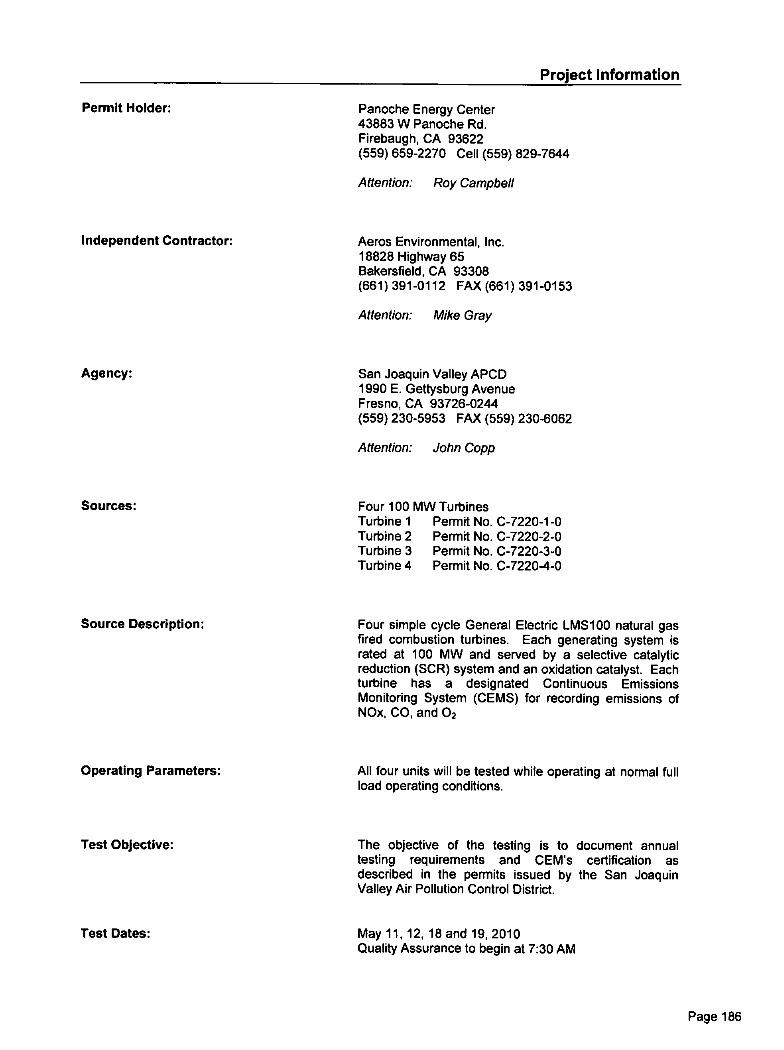
Project Information
Permit Holder:
Independent Contractor:
Agency:
Sources:
Source Description:
Operating Parameters:
Test Objective:
Panoche Energy Center43883 W Panoche Rd.Firebaugh, CA 93622(559) 659-2270 Cell (559) 829-7644
Attention: Roy Campbell
Aeros Environmental, Inc.18828 Highway 65Bakersfield, CA 93308(661) 391-0112 FAX (661) 391-0153
Attention: Mike Gray
San Joaquin Valley APCD1990 E. Gettysburg AvenueFresno, CA 93726-0244(559) 230-5953 FAX (559) 230-6062
Attention: John Copp
Four 100 MW TurbinesTurbine 1 Permit No. C-7220-1-0Turbine 2 Permit No. C-7220-2-0Turbine 3 Permit No. C-7220-3-0Turbine 4 Permit No. C-7220-4-0
Four simple cycle General Electric LMS100 natural gasfired combustion turbines. Each generating system israted at 100 MW and served by a selective catalyticreduction (SCR) system and an oxidation catalyst. Eachturbine has a designated Continuous EmissionsMonitoring System (GEMS) for recording emissions ofNOx, CO, and 02
All four units will be tested while operating at normal fullload operating conditions.
The objective of the testing is to document annualtesting requirements and CEM's certification asdescribed in the permits issued by the San JoaquinValley Air Pollution Control District.
Test Dates: May 11, 12, 18 and 19, 2010Quality Assurance to begin at 7:30 AM
Page 186
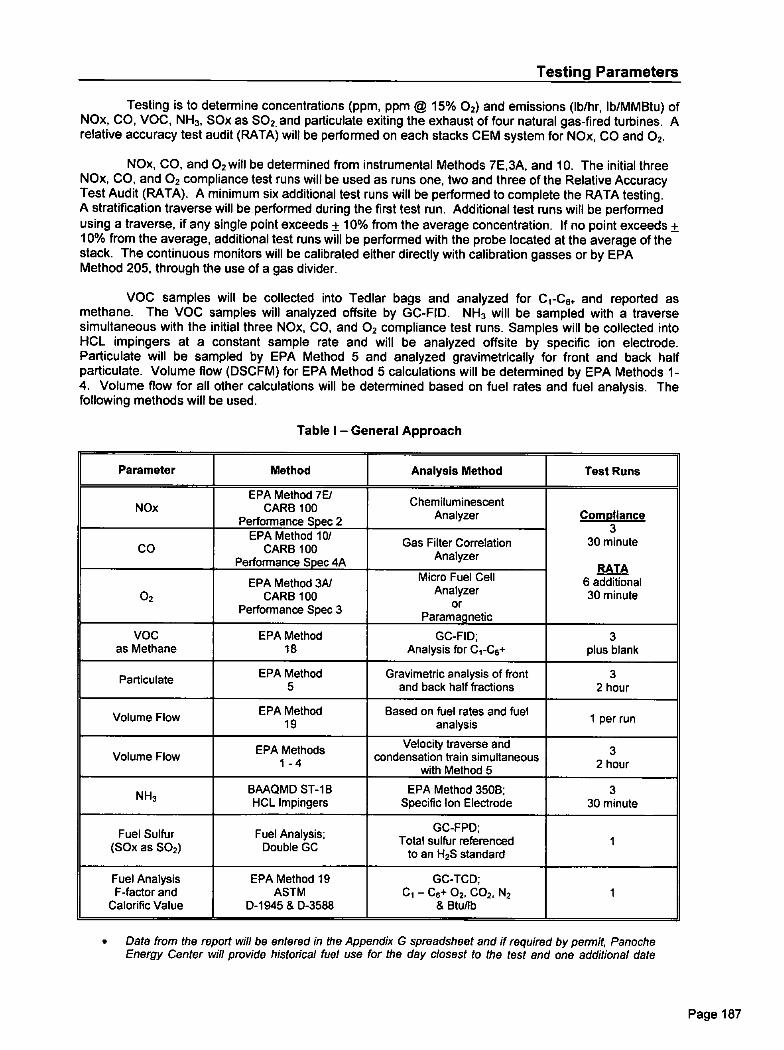
Testing Parameters
Testing is to determine concentrations (ppm, ppm @ 15% 0 2) and emissions (lb/hr, lb/MMBtu) ofNOx, CO, VOC, NH 3, SOx as SO 2, and particulate exiting the exhaust of four natural gas-fired turbines. Arelative accuracy test audit (RATA) will be performed on each stacks CEM system for NOx, CO and 02.
NOx, CO, and 0 2 will be determined from instrumental Methods 7E,3A, and 10. The initial threeNOx, CO, and 02 compliance test runs will be used as runs one, two and three of the Relative AccuracyTest Audit (RATA). A minimum six additional test runs will be performed to complete the RATA testing.A stratification traverse will be performed during the first test run. Additional test runs will be performedusing a traverse, if any single point exceeds + 10% from the average concentration. If no point exceeds +10% from the average, additional test runs will be performed with the probe located at the average of thestack. The continuous monitors will be calibrated either directly with calibration gasses or by EPAMethod 205, through the use of a gas divider.
VOC samples will be collected into Tedlar bags and analyzed for C 1 -C6+ and reported asmethane. The VOC samples will analyzed offsite by GC-FID. NH 3 will be sampled with a traversesimultaneous with the initial three NOx, CO, and 0 2 compliance test runs. Samples will be collected intoHCL impingers at a constant sample rate and will be analyzed offsite by specific ion electrode.Particulate will be sampled by EPA Method 5 and analyzed gravimetrically for front and back halfparticulate. Volume flow (DSCFM) for EPA Method 5 calculations will be determined by EPA Methods 1-4. Volume flow for all other calculations will be determined based on fuel rates and fuel analysis. Thefollowing methods will be used.
Table I — General Approach
Parameter Method Analysis Method Test Runs
NOxEPA Method 7E1
CARB 100Performance Spec 2
ChemiluminescentAnalyzer Compliance
330 minute
RATA
COEPA Method 10/
CARB 100Performance Spec 4A
Gas Filter CorrelationAnalyzer
02EPA Method 3A1
CARB 100Performance Spec 3
Micro Fuel CellAnalyzer
Or
Paramagnetic
6 additional30 minute
VOCas Methane
EPA Method18
GC-FID;Analysis for C,-C6+
3plus blank
Particulate EPA Method5
Gravimetric analysis of frontand back half fractions
32 hour
Volume Flow EPA Method19
Based on fuel rates and fuelanalysis 1 per run
Volume FlowEPA Methods
1 - 4
Velocity traverse andcondensation train simultaneous
with Method 5
32 hour
NH3 BAAQMD ST-1BHCL Impingers
EPA Method 350B;Specific Ion Electrode
330 minute
Fuel Sulfur(S0x as SO2)
Fuel Analysis;Double GC
GC-FPD;Total sulfur referenced
to an H2S standard1
Fuel AnalysisF-factor and
Calorific Value
EPA Method 19ASTM
D-1945 & D-3588
GC-TCD;C1— Cg+ 02, CO2, N2
& Btu/lb1
• Data from the report will be entered in the Appendix G spreadsheet and if required by permit, PanocheEnergy Center will provide historical fuel use for the day closest to the test and one additional date
Page 187
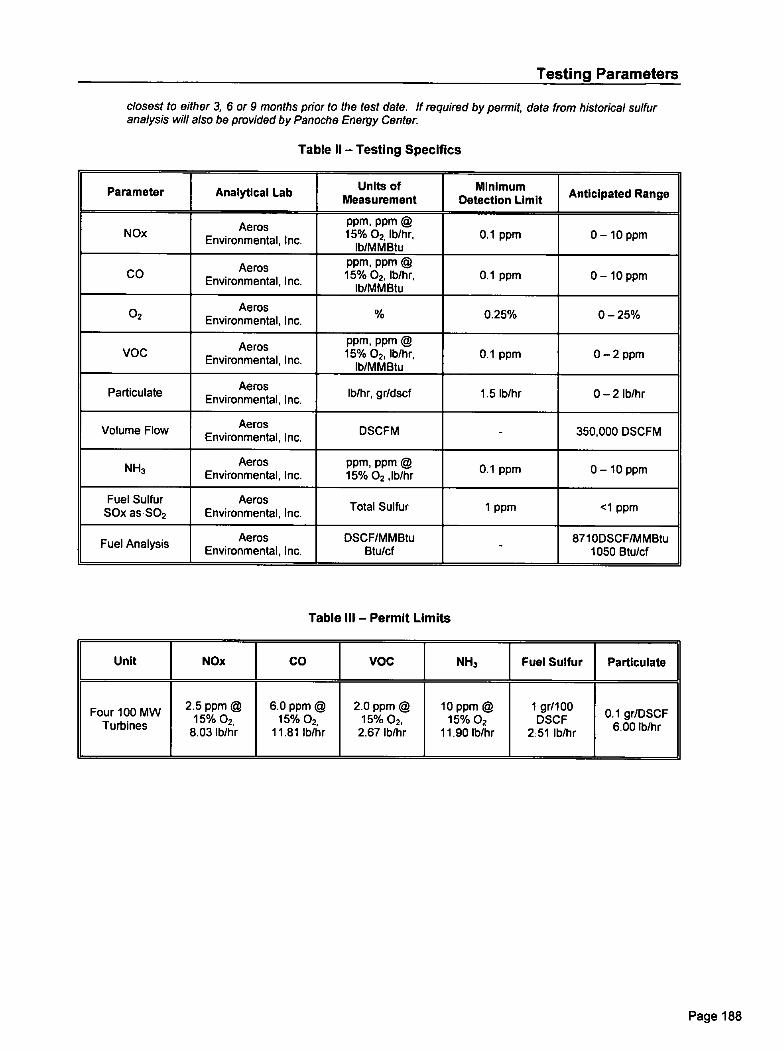
Testing Parameters
closest to either 3, 6 or 9 months prior to the test date. If required by permit, data from historical sulfuranalysis will also be provided by Panoche Energy Center.
Table II — Testing Specifics
Parameter Analytical Lab Units ofMeasurement
MinimumDetection Limit Anticipated Range
NOx AerosEnvironmental, Inc.
PPm , PPm @ 15% 02, lb/hr,
lb/MMBtu0.1 ppm 0-10 ppm
CO AerosEnvironmental, Inc.
PPm , PPm © 15% 02, lb/hr,
lb/MMBtu0.1 ppm 0-10 ppm
02Aeros
Environmental, Inc. % 0.25% 0— 25%
VOC AerosEnvironmental, Inc.
PPm, PPm @ 15% 02, lb/hr,
lb/MMBtu0.1 ppm 0 — 2 ppm
Particulate AerosEnvironmental, Inc. lb/hr, gr/dscf 1.5 lb/hr 0 — 2 lb/hr
Volume Flow AerosEnvironmental, Inc. DSCFM - 350,000 DSCFM
NI-13 AerosEnvironmental, Inc.
PPm, PPm @15% 02 ,lb/hr 0.1 ppm 0-10 ppm
Fuel SulfurSOx as S02
AerosEnvironmental, Inc. Total Sulfur 1 ppm <1 ppm
Fuel Analysis AerosEnvironmental, Inc.
DSCF/MMBtuBtu/cf - 8710DSCF/MMBtu
1050 Btu/cf
Table Ill — Permit Limits
Unit NOx CO VOC NH3 Fuel Sulfur Particulate
Four 100 MWTurbines
2.5 ppm @15% 02,
8.03 lb/hr
6.0 ppm @15% 02,
11.81 lb/hr
2.0 ppm @15% 02,
2.67 lb/hr
10 ppm @15% 02
11.90 lb/hr
1 gr/100DSCF
2.51 lb/hr
0.1 gr/DSCF6.00 lb/hr
Page 188
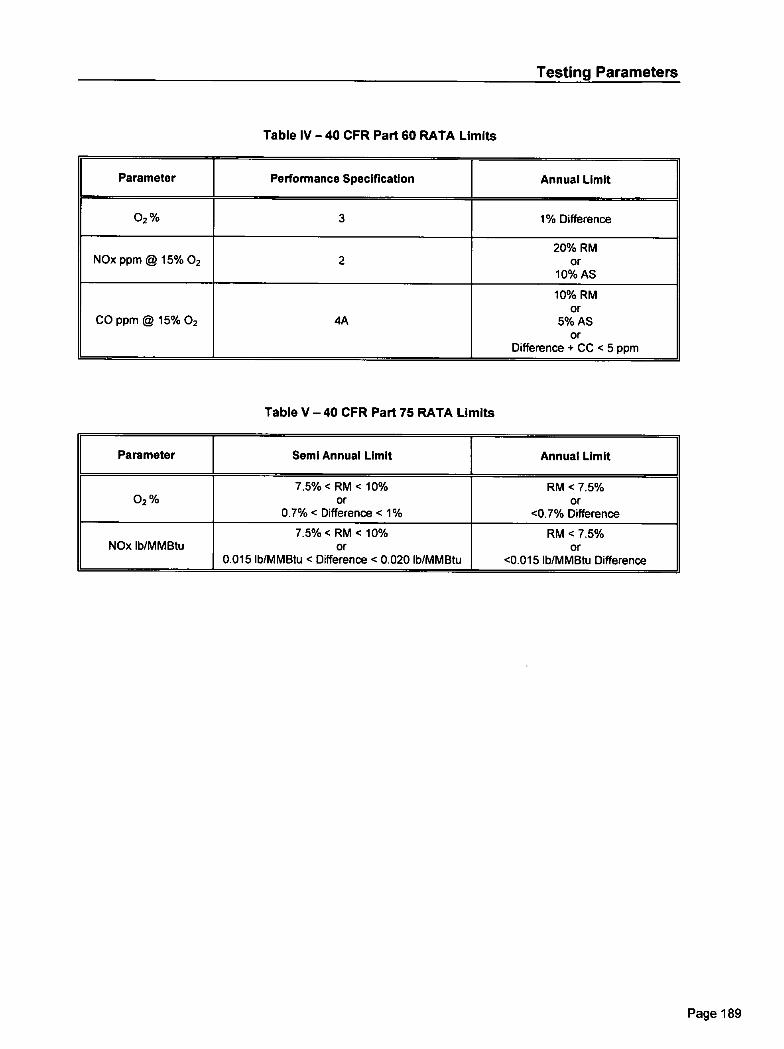
Testing Parameters
Table IV -40 CFR Part 60 RATA Limits
Parameter Performance Specification Annual Limit
02% 3 1% Difference
NOx ppm @ 15% 02 220% RM
Or
10% AS
CO ppm @ 15% 02 4A
10% RMOr
5% ASOr
Difference + CC < 5 ppm
Table V -40 CFR Part 75 RATA Limits
Parameter Semi Annual Limit Annual Limit
02%7.5% < RM < 10%
Or
0.7% < Difference < 1%
RM < 7.5%Or
<0.7% Difference
NOx lb/MMBtu7.5% < RM < 10%
Or
0.015 lb/MMBtu < Difference <0.020 lb/MMBtu
RM < 7.5%Or
<0.015 lb/N1MBtu Difference
Page 189
RED2g1'44Page 1 of 7
E: 12/19/2007
CONDITIONS FOR APPLICATION C-7220-1-0
LEGAL OWNER OR OPERATOR: PAI4OCHE ENERGYMAILING ADDRESS: 43863W PANOCHE
FIREBAUGH, CA 936
LOCATION: W PANOCHE RDFIREBAUGH, CA
INSPECT PROGRAM PARTICIPANT: NO
EQUIPMENT DESCRIPTION:100 MW SIMPLE-CYCLE POWER GENERATING SYSTEM #1 CONSISTING OF A GENERAL ELECTRIC LMS100NATURAL GAS-FIRED COMBUSTION TURBINE GENERATOR SERVED BY A SELECTIVE CATALYTIC REDUCTION(SCR) SYSTEM AND AN OXIDATION CATALYST
CONDITIONS1. Prior to initial operation of C-7220-1, '2; '3, and '4, permittee shall provide NOX emission reduction credits for the
following quantity of emissions: 1st quarter- 38,249 lb, 2nd quarter - 38,249 lb, 3n1 quarter - 55,635 lb, and fourthquarter -41726 lb. Offsets shall be Provided at the applicable offset ratio specified in Table 4-2 of Rule 2201 (asamended 9/21/06). [District Rule 2201]
2. Prior to initial operation of C-7220-1, 2; '3, and '4, permittee shall provide PM10 emission reduction credits for thefollowing quantity of emissions: 1st quaiter - 20,364 lb, 2nd quarter -20,364 lb, 3rd quarter -29,620 lb, and fourthquarter -22,215 lb. Offsets shall be provided at the applicable offset ratio specified in Table 4-2 of Rule 2201 (asamended 9/21/06). SOx ERC,s may be Used to offset PM10 increases at an interpollutant ratio of 1.867 lb-SOx : 1.0 lb-PMIO. [District Rule 2201]
3. Prior to initial operation of C-7220-1, '2, '3, and '4, permittee shall provide VOC emission reduction credits for thefollowing quantity of emissions: 1st quarter -8,953 lb, 2nd quarter -8,953 lb, 3rd quarter - 13,023 lb, and fourthquarter - 9,767 lb. Offsets shall be provided at the applicable offset ratio specified in Table 4-2 of Rule 2201 (asamended 9/21/06). [District Rule 2201]
4. ERC Certificate Numbers S-2437-2, S-2362-2, S-2431-4, S-2432-4, S-2433-4, S-24344, S-2436-4, S-2435-4, N-559-5, N-591-5, S-2465-1 (or certificates split from these certificates) shall be used to supply the required offsets, unless arevised offsetting proposal is received and approved by the District, upon which this Determination of Complianceshall be reissued, administratively specifying the new offsetting proposal. Original public noticing requirements, ifany, shall be duplicated prior to reis.suance of this Determination of Compliance. [District Rule 2201]
5. Pennittee shall submit an application to comply with Rule 2520 - Federally Mandated Operating Permits within twelvemonths of commencing operation. [District Rule 2520]
6. Pennittee shall submit an application to comply with Rule 2540 - Acid Rain Program within twelve months ofcommencing operation. [District Rule 2540]
7. The owner/operator of the Panoche Energy Center Power Plant (PECPP) shall minimize the emissions from the gasturbine to the maximum extent possible during the commissioning period. Conditions #8 through #18 shall apply onlyduring the commissioning period as defined below. Unless otherwise indicated, Conditions #20 through #80 shallapply after the commissioning period has ended. [District Rule 2201]
8. Commissioning activities are defined as but not limited to, all testing, adjustment, tuning, and calibration activitiesrecommended by the equipment manufacturers and the PEC construction contractor to insure safe and reliable steadystate operation of the gas turbines and associated electrical delivery systems. [District Rule 2201]
9. Commissioning period shall commence when all mechanical, electrical, and control systems are installed andindividual system startup has been completed, or when a gas turbine is first fired, whichever occurs first. Thecommissioning period shall terminate when the plant has completed initial performance testing, completed final planttuning, and is available for commercial operation. [District Rule 2201]
10. No more than two of the turbines operating under C-7220-1, C-7220-2, C-7220-3 or C-7220-4 shall be commissionedat any one time. [District Rule 2201]
0722130 : 1112010 MAU-COM
Page 190
CONDMONS FOR APPLICATION C-7220-1-0
11. At the earliest feasible opportunity, in accordance with the recoconstruction contractor, the combustors of this unit shall be tuned to minimize emission
Page 2 of 7
rand the2201]
12. At the earliest feasible opportunity, in accordance with thconstruction contractor, the Selective Catalytic Reductionadjusted, and operated to minimize emissions from this un
the equipment manufacturer and the11 be installed,
13. Coincident with the steady-state opemtion of the SCR system and the oxidation ; - than 50% andafter installation and tuning of the emission controls, NOx, CO, and VOC emissions from this unit shall comply withthe limits specified in condition #36. [District Rule 2201]
14. The permittee shall submit a plan to the District at least four weeks prior to the first firing of this unit, describing theprocedures to be followed during the cOmmissioning period. The plan shall include a description of eachcommissioning activity, the anticipated duration of each activity in hours, and the purpose of the activity. The activitiesdescribed shall include, but not limited to, the tuning of the combustors, the installation and operation of the SCRsystem and the oxidation catalyst, the installation, calibration, and testing of the NOx and CO continuous emissionsmonitors, and any activities requiring the firing of this =it without abatement by the SCR system or oxidation catalyst.[District Rule 2201]
15. Emission rates from the CTG, during the commissioning period, shall not exceed any of the following limits: NOx (asNO2) - 187.00 lb/hr, PM10 -6.00 lb/hr, CO . 309.75 lb/hr, or VOC (as methane) - 17.14 lb/hr. [District Rule 2201]
16. During the commissioning period, the Permittee shall demonstrate NOx and CO compliance with condition #15through the use of properly operated arid maintained continuous emissions monitors and recorders as specified incondition #12. The monitored parameters for this unit shall be recorded at least once every 15 minutes (excludingnormal calibration periods or when the, monitored source is not in operation). [District Rule 2201]
17. The continuous emissions mcmitors specified in these permit conditions shall be installed, calibrated and operationalprior to the first firing of the unit After first firing, the detection range of the CEMS shall be adjusted as necessary toaccurately measure the resulting range of NOx and CO emissions concentrations. [District Rule 2201]
18. The total number of firing hours of this unit without abatement of emissions by the SCR system and the oxidationcatalyst of units C-7220-1, '2, '3, and '4 shall not exceed 800 hours total during the commissioning period. Suchoperation of this unit without abatement shall be limited to discrete commissioning activities that can only be properlyexecuted without the SCR system and the oxidation catalyst in place. Upon completion of these activities, thepermittee shall provide written notice to the District and the unused balance of the 800 firing hours without abatementshall expire. Records of the commissioning hours of operation for units C-7220-1, '2, '3, and '4 shall be maintained.[District Rule 2201]
19. The total mass emissions of NOx, SO; PM10, CO, and VOC that are emitted during the commissioning period shallaccrue towards the consecutive twelve month emission limits specified in condition #38. NOx and CO total massemissions will be determined from CEMs data and S0x, PM 10, and VOC total mass emissions will be calculated.[District Rule 2201]
20. A selective catalytic reduction (SCR) system and an oxidation catalyst shall serve the gas turbine engine. Exhaustducting may be equipped (if required) with a fresh air inlet blower to be used to lower the exhaust temperature prior toinlet of the SCR system catalyst. The permittee shall submit SCR and oxidation catalyst design details to the Districtat least 30 days prior to commencement of construction. [District Rule 2201]
21. Permittee shall submit continuous emission monitor design, installation, and operational details to the District at least30 days prior to commencement of construction. [District Rule 2201]
22. The pemittee shall submit to the District information correlating the NOx control system operating parameters to theassociated measured NOx output. The information must be sufficient to allow the District to determine compliancewith the NOx emission limits of this permit when no continuous emission monitoring data for NOx is available orwhen the continuous emission monitoring system is not operating properly. [District Rule 4703]
23. All equipment shall be maintained in good operating condition and shall be operated in a manner to minimizeemissions of air contaminants into the atmosphere. [District Rule 2201]
24. No air contaminant shall be released into the atmosphere which causes a public nuisance. [District Rule 4102]
Innet • n • a.m.. 111111111 001.11n14.. Page 191
CONDITIONS FOR APPUCATION C-7220-1-0 Page 3 of 725. No air contaminant shall be discharged into the atmosphere or a three
minutes in any one hour which is as dark as, or darker than, Ringehnann 1 or 20% opac e4101]26. Particulate matter emissions shall not eicceed 0.1 grains/d istrict Rule 4201]27. Combustion turbine generator (CM) and electrical gen eliminators.
Visible emissions from lube oil vents shall not exhibit opacity of ?periods notexceeding three minutes in any one hour. [District Rules 2201 and 4101]
28. The CTO shall be fired exclusively on PUC-regulated natural gas with a sulfur content of no greater than 1.0 grain ofsulfur compounds (as S) per 100 dry scf of natural gas. [District Rule 2201 and 40 CFR 60.4330(a)(2)]
29. Emission rates from the CTG, except during startup or shutdown periods, shall not exceed any of the following limits:NOx (as NO2) -8.03 lb/hr and 2.5 pprnvd ® 15% 02; SOx (as 502) -2.51 lb/hr; PM10 - 6.00 lb/hr, CO - 11.81 lb/hrand 6.0 ppmvd ® 15% 02; or VOC (as methane) -2.67 lb/hr and 2.0 ppmvd ® 15% 02. NOX (as NO2) emissionlimits are one how rolling averages. All other pollutant emission concentration limits are based on three how rollingaverages. [District Rules 2201 and 4703 and 40 CFR 60.4320(a) & (b)]
30. Ammonia (NH3) emissions shall not eXceed either of the following limits: 11.90 lb/hr or 10 ppmvd ® 15% 02 (basedon a 24 hour rolling average). [District Rule 2201]
31. During periods of startup, CTG exhaust emission rates shall not exceed any of the following limits: NOx (as NO2) -44.40 lb/hr, SOx -2.51 lb/br, PM10 6.00 CO - 106.60 lb/hr, or VOC - 7.60 lb/hr, based on one hour averages.[District Rule 22011
32. During periods of shutdown, CM exhaust emission rates shall not exceed any of the following limits: NOx (as NO2) -34.29 lb/hr, SOx -2.51 lb/hr, PMIO 6.00 lb/hr, CO -268.57 lb/hr, or VOC - 17.14 lb/hr, based on one hour averages.[District Rule 2201]
33. Startup shall be defined as the period of time during which a unit is brought from a shutdown status to its SCRoperating temperature and pressure, including the time required by the unit's emission control system to reach fulloperations. Shutdown shall be defined as the period of time during which a unit is taken from an operational to a non-operational status as the fuel supply to the unit is completely turned off. [District Rules 2201 and 4703]
34. The duration of each startup or shutdown shall not exceed two hours. Startup and shutdown emissions shall becounted toward all applicable emission limits. [District Rules 2201 and 4703]
35. The emission control systems shall be in operation and emissions shall be minimized insofar as technologicallyfeasible during startup and shutdown. [District Rule 4703]
36. Daily emissions from the CTG shall not exceed any of the following limits: NOx (as NO2) -261.1 lb/day; VOC -79.1lb/day; CO -560.4 lb/day; PM10 - 144.1 lb/day, or SOx (as S02) - 60.2 lb/day. [District Rule 2201]
37. Quarterly hours of operation shall not exceed any of the following: 1st Quarter- 1,100 hours, 2nd Quarter- 1,100hours, 3rd Quarter . 1,600 hours, or 4th Quarter - 1,200 hours. [District Rule 2201]
38. Annual emissions from the CTG, calculated on a twelve consecutive month rolling basis, shall not exceed any of thefollowing: NOx (as NO2) - 48,465 lb/year; SOx (as SO2) - 12,550 lb/year, PM10 - 30,000 lb/year; CO -92,750lb/year, or VOC - 15,174 lb/year. [District Rule 2201]
39. Each one hour period shall commence on the how. Each one hour period in a three hour rolling average willcommence on the hour. The three hour average will be compiled from the three most recent one hour periods. Eachone hour period in a twenty-four hour average for ammonia slip will commence on the hour. [District Rule 2201]
40. Daily emissions will be compiled for a twenty-four hour period starting and ending at twelve-midnight. Each month inthe twelve consecutive month rolling average emissions shall commence at the beginning of the first day of the month.The twelve consecutive month rolling average emissions to determine compliance with annual emissions limitationsshall be compiled from the twelve most recent calendar months. [District Rule 2201]
C-7220143:U . 152010 IMAM -CORO Page 192
CONDITIONS FOR APPLICATION C-7220-1-0
41. Compliance with the ammonia emission limits shall be demo f I . •
61,S f,! E Page 4 of 7
.,„ urea: 1)calculate the daily ammonia emissions using the following equation: (ppmvd ® 15 o >000,000)) x(1,000,000 / b)) x d, where a = average 'ammonia injection ,,r)/111,7 . b= dry exhaust flow rate (lb/hr)/ (29 lb/lb mol), c = change in measured NOx concentratio st, and d = correction
.4.
factor. The correction factor shall be derived annually d !hr!t#P14#. ,Rtel tired andcalculated ammonia slip; 2.) Utilize another District-approved . 1101. 1k vri ;Avg
:• „tiparameters to determine the daily ammonia emissions in ppmvd I® 15% 02. If this opt'', e pemtitteeshall submit a detailed calculation protocol for District approval at least 60 days prior to commencement of operation;3.) Alternatively, the permittee may utilize a continuous in-stack ammonia monitor to verify compliance with theammonia emissions limit. If this option is chosen, the pemtittee shall submit a monitoring plan for District approval atleast 60 days prior to commencement of operation. [District Rule 2201]
42. Source testing to measure startup and shutdown NOx, CO, and VOC mass emission rates shall be conducted for one ofthe gas turbines (C-7220-1, C-7220-2, C-7220-3, or C-7220-4) prior to the end of the commissioning period and atleast once every seven years thereafter. CEM relative accuracy shall be determined during startup source testing inaccordance with 40 CFR 60, Appendix B. If CEM data is not certifiable to determine compliance with NOx and COstartup emission limits, then source testing to measure startup NOx and CO mass emission rates shall be conducted atleast once every 12 months. [District Rule 1081]
43. Hazardous Air Pollutant (HAP) emissions shall not exceed 25 tpy all RAPS or 10 tpy any single HAP. [District Rule4002]
44. Permittee shall conduct an initial speciated RAPS and total VOC source test for one of the GTEs (C-7220-1, '2, '3 or'4), by District witnessed in situ sampling of exhaust gases by a qualified independent source test firm. PEC shallcorrelate the total RAPS emissions rate and the single highest HAP emission rate to the VOC mass emissiondetermined during the speciated HAPs source test. Initial and annual compliance with the HAPS emissions limit (25tpy all HAPs or 10 tpy any single HAP) shall be demonstrated by the combined VOC emissions rates for the GTEs (C-7220-1,2, '3, and '4) determined during initial and annual compliance source testing and the correlation between VOCemissions and HAP(s). [District Rule 4002]
45. Source testing to measure the NOx, CO, VOC, and NH3 emission rates (lb/hr and pprnvd ® 15% 02) and PMIOemission rate (lb/hr) shall be conducted within 120 days after initial operation and at least once every twelve monthsthereafter. [District Rules 1081 and 4703 and 40 CFR 60.4400(a)]
46. The sulfur content of each fuel source shall be: (i) documented in a valid purchase contract a supplier certification, atariff sheet or transportation contract or (ii) shall be demonstrated within 60 days after the end of the commissioningperiod and monitored weekly thereafter. lithe sulfur content is demonstrated to be less than 1.0 gr/100 scf for eightconsecutive weeks, then the monitoring frequency shall be every six months. If the result of any six month monitoringdemonstrates that the fuel does not meet the fuel sulfur content limit weekly monitoring shall resume. [40 CFR60.4360,60.4365(a) and 60.4370(c)]
47. The following test methods shall be used: NOx - EPA Method 7E or 20, PM10 - EPA Method 5/202 (front half andback half), CO - EPA Method 10 or 10B, 02 - EPA Method 3, 3A, or 20, VOC - EPA Method 18 or 25, and ammonia- EPA Method 206. EPA approved alternative test methods as approved by the District may also be used to addressthe source testing requirements of this permit. The request to utilize EPA approved alternative source testing methodsmust be submitted in writing and written approval received from the District prior to the submission of the source testplan. [District Rules 1081 and 4703 and 40 CPR 60.4400(1)(i)]
48. HHV and LHV of the fuel shall be determined using ASTM D3588, ASTM 1826, or ASTM 1945. [40 CFR60.332(a),(b) and District Rule 4703, 6.4.5]
49. Fuel sulfur content shall be monitored using one of the following methods: ASTM Methods D1072, D3246, D4084,D4468, D4810, D6228, D6667 or Gas Processors Association Standard 2377. [40 CFR 60.4415(aX1Xi)]
50. The exhaust stack shall be equipped with permanent provisions to allow collection of stack gas samples consistent withEPA test methods and shall be equipped with safe permanent provisions to sample stack gases with a portable NOx,C(), and 02 analyzer during District inspections. The sampling ports shall be located in accordance with the CARBregulation titled California Air Resources Board Air Monitoring Quality Assurance Volume VL Standard OperatingProcedures for Stationary Source Emission Monitoring and Testing. [District Rule 1080]
0422044 IS IMO MOM- COM
Page 193
CONDITIONS FOR APPLICATION C-7220-1-0
Tr,tPage 5 of 7
collected by51. Compliance demonstration (source testing) shall be District wirNS• • t a ! coa certified testing labomtory. Source te:sting shall be conducted using the methods and p I . • ved by theDistrict The District must be notified 30 days prior to any ce source test, and a source test plan must besubmitted for approval 15 days prior to testing. The itted to the District within60 days thereafter. [District Rule 1081]
52. The turbine shall be equipped with a coatinuous monitoring system to mRules 2201 and 4703 and 40 CFR 60.4335(b)(1)]
53. The owner or operator shall install, certify, maintain, operate and quality-assure a Continuous Emission MonitoringSystem (CEMS) which continuously measures and records the exhaust gas NOx, CO and 02 concentrations.Continuous emissions monitor(s) shall be capable of monitoring emissions during normal operating conditions, andduring startups and shutdowns provided the CEMS pass the relative accuracy requirement for startups and shutdownsspecified herein. If relative accuracy of CEMS cannot be demonstrated during startup conditions, CEMS resultsduring startup and shutdown events shall be replaced with startup emission rates obtained from source testing todetermine compliance with emission linsits contained in this document. [District Rules 1080, 2201, and 4703 and 40CFR 60.4335(b)(1)]
54. The CEMS shall complete a minimum of one cycle of operation (stunpling, analyzing, and data recording) for eachsuccessive 15-minute period or shall meet equivalent specifications established by mutual agreement of the District,the ARB and the EPA. [District Rule 1080 and 40 CFR 60.4345(b)]
55. The NOx, CO and 02 CEMS shall meet the requirements in 40 CFR 60, Appendix F Procedure 1 and Part 60,Appendix B Performance Specification 2 (PS 2), or shall meet equivalent specifications established by mutualagreement of the District, the ARB, and the EPA. [District Rule 1080 and 40 CFR 60.4345(a)]
56. Audits of continuous emission monitors shall be conducted quarterly, except dining quarters in which relative accuracyand total accuracy testing is performed, in accordance with EPA guidelines. The District shall be notified prior tocompletion of the audits. Audit reports shall be submitted along with quarterly compliance reports to the District.[District Rule 1080]
57. The owner/operator shall perform a relative accuracy test audit (RATA) for the NOx, CO, and 02 CEMs as specifiedby 40 CFR Part 60, Appendix F, 5.11, at least once every four calendar quarters. The permittee shall comply with theapplicable requirements for quality assurance testing and maintenance of the continuous emission monitor equipmentin accordance with the procedures and guidance specified in 40 CFR Part 60, Appendix F. [District Rule 1080]
58. Results of the CEM system shall be averaged over a one hour period for NOir emissions and a three hour period forCO emissions using consecutive 15-minute sampling periods in accordance with all applicable requirements of CFR60.13. [District Rule 4703 and 40 CFR 60.13]
59. Excess emissions shall be defined as any operating hour in which the 4-hour or 30-day rolling average NOXconcentration exceeds applicable emissions limit and a period of monitor downtime shall be any unit operating hour inwhich sufficient data are not obtained to validate the hour for either NOX or 02 (or both). [40 CFR 60.4380(bX1)]
60. Results of continuous emissions monitoring shall be reduced according to the procedure established in 40 CFR, Part51, Appendix P, paragraphs 5.0 through 5.3.3, or by other methods deemed equivalent by mutual agreement with theDistrict, the ARB, and the EPA. [District Rule 1080]
61. The facility shall install and maintain equipment, facilities, and systems compatible with the District's CEM datapolling software system and shall make CEM data available to the District's automated polling system on a daily basis.[District Rule 1080]
62. Upon notice by the District that the facility's CEM system is not providing polling data, the facility may continue tooperate without providing automated data for a maximum of 30 days per calendar year provided the CEM data is sentto the District by a District-approved alternative method. [District Rule 1080]
63. The owner or operator shall, upon written notice from the APCO, provide a summary of the data obtained from theCEM systems. This summary shall be in the form and the manner prescribed by the APCO. [District Rule 1080]
1172204/1, Mar IS 1010 INSCOL -MOM
Page 194
CONDMONS FOR APPLICATION C-7220-1-0 •
• I , a
Page 6 of 7
64. The owner or operator shall submit a written report of CEM o o 0. Thereport is due on the 30th day following the end of the calendar quarter and shall inc ude ime intervals,data and magnitude of excess NOX emissions, nature and of excess (if known), corrective actions taken andpreventative measures adopted; Averaging period used for
...'averaging periodspecified in the emission test period and used to determine 11.: !rt Yr licable timeand date of each period during which the CEM was inoperative (mon 152 'd span checks,- 2and the nature of system repairs and adjUstments; A negative declaration when no excess ."'" urred. [DistrictRule 1080 and 40 CFR 60.4375(a) and 60.4395]
65. APCO or an authorized representative shall be allowed to inspect, as determined to be necessary, the requiredmonitoring devices to ensure that such devices are functioning properly. [District Rule 1080]
66. Pennittee shall notify the District of any breakdown condition as soon as reasonably possible, but no later than onehour after its detection, unless the owner or operator demonstrates to the District's satisfaction that the longer reportingperiod was necessary. [District Rule 1100, 6.1]
67. The District shall be notified in writing within ten days following the correction of any breakdown condition. Thebreakdown notification shall include a description of the equipment rnalfimction or failure, the date and cause of theinitial failure, the estimated emissions in excess of those allowed, and the methods utilized to restore normaloperations. [District Rule 1100, 7.0]
68. The permittee shall maintain the following records: date and time, duration, and type of any startup, shutdown, ormalfunction; performance testing, evaluations, calibrations, checks, adjustments, any period during which a continuousmonitoring system or monitoring device was inoperative, and maintenance of any continuous emission monitor.[District Rules 2201 and 4703]
69. The permittee shall maintain the following records: quarterly hours of operation, fuel consumption (scf/br andscf/rolling twelve month period), continuous emission monitor measurements, calculated ammonia slip, and calculatedNOx mass emission lutes (lb/hr and lb/twelve month rolling period). [District Rules 2201 and 4703]
70. All records shall be maintained and retained on-site for a period of at least 5 years and shall be made available forDistrict inspection upon request. [District Rules 1070, 2201, and 4703]
71. Disturbances of soil related to any construction, demolition, excavation, extraction, or other earthmoving activitiesshall comply with the requirements for fugitive dust control in District Rule 8021 unless specifically exempted underSection 4.0 of Rule 8021 or Rule 8011. [District Rules 8011 and 8021]
72. An owner/operator shall submit a Dust Control Plan to the APCO prior to the start of any construction activity on anysite that will include 10 acres or more of disturbed surface area for residential developments, or 5 acres or more ofdisturbed surface area for non-residential development, or will include moving, depositing, or relocating more than2,500 cubic yards per day of bulk materials on at least three days. [District Rules 8011 and 8021]
73. An owner/operator shall prevent or cleanup any canyout or trackout in accordance with the requirements of DistrictRule 8041 Section 5.0, unless specifically exempted under Section 4.0 of Rule 8041 (8/19/04) or Rule 8011(8/19/04).[District Rules 8011 and 80211
74. Whenever open areas are disturbed, or vehicles are used in open areas, the facility shall comply with the requirementsof Section 5.0 of District Rule 8051, unless specifically exempted under Section 4.0 of Rule 8051 or Rule 8011.[District Rules 8011 and 8051]
75. Any paved road or unpaved road shall comply with the requirements of District Rule 8061 unless specificallyexempted under Section 4.0 of Rule 8061 or Rule 8011. [District Rules 8011 and 80611
76. Water, gravel, roadmix, or chemical/organic dust stabilizers/suppressants, vegetative materials, or other District-approved control measure shall be applied to unpaved vehicle travel areas as required to limit Visible Dust Emissionsto 20% opacity and comply with the requirements for a stabilized unpaved road as defined in Section 3.59 of DistrictRule 8011. [District Rules 8011 and 8071]
77. Where dusting materials are allowed to accumulate on paved surfaces, the accumulation shall be removed daily orwater and/or chemical/organic dust stabilizers/suppressants shall be applied to the paved surface as required tomaintain continuous compliance with the requirements for a stabilized unpaved road as defined in Section 3.59 ofDistrict Rule 8011 and limit Visible Dust Emissions (VDE) to 20% opacity. [District Rules 8011 and 8071]
Page 195

CONDITIONS FOR APPUCATION C-7220-1-0 Page 7 of 7
78. On each day that 50 or more Vehicle Daily Trips or 25 or more will occur onan unpaved vehicle/equipment traffic area, permittee shall apply water, gravel, IX, ic duststabilizers/suppressants, vegetative materials, or other ' ... ..ved control measure as required to limit VisibleDust Emissions to 20% opacity and comply with the as defined in Section3.59 of District Rule 8011. [District Rules 8011 and 8071]
79. Whenever any portion of the site becomes inactive, Permittee shall restrict Wilize anydisturbed surface to comply with the conditions for a stabilized surface as defined in Section 3.5 o istrict Rule8011. [District Rules 8011 and 8071]
80. Records and other supporting documentation shall be maintained as required to demonstrate compliance with therequirements of the rules under Regulation VIII only for those days that a control measure was implemented. Suchrecords shall include the type of control measure(s) used, the location and extent of coverage, and the date, amount,and frequency of application of dust suppressant, manufacturer's dust suppressant product information sheet thatidentifies the name of the dust suppressant and application instructions. Records shall be kept for one year followingproject completion that results in the termination of all dust generating activities. [District Rules 8011, 8031, and 8071]
/......ft•A • ••n•n •• 11,411 S erte•DI
Page 196
Appendix(Hazardous Air Pollutants supplied by Panoche Energy Center)
Page 197
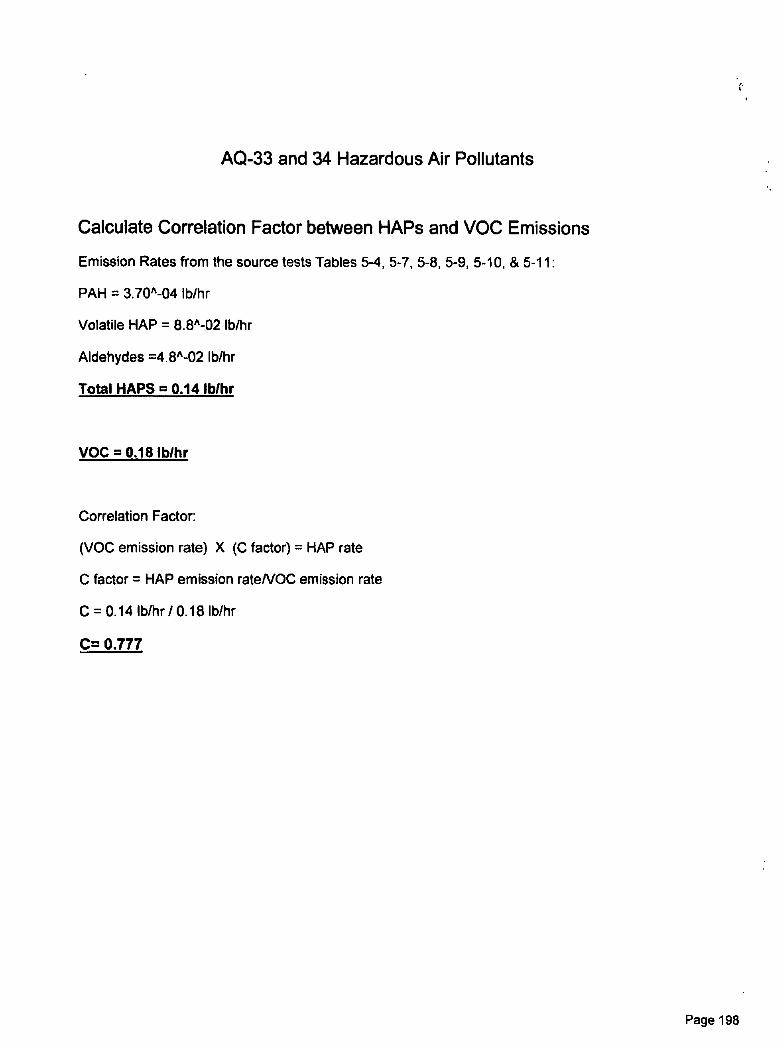
AQ-33 and 34 Hazardous Air Pollutants
Calculate Correlation Factor between HAPs and VOC Emissions
Emission Rates from the source tests Tables 5-4, 5-7, 5-8, 5-9, 5-10, & 5-11:
PAH = 3.70A-04 lb/hr
Volatile HAP = 8.8^-02 lb/hr
Aldehydes =4.8^-02 lb/hr
Total HAPS = 0.14 lb/hr
VOC = 0.18 lb/hr
Correlation Factor:
(VOC emission rate) X (C factor) = HAP rate
C factor = HAP emission rateNOC emission rate
C = 0.14 lb/hr / 0.18 lb/hr
C= 0.777
Page 198

HAPS Estimation from VOC emissions2009 Correlation Factor = 0.777
2009 VOC's 2009 HAPSLBS Tons LBS '' Tons
CT1 113 0.0565 87.801 0.0439
CT2 73 0.0365 56.721 0.02836
CT3 190 0.095 147.63 0.07382
CT4 81 0.0405 62.937 0.03147
457 0.2285 355.089 0.17754
* VOC Lbs to total HAPs lbs correlation factor = 0.777
calculated from the April 2009 Source Test Reports
Page 199
CONDITIONS FOR APPLICATION C-7220-1-0 Page 1 of 7
E: 12/19/2007
LEGAL OWNER OR OPERATOR: PANOCHE ENERGYMAILING ADDRESS: 43883 W PANOCHE
FIREBAUGH, CA 93
LOCATION: W PANOCHE RDFIREBAUGH, CA
INSPECT PROGRAM PARTICIPANT: NO
EQUIPMENT DESCRIPTION:100 MW SIMPLE-CYCLE POWER GENERATING SYSTEM #1 CONSISTING OF A GENERAL ELECTRIC LMS100NATURAL GAS-FIRED COMBUSTION TURBINE GENERATOR SERVED BY A SELECTIVE CATALYTIC REDUCTION(SCR) SYSTEM AND AN OXIDATION CATALYST
CONDITIONS1. Prior to initial operation of C-7220-1, '2, '3, and '4, permittee shall provide NOX emission reduction credits for the
following quantity of emissions: 1st quarter - 38,249 lb, 2nd quarter -38,249 lb, 3rd quarter - 55,635 lb, and fourthquarter -41,726 lb. Offsets shall be provided at the applicable offset ratio specified in Table 4-2 of Rule 2201 (asamended 9/21/06). [District Rule 2201]
2. Prior to initial operation of C-7220-1, '2, '3, and '4, permittee shall provide PM10 emission reduction credits for thefollowing quantity of emissions: 1st quarter -20,364 lb, 2nd quarter -20,364 lb, 3rd quarter -29,620 lb, and fourthquarter -22,215 lb. Offsets shall be provided at the applicable offset ratio specified in Table 4-2 of Rule 2201 (asamended 9/21/06). SOx ERCs may be used to offset PM 10 increases at an interpollutant ratio of 1.867 lb-S0x : 1.0 lb-PM 10. [District Rule 2201]
3. Prior to initial operation of C-7220-1, '2, '3, and '4, permittee shall provide VOC emission reduction credits for thefollowing quantity of emissions: 1st quarter - 8,953 lb, 2nd quarter - 8,953 lb, 3rd quarter - 13,023 lb, and fourthquarter - 9,767 lb. Offsets shall be provided at the applicable offset ratio specified in Table 4-2 of Rule 2201 (asamended 9/21/06). [District . Rule 2201]
4. ERC Certificate Numbers S-2437-2, S-2362-2, S-2431-4, S-2432-4, S-2433-4, S-2434-4, S-2436-4, S-2435-4, N-559-5, N-591-5, S-2465-1 (or certificates split from these certificates) shall be used to supply the required offsets, unless arevised offsetting proposal is received and approved by the District, upon which this Determination of Complianceshall be reissued, administratively specifying the new offsetting proposal. Original public noticing requirements, ifany, shall be duplicated prior to reissuance of this Determination of Compliance. [District Rule 2201]
5. Permittee shall submit an application to comply with Rule 2520 - Federally Mandated Operating Permits within twelvemonths of commencing operation. [District Rule 2520]
6. Permittee shall submit an application to comply with Rule 2540 - Acid Rain Program within twelve months ofcommencing operation. [District Rule 2540]
7. The owner/operator of the Panoche Energy Center Power Plant (PECPP) shall minimize the emissions from the gasturbine to the maximum extent possible during the commissioning period. Conditions #8 through #18 shall apply onlyduring the commissioning period as defined below. Unless otherwise indicated, Conditions #20 through #80 shallapply after the commissioning period has ended. [District Rule 2201]
8. Commissioning activities are defined as, but not limited to, all testing, adjustment, tuning, and calibration activitiesrecommended by the equipment manufacturers and the PEC construction contractor to insure safe and reliable steadystate operation of the gas turbines and associated electrical delivery systems. [District Rule 2201]
9. Commissioning period shall commence when all mechanical, electrical, and control systems are installed andindividual system startup has been completed, or when a gas turbine is first fired, whichever occurs first. Thecommissioning period shall terminate when the plant has completed initial performance testing, completed final planttuning, and is available for commercial operation. [District Rule 2201]
10. No more than two of the turbines operating under C-7220-1, C-7220-2, C-7220-3 or C-7220-4 shall be commissionedat any one time. [District Rule 2201]
C-7220. / -0: Arc VI 2010 1 n12P1.1 AV11.AJ
12. At the earliest feasible opportunity, in accordance with thconstruction contractor, the Selective Catalytic Reductionadjusted, and operated to minimize emissions from this u
the equipment manufacturer and the11 be installed,
g11. At the earliest feasible opportunity, in accordance with the recom e ns
construction contractor, the combustors of this unit shall be tuned to minimize emissions.
CONDITIONS FOR APPLICATION C-7220-1-0 Page 2 of 7
urer and the2201]
13. Coincident with the steady-state operation of the SCR system and the oxidation catalys a drther than 50% andafter installation and tuning of the emission controls, NOx, CO, and VOC emissions from this unit shall comply withthe limits specified in condition #36. [District Rule 2201]
14. The permittee shall submit a plan to the District at least four weeks prior to the first firing of this unit, describing theprocedures to be followed during the commissioning period. The plan shall include a description of eachcommissioning activity, the anticipated duration of each activity in hours, and the purpose of the activity. The activitiesdescribed shall include, but not limited to, the tuning of the combustors, the installation and operation of the SCRsystem and the oxidation catalyst, the installation, calibration, and testing of the NOx and CO continuous emissionsmonitors, and any activities requiring the firing of this unit without abatement by the SCR system or oxidation catalyst.[District Rule 2201]
15. Emission rates from the CTG, during the commissioning period, shall not exceed any of the following limits: NOx (asNO2) - 187.00 lb/hr; PM10 -6.00 lb/hr; CO -309.75 lb/hr; or VOC (as methane) - 17.14 lb/hr. [District Rule 2201]
16. During the commissioning period, the permittee shall demonstrate NOx and CO compliance with condition #15through the use of properly operated and maintained continuous emissions monitors and recorders as specified incondition #12. The monitored parameters for this unit shall be recorded at least once every 15 minutes (excludingnormal calibration periods or when the monitored source is not in operation). [District Rule 2201]
17. The continuous emissions monitors specified in these permit conditions shall be installed, calibrated and operationalprior to the first firing of the unit. After first firing, the detection range of the CEMS shall be adjusted as necessary toaccurately measure the resulting range of NOx and CO emissions concentrations. [District Rule 2201]
18. The total number of firing hours of this unit without abatement of emissions by the SCR system and the oxidationcatalyst of units C-7220-1, '2, '3, and '4 shall not exceed 800 hours total during the commissioning period. Suchoperation of this unit without abatement shall be limited to discrete commissioning activities that can only be properlyexecuted without the SCR system and the oxidation catalyst in place. Upon completion of these activities, thepermittee shall provide written notice to the District and the unused balance of the 800 firing hours without abatementshall expire. Records of the commissioning hours of operation for units C-7220-1, '2, '3, and '4 shall be maintained.[District Rule 2201]
19. The total mass emissions of NOx, S0x, PM10, CO, and VOC that are emitted during the commissioning period shallaccrue towards the consecutive twelve month emission limits specified in condition #38. NOx and CO total massemissions will be determined from CEMs data and S0x, PM 10, and VOC total mass emissions will be calculated.[District Rule 2201]
20. A selective catalytic reduction (SCR) system and an oxidation catalyst shall serve the gas turbine engine. Exhaustducting may be equipped (if required) with a fresh air inlet blower to be used to lower the exhaust temperature prior toinlet of the SCR system catalyst. The permittee shall submit SCR and oxidation catalyst design details to the Districtat least 30 days prior to commencement of construction. [District Rule 2201]
21. Permittee shall submit continuous emission monitor design, installation, and operational details to the District at least30 days prior to commencement of construction. [District Rule 2201]
22. The permittee shall submit to the District information correlating the NOx control system operating parameters to theassociated measured NOx output. The information must be sufficient to allow the District to determine compliancewith the NOx emission limits of this permit when no continuous emission monitoring data for NOx is available orwhen the continuous emission monitoring system is not operating properly. [District Rule 4703]
23. All equipment shall be maintained in good operating condition and shall be operated in a manner to minimizeemissions of air contaminants into the atmosphere. [District Rule 22011
24. No air contaminant shall be released into the atmosphere which causes a public nuisance. [District Rule 4102]
C-7220. 1-0: Pp 262010 1 •17K1- AVILA!
CONDITIONS FOR APPLICATION C-7220-1-0
25. No air contaminant shall be discharged into the atmospherefor a r •p a 4 gai At threeminutes in any one hour which is as dark as, or darker than, Ringelmann 1 or 20% opaci . tsaat/Rg e 4101]
Page 3 of 7
26. Particulate matter emissions shall not exceed 0.1 grains/d
27. Combustion turbine generator (CTG) and electrical generhVisible emissions from lube oil vents shall not exhibit opacity o 0 rexceeding three minutes in any one hour. [District Rules 2201 and 4101]
istrict Rule 4201]
eliminators.periods not
28. The CTG shall be fired exclusively on PUC-regulated natural gas with a sulfur content of no greater than 1.0 grain ofsulfur compounds (as S) per 100 dry scf of natural gas. [District Rule 2201 and 40 CFR 60.4330(a)(2)]
29. Emission rates from the CTG, except during startup or shutdown periods, shall not exceed any of the following limits:NOx (as NO2) -8.03 lb/hr and 2.5 ppmvd © 15% 02; SOx (as S02) -2.51 lb/hr; PM10 -6.00 lb/hr; CO - 11.81 lb/hrand 6.0 ppmvd @ 15% 02; or VOC (as methane) -2.67 lb/hr and 2.0 ppmvd @ 15% 02. NOX (as NO2) emissionlimits are one hour rolling averages. All other pollutant emission concentration limits are based on three hour rollingaverages. [District Rules 2201 and 4703 and 40 CFR 60.4320(a) & (b)]
30. Ammonia (NH3) emissions shall not exceed either of the following limits: 11.90 lb/hr or 10 ppmvd @ 15% 02 (basedon a 24 hour rolling average). [District Rule 2201]
31. During periods of startup, CTG exhaust emission rates shall not exceed any of the following limits: NOx (as NO2) -44.40 lb/hr, SOx -2.51 lb/hr, PM10 6.00 lb/hr, CO - 106.60 lb/hr, or VOC -7.60 lb/hr, based on one hour averages.[District Rule 2201]
32. During periods of shutdown, CTG exhaust emission rates shall not exceed any of the following limits: NOx (as NO2) -34.29 lb/hr, SOx -2.51 lb/hr, PM10 6.00 lb/hr, CO -268.57 lb/hr, or VOC - 17.14 lb/hr, based on one hour averages.[District Rule 2201]
33. Startup shall be defined as the period of time during which a unit is brought from a shutdown status to its SCRoperating temperature and pressure, including the time required by the unit's emission control system to reach fulloperations. Shutdown shall be defined as the Period of time during which a unit is taken from an operational to a non-operational status as the fuel supply to the unit is completely turned off. [District Rules 2201 and 4703]
34. The duration of each startup or shutdown shall not exceed two hours. Startup and shutdown emissions shall becounted toward all applicable emission limits. [District Rules 2201 and 4703]
35. The emission control systems shall be in operation and emissions shall be minimized insofar as technologicallyfeasible during startup and shutdown. [District Rule 4703]
36. Daily emissions from the CTG shall not exceed any of the following limits: NOx (as NO2) - 261.1 lb/day; VOC - 79.1lb/day; CO -560.4 lb/day; PM10 - 144.1 lb/day; or SOx (as S02) -60.2 lb/day. [District Rule 2201]
37. Quarterly hours of operation shall not exceed any of the following: 1st Quarter - 1,100 hours, 2nd Quarter - 1,100hours, 3rd Quarter - 1,600 hours, or 4th Quarter - 1,200 hours. [District Rule 22011
38. Annual emissions from the CTG, calculated on a twelve consecutive month rolling basis, shall not exceed any of thefollowing: NOx (as NO2) -48,465 lb/year; SOx (as S02) - 12,550 lb/year; PMIO -30,000 lb/year; CO -92,750lb/year; or VOC - 15,174 lb/year. [District Rule 2201]
39. Each one hour period shall commence on the hour. Each one hour period in a three hour rolling average willcommence on the hour. The three hour average will be compiled from the three most recent one hour periods. Eachone hour period in a twenty-four hour average for ammonia slip will commence on the hour. [District Rule 2201]
40. Daily emissions will be compiled for a twenty-four hour period starting and ending at twelve-midnight. Each month inthe twelve consecutive month rolling average emissions shall commence at the beginning of the first day of the month.The twelve consecutive month rolling average emissions to determine compliance with annual emissions limitationsshall be compiled from the twelve most recent calendar months. [District Rule 2201]
C-7220. 1-0: Art 253010 1 a7PLI - AVILA1
1141. Compliance with the ammonia emission limits shall be demons in dures: 1)
calculate the daily ammonia emissions using the following equation: (ppmvd @ 15°o 0 1,000,000)) x(1,000,000 / b)) x d, where a = average ammonia injection Al / 17 lb/lb mol), b = dry exhaust flow rate (lb/hr)/ (29 lb/lb mol), c = change in measured NOx concentrati I 0, , is. atalyst, and d = correctionfactor. The correction factor shall be derived annually du i m sured andcalculated ammonia slip; 2.) Utilize another District-approved ca cul ii • ; s ogateparameters to determine the daily ammonia emissions in ppmvd @ 15% 02. If this option 0441, the permitteeshall submit a detailed calculation protocol for District approval at least 60 days prior to commencement of operation;3.) Alternatively, the permittee may utilize a continuous in-stack ammonia monitor to verify compliance with theammonia emissions limit. If this option is chosen, the permittee shall submit a monitoring plan'for District approval atleast 60 days prior to commencement of operation. [District Rule 2201]
42. Source testing to measure startup and shutdown NOx, CO, and VOC mass emission rates shall be conducted for one ofthe gas turbines (C-7220-1, C-7220-2, C-7220-3, or C-7220-4) prior to the end of the commissioning period and atleast once every seven years thereafter. CEM relative accuracy shall be determined during startup source testing inaccordance with 40 CFR 60, Appendix B. If CEM data is not certifiable to determine compliance with NOx and COstartup emission limits, then source testing to measure startup NOx and CO mass emission rates shall be conducted atleast once every 12 months. [District Rule 1081]
43. Hazardous Air Pollutant (HAP) emissions shall not exceed 25 tpy all HAPS or 10 tpy any single HAP. [District Rule4002]
44. Permittee shall conduct an initial speciated HAPS and total VOC source test for one of the GTEs (C-7220-1, '2, '3 or'4), by District witnessed in situ sampling of exhaust gases by a qualified independent source test firm. PEC shallcorrelate the total HAPS emissions rate and the single highest HAP emission rate to the VOC mass emissiondetermined during the speciated HAPs source test. Initial and annual compliance with the HAPS emissions limit (25tpy all HAPs or 10 tpy any single HAP) shall be demonstrated by the combined VOC emissions rates for the GTEs (C-7220-1, '2, '3, and '4) determined during initial and annual compliance source testing and the correlation between VOCemissions and HAP(s). [District Rule 4002]
45. Source testing to measure the NOx, CO, VOC, and NH3 emission rates (lb/hr and ppmvd @ 15% 02) and PM10emission rate (1b/hr) shall be conducted within 120 days after initial operation and at least once every twelve monthsthereafter. [District Rules 1081 and 4703 and 40 CFR 60.4400(a)]
46. The sulfur content of each fuel source shall be: (i) documented in a valid purchase contract, a supplier certification, atariff sheet or transportation contract or (ii) shall be demonstrated within 60 days after the end of the commissioningperiod and monitored weekly thereafter. If the sulfur content is demonstrated to be less than 1.0 gr/100 scf for eightconsecutive weeks, then the monitoring frequency shall be every six months. If the result of any six month monitoringdemonstrates that the fuel does not meet the fuel sulfur content limit, weekly monitoring shall resume. [40 CFR60.4360, 60.4365(a) and 60.4370(c)]
47. The following test methods shall be used: NOx - EPA Method 7E or 20, PMIO - EPA Method 5/202 (front half andback half), CO - EPA Method 10 or 10B, 02 - EPA Method 3, 3A, or 20, VOC - EPA Method 18 or 25, and ammonia- EPA Method 206. EPA approved alternative test methods as approved by the District may also be used to addressthe source testing requirements of this permit. The request to utilize EPA approved alternative source testing methodsmust be submitted in writing and written approval received from the District prior to the submission of the source testplan. [District Rules 1081 and 4703 and 40 CFR 60.4400(1)(i)]
48. HHV and LHV of the fuel shall be determined using ASTM D3588, ASTM 1826, or ASTM 1945. [40 CFR60.332(a),(b) and District Rule 4703, 6.4.5]
49. Fuel sulfur content shall be monitored using one of the following methods: ASTM Methods D1072, D3246, D4084,D4468, D4810, D6228, D6667 or Gas Processors Association Standard 2377. [40 CFR 60.4415(a)(1)(i)]
50. The exhaust stack shall be equipped with permanent provisions to allow collection of stack gas samples consistent withEPA test methods and shall be equipped with safe permanent provisions to sample stack gases with a portable NOx,CO, and 02 analyzer during District inspections. The sampling ports shall be located in accordance with the CARBregulation titled California Air Resources Board Air Monitoring Quality Assurance Volume VI, Standard OperatingProcedures for Stationary Source Emission Monitoring and Testing. [District Rule 1080]
CONDITIONS FOR APPLICATION C-7220-1-0 Page 4 of 7
c-n2111-0: Apr 262010 I 47P54.. AVILA)

11 eCONDITIONS FOR APPLICATION C-7220-1-0
51. Compliance demonstration (source testing) shall be District witnea certified testing laboratory. Source testing shall be conducted using the methods and pDistrict. The District must be notified 30 days prior to anysubmitted for approval 15 days prior to testing. The result60 days thereafter. [District Rule 10811
52. The turbine shall be equipped with a continuous monitoring system to measureRules 2201 and 4703 and 40 CFR 60.4335(b)(1)]
53. The owner or operator shall install, certify, maintain, operate and quality-assure a Continuous Emission MonitoringSystem (CEMS) which continuously measures and records the exhaust gas NOx, CO and 02 concentrations.Continuous emissions monitor(s) shall be capable of monitoring emissions during normal operating conditions, andduring startups and shutdowns provided the CEMS pass the relative accuracy requirement for startups and shutdownsspecified herein. If relative accuracy of CEMS cannot be demonstrated during startup conditions, CEMS resultsduring startup and shutdown events shall be replaced with startup emission rates obtained from source testing todetermine compliance with emission limits contained in this document. [District Rules 1080, 2201, and 4703 and 40CFR 60.4335(b)(1)]
54. The CEMS shall complete a minimum of one cycle of operation (sampling, analyzing, and data recording) for eachsuccessive 15-minute period or shall meet equivalent specifications established by mutual agreement of the District,the ARB and the EPA. [District Rule 1080 and 40 CFR 60.4345(b)]
55. The NOx, CO and 02 CEMS shall meet the requirements in 40 CFR 60, Appendix F Procedure 1 and Part 60,Appendix B Performance Specification 2 (PS 2), or shall meet equivalent specifications established by mutualagreement of the District, the ARB, and the EPA. [District Rule 1080 and 40 CFR 60.4345(a)]
56. Audits of continuous emission monitors shall be conducted quarterly, except during quarters in which relative accuracyand total accuracy testing is performed, in accordance with EPA guidelines. The District shall be notified prior tocompletion of the audits. Audit reports shall be submitted along with quarterly compliance reports to the District.[District Rule 1080]
57. The owner/operator shall perform a relative accuracy test audit (RATA) for the NOx, CO, and 02 CEMs as specifiedby 40 CFR Part 60, Appendix F, 5.11, at least once every four calendar quarters. The permittee shall comply with theapplicable requirements for quality assurance testing and maintenance of the continuous emission monitor equipmentin accordance with the procedures and guidance specified in 40 CFR Part 60, Appendix F. [District Rule 1080]
58. Results of the CEM system shall be averaged over a one hour period for NOx emissions and a three hour period forCO emissions using consecutive 15-minute sampling periods in accordance with all applicable requirements of CFR60.13. [District Rule 4703 and 40 CFR 60.13]
59. Excess emissions shall be defined as any operating hour in which the 4-hour or 30-day rolling average NOXconcentration exceeds applicable emissions limit and a period of monitor downtime shall be any unit operating hour inwhich sufficient data are not obtained to validate the hour for either NOX or 02 (or both). [40 CFR 60.4380(b)(1)]
60. Results of continuous emissions monitoring shall be reduced according to the procedure established in 40 CFR, Part51, Appendix P, paragraphs 5.0 through 5.3.3, or by other methods deemed equivalent by mutual agreement with theDistrict, the ARB, and the EPA. [District Rule 1080]
61. The facility shall install and maintain equipment, facilities, and systems compatible with the District's CEM datapolling software system and shall make CEM data available to the District's automated polling system on a daily basis.[District Rule 1080]
62. Upon notice by the District that the facility's CEM system is not providing polling data, the facility may continue tooperate without providing automated data for a maximum of 30 days per calendar year provided the CEM data is sentto the District by a District-approved alternative method. [District Rule 1080]
63. The owner or operator shall, upon written notice from the APCO, provide a summary of the data obtained from theCEM systems. This summary shall be in the form and the manner prescribed by the APCO. [District Rule 1080]
Page 5 of 7
collected byved by the
ce source test, and a source test plan must beitted to the District within
ut
ption. [District
C.7220. 1 .0: 4. 20 2010 1 471.1n1-- AV1LAJ

Page 6 of 7g
64. The owner or operator shall submit a written report of CEM oper ioreport is due on the 30th day following the end of the calendar quarter and shall incdata and magnitude of excess NOX emissions nature andpreventative measures adopted; Averaging period used fospecified in the emission test period and used to determinand date of each period during which the CEM was inoperative (moand the nature of system repairs and adjustments; A negative declaration when no excess eRule 1080 and 40 CFR 60.4375(a) and 60.43951
65. APCO or an authorized representative shall be allowed to inspect, as determined to be necessary, the requiredmonitoring devices to ensure that such devices are functioning properly. [District Rule 1080]
66. Permittee shall notify the District of any breakdown condition as soon as reasonably possible, but no later than onehour after its detection, unless the owner or operator demonstrates to the District's satisfaction that the longer reportingperiod was necessary. [District Rule 1100, 6.1]
67. The District shall be notified in writing within ten days following the correction of any breakdown condition. Thebreakdown notification shall include a description of the equipment malfunction or failure, the date and cause of theinitial failure, the estimated emissions in excess of those allowed, and the methods utilized to restore normaloperations. [District Rule 1100, 7.0]
68. The permittee shall maintain the following records: date and time, duration, and type of any startup, shutdown, ormalfunction; performance testing, evaluations, calibrations, checks, adjustments, any period during which a continuousmonitoring system or monitoring device was inoperative, and maintenance of any continuous emission monitor.[District Rules 2201 and 4703]
69. The permittee shall maintain the following records: quarterly hours of operation, fuel consumption (scf/hr andscf/rolling twelve month period), continuous emission monitor measurements, calculated ammonia slip, and calculatedNOx mass emission rates (lb/hr and lb/twelve month rolling period). [District Rules 2201 and 4703]
70. All records shall be maintained and retained on-site for a period of at least 5 years and shall be made available forDistrict inspection upon request. [District Rules 1070, 2201, and 4703]
71. Disturbances of soil related to any construction, demolition, excavation, extraction, or other earthmoving activitiesshall comply with the requirements for fugitive dust control in District Rule 8021 unless specifically exempted underSection 4.0 of Rule 8021 or Rule 8011. [District Rules 8011 and 8021]
72. An owner/operator shall submit a Dust Control Plan to the APCO prior to the start of any construction activity on anysite that will include 10 acres or more of disturbed surface area for residential developments, or 5 acres or more ofdisturbed surface area for non-residential development, or will include moving, depositing, or relocating more than2,500 cubic yards per day of bulk materials on at least three days. [District Rules 8011 and 8021]
73. An owner/operator shall prevent or cleanup any carryout or trackout in accordance with the requirements of DistrictRule 8041 Section 5.0, unless specifically exempted under Section 4.0 of Rule 8041 (8/19/04) or Rule 8011(8/19/04).[District Rules 8011 and 8021]
74. Whenever open areas are disturbed, or vehicles are used in open areas, the facility shall comply with the requirementsof Section 5.0 of District Rule 8051, unless specifically exempted under Section 4.0 of Rule 8051 or Rule 8011.[District Rules 8011 and 8051]
75. Any paved road or unpaved road shall comply with the requirements of District Rule 8061 unless specificallyexempted under Section 4.0 of Rule 8061 or Rule 8011. [District Rules 8011 and 8061]
76. Water, gravel, roadmix, or chemical/organic dust stabilizers/suppressants, vegetative materials, or other District-approved control measure shall be applied to unpaved vehicle travel areas as required to limit Visible Dust Emissions .to 20% opacity and comply with the requirements for a stabilized unpaved road as defined in Section 3.59 of DistrictRule 8011. [District Rules 8011 and 8071]
77. Where dusting materials are allowed to accumulate on paved surfaces, the accumulation shall be removed daily orwater and/or chemical/organic dust stabilizers/suppressants shall be applied to the paved surface as required tomaintain continuous compliance with the requirements for a stabilized unpaved road as defined in Section 3.59 ofDistrict Rule 8011 and limit Visible Dust Emissions (VDE) to 20% opacity. [District Rules 8011 and 8071]
CONDITIONS FOR APPLICATION C-7220-1-0
PCO. Theime intervals,
of excess (if known), corrective actions taken andthe averaging period
t !I? licable timer _.. r I :nd span checks,s. 1, • occurred. [District
0.7220.1 .0: 26 2010 n TP,A- MILO"

CONDITIONS FOR APPLICATION C-7220-1-0 D f7711
Page 7 of 7
78. On each day that 50 or more Vehicle Daily Trips or 25 or morv 4 ail will occur onan unpaved vehicle/equipment traffic area, permittee shall apply water, gravel, roa mix, or anic duststabilizers/suppressants, vegetative materials, or other Dis•ved control measure as required to limit VisibleDust Emissions to 20% opacity and comply with the requ c t dpv.,jd.as defined in Section3.59 of District Rule 8011. [District Rules 8011 and 8071
79. Whenever any portion of the site becomes inactive, Permittee shall restriciac'es Lijy tbilize anydisturbed surface to comply with the conditions for a stabilized surface as defined in Section 3.58 o District Rule8011. [District Rules 8011 and 8071]
80. Records and other supporting documentation shall be maintained as required to demonstrate compliance with therequirements of the rules under Regulation VIII only for those days that a control measure was implemented. Suchrecords shall include the type of control measure(s) used, the location and extent of coverage, and the date, amount,and frequency of application of dust suppressant, manufacturer's dust suppressant product information sheet thatidentifies the name of the dust suppressant and application instructions. Records shall be kept for one year followingproject completion that results in the termination of all dust generating activities. [District Rules 8011, 8031, and 8071]
C-7220. 1 .0 : Art 28 2010 1 47P1.4- AVILA,

CONDITIONS FOR APPLICATION C-7220-2-0
PANOCHE ENERGYIo_LC43883 W PANOCHEFIREBAUGH, CA 93 0
W PANOCHE RDFIREBAUGH, CA
Page 1 of 7
E: 12/19/2007
LEGAL OWNER OR OPERATOR:MAILING ADDRESS:
LOCATION:
INSPECT PROGRAM PARTICIPANT: NO
EQUIPMENT DESCRIPTION:100 MW SIMPLE-CYCLE POWER GENERATING SYSTEM #2 CONSISTING OF A GENERAL ELECTRIC LMS100NATURAL GAS-FIRED COMBUSTION TURBINE GENERATOR SERVED BY A SELECTIVE CATALYTIC REDUCTION(SCR) SYSTEM AND AN OXIDATION CATALYST
CONDITIONS1. Prior to initial operation of C-7220-1, 2, '3, and '4, permittee shall provide NOX emission reduction credits for the
following quantity of emissions: 1st quarter - 38,249 lb, 2nd quarter - 38,249 lb, 3rd quarter -55,635 lb, and fourthquarter -41,726 lb. Offsets shall be provided at the applicable offset ratio specified in Table 4-2 of Rule 2201 (asamended 9/21/06). [District Rule 2201]
2. Prior to initial operation of C-7220-1, '2, '3, and '4, permittee shall provide PM10 emission reduction credits for thefollowing quantity of emissions: 1st quarter - 20,364 lb, 2nd quarter - 20,364 lb, 3rd quarter - 29,620 lb, and fourthquarter -22,215 lb. Offsets shall be provided at the applicable offset ratio specified in Table 4-2 of Rule 2201 (asamended 9/21/06). SOx ERCs may be used to offset PM 10 increases at an interpollutant ratio of 1.867 lb-S0x : 1.0 lb-PM10. [District Rule 2201]
3. Prior to initial operation of C-7220-1, '2, '3, and '4, permittee shall provide VOC emission reduction credits for thefollowing quantity of emissions: 1st quarter - 8,953 lb, 2nd quarter - 8,953 lb, 3rd quarter - 13,023 lb, and fourthquarter -9,767 lb. Offsets shall be provided at the applicable offset ratio specified in Table 4-2 of Rule 2201 (asamended 9/21/06). [District Rule 2201]
4. ERC Certificate Numbers S-2437-2, S-2362-2, S-2431-4, S-2432-4, S-2433-4, S-2434-4, S-2436-4, S-2435-4, N-559-5, N-591-5, S-2465-1 (or certificates split from these certificates) shall be used to supply the required offsets, unless arevised offsetting proposal is received and approved by the District, upon which this Determination of Complianceshall be reissued, administratively specifying the new offsetting proposal. Original public noticing requirements, ifany, shall be duplicated prior to reissuance of this Determination of Compliance. [District Rule 2201]
5. Permittee shall submit an application to comply with Rule 2520 - Federally Mandated Operating Permits within twelvemonths of commencing operation. [District Rule 2520]
6. Permittee shall submit an application to comply with Rule 2540 - Acid Rain Program within twelve months ofcommencing operation. [District Rule 2540]
7. The owner/operator of the Panoche Energy Center Power Plant (PECPP) shall minimize the emissions from the gasturbine to the maximum extent possible during the commissioning period. Conditions #8 through #18 shall apply onlyduring the commissioning period as defined below. Unless otherwise indicated, Conditions #20 through #80 shallapply after the commissioning period has ended. [District Rule 2201]
8. Commissioning activities are defined as, but not limited to, all testing, adjustment, tuning, and calibration activitiesrecommended by the equipment manufacturers and the PEC construction contractor to insure safe and reliable steadystate operation of the gas turbines and associated electrical delivery systems. [District Rule 2201]
9. Commissioning period shall commence when all mechanical, electrical, and control systems are installed andindividual system startup has been completed, or when a gas turbine is first fired, whichever occurs first. Thecommissioning period shall terminate when the plant has completed initial performance testing, completed final planttuning, and is available for commercial operation. [District Rule 2201]
10. No more than two of the turbines operating under C-7220-1, C-7220-2, C-7220-3 or C-7220-4 shall be commissionedat any one time. [District Rule 22011
C.7220.20: Op 26 2010 1 01PAI - AV1Ull

CONDITIONS FOR APPLICATION C-7220-2-0
11. At the earliest feasible opportunity, in accordance with the rmied 1nsconstruction contractor, the combustors of this unit shall be tuned to minimize emissions.
Page 2 of 7
urer and the2201]
12. At the earliest feasible opportunity, in accordance with thconstruction contractor, the Selective Catalytic Reductionadjusted, and operated to minimize emissions from this u
the equipment manufacturer and the11 be installed,
13. Coincident with the steady-state operation of the SCR system and the oxidation catalys a . ddsrdter than 50% andafter installation and tuning of the emission controls, NOx, CO, and VOC emissions from this unit shall comply withthe limits specified in condition #36. [District Rule 2201]
14. The permittee shall submit a plan to the District at least four weeks prior to the first firing of this unit, describing theprocedures to be followed during the commissioning period. The plan shall include a description of eachcommissioning activity, the anticipated duration of each activity in hours, and the purpose of the activity, The activitiesdescribed shall include, but not limited to, the tuning of the combustors, the installation and operation of the SCRsystem and the oxidation catalyst, the installation, calibration, and testing of the NOx and CO continuous emissionsmonitors, and any activities requiring the firing of this unit without abatement by the SCR system or oxidation catalyst.[District Rule 2201]
15. Emission rates from the CTG, during the commissioning period, shall not exceed any of the following limits: NOx (asNO2) - 187.00 lb/hr; PM10 -6.00 lb/hr; CO -309.75 lb/hr; or VOC (as methane) - 17.14 lb/hr. [District Rule 2201]
16. During the commissioning period, the permittee shall demonstrate NOx and CO compliance with condition #15through the use of properly operated and maintained continuous emissions monitors and recorders as specified incondition #12. The monitored parameters for this unit shall be recorded at least once every 15 minutes (excludingnormal calibration periods or when the monitored source is not in operation). [District Rule 2201]
17. The continuous emissions monitors specified in these permit conditions shall be installed, calibrated and operationalprior to the first firing of the unit. After first firing, the detection range of the CEMS shall be adjusted as necessary toaccurately measure the resulting range of NOx and CO emissions concentrations. [District Rule 2201]
18. The total number of firing hours of this unit without abatement of emissions by the SCR system and the oxidationcatalyst of units C-7220-1, '2, '3, and '4 shall not exceed 800 hours total during the commissioning period. Suchoperation of this unit without abatement shall be limited to discrete commissioning activities that can only be properlyexecuted without the SCR system and the oxidation catalyst in place. Upon completion of these activities, thepermittee shall provide written notice to the District and the unused balance of the 800 firing hours without abatementshall expire. Records of the commissioning hours of operation for units C-7220-1, '2, '3, and '4 shall be maintained.[District Rule 2201]
19. The total mass emissions of NOx, S0x, PM10, CO, and VOC that are emitted during the commissioning period shallaccrue towards the consecutive twelve month emission limits specified in condition #38. NOx and CO total massemissions will be determined from CEMs data and S0x, PM 10, and VOC total mass emissions will be calculated.[District Rule 2201]
20. A selective catalytic reduction (SCR) system and an oxidation catalyst shall serve the gas turbine engine. Exhaustducting may be equipped (if required) with a fresh air inlet blower to be used to lower the exhaust temperature prior toinlet of the SCR system catalyst. The permittee shall submit SCR and oxidation catalyst design details to the Districtat least 30 days prior to commencement of construction. [District Rule 2201]
21. Permittee shall submit continuous emission monitor design, installation, and operational details to the District at least30 days prior to commencement of construction. [District Rule 2201]
22. The permittee shall submit to the District information correlating the NOx control system operating parameters to theassociated measured NOx output. The information must be sufficient to allow the District to determine compliancewith the NOx emission limits of this permit when no continuous emission monitoring data for NOx is available orwhen the continuous emission monitoring system is not operating properly. [District Rule 4703]
23. All equipment shall be maintained in good operating condition and shall be operated in a manner to minimizeemissions of air contaminants into the atmosphere. [District Rule 2201]
24. No air contaminant shall be released into the atmosphere which causes a public nuisance. [District Rule 4102]
C-7220.2-0 : Apr 25 2010 1 . 47PM - AVILA/
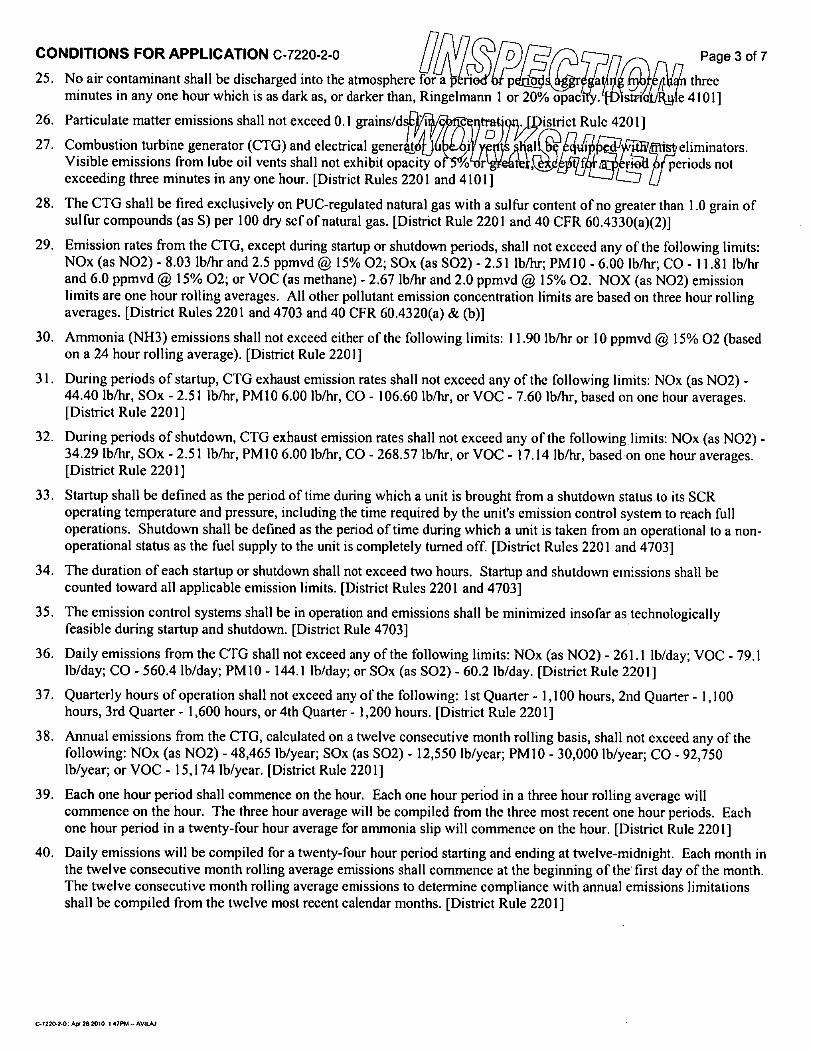
CONDITIONS FOR APPLICATION C-7220-2-0 Page 3 of 7pi- t25. No air contaminant shall be discharged into the atmosphere for a . p a 03 At threeminutes in any one hour which is as dark as, or darker than, Ringelmann 1 or 20% °pact . 0 i. Rg e 4101]
26. Particulate matter emissions shall not exceed 0.1 grains/d 'strict Rule 42011
27. Combustion turbine generator (CTG) and electrical gene4t,eliminators.Visible emissions from lube oil vents shall not exhibit opacity o /0 r periods notexceeding three minutes in any one hour. [District Rules 2201 and 4101]
28. The CTG shall be fired exclusively on PUC-regulated natural gas with a sulfur content of no greater than 1.0 grain ofsulfur compounds (as S) per 100 dry scf of natural gas. [District Rule 2201 and 40 CFR 60.4330(a)(2)]
29. Emission rates from the CTG, except during startup or shutdown periods, shall not exceed any of the following limits:NOx (as NO2) - 8.03 lb/hr and 2.5 ppmvd @ 15% 02; SOx (as S02) - 2.51 lb/hr; PM 10 - 6.00 lb/hr; CO - 11.81 lb/hrand 6.0 ppmvd @ 15% 02; or VOC (as methane) -2.67 lb/hr and 2.0 ppmvd @ 15% 02. NOX (as NO2) emissionlimits are one hour rolling averages. All other pollutant emission concentration limits are based on three hour rollingaverages. [District Rules 2201 and 4703 and 40 CFR 60.4320(a) & (b)]
30. Ammonia (NH3) emissions shall not exceed either of the following limits: 11.90 lb/hr or 10 ppmvd @ 15% 02 (basedon a 24 hour rolling average). [District Rule 2201]
31. During periods of startup, CTG exhaust emission rates shall not exceed any of the following limits: NOx (as NO2) -44.40 lb/hr, SOx -2.51 lb/hr, PM10 6.00 lb/hr, CO - 106.60 lb/hr, or VOC -7.60 lb/hr, based on one hour averages.[District Rule 2201]
32. During periods of shutdown, CTG exhaust emission rates shall not exceed any of the following limits: NOx (as NO2) -34.29 lb/hr, SOx -2.51 lb/hr, PM10 6.00 lb/hr, CO -268.57 lb/hr, or VOC - 17.14 lb/hr, based on one hour averages.[District Rule 2201]
33. Startup shall be defined as the period of time during which a unit is brought from a shutdown status to its SCRoperating temperature and pressure, including the time required by the unit's emission control system to reach fulloperations. Shutdown shall be defined as the period of time during which a unit is taken from an operational to a non-operational status as the fuel supply to the unit is completely turned off. [District Rules 2201 and 4703]
34. The duration of each startup or shutdown shall not exceed two hours. Startup and shutdown emissions shall becounted toward all applicable emission limits. [District Rules 2201 and 4703]
35. The emission control systems shall be in operation and emissions shall be minimized insofar as technologicallyfeasible during startup and shutdown. [District Rule 4703]
36. Daily emissions from the CTG shall not exceed any of the following limits: NOx (as NO2) -261.1 lb/day; VOC -79.1lb/day; CO -560.4 lb/day; PMIO - 144.1 lb/day; or SOx (as S02) -60.2 lb/day. [District Rule 2201]
37. Quarterly hours of operation shall not exceed any of the following: 1st Quarter - 1,100 hours, 2nd Quarter - 1,100hours, 3rd Quarter - 1,600 hours, or 4th Quarter - 1,200 hours. [District Rule 2201]
38. Annual emissions from the CTG, calculated on a twelve consecutive month rolling basis, shall not exceed any of thefollowing: NOx (as NO2) -48,465 lb/year; SOx (as SO2) - 12,550 lb/year; PM10 -30,000 lb/year; CO -92,750lb/year; or VOC - 15,174 lb/year. [District Rule 2201]
39. Each one hour period shall commence on the hour. Each one hour period in a three hour rolling average willcommence on the hour. The three hour average will be compiled from the three most recent one hour periods. Eachone hour period in a twenty-four hour average for ammonia slip will commence on the hour. [District Rule 2201]
40. Daily emissions will be compiled for a twenty-four hour period starting and ending at twelve-midnight. Each month inthe twelve consecutive month rolling average emissions shall commence at the beginning of the first day of the month.The twelve consecutive month rolling average emissions to determine compliance with annual emissions limitationsshall be compiled from the twelve most recent calendar months. [District Rule 2201]
C-7220-20: Apr 28 2010 1 47PM - AVIOJ

CONDITIONS FOR APPLICATION C-7220-2-0 Page 4 of 7
41. Compliance with the ammonia emission limits shall be demons e dures: 1)calculate the daily ammonia emissions using the following equation: (ppmvd @ 15 0 ( 1,000,000)) x
;(1,000,000 / b)) x d, where a = average ammonia injection • i• ) / 17 lb/lb mol), b = dry exhaust flow rate (lb/hr)/ (29 lb/lb mol), c = change in measured NOx concentrati• s atalyst, and d = correctionfactor. The correction factor shall be derived annually du i • I
• c t m sured andcalculated ammonia slip; 2.) Utilize another District-approved ca cul - • • ph-4 :), gateparameters to determine the daily ammonia emissions in ppmvd @ 15% 02. If this option -11--oldn, the permitteeshall submit a detailed calculation protocol for District approval at least 60 days prior to commencement of operation;3.) Alternatively, the permittee may utilize a continuous in-stack ammonia monitor to verify compliance with theammonia emissions limit. If this option is chosen, the permittee shall submit a monitoring plan for District approval atleast 60 days prior to commencement of operation. [District Rule 2201]
42. Source testing to measure startup and shutdown NOx, CO, and VOC mass emission rates shall be conducted for one ofthe gas turbines (C-7220-1, C-7220-2, C-7220-3, or C-7220-4) prior to the end of the commissioning period and atleast once every seven years thereafter. CEM relative accuracy shall be determined during startup source testing inaccordance with 40 CFR 60, Appendix B. If CEM data is not certifiable to determine compliance with NOx and COstartup emission limits, then source testing to measure startup NOx and CO mass emission rates shall be conducted atleast once every 12 months. [District Rule 1081]
43. Hazardous Air Pollutant (HAP) emissions shall not exceed 25 tpy all HAPS or 10 tpy any single HAP. [District Rule4002]
44. Permittee shall conduct an initial speciated HAPS and total VOC source test for one of the GTEs (C-7220-1, '2, '3 or'4), by District witnessed in situ sampling of exhaust gases by a qualified independent source test firm. PEC shallcorrelate the total HAPS emissions rate and the single highest HAP emission rate to the VOC mass emissiondetermined during the speciated HAPs source test. Initial and annual compliance with the HAPS emissions limit (25tpy all HAPs or 10 tpy any single HAP) Shall be demonstrated by the combined VOC emissions rates for the GTEs (C-7220-1, '2, '3, and '4) determined during initial and annual compliance source testing and the correlation between VOCemissions and HAP(s). [District Rule 4002]
45. Source testing to measure the NOx, CO, VOC, and NH3 emission rates (lb/hr and ppmvd @ 15% 02) and PMIOemission rate (lb/hr) shall be conducted within 120 days after initial operation and at least once every twelve monthsthereafter. [District Rules 1081 and 4703 and 40 CFR 60.4400(a)]
46. The sulfur content of each fuel source shall be: (i) documented in a valid purchase contract, a supplier certification, atariff sheet or transportation contract or (ii) shall be demonstrated within 60 days after the end of the commissioningperiod and monitored weekly thereafter. If the sulfur content is demonstrated to be less than 1.0 gr/100 scf for eightconsecutive weeks, then the monitoring frequency shall be every six months. If the result of any six month monitoringdemonstrates that the fuel does not meet the fuel sulfur content limit, weekly monitoring shall resume. [40 CFR60.4360, 60.4365(a) and 60.4370(c)]
47. The following test methods shall be used: NOx - EPA Method 7E or 20, PM10 - EPA Method 5/202 (front half andback half), CO - EPA Method 10 or 10B, 02- EPA Method 3, 3A, or 20, VOC - EPA Method 18 or 25, and ammonia- EPA Method 206. EPA approved alternative test methods as approved by the District may also be used to addressthe source testing requirements of this permit. The request to utilize EPA approved alternative source testing methodsmust be submitted in writing and written approval received from the District prior to the submission of the source testplan. [District Rules 1081 and 4703 and 40 CFR 60.4400(1)(i)]
48. HHV and LHV of the fuel shall be determined using ASTM D3588, ASTM 1826, or ASTM 1945. [40 CFR60.332(a),(b) and District Rule 4703, 6.4.5]
49. Fuel sulfur content shall be monitored using one of the following methods: ASTM Methods D1072, D3246, D4084,D4468, D4810, D6228, D6667 or Gas Processors Association Standard 2377. [40 CFR 60.4415(a)(1)(0]
50. The exhaust stack shall be equipped with permanent provisions to allow collection of stack gas samples consistent withEPA test methods and shall be equipped with safe permanent provisions to sample stack gases with a portable NOx,CO, and 02 analyzer during District inspections. The sampling ports shall be located in accordance with the CARBregulation titled California Air Resources Board Air Monitoring Quality Assurance Volume VI, Standard OperatingProcedures for Stationary Source Emission Monitoring and Testing. [District Rule 1080]
C.72202-0: Apr 28 2010 1 {TRA - AVILA)

CONDITIONS FOR APPLICATION C-7220-2-0 Page 5 of 7
51 Compliance demonstration (source testing) shall be District wi e se ut a • I 9- collected bya certified testing laboratory. Source testing shall be conducted using the methods and pro d. • • sved by theDistrict. The District must be notified 30 days prior to any • • • 40: .ce source test, and a source test plan must besubmitted for approval 15 days prior to testing. The resul • . s itted to the District within60 days thereafter. [District Rule 1081]
52. The turbine shall be equipped with a continuous monitoring system to measure . • aRules 2201 and 4703 and 40 CFR 60.4335(b)(1)]
53. The owner or operator shall install, certify, maintain, operate and quality-assure a Continuous Emission MonitoringSystem (CEMS) which continuously measures and records the exhaust gas NOx, CO and 02 concentrations.Continuous emissions monitor(s) shall be capable of monitoring emissions during normal operating conditions, andduring startups and shutdowns provided the CEMS pass the relative accuracy requirement for startups and shutdownsspecified herein. If relative accuracy of CEMS cannot be demonstrated during startup conditions, CEMS resultsduring startup and shutdown events shall be replaced with startup emission rates obtained from source testing todetermine compliance with emission limits contained in this document. [District Rules 1080, 2201, and 4703 and 40CFR 60.4335(b)(1)]
54. The CEMS shall complete a minimum of one cycle of operation (sampling, analyzing, and data recording) for eachsuccessive 15-minute period or shall meet equivalent specifications established by mutual agreement of the District,the ARB and the EPA. [District Rule 1080 and 40 CFR 60.4345(b)]
55. The NOx, CO and 02 CEMS shall meet the requirements in 40 CFR 60, Appendix F Procedure 1 and Part 60,Appendix B Performance Specification 2 (PS 2), or shall meet equivalent specifications established by mutualagreement of the District, the ARB, and the EPA. [District Rule 1080 and 40 CFR 60.4345(a)]
56. Audits of continuous emission monitors shall be conducted quarterly, except during quarters in which relative accuracyand total accuracy testing is performed, in accordance with EPA guidelines. The District shall be notified prior tocompletion of the audits. Audit reports shall be submitted along with quarterly compliance reports to the District.[District Rule 1080]
57. The owner/operator shall perform a relative accuracy test audit (RATA) for the NOx, CO, and 02 CEMs as specifiedby 40 CFR Part 60, Appendix F, 5.11, at least once every four calendar quarters. The permittec shall comply with theapplicable requirements for quality assurance testing and maintenance of the continuous emission monitor equipmentin accordance with the procedures and guidance specified in 40 CFR Part 60, Appendix F. [District Rule 1080]
58. Results of the CEM system shall be averaged over a one hour period for NOx emissions and a three hour period forCO emissions using consecutive 15-minute sampling periods in accordance with all applicable requirements of CFR60.13. [District Rule 4703 and 40 CFR 60.13]
59. Excess emissions shall be defined as any operating hour in which the 4-hour or 30-day rolling average NOXconcentration exceeds applicable emissions limit and a period of monitor downtime shall be any unit operating hour inwhich sufficient data are not obtained to validate the hour for either NOX or 02 (or both). [40 CFR 60.4380(b)(1)]
60. Results of continuous emissions monitoring shall be reduced according to the procedure established in 40 CFR, Part51, Appendix P, paragraphs 5.0 through 5.3.3, or by other methods deemed equivalent by mutual agreement with theDistrict, the ARB, and the EPA. [District Rule 1080]
61. The facility shall install and maintain equipment, facilities, and systems compatible with the District's CEM datapolling software system and shall make CEM data available to the District's automated polling system on a daily basis.[District Rule 1080]
62. Upon notice by the District that the facility's CEM system is not providing polling data, the facility may continue tooperate without providing automated data for a maximum of 30 days per calendar year provided the CEM data is sentto the District by a District-approved alternative method. [District Rule 1080]
63. The owner or operator shall, upon written notice from the APCO, provide a summary of the data obtained from theCEM systems. This summary shall be in the form and the manner prescribed by the APCO. [District Rule 1080]
ption. [District
C-7220, 2-0: *1120 2010 1 42P4 - AVILA.1
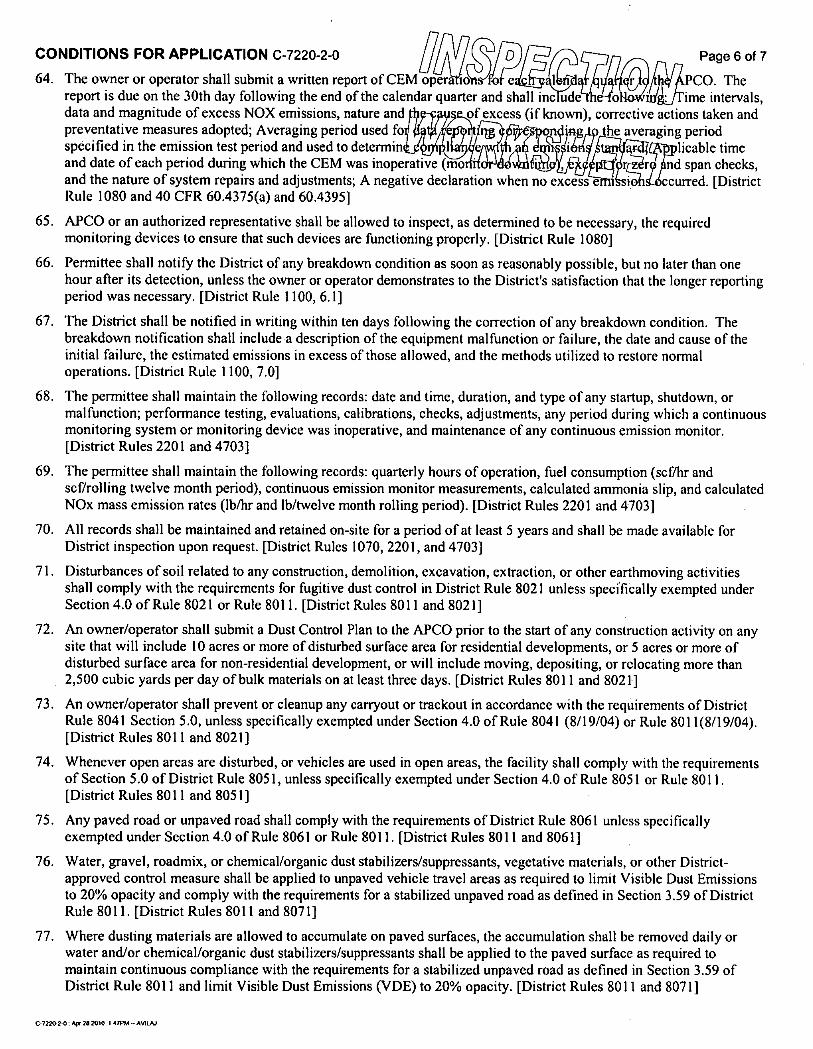
CONDITIONS FOR APPLICATION C-7220-2-0 Page 6 of 7
64. The owner or operator shall submit a written report of CEM opera io o e CO. Thereport is due on the 30th day following the end of the calendar quarter and shall inc ime intervals,data and magnitude of excess NOX emissions, nature and of excess (if known), corrective actions taken andpreventative measures adopted; Averaging period used fo I 6 ." 1 ng • the averaging period
1specified in the emission test period and used to determin 4 I', • • i4 • • • JP licable timeand date of each period during which the CEM was inoperative (mo • . 1 - os'• r ' nd span checks,and the nature of system repairs and adjustments; A negative declaration when no excess e ccurred. [DistrictRule 1080 and 40 CFR 60.4375(a) and 60.4395]
65. APCO or an authorized representative shall be allowed to inspect, as determined to be necessary, the requiredmonitoring devices to ensure that such devices are functioning properly. [District Rule 1080]
66. Permittee shall notify the District of any breakdown condition as soon as reasonably possible, but no later than onehour after its detection, unless the owner or operator demonstrates to the District's satisfaction that the longer reportingperiod was necessary. [District Rule 1100, 6.11
67. The District shall be notified in writing within ten days following the correction of any breakdown condition. Thebreakdown notification shall include a description of the equipment malfunction or failure, the date and cause of theinitial failure, the estimated emissions in excess of those allowed, and the methods utilized to restore normaloperations. [District Rule 1100, 7.0]
68. The permittee shall maintain the following records: date and time, duration, and type of any startup, shutdown, ormalfunction; performance testing, evaluations, calibrations, checks, adjustments, any period during which a continuousmonitoring system or monitoring device was inoperative, and maintenance of any continuous emission monitor.[District Rules 2201 and 4703]
69. The permittee shall maintain the following records: quarterly hours of operation, fuel consumption (scf/hr andscf/rolling twelve month period), continuous emission monitor measurements, calculated ammonia slip, and calculatedNOx mass emission rates (lb/hr and lb/twelve month rolling period). [District Rules 2201 and 4703]
70. All records shall be maintained and retained on-site for a period of at least 5 years and shall be made available forDistrict inspection upon request. [District Rules 1070, 2201, and 4703]
71. Disturbances of soil related to any construction, demolition, excavation, extraction, or other earthmoving activitiesshall comply with the requirements for fugitive dust control in District Rule 8021 unless specifically exempted underSection 4.0 of Rule 8021 or Rule 8011. [District Rules 8011 and 8021]
72. An owner/operator shall submit a Dust Control Plan to the APCO prior to the start of any construction activity on anysite that will include 10 acres or more of disturbed surface area for residential developments, or 5 acres or more ofdisturbed surface area for non-residential development, or will include moving, depositing, or relocating more than2,500 cubic yards per day of bulk materials on at least three days. [District Rules 8011 and 8021]
73. An owner/operator shall prevent or cleanup any carryout or trackout in accordance with the requirements of DistrictRule 8041 Section 5.0, unless specifically exempted under Section 4.0 of Rule 8041 (8/19/04) or Rule 8011(8/19/04).[District Rules 8011 and 8021]
74. Whenever open areas are disturbed, or vehicles are used in open areas, the facility shall comply with the requirementsof Section 5.0 of District Rule 8051, unless specifically exempted under Section 4.0 of Rule 8051 or Rule 8011.[District Rules 8011 and 8051]
75. Any paved road or unpaved road shall comply with the requirements of District Rule 8061 unless specificallyexempted under Section 4.0 of Rule 8061 or Rule 8011. [District Rules 8011 and 8061]
76. Water, gravel, roadmix, or chemical/organic dust stabilizers/suppressants, vegetative materials, or other District-approved control measure shall be applied to unpaved vehicle travel areas as required to limit Visible Dust Emissionsto 20% opacity and comply with the requirements for a stabilized unpaved road as defined in Section 3.59 of DistrictRule 8011. [District Rules 8011 and 8071]
77. Where dusting materials are allowed to accumulate on paved surfaces, the accumulation shall be removed daily orwater and/or chemical/organic dust stabilizers/suppressants shall be applied to the paved surface as required tomaintain continuous compliance with the requirements for a stabilized unpaved road as defined in Section 3.59 ofDistrict Rule 8011 and limit Visible Dust Emissions (VDE) to 20% opacity. [District Rules 8011 and 8071]
C42204-0: 4. 20 2010 I 47Pf..1- AVILA/

CONDITIONS FOR APPLICATION C-7220-2-0 Page 7 of 7
78. On each day that 50 or more Vehicle Daily Trips or 25 or more t ail itM will occur onan unpaved vehicle/equipment traffic area, permittee shall apply water, gravel, roa mix, or anic duststabilizers/suppressants, vegetative materials, or other Dis ved control measure as required to limit VisibleDust Emissions to 20% opacity and comply with the requ road as defined in Section3.59 of District Rule 8011. [District Rules 8011 and 8071
79. Whenever any portion of the site becomes inactive, Permittee shall restricrac&'frM tbilize anydisturbed surface to comply with the conditions for a stabilized surface as defined in Section 3.58 o District Rule8011. [District Rules 8011 and 8071]
80. Records and other supporting documentation shall be maintained as required to demonstrate compliance with therequirements of the rules under Regulation VIII only for those days that a control measure was implemented. Suchrecords shall include the type of control measure(s) used, the location and extent of coverage, and the date, amount,and frequency of application of dust suppressant, manufacturer's dust suppressant product information sheet thatidentifies the name of the dust suppressant and application instructions. Records shall be kept for one year followingproject completion that results in the termination of all dust generating activities. [District Rules 8011, 8031, and 8071]
C-72202.0 : Ap, 28 2010 1 47PAI - AMA,

iglY4.44Page 1 of 7
E: 12/19/2007
LLC
ffk
CONDITIONS FOR APPLICATION C-7220-3-0
LEGAL OWNER OR OPERATOR: PANOCHE ENERGYMAILING ADDRESS: 43883 W PANOCHE
FIREBAUGH, CA 93
LOCATION: W PANOCHE RDFIREBAUGH, CA
INSPECT PROGRAM PARTICIPANT: NO
EQUIPMENT DESCRIPTION:100 MW SIMPLE-CYCLE POWER GENERATING SYSTEM #3 CONSISTING OF A GENERAL ELECTRIC LMS100NATURAL GAS-FIRED COMBUSTION TURBINE GENERATOR SERVED BY A SELECTIVE CATALYTIC REDUCTION(SCR) SYSTEM AND AN OXIDATION CATALYST
CONDITIONS1. Prior to initial operation of C-7220-1, 2, '3, and '4, permittee shall provide NOX emission reduction credits for the
following quantity of emissions: 1st quarter -38,249 lb, 2nd quarter -38,249 lb, 3rd quarter -55,635 lb, and fourthquarter - 41,726 lb. Offsets shall be provided at the applicable offset ratio specified in Table 4-2 of Rule 2201 (asamended 9/21/06). [District Rule 2201]
2. Prior to initial operation of C-7220-1, '2, '3, and '4, permittee shall provide PM10 emission reduction credits for thefollowing quantity of emissions: 1st quarter -20,364 lb, 2nd quarter -20,364 lb, 3rd quarter -29,620 lb, and fourthquarter -22,215 lb. Offsets shall be provided at the applicable offset ratio specified in Table 4-2 of Rule 2201 (asamended 9/21/06). SOx ERCs may be used to offset PM10 increases at an interpollutant ratio of 1.867 lb-S0x : 1.0 lb-PM10. [District Rule 2201]
3. Prior to initial operation of C-7220-1, '2, '3, and '4, permittee shall provide VOC emission reduction credits for thefollowing quantity of emissions: 1st quarter -8,953 lb, 2nd quarter - 8,953 lb, 3rd quarter - 13,023 lb, and fourthquarter -9,767 lb. Offsets shall be provided at the applicable offset ratio specified in Table 4-2 of Rule 2201 (asamended 9/21/06). [District Rule 2201]
4. ERC Certificate Numbers S-2437-2, S-2362-2, S-2431-4, S-2432-4, S-2433-4, S-2434-4, S-2436-4, S-2435-4, N-559-5, N-591-5, S-2465-1 (or certificates split from these certificates) shall be used to supply the required offsets, unless arevised offsetting proposal is received and approved by the District, upon which this Determination of Complianceshall be reissued, administratively specifying the new offsetting proposal. Original public noticing requirements, ifany, shall be duplicated prior to reissuance of this Determination of Compliance. [District Rule 2201]
5. Permittee shall submit an application to comply with Rule 2520 - Federally Mandated Operating Permits within twelvemonths of commencing operation. [District Rule 2520]
6. Permittee shall submit an application to comply with Rule 2540 - Acid Rain Program within twelve months ofcommencing operation. [District Rule 2540]
7. The owner/operator of the Panoche Energy Center Power Plant (PECPP) shall minimize the emissions from the gasturbine to the maximum extent possible during the commissioning period. Conditions #8 through #18 shall apply onlyduring the commissioning period as defined below. Unless otherwise indicated, Conditions #20 through #80 shallapply after the commissioning period has ended. [District Rule 2201]
8. Commissioning activities are defined as, but not limited to, all testing, adjustment, tuning, and calibration activitiesrecommended by the equipment manufacturers and the PEC construction contractor to insure safe and reliable steadystate operation of the gas turbines and associated electrical delivery systems. [District Rule 2201]
9. Commissioning period shall commence when all mechanical, electrical, and control systems are installed andindividual system startup has been completed, or when a gas turbine is first fired, whichever occurs first. Thecommissioning period shall terminate when the plant has completed initial performance testing, completed final planttuning, and is available for commercial operation. [District Rule 2201]
10. No more than two of the turbines operating under C-7220-1, C-7220-2, C-7220-3 or C-7220-4 shall be commissionedat any one time. [District Rule 2201]
0. 7220-3-0 : Apr 28 2010 1 47PN1- AV1LPJ
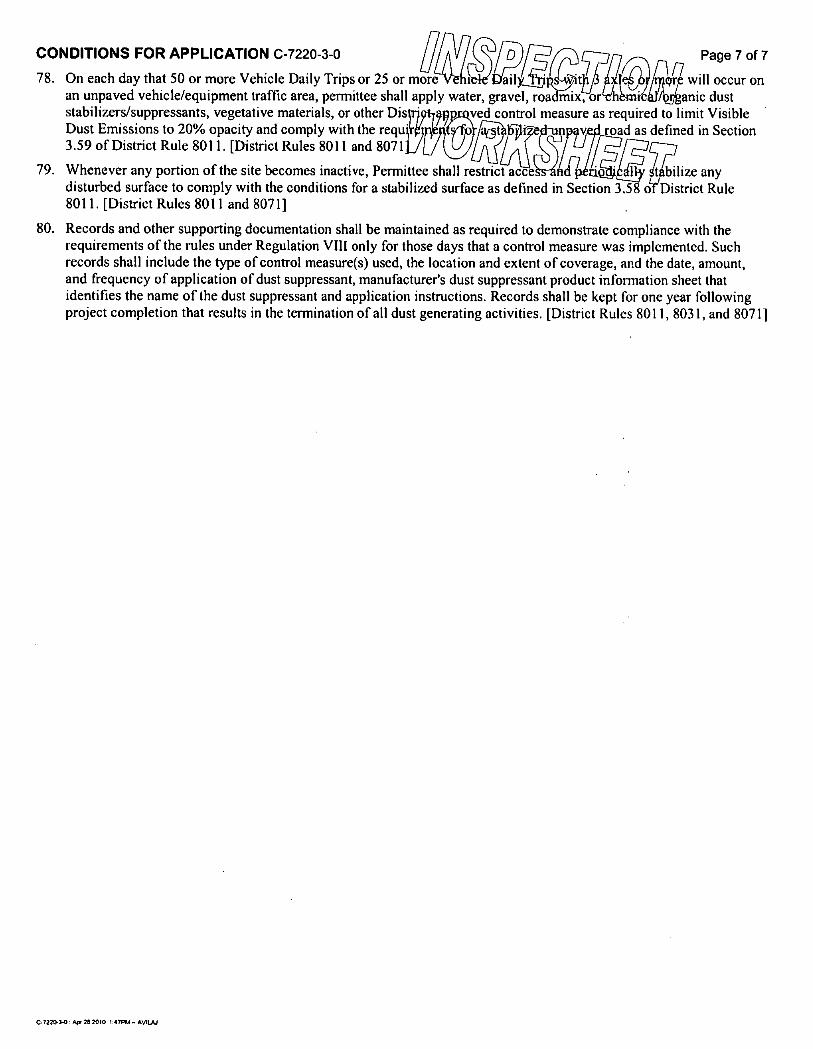
CONDITIONS FOR APPLICATION C-7220-3-0
llZ31 1V
Page 7 of 7
78. On each day that 50 or more Vehicle Daily Trips or 25 or more t ai11 will occur onan unpaved vehicle/equipment traffic area, permittee shall apply water, gravel, roa mix, or / anic duststabilizers/suppressants, vegetative materials, or other Dis s ved control measure as required to limit VisibleDust Emissions to 20% opacity and comply with the requ' • - Ozi aot j sv road as defined in Section3.59 of District Rule 8011. [District Rules 8011 and 8071
79. Whenever any portion of the site becomes inactive, Permittee shall restrict acce
s
I t bilize anydisturbed surface to comply with the conditions for a stabilized surface as defined in Section 3.58 o District Rule8011. [District Rules 8011 and 8071]
80. Records and other supporting documentation shall be maintained as required to demonstrate compliance with therequirements of the rules under Regulation VIII only for those days that a control measure was implemented. Suchrecords shall include the type of control measure(s) used, the location and extent of coverage, and the date, amount,and frequency of application of dust suppressant, manufacturer's dust suppressant product information sheet thatidentifies the name of the dust suppressant and application instructions. Records shall be kept for one year followingproject completion that results in the termination of all dust generating activities. [District Rules 8011, 8031, and 80711
C-7220-3-O: A 28 2010 1 11181.1 -

ig4 Page 1 of 7
E: 12/19/2007
SekCONDITIONS FOR APPLICATION C-7220 -4 -0
LEGAL OWNER OR OPERATOR: PANOCHE ENERGY RLLCMAILING ADDRESS: 43883 W PANOCHE
FIREBAUGH, CA 93
LOCATION: W PANOCHE RDFIREBAUGH, CA
INSPECT PROGRAM PARTICIPANT: NO
EQUIPMENT DESCRIPTION:100 MW SIMPLE-CYCLE POWER GENERATING SYSTEM #4 CONSISTING OF A GENERAL ELECTRIC LMS100NATURAL GAS-FIRED COMBUSTION TURBINE GENERATOR SERVED BY A SELECTIVE CATALYTIC REDUCTION(SCR) SYSTEM AND AN OXIDATION CATALYST
CONDITIONS1. Prior to initial operation of C-7220-1, 2, '3, and '4, permittee shall provide NOX emission reduction credits for the
following quantity of emissions: 1st quarter -38,249 lb, 2nd quarter - 38,249 lb, 3rd quarter -55,635 lb, and fourthquarter -41,726 lb. Offsets shall be provided at the applicable offset ratio specified in Table 4-2 of Rule 2201 (asamended 9/21/06). [District Rule 2201]
2. Prior to initial operation of C-7220-1, '2, '3, and '4, permittee shall provide PM10 emission reduction credits for thefollowing quantity of emissions: 1st quarter - 20,364 lb, 2nd quarter -20,364 lb, 3rd quarter -29,620 lb, and fourthquarter - 22,215 lb. Offsets shall be provided at the applicable offset ratio specified in Table 4-2 of Rule 2201 (asamended 9/21/06). SOx ERCs may be used to offset PMIO increases at an interpollutant ratio of 1.867 lb-S0x : 1.0 lb-PMIO. [District Rule 2201]
3. Prior to initial operation of C-7220-1, '2, '3, and '4, permittee shall provide VOC emission reduction credits for thefollowing quantity of emissions: 1st quarter -8,953 lb, 2nd quarter - 8,953 lb, 3rd quarter - 13,023 lb, and fourthquarter -9,767 lb. Offsets shall be provided at the applicable offset ratio specified in Table 4-2 of Rule 2201 (asamended 9/21/06). [District Rule 2201]
4. ERC Certificate Numbers S-2437-2, S-2362-2, S-2431-4, S-2432-4, S-2433-4, S-2434-4, S-2436-4, S-2435-4, N-559-5, N-591-5, S-2465-1 (or certificates split from these certificates) shall be used to supply the required offsets, unless arevised offsetting proposal is received and approved by the District, upon which this Determination of Complianceshall be reissued, administratively specifying the new offsetting proposal. Original public noticing requirements, ifany, shall be duplicated prior to reissuance of this Determination of Compliance. [District Rule 2201]
5. Permittee shall submit an application to comply with Rule 2520 - Federally Mandated Operating Permits within twelvemonths of commencing operation. [District Rule 2520]
6. Permittee shall submit an application to comply with Rule 2540 - Acid Rain Program within twelve months ofcommencing operation. [District Rule 2540]
7. The owner/operator of the Panoche Energy Center Power Plant (PECPP) shall minimize the emissions from the gasturbine to the maximum extent possible during the commissioning period. Conditions #8 through #18 shall apply onlyduring the commissioning period as defined below. Unless otherwise indicated, Conditions #20 through #80 shallapply after the commissioning period has ended. [District Rule 2201]
8. Commissioning activities are defined as, but not limited to, all testing, adjustment, tuning, and calibration activitiesrecommended by the equipment manufacturers and the PEC construction contractor to insure safe and reliable steadystate operation of the gas turbines and associated electrical delivery systems. [District Rule 2201]
9. Commissioning period shall commence when all mechanical, electrical, and control systems are installed andindividual system startup has been completed, or when a gas turbine is first fired, whichever occurs first. Thecommissioning period shall terminate when the plant has completed initial performance testing, completed final planttuning, and is available for commercial operation. [District Rule 2201]
10. No more than two of the turbines operating under C-7220-1, C-7220-2, C-7220-3 or C-7220-4 'shall be commissionedat any one time. [District Rule 2201]
C-7220+0 : Ars 28 2010 1A7PIA — AVILA!
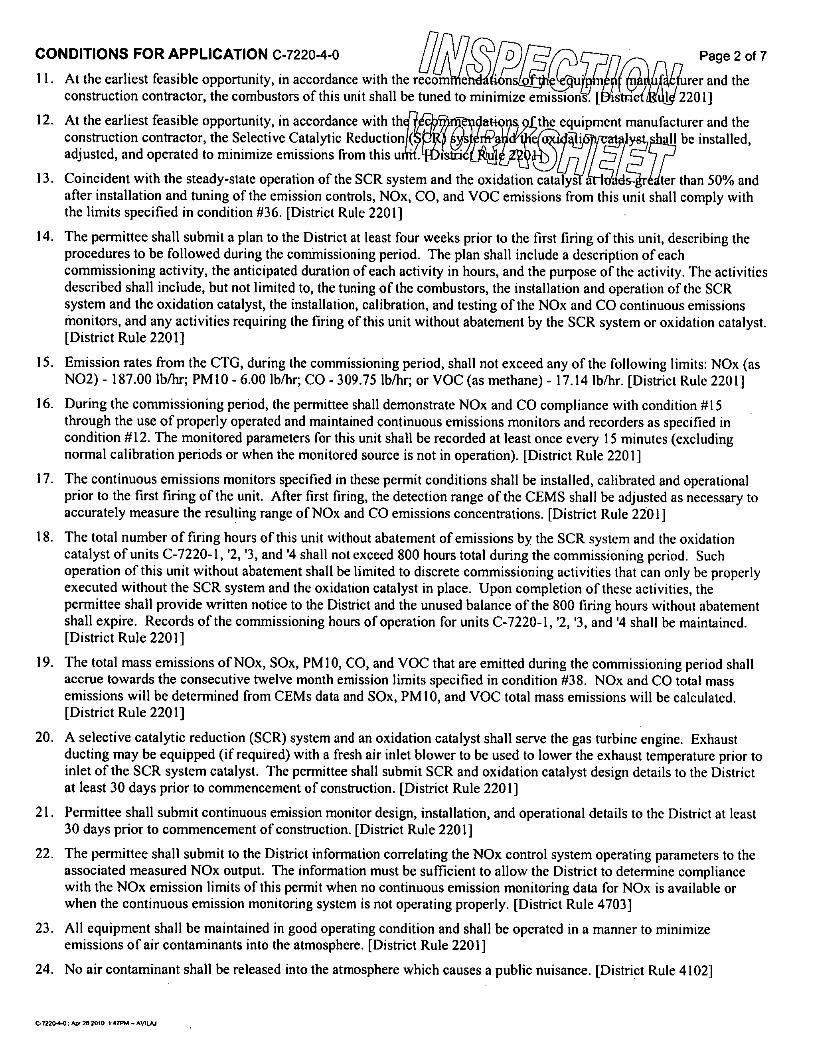
CONDITIONS FOR APPLICATION C-7220-4-0
llbrZPE467 . re Page 2 of 7
11. At the earliest feasible opportunity, in accordance with the recom e in i . .. :1 • 01 r and theconstruction contractor, the combustors of this unit shall be tuned to minimize emissions. [ istri it l• 2201]
i12. At the earliest feasible opportunity, in accordance with thi - i'" • ; ' • • the equipment manufacturer and theconstruction contractor, the Selective Catalytic Reduction ir i -rii) . i • - ii • . • • . : II be installed,adjusted, and operated to minimize emissions from this u . )is.tri A , ' P I. b
13. Coincident with the steady-state operation of the SCR system and the oxidation catalys a • s- ter than 50% andafter installation and tuning of the emission controls, NOx, CO, and VOC emissions from this unit shall comply withthe limits specified in condition #36. [District Rule 2201] -
14. The permittee shall submit a plan to the District at least four weeks prior to the first firing of this unit, describing theprocedures to be followed during the commissioning period. The plan shall include a description of eachcommissioning activity, the anticipated duration of each activity in hours, and the purpose of the activity. The activitiesdescribed shall include, but not limited to, the tuning of the combustors, the installation and operation of the SCRsystem and the oxidation catalyst, the installation, calibration, and testing of the NOx and CO continuous emissionsMonitors, and any activities requiring the firing of this unit without abatement by the SCR system or oxidation catalyst.[District Rule 2201]
15. Emission rates from the CTG, during the commissioning period, shall not exceed any of the following limits: NOx (asNO2) - 187.00 lb/hr; PM10 -6.00 lb/hr; CO -309.75 lb/hr; or VOC (as methane) - 17.14 lb/hr. [District Rule 2201]
16. During the commissioning period, the permittee shall demonstrate NOx and CO compliance with condition #15through the use of properly operated and maintained continuous emissions monitors and recorders as specified incondition #12. The monitored parameters for this unit shall be recorded at least once every 15 minutes (excludingnormal calibration periods or when the monitored source is not in operation). [District Rule 2201]
17. The continuous emissions monitors specified in these permit conditions shall be installed, calibrated and operationalprior to the first firing of the unit. After first firing, the detection range of the CEMS shall be adjusted as necessary toaccurately measure the resulting range of NOx and CO emissions concentrations. [District Rule 2201]
18. The total number of firing hours of this unit without abatement of emissions by the SCR system and the oxidationcatalyst of units C-7220-1, '2, '3, and '4 shall not exceed 800 hours total during the commissioning period. Suchoperation of this unit without abatement shall be limited to discrete commissioning activities that can only be properlyexecuted without the SCR system and the oxidation catalyst in place. Upon completion of these activities, thepermittee shall provide written notice to the District and the unused balance of the 800 firing hours without abatementshall expire. Records of the commissioning hours of operation for units C-7220-1, '2, '3, and '4 shall be maintained.[District Rule 2201]
19. The total mass emissions of NOx, S0x, PM 10, CO, and VOC that are emitted during the commissioning period shallaccrue towards the consecutive twelve month emission limits specified in condition #38. NOx and CO total massemissions will be determined from CEMs data and S0x, PM 10, and VOC total mass emissions will be calculated.[District Rule 2201]
20. A selective catalytic reduction (SCR) system and an oxidation catalyst shall serve the gas turbine engine. Exhaustducting may be equipped (if required) with a fresh air inlet blower to be used to lower the exhaust temperature prior toinlet of the SCR system catalyst. The permittee shall submit SCR and oxidation catalyst design details to the Districtat least 30 days prior to commencement of construction. [District Rule 2201]
21. Permittee shall submit continuous emission monitor design, installation, and operational details to the District at least30 days prior to commencement of construction. [District Rule 2201]
22. The permittee shall submit to the District information correlating the NOx control system operating parameters to theassociated measured NOx output. The information must be sufficient to allow the District to determine compliancewith the NOx emission limits of this permit when no continuous emission monitoring data for NOx is available orwhen the continuous emission monitoring system is not operating properly. [District Rule 4703]
23. All equipment shall be maintained in good operating condition and shall be operated in a manner to minimizeemissions of air contaminants into the atmosphere. [District Rule 2201]
24. No air contaminant shall be released into the atmosphere which causes a public nuisance. [District Rule 4102]
C-7220-4.O: 28 2010 147P51- AVILA1

a r p a I(minutes in any one hour which is as dark as, or darker than, Ringelmann 1 or 20% opaci .
25. No air contaminant shall be discharged into the atmosphere forg
CONDITIONS FOR APPLICATION C-7220-4-0 Page 3 of 7
three4101]
26. Particulate matter emissions shall not exceed 0.1 grains/d
27. Combustion turbine generator (CTG) and electrical generVisible emissions from lube oil vents shall not exhibit opacity o 0 rexceeding three minutes in any one hour. [District Rules 2201 and 4101]
District Rule 42011
eliminators.periods not
28. The CTG shall be fired exclusively on PUC-regulated natural gas with a sulfur content of no greater than 1.0 grain ofsulfur compounds (as S) per 100 dry scf of natural gas. [District Rule 2201 and 40 CFR 60.4330(a)(2)]
29. Emission rates from the CTG, except during startup or shutdown periods, shall not exceed any of the following limits:NOx (as NO2) - 8.03 lb/hr and 2.5 ppmvd @ 15% 02; SOx (as S02) - 2.51 lb/hr; PM 10 - 6.00 !b/hr; CO - 11.81 lb/hrand 6.0 ppmvd @ 15% 02; or VOC (as methane) - 2.67 lb/hr and 2.0 ppmvd @ 15% 02. NOX (as NO2) emissionlimits are one hour rolling averages. All other pollutant emission concentration limits are based on three hour rollingaverages. [District Rules 2201 and 4703 and 40 CFR 60.4320(a) & (b)]
30. Ammonia (NH3) emissions shall not exceed either of the following limits: 11.90 lb/hr or 10 ppmvd @ 15% 02 (basedon a 24 hour rolling average). [District Rule 2201]
31. During periods of startup, CTG exhaust emission rates shall not exceed any of the following limits: NOx (as NO2) -44.40 lb/hr, SOx -2.51 lb/hr, PM10 6.00 lb/hr, CO - 106.60 lb/hr, or VOC -7.60 lb/hr, based on one hour averages.[District Rule 2201]
32. During periods of shutdown, CTG exhaust emission rates shall not exceed any of the followinglimits: NOx (as NO2) -34.29 lb/hr, SOx -2.51 lb/hr, PMIO 6.00 lb/hr, CO -268.57 lb/hr, or VOC - 17.14 lb/hr, based on one hour averages.[District Rule 2201]
33. Startup shall be defined as the period of time during which a unit is brought from a shutdown status to its SCRoperating temperature and pressure, including the time required by the unit's emission control system to reach fulloperations. Shutdown shall be defined as the period of time during which a unit is taken from an operational to a non-operational status as the fuel supply to the unit is completely turned off. [District Rules 2201 and 4703]
34. The duration of each startup or shutdown shall not exceed two hours. Startup and shutdown emissions shall becounted toward all applicable emission limits. [District Rules 2201 and 4703]
35. The emission control systems shall be in operation and emissions shall be minimized insofar as technologicallyfeasible during startup and shutdown. [District Rule 4703]
36. Daily emissions from the CTG shall not exceed any of the following limits: NOx (as NO2) - 261.1 lb/day; VOC - 79.1lb/day; CO - 560.4 lb/day; PM10 - 144.1 lb/day; or SOx (as S02) -60.2 lb/day. [District Rule 2201]
37. Quarterly hours of operation shall not exceed any of the following: 1st Quarter - 1,100 hours, 2nd Quarter - 1,100hours, 3rd Quarter - 1,600 hours, or 4th Quarter - 1,200 hours. [District Rule 2201]
38. Annual emissions from the CTG, calculated on a twelve consecutive month rolling basis, shall not exceed any of thefollowing: NOx (as NO2) -48,465 lb/year; SOx (as S02) - 12,550 lb/year; PM10 - 30,000 lb/year; CO -92,750lb/year; or VOC - 15,174 lb/year. [District Rule 2201]
39. Each one hour period shall commence on the hour. Each one hour period in a three hour rolling average willcommence on the hour. The three hour average will be compiled from the three most recent one hour periods. Eachone hour period in a twenty-four hour average for ammonia slip will commence on the hour. [District Rule 2201]
40. Daily emissions will be compiled for a twenty-four hour period starting and ending at twelve-midnight. Each month inthe twelve consecutive month rolling average emissions shall commence at the beginning of the first day of the month.The twelve consecutive month rolling average emissions to determine compliance with annual emissions limitationsshall be compiled from the twelve most recent calendar months. [District Rule 2201]
C. 7220-4 ,0: Air 202010 1 17PIA - AVILA/

C-1220.4.0: 4, 26 2010 1 n17P1.1 - AV1LAJ
41. Compliance with the ammonia emission limits shall be demons e i inLii) dures: 1)calculate the daily ammonia emissions using the following equation: (ppmvd @ 15 0 0 ( 1,000,000)) x(1,000,000 / b)) x d, where a = average ammonia injection ) / (17 lb/lb mol), b = dry exhaust flow rate (lb/hr)/ (29 lb/lb mol), c = change in measured NOx concentrati s t5 . P 0 . . 7s atalyst, and d = correctionifactor. The correction factor shall be derived annually du e.
th m sured and
calculated ammonia slip; 2.) Utilize another District-approved ca cul 4,• • • I1) s ogate
parameters to determine the daily ammonia emissions in ppmvd @ 15% 02. If this option ho en, the permittee .shall submit a detailed calculation protocol for District approval at least 60 days prior to commencement of operation;3.) Alternatively, the permittee may utilize a continuous in-stack ammonia monitor to verify compliance with theammonia emissions limit. If this option is chosen, the permittee shall submit a monitoring plan for District approval atleast 60 days prior to commencement of operation. [District Rule 22011
42. Source testing to measure startup and shutdown NOx, CO, and VOC mass emission rates shall be conducted for one ofthe gas turbines (C-7220-1, C-7220-2, C-7220-3, or C-7220-4) prior to the end of the commissioning period and atleast once every seven years thereafter. CEM relative accuracy shall be determined during startup source testing inaccordance with 40 CFR 60, Appendix B. If CEM data is not certifiable to determine compliance with NOx and COstartup emission limits, then source testing to measure startup NOx and CO mass emission rates shall be conducted atleast once every 12 months. [District Rule 1081]
43. Hazardous Air Pollutant (HAP) emissions shall not exceed 25 tpy all HAPS or 10 tpy any single HAP. [District Rule4002]
44. Permittee shall conduct an initial speciated HAPS and total VOC source test for one of the GTEs (C-7220-1, 2, '3 or'4), by District witnessed in situ sampling of exhaust gases by a qualified independent source test firm. PEC shallcorrelate the total HAPS emissions rate and the single highest HAP emission rate to the VOC mass emissiondetermined during the speciated HAPs source test. Initial and annual compliance with the HAPS emissions limit (25tpy all HAPs or 10 tpy any single HAP) shall be demonstrated by the combined VOC emissions rates for the GTEs (C-7220-1, '2, '3, and '4) determined during initial and annual compliance source testing and the correlation between VOCemissions and HAP(s). [District Rule 4002]
45. Source testing to measure the NOx, CO, VOC, and NH3 emission rates (lb/hr and ppmvd @ 15% 02) and PMIOemission rate (lb/hr) shall be conducted within 120 days after initial operation and at least once every twelve monthsthereafter. [District Rules 1081 and 4703 and 40 CFR 60.4400(a)]
46. The sulfur content of each fuel source shall be: (i) documented in a valid purchase contract, a supplier certification, atariff sheet or transportation contract or (ii) shall be demonstrated within 60 days after the end of the commissioningperiod and monitored weekly thereafter. If the sulfur content is demonstrated to be less than 1.0 gr/100 scf for eightconsecutive weeks, then the monitoring frequency shall be every six months. If the result of any six month monitoringdemonstrates that the fuel does not meet the fuel sulfur content limit, weekly monitoring shall resume. [40 CFR60.4360, 60.4365(a) and 60.4370(c)]
47. The following test methods shall be used: NOx - EPA Method 7E or 20, PM10 - EPA Method 5/202 (front half andback half), CO - EPA Method 10 or 10B, 02- EPA Method 3, 3A, or 20, VOC - EPA Method 18 or 25, and ammonia- EPA Method 206. EPA approved alternative test methods as approved by the District may also be used to addressthe source testing requirements of this permit. The request to utilize EPA approved alternative source testing methodsmust be submitted in writing and written approval received from the District prior to the submission of the source testplan. [District Rules 1081 and 4703 and 40 CFR 60.4400(1)(i)]
48. HHV and LHV of the fuel shall be determined using ASTM D3588, ASTM 1826, or ASTM 1945. [40 CFR60.332(a),(b) and District Rule 4703, 6.4.5]
49. Fuel sulfur content shall be monitored using one of the following methods: ASTM Methods Dl 072, D3246, D4084,D4468, D4810, D6228, D6667 or Gas Processors Association Standard 2377. [40 CFR 60.4415(a)(1)W]
50. The exhaust stack shall be equipped with permanent provisions to allow collection of stack gas samples consistent withEPA test methods and shall be equipped with safe permanent provisions to sample stack gases with a portable NOx,CO, and 02 analyzer during District inspections. The sampling ports shall be located in accordance with the CARBregulation titled California Air Resources Board Air Monitoring Quality Assurance Volume VI, Standard OperatingProcedures for Stationary Source Emission Monitoring and Testing. [District Rule 1080]
CONDITIONS FOR APPLICATION C-7220-4-0 Page 4 of 7

CONDITIONS FOR APPLICATION C-7220-4-0 Page 5 of 7
51. Compliance demonstration (source testing) shall be District waneut i qs 1 9 collected bya certified testing laboratory. Source testing shall be conducted using the methods and p o dr I I ved by theDistrict. The District must be notified 30 days prior to any . Ice source test, and a source test plan must besubmitted for approval 15 days prior to testing.60 days thereafter. [District Rule 1081]
0 b s itted to the District withinThe result
52. The turbine shall be equipped with a continuous monitoring system to measureRules 2201 and 4703 and 40 CFR 60.4335(b)(I)]
53. The owner or operator shall install, certify, maintain, operate and quality-assure a Continuous Emission MonitoringSystem (CEMS) which continuously measures and records the exhaust gas NOx, CO and 02 concentrations.Continuous emissions monitor(s) shall be capable of monitoring emissions during normal operating conditions, andduring startups and shutdowns provided the CEMS pass the relative accuracy requirement for startups and shutdownsspecified herein. If relative accuracy of CEMS cannot be demonstrated during startup conditions, CEMS resultsduring startup and shutdown events shall be replaced with startup emission rates obtained from source testing todetermine compliance with emission limits contained in this document. [District Rules 1080, 2201, and 4703 and 40CFR 60.4335(b)(1)]
54. The CEMS shall complete a minimum of one cycle of operation (sampling, analyzing, and data recording) for eachsuccessive I5-minute period or shall meet equivalent specifications established by mutual agreement of the District,the ARB and the EPA. [District Rule 1080 and 40 CFR 60.4345(b)]
55. The NOx, CO and 02 CEMS shall meet the requirements in 40 CFR 60, Appendix F Procedure 1 and Part 60,Appendix B Performance Specification 2 (PS 2), or shall meet equivalent specifications established by mutualagreement of the District, the ARB, and the EPA. [District Rule 1080 and 40 CFR 60.4345(a)] .
56. Audits of continuous emission monitors shall be conducted quarterly, except during quarters in which relative accuracyand total accuracy testing is performed, in accordance with EPA guidelines. The District shall be notified prior tocompletion of the audits. Audit reports shall be submitted along with quarterly compliance reports to the District.[District Rule 1080]
57. The owner/operator shall perform a relative accuracy test audit (RATA) for the NOx, CO, and 02 CEMs as specifiedby 40 CFR Part 60, Appendix F, 5.11, at least once every four calendar quarters. The permittee shall comply with theapplicable requirements for quality assurance testing and maintenance of the continuous emission monitor equipmentin accordance with the procedures and guidance specified in 40 CFR Part 60, Appendix F. [District Rule 1080]
58. Results of the CEM system shall be averaged over a one hour period for NOx emissions and a three hour period forCO emissions using consecutive 15-minute sampling periods in accordance with all applicable requirements of CFR60.13. [District Rule 4703 and 40 CFR 60.13]
59. Excess emissions shall be defined as any operating hour in which the 4-hour or 30-day rolling average NOXconcentration exceeds applicable emissions limit and a period of monitor downtime shall be any unit operating hour inwhich sufficient data are not obtained to validate the hour for either NOX or 02 (or both). [40 CFR 60.4380(b)(1)]
60. Results of continuous emissions monitoring shall be reduced according to the procedure established in 40 CFR, Part51, Appendix P, paragraphs 5.0 through 5.3.3, or by other methods deemed equivalent by mutual agreement with theDistrict, the ARB, and the EPA. [District Rule 1080]
61. The facility shall install and maintain equipment, facilities, and systems compatible with the District's CEM datapolling software system and shall make CEM data available to the District's automated polling system on a daily basis.[District Rule 1080]
62. Upon notice by the District that the facility's CEM system is not providing polling data, the facility may continue tooperate without providing automated data for a maximum of 30 days per calendar year provided the CEM data is sentto the District by a District-approved alternative method. [District Rule 1080]
63. The owner or operator shall, upon written notice from the APCO, provide a summary of the data obtained from theCEM systems. This summary shall be in the form and the manner prescribed by the APCO. [District Rule 1080]
ption. [District
C.7220.0 : Art 28 2010 I:41M AVILAJ
-CONDITIONS FOR APPLICATION C-7220-4-0 IZ,cgtp EIVdttynqo Page 6 of 7
64. The owner or operator shall submit a written report of CEM oper to e. , 1 0 Cereport is due on the 30th day following the end of the calendar quarter and shall inc ude o
' :PO.Thime intervals,
eN.
data and magnitude of excess NOX emissions, nature and - . - of excess (if known), corrective actions taken andpreventative measures adopted; Averaging period used for a. . , - .1k rtg i ó -- • . 6 n 'nig • the averaging periodspecified in the emission test period and used to determin- -I 4 ir .- - . •k, • ... •. •rp ,o,licable timeand date of each period during which the CEM was inoperative (mo ' • dE 4 4 , - •- 4104r r .nd span checks,and the nature of system repairs and adjustments; A negative declaration when no excess e . 'oi • iccurred. [DistrictRule 1080 and 40 CFR 60.4375(a) and 60.4395]
65. APCO or an authorized representative shall be allowed to inspect, as determined to be necessary, the requiredmonitoring devices to ensure that such devices are functioning properly. [District Rule 1080]
66. Permittee shall notify the District of any breakdown condition as soon as reasonably possible, but no later than onehour after its detection, unless the owner or operator demonstrates to the District's satisfaction that the longer reportingperiod was necessary. [District Rule 1100, 6.1]
67. The District shall be notified in writing within ten days following the correction of any breakdown condition. Thebreakdown notification shall include a description of the equipment malfunction or failure, the date and cause of theinitial failure, the estimated emissions in excess of those allowed, and the methods utilized to restore normaloperations. [District Rule 1100, 7.0]
68. The permittee shall maintain the following records: date and time, duration, and type of any startup, shutdown, ormalfunction; performance testing, evaluations, calibrations, checks, adjustments, any period during which a continuousmonitoring system or monitoring device was inoperative, and maintenance of any continuous emission monitor.[District Rules 2201 and 4703]
69. The permittee shall maintain the following records: quarterly hours of operation, fuel consumption (scf/hr andscf/rolling twelve month period), continuous emission monitor measurements, calculated ammonia slip, and calculatedNOx mass emission rates (lb/hr and lb/twelve month rolling period). [District Rules 2201 and 4703]
70. All records shall be maintained and retained on-site for a period of at least 5 years and shall be made available forDistrict inspection upon request. [District Rules 1070, 2201, and 4703]
71. Disturbances of soil related to any construction, demolition, excavation, extraction, or other earthmoving activitiesshall comply with the requirements for fugitive dust control in District Rule 8021 unless specifically exempted underSection 4.0 of Rule 8021 or Rule 8011. [District Rules 8011 and 8021]
72. An owner/operator shall submit a Dust Control Plan to the APCO prior to the start of any construction activity on anysite that will include 10 acres or more of disturbed surface area for residential developments, or 5 acres or more ofdisturbed surface area for non-residential development, or will include moving, depositing, or relocating more than2,500 cubic yards per day of bulk materials on at least three days. [District Rules 8011 and 802-1]
73. An owner/operator shall prevent or cleanup any carryout or trackout in accordance with the requirements of DistrictRule 8041 Section 5.0, unless specifically exempted under Section 4.0 of Rule 8041 (8/19/04) or Rule 8011(8/19/04).[District Rules 8011 and 8021]
74. Whenever open areas are disturbed, or vehicles are used in open areas, the facility shall comply with the requirementsof Section 5.0 of District Rule 8051, unless specifically exempted under Section 4.0 of Rule 8051 or Rule 8011.[District Rules 8011 and 8051]
75. Any paved road or unpaved road shall comply with the requirements of District Rule 8061 unless specificallyexempted under Section 4.0 of Rule 8061 or Rule 8011. [District Rules 8011 and 8061]
76. Water, gravel, roadmix, or chemical/organic dust stabilizers/suppressants, vegetative materials, or other District-approved control measure shall be applied to unpaved vehicle travel areas as required to limit Visible Dust Emissionsto 20% opacity and comply with the requirements for a stabilized unpaved road as defined in Section 3.59 of DistrictRule 8011. [District Rules 8011 and 8071]
77. Where dusting materials are allowed to accumulate on paved surfaces, the accumulation shall be removed daily orwater and/or chemical/organic dust stabilizers/suppressants shall be applied to the paved surface as required tomaintain continuous compliance with the requirements for a stabilized unpaved road as defined in Section 3.59 ofDistrict Rule 8011 and limit Visible Dust Emissions (VDE) to 20% opacity. [District Rules 8011 and 8071]
0,7220-40 Arf 28 2010 1 n17P1.1 - /MA)

CONDITIONS FOR APPLICATION C-7220-4-0
78. On each day that 50 or more Vehicle Daily Trips or 25 or more 1 ailan unpaved vehicle/equipment traffic area, permittee shall apply water, gravel, roa max, orstabilizers/suppressants, vegetative materials, or other Dis
Page 7 of 7
will occur onanic dust
ved control measure as required to limit VisibleDust Emissions to 20% opacity and comply with the requ road as defined in Section3.59 of District Rule 8011. [District Rules 8011 and 8071
79. Whenever any portion of the site becomes inactive, Permittee shall restrict acce bilize anydisturbed surface to comply with the conditions for a stabilized surface as defined in Section 3.58 o District Rule8011. [District Rules 8011 and 80711
80. Records and other supporting documentation shall be maintained as required to demonstrate compliance with therequirements of the rules under Regulation VIII only for those days that a control measure was implemented. Suchrecords shall include the type of control measure(s) used, the location and extent of coverage, and the date, amount,and frequency of application of dust suppressant, manufacturer's dust suppressant product information sheet thatidentifies the name of the dust suppressant and application instructions. Records shall be kept for one year followingproject completion that results in the termination of all dust generating activities. [District Rules 8011, 8031, and 8071]
C.7220-4-0: Air 20 2000 1,17PAI - AVILAJ
Environmental Inc.
April 6, 2010
John CoppSan Joaquin Valley APCD1990 E. Gettysburg AvenueFresno, CA 93726-0244
RE: Panoche Energy CenterProject 280-6747Source Test Protocol
Dear Sir/Madam:
Enclosed in this package is the Source Test Protocol for the upcoming testing to be performed forPanoche Energy Center on four 100 MW GE Model LMS100 Turbines at the Panchoe Facility. Testing iscurrently scheduled for May 11, 12, 18 and 19, 2010.
Should you have any questions or require additional information, please do not hesitate to contactme.
Sincerely,
Mike GrayProject Manager
enclosure
cc: Roy CampbellPanoche Energy Center
"Professional Air Emissions Testing and Analytical Services"18828 Highway 65 • Bakersfield, CA 93308
(661) 391-0112 • (661) 391-0153 Fax
San Joaquin Valley Air Pollution Control District
Source Test Protocol
for
Panoche Energy Center
Panoche FacilityFour 100 MW
GE Model LMS100 Turbines
Project 280-6747
Submitted April 6, 2010
Environmental Inc.

Project Information
Permit Holder:
Independent Contractor:
Agency:
Sources:
Source Description:
Operating Parameters:
Panoche Energy Center43883 W Panoche Rd.Firebaugh, CA 93622(559) 659-2270 Cell (559) 829-7644
Attention: Roy Campbell
Aeros Environmental, Inc.18828 Highway 65Bakersfield, CA 93308(661) 391-0112 FAX (661) 391-0153
Attention: Mike Gray
San Joaquin Valley APCD1990 E. Gettysburg AvenueFresno, CA 93726-0244(559) 230-5953 FAX (559) 230-6062
Attention: John Copp
Four 100 MW TurbinesTurbine 1 Permit No. C-7220-1-0Turbine 2 Permit No. C-7220-2-0Turbine 3 Permit No. C-7220-3-0Turbine 4 Permit No. C-7220-4-0
Four simple cycle General Electric LMS100 natural gasfired combustion turbines. Each generating system israted at 100 MW and served by a selective catalyticreduction (SCR) system and an oxidation catalyst. Eachturbine has a designated Continuous EmissionsMonitoring System (CEMS) for recording emissions ofNOx, CO, and 02
All four units will be tested while operating at normal fullload operating conditions.
Test Objective: The objective of the testing is to document annualtesting requirements and CEM's certification asdescribed in the permits issued by the San JoaquinValley Air Pollution Control District.
Test Dates: May 11, 12, 18 and 19, 2010Quality Assurance to begin at 7:30 AM

Testing Parameters
Testing is to determine concentrations (ppm, ppm © 15% 0 2) and emissions (lb/hr, lb/MMBtu) ofNOx, CO, VOC, NH 3 , SOx as SO 2, and particulate exiting the exhaust of four natural gas-fired turbines. Arelative accuracy test audit (RATA) will be performed on each stacks CEM system for NOx, CO and 02.
NOx, CO, and 0 2 will be determined from instrumental Methods 7E,3A, and 10. The initial threeNOx, CO, and 0 2 compliance test runs will be used as runs one, two and three of the Relative AccuracyTest Audit (RATA). A minimum six additional test runs will be performed to complete the RATA testing.A stratification traverse will be performed during the first test run. Additional test runs will be performedusing a traverse, if any single point exceeds + 10% from the average concentration. If no point exceeds +10% from the average, additional test runs will be performed with the probe located at the average of thestack. The continuous monitors will be calibrated either directly with calibration gasses or by EPAMethod 205, through the use of a gas divider.
VOC samples will be collected into Tedlar bags and analyzed for C 1 -C6. and reported asmethane. The VOC samples will analyzed offsite by GC-FID. NH 3 will be sampled with a traversesimultaneous with the initial three NOx, CO, and 02 compliance test runs. Samples will be collected intoHCL impingers at a constant sample rate and will be analyzed offsite by specific ion electrode.Particulate will be sampled by EPA Method 5 and analyzed gravimetrically for front and back halfparticulate. Volume flow (DSCFM) for EPA Method 5 calculations will be determined by EPA Methods 1-4. Volume flow for all other calculations will be determined based on fuel rates and fuel analysis. Thefollowing methods will be used.
Table I — General Approach
Parameter Method Analysis Method Test Runs
NOxEPA Method 7E1
GARB 100Performance Spec 2
ChemiluminescentAnalyzer Compliance
330 minute
RATA
COEPA Method 10/
CARB 100Performance Spec 4A
Gas Filter CorrelationAnalyzer
02
EPA Method 3A1CARB 100
Performance Spec 3
Micro Fuel CellAnalyzer
OrParamagnetic
6 additional30 minute
VOCas Methane
EPA Method18
GC-FID;Analysis for C1-C64-
3plus blank
Particulate EPA Method5
Gravimetric analysis affrontand back half fractions
32 hour
Volume Flow EPA Method19
Based on fuel rates and fuelanalysis 1 per run
Volume FlowEPA Methods
1 - 4
Velocity traverse andcondensation train simultaneous
with Method 5
32 hour
NH3BAAQMD ST-1BHCL lmpingers
EPA Method 350B;Specific Ion Electrode
330 minute
Fuel Sulfur(S0x as SO2 )
Fuel Analysis;Double GC
GC-FPD;Total sulfur referenced
to an H 2S standard1
Fuel AnalysisF-factor and
Calorific Value
EPA Method 19ASTM
D-1945 & D-3588
GC-TCD;C1 — C6+ 02, CO2, N2
& Btu/lb1
• Data from the report will be entered in the Appendix G spreadsheet and if required by permit, PanacheEnergy Center will provide historical fuel use for the day closest to the test and one additional date
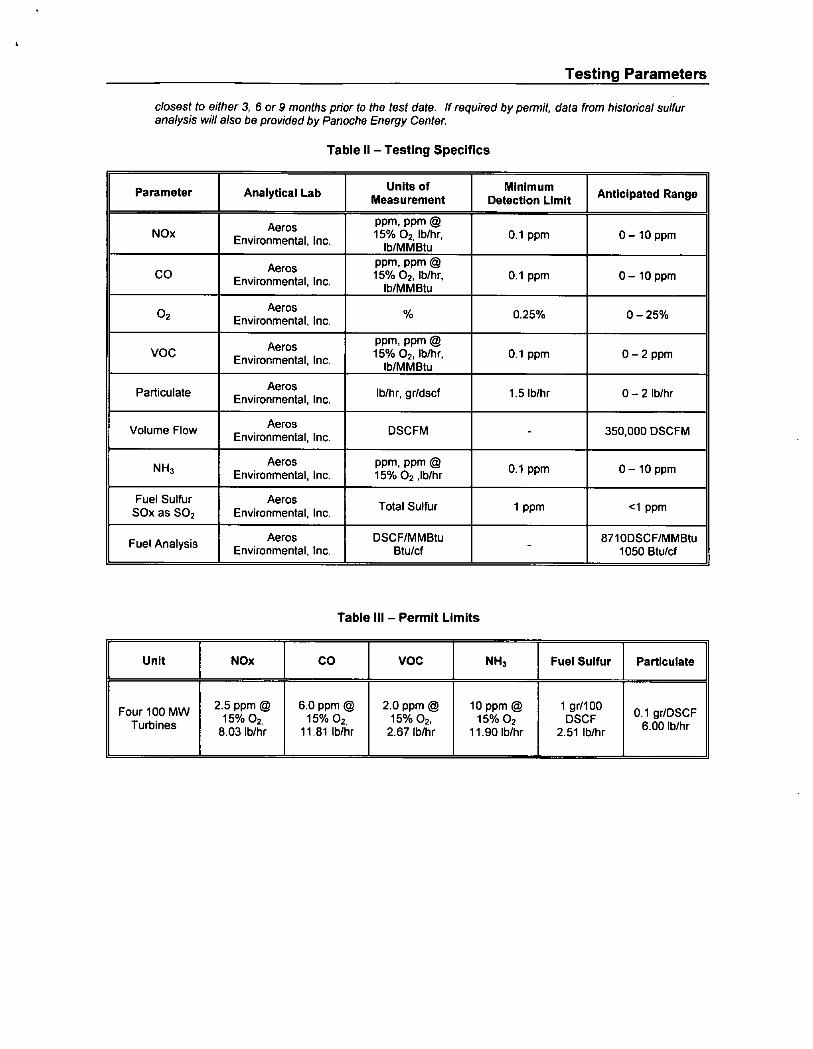
Testing Parameters
closest to either 3, 6 or 9 months prior to the test date. If required by permit, data from historical sulfuranalysis will also be provided by Panoche Energy Center.
Table il - Testing Specifics
Parameter Analytical Lab Units ofMeasurement
MinimumDetection Limit Anticipated Range
NOx AerosEnvironmental, Inc.
PPm , PPm @ 15% 02, lb/hr,
lb/MMBtu0.1 ppm 0-10 ppm
CO AerosEnvironmental, Inc.
PPm, PPm @ 15% 02, lb/hr,
lb/MMBlu0.1 ppm 0— 10 ppm
02Aeros
Environmental, Inc.ok 0.25% 0— 25%
VOC AerosEnvironmental, Inc.
PPm, PPm @ 15% 02, lb/hr,
lb/MMBtu0.1 ppm 0 — 2 ppm
Particulate AerosEnvironmental, Inc. lb/hr, gr/dscf 1.5 lb/hr 0 — 2 lb/hr
Volume Flow AerosEnvironmental, Inc. DSCFM - 350,000 DSCFM
NH3 AerosEnvironmental, Inc.
PPm. PPm @15% 02 ,lb/hr 0.1 ppm 0-10 ppm
Fuel SulfurSOx as SO 2
AerosEnvironmental, Inc. Total Sulfur 1 ppm <1 ppm
Fuel Analysis AerosEnvironmental, Inc.
DSCF/MMBtuBtu/cf - 87100SCF/MMBtu
1050 Btu/cf
Table III - Permit Limits
Unit NOx CO VOC NH3 Fuel Sulfur Particulate
Four 100 MWTurbines
2.5 ppm @15% 02,
8.03 lb/hr
6.0 ppm @15% 02,
11.81 lb/hr
2.0 ppm @15% 02,
2.67 lb/hr
10 ppm @15% 02
11.90 lb/hr
1 gr/100DSCF
2.51 lb/hr
0.1 gr/DSCF6.00 lb/hr
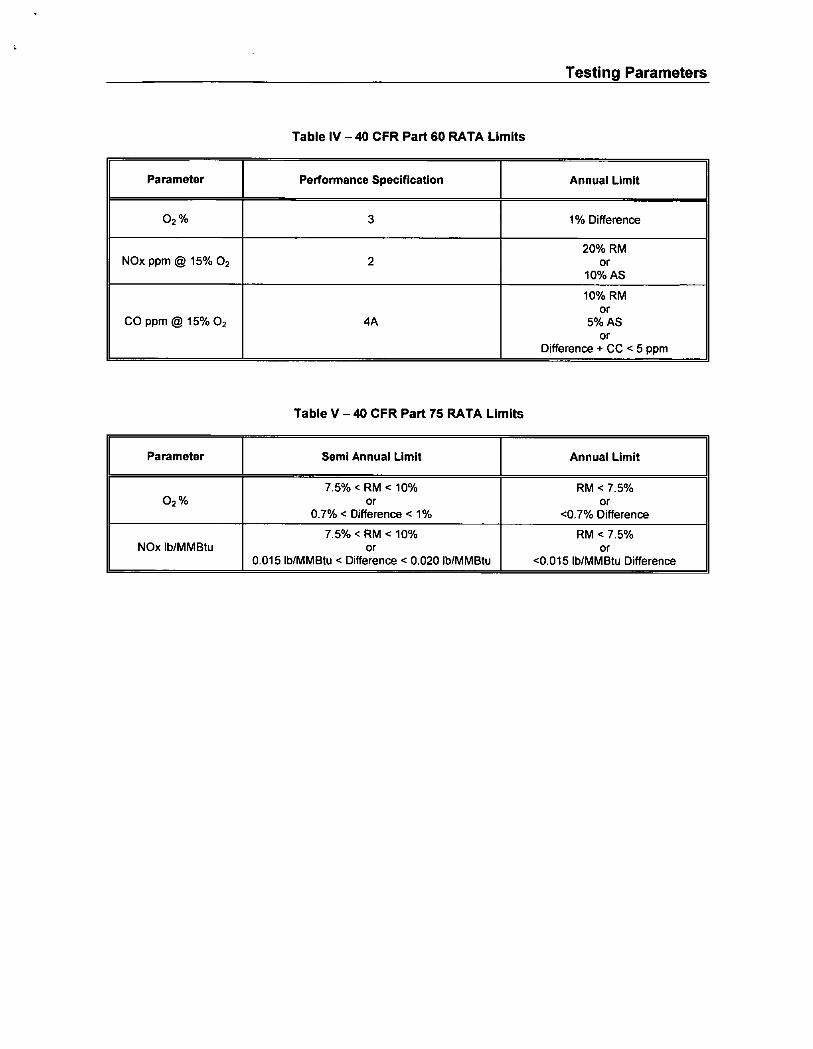
Testing Parameters
Table IV —40 CFR Part 60 RATA Limits
Parameter Performance Specification Annual Limit
02 % 3 1% Difference
NOx ppm @ 15% 02 220% RM
Or
10% AS
CO ppm @ 15% 02 4A
10% RMOr
5% ASOr
Difference + CC <5 ppm
Table V —40 CFR Part 75 RATA Limits
Parameter Semi Annual Limit Annual Limit
02 %7.5% < RM < 10°/0
Or
0.7% < Difference < 1%
RM < 7.5%Or
<0.7% Difference
NOx lb/MMBtu7.5% < RM < 10%
Or0.015 lb/MMBtu < Difference < 0.020 lb/MMBtu
RM < 7.5%Or
<0.015 lb/MMBtu Difference
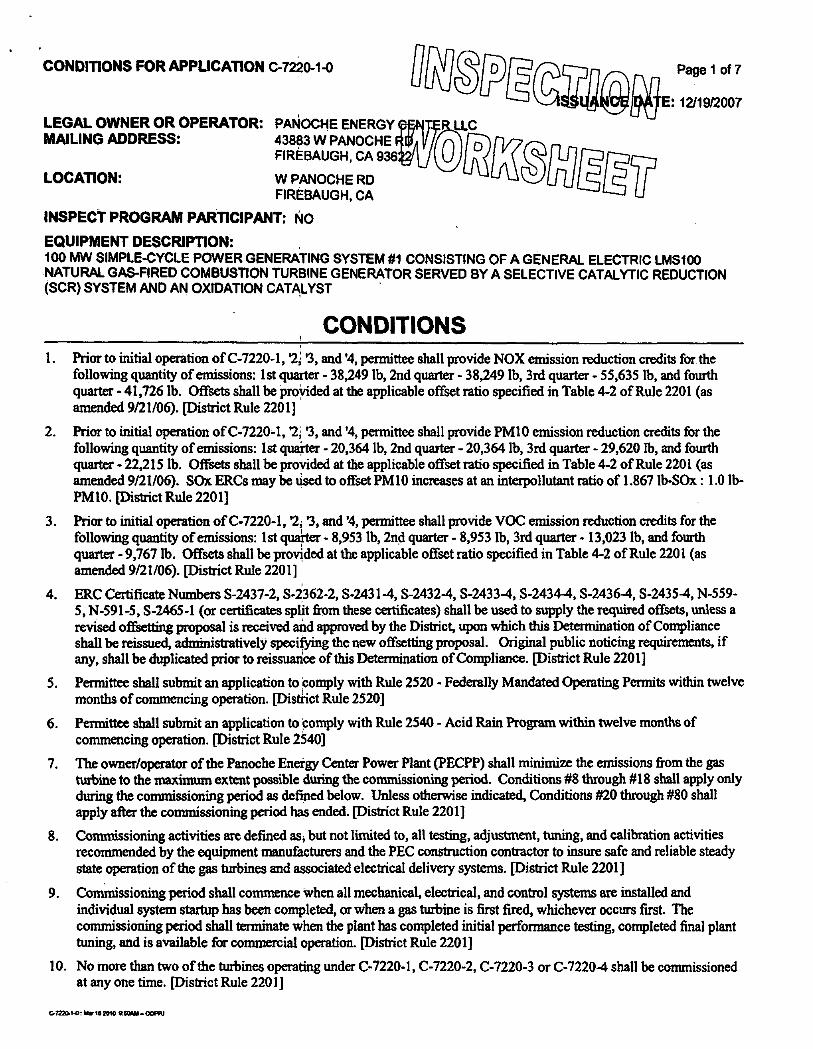
CONDITIONS FOR APPLICATION C-7220-1-0 Page 1 of 7
E: 12/19/2007
LEGAL OWNER OR OPERATOR: PANOCHE ENERGY LLCMAILING ADDRESS: 43883 W PANOCHE
FIREBAUGH, CA 936
LOCATION: W PANOCHE RDFIREBAUGH, CA
INSPECT PROGRAM PARTICIPANT: NO
EQUIPMENT DESCRIPTION:100 MW SIMPLE-CYCLE POWER GENERATING SYSTEM #1 CONSISTING OF A GENERAL ELECTRIC LMS100NATURAL GAS-FIRED COMBUSTION TURBINE GENERATOR SERVED BY A SELECTIVE CATALYTIC REDUCTION(SCR) SYSTEM AND AN OXIDATION CATALYST
CONDITIONS 1. Prier to initial operation of C-7220-1, 2; '3, and '4, permittee shall provide NOX emission reduction credits for the
following quantity of emissions: 1st quarter - 38,249 lb, 2nd quarter - 38,249 lb, 3rd quarter - 55,635 lb, and fourthquarter -41,726 lb. Offsets shall be provided at the applicable offset ratio specified in Table 4-2 of Rule 2201 (asamended 9/21/06). [District Rule 2201]
2. Prior to initial operation of C-7220-1, '2; '3, and '4, pennittee shall provide PM10 emission reduction credits for thefollowing quantity of emissions: 1st quarter - 20,364 lb, 2nd quarter - 20,364 lb, 3rd quarter -29,620 lb, and fourthquarter - 22,215 lb. Offsets shall be provided at the applicable offset ratio specified in Table 4-2 of Rule 2201 (asamended 9/21/06). SOx ERCs may be used to offset PM10 increases at an interpollutant ratio of 1.867 lb-S0x : 1.0 lb-PM10. [District Rule 2201]
3. Prior to initial operation of C-7220-1, 2, '3, and '4, permittee shall provide VOC emission reduction credits for thefollowing quantity of emissions: 1st quarter - 8,953 lb, 2nd quarter - 8,953 lb, 3rd quarter - 13,023 lb, and fourthquarter -9,767 lb. Offsets shall be provided at the applicable offset ratio specified in Table 4-2 of Rule 2201 (asamended 9/21/06). [District Rule 2201]
4. ERC Certificate Numbers S-2437-2, S-2362-2, S-2431-4, S-2432-4, S-2433-4, S-2434-4, S-2436-4, S-2435-4, N-559-5, N-591-5, S-2465-1 (or certificates split from these certificates) shall be used to supply the required offsets, unless arevised offsetting proposal is received and approved by the District, upon which this Determination of Complianceshall be reissued, administratively specifying the new offsetting proposal. Original public noticing requirements, ifany, shall be duplicated prior to reissuance of this Determination of Compliance. [District Rule 2201]
5. Pennittee shall submit an application to Comply with Rule 2520 - Federally Mandated Operating Permits within twelvemonths of commencing operation. [Disnict Rule 2520]
6. Permittee shall submit an application to comply with Rule 2540 - Acid Rain Program within twelve months ofcommencing operation. [District Rule 2540]
7. The owner/operator of the Panoche Energy Center Power Plant (PF,CPP) shall minimize the emissions from the gasturbine to the maximum extent possible during the commissioning period. Conditions #8 through #18 shall apply onlyduring the commissioning period as defined below. Unless otherwise indicated, Conditions #20 through #80 shallapply after the commissioning period has ended. [District Rule 22011
8. Commissioning activities are defined as, but not limited to, all testing, adjustment, tuning, and calibration activitiesrecommended by the equipment manufacturers and the PEC construction contractor to insure safe and reliable steadystate operation of the gas turbines and associated electrical delivery systems. [District Rule 2201]
9. Commissioning period shall commence when all mechanical, electrical, and control systems are installed andindividual system startup has been completed, or when a gas turbine is first fired, whichever occurs first. Thecommissioning period shall terminate when the plant has completed initial performance testing, completed final planttuning, and is available for commercial operation. [District Rule 2201]
10. No more than two of the turbines operating under C-7220-1, C-7220-2, C-7220-3 or C-7220-4 shall be commissionedat any one time. [District Rule 2201]
22Y
C-772044: Mar 1112010 Ii14:011-CCORI
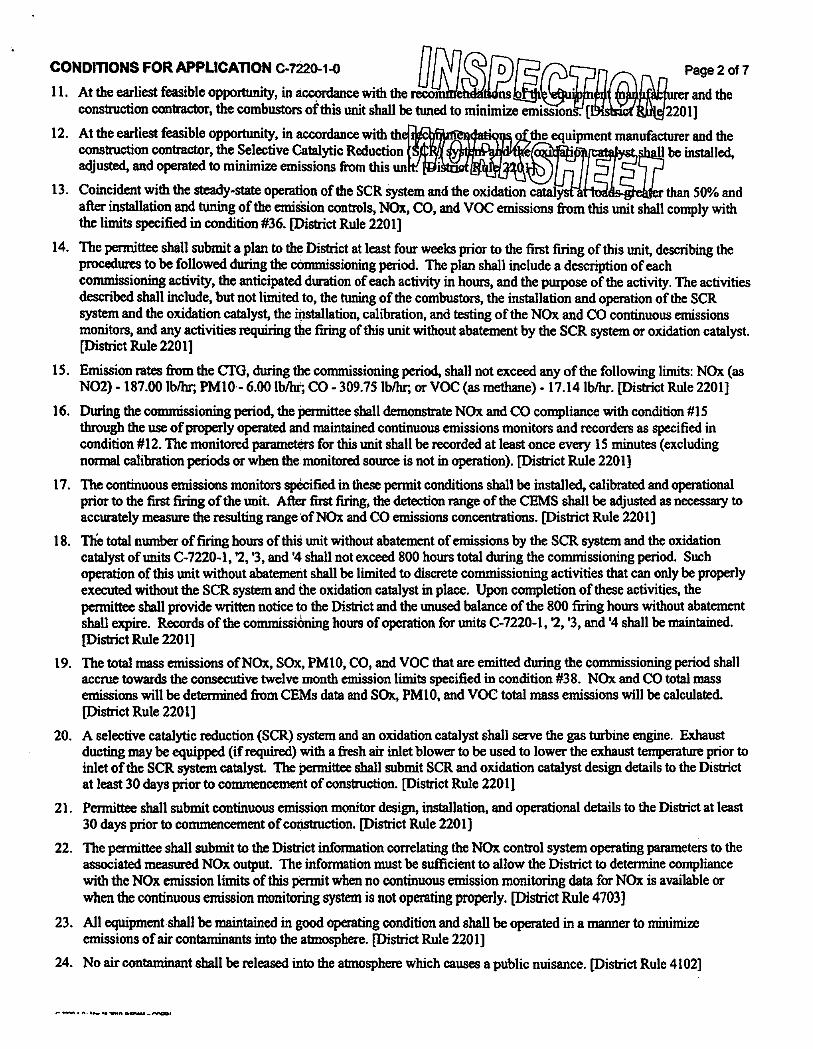
CONDMONS FOR APPLICAllON C-7220-1-0 Page 2 of 711. At the earliest feasible opportunity, in accordance with the reco ns
rand the
construction contractor, the combustors of this unit shall be tuned to minimize emissio [L 2201]12. At the earliest feasible opportunity, in accordance with th- Oatil 1. 1.the equipment manufacturer and the
construction contractor, the Selective Catalytic Reduction j/9 rr II be installed,adjusted, and operated to minimize emissions from this un "r4" 1,11 I-11: IuI1E13. Coincident with the steady-state operation of the SCR system and the oxidation catal • . - than 50% andafter installation and tuning of the emission controls, NOx, CO, and VOC emissions from this unit shall comply withthe limits specified in condition #36. [District Rule 2201]
14. The perrnittee shall submit a plan to the District at least four weeks prior to the first firing of this unit, describing theprocedures to be followed during the commissioning period. The plan shall include a description of eachcommissioning activity, the anticipated duration of each activity in hours, and the purpose of the activity. The activitiesdescribed shall include, but not limited to, the tuning of the combustors, the installation and operation of the SCRsystem and the oxidation catalyst, the installation, calibration, and testing of the NOx and CO continuous emissionsmonitors, and any activities requiring the firing of this unit without abatement by the SCR system or oxidation catalyst.[District Rule 2201]
15. Emission rates from the CM, during the commissioning period, shall not exceed any of the following limits: NOx (asNO2) . 187.00 lb/hr, PM10 - 6.00 lb/hr; CO -309.75 lb/hi; or VOC (as methane). 17.14 lb/hr. [District Rule 2201]
16. During the commissioning period, the Permittee shall demonstrate NOx and CO compliance with condition #15through the use of properly operated and maintained continuous emissions monitors and recorders as specified incondition #12. The monitored parameters for this unit shall be recorded at least once every 15 minutes (excludingnormal calibration periods or when the monitored source is not in operation). [District Rule 2201]
17. The continuous emissions monitors specified in these permit conditions shall be installed, calibrated and operationalprior to the first firing of the unit. After first firing, the detection range of the CFNIS shall be adjusted as necessary toaccurately measure the resulting range of NOx and CO emissions concentrations. [District Rule 2201]
18. The total number of firing hours of this unit without abatement of emissions by the SCR system and the oxidationcatalyst of units C-7220-1, '2, '3, and '4 shall not exceed 800 hours total during the commissioning period. Suchoperation of this unit without abatement shall be limited to discrete commissioning activities that can only be properlyexecuted without the SCR system and the oxidation catalyst in place. Upon completion of these activities, thepennittee shall provide written notice to the District and the unused balance of the 800 firing hours without abatementshall expire. Records of the commissiOning hours of operation for units C-7220-1, 7, '3, and '4 shall be maintained.[District Rule 2201]
19. The total mass emissions of NOx, S0x, PM10, CO, and VOC that are emitted during the commissioning period shallaccrue towards the consecutive twelve month emission limits specified in condition #38. NOx and CO total massemissions will be determined from CEMs data and S0x, PM10, and VOC total mass emissions will be calculated.[District Rule 2201]
20. A selective catalytic reduction (SCR) system and an oxidation catalyst shall serve the gas turbine engine. Exhaustducting may be equipped (if required) with a fresh air inlet blower to be used to lower the exhaust temperature prior toinlet of the SCR system catalyst. The permittee shall submit SCR and oxidation catalyst design details to the Districtat least 30 days prior to commencement of construction. [District Rule 22011
21. Permittee shall submit continuous emission monitor design, installation, and operational details to the District at least30 days prior to commencement of construction. [District Rule 2201]
22. The pennittee shall submit to the District information correlating the NOx control system operating parameters to theassociated measured NOx output. The information must be sufficient to allow the District to determine compliancewith the NOx emission limits of this permit when no continuous emission monitoring data for NOx is available orwhen the continuous emission monitoring system is not operating properly. [District Rule 4703]
23. All equipment shall be maintained in good operating condition and shall be operated in a manner to minimizeemissions of air contaminants into the atmosphere. [District Rule 2201]
24. No air contaminant shall be released into the atmosphere which causes a public nuisance. [District Rule 4102]
n Tn.. • A- wt." 011•1n••••• -.••••1012.
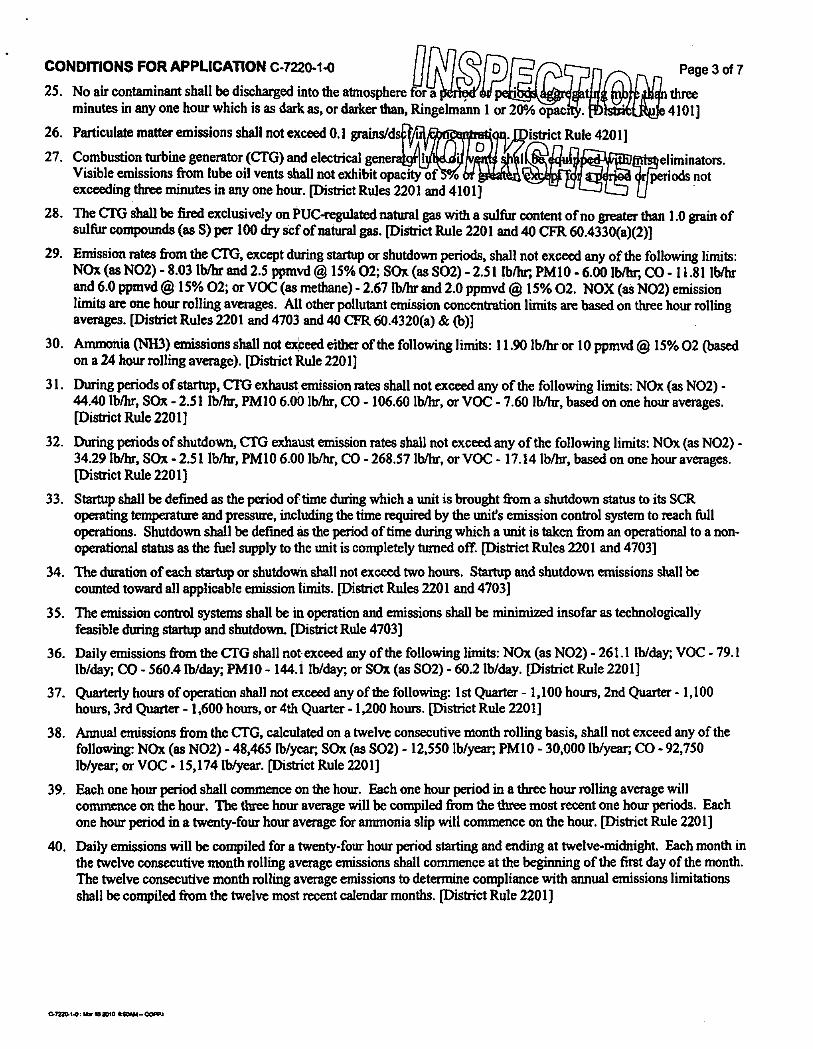
CONDMONS FOR APPLICATION C-7220-1-0
25. No air contaminant shall be discharged into the atmosphere for a I TIEminutes in any one hour which is as dark as, or darker than, Ringelmann 1
26. Particulate matter emissions shall not exceed 0.1 grains/ds
27. Combustion turbine generator (CTG) and electrical gene eliminators.
Visible emissions from lube oil vents shall not exhibit opacity of rperiods notexceeding three minutes in any one hour. [District Rules 2201 and 4101]
28. The CfG shall be fired exclusively on PUC-regulated natural gas with a sulfur content of no greater than 1.0 grain ofsulfur compounds (as S) per 100 dry scf of natural gas. [District Rule 2201 and 40 CFR 60.4330(a)(2)]
29. Emission rates from the CTG, except during startup or shutdown periods, shall not exceed any of the following limits:NOx (as NO2) - 8.03 lb/hr and 2.5 ppmvd ® 15%02; SOx (as SO2) - 2.51 lb/hr; PM10 - 6.00 lb/hr, CO - 11.81and 6.0 ppmvd ® 15% 02; or VOC (as methane) - 2.67 lb/hr and 2.0 ppmvd ® 15% 02. NOX (as NO2) emissionlimits are one hour rolling averages. All other pollutant emission concentration limits are based on three hour rollingaverages. [District Rules 2201 and 4703 and 40 CFR 60.4320(a) & (b)]
30. Ammonia (NH3) emissions shall not exceed either of the following limits: 11.90 lb/hr or 10 ppmvd ® 15% 02 (basedon a 24 hour rolling average). [District Rule 2201]
31. During periods of startup, CTG exhaust emission rates shall not exceed any of the following limits: NOx (as NO2) -44.40 lb/hr, SOx -2.51 lb/hr, PM10 6.00 lb/hr, CO - 106.60 lb/hr, or VOC - 7.60 lb/hr, based on one hour averages.[District Rule 2201]
32. During periods of shutdown, CTG exhaust emission rates shall not exceed any of the following limits: NOx (as NO2) -34.29 lb/hr, SOx -2.51 lb/hr, PM10 6.00 lb/hr, CO -268.57 lb/hr, or VOC - 17.14 lb/hr, based on one hour averages.[District Rule 2201]
33. Startup shall be defined as the period of time during which a unit is brought from a shutdown status to its SCRoperating temperature and pressure, including the time requited by the unit's emission control system to reach fulloperations. Shutdown shall be defined as the period of time during which a unit is taken from an operational to a non-operational status as the fuel supply to the unit is completely turned off. [District Rules 2201 and 4703]
34. The duration of each startup or shutdown shall not exceed two hours. Startup and shutdown emissions shall becounted toward all applicable emission limits. [District Rules 2201 and 4703]
35. The emission control systems shall be in operation and emissions shall be minimized insofar as technologicallyfeasible during startup and shutdown. [District Rule 4703]
36. Daily emissions from the CTG shall not exceed any of the following limits: NOx (as NO2) -261.1 lb/day; VOC -79.1lb/day; CO -560.4 lb/day; PM10 - 144.1 lb/day; or SOx (as S02) -60.2 lb/day. [District Rule 2201]
37. Quarterly hours of operation shall not exceed any of the following: 1st Quarter - 1,100 hours, 2nd Quarter - 1,100hours, 3rd Quarter - 1,600 hours, or 4th Quarter -1,200 hours. [District Rule 2201]
38. Amnia] emissions from the CM, calculated on a twelve consecutive month rolling basis, shall not exceed any of thefollowing: NOx (as NO2) - 48,465 lb/year; SOx (as S02) - 12,550 lb/year, PM10 - 30,000 lb/year, CO -92,750lb/year; or VOC - 15,174 lb/year. [District Rule 2201]
39. Each one hour period shall commence on the hour. Each one hour period in a three hour rolling average willcommence on the hour. The three hour average will be compiled from the three most recent one hour periods. Eachone hour period in a twenty-four hour average for ammonia slip will commence on the hour. [District Rule 2201]
40. Daily emissions will be compiled for a twenty-four hour period starting and ending at twelve-midnight. Each month inthe twelve consecutive month rolling average emissions shall commence at the beginning of the first day of the month.The twelve consecutive month rolling average emissions to determine compliance with annual emissions limitationsshall be compiled from the twelve most recent calendar months. [District Rule 2201]
Page 3 of 7
threee4101]
C-7220.14: 152010 110AM -Cam
CONDITIONS FOR APPLICATION C-7220-1-0
Page 4 of 741. Compliance with the anunonia emission limits shall be demoi dures: 1)
calculate the daily ammonia emissions using the following equation: (ppmvd ® 15 0 ,000,000)) x(1,000,000 / b)) x d, where a = average ammonia injectiond
' / 17 lb/lb mol), b = dry exhaust flow rate (lb/hr)
/ (29 lb/lb mol), c = change in measured NOx concentratio and d = correctionfactor. The correction factor shall be derived annually d ir, ureAl andcalculated ammonia slip; 2.) Utilize another District-approvedparameters to determine the daily ammonia emissions in ppmvd ® 15% 02. If this option permitteeshall submit a detailed calculation protocol for District approval at least 60 days prior to commencement of operation;3.) Alternatively, the pemdttee may utilize a continuous in-stack ammonia monitor to verify compliance with theammonia emissions limit. If this option is chosen, the permittee shall submit a monitoring plan for District approval atleast 60 days prior to commencement of operation. [District Rule 2201]
42. Source testing to measure startup and shutdown NOx, CO, and VOC mass emission rates shall be conducted for one ofthe gas turbines (C-7220-1, C-7220-2, C-7220-3, or C-7220-4) prior to the end of the commissioning period and atleast once every seven years thereafter. CEM relative accuracy shall be determined during startup source testing inaccordance with 40 CFR 60, Appendix B. If CEM data is not certifiable to determine compliance with NOx and COstartup emission limits, then source testing to measure startup NOx and CO mass emission rates shall be conducted atleast once every 12 months. [District Rule 1081]
43. Hazardous Air Pollutant (HAP) emissions shall not exceed 25 tpy all RAPS or 10 tpy any single HAP. [District Rule4002]
44. Pennittee shall conduct an initial speciated RAPS and total VOC source test for one of the GTEs (C-7220-1, '2, '3 or'4), by District witnessed in situ sampling of exhaust gases by a qualified independent source test firm. PEC shallcorrelate the total RAPS emissions rate and the single highest HAP emission rate to the VOC mass emissiondetermined during the speciated HAPs source test. Initial and annual compliance with the RAPS emissions limit (25tpy all HAN or 10 tpy any single HAP) shall be demonstrated by the combined VOC emissions rates for the GTEs (C-7220-1, '2, '3, and '4) determined during initial and annual compliance source testing and the correlation between VOCemissions and HAP(s). [District Rule 4002]
45. Source testing to measure the NOx, CO, VOC, and NII3 emission rates (lb/hr and ppinvd ® 15% 02) and PMIOemission rate (lb/hr) shall be conducted within 120 days after initial operation and at least once every twelve monthsthereafter. [District Rules 1081 and 4703 and 40 CFR 60.4400(a)]
46. The sulfur content of each fuel source shall be: (i) documented in a valid purchase contract, a supplier certification, atariff sheet or transportation contract or (ii) shall be demonstrated within 60 days after the end of the commissioningperiod and monitored weekly thereafter. If the sulfur content is demonstrated to be less than 1.0 gr/100 scf for eightconsecutive weeks, then the monitoring frequency shall be every six months. lithe result of any six month monitoringdemonstrates that the fuel does not meet the fuel sulfur content limit, weekly monitoring shall resume. [40 CFR60.4360,60.4365(a) and 60.4370(c)]
47. The following test methods shall be used: NOx - EPA Method 7E or 20, PM10 - EPA Method 5/202 (front half andback half), CO - EPA Method 10 or 10B, 02 - EPA Method 3, 3A, or 20, VOC - EPA Method 18 or 25, and ammonia- EPA Method 206. EPA approved alternative test methods as approved by the District may also be used to addressthe source testing requirements of this permit. The request to utilize EPA approved alternative source testing methodsmust be submitted in writing and written approval received from the District prior to the submission of the source testplan. [Distnct Rules 1081 and 4703 and 40 CFR 60.4400(1)(i)]
48. 1111V and LHV of the fuel shall be determined using ASTM D3588, ASTM 1826, or ASTM 1945. [40 CFR60.332(a),(b) and District Rule 4703, 6.4.5]
49. Fuel sulfur content shall be monitored using one of the following methods: ASTM Methods D1072, D3246, D4084,D4468, D4810, D6228, D6667 or Gas Processors Association Standard 2377. [40 CFR 60.4415(a)(1)(i)]
50. The exhaust stack shall be equipped with permanent provisions to allow collection of stack gas samples consistent withEPA test methods and shall be equipped with safe permanent provisions to sample stack gases with a portable NOx,CO, and 02 analyzer during District inspections. The sampling ports shall be located in accordance with the CARDregulation titled California Air Resources Board Air Monitoring Quality Assurance Volume VI, Standard OperatingProcedures for Stationary Source Emission Monitoring and Testing. [District Rule 1080]
G722014: kb 10 2010 129111/1-40009.1
CONDITIONS FOR APPLICATION C-7220-1-0 III11:11
Page 5 of 7
51. Compliance demonstration (source testing) shall be District wr - t. .a certified testing laboratory. Source testing shall be conducted using the methods and p
vcollected by
District. The District must be notified 30 days prior to any • ce source test.1 • . 1
ed by the, and a source test plan must be
4110,submitted for approval 15 days prior to testing. The resu ! ' fl itted to the District within60 days thereafter. [District Rule 1081]
52. The turbine shall be equipped with a continuous monitoring system to measure i. ption. [DistrictRules 2201 and 4703 and 40 CFR 60.4335(b)(1)]
53. The owner or operator shall install, certify, maintain, operate and quality-assure a Continuous Emission MonitoringSystem (CEMS) which continuously measures and records the exhaust gas NOx, CO and 02 concentrations.Continuous emissions monitor(s) shall be capable of monitoring emissions during normal operating conditions, andduring startups and shutdowns provided the CEMS pass the relative accuracy requirement for startups and shutdownsspecified herein. If relative accuracy of CEMS cannot be demonstrated during startup conditions, CEMS resultsduring startup and shutdown events shall be replaced with startup emission rates obtained from source testing todetermine compliance with emission limits contained in this document. [District Rules 1080, 2201, and 4703 and 40CFR 60.4335(b)(1)]
54. The CEMS shall complete a minimum of one cycle of operation (sampling, analyzing, and data recording) for eachsuccessive 15-minute period or shall meet equivalent specifications established by mutual agreement of the District,the ARB and the EPA. [District Rule 1080 and 40 CFR 60.4345(b)]
55. The NOx, CO and 02 CEMS shall meet the requirements in 40 CFR 60, Appendix F Procedure 1 and Part 60,Appendix B Performance Specification 2 (PS 2), or shall meet equivalent specifications established by mutualagreement of the District, the ARB, and the EPA. [District Rule 1080 and 40 CFR 60.4345(a)]
56. Audits of continuous emission monitors shall be conducted quarterly, except during quarters in which relative accuracyand total accuracy testing is performed, in accordance with EPA guidelines. The District shall be notified prior tocompletion of the audits. Audit reports 'shall be submitted along with quarterly compliance reports to the District.[District Rule 1080]
57. The owner/operator shall perform a relative accuracy test audit (RATA) for the NOx, CO, and 02 CEMs as specifiedby 40 CFR Part 60, Appendix F, 5.11, at least once every four calendar quarters. The perrnittee shall comply with theapplicable requirements for quality assurance testing and maintenance of the continuous emission monitor equipmentin accordance with the procedures and guidance specified in 40 CFR Part 60, Appendix F. [District Rule 1080]
58. Results of the CEM system shall be averaged over a one hour period for NOx emissions and a three hour period forCO emissions using consecutive 15-minute sampling periods in accordance with all applicable requirements of CFR60.13. [District Rule 4703 and 40 CFR 60.13]
59. Excess emissions shall be defined as any operating hour in which the 4-hour or 30-day rolling average NOXconcentration exceeds applicable emissions limit and a period of monitor downtime shall be any unit operating hour inwhich sufficient data are not obtained to validate the hour for either NOX or 02 (or both). [40 CFR 60.4380(bX1)]
60. Results of continuous emissions monitoring shall be reduced according to the procedure established in 40 CFR, Part51, Appendix P, paragraphs 5.0 through 5.3.3, or by other methods deemed equivalent by mutual agreement with theDistrict, the ARB, and the EPA. [District Rule 1080]
61. The facility shall install and maintain equipment, facilities, and systems compatible with the District's CEM datapolling software system and shall make CEM data available to the District's automated polling system on a daily basis.[District Rule 1080]
62. Upon notice by the District that the facility's CEM system is not providing polling data, the facility may continue tooperate without providing automated data for a maximum of 30 days per calendar year provided the CEM data is sentto the District by a District-approved alternative method. [District Rule 1080]
63. The owner or operator shall, upon written notice from the APCO, provide a summary of the data obtained from theCEM systems. This summary shall be in the form and the manner prescribed by the APCO. [District Rule 1080]
C.TII014: lair 15 2010 050%11- COOP/
CONOMONS FOR APPLICATION C-7220-1-0
64. The owner or operator shall submit a written report of CEM oreport is due on the 30th day following the end of the calendar quarter and shall inc udedata and magnitude of excess NOX emissions, nature and of excess (if knownpreventative measures adopted; Averaging period used forspecified in the emission test period and used to determineand date of each period during which the CEM was inoperative (monand the nature of system repairs and adjustments; A negative declaration when no excessRule 1080 and 40 CFR 60.4375(a) and 60.4395]
65. APCO or an authorized representative shall be allowed to inspect, as determined to be necessary, the requiredmonitoring devices to ensure that such devices are functioning properly. [District Rule 1080]
66. Permittee shall notify the District of any breakdown condition as soon as reasonably possible, but no later than onehour after its detection, unless the owner or operator demonstrates to the Districfs satisfaction that the longer reportingperiod was necessary. [District Rule 1100, 6.1]
67. The District shall be notified in writing within ten days following the correction of any breakdown condition. Thebreakdown notification shall include a description of the equipment malfunction or failure, the date and cause of theinitial failure, the estimated emissions in excess of those allowed, and the methods utilized to restore normaloperations. [District Rule 1100, 7.0]
68. The permittee shall maintain the following records: date and time, duration, and type of any startup, shutdown, ormalfunction; performance testing, evaluations, calibrations, checks, adjustments, any period during which a continuousmonitoring system or monitoring device was inoperative, and maintenance of any continuous emission monitor.[District Rules 2201 and 4703]
69. The permittee shall maintain the following records: quarterly hours of operation, fuel consumption (scf/hr andscf/rolling twelve month period), continuous emission monitor measurements, calculated ammonia slip, and calculatedNOx mass emission rates (lb/hr and lb/twelve month rolling period). [District Rules 2201 and 4703]
70. All records shall be maintained and retained on-site for a period of at least 5 years and shall be made available forDistrict inspection upon request. [District Rules 1070, 2201, and 4703]
71. Disturbances of soil related to any construction, demolition, excavation, extraction, or other earthmoving activitiesshall comply with the requirements for fugitive dust control in District Rule 8021 unless specifically exempted underSection 4.0 of Rule 8021 or Rule 8011. [District Rules 8011 and 8021]
72. An owner/operator shall submit a Dust Control Plan to the APCO prior to the start of any construction activity on anysite that will include 10 acres or more of disturbed surface area for residential developments, or 5 acres or more ofdisturbed surface area for non-residential development, or will include moving, depositing, or relocating more than2,500 cubic yards per day of bulk materials on at least three days. [District Rules 8011 and 8021]
73. An owner/operator shall prevent or cleanup any carryout or trackout in accordance with the requirements of DistrictRule 8041 Section 5.0, unless specifically exempted under Section 4.0 of Rule 8041 (8/19/04) or Rule 8011(8/19/04).[District Rules 8011 and 8021]
74. Whenever open areas are disturbed, or vehicles are used in open areas, the facility shall comply with the requirementsof Section 5.0 of District Rule 8051, unless specifically exempted under Section 4.0 of Rule 8051 or Rule 8011.[District Rules 8011 and 8051]
75. Any paved road or unpaved road shall comply with the requirements of District Rule 8061 unless specificallyexempted under Section 4.0 of Rule 8061 or Rule 8011. [District Rules 8011 and 8061]
76. Water, gravel, roadmix, or chemical/organic dust stabilizers/suppressants, vegetative materials, or other District-approved control measure shall be applied to unpaved vehicle travel areas as required to limit Visible Dust Emissionsto 20% opacity and comply with the requirements for a stabilized unpaved road as defined in Section 3.59 of DistrictRule 8011. [District Rules 8011 and 8071]
77. Where dusting materials are allowed to accumulate on paved surfaces, the accumulation shall be removed daily orwater and/or chemical/organic dust stabilizers/suppressants shall be applied to the paved surface as required tomaintain continuous compliance with the requirements for a stabilized unpaved road as defined in Section 3.59 ofDistrict Rule 8011 and limit Visible Dust Emissions (VDE) to 20% opacity. [District Rules 8011 and 8071]
Page 6 of 7
O. Theime intervals,
, corrective actions taken ande averaging period
licable timed span checks,uned. [District
CONDITIONS FOR APPUCATION C-7220-1-0 S Fs Page 7 of 7
78. On each day that 50 or more Vehicle Daily Trips or 25 or more I - • ,, NI will occur onan unpaved vehicle/equipment traffic area, pennittee shall apply water, gravel, • : • i • ix, r . 0 , : . 1 ic dust
•stabilizers/suppressants, vegetative materials, or other II Ivo .1.ved control measure as required to limit VisibleDust Emissions to 20% opacity and comply with the req w a 4 . : e., , ; r7..t •.1 --11-4 I ad as defined in Section3.59 of District Rule 8011. [District Rules 8011 and 8071] ff W
79. Whenever any portion of the site becomes inactive, Pennittee shall restrict anydisturbed surface to comply with the conditions for a stabilized surface as defined in Section 3.5 otbistrict Rule8011. [District Rules 8011 and 8071]
80. Records and other supporting documentation shall be maintained as required to demonstrate compliance with therequirements of the roles under Regulation VIII only for those days that a control measure was implemented. Suchrecords shall include the type of control measure(s) used, the location and extent of coverage, and the date, amount,and frequency of application of dust suppressant, manufacturer's dust suppressant product information sheet thatidentifies the name of the dust suppressant and application instructions. Records shall be kept for one year followingproject completion that results in the termination of all dust generating activities. [District Rules 8011, 8031, and 8071]

JHEALTHY iMR) LIVING"
San Joaquin Valleylia AIR POLLUTION CONTROL DISTRICT
April 28, 2010
Aeros EnvironmentalAttn: Mr. Mike Gray18828 Highway 65Bakersfield, CA 93308
RE: Approval of Test ProtocolPanoche Energy Center LLCMay 11-12 & 18-19, 2010Authority to Construct: C-7220-1-0, -2-0, -3-0, & -4-0
District staff has completed the review of the test protocol submitted for the compliance and RATA testingof four (4) 100 MW power generating systems with GE LMS100 natural gas tired turbine generators servedby selective catalytic reduction system and oxidation catalyst. Staff finds the protocol will meet theDistrict's requirements. Should the test date or test methods change from the approved protocol, then amodified protocol shall be submitted for review no later than seven (7) days prior to the scheduled test date.Submittal of the modified protocol after this date may result in test cancellation by District staff
Standard conditions include the following:1) All data must be recorded by a data logger and shall be submitted to the District in hard copy and in
electronic form on disk.2) A colored copy of the original 110% strip chart must be submitted with the report.3) If at any time during a test run the measured concentration exceeds the span, the test run shall be
considered invalid for determining compliance (in some cases, two recorders or a dual-range recordermay be necessary). The emission standard shall not be less than 30% of the monitoring range.
4) Source test is being performed in accordance with the most recent PTO/ATC.5) All testing must be done during normal District business hours unless otherwise approved.
If the equipment to be tested is being operated under a District issued Authority to Construct, it is theoperator's responsibility to contact the District and schedule a start-up inspection prior to the scheduledsource test date. Failure to do so may result in cancellation of the scheduled source test. If you have anyquestions, please contact Mr. Joe Avila at (559) 230-5951.
Sincerely,
Michael CarreraSupervising Air Quality Inspector
Joe AvilaAi r-Quality-kispeeter
Northern Region
4800 Enterprise Way
Modesto, CA 95356-8718
Tel: (209) 557-6400 FAX: (209) 557-6475
Central Region (Main Office)
1990 E. Gettysburg Avenue
Fresno, CA 93726-0244
Tel: (559) 230-6000 FAX: (559) 230-6061
Southern Region
34946 Flyover Court
Bakersfield, CA 93308-9725
Tel: 661-392-5500 FAX: 661-392-5585
www.valleyair.org www.healthyairtiving.comPrimed an recycled ma. 0
San Joaquin ValleyAIR POLLUTION CONTROL DISTRICT
ZiHEALTHY ta 'A LIVING'April 28, 2010
Panoche Energy Center, LLCAttn: Mr. Roy Campbell43883 W Panoche Rd.Firebaugh, CA 93622
RE: Approval of Test ProtocolPanoche Energy Center LLCMay 11-12& 18-19, 2010Authority to Construct: C-7220-1-0, -2-0, -3-0, & -4-0
District staff has completed the review of the test protocol submitted for the compliance and RATA testingof four (4) 100 MW power generating systems with GE LMS100 natural gas fired turbine generators servedby selective catalytic reduction system and oxidation catalyst. Staff finds the protocol will meet theDistrict's requirements. Should the test date or test methods change from the approved protocol, then amodified protocol shall be submitted for review no later than seven (7) days prior to the scheduled test date.Submittal of the modified protocol after this date may result in test cancellation by District staff.
Standard conditions include the following:I) All data must be recorded by a data logger and shall be submitted to the District in hard copy and in
electronic form on disk.2) A colored copy of the original 110% strip chart must be submitted with the report.3) If at any time during a test run the measured concentration exceeds the span, the test run shall be
considered invalid for determining compliance (in some cases, two recorders or a dual-range recordermay be necessary). The emission standard shall not be less than 30% of the monitoring range.
4) Source test is being performed in accordance with the most recent PTO/ATC.5) All testing must be done during normal District business hours unless otherwise approved.
If the equipment to be tested is being operated under a District issued Authority to Construct, it is theoperator's responsibility to contact the District and schedule a start-up inspection prior to the scheduledsource test date. Failure to do so may result in cancellation of the scheduled source test. If you have anyquestions, please contact Mr. Joe Avila at (559) 230-5951.
Sincerely,
Michael Can-eraSupervising Air Quality Inspector
Joe AvilaAir Quality Inspector 1
Northern Region
4800 Enterprise Way
Modesto, CA 953569718
Tel: (2091557-6400 FAX:12091557-6475
Central Region (Main Office)
1990 E. Gettysburg Avenue
Fresno, CA 93728-0244
Tel: 15591230-6000 FAX: (559)2396061
Southern Region
34946 Flyover Court
Bakersfield, CA 93308-9725
Tel: 661-392-5500 FAX: 661-392-5585
www.valleyair.org www.healthyairliving.comPrited randol paw. 0
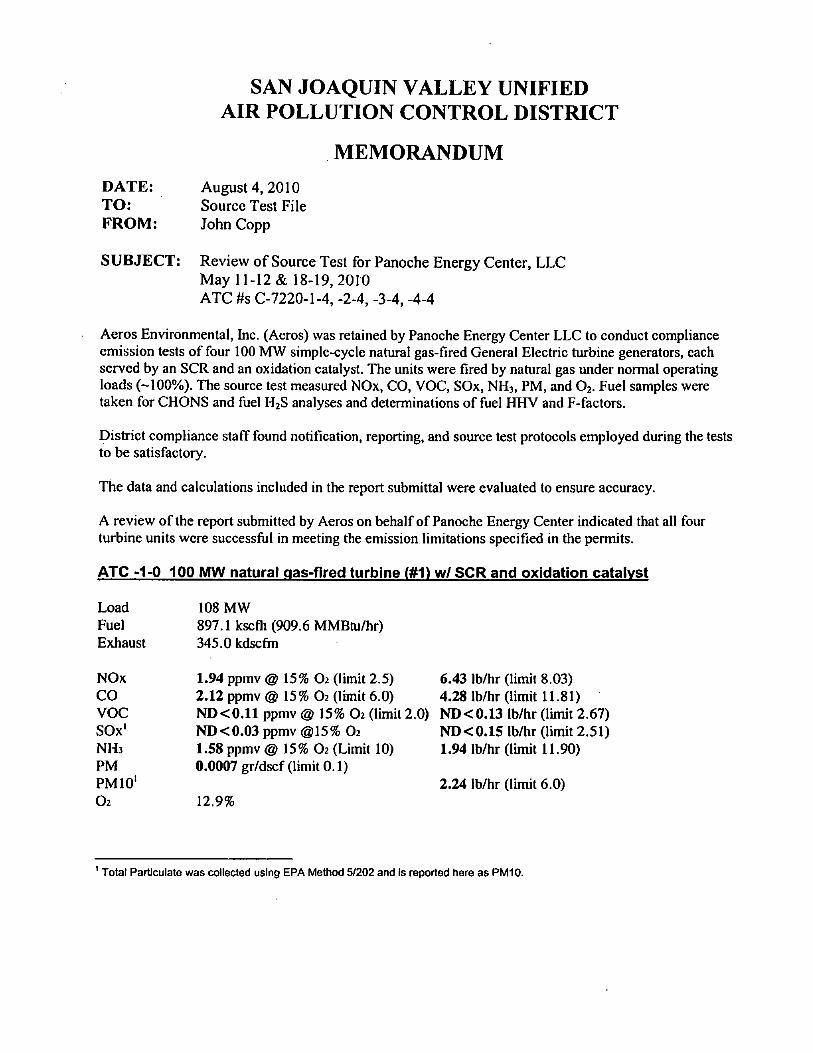
SAN JOAQUIN VALLEY UNIFIEDAIR POLLUTION CONTROL DISTRICT
MEMORANDUM
DATE: August 4, 2010TO: Source Test FileFROM: John Copp
SUBJECT: Review of Source Test for Panoche Energy Center, LLCMay 11-12 & 18-19, 2010ATC #s C-7220-1-4, -2-4, -3-4, -4-4
Aeros Environmental, Inc. (Aeros) was retained by Panoche Energy Center LLC to conduct complianceemission tests of four 100 MW simple-cycle natural gas-fired General Electric turbine generators, eachserved by an SCR and an oxidation catalyst. The units were fired by natural gas under normal operatingloads (-100%). The source test measured NOx, CO, VOC, S0x, NH3 , PM, and 02. Fuel samples weretaken for CHONS and fuel H2S analyses and determinations of fuel HHV and F-factors.
District compliance staff found notification, reporting, and source test protocols employed during the teststo be satisfactory.
The data and calculations included in the report submittal were evaluated to ensure accuracy.
A review of the report submitted by Aeros on behalf of Panoche Energy Center indicated that all fourturbine units were successful in meeting the emission limitations specified in the permits.
ATC -1-0 100 MW natural gas-fired turbine (#1) w/ SCR and oxidation catalyst
Load 108 MWFuel 897.1 kscfh (909.6 MMBtu/hr)Exhaust 345.0 kdscfm
NOx 1.94 ppmv 15% 02 (limit 2.5) 6.43 lb/hr (limit 8.03)CO 2.12 ppmv @ 15% 02 (limit 6.0) 4.28 lb/hr (limit 11.81)VOC ND<0.11 ppmv 15% 02 (limit 2.0) ND<0.13 lb/hr (limit 2.67)SOx' ND<0.03 ppmv @15% 02 ND<0.15 lb/hr (limit 2.51)NH3 1.58 ppmv 15% 02 (Limit 10) 1.94 lb/hr (limit 11.90)PM 0.0007 gr/dscf (limit 0.1)rm 10 1 2.24 lb/hr (limit 6.0)02 12.9%
Total Particulate was collected using EPA Method 5/202 and is reported here as PM10.

ATC -2-0 100 MW natural gas-fired turbine (#2) w/ SCR and oxidation catalyst
Load 106.3 MWFuel 901.5 kscfh (914.2 MMBtu/hr)Exhaust 347.4 kdscfm
NOx 2.13 ppmv @ 15% 02 (limit 2.5) 7.11 lb/hr (limit 8.03)CO 1.53 ppmv @ 15% 02 (limit 6.0) 3.11 lb/hr (limit 11.81)VOC ND< 0.11 ppmv @ 15% 02 (limit 2.0) ND < 0.13 lb/hr (limit 2.67)SOx' ND< 0.04 ppmv @15% 02 ND < 0.15 lb/hr (limit 2.51)NH3 1.37 ppmv @ 15% 02 (Limit 10) 1.70 lb/hr (limit 11.90)PM 0.0004 gr/dscf (limit 0.1)PM 102 1.38 lb/hr (limit 6.0)02 13.0%
ATC -3-0 100 MW natural gas-fired turbine (#3) w/ SCR and oxidation catalyst
Load 107.6 MWFuel 904.6 kscfh (913.6 MMBtu/hr)Exhaust 343.0 kdscfm
NOx 2.11 ppmv @ 15% 02 (limit 2.5) 7.02 lb/hr (limit 8.03)CO 0.62 ppmv @ 15% 02 (limit 6.0) 1.25 lb/hr (limit 11.81)VOC ND< 0.11 ppmv @ 15% 02 (limit 2.0) ND< 0.13 lb/hr (limit 2.67)SOx' ND <0.03 ppmv (4, 15% 02 ND< 0.15 lb/hr (limit 2.51)NH3 1.44 ppmv @ 15% 02 (Limit 10) 1.77 lb/hr (limit 11.90)PM 0.0005 gr/dscf (limit 0.1)PM 102 1.72 lb/hr (limit 6.0)02 12.9%
ATC -4-0 100 MW natural gas-fired turbine (#4) w/ SCR and oxidation catalyst
Load 105.4 MWFuel 888.2 kscfh (897.1 MMBtu/hr)Exhaust 340.1 kdscfm
NOx 2.10 ppmv @ 15% 02 (limit 2.5) 6.88 lb/hr (limit 8.03)CO 1.28 ppmv @ 15% 02 (limit 6.0) 2.55 lb/hr (limit 11.81)VOC ND < 0.11 ppmv @ 15% 02 (limit 2.0) ND <0.13 lb/hr (limit 2.67)SOx' ND<0.03 ppmv @15% 02 ND < 0.15 lb/hr (limit 2.51)NH3 1.36 ppmv @ 15% 02 (Limit 10) 1.63 lb/hr (limit 11.90)PM 0.0008 gr/dscf (limit 0.1)PM 102 2.56 lb/hr (limit 6.0)02 13.0%
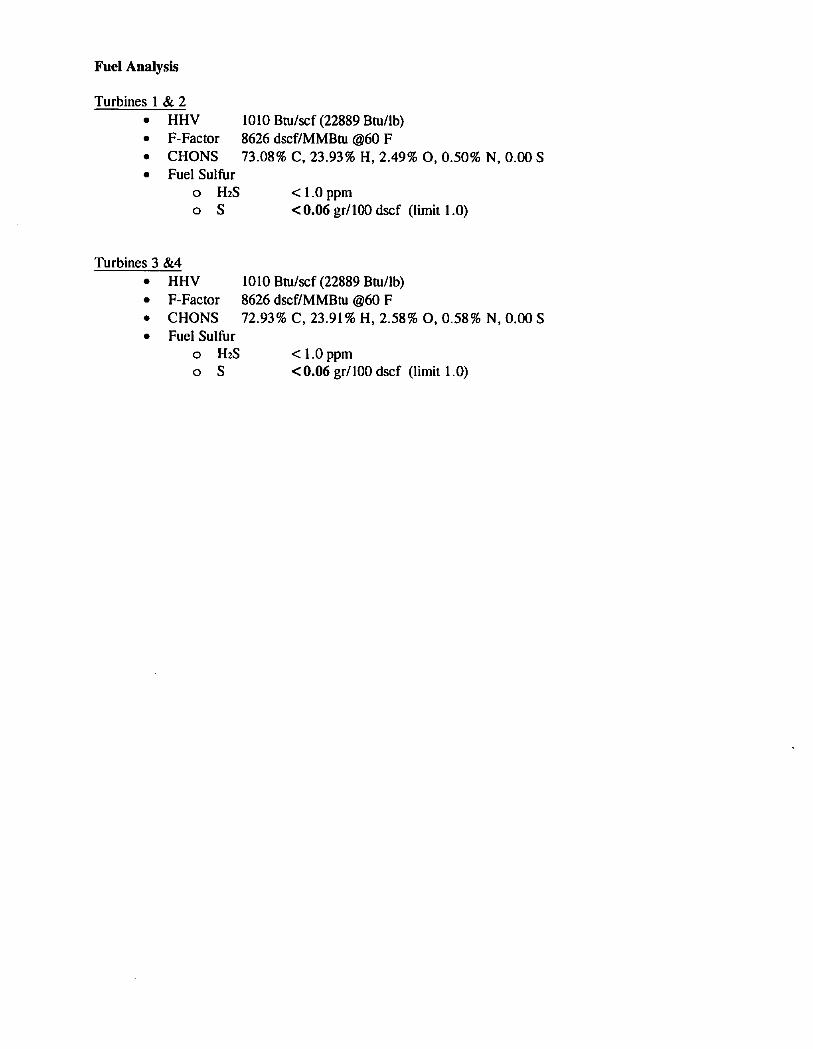
Fuel Analysis
Turbines 1 & 2• HHV 1010 Btu/scf (22889 Btu/lb)• F-Factor 8626 dscf/MMBtu @60 F• CHONS 73.08% C, 23.93% H, 2.49% 0, 0.50% N, 0.00 S• Fuel Sulfur
o H2S <1.0 ppmo S <0.06 gr/lOOdscf (limit 1.0)
Turbines 3 &4• HHV 1010 Btu/scf (22889 Btu/lb)• F-Factor 8626 dscf/MMBtu @60 F• CHONS 72.93% C, 23.91% H, 2.58% 0, 0.58% N, 0.00 S• Fuel Sulfur
o 142S <1.0 ppmo S <0.06 gr/100 dscf (limit 1.0)
Sia koaqvAn Vaney LJHEALTHY AEI LOVING'AIR POLLUTION CONTROL DISTRICT
August 4, 2010
Panoche Energy Center LLCAttn: Roy Hargrove43883 W. Panoche Rd.Firebaugh, CA 93622
Re: DETERMINATION OF COMPLIANCE EMISSION TESTING
Dear Mr. Hargrove,
District staff has received the test reports for the permitted equipment listed below submitted forcompliance determination with permitted emission limits. Review of the test result(s) reveal • theequipment to be operating in compliance with permitted NOx, CO, VOC, S0x, PM10 and N113emission limits.
If the permitted equipment has annual source testing requirements, then the next annual test mustbe conducted within thirty days (+/- 30) of the next test date as shown below. If an ATC hasbeen issued for modifications to the permitted equipment, then the testing requirements mustfollow the ATC.
Permit Number Unit Test Date Next Test DateC-7220-1-0 100 MW Turbine Generator #1 5/11/10 4/30/11C-7220-2-0 100 MW Turbine Generator #2 5/12/10 4/27/11C-7220-3-0 100 MW Turbine Generator #3 5/18/10 4/23/11C-7220-4-0 100 MW Turbine Generator #4 5/19/10 4/24/11
If you have any questions please call this office at (559) 230-6000.
Sincerely,
Michael CarreraCentral Region Compliance Manager
de),/
John CoppAir Quality Inspector II
Northern Region
4800 Enterprise Way
Modesto, CA 95356-8718
Tel: (209) 557-6400 FAX: 12091557-M75
Central Region (Main Office)
1990 E. Gettysburg Avenue
Fresno, CA 93726-0244
Tel: 1559) 230-6000 FAX: (559) 230-6061
Southern Region
34946 Flyover Court
Bakersfield, CA 93308-9725
Tel: 661•392•5500 MX: 661-392-5585
www.valleyeir.org www.healthyaidiving.com?note, ncydd owl 0
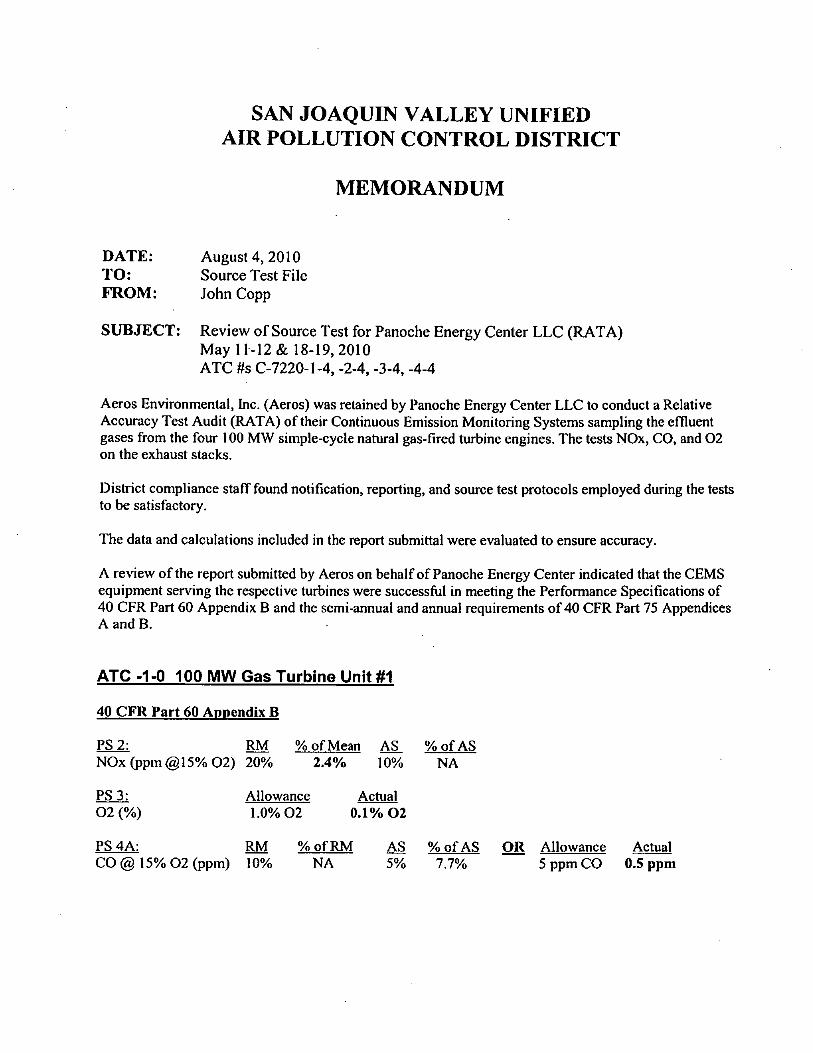
SAN JOAQUIN VALLEY UNIFIEDAIR POLLUTION CONTROL DISTRICT
MEMORANDUM
DATE: August 4, 2010TO: Source Test FileFROM: John Copp
SUBJECT: Review of Source Test for Panache Energy Center LLC (RATA)May 11-12 & 18-19, 2010ATC #s C-7220-1-4, -2-4, -3-4, -4-4
Aeros Environmental, Inc. (Aeros) was retained by Panoche Energy Center LLC to conduct a RelativeAccuracy Test Audit (RATA) of their Continuous Emission Monitoring Systems sampling the effluentgases from the four 100 MW simple-cycle natural gas-fired turbine engines. The tests NOx, CO, and 02on the exhaust stacks.
District compliance staff found notification, reporting, and source test protocols employed during the teststo be satisfactory.
The data and calculations included in the report submittal were evaluated to ensure accuracy.
A review of the report submitted by Aeros on behalf of Panache Energy Center indicated that the CEMSequipment serving the respective turbines were successful in meeting the Performance Specifications of40 CFR Part 60 Appendix B and the semi-annual and annual requirements of 40 CFR Part 75 AppendicesA and B.
ATC -1-0 100 MW Gas Turbine Unit #1
40 CFR Part 60 Appendix B
PS 2: RM % of Mean AS % of ASNOx (ppm @15% 02) 20% 2.4% 10% NA
PS 3: Allowance Actual 02(%) 1.0%02 0.1%02
PS 4A: RM % of RM AS % of AS OR Allowance ActualCO @ 15% 02 (ppm) 10% NA 5% 7.7% 5 ppm CO 0.5 ppm
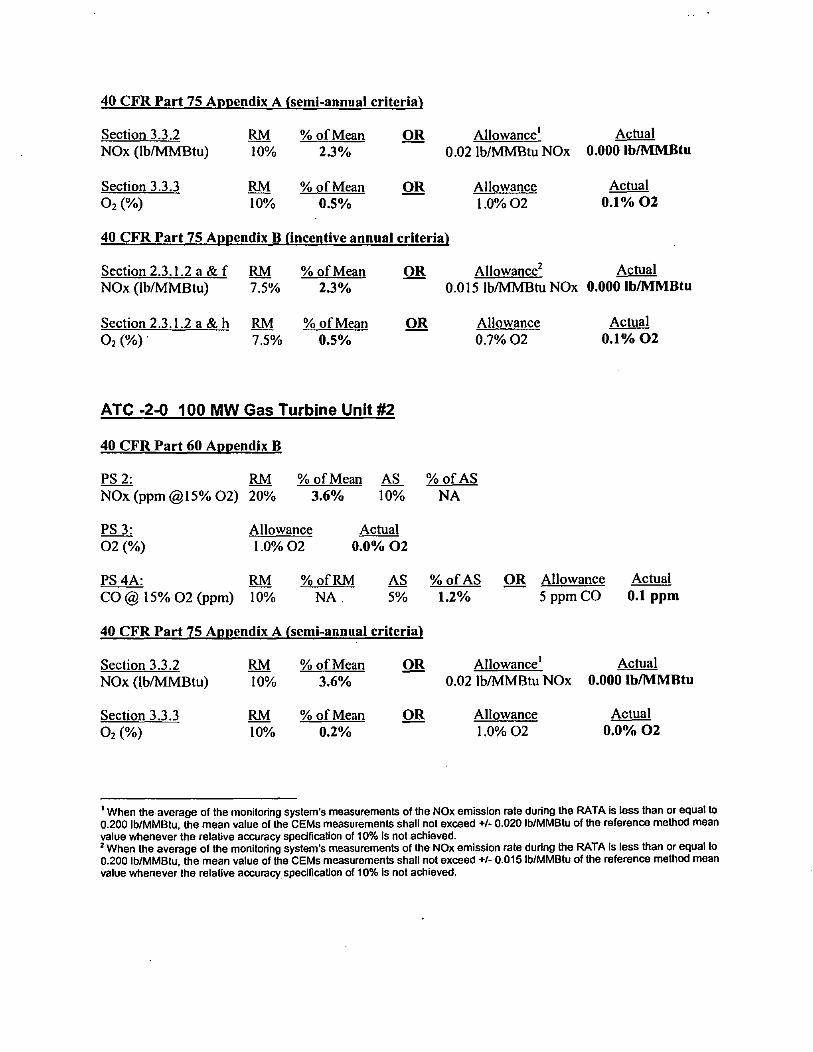
Section 2.3.1.2 a & h RM % of Mean OR Allowance0.7% 02
Actual0.1% 0202 (%) 7.5% 0.5%
40 CFR Part 75 Appendix A (semi-annual criterial
Section 3.3.2 RM % of Mean
OR Allowance' Actual NOx (1b/MMBtu) 10% 2.3%
0.02 lb/lVIMBtu NOx 0.000 lb/IVIIVIBtu
Section 3.3.3
RM % of Mean OR
Allowance Actual
02 (%)
10% 0.5%
1.0% 02
0.1% 02
40 CFR Part 75 Appendix B (incentive annual criteria)
Section 2.3.1.2 a & f RM
% of Mean
OR Allowance2 Actual NOx (1b/MMBtu) 7.5%
2.3%
0.015 lb/MMBtu NOx 0.000 lb/MMBtu
ATC -2-0 100 MW Gas Turbine Unit #2
40 CFR Part 60 Appendix B
PS 2: RM % of Mean AS % of ASNOx (ppm @15% 02) 20% 3.6% 10% NA
PS 3: Allowance Actual02 (%) 1.0% 02
0.0% 02
PS 4A: RM % of RM AS % of AS OR Allowance ActualCO @ 15% 02 (ppm) 10% NA 5% 1.2% 5 ppm CO 0.1 ppm
40 CFR Part 75 Appendix A (semi-annual criteria)
Section 3.3.2
RM % of Mean OR Allowance' Actual NOx (lb/IVIMBtu) 10% 3.6%
0.02 lb/MMI3tu NOx 0.000 lb/MMBtu
Section 3.3.3
RM % of Mean OR
Allowance
Actual
02 (%)
10% 0.2%
1.0% 02
0.0% 02
When the average of the monitoring system's measurements of the NOx emission rate during the RATA is lass than or equal to0.200 lb/MMBtu, the mean value of the CEMs measurements shall not exceed +/- 0.020 lb/MMBtu of the reference method meanvalue whenever the relative accuracy specification of 10% Is not achieved.2 When the average of the monitoring system's measurements of the NOx emission rate during the RATA Is less than or equal to0.200 lb/MMBtu, the mean value of the CEMs measurements shall not exceed +/- 0.015 lb/MMBtu of the reference method meanvalue whenever the relative accuracy specification of 10% is not achieved.
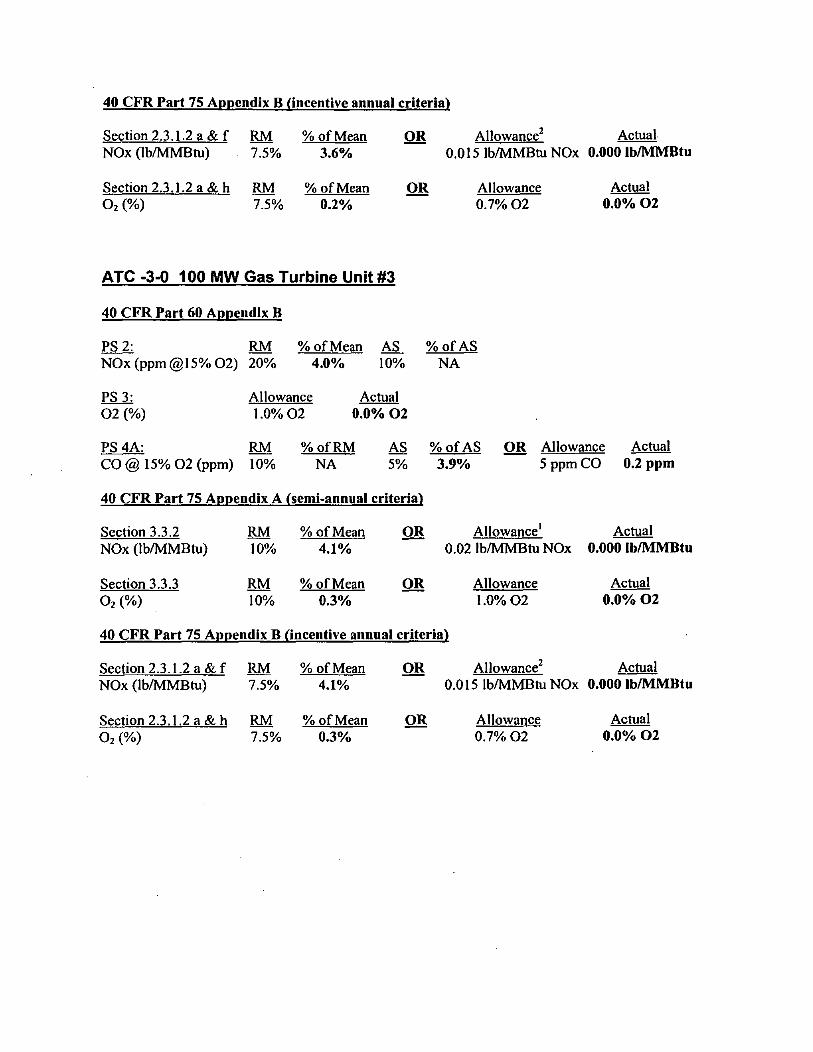
40 CFR Part 75 Appendix B (incentive annual criteria)
Section 2.3.1.2 a & f RM % of Mean OR Allowance2ActualNOx (1b/MMBtu) 7.5% 3.6% 0.015 lb/MMBtu NOx 0.00016/MI1/Btu
Section 2.3.1.2 a& h RM % of Mean OR Allowance
Actual02 (%)
7.5% 0.2% 0.7% 02
0.0% 02
ATC -3-0 100 MW Gas Turbine Unit #3
40 CFR Part 60 Appendix B
PS 2: RM % of Mean AS % of ASNOx (ppm ®15% 02) 20% 4.0% 10% NA
PS 3: Allowance Actual 02 (%) 1.0% 02 0.0% 02
PS 4A: RM % of RM AS % of AS OR Allowance Actual CO 15% 02 (ppm) 10% NA 5% 3.9% 5 ppm CO 0.2 ppm
40 CFR Part 75 Appendix A (semi-annual criteria)
Section 3.3.2 RM % of Mean OR Allowance' ActualNOx (1b/MMBtu) 10% 4.1%
0.02 lb/MMBtu NOx 0.000 lb/M11113tu
Section 3.3.3
RM % of Mean OR Allowance
Actual
02 (%)
10% 0.3% 1.0% 02
0.0% 02
40 CFR Part 75 Appendix B (incentive annual criteria)
Section 2.3.1.2 a & f RM % of Mean OR Allowance2Actual NOx (1b/MMBtu) 7.5% 4.1% 0.015 lb/MMBtu NOx 0.000 lb/MMBtu
Section 2.3.1.2 a & h RM % of Mean OR Allowance
Actual02 (A) 7.5% 0.3% 0.7% 02
0.0% 02
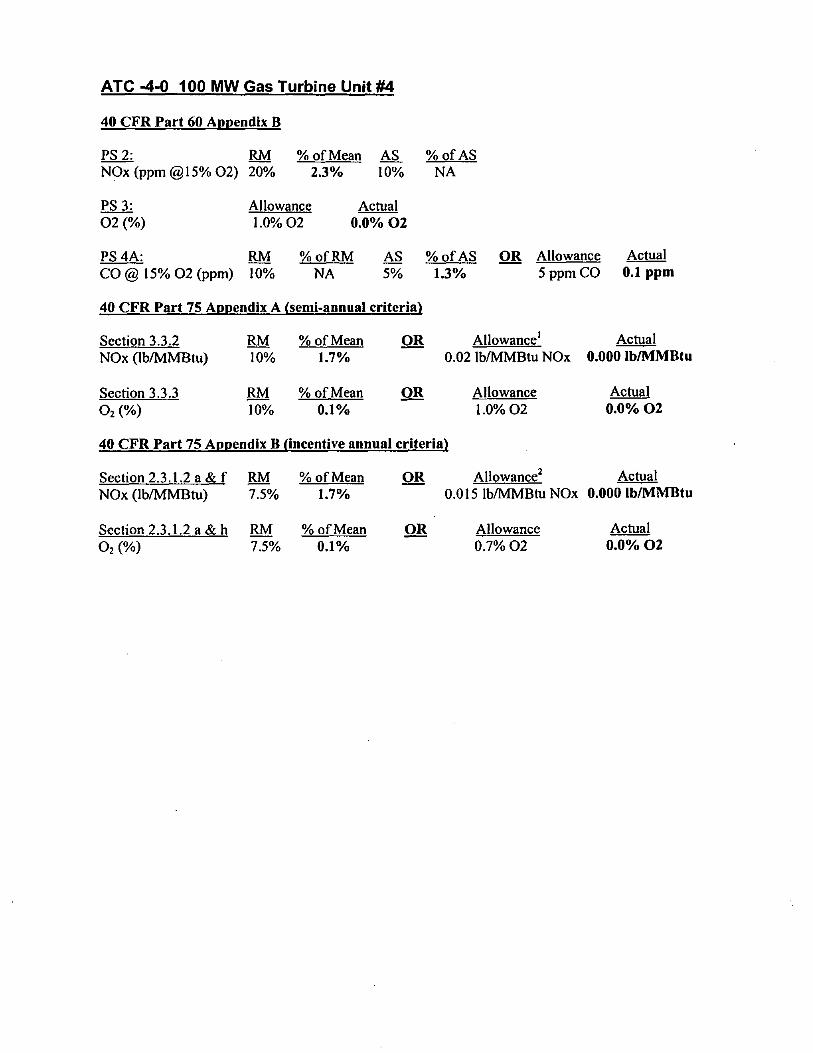
ATC -4-0 100 MW Gas Turbine Unit #4
40 CFR Part 60 Appendix B
PS 2: RM % of Mean AS % of ASNOx (ppm @15% 02) 20% 2.3% 10% NA
PS 3: Allowance Actual 02 (%) 1.0% 02 0.0% 02
PS 4A: RM % of RM AS % of AS OR Allowance ActualCO @ 15% 02 (ppm) 10% NA 5% 1.3% 5 ppm CO 0.1 ppm
40 CFR Part 75 Appendix A (semi-annual criteria)
Section 3.3.2 RM % of Mean OR Allowancel Actual NOx (1b/MMBtu) 10% 1.7% 0.02 lb/MMBtu NOx 0.000 lb/MMBtu
Section 3.3.3
RM % of Mean OR Allowance
Actual02 (%)
10% 0.1% L0%02
0.0% 02
40 CFR Part 75 Appendix B (incentive annual criteria)
Section 2.3.1.2 a & f RM % of Mean OR Allowance2Actual NOx (1b/MMBtu) 7.5% 1.7% 0.015 lb/MMBtu NOx 0.000 lb/MMBtu
Section 2.3.1.2 a & h RM % of Mean OR Allowance
Actual
02 CM 7.5% 0.1% 0.7% 02
0.0% 02
Related Documents


