Molecular Ecology (2008) 17, 2839–2853 doi: 10.1111/j.1365-294X.2008.03794.x © 2008 The Authors Journal compilation © 2008 Blackwell Publishing Ltd Blackwell Publishing Ltd Complex patterns of genetic and phenotypic divergence in an island bird and the consequences for delimiting conservation units A. B. PHILLIMORE,*†‡ I. P. F. OWENS,*† R. A. BLACK,* J. CHITTOCK,‡ T. BURKE‡ and S. M. CLEGG* *Division of Biology and †NERC Centre for Population Biology, Imperial College London, Silwood Park, Ascot, Berkshire SL5 7PY, UK, ‡Sheffield Molecular Genetics Facility, Department of Animal and Plant Sciences, University of Sheffield, Sheffield S10 2TN, UK Abstract Substantial phenotypic and genetic variation is often found below the species level and this may be useful in quantifying biodiversity and predicting future diversification. However, relatively few studies have tested whether different aspects of intraspecific variation show congruent patterns across populations. Here, we quantify several aspects of divergence between 13 insular populations of an island endemic bird, the Vanuatu white-eye (Zosterops flavifrons). The components of divergence studied are mitochondrial DNA (mtDNA), nuclear DNA microsatellites and morphology. These different aspects of divergence present subtly different scenarios. For instance, an mtDNA phylogenetic tree reveals a potential cryptic species on the most southerly island in Vanuatu and considerable divergence between at least two other major phylogroups. Microsatellite loci suggest that population genetic divergence between insular populations, both between and within phylogroups, is substantial, a result that is consistent with a low level of interisland gene flow. Finally, most populations were found to be strongly morphologically divergent, but no single population was morphologically diagnosable from all others. Taken together, our results show that, although many measures of divergence are concordant in this system, the number of divergent units identified varies widely depending on the characters considered and approach used. A continuum of divergence and a degree of discordance between different characters are both to be expected under simple models of evolution, but they present problems in terms of delimiting conservation units. Keywords: birds, conservation, islands, phylogeny, subspecies Received 23 December 2007; revision accepted 7 April 2008 Islands have been described as natural laboratories by evolutionary biologists and ecologists alike and have played a pivotal role in the development of these fields (e.g. Darwin 1859; Wallace 1880; Mayr 1942; MacArthur & Wilson 1967; Lack 1971; Diamond 1975; Grant 1986). Perhaps more than any other vertebrate group, birds are excellent colonizers of, and speciators on, islands and archipelagos (Newton 2003). Indeed, Gaston & Blackburn (1995) classified almost 20% of all bird species as island endemics. Unfortunately, insular bird species are also among the most threatened in their Class (Collar et al. 1994), which places a premium on consistently delimiting appropriate units of insular diversity for conservation. After more than a century of debate (see Darwin 1859 for an early discussion of this issue), the criteria for delimiting species is still contentious (e.g. Hey 2001; Coyne & Orr 2004; de Queiroz 2005) and this includes insular taxa. For instance, under the biological species concept (BSC) reproductive isolation is required for species status to be conferred on a population. This means that a degree of subjectivity is necessary in deciding whether allopatric populations have diverged enough to prevent interbreeding (Wilson & Brown 1953; Helbig et al. 2002; Coyne & Orr 2004). An alternative to the BSC, the phylogenetic species concept (PSC) offers greater objectivity with respect to allopatric taxa; species are identified as monophyletic clusters that share a derived character (Cracraft 1983). However, a drawback of this method is that it offers little information regarding the potential for future interbreeding (Helbig et al. 2002). Correspondence: A. B. Phillimore, Fax: +44(0)20 75942339; E-mail: [email protected]

Welcome message from author
This document is posted to help you gain knowledge. Please leave a comment to let me know what you think about it! Share it to your friends and learn new things together.
Transcript

Molecular Ecology (2008) 17, 2839–2853 doi: 10.1111/j.1365-294X.2008.03794.x
© 2008 The AuthorsJournal compilation © 2008 Blackwell Publishing Ltd
Blackwell Publishing LtdComplex patterns of genetic and phenotypic divergence in an island bird and the consequences for delimiting conservation units
A. B . PHILLIMORE ,*†‡ I . P. F. OWENS,*† R . A . BLACK,* J . CHITTOCK,‡ T. BURKE‡ and S . M. CLEGG**Division of Biology and †NERC Centre for Population Biology, Imperial College London, Silwood Park, Ascot, Berkshire SL5 7PY, UK, ‡Sheffield Molecular Genetics Facility, Department of Animal and Plant Sciences, University of Sheffield, Sheffield S10 2TN, UK
Abstract
Substantial phenotypic and genetic variation is often found below the species level andthis may be useful in quantifying biodiversity and predicting future diversification.However, relatively few studies have tested whether different aspects of intraspecificvariation show congruent patterns across populations. Here, we quantify several aspects ofdivergence between 13 insular populations of an island endemic bird, the Vanuatu white-eye(Zosterops flavifrons). The components of divergence studied are mitochondrial DNA(mtDNA), nuclear DNA microsatellites and morphology. These different aspects of divergencepresent subtly different scenarios. For instance, an mtDNA phylogenetic tree reveals apotential cryptic species on the most southerly island in Vanuatu and considerable divergencebetween at least two other major phylogroups. Microsatellite loci suggest that populationgenetic divergence between insular populations, both between and within phylogroups,is substantial, a result that is consistent with a low level of interisland gene flow. Finally, mostpopulations were found to be strongly morphologically divergent, but no single populationwas morphologically diagnosable from all others. Taken together, our results show that,although many measures of divergence are concordant in this system, the number of divergentunits identified varies widely depending on the characters considered and approach used.A continuum of divergence and a degree of discordance between different characters areboth to be expected under simple models of evolution, but they present problems in terms ofdelimiting conservation units.
Keywords: birds, conservation, islands, phylogeny, subspecies
Received 23 December 2007; revision accepted 7 April 2008
Islands have been described as natural laboratories byevolutionary biologists and ecologists alike and have playeda pivotal role in the development of these fields (e.g. Darwin1859; Wallace 1880; Mayr 1942; MacArthur & Wilson 1967;Lack 1971; Diamond 1975; Grant 1986). Perhaps more thanany other vertebrate group, birds are excellent colonizersof, and speciators on, islands and archipelagos (Newton2003). Indeed, Gaston & Blackburn (1995) classified almost20% of all bird species as island endemics. Unfortunately,insular bird species are also among the most threatened intheir Class (Collar et al. 1994), which places a premium onconsistently delimiting appropriate units of insulardiversity for conservation.
After more than a century of debate (see Darwin 1859 foran early discussion of this issue), the criteria for delimitingspecies is still contentious (e.g. Hey 2001; Coyne & Orr 2004;de Queiroz 2005) and this includes insular taxa. For instance,under the biological species concept (BSC) reproductiveisolation is required for species status to be conferred on apopulation. This means that a degree of subjectivity isnecessary in deciding whether allopatric populations havediverged enough to prevent interbreeding (Wilson &Brown 1953; Helbig et al. 2002; Coyne & Orr 2004). Analternative to the BSC, the phylogenetic species concept(PSC) offers greater objectivity with respect to allopatrictaxa; species are identified as monophyletic clusters that sharea derived character (Cracraft 1983). However, a drawbackof this method is that it offers little information regardingthe potential for future interbreeding (Helbig et al. 2002).
Correspondence: A. B. Phillimore, Fax: +44(0)20 75942339; E-mail:[email protected]

2840 A . B . P H I L L I M O R E E T A L .
© 2008 The AuthorsJournal compilation © 2008 Blackwell Publishing Ltd
Application of the PSC generally leads to greater splitting(Agapow et al. 2004), a trend that tends to be more pro-nounced on islands (Peterson & Navarro-Sigüenza 1999).
It is of little surprise that in a BSC framework, the taxo-nomic rank below the species, the subspecies, has alsoattracted enduring controversy (e.g. Wilson & Brown 1953;Barrowclough 1980; Mayr 1982; O’Brien & Mayr 1991; Zink2004). Subspecies are defined as populations that occupydifferent ranges or habitats, possess phylogeneticallyconcordant traits, and differ from each other in naturalhistory (O’Brien & Mayr 1991). Typically, studies that addressrelationships among subspecies using molecular phylo-genies have found many to be paraphyletic (Barrow-clough 1980; Zink 2004). Interestingly, the incidence ofparaphyly is lower on islands (Phillimore & Owens 2006),which may be attributable to faster rates of drift and fixa-tion of alleles in small populations that experience little geneflow. Deciding on appropriate units for conservation belowthe species level is a major area of current discussion, withdifferent sources of information favoured (e.g. Moritz 1994;Crandall et al. 2000; Zink 2004; Haig et al. 2006). One of theproblems is that intraspecific geographical variation indifferent characters is often discordant (Wilson &Brown 1953). Studies that compare the extent of neutralgenetic divergence and phenotypic divergence betweenpopulations have reported a weakly positive correlation orno correlation between the two and that phenotypic diver-gence tends to exceed neutral genetic divergence (e.g. Mer-ilä 1997; McKay & Latta 2002; Nicholls et al. 2006; Saetheret al. 2007; Leinonen et al. 2008). Most tests addressingphenotypic evolution among insular taxa have found thatphenotypic divergence departs from a neutral null expec-tation, implying an important role for selection (e.g. Clegget al. 2002b; Harmon & Gibson 2006). A lack of congruencebetween different classes of information relates both to thecontinuum of divergence that exists as different loci evolveat different rates, and to the different evolutionary processesthat are involved in the divergence of different characters(Crandall et al. 2000).
Our aim in this study is to quantify three distinct aspectsof interisland divergence across 13 insular populations ofan endemic passerine bird, the Vanuatu white-eye (Zosteropsflavifrons). This species represents an excellent case study asit has diversified into seven recognized subspecies in asingle archipelago (Mayr 1945; Mees 1969). First, we use aphylogenetic approach to identify clusters of populationsthat have been on independent evolutionary trajectorieslong enough for mitochondrial genes to coalesce. It is,however, possible for two populations to be polyphyleticon a gene tree, but for them to have been exchanging fewor no individuals for many generations (Hudson & Coyne2002; Funk & Omland 2003). We therefore use microsatellitesto test for population genetic divergence at neutral nuclearloci and calculate the proportion of total neutral genetic
variation that is distributed among island populations. Wecomplement this with an individual-based clusteringapproach, which we use to test for genetic structure in theabsence of prior geographical information. Last, we conductquantitative analyses of morphological divergence amongislands using (i) a multivariate variance-partitioningapproach, which is a variant of the QST statistic commonlyused by evolutionary biologists (Spitze 1993), and (ii)univariate diagnosability tests, which are advocated bysome museum taxonomists (Patten & Unitt 2002; Cicero &Johnson 2006). We interpret the results of these tests andthe degree of congruence or conflict between them in thelight of evolutionary theory and consider the implicationsfor the conservation of insular endemics.
Methods
Study system
The Vanuatu white-eye is endemic to the Vanuatu archi-pelago in Melanesia, where it occurs on every major island(Mees 1969). Seven subspecies have been described (Mayr1945; Mees 1969), a number that is only exceeded amongbirds in Vanuatu by the island thrush (Turdus poliocephalus,with eight subspecies in the archipelago) and is in the topdecile for avian subspecies richness globally (Phillimoreet al. 2007). These subspecies vary only slightly in plumagecolour and pattern, size and tail length and are divided intotwo groups on the basis of plumage: those that are ‘yellow’(efatensis, flavifrons and gauensis); and those that are ‘darker’(brevicauda, macgillivrayi, majuscula and perplexa) (Mayr1945; Mees 1969; see Fig. 1). Throughout this study, we usethe term ‘population’ to refer to single-island populationsof the Vanuatu white-eye, which will only correspond tosubspecies status where a subspecies is a single-islandendemic.
Data collection
Birds were caught using mist nets and traps on 13 islandsin the Vanuatu archipelago during February–May 2004(A.B.P.) and February–April 2006 (S.M.C.). A total of 432Zosterops flavifrons were caught (Fig. 1). The followingstandard morphological measurements were taken for eachbird: culmen length to posterior of nostril, culmen depthand width (both taken at anterior of nostril), length of thetarso-metatarsus, flattened wing chord length, maximumtail length and body mass (Clegg et al. 2002b). Blood sampleswere taken via brachial venipuncture from each bird andstored either in eppendorfs containing 95% ethanol (A.B.P.)or on EDTA treated filter paper (S.M.C.) (Petren 1998). Asuse of numbered or coloured bands was not authorized forthese populations, the tip of the right-sided outer tail featherof each captured bird was clipped to avoid resampling.

PAT T E R N S O F D I V E R G E N C E I N A N I S L A N D B I R D 2841
© 2008 The AuthorsJournal compilation © 2008 Blackwell Publishing Ltd
Molecular methods
DNA was extracted from all individuals, following anammonium acetate protocol (Nicholls et al. 2000). A further12 blood samples from Santo were kindly provided byJ. Kirchman (New York State Museums). We selected four tofive individuals for phylogenetic analysis from each of theislands. In addition, we included a sample from Zosteropsrennellianus (kindly provided by C. Filardi) and Zosteropslateralis (collected on Tanna) as potential outgroups. Weamplified two mitochondrial protein coding regions: theL10755 and H11151 primers (Chesser 1999) amplified aregion including the ND3 gene; and the primers CB1 andCB2 amplified a portion of cytochrome b (cyt b) (Palumbi1996). These genes were chosen as they have already beenused in a phylogeographical study of Zosterops species(Warren et al. 2006). Amplifications were performed in20 μL reactions, including 30–40 ng template DNA, 0.5 μmof each forward and reverse primer, 0.25 μm dNTPs, 1×reaction buffer (Bioline), 0.1 U Taq polymerase (Bioline),2 mm MgCl2 (Bioline). Thermal cycling consisted of aninitial denaturation at 94 °C for 3 min, followed by 35cycles (40 cycles for cyt b) of: 94 °C for 30 s, 54 °C (55 °C forcyt b) for 30 s (45 s for cyt b) and 72 °C for 35 s (40 s for cytb). A final 10-min incubation period at 72 °C completed thereaction. Amplified fragments were electrophoresed on a1% agarose gel, stained with ethidium bromide and excisedfor purification with a Qiaquick gel extraction kit (QIAGEN).The purified DNA fragments were quantified against a 100base pair (bp) ladder (Bioline) on an ethidium bromide-
stained agarose gel. The purified fragments were used astemplate for Big Dye terminator cycle sequencing reactions(Applied Biosystems [ABI]). Cycle sequence products wereprecipitated in ethanol and electrophoresed on an ABI 3730sequencer. seqscape (ABI) was used to score bases andalign sequences. The sequences for ND3 and cyt b aredeposited in EMBL under Accession nos AM946092–AM946148 and AM946034–AM946091, respectively.
A total of 438 individuals were screened at seven micro-satellite loci using primers that had been developed for Z.lateralis [ZL12, ZL18, ZL38 (Degnan et al. 1999) and ZL45,ZL46, ZL50 and ZL54 (Frentiu et al. 2003, 2008)] and afurther three loci characterized in Acrocephalus sechellensis[Ase19, Ase28, Ase64 (Richardson et al. 2000)], that hadbeen successfully used across a wide range of species (seethe passerine microsatellite cross-utility database main-tained on the BIRDMARKER webpage at http://www.shef.ac.uk/misc/groups/molecol/deborah-dawson-bird-markers.html). Polymerase chain reaction (PCR) wasconducted using standard protocols or QIAGEN MultiplexPCR kits. Standard PCR consisted of 10 μL reactions con-taining 20 ng DNA, 0.5 μm of each primer (one fluores-cently labelled), 0.25 mm dNTPs, 1× reaction buffer (Bioline),0.5 U Taq polymerase (Bioline), and primer-dependentconcentrations of MgCl2. Cycling conditions were: 94 °Cfor 3 min, followed by 34 cycles of 94 °C 30 s, TA for 30 s(see Table S1, Supplementary material for further details),72 °C for 30 s. Primer sets were multiplexed post-PCR prior torunning on an Applied Biosystems 3730 DNA analyser. ForQIAGEN Multiplex PCR, we followed the manufacturer’s
Fig. 1 Map of Vanuatu and the distribution of subspecies and sample sizes (yellow subspecies are in plain text and darker subspecies areunderlined).

2842 A . B . P H I L L I M O R E E T A L .
© 2008 The AuthorsJournal compilation © 2008 Blackwell Publishing Ltd
recommendations, modified to a 4 μL reaction volume andused the recommended touchdown PCR cycle for multiplexPCR. Additionally, each individual was genetically sexedusing primers P2 and P8 (Griffiths et al. 1998). Allele sizescoring was conducted using the software genemapperversion 3.0 (Applied Biosystems).
Phylogenetic analyses
We included published Zosterops sequence data fromZ. atricapillus (GenBank Accession nos DQ328498.1,DQ328398.1), Z. nigrorum (DQ328455.1, DQ328355.1), Z.palpebrosus (DQ328449.1, DQ328349.1) and Z. senegalensis(DQ328443.1, DQ328343.1) as additional potential outgroups(Warren et al. 2006). We used the partition rate homogeneitytest in paup* 4.0 (Swofford 2003) to test whether there wasa significant difference in the phylogenetic signal of the twogenes. We then used an Akaike information criterion-basedapproach in modeltest version 3.7 (Posada & Crandall1998) to identify an appropriate nucleotide substitutionmodel. Phylogenetic reconstruction was implemented inbeast version 1.4.6 (Drummond & Rambaut 2007), using arelaxed clock approach (Drummond et al. 2006) with a meansubstitution rate set at 1% per lineage per million years (Weir2006). Rates of substitution were assumed to be uncorrelatedbetween adjacent branches and were drawn from a lognormaldistribution. A neighbour-joining tree was used as a priordistribution for the tree, and a Yule prior was used forbranching rates. We conducted two runs of 10 milliongenerations, each with sampling conducted every 1000generations. tracer (Rambaut & Drummond 2003) was usedto assess convergence, whether the two chains were mixing,and whether the estimated sample size (ESS) for each para-meter was of sufficient size to obtain good parameter estimates(i.e. ESS > 200). One million generations were discardedas burn-in from each run, leaving us with a posteriordistribution of 18 000 ultrametric trees. We obtained arooted ultrametric consensus tree where branch lengthsrepresent divergence measured in units of time.
Reciprocal monophyly of clades in phylogenetic treeshas variously been advocated as a means of delimitingspecies (e.g. Cracraft 1983) and intraspecific units (e.g. Ball& Avise 1992; Moritz 1994; Zink 2004). We therefore testedwhich of our island populations or groups of populationsform well-supported monophyletic clades on the basis ofBayesian posterior support. We also implemented a coa-lescent model in a likelihood framework to identify thenumber and membership of species clusters (described inPons et al. 2006; Fontaneto et al. 2007). We preferred thismethod to several alternative tree-based methods (see Sites& Marshall 2004), because clusters are identified using anentirely objective criterion and the number of clusters iden-tified is not a function of sample size. We compared themaximum-likelihood solution to a null model, under which all
lineages followed the same coalescent and branching processthrough time (i.e. corresponding to all individuals belongingto a single cluster), using a likelihood-ratio test with threedegrees of freedom. We identified any other clusteringsolutions that were found within two log-likelihoods of themaximum-likelihood solution. This analysis was conductedin r (r Development Core Team 2007) using script pro-vided by T. Barraclough (Imperial College London).
Population genetic analyses of microsatellites
Deviation from Hardy–Weinberg equilibrium was assessedfor each locus-population combination using genepop version3.4 (Raymond & Rousset 1995). An exact test for deviationfrom Hardy–Weinberg equilibrium was implemented usinga Markov chain approach (Guo & Thompson 1992; Raymond& Rousset 1995), to find the probability of obtaining anallele frequency distribution that was equally or less likely thanthat which was observed. This probability value, combinedwith Weir & Cockerham’s (1984) FIS value, identified cases inwhich there was a significant deficit (negative FIS) or excess(positive FIS) of homozygotes. We tested linkage disequilibr-ium between loci for all pairwise population combinationsand for each locus in turn using a Markov chain contingencytable approach in genepop (Raymond & Rousset 1995). Aglobal P value across populations was estimated usingFisher’s exact test (Fisher 1932). Bonferroni corrections formultiple comparisons were applied to these tests (Holm1979; Rice 1989; but see Moran 2003; Nakagawa 2004).
The proportion of the total genotypic variation that isdistributed among, rather than within, populations, denotedFST, is commonly used to quantify neutral genetic diver-gence among populations (Wright 1965). Although thismeasure assumes an infinite alleles model of mutation, itwas preferred as it has been shown to perform better thanother estimates of population structure when the numberof loci and the number of samples per population are small(Gaggioti et al. 1999). Here we estimate FST using θ (Weir &Cockerham 1984). However, FST-based approaches areinfluenced by the genetic variation within populations;two populations that share no alleles but have high hetero-zygosity will have lower FST values than two equallydivergent populations each with low heterozygosity(Hedrick 2005). To address this, and make θ estimatescomparable, we adopted the straightforward standardiza-tion procedure of Meirmans (2006). Pairwise θ was dividedby the maximum possible value, which we estimated bycoding alleles using the recodedata package, such that thewithin-population variation was maintained and among-population variation maximized, i.e. no allele sharingbetween populations (Meirmans 2006).
We used an individual-based Bayesian clustering methodimplemented in structure 2.0 to assess genetic structurein the absence of prior geographical information (Pritchard

PAT T E R N S O F D I V E R G E N C E I N A N I S L A N D B I R D 2843
© 2008 The AuthorsJournal compilation © 2008 Blackwell Publishing Ltd
et al. 2000). The analysis was conducted separately forpopulations of the darker form vs. the yellow forms due tothe substantial phylogenetic divergence between the twogroups (see mtDNA results). The population from Aneityumwas not included in this analysis, as our mtDNA gene treesuggests that it is not monophyletic with other Z. flavifrons.For both sets of analysis, we used a burn-in length of 105
and run-length of 106 iterations, with the default programsettings and no prior population information. We evaluatedthe number of genetic clusters (k) from 1 to 8 for the darkergroup, and from 1 to 5 for the yellow group. The posteriorprobabilities (calculated from model likelihoods) for eachvalue of k were compared to identify the most likelynumber of genetic clusters in each case. The proportion ofmembership of each population in each of the identifiedclusters was taken from the posterior distribution from thebest run for the most likely value of k.
Multivariate morphological analyses
Repeatability between the two measurers (A.B.P. and S.M.C.)was assessed on 25 live blue tits (Cyanistes caeruleus)measured in the field (tarsus, wing and tail) and 22Z. flavifrons skins measured at Natural History Museum atTring, UK (culmen length to posterior nostril, culmen widthand depth at anterior of nostril). The repeatability obtainedin the field for tarsus and wing was greater than 0.9, whilethat of the tail was < 0.6; we thus excluded tail measurementsfrom subsequent analyses. The Z. flavifrons specimensderived from six islands, consequently measurer identitywas nested within island in a linear mixed-effects model(Pinheiro & Bates 2000). A correction factor of 0.064 wasadded to the ln-transformed culmen length measurementsmade by A.B.P., giving a between-measurer repeatabilityfor culmen length of 0.74. Repeatabilities for culmen widthand depth were 0.90 and 0.68, respectively.
We used multivariate analysis of variance (manova) ofthe ln-transformed measurements to test whether therewere significant differences between adult birds from thedifferent island populations. Sex was included as a fixedeffect in this model. The orthogonal axes that maximizedmorphological divergence between island populationswere calculated from the output of the manova, followingthe approach of McGuigan et al. (2005). Divergence ofmorphology between islands in multidimensional trait space(D) was calculated from the sum of squares cross-product(SSCP) matrix of islands (H) and error (E), respectively,following equation 6.1 in Rencher (1998). Canonical variates,which maximize interpopulation variance, were extractedfrom the D matrix. Unless otherwise indicated, all analyseswere conducted in the r statistical programming environ-ment (r Development Core Team 2007).
To examine phenotypic divergence between pairs ofislands, we conducted pairwise manova with island and
sex as fixed effects. The SSCP matrices for the island anderror term in each test were used to estimate the variance–covariance matrix for each term. By summing the eigenvaluesfrom the resulting variance–covariance matrices, an estimateof the total variation in morphospace distributed between(vb) and within islands (vw) was obtained (Hadfield &Owens 2006). We then used PST (equation 1, Leinonen et al.2006), which is the phenotypic analogue of QST (Spitze 1993),to quantify morphological divergence between populations.PST differs from QST in that both vb and vw may also includeenvironmental effects, whereas for QST, a quantitative geneticdesign is used so that only the additive genetic variancecomponents of vb and vw are estimated (Leinonen et al. 2006).We estimated PST under the assumption that all pheno-typic differences between populations are solely genetic-based and that the heritability, h2, of morphological traits is0.5. This value was chosen as heritability estimates of adultmorphological traits in an island population of Z. lateralischlorocephalus are in the range 0–0.74 (S.M.Clegg, unpublisheddata). We also examined the sensitivity of PST estimates to(i) different environmental effects, where vb is replaced with0.5vb, and (ii) different heritability values, where h2 = 0.25and 0.75. We tested the significance of a correlation betweenthe pairwise PST and the degree of neutral genetic diver-gence, θ, using a Mantel test with 10 000 permutations.
(eqn 1)
Next, we tested whether pairs of populations were statis-tically diagnosable along univariate morphological axes(Amadon 1949; Patten & Unitt 2002). Two populations areconsidered diagnosable (Dij and Dji values > 0) if ≥ 99% of thedistribution of traits in population i (the population withlarger trait size) are larger than 75% of the distribution oftraits in population j and ≥ 75% of the distribution of traits inpopulation i are larger than 99% of the distribution of traitsin population j (Patten & Unitt 2002). We applied this testfor each population pairwise comparison for wing lengthand relative culmen length (measured as culmen length/tarsus length), as these variables were found to correspondto important axes of morphological divergence. We favouredsimple morphometric measurements over multivariateapproaches in this instance, because diagnosability methodswere developed to provide a straightforward means of dis-tinguishing populations. As the sexes of this speciesshow significant differences in morphology (Phillimore 2006),tests were conducted separately for males and females.
Results
Phylogenetic analyses
We obtained a 351-bp region of ND3 and 308-bp region ofcyt b from 55 Z. flavifrons plus six individuals of potential
Pv
v v hb
b wST =
+⎛
⎝⎜⎜
⎞
⎠⎟⎟2 2

2844 A . B . P H I L L I M O R E E T A L .
© 2008 The AuthorsJournal compilation © 2008 Blackwell Publishing Ltd
outgroup species. For ND3, 270 (77%) and 48 (14%) siteswere invariable and parsimony-informative, respectively.For cyt b, the corresponding figures were 246 (80%) and38 (12%). Using the partition rate homogeneity test, weuncovered no significant conflict in the phylogeneticsignal between the two protein-coding genes (P = 0.968);consequently, we partitioned the concatenated sequencefor phylogenetic analysis allowing parameters to varybetween the two genes. Of the nucleotide substitutionmodels implemented in beast (Drummond & Rambaut2007), HKY + I + G was preferred.
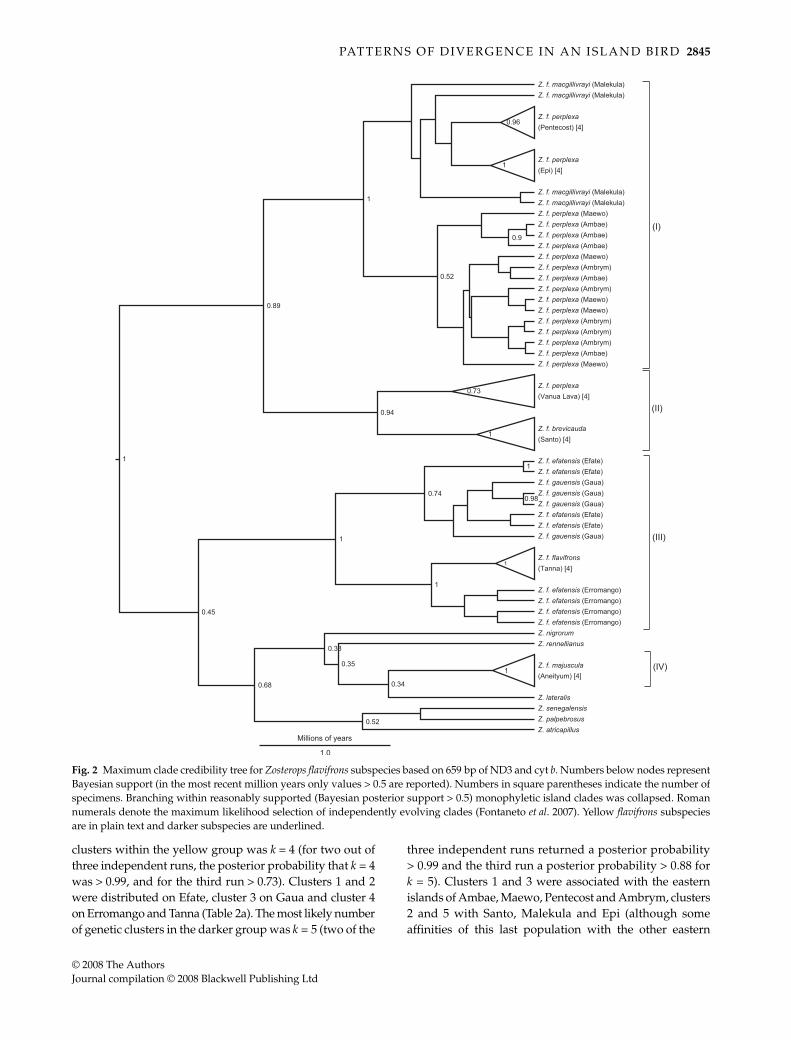
Our reconstructed mitochondrial gene tree casts somedoubt on the monophyly of Z. flavifrons, with a groupincluding Z. f. majuscula (from Aneityum in the far south)and the outgroup taxa having a Bayesian posterior supportof 0.68 (Fig. 2). There was robust evidence of a deep splitbetween two Z. flavifrons clades that correspond to previouslydescribed yellow (gauensis, efatensis and flavifrons) and darker(brevicauda, macgillivrayi and perplexa) forms (Mayr 1945),and there was some evidence that this clade may not bemonophyletic. Of the yellow forms, the Tanna (the nominaterace) and Erromango populations were monophyletic. Theefatensis population on Erromango appears to be sister tothe Tanna population ( flavifrons) rather than the efatensispopulation on Efate, rendering efatensis paraphyletic. Thegene tree revealed a deep split within the darker clade,between the monophyletic Santo and Vanua Lava popula-tions and the remaining darker island populations. Theaffinities of individuals from the remaining darker popula-tions were not well-resolved, with only Epi and Pentecostpossessing monophyletic clades. On this basis, phylogeneticmonophyly of the perplexa subspecies can be rejected.
Individuals from outgroup species were excluded fromour analysis of the number and identity of independentlyevolving lineages. Four distinct Z. flavifrons lineages, somemade up of multiple populations, were identified; thesewere: (i) Ambae, Ambrym, Epi, Maewo, Malekula andPentecost; (ii) Santo and Vanua Lava; (iii) Efate, Erromango,Gaua and Tanna; and (iv) Aneityum (Fig. 2). The four-lineagesolution was not significantly more likely than the nullhypothesis that all lineages belonged to a single cluster(likelihood ratio = 1.08, d.f. = 3, P = 0.78). Furthermore, theconfidence interval for the maximum-likelihood solutionincluded many other different numbers of clusters, suggestingeither the absence of independently evolving units or lowstatistical power.
Population genetic analyses
A total of 438 individuals were genotyped at 10 polymorphicmicrosatellite loci (for sample sizes and heterozygositiessee Table S2, Supplementary material). ZL38 and Ase64showed a highly significant deficit of heterozygotes inmultiple populations (Table S3, Supplementary material);
therefore, these loci were excluded from subsequent analysesdue to a risk of null alleles (Brookfield 1996) and the possibilitythat the locus is under selection. Seventeen of the remaining104 island-locus combinations showed significant departuresfrom Hardy–Weinberg equilibrium. The Vanua Lava popula-tion had an excess of homozygotes at 7/8 loci, which mayindicate inbreeding.
Combined across populations, all but two cases of pairwiselocus tests for linkage disequilibrium were nonsignificant(P > 0.15). In one case, ZL12 × ZL46, P = 0.007; however,this was not significant following Bonferroni correctionfor multiple comparisons (adjusted α = 0.001) and was dueto significant values in only two of the 13 populations,Aneityum (P = 0.01) and Efate (P = 0.031). Therefore, bothloci were retained. Linkage disequilibrium between ZL54and Ase28 was suggested from the combined P value(P < 0.0001). On closer inspection, this result was due to ahighly significant value in a single population, Malekula,and all other P values for this locus pair comparison were> 0.12; therefore, these loci can be considered independentand were also retained in the analysis.
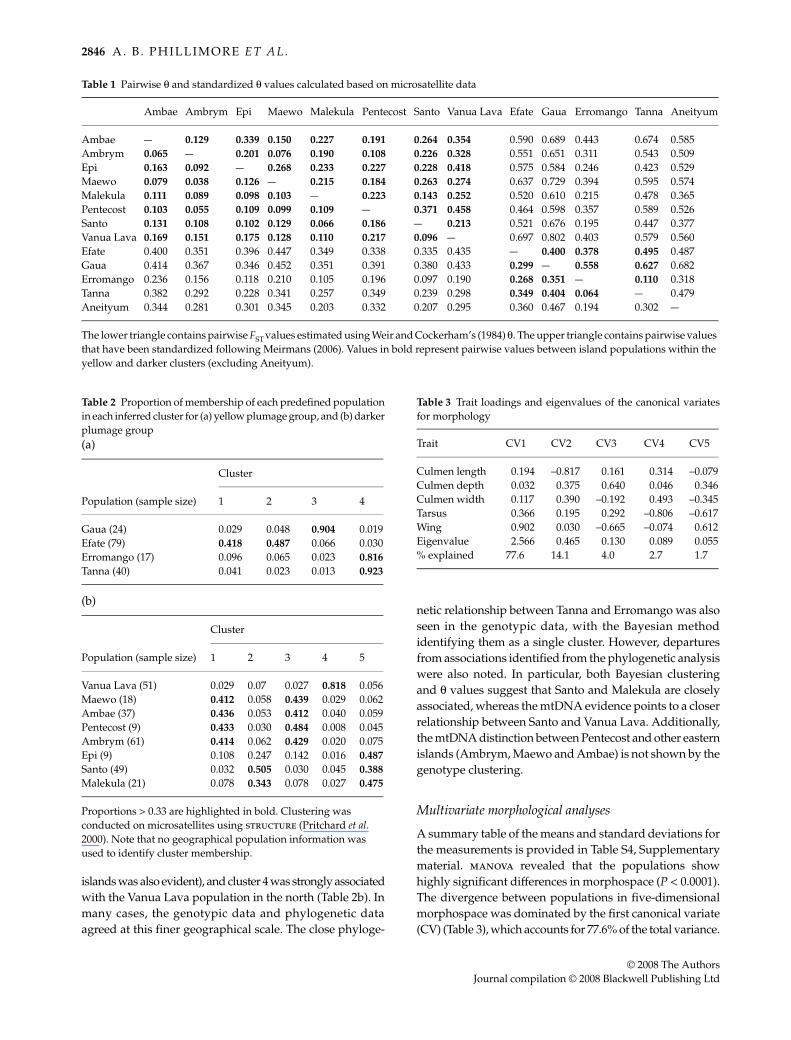
Pairwise θ and standardized θ values reflected thedeeper phylogenetic groupings very well (Table 1). Thepairwise θ values between populations that are in different,highly divergent phylogenetic clades (i.e. the yellow clade,the two darker clades, and the Aneityum population) weregenerally > 0.1 (0.2 using standardized θ) and in some casesmuch higher than this; for example, comparisons involvingGaua were typically between 0.35 and 0.45 (0.56 and 0.80using standardized θ). The absolute values of the large θestimates between highly divergent clades should, of course,be interpreted cautiously due to the risk of back-mutationleading to underestimation (Hedrick 1999) and the likelydeparture of populations from migration/drift balance.
Within each clade (i.e. between populations within theyellow clade and two darker clades), pairwise θ-valueswere generally smaller than those between clades, agreeingwith the mtDNA phylogenetic inferences. Nevertheless,substantial population genetic structuring was evidentfrom both island-based and individual-based approacheswithin these clades. Pairwise θ values within the yellowgroup reached 0.404 (standardized θ = 0.627), betweenTanna and Gaua, and within the darker group it reached0.217 (standardized θ = 0.458), between Vanua Lava andPentecost. Within both the yellow and darker groups, somepopulations with close mtDNA phylogenetic affinities werefound to be highly divergent at microsatellite loci, e.g. Efateand Gaua (standardized θ = 0.40) and Malekula and Ambae(standardized θ = 0.23). While varying degrees of differen-tiation were exhibited between populations, even the smallestθ values were significantly greater than zero.
The structure analysis (Pritchard et al. 2000) supportedthe presence of several genotypic clusters within both theyellow and darker forms. The most likely number of genetic
PAT T E R N S O F D I V E R G E N C E I N A N I S L A N D B I R D 2845
© 2008 The AuthorsJournal compilation © 2008 Blackwell Publishing Ltd
clusters within the yellow group was k = 4 (for two out ofthree independent runs, the posterior probability that k = 4was > 0.99, and for the third run > 0.73). Clusters 1 and 2were distributed on Efate, cluster 3 on Gaua and cluster 4on Erromango and Tanna (Table 2a). The most likely numberof genetic clusters in the darker group was k = 5 (two of the
three independent runs returned a posterior probability> 0.99 and the third run a posterior probability > 0.88 fork = 5). Clusters 1 and 3 were associated with the easternislands of Ambae, Maewo, Pentecost and Ambrym, clusters2 and 5 with Santo, Malekula and Epi (although someaffinities of this last population with the other eastern
Fig. 2 Maximum clade credibility tree for Zosterops flavifrons subspecies based on 659 bp of ND3 and cyt b. Numbers below nodes representBayesian support (in the most recent million years only values > 0.5 are reported). Numbers in square parentheses indicate the number ofspecimens. Branching within reasonably supported (Bayesian posterior support > 0.5) monophyletic island clades was collapsed. Romannumerals denote the maximum likelihood selection of independently evolving clades (Fontaneto et al. 2007). Yellow flavifrons subspeciesare in plain text and darker subspecies are underlined.
2846 A . B . P H I L L I M O R E E T A L .
© 2008 The AuthorsJournal compilation © 2008 Blackwell Publishing Ltd
islands was also evident), and cluster 4 was strongly associatedwith the Vanua Lava population in the north (Table 2b). Inmany cases, the genotypic data and phylogenetic dataagreed at this finer geographical scale. The close phyloge-
netic relationship between Tanna and Erromango was alsoseen in the genotypic data, with the Bayesian methodidentifying them as a single cluster. However, departuresfrom associations identified from the phylogenetic analysiswere also noted. In particular, both Bayesian clusteringand θ values suggest that Santo and Malekula are closelyassociated, whereas the mtDNA evidence points to a closerrelationship between Santo and Vanua Lava. Additionally,the mtDNA distinction between Pentecost and other easternislands (Ambrym, Maewo and Ambae) is not shown by thegenotype clustering.
Multivariate morphological analyses
A summary table of the means and standard deviations forthe measurements is provided in Table S4, Supplementarymaterial. manova revealed that the populations showhighly significant differences in morphospace (P < 0.0001).The divergence between populations in five-dimensionalmorphospace was dominated by the first canonical variate(CV) (Table 3), which accounts for 77.6% of the total variance.
Table 1 Pairwise θ and standardized θ values calculated based on microsatellite data
Ambae Ambrym Epi Maewo Malekula Pentecost Santo Vanua Lava Efate Gaua Erromango Tanna Aneityum
Ambae — 0.129 0.339 0.150 0.227 0.191 0.264 0.354 0.590 0.689 0.443 0.674 0.585Ambrym 0.065 — 0.201 0.076 0.190 0.108 0.226 0.328 0.551 0.651 0.311 0.543 0.509Epi 0.163 0.092 — 0.268 0.233 0.227 0.228 0.418 0.575 0.584 0.246 0.423 0.529Maewo 0.079 0.038 0.126 — 0.215 0.184 0.263 0.274 0.637 0.729 0.394 0.595 0.574Malekula 0.111 0.089 0.098 0.103 — 0.223 0.143 0.252 0.520 0.610 0.215 0.478 0.365Pentecost 0.103 0.055 0.109 0.099 0.109 — 0.371 0.458 0.464 0.598 0.357 0.589 0.526Santo 0.131 0.108 0.102 0.129 0.066 0.186 — 0.213 0.521 0.676 0.195 0.447 0.377Vanua Lava 0.169 0.151 0.175 0.128 0.110 0.217 0.096 — 0.697 0.802 0.403 0.579 0.560Efate 0.400 0.351 0.396 0.447 0.349 0.338 0.335 0.435 — 0.400 0.378 0.495 0.487Gaua 0.414 0.367 0.346 0.452 0.351 0.391 0.380 0.433 0.299 — 0.558 0.627 0.682Erromango 0.236 0.156 0.118 0.210 0.105 0.196 0.097 0.190 0.268 0.351 — 0.110 0.318Tanna 0.382 0.292 0.228 0.341 0.257 0.349 0.239 0.298 0.349 0.404 0.064 — 0.479Aneityum 0.344 0.281 0.301 0.345 0.203 0.332 0.207 0.295 0.360 0.467 0.194 0.302 —
The lower triangle contains pairwise FST values estimated using Weir and Cockerham’s (1984) θ. Τhe upper triangle contains pairwise values that have been standardized following Meirmans (2006). Values in bold represent pairwise values between island populations within the yellow and darker clusters (excluding Aneityum).
Table 2 Proportion of membership of each predefined populationin each inferred cluster for (a) yellow plumage group, and (b) darkerplumage group(a)
(b)
Population (sample size)
Cluster
1 2 3 4
Gaua (24) 0.029 0.048 0.904 0.019Efate (79) 0.418 0.487 0.066 0.030Erromango (17) 0.096 0.065 0.023 0.816Tanna (40) 0.041 0.023 0.013 0.923
Population (sample size)
Cluster
1 2 3 4 5
Vanua Lava (51) 0.029 0.07 0.027 0.818 0.056Maewo (18) 0.412 0.058 0.439 0.029 0.062Ambae (37) 0.436 0.053 0.412 0.040 0.059Pentecost (9) 0.433 0.030 0.484 0.008 0.045Ambrym (61) 0.414 0.062 0.429 0.020 0.075Epi (9) 0.108 0.247 0.142 0.016 0.487Santo (49) 0.032 0.505 0.030 0.045 0.388Malekula (21) 0.078 0.343 0.078 0.027 0.475
Proportions > 0.33 are highlighted in bold. Clustering was conducted on microsatellites using structure (Pritchard et al. 2000). Note that no geographical population information was used to identify cluster membership.
Table 3 Trait loadings and eigenvalues of the canonical variatesfor morphology
Trait CV1 CV2 CV3 CV4 CV5
Culmen length 0.194 –0.817 0.161 0.314 –0.079Culmen depth 0.032 0.375 0.640 0.046 0.346Culmen width 0.117 0.390 –0.192 0.493 –0.345Tarsus 0.366 0.195 0.292 –0.806 –0.617Wing 0.902 0.030 –0.665 –0.074 0.612Eigenvalue 2.566 0.465 0.130 0.089 0.055% explained 77.6 14.1 4.0 2.7 1.7
PAT T E R N S O F D I V E R G E N C E I N A N I S L A N D B I R D 2847
© 2008 The AuthorsJournal compilation © 2008 Blackwell Publishing Ltd
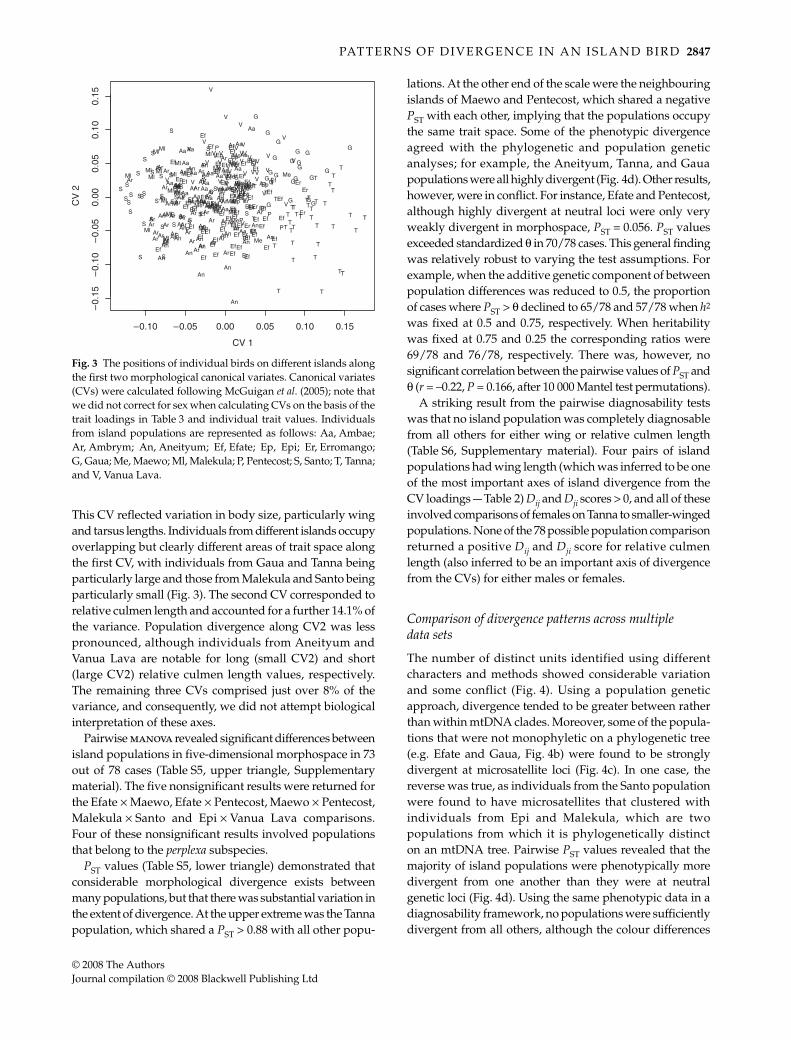
This CV reflected variation in body size, particularly wingand tarsus lengths. Individuals from different islands occupyoverlapping but clearly different areas of trait space alongthe first CV, with individuals from Gaua and Tanna beingparticularly large and those from Malekula and Santo beingparticularly small (Fig. 3). The second CV corresponded torelative culmen length and accounted for a further 14.1% ofthe variance. Population divergence along CV2 was lesspronounced, although individuals from Aneityum andVanua Lava are notable for long (small CV2) and short(large CV2) relative culmen length values, respectively.The remaining three CVs comprised just over 8% of thevariance, and consequently, we did not attempt biologicalinterpretation of these axes.
Pairwise manova revealed significant differences betweenisland populations in five-dimensional morphospace in 73out of 78 cases (Table S5, upper triangle, Supplementarymaterial). The five nonsignificant results were returned forthe Efate × Maewo, Efate × Pentecost, Maewo × Pentecost,Malekula × Santo and Epi × Vanua Lava comparisons.Four of these nonsignificant results involved populationsthat belong to the perplexa subspecies.
PST values (Table S5, lower triangle) demonstrated thatconsiderable morphological divergence exists betweenmany populations, but that there was substantial variation inthe extent of divergence. At the upper extreme was the Tannapopulation, which shared a PST > 0.88 with all other popu-
lations. At the other end of the scale were the neighbouringislands of Maewo and Pentecost, which shared a negativePST with each other, implying that the populations occupythe same trait space. Some of the phenotypic divergenceagreed with the phylogenetic and population geneticanalyses; for example, the Aneityum, Tanna, and Gauapopulations were all highly divergent (Fig. 4d). Other results,however, were in conflict. For instance, Efate and Pentecost,although highly divergent at neutral loci were only veryweakly divergent in morphospace, PST = 0.056. PST valuesexceeded standardized θ in 70/78 cases. This general findingwas relatively robust to varying the test assumptions. Forexample, when the additive genetic component of betweenpopulation differences was reduced to 0.5, the proportionof cases where PST > θ declined to 65/78 and 57/78 when h2
was fixed at 0.5 and 0.75, respectively. When heritabilitywas fixed at 0.75 and 0.25 the corresponding ratios were69/78 and 76/78, respectively. There was, however, nosignificant correlation between the pairwise values of PST andθ (r = –0.22, P = 0.166, after 10 000 Mantel test permutations).
A striking result from the pairwise diagnosability testswas that no island population was completely diagnosablefrom all others for either wing or relative culmen length(Table S6, Supplementary material). Four pairs of islandpopulations had wing length (which was inferred to be oneof the most important axes of island divergence from theCV loadings — Table 2) Dij and Dji scores > 0, and all of theseinvolved comparisons of females on Tanna to smaller-wingedpopulations. None of the 78 possible population comparisonreturned a positive Dij and Dji score for relative culmenlength (also inferred to be an important axis of divergencefrom the CVs) for either males or females.
Comparison of divergence patterns across multiple data sets
The number of distinct units identified using differentcharacters and methods showed considerable variationand some conflict (Fig. 4). Using a population geneticapproach, divergence tended to be greater between ratherthan within mtDNA clades. Moreover, some of the popula-tions that were not monophyletic on a phylogenetic tree(e.g. Efate and Gaua, Fig. 4b) were found to be stronglydivergent at microsatellite loci (Fig. 4c). In one case, thereverse was true, as individuals from the Santo populationwere found to have microsatellites that clustered withindividuals from Epi and Malekula, which are twopopulations from which it is phylogenetically distincton an mtDNA tree. Pairwise PST values revealed that themajority of island populations were phenotypically moredivergent from one another than they were at neutralgenetic loci (Fig. 4d). Using the same phenotypic data in adiagnosability framework, no populations were sufficientlydivergent from all others, although the colour differences
Fig. 3 The positions of individual birds on different islands alongthe first two morphological canonical variates. Canonical variates(CVs) were calculated following McGuigan et al. (2005); note thatwe did not correct for sex when calculating CVs on the basis of thetrait loadings in Table 3 and individual trait values. Individualsfrom island populations are represented as follows: Aa, Ambae;Ar, Ambrym; An, Aneityum; Ef, Efate; Ep, Epi; Er, Erromango;G, Gaua; Me, Maewo; Ml, Malekula; P, Pentecost; S, Santo; T, Tanna;and V, Vanua Lava.

2848 A . B . P H I L L I M O R E E T A L .
© 2008 The AuthorsJournal compilation © 2008 Blackwell Publishing Ltd
between the yellow and darker phylogroups (Mayr 1945)mean that two units are probably diagnosable using thisapproach (Fig. 4e). Thus, an approximate spectrum acrosscharacters and methods from highest to lowest extentof divergence is: morphology (PST) > population-basedmicrosatellite analysis > individual based microsatelliteanalysis > mtDNA phylogeny > morphology (diagnosability).
Some of the units identified using phylogenetic, popula-tion genetic and phenotypic methods agreed well withsubspecies designation, such as Aneityum (majuscula), and tosome degree Gaua (gauensis) and Tanna (flavifrons) (Fig. 4a).Others had mixed support depending on the data set con-sidered, e.g. Santo (brevicauda) was phylogenetically (mtDNA)distinct, but had similar microsatellite genotypes to macgil-livrayi on nearby Malekula and these two populations wereextremely similar morphologically. The most geographicallywidespread subspecies (perplexa) was found to have a complexpattern of divergence, comprising at least three phylogeneticclusters and two to three population genetic clusters.
Discussion
We identified considerable divergence among insularpopulations of a single recognized species of island-dwellingbird. The Vanuatu white-eye is paraphyletic on a mitoch-ondrial gene tree and we argue that it is likely to representthe product of at least two independent invasions of thearchipelago. The multiple monophyletic island groupswithin the Vanuatu white-eye lead us to infer that theseclades are likely to have experienced long periods ofisolation with very little, if any, gene flow between most
islands. Insular populations of the Vanuatu white-eye,including those that were polyphyletic on the mitochondrialgene tree, were all significantly divergent at nuclearmicrosatellite loci, although a close association betweensome sets of neighbouring populations was revealed by thegenotype clustering method. Moreover, the majority ofpopulation comparisons showed levels of phenotypicdivergence that were statistically significant and exceededlevels of neutral divergence. Given that this species containsconsiderable evolutionary and phenotypic diversity, it wassurprising then that none of the island populations wasdiagnosable from all others using the 75% diagnosabilityrule (Patten & Unitt 2002).
Our results show that these island populations containeda large amount of independent evolutionary history, inagreement with several other studies on insular birds(Slikas et al. 2000, e.g. Phillimore & Owens 2006; Warrenet al. 2006; Smith & Filardi 2007; Smith et al. 2007). As theAneityum (majuscula) population of Vanuatu white-eyewas more closely related to Zosterops lateralis than anyother Zosterops flavifrons population on an mtDNA genetree and was strongly divergent from all other populationsat nuclear loci, we suggest that this may be a crypticspecies, Zosterops majuscula (Murphy & Mathews 1929). Astudy on the white-eyes of Micronesia also identified verydeep phylogenetic splits among insular populations(Slikas et al. 2000), perhaps reflecting the difficulties ofdelimiting species in this relatively phenotypically uniformgenus (Lack 1971). Zosterops minutus of Lifou, New Caledonia,should be included in future phylogenetic analyses assessingthe sister relationship of Z. f. majuscula on Aneityum, due
Fig. 4 Schematic maps of the clusters of related individuals identified using different data and/or methods. Membership of a cluster isindicated by colour. (a) Subspecies correspond to those recognized by Mayr (1945). (b) Phylogenetic clusters were identified using the methodof Fontaneto et al. (2007). (c) Membership of population genetic clusters was assessed using Bayesian clustering methods; see Table 2. (d)Membership of PST clusters used an arbitrary cut-off of 0.25 for membership. This arbitrary cut-off value if for illustrative purposes andcould be made more inclusive or exclusive by lowering or raising the value. (e) Diagnosability clusters are those in which every memberof one cluster is diagnosable from every member of the other. Here, two diagnosable clusters on the basis of differences in plumage colourand pattern are presented. Alternatively, if morphometric information alone were used, all populations would belong to a single cluster.

PAT T E R N S O F D I V E R G E N C E I N A N I S L A N D B I R D 2849
© 2008 The AuthorsJournal compilation © 2008 Blackwell Publishing Ltd
to its proximate geography and similar colouration. Thedeep phylogenetic divergence among the remainingVanuatu white-eye populations is concordant with a long-recognized divergence in colouration (Mayr 1945; Mees1969). Within the yellow clade, the affinity of the Gauapopulation (gauensis) with the Efate population of efatensis,in particular, was raised earlier by Mees (1969) in histaxonomic study of Zosteropidae. A striking aspect of thisaffinity, corroborated by mitochondrial and to a lesserextent nuclear DNA microsatellites (of all pairwise com-parisons involving Gaua, the standardized θ with Efate isthe lowest), is that the Gaua population is more closelyrelated to a population that lies several hundred kilometresto the south than it is to populations on any of the interveningislands or on Vanua Lava (located approximately 30 km tothe north of Gaua). It seems quite likely that members ofthe yellow and darker clades will have dispersed ontoislands inhabited by members of the alternate phylogroupat some point in time. Therefore, given the lack of evidencefor recent introgression, we infer that that some form ofpre- or postzygotic isolation may exist between populationsbelonging to these two clades.
Across all Vanuatu white-eye populations, the majoraxis of morphological divergence was body size. Indeed,body size has been identified as a major axis of variationand divergence among other white-eye species and sub-species (Mees 1957, 1961, 1969; Lack 1971; Clegg et al. 2002a;Frentiu et al. 2007). Phenotypic divergence between popu-lations generally exceeded the neutral genetic divergence,an outcome that is often taken as evidence for directionalselection (Spitze 1993; Merilä & Crnokrak 2001). However,great care must be taken in drawing such conclusions fromthese data, as we did not conduct a formal test or use aquantitative genetic design. Moreover, concerns have beenraised about both the validity of the assumptions required(e.g. Hendry 2002; Saether et al. 2007) and the statisticalapproaches used (O’Hara & Merilä 2005) in QST vs. FST tests.Unfortunately, despite identifying significant phenotypicdivergence between most pairs of populations, we can saylittle about the degree of ecological exchangeability, as we donot know whether the phenotypic divergence that we observehas an adaptive basis (Crandall et al. 2000; Rader et al. 2005).
While morphological differentiation between the majorityof island populations was pronounced, very few populationswere found to be diagnosable using a standard univariateapproach (Amadon 1949; Patten & Unitt 2002). In fact, nopairwise population comparison with a PST < 0.9 (indicatingthat < 90% of the total morphological variation lies betweenpopulations) was found to be diagnosable using this method.Considering the failure of this method to diagnose evenstrongly phenotypically divergent populations, the arbitrary75% criterion appears to be very stringent and shows littlerelation to the evolutionary processes at play. It is straight-forward to show using simulations that for two populations
to be diagnosable at the 75% level, the PST for the trait inquestion (assuming a heritability of 0.5, that between-population differences have a solely genetic basis and asample size for each population of 100) should exceedapproximately 0.91. Whereas, if PST = 0.5, this translates toa diagnosability criterion in the region of just 9%. Therefore,PST (or ideally QST, if a quantitative genetics design to controlfor environmental variance is possible) may be preferableto the 75% criterion for identifying subspecies on the basisof continuous traits. Moreover, the behaviour of the QSTstatistic has been demonstrated under a variety of evolu-tionary scenarios (e.g. Spitze 1993; Goudet & Buchi 2006),which means that its use would serve to bridge a gapbetween evolutionary biology and intraspecific systematics.A drawback of using PST or QST to identify conservationunits is that, like the diagnosability approach, these methodswould require an arbitrary threshold.
We found that subspecies limits showed some corre-spondence with the units identified using both phenotypicand molecular data (Fig. 4). Of the seven subspecies con-sidered here, three (brevicauda, flavifrons and majuscula)were monophyletic. The genetic and phenotypic distinctnessof the latter population was supported by microsatelliteand morphological data. However, both brevicauda fromSanto and flavifrons from Tanna were part of larger geneticclusters when nuclear microsatellites were used. Whileflavifrons was highly divergent in terms of morphometrics,brevicauda was found to be morphologically very similar tomacgillivrayi on Malekula. Of the others: (i) efatensis onEfate and Erromango was paraphyletic and should perhapsbe split into two subspecies; (ii) gauensis on Gaua was notmonophyletic, although it was highly divergent from otherpopulations at microsatellite loci and in terms of morpho-metrics; (iii) macgillivrayi on Malekula was paraphyleticwith respect to several perplexa populations and, based onmicrosatellites, grouped in a genotypic cluster with popu-lations on neighbouring islands (Santo and Epi); and (iv)perplexa was paraphyletic and comprised up to threegenotypic clusters. A phylogenetic study of three species thatwere each monotypic in Vanuatu identified no reciprocallymonophyletic units (Kirchman & Franklin 2007). In com-parison, a phylogeographical analysis of Zosterops lateralisin Vanuatu, which has two to three subspecies described inthe archipelago (Mayr 1945; Mees 1969), identified twoputative evolutionary units, one monophyletic single-islandclade and one widespread paraphyletic group of popula-tions (Phillimore 2006). Moreover, a phylogeographical studyconducted on 23 species in the Solomon Islands found thatspecies that are represented by multiple subspecies tendedtowards greater intraspecific phylogenetic divergence(Smith & Filardi 2007). Overall, there appears to be somecorrespondence between insular subspecies richness andintraspecific phylogenetic diversity. Thus, in the absence ofdetailed phylogenetic and population genetic information,

2850 A . B . P H I L L I M O R E E T A L .
© 2008 The AuthorsJournal compilation © 2008 Blackwell Publishing Ltd
subspecies richness may be a useful proxy for the numberof conservation units in insular systems.
Conservation in island environments
An objective means of quantifying biodiversity within andbetween forms would help in making informed conserva-tion decisions (Moritz 2002), but different traits and/orapproaches can lead to very disparate outcomes (Wilson &Brown 1953). In this study, we found that divergence betweenpopulations at mitochondria, nuclear loci and morphologywere broadly concordant, although there were a number ofdiscrepancies. Some of the conflicts between the approachessuggested that there may be differences in the mode ofevolution of the different characters; for instance, Ambaeand Ambrym populations were paraphyletic at mitoch-ondrial loci and weakly divergent at microsatellite loci, butdivergent in terms of morphometrics, which is consistentwith morphology evolving in a non-neutral manner.Other differences in the number and identity of divergentpopulations reflect variation in stringency between differentmethods. Depending on the approach employed, the 13populations we examined may constitute anything betweentwo and 13 conservation units. From an evolutionaryperspective, these different degrees of population divergencereflect the continuum from populations to species (Mayr1942; Crandall et al. 2000).
In order to conserve biodiversity, it is desirable to main-tain the processes that are essential for future diversification(Crandall et al. 2000; Moritz 2002). Islands are importantpromoters of intraspecific diversification (Lack 1947; Mayr& Diamond 2001; Phillimore et al. 2007) and, as such, theirimportance for conservation is strongly advocated (Whit-taker & Fernandez-Palacios 2007). Interestingly, few casesof island species colonizing continents have been observed(but see Nicholson et al. 2004; Filardi & Moyle 2005), whichwould appear to place a limit on the potential for insulartaxa to generate continental diversity. Given that each of thefive most species-rich avian families is primarily continental(Sibley & Monroe 1990), it could be argued that islands arenot among the most important engines of global diversity.It seems that elevated intraspecific diversification rates onislands do not beget elevated interspecific diversificationrates (Phillimore et al. 2006, 2007). A potential explanationfor this paradox is that extinction rates may also be ele-vated in insular settings (see Ricklefs & Bermingham 1999;Steadman 2006). Taken together, the available evidencesuggests that islands are important promoters of divergentbut potentially short-lived populations.
Acknowledgements
We are grateful to E. Bani, D. Kalfatak and T. Tari from VanuatuEnvironmental Unit and chiefs and landowners on various islands
for providing permissions to catch birds; members of WantocEnvironment Centre, Luganville, particularly R. Hills andS. Totterman, for invaluable logistic advice and support; O. Boissier,S. Geiger and J. Phillimore for assistance in the field; D. Dawsonand A. Krupa for laboratory advice and support; C. Filardi andJ. Kirchman for providing blood samples; T. Barraclough andJ. Hadfield for assistance with statistical analyses; and M. Adamsfor access to bird skins at the Natural History Museum, Tring. Wethank three anonymous referees, R. Grenyer, G. Hurst, S. Meiri, I.Newton, R. Prys-Jones, N. Seddon and J. Tobias for stimulatingdiscussion and/or comments that greatly improved this manuscript.This project was funded by a Natural Environment Research Council(NERC) funded studentship to A.B.P. and NERC postdoctoralfellowship to S.M.C., and the NERC-funded Sheffield MolecularGenetics Facility.
References
Agapow P-M, Bininda-Emonds ORP, Crandall KA et al. (2004) Theimpact of species concept on biodiversity studies. QuarterlyReview of Biology, 79, 161–178.
Amadon D (1949) The seventy-five percent rule for subspecies.Condor, 51, 250–258.
Ball RM, Avise JC (1992) Mitochondrial DNA phylogeographicdifferentiation among avian populations and the evolutionarysignificance of subspecies. Auk, 109, 626–636.
Barrowclough GF (1980) Genetic and phenotypic differentiation ina wood warbler (genus Dendroica) hybrid zone. Auk, 97, 655–668.
Brookfield JFY (1996) A simple new method for estimating nullallele frequency from heterozygote deficiency. Molecular Ecology,5, 453–455.
Chesser RT (1999) Molecular systematics of the rhinocrypid genusPteroptochos. Condor, 101, 439–446.
Cicero C, Johnson NK (2006) Diagnosability of subspecies: lessonsfrom sage sparrows (Amphispiza belli) for analysis of geographicvariation in birds. Auk, 123, 266–274.
Clegg SM, Degnan SM, Kikkawa J et al. (2002a) Genetic consequencesof sequential founder events by an island-colonizing bird.Proceedings of the National Academy of Sciences, USA, 99, 8127–8132.
Clegg SM, Degnan SM, Moritz C et al. (2002b) Microevolutionin island forms: the roles of drift and directional selection inmorphological divergence of a passerine bird. Evolution, 56,2090–2099.
Collar NJ, Crosby MJ, Stattersfield AJ (1994) Birds to Watch 2: TheWorld List of Threatened Birds. Birdlife International, Cambridge,UK.
Coyne JA, Orr HA (2004) Speciation. Sinauer Associates, Sunderland,Massachusetts.
Cracraft J (1983) Species concepts and speciation analysis. CurrentOrnithology, 1, 159–187.
Crandall KA, Bininda-Emonds ORP, Mace GM, Wayne RK (2000)Considering evolutionary processes in conservation biology.Trends in Ecology and Evolution, 15, 290–295.
Darwin C (1859) The Origin of the Species by Means of Natural Selection.Murray, London.
Degnan SM, Robertson BC, Clegg SM, Moritz C (1999) Microsatelliteprimers for the study of gene flow and mating systems in white-eyes (Zosterops). Molecular Ecology, 8, 157–158.
Diamond JM (1975) Assembly of species communities. In: Ecology

PAT T E R N S O F D I V E R G E N C E I N A N I S L A N D B I R D 2851
© 2008 The AuthorsJournal compilation © 2008 Blackwell Publishing Ltd
and Evolution of Communities (ed. Diamond JM), pp. 342–444.Harvard University Press, Cambridge, Massachusetts.
Drummond AJ, Rambaut A (2007) beast: Bayesian evolutionaryanalysis by sampling trees. BMC Evolutionary Biology, 7, 214.
Drummond AJ, Ho SYW, Phillips MJ, Rambaut A (2006) Relaxedphylogenetics and dating with confidence. Public Library ofScience, Biology, 4, e88.
Filardi CE, Moyle RG (2005) Single origin of a pan-Pacific birdgroup and upstream colonization of Australasia. Science, 438,216–219.
Fisher RA (1932) Statistical Methods for Research Workers. Oliver andBoyd, London.
Fontaneto D, Herniou EA, Boschetti C et al. (2007) Independentlyevolving species in asexual bdelloid rotifers. Public Library ofSciece, Biology, 5, e87.
Frentiu FD, Lange CL, Burke T, Owens IPF (2003) Isolation ofmicrosatellite loci in the Capricorn silvereye, Zosterops lateralischlorocephalus (Aves: Zosteropidae). Molecular Ecology Notes, 3,462–464.
Frentiu FD, Clegg SM, Blows MW, Owens IPF (2007) Large bodysize in an island-dwelling bird: a microevolutionary analysis.Journal of Evolutionary Biology, 20, 639–649.
Frentiu FD, Clegg SM, Chittock J et al. (2008) Pedigree-free animalmodels: the relatedness matrix reloaded. Proceedings of the RoyalSociety B: Biological Sciences, 275, 639–647.
Funk DJ, Omland KE (2003) Species-level paraphyly and polyphyly:frequency, causes, and consequences, with insights from animalDNA. Annual Review of Ecology, Evolution and Systematics, 34,397–423.
Gaggioti OE, Lange O, Rassmann K, Gliddon C (1999) A comparisonof two indirect methods for estimating average levels of gene flowusing microsatellite data. Molecular Ecology, 8, 1513–1520.
Gaston KJ, Blackburn TM (1995) Birds, body size and the threat ofextinction. Philosophical Transactions of the Royal Society B: BiologicalSciences, 347, 205–212.
Goudet J, Buchi L (2006) The effects of dominance, regular inbreedingand sampling design on QST, an estimator of population differ-entiation for quantitative traits. Genetics, 172, 1337–1347.
Grant PR (1986) Ecology and Evolution of Darwin’s Finches. PrincetonUniversity Press, Princeton, New Jersey.
Griffiths R, Double MC, Orr K, Dawson RJG (1998) A DNA test tosex most birds. Molecular Ecology, 7, 1071–1075.
Guo SW, Thompson EA (1992) Performing the exact test of Hardy–Weinberg proportions for multiple alleles. Biometrics, 48,361–372.
Hadfield JD, Owens IPF (2006) Strong environmental determinationof a carotenoid-based plumage trait is not mediated by carotenoidavailability. Journal of Evolutionary Biology, 19, 1104–1114.
Haig SM, Beever EA, Chambers SM et al. (2006) Taxonomic con-siderations in listing subspecies under the U.S. EndangeredSpecies Act. Conservation Biology, 20, 1584–1594.
Harmon LJ, Gibson R (2006) Multivariate phenotypic evolutionamong island and mainland populations of the ornate daygecko, Phelsuma ornata. Evolution, 60, 2622–2632.
Hedrick PW (1999) Highly variable loci and their interpretation inevolution and conservation. Evolution, 53, 313–318.
Hedrick PW (2005) A standardized genetic differentiation measure.Evolution, 59, 1633–1638.
Helbig AJ, Knox AG, Parkin DT, Sangster G, Collinson M (2002)Guidelines for assigning species rank. Evolution, 144, 518–525.
Hendry AP (2002) QST > = < FST? Trends in Ecology & Evolution, 17,502.
Hey J (2001) Genes, Categories, and Species: The Evolutionary andCognitive Causes of the Species Problem. Oxford University Press,Oxford, UK.
Holm S (1979) A simple sequentially rejective multiple testprocedure. Scandinavian Journal of Statistics, 6, 65–70.
Hudson RR, Coyne JA (2002) Mathematical consequences of thegenealogical species concept. Evolution, 56, 1557–1565.
Kirchman JJ, Franklin JD (2007) Comparative phylogeographyand genetic structure of Vanuatu birds: control region variationin a rail, a dove, and a passerine. Molecular Phylogenetics andEvolution, 43, 14–23.
Lack D (1947) Darwin’s Finches. Cambridge University Press,Cambridge, UK.
Lack D (1971) Ecological Isolation in Birds. Blackwell ScientificPublications, Oxford, UK.
Leinonen T, Cano JM, Makinen H, Merila J (2006) Contrastingpatterns of body shape and neutral genetic divergence inmarine and lake populations of threespine sticklebacks. Journalof Evolutionary Biology, 19, 1803–1812.
Leinonen T, O’Hara RB, Cano JM, Merila J (2008) Comparativestudies of quantitative trait and neutral marker divergence: ameta-analysis. Journal of Evolutionary Biology, 21, 1–17.
MacArthur RH, Wilson EO (1967) The Theory of Island Biogeography.Princeton University Press, Princeton, New Jersey.
Mayr E (1942) Systematics and the Origin of Species. ColumbiaUniversity Press, New York.
Mayr E (1945) Birds of the Southwest Pacific. The MacmillanCompany, New York.
Mayr E (1982) of what use are subspecies? Auk, 99, 593–595.Mayr E, Diamond J (2001) The Birds of Northern Melanesia: Speciation,
Ecology and Biogeography. Oxford University Press, New York.McGuigan K, Chenoweth SF, Blows MW (2005) Phenotypic
divergence along lines of genetic variance. American Naturalist,165, 32–43.
McKay JK, Latta RG (2002) Adaptive population divergence:markers, QTL and traits. Trends in Ecology & Evolution, 17, 285–291.
Mees GF (1957) A systematic review of the Indo-AustralianZosteropidae. Part I. Zoologische Verhandelingen, 35, 1–204.
Mees GF (1961) A systematic review of the Indo-AustralianZosteropidae. Part II. Zoologische Verhandelingen, 50, 1–168.
Mees GF (1969) A systematic review of the Indo-AustralianZosteropidae. Part III. Zoologische Verhandelingen, 102, 1–390.
Meirmans P (2006) Using the amova framework to estimate astandardized genetic differentiation measure. Evolution, 60,2399–2402.
Merilä J (1997) Quantitative trait and allozyme divergence in thegreenfinch (Carduelis chloris, Aves: Fringillidae). BiologicalJournal of the Linnean Society, 61, 243–266.
Merilä J, Crnokrak P (2001) Comparison of genetic differentiationat marker loci and quantitative traits. Journal of EvolutionaryBiology, 14, 892–903.
Moran MD (2003) Arguments for rejecting the sequential Bonferroniin ecological studies. Oikos, 100, 403–405.
Moritz C (1994) Defining ‘evolutionary significant units’ forconservation. Trends in Ecology & Evolution, 9, 373–375.
Moritz C (2002) Strategies to protect biological diversity and theevolutionary processes that sustain it. Systematic Biology, 51,238–254.
Murphy RM, Mathews GM (1929) Birds Collected During the WhitneySouth Sea Expedition. American Museum of Natural History,New York.

2852 A . B . P H I L L I M O R E E T A L .
© 2008 The AuthorsJournal compilation © 2008 Blackwell Publishing Ltd
Nakagawa S (2004) A farewell to Bonferroni: the problems of lowstatistical power and publication bias. Behavioral Ecology, 15,1044–1045.
Newton I (2003) Speciation and Biogeography of Birds. AcademicPress, London.
Nicholls JA, Double MC, Rowell DM, Magrath D (2000) Theevolution of cooperative and pair breeding in thornbills Acanthiza(Pardalotidae). Journal of Avian Biology, 31, 165–176.
Nicholls JA, Austin JJ, Moritz C, Goldizen AW (2006) Geneticpopulation structure and call variation in a passerine bird, thesatin bowerbird, Ptilonorhynchus violaceous. Evolution, 60, 1279–1290.
Nicholson KE, Glor RE, Kolbe KA, Hedges SB, Losos JB (2004)Mainland colonization by island lizards. Journal of Biogeography,32, 929–938.
O’Brien SJ, Mayr E (1991) Bureaucratic mischief: recognizingendangered species and subspecies. Science, 251, 1187–1188.
O’Hara B, Merilä J (2005) Bias and precision in QST estimates:problems and some solutions. Genetics, 171, 1331–1339.
Palumbi SR (1996) Nucleic acid II: the polymerase chain reaction.In: Molecular Systematics (eds Hillis DM Moritz C Mable BK),pp. 205–247. Sinauer Associates, Sunderland, Massachusetts.
Patten MA, Unitt P (2002) Diagnosability versus mean differencesof sage sparrow subspecies. Auk, 119, 26–35.
Peterson AT, Navarro-Sigüenza AG (1999) Alternate speciesconcepts as bases for determining priority conservation areas.Conservation Biology, 13, 427–431.
Petren K (1998) Microsatellite primers from Geospiza fortis andcross-species amplification in Darwin’s finches. MolecularEcology, 7, 1782–1784.
Phillimore AB (2006) The ecological basis of speciation and divergencein birds. PhD Thesis, Imperial College London.
Phillimore AB, Owens IPF (2006) Are subspecies useful inevolutionary and conservation biology? Proceedings of the RoyalSociety B: Biological Sciences, 273, 1049–1053.
Phillimore AB, Freckleton RP, Orme CDL, Owens IPF (2006) Ecologypredicts large-scale patterns of phylogenetic diversification inbirds. American Naturalist, 168, 220–229.
Phillimore AB, Orme CDL, Davies RG et al. (2007) Biogeographicalbasis of recent phenotypic divergence among birds: a global studyof subspecies richness. Evolution, 61, 942–957.
Pinheiro JC, Bates DM (2000) Mixed Effects Models in S and S-Plus.Springer, New York.
Pons J, Barraclough TG, Gomez-Zurita J et al. (2006) Sequence-based species delimitation for the DNA taxonomy of undescribedinsects. Systematic Biology, 55, 595–609.
Posada D, Crandall KA (1998) modeltest: testing the model ofDNA substitution. Bioinformatics, 14, 817–818.
Pritchard JK, Stephens M, Donnelly PJ (2000) Inference of popu-lation structure using multilocus genotype data. Genetics, 155,945–959.
de Queiroz K (2005) Ernst Mayr and the modern concept of species.Proceedings of the National Academy of Sciences, USA, 102, 6600–6607.
R Development Core Team (2007) R: A Language and Environmentfor Statistical Computing. r Foundation for Statistical Computing,Vienna, Austria.
Rader RB, Belk MC, Shiozawa DK, Crandall KA (2005) Empiricaltests for ecological exchangability. Animal Conservation, 8, 239–247.
Rambaut A, Drummond AJ (2003) TRACER Version 1.3. Availablefrom http://evolve.zoo.ox.ac.uk/.
Raymond M, Rousset F (1995) genepop version 1.2.: populationgenetics software for exact tests and ecumenicism. Journal ofHeredity, 86, 248–249.
Rencher AC (1998) Multivariate Statistical Inference and Applications.Wiley, New York.
Rice WR (1989) Analyzing tables of statistical tests. Evolution, 43,223–225.
Richardson DS, Jury FL, Dawson DA et al. (2000) Fifty Seychelleswarbler (Acrocephalus sechellensis) microsatellite loci polymorphicin Sylviidae species and their cross-species amplification in otherpasserine birds. Molecular Ecology, 9, 2226–2234.
Ricklefs RE, Bermingham E (1999) Taxon cycles in the LesserAntillean avifauna. Ostrich, 70, 49–59.
Saether SA, Fiske P, Kålås JA et al. (2007) Inferring local adaptationfrom QST–FST comparisons: neutral genetic and quantitativetrait variation in European populations of great snipe. Journal ofEvolutionary Biology, 20, 1563–1576.
Sibley CG, Monroe BL (1990) Distribution and Taxonomy of Birds ofthe World. Yale University Press, New Haven, Connecticut.
Sites JWJ, Marshall JC (2004) Operational criteria for delimitingspecies. Annual Review of Ecology, Evolution and Systematics, 35,199–227.
Slikas B, Jones IB, Derrickson SR, Fleischer RC (2000) Phylogeneticrelationships of Micronesian white-eyes based on mitochondrialsequence data. Auk, 117, 355–365.
Smith CE, Filardi CE (2007) Patterns of molecular and morpholo-gical variation in some Solomon Island land birds. Auk, 124,479–493.
Smith AL, Monteiro L, Hasegawa O, Friesen VL (2007) Globalphylogeography of the band-rumped storm-petrel (Oceanodramacastro; Procellariiformes: Hydrobatidae). Molecular Phylogeneticsand Evolution, 43, 755–773.
Spitze K (1993) Population-structure in Dapnia obtusa: quantitativegenetic and allozymic variation. Genetics, 135, 367–374.
Steadman DW (2006) Extinction and Biogeography of Tropical PacificBirds. University of Chicago Press, Chicago.
Swofford DL (2003) PAUP*: Phylogenetic Analysis Using Parsimony (*andOther Methods. Sinauer Associates, Sunderland, Massachusetts.
Wallace AR (1880) Island Life, or the Phenomena and Causes ofInsular Faunas and Floras, Including a Revision and AttemptedSolution of the Problem of Geological Climates. Macmillan Press,London.
Warren BH, Bermingham E, Prys-Jones RP, Thebaud C (2006)Immigration, species radiation and extinction in a highly diversesongbird lineage: white-eyes on Indian Ocean islands. MolecularEcology, 15, 3769–3786.
Weir JT (2006) Divergent timing and patterns of species accumu-lation in lowland and highland neotropical birds. Evolution, 60,842–855.
Weir BS, Cockerham CC (1984) Estimating F statistics for theanalysis of population structure. Evolution, 38, 1358–1370.
Whittaker RJ, Fernandez-Palacios JM (2007) Island Biogeography:Ecology, Evolution and Conservation. Oxford University Press,Oxford, UK.
Wilson EO, Brown WLJ (1953) The subspecies concept and itstaxonomic application. Systematic Biology, 2, 97–111.
Wright S (1965) The interpretation of population structure by F-statistics with special regard to systems of mating. Evolution, 19,395–420.
Zink RM (2004) The role of subspecies in obscuring avian biologicaldiversity and misleading conservation policy. Proceedings of theRoyal Society B: Biological Sciences, 271, 561–564.

PAT T E R N S O F D I V E R G E N C E I N A N I S L A N D B I R D 2853
© 2008 The AuthorsJournal compilation © 2008 Blackwell Publishing Ltd
Albert Phillimore is a postdoc in the NERC Centre for populationbiology at Imperial College London and is interested inintraspecific divergence and speciation. Ian Owens, a Professor ofEvolutionary Ecology at Imperial College London, studies traitevolution using wild populations and comparative approaches.Richard Black is in the process of a PhD focusing on the interplaybetween song and population divergence in birds, with aparticular focus on insular white-eyes. John Chittock formerlyworked as a technician at Sheffield’s molecular genetics facilityand now works in the field of biomedical genetics. Professor TerryBurke heads the NERC molecular genetics facility at SheffieldUniversity. Sonya Clegg, a research fellow at Imperial CollegeLondon, is interested in microevolutionary processes thatunderly divergence in natural systems, and uses a combination ofmorphological, ecological and quantitative and molecular geneticapproaches to examine divergence of bird populations.
Supplementary material
The following supplementary material is available for this article:
Table S1 Microsatellite primer sets and PCR conditions for Zoster-ops flavifrons
Table S2 Summary of sample size, number of alleles, observedheterozygosity and expected heterozygosity for microsatellite locion each island
Table S3 Tests of departure from Hardy-Weinberg equilibriumacross populations and loci
Table S4 Summary statistics of morphometrics obtained from dif-ferent populations
Table S5 Pairwise PST values and the significance derived frompairwise manova tests
Table S6 Pairwise diagnosability scores for (a) wing length and(b) culmen length to tarsus length ratio
This material is available as part of the online article from:http://www.blackwell-synergy.com/doi/abs/10.1111/j.1365-294X.2008.03794.x(This link will take you to the article abstract).
Please note: Blackwell Publishing are not responsible for the contentor functionality of any supplementary materials supplied by theauthors. Any queries (other than missing material) should bedirected to the corresponding author for the article.
Related Documents