Geophys. J. Int. (2007) 170, 371–386 doi: 10.1111/j.1365-246X.2007.03433.x GJI Seismology Complex mantle flow in the Mariana subduction system: evidence from shear wave splitting S. H. Pozgay, 1 D. A. Wiens, 1 J. A. Conder, 1 H. Shiobara 2 and H. Sugioka 3 1 Washington University in St. Louis, Department of Earth and Planetary Sciences, 1 Brookings Drive, St. Louis, MO 63130, USA. E-mail: [email protected] 2 Earthquake Research Institute, University of Tokyo 1-1-1 Yayoi, Bunkyo-ku, Tokyo 113-0032, Japan 3 IFREE, JAMSTEC, 2-15 Natsushima-Cho, Yokosuka 237-0061, Japan Accepted 2007 March 2, Received 2007 March 1; in original form 2006 November 14 SUMMARY Shear wave splitting measurements provide significant information about subduction zone mantle flow, which is closely tied to plate motions, lithospheric deformation, arc volcanism, and backarc spreading processes. We analyse the shear wave splitting of local S waves recorded by a large 2003–2004 deployment consisting of 58 ocean-bottom seismographs (OBSs) and 20 land stations and by nine OBSs from a smaller 2001–2002 deployment. We employ several methods and data processing schemes, including spatial averaging methods, to obtain stable and consistent shear wave splitting patterns throughout the arc–backarc system. Observed fast orientation solutions are dependent on event location and depth, suggesting that anisotropic fabric in the mantle wedge is highly heterogeneous. Shear waves sampling beneath the northern island arc (latitudes 17.5 ◦ –19 ◦ N) and between the arc and backarc spreading centre show arc- parallel fast orientations for events shallower than 250 km depth; whereas, fast orientations at the same stations are somewhat different for deeper events. Waves sampling beneath the central island arc stations (latitudes 15.5 ◦ –17.5 ◦ ) show fast orientations subparallel to both the arc and absolute plate motion (APM) for events <250 km depth and APM-parallel for deeper events. Ray paths sampling west of the spreading centre show fast orientations ranging from arc-perpendicular to APM-parallel. Arc-parallel fast orientations characterize the southern part of the arc with variable orientations surrounding Guam. These results suggest that the typical interpretation of mantle wedge flow strongly coupled to the downgoing slab is valid only at depths greater than ∼250 km and at large distances from the trench. We conclude that the arc-parallel fast orientations are likely the result of physical arc-parallel mantle flow and are not due to recently proposed alternative lattice preferred orientation mechanisms and fabrics. This flow pattern may result from along-strike pressure gradients in the mantle wedge, possibly due to changes in slab dip and/or convergence angles. Key words: Mariana Islands, seismic anisotropy, shear wave splitting, subduction zone. 1 INTRODUCTION The flow pattern of subduction zone mantle wedges is a matter of great importance for understanding the dynamics of subduction and backarc spreading processes. Models of subduction systems suggest that mantle wedge flow may be dominated by viscous coupling to the downgoing slab, producing flow directions parallel to the present- day absolute plate motion (APM) of the downgoing plate (McKenzie 1979; Ribe 1989; van Keken 2003). However, more complex flow patterns, including arc-parallel flow above the slab, may be produced by significant amounts of slab rollback (Buttles & Olson 1998), shearing or extension in the arc-parallel direction (Hall et al. 2000), changes in slab dip (Buttles & Olson 1998; Hall et al. 2000), or changes in convergence angle (Blackman & Kendall 2002; Honda & Yoshida 2005). Mantle flow may also align parallel to the orientation of maximum extension beneath the backarc spreading centre (Fischer et al. 2000). It is commonly assumed that observations of seismic anisotropy can provide strong constraints on mantle flow patterns. Both petro- physical studies of mantle xenoliths (Nicolas & Christensen 1987; Mainprice & Silver 1993) and laboratory studies of deforming rocks (Zhang & Karato 1995; Zhang et al. 2000) suggest that, in most cases, flow of mantle materials should produce a ‘fast orientation’ of upper-mantle anisotropy aligned close to or along the flow orien- tation, although some recent studies suggest that under a restricted range of conditions such as high stress and high water content, the ‘fast orientation’ may be perpendicular to the flow direction (Jung & Karato 2001; Karato 2003). The Mariana subduction system is a highly complex tectonic envi- ronment. Active volcanism throughout the forearc, arc and backarc C 2007 The Authors 371 Journal compilation C 2007 RAS

Welcome message from author
This document is posted to help you gain knowledge. Please leave a comment to let me know what you think about it! Share it to your friends and learn new things together.
Transcript
Geophys. J. Int. (2007) 170, 371–386 doi: 10.1111/j.1365-246X.2007.03433.x
GJI
Sei
smol
ogy
Complex mantle flow in the Mariana subduction system: evidencefrom shear wave splitting
S. H. Pozgay,1 D. A. Wiens,1 J. A. Conder,1 H. Shiobara2 and H. Sugioka3
1Washington University in St. Louis, Department of Earth and Planetary Sciences, 1 Brookings Drive, St. Louis, MO 63130, USA. E-mail: [email protected] Research Institute, University of Tokyo 1-1-1 Yayoi, Bunkyo-ku, Tokyo 113-0032, Japan3IFREE, JAMSTEC, 2-15 Natsushima-Cho, Yokosuka 237-0061, Japan
Accepted 2007 March 2, Received 2007 March 1; in original form 2006 November 14
S U M M A R YShear wave splitting measurements provide significant information about subduction zonemantle flow, which is closely tied to plate motions, lithospheric deformation, arc volcanism,and backarc spreading processes. We analyse the shear wave splitting of local S waves recordedby a large 2003–2004 deployment consisting of 58 ocean-bottom seismographs (OBSs) and20 land stations and by nine OBSs from a smaller 2001–2002 deployment. We employ severalmethods and data processing schemes, including spatial averaging methods, to obtain stableand consistent shear wave splitting patterns throughout the arc–backarc system. Observed fastorientation solutions are dependent on event location and depth, suggesting that anisotropicfabric in the mantle wedge is highly heterogeneous. Shear waves sampling beneath the northernisland arc (latitudes 17.5◦–19◦N) and between the arc and backarc spreading centre show arc-parallel fast orientations for events shallower than 250 km depth; whereas, fast orientationsat the same stations are somewhat different for deeper events. Waves sampling beneath thecentral island arc stations (latitudes 15.5◦–17.5◦) show fast orientations subparallel to both thearc and absolute plate motion (APM) for events <250 km depth and APM-parallel for deeperevents. Ray paths sampling west of the spreading centre show fast orientations ranging fromarc-perpendicular to APM-parallel. Arc-parallel fast orientations characterize the southern partof the arc with variable orientations surrounding Guam. These results suggest that the typicalinterpretation of mantle wedge flow strongly coupled to the downgoing slab is valid only atdepths greater than ∼250 km and at large distances from the trench. We conclude that thearc-parallel fast orientations are likely the result of physical arc-parallel mantle flow and arenot due to recently proposed alternative lattice preferred orientation mechanisms and fabrics.This flow pattern may result from along-strike pressure gradients in the mantle wedge, possiblydue to changes in slab dip and/or convergence angles.
Key words: Mariana Islands, seismic anisotropy, shear wave splitting, subduction zone.
1 I N T RO D U C T I O N
The flow pattern of subduction zone mantle wedges is a matter of
great importance for understanding the dynamics of subduction and
backarc spreading processes. Models of subduction systems suggest
that mantle wedge flow may be dominated by viscous coupling to the
downgoing slab, producing flow directions parallel to the present-
day absolute plate motion (APM) of the downgoing plate (McKenzie
1979; Ribe 1989; van Keken 2003). However, more complex
flow patterns, including arc-parallel flow above the slab, may
be produced by significant amounts of slab rollback (Buttles &
Olson 1998), shearing or extension in the arc-parallel direction (Hall
et al. 2000), changes in slab dip (Buttles & Olson 1998; Hall et al.2000), or changes in convergence angle (Blackman & Kendall 2002;
Honda & Yoshida 2005). Mantle flow may also align parallel to the
orientation of maximum extension beneath the backarc spreading
centre (Fischer et al. 2000).
It is commonly assumed that observations of seismic anisotropy
can provide strong constraints on mantle flow patterns. Both petro-
physical studies of mantle xenoliths (Nicolas & Christensen 1987;
Mainprice & Silver 1993) and laboratory studies of deforming rocks
(Zhang & Karato 1995; Zhang et al. 2000) suggest that, in most
cases, flow of mantle materials should produce a ‘fast orientation’
of upper-mantle anisotropy aligned close to or along the flow orien-
tation, although some recent studies suggest that under a restricted
range of conditions such as high stress and high water content, the
‘fast orientation’ may be perpendicular to the flow direction (Jung
& Karato 2001; Karato 2003).
The Mariana subduction system is a highly complex tectonic envi-
ronment. Active volcanism throughout the forearc, arc and backarc
C© 2007 The Authors 371Journal compilation C© 2007 RAS
372 S.H. Pozgay et al.
Figure 1. Bathymetric station map of Mariana Islands, the location of which
is enclosed by the red box in the small inset. Blue triangles are broadband
land stations, red triangles are 2003–2004 OBSs that returned data (see
Table 1), yellow triangles are 2001–2002 OBSs used in the current study.
Large black vector is Pacific plate absolute plate motion (PAC APM). The
backarc spreading centre and trench are sketched with thick red and black
lines, respectively. Spreading direction is perpendicular to the spreading
ridges, as indicated by small double-headed red arrows. Several islands are
named in bold text. Blue square on Guam is GSN station GUMO. Earth-
quakes (circles) are colour coded by increasing depth: <100 km are red,
100–200 km orange, 200–300 km yellow, 300–400 km green, 400–500 km
blue and >500 km violet.
spreading centre, in addition to significant along-strike changes in
slab dip and convergence angles, suggest complicated patterns of
mantle flow throughout the region. However, the Marianas are com-
monly cited as having mantle flow parallel to present-day Pacific
Plate APM directions based on prior studies at Guam (Xie 1992;
Fouch & Fischer 1998). Here we analyse shear wave splitting results
from two well-distributed seismograph deployments to characterize
mantle flow patterns throughout the Mariana arc system. We find
that several mechanisms are required to explain the observed shear
wave splitting patterns and that the conventional corner flow model
in a subduction zone is not a comprehensive description of mantle
flow in the Mariana system.
1.1 Regional setting
The Mariana arc system encompasses a wide variety of tectonic
settings, with active serpentinite seamounts in the forearc, an active
island arc and backarc spreading centre, and an extinct fossil arc on
the overriding Philippine Sea Plate (Fig. 1). Geochemical variations
have been observed across and along the arc (Kelley et al. 2003;
Pearce et al. 2005) and several physical features change rapidly
along strike of the arc. Near Pagan, the slab dip is nearly vertical
and the slab appears to penetrate the 660 km discontinuity (van
der Hilst et al. 1991). Convergence is highly oblique at a rate of
∼4 cm yr–1 and the half spreading rate at the Mariana trough is
∼1.6 cm yr–1 (Kato et al. 2003). The southern part of the arc near
Guam and Rota is significantly different from the northern part of
the arc. The slab dips at ∼55◦, seismicity extends only to depths of
∼250 km, and convergence is roughly perpendicular to the trench at
a rate of ∼6.5 cm yr–1 (Stern et al. 2003). The half spreading rate of
the southern Mariana trough is ∼4.5 cm yr–1 (Kato et al. 2003). The
Mariana trench does not experience rollback (Stern et al. 2003), as
both the trench and the overriding Philippine Sea Plate both move
westward at rates of ∼2.5–5 and ∼3–8 cm yr–1, respectively (Heuret
& Lallemand 2005; Martinez et al. 2000). Upper plate and trench
migration rates are maximum near Saipan and Tinian Islands and
backarc spreading rates are maximum near Guam (Martinez et al.2000). Plate motions suggest that backarc deformation is primarily
controlled by upper plate motions (Heuret & Lallemand 2005).
1.2 Previous work
Despite the intrinsic value of shear wave splitting measurements
for addressing questions regarding the flow pattern in the Mariana
mantle wedge, prior observations are sparse with data obtained only
at the Global Seismic Network (GSN) station on Guam (GUMO)
and a few ocean-bottom seismographs (OBSs) (Xie 1992; Fouch &
Fischer 1998; Volti et al. 2006). These studies found fast orientations
roughly parallel to the Pacific plate APM orientation and attributed
their observations to the conventional interpretation of mantle wedge
corner flow. The one exception to this is near the backarc spreading
centre, where Volti et al. (2006) found fast orientations subparallel
to the spreading direction.
The present study provides a detailed and thorough analysis of
shear wave splitting patterns observed along and across the entire
Mariana arc system. We use a relatively dense deployment of land
and ocean bottom seismographs (Fig. 1) and analyse local S phases
with multiple data processing schemes to describe mantle flow
patterns throughout the region. We find that while the commonly
cited APM-parallel fast orientations are present in certain areas,
arc-parallel fast orientations dominate at shallow and intermediate
depths. Results show that mantle flow patterns vary along-strike of
the arc and in the across-arc direction, indicating that a simple corner
flow model for the region is not ubiquitous.
2 DATA A N D M E T H O D S
2.1 Data acquisition
Two seismic deployments provide a high-resolution data set for
this study. Most data is from the 2003–2004 MultiScale Seismic
Imaging Experiment in the Mariana Subduction System consisting
of an 11-month deployment of 20 land broadband seismographs
and 58 semi-broadband OBSs (Fig. 1 and Table 1). The 78 stations
were deployed during 2003 May–June and recovered during 2004
April–May. The land stations used Streckheisen STS-2 and Guralp
CMG-40T sensors and were deployed on each island between Guam
and Agrihan, with Reftek 72A-08 dataloggers and GPS timing. The
58 OBSs surround the deepest earthquake locations near Pagan Is-
land and traverse the trench, forearc, island arc, and backarc spread-
ing centre, extending across the West Mariana Ridge. Fifty OBSs
used three-component Mark Products L4 sensors with 1 Hz natural
period and modified amplifiers to extend long-period performance
C© 2007 The Authors, GJI, 170, 371–386
Journal compilation C© 2007 RAS
Local S anisotropy in the Mariana arc 373
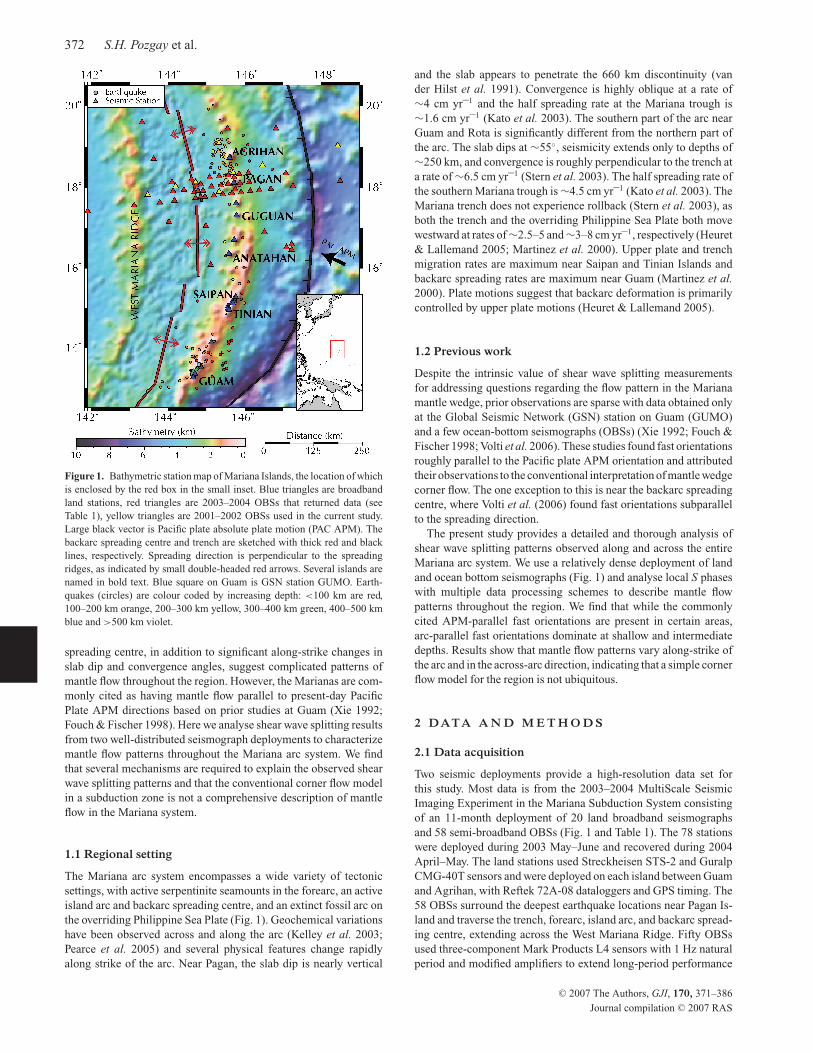
Table 1. Station information for 2001–2002 and 2003–2004 deployments. Land stations are listed by island name; OBS stations are listed by OBS number.
Data recovery problems are noted in the table and are discussed in the text. OBSs never recovered are not listed.
Station Latitude (◦) Longitude (◦) Elevation (m) Typea On date Off date Resultsb
Agrihan 18.7365 145.6529 71 STS-2 05/10/03 04/18/04 A
Alamagan 17.6124 145.8214 71 STS-2 05/08/03 04/22/04 S
Anatahan 16.3644 145.6337 91 STS-2 05/06/03 04/15/04 A
Guam 13.5397 144.9140 289 CMG-40T 05/06/03 05/14/04 A
Guam 13.3631 144.7592 163 CMG-40T 05/08/03 05/14/04 A
Guam 13.2664 144.7172 140 STS-2 05/08/03 05/15/04 A
Guguan 17.3116 145.8334 80 STS-2 05/07/03 04/23/04 A
MAR01 17.2331 141.3855 −4731 PMD 10/09/01 10/06/02 S
MAR02 17.8251 143.5433 −5171 PMD 10/09/01 10/06/02 S
MAR03 18.0333 144.2667 −3811 PMD 10/09/01 09/15/02 S
MAR04 18.1314 144.7814 −3478 PMD 10/09/01 09/15/02 A
MAR05 18.3660 145.7503 −2728 PMD 10/09/01 10/06/02 A
MAR06 18.5501 146.4986 −3698 PMD 10/09/01 09/27/02 S
MAR07 19.0362 148.4356 −5557 PMD 10/09/01 10/01/02 A
MAR08 17.8992 145.3837 −3509 PMD 10/09/01 10/01/02 A
MAR09 19.0918 145.3807 −3571 PMD 10/09/01 09/15/02 A
PMD03 17.0504 145.0403 −3800 PMD 06/20/03 04/12/04 A
PMD04 17.1482 144.0892 −4326 PMD 06/21/03 04/11/04 S
PMD16 17.7750 145.0182 −3471 PMD 06/20/03 03/21/04 S
PMD22 17.9367 146.4181 −3417 PMD 06/18/03 04/02/04 S
PMD40 18.2053 144.6745 −3701 PMD 06/15/03 04/01/04 A
PMD42 18.2504 145.1378 −3744 PMD 06/15/03 04/02/04 A
PMD46 18.3581 146.1356 −3373 PMD 06/16/03 04/01/04 A
PMD58 17.4189 141.9958 −4474 PMD 06/22/03 03/11/04 A
OBS02 16.8998 146.5501 −3492 MPL4n 06/21/03 08/10/04 A
OBS06 16.0834 145.1657 −3608 MPL4n 06/23/03 07/30/03 A
OBS07 16.4604 147.2519 −3224 MPL4n 06/20/03 05/11/04 S
OBS08 16.5206 147.1191 −3541 MPL4o 06/21/03 05/11/04 S
OBS09 16.6002 147.2499 −3334 MPL4o 06/21/03 05/10/04 S
OBS10 17.5614 143.1964 −2418 MPL4n 06/23/03 08/09/03 A
OBS11 17.6302 143.8577 −3889 MPL4n 06/23/03 08/09/03 N
OBS12 17.6787 144.2322 −3948 MPL4n 06/23/03 06/29/03 S
OBS14 17.7444 144.7780 −3671 MPL4o 06/23/03 05/02/04 S
OBS15 17.7677 144.9094 −4152 MPL4n 06/22/03 07/31/03 N
OBS17 17.8033 145.2489 −3595 MPL4n 06/22/03 07/31/03 N
OBS18 17.8327 145.4807 −3244 MPL4n 06/21/03 07/31/03 N
OBS19 17.8596 145.7184 −2882 MPL4o 06/22/03 05/06/04 A
OBS20 17.8849 145.9510 −2702 MPL4n 06/22/03 05/08/04 N
OBS21 17.9114 146.1851 −2602 MPL4n 06/21/03 05/08/04 A
OBS23 17.9659 146.7163 −3491 MPL4o 06/20/03 05/08/04 A
OBS25 18.0333 147.2825 −3723 MPL4n 06/19/03 07/31/03 A
OBS26 18.1624 148.4979 −5923 MPL4n 06/18/03 07/01/03 A
OBS27 17.8892 144.7436 −3883 MPL4n 06/23/03 07/27/03 N
OBS28 17.9160 144.8410 −4624 MPL4o 06/23/03 05/03/04 A
OBS29 17.9239 144.9671 −3740 MPL4n 06/22/03 05/03/04 A
OBS31 18.0586 144.7900 −4386 MPL4n 06/16/03 07/31/03 A
OBS32 18.0809 144.9098 −3565 MPL4o 06/16/03 05/04/04 A
OBS33 17.9075 144.1975 −3847 MPL4o 06/16/03 05/01/04 A
OBS34 17.9398 144.4771 −3880 MPL4n 06/16/03 07/30/03 N
OBS35 18.0261 145.1856 −3688 MPL4n 06/22/03 05/06/04 N
OBS36 18.0541 145.4288 −3176 MPL4o 06/22/03 05/06/04 S
OBS37 18.1345 146.1582 −3034 MPL4n 06/18/03 05/08/04 N
OBS38 18.1297 144.1725 −4154 MPL4n 06/16/03 07/30/03 S
OBS43 18.2776 145.3837 −3338 MPL4n 06/18/03 07/31/03 N
OBS44 18.3042 145.6212 −2585 MPL4o 06/18/03 05/07/04 A
OBS45 18.3311 145.9002 −2669 MPL4n 06/18/03 05/07/04 S
OBS47 18.2496 145.7710 −1898 MPL4o 06/18/03 05/07/04 A
OBS48 18.1085 145.9230 −2247 MPL4o 06/18/03 05/07/04 A
OBS49 17.9595 145.7990 −2287 MPL4o 06/22/03 05/08/04 A
OBS50 18.0978 145.6150 −2339 MPL4n 06/21/03 05/07/04 N
OBS51 18.3497 147.1013 −2757 MPL4n 06/19/03 05/09/04 S
OBS52 19.4504 145.6001 −2475 MPL4n 06/17/03 05/05/04 N
OBS53 18.7006 143.6993 −3656 MPL4n 06/16/03 07/30/03 N
C© 2007 The Authors, GJI, 170, 371–386
Journal compilation C© 2007 RAS
374 S.H. Pozgay et al.
Table 1. (Continued.)
Station Latitude (◦) Longitude (◦) Elevation (m) Typea On date Off date Resultsb
OBS54 18.7009 144.8001 −4139 MPL4n 06/17/03 05/04/04 N
OBS55 19.4498 146.8497 −4735 MPL4n 06/18/03 07/25/03 A
OBS57 19.5999 143.4003 −4070 MPL4n 06/16/03 07/30/03 A
Pagan 18.1207 145.7669 73 STS-2 05/25/03 04/16/04 A
Pagan 18.1222 145.7617 61 STS-2 05/09/03 04/17/07 A
Rota 14.1481 145.1866 528 STS-2 05/10/03 05/05/04 A
Saipan 15.2857 145.8093 100 STS-2 04/30/03 05/01/04 A
Saipan 15.2340 145.7670 219 CMG-40T 05/02/03 05/01/04 A
Saipan 15.1837 145.7466 410 STS-2 05/03/03 05/07/04 A
Saipan 15.1746 145.7712 116 CMG-40T 06/27/03 05/02/04 A
Saipan 15.1323 145.7076 74 CMG-40T 05/05/03 05/07/04 A
Saipan 15.1258 145.7409 122 CMG-40T 05/03/03 05/02/04 A
Sarigan 16.7096 145.7697 85 STS-2 05/06/03 04/24/04 A
Tinian 15.0484 145.6124 126 CMG-40T 05/16/03 05/03/04 A
Tinian 14.9950 145.6130 133 STS-2 05/15/03 05/04/04 A
Tinian 14.9604 145.6412 110 CMG-40T 05/15/03 05/04/04 A
aStreckheisen STS-2, Guralp CMG-40T, Precision Measuring Devices (PMD), Lamont-Doherty Mark Products L-4 (MPL4n for new model, MPL4o for old
model).b‘A’—quality-A results reported, ‘S’—some splitting results but no quality-A splitting measurements and ‘N’—no usable splitting results (see text for
discussion).
(Webb et al. 2001). Fifteen of these OBSs were an older 16-bit model
and 35 of were a new 24-bit design, and they were operated by La-
mont Doherty Earth Observatory (these instruments are denoted by
the ‘OBS’ prefixes in Table 1). The remaining eight OBSs used Pre-
cision Measuring Devices (PMD – WB2023LP) sensors with a low
frequency corner at 0.03 Hz and were built by H. Shiobara at the
University of Tokyo (denoted by the ‘PMD’ prefixes in Table 1). The
35 new U.S. OBSs stopped recording data ∼50 days after deploy-
ment due to a firmware error, eight U.S. OBSs were not recovered,
and the Anatahan Island station had several power failures due to
ash from the eruption covering the solar panels (see Pozgay et al.2005). Several of the U.S. OBSs also failed to properly deploy the
sensor to the seafloor. All other stations operated smoothly for the
duration of the 2003–2004 deployment. The smaller data set is from
nine OBSs with PMD sensors deployed during 2001–2002 across
the arc system (denoted by the ‘MAR’ prefixes in Table 1) (Shiobara
et al. 2005).
2.2 Data selection and processing
We use local earthquakes with depths greater than 80 km from the
USA National Earthquake Information Center (NEIC) global cat-
alog. Most events are between 100 and 300 km depth, but several
events are between 300 and 600 km. We also investigated earth-
quakes located by the local deployment, but not identified at the
NEIC due to their small magnitudes; only a few of these earthquakes
were added to the final event list. Earthquake locations and depths
were checked against relocations made using the local network. Un-
like Volti et al. (2006) who used earthquakes as shallow as 19 km,
we use only intermediate and deep earthquakes to eliminate com-
plex ray propagation effects associated with shallow regional events
and to provide ray paths that are generally propagating vertically.
Most earthquakes have S arrivals within the shear wave window
only at stations located fairly close to the events, which limits our
sampling range. In addition, S arrivals west of the spreading centre
experience higher attenuation than at stations east of the trough axis,
such that only the larger events have high quality S arrivals in the far
backarc. We also investigated SKS arrivals, but no reliable splitting
measurements were obtained due to low signal-to-noise ratio and
poor distribution of events in the proper distance ranges. Finally,
we compute shear wave splitting measurements for 59 OBSs and
20 land stations. The final 2003–2004 data set consists of 252 local
events with 1232 event-station pairs and 25 events with 72 event-
station pairs from the 2001–2002 deployment; a total of 79 stations,
277 events, and 1304 event-station pairs (Fig. 2 and Table 1).
Filtering is often necessary to eliminate noisy portions of the
spectrum, particularly the microseism peak near 0.2 Hz and/or high
frequencies that may result from near receiver scattering. Some fre-
quency dependence has previously been reported in results observed
at the GUMO station (Fouch & Fischer 1998). Therefore, we anal-
yse each shear wave with three filters (a 1-Hz lowpass filter and
bandpass filters at 0.3–0.7 and 0.5–1.5 Hz) and visually inspect
them to determine which frequency band produced the best result.
In many cases, only one filter (usually 0.3–0.7 Hz) is appropri-
ate. For larger events with very high signal-to-noise ratio across
the entire frequency band, the three filters produce nearly the same
result.
We orient OBSs using polarization data from air-gun shots and
several Rayleigh waves and average 7–15 high-quality measure-
ments for each OBS to ensure accuracy of the final orientations.
Standard errors for the orientations range from 3◦ to 7◦, except for
four OBSs with standard errors of 13◦–17◦. In total, we compute
27 OBS orientations and use two orientations determined from P-
wave polarizations by Volti et al. (2006). Note that we only orient
OBSs with quality-A splitting results (see below).
2.3 Shear wave splitting analysis
Shear wave splitting is the process by which an S-wave travelling
through a seismically anisotropic medium is split into a fast compo-
nent and an orthogonal slow component. Two parameters describe
the effects of anisotropy on the waveform: the polarization orien-
tation of the fast component (φ) measured in degrees clockwise
from north and the time lag (δt) between the two components (see
Savage 1999 for a review). (Although ‘fast direction’ is the pre-
dominant term throughout the literature, we in most cases refer to a
C© 2007 The Authors, GJI, 170, 371–386
Journal compilation C© 2007 RAS
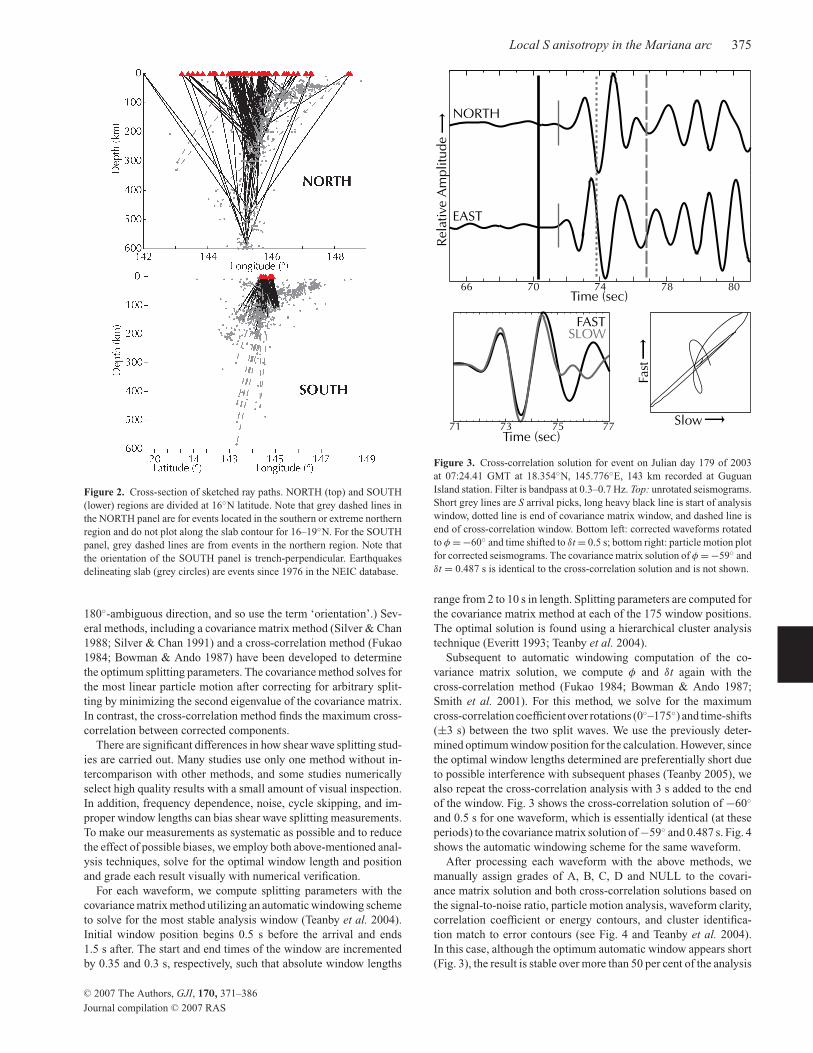
Local S anisotropy in the Mariana arc 375
Figure 2. Cross-section of sketched ray paths. NORTH (top) and SOUTH
(lower) regions are divided at 16◦N latitude. Note that grey dashed lines in
the NORTH panel are for events located in the southern or extreme northern
region and do not plot along the slab contour for 16–19◦N. For the SOUTH
panel, grey dashed lines are from events in the northern region. Note that
the orientation of the SOUTH panel is trench-perpendicular. Earthquakes
delineating slab (grey circles) are events since 1976 in the NEIC database.
180◦-ambiguous direction, and so use the term ‘orientation’.) Sev-
eral methods, including a covariance matrix method (Silver & Chan
1988; Silver & Chan 1991) and a cross-correlation method (Fukao
1984; Bowman & Ando 1987) have been developed to determine
the optimum splitting parameters. The covariance method solves for
the most linear particle motion after correcting for arbitrary split-
ting by minimizing the second eigenvalue of the covariance matrix.
In contrast, the cross-correlation method finds the maximum cross-
correlation between corrected components.
There are significant differences in how shear wave splitting stud-
ies are carried out. Many studies use only one method without in-
tercomparison with other methods, and some studies numerically
select high quality results with a small amount of visual inspection.
In addition, frequency dependence, noise, cycle skipping, and im-
proper window lengths can bias shear wave splitting measurements.
To make our measurements as systematic as possible and to reduce
the effect of possible biases, we employ both above-mentioned anal-
ysis techniques, solve for the optimal window length and position
and grade each result visually with numerical verification.
For each waveform, we compute splitting parameters with the
covariance matrix method utilizing an automatic windowing scheme
to solve for the most stable analysis window (Teanby et al. 2004).
Initial window position begins 0.5 s before the arrival and ends
1.5 s after. The start and end times of the window are incremented
by 0.35 and 0.3 s, respectively, such that absolute window lengths
Time (sec)
NORTH
EAST
66 70 74 78 80
Rel
ativ
e A
mpl
itude
FASTSLOW
71 73 75 77Time (sec)
Fast
Slow
Figure 3. Cross-correlation solution for event on Julian day 179 of 2003
at 07:24.41 GMT at 18.354◦N, 145.776◦E, 143 km recorded at Guguan
Island station. Filter is bandpass at 0.3–0.7 Hz. Top: unrotated seismograms.
Short grey lines are S arrival picks, long heavy black line is start of analysis
window, dotted line is end of covariance matrix window, and dashed line is
end of cross-correlation window. Bottom left: corrected waveforms rotated
to φ = −60◦ and time shifted to δt = 0.5 s; bottom right: particle motion plot
for corrected seismograms. The covariance matrix solution of φ = −59◦ and
δt = 0.487 s is identical to the cross-correlation solution and is not shown.
range from 2 to 10 s in length. Splitting parameters are computed for
the covariance matrix method at each of the 175 window positions.
The optimal solution is found using a hierarchical cluster analysis
technique (Everitt 1993; Teanby et al. 2004).
Subsequent to automatic windowing computation of the co-
variance matrix solution, we compute φ and δt again with the
cross-correlation method (Fukao 1984; Bowman & Ando 1987;
Smith et al. 2001). For this method, we solve for the maximum
cross-correlation coefficient over rotations (0◦–175◦) and time-shifts
(±3 s) between the two split waves. We use the previously deter-
mined optimum window position for the calculation. However, since
the optimal window lengths determined are preferentially short due
to possible interference with subsequent phases (Teanby 2005), we
also repeat the cross-correlation analysis with 3 s added to the end
of the window. Fig. 3 shows the cross-correlation solution of −60◦
and 0.5 s for one waveform, which is essentially identical (at these
periods) to the covariance matrix solution of −59◦ and 0.487 s. Fig. 4
shows the automatic windowing scheme for the same waveform.
After processing each waveform with the above methods, we
manually assign grades of A, B, C, D and NULL to the covari-
ance matrix solution and both cross-correlation solutions based on
the signal-to-noise ratio, particle motion analysis, waveform clarity,
correlation coefficient or energy contours, and cluster identifica-
tion match to error contours (see Fig. 4 and Teanby et al. 2004).
In this case, although the optimum automatic window appears short
(Fig. 3), the result is stable over more than 50 per cent of the analysis
C© 2007 The Authors, GJI, 170, 371–386
Journal compilation C© 2007 RAS
376 S.H. Pozgay et al.
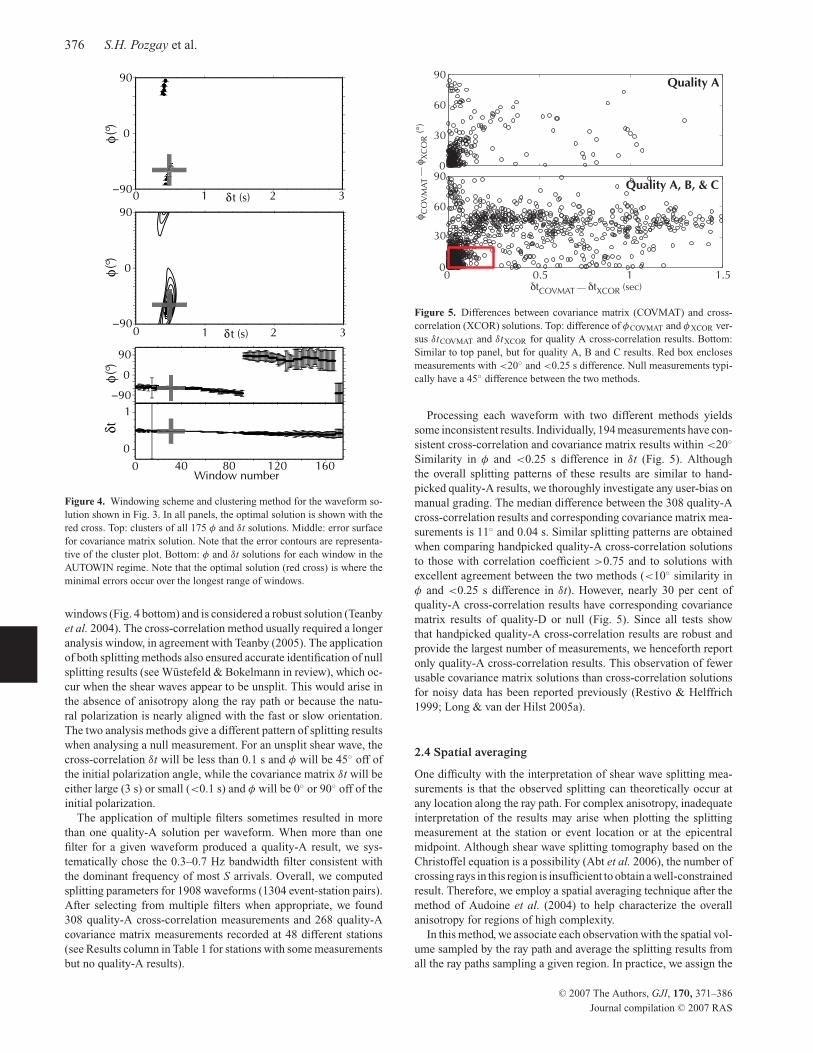
0
90
φ (°)
0 1 2 3δ t (s)
0
90
0 1 2 3δ t (s)
0
1
δt
40 80 120 160Window number
0
90
φ (°)
φ (°)
0
Figure 4. Windowing scheme and clustering method for the waveform so-
lution shown in Fig. 3. In all panels, the optimal solution is shown with the
red cross. Top: clusters of all 175 φ and δt solutions. Middle: error surface
for covariance matrix solution. Note that the error contours are representa-
tive of the cluster plot. Bottom: φ and δt solutions for each window in the
AUTOWIN regime. Note that the optimal solution (red cross) is where the
minimal errors occur over the longest range of windows.
windows (Fig. 4 bottom) and is considered a robust solution (Teanby
et al. 2004). The cross-correlation method usually required a longer
analysis window, in agreement with Teanby (2005). The application
of both splitting methods also ensured accurate identification of null
splitting results (see Wustefeld & Bokelmann in review), which oc-
cur when the shear waves appear to be unsplit. This would arise in
the absence of anisotropy along the ray path or because the natu-
ral polarization is nearly aligned with the fast or slow orientation.
The two analysis methods give a different pattern of splitting results
when analysing a null measurement. For an unsplit shear wave, the
cross-correlation δt will be less than 0.1 s and φ will be 45◦ off of
the initial polarization angle, while the covariance matrix δt will be
either large (3 s) or small (<0.1 s) and φ will be 0◦ or 90◦ off of the
initial polarization.
The application of multiple filters sometimes resulted in more
than one quality-A solution per waveform. When more than one
filter for a given waveform produced a quality-A result, we sys-
tematically chose the 0.3–0.7 Hz bandwidth filter consistent with
the dominant frequency of most S arrivals. Overall, we computed
splitting parameters for 1908 waveforms (1304 event-station pairs).
After selecting from multiple filters when appropriate, we found
308 quality-A cross-correlation measurements and 268 quality-A
covariance matrix measurements recorded at 48 different stations
(see Results column in Table 1 for stations with some measurements
but no quality-A results).
Figure 5. Differences between covariance matrix (COVMAT) and cross-
correlation (XCOR) solutions. Top: difference of φCOVMAT and φXCOR ver-
sus δtCOVMAT and δtXCOR for quality A cross-correlation results. Bottom:
Similar to top panel, but for quality A, B and C results. Red box encloses
measurements with <20◦ and <0.25 s difference. Null measurements typi-
cally have a 45◦ difference between the two methods.
Processing each waveform with two different methods yields
some inconsistent results. Individually, 194 measurements have con-
sistent cross-correlation and covariance matrix results within <20◦
Similarity in φ and <0.25 s difference in δt (Fig. 5). Although
the overall splitting patterns of these results are similar to hand-
picked quality-A results, we thoroughly investigate any user-bias on
manual grading. The median difference between the 308 quality-A
cross-correlation results and corresponding covariance matrix mea-
surements is 11◦ and 0.04 s. Similar splitting patterns are obtained
when comparing handpicked quality-A cross-correlation solutions
to those with correlation coefficient >0.75 and to solutions with
excellent agreement between the two methods (<10◦ similarity in
φ and <0.25 s difference in δt). However, nearly 30 per cent of
quality-A cross-correlation results have corresponding covariance
matrix results of quality-D or null (Fig. 5). Since all tests show
that handpicked quality-A cross-correlation results are robust and
provide the largest number of measurements, we henceforth report
only quality-A cross-correlation results. This observation of fewer
usable covariance matrix solutions than cross-correlation solutions
for noisy data has been reported previously (Restivo & Helffrich
1999; Long & van der Hilst 2005a).
2.4 Spatial averaging
One difficulty with the interpretation of shear wave splitting mea-
surements is that the observed splitting can theoretically occur at
any location along the ray path. For complex anisotropy, inadequate
interpretation of the results may arise when plotting the splitting
measurement at the station or event location or at the epicentral
midpoint. Although shear wave splitting tomography based on the
Christoffel equation is a possibility (Abt et al. 2006), the number of
crossing rays in this region is insufficient to obtain a well-constrained
result. Therefore, we employ a spatial averaging technique after the
method of Audoine et al. (2004) to help characterize the overall
anisotropy for regions of high complexity.
In this method, we associate each observation with the spatial vol-
ume sampled by the ray path and average the splitting results from
all the ray paths sampling a given region. In practice, we assign the
C© 2007 The Authors, GJI, 170, 371–386
Journal compilation C© 2007 RAS
Local S anisotropy in the Mariana arc 377
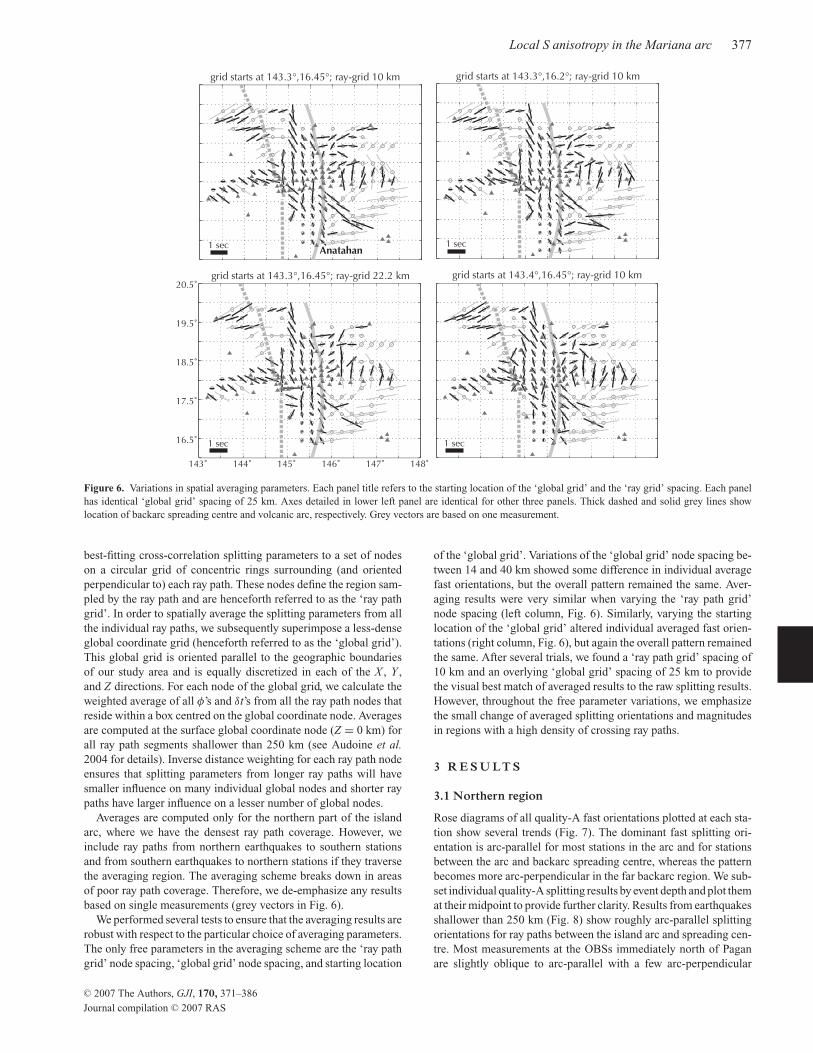
Figure 6. Variations in spatial averaging parameters. Each panel title refers to the starting location of the ‘global grid’ and the ‘ray grid’ spacing. Each panel
has identical ‘global grid’ spacing of 25 km. Axes detailed in lower left panel are identical for other three panels. Thick dashed and solid grey lines show
location of backarc spreading centre and volcanic arc, respectively. Grey vectors are based on one measurement.
best-fitting cross-correlation splitting parameters to a set of nodes
on a circular grid of concentric rings surrounding (and oriented
perpendicular to) each ray path. These nodes define the region sam-
pled by the ray path and are henceforth referred to as the ‘ray path
grid’. In order to spatially average the splitting parameters from all
the individual ray paths, we subsequently superimpose a less-dense
global coordinate grid (henceforth referred to as the ‘global grid’).
This global grid is oriented parallel to the geographic boundaries
of our study area and is equally discretized in each of the X , Y ,
and Z directions. For each node of the global grid, we calculate the
weighted average of all φ’s and δt’s from all the ray path nodes that
reside within a box centred on the global coordinate node. Averages
are computed at the surface global coordinate node (Z = 0 km) for
all ray path segments shallower than 250 km (see Audoine et al.2004 for details). Inverse distance weighting for each ray path node
ensures that splitting parameters from longer ray paths will have
smaller influence on many individual global nodes and shorter ray
paths have larger influence on a lesser number of global nodes.
Averages are computed only for the northern part of the island
arc, where we have the densest ray path coverage. However, we
include ray paths from northern earthquakes to southern stations
and from southern earthquakes to northern stations if they traverse
the averaging region. The averaging scheme breaks down in areas
of poor ray path coverage. Therefore, we de-emphasize any results
based on single measurements (grey vectors in Fig. 6).
We performed several tests to ensure that the averaging results are
robust with respect to the particular choice of averaging parameters.
The only free parameters in the averaging scheme are the ‘ray path
grid’ node spacing, ‘global grid’ node spacing, and starting location
of the ‘global grid’. Variations of the ‘global grid’ node spacing be-
tween 14 and 40 km showed some difference in individual average
fast orientations, but the overall pattern remained the same. Aver-
aging results were very similar when varying the ‘ray path grid’
node spacing (left column, Fig. 6). Similarly, varying the starting
location of the ‘global grid’ altered individual averaged fast orien-
tations (right column, Fig. 6), but again the overall pattern remained
the same. After several trials, we found a ‘ray path grid’ spacing of
10 km and an overlying ‘global grid’ spacing of 25 km to provide
the visual best match of averaged results to the raw splitting results.
However, throughout the free parameter variations, we emphasize
the small change of averaged splitting orientations and magnitudes
in regions with a high density of crossing ray paths.
3 R E S U LT S
3.1 Northern region
Rose diagrams of all quality-A fast orientations plotted at each sta-
tion show several trends (Fig. 7). The dominant fast splitting ori-
entation is arc-parallel for most stations in the arc and for stations
between the arc and backarc spreading centre, whereas the pattern
becomes more arc-perpendicular in the far backarc region. We sub-
set individual quality-A splitting results by event depth and plot them
at their midpoint to provide further clarity. Results from earthquakes
shallower than 250 km (Fig. 8) show roughly arc-parallel splitting
orientations for ray paths between the island arc and spreading cen-
tre. Most measurements at the OBSs immediately north of Pagan
are slightly oblique to arc-parallel with a few arc-perpendicular
C© 2007 The Authors, GJI, 170, 371–386
Journal compilation C© 2007 RAS
378 S.H. Pozgay et al.
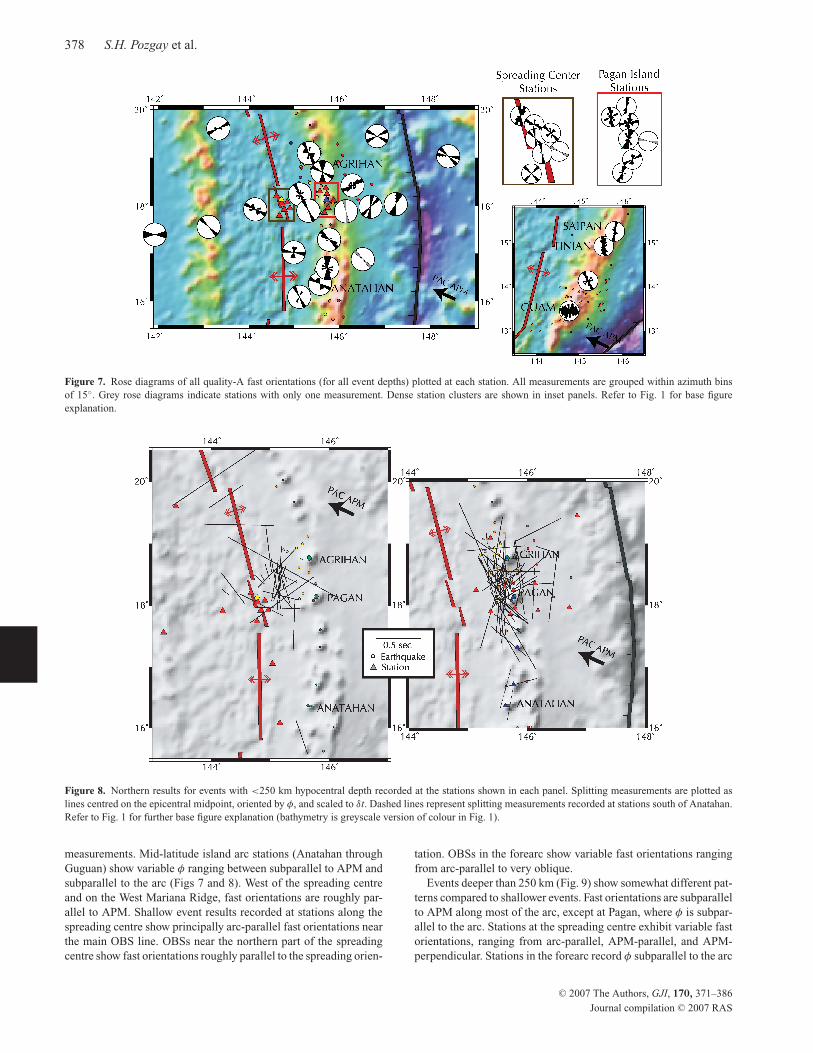
Figure 7. Rose diagrams of all quality-A fast orientations (for all event depths) plotted at each station. All measurements are grouped within azimuth bins
of 15◦. Grey rose diagrams indicate stations with only one measurement. Dense station clusters are shown in inset panels. Refer to Fig. 1 for base figure
explanation.
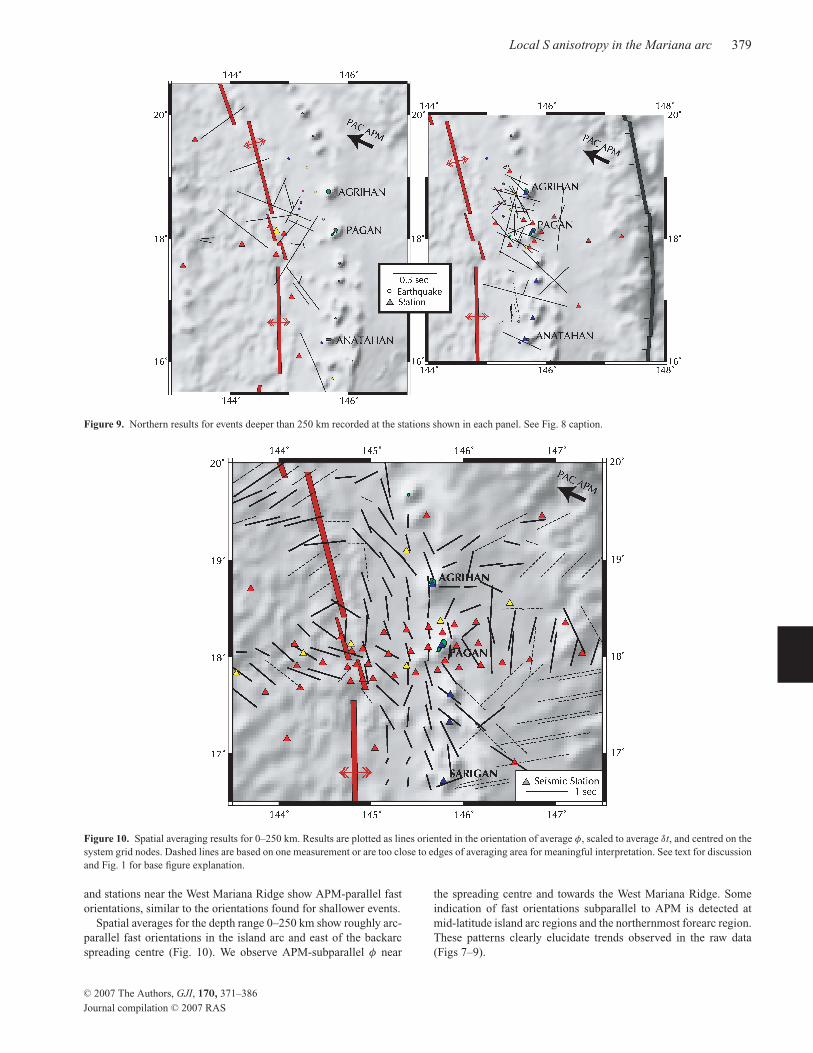
Figure 8. Northern results for events with <250 km hypocentral depth recorded at the stations shown in each panel. Splitting measurements are plotted as
lines centred on the epicentral midpoint, oriented by φ, and scaled to δt. Dashed lines represent splitting measurements recorded at stations south of Anatahan.
Refer to Fig. 1 for further base figure explanation (bathymetry is greyscale version of colour in Fig. 1).
measurements. Mid-latitude island arc stations (Anatahan through
Guguan) show variable φ ranging between subparallel to APM and
subparallel to the arc (Figs 7 and 8). West of the spreading centre
and on the West Mariana Ridge, fast orientations are roughly par-
allel to APM. Shallow event results recorded at stations along the
spreading centre show principally arc-parallel fast orientations near
the main OBS line. OBSs near the northern part of the spreading
centre show fast orientations roughly parallel to the spreading orien-
tation. OBSs in the forearc show variable fast orientations ranging
from arc-parallel to very oblique.
Events deeper than 250 km (Fig. 9) show somewhat different pat-
terns compared to shallower events. Fast orientations are subparallel
to APM along most of the arc, except at Pagan, where φ is subpar-
allel to the arc. Stations at the spreading centre exhibit variable fast
orientations, ranging from arc-parallel, APM-parallel, and APM-
perpendicular. Stations in the forearc record φ subparallel to the arc
C© 2007 The Authors, GJI, 170, 371–386
Journal compilation C© 2007 RAS
Local S anisotropy in the Mariana arc 379
Figure 9. Northern results for events deeper than 250 km recorded at the stations shown in each panel. See Fig. 8 caption.
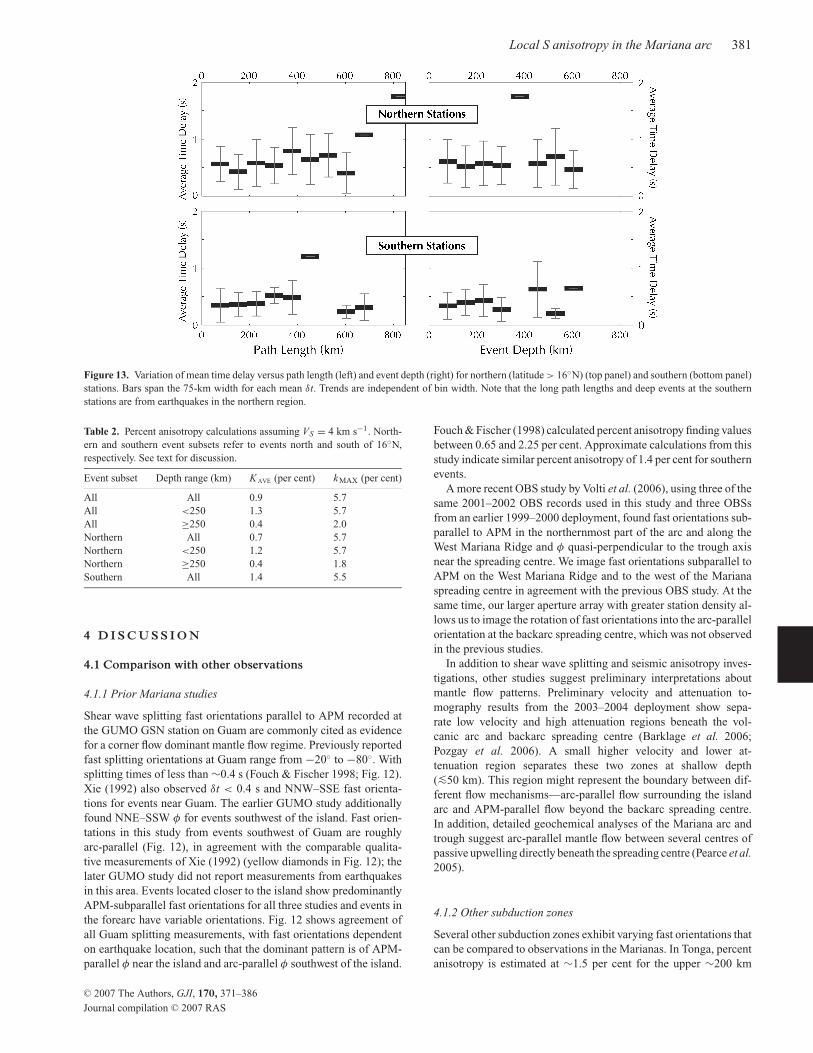
Figure 10. Spatial averaging results for 0–250 km. Results are plotted as lines oriented in the orientation of average φ, scaled to average δt, and centred on the
system grid nodes. Dashed lines are based on one measurement or are too close to edges of averaging area for meaningful interpretation. See text for discussion
and Fig. 1 for base figure explanation.
and stations near the West Mariana Ridge show APM-parallel fast
orientations, similar to the orientations found for shallower events.
Spatial averages for the depth range 0–250 km show roughly arc-
parallel fast orientations in the island arc and east of the backarc
spreading centre (Fig. 10). We observe APM-subparallel φ near
the spreading centre and towards the West Mariana Ridge. Some
indication of fast orientations subparallel to APM is detected at
mid-latitude island arc regions and the northernmost forearc region.
These patterns clearly elucidate trends observed in the raw data
(Figs 7–9).
C© 2007 The Authors, GJI, 170, 371–386
Journal compilation C© 2007 RAS
380 S.H. Pozgay et al.
Figure 11. Splitting results for results recorded at all southern stations are
plotted at the event-station midpoint, oriented by φ, and scaled to δt. Refer
to Fig. 8 for base figure explanation.
3.2 Southern region
Nearly all measurements in the southern region have focal depths
<250 km and two patterns of fast orientations predominate
(Figs 11 and 12). Between Rota and Saipan, we record splitting
measurements subparallel and oblique to the arc. In this region,
the strike of the arc is ∼20◦ and the average φ of these measure-
ments is 3.1◦. We observe variable splitting orientations near Guam,
but can make several general observations from the splitting map
(Fig. 12). For example, events in the forearc show variable split-
ting orientations, events north of the island show fast orientations
subparallel to APM, and events southwest of the island show dom-
inantly arc-parallel orientations. However, results are complicated
and data coverage is sparse.
3.3 Depth extent of anisotropy
We investigate the possibility of depth-dependent lag times, as would
be expected if anisotropy extends throughout the depth range stud-
ied, and has been noted for several other subduction zones (Yang
et al. 1995; Fouch & Fischer 1996). Delay times throughout the
northern region range from 0.1 to 2.1 s for focal depths <250 km
and from 0.1 to 1.5 s for events ≥250 km. For both depth ranges,
average lag times are 0.55–0.56 s. Southern region delay times range
from 0.1 to 1.2 s with a 0.36 s average. There is a lack of system-
atic variation of δt with hypocentral depth (Fig. 13, right). However,
there is a slight suggestion of a small increase of δt with path length
that is more apparent for the southern stations (Fig. 13, lower left),
but also noticeable at northern stations (upper left).
Percent anisotropy (k) is calculated for the ith ray path by
ki = δti VS
di,
where VS is an assumed S velocity of 4 km s−1 and d is the hypocen-
tral distance. Arithmetic mean kAVE and individual kMAX are detailed
in Table 2. Mean percent anisotropy for northern and southern events
is 1.0 and 1.4 per cent, respectively. Nearly all southern events are
between 80 and 200 km, therefore, we cannot discuss the depth ex-
tent of anisotropy there, except to mention that the mean value of
1.4 per cent must be characteristic of the upper 80–100 km. For the
northern region, mean anisotropy for events shallower than 250 km
is 1.3 per cent, which reduces to 0.5 per cent for events 250–600 km
depth. The reduction in average anisotropy with depth is consistent
with a small amount azimuthal anisotropy below 250–300 km in the
mantle wedge (Fischer & Wiens 1996). We note that, since there is
little or no variation in splitting time with depth or path length, the
maximum percent anisotropy can be calculated with the minimum
path length, which gives a maximum percent anisotropy of 1.6 per
cent, which is slightly higher than the mean calculations.
Figure 12. Comparison of results near Guam. All splitting results are plotted at the epicentre, oriented by φ, and scaled to δt. Solid black lines are results from
this study and dashed lines are local S results from Fouch & Fischer (1998). Diamonds show qualitative NW (pink) or NE (yellow) fast orientations from Xie
(1992). Circles are events used in this study. See text for discussion and Fig. 1 for base figure explanation.
C© 2007 The Authors, GJI, 170, 371–386
Journal compilation C© 2007 RAS
Local S anisotropy in the Mariana arc 381
Figure 13. Variation of mean time delay versus path length (left) and event depth (right) for northern (latitude > 16◦N) (top panel) and southern (bottom panel)
stations. Bars span the 75-km width for each mean δt. Trends are independent of bin width. Note that the long path lengths and deep events at the southern
stations are from earthquakes in the northern region.
Table 2. Percent anisotropy calculations assuming VS = 4 km s−1. North-
ern and southern event subsets refer to events north and south of 16◦N,
respectively. See text for discussion.
Event subset Depth range (km) K AVE (per cent) kMAX (per cent)
All All 0.9 5.7
All <250 1.3 5.7
All ≥250 0.4 2.0
Northern All 0.7 5.7
Northern <250 1.2 5.7
Northern ≥250 0.4 1.8
Southern All 1.4 5.5
4 D I S C U S S I O N
4.1 Comparison with other observations
4.1.1 Prior Mariana studies
Shear wave splitting fast orientations parallel to APM recorded at
the GUMO GSN station on Guam are commonly cited as evidence
for a corner flow dominant mantle flow regime. Previously reported
fast splitting orientations at Guam range from −20◦ to −80◦. With
splitting times of less than ∼0.4 s (Fouch & Fischer 1998; Fig. 12).
Xie (1992) also observed δt < 0.4 s and NNW–SSE fast orienta-
tions for events near Guam. The earlier GUMO study additionally
found NNE–SSW φ for events southwest of the island. Fast orien-
tations in this study from events southwest of Guam are roughly
arc-parallel (Fig. 12), in agreement with the comparable qualita-
tive measurements of Xie (1992) (yellow diamonds in Fig. 12); the
later GUMO study did not report measurements from earthquakes
in this area. Events located closer to the island show predominantly
APM-subparallel fast orientations for all three studies and events in
the forearc have variable orientations. Fig. 12 shows agreement of
all Guam splitting measurements, with fast orientations dependent
on earthquake location, such that the dominant pattern is of APM-
parallel φ near the island and arc-parallel φ southwest of the island.
Fouch & Fischer (1998) calculated percent anisotropy finding values
between 0.65 and 2.25 per cent. Approximate calculations from this
study indicate similar percent anisotropy of 1.4 per cent for southern
events.
A more recent OBS study by Volti et al. (2006), using three of the
same 2001–2002 OBS records used in this study and three OBSs
from an earlier 1999–2000 deployment, found fast orientations sub-
parallel to APM in the northernmost part of the arc and along the
West Mariana Ridge and φ quasi-perpendicular to the trough axis
near the spreading centre. We image fast orientations subparallel to
APM on the West Mariana Ridge and to the west of the Mariana
spreading centre in agreement with the previous OBS study. At the
same time, our larger aperture array with greater station density al-
lows us to image the rotation of fast orientations into the arc-parallel
orientation at the backarc spreading centre, which was not observed
in the previous studies.
In addition to shear wave splitting and seismic anisotropy inves-
tigations, other studies suggest preliminary interpretations about
mantle flow patterns. Preliminary velocity and attenuation to-
mography results from the 2003–2004 deployment show sepa-
rate low velocity and high attenuation regions beneath the vol-
canic arc and backarc spreading centre (Barklage et al. 2006;
Pozgay et al. 2006). A small higher velocity and lower at-
tenuation region separates these two zones at shallow depth
(<∼50 km). This region might represent the boundary between dif-
ferent flow mechanisms—arc-parallel flow surrounding the island
arc and APM-parallel flow beyond the backarc spreading centre.
In addition, detailed geochemical analyses of the Mariana arc and
trough suggest arc-parallel mantle flow between several centres of
passive upwelling directly beneath the spreading centre (Pearce et al.2005).
4.1.2 Other subduction zones
Several other subduction zones exhibit varying fast orientations that
can be compared to observations in the Marianas. In Tonga, percent
anisotropy is estimated at ∼1.5 per cent for the upper ∼200 km
C© 2007 The Authors, GJI, 170, 371–386
Journal compilation C© 2007 RAS
382 S.H. Pozgay et al.
(Fischer & Wiens 1996), similar to calculations in this study, and
fast orientations at stations near the arc are arc-parallel, while APM-
parallel values are observed farther into the backarc near the Fiji
plateau (Bowman & Ando 1987; Smith et al. 2001). Southward in-
filtration of the Samoan plume above the retreating Pacific slab is one
likely interpretation for this pattern, in agreement with geochemi-
cal evidence for plume infiltration (Turner & Hawkesworth 1998).
Our observations in the Mariana arc show a similar pattern of arc-
parallel fast orientations near the arc and APM-parallel φ in the far
backarc. In both subduction zones, the rotation from arc-parallel
to APM-parallel occurs near the backarc spreading centre. The
Mariana region does not show a slab window or the slab rollback
thought to contribute to the Tonga dynamics, however the similarity
of shear wave splitting measurements in the two different subduc-
tion zones may be indicative of a general pattern of upper-mantle
flow in arcs with active backarc spreading.
Local S splitting results in Kamchatka show a maximum of
2.6 per cent anisotropy and highly variable fast splitting orientations
(Levin et al. 2004). Fast orientations behind the arc are roughly arc-
parallel throughout the study area. However, the northeastern region
shows oblique and scattered φ near the trench and arc, compared to
relatively uniform arc-perpendicular φ in the southwest. Levin et al.(2004) conclude that corner flow is highly localized near the south-
ern region and suggest that complex slab morphology and temporal
slab dip variations might explain the heterogeneous fast orienta-
tions in the north. In our study, we also observe highly variable
splitting orientations and time lags in some regions and observe
similar percent anisotropy. However, we observe nearly opposite
fast orientations compared to Kamchatka, with arc-parallel fast ori-
entations dominating near the Mariana arc, but APM-parallel φ in
the far backarc.
Splitting orientations from teleseismic S phases recorded in
southern Japan are dominantly trench-parallel at the arc and trench-
perpendicular in the backarc (Long & van der Hilst 2005b), while lo-
cal S observations in central Honshu and Hokkaido show arc-parallel
fast orientations in the forearc and APM-parallel φ beneath the arc
(Nakajima & Hasegawa 2004; Long & van der Hilst 2005b). Fast ori-
entations in the northern part of the Izu arc are oriented subparallel
to both the convergence direction and the trench-parallel orientation
(Anglin & Fouch 2005), whereas φ is consistently trench-parallel
in the Ryukyu arc (Long & van der Hilst 2006). Fast orientations in
this study are similar to that observed throughout parts of Japan and
the Izu and Ryukyu islands and our estimate of percent anisotropy
for northern events agrees well with similar calculations in Japan
(Fouch & Fischer 1996).
In addition to those mentioned above, other subduction zones are
also dominated by arc-parallel fast splitting orientations with some
nearby APM-parallel component. Fast splitting orientations in the
mid-latitude regions of the South American subduction zone are
dominantly trench-parallel in regions of ‘normal’ slab behaviour
and are subparallel to the strike of slab contours in regions where
the slab flattens (Anderson et al. in review). Fast orientations are
dominantly trench-parallel throughout the Central American arc
and backarc and are only trench-perpendicular in the forearc (Abt
et al. 2006), whereas the north island of New Zealand shows trench-
parallel φ in the arc and forearc with trench-perpendicular φ only
in the backarc (Marson-Pidgeon et al. 1999; Audoine et al. 2004;
Styles et al. 2006). Geodynamic modelling results typically suggest
APM-parallel mantle flow, however most arcs show arc-parallel fast
orientations implying arc-parallel mantle flow. This study shows
that although APM-parallel fast orientations are present in the far
backarc and in a small region surrounding the island of Guam, arc-
parallel fast splitting orientations predominate throughout the Mar-
iana subduction system.
4.2 Possible factors controlling seismic anisotropy
in the Mariana Arc
4.2.1 Fossil anisotropy in the subducting slab
Anisotropy might be controlled by fossil sea floor spreading (FSS)
(Hess 1964) from ray paths travelling through the slab. Based on
45◦ magnetic isochrons prior to subduction (Nakanishi et al. 1992),
slab dips of ∼88◦ and ∼55◦, and arc strikes of ∼0◦ and ∼20◦ for
the northern and southern regions, respectively, and assuming the
dominant fast anisotropy orientation in the oceanic lithosphere is
isochron-perpendicular (Forsyth 1992), we would expect fast orien-
tations approximately N–S or NNW–SSE in the northern region and
roughly −20◦ in the south. Although anisotropy in the slab could be
distinguished by time lag differences between events in the upper
or lower plane of the double seismic zone (Wiens et al. 2005), data
for such investigation is insufficient. Similarly, any anisotropy due
to in-slab strain resulting from downdip extension or compression
is not resolvable with this study.
We can, however, infer the presence or absence of slab anisotropy
by other means. Along the arc and east of the trough, arc-parallel φ
dominates for events <250 km (Figs 7–10). The arc-parallel orien-
tation is similar to the FSS direction in the northern region, however
we do not attribute the majority of these measurements to anisotropy
in the slab because most ray paths travel primarily through the mantle
wedge and sample a minimal region of the slab itself. Several deep
northern events recorded at Pagan and at southern stations show fast
orientations parallel to predicted FSS orientations with small δt and
may result from slab anisotropy (dashed vectors in Fig. 9). These ray
paths sample a significant amount of the slab and the solutions are
oriented in the expected FSS directions and are in agreement with
prior slab anisotropy solutions with average lag times of ∼0.25 s
(Volti et al. 2006). APM-parallel fast orientations are recorded at
Agrihan and Guguan.
4.2.2 Anisotropy in the crust
Considering the apparent lack of depth dependence on our splitting
measurements, crustal anisotropy might seem a plausible source.
However, we first note that most crustal anisotropy measurement
are on the order of 0.05–0.2 s (Savage 1999), which is much smaller
than our delay times (average δt is ∼0.5 s). Second, we note that
crustal thickness beneath the Mariana Trough is only ∼5–7, ∼20 km
thick beneath island arc stations, and ∼10 km thick beneath forearc
stations (Takahashi et al. 2007). If the crust was the main source
of anisotropy at OBS stations, where we observe an average 0.5 s
delay time, percent anisotropy would be on the order of >28 per cent
(based on 10 km thick crust and shear velocity of 4 km s−1), which is
significantly larger than has been observed in crustal rocks (Babuska
& Cara 1991; Crampin 1994). Although we cannot completely rule
out a small effect of crustal anisotropy on our measurements, it
cannot be a major source of splitting in our measurements.
4.2.3 Effect of water on the anisotropic slip system
Significant amounts of water and high shear stress may align the
olivine a-axis perpendicular to the direction of maximum strain,
resulting in a shear wave splitting fast orientation perpendicular
C© 2007 The Authors, GJI, 170, 371–386
Journal compilation C© 2007 RAS
Local S anisotropy in the Mariana arc 383
to mantle flow (Jung & Karato 2001). Recent modelling results
show that such changes in olivine slip systems are likely for slow
subduction rates (< ∼3–4 cm/yr) and in areas with extremely
high stresses (�50 MPa), low temperatures (700–1000 ◦C), and
presence of water, for example in forearcs (Kneller et al. 2005).
Geodynamic modelling (Currie & Hyndman 2006) and heat flow
(Blackwell et al. 1982) results suggest that the upper mantle beneath
arc and backarc regions is characterized by temperatures that are too
high (>1200 ◦C) to produce this alignment. Thus, ‘B-type fabric’ is
not a good explanation for the extensive region of along-strike fast
orientations extending from the arc to the backarc spreading centre
in our results.
B-type fabric remains a possibility for the interpretation of fore-
arc measurements, where the mantle is cold and has a high water
content, as indicated by widespread serpentinization (Fryer 1996).
However, if B-type fabric exists in the Mariana forearc, we would
expect a small magnitude of anisotropy and the arc-parallel φ mea-
surements would be interpreted as APM-parallel flow. Since island
arc fast orientations are predominantly arc-parallel and that area is
too hot for B-type fabric, this scenario would then require differ-
ent physical mechanisms to invoke APM-parallel flow beneath the
forearc and arc-parallel flow beneath the arc. However, due to the
predominance of arc-parallel φ throughout much of the arc system
and the significant magnitude of splitting observed in this region, we
suggest that the forearc fast orientations are probably due to similar
mechanisms that produce the arc-parallel fast orientations beneath
the arc and are probably not due to B-type fabric.
4.2.4 Oriented melt pockets
Experimental studies show that a small amount of melt can weaken
the overall a-axis alignment, such that abundant melt bands aligned
in the direction of stress would rotate the a-axis 90◦ to the dom-
inant flow direction (Holtzman et al. 2003). If the flow direction
in the vicinity of the backarc spreading centre were parallel to the
spreading direction as inferred from a-axis orientations obtained by
ocean-bottom electromagnetic studies (Baba et al. 2004), we would
expect fast orientations aligned 90◦ to the extension direction. We
observe fast orientations that are dominantly ridge-parallel near the
arc and switch to ridge-perpendicular immediately to the west of the
spreading centre axis (Figs 7–10). This might suggest dominantly
ridge-perpendicular mantle flow along the entire spreading centre
with the along-strike fast orientation between the arc and spreading
centre produced by aligned melt bands.
Although this hypothesis requires further study, there are several
difficulties. This model would warrant significant melt porosity in
the upper mantle over a wide depth range and over a large spatial
extent; it is not clear whether sufficient in situ melt exists in the
upper mantle to cause this effect on a wide scale. In fact, U-series
disequilibria studies suggest that the porosity of the upper mantle
is very low, both beneath oceanic spreading centres (Spiegelman &
Elliott 1993; Lundstrom et al. 1998) and island arcs (Turner & Foden
2001). In addition, if widespread melt exists beneath the arc and
between the arc and backarc spreading centre where we see along-
strike fast orientations, it is not clear why this mechanism would not
also operate somewhat west of the spreading centre where we see
APM-parallel fast orientations.
4.2.5 Slab-driven flow
A long-standing model for mantle flow in a subduction zone consists
of mantle wedge material coupled to the downgoing slab producing
APM-parallel fast orientations (e.g. van Keken 2003). The Mariana
arc is often cited as a model for APM-parallel corner flow. However,
we observe APM-parallel fast orientations only for deep events,
at stations near the West Mariana Ridge, and close to Guam. We
record a slight rotation of fast orientations towards APM-parallel at
mid-latitude island arc stations, but fast orientations are dominantly
arc-parallel. We conclude that APM-parallel corner flow is likely
at �250 km distance and depth away from the trench, but is not
dominant throughout the arc system.
4.2.6 Arc-parallel mantle flow due to slab morphology andconvergence angle variations
One mechanism that may be important for producing arc-parallel
flow in the Mariana wedge is arc-parallel flow in the asthenosphere.
Pressure gradients that drive flow may be generated in a variety of
ways, such as flow through slab tears or windows due to spatial
(Smith et al. 2001) or temporal variations (Levin et al. 2004), slab
rollback (Russo & Silver 1994; Buttles & Olson 1998), variations
in downgoing slab morphology (Hall et al. 2000), or variations in
convergence angle along-strike of the arc (Honda & Yoshida 2005).
Analytical models show that a change in slab dip of one degree
over ∼100 km of along-strike distance will produce arc-parallel
pressure gradients in the wedge corner that may, in turn, elicit arc-
parallel flow above the slab (Hall et al. 2000). Numerical modelling
results based on this suggest that the magnitude of arc-parallel flow
must be >25 per cent of the plate convergence rate to noticeably
rotate olivine a-axes away from an APM orientation (Blackman &
Kendall 2002). Such arc-parallel flow would decrease in magnitude
with distance away from the wedge corner. In the Marianas, slab
dip decreases by ∼40◦ between Agrihan and Guam, a distance of
∼555 km. In accordance with modelling results of Hall et al. (2000),
we would expect arc-parallel flow near the wedge corner resulting
from large changes in slab dip and waning effects of arc-parallel
flow with increasing distance away from the corner. Such a model is
consistent with our observations of arc-parallel φ east of the spread-
ing centre for events shallower than ∼250 km and APM-parallel φ
for deeper events and at stations west of the spreading centre. If
arc-parallel flow is due to slab dip variations, effects may only be
imaged near the arc for shallow events (<250 km) with waning
influence to the spreading centre (∼250–300 km laterally). Addi-
tionally, laboratory experimental results modelling a steeply dipping
slab suggest that a-axis alignment may only predominate near the
slab (Buttles & Olson 1998), further reinforcing a confined spatial
extent of arc-parallel flow.
4.2.7 Arc-parallel pressure gradients—geodynamic modelling
To illustrate the qualitative viability of arc-parallel pressure gradi-
ents controlling the LPO structure within the mantle wedge, we cre-
ate a 2-D finite-element model of mantle wedge flow using a stress-
and temperature-dependent viscosity structure. First, we calculate
the viscosity structure of the mantle wedge, with the known inverse
exponential relationship to temperature (Karato & Wu 1993), using
prior thermal modelling methods (Conder et al. 2002; Conder 2005).
The viscosities are lowest just outside of the ‘cold nose’ forearc, in
the uppermost corner where temperatures and corner flow strain
rates are highest. We impose an arc-parallel pressure gradient of a
few kPa km–1 to that resultant viscosity structure and calculate the
induced arc-parallel velocity structure (Fig. 14a) and the subsequent
strain rate from the induced flow (Fig. 14b). The pressure gradient
C© 2007 The Authors, GJI, 170, 371–386
Journal compilation C© 2007 RAS
384 S.H. Pozgay et al.
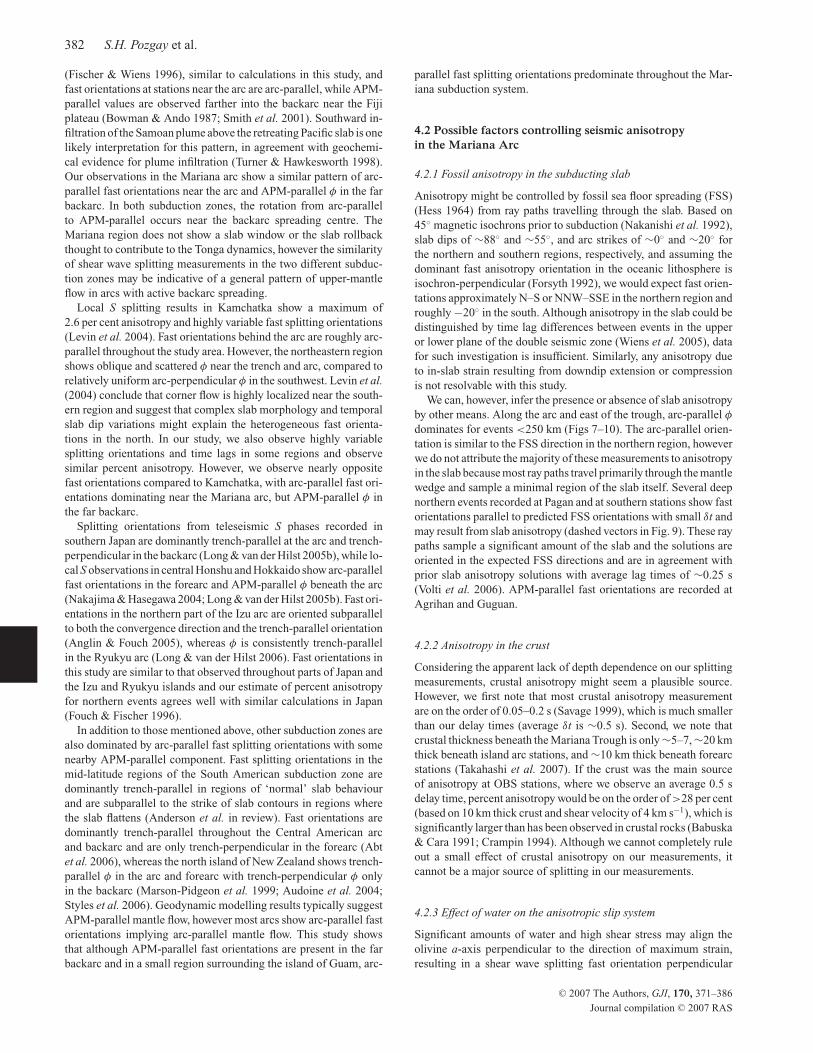
Figure 14. Arc-parallel mantle flow velocity in dimensionless units (a) and
resulting strain rate in log units (b) from applying an along-strike pressure
gradient to the 2-D variable viscosity, non-Newtonian flow models patterned
after the northern Mariana mantle wedge. Note that strain rates far away from
the wedge corner are overestimated. See text for discussion.
is an a priori assumption in this simple modelling, the purpose of
which is to investigate whether a pressure gradient can produce
the observed spatial distribution of splitting orientations. Thus, the
magnitude of both the pressures and the flow velocity are meant to
be representative and should not be as a precise measure.
We approximate conditions for a cross-section along our main
OBS line near Pagan in our model with a slab dip of ∼75◦ and a
convergence rate of 4 cm yr–1. To keep the methodology simple,
we ignore the spreading centre in these models. While pressure
gradients for either flow through slab tears or pressure-gradients
from changes in slab morphology will be strongest near the corner,
our 2.5-D assumption requires a constant pressure gradient over
the entire wedge, noting that a variable pressure gradient would
be possible with full 3-D modelling, but is outside the scope of
this paper for our illustrative purposes. As such, arc-parallel flow
rates far from the corner are likely overestimated relative to the
arc-parallel flow rates within the corner. However, even with this
overestimation, clear differences are apparent between the backarc
and the uppermost corner of the wedge.
Two localized regions of high strain rate are visible in Fig. 14(b).
One region is along the top of the slab and extends to depths
�150 km. The other region is just below the overriding Philippine
Sea Plate with a maximum depth extent of ∼150 km and dissi-
pates towards the backarc. In this light, the high strain rates in the
wedge corner dissipate between the island arc and spreading cen-
tre, becoming close to the ambient background. These regions of
high strain rate due to arc-parallel velocity gradients illustrate re-
gions of expected contribution to arc-parallel fast orientations and
are a good match to our observations. Similarly, 3-D models with
curved slabs also show strong trench-parallel stretching in the wedge
corner (Kneller & van Keken 2006). Ray paths that travel through
these high strain regions result in dominantly arc-parallel fast orien-
tations, whereas ray paths travelling mostly through regions of low
arc-parallel strain rate have roughly APM-parallel φ. In contrast,
deep events recorded at northern island arc stations are nearly all
subparallel to APM. Ray paths from deeper hypocentres will spend
more time at depths that are largely unaffected by arc-parallel pres-
sure gradients (Fig. 14b), and are more affected by corner flow in a
direction parallel to APM.
5 C O N C L U S I O N S
Local S splitting results show complex patterns along and across
the Mariana subduction system. Dense seismic arrays, multiple
data analysis techniques, and comprehensive manual and numer-
ical grading schemes provide a high-resolution image of seismic
anisotropy patterns throughout the region. Shallow and intermedi-
ate depth events exhibit predominantly arc-parallel fast orientations
in the forearc, island arc and backarc regions. Splitting measure-
ments recorded at stations west of the backarc spreading centre and
measurements from deep events show fast orientations subparallel
to APM. We observe larger average splitting times in the northern
region (0.55 s) compared to the southern region (0.36 s), but there
is no increase in lag time with depth. Arc-parallel fast orientations
for shallow and intermediate depth events are likely controlled by
arc-parallel flow due to trench-parallel pressure gradients induced
by a combination of slab dip and convergence angle variations and
by arc-parallel extension. These causes would dominate near the
wedge corner and have waning influence at greater distances. Our
results indicate a transition at the backarc spreading centre from
arc-parallel fast orientation on the east side to APM-parallel on the
western side, similar to the transition observed in other subduction
zones (e.g. Tonga arc). In addition, modelling results suggest that any
arc-parallel pressure gradient induced by tectonic variations would
not affect the far backarc and we see no evidence of arc-parallel
fast orientations in this region. We conclude that simple 2-D corner
flow does not dominate throughout the Mariana arc system and the
slab–mantle system is only strongly coupled at ≥ ∼250 km depth
and at large distances from the wedge corner.
A C K N O W L E D G M E N T S
Thanks to Gideon Smith, Nick Teanby, and Martha Savage for help-
ful comments on shear wave splitting methods and implementa-
tion. Theodora Volti provided two OBS orientations. Martha Sav-
age, Vadim Levin, Karen Fischer, Megan Anderson, Maureen Long,
Garrett Euler, Erica Emry, Moira Pyle and one anonymous reviewer
C© 2007 The Authors, GJI, 170, 371–386
Journal compilation C© 2007 RAS
Local S anisotropy in the Mariana arc 385
all provided helpful advice and suggestions that greatly improved
this paper. We thank numerous people, particularly Patrick Shore,
Spahr Webb, Allan Sauter, Patrick Jonke, Juan Camacho, Joe Kaipat
and Ray Chong, as well as the captain and the crew of the R/V
Kaiyo, the R/V Wecoma, and the Super Emerald for assistance with
deploying and recovering the seismographs. Land seismic instru-
mentation was provided by the PASSCAL program of the Incorpo-
rated Research Institutions in Seismology (IRIS) and the Lamont
Ocean Bottom Seismograph Facility provided ocean bottom seis-
mographs. This research was supported by the MARGINS program
under National Science Foundation grant OCE0001938.
R E F E R E N C E S
Abt, D.L., Fischer, K.M., Martin, L.J., Abers, G.A., Protti, J.M., Gonzalez,
V. & Strauch, W., 2006. Shear-wave splitting tomography in the central
american subduction zone: implications for flow and melt in the mantle
wedge, EOS Trans. AGU, Fall Meet. Suppl., 87(52), T22C-05.
Anderson, M.L., Zandt, G. & Wagner, L., in review. Along-strike mantle
flow variations in a segment of the South American subduction zone,
Chile and Argentina, Ear. Planet. Sci. Lett., in review.
Anglin, D.K. & Fouch, M.J., 2005. Seismic anisotropy in the Izu-Bonin
subduction system, Geophys. Res. Lett., 32, doi:10.1029/2005GL022714.
Audoine, E., Savage, M.K. & Gledhill, K., 2004. Anisotropic structure under
a back arc spreading region, the Taupo Volcanic Zone, New Zealand, J.Geophys. Res., 109(B11305), doi:10.1029/2003JB002932.
Baba, K., Seama, N., Goto Ichiki, T., Schwalenberg, K., Suyehiro, K. &
Utada, H., 2004. Electrical transection of the upper mantle in the Mariana
subduction system, The 17th International Workshop on ElectromagneticInduction in the Earth, Natl. Geophys. Res. Inst., Hyderabad, India.
Babuska, V. & Cara, M., 1991. Seismic Anisotropy in the Earth, pp. 217,
Kluwer Academic Publishers, Dordrecht, The Netherlands.
Barklage, M.E., Conder, J.A., Wiens, D.A., Shore, P.J., Shiobara, H., Sugioka,
H. & Zhang, H., 2006. 3-D seismic tomography of the mariana mantle
wedge from the 2003–2004 passive component of the mariana subduction
factory imaging experiment, EOS Trans. AGU, Fall Meet. Suppl., 87(52),
T23C-0506.
Blackman, D.K. & Kendall, J.-M., 2002. Seismic anisotropy in the upper
mantle 2. Predictions for current plate boundary flow models, Geochem.Geophys. Geosys., 3(9), 8602, doi:10.1029/2001GC000247.
Blackwell, D.D., Bowen, R.G., Riccio, J. & Steele, J.L., 1982. Heat flow,
arc volcanism, and subduction in Northern Oregon, J. Geophys. Res., 87,8735–8754.
Bowman, J.R. & Ando, M., 1987. Shear-wave splitting in the upper-mantle
wedge above the Tonga subduction zone, Geophys. Jour. Roy. Astr. Soc.,88, 25–41.
Buttles, J. & Olson, P., 1998. A laboratory model of subduction zone
anisotropy, Ear. Planet. Sci. Lett., 164, 245–262.
Conder, J.A., 2005. A case for hot slab surface temperatures in nu-
merical viscous flow models of subduction zones with an improved
fault zone parameterization, Phys. Ear. Planet. Int., 149, 155–164,
doi:10.1029/j.pepi.2004.09.018.
Conder, J.A., Wiens, D.A. & Morris, J., 2002. On the decompression melting
structure at volcanic arcs and back-arc spreading centers, Geophys. Res.Lett., 29(15), doi:10.1029/2002GL015390.
Crampin, S., 1994. The fracture criticality of crustal rocks, Geophys. J. Int.,118, 428–438.
Currie, C.A. & Hyndman, R.D., 2006. The thermal structure of
subduction zone back arcs, J. Geophys. Res., 111, B08404,
doi:10.1029/2005JB004024.
Everitt, B., 1993. Cluster Analysis, 3rd ed., pp. 170, Halsted Press, London.
Fischer, K.M. & Wiens, D.A., 1996. The depth distribution of mantle
anisotropy beneath the Tonga subduction zone, Ear. Planet. Sci. Lett.,142, 253–260.
Fischer, K.M., Parmentier, E.M., Stine, A.R. & Wolf, E.R., 2000. Modeling
anisotropy and plate-driven flow in the Tonga subduction zone back arc,
J. Geophys. Res., 105(B7), 16 181–16 191.
Forsyth, D.W., 1992. Geophysical constraints on mantle flow and melt gen-
eration beneath mid-ocean ridges, in Mantle Flow and Melt Generationat Mid-Ocean Ridges, 361, eds Phipps Morgan, J., Blackman, D.K. &
Sinton, J.M., American Geophysical Union, Washington, D.C.
Fouch, M.J. & Fischer, K.M., 1996. Mantle anisotropy beneath northwest
Pacific subduction zones, J. Geophys. Res., 101(B7), 15 987–16 002.
Fouch, M.J. & Fischer, K.M., 1998. Shear wave anisotropy in the Mariana
subduction zone, Geophys. Res. Lett., 25(8), 1221–1224.
Fryer, P., 1996. Evolution of the Mariana convergent plate margin system,
Rev. Geophys., 34(1), 89–125.
Fukao, Y., 1984. Evidence from core-reflected shear waves for anisotropy in
the Earth’s mantle, Nature, 309, 695–698.
Hall, C., Fischer, K.M., Parmentier, E. & Blackman, D.K., 2000. The in-
fluence of plate motions on three-dimensional back arc mantle flow and
shear wave splitting, J. Geophys. Res., 105(B12), 28 009–28 033.
Hess, H.H., 1964. Seismic anisotropy of the uppermost mantle under oceans,
Nature, 203, 629–631.
Heuret, A. & Lallemand, S., 2005. Plate motions, slab dynamics and back-arc
deformation, Phys. Ear. Planet. Int., 149, 31–51.
Holtzman, B.K., Kohlstedt, D.L., Zimmerman, M.E., Heidelback, F.,
Hiraga, T. & Hustoft, J., 2003. Melt segregation and strain partitioning:
implications for seismic anisotropy and mantle flow, Science, 301, 1,227–
1,230.
Honda, S. & Yoshida, T., 2005. Effects of oblique subduction on the 3-D
pattern of small-scale convection within the mantle wedge, Geophys. Res.Lett., 32(L13307), 1–4. doi:10.1029/2005GL023106.
Jung, H. & Karato, S., 2001. Water-induced fabric transitions in olivine,
Science, 293, 1,460–1,463.
Karato, S., 2003. Mapping water content in the upper mantle, in Insidethe Subduction Factory, 324, ed. Eiler, J., American Geophysical Union,
Washington, D.C.
Karato, S.-I. & Wu, P., 1993. Rheology of the upper mantle: a synthesis,
Science, 260(5109), 771–778.
Kato, T., Beavan, J., Matsushima, T., Kotake, Y., Camacho, J.T. & Nakao, S.,
2003. Geodetic evidence of back-arc spreading in the Mariana Trough,
Geophys. Res. Lett., 30(12), 1625–1629.
Kelley, K.A., Plank, T., Newman, S., Stolper, E.M., Grove, T.L., Parman, S.
& Hauri, E., 2003. Mantle melting as a function of water content in arcs,
EOS Trans. AGU, Fall Meet. Suppl., 84(46), Abstract V41D-06.
Kneller, E.A. & van Keken, P.E., 2006. The effects of 3D slab geometry on
deformation in the mantle wedge, EOS Trans. AGU, Fall Meet. Suppl.,87(52), Abstract T22C-07.
Kneller, E.A., van Keken, P.E., Karato, S. & Park, J., 2005. B-type olivine
fabric in the mantle wedge: Insights from high-resolution non-Newtonian
subduction zone models, Ear. Planet. Sci. Lett., 237, 781–797.
Levin, V., Droznin, D., Park, J. & Gordeev, E., 2004. Detailed mapping of
seismic anisotropy with local shear waves in southeastern Kamchatka,
Geophys. J. Int., 158, 1,009–1,023.
Long, M.D. & Van Der Hilst, R.D., 2005a. Estimating shear-wave splitting
parameters from broadband recordings in Japan: A comparison of three
methods, Bull. Seis. Soc. Am., 95(4), 1346–1358.
Long, M.D. & Van Der Hilst, R.D., 2005b. Upper mantle anisotropy beneath
Japan from shear wave splitting, Phys. Ear. Planet. Int., 151, 206–222.
Long, M.D. & Van Der Hilst, R.D., 2006. Shear wave splitting from local
events beneath the ryukyu arc: trench-parallel anisotropy in the mantle
wedge, Phys. Ear. Planet. Int., 155(3–4), 300–312.
Lundstrom, C.C., Williams, Q. & Gill, J., 1998. Investigating solid mantle
upwelling rates beneath mid-ocean ridges using U-series disequilibria: I.
A global approach, Ear. Planet. Sci. Lett., 167, 151–165.
Mainprice, D. & Silver, P.G., 1993. Interpretation of SKS-waves using sam-
ples from the subcontinental lithosphere, Phys. Ear. Planet. Int., 78(3–4),
257–280.
Marson-Pidgeon, K., Savage, M.K., Gledhill, K. & Stuart, G., 1999. Seismic
anisotropy beneath the lower half of the North Island, New Zealand, J.Geophys. Res., 104, 20,277–20,286.
C© 2007 The Authors, GJI, 170, 371–386
Journal compilation C© 2007 RAS
386 S.H. Pozgay et al.
Martinez, F., Fryer, P. & Becker, N., 2000. Geophysical characteristics of
the southern Mariana Trough, 11deg50’N-13deg40’N, J. Geophys. Res.,105(B7), 16,591–16,607.
McKenzie, D., 1979. Finite deformation during fluid flow, Geophys. Jour.Roy. Astr. Soc., 58, 689–715.
Nakajima, J. & Hasegawa, A., 2004. Shear-wave polarization anisotropy and
subduction-induced flow in the mantle wedge of northeastern Japan, Ear.Planet. Sci. Lett., 225, 365–377.
Nakanishi, M., Tamaki, K. & Kobayashi, K., 1992. Magnetic anomaly lin-
eations from Late Jurassic to Early Cretaceous in the west-central Pacific
Ocean, Geophys. J. Int., 109, 701–719.
Nicolas, A. & Christensen, N.I., 1987. Formation of anisotropy in upper
mantle peridotites: a review, in Composition, Structure and Dynamics ofthe Lithosphere/Asthenosphere System, pp. 111–123, ed. Fuchs, K.A.F.C.,
American Geophysical Union, Washington, D.C.
Pearce, J.A., Stern, R.J., Bloomer, S.H. & Fryer, P., 2005. Geochemical
mapping of the Mariana arc-basin system: Implications for the nature and
distribution of subduction components, Geochem. Geophys. Geosys., 6,Q07006(7), doi:10.1029/2004GC000895.
Pozgay, S.H., Wiens, D.A., Shiobara, H. & Sugioka, H., 2006. Seismic At-
tenuation Structure of the Mariana Subduction System, EOS Trans. AGU,Fall Meet. Suppl., 87(52), T23C-0504.
Pozgay, S.H., White, R.A., Wiens, D.A., Shore, P.J., Sauter, A.W. & Kaipat,
J.L., 2005. seismicity and tilt associated with the 2003 Anatahan Eruption
Sequence, J. Volcan. Geotherm. Res., 146(1–3), 60–76.
Restivo, A. & Helffrich, G.R., 1999. Teleseismic shear wave splitting mea-
surements in noisy environments, Geophys. J. Int., 137, 821–830.
Ribe, N.M., 1989. Seismic anisotropy and mantle flow, J. Geophys. Res.,94(B4), 4,213–4,223.
Russo, R.M. & Silver, P.G., 1994. Trench-parallel flow beneath the Nazca
plate from seismic anisotropy, Science, 263(5150), 1,105–1,111.
Savage, M.K., 1999. Seismic anisotropy and mantle deformation: what have
we learned from shear wave splitting?, Rev. Geophys., 37(1), 65–106.
Shiobara, H., Sugioka, H., Mochizuki, K., Oki, S., Kanazawa, T., Fukao, Y.
& Suyehiro, K., 2005. Long term seismic observation in mariana by obss:
double seismic zone and upper mantle structure, EOS Trans. AGU, FallMeet. Suppl., 86(52), Abstract T53A-1407.
Silver, P.G. & Chan, W.W., 1988. Implications for continental structure and
evolution from seismic anisotropy, Nature, 335, 34–39.
Silver, P.G. & Chan, W.W., 1991. Shear wave splitting and subcontinental
mantle deformation, J. Geophys. Res., 96(B10), 16 429–16 454.
Smith, G.P., Wiens, D.A., Fischer, K.M., Dorman, L.M., Webb, S.C. &
Hildebrand, J.A., 2001. A complex pattern of mantle flow in the Lau
Backarc, Science, 292, 713–716.
Spiegelman, M. & Elliott, T., 1993. Consequences of melt transport for
uranium series disequilibrium in young lavas, Ear. Planet. Sci. Lett., 118,1–20.
Stern, R.J., Fouch, M.J. & Klemperer, S.L., 2003. An overview of the Izu-
Bonin-Mariana subduction factory, in Inside the Subduction Factory,
p.324, ed. Eiler, J., American Geophysical Union, Washington, D.C.
Styles, K.E., Stuart, G.W., Kendall, J.-M. & Reyners, M., 2006. Seismic
anisotropy from local earthquakes in the hikurangi subduction zone, North
Island, New Zealand, EOS Trans. AGU, Fall Meet. Suppl., 87(52), T23C-
0510.
Takahashi, N., Kodiara, S., Klemperer, S.L., Tatsumi, Y., Kaneda, Y. &
Suyehiro, K., 2007. Crustal structure and evolution of the Mariana intra-
oceanic island arc, Geology, 35, 203–206.
Teanby, N.A., 2005. E-mail, personal communication.
Teanby, N.A., Kendall, J.-M. & Van Der Baan, M., 2004. Automation of
shear-wave splitting measurements using cluster analysis, Bull. Seis. Soc.Am., 94(2), 453–463.
Turner, S. & Hawkesworth, C., 1998. Using geochemistry to map mantle
flow beneath the Lau Basin, Geology, 26(11), 1019–1022.
Turner, S. & Foden, J., 2001. U, Th, and Ra disequilibria, Sr, Nd and Pb
isotope and trace element variations in Sunda arc lavas: predominance
of a subducted sediment component, Contribut. Miner. Petrol., 142(1),
43–57.
Van Der Hilst, R.D., Engdahl, E.R., Spakman, W. & Nolet, G., 1991. Tomo-
graphic imaging of subducted lithosphere below northwest Pacific island
arcs, Nature, 353, 37–43.
van Keken, P.E., 2003. The structure and dynamics of the mantle wedge,
Ear. Planet. Sci. Lett., 215, 323–338.
Volti, T., Gorbatov, A., Shiobara, H., Sugioka, H., Mochizuki, K. & Kaneda,
Y., 2006. Shear-wave splitting in the Mariana trough—a relation between
back-arc spreading and mantle flow?, Ear. Planet. Sci. Lett., 244, 566–
575.
Webb, S.C., Deaton, T.K. & Lemire, J.C., 2001. A Broadband ocean-bottom
seismometer system based on a 1-Hz natural period geophone, Bull. Seis-mol. Soc. Am., 91(2), 304–312.
Wiens, D.A. et al., 2005. An Overview of the 2003–2004 Mariana subduction
factory passive imaging experiment, EOS Trans. AGU, Fall Meet. Suppl.,86(52), Abstract T44A-04.
Wustefeld, A. & Bokelmann, G., in review. Null detection in shear-wave
splitting measurements, Bull. Seismol. Soc. Am., in review.
Xie, J., 1992. Shear-wave splitting near Guam, Phys. Ear. Planet. Int., 72,211–219.
Yang, X., Fischer, K.M. & Abers, G.A., 1995. Seismic anisotropy beneath
the Shumagin Islands segment of the Aleutian-Alaska subduction zone,
J. Geophys. Res., 100(B9), 18 165–18 177.
Zhang, S. & Karato, S., 1995. Lattice preferred orientation of olivine aggre-
gates deformed in simple shear, Nature, 375, 774–777.
Zhang, S., Karato, S., Fitz Gerald, J., Faul, U.H. & Zhou, Y., 2000. Sim-
ple shear deformation of olivine aggregates, Tectonophysics, 316, 133–
152.
C© 2007 The Authors, GJI, 170, 371–386
Journal compilation C© 2007 RAS
Related Documents