Complex interactions between components of individual prey specialization affect mechanisms of niche variation in a grasshopper-hunting wasp Davide Santoro 1 , Carlo Polidori 1 *, Josep D. Ası´ s 2 and Jose´ Tormos 2 1 Dipartimento di Biologia, Sezione di Zoologia e Citologia, Universita ` degli Studi di Milano – Via Celoria, 26, Milan 20133, Italy; and 2 Unidad de Zoologı´a, Facultad de Biologı´a, Universidad de Salamanca – 37071, Salamanca, Spain Summary 1. Individual foraging behaviour defines the use of resources by a given population and its varia- tion in different ways such as, for example, unpredictable interactions between taxon-biased and size-biased selection. Here we investigated how the environmental availability of prey and individ- ual specialization, for both prey taxa and prey size, shape niche variation across generations in the grasshopper-hunting digger wasp Stizus continuus. 2. The population of S. continuus expressed selective predation, females mainly hunting species encountered on large bushes; diet changed across generations, due more to size increase in poten- tial prey than to changes in the orthopteran community. 3. Individual females of both generations weakly overlapped the size and taxa of prey, and the niche width of the second generation increased for both prey size and taxa. 4. The greater variance in prey size in the environment accounted for the enlarged prey size niche of the second generation, but the load-lifting constraints of the wasps maintained individual prey size specialization constant. In contrast, the enlarged prey taxon niche paralleled a smaller overlap of diets between wasps in the second generation. 5. Increased niche width in the S. continuus population was thus achieved in two ways. Regarding prey size, all individuals shifted towards the use of the full set of available resources (parallel release). For prey taxa, according to the classical niche variation hypothesis, individuals diverged to minimize resource use overlap and perhaps intraspecific competition. These two mechanisms were observed for the first time simultaneously in a single predator population. Key-words: niche variation hypothesis, parallel release, predation, resource availability, solitary wasp Introduction Specialization of a population can be defined according to different conceptual frameworks (Ferry-Graham, Bolnick & Wainwright 2002). For example, an ‘ecological specialist’ is a species that utilizes a narrow range of resources, while a ‘functional specialist’ is a species that is forced to use a nar- row range of the available resources because it is ‘mechani- cally’ constrained to that subset (Ferry-Graham, Bolnick & Wainwright 2002; Irschick, Dyer & Sherry 2005). Because they are not ecologically equivalent, the same concepts can be applied to single individuals, which can show different degrees of intraspecific resource overlap. This individual spe- cialization is widespread in the animal kingdom and can be invoked to explain the majority of the population niche width, thus having important ecological, evolutionary and conservation implications (reviewed by Bolnick et al. 2003). The realized niche is frequently narrower than the funda- mental (potential) niche (the manifestation of species geno- type in the environment) and reflects how extrinsic factors such as competition, predation or other ecological interac- tions affect the population and individual niche (Futuyma & Moreno 1988). Regarding diet, the realized niche corre- sponds to the natural diet, e.g. the prey a predator actually eats in nature. An opportunistic population of a predator would hunt each prey species with a frequency not very dif- ferent from its abundance in the environment (Polidori et al. 2007, 2009, 2010; Huseynov, Jackson & Cross 2008); in con- trast, an opportunistic individual in a predator population would have a prey spectrum reflecting that of the whole pop- ulation (Bolnick et al. 2003). Both levels of analysis are important and should ideally be carried out at the same time *Correspondence author. E-mail: [email protected] Journal of Animal Ecology 2011, 80, 1123–1133 doi: 10.1111/j.1365-2656.2011.01874.x Ó 2011 The Authors. Journal of Animal Ecology Ó 2011 British Ecological Society

Welcome message from author
This document is posted to help you gain knowledge. Please leave a comment to let me know what you think about it! Share it to your friends and learn new things together.
Transcript

Complex interactions between components of individual
prey specialization affect mechanisms of niche variation
in a grasshopper-huntingwasp
Davide Santoro1, Carlo Polidori1*, JosepD. Asıs2 and Jose Tormos2
1Dipartimento di Biologia, Sezione di Zoologia e Citologia, Universita degli Studi di Milano – Via Celoria, 26,Milan 20133,
Italy; and 2Unidad de Zoologıa, Facultad de Biologıa, Universidad de Salamanca – 37071, Salamanca, Spain
Summary
1. Individual foraging behaviour defines the use of resources by a given population and its varia-
tion in different ways such as, for example, unpredictable interactions between taxon-biased and
size-biased selection. Here we investigated how the environmental availability of prey and individ-
ual specialization, for both prey taxa and prey size, shape niche variation across generations in the
grasshopper-hunting digger wasp Stizus continuus.
2. The population of S. continuus expressed selective predation, females mainly hunting species
encountered on large bushes; diet changed across generations, due more to size increase in poten-
tial prey than to changes in the orthopteran community.
3. Individual females of both generations weakly overlapped the size and taxa of prey, and the
niche width of the second generation increased for both prey size and taxa.
4. The greater variance in prey size in the environment accounted for the enlarged prey size niche
of the second generation, but the load-lifting constraints of the wasps maintained individual prey
size specialization constant. In contrast, the enlarged prey taxon niche paralleled a smaller overlap
of diets between wasps in the second generation.
5. Increased niche width in the S. continuus population was thus achieved in two ways. Regarding
prey size, all individuals shifted towards the use of the full set of available resources (parallel
release). For prey taxa, according to the classical niche variation hypothesis, individuals diverged
to minimize resource use overlap and perhaps intraspecific competition. These two mechanisms
were observed for the first time simultaneously in a single predator population.
Key-words: niche variation hypothesis, parallel release, predation, resource availability, solitary
wasp
Introduction
Specialization of a population can be defined according to
different conceptual frameworks (Ferry-Graham, Bolnick &
Wainwright 2002). For example, an ‘ecological specialist’ is a
species that utilizes a narrow range of resources, while a
‘functional specialist’ is a species that is forced to use a nar-
row range of the available resources because it is ‘mechani-
cally’ constrained to that subset (Ferry-Graham, Bolnick &
Wainwright 2002; Irschick, Dyer & Sherry 2005). Because
they are not ecologically equivalent, the same concepts can
be applied to single individuals, which can show different
degrees of intraspecific resource overlap. This individual spe-
cialization is widespread in the animal kingdom and can be
invoked to explain the majority of the population niche
width, thus having important ecological, evolutionary and
conservation implications (reviewed by Bolnick et al. 2003).
The realized niche is frequently narrower than the funda-
mental (potential) niche (the manifestation of species geno-
type in the environment) and reflects how extrinsic factors
such as competition, predation or other ecological interac-
tions affect the population and individual niche (Futuyma &
Moreno 1988). Regarding diet, the realized niche corre-
sponds to the natural diet, e.g. the prey a predator actually
eats in nature. An opportunistic population of a predator
would hunt each prey species with a frequency not very dif-
ferent from its abundance in the environment (Polidori et al.
2007, 2009, 2010; Huseynov, Jackson & Cross 2008); in con-
trast, an opportunistic individual in a predator population
would have a prey spectrum reflecting that of the whole pop-
ulation (Bolnick et al. 2003). Both levels of analysis are
important and should ideally be carried out at the same time*Correspondence author. E-mail: [email protected]
Journal of Animal Ecology 2011, 80, 1123–1133 doi: 10.1111/j.1365-2656.2011.01874.x
� 2011 TheAuthors. Journal ofAnimal Ecology� 2011 British Ecological Society
for a given population, because the hypothesis that popula-
tions and individuals behave opportunistically is generally
not supported by empirical evidence. Thus, opportunism or
specialization may appear at population and ⁄or individual
level (see Fig. 1).
The same concept is also valid when considering prey size
classes instead of prey taxa. Under size constraints, consum-
ers efficiently exploiting one type of resource are inefficient
using another type of resource (Bolnick et al. 2003). For
example, larger individuals can detect, capture and consume
both small and large prey items, whereas small predators are
usually restricted to small prey (Barclay & Brigham 1991;
Polidori et al. 2005) and thus large individuals may be capa-
ble of using a broader range of prey species than smaller ones
if different prey species fall in different prey size classes (e.g.
Liao, Pierce & Larscheid 2001); alternatively, larger preda-
tors might avoid smaller prey, weakening the relationship
between predator size and niche breadth (e.g. Costa 2009).
These patterns, in turn, would affect the arrangement of
interaction strengths and consequently food web stability
(Emmerson&Raffaelli 2004).
Furthermore, the niches of individuals and populations
vary with time. This niche variation may simply reflect the
changes occurring in prey availability or may be linked to
other additional factors. Increased niche width could, in prin-
ciple, be achieved in two ways. First, all individuals might
shift to use the full set of available resources (parallel release)
(Bolnick et al. 2010). Alternatively, each individual might
continue to use a narrow range of resources but diverge from
its conspecific competitors to minimize resource use overlap
and competition: increased population diet breadth is thus
achieved by greater between-individual variation (Bolnick
et al. 2007). Following the ‘niche variation hypothesis’
(NVH) (Van Valen 1965), populations with wider niches are
more variable (e.g. morphologically or behaviourally) than
populations with narrower niches. Populations may broaden
their niche through this mechanism if interspecfic competi-
tion decreases and ⁄or intraspecific competition increases
(Bolnick 2001; Svanback & Bolnick 2007; Bolnick et al.
2010). It is also possible, evidently, that increased individual
niche width does not correspond to a variation in population
niche, because expansion may be offset by decreased
between-individual variation (individual release) (Bolnick
et al. 2010). Again, the same model of niche variation may
not necessarily apply to both prey taxa and prey size for a
given predator population (e.g. Araujo & Gonzaga 2007), so
that considering simultaneously both diet axes (and their
relationship) is extremely important.
(a) (b)
(c) (d)
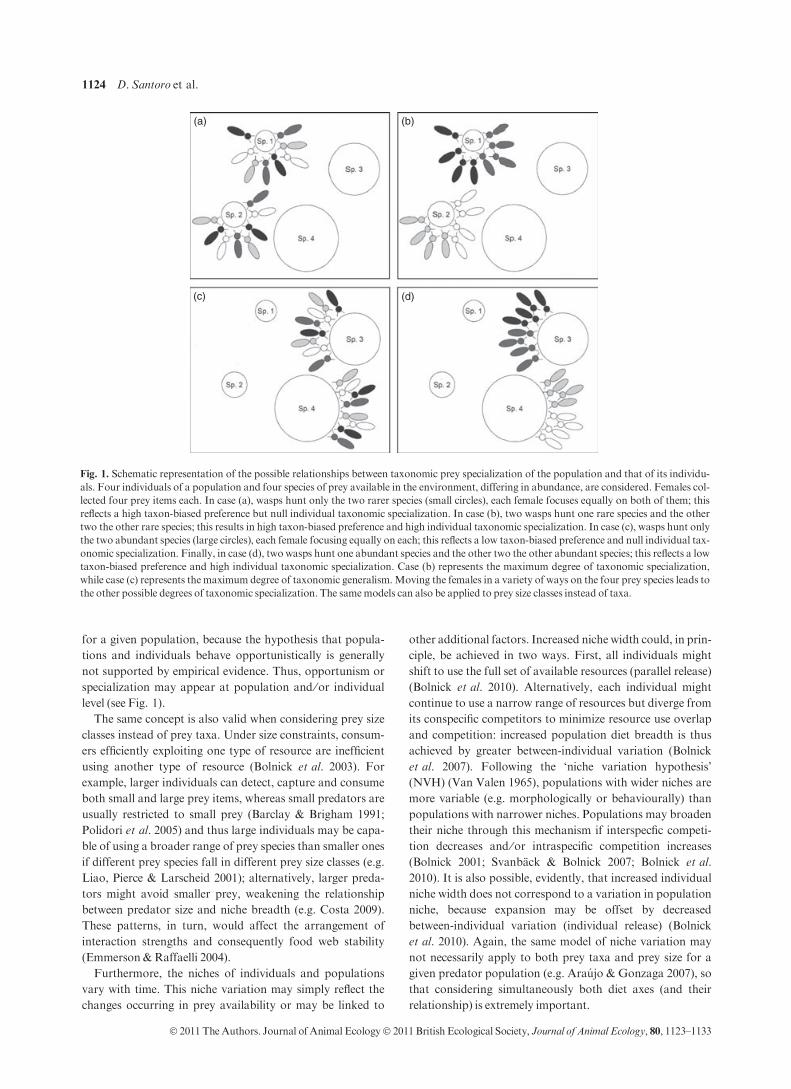
Fig. 1. Schematic representation of the possible relationships between taxonomic prey specialization of the population and that of its individu-
als. Four individuals of a population and four species of prey available in the environment, differing in abundance, are considered. Females col-
lected four prey items each. In case (a), wasps hunt only the two rarer species (small circles), each female focuses equally on both of them; this
reflects a high taxon-biased preference but null individual taxonomic specialization. In case (b), two wasps hunt one rare species and the other
two the other rare species; this results in high taxon-biased preference and high individual taxonomic specialization. In case (c), wasps hunt only
the two abundant species (large circles), each female focusing equally on each; this reflects a low taxon-biased preference and null individual tax-
onomic specialization. Finally, in case (d), two wasps hunt one abundant species and the other two the other abundant species; this reflects a low
taxon-biased preference and high individual taxonomic specialization. Case (b) represents the maximum degree of taxonomic specialization,
while case (c) represents the maximum degree of taxonomic generalism.Moving the females in a variety of ways on the four prey species leads to
the other possible degrees of taxonomic specialization. The samemodels can also be applied to prey size classes instead of taxa.
1124 D. Santoro et al.
� 2011 TheAuthors. Journal of Animal Ecology� 2011 British Ecological Society, Journal of Animal Ecology, 80, 1123–1133

This theoretical framework gives rise to some fundamental
questions: (1) How does individual-level specialization for
prey taxa and size interact and shape population-level selec-
tivity? (2) Do unpredictable interactions between prey taxa
and size lead to different mechanisms of niche variation in
time? (3) Do changes in environmental availability of prey
taxa and the environmental distribution of prey size account
for such mechanisms? To try to answer to these questions, a
grasshopper-hunting predatory wasp was used as a model
species.
Materials andmethods
STUDY ORGANISM AND STUDY AREA
Stizus continuus (Klug) (Hymenoptera: Apoidea: Crabronidae)
(Fig. 2) is a Mediterranean digger wasp; females dig multicellular
nests and hunt orthopterans to feed their offspring (Polidori et al.
2009). Stizus continuus, like most digger wasps (O’Neill 2001), is a
central-place forager, nesting in dense aggregations and hunting for a
single insect order, which allowmany prey to be collected easily from
wasps’ nests. Moreover, females of Apoidea generally collect
resources at relatively short distances from their nesting sites (Green-
leaf et al. 2007), thus sampling potential prey from the environment
around nests is reasonably easy. These characteristics make S. con-
tinuus a goodmodel to investigate patterns of resource specialization.
Data were collected in the area of ‘Mallada Llarga’ at ‘Dehesa del
Saler’, in the ‘Parque Natural de l’Albufera’ (Valencia, Spain). Small,
thick bushes of Salicornia ramosissima (J. Woods) and Sarcocornia
fruticosa (L.), large patches of Juncus maritimus Lam. and Phrag-
mites australis Cav. as well as groves of Pinus maritimus (Morgan)
cover most of the study area (see also Polidori et al. 2009). A large
nest aggregation of S. continuus (about 200 m2 in total extension, see
also Polidori et al. 2008) was chosen for the study. At this location,
S. continuus is bivoltine, with generations partially overlapping
(Polidori et al. 2008).
The field work was conducted during the summer of 2007, between
8 July and 4 September, spanning the nesting activity of both genera-
tions (Polidori et al. 2008). In 2007, a series of rain storms clearly sep-
arated the activity of the two generations, interrupting the activity of
the first generation (active until 4 August) and shifting the emergence
of the individuals of the second generation (active after 12 August).
PREY COLLECTION AND SURVEY OF WASP ACTIV ITY
Eighty-eight females of S. continuus (42 from the first generation and
46 from the second generation) were captured with an entomological
net, marked with nontoxic, soft felt-tip pens (Unipaint marker; Mits-
ubishi Pencil Co., Tokyo, Japan), weighed with an Ohaus Navigator
field balance (to the nearest 0Æ002 g) and then released.
To obtain prey, marked females carrying grasshoppers were re-
captured and, once deprived of the prey, released. No more than one
prey item from the same individual was collected per hour. The prey
were weighed immediately after collection, placed in closed test tubes
and frozen. Subsequently, they were identified following the keys of
Clemente, Garcia & Presa (1987) and by comparisons with a previous
collection made in the same area (Polidori et al. 2009). A total of 479
prey items were taken from 77 wasps, 1–20 (6 ± 5 on average) per
wasp.
To evaluate a possible effect of intraspecific competition on indi-
vidual specialization, we needed a measure of wasp density. To
achieve this, over 37 days during the study period, we made 5-min
counts of the number of active nests (i.e. in course of provisioning) in
four patches (1 m2) randomly fixed in the wasps’ aggregation and
then obtained a simple measure of wasp activity density
(AD = mean number of active nests per patch). On the whole, the
patches were randomly surveyed 529 times.
SAMPLING OF ORTHOPTERA IN THE ENVIRONMENT
Sampling of the orthopterans in the environment was performed over
42 days. One ten-minute, nonlinear transect was carried out each
hour from 9Æ00 to 17Æ00 (solar hours) in a radius of about 500 m
around the aggregation, intersecting ecologically different patches
(e.g. open areas, Sarcorcornia bushes), based on previous collections
in the same area (Polidori et al. 2009 and unpublished data).
Sweep net sampling and visual searches were performed to capture
the grasshoppers, according to common protocols (Evans, Roger &
Opferman 1983; Badih et al. 1997). Considering the habitat type and
biological traits of the target taxa (e.g. low mobility), we believe
abundance provides a reasonable estimation of availability (Johnson
1980).
Each sampled grasshopper was associated with one of the follow-
ing microhabitats: (i) ground, leaf litter and short grass –< 20 cm in
height, (ii) tall grass, shrubs, trees. In total, 705 grasshoppers from
174 transects were collected.
The orthopterans were weighed and identified as described earlier.
The vast majority (96%) of the orthopterans could be identified at
generic level, and in the analysis, we refer to this taxonomic level.
However, because nomore than one species per genus was found (see
Results and Table S2), we concluded that the probability of having
collected individuals of more than one species per genus was very low
(see also Polidori et al. 2009).
DATA ANALYSIS
To evaluate the role of prey size on wasp selectivity, we estimated
the load-lifting capacity of the wasps. For each wasp, using the
Fig. 2. A marked female of S. continuus carrying its paralysed prey
(Heteracris littoralis adult male).
Mechanisms of niche width expansion in a predatory wasp 1125
� 2011 TheAuthors. Journal ofAnimal Ecology� 2011 British Ecological Society, Journal of Animal Ecology, 80, 1123–1133

previously published regression of flight muscle mass on body mass
for S. continuus (Polidori et al. 2009) and through the equation pro-
vided by Marden (1987), we estimated the maximum load that could
theoretically be carried in flight. We then compared these values with
the actual prey weights (Coelho & Ladage 1999). Because wasp
weight and maximum lift were normally distributed (Jarque–Bera
test: 0Æ7 < JB<1Æ4, 0Æ5 < P < 0Æ8) but variances were not homoge-
neous, the Aspin–Welch test was used instead of the Student’s t-test
to compare wasp weights and theoretical maximum loads between
generations.
Because intraspecific competition could affect interindividual prey
overlap (see Introduction), a rough measure of orthopteran density
(OD) was calculated as the ratio between the number of collected
individuals and the number of transects, and this was divided by
wasp AD (OD ⁄AD). This roughly estimated how much prey were
available per wasp and hence the level of competition. AD was cal-
culated for 37 days and OD for 26 days; both measures were
obtained simultaneously for 22 days. We then regressed OD ⁄ADagainst dates to evaluate its temporal variation. To verify whether
AD and OD varied between generations, the Mann–Whitney U-test
was used.
MEASURING GENERATION-LEVEL SELECTIV ITY BY
ENVIRONMENTAL AVAILABIL ITY
A contingency table was built to test for prey taxon selectivity, com-
paring the observed number of individuals per genus stolen from the
wasps with the expected ones, i.e. by multiplying, for each genus, the
total number of prey by the proportion belonging to that genus of the
total sampled in the environment (Polidori et al. 2009).
The relative selectivity of the two wasp generations for each prey
genus was quantified using the standardized residual (SR = (ob-
served-expected) ⁄ expected1 ⁄ 2). To test whether wasps hunt the com-
mon genera at disproportionate rates compared with others (i.e. they
form search images while hunting), SR for the genera was plotted
against their frequencies in the environmental sample and a Pearson’s
correlation test was performed. The overlap between the generation-
level niche and the orthopteran communitywas estimated bymeasur-
ing the sample similarity between the frequency distribution of gen-
era used and that of genera in the environment (Czekanowsky’s
proportional similarity index, PS) (Hurlbert 1978; Feinsinger &
Spears 1981) (Table S1).
As comparing prey selectivity between generations can reflect
either prey growing into size refuges, or wasps changing their prey
taxon preferences without regard to size, we considered size-specific
selectivity, i.e. by breaking down each of the three most abundant
genera (the smaller sample size of the other ones prevented the split in
size classes) into four size classes; we then compared prey and envi-
ronmental sample frequencies for each size class with a contingency
table, as described earlier. Size classes were as follows: 1–50, 51–100,
101–200 and> 200 mg.We calculated the generation-level total var-
iance in weight distribution both for prey (TNW, see below) and for
environmental sample (Table S1). Comparisons of such variances
were performed with the F-test. The relative effects of period of col-
lection (generation), the type of sample (prey or environment), the
genus and the interactions between these factors on the variance of
orthopteran weight were tested by an anova. Mean weight was sub-
tracted from each weight (mean-centring, see e.g. Aiken & West
(1991)) to achieve normality (Jarque–Bera test: JB = 5Æ7, n = 1086,
P = 0Æ06).A contingency table was built for each generation to test for habi-
tat preference in the different genera of the grasshoppers, comparing
the observed frequencies in each habitat with the expected ones, with
reference to general abundance in different habitats.
MEASURING THE GENERATION-LEVEL NICHE WIDTH
Niche width for prey taxawasmeasured with Levins’D index (Levins
1968), which estimates how wide the niche is, taking into account the
relative use of the different resources (Table S1).
To compare the niche width (D) between generations, 10 000 non-
parametric bootstrap re-samplings were generated for each one,
using the NicheWidth program (Araujo & Gonzaga 2007). If the
overlap between 2Æ5 and 97Æ5 percentiles (95% confidence limits
around D values) does not overlap, there is a significant difference
between the niche widths of the two generations. D was also calcu-
lated for the environmental sample to allow comparisons with niche
width of wasps; in this case, qj is the proportion of jth genus in the
community.
Niche width for prey weight was measured as the total variance in
weight distribution (TNW) (Table S1).
MEASURING THE INDIV IDUAL-LEVEL NICHE WIDTH AND
NICHE OVERLAP
To analyse individual diets, 43 individuals with at least four prey were
considered: this was the minimum value that guaranteed an absence
of correlation between the number of prey items and the number of
corresponding genera (r = 0Æ16, n = 43,P = 0Æ30).The similarity between the diet of the individual i and the diet of
the generation (intraspecific overlap in prey taxa) was measured with
the PS index adapted to individual-level analysis (PSi, Bolnick et al.
2002) (Table S1). The mean value of PSi (IS) expresses the average
individual specialization for a generation (Table S1). Individual
niche width (Di) for prey taxa was calculated as for the generation-
level niche width (D), but using the proportion of each resource cate-
gory in the individual diets (Levins 1968).
To measure individual specialization for prey weight, we used
Roughgarden’s index (R’s I) (Roughgarden 1974) for continuous
data (Bolnick et al. 2002) (Table S1); this index is based on the
within-individual component and the between-individual component
of the total niche width (TNW = WIC + BIC) (Table S1). A para-
metric correlation test (Pearson) was used to look for significant lin-
ear associations between the size of the wasps and the mean size of
prey and between the size of the wasps and the coefficient of prey
weight variation (CV = standard deviation ⁄mean).
The indices of individual specialization (PSi and R’s I) were calcu-
lated with the IndSpec1 program (Bolnick et al. 2002). IndSpec1 uses
a nonparametric Monte Carlo procedure to generate replicate null
diet matrices drawn from the population distribution, from which P
values can be computed (Bolnick et al. 2002). Ten thousand repli-
cates in Monte Carlo bootstrap simulations were performed. Non-
parametric comparisons of Di and IS of the two generations were
tested with theMann–WhitneyU-test.
In the following text, mean values are reported ± standard
deviation.
Results
PREY SPECTRUM AND ORTHOPTERAN COMMUNITY
The orthopterans belonged to 16 genera, in six families
(Table S2). Almost all the prey and the environmental spectra
1126 D. Santoro et al.
� 2011 TheAuthors. Journal of Animal Ecology� 2011 British Ecological Society, Journal of Animal Ecology, 80, 1123–1133

were composed by Acrididae (85% and 84%, respectively)
and Pyrgomorphidae (11% and 12%, respectively); the other
families did not reach 2%. Seven genera (Calliptamus,
Acrotylus, Pyrgomorpha, Tropidopola, Sphingonotus, Anacri-
dium andHeteracris) encompassed > 95% of the total num-
ber of individuals collected (Table S2), so that in the
following analyses, we refer only to these seven genera. Most
of the grasshoppers were in the nymph stage (81%,
n = 1184), both with respect to prey (82%, n = 479) and
those collected from the environment (80%, n = 705). The
sex ratio was 1 : 1 (45% for both males and females and 10%
undetermined) for the grasshoppers in the environment, and
1Æ2 males to females in the case of prey, not differing from
1 : 1 (v2 = 2Æ06, d.f. = 1,P = 0Æ15).During the season, variations occurred in the orthopteran
community. In July, the most abundant genus wasAcrotylus;
in August, Calliptamus became the most representative
genus, Tropidopola grew in number andHeteracris appeared
(Table S2). The available prey spectrum (D) was wider in the
second generation, when othopteran density (OD) was higher
(3Æ4 ± 1Æ4, n = 76 vs. 5Æ4 ± 4Æ6, n = 88) (Mann–Whitney
U = 2369, P < 0Æ001) (Table 1). Each genus showed a sta-
tistically significant preference for one of the two habitats dis-
tinguished (Table S3). Pyrgomorpha was subject to a niche
shift between July andAugust (Table S3).
WASP ACTIV ITY
There was increased wasp activity in the aggregation during
August: the AD index of the first generation (0Æ9 ± 1Æ2,n = 265) was significantly lower than that of the second gen-
eration (2Æ0 ± 1Æ6, n = 264) (Mann–Whitney U = 2673,
P < 0Æ001). OD ⁄AD weakly decreased across the period
(r = )0Æ44, n = 22, P = 0Æ041), suggesting there was
increasing intraspecific competition in the second generation.
GENERATION-LEVEL SELECTIV ITY: PREY TAXA
The wasps appeared to be selective (Table S2). The two gen-
erations showed a different rank of preference towards the
same prey taxa (Fig. 3).Whereas in the first generationAnac-
ridium andCalliptamuswere overhunted, in the second gener-
ation, Tropidopola was preferred as prey, followed by
Anacridium and Pyrgomorpha, and Heteracris appeared
among prey. Acrotylus and Sphingonotus were significantly
ignored by both generations (Table S2, Fig. 3). Prey
belonged mostly to genera found on bushes and tall grasses
(Table S3). Wasps did not seem to form search image while
hunting, as shown by the absence of correlation between SR
and frequencies in the environment (Pearson test: first gener-
ation: r = )0Æ25, n = 10, P = 0Æ48; second generation:
r = )0Æ26, n = 11, P = 0Æ44) (the genera with null fre-
quency in the environment were excluded). Wasps of the first
generation used a narrower proportion of environmental
resources than those of the second generation (Table 1).
The niche of the second generation was significantly wider
than that of the first: there was no overlap between the confi-
dence intervals around the D measures of the first (1Æ244–2Æ377) and second (3Æ205–4Æ572) generations (Table 1).
GENERATION-LEVEL SELECTIV ITY : PREY SIZE
The weight of females of the two generations did not differ
(first generation: 176 ± 45 mg; second generation: 176 ±
42 mg) (t = 0Æ01, d.f. = 86, P = 0Æ99). Accordingly, the
maximum theoretical load was similar in the two generations
(Table S4) (first generation: 178 ± 25 mg, second genera-
tion: 185 ± 24 mg, t = )0Æ94, d.f. = 86,P = 0Æ17).Total variance in orthopteran weight in the environment
was much higher in the second generation than in the first
(Table 1), and it was significantly broader than prey size vari-
ance (TNW) for the second generation only (F407,201 = 4Æ49,P < 0Æ001). There was an increase in prey size variances
across generations (Table 1). Parallel, the first generation of
wasps used a narrower range of prey sizes than the second
one (Table 1). The analysis of variance (Goodness-of-fit:
R2 = 0Æ38; anova: F = 32Æ4, d.f.model = 20, d.f.error = 1065
P < 0Æ0001) showed that the weight of orthopterans (only
the seven most abundant genera were used) depended on the
period (grasshoppers from the second generation weighed
more than those from the first one: F = 40Æ22, SS = 10Æ57,P < 0Æ0001), from the genus (F = 3Æ2, SS = 5Æ0,P = 0Æ004) and from two interactions (type of sam-
ple · genus: F = 7Æ84, SS = 12Æ37, P < 0Æ0001; genera-
tion · genus: F = 22Æ28, SS = 29Æ29, P < 0Æ0001). In
particular, Pyrgomorpha (F = 9Æ8, P = 0Æ002), Acrotylus
(F = 10Æ3, P = 0Æ001) and Tropidopola (F = 21Æ6, P <
0Æ0001) were all smaller in the environment than among prey
(all P < 0Æ01), while Calliptamus (F = 41, P < 0Æ0001),Acrotylus (F = 11Æ7, P = 0Æ001) and Sphingonotus (F =
5Æ9, P = 0Æ015) grew significantly between July and August
(all P < 0Æ01) (Table S4). All the other interactions had no
effect on weight.
For the genus Calliptamus, strongly preferred by the first
generation overall, positive selectivity concerned only the
lower size classes, with the larger individuals being under-
represented in the diet (Fig. 3, Table S5). In the second gen-
eration, Calliptamus was, on the whole, less hunted than its
environmental abundance, and this trend was confirmed for
all the size classes (Fig. 3, Table S5). Overall, this suggests
that only smaller individuals of this prey genus were conspic-
uously used. With respect to the genus Tropidopola, wasps
preferred medium and large individuals, while smaller ones
were selected slightly less frequently (Fig. 3, Table S5). Smal-
ler individuals of Pyrgomorpha were avoided by the first gen-
eration but strongly selected by the second generation,
regardless of size (Fig. 3, Table S5).
INDIV IDUAL SPECIAL IZATION ( INTRASPECIF IC
OVERLAP) : PREY TAXA
Evidence of significant segregation of the prey spectrum
among individuals was found in both generations (Fig. 4,
Table 1), and the mean intraspecific overlap in prey taxa (IS)
Mechanisms of niche width expansion in a predatory wasp 1127
� 2011 TheAuthors. Journal ofAnimal Ecology� 2011 British Ecological Society, Journal of Animal Ecology, 80, 1123–1133

Table
1.Values
ofthedifferentindices
relativeto
preyuse
atpopulationandindividuallevel,andpatternsofpotentialpreycommunityin
theenvironment.Statisticsforcomparisonsbetweengenerations
are
shownwhen
possible
Numberofgenera
Nichewidth
Individualspecialization
Taxon
Weight
Taxo
nWeight
Population
Individual
Population
Individual
DPS
Di
TNW
WIC
ISR’sI
GenerationI
Prey
7,1Æ81±
0Æ98perwasp
1Æ695
0Æ343
1Æ066
±0Æ087
2869
1068
0Æ639±
0Æ281
(P<
0Æ001)
0Æ372(P
<0Æ001)
Environment
10
3Æ137
––
2444
––
–
GenerationII
Prey
8,2Æ50±
1Æ41perwasp
4Æ163
0Æ632
1Æ992
±1Æ004
7405
2794
0Æ459±
0Æ168
(P<
0Æ001)
0Æ377(P
<0Æ001)
Environment
11
4Æ236
––
29345
––
–
Statistics
Prey
Mann–Whitney
test,U
=163,
P=
0Æ09
P<
0Æ001
–Mann–Whitney
test,
U=
429,P
<0Æ001
F278,201=
0Æ414,
P<
0Æ0001
P<
0Æ001
Mann–Whitney
test,U
=354,
P<
0Æ01
–
Statistics
Environment
––
–*
–F274,407=
11Æ992,
P<
0Æ001
––
–
*Probab
ilitynotpossibleto
calculatebecau
senobootstrappossible.P
S,p
roportionalsim
ilarity.
1128 D. Santoro et al.
� 2011 TheAuthors. Journal of Animal Ecology� 2011 British Ecological Society, Journal of Animal Ecology, 80, 1123–1133

was weaker in the second generation (Table 1). The increase
in generation niche width (D) was accompanied by a propor-
tionally lower increase in individual niche width (Di)
(Table 1).
INDIV IDUAL SPECIAL IZATION: PREY SIZE
Highly significant individual specialization in prey size (R’s I)
was found in both generations (Table 1). The broader niche
width of the second generation (TNW) corresponded to a
proportional increase in the niche width of single individuals
(WIC). Thus, the two R’s I values were very similar
(Table 1).
There was a positive correlation between the weight of the
wasps and the mean weight of their prey only in the second
generation (first generation: r = 0Æ37, n = 20, P = 0Æ113;second generation: r = 0Æ68, n = 22, P < 0Æ001) (Fig. 5).Individual variance in prey weight (CV) did not increase with
wasp weight in the first (r = 0Æ11, n = 21, P = 0Æ63) or inthe second generation (r = )0Æ083, n = 22, P = 0Æ71).Moreover, in the first generation, we found no correlations
between lower or upper quartile of prey weight and wasp
weight (I quartile: r = 0Æ35, n = 21, P = 0Æ13; III quartile:r = 0Æ39, n = 21, P = 0Æ08), while for the second genera-
tion, we found a weak increase in the lower quartile
(r = 0Æ45, n = 22, P = 0Æ04) and a strong increase in the
upper quartile (r = 0Æ89, n = 22, P < 0Æ0001) with wasp
weight. This suggests that in August, larger wasps strongly
preferred larger prey but still consumed an important
number of smaller prey.
Fig. 3. Diet preference (considering only the seven most abundant genera) of the wasps from the two generations. Here preference is measured
as standardized residuals (SR). For the three most abundant genera, selectivity was further calculated by dividing samples into size classes (see
text for further details). Ranks below the bars indicate the range ofmg for the size classes; (a):P < 0.001, (b):P < 0.01, (c):P < 0.05, no letter:
P > 0.05.
Fig. 4. Individual diet spectrum for the 43
wasps with at least four prey items.
Mechanisms of niche width expansion in a predatory wasp 1129
� 2011 TheAuthors. Journal ofAnimal Ecology� 2011 British Ecological Society, Journal of Animal Ecology, 80, 1123–1133

In the first generation, prey taken to the nest weighedmuch
less than the maximum theoretical load transportable in
flight (Table S4, Fig. 5); in contrast, in the second genera-
tion, prey taken to the nest approached the maximum theo-
retical load, and almost coincided with the mean weight of
grasshoppers available in the environment. Several wasps
even hunted for prey that exceeded their lifting capacity in
flight (Fig. 5), so they were probably forced to carry them by
walking after gliding from tall objects. In particular, Callipt-
amus prey became much larger in the second generation and
exceeded, on average, the lifting capacity of wasps
(Table S4).
Discussion
Recovering the questions addressed in the Introduction, we
first clearly found that individual specialization was strong in
the two generations, both in prey size (R’s I) and in prey taxa
(IS) and that the growing in body mass of the preferred prey
of the first generation had a major role in driving prey taxa
use in the second generation. This showed an important
effect of predator–prey size relationships on prey–taxa rela-
tionship at individual level and hence on population diet
(question 1). Second, we found that the relationship between
this strong individual specialization and niche width varia-
tion differed when considering prey size or taxa, evidencing
two distinct mechanisms of niche variation. For prey size,
individual specialization (R’s I) remained constant, while the
niche width (TNW) increased in the second generation (par-
allel release); for prey taxa, the second generation showed a
wider niche (D), together with a much weaker increase in
individual niche width and a decrease in individual prey
taxon overlap (IS) (increased among-individual variation)
(question 2). To our knowledge, this is the first time that these
two mechanisms of niche expansion were observed to occur
simultaneously in a natural population of predators. Third,
we found that although prey availability certainly accounted
for the prey spectrum, S. continuus population seemed clearly
selective, with the observed taxon-biased selectivity probably
most explained by prey distribution among habitat types
(bush species preferred over soil species) and then by prey size
distribution in the environment (question 3).
We discuss in detail these findings below, highlighting the
novel aspects of our study in relation to what is known on
prey selectionmechanisms in other predatory taxa.
POPULATION-LEVEL SELECTIV ITY AND NICHE
VARIATION
The role of prey availability in determining the prey spectrum
of S. continuus is supported by diet variation on multiple
time-scales. Prey records changed between generations and
also among years: in 2004 and 2005, Polidori et al. (2009)
studied the same population and they found that almost all
the prey belonged to the abundant genus Heteracris; in con-
trast, this genus was much rarer in 2007 and, accordingly, it
was only marginally hunted, with most of the prey belonging
to the abundant genus Calliptamus. In a single year (2007),
the abundance of Tropidopola, for example, increased across
generations and, accordingly, wasps conspicuously hunted it
late in the season. Variations in the relative abundance of
prey types accounted for a temporal variation in diet in other
wasp species (e.g. Brockmann 1985; Stubblefield et al. 1993;
Grant 2006).
Prey availability, however, only partially explain the
S. continuus diet. For example, Acrotylus was almost never
hunted in either year the wasp was studied (Polidori et al.
2009; this study), despite its high abundance. Similar patterns
of selectivity, where abundant and apparently exploitable
taxa are ignored, were also found in other wasp species and
were related to size constraints of wasps and ⁄or specializa-tion for particular ecological traits of certain prey types
(Karsai, Somogyi & Hardy 2006; Polidori et al. 2007, 2010).
Similarly, the evidence suggests that the selectivity demon-
strated by the S. continuus population is driven by: (i) strong
hunting habitat preference and (ii) functional specialization
(because of size constraints).
Fig. 5. Correlation betweenwaspweight andmean prey weight (filled
circles and bold line), and correlation between wasp weight and theo-
retical maximum load that can be lifted (empty squares and thin
lines), in the two generations. Only the 43 wasps with at least four
prey items were used. Grey arrows indicate the wasps which carried
prey, on average, larger than the maximum theoretically transport-
able in flight. The white circle in (a) refers to the outlier of the first
generation, not used in the correlation test.
1130 D. Santoro et al.
� 2011 TheAuthors. Journal of Animal Ecology� 2011 British Ecological Society, Journal of Animal Ecology, 80, 1123–1133

First, only grasshoppers living on tall grass, bushes and
shrubs were hunted, while genera living on the ground were
ignored. Only a controlled experiment would be able to assess
whether these particular hunting sites are actively selected, or
whether prey selection determines habitat use, although a
previous study supports our view. In fact, Asıs, Tormos &
Jimenez (1988) have shown that in captivity, S. continuus
females accept grasshopper species (including the ground-liv-
ingAcrotylus), which they normally do not hunt in their envi-
ronment. Thus, we suggest that habitat types are selected
prior to prey species selection. The effect of hunting habitat
selection is further suggested by the case ofPyrgomorpha: this
genus of prey did not undergo changes in environmental
abundance, but it was hunted much more frequently by the
second generation, when it was found mostly on bushes. The
microhabitat was also shown to account for most prey selec-
tivity in other wasp species: for example, Sceliphron wasps
hunt spiders living on two-dimensional webs when terrico-
lous species are more abundant (Polidori et al. 2007) and
Cerceris rubida Jurine only hunts phytophagous beetles living
in grass fields adjacent to their nesting site (Polidori et al.
2010). Thus, S. continuus could probably be considered an
‘ecological specialist’ (Ferry-Graham, Bolnick &Wainwright
2002).
Second, predator–prey size relationship accounts for selec-
tivity. Females of the second generation seemed to select the
size of prey in accordance with their own size (and thus with
their load-lifting capacity), as occurs in other wasp species
(Gwynne & Dodson 1983; Polidori et al. 2005, 2010; Karsai,
Somogyi & Hardy 2006). Furthermore, larger individuals,
although preferring larger prey, also hunted small grasshop-
pers, suggesting that S. continuus does not reject small-sized
prey, similarly to what is believed to occur in other wasp spe-
cies (Brockmann 1985; Coelho & Ladage 1999; Grant 2006).
Such relationships appeared in the second generation
because of the increase in grasshopper size (which
approached the wasps’ maximum theoretical load), while
they were absent in the first generation because the smaller
size of potential prey (well below the wasps’ maximum theo-
retical load) guaranteed their accessibility to most of the
wasps. For example, the most used prey in July, Calliptamus,
grew in size across generations and an important proportion
of individuals (see class 4 in Fig. 3) reached size refuge
(Fig. S1a). Size constraints have been shown to account for
prey shift in another grasshopper-hunting wasp species
(Brockmann 1985). On the other hand, large Tropidopola
were hunted by both generations, maybe because of their
unique body shape (elongated, slender body with short
appendices), which would not prevent its successful trans-
port (see Fig. S1 for comparison with Calliptamus). Thus,
S. continuus can also be considered a ‘functional specialist’
(Ferry-Graham, Bolnick &Wainwright 2002).
Gender and developmental stage of orthopterans did not
account for selectivity, as occurs in other wasp species (Stub-
blefield et al. 1993; Grant 2006; Polidori et al. 2007, 2010).
Hence, prey availability, size and habitat ultimately inter-
acted, leading the S. continuus population to expand its niche
across generations, both for prey taxa (D) and for prey size
(TNW).
INDIV IDUAL SPECIAL IZATION AND NICHE VARIATION
Intraspecific variation in S. continuus was among the stron-
gest ever measured in animals (Bolnick et al. 2003), including
the only two other wasp species studied in the past (Araujo &
Gonzaga 2007; Polidori et al. 2010).
Regarding prey size, the strong individual specialization in
size was correlated with the remarkable variations in size,
shown by female wasps. Size niche expanded across the two
generations through a parallel increase in individual niche
widths. Parallel release can be predicted by a number of
adaptive dynamic and quantitative genetic models, which
indicates that individuals should be driven to use the full
range of the population’s resources (Taper & Case 1985;
Ackermann & Doebeli 2004). We have shown here that
parallel release may also appear at smaller (nonevolutionary)
time-scales (e.g. across two generations) as a behavioural
response to changes in the prey community.
With respect to prey taxa, niche expanded through
increased among-individual variation, according to predica-
tions of the NVH. For another wasp species, Araujo & Gon-
zaga (2007) showed the same pattern of niche variation for
prey taxa across generations. Such a mechanism has been
found to be related to a release from interspecific competition
(ecological release) (Van Valen 1965; Svanback et al. 2008;
Bolnick et al. 2010). Alternatively, niche expansion may be
achieved through increasing intraspecific competition. This
was seen both in experimental (Bolnick 2001; Svanback &
Bolnick 2007; Tinker, Bentall & Estes 2008) and in field
studies, which estimate competition with predator density
(Svanback & Persson 2004). Limited evidence suggests that
this may be possible for S. continuus. First, a rough estimate
of how many prey are available per wasp (OD ⁄AD) weakly
decreased across generations; second, intraspecific prey-
stealing (14 cases) was recorded only in the second generation.
Conclusions
With the present results, it is possible to build a simplified
model of selective predation by S. continuus and its conse-
quences on niche variation (Fig. 6). Two females of S. con-
tinuus hunt their prey (four items each) almost only on large
bushes (sp. 3–4), avoiding nonbush species regardless of
abundance (sp.1–2) (Fig. 6a). Wasps segregate their individ-
ual diet, partially depending on their functional limits (size
constraints). This produces a low overlap of prey taxa and
size among individuals (Fig. 6b). Thus, population-level
selectivity is the result of complex interactions between indi-
vidual-level specialization for prey taxa and size. During the
season, the increase in preferred prey size and the enlarge-
ment of potential prey spectrum lead to niche expansion for
both taxa (through minimization of resource use overlap)
and size (through parallel release) (Fig. 6c,d). Thus, changes
in environmental prey availability and the environmental
Mechanisms of niche width expansion in a predatory wasp 1131
� 2011 TheAuthors. Journal ofAnimal Ecology� 2011 British Ecological Society, Journal of Animal Ecology, 80, 1123–1133

distribution of prey size interact with individual-based com-
plex behaviour, strongly influencing mechanisms of niche
variation. Factors driving niche expansion should be investi-
gated in S. continuus in greater depth through experimental
set-ups, which could control for possible confounding fac-
tors.
Acknowledgements
Thanks are due to the Town Hall of Valencia and the Generalitat Valenciana
for issuing the permits necessary to carry out this work in a Nature Reserve.
We are indebted to Marcio Araujo, Dan Bolnick and F. Andrietti, who gave
many suggestions for a draft version of the manuscript, and two anonymous
referees for the comments which improved the manuscript. J.J. Presa and
M.D. Garcıa helped with grasshopper identification, and P. Mendiola and G.
Storino with the field work. Fabiola Barraclough kindly revised the English.
The research was partially supported by grants from the Spanish Government
(CGL2006-02568) and Castilla y Leon government (SA094A09). The experi-
ments comply with current Spanish law.
References
Ackermann, M. & Doebeli, M. (2004) Evolution of niche width and adaptive
diversification.Evolution, 58, 2599–2612.
Aiken, L.S. & West, S.G. (1991) Multiple Regression: Testing and Interpreting
Interactions. Sage Publications, Newbury Park, CA.
Araujo, M.S. & Gonzaga, M.O. (2007) Individual specialization in the hunting
wasp Trypoxylon (Trypargylum)albonigrum (Hymenoptra, Crabronidae).
Behavioural Ecology and Sociobiology, 61, 1855–1863.
Asıs, J.D., Tormos, J. & Jimenez, R. (1988) Contribution to the study of the
biology of Stizus continuus (Hymenoptera: Sphecidae). Entomological News,
99, 199–206.
Badih, A., Hidalgo, J., Ballesta, M., Ruano, F. & Tinaut, A. (1997) Distribu-
tion and phenology of a community of orthoptera (Insecta) in a dune ecosys-
tem of the southeastern iberian peninsula.Zoologica Baetica, 8, 31–42.
Barclay, R.M.R. & Brigham, R.M. (1991) Prey detection, dietary niche
breadth, and body size in bats: why are aerial insectivorous bats so small?
The AmericanNaturalist, 137, 693–703.
Bolnick, D.I. (2001) Intraspecific competition favours niche width expansion in
Drosophila melanogaster.Nature, 410, 463–466.
Bolnick, D.I., Yang, L.H., Fordyce, J.A., Davis, J.M. & Svanback, R. (2002)
Measuring individual-level resource specialization.Ecology, 83, 2936–2941.
Bolnick, D.I., Svanback, R., Fordyce, J.A., Yang, L.H., Davis, J.M., Hulsey,
C.D. & Forister, M.L. (2003) The ecology of individuals: incidence and
implications of individual specialization. The American Naturalist, 161, 1–
28.
Bolnick, D.I., Svanback, R., Araujo, M.S. & Persson, L. (2007) Comparative
support for the niche variation hypothesis thatmore generalized populations
also are more heterogeneous. Proceedings of the National Academy of Sci-
ences, 104, 10075–10079.
Bolnick, D.I., Ingram, T., Stutz,W.E., Snowberg, L.K., Lau, O.L. & Paull, J.S.
(2010) Ecological release from interspecific competition leads to decoupled
changes in population and individual niche width. Proceedings of the Royal
Society of London (Series B), 277, 1789–1797.
Brockmann,H.J. (1985) Provisioning behavior of the great golden digger wasp,
Sphex ichneumoneus (L.) (Sphecidae). Journal of the Kansas Entomological
Society, 58, 631–655.
Clemente, M.E., Garcia, M.D. & Presa, J.J. (1987) Clave de los generos de salt-
amontes ibericos (Orthoptera: Caelifera). Segretariado de publicaciones e in-
tercambios centifico,Universidad deMurcia, Espana.
Coelho, J.R. & Ladage, L.D. (1999) Foraging capacity of the great golden dig-
ger wasp Sphex ichneumoneus.Ecological Entomology, 24, 480–483.
Costa, G.C. (2009) Predator size, prey size, and dietary niche breadth relation-
ships inmarine predators.Ecology, 90, 2014–2019.
Emmerson, M.C. & Raffaelli, D.G. (2004) Body size, patterns of interaction
strength and the stability of a real food web. Journal of Animal Ecology, 73,
399–409.
Evans, E.W., Roger, E.A. & Opferman, D.J. (1983) Sampling grasshoppers
(Orthoptera: Acrididae) on burned and unburned tallgrass prairie: night
trapping vs. sweeping.Environmental Entomology, 62, 1449–1454.
Feinsinger, P. & Spears, E.E. (1981) A simple measure of niche breadth. Ecol-
ogy, 62, 27–32.
Ferry-Graham, L.A., Bolnick, D.I. & Wainwright, P.C. (2002) Using func-
tional morphology to examine the ecology and evolution of specialization.
Integrative and Comparative Biology, 42, 265–277.
Futuyma, D.J. &Moreno, G. (1988) The evolution of ecological specialization.
Annual Review of Ecology and Systematics, 19, 207–233.
Grant, P.R. (2006) Opportunistic predation and offspring sex ratios of cicada-
killer wasps (Sphecius speciosusDrury).Ecological Entomology, 31, 539–547.
Greenleaf, S.S.,Williams, N.M.,Winfree, R. &Kremen, C. (2007) Bee foraging
ranges and their relationship with body size.Oecologia, 153, 589–596.
Gwynne, D.T. & Dodson, G.N. (1983) Nonrandom provisioning by the digger
wasp, Palmodes laeviventris (Hymenoptera: Sphecidae). Annals of The Ento-
mological Society of America, 76, 434–436.
Hurlbert, S.H. (1978) The measurement of niche overlap and some relatives.
Ecology, 59, 67–77.
Huseynov,E.F., Jackson,R.R.&Cross, F.R. (2008)Themeaningofpredator spe-
cialization as illustrated by Aelurillus m-nigrum, an ant-eating jumping spider
(Araneae: Salticidae) fromAzerbaijan.Behavioral Processes, 77, 389–399.
Irschick, D., Dyer, L. & Sherry, T.W. (2005) Phylogenetic methodologies for
studying specialization.Oikos, 110, 404–408.
Fig. 6. Simple model of selective predation by S. continuus and niche variation. Two females of S. continuus hunt their prey (four items each)
almost only on large bushes (sp. 3–4), avoiding nonbush species regardless of abundance (sp.1–2), and segregate their individual diet (a) (see also
Fig. 1). This produces a low overlap of prey taxa and size among individuals (b). During the season, the increase in preferred prey size, in the
potential prey spectrum, in potential prey size variance, and in intraspecific competition leads to a niche expansion for both taxa and size follow-
ing two different mechanisms. In the case of prey size, the two individuals shifted to using the full set of available resources (d), while for prey
taxa each individual continued to use a narrow range of resources but diverged from its conspecific (e).
1132 D. Santoro et al.
� 2011 TheAuthors. Journal of Animal Ecology� 2011 British Ecological Society, Journal of Animal Ecology, 80, 1123–1133

Johnson, D.H. (1980) The comparison of usage and availability measurements
for evaluating resource preference.Ecology, 61, 65–71.
Karsai, I., Somogyi, K. & Hardy, I.C.W. (2006) Body size, host choice and sex
allocation in a spider-hunting pompilid wasp. Biological Journal of the Lin-
nean Society, 87, 285–296.
Levins, R. (1968)Evolution in Changing Environments: Some Theoretical Explo-
rations. PrincetonUniversity Press, Princeton, NJ, USA.
Liao, H., Pierce, C.L. & Larscheid, J.G. (2001) Empirical assessment of indices
of prey importance in the diets of predacious fish. Transactions of the Ameri-
can Fisheries Society, 130, 583–591.
Marden, J.H. (1987)Maximum lift production during takeoff in flying animals.
Journal of Experimental Biology, 130, 235–258.
O’Neill, K.M. (2001) Solitary Wasps: Behaviour and Natural History. Cornel
University Press, Ithaca, NY,USA.
Polidori, C., Boesi, R., Isola, F. & Andrietti, F. (2005) Provisioning patterns
and choice of prey in the digger waspCerceris arenaria (Hymenoptera: Crab-
ronidae): the role of prey size. European Journal of Entomology, 102, 801–
804.
Polidori, C., Federici, M., Pesarini, M. & Andrietti, F. (2007) Factors affecting
spider prey selection by Sceliphron mud-dauber wasps (Hymenoptera:
Sphecidae) in northern Italy.Animal Biology, 57, 11–28.
Polidori, C., Mendiola, P., Asıs, J.D., Tormos, J., Selfa, J. & Andrietti, J.
(2008) Inter-attraction influences nest establishment in the digger wasp Sti-
zus continuus (Hymenoptera: Crabronidae). Animal Behaviour, 75, 1651–
1661.
Polidori, C., Mendiola, P., Asıs, J.D., Tormos, J., Garcia, M.D. & Selfa, J.
(2009) Predatory habits of the grasshopper-hunting wasp Stizus continuus
(Hymenoptera: Crabronidae): diet preference, predator-prey size relation-
ships and foraging capacity. Journal of Natural History, 43, 2985–3000.
Polidori, C., Gobbi, M., Chatenaud, L., Santoro, D., Montani, O. & Andrietti,
F. (2010) Taxon-biased diet preference in the ‘generalist’ beetle-hunting wasp
Cerceris rubida provides insights on the evolution of prey specialization in
apoid wasps.Biological Journal of the Linnean Society, 99, 544–558.
Roughgarden, J. (1974) Niche width: biogeographic patterns amongAnolis liz-
ard populations.The AmericanNaturalist, 108, 429–442.
Stubblefield, J.W., Seger, J., Wenzel, W. & Heisler, M.M. (1993) Temporal,
spatial, sex-ratio and body-size heterogeneity of prey species taken by the
beewolf Philanthus sanbornii (Hymenoptera: Sphecidae). Philosophical
Transactions of the Royal Society of London (Series B), 339, 397–423.
Svanback, R. & Bolnick, D.I. (2007) Intraspecific competition drives increased
resource use diversity within a natural population. Proceedings of the Royal
Society of London (Series B), 274, 839–844.
Svanback, R. & Persson, L. (2004) Individual diet specialization, niche width
and population dynamics: implications for trophic polymorphism. Journal
of Animal Ecology, 73, 973–982.
Svanback, R., Eklov, P., Fransson, R. & Holmgren, K. (2008) Intra-specific
competition drives multiple species trophic polymorphism in fish communi-
ties.Oikos, 117, 114–124.
Taper, M.L. & Case, T.J. (1985) Quantitative genetic models for the coevolu-
tion of character displacement.Ecology, 66, 355–371.
Tinker, M.T., Bentall, G. & Estes, J.A. (2008) Food limitation leads to behav-
ioral diversification and dietary specialization in sea otters. Proceedings of
the National Academy of Sciences, 2, 560–565.
Van Valen, L. (1965) Morphological variation and width of ecological niche.
The AmericanNaturalist, 99, 377–390.
Received 28May 2010; accepted 9May 2011
Handling Editor: Frank van Veen
Supporting Information
Additional Supporting Information may be found in the online
version of this article.
Table S1. Indices used in the analysis.
Table S2.Number of individuals of orthopterans collected (and iden-
tified at least at the generic level) from the environment (E) and
among wasp prey (P) during the activity of the two generations (first
generation: I; second generation: II), and statistical differences
between frequencies (only if sample size adequate). In brackets the
collected species for each genus are shown.
Table S3. Number of individuals of grasshoppers of the seven most
hunted genera collected in the two different habitats considered, and
statistical differences between frequencies (only if sample size
adequate).
Table S4. Mean weight ± SD (mg) of orthopterans collected from
the environment (E) and among wasp prey (P), and the theoretical
maximum lift (Max lift) of wasps which hunted for each genus,
during the activity of the two generations (first generation: I; second
generation: II).
Table S5.Number of individuals of the three most abundant orthop-
teran genera per size class collected from the environment (E) and
among wasp prey (P) during the activity of the two generations (first
generation: I; second generation: II), and statistical differences
between frequencies.
Fig. S1. Pictures showing the very different body shapes of two
abundantly grasshopper genera. (a) Tropidopola, (b) Calliptamus
(lateral and dorsal view).
As a service to our authors and readers, this journal provides
supporting information supplied by the authors. Such materials may
be reorganised for online delivery, but are not copy-edited or typeset.
Technical support issues arising from supporting information (other
thanmissing files) should be addressed to the authors.
Mechanisms of niche width expansion in a predatory wasp 1133
� 2011 TheAuthors. Journal ofAnimal Ecology� 2011 British Ecological Society, Journal of Animal Ecology, 80, 1123–1133
Related Documents