Complex Evolutionary Dynamics in Simple Genomes: The Paradoxical Survival of Intracellular Symbiotic Bacteria Christina Toft Thesis submitted to the The University of Dublin for the degree of Doctor of Philosophy Supervised by Dr. Mario A. Fares Department of Genetics Trinity College University of Dublin 2008

Welcome message from author
This document is posted to help you gain knowledge. Please leave a comment to let me know what you think about it! Share it to your friends and learn new things together.
Transcript

Complex Evolutionary Dynamics in Simple Genomes:The Paradoxical Survival of Intracellular Symbiotic
Bacteria
Christina Toft
Thesis submitted to theThe University of Dublin
for the degree of
Doctor of Philosophy
Supervised by Dr. Mario A. Fares
Department of GeneticsTrinity College
University of Dublin
2008


Declaration
This thesis is submitted by the undersigned for the degree of Doctor of Philosophy at the Uni-
versity of Dublin and has not previous been submitted as an exercise for a degree at this, or any
other University. Except where otherwise stated, the work described herein has been carried out by
the author alone. This thesis may be borrowed or copied upon request with the permission of the
Librarian, University of Dublin, Trinity College.
Christina Toft
Trinity College, University of Dublin
October 2008
i


Summary
Symbiosis is one of the ways in which nature has been able to generate biological innovation
by fusing two organisms with di!erent complexities. Because of these di!ering complexities, many
problems for both organisms had to be overcome to succeed in their biological marriage, including
their metabolic communication and the coupling of their population dynamics. An example of a suc-
cessful co-living is best represented by the relationship between strict endo-cellular symbiotic bacteria
and insects, such as the case of symbionts of aphids and those of carpenter ants. Due to their inter-
generational transmission dynamics, these bacteria present high mutational load, downsized genomes
and unstable proteomes. Despite this the symbiotic relationships between these organisms have sur-
vived for tens of millions of years. However, the mechanism underlying this survival remains an
evolutionary puzzle.
In this thesis a comprehensive whole genome comparative analysis was carried out between intra-
cellular symbionts of insects and their close free-living relatives. To achieve an exhaustive comparative
genomics analysis pre-existing and novel tools were used to investigate the evolutionary dynamics of
endosymbionts and quantify the shift in the selection-drift balance. To contribute to the understanding
of the evolutionary mechanisms enabling the survival of endosymbiosis, extensive evolutionary anal-
yses were conducted on di!erent phenomena as yet poorly examined. The main questions that this
thesis aimed at answering were: How did mutations accumulate in endosymbiotic bacterial genomes?
What are the evolutionary rules these mutations follow? What is the selective mechanism(s) whereby
selection counteracted the destabilising e!ects of slightly deleterious mutations? Deciphering the main
genome dynamics, the evolution of redundancy, divergence and reshaping of the mutational and func-
tional landscapes, the role of structural constraints and the interaction between mutations’ e!ects
have been among the key points addressed in this thesis.
Contradictary to the believe of the scientific community, the main finding of this theses is that mu-
tations are not fixed randomly in endosymbiotic bacterial proteins despite their stochastic emergence
but rather follow a clear evolutionary pattern devoted to the physico-chemical and thermodynamic
rules of nature. Endosymbiotic bacteria are not exempt from following selection rules observed in
free-living organisms, this is for example observed with the strong signal of translational robustness
of genes which carry out important and fundamental cellular processes for the bacterium or its host.
The adaptation of the endosymbiotic bacteria to their new environment has created new require-
ments such as export of metabolites from the bacterium to the host. This could be possible by re-use
of existing biological material instead of inventing new material previously dedicated to cell motility.
This thesis shows that flagella genes have reduced their complex proteomic apparatus to the neces-
iii

sary genes for protein export in a reverse evolution way. This reuse and/or specialisation of proteins
do not only occur with some of the flagellar genes. One of the other results in this thesis indicates
that endosymbiotic bacteria have undergone genome wide functional divergence events, fundamen-
tally a!ecting genes whose protein products in endosymbiotic bacteria are dependent not only on the
ecological requirements of the bacterium but also upon those of their host.
The population genetics conditions under which the endosymbiotic bacteria populations of insect
live have facilitated the neutral fixation by genetic drift of slightly deleterious mutations. These muta-
tions are mostly destabilising and would be doomed under strong selective pressures. Endosymbiotic
bacteria need to use other means to minimise the relative biological fitness decline of these mutations.
One of the main findings of this thesis is that endosymbiotic bacteria of insects have evolved towards
utilising two main ingenious mechanisms to ameliorate the e!ects of slightly deleterious mutations:
i) one direct mechanism provided by the ubiquitous and over-expressed heat-shock protein GroEL,
to ensure correct folding of protein despite accumulation of mildly deleterious mutations, and ii)
an indirect mechanism due to the Dobzhansy-Müller within-protein interactions between amino acid
sites, to reduce the overall fitness decline of the mutations. Evidence that endosymbiotic bacterial
proteins have evolved towards structures highly robust to mistranslation errors was also observed. In
conclusion, this thesis provides a mechanistic explanation for the successful survival of an innovative
evolutionary strategy and highlights the intricate complex evolutionary dynamics of apparently simple
organisms.
iv

Acknowledgements
First and foremost, thank you Mario for your guidance, support, inspiration, and enormous
patience throughout this project. I have enjoyed immensely learning about this exciting field of
science and your “jumpy excitement” has been a good fuel for the progress of this project.
I consider environment a fundamental factor to the “success of symbiosis” and that happened
twice, one provided by the aphid and another by my colleagues in the laboratory ;-). I have been in
an “intense social environment” where science has been the primordial engine for heated constructive
discussions with my colleagues in the lab about many fields in science “Do you agree guys :-D?”.
The concept of symbiosis has probably gained fruitful insights through this thesis thanks to good
environment in the lab and even to the turbulent episodes that have enriched our experiences and
also our way of seeing things. Because of this and many other reasons thanks to past and present
members of Mario’s lab: Jenny, Paco, Orla, Valentin, Damien, Tom, Xiaowei, David, Fran, Simon,
Aisling. Special thanks to Jenny for having a look to the chapter and correcting the DanEnglish.
A very good friend for every bioinformatician is co!ee. A good flavoured co!ee has been always
fundamental to open my eyes in the morning without mechanical help. During my co!ee sessions I
have had the luck of sharing my conversations and funny stories with my good friends, Karen and
Dee. Our tea and co!ee breaks have always been enjoyable times. Although not apparently related
to this thesis, I would definitively like to thank the co!ee shop that has have a great influence in our
performance and has greatly enhanced the “social interaction” in the lab through their great co!ee.
They say that behind a good scientist there is always a supporting hand. That was the case
of great scientists since the beginning of times and good records are compiled in books where the
relationship between extraordinary scientists and financial supporting bodies has been fundamental
to the success of discoveries and inventions. With this rather poor and modest introduction, I would
like to send special thanks to the Irish Council for Science Engineering and Technology (IRCSET)
that made the completion of this thesis possible.
Finally, I would like to devote the most important part of this acknowledgement section to thank
my grandmother for her valuable support during the years and for her encouragement and special
way of teaching me the way to fight against obstacles and di"culties. I thank her and my dad for
teaching me the way to “walk over the waters”. I would not be submitting this thesis if it had not been
for their support and believe in me. Thanks to my fiancée for supporting and for being right beside
me. Showing me the way toward the light at the end of the tunnel, especially in the most di"cult of
times.
v


To my wonderful gran
To my dad


Contents
Declaration i
Summary iii
Achnowledgements v
List of Tables xv
List of Figures xvii
Abbreviations xix
Chapter 1 Introduction 1
1.1 Symbiosis . . . . . . . . . . . . . . . . . . . . . . . . . . . . . . . . . . . . . . . . . . . 1
1.1.1 Di!erent relationships between organisms . . . . . . . . . . . . . . . . . . . . . 3
1.2 The diversity of symbiotic niches . . . . . . . . . . . . . . . . . . . . . . . . . . . . . . 5
1.2.1 Commensalism . . . . . . . . . . . . . . . . . . . . . . . . . . . . . . . . . . . . 5
1.2.2 Parasitism . . . . . . . . . . . . . . . . . . . . . . . . . . . . . . . . . . . . . . 5
1.2.3 Mutualism . . . . . . . . . . . . . . . . . . . . . . . . . . . . . . . . . . . . . . 6
1.3 Bacteriocyte-housed symbiotic bacteria of insects . . . . . . . . . . . . . . . . . . . . . 6
1.4 Endosymbionts of insects . . . . . . . . . . . . . . . . . . . . . . . . . . . . . . . . . . 10
1.5 Bacterial endosymbiosis with insects of the order Homoptera . . . . . . . . . . . . . . 12
1.5.1 Di!erent types of symbionts in aphids . . . . . . . . . . . . . . . . . . . . . . . 13
1.6 Endosymbiotic bacteria of carpenter ants . . . . . . . . . . . . . . . . . . . . . . . . . 14
1.7 Symbionts in the order Dictyoptera and others . . . . . . . . . . . . . . . . . . . . . . 15
1.8 Genomic and evolutionary dynamics of intra-cellular symbiotic bacteria of insects . . . 16
1.8.1 Genomic dynamics in endosymbiotic bacteria . . . . . . . . . . . . . . . . . . . 17
ix

1.8.2 Function, metabolism and minimum set of genes for endosymbiosis . . . . . . . 20
1.8.3 Bu!ering systems and evolutionary innovation in endosymbiotic bacteria . . . . 21
Chapter 2 Indentifying The Genome Dynamics in Endosymbiotic Bacteria of Aphids 25
2.1 Related publications . . . . . . . . . . . . . . . . . . . . . . . . . . . . . . . . . . . . . 25
2.2 Abstract . . . . . . . . . . . . . . . . . . . . . . . . . . . . . . . . . . . . . . . . . . . . 26
2.3 Introduction . . . . . . . . . . . . . . . . . . . . . . . . . . . . . . . . . . . . . . . . . . 26
2.3.1 The first hurdle – how to determine the homologs (orthologs and/or paralogs)? 27
2.3.2 Pairwise genome comparisons . . . . . . . . . . . . . . . . . . . . . . . . . . . . 29
2.3.3 Multiple genome comparisons . . . . . . . . . . . . . . . . . . . . . . . . . . . . 29
2.4 Material and methods . . . . . . . . . . . . . . . . . . . . . . . . . . . . . . . . . . . . 31
2.4.1 Genome sequences . . . . . . . . . . . . . . . . . . . . . . . . . . . . . . . . . . 31
2.4.2 Genome rearrangements . . . . . . . . . . . . . . . . . . . . . . . . . . . . . . 32
2.4.3 Conserved gene succession clusters (CGSCs) . . . . . . . . . . . . . . . . . . . 32
2.4.4 Gathering of functionally related genes . . . . . . . . . . . . . . . . . . . . . . 32
2.4.5 Intergenic DNA . . . . . . . . . . . . . . . . . . . . . . . . . . . . . . . . . . . 35
2.4.6 Implementation of GRAST . . . . . . . . . . . . . . . . . . . . . . . . . . . . . 35
2.4.7 Phylogenetic approach for multi-genome comparison . . . . . . . . . . . . . . . 35
2.4.7.1 Algorithms . . . . . . . . . . . . . . . . . . . . . . . . . . . . . . . . . 37
2.5 Sample output and discussion . . . . . . . . . . . . . . . . . . . . . . . . . . . . . . . 42
2.5.1 Genome plot . . . . . . . . . . . . . . . . . . . . . . . . . . . . . . . . . . . . . 42
2.5.2 Identifying lost, retained and non-common genes after genome reduction . . . . 42
2.5.3 Conserved gene succession cluster . . . . . . . . . . . . . . . . . . . . . . . . . 44
2.5.4 Functional categorisation of genes lost in the reduced genome . . . . . . . . . 47
2.5.5 Gathering of genes . . . . . . . . . . . . . . . . . . . . . . . . . . . . . . . . . . 48
2.5.6 Non-functional intergenic (junk) DNA . . . . . . . . . . . . . . . . . . . . . . . 49
2.6 Conclusion . . . . . . . . . . . . . . . . . . . . . . . . . . . . . . . . . . . . . . . . . . 50
2.7 Acknowledgements . . . . . . . . . . . . . . . . . . . . . . . . . . . . . . . . . . . . . . 51
Chapter 3 The Evolution of a ‘Redundant’ Pathway: The Flagellar Assembly Path-
way 53
3.1 Related publications . . . . . . . . . . . . . . . . . . . . . . . . . . . . . . . . . . . . . 53
3.2 Abstract . . . . . . . . . . . . . . . . . . . . . . . . . . . . . . . . . . . . . . . . . . . . 53
3.3 Introduction . . . . . . . . . . . . . . . . . . . . . . . . . . . . . . . . . . . . . . . . . . 54
x

3.4 Material and methods . . . . . . . . . . . . . . . . . . . . . . . . . . . . . . . . . . . . 57
3.4.1 Genomes, genes and alignments . . . . . . . . . . . . . . . . . . . . . . . . . . 57
3.4.2 Analysis of evolutionary rates . . . . . . . . . . . . . . . . . . . . . . . . . . . 58
3.5 Results and discussion . . . . . . . . . . . . . . . . . . . . . . . . . . . . . . . . . . . . 59
3.5.1 Di!erential loss of flagellar genes in endosymbiotic bacteria . . . . . . . . . . . 59
3.5.2 Di!erential selective pressures among flagellar genes . . . . . . . . . . . . . . . 62
3.6 Acknowledgements . . . . . . . . . . . . . . . . . . . . . . . . . . . . . . . . . . . . . . 67
Chapter 4 Functional Divergence Followed the Establishment of Endocellular Sym-
biosis in Insects 69
4.1 Related publications . . . . . . . . . . . . . . . . . . . . . . . . . . . . . . . . . . . . . 69
4.2 Abstract . . . . . . . . . . . . . . . . . . . . . . . . . . . . . . . . . . . . . . . . . . . . 69
4.3 Introduction . . . . . . . . . . . . . . . . . . . . . . . . . . . . . . . . . . . . . . . . . . 70
4.4 Material and methods . . . . . . . . . . . . . . . . . . . . . . . . . . . . . . . . . . . . 72
4.4.1 Genomes and alignments . . . . . . . . . . . . . . . . . . . . . . . . . . . . . . 72
4.4.2 Characterisation of selective constraints in endosymbiotic genomes . . . . . . . 73
4.4.3 Identification of functional divergence . . . . . . . . . . . . . . . . . . . . . . . 74
4.4.4 Metabolic data . . . . . . . . . . . . . . . . . . . . . . . . . . . . . . . . . . . . 76
4.4.5 Statistical analyses . . . . . . . . . . . . . . . . . . . . . . . . . . . . . . . . . . 76
4.5 Results . . . . . . . . . . . . . . . . . . . . . . . . . . . . . . . . . . . . . . . . . . . . . 76
4.5.1 Di!erential selective constraints in endosymbiotic genomes . . . . . . . . . . . 77
4.5.2 Di!erential functional enrichment in highly constrained genes in endosymbiontic
bacteria . . . . . . . . . . . . . . . . . . . . . . . . . . . . . . . . . . . . . . . . 78
4.5.3 Heterogeneous functional divergence among functional categories in endosym-
bionts . . . . . . . . . . . . . . . . . . . . . . . . . . . . . . . . . . . . . . . . . 80
4.5.4 Functional divergence in the endosymbioic metabolic pathways . . . . . . . . . 81
4.6 Discussion . . . . . . . . . . . . . . . . . . . . . . . . . . . . . . . . . . . . . . . . . . . 86
Chapter 5 The Role of Translational Robustness in the Evolution of Buchnera aphidi-
cola 91
5.1 Related publications . . . . . . . . . . . . . . . . . . . . . . . . . . . . . . . . . . . . . 91
5.2 Abstract . . . . . . . . . . . . . . . . . . . . . . . . . . . . . . . . . . . . . . . . . . . . 91
5.3 Introduction . . . . . . . . . . . . . . . . . . . . . . . . . . . . . . . . . . . . . . . . . . 92
5.4 Materials and methods . . . . . . . . . . . . . . . . . . . . . . . . . . . . . . . . . . . . 94
xi

5.4.1 Gene and genome sequences . . . . . . . . . . . . . . . . . . . . . . . . . . . . . 94
5.4.2 Identification of orthologs . . . . . . . . . . . . . . . . . . . . . . . . . . . . . . 94
5.4.3 Measurement of expression levels . . . . . . . . . . . . . . . . . . . . . . . . . . 94
5.4.4 Estimating evolutionary rates . . . . . . . . . . . . . . . . . . . . . . . . . . . . 95
5.4.5 Constructing sub-alignments with unpreferred codons . . . . . . . . . . . . . . 96
5.4.6 Statistical analyses . . . . . . . . . . . . . . . . . . . . . . . . . . . . . . . . . . 96
5.5 Results . . . . . . . . . . . . . . . . . . . . . . . . . . . . . . . . . . . . . . . . . . . . 97
5.5.1 Expression levels correlate with evolutionary rates in B. aphidicola . . . . . . . 97
5.5.2 Evolutionary rates in B. aphidicola are under structural constraints . . . . . . 99
5.5.3 Translational robustness determines the evolution of B. aphidicola . . . . . . . 100
5.5.4 Heterogeneous translational robustness among functional categories in B. aphidi-
cola . . . . . . . . . . . . . . . . . . . . . . . . . . . . . . . . . . . . . . . . . . 100
5.5.5 The magnitude of translational robustness is lineage dependent . . . . . . . . . 101
5.6 Discussion . . . . . . . . . . . . . . . . . . . . . . . . . . . . . . . . . . . . . . . . . . . 103
5.7 Acknowledgements . . . . . . . . . . . . . . . . . . . . . . . . . . . . . . . . . . . . . . 106
Chapter 6 Dobzhansky-Müller Amino Acid Sites Interact to Ameliorate Müller’s
Ratchet E!ects in Buchnera aphidicola 107
6.1 Related publications . . . . . . . . . . . . . . . . . . . . . . . . . . . . . . . . . . . . . 107
6.2 Abstract . . . . . . . . . . . . . . . . . . . . . . . . . . . . . . . . . . . . . . . . . . . . 107
6.3 Introduction . . . . . . . . . . . . . . . . . . . . . . . . . . . . . . . . . . . . . . . . . . 108
6.4 Material and methods . . . . . . . . . . . . . . . . . . . . . . . . . . . . . . . . . . . . 110
6.4.1 Genome sequences . . . . . . . . . . . . . . . . . . . . . . . . . . . . . . . . . . 111
6.4.2 Identifying orthologs . . . . . . . . . . . . . . . . . . . . . . . . . . . . . . . . . 111
6.4.3 Identifying protein crystall structures . . . . . . . . . . . . . . . . . . . . . . . 112
6.4.4 Estimating evolutionary rates and propensity for fast evolution . . . . . . . . . 112
6.4.5 Identifying slightly deleterious mutations (SDMs) . . . . . . . . . . . . . . . . . 113
6.4.6 Identifying compensatory mutations (Dobzhansky-Müller incompatibilities: DMI)115
6.5 Results . . . . . . . . . . . . . . . . . . . . . . . . . . . . . . . . . . . . . . . . . . . . . 115
6.5.1 Evolutionary rates correlate with atomic density . . . . . . . . . . . . . . . . . 115
6.5.2 Pervasive fixations of SDMs during the evolution of B. aphidicola . . . . . . . . 119
6.5.3 Protein clients of GroEL accumulate greater proportion of SDMs . . . . . . . . 123
6.5.4 Dobzhansky-Müller incompatibilities bu!er SDMs in B. aphidicola . . . . . . . 123
6.6 Discussion . . . . . . . . . . . . . . . . . . . . . . . . . . . . . . . . . . . . . . . . . . . 124
xii

Chapter 7 General Discussion and Conclusions 129
Appendix A Functional Categories deficed by COG 135
Appendix B Functional Divergence of Buchnera aphidicola genes 136
Appendix C The Ratio between the Intensities of Selection in the Endosymbiont
Genomes and their Free-living Cousins 149
Appendix D Codon Adaptaion Index for Buchnera aphidicola Genes 166
Appendix E Mean Atomic Density for the Genes in Buchnera aphidicola 173
Appendix F Fully Sequenced Free-living Genomes in gamma-3-proteobacteria 178
Appendix G Gene Names and their Corresponding Crystal Structures 180
xiii

xiv

List of Tables
1.1 Symbiosis in insects . . . . . . . . . . . . . . . . . . . . . . . . . . . . . . . . . . . . . 8
1.2 Genome size and AT content in fully sequenced endosymbionts. . . . . . . . . . . . . . 19
3.1 Events of gene loss among the endosymbiotic bacteria of aphids in the flagellar assembly
parthway . . . . . . . . . . . . . . . . . . . . . . . . . . . . . . . . . . . . . . . . . . . 61
3.2 Analysis of functional divergence in flagellar genes in the endosymbiont of B. aphidicola. 65
4.1 Increments of selective constraints in endosymbiotic bacteria of insects . . . . . . . . . 77
4.2 Distribution of constrained genes in endosymbiotic bacteria of aphids and carpenter
ants among the functional categories . . . . . . . . . . . . . . . . . . . . . . . . . . . . 79
4.3 Functional divergence analysis in the metabolic pathways of B. aphidicola and Blochman-
nia endosymbionts . . . . . . . . . . . . . . . . . . . . . . . . . . . . . . . . . . . . . . 84
5.1 Correlation between CAI and nucleotides substitutions . . . . . . . . . . . . . . . . . . 98
5.2 Correlation between CAI and rate of protein evolution . . . . . . . . . . . . . . . . . . 101
5.3 Lineage specific correlation between CAI and proteins evolutionary rates . . . . . . . . 103
6.1 Correlation between atomic density and evolutionary rate for di!erent divergence levels 116
6.2 Slope of the curves from the comparison between atomic density and evolutionary rate 118
A.1 Functional Categories deficed by the Cluster of Orthologous Groups (COG) . . . . . . 135
B.1 Analysis of functional divergence in genes of the endosmbiont of B. aphidicola . . . . . 136
C.1 The ratio between the intensities of selection in the endosymbiont genomes and their
free-living cousins . . . . . . . . . . . . . . . . . . . . . . . . . . . . . . . . . . . . . . . 149
D.1 Codon adaptation Index for genes in Buchnera aphidicola . . . . . . . . . . . . . . . . 166
xv

E.1 Mean atomic density for the genes in Buchnera aphidicola . . . . . . . . . . . . . . . . 173
F.1 Fully sequenced free-living genomes in gamma-3-proteobacteria . . . . . . . . . . . . . 178
G.1 Gene names and their corresponding crystal structures . . . . . . . . . . . . . . . . . . 180
xvi

List of Figures
1.1 Degree of intimacy between co-habiting organisms in a symbiotic relationship . . . . . 2
1.2 Terminology to define relationships between co-living organisms . . . . . . . . . . . . . 3
1.3 Phylogenetic co-evolution between endosymbiotic bacteria of aphids and their insects’
hosts . . . . . . . . . . . . . . . . . . . . . . . . . . . . . . . . . . . . . . . . . . . . . . 14
1.4 Increment of mutational load in B. aphidicola symbionts by Müller’s ratchet . . . . . . 20
2.1 Gene rearrangements in the endosymbiont genome identified by GRAST . . . . . . . . 33
2.2 Flow-chart of GRAST with all the options requested by the user . . . . . . . . . . . . 36
2.3 Branch specific gene events . . . . . . . . . . . . . . . . . . . . . . . . . . . . . . . . . 40
2.4 Branch specific conserved gene succession cluster (CGSC) . . . . . . . . . . . . . . . . 41
2.5 Plot of the orthologous gene pairs generated by GRAST . . . . . . . . . . . . . . . . . 42
2.6 Common and non-common genes figures created by GRAST . . . . . . . . . . . . . . . 43
2.7 Phylogenetic gene events and CGSC for the four B. aphidicola . . . . . . . . . . . . . 45
2.8 Conserved Gene Succession Clusters produced by GRAST . . . . . . . . . . . . . . . . 46
2.9 Reduction in functional categories graphically represented by GRAST . . . . . . . . . 48
2.10 Junk DNA graphically represented by GRAST . . . . . . . . . . . . . . . . . . . . . . 49
3.1 Schematic diagram of the bacterial flagellar assembly pathway, excluding the bacteria
chemotaxic pathway . . . . . . . . . . . . . . . . . . . . . . . . . . . . . . . . . . . . . 60
3.2 Schematic representation of events of gene loss or functional divergence for the flagellar
assembly pathway in aphids’ endosymbionts. . . . . . . . . . . . . . . . . . . . . . . . 63
3.3 Comparative genomic analysis of selective constraints between endosymbiotic bacteria
and their free-living relatives . . . . . . . . . . . . . . . . . . . . . . . . . . . . . . . . 64
4.1 Identification of Functional Divergence type 1 . . . . . . . . . . . . . . . . . . . . . . . 75
xvii

4.2 Constraints operating in endosymbiotic bacteria of insects in comparison to free-living
bacteria . . . . . . . . . . . . . . . . . . . . . . . . . . . . . . . . . . . . . . . . . . . . 78
4.3 Distribution of highly constrained genes among the functional categories in B. aphidi-
cola and Blochmannia . . . . . . . . . . . . . . . . . . . . . . . . . . . . . . . . . . . . 80
4.4 Distribution of genes under functional divergence among the functional categories in B.
aphidicola and Blochmannia . . . . . . . . . . . . . . . . . . . . . . . . . . . . . . . . . 81
4.5 Distribution of genes under functional divergence among the metabolic pathways . . . 83
5.1 Correlation of nucleotide substitutions and codon adaptation index in Escherichia coli 98
5.2 Variation of correlation of CAI and dNe between di!erent proteins’ functional classes . 102
6.1 Identification of slightly deleterious mutations . . . . . . . . . . . . . . . . . . . . . . . 114
6.2 Idenitification of Dobzhansky-Müller incompatibilities (DMI) . . . . . . . . . . . . . . 116
6.3 Curves showing the correlation between evolutionary rate and atomic density at di!er-
ent divergence levels . . . . . . . . . . . . . . . . . . . . . . . . . . . . . . . . . . . . . 117
6.4 Distribution for the mean Poisson amino acid distance for proteins retained in B. aphidi-
cola and those lost before symbiosis . . . . . . . . . . . . . . . . . . . . . . . . . . . . 120
6.5 Distribution of slightly deleterious mutations in proteins retained in B. aphidicola and
those lost before symbiosis . . . . . . . . . . . . . . . . . . . . . . . . . . . . . . . . . . 121
6.6 Correlation between % SDM in B. aphidicola and the evolutionary rate of corresponding
proteins in free-living bacteria. . . . . . . . . . . . . . . . . . . . . . . . . . . . . . . . 122
6.7 Mean % SDM in GroEL vs. non GroEL clients . . . . . . . . . . . . . . . . . . . . . . 123
xviii

Abbreviations
BAp Buchnera aphidicola strain Acyrthosiphon pisum
BBp Buchnera aphidicola strain Baizongia pistaciae
BCc Buchnera aphidicola strain Cinara cedri
Bf Candidatus Blochmannia floridanus
BLAST basic local alignment search tool
BLOSUM blocks substitution matrix
Bp Candidatus Blochmannia pennsylvan icus
BSg Buchnera aphidicola strain Acyrthosiphon pisum
CAI codon adaptation index
CGSC conserved gene succession cluster
COG cluster of orthologous groups
CPS cellular processes and signaling
DMI Dobzhansky-Müller Incompatibilities
Ec Escherichia coli K12
Eca Erwinia carotovora
e-value expectation value
ISP information storage and processing
kb kilobase
Mbp megabase
MCSA most common symbiotic ancestor
Met metabolism
MY millions of years
MYA millions years ago
Pl Photorhabdus luminescens
RBH Reciprocal best BLAST Hits
RNA ribonucleic acid
rDNA ribosomal RNA
RSD reciprocal smallest distance algorithm
SDM Slightly deleterious mutation
Sf Shigel la flexneri
SS Candidatus Serratia symbiotica
St Salmonel la typhimurium LT2
Wg Wigglesworthia glossinidia
xix


“Discovery consists in seeing what everyone else has seen
and thinking what no one else has thought.”
Albert Szent-Gyorgyi


Chapter 1
Introduction
Earths environment has changed over billions of years at two levels, at the temporal level as
well as at the spatial level. This ever-changing environment has created the necessary pressure so
as to produce an enormous biological diversity only partially perceived by the genius of Darwin.
The great diversity on earth has not only been the result of innovation based on the emergence of
new biological material but rather the result of the continuously emerging complexity. The origin of
the eukaryotic cell through the biochemical marriage between two organisms (for example a proto-
eukaryote and a bacterium) is a demonstration of the potential o!ert that emerging complexity has on
biological innovation. Symbiosis is one of the most powerful described sources of biological innovation
and has been regarded as the main fuel for rapid evolutionary dynamism (Gray & Doolittle, 1982;
Margulis, 1991). Although the origin of eukaryotic cells is an example of the symbiosis between two
organisms taken to completion, other synergistic associations do not necessarily evolve towards such
levels but rather adopt intermediate states (see Figure 1.1). In this case, the association may allow the
“simplest” of the organisms to evolve towards generating the essential components that may provide
the “complex” organism with the capacity to colonise new ecological niches, reduce competition with
related organisms and eventually undergo reproductive isolation and reinforcement to generate a new
species. The process of symbiosis is also responsible for the generation of diversity with the final
outcome depending on profound coordinated changes on both sides of the association.
1.1 Symbiosis
The term “symbiosis” etymologically comes from the Greek term “symbios” which decomposed
means to live (bios) with (sym). This term describes the relationship between two or more di!erent
1

Chapter 1. Introduction
Figure 1.1: Degree of intimacy between co-habiting organisms in a symbiotic relationship. Symbiosiscan be established at several levels ranging between a slight dependency between the partners of therelationship, where the “simplest” organism colonises body surfaces of the more “complex” organismand strict endo-cellular lifestyle for the symbiotic organism. Metabolic and biochemical relationshipsbetween both organisms are correlated with the degree of intra-cellularity of the symbiotic partner.Degree of biological interlink between the two partners is colour coded. We assume here that thesymbiosis gets to its completion with the simplest organisms becoming an organelle of the morecomplex one. This implies that genetic flux is established between both partners of the symbioticrelationship.
species living in close physical proximity over a long period of time. It was first used in 1879 by
the German mycologist Hienrich Anton de Bary. De Bary’s definition (for a review see Sa!o, 1992)
included in principle every type of inter-organismal interaction, making no explicit distinction between
mutualistic, parasitic or commensal relationships. The only strict condition for De Bary’s organisms
association is their inextricable physical (physiological) interaction irrespective of the consequences of
such interactions for the involved species (Margulis & Fester, 1991). Although it is generally under-
stood that symbiosis can include any of the three relationships mentioned above as described in many
of the general biology books (Keeton et al., 1986; Ehrlich & Roughgarden, 1987; Howe & Westley,
1988; Wessells & Hopson, 1988; Curtis & Barnes, 1989; Begon et al., 1990; Campbell, 1990; Raven
& Johnson, 1992; Stiling, 1992), I will use symbiosis as synonymous for mutualistic relationships
throughout this thesis as adopted in many other modern books (Kormondy, 1984; Futuyma, 1986;
Odum, 1989; Ricklefs, 1990). However, to understand the di!erence between mutualistic and other
intimate associations between organisms it is imperative that I define and describe the di!erent al-
ternative outcomes when a relationship is established between two organisms with di!erent biological
complexities.
2

1.1 Symbiosis
Figure 1.2: Terminology to define relationships between co-living organisms. These relationships aredefined in terms of the benefit (for example, positive, neutral or negative) that each partner of therelationship gets. Benefit is considered here to be e!ect of the relationship on the relative biologicalfitness of the individual.
1.1.1 Di!erent relationships between organisms
Species can live in close physical relation and have no negative e!ect on one another. Alternatively,
one of the association partners can extract a biological benefit, the side e!ect do which can be harmful
for the other species. Finally, the association can be of such biochemical and metabolic intimacy that
both sides of the relationship depend on one another and hence get benefit from each other. Formally
speaking these di!erent relationships can be described as follows (see also Figure 1.2 for an overview
the association between e!ect from relationship and terminology):
Commensalism: This describes a relationship where one organism benefits from the relationship
while the other organism obtains no benefit or harm from such association.
Mutualistism: This describes the synergistic interaction or association between two organisms whose
relative biological fitness is maximised by the continuous flux of biochemical communication
between them.
Parasitism: This describes a relationship in which only one of the organisms involved in the associa-
tion benefits from it while the other organism is harmed by the side e!ects of such a relationship.
In general we can identify/define symbiosis between two organisms based on many characteristics that
are represented in every symbiotic relationship:
1. Generally symbiosis is established between a eukaryote and a unicellular organism. The latter
provides for the former via metabolic capabilities. Examples of such relationships can be repre-
sented by the relationship of algae with some animals with the algae providing photosynthetic
capacities (Clay, 1990).
3

Chapter 1. Introduction
2. The relationship between the two organisms is biotrophic.
3. Nutrient flux is bidirectional.
4. The relationship can be either symmetrically or assymmetrically mutualistic. In fact, a mutual-
istic interaction is rarely symmetric. An example where the host seems to obtain more benefit
than the microbe or symbiont is the case of aphids and their symbiotic bacteria. The sym-
biont complements the hosts diet (plant phloem) with essential amino acids. The host provides
a “stable” biochemical and physiological environment to the bacterium (Moran et al., 1993).
Other mutualistic relationships are highly biased towards the microbe. Such is the case of the
bacterium Wolbachia and the tsetse fly, that utilises the host for its reproduction and spread of
its progeny while the host does not seem to receive any reward from the association (Werren
& O’Neill, 1997). Finally, some relationships are entirely unidirectional with one of the species
providing the other by a benefit, while obtaining no apparent reward. This is the case of some
luminescent bacteria and fungi that provide the host with the food they obtain from the external
environment (for example from plants and animals) whereas they obtain no benefit in return.
This is also the case of some lichens (Honegger, 1993) that are the result of the symbiotic asso-
ciation between algae and fungi, or some mycorrizals, which form a symbiotic association with
the orchids (Smith, 1967; Alexander & Hadley, 1985).
Symbiosis between two or more organisms can occur at di!erent levels of physical contact. These
can be classified into ectosymbiosis (synonym: exosymbiosis), in which one of the species lives on the
internal or external surfaces of the other; and endosymbiosis (endocellular symbiosis) where one of
the species live within the cells of the other species. Unlike ectosymbiosis, endosymbiosis performs a
complex level of symbiosis in that the smaller organisms has to cross the di!erent barriers imposed by
the cells of the host to be able to live inside the cell. However, as I will explain in the next sections,
these barriers can be avoided through the evolution within the host of new ontogeny programs that
allow for the stable confinement of endocellular symbionts including, for example, the development of
specialised cells to house these organisms. In such case, the host becomes intimately related to the
invasive organism to such an extent that their relative biological fitness becomes seriously compro-
mised if they are deprived of one another (obligate relationship). Alternatively, the association can
be facultative and the survival of each can be possible without the other under special environmental
conditions. This is for example seen between Acyrthosiphon pisum (pea aphid) and the facultavive
endosymbionts hamiltonella defensa that acts as a protector of the aphid against parasitism by the
solitary endoparasitoids Aphidium ervi and Aphidius eadyi (Oliver et al., 2003; Ferrari et al., 2004;
4

1.2 The diversity of symbiotic niches
Bensadia et al., 2006; Degnan & Moran, 2008). Having explained briefly the di!erent types of associ-
ations, the overall question here is: What are the ecological conditions that maximise the likelihood
of each of the di!erent associations?
1.2 The diversity of symbiotic niches
1.2.1 Commensalism
Commensal derives from the Latin term ‘com mensa’, meaning sharing a table. Strict commen-
salisms only benefits one of the parties in the relationship and this is generally very unlikely since most
ecological interactions involve consequences for both organisms of the association. Nonetheless, there
are a few examples in nature that illustrate this type of relationship. For instance, in the Pherosy
relationship, one animal uses another for transportation (e.g. Pseudoscorpions use Mammals (Durden,
1991)). Inquilinism performs another example where one organism uses a second for housing (such is
the case of birds creating holes in trees). Finally, metabioisis is another type of association where an
organism takes advantage of the results of the biological activities of another organism (e.g. Hermit
crabs use the shells from dead gastropods to protect themselves).
1.2.2 Parasitism
Parasitism is one of the most di"cult relationships to define because its plasticity is dependent
upon the environmental or ecological conditions under which both organisms of the association live.
In any case, parasitism involves two organisms where one benefits from the relationships, while the
other is negatively a!ected by the biological activities of its partner. It is noteworthy that mutualistic
or commensalistic relationships can become parasitic under specific environmental or physiological
conditions. For example, the Baker’s yeast Saccharomyces cerevisiae is a unicellular eukaryote used
in di!erent biotechnological processes to produce products that are eaten daily by humans, such as
bread. Even though, this implies that yeasts are naturally harmless to humans, this association can
becomes parasitic for humans under the coditions of a compromised immune system (Tawfik et al.,
1989). Parasites can either live within the cells of their host, endoparasites, or they can live on the
surface of the host, ectoparasites. The e!ects parasites have on their host are di!erent and range
between severe e!ects where the parasite kills its host (necrotrophic), to a relationship where the
parasite may be dependent on the survival of the host to spread and hence parasitise without killing
(biotrophic).
5

Chapter 1. Introduction
1.2.3 Mutualism
Mutualistic relationships are the interaction between two organisms where both parties benefits
from one another. In mutualism, the degree and type of products provided by each one of the parties
are very diverse in nature. There are mutuatistic relationships where both parties provide a service
instead of a direct product to the other. This form of mutualism is the least common in nature and is
seen in cases such as in the relationship between goby fish and shrimp. In this association the shrimp
digs a whole in the sand, which it uses for housing but it allows the goby fish to use it as well. The
shrimp is almost blind so in return for shelter, the goby fish alerts the shrimp to danger (Thompson
et al., 2005).
Another type of mutualistic relationship is the one where one of the organisms gains benefit from
the resources provided by the other but gives a service in return. A clear example of such relationship is
seen between plants and insects, including pollenisation (for example, between the honey bee and some
flowers, the bee gets nectar and the flowers are pollinated as the bee flies from one flower to another)
and between insects (for example, between ants and aphids, where the ant feeds on a by-product
(honeydew) of the aphids diet and in return defends the aphid against predators like the ladybird).
There are other mutualistic relationships where both parties gain benefit. Mycorrhizae is an example
of this (for an overview see Allen (1991)), where a fungi grows in association with the root of plants
(leguminoses), either living on the surface of the root cells or by penetrating through the cell wall.
In this association, the plant produces carbohydrates that are utilised by the fungi while the fungi
in exchange allows the fixation of nitrogen in the plant. Another relationship between a unicellular
organism and a eukaryote is the one between the endosymbionts and insects, with the endosymbiont
being intracellular bacteria that live in an obligatory muturalistic association with their insect host. In
some cases, the association is of such a magnitude that insects have evolved developmental programs
that instigate the generation of specialised cells during their ontogeny to house these bacteria (called
bacteriocytes).
1.3 Bacteriocyte-housed symbiotic bacteria of insects
One of the most striking characteristics that defines the intimate association between the insect
host and the symbiotic microbe is the development of a special organ in the host to facilitate the mi-
crobe called the Mycetome. This organ is formed of specialised somatic cells that are generated during
the ontogeny of the insect and simultaneously infected by the symbiotic microbe. The rod-shaped
symbionts contained in these mycetomes, which were first named after the name of the discoverer
6

1.3 Bacteriocyte-housed symbiotic bacteria of insects
Blochman as Blochman body (Lanham, 1968), correspond in the today’s scientific literature to myce-
tocyte symbionts. In some cases, these somatic cells can be assembled to form a coherent body of cells
called a bacteriome (Buchner, 1965) or mycotecytes. The term mycotecytes refers to cells housing
microbes irrespective of the kind of microbe, when they contain bacteria they can be more specifically
referred to as bacteriocytes.
Bacteriocyte or mycetocyte housed symbiotic bacteria illustrate an evolutionary example of the
degree of intimacy that two biological systems with substantially di!erent complexities could achieve.
There are many examples of bacteriocyte-housed symbiotic bacteria of insects, and these have been
classified into three main insect orders (The characteristics of these endosymbiotic bacteria are shown
in Table 1.1) : order Dictioptera; order Homoptera; and order Coleoptera (Dasch et al., 1984). Fol-
lowing Margulis (1991), the establishment of endosymbiosis requires several non-mutually exclusive
steps:
1. It is necessary that both organisms that belong to di!erent species frequent the same ecological
or geographical location in order for the opportunity for the interaction to take place. This
requirement obviously imposes a tempo and mode of acquisition of one organism by another.
For example, the pre-symbiotic bacteria could be acquired if it exists already in the diet of the
host. Alternatively, the symbiont could be transmitted vertically between host’s generations.
2. Once the symbiosis has been established, the metabolic inter-link between the two organisms
becomes important. This initial metabolic inter-link will lead (as I will show in the following
research chapters) to important genomic rearrangements and dynamics that will strengthen both
the endosymbiont and the host dependencies upon one another. From this point on, the di!erent
evolutionary and ecological dynamics that both organisms will undergo will heavily depend on
the initial metabolic links between them.
3. Also important is the range of specificity between the host and the symbiont.
4. Finally, the interaction and chemical recognition of the symbiont by the host and vice versa is
fundamental for the establishment and retainment of symbiosis.
Once the symbiosis has been established, for example between an insect and a bacterium, the transmis-
sion of the symbiotic bacteria to other hosts can occur vertically or horizontally. Vertical transmission
implies that the bacterium is transmitted from the host directly to the o!spring, which implies a
clonal transmission of the bacterium. This also means that the phylogeny of the host is expected
to mirror that of the bacterium (phylogenetic co-evolution), which is the case of the aphid insects
7

Chapter 1. Introduction
Table
1.1:Sym
biosisin
insects
Suborder
Family
Diet
Symbiont
Bacteria
groupIncidenceof
bacteriaP
rimary
locatedN
utriencefor
hostR
eference
Hem
iptera(bugs,coocids,cicadas,leadhoppers,ect)
Aucherorrhyncha
Cicadellidea
(leafhoppers)
Plant
sapY
east-likeorgam
isms
Pyrenom
ycetesIn
most
speciesi
recyclingnitrogen
Nikoh
&Fukatsu,
2000H
ereopteracc(true
bugs)C
imicidae
(bedbugs)B
loodR
ickettsia-like3-proteobacteria
Universal
iC
hang&
Musgrave,1973;
Hypsa
&A
ksoy,1997
Rickettsia-like
-proteobactriai
SternorrhynchaA
phidoidea(aphids)
Plant
sapBuchnera
aphidicola(P
S)3-proteobacteria
Inm
ostspecies
i-bA
As,
vitamins
Baum
annet
al.,1995
SS-proteobacteria
i-bC
henet
al.,1996;U
nterman
etal.,
1989Rickettsia
sp.-proteobacteria
iC
henet
al.,1996Y
east-likeorganism
sP
yrenomycetes
Body
cavityFukatsu
&Ishikaw
a,1996Spiroplasm
asp.
Mollicutes
Fukatsuet
al.,1994
Aleyrodidae
(whitefly)
Plant
sapP
S-proteobacteria
-i-b
AA
s,vitam
insC
larket
al.,1992
SS-proteobacteria
iC
larket
al.,1992P
seudococcide(M
ealybugs)P
lantsap
PS
-proteobacteria-
i-bV
itamin
BM
unsonet
al.,1992
SS-proteobacteria
i-bSterols
Fukatsu&
Nikoh,
2000Spiroplasm
asp
Mollicutes
i-vP
syllidaeP
lantsap
Carsonella
ruddii(P
S)3-proteobacteria
-i-b
AA
s,vitam
insB
uchner(1965)
SS-proteobacteria
iT
haoet
al.,2000;Fukatsu
&N
ikoh,1998
8

1.3 Bacteriocyte-housed symbiotic bacteria of insects
Subor
der
Fam
ilyD
iet
Sym
bion
tB
acte
ria
grou
pIn
cide
nce
ofba
cter
iaP
rim
ary
loca
ted
Nut
rien
cefo
rho
stR
efer
ence
Bla
ttar
ia(C
ockr
oach
es) Bla
ttid
eaU
nive
rsal
ists
Bla
ttob
acte
rium
cuen
oti
Fla
vova
cter
ium
-B
acte
roid
esU
nive
rsal
i-bR
ecyc
led
N2
Ban
diet
al.,
1997
Col
eopt
era
(bee
tles
)A
deph
aga
Cur
culio
nida
e(w
eevi
ls)
stor
edgr
ain
SOP
E3-
prot
eoba
cter
iaPre
vale
ntin
Sito
philu
ssp
p.
i-bV
itam
ins
Cha
rles
etal
.,19
97
SSE
nter
obac
teri
acae
Hed
diet
al.,
1998
Sym
biot
aphr
ina
buch
neri
Dis
com
ycet
esi
Vitam
inb
and
ster
ols
Nod
a&
Kod
ama,
1996
Sym
biot
aphr
ina
koch
iD
isco
myc
etes
i
Dip
tera
(tru
efli
es)
Bra
chyc
era
Glo
ssin
idae
Ani
mal
bloo
dW
iggl
eswor
thia
(PS)
3-pr
oteo
bact
eria
Uni
vers
ali-b
Vitam
inB
Aks
oy,1
995;
Che
net
al.,
1999
Soda
lisgl
aoss
inid
ium
(SS)
-pro
teob
acte
ria
Dal
e&
Mau
dlin
,19
99
Hym
enop
tera
(bee
s,w
asps
,ant
san
dsa
wfli
es)
Apo
crita
Form
icid
ae(a
nts)
Tri
beC
ampo
notini
Pla
ntne
ctar
,ho
neyd
rew
Blo
chm
anni
a3-
prot
eoba
cter
iaU
nive
rsal
i-bA
As
Bou
rsau
x-E
ude
&G
ross
2000
Gro
upin
gof
bact
eria
into
the
di!e
rent
clad
esis
base
don
the
16S
rDN
Aph
ylog
enet
ican
alys
is.
PS,
prim
ary
sym
bion
t.SS
,se
cond
ary
sym
bion
t.Y
LS,
yeas
t-lik
esy
mbi
ont.
SOP
E,
Sito
phyl
usor
yzae
prim
ary
sym
bion
t.i,
intr
acel
lula
r(e
ndos
ymbi
ont)
.i-b
,w
ithi
nba
cter
iocy
te.
i-v,
intr
acel
lula
rw
ithi
neva
riou
stiss
ues.
e,ex
trac
ellu
lar
(ect
osym
bion
t).
AA
,am
ino
acid
.
9

Chapter 1. Introduction
and their endosymbiotic bacteria Buchnera aphidicola (Munson et al., 1991). Horizontal transmission
involves the possible transmission of the endosymbiotic bacteria to other host species. Some bacteria
can be transmitted vertically and horizontally. Unlike vertical transmission, horizontal transmission
will generate discordance between the symbiont-host phylogeny (for example, see the case of Cnidaria,
Rowan & Powers 1991).
1.4 Endosymbionts of insects
As mentioned earlier in this introduction, the primary source of biodiversity comes from the
generation of new species from the original ones. Biological innovation has also been promoted by
natural selection through the combination of species with di!erent biological complexities. Insects are
by far the most diverse of the animals. They may be found in almost all environments on the planet,
although they are less represented in the oceans. This high biodiversity is probably illustrated by the
fact that insects have colonised almost every ecological niche and have been able to feed on the most
diverse and striking of diets. This ability to colonise di!erent ecologically unexplored niches has led
to a reduced pressure of selection in new emerging insect variants and the possibility for the fixation
of new species in an environment with e!ectively little to no competition for resources. What is the
cause for such biodiversity explosion? Answering this question is anything but straightforward. It is
worth noting that insects are characterised by their striking flexibility to co-live with other species
inhabiting their external or internal body surfaces. This has created over time the possibility for
the emergence of a biological marriage between insects and other species of microbes, which has led
to a di!erent dimension of biological organisation, making possible the emergence of new ecological
capabilities.
One of the most intimate symbiotic relationships between insects and other organisms is that
established with microbes. Microbes can be located at di!erent places within the insect. Microbes can
colonise either intra-cellular or extra-cellular surfaces. Only the intra-cellular colonisation performs the
most intimate biochemical communication between insect and microbes. Regarding the extra-cellular
colonisation, microbes can colonise internal or external surfaces, without any of them involving a more
intimate chemical relationship with the host than the other. As mentioned earlier, the most intimate
relationship is the one established between the insect host and an endosymbiont that lives within
specialised cells of the insect. The intracellular microbes can either be mycetocyte symbionts, as
explained above, or may not be restricted to any specific cell type, in which case they are called ‘guest
microbes’. Unlike, strictly intra-cellular mycetocyte-housed microbes, guest microbes are maternally
10

1.4 Endosymbionts of insects
inherited but are not mutualistic because they interfere with host sexuality and reproduction to ensure
their survival (Ho!mann et al., 1986; Breeuwer & Werren, 1990). An example of such a guest microbe
is Wolbachia that infects a number of invertebrates (Werren & O’Neill, 1997).
The colossal biodiversity of insects has been possible thanks to the exploration of nutrient defi-
cient diet niches mainly supported by these intra-cellular symbionts (see Table 1.1 for an example of
nutrients provided by endosymbionts). It is thought that around 10-15% of all insects live in such sym-
biosis relationships with bacteria. Many of these relationships are obligated for both the endosymbiont,
which cannot live outside the host, and for the host that cannot survive without the endosymbiont,
or at least their fitness can be considerably reduced if deprived from one another. Experiments where
the insects were treated with antibiotics (for example, the insects became aposymbiotic) show that
deprivation of the insect of its endosymbiotic bacteria can lead to its sterility, size diminishment or
even death (Douglas, 1989). In fact, it has been shown that endosymbiotic bacteria provide their
insect hosts with essential amino acids that are lacking in their diet (Shigenobu et al., 2000; Tamas
et al., 2002; Gil et al., 2003; van Ham et al., 2003; Degnan et al., 2005; Nakabachi et al., 2006; Perez-
Brocal et al., 2006; McCutcheon & Moran, 2007), vitamins and cofactors (Shigenobu et al., 2000;
Akman et al., 2002; Tamas et al., 2002; van Ham et al., 2003; Wu et al., 2006); Nitrogen recycling
and storage (Gil et al., 2003; Degnan et al., 2005) and components essential for host fertility (Foster
et al., 2005). Further to that, experiments trying to culture endosymbiotic bacteria outside their
host have dramatically failed (Baumann & Moran, 1997). As opposed to the significant biodiversity
of the insects establishing symbiotic relationships, endosymbiotic bacteria have been observed to be
very limited in their biodiversity probably because the stable environment provided by the host cells
imposes a stabilising selection constraint (Law & Lewis, 1983).
As mentioned above, there are three main insect orders that have established a symbiotic re-
lationship with bacteria: Order Homoptera, order Dictioptera and order Coleoptera. Most of the
information on the endosymbiotic bacteria of insects has been gained using in situ hybridisation tech-
niques (For example see Berchtold & M. Konig (1996); Schroder et al. (1996)). Despite the ubiquitous
nature of endosymbiosis in insects, much attention has been put on the endosymbiosis in the order
Homoptera, with some of the associations being among the best characterised from the molecular,
biochemical and physiological points of view (Buchner, 1965; Houk & Gri"ths, 1980; Dasch et al.,
1984; Douglas, 1989; Baumann & Moran, 1997). For this reason I will start introducing these associ-
ations in the following subsections of this introduction. Despite the fact that this thesis will mainly
concentrate on the symbiosis between insects of the order Homoptera and bacteria, I will give brief
glimpses into the symbiotic relationships established in other insect orders as well.
11

Chapter 1. Introduction
1.5 Bacterial endosymbiosis with insects of the order Homoptera
As mentioned before, symbiosis between insects and bacteria has allowed insects to colonise
unlikely ecological niches by enabling them to feed on diets poor in essential amino acids and nitrogen
compounds. Association between Homoptera and bacteria has been very well characterised in the
case of the proteobacteria wihtin the group gamma 3 (!-3). Among these are: symbiosis between
B. aphidicola and the aphid host (Buchner, 1965; Munson et al., 1991), eubacteria and the whitefly
(Clark et al., 1992; Brown et al., 1995); eubacteria and the carpenter ants (Boursaux-Eude & Gross,
2000), and endosymbiosis with psyllids and Carsonella (Buchner, 1965; Thao et al., 2000). It is worth
noting that the Hemiptera is the only group of animals that have been able to use plant phloem as
dominant or sole food source (Dolling & Plamer, 1991). The association that Hemiptera has with
microbes is one of the reasons that they have overcome the fact that sap poses a nutritional barrier.
Other important factors are their anatomy and function of the insect mouthparts and gut (as discussed
by Munson et al., 1991).
As mentioned above, aphids-endosymbionts are among the best-characterised associations so far
and this association is strongly related to the ability of aphids to feed on plant phloem and to eco-
logically diversify. It has been estimated that in nature there are approximately 4000 aphid species
(Blackman & Eastop, 1984) of which only 35 have been identified and partially characterised. This
incredible insect diversity is testament to the important contribution of endosymbiosis to the genera-
tion of diversity. Aphids feed on the phloematic fluid of plants and their diet is therefore deficient in
essential amino acids and nitrogen compounds that are essential for amino acid production (Dixon,
1973; Dadd, 1985; Minks & Harrewijn, 1987; Douglas, 1998; Sandstroem & Pettersson, 1994; Sand-
ström & Moran, 1999). These insects feed using a sharp and flexible stylus that allow them to obtain
the phloem through the degradation of the pectin cementation by the pectinases contained in their
saliva (Campbell & Dreyer, 1985; Ma et al., 1990). The plant phloem sap is rich in sugars and poor in
amino acids and nitrogen. This results in the aphid needing to obtain large amounts of phloem so as
to gain enough nitrogen in their diet with the by-product of this being in some aphids the excreting
of large amounts of sugary liquid (the so called honeydew).
The aphids are heavily dependent on their obligated endosymbionts who provide the amino acids
and nutrients to the aphids incapable of obtaining them through their diet. Experiments have been
conducted to show the impact that the loss of these bacteria has on the development and survival of the
aphids, when aphids are fed a diet supplemented with large amounts of antibiotics to ensure killing the
endosymbiotic bacteria while having little to no e!ect on the aphid itself. When the antibiotic is given
to young larvae, the aphid grows very slowly and has either no o!spring or when they do the o!spring
12

1.5 Bacterial endosymbiosis with insects of the order Homoptera
are dead at birth or within a few days. Supplementing adult aphids diet with antibiotics produces
a negative e!ect on the o!spring, which become bacteria free and are hence sterile. Treatment of
embryos with antibiotic has severe e!ects. The embryonic mass of a young adult of Acyrthosiphon
pisum (11 days old) is decreased to as much as 12 % from 65 % in untreated aphids (Douglas, 1996).
All these experiments therefore provide su"cient grounds for the acceptance of the existence of the
metabolic and biochemical connections between endosymbionts and aphids.
1.5.1 Di!erent types of symbionts in aphids
There are several types of possible symbiotic relationships in aphids, including primary symbiotic
and secondary symbiotic bacteria of aphids. Primary symbiotic bacteria of aphids are characterised
by their obligate replication within the bacteriocytes and are present throughout the lifespan of the
aphid. The aphid’s inter-generational transmission of these bacteria occurs through the almost clonal
infection by a limited number of bacteria of the progeny and developing embryos within the host (Tele-
scopic transmission/infection). This vertical (maternal) transmission between host generations results
in a perfect synchronous evolution between both organisms, and their tree topologies consequently
mirror each other. In fact, phylogenetic trees of the endosymbiont built using rDNA mirrors that of
aphid species inferred using morphological characters (Munson et al., 1991; Lo et al., 2003; Moran
et al., 2003; Baumann, 2005; Wu et al., 2006) (see Figure 1.3 ). Based on the fact that the primary
symbiotic bacteria are transmitted vertically to the next host generations, and using the fossil record,
we can support the conjecture that the infection of the aphid host by a proteobacterium occurred
approximately 200 MYA.
Some aphids also contain a second type of endosymbiont that is also transmitted vertically be-
tween host generations but can undergo horizontal transmission among host individuals and species
(Russell et al., 2003). These bacteria are called secondary endosymbionts, accessory bacteria, or fac-
ultative endosymbionts (Fukatsu & Ishikawa, 1993; Fukatsu & Nikoh, 1998). Does this facultative
relationship a!ect the relative biological fitness of the host? The establishment of such relationship
is only conceivable if the presence of the facultative endosymbiont can ensure increased advantage for
the infected host individuals when compared to non-infected individuals. These advantages for the
host can be based on increasing survival or reproductive rates through protection against parasites or
stress (Dale & Moran, 2006). The locations of these bacteria is also di!erent from that of the primary
endosymbionts – in some cases they are not located in bacteriocytes but are rather restricted to the
cells bounding the bacteriocytes, but have also, for example, been observed free in the hemolymph
and in cells of the fat body (Douglas, 1998; Fukatsu & Nikoh, 2000).
13

Chapter 1. Introduction
Figure 1.3: Phylogenetic co-evolution between endosymbiotic bacteria of aphids and their insects’hosts. Because of the strict vertical transmission of endosymbiotic bacteria between host’s generationsand the lack of horizontal transfer of genes between close bacterial species, the tree of the bacteriummirrors that of the host. The dating of speciation events of the host through the fossil record permitsdetermimation of the origin of establishment of the symbiosis between the aphid and the proto-symbiotic bacterium (for example, we can date the Most Common Symbiotic Ancestor “MCSA” usingthe phylogenetic information of the host). Numbers in the nodes refer to estimates of the ancestorsof endosymbiotic bacterial strains. Redrawn from Moran & Baumann, 1994.
Because of the extensive scientific literature and genomic and proteomic data regarding the en-
dosymbiosis between the aphid and B. aphidicola, most of this thesis will attempt to characterise
the evolutionary dynamics at the genome as well as proteome levels in this relationships. As I will
highlight later, despite our profound knowledge of such biological system, many questions remain to
be answered.
1.6 Endosymbiotic bacteria of carpenter ants
Carpenter ants have a very complex diet and endosymbiotic bacteria have only been identified
in two main genera, (Formica and Camponotus) characterised by feeding on plant nectar and other
sugary secretions, from insects of the order Homoptera (Buchner, 1965; Dasch et al., 1984; Borror
et al., 1989). The endosymbiotic bacteria (Blochmannia) have been found to contain high levels of
Guanine and Cytosine (Dasch, 1975; Dasch et al., 1984) and it has been established that they form a
monophyletic group (Schroder et al., 1996). These bacteria pass between generations through vertical
transmissions and the symbiosis is at least 30 MY old (Degnan et al., 2004) but could pre-date the
first ant fossil record (Schroder et al., 1996) which have been established to be approximately 80 MY
old (Wilson et al., 1967; Holldobler & Wilson, 1990). These endosymbiotic bacteria upgrade the diet
14

1.7 Symbionts in the order Dictyoptera and others
of Camponotus ants by supplying essential amino acids and performing nitrogen recycling (Feldhaar
et al., 2007). Despite the fact that these bacteria are still under molecular characterisation, important
advances have been made by sequencing the genomes of Blochmannia pennsylvanicus (Degnan et al.,
2005) and Blochmannia floridanus (Gil et al., 2003). Even though the main focus of this thesis is B.
aphidicola, I have conducted many di!erent genomic and evolutionary analyses in Blochmannia for
the sake of comparison of the evolutionary dynamics of two systems with very similar features.
The metabolic relationship between carpenter ants and their endosymbiont are not as tight as in
other symbiotic relationships (as discussed in above). This was noticed when Blochmannia flodidanus
worker ants were treated with antibiotic to kill of their endosymbionts. The e!ect of this treatment
was not adverse (Sauer et al., 2002). A reason for this could be that the endosymbionts are important
for the development of the ant but not essential for the adult insect (Wolschin et al., 2004).
1.7 Symbionts in the order Dictyoptera and others
The order Dictyoptera also contains examples of the establishment of endosymtiosis (See table
1.1). Among these bacteria are those belonging to Blattabacterium sp. that are considered together
with the endosymbionts of termites because of the strict close phylogenetic relationship between both
host species (McKittrick et al., 1964). Other data, for example the existence of a common ancestor
between cockroaches and termites (called Cryptocercus punctulatus) and feeding on wood support a
common origin for both sub-orders (Bandi et al., 1995). This common origin was further pinpointed
by the fact that the termite Mastotermes Darwiniensis lays eggs with a similar structure to that of
cockroaches. In fact, the order Dyctioptera includes cockroaches, termites and manta that belong to
sub-orders Blattaria, Isoptera and Mantida, respectively. Dasch and colleagues reported the existence
of endosymbiotic bacteria in cockroaches for the first time (1984). These bacteria were later located
in the ovaries and fat body of the cockroaches and were deemed crucial for the cockroaches lifecycle
(Douglas, 1989; Sacchi & Grigolo, 1989). The presence of this endosymbiotic bacteria in the fat body of
Mastotermes Darwiniensis (Jucci, 1932, 1952) but its absence from the remaining termites and manta
led some authors to propose the hypothesis of the establishment of endosymbiosis in the ancestor of
cockroaches and termites (Grassé & Noirot, 1959) and its later evolutionary loss from termites and
manta (Buchner, 1965; Bandi et al., 1995, 1997). However, many other authors maintained that the
parallel acquisition of endosymbionts by cockroaches and the termite Mastotermes Darwiniensis was
a plausible scenario (O’Neill et al., 1993; Moran & Baumann, 1994).
Phylogenetic analysis based on the 16S rDNA has permitted the classification of the endosym-
15

Chapter 1. Introduction
bionts in Blattaria within the group of bacteria Flavobacter-Bacteroides (Bandi et al., 1994, 1995).
These authors estimated that the symbiosis event took place 135-300 MYA, taking into account that
the ancestor of cockroaches and termites way infected by these proto-symbionts (Bandi et al., 1995).
These authors did not discard the possible horizontal transmission of these bacteria, although a recent
report supports the vertical transmission of these bacteria because the phylogeny of the host (Kamb-
hampati, 1995) mirrors that of the endosymbionts isolated from five species of cockroaches (Fares,
2002). Additional experiments with antibiotics also confirm a tight metabolic association between
the host and the endosymbiont because cockroaches deprived of their endosymbionts show decreased
body sizes, coloration and fertility. This metabolic association seems to be limited to the nitrogen
mobilisation and essential amino acids supplementation to the host by the bacteria (Cochran, 1985).
In addition these bacteria are vertically transmitted through the oocytes and the eggs (Bigliardi et al.,
1995; Sacchi et al., 1996, 1998a,b).
The order Diptera (true flies) also contains examples of symbiosis. In the case of the tsetse fly
(Glossinidae), which feeds on a restricted diet of animal blood that is poor in nutrients, they rely
on their symbiotic relationship with microbes to produce the nutrients their diet lacks and they can-
not produce themselves. These enodsymbiotic bacteria, for example Wiggleworthia, are present in
the bacteriome located in the anterior midgut of the host fly. The tsetse fly also has a secondary
endosymbiont (genus Sodalis) (Aksoy, 1995; Cheng & Aksoy, 1999; Dale & Maudlin, 1999), which is
present, both inter- and intra-cellularly, in the midgut but has been detected in the hemolymph of
the fly as well. These two symbionts are maternally transmitted between host generations. They are
transmitted through the mother’s milk gland secretions to the intrauterine larval (Cheng & Aksoy,
1999) as well as transovarial transmission either to the egg or to the parthenogenetic embryos. In ad-
dition to the maternally transmitted symbionts, many tsetse fly populations contain a third symbiont
(Wolbachia).
1.8 Genomic and evolutionary dynamics of intra-cellular sym-
biotic bacteria of insects
The stable environment provided by the host and the presence in some occasions of secondary
endosymbionts collaborating in such metabolic intimacy with the host renders most of the genes in
the endosymbiont redundant (Perez-Brocal et al., 2006; Toft & Fares, 2008). The consequent relaxed
constraints on these genes, in addition to the strong intergenerational bottlenecks these bacteria
undergo and hence the strong e!ects of genetic drift (Moran, 1996), has led to the characterisation
16

1.8 Genomic and evolutionary dynamics of intra-cellular symbiotic bacteria of insects
of what has become a syndrome for endosymbiosis. This syndrome is characterised by a genome
AT enrichment, constituting in B. aphidicola up to 72% of the bases (Ishikawa, 1989; Moran, 1996;
Clark et al., 1998) , and accelerated protein evolutionary rates (Lynch, 1996; Moran, 1996; Lynch,
1997; Brynnel et al., 1998; Clark et al., 1999; Rispe & Moran, 2000; Funk et al., 2001), genome
reduction (for example see Wernegreen & Moran (2000); Gil et al. (2002)), low levels of intra-specific
polymorphism (Funk et al., 2001; Abbot & Moran, 2002), and decreased stability of RNAs (Lambert
& Moran, 1998) and of proteins (van Ham et al., 2003). All these consequences of endosymbiosis have
generated many questions, to which answers still remain to be found. In the next sections I will deal
with each one of the dynamics that result from the endosymbiotic lifestyle and I will underline the
main questions to be investigated.
1.8.1 Genomic dynamics in endosymbiotic bacteria
The intimate association between the host and the endosymbiont makes it impossible to culture
symbiotic bacteria outside their host. However, with the advent of genomics, proteomics, transcrip-
tomics and metagenomics it has become possible to generate and test new hypotheses regarding the
main biological processes subsequent to symbiosis and the minimum indispensable genome composi-
tion for intracellular life to be sustainable. For example, the study of the newly sequenced genomes
made it possible to understand the main innovative genomic and metabolic processes that led to the
coordinated evolution of two or more organisms at various stages of integration within their hosts
(Shigenobu et al., 2000; Akman et al., 2002; Tamas et al., 2002; Gil et al., 2003; van Ham et al., 2003;
Degnan et al., 2005; Foster et al., 2005; Nakabachi et al., 2006; Perez-Brocal et al., 2006; Toh et al.,
2006; Wu et al., 2006; Kuwahara et al., 2007; McCutcheon & Moran, 2007; Nakagawa et al., 2007;
Newton et al., 2007; Moya et al., 2008).
The advances made in understanding the genomics of endosymbiotic bacteria will allow tackling
several questions. What is the minimum set of necessary genes for the inter-partner communication?
What are the pathways retained by the endosymbionts to ensure its continuous survival within the
host? What mechanisms follow the host to control the endosymbiotic population? What are the
gene sets that determine the final outcome of the endosymbiosis established by a prokaryote and a
eukaryote? Although many of these questions have been addressed in previous studies, most of the
focus has been on analysing independently each subsystem (for example either the bacterium or the
host), which renders most of the results di"cult to interpret in the light of the endosymbiosis system
as a whole. In the case of the endosymbiotic bacterium, researchers have attempted to answer many
of the questions about the final outcome of symbiosis and the minimum set of genes for intra-cellular
17
Chapter 1. Introduction
life through the comparison of the dynamics of genome shrinkage between di!erent endosymbiotic
bacteria of insects.
Genome reduction is among the most striking characteristics of the endosymbiotic lifestyle and
its magnitude is astonishing when comparing the genome size of the free-living bacterium Escherichia
coli (4.6 Mbp) (Blattner et al., 1997) to the endosymbiont B. aphidicola Cinara cedri whose genome
size is about 0.45 Mbp (Gil et al., 2002) or to the almost endosymbiont Carsonella ruddii, that only
encodes 180 proteins (Tamames et al., 2007). This genome shrinkage phenomenon seems however to
be related to intracellular lifestyle of organisms rather than to the endosymbiosis itself because many
intracellular pathogenic bacteria also present streamlined genomes. For instance, authors detected
very small sizes in intracellular pathogenic bacteria Mycoplasma genitalium (0.58 Mbp) (Fraser et al.,
1995), Chlamydia trachomatis (1.0 Mbp) (Stephens et al., 1998), Rickettsia prowazekii (1.1 Mbp)
(Andersson et al., 1998) and Haemophilus influenzae (1.8 Mbp) (Fleischmann et al., 1995). All
endosymbiotic bacteria so far characterised from the genomic point of view show in fact a strong
reduction in genome sizes in comparison with their free-living cousins (see table 1.2).
The cause for such dramatic genome reduction seems to be a combination of two factors, the
population dynamics of the bacterium and the new set of genes needed to adapt to the new envi-
ronment. The relative importance of both factors however remains to be investigated (Moran, 1996;
Itoh et al., 2002; Moya et al., 2008). The essentiality of the genes in the endosymbiotic bacterium
changes significantly in comparison with bacteria sharing a free lifestyle. Many of the genes that
were essential before became redundant after symbiosis because either the host provides many of the
products of these genes or alternatively the stable environment provided by the host makes some of
the genes dispensable for intra-cellular life. For instance in the case of the loss of genes encoding the
hook and filament structural proteins of the flagellum, which are unnecessary in an endosymbiotic
bacterium such as B. aphidicola whose cells are non-motile (Toft & Fares, 2008). In such a set of
genes purifying selection is unable to purge slightly deleterious mutations that accumulate at a neu-
tral rate, are also promoted by random genetic drift due to the host inter-generational bottlenecks
(see Figure 1.4 (Müller’s ratchet)). Furthermore, mutations accumulate in non-essential genes such as
in those encoding the recombination machinery, further reducing the possibility of reversal mutation
or exchange by homologous recombination. The isolation of the endosymbiont within bacteriocytes
almost eliminates the possible acquisition or exchange of genes between bacterial species (Silva et al.,
2003). The irreversible consequence of the loss of genetic material and the impossibility of acquiring
new material reduce genome size through a mechanism based on mutational deletion bias (Anders-
son & Andersson, 1999, 2001; Moran & Mira, 2001; Wernegreen, 2002; Gregory, 2003; Wernegreen,
18

1.8 Genomic and evolutionary dynamics of intra-cellular symbiotic bacteria of insects
Tab
le1.
2:G
enom
esi
zean
dA
Tco
nten
tin
fully
(by
Sept
embe
r20
08)s
eque
nced
endo
sym
bion
ts.
Gen
ome
trai
tsin
endo
sym
biot
icba
cter
iaof
inse
cts.
Gen
ome
leng
th,h
ost
inse
ct,p
rote
innu
mbe
rco
nten
tan
dA
Tpr
opor
tion
inco
mpl
ete
geno
mes
(by
Sept
embe
r20
08)
are
show
n.
End
osym
bion
tR
elIn
sect
host
Gen
ome
#P
rote
ins
AT
Cit
atio
nBuc
hner
aap
hidi
cola
PE
Acy
rtho
siph
onpi
sum
pea
aphi
d64
0kb
564
73.7
%Sh
igen
obu
etal
.,20
00P
ESc
hiza
phis
gram
inum
gree
nbu
gap
hid
641
kb54
674
.7%
van
Ham
etal
.,20
03P
EB
aizo
ngia
pist
acia
eap
hid
616
kb50
474
.7%
van
Ham
etal
.,20
03P
EC
inar
ace
dria
phid
420
kb35
779
.9%
Per
ez-B
roca
let
al.,
2006
Con
dida
tus
Blo
chm
anni
aP
EC
ampo
notu
sflo
rida
nus
Flo
rida
carp
ente
ran
t71
0kb
583
72.6
%G
ilet
al.,
2003
PE
Cam
pono
tus
penn
sylv
anic
usbl
ack
carp
ente
ran
t79
1kb
610
70.4
%D
egna
net
al.,
2005
Wig
gles
wor
thia
glos
sini
dai
PE
Glo
ssin
abr
evip
alpi
sTse
tse
fly69
8kb
611
79.5
%A
kman
etal
.,20
02Bau
man
nia
cica
delli
nico
laP
EH
omal
odis
caco
agul
ata
leaf
hopp
erin
sect
s69
0kb
595
66.8
%W
uet
al.,
2006
Am
oebo
philu
sas
iaticu
s5a
2P
EA
cant
ham
oeba
sp.
TU
MSJ
-321
1900
kb12
8365
.0%
JGI-
PG
FC
andi
datu
sC
orso
nella
Pac
hyps
ylla
venu
sta
160
kb18
283
.4%
Nak
abac
hiet
al.,
2006
Pro
toch
lam
ydia
amoe
boph
ilaE
Aca
ntha
moe
basp
.24
14kb
2031
65.3
%H
orn
etal
.,20
04C
andi
datu
sRut
hia
mag
nific
aC
alyp
toge
nam
agni
fica
(hyd
roth
erm
alve
ntcl
am)
1200
kb97
666
.0%
New
ton
etal
.,20
07Elu
sim
icro
bium
min
utum
hind
gut
ofte
rmites
&w
ood-
feed
ing
cock
roac
hes
1600
kb15
2960
.0%
JGI-
PG
FPol
ynuc
leob
acte
rne
cess
ariu
sE
uplo
tes
aedi
cula
tus
(cill
iate
)16
00kb
1508
54.4
%JG
I-P
GF
Ric
kettsi
abe
lliiO
SU85
-389
Der
mac
ento
r&
Am
blyo
mm
a&
othe
rs15
00kb
1476
68.4
%U
nive
rsity
ofIo
wa
Ric
kettsi
abe
lliiR
ML
369-
CD
erm
acen
tor
vari
abili
stick
s15
22kb
1429
68.4
%O
gata
etal
.,20
06So
dalis
floss
inid
ium
SEG
loss
ina
brev
ipal
pis
Tse
tse
fly41
71kb
2432
45.3
%Toh
etal
.,20
06Ver
min
ephr
obac
ter
eise
niae
SE
isen
iafo
etid
a(a
rthw
orm
)56
00kb
4908
34.7
%D
avid
son
&St
ahl,
2006
Wol
bach
iaSE
Dro
soph
ilaan
anas
sae
1440
kb18
0264
.3%
TIG
RD
roso
phila
mel
anog
aste
r12
68kb
1195
64.8
%W
uet
al.,
2004
Dro
soph
ilasi
mul
ans
1100
kb76
064
.6%
TIG
RB
rugi
am
alay
i10
80kb
805
65.8
%Fo
ster
etal
.,20
05C
ulex
pipi
ens
mos
quitoe
s14
82kb
1275
65.8
%K
lass
onet
al.,
2008
Esc
heri
chia
coli
k12
F46
00kb
4243
49.2
%B
latt
ner
etal
.,19
97Sa
lmon
ella
typh
imur
ium
LT2
F49
00kb
4425
47.8
%M
cCle
lland
etal
.,20
01P
E:P
rim
ary
End
osym
bion
t,SE
;Sec
onda
ryE
ndos
ymbi
ont,
F:Fr
ee-li
ving
,Rel
:R
elat
ions
hip
19

Chapter 1. Introduction
Figure 1.4: Increment of mutational load in B. aphidicola symbionts by Müller’s ratchet. Theendosymbiotic bacteria of aphids, B. aphidicola, are transmitted in small numbers to the next gen-erations of the host by infecting eggs or developing embryos within the aphid female. The strongintergenerational bottlenecks under which these bacteria are transmitted allows the fixation of mu-tations by genetic drift in an irreversible manner. This phenomenon is considered as an example ofMüller’s ratchet (Muller, 1964). Mutations here are represented as di!erent geometrical forms and thebottleneck is also symbolised as a narrow filter for genetic variation. Although this figure represent aconstant bottleneck size, this may vary depending on host’s populations sizes.
2005). This loss has been speculated to consist of two stages: a first stage characterised by a massive
loss of genes straight after the establishment of symbiosis (Moran & Mira, 2001) followed by grad-
ual gene losses (Silva et al., 2001). Other studies speculated that the genome reduction starts o!
with a gradual gene-by-gene non-functionalisation, which damages certain pathways, which leads to
a domino e!ect of non-functionalisation of dependent genes. In the later stage of the initial reduction
the non-functionalisation is rapid and large deletions occur (Dagan et al., 2006; Delmotte et al., 2006).
As average, it has been estimated that the rate of genome disintegration ranges between 2.9 ! 10!8
nucleotides/site/year (Gomez-Valero et al., 2004) and 7.7 ! 10!10 (Gomez-Valero et al., 2007). It is
tempting also to speculate that mobile elements have had an important role in gene loss soon after
symbiosis based on the fact that bacteria that have recently established an intra-cellular life present
important percentage of gene losses (Moran & Plague, 2004; Wu et al., 2004; Plague et al., 2008),
although this remains to be investigated.
1.8.2 Function, metabolism and minimum set of genes for endosymbiosis
In a comparative genomic analysis of the full genome sequences of five distinct endosymbiotic
bacteria of insects (three B. aphidicola endosymbionts, Blochmannia floridanus and Wigglersworthis
glossinidia) Gil and colleagues showed that only 313 genes were shared among them, possibly repre-
20

1.8 Genomic and evolutionary dynamics of intra-cellular symbiotic bacteria of insects
senting the minimum set of genes necessary for intra-cellular life (Gil et al., 2003). Among these genes,
they noticed that only one third were devoted to the maintenance of the endosymbiotic organism and
most of them were related to fundamental cellular processes, signalling processes and information
storage. They also found that chaperones and all essential components of chaperone translocation
machinery were kept in all five genomes, possibly to ensure a proper folding and functioning of the
proteome (Shigenobu et al., 2000; Fares et al., 2002b). Metabolic genes are not essential for the host
survival and repair genes, not essential for the bacteria in a stable environment, have been mostly lost.
The non-essentiality of these metabolic genes comes from experiments with microarrays showing that
their expression is independent of the environmental metabolic changes (Wilcox et al., 2003; Wilson
et al., 2006). The observation of the downsizing of the endosymbiotic genomes to contain fundamen-
tal process encoding genes has inspired the search for the minimal life (for example, minimum set
of genes that a biological entity should contain to ensure its survival and replication). Although the
minimum number of genes depends on the combination of metabolic pathways that are essential in
each di!erent ecological niche, comparative genomic of endosymbiotic bacteria thriving in di!erent
chemical environments may shed light on the minimum required set of genes for replication, survival
and evolution. It is worth noting that there is no such thing as a minimal gene set so it might be
more appropriate to talk about minimum function of a gene set rather than thinking of it as specific
genes required for minimum life. This should be seen in the light that proteins could change function
– which can be driven by the loss of the original gene coding for that protein.
1.8.3 Bu!ering systems and evolutionary innovation in endosymbiotic bac-
teria
As mentioned earlier, endosymbiotic bacteria of insects undergo an irreversible accumulation
of mildly deleterious mutations as a result of their population-genetics dynamics. This increasing
mutational load eventually leads to the destabilisation of the RNA molecules and proteins, to the
decline in the biological fitness of the individuals and to the consequential unsustainability of the
biological system as a whole. Such processes of irreversible accumulation of mutations have been
well characterised in some endosymbiotic bacteria of insects, such as B. aphidicola, through di!erent
evolutionary studies (For example see Moran, 1996; Tamas et al., 2002). However, several mechanisms
may have prevented the early demise of these endosymbionts because most of them have survived for
hundreds of millions of years of endosymbiosis (Aksoy, 1995; Charles et al., 1997). Moran proposed
that molecular chaperonins, such as the heat shock protein GroEL, might bu!er the e!ects of the
accumulation of mutations in these bacteria through ensuring the correct folding of mutated proteins
21

Chapter 1. Introduction
(Moran, 1996). Several sets of evidence strongly support this view, including the over-production
of GroEL/S in most if not all endosymbiotic bacteria but not in free-living bacteria (Aksoy, 1995;
Charles et al., 1997; Sato & Ishikawa, 1997), and the detection of mutations favouring protein binding
and folding fixed by adaptive evolution in two phylogenetically independent endosymbiotic bacteria
of insects (Fares et al., 2002a, 2005). Over-production of GroEL in strains of Escherichia coli with
diminished relative biological fitnesses, using wild-type and highly mutagenic strains, permits the
recovery of a significant proportion of E. coli strains’ fitnesses (Fares et al., 2002b). This has been
experimentally reproduced in other bacteria with increasing expression levels of GroEL/S (Maisnier-
Patin et al., 2005).
Although exciting, it is rather hard to believe that a single gene may be responsible for the stable
equilibrium of endosymbiotic bacteria of insects despite the build up of mildly deleterious mutations.
Other scenarios may play important roles in such a system. For example epistasis (accumulation of
compensatory mutations in essential genes) and increasing translational robustness may be relatively
more important in endosymbiotic systems than in free-living organisms. The bu!ering potential of
molecular chaperones and chaperonins has been also demonstrated in other biological systems. For
example the heat-shock protein 90 Kda, responsible for the folding and activation of signal transduction
proteins and steroid hormone receptors, has been shown to play an important role in bu!ering the
phenotypic e!ects of the genetic variability in the insect Drosophila melanogaster (Rutherford &
Lindquist, 1998) and the plant Arabidopsis thaliana (Queitsch et al., 2002).
The importance of molecular chaperones in bu!ering genetic variability has allowed them to
maintain a source of genetic novelties possibly advantageous under specific environmental conditions.
Endosymbiotic bacteria of insects perform one such system where the chance for the emergence of
functionally innovative mutations is enhanced in comparison with free-living organisms because of the
high mutational load. The relationship between mutational e!ects, function and protein structure sta-
bility is essential for our understanding of the evolutionary dynamics of proteins (DePristo et al., 2005;
Pal et al., 2006; Bloom et al., 2007; Camps et al., 2007; Poelwijk et al., 2007) as well as in engineering,
designing, and evolving novel enzyme or protein functions (van den Burg & Eijsink, 2002; Bloom et al.,
2005; Butterfoss & Kuhlman, 2006). The fact that most of the functionally important residues are
polar or charged and are embedded in hydrophobic clefts supports the existence of a tradeo! between
protein stability and function, with mutating to more stable residues compromising protein functional
performance (Beadle & Shoichet, 2002). This concept was later extended to tradeo!s between new
functions and stability (Wang et al., 2002).
Indeed, it has been proven that most mutations conferring new functions are destabilising (Bloom
22

1.8 Genomic and evolutionary dynamics of intra-cellular symbiotic bacteria of insects
et al., 2006). This is translated into the premise that protein structures robust to mutations are more
prone to accumulate functionally beneficial but destabilising mutations, something that has been al-
ready demonstrated by mutagenesis experiments on marginally stable and thermostable variants of
the protein P450 (Bloom et al., 2006). Irrespective of the protein structural robustness to destabilis-
ing mutations, several other mechanisms may allow the accumulation of functionally innovative but
destabilising mutations. For example, compensatory mutations at nearby protein structural regions
may counterbalance the negative structural e!ects of such destabilising mutations. Further, the desta-
bilising e!ects of mutations can be greatly bu!ered by the folding activity of heat-shock proteins that
may keep such proteins conformationally active despite mutations. In support of this, experiments in
the fruit fly Drosophila melanogaster where the function of the chaperone Hsp90 was compromised by
heat-stress or pharmacologically using hsp90-specific drugs such as GDA (a benzoquinone ansamycin)
or radicicol (a macrolactone), showed the cryptic genetic variability present and that chaperone can
bu!er the phenotypic e!ects of mutations in many di!erent morphological pathways (Rutherford &
Lindquist, 1998). Other experiments showed similar bu!ering e!ects of this chaperone reproducible
in the plant Arabidopsis thaliana (Queitsch et al., 2002). This cryptic genetic variability performs a
source of evolutionary innovation under changing environmental conditions that may allow the fixation
of certain variants of chaperone protein clients. In conclusion much e!ort has to be invested in un-
derstanding the profound evolutionary consequences of bu!ering by the chaperonins in endosymbiotic
bacteria of insects.
Despite the huge e!ort made and the advances achieved during the last two decades many ques-
tions remain to be addressed so as to make it possible to understand the evolutionary forces that
have shaped the success of the endosymbiotic lifestyle in insects. For example, how has the proteomic
system of endosymbiotic bacteria evolved to counteract the e!ects of neutral genetic drift? What are
the consequences of a bu!ering system and how much mutational load is the endosymbiont genome
able to accept? Did the evolutionary and fitness landscape for endosymbionts changed as compared
to their free-living cousins? What are the dynamics of coevolution between and within proteins in
endosymbiotic bacteria of insects? How are these dynamics a!ecting the di!erent functional cate-
gories and how can we utilise this information to infer conclusions regarding the minimum genome
composition for intracellular life?
23


Chapter 2
Indentifying The Genome Dynamics
in Endosymbiotic Bacteria of Aphids
2.1 Related publications
Toft C and Fares MA. GRAST: a new way of genome reduction analysis using comparative
genomics.
Bioinformatics Vol. 22 no. 13 2006, pages 1551–1561
Commins J, Toft C and Fares MA. Computational Biology methods and their application to the
comparative genomics of endo-cellular symbiotic bacteria of insects.
Biological Procedures Online (accepted).
This chapter follows the contents of the first of the above articles (Toft & Fares, 2006), although
sections have been rewritten and extended to integrate the development of a second program (Phy-
GRAST) that performs a phylogenetic comparison analysis which was not implemented in the previous
software (GRAST). Some parts in which the author has contributed to the second article (Commins
et al ) have been integrated into the introduction to give further insight to the subject discussed in
this chapter. Changes have also been made to better contextualise this chapter within the body of
the thesis.
25

Chapter 2. Indentifying The Genome Dynamics in Endosymbiotic Bacteria of Aphids
2.2 Abstract
Establishment of intra-cellular life involved a profound re-configuration of the genetic characteris-
tics of bacteria, including genome reduction and rearrangements. Understanding the mechanisms un-
derlying these phenomena will shed light on the genome rearrangements essential for the development
of an intra-cellular lifestyle. Comparison of genomes with di!erences in their sizes poses statistical as
well as computational problems. Little e!orts have been made to develop flexible computational tools
with which to analyse genome reduction and rearrangements. Here I describe computational tools
with which we investigate and statistically describe events of genome reduction and rearrangements
in endosymbiotic bacteria of aphids. Two novel computational tools were developed namely GRAST
and PhyGRAST. GRAST carries out pair-wise comparisons and is capable of identifying groups of
genes with similar functions. Conserved clusters of functionally related genes (CGSCs) were detected.
Heterogeneous gene and gene cluster non-functionalisation/loss are identified between genome regions,
between functional gene categories and during evolution. PhyGRAST uses a phylogenetic approach
whereby it can determine losses and gains of genes within a clade of interest (the endosymbiotic clade).
Our results show that gene non-functionalisation has accelerated during the last 50 MY of Buchnera’s
evolution while CGSCs have been static regarding rearrangements and loss.
2.3 Introduction
Intra-cellular bacteria are characterised by their intimate biochemical and genetic relationships
with the host, which can result in a pathogenic or symbiotic relationship. Symbiosis has been largely
associated with the emergence of metabolic, ecological and genetic novelties in the host and the
bacteria (Gil et al., 2002). The epidemiological behaviour of intracellular bacteria relies on spe-
cific population genetics factors that have an enormous influence on the mutational dynamics at the
genome and proteome level. The most important of these factors is the strong bottlenecks to which
the bacterial e!ective population sizes are subjected to between generations and the absence of lat-
eral gene transfer and recombination (Tamas et al., 2002). This results in a high rate of fixation of
slightly deleterious mutations by genetic drift (Rispe & Moran, 2000). This scenario has been con-
firmed through comparative genomic analyses (Moran & Mira, 2001; Silva et al., 2001; Tamas et al.,
2002) and has been associated with the non-functionalisation of genes (Andersson & Kurland, 1998;
McClelland et al., 2004) followed by disintegration and genome reduction (Andersson & Andersson,
1999; Silva et al., 2001). As a result, intra-cellular bacteria are expected to form unstable biological
systems (Kondrashov, 1988; Lynch et al., 1993). Despite this, the symbiotic relationship between
26

2.3 Introduction
the bacteria, such as the endosymbiotic bacteria of aphids Buchnera aphidicola, and their hosts has
been successfully maintained for 100–150 MY. Mechanisms that compensate for the e!ects of slightly
deleterious mutations have been proposed (Moran, 1996) and demonstrated (Fares et al., 2002a,b).
E!ects attributable to the intracellular life are reduced genome sizes and high level of genome
rearrangements (Mira et al., 2001; Belda et al., 2005). Understanding the underlying mechanisms re-
sponsible for such genome dynamics is instrumental in uncovering the genome rearrangement patterns
and genes responsible for the establishment of the intra-cellular lifestyle. These mechanisms may also
be crucial to defining the final outcome of the interaction between the biological system of the host
and that of the bacterium.
Comparative genomics is one of the most promising areas that logically follows the success in
improving genome sequencing. More and more comparative genomics programs are being demanded
to identify protein-coding genome regions, placement of regulatory elements and the main evolutionary
dynamics a!ecting the complexity of genome organization. Despite its apparent simplicity, such
comparative methods have to face many technical as well as theoretical problems. One of the most
important problems is aligning whole genomes and visualizing such alignments in a comprehensive and
comprehensible way. This problem in sequence alignment leads to other genomic problems such as the
finding of orthologs between genomes. The magnitude of this problem becomes increasingly magnified
when the comparison is held between genomes with di!erent population dynamics and hence di!erent
mutational rates, as we will explain below.
2.3.1 The first hurdle – how to determine the homologs (orthologs and/or
paralogs)?
Identification of homologous genes relies on the appropriate definition of a homolog. The most
widely accepted definition is that homologous genes share a common ancestor. This definition however
is not precise as to the nature of this common ancestry and comprises both types of homology, orthologs
(common species ancestry) and paralogs (common gene ancestry).
Irrespective of the nature of the ancestry considered, homologs are usually identified on the
basis of sequence similarity. So the greater the similarity the more likely it is the sequences have
derived form a common ancestor. One of the first and the most commonly used pieces of software
to detect the degree of similarity between sequences is BLAST (Altschul et al., 1990) and the newer
version PSI-BLAST (Altschul et al., 1997). BLAST uses pre-defined scoring matrices in comparison
to position-specific scoring matrices derived from the hits scoring hits in the initial search in PSI-
BLAST. The two programs give the score for the comparison plus an estimate of the likelihood of
27

Chapter 2. Indentifying The Genome Dynamics in Endosymbiotic Bacteria of Aphids
seeing this score, called the e-value. This means that sequences with the highest score and therefore
lowest e-value are considered to be the closest relative in the searched database. The assumption
underlying this software is that the phylogenetic relationship between any two sequences and their
degree of similarity are positively correlated. This however leads to another theoretical problem: how
to determine if a sequence is more similar to a di!erent sequence than another. Unfortunately, setting
a statistical cut-o! value to determine when two sequences are significantly similar is rather di"cult
and problematic when determining a set of possible homologs. The lower the cut-o! the larger the
number of false-negatives. On the other hand the higher the cut-o! the larger the number of false-
positives. As an additional drawback the sequences with the highest score and lowest e-value are not
always more closely related than those identified as hits with a lower score (Koski & Golding, 2001).
In BLAST searches for homologs, many types of relationships between homologs can be investi-
gated, including hits of many-to-many, one-to-many or very strict one-to-one relationships. The first
two are the result of duplication events after speciation. A very e!ective way to identify one-to-one
relationship is by performing the generally called Reciprocal best BLAST Hits (RBH) method (Hirsh
& Fraser, 2001; Jordan et al., 2002). This method is based on the assumption that genes that are each
other’s best hits when performing a BLAST search are more likely to be orthologs compared to ones
that are not. The reason for this is that although gene A in genome 1 may be the best match for gene
B in genome 2, this match may be worse than gene B in genome 2 with gene C in genome 1. This ap-
proach is again limited by the problem of the assumption that best hits ensure orthology, which might
not be the case when a particular gene underwent a recent duplication in a particular lineage. The
consequence of this is that when a gene finds a paralog as top BLAST hit instead of its ortholog, both
itself and the paralog is excluded from the rest of the analysis (Wall et al., 2003). These limitations
in the BLAST searches have fuelled the development of other ways to identify putative orthologs over
the last few years. One of such methods uses the sequence distances instead of similarities to identify
orthologs and uses the reciprocal smallest distance algorithm (RSD) (Wall et al., 2003). It uses global
sequence alignment and maximum likelihood to estimate the evolutionary distances between genes to
detect orthologous genes. This approach have also been used to determine orthologs in databases like
Roundup (Deluca et al., 2006).
Irrespective of the method used to identify homologs, visualising results is one of the best ways
to inspect and yield the first insights into trends and patterns when looking at genome evolutionary
dynamics. This fact has inspired the creation of software for comparative genomics with graphical
solutions to assist in the interpretation of the results. The question remains, whether visualisation
tools can solve the puzzle of genome rearrangements.
28

2.3 Introduction
2.3.2 Pairwise genome comparisons
Many groups have devoted a substantial amount of their resources to the development of tools
aimed at comparing two genomes and have validated such tools by comparing circular prokaryotic
genomes. Some visualisation softwares have specialised in performing direct comparisons of synteny
information through scatter plots of pair-wise genome comparisons. For example, software such as
DAGchainer (Haas et al., 2004), GeneOrder (Celamkoti et al., 2004), GenePlot from NCBI (Wheeler
et al., 2008), Genome v/s Genome Protein Hits Scatter Plot from The Comprehensive Microbial
Resource (CMR) (Peterson et al., 2001) and GenomePlot from PLATCOM (Choi et al., 2005) achieve
this by presenting a plot where one axis represents the positions of the genes within one of the genomes
while the other represents the genes for the other genome. The scatter plot then represents homologous
genes for both genomes determined by either total hits or best BLAST hit. Perfectly syntenic genes
between the two genomes would therefore represent a linear relationship between the two axes whereas
arrangements of the scattered dots may indicate that genome rearrangements have taken place in one
of the genomes. Finally, other programs such as ACGT (Xie & Hood, 2003), GOAL from BROP
(Chen et al., 2005), BugView (Leader, 2004) and GenomeComp (Yang et al., 2003) have contributed
to the field of comparative genomics by linearly representing rearrangements or syntenic information
by linking homologous regions between the compared genomes using lines. The advantage of programs
such as these is that in addition to yielding information about genome rearrangements, they can also
spot conserved and non-conserved regions between the two genomes in much greater detail than other
programs.
Aside from the syntenic analyses using visualisation tools, other programs have been developed to
search for other types of information in comparative genomics. For example, GC Comparison Graph
from The Comprehensive Microbial Resource (CMR) (Peterson et al., 2001) compares the GC content
between two genomes by placing orthologs in the axis according to their GC content, thus highlighting
GC compositional shifts at the genome level between two genomes. Although useful in their content,
these programs are subject to several drawbacks from a pragmatic point of view among which the
most important is the impossibility to perform multiple genome comparisons and hence to establish
the ancestry of genome rearrangement dynamics.
2.3.3 Multiple genome comparisons
As the number of genomes sequenced increased over the last decade, the demand for an un-
derstanding of the dynamics of genome evolution has also increased. Dealing with the complexity
of multiple genome comparisons has been halted by the un-paralleled development of appropriate
29

Chapter 2. Indentifying The Genome Dynamics in Endosymbiotic Bacteria of Aphids
software tools. Nowadays several tools have been developed. An example of a multiple genome com-
parison tool is GenColors from Jena Prokaryotic Genome Viewer (JPGV) (Romualdi et al., 2007).
This program allows the user to display a number of features on the genome, like CDS, RNA genes,
tRNA genes, rRNA genes, Mics RNA, GC contents, GC skew Keto excess etc. This database also
represents genomes in either a circular diagram or in a linear plot. Although several genomes can
be examined at the same time using this tool, these are human observations of the genomes rather
than real phylogenetic studies of the genome properties. JPGV allows multiple genome comparisons
by determining a core gene set of two or more genomes defined by the set of best-bidirectional hits
for all possible pairs of genes. Other methods of the JPGV are implemented to perform pair-wise
comparisons only.
In addition, there are computational tools that compare multi circular prokaryotic genomes and
present their similarities in a circular diagram. Some of these tools perform these comparisons in
addition to the BLAST searches and the CGView server is an example of that (Grant & Stothard,
2008). Others also display information about the percentage of GC for each one of the genomes, such
is the case of GenomeViz (Ghai & Chakraborty, 2007).
To gain more information about genome rearrangements and inversions there has been a great
e!ort in developing tools that perform linear comparisons between genomes. The way these tools
compare genomes is by performing genome alignments where possible and then by conducting multiple
genome comparisons. There are many di!erent multiple genome alignments algorithms. The first type
is based on defining a reference genome and performing alignments taking into account that reference
genome. This type of alignment algorithm is implemented in a program called Vista (Dubchak &
Ryaboy, 2006). The second approach is where an iterative pair-wise alignment is performed under
the control of a guide tree. The tree defines the order in which the genomes should be added to the
alignment. The third type of algorithm determines anchors present in all genomes and then proceeds
to align them. Once aligned, the last step is to close the gaps between the anchors by aligning the
substrings between them. Examples of programs implementing this type of algorithm are MGA (Hohl
et al., 2002), M-GCAT (Treangen & Messeguer, 2006) and Mauve (Darling et al., 2004), with each
of them having their own algorithm for identifying the anchors and performing the alignment of the
inter-anchor regions afterwards.
There are other tools that allow the user to do other things in addition to the alignment of
genomes. For example MANTIS (Tzika et al., 2008) is a phylogenetic-group specific (metazoan phy-
logeny) tool that analyses the patterns of gene gains and losses at specific branches of the phylogeny.
Then the program infers the gene content of the ancestral genome to the clade and identifies over- or
30

2.4 Material and methods
under-representation of certain processes among the class of gene gains or losses.
Despite all these e!orts to developing more robust and accurate methods to perform comparative
genomic studies, several biological phenomena pose di"culties in identifying the real genome dynamic
processes in organisms. For example, genome duplication, genome shrinkage in intra-cellular symbiotic
bacteria and lateral gene transfer may well hide the real genome rearrangement processes undergone
in particular genomes.
Here we present Genome Reduction Analysis Software Tool (GRAST) and a phylogenetic ap-
proach to this analysis (PhyGRAST) that allows the user to investigate genome reduction by com-
paring an intra-cellular organism (reduced genome(s)) to its closest free-living relatives (reference
genome(s)). The application of the first tool for the comparative genomic analysis of free-living bac-
teria with endosymbiotic bacteria yields information on the main genome dynamics that occurred
following the establishment of intra-cellular life, including, among others, genome rearrangements,
propensity of functional categories to lose functional genes, gathering of functionally related genes
and the genome distribution of junk DNA. The second tool is able to determine branch specific gene
events (loss, gain, retained), and common and specific conserved gene succession clusters on the in-
ternal branches of the endosymbiotic clade.
2.4 Material and methods
The first parts of this section will be focused on GRAST, whilst later in the section PhyGRAST
will be introduced. Orthologous pairs of genes between the reduced genome and the reference genomes
are identified by mutual BLASTP (Altschul et al., 1997) searches of the genes of both genomes.
Orthologous gene pairs are those finding each other as top BLAST hits with E-value being lower than
a certain cut-o! value. In this analysis only orthologous functional genes are compared between the
two genomes.
2.4.1 Genome sequences
In this study we have compared the genomes of the endosymbiotic bacterium B. aphidicola from
the aphid strains Acyrthosiphon pisum (BAp; Accession number: NC_002528), Schizaphis graminum
(BSg ; Accession number: NC_004061), Baizongia pistaciae (BBp; Accession number: NC_4545)
and Cinara cedri (BCc; Accession number: NC_008513) to that of their closest free-living relatives
Escherichia coli K12 (Ec; Accession number: NC_000913) and Salmonella typhimurium LT2 (St ;
Accession number: NC_003197). Similar to the establishment of endosymbiosis in aphids, both free-
31

Chapter 2. Indentifying The Genome Dynamics in Endosymbiotic Bacteria of Aphids
living bacteria diverged 100–160 MY.
2.4.2 Genome rearrangements
GRAST examines three ways in which genes can undergo rearrangements (Figure 2.1). First, two
adjacent genes in the reference genome can be separated in the rearranged genome by translocation
(Figure 2.1 a). Second, genes can be gathered due to the disintegration of non-functional genes between
them (Figure 2.1 b). Third, genes can be gathered by the translocation of one gene to a nearby region
of the other gene or by the movement of both genes to adjacent regions in the reference genomes (Figure
2.1 c). In the latter case, genes included between gathered genes may have been moved to another
region of the genome by other mechanisms such as translocations of complete genome segments (Figure
2.1 c) or chromosomal segment inversion (Figure 2.1 d). All of these possible genome rearrangements
were studied in B. aphidicola.
2.4.3 Conserved gene succession clusters (CGSCs)
Genes that remain clustered after genome reduction and do not su!er internal rearrangements
are often under strong selective constraints to remain so. For example, genes with similar functions
may be maintained proximally to coordinate their expression (Siefert et al., 1997). In GRAST, CGSC
are identified as groups of two or more genes that have retained their gene order following genome
reduction (Figure 2.1 e). For two adjacent genes to be in a CGSC they are required to be in synteny
with their orthologs in the reference genome and any gene between them in the reference genome
should have been lost in the reduced genome. We examined CGSCs in each one of the B. aphidicola
genomes and identified the main rearrangements that occurred in these clusters.
2.4.4 Gathering of functionally related genes
There are three overall functional categories defined by the clusters of orthologous groups of pro-
teins (COG; (Tatusov et al., 2003)); ISP refers to information processing and storage, CPS to cellular
processes and signalling category and the Met to metabolism. GRAST calculates the probability of
observing a pair of genes belonging to the same functional category clustered together. The assump-
tion here is that each rearrangement is an independent event and follows no specific order. We can
thus estimate the probability of gene gathering under a multinomial density function as follows: Let z1
and z2 be two genes that have been gathered (Figure 2.1 c) owing to a specific genome rearrangement
mechanism, and let us assume that
32

2.4 Material and methods
Figure 2.1: Gene rearrangements in the endosymbiont (reduced) genome identified by GRAST (a)Gene movements can occur through the translocation of neighbour genes in the ancestral genome todi!erent positions in the reduced genome; (b) genes can be gathered as a result of loss of non-functionalgenes located between them or (c) by translocation in the reduced genome. (d) Gene movements canalso occur by gene translocation and genome segment inversion in the reduced genome. CGSCs aredefined as segments in the reduced genome in genetic synteny with the reference genome (e).
33

Chapter 2. Indentifying The Genome Dynamics in Endosymbiotic Bacteria of Aphids
Y1 = {{z1, z2} : where both genes belong to the functional category ISP}
Y2 = {{z1, z2} : where both genes belong to the functional category CPS}
Y3 = {{z1, z2} : where both genes belong to the functional category Met}
Y4 = {{z1, z2} : where both genes belong to different functional categories}
In this particular case, the probability of the observed number of translocations causing gene
gathering is:
P (Y1 = n1, Y2 = n2, Y3 = n3, Y4 = n4) =n!
n1!n2!n3!n4!pn11 pn2
2 pn33 pn4
4 (2.1)
Where n is the number of translocations, ni is the number of Yi observations, and pi is the
probability of observing Yi and is calculated as follows:
pi = P (YI = !) = (Number of genes in that category
Total number of genes in the reference genome)2 : "! # [1, 3]
Conversely, the probability of having two genes belonging to two di!erent functional categories
gathered together is:
p4 = P (Y4 = 1) = 1$i=3!
i=1
pi
In general, if we have K functional categories, then the probability of the observed number of
translocation causing gene gathering will be:
P (Y1 = n1, Y2 = n2, . . . , YK = nK) =n!
"i=Ki=i ni!
i=k#
i=1
pi
We evaluated the importance of genes gathering in B. aphidicola genomes and tested functional
relatedness of gathered genes.
34

2.4 Material and methods
2.4.5 Intergenic DNA
The mutational dynamic of non-functional intergenic DNA might shed light on the mechanism
of gene non-functionalisation and disintegration. Genomes undergoing high fixation rates of slightly
deleterious mutations and gene non-functionalisation followed by disintegration are expected to show
shorter intergenic regions after a certain evolutionary time span (Gomez-Valero et al., 2004, 2008).
GRAST investigates the dynamics of the intergenic regions length and tests whether these have
changed in any of the gene categories described in this work (CGSCs, translocated genes or gathered
genes categories) between related genomes with di!erent genome sizes.
2.4.6 Implementation of GRAST
GRAST is written in PERL and consists of a main program called GRAST.pl that uses a number
of other PERL modules. An interface to visualise graphs was built using the PERL module GD.pm.
There are two versions of GRAST one that outputs gif-type files and that uses GD and GD:Graph
modules to create the files, the other version outputs svg-type files and uses GD::SVG modules.
The implementation of the subroutine that calculates the probabilities of gene gathering is com-
plemented by the PERL module Math::BigFloat to deal with the factorial calculations of the number
of translocations. Finally, GRAST can be executed through a user interface or using command line
arguments. The flow of information and functions in GRAST together with the input and output
files generated are depicted in Figure 2.2. Briefly, GRAST takes as input files the GenBank genome
files and extracts the information regarding genome location, direction and amino acid sequences of
genes. Then, GRAST performs mutual BLASTP searches to find orthologous genes in the compared
genomes and extracts gene function information. GRAST also screens for gene duplications by intra-
genomic BLASTP searches and one of the gene copies is removed from later analyses. Finally, GRAST
performs the analyses and generates graphs and output files (Figure 2.2).
2.4.7 Phylogenetic approach for multi-genome comparison
The software GRAST provides the ideal opportunity to investigate the genome dynamics of
intracellular bacteria. It performs a pair-wise comparison of an intracellular bacterium and a close free-
living relative. However, pair-wise comparison only yields information about the di!erences between
the two genomes compared. To accurately identify lineage specific genome dynamics, more genomes are
required and hence phylogenetic comparisons, instead of pair-wise comparisons, should be performed.
In order to perform such comparisons we built additional modules and added them to the previously
35

Chapter 2. Indentifying The Genome Dynamics in Endosymbiotic Bacteria of Aphids
Figure 2.2: Flow-chart of GRAST with all the options requested by the user. Genome files areread, information for individual genes extracted and BLASTP searches performed by GRAST to findorthologous genes between the compared genomes. Analyses are run to find CGSCs, genes gatheringand genes lost and output graphs generated.
36

2.4 Material and methods
published program GRAST (that only permitted pair-wise comparisons) (Toft & Fares, 2006)
Because of di"culties of such a task we finally decided to create a new software based on some
of the ideas from GRAST. The new program, called PhyGRAST, performs a phylogenetic approach
for the comparison between endosymbionts and their free-living relatives. It takes in a phylogenetic
tree and identifies common genes between all genomes analysed, predicts the most likely evolutionary
events the genes have undergone on the branches of the endosymbiotic clade and determines branch
specific and common (again in the endosymbiotic clade) CGSC.
2.4.7.1 Algorithms
Phylogenetic comparisons require several algorithmical steps whose complexity obliges to divide
the code into very small pieces that allow for fast and more e"cient computation of the tasks. Below
I give details of the di!erent algorithms utilised.
Predicting gene table The first task is to determine how genes, in the di!erent genomes, are
related (determining orthologous genes between the genomes). Our first approach was to extend
the one used in GRAST – so performing pair-wise comparison between all genomes in the analysis
and determining orthologous genes by RBH. This method however does not ensure the avoidance of
identifying conflicting pairs of orthologs between the di!erent genomes. We consequently create sets
of genes, where each set maximally contains one gene per genome. We do this in such a way that
closely related genomes are compared first and an initial set of sets is created from which the final set
of sets (gene table) is based on. The algorithm starts by comparing two genomes. Then the software
walks through the tree from the tips towards the root and comparisons are made at the di!erent
phylogenetic levels; genome versus genome (Algorithm 1) , genome versus internal node (set of sets)
Algorithm 1 Genome versus GenomeDetermine orthologous gene pairs between two genome (G1 and G2)for all genes in G1 do
determine orthologues gene in G2 by RBHif e-value is low then
RBH is enough and ortholog have been foundelse
take gene succession into account when determining orthologous geneend if
end for=> This produces a set of sets- each set contains an orthologous gene pair or only one gene where no orthologous genes have beenidentified in the other genome.
37

Chapter 2. Indentifying The Genome Dynamics in Endosymbiotic Bacteria of Aphids
(Algorithm 2) , and internal node (set of sets) versus internal node (set of sets) (Algorithm 3) . Each
of these comparisons has their own sets of conditions and rules.
Branch specific events for individual genes For each of the identified orthologous sets, knowing
information about the state of each the genes in the endosymbiotic genomes, allows to identify the
most likely gene event (gain, loss and retained) on specific branches within the endosymbiotic clade.
There are three states for each set at the leaves of the endosymbiotic clade giving information on the
presence and absence of an ortholog; i) gene is not present in the endosymbiotic genome (state 0),
ii) gene present in the endosymbiotic genome and none of the genomes in the outgroup contains the
gene (state 1), and iii) gene present in the endosymbiotic genome and at least one of the genomes in
the outgroup contains the gene (state 2). For each of the analysed genes we can consequently define
a phylogentic profile. This profile can only be characterised by inferring the ancestral state and they
are defined as follows:
0 when the majority of descendants have lost the gene
1 when the majority of descendants have this gene and it is NOT present in the outgroup
2 when ALL descendants have retained the gene present in the outgroup
3 when equal number of descendants have retained or lost the gene that is NOT present in the
outgroup
4 when some descendants have been lost and other retained the gene that is present in the outgroup.
The branch specific events for each of the sets can now be determined as follows (see also Figure 2.3):
Retained (Figure 2.3 a): when all descendants have retained the gene found in the outgroup – branch
have state 2 and ancestor has state 4.
Gained (Figure 2.3 b): A gene has been gained on a branch if the likelihood of the gene being present
in the ancestor is small. In other words, when the gene has been lost more times than gained
then the ancestor does not contain the gene. A gene is gained on a branch if the branch has
state 1 and the ancestral state is 0.
Lose of genes present in the outgroup (Figure 2.3 c): A gene is lost on a branch if none of the
descendants contain that gene and at least one of the other descendants of the ancestor contains
the gene(the gene is present in the ancestral node). This occurs when the branch has state 0
and the ancestor has either state 2 or 4.
38

2.4 Material and methods
Algorithm 2 Genome versus internal nodeDetermine orthologous genes between genome (G) and internal node (set S of sets s)for all genes in G do
determine a possible orthologues set (si) by RHBif gene finds all genes in sx with RBH and set is the maximal size (so containing one gene from
each of the decendants of the internal node) thena match have been found
elsedetermine a possible orthologues set (sj) by low e-values and gene successionif set sj contains a representative from each of the decendants of the internal node then
a match have been foundelse
try to combine sets that do not overlapend if
end ifend for=> This produces a set of sets- each set contain orthologous genes (a set from internal node + gene from genome), a set frominternal node or only one gene where no orthologous gene has been identified in the genome.
Algorithm 3 Internal node versus internal nodeDetermine orthologous sets between two sets of sets (S1 and S2)for all sets in S1 (s1) do
determine a possible orthologues set (s2j) in S2 for s1i
if all genes in s1i find all genes in s2j with RBH thenif all genes in s2j find all genes in s1i with RBH then
a match have been foundend if
elsedetermine a possible orthologues set (s2k) by low e-values and gene successionif set s2k contains a representative from each of the decendants of the internal node then
a match have been foundelse
try to combine sets that do not overlapend if
end ifend for=> This produces a set of sets- each set contains orthologous genes (a set from each of the internal nodes), or a set from one ofthe internal nodes where no orthologous set have been identified in the other internal node.
39

Chapter 2. Indentifying The Genome Dynamics in Endosymbiotic Bacteria of Aphids
Figure 2.3: Branch specific gene events. Phylogenetic scenarios for retaining a gene at branch x,where all descendants have retained the gene a), for gaining a gene at branch x b), and for losing agene at branch x, where the gene is present at outgroup c) and not present in outroup d).
40

2.4 Material and methods
Figure 2.4: Common and specific CGSC for branches within the endosymbiotic clade. Theblue genes are genes in a CGSC and the light blue show how branch specific CGSC are identifiedfor branch a.
Lose of gene NOT present in the outgroup (Figure 2.3 d): A gene has been lost on a branch if
the likelihood of having that gene present in the ancestral branch is greater than not having it
present. So the same argument as with gained is applicable – the gene is present in the ancestral
node if it has fewer losses than gains. This occurs when the branch studied has state 0 and the
ancestral state is also 0. In the case where the ancestral state is 3, the next ancestral node have
to be examined to determine the most likely state.
Branch common and specific CGSC Determine if certain gene succession has been retained
in ancestral stages. In addition to identifying succession between genes, could help in predicting the
evolutionary chances and pressures the endosymbionic genomes have undergone. To determine branch
specific CGSC we would have to go through a number of steps (Figure 2.4):
1. Determine the overall CGSCs in the outgroup – these will be used as a base for the CGSC in
the endosymbiotic clade
2. Compare the overall CGSC to the gene order in each of the genomes in the endosymbiotic clade
3. Walk back through the tree (leaf to root) to determine common CGSC for each of the branches
in the endosymbiontic clade
4. Walk back through the tree (leaf to root) again to determine lineage specific CGSC by comparing
the common CGSC from the ancestral node with the common CGSC for the branch examined.
41

Chapter 2. Indentifying The Genome Dynamics in Endosymbiotic Bacteria of Aphids
Figure 2.5: Plot of the orthologous gene pairs generated by GRAST. Comparing the reduced genomeB. aphidicola (BAp) with the reference genomes Escherichia coli (a) and Salmonella typhimurium (b).Axes represent positions in each genome in kilo base pairs (Kbp).
The branch specific CGSC are then the gene succession only seen on the branch and not in the
ancestral (branch specific CGSC are the light blue genes in Figure 2.4).
2.5 Sample output and discussion
2.5.1 Genome plot
The genome plot output by GRAST is a combination of di!erent approaches used in existing
software (Figure 2.5 a and b). GRAST plots the genes that have been identified as orthologous pairs
and allows the user to determine the cut-o! value to plot genes in the genome. While it is possible to
set the cut-o! value in programs such as GenomePlot (Choi et al., 2005) and GeneOrder (Celamkoti
et al., 2004), these programs plot all genes that satisfy the cut-o! value as opposed to gene pairs
that have been determined to be orthologues, increasing the risk of finding paralogs. Our approach,
however, is susceptible to missing orthologous genes when the sequences compared are too divergent
(Tatusov et al., 1997), and hence more is conservative.
2.5.2 Identifying lost, retained and non-common genes after genome re-
duction
To qualitatively determine the extent of genome modification between the reduced genome and the
two free-living bacteria genomes GRAST shows the number of common genes conserved after genome
reduction (Figure 2.6 a) and non-common genes from both genomes (Figure 2.6 b). Further, to define
42

2.5 Sample output and discussion
Figure 2.6: The schematic representation by GRAST of the common (a), non-common (b) and bothcommon and non-common genes (c) when comparing B. aphidicola strain Acyrthosiphon pisum (innercircle) to Escherichia coli or Salmonella typhimurium (outer circle).
the extent of gene loss in the reduced genome, GRAST generates a figure showing simultaneously,
genome-specific and shared genes between the genomes compared (Figure 2.6 c). Note that gene
non-functionalisation would be followed by extreme sequence divergence and therefore might not be
identifiable through BLAST searches. Thus, gene loss will hereon refer to either gene disintegration
or non-functionalisation.
Placing genome size modifications, genome rearrangements and gene acquisition in specific time
points of the endosymbiotic bacteria evolution would uncover bacteria group-specific patterns of
genome dynamics. One way to approach this is through multiple genome comparisons. GRAST
is a useful tool to make pair-wise comparisons and to combine the results of multiple comparisons to
get information about the phylogenetically related genomes, which can help to identify branch specific
patterns of gene loss/retention and rearrangements within a phylogeny.
In Toft & Fares (2006) we compared the three fully sequenced genomes (at that time) of B.
aphidicola with their two free-living bacterial relatives Ec and St. This comparison identified events
specific to each branch of the tree by genome pairwise phylogenetic comparisons. Subsequently, we
43

Chapter 2. Indentifying The Genome Dynamics in Endosymbiotic Bacteria of Aphids
created a new version of GRAST to deal with the phylogenetics genome analysis. This software is
called PhyGRAST and is described above. To test PhyGRAST we performed a new comparison,
taking the original genomes plus the newly sequenced genome of B. aphidicola strain Cinara cedri
(Perez-Brocal et al., 2006)(Figure 2.7). For example, genes retained in BBp and in BCc but not in
BSg and BAp are considered to have been lost in the common ancestor of BSg and BAp. Genes
lost in all four B. aphidicola genomes are considered to have been lost in the most recent common
symbiotic ancestor. PhyGRAST analysis clearly shows that, in accordance with previous reports (Silva
et al., 2003; Gomez-Valero et al., 2004), B. aphidicola genomes have been highly static following the
establishment of endosymbiosis and genome reduction, since most of the events may have pre-dated
the split between the four B. aphidicola endosymbionts (Figure 2.7). However, gene loss has not been
homogenously distributed along time as most of the gene non-functionalisation events occurred during
the last 50 MY in the lineages of BAp and BSg (Figure 2.7). This could be due to the loss of important
genes involved in recombination such as recA and recF (Tamas et al., 2002) that has halted the process
of removal of slightly deleterious mutations and hence accelerated the non-functionalisation of genes.
These two genes have been lost in all four lineages but since rearrangement are observed in all three
branches leading from their most common ancestor (data not shown) it would indicate that the loss
of these genes have been independent events. Which can explain the acceleration of gene loss during
the last 50 MY. Calculation of the rate of gene loss in this study gives estimates of 1 gene lost every
6.4 MY during the first 90 MY of B. aphidicola’s evolution and 1 gene loss every 2 MY following the
split giving rise to BAp and BSg. These results give faster rates for gene loss than previous works that
reported 1 complete gene elimination per 5–10 MY during the divergence of BAp and BSg (Tamas
et al., 2002). The phylogenetic distribution of lost genes is very similar to that reported previously
(Silva et al., 2003). Conversely, conserved gene succession clusters (CGSCs) have been conserved
during the last 50 MY after the split giving BAp and BSg with very few lineage specific CGSCs lost
(Figure 2.7) which demonstrates that CGSCs have been under selective constraints. From this we
conclude that the rate of gene function loss in B. aphidicola has accelerated during the last 50 MY
despite genome stasis regarding CGSCs and genome rearrangements.
2.5.3 Conserved gene succession cluster
The frequency and length of CGSCs indicate how conserved the reduced genome is and how many
rearrangements the genome has undergone. Density in CGSCs of the reduced genome was determined
by identifying CGSC in the genomes of Ec, St and BAp (green blocks in Figure 2.8 a). We have also
identified CGSCs that have undergone gene order reversion (red blocks in Figure 2.8 a). The results
44

2.5 Sample output and discussion
Fig
ure
2.7:
Bra
nch
spec
ific
even
tsof
gene
loss
/non
-func
tion
aliz
atio
nan
dC
GSC
sre
arra
ngem
ents
duri
ngth
eev
olut
ion
ofB.ap
hidi
cola
sym
bion
ts.
The
four
B.
aphi
dico
lage
nom
esw
ere
com
pare
dw
ith
thei
rfr
ee-li
ving
bact
eria
rela
tive
sEsc
heri
chia
coli
and
Salm
onel
laty
phim
uriu
m.
Bra
nch
leng
ths
inth
etr
eear
eno
tti
me-
scal
ed.
Cir
cles
repr
esen
tco
mpl
ete
geno
mes
and
red
lines
,gre
enlin
es;b
lue
boxe
sre
fer
tolo
stge
nes,
non-
com
mon
gene
sbe
twee
nge
nom
es,a
ndC
GSC
s,re
spec
tive
ly.
CG
SCs
inea
chlin
eage
indi
cate
clus
ters
reta
ined
inea
chlin
eage
and
lost
inth
eot
hers
.
45

Chapter 2. Indentifying The Genome Dynamics in Endosymbiotic Bacteria of Aphids
Figure 2.8: Schematic representation of the CGSCs rearrangements generated by GRAST. The figurerepresents the density of CGSCs and CGSCs that underwent inversions in the reduced genome (a)and the percentage of the reduced genome and genes lost that belong to CGSCs (b). The number ofgenes within CGSCs and genes lost that belong to CGSCs are also shown (c).
46

2.5 Sample output and discussion
show that specific regions of the reduced genome have a greater density of CGSC than others. These
genome regions may have an important functional role for the organism, given the selective pressure
against gene death and to maintain gene order in these clusters.
Comparison of BAp genome to that of Ec and of St shows that the percentage of genes lost in
the CGSCs is significantly lower than the overall percentage of lost genes (orange bar in Figure 2.8 b).
Random loss of genes in the reduced genome would yield similar values for both the mean percentage
of genes lost in the genome and the mean percentage of genes lost in the CGSCs. Our results,
however, demonstrate that the events of genes lost are significantly low in CGSCs indicating a strong
selective pressure to maintain the composition of genes in these clusters. Genes’ functions have been
asymmetrically lost in the genome of B. aphidicola, with CGSCs being highly static and with inter-
cluster genome regions being hyper-dynamic. On the other hand, comparison of the means, maximum
and medians numbers of genes in individual CGSCs (Figure 2.8 c) highlights the heterogeneity in
the size and the amount of rearrangements in the CGSCs in comparison with the rest of the reduced
genome. Furthermore, most of CGSCs have been retained during the last 50 MY since CGSCs,
present in the ancestor of BAp and BSg, were also detected in these lineages individually (Figure 2.7).
The reason why branch specific CGSC in PhyGRAST does not yield the same result as in Toft &
Fares (2006) is the di!erent ways of identifying orthologous genes between the genomes analysed and
because of the additional genome in the analysis. It should also be noted that the reason for the less
dense CGSC in the ancestor of the endosymbiont is because in Toft & Fares (2006) we used one of
the B. aphidicola genomes to place on the CGSC while in PhyGRAST we used Ec. The results as a
whole however remain unaltered.
2.5.4 Functional categorisation of genes lost in the reduced genome
A number of databases provide information as to the function of the genes present in individual
genomes (COGs; Tatusov et al., 1997). However, no computational tools have been designed to
compare the distribution of genes and genes lost in the di!erent functional categories between two
genomes. GRAST allows the identification of significantly conserved gene functional categories and
the propensity of each category to lose genes. The gene loss between the di!erent functional categories
in BAp, when compared with Ec and with St, is highly heterogeneous (blue bars in Figure 2.9 a and
b). This heterogeneity is also very significant in some functional categories when compared with
the expected value of lost genes (Figure 2.9 a and b). For example, only 28% of genes involved in
translation have been lost compared with the expected 86%. Functional categories that contain a
large percentage of the genes of Ec and of St and where the percentage of genes lost is significantly
47

Chapter 2. Indentifying The Genome Dynamics in Endosymbiotic Bacteria of Aphids
Figure 2.9: (a) and (b) Percentage of genes lost in each of the functional categories described byTatusov et al. (2003) (See Table A.1 for definition of functional categories). Blue bars indicate thepercentage of the genes in a specific functional category that have been lost, yellow bars indicate thepercentage of the genes lost belonging to a specific functional category and the red line indicates theexpected percentage of genes lost in the functional categories.
di!erent from the expectation will be those that are either highly conserved regarding gene non-
functionalisation or have a high propensity to lose its genes.
2.5.5 Gathering of genes
GRAST allows for the investigation of the movement of genes during or after genome reduction
by calculating the probability of the gathering of functionally related genes. To test this probability, a
simulation of the genome rearrangement is performed in the reference genome and in a model genome
that contains the genes found in the two genomes but in synteny with their orthologs in the reference
genome. Performing this analysis with BAp shows that the probability of the observed number of
gene gathering, computed by Equation 2.1, is P (CG) = 1.2924 ! 10!12; P (GGR) = 1.6581 ! 10!3;
P (GGM) = 1.6411 ! 10!7 when compared with Ec and is P (GG) = 3.0494 ! 10!10; P (GGR) =
1.6617! 10!3; P (GGM) = 5.0721! 10!7; when compared with St. Here GG, GGR and GGM refer
to the observed genes gathered and expected genes gathered in the reference genomes and in the
model genome, respectively. The observed probability of genes gathered is significantly lower than the
expectation irrespective of the time point in which rearrangements occurred (before or after genome
reduction). No single events of gene gathering was observed in the last 50 MY of B. aphidicola’s
evolution, which supports previous reports (Silva et al., 2003; Tamas et al., 2002).
The accuracy of the simulations depends on the number of simulations performed. By default 100
48

2.5 Sample output and discussion
Figure 2.10: Distribution of the length of junk DNA in base pairs in the di!erent categories of genedynamics. The junk DNA lengths of the genes belonging to conserved gene succession, translocatedgenes in B. aphidicola, genes lost, genes gathered by translocation or because of the loss of genes be-tween them in the free-living relatives are compared. The junk DNA length in B. aphidicola comparedwith (a) Escherichia coli and (b) Salmonella typhimurium is also shown
simulations are performed in GRAST and the average value of those simulations is taken. The simu-
lations of the model genome however do not always give an accurate prediction of the expected value
after genome reduction because simulations are conducted over the genes present in both genomes. In
the case of B. aphidicola symbionts inaccuracy is meaningless since 98.76% of its genes have orthologs
in the reference genomes.
2.5.6 Non-functional intergenic (junk) DNA
Another parameter that could aid in determining whether genome reduction is an ongoing process
is the distribution of the junk DNA (intergenic DNA) in the reduced genome. The question we
asked was whether a correlation exists between the fact gene pairs have retained succession, are
gathered, translocated or lost in the reduced genome and the length of junk DNA. Comparison of
BAp with Ec and St supports very similar lengths in their intergenic DNA (Figure 2.10 a and b).
Interestingly, genes belonging to CGS present very short junk DNA compared with any of the other
gene categories, indicating that these genes may belong to the same transcription unit. Genes that
have been translocated, gathered or non-functionalised/lost in the reduced genome present significantly
large junk DNA lengths in the reference genomes when compared with the mean junk DNA length
49
Chapter 2. Indentifying The Genome Dynamics in Endosymbiotic Bacteria of Aphids
(Figure 2.10 a and b). This observation suggests a relationship between gene movements and junk
DNA lengths. However, further studies should be performed to confirm this. Also, in contrast to
previous reports (Gomez-Valero et al., 2004), the mean and median length of intergenic DNA is
slightly longer for BAp than for Ec and St, although this di!erence is not significant.
2.6 Conclusion
Full genome comparisons are a powerful tool to investigate the most dramatic genome rearrange-
ments between close relatives with either similar or di!erent genome sizes. At present a number of
software tools are available to perform di!erent kinds of comparative genomic analyses although no
computational tools provide ways to investigate genome dynamical change under a particular biological
phenomenon. GRAST and PhyGRAST o!er a user-friendly tool to investigate genome rearrangements
following genome reduction. The comparison of the endosymbiotic bacteria of aphids B. aphidicola
with its closest free-living relatives Ec and St using GRAST and PhyGRAST suggests that genome
reduction has been followed by complex dynamics of genome rearrangements. We demonstrate that
gene movements have been under a selective pressure to keep functionally related genes gathered and
to maintain specific genes physically and functionally clustered and in synteny with the ancestral
genome. Also, we uncover heterogeneous selective pressures on genome rearrangements amongst B.
aphidicola lineages using the implemented PhyGRAST. We observe that, in contrast to individual
genes, CGSCs have been maintained unaltered during the last 50 MY of the B. aphidicola’s evolution.
Moreover, junk DNA seems to present more complex dynamics and more detailed studies are needed
to explore these dynamics. Further studies including other intra-cellular bacteria will demonstrate
that this analysis has only uncovered the tip of the iceberg.
Even though we have investigated the genome dynamics in the four fully sequenced genomes of B.
aphidicola, we have only scraped the surface of the complex genomic dynamics. We re-observed that
the genome reduction in B. aphidicola has been enormous when comparing with their close free-living
relatives. When the reduction in the genome size is so large, one would expect that only important
genes have been kept. In such genes coding for proteins in presumably redundant pathways would have
been lost over time. We expect redundant pathways to be those that are either related to free-living
lifestyle or alternatively output products that are provided by the host. If some of these pathways have
been kept one could hypothesize that the product(s) now perform a new function in the bacterium.
50

2.7 Acknowledgements
2.7 Acknowledgements
The authors are thankful to Simon Travers for helpful comments on the manuscript. This work
was supported by Science Foundation Ireland, under the program of the President of Ireland Young
Researcher Award to M.A.F, and the Irish Council for Science, Engineering and Technology and the
John & Pat Hume Scholarship to C.T. Conflict of Interest: none declared.
51

Chapter 3
The Evolution of a ‘Redundant’
Pathway: The Flagellar Assembly
Pathway
3.1 Related publications
Toft C and Fares MA. The evolution of the flagellar assembly pathway in endosymbiotic bacterial
genomes.
Molecular Biology and Evolution. 2008 25:2069-2076.
This chapter follows closely the contents of the above article, although sections like introduction,
and results and discussion have been rewritten or extended to better contextualise the other chapters
and/or to give further depth to the subject.
3.2 Abstract
Genome shrinkage is a common feature of most intra-cellular pathogens and symbionts. Re-
duction of genome sizes is among the best-characterised evolutionarily parsimonious ways whereby
intra-cellular organisms save and avoid maintaining expensive redundant biological processes. En-
dosymbiotic bacteria of insects are examples of biological economy taken to completion because their
genomes are dramatically reduced keeping only genes necessary for the bacterium and the host. These
53

Chapter 3. The Evolution of a ‘Redundant’ Pathway: The Flagellar Assembly Pathway
bacteria are non-motile and their biochemical processes are intimately related to those of their host.
Because of this relationship, many of the processes in these bacteria have been either lost or have
su!ered massive re-modelling to adapt to the intra-cellular symbiotic lifestyle. An example of such
changes is the flagellum structure that is essential for bacterial motility and infectivity. Our analy-
sis indicates that genes responsible for flagellar assembly have been partially or totally lost in most
intra-cellular symbionts of gamma-Proteobacteria. Comparative genomic analyses show that flagellar
genes have been di!erentially lost in endosymbiotic bacteria of insects. Only proteins involved in
protein export within the flagella assembly pathway (type III secretion system and the basal-body)
have been kept in most of the endosymbionts whereas those involved in building the filament and hook
of the flagella have only in few instances been kept, indicating a change in the functional purpose of
this pathway. In some endosymbionts, genes controlling protein-export switch and hook length have
undergone functional divergence as shown through an analysis of their evolutionary dynamics. Based
on our results we suggest that genes of the flagellum have diverged functionally to specialise in the
export of proteins from the bacterium to the host.
3.3 Introduction
Genome streamlining in endosymbiotic bacteria of insects represents one of the most striking
examples of the pressure of selection towards generating highly fit organisms with minimum energy
waste. The dynamics of genome rearrangements and shrinkage is rather di"cult to describe and, as
shown in the previous chapter, di!erent patterns of such dynamics may emerge as a result of the
organism’s lifestyle. Reports attempting to provide a mechanistic explanation for such evolutionary
genome dynamics share the conclusion that bacterial genome size and composition is highly dependent
on the environmental (ecological) conditions under which bacteria replicate.
Bacteria live under a myriad of di!erent ecological niches that go from highly harsh surroundings
(for example extremophiles) to very protected environments (for example, intra-cellular housed bac-
teria). Because of di!ering ecological niches bacterial genome sizes can range between 9.2 Mb in the
soil-borne bacterium Myxococcus xanthus (Stepkowski & Legocki, 2001) and 0.45 Mb in the smallest
of the primary symbiotic bacteria of aphids, Buchnera aphidicola Cinara cedri (Gil et al., 2002). This
genome reduction is common for most obligate intra-cellular bacteria and parasites Moran & Werne-
green 2000; Gil et al. 2002. The intimate relationship between the two organisms of the symbiotic
system is believed to be responsible for the reduction in the bacterial genome size, thus saving energy
through the removal of unnecessary redundant genes (Andersson et al., 1998). In addition, endosym-
54

3.3 Introduction
biotic bacteria go through severe population bottlenecks in the infection of new insect generations
increasing the chance of passing mildly deleterious mutations into the next generations. These muta-
tions are subsequently fixed in the bacterial population by the lack of the recombination apparatus
(Gil et al., 2003) and this increase in the mutational load inactivates protein-coding genes, which is
followed by gene disintegration (Moran, 1996; Andersson et al., 1998; Ochman & Moran, 2001). The
stable cellular environment provided by the host cell and the presence in some cases of secondary
symbiotic bacteria providing biosynthetic components lacking in the primary symbiont (Perez-Brocal
et al., 2006) renders most of the mechanisms associated with the free lifestyle redundant in endosym-
biotic bacteria. The flagella structure is an example of a complex structure which confers motility to
free living bacteria, and the function of which has become redundant in endosymbiotic bacteria.
The flagellum is characterised by a long rotating helical propeller called the filament that is
anchored to a basal body of proteins in the cell envelope through the action of a flexible hook (Macnab,
2003) (see Figure 3.1 a for schematic representation of the bacteria flagellar assembly pathway). The
basal body is a passive structure where the motor of the flagellum is attached and in which the
transport system of the flagellum is located. The transport system of the flagellum has an important
role in controlling the nature, amount and tempo of protein export outside the cell. The flagellar
structure is hollow and this allows proteins to be exported to the right place during the construction
of this structure, consequently it grows from the base towards the tip. The tight temporal and mode
control necessary to build such a structure has resulted in the evolutionary ordering of the flagellar
assembly genes into three operons (namely; class 1, 2 and 3). Genes belonging to each one of these
operon classes can be regulated negatively or positively by genes in the other two operons. Operon
1 contains the genes that encode the master-switch (flhDC ) of the flagellar assembly pathway, which
initiates and controls transcriptions of genes in class 2 (Liu & Matsumura, 1994). Class 2 contains genes
coding for the basal body, hook, transport system, sigma factor (FliA) that initiates the transcription
of class 3 (Ohnishi et al., 1990; Liu & Matsumura, 1995) and the anti-sigma factor (FlgM) that controls
when the sigma-factor is turned on. The activation of the sigma factor is controlled by the anti-sigma
factor and by the completion of the basal body and hook structures (Chadsey et al., 1998). Once this
structure is completed and the anti-sigma factor exported from the cell, the sigma factor switches to
an active state. Operon 3 contains genes encoding the construction of the hook-filament junction,
filament and cap.
The energy cost involved in synthesising the flagellar apparatus is significant, conferring a growth
disadvantage of about 2% (for example a non-motile population overtakes a motile bacterial population
in 10 days, (Macnab 1996)). This cost slows significantly the growth rate of bacteria (Kutsukake &
55

Chapter 3. The Evolution of a ‘Redundant’ Pathway: The Flagellar Assembly Pathway
Iino, 1994). However, in free-living bacteria these disadvantages are compensated for by the increased
capacity provided by the flagella to compete for resources, and to avoid toxic chemicals through
chemotaxis. In addition, many of the proteins of the flagellar pathway are involved in protein export,
especially in the export of virulence factors (Young et al., 1999). Flagella motility is an ancient system
pre-dating the divergence of archaebacteria and prokaryotes and the export function may have thus
evolved from proteins of the flagellum. However, in non-motile bacteria, such as the obligate intra-
cellular symbiotic bacteria of insects, the presence of flagella is unnecessary and energy expensive
unless proteins involved in flagella pathway are also involved in other essential functions for the
bacterium or the host. Indeed, endosymbiotic bacteria such as Buchnera aphidicola are non-motile
and have consequently lost most of the genes involved in the assembly of the flagellum (Maezawa
et al., 2006). Many other endosymbionts having a similar endosymbiotic lifestyle and belonging to
the gamma-Proteobacteria, such as Blochmannia floridanus or Blochmannia pensylvanicus (Gil et al.,
2003) and Baumannia (Wu et al., 2006) have also lost most of the genes in this pathway. Other
symbionts, such as Wigglesworthia glossinidia, which has been thought to have a motile phase when
transmitted between host generations, retained most of the flagellar assembly pathway (Akman et al.,
2002).
The four fully sequenced B. aphidicola genomes still have a large subset of the flagellar assembly
genes retained in the genome (Shigenobu et al., 2000; Tamas et al., 2002; van Ham et al., 2003; Perez-
Brocal et al., 2006). Many of the fli and flg genes homologs, involved in flagellar biosynthesis and
protein export, show strikingly high amino acid divergence levels in the B. aphidicola lineage compared
to its free-living relatives (Tamas et al., 2002). This observation led authors to the suggestion that
these genes may have very likely changed their function after the establishment of symbiosis. Later,
Maezawa and colleagues (Maezawa et al., 2006) reported the existence of hundreds of flagellar hook and
basal body structures that lacked the filament part of the flagellum, supporting previous suggestions of
the possible specialisation of these genes in protein export from the bacterium to the host (Shigenobu
et al., 2000). A recent study has claimed the possible pathogenic and invasive role of the remaining
flagellar genes in B. aphidicola (Moya et al., 2008), although most of the flagellar proteins that are
likely to be involved in pathogenesis have been lost in these bacteria. The flagellar pathway in
endosymbiotic bacteria may represent therefore an example of reverse evolution dependent on the
bacterium lifestyle whereby the ancient function of the flagella (cell motility) has been replaced by a
new function (protein export), these mutational dynamics may be governed by the bacterium, but are
most likely governed by the host selection dynamics. Thus, it becomes crucial to uncover the role of
“flagellar” genes in endosymbiotic bacteria to understand the biological way whereby bacterium and
56
3.4 Material and methods
host communicate. However, the implication of the presence of flagellar proteins in the export system
of proteins from the endosymbiont to the host remains to be investigated.
Here we test the hypothesis of reverse evolution of the flagellum biosynthesis pathway through
comparative genomic analyses. We show that: i) There has been a progressive disintegration of genes
correlated with the intra-cellular symbiosis process; ii) There is a di!erential loss of flagellar genes and
functional gene divergence in the di!erent primary symbiotic bacteria of aphids; and iii) The retained
genes have possibly been selected for protein export to the host.
3.4 Material and methods
To test the hypothesis of functional divergence of flagellar genes and di!erential gene loss between
the endosymbiotic bacteria of insects we first conducted a comparative genomic analysis of the genomes
available for the endosymbiotic bacteria of insects and then we studied the changes in the evolutionary
dynamics of these genes.
3.4.1 Genomes, genes and alignments
The full list of genes involved in flagellar assembly in Escherichia col i (Ec: NC_000913) was
taken from table 1 in Macnab 1996. Orthologous genes were determined by reciprocal best hits per-
forming blastp searches of the amino acid sequence of these genes between the Salmonella typhimurium
(St : NC_003197), B. aphidicola endosymbionts of Acyrthosiphon pisum (BAp: NC_002528), Schiza-
phis graminum (BSg : NC_004061), Baizongia pistaciae (BBp: NC_004545), Cinara cedri (BCc:
NC_008513), endosymbiotic bacteria of the carpenter ants Candidatus Blochmannia pennsylvanicus
(Bp: NC_007292) and Blochmannia floridanus (Bf : NC_005061), and the endosymbiont of the tsetse
fly Wigglesworthia glossinidia (Wg : NC_004344). Only reciprocal best top-hits with scores of less or
equal to 10!4 were accepted. We utilised the cluster of orthologous groups (COG) files from NCBI
for the genomes to identify genes involved in flagellar assembly by looking at their gene names and
products.
For each one of the genes we subsequently built multiple protein sequence alignments using
ClustalW (Thompson et al., 1994) using the default parameters. Then we obtained protein-coding
sequence alignments concatenating nucleotide triplets according to their corresponding protein align-
ments. We also built multiple sequence alignments for the complete set of genes in common among
the symbiotic and free-living bacterial genomes for downstream evolutionary analyses. All multiple
sequence alignments were carefully inspected.
57

Chapter 3. The Evolution of a ‘Redundant’ Pathway: The Flagellar Assembly Pathway
3.4.2 Analysis of evolutionary rates
We estimated the number of substitutions per non-synonymous site (dN ) and number of muta-
tions per synonymous site (dS) using the modified Nei and Gojobori method (Nei & Gojobori, 1986)
implemented in the program PAML v4 (Yang, 1997). Because of the bias in AT content in endosymbi-
otic bacteria of insects we sought to obtain accurate estimates of these parameters by applying several
maximum-likelihood models implemented in PAML. The models applied were M0, M1, M2, M3, M7
and M8 (see Yang & Nielsen (2000) for detailed explanation of these models). We then obtained the
mean values for dN and dS under the appropriate model. To determine the best model explaining
our data and phylogenetic tree, we compared the models’ log-likelihood values using the likelihood-
ratio test. Here we assumed that synonymous substitutions are neutrally fixed since they produce no
changes in the amino acid composition of proteins. In theory the number of synonymous substitutions
per site is proportional to the time since the species diverged. Based on this, the ratio between dN and
dS is a good measure of the force of selection acting on a particular protein. In order to identify shifts
in the evolutionary rates due to the intra-cellular lifestyle of the endosymbiotic bacteria in each one of
the genes, we compared the non-synonymous-to-synonymous rates ratio (") for the pairwise compar-
ison BAp-BSg with that for the comparison of Ec-St, by dividing the ratios (R = !BAp!BSg/!Ec!St).
We implemented this comparison because both pairs of species have been estimated to present similar
divergence dates. The hypothesis tested in these comparisons was whether R was maintained at 1
(no change in selective constraints), R > 1 (relaxed selective constraints in the endosymbiotic bac-
teria), R < 1 (increased selective constraints in the endosymbiotic bacteria). It is noteworthy that
saturation of synonymous sites due to nucleotide compositional bias in endosymbiotic genes makes
our analyses and conclusions conservatives because such saturation would lead to inflated " values
and would yield therefore significantly higher R-values, which would be interpreted as evidence in
support of the null hypothesis of no functional divergence in endosymbiotic proteins. To conduct this
comparison in BBp, we estimated first the " values for the pairwise sequence comparisons using the
Nei and Gojobori method. Then we estimated the " value for the branch leading to BBp as follows:
"BBp =
12 (!BBp!BAp+!BBp!BSg)+ 1
2 (!BBp!Ec+!BBp!St)
! 14 (!BAp!Ec+!BAp!St+!BSg!Ec+!BSg!St)
2
We also conducted the same approach but estimating dN and dS for each branch of the tree and
obtaining " per branch using these values, yielding almost identical results.
To test the significance of the R-values for each one of the flagellar genes, we first estimated
R-values for the full set of genes present in free-living and endosymbiotic bacteria of aphids (See
58

3.5 Results and discussion
Table B.1). Then we re-sampled 10,000 replicates from the distribution of R-values and identified the
median and threshold R-values below which we consider R significant [P(R) < 0.05)].
3.5 Results and discussion
3.5.1 Di!erential loss of flagellar genes in endosymbiotic bacteria
Comparative genomic analysis of the seven endosymbiotic bacteria of insects (BAp, BSg, BBp,
BCc, Bf, Bp and W g) and the two free-living bacteria (Ec and St) indicate that the loss of flagellar
genes is indeed associated to the intra-cellular life, with all the intra-cellular symbionts presenting lack
of an important percentage of flagellar genes (Figure 3.1 and Table 3.1). The di!erent endosymbionts
however showed di!erent degrees of gene loss, going from complete lack of flagellar genes (in Bf and
Bp) to a very partial gene content (in BCc) or to a greater flagellar genes representation (in BAp
and BSg) (Figure 3.1 and Table 3.1). In contrast, Wg have conserved most of the flagellum genes,
suggesting that the flagellum is of importance for the lifestyle of this bacterium and could facilitate
the transmission to intrauterine progeny (Aksoy & Rio, 2005).
Genes involved in the biosynthesis of flagella are organised into three classes of operons (class
1, 2 and 3) with the expression of the next class (for example class 2) requiring the expression of
the previous transcriptional class (for example class 1) (Kutsukake et al., 1990). The first class, also
named master operon (flhDC ), includes two genes and they are essential for positive transcriptional
activation of class 2 operons, that contains genes whose products are required for the morphogenesis
of the hook and basal body (Jones & Macnab, 1990). Finally Class 3 operons include late-expression
genes such as the motor torque generator subunits MotA and MotB, chemotaxis proteins, and the
flagellin proteins FliC and FljB (Macnab 1996). The two genes of the master operon have been lost
in all B. aphidicola lineages (Figure 3.1 and Table 3.1). It has been shown that when these two genes,
flhC and flhD, are mutated in Ec and St, cells become non-motile and non-flagellated (Wang et al.,
2006). Most of the genes belonging to class 2 operons have been retained in B. aphidicola, as well as
some of the structural flagellar proteins (Table 3.1). Regarding the structural proteins of the hook,
we observed di!erential conservation between the di!erent B. aphidicola primary symbionts (Figure
3.1 and Table 3.1). For example, genes flgE, flgD and flgK have been retained only in BAp and
BSg, but not in BBp or in BCc. Also, the gene that encodes the protein determining the length of
the hook (fliK ) has been retained in the three largest B. aphidicola primary endosymbionts (BAp,
BSg and BBp). Most of the genes therefore belonging to class 3 operons have been lost in the four
B. aphidicola endosymbiotic lineages including (motA, motB) together with all the genes encoding
59

Chapter 3. The Evolution of a ‘Redundant’ Pathway: The Flagellar Assembly Pathway
Figure 3.1: Schematic diagram of the bacterial flagellar assembly pathway, excluding the bacteriachemotaxic pathway. (a) The flagellar assembly pathway as observed in Escherichia coli (Ec) andSalmonella typhimurium (St). The four fully sequenced genomes of the endosymbiont B. aphidicolaonly contain part of this pathway/structure. All four endosymbiont have lost the regulatory genesof the pathway and they have all retained most of the type III export apparatus proteins. (b) B.aphidicola Acyrthosiphon pisum (BAp) and B. aphidicola Schizaphis graminum (BSg) have retainedthe Basal Body and Hook. (c) B. aphidicola Bayzongia pistaciae (BBp) has farther reduced thepathway to only the Basal Body. (d) B. aphidicola Cinara cedri (BCc), the smallest of the four B.aphidicola genomes, has reduced the gene number codifying for the Basal Body. Outer membrane(OM); Peptidoglycal layer (PG); and cytoplasmic membrane (CM) are indicated. The purple proteins(FliJST, FlgADN) are chaperones and they are linked through connectors to their specific clientproteins. Proteins names in blue (FlgDJ) are those forming the temporary caps. This figure isredrawn with permission from the original authors (Minamino & Namba, 2004).
60

3.5 Results and discussion
Table 3.1: .Events of gene loss among the endosymbiotic bacteria of aphids in the flagellar assemblyparthway. Presence of a gene is represented by its locus tag for the corresponding species whereasabsence or loss is represented by (-).
BAp BSg BBp BCc Description
Master ControlFlhC - - - - Master regulatorFlhD - - - - Master regulatorRegulatorsFliK BU079 BUsg072 bbp073 - Hook-length controlFliZ - - - - Regulator of FliA activityFliA - - - - !28 factorFlgM - - - - Anti-! factor for FliAChaperonsFliJ BU077 BUsg071 bbp072 - Genereal chaperonFlgA BU336 BUsg324 - - Chaperone for FlgIFlgN BU335 BUsg323 - - Chaperone for FlgKLFliS - - - - Chaperone for FliCFliT - - - - Chaperone for FliDMotor control complexFliG BU074 BUsg068 bbp069 BCc_044 Motor/switchFliM BU080 BUsg073 bbp074 - Motor/switchFliN BU081 BUsg074 bbp075 BCc_047 Motor/switchFlgH BU343 BUsg331 bbp314 BCc_212 Basel-body L ringMotA - - - - Motor proteinMotB - - - - Motor rotation proteinFlgB BU337 BUsg325 bbp310 - Basal-body rodFlgC BU338 BUsg326 bbp311 - Basal-body rodFlgF BU341 BUsg329 bbp312 BCc_211 Basal-body rodFlgG BU342 BUsg330 bbp313 - Basal-body rodFlgJ BU345 BUsg333 bbp316 - Temporary rod capFlgI BU344 BUsg332 bbp315 BCc_213 Basel-body P ringFliF BU073 BUsg067 bbp068 BCc_043 Basal-body MS-ringFliE BU072 BUsg066 bbp067 - Basal-bodyFlagellar export apparatusFlhA BU241 BUsg236 bbp223 BCc_151 Export pore proteinFlhB BU240 BUsg235 bbp222 BCc_150 Export pore proteinFliO - - - - Biosynthesis proteinFliP BU082 BUsg075 bbp076 BCc_048 Biosynthesis proteinFliQ BU083 BUsg076 bbp077 BCc_049 Biosynthesis proteinFliR BU084 BUsg077 bbp078 BCc_050 Export pore proteinFliH BU075 BUsg069 bbp070 BCc_045 Biosynthesis proteinFliI BU076 BUsg070 bbp071 BCc_046 ATPaseHook and filamentFlgE BU340 BUsg328 - - Hook proteinFlgD BU339 BUsg327 - - Temporary hook capFlgK BU346 BUsg334 - - Hook-filament junctionFlgL - - - - Hook-filament junctionFliC - - - - FilamentFliD - - - - Filament Cap
61

Chapter 3. The Evolution of a ‘Redundant’ Pathway: The Flagellar Assembly Pathway
the proteins of the hook, hook-filament junction and filament. The lineage formed by BAp and BSg
however represents an intermediate stage with some of the genes encoding for the hook and hook-
filament junction, belonging to class 3 operons, having been retained (Figure 3.1 and Table 3.1). Genes
from the class 3 operon have a positive transcriptional control over the master operon FlhDC through
the protein FliZ. FliZ however is not present in any of the B. aphidicola endosymbionts, coinciding
with that FlhDC has also been lost in these bacteria. Further, the # factor 28 (FliA) that has a
negative transcriptional control over the master operon and its anti-# factor FlgM has also been lost
in all B. aphidicola endosymbiont lineages. So in general they have lost all the genes involved in the
regulation of the flagellar assembly pathway.
In sharp contrast to the case of genes involved in biosynthesis of the flagellum, the protein
export system of the flagellar proteins has been almost completely retained in the four B. aphidicola
endosymbionts analysed. Because most of the genes involved in hook-filament junction and filament
biosynthesis have been lost in B. aphidicola endosymbionts, the export system may be more specialised
in exporting proteins to the host. However, this mechanism does not seem to be a general feature in
endosymbiotic bacteria of insects because neither Bf nor Bp retained any of these export proteins.
In addition, a parsimony based analysis of the distribution of gene loss in the phylogenetic tree of B.
aphidicola (Figure 3.2) puts forward the conclusion that most of these gene losses have occurred in
the most common symbiotic ancestor as well as in the lineages leading to BBp and BCc. We could
not find events specific to BAp or BSg, which is in agreement with the genome stasis previously shown
for these bacteria (Tamas et al., 2002). The question remaining to be answered is why BAp and BSg
present a di!erential gene loss in comparison with BBp or BCc?
3.5.2 Di!erential selective pressures among flagellar genes
Endosymbiotic bacteria of insects have small population sizes, do not undergo recombination, and
are maternally transmitted in a strictly clonal manner through tight population bottlenecks (Funk
et al., 2000, 2001). The consequence of this transmission dynamic is the fixation of mildly deleterious
mutations due to genetic drift and the irreversible decline in fitness (Muller, 1964). This decline in
fitness may be compensated by the increasing bu!ering activity of the heat-shock protein GroEL
coupled with its constitutive over-expression (Fares et al., 2002b) or its optimised folding activity
bu!ering consequently the e!ects of mildly deleterious mutations on proteins’ structures (Fares et al.,
2002a). Small populations of asexual organisms, such as the endosymbiont of B. aphidicola, show
increased rates of sequence evolution when the amount of mildly deleterious mutations is substantial
(Ohtaka & Ishikawa, 1993). As shown by Moran (1996), the increased rates of evolution should only
62

3.5 Results and discussion
Figure 3.2: Schematic representation of events of gene loss or functional divergence for the flagellarassembly pathway in aphids’ endosymbionts. Arrows leading o! branches indicate gene loss whereas anarrow looping back onto the branch indicates the gene(s) (are red) have possibly undergone functionaldiverges. The genes in blue are those that are lost in both the branch leading to B. aphidicola Byzongiapistaciae (BBp) and B. aphidicola Cinara cedri (BCc). Caution however must be taken because ofthe phylogenetic position ambiguity of BCc. The dates of the splits are only approximate dates: B.aphidicola Acyrthosiphon pisum (BAp) and B. aphidicola Schizaphis graminum (BSg) are thought tohave split 50-70 MYA, the most common symbiotic ancestor is thought to date back 150-250 MYA.The free-living bacteria Escherichia coli (Ec) and Salmonella typhimurium (St) are thought to havediverged approximately100 MYA.
a!ect amino acid sites under selection since neutral sites are independent of the population structure.
We therefore expect selective constraints to be relaxed over functional sites and consequently the
ratio of non-synonymous-to-synonymous mutations rate may have increased. Although this may be
true for the vast majority of genes in the endosymbiont, several circumstances may challenge this
outcome. For example, in highly essential genes that present no selective flexibility to mutations, the
evolutionary rate may be maintained in endosymbionts in comparison with free-living bacteria due to
the unavoidable deleterious e!ects that mutations have on these genes. In addition, genes that have
functionally diverged in endosymbionts to accommodate their function to a new lifestyle (intra-cellular
life) may have undergone selective shifts presenting evolutionary rates that are equal or lower than
those in free-living bacterial genes. We tested the functional divergence of kept flagellum genes in
B. aphidicola towards other functions di!erent from their original ones, for example divergence for
protein export. For that purpose we compared the strength of selection in endosymbiotic genes in
comparison with their free-living cousins by dividing " values estimated for the comparison BAp and
BSg by that estimated for the comparison of Ec and St (R = !BAp!BSg/!Ec!St).
Due to the fact that B. aphidicola cells are non-motile and their flagella have lost components
associated with the hook and the entire set of filament proteins, we expect a change in the function
63

Chapter 3. The Evolution of a ‘Redundant’ Pathway: The Flagellar Assembly Pathway
Figure 3.3: Comparative genomic analysis of selective constraints between endosymbiotic bacte-ria and their free-living relatives. We divided the non-synonymous-to-synonymous rates ratio esti-mated for the comparison of B. aphidicola Acyrthosiphon pisum (BAp) and B. aphidicola Schizaphisgraminum (BSg) by that estimated for the comparison of Escherichia coli (Ec) and Salmonella ty-phimurium (St) (R = !BAp!BSg/!Ec!St) for the genes of the flagellar assembly pathway (a). Thenwe estimated R for the complete set of genes in the genome of endosymbionts (b) and tested thesignificance of the R values of the flagellar genes against a distribution of 10,000 pseudo-randomlysampled R from the 520 genes examined. We then identified significant R-values at the 5% confidence(c).
of the proteins in that pathway towards the export of proteins from the bacteria to the host. Most
of the genes examined in this pathway showed greater increase (lower selective pressures) in the "
values for endosymbionts compared with their free-living relatives ("BAp!BSg % "Ec!St) (Figure3.3
a). However, in a few instances, the rate of evolution was slower in the endosymbiont than in the
free-living relatives. Such was the case of genes encoding the C ring proteins (FliMN), hook-filament
junction and hook proteins (FlgK and FlgE), basal body MS ring protein (FliF) and FliK protein
responsible for the hook length control (Figure 3.3 a and Table 3.2). Proteins from the C-ring and
FliK are intimately coordinated during the export of hook proteins in free-living flagellated bacteria.
Aside from its role as hook-length controller, FliK has also been shown to be involved in the initiation
64

3.5 Results and discussion
Table 3.2: Analysis of functional divergence in flagellar genes in the endosymbiont of B. aphidicola.
Operon Gene "Ec!Sta "BAp!BSg
b Rc Structured
Class 2 fliH 0.0764 0.2286 2.9924 ExportfliI 0.0383 0.0465 1.2154 ExportfliJ 0.0256 0.0417 1.6289 General chaperoneflhA 0.0247 0.0445 1.8063 ExportflhB 0.0434 0.1367 3.1482 ExportfliR 0.0577 0.1395 2.4173 ExportfliQ 0.0131 0.0372 3.1409 ExportfliP 0.0287 0.0417 1.4521 ExportfliG 0.0252 0.1874 7.4486 Rotor/switch proteinfliF 0.0807 0.0609 0.7549 MS-ringfliM 0.2080 0.1468 0.7058 C-ringfliN 0.0832 0.0756 0.9093 C-ringfliE 0.0885 0.1786 2.0197 Proximal rodflgA 0.1673 0.1705 1.0191 Chaperone for P-ring proteinflgB 0.0672 0.0884 1.3153 RodflgC 0.0366 0.0525 1.4321 RodflgI 0.0355 0.0626 1.7625 P-ringflgF 0.0421 0.1141 2.7109 RodflgH 0.0237 0.0753 3.1784 L-ringflgG 0.0028 0.0139 4.8694 Distal rodflgJ 0.0386 0.1177 3.0529 Temporal rod capflgE 0.0547 0.0618 0.8661 HookfliK 0.2225 0.1181 0.5310 Control hook lengthflgD 0.0672 0.1192 1.7728 Temporal hook cap
Class 3 flgK 0.0988 0.0355 0.3597 First hook-filament junctionflgN 0.0470 0.0566 1.2043 Chaperon for hook-filament junction proteins
anon-synonymous-to-synonymous rates ratio estimated by the modified method of Nei and Gojobori for thecomparison between the sequence of Escherichia coli (Ec) and Salmonella typhimurium (St).
bnon-synonymous-to-synonymous rates ratio estimated by the modified method of Nei and Gojobori for the compar-ison between the sequence of the endosymbionts
cThe Ratio between the ratios of non-synonymous-to-synonymous rates of free-living bacteria Escherichiacoli and Salmonella typhimurium (Ec-St) to that of endosymbiotic bacteria B. aphidicola strains Acyrthosiphonpisum and Schizaphis graminum (BAp-BSg).
dThe structure of the flagella that the protein codified by that particular gene belongs to
65

Chapter 3. The Evolution of a ‘Redundant’ Pathway: The Flagellar Assembly Pathway
of the switch in export substrate specificity (Hirano et al., 1994; Koroyasu et al., 1998). However, the
detailed role of FliK and its coordinated function with proteins from the C-ring is under continual
debate. The involvement of both types of proteins in protein export is supported by several data. For
instance, the C-terminal 87 residues of FliN have sequence homology to Spa33, a protein implicated
in the protein transmembrane export in Shigella flexneri (Tang et al., 1995). Furthermore, FliM
and FliN form a stable FliM1FliN4 solution complex (Brown et al., 2005) and FliM is known to have
chemotaxis activity important for the orientation of the bacterial movement in the medium (Bren &
Eisenbach, 1998). A change in the selective constraints in FliM may have conducted its functional
divergence towards sensing the concentration of exported proteins from B. aphidicola cells and thus
maintaining thus a balance between exported and produced proteins by the cell. FliK regulates FlgK
and FlgE and the functional divergence of these proteins may have conferred them separate but related
functions. Finally, FliF acts as a structural link between the S and M rings through which proteins are
exported. To test the significance of low R-values for these genes, we conducted a genomic comparison
of BAp and BSg versus Ec and St and calculated the R-values for each one of the genes present in all
four genomes (Table B.1) and plotted these values along the genome (Figure 3.3 b). Plotting RFLiK,
RFliM, RFliN, RFlgE, RFliF and RFlgK in the distribution of R-values shows that some of these values
are significantly smaller than expected (Figure 3.3 c).
To determine whether these selective constraints are general among endosymbionts of aphids, we
measured " for the branch leading to BBp and compared this value with that obtained for free-living
bacteria Ec and St. The analysis showed that all of those flagellar genes that presented low R values
in the comparison of BAp-BSg to Ec-St had values of R > 1 in the BBp lineage. Interestingly, some
of the genes presenting very high R values in BBp (FliM, FlgG) have been lost in the most reduced
B. aphidicola genome BCc. This indicates that the reduced genome of BCc may be the results of
systematic disintegration of genes encoding proteins with low structural stability possibly leading to
a strongly evolutionarily static genome. This also supports the view that BCc genome may represent
the smallest possible set of genes necessary for the maintenance of symbiosis, although this view may
be challenged by the triangular relationship established by BCc, the host and the secondary symbiont
(Perez-Brocal et al., 2006). In addition, FlgD and FlgE that interact with FliK have been lost in BBp
where FliK present values of R > 1, suggesting that no functional divergence has occurred in FliK in
this B. aphidicola lineage. Furthermore, Blastp searches of FliK in BBp against the other bacteria
only found homologs in other B. aphidicola but not in the free-living relatives, suggesting that FliK
diverged functionally after the speciation event giving the lineages of BAp and BSg.
In conclusion, this work suggests that flagellar genes in endosymbiotic bacteria of insects belonging
66

3.6 Acknowledgements
to the gamma-proteobacterium group seem to have undergone species-specific functional divergence
events to adapt to the new environment and to become specialised in exporting proteins from the
bacterium to the host. Our results however only support this hypothesis and do not definitively
demonstrate such a role. This work provides further support to the possible tight metabolic and
biochemical communication between the endosymbiotic bacterium and its insect host. Further exper-
imental work that targets specifically genes shown here to be under functional divergence (fliK, fliM,
fliN and flgK ) may shed light on the veracity of these hypotheses.
Even though we have investigated the evolutionary peculiarities of a rather highly transformed
pathway as a result of an astonishing revolution in the lifestyle of a bacterium, the generality of such
patterns in other pathways requires investigation. This investigation may shed light on the main
metabolic pathways responsible for the stability of endosymbiosis. In addition, issues such as selective
pressures on protein structure and folding evolvability particularly in B. aphidicola and in endosym-
biotic bacteria of insects in general and its relationship with these metabolic/functional novelties may
aid at unearthing novel evolutionary dynamics that are strongly pinpointed by a biological system
wandering at the edge of extinction.
3.6 Acknowledgements
This work was supported by a grant from the Irish Research Council for Science, Engineering and
Technology: funded by the National Development Plan to C.T and a grant from Science Foundation
Ireland to M.A.F.
67


Chapter 4
Functional Divergence Followed the
Establishment of Endocellular
Symbiosis in Insects
4.1 Related publications
Toft C, Williams TA. and Fares MA. Genome Wide Functional Divergence Followed the Symbiosis
of Proteobacteria with Insects.
Plos Computational Biology (under review)
This chapter follows closely the contents of the above manuscript, although sections like intro-
duction, methods and material, and conclusion have been extended to better contextualise the other
chapters and/or to give feather depth to the subject. The novel script to perform the Functional
Divergence part of the analyse have been implemented by Tom Williams.
4.2 Abstract
Endosymbiontic bacteria live within specialised organelles or cells of their host. The host provides
them with a stable environment and in return the endosymbiont supplements the host’s diet with
metabolites according to the host’s ecological requirements. In endosymbiotic bacteria of insects
many of these metabolites comprise essential amino acids and/or vitamins. Because of the changing
69

Chapter 4. Functional Divergence Followed the Establishment of Endocellular Symbiosis in Insects
ecological conditions of endosymbionts, many of the genes that encoded products now provided by
the host became redundant and consequently disintegrated within the genome after a period of non-
functionalisation. Another group of genes however are expected to have changed their function to cover
the needs of both the host and the bacterium. The first fact has been extensively investigated and in
this chapter we aim at testing the second outcome. We conducted a comprehensive genome screening
for genes under functional divergence and studied their role in mediating the success of symbiosis
between two organisms with di!erent biological complexities. The analysis of endosymbiotic bacteria
of aphids and carpenter ants (Buchnera sp. and Blochmannia sp.) allowed the identification of genes
that underwent stronger constraints in the endosymbiont than in their free-living relatives despite the
intergenerational bottlenecks to which symbiotic bacterial population sizes are subjected. Our novel
test of functional divergence also identified a significant proportion of genes in both endosymbionts
to have shifted their evolutionary rates. These evolutionary patterns a!ected genes within functional
categories and metabolic pathways important for both the bacterium and the host. We identify
substantial di!erences between the bacterium-aphid and bacterium-ant symbiotic systems mainly due
to the di!erent ecological requirements of aphids and ants. The implications and the importance of
such findings in the understanding of the molecular basis of symbiosis are discussed.
4.3 Introduction
One of the most fascinating puzzles that evolution left us with is how the relationship between
variability at the gene and protein levels map to the generation of new species. There are two
main questions that remain the focus of heated debates and arduous investigation: To what extent
protein function changes? And to what extent sequence variability is related to protein’s function?
Organismal lineages do in general evolve under strict negative selection (purifying selection) most of
the time with bursts of adaptive mutations becoming punctually fixed in the populations. Negative
selection generally removes functionally/structurally destabilising mutations leading consequently to
protein functional stasis (Messier & Stewart, 1997). Alternatively, new protein functions may emerge
by the selective fixation of adaptive mutations (Gould & Eldredge, 1993). Protein structure is the
major determinant of protein’s function and recent evidence suggest that structural robustness to
mistranslation errors is the factor orchestrating protein’s evolutionary rate (Drummond et al., 2005).
Consequently, pressures to maintain protein’s function will imply that amino acid mutations will
be only fixed at amino acid sites with no structural importance, while those diminishing structural
stability and function will be removed by selection (Bloom et al., 2007; Lin et al., 2007). Conversely,
70

4.3 Introduction
changes in protein function can be possible due to selection shifts at particular sites that may a!ect
protein structure and function and hence lead to functional divergence (Gaucher et al., 2002). Whether
these selection shifts may occur neutrally (Lopez et al., 2002) or may lead to functional divergence
(Abhiman & Sonnhammer, 2005; Gu et al., 2007) remains the subject of intense debate.
There are several scenarios under which change in selective pressures may occur, with gene du-
plication being the most prominent case (Fitch & Markowitz, 1970; Ohno, 1970; Li & Gojobori, 1983;
Clark, 1994; Hughes, 1994; Fryxell, 1996; Nei et al., 1997; Force et al., 1999; Gu, 2003). Revolutionising
changes in the organism’s lifestyle may also lead to proteome functional divergence and consequen-
tially to the emergence of new species. In some cases, such as in the case of endosymbiotic bacteria of
insects, this change in the lifestyle can be dramatic and may provide the source for profound genomic
and metabolic remodelling dynamics. For example, the switch of endosymbiotic bacteria of insects
from a free lifestyle to a symbiotic one with organisms showing qualitatively di!erent biological com-
plexity levels may have led to two main dramatic genomic and metabolic architecture changes in
the bacterium: Intracellular life may deem most of the biological processes in the bacterium related
with extra-cellular life redundant, thus becoming lost; and may force the proteome/interactome and
metabolism of the bacterium to change as to satisfy the need for the metabolic interlink between
host and bacterium (Andersson & Kurland, 1998). In particular, the stable environment provided
by the host and the presence in certain circumstances of secondary endosymbionts collaborating in
such metabolic intimacy with the host renders most of the genes in the endosymbiont redundant
(Perez-Brocal et al., 2006; Toft & Fares, 2008). The consequentially relaxed constraints on these
genes, in addition to the strong intergenerational bottlenecks these bacteria undergo (Moran, 1996),
has encouraged the characterisation of what has become a syndrome for the endosymbiosis. This syn-
drome is characterised by an AT enrichment and accelerated protein evolutionary rates (Lynch, 1996;
Moran, 1996; Lynch, 1997; Brynnel et al., 1998; Clark et al., 1999; Rispe & Moran, 2000; Funk et al.,
2001), genome reduction (for example see Wernegreen & Moran (2000); Gil et al. (2002)), low levels
of intra-specific polymorphism (Funk et al., 2001; Abbot & Moran, 2002), and decreased stability of
RNAs (Lambert & Moran, 1998) and of proteins (van Ham et al., 2003). Besides all of these e!ects,
we also expect ample opportunity for functional divergence in the bacterium for two main reasons:
i) strong genetic drift allows the neutral fixation of mildly deleterious mutations that may become
functionally interesting when ameliorated by compensatory mutations; and ii) the emergence of new
functions enabling the biochemical communication with the host as well as saving metabolic energy
in the bacterium may have been favoured by the pressures established by endosymbiosis.
An example of such a case is the flagellar assembly pathway in bacteria that is also responsible
71

Chapter 4. Functional Divergence Followed the Establishment of Endocellular Symbiosis in Insects
for protein export in free-living bacteria. It has been shown that endosymbiotic bacteria of insects
such as Buchnera aphidicola are non-motile and yet they have been observed to have hundreds of
hook and basal body structures of the flagella on their cell surface (Maezawa et al., 2006), supporting
previous suggestions of the specialisation of this structure in export of proteins to the host from the
bacterium (Shigenobu et al., 2000). In the previous chapter, we conducted an exhaustive evolutionary
analysis of the flagellar genes in endosymbiotic bacteria of insects and showed that indeed some
genes may have changed their function towards protein export (Toft & Fares, 2008). Identification
of functional divergence is key to understanding the metabolic communication between the host and
the endosymbiont. However, detecting events of adaptive evolution caused by functional divergence is
usually hampered by the fact that genetic drift within these bacteria may produce similar evolutionary
patterns. Standard statistical methods cannot disentangle functional divergence from genetic drift
e!ects and alternative strategies are needed.
To better understand the scenarios under which endosymbiotic bacteria of insects evolved to
adapt to a dramatically di!erent lifestyle in comparison with their closest free-living relatives, we
here conduct a genome wide analysis of functional divergence in the endosymbiont of aphids and
endosymbionts of carpenter ants using a novel and simple statistical approach.
4.4 Material and methods
4.4.1 Genomes and alignments
In our analysis we used the four genomes of the endosymbiotic bacterium of aphids B. aphidicola,
including strains Acyrthosiphon pisum (BAp: NC_002528), Schizaphis graminum (BSg : NC_004061),
Baizongia pistaciae (BBp: NC_004545) and Cinara cedri (BCc: NC_008513). For the same genes
we used the genomes of the free-living relatives Escherichia coli K12 (Ec: NC_000913); Salmonella
tyhimurium (St : NC_003197); Shigella flexneri (Sf : NC_004741); and Erwinia carotovora (Eca:
NC_004547). For the analysis of functional divergence we used the external (outgroup) genome of
Photorhabdus luminescens (Pl : NC_005126), due to its appropriate phylogenetic proximity to both
groups of bacteria. In the case of the endosymbiotic bacteria of carpenter ants, we used Candi-
datus Blochmannia floridanus (B f: NC_005061) and Candidatus Blochmannia pennsylvanicus (Bp:
NC_007292), the only two fully sequenced genomes available.
With each one of the genes in the Ec genomes we performed BLAST searches to find the orthologs
in the other genomes, considering acceptable only those genes showing reciprocal best top hits with
scores of less or equal than 10!4. For each one of the genes we built multiple protein alignments
72

4.4 Material and methods
using ClustalW program with the default parameters (Thompson et al., 1994). Then we obtained the
protein-coding multiple nucleotide sequence alignments concatenating nucleotide triples according to
the corresponding protein alignment.
4.4.2 Characterisation of selective constraints in endosymbiotic genomes
In theory, the functional divergence of a lineage or cluster in the phylogenetic tree requires
the rapid fixation of functionally advantageous mutations through episodic (punctual) Darwinian
selection. In order for this divergence to take place it is imperative that these mutations become
fixed under strong purifying selection after speciation in that cluster. This involves an increase in
the number of amino acid replacing nucleotide substitutions in the lineage leading to that cluster
while synonymous substitutions remain neutral. Consequently, we expect an increase in the non-
synonymous-to-synonymous rates ratio (" = dN/dS), which has been used in numerous studies as an
indicator of the force of selection acting on protein-coding genes (for example see Fares et al., 2002a;
Yang, 2002; Lynn et al., 2004). The number of non-synonymous nucleotide substitutions per site (dN )
is under selection because they involve changing the amino acid composition of sequences, whereas
synonymous substitution per site (dS) accumulate neutrally due to their silent e!ect on protein’s amino
acid composition. However, caution must be exercised as synonymous sites may be also under selection
caused by translational e"ciency or stability of RNA molecules (Chamary et al., 2006; Parmley et al.,
2006; Mayrose et al., 2007; Resch et al., 2007). Assuming however that synonymous sites evolve
neutrally, Values of " < 1 indicates that most of the amino acid substitutions are deleterious and
removed by selection (purifying selection); " = 1 indicates neutral evolution, while " > 1 provides
evidence for the fixation of a burst of amino acid replacing mutations by positive selection.
Functional divergence involves a shift in the selection forces acting on amino acid sites of protein-
coding genes. Therefore, irrespective of the constraints on synonymous sites, endosymbiotic " values
("e) will yield similar values to those in free-living relatives ("f ) if the constraints are the same in
both groups of bacteria and di!erent values if the selective constraints have changed in one clade
compared to the other. To first characterise the changes in selective constraints between the clade of
endosymbionts and the clade of their free-living bacterial relatives we estimated dN and dS using the
program YN00 from the PAML package version 4.0 (Yang, 2007) for the full set of 509 endosymbiotic
genes in B. aphidicola strains and 536 genes in Blochmannia strains. We estimated the number of
substitutions per site using the modified method of Nei and Gojobori (Nei & Gojobori, 1986) as
implemented in YN00. We performed thereafter comparisons of the selective constraints in each
gene between endosymbionts and their free-living cousins by dividing their corresponding " values
73

Chapter 4. Functional Divergence Followed the Establishment of Endocellular Symbiosis in Insects
(R = wBAp!BSg
!Ec!St). To conduct even more coherent comparisons we estimated nucleotide substitutions
for the genes in the comparisons of each one of the endosymbiotic lineages (BAp-BSg, Bf-Bp) to their
free-living relatives Ec-St since these pairs show similar divergence times (50-100 Million Years).
4.4.3 Identification of functional divergence
In this chapter we identified functional divergence type I as described previously (Gu, 2001).
Functional divergence type I involves the change in the selection constraints at specific amino acid
sites of a protein in a phylogenetic cluster in comparison to another. The question we asked here is
what genes have dramatically changed their selective constraints during the evolution of endosymbiosis
in comparison with their free-living bacterial relatives, indicating a change in function. The test per-
formed here is therefore unidirectional (1 tail test). In particular, we wanted to examine the acquisition
of functional importance at amino acid sites in endosymbiotic proteins that were evolving neutrally
in their free-living cousins (indicating functional divergence). In statistical and evolutionary terms,
we aimed to identify amino acid sites evolving neutrally at proteins from free-living bacteria (variable
sites), that underwent important physicochemical changes in the lineage leading to endosymbionts
and then became highly constrained (conserved) after endosymbionts speciation events. Because en-
dosymbiotic bacteria have been evolving under genetic drift, we expect sites to be more variable than
in their free-living relatives and hence our test will yield conservative conclusions.
Bayesian approaches and methods to identify functional divergence are rather di"cult to use in
genomic analyses because they are computational intensive (sometimes even prohibitive) and because
they are not properly implemented for genomic analyses. For example, one of the most widely used
methods (Gu, 2001) is implemented to run over one alignment at a time and in addition requires the
presence of at least 4 sequences per cluster. These requirements are not always met as in the case of
endosymbionts of ants where we only had two genome sequences. We hence developed a fast, accurate,
and simple statistical method to identify functional divergence in genomic data. The method uses
BLOSUM scores to compare the evolutionary distance between two clades of homologous proteins
and an outgroup sequence, providing a fast and conservative way of identifying amino acid sites under
functional divergence. The input is a protein sequence alignment of the two pre-defined clades and
an outgroup sequence. The endosymbiont clade was defined as the clade-of-interest (which we call
clade 1), so that the method identifies sites in that clade which have diverged significantly further in
function from the outgroup sequence than have the homologous sites in the second clade (clade 2)
(see Figure 4.1 for details).
For each column in the alignment, we calculate the BLOSUM scores for the substitution between
74

4.4 Material and methods
Figure 4.1: Identification of Functional Divergence type 1. The BLOSUM distribution for site i overthe whole alignment (purple dotted line) and between the out-group and the two clades are drawn.The non overlap between clade-to-outgroup transition distributions indicates that strong transitionshave to happen to switch between clade specific distributions. Only sites where the mean BLOSUMscore from outgroup to clade 1 is negative and from outgroup to clade 2 in positive are looked at. Toavoid obtaining spurious results due to the high genetic drift experienced by endosymbiotic bacteria,we condition that residues are fully conserved in clade 1 – this insures the change have occurred in theancestral sequence of the endosymbionts. Finally, the Z-score for the column was calculated to obtainthe probability of the observed putative functionally divergent site. The strength of the BLOSUMtransition values is colour coded.
each amino acid in each clade and the outgroup residue. Since the probability of observing an unlikely
substitution increases with the divergence time between sequences, each pairwise BLOSUM score is
divided by the Poisson distance between the sequences from which the two residues are derived – that
is, the outgroup and one other sequence. Even though amino acid substitutions are under selective
constraints, we assume that some sites may evolve neutrally and some others under constraints but
that these e!ects cancel each other out when averaged along the sequence. We then calculate the
mean BLOSUM score between all clade 1 residues and the outgroup (clade 1 mean: B1), all clade 2
residues and the outgroup (clade 2 mean: B2), and the standard error of both these quantities (SE1,
SE2). Negative BLOSUM scores indicate rarely observed substitutions, while positive scores indicate
commonly observed ones. Since we are attempting to identify sites in clade 1 that are under functional
divergence when compared to clade 2, we filter out all sites for which the value of clade 1 mean is
positive (indicating hence conservative substitutions; B1 > 0), and also those sites for which the value
of clade 2 mean is negative. Further, to avoid obtaining spurious results due to the high genetic drift
experienced by endosymbiotic bacteria, we filter out all sites that are not completely conserved in
clade 1. Finally, we calculate a Z-score for the column to calculate the probability of the observed
putative functionally divergent site.
75

Chapter 4. Functional Divergence Followed the Establishment of Endocellular Symbiosis in Insects
4.4.4 Metabolic data
The database KEGG (Kyoto Encyclopedia of Genes and Genomes(Arakawa et al., 2005)) links
genomic information with current knowledge on functional information. It consists of four main
sections including pathway information, genes collections from all fully sequenced genome, chemical
information (for example, cell compounds, enzymes, drugs approved etc.) and relationships of various
biological objects. It also integrates a number of pieces of software that link all the knowledge about
the pathway, comprising information about the genes present in a particular pathway for a specific
species.
We downloaded the file genes_pathway.list from KEGG ftp site, which contains all links between
genes in KEGG database, and the pathway in which the gene is present. To determine the possible
link between the pathway and the establishment of endosymbiosis, we tested if particular pathways
showed evidence of proteins under functional divergence constraints in the endosymbiotic lineages.
4.4.5 Statistical analyses
The main tests we performed were those aimed at determining whether any of the functional
classes characterised by Cluster of Orthologous Groups (COG) or any of the pathways presented
evidence of enrichment with genes under strong selective constraints and/or functional divergence.
Since the amount of data was finite per class and we were using discrete numbers of genes we conducted
our tests using an approximation to the exact Fisher’s test, called Hypergeometric approximation.
Under the Hypergeometric density function, the probability of observing K events in the class m,
from a sample size of N is:
p =
$mK
% &N!mn!K
'
&Nn
'
This probability density accounts for the unequal size of the di!erent classes and for the non-
normal distribution of data, making the test statistically robust for non-normal distributions due to
finite data sets and appropriate for testing enrichment in categorical data.
4.5 Results
To investigate the relationship between endosymbiosis and the shift in the nucleotide substitution
rates we first estimated synonymous (dS) and non-synonymous (dN ) pairwise substitutions as well
as the ratio between these estimates (" = dN/dS) in endosymbiotic bacteria and in their free-living
76

4.5 Results
Table 4.1: Increments of selective constraints in endosymbiotic bacteria of insects
MedianData Buchnera sp. Blochmannia sp
R(dN )a R(dS)b R(dN ) R(dS)Full dataset 5.118± 2.097 3.329± 2.018 7.458± 4.511 3.568± 2.395R(")c< 1 3.288± 1.506 5.344± 3.470 4.393± 2.531 6.738± 3.554R(") & 1 5.302± 3.639 2.766± 0.211 8.135± 5.316 3.146± 2.064
aRatio between the rate of non-synonymous substitutions per site in endosymbiotic bacteria and that of their free-living bacteria
bRatio between the rate of synonymous substitutions per site in endosymbiotic bacteria and that of their free-livingbacteria
cRatio between the non-synonymous-to-synonymous rates ratio of endosymbiotic bacteria and that of their free-livingrelatives
relatives. For the sake of generalisation, we present results from the two endosymbiotic systems, B.
aphidicola and Blochmannia sp. (hereon we will use the genera name to refer to these endosymbionts B.
aphidicola and Blochmannia), in each one of the sub-sections. To compare endosymbiotic evolutionary
rates we used the comparisons BAp-BSg and Bf-Bp to their free-living relatives Ec-St because these
divergence events present equivalent times rendering the comparisons appropriate despite possible
pressures on synonymous sites.
4.5.1 Di!erential selective constraints in endosymbiotic genomes
B. aphidicola genomes underwent relaxed constraints after the establishment of endosymbiosis
with aphids because the estimated number of substitutions increased proportionally in synonymous
and non-synonymous sites (Table 4.1). For example, dN in endosymbionts (dNe) increased on average
fivefold when compared to dN in free-living bacteria (dNf ) (Median ratio R(dN ) = dNe/dNf = 5.118).
Similarly, dSe increased on average three fold when compared to dSf (R(dS) = 3.329). On average
after symbiosis of bacteria with aphids both types of sites underwent relaxed constraints but more
significantly at non-synonymous sites, further highlighting the importance of genetic drift during
the evolution of endosymbiotic bacteria. The endosymbiont of carpenter ants however presented
similar relaxed constraints at synonymous sites but much more relaxed constraints at non-synonymous
sites when compared to Buchnera sp. (Table 4.1). Unlike the expectation of genome wide relaxed
constraints after symbiosis, we found that some genes showed increased selection pressures, presenting
greater selection intensities in endosymbionts ("e) than in their free-living relatives ("f ) [R(") =we/!f < 1]. The number of genes showing such ratios was significant with as much as 29.67% of the
genes (151 out of 509 genes) and 16.98% of genes (91 out of the 536 genes) presenting R(") < 1,
in Buchnera sp. and Blochmannia sp. endosymbiont genomes, respectively (Figure 4.2 a and b and
77

Chapter 4. Functional Divergence Followed the Establishment of Endocellular Symbiosis in Insects
Figure 4.2: Constraints operating in endosymbiotic bacteria of aphids (a) and carpenter ants (b)in comparison with their free-living relative bacteria Escherichia coli and Salmonella typhimurium.We compared the constraints operating in protein-coding genes between endosymbiotic and free-livingbacteria by dividing the non-synonymous-to-synonymous rates ratio of endosymbionts ("e) by that oftheir free-living relatives ("f ) and we called this ratio R(") [R(") = we/!f ; represented in the Y-axis).We plotted genes according to their position in the bacterial chromosome (X-axis).
table C.1). When we examined the constraints operating at synonymous and non-synonymous sites on
these genes and compared them to those in the set of genes with R(") > 1 we noticed that increased
selection intensity was due to more relaxed constraints at synonymous sites but fundamentally to
significant stronger constraints at non-synonymous sites in this dataset (Table 4.1). In summary,
increments of " in endosymbiotic bacteria are negatively correlated with increments in synonymous
substitutions and positively correlated with non-synonymous substitutions increments for Buchnera
sp. (Perason’s correlation; $R(!)!R(dS) = $0.696, P ' 10!12, and $R(!)!R(dN ) = 0.539, P ' 10!12)
and Blochmannia sp. ($R(!)!R(dS) = $0.540, P ' 10!12, and $R(!)!R(dN ) = $0.421, P ' 10!9).
4.5.2 Di!erential functional enrichment in highly constrained genes in en-
dosymbiontic bacteria
To test the link between the biological and evolutionary characteristics of B. aphidicola and
Blochmannia and the constraints on their genomes we analysed the distribution of genes presenting
R(") < 1 among the di!erent functional classes obtained using COG terms. We examined three
classes identified by the Cluster of Orthologous Groups, including metabolism (represented by 161
genes and 229 genes in B. aphidicola and Blochmannia, respectively), cellular processes and signalling
(represented by 99 and 108 genes in B. aphidicola and Blochmannia, respectively) and information
storage and processing (represented by 127 and 153 genes in B. aphidicola and Blochmannia, respec-
78

4.5 Results
Table 4.2: Distribution of constrained genes in endosymbiotic bacteria of aphids (Buch) and carpenterants (Bloc) among the functional categories classified using the Cluster of Orthologou Groups (COG).See Table A.1 for definition of subcategories
Category Sub-category
# Genes # Genes [R(") < 1] % Genes
Buch Bloc Buch Bloc Buch BlocMet C 40 42 12 5 30.0 11.9
G 19 28 6 4 31.6 14.3E 47 58 21 11 44.7 18.9F 20 23 4 2 20.0 8.7H 25 34 5 4 20.0 11.8I 10 25 3 4 33.0 16.0P 12 19 6 7 50.0 36.8
CPS D 8 13 2 1 25.0 7.8O 33 28 13 4 39.4 14.3M 17 48 4 7 23.5 14.6N 23 0 2 0 8.7 0.0T 4 4 1 0 25.0 0.0U 10 13 3 1 33.0 7.7V 3 2 0 0 0.0 0.0
ISP J 82 106 41 29 50.0 27.4K 14 16 8 3 57.0 18.8L 31 31 9 7 29.0 22.6
tively). We discarded genes that were ambiguously classified. The total number of genes, number of
genes with R(") < 1 and enrichment of each functional sub-category are indicated in Table 4.2. We
tested the significance of the enrichment with genes highly conserved in endosymbionts compared to
their free-living relatives using the hypergeometrical distribution as explained in material and meth-
ods. Several of the functional categories examined presented high percentages of constrained genes
in both B. aphidicola and Blochmannia, although this was more pronounced in B. aphidicola than
in Blochmannia (Figure 4.3). B. aphidicola presented several of the categories enriched with genes
under stronger constraints than in its free-living relatives, including genes involved in transport and
metabolism of essential amino acids (sub-category E); in post-translational modification and chaper-
ones (O); and in translation, ribosomal structure and biogenesis (J) (Figure 4.3). Blochmannia only
presented evidence for such enrichment in the category of genes involved in translation, ribosomal
structure and biogenesis. Several other functional categories presented poor percentages (significantly
low) of strongly constrained genes in B. aphidicola but not in Blochmannia including the categories of
coenzyme transport and metabolism (H), cell motility (N), and inorganic ion transport and metabolism
(P) (Figure 4.3). Other categories such as those including defence genes (V), signal transduction (T),
79

Chapter 4. Functional Divergence Followed the Establishment of Endocellular Symbiosis in Insects
Figure 4.3: Distribution of highly constrained genes among the functional categories in B. aphidicola(blue bars) and Blochmannia (red bars). The di!erent functional categories as explained by theCluster of Orthologous Groups (COG) are represented in the X-axis. The height of the bar representsthe relative contribution of each class (i) of size (t), to the total number of genes under strongselective constraints (ni : R(") = !e/!f < 1) when considering the whole dataset (T ). This normalisednumber hence was calculated as ! =( ni/t)! (t/T). Classes showing significant enrichment with highlyconstrained genes under a hypergeometrical distribution are labelled by (*, P < 0.05; **, P < 10!2;***, P < 10!3). We also labelled those functional classes significantly underrepresented by highlyconstrained genes using green stars. See Table A.1 for definition of Functional Categories
etc. comprised very low number of genes and hence presented no statistical power for rejecting the
null hypothesis of no di!erential enrichment with constrained genes.
4.5.3 Heterogeneous functional divergence among functional categories in
endosymbionts
Based on the assumption that endosymbiosis involved a dramatic biological jump that has been
possible thanks to functional shifts of pre-existing proteins, we tested for the presence of functional
divergence in B. aphidicola and Blochmannia. Even though both endosymbiotic systems share common
biochemical traits (for example, the need for essential amino acids in their diet as well as nitrogen
compounds) they also present two systems with slightly di!erent requirements. For example, ants
are unable to fix and reduce sulphur, which is provided by the endosymbiont. We attempted to test
whether functional divergence analyses could shed light on the connection between protein variability
and biochemical host-endosymbiont links. Our test identified 63.7% and 78.6% of genes to be under
80

4.5 Results
Figure 4.4: Distribution of genes under functional divergence among the functional categories in B.aphidicola (blue bars) and Blochmannia (red bars). The di!erent functional categories as explainedby the Cluster of Orthologous Groups (COG) are represented in the X-axis. The height of thebar represents the relative contribution of each class (i) of size (t), to the total number of genesunder functional divergence (ni : R(") = !e/!f < 1) when considering the whole dataset (T ). Thisnormalised number hence was calculated as ! =( ni/t)! (t/T). Classes showing significant enrichmentof genes under functional divergence under a hyper-geometrical distribution are labelled (*, P < 0.05;**, P < 10!2; ***, P < 10!3). We also labelled those functional classes significantly underrepresentedby highly constrained genes using green stars. See Table A.1 for definition of Functional Categories
functional divergence in B. aphidicola and Blochmannia, respectively. B. aphidicola presented three
functional categories enriched with functional divergence, including the one involved in amino acid
transport and metabolism (E), post-translational modification and chaperones (O) and translation,
ribosomal structure and biogenesis (J) (Figure 4.4). Blochmannia also presented significant evidence of
functional divergence enrichment at these categories and in additional categories involved in coenzyme
transport and metabolism (H), and cell wall and membrane biogenesis (M) (Figure 4.4). Other
categories in Blochmannia presented evidence of being poorly populated by genes under functional
divergence including that comprising genes involved in intra-cellular tra"cking (U) and transcription
(K) (Figure 4.4).
4.5.4 Functional divergence in the endosymbioic metabolic pathways
To identify the relationship between functional divergence and endosymbiosis we analysed the
distribution of genes between the di!erent metabolic pathways and tested the enrichment of path-
81

Chapter 4. Functional Divergence Followed the Establishment of Endocellular Symbiosis in Insects
ways with genes under functional divergence using the hypergeometric distribution. We identified and
classified genes into 67 di!erent pathways. In B. aphidicola symbionts we found 10 pathways to be
significantly enriched and 4 to be significantly impoverished with proteins that underwent functional
divergence after symbiosis established (Figure 4.5 a and table 4.3). Among the enriched pathways we
identified those including proteins involved in the biosynthesis of aminoacyl-tRNA of the 10 essential
amino acids needed by the aphid, biosynthesis of the essential amino acids (Lysine, Valine, Leucine,
Isoleucine, Glycine, Serine, Threonine, Phenylalanine, Tyrosine and Tryptophan), DNA replication,
ribosomes, and homologous recombination. ABC transporters, two-component system, phosphotrans-
ferases and RNA polymerase were the metabolic pathways showing the least number of functionally
divergent genes. In the case of Blochmannia we could identify and classify genes into 71 di!erent
pathways. 506 genes showed evidence of functional divergence and because of this large number we
applied a chi-square distribution to test for enrichment with functional divergence. This test was
performed so that chi-square value was calculated for each metabolic class (pathways) as follows:
%2i =
(%FDi $ µ)2
(%FDi + µ)
Here %FDi stands for the proportion of the genes in that metabolic class i showing functional di-
vergence, while µ is the mean proportion of genes under functional divergence in the di!erent metabolic
pathways. Analyses of Blochmannia pathways identified similar pathways as those in Buchnera sp.
to be enriched with genes under functional divergence, including aminoacyl-tRNA for essential amino
acids for the host, DNA replication, essential amino acids biosynthesis, folate biosynthesis and oxida-
tive phosphorylation (Figure 4.5 b). The pathways for ABC transporters, phophotransferases, and
the two-component system were also impoverished with genes under functional divergence. However,
in contrast to B. aphidicola 18 pathways were enriched and 16 pathways impoverished with genes
under functional divergence. For example, among enriched pathways with proteins under functional
divergence not present in B. aphidicola were those involved in the metabolism of sulphur, histidine,
vitamine B6, selenamine acid, pyrimidine; biosynthesis of liposaccharides, ubiquinones, fatty acids,
and peptidoglycans, and the pathway of RNA polymerase. In contrast to B. aphidicola other pathways
were impoverished with proteins under functional divergences, including those involved in metabolism
of nitrogen, urea, phenylalanine, starch and sucrose, galactose, fructose and mannose, propanoate,
thiamine, biotine, methane and butanoate (Figure 4.5 b and Table 4.3).#
82

4.5 Results
Figure 4.5: Distribution of genes under functional divergence among the metabolic pathways sig-nificantly enriched or impoverished with these genes in B. aphidicola (a) and Blochmannia (b). Thedi!erent metabolic classes are colour-coded. Dotted line separates metabolic pathways enriched withfunctionally divergent genes (above the line) from those impoverished with these genes (below theline).The height of the bar represents the relative contribution of each class (i) of size (t), to the totalnumber of genes under functional divergence (ni : R(") = !e/!f < 1) when considering the wholedataset (T ). This normalised number hence was calculated as ! =( ni/t)! (t/T).
83

Chapter 4. Functional Divergence Followed the Establishment of Endocellular Symbiosis in Insects
Table 4.3: Functional divergence analysis in the metabolic pathways of B. aphidicola and Blochman-nia endosymbionts. The number of genes in each pathway category was examined using a hyperge-omtrical distribution test. Classes of pathway significantly enriched or impoverished are indicated(*,P< 0.01; **, P< 10-6).
Metab. #GenesE.coli
#FDB.aphidicola
#FDBlochmannia
ABC transporters 189 1** 8**Ala & Asp metab. 28 4 8Aa-tRNA biosyn. 25 16** 23**Aminosugars metab. 18 0 6Arg & Pro metab. 18 3 3Bacterial chemotaxis 17 0 -Base excision repair 14 1 6beta-Ala metab. 14 0 -Biosyn. of steroids 9 0 3Biosyn. of unsaturated FA 4 2 1Biotin metab. 7 0 1Butanoate metab. 34 3 5*C5-Branched dibasic acid metab. 7 - 2Carbon fixation 20 4 6Citrate cycle (TCA cycle) 27 1* 8*Cys metab. 13 1 6D-Gln & D-Glu metab. 5 0 2DNA replication 17 5* 14**Drug metab. - other enzymes 10 0 4Fatty acid biosyn. 12 3* 8**Flagellar assembly 38 4 9Folate biosyn. 14 0 -Fructose & mannose metab. 47 2 6*Galactose metab. 32 - 2*Glutamate metab. 32 4 7Glutathione metab. 14 1 3Glycan structures 11 - -Glycerophospholipid metab. 27 - 8*Gly, Ser & Thr metab. 34 9* 13*Glycolysis / Gluconeogenesis 37 6 10*Glyoxylate & dicarboxylate metab. 34 1* 1*His metab. 12 3 9Homologous recombination 27 6* 12Inositol phosphate metab. 4 1 1Lipoic acid metab. 3 1 0Lipopolysaccharide biosyn. 28 1 14**Lys biosyn. 18 8* 10**Lys degradation 10 1 2
84

4.5 Results
Methane metab. 13 2 2*Met metab. 16 2 7Mismatch repair 22 4 10Nitrogen metab. 35 - 2*Novobiocin biosyn. 3 - 1Nicotinate & nicotinamide metab. 12 0 2Nucleotide excision repair 8 0 -One carbon pool by folate 12 4* 6*Oxidative phosphorylation 41 13* 25**Pantothenate & CoA biosyn. 17 4 4Pentose phosphate pathway 29 5 10Peptidoglycan biosyn. 17 0 10**Phe metab. 17 - 1Phe, Tyr & Trp biosyn. 24 6* 17**Phosphotransferase system 52 0** 3**Porphyrin & chlorophyll metab. 23 3 5Propanoate metab. 30 1 4Protein export 18 4 7Purine metab. 79 5 24Pyrimidine metab. 48 6 25**Pyruvate metab. 42 3 9Reductive carboxylate cycle 22 - 5Riboflavin metab. 11 0 5Ribosome 79 13* 22RNA polymerase 4 2* 2*Selenoamino acid metab. 15 0 9*Starch & sucrose metab. 33 - 2**Streptomycin biosyn. 9 - 2Sulfur metab. 13 0 10**Taurine & hypotaurine metab. 6 1 1Terpenoid biosyn. 3 0 -Thiamine metab. 15 1 2*Trp metab. 12 2 3Two-component system 129 0** 6**Tyr metab. 11 3 2Ubiquinone biosyn. 30 0 20Urea cycle & metab. of amino groups 28 2 0**Val, Leu & Ile biosyn. 19 7* 13**Val, Leu & Ile degradation 11 0 2Vitamin B6 metab. 9 2 6*
85

Chapter 4. Functional Divergence Followed the Establishment of Endocellular Symbiosis in Insects
4.6 Discussion
Here we have attempted to answer a fundamental question regarding endocellular symbiosis:
What are the main genome evolutionary events that enabled the functional/metabolic communica-
tion between symbiotic bacteria and insects? In some cases, such as in that represented by the
association between aphids and their endosymbiotic bacteria, association has been comprehensibly
characterised from the genetic, evolutionary and metabolic perspectives. Other associations, such
as the one established between ants and their symbionts remain intriguing because of the apparent
balance of the insect’s diet. The sequencing of few endosymbiotic genomes and a plethora of many
other genomes that are in the process of full genome sequencing o!er an unprecedented opportunity
for establishing the biological and evolutionary bases of endosymbiosis in insects. However, until such
genome projects are completed, we rely on a handful of endosymbiotic genomes to infer general results.
Convergent dynamics inferences are only possibly if the di!erent endosymbiotic bacteria examined are
not directly related from the phylogenetic perspective. B. aphidicola and Blochmannia endosymbionts
o!er the opportunity for such studies because their symbiosis have been shown to have occurred in-
dependently during evolution in two di!erent insect genera (Dasch et al., 1984; Schroder et al., 1996;
Sameshima et al., 1999; Herbeck et al., 2005). In addition, many genomes have been sequenced for
these endosymbionts, which makes it possible to infer major genome evolutionary events before and
after the establishment of symbiosis.
We analysed these two groups of bacteria because of their di!ering host ecological traits. While
aphids are phloem feeders, ants have been reported to feed on honeydew from sap-sucking insects but
also to use complex diets that include dead and live insects, bird excrements and sweet food waste
(Pfei!er & Linsenmair, 2000). Thus, the ants diet seems to be much more balanced than that of
aphids. In addition, experiments during the ontogeny of ants have shown that endosymbionts may
play a crucial role during the process of pupation while they may be unnecessary in the adult stage
(Zientz et al., 2006). The ecological requirements of aphids and ants are therefore very di!erent. This
means that we could in theory identify evolutionary genome dynamics of only those that are strictly
related to the establishment of symbiosis per se but also those that are related to the ecological
capabilities provided by the bacterium to the host.
Our analyses of the evolutionary rates at synonymous and non-synonymous nucleotides sites at
the genome level unravel the clear e!ect of genetic drift in both endosymbiotic systems. This is
also supported by the fact that non-synonymous sites are much more relaxed than synonymous sites
in endosymbionts because these sites are under selection in free-living bacteria. Strikingly however,
Blochmannia presents much higher relaxed constraints than B. aphidicola probably because of the
86

4.6 Discussion
weaker action of selection at Blochmannia resulting from its limited role during the lifecycle of the
ants’ host. Interestingly, this is confirmed by the fact that we detect a significantly higher percentage
of genes showing lower " values in B. aphidicola compared to free-living bacteria than in the case of
Blochmannia (for example the percentage of genes with R(") < 1 in B. aphidicola is almost twice
that in Blochmannia). The greater genome size of Blochmannia despite the greater proportion of
slightly deleterious mutations supports an important persistence of non-functionalised genes in the
genome because Blochmannia endosymbiosis has been established to be more recent than that of B.
aphidicola (around 70 MYA for Blochmannia against the approximately 200 MYA for B. aphidicola)
(Sauer et al., 2000).
The next question we asked was whether these selective constraints are random (as a result of
genetic drift) or have a functional basis that correlated with the host and the bacterium requirements.
After performing functional class enrichment analyses we found that, in accordance with the expecta-
tion given the metabolic requirements of the host, B. aphidicola presented a high percentage of genes
under stronger constraints than in their free-relative bacterial homologs. These genes were those
responsible for transport and metabolism of essential amino acids, translation, ribosomal structure
and biogenesis, and genes involved in posttranslational modifications and chaperones. Our analyses
also show that these constraints are not the sole cause of more relaxed constraints at synonymous
sites but also stronger constraints at non-synonymous sites. Genetic drift in B. aphidicola has been
extensively demonstrated (for example see Moran, 1996). Therefore such conserved constraints at
non-synonymous sites can be either due to a major need for these proteins to perform their ancestral
functions or alternatively to the functional divergence of these proteins so as to perform di!erent but
more important functions in the endosymbionts. Indeed, all the functional categories where we detect
R(") < 1 have been previously reported to play key roles in the counterbalancing of the population-
genetics inconvenient consequences of an endocellular symbiotic lifestyle. The strongly unbalanced
diet of aphids lacks the 10 essential amino acids needed and these are provided by the endosymbiotic
bacterium (Douglas, 1998; Sandstrom et al., 2000). Furthermore, if translational e"ciency and trans-
lational robustness have changed in the endosymbiotic genomes compared to there free-living cousins
(which is the case in B. aphidicola (Toft & Fares, 2009)) we would expect that genes in functional
categories related with translation would have undergone a shift in their constrains. Indeed this is
what we are observing, with functional categories as translation, ribosomal structure and biogenesis
and posttranslational modification and folding being all enriched with genes containing functionally
divergent sites. Chaperones have been reported to improve their folding activity, probably by func-
tional divergence, thereby bu!ering the e!ects of Müller’s ratchet (Fares et al., 2002a,b). Transport
87

Chapter 4. Functional Divergence Followed the Establishment of Endocellular Symbiosis in Insects
and metabolism of essential amino acids was not detected in the case of Blochmannia to be enriched by
genes under strong constraints, but the class including translation, ribosomal structure and biogenesis
was detected. This may be in accordance with ants being characterised by being omnivorous (Dasch,
1975; Holldobler & Wilson, 1990; Bolton, 1994; Davidson, 1997, 1998) and thus the need for essential
amino acids is rather ambiguous (Zientz et al., 2006). The fact that B. aphidicola and Blochman-
nia both present genes evolving under di!erent constraints in the category of translation, ribosomal
structures and biogenesis, may provide further evidence for the functional divergence of these genes
the change in translational e"ciency and translational robustness in B. aphidicola as compared to its
closest free-living relative (Toft & Fares, 2009).
To test the hypothesis of functional divergence, we developed, implemented and conducted a new
method of functional divergence at the genome level in both endosymbiotic bacteria. The results
correlated strongly with ecological requirements of the hosts and highlighted the main convergent
events between endosymbionts regardless these requirements. In analysing these data and the dis-
tribution of the functionally divergent genes among the di!erent categories, we found that pathways
involved in tRNA synthesis, of the 10 essential amino acids, the metabolism of these 10 essential
amino acids, DNA replication, ribosomes, and homologous recombination are highly enriched with
genes that present evidence for functional divergence in both endosymbiotic systems. Despite the
omnivorous diet of the Camponotus ant, endosymbiont are only necessary during the pupation phase,
phase at which such diet may consist of a di!erent and more unbalanced composition. This would be
testament to the need for essential amino acids in the diet of two insect hosts with highly discordant
ecological requirements in the adult phase. Functional divergence of genes involved in DNA replica-
tion is an essential mechanism to slow the rate of bacterial DNA replication and to make this process
dependent upon the population of the host. In fact, genes under functional divergence in this category
were those involved in the initiation of replication, including the helicase (DnaB), primase (DnaG)
and the SSB in B. aphidicola. Moreover, other metabolic pathways were poorly populated by genes
under functional divergence, such as ABC transporters, phosphotransferases, and the two-component
system, probably involved in the transport of proteins and ions from the bacterium to the host, and
hence the need for their conserved function puts pressure to ensure their evolutionary conservation.
RNA polymerase category showed a low percentage of genes under functional divergence, supporting
the need for maintaining its ancestral function.
Other categories in Blochmannia, but not in B. aphidicola, presented enrichment with genes un-
der functional divergence that are directly related with the ecological requirements of their ants host.
These categories included genes involved in metabolism of sulphur, histidine, lipopolysaccharides, fatty
88

4.6 Discussion
acids, peptidoglycans, and nitrogen. All these categories include genes that are essential to provide
the host with the ability to reduce sulphur, and may provide the host with the capacity to recycle ni-
trogen through the endosymbiont urease, as previously suggested (Feldhaar et al., 2007). In addition,
polysaccharides and peptidoglycans, that are essential components of the cell wall (specifically of the
outer membrane), are also under functional divergence probably to provide a rather more structured
membrane to the bacterium making it more resistant to a hostile environment. Blochmannia di!ers
from B. aphidicola in that it is not contained in vacuoles but rather confined to the cytosol of the
bacteriocytes, which may be a more hostile environment than what have been previously thought
(Goetz et al., 2001), requiring a more resistant bacterial cell wall (Gil et al., 2003). Finally, metabolic
pathways related to the metabolism of sugars (for example, Fructose) are highly impoverished with
genes under functional divergence probably due to the need to conserve the ancestral function so as to
deal with the large amount of sugar in the ants diet. Metabolic pathways related to host ecological re-
quirements are either enriched or impoverished with genes under functional divergence, both extremes
ensuring the conservation of the ancestral optimised function or focusing the pathway on overproduc-
tion or improvement of the final substrate. In summary, we provide evidence of the main underlying
evolutionary mechanisms that were essential to the establishment of endosymbiosis and to the spe-
cific metabolic communication between the bacterium and the insect host. The di!ering evolutionary
dynamics of the metabolic pathways and their correlation with the insect’s ecological requirements
unearths the evident connection between bacterial symbiosis and species ecological innovation.
Here it was observed that functional divergent genes have been enriched in functional categories
and pathways important to the host and that there were a negative correlation between " and synony-
mous substitutions while the correlation was positive with non-synonymous substitutions. It would
be expected that non-synonymous sites are more relaxed in endosymbionts then synonymous because
they are not under the same selection constraints as in free-living bacteria. What was observed was
that genes related to the host within endosymbionic genome had stronger selection then they had in
the free-living bacteria. This was not only due to relaxation of synonymous sites but also stronger
constraint on non-synonymous sites. This could be an indication that there is selection for preferred
codons in endosymbionts. It has been shown in free-living organisms that there is a correlation be-
tween the use of preferred codons and expression levels and that highly expressed genes evolve slower
due to translational robustness. This leads to questions such as: does these selection constraints also
act on endosymbionic genomes despite the genetic drift that they are under?
89


Chapter 5
The Role of Translational Robustness
in the Evolution of Buchnera
aphidicola
5.1 Related publications
Toft C and Fares MA. Selection for Translational Robustness in Buchnera aphidicola,
Endosymbiotic Bacteria of Aphids.
Molecular Biology and Evolution (in press).
This chapter follows closely the contents of the above article, although sections like introduction,
methods and discussion have been rewritten or extended to better contextualise the other chapters
and/or to give further depth to the subject.
5.2 Abstract
Its strong intergenerational bottlenecks and e!ectively asexual reproduction have led Buchnera
aphidicola, the endocellular symbiotic bacterium of aphids, to spectacular evolutionary and genomic
changes in comparison with its free-living bacterial cousins. These changes summarise into high
fixation rates of mildly deleterious destabilizing mutations. This predicts a sharp decline of its fitness
and the consequent early demise of this endosymbiotic bacterium. Its survival for hundreds of millions
91

Chapter 5. The Role of Translational Robustness in the Evolution of Buchnera aphidicola
of years casts doubt on genetic drift as the sole evolutionary force and seeks further explanation.
We identify in B. aphidicola selection of proteins variants robust to misfolding translation errors
“translational robustness”. Translational robustness varies between B. aphidicola lineages and protein
functional categories. Metabolic proteins have been under selection for translational e"ciency, while
evolutionary rates of proteins involved in fundamental cellular processes have been largely determined
by selection for translational robustness. We detect the strongest signal of translational robustness
in B. aphidicola Cinara cedri with a very similar pattern to that inferred for the most common
symbiotic ancestor of B. aphidicola lineages. This indicates that B. aphidicola Cinara cedri lineage
may have reached the minimum evolutionary stable gene composition for endosymbiotic lifestyle.
The evolutionary patterns from the comparative genomic analyses of these endosymbionts support a
paradoxically complex dynamic for apparently simple genomes.
5.3 Introduction
Many eukaryotes harbour endocellular symbiotic eubacteria that obtain metabolic precursors
from the host while providing them with metabolic components lacking in their diet (Gray et al.,
1999; Shigenobu et al., 2000). Aphids are an example of a mutualistic consortium between a eukaryote
and its co-inherited primary symbiotic bacterium (Buchnera sp. APS). Due to the stable biochemical
cellular environment provided by the host, B. aphidicola has undergone a dramatic genome shrinkage
losing many genes from its biosynthetic pathways (Ochman & Moran, 2001; Silva et al., 2001). The
magnitude of genome reduction has been lineage specific and very dramatic in some cases such as in the
symbiont of Buchnera aphidicola strain Cinara cedri (BCc) (Perez-Brocal et al., 2006). This genome
reduction has been the consequence of a revolution in the lifestyle of B. aphidicola after symbiosis that
led to reduced population sizes an e!ectively asexual reproduction with little to no opportunity for
recombination with other bacterial lineages, and frequent intergenerational bottlenecks. The results
of such dynamics included dramatic genomic changes (Wernegreen, 2002), genome AT enrichment
and accelerated evolutionary rates at non-synonymous sites (Lynch, 1996; Moran, 1996; Lynch, 1997;
Brynnel et al., 1998; Clark et al., 1999; Rispe & Moran, 2000; Funk et al., 2001). Consequently, B.
aphidicola has undergone progressive and irreversible accumulation of slightly deleterious mutations,
a phenomenon interpreted to be an example of the e!ect of Müller’s ratchet (Rispe & Moran, 2000;
Moran & Mira, 2001). These dynamics have also led to low levels of intraspecific polymorphism (Funk
et al., 2001; Abbot & Moran, 2002); and decreased stability of RNAs (Lambert & Moran, 1998) and
of proteins (van Ham et al., 2003).
92

5.3 Introduction
Continuous fixation of slightly deleterious mutations would eventually lead to gene non-functiona-
lisation and deterioration and thus to the extinction of the biological system (Pamilo et al., 1987;
Kondrashov, 1995; Rispe & Moran, 2000). In studying the actual genomes however we are only
considering genes that in general still maintain the original function after hundreds of million of years of
endosymbiosis (Ochman et al., 1999). This raises the possibility that other factors may play important
roles in maintaining an acceptable balance between drift and selection in B. aphidicola. For example,
Rispe et al. (2004) showed that highly expressed genes present greater resistance to AT enrichment
and di!erential selective pressures between genomic regions. Itoh and colleagues (Itoh et al., 2002)
proposed purified selective pressures and high mutation rates as the main cause for the accelerated
evolutionary rates in B. aphidicola. Beside these observations, we sought to determine if the general
selective forces acting on proteins’ evolution could explain the evolution of B. aphidicola following the
rationale that protein’s overall functional importance should amplify the fitness costs of mutations
at functionally important sites. Several studies have already shown the correlation between proteins’
evolutionary rates and the functional category they belong to (Pal et al., 2001; Rocha & Danchin,
2004), or their essentiality for organism survival (Hurst & Smith, 1999; Jordan et al., 2002; Rocha &
Danchin, 2004). Drummond and colleagues analysed the correlation between evolutionary rates and
expression levels in a set of 900 paralogous proteins from the yeast Saccharomyces cerevisiae and also
included orhtologs of S. cerevisiae. They found significant negative correlations between expression
levels, synonymous nucleotide substitutions and amino acid replacement rates. This was consistent
with highly expressed genes evolving slowly. The strong correlation observed between protein evolution
rate and expression after removing preferentially translated codons (codons showing an adaptedness
index > 0.5) led them to the conclusion that selection may favour protein sequences with increasing
robustness to misfolding translation errors (they termed this hypothesis translational robustness) and
they invoked this as the determinant factor of protein’s evolution (Drummond et al., 2005). Whether
this hypothesis can be extended to a system under a powerful genetic drift force, such as in B.
aphidicola, remains to be explored. Our hypothesis is that such a system would need amplified selection
for translational robustness to counteract the destabilizing e!ects of mildly deleterious mutations
neutrally fixed in the genome.
In the previous chapter we observed how proteins involved in pathways related to facilitating the
host had an increased functional divergence and this was especifically observed in proteins with slower
evolutionary rates in the endosymbiont compared to free-living bacteria. Also observed was a sharp
increase in synonymous substitutions in flagella genes. This led us to test if selection for translation
robustness explains the rates of protein evolution in intracellular symbiotic bacteria and if this force
93

Chapter 5. The Role of Translational Robustness in the Evolution of Buchnera aphidicola
is asymmetrically distributed between lineages and/or functional categories.
5.4 Materials and methods
5.4.1 Gene and genome sequences
We used four genomes in our study, two of which belong to the endosymbionts of B. aphidicola
sp. strains Acyrthosiphon pisum (BAp: NC_002528) and Schizaphis graminum (BSg : NC_004061),
and the other two correspond to the genomes of their free-living cousins Escherichia coli K12 (Ec:
NC_000913) and Salmonella typhimurium (St : NC_003197). We chose these four genomes because
the divergence times between B. aphidicola’s BAp and BSg strains and of their closest free-living rel-
atives Ec and St are equivalent making possible the direct comparison of their proteins’ evolutionary
rates. To generalize our conclusions we also explored two additional genomes belonging to the en-
dosymbionts of B. aphidicola strain Baizongia pistaciae (BBp: NC_004545) and strain Cinara cedri
(BCc: NC_008513) for lineage specific analyses.
5.4.2 Identification of orthologs
We determined orthologous genes by first performing an all-against-all blastp searches between
the protein coding genes in the six genomes and by then identifying pairs of genes showing reciprocal
best hits (RBH). This can produce redundancies between the genomes (for example, gene a in genome
1 finds gene b in genome 2 but the two genes, a and b, do not find the same gene by RBH in genome 3).
In these cases we selected genes as orthologs if they were in the same syntenic order in the compared
genomes. The final list consisted of 509 genes present in all four genomes (BAp, BSg, Ec and St) and
309 genes present in the six genomes (BAp, BSg, BBp, BCc, Ec and St).
5.4.3 Measurement of expression levels
Because laboratory conditions (for example, growth media, temperature etc.) may not reflect
real environmental conditions of the free-living bacteria or the endosymbiont we used each Ec gene’s
codon adaptation index (CAI) as proxy for expression levels (Sharp & Li, 1987) (CAI for all the genes
used in this study are listed in table D.1). Abundance of mRNA molecules and CAI was used in other
studies showing that both approximations yield similar correlations between the protein evolutionary
rates and gene expression levels (Drummond et al., 2005; Wall et al., 2005). We calculated CAI for
Ec and used it to representate those in BAp assuming that closely related species present similar gene
94

5.4 Materials and methods
expression levels. To test this in general terms, we also estimated CAI for BAp using its own codon
set and measured the correlation with CAI of Ec yielding a low positive but highly significant value
despite the AT bias in B. aphidicola genome (Pearson’s correlation coe"cient: $ = 0.2; P ' 10!6).
However, we used the CAI of Ec because the extreme AT bias of B. aphidicola genomes makes it
di"cult to assign “optimal” codons and may consequently yield misleading CAI estimates (Rispe
et al., 2004).
5.4.4 Estimating evolutionary rates
We constructed multiple sequence alignments for the full set of genes using the program ClustalW
(Thompson et al., 1994). We calculated the number of synonymous substitutions per site (dS) and
non-synonymous replacements per site (dN ) by maximum likelihood using the program CODEML
from the PAML package v4 (Yang, 1997). We estimated dS and dN values for the genes using the
modified Nei and Gojobori method implemented in the software CODEML (see Table B.1). These
values were estimated for the pairs Ec-St and BAp-BSg (for simplicity we will call the substitution
rates dSf and dNf for the comparison of free-living bacteria and dSe and dNe for the comparison of
endosymbiotic bacteria). We also estimated these values for each one of the branches of the tree by
first obtaining the pair wise sequence substitutions and by then calculating the substitutions rates per
branch from these as follows:
dS(BAp!as) =14
i=4!
i=1
dS(BAp!BSg) + dS(BAp!i) $ dS(BSg!i)
2, for i # [BBp, BCc,Ec, St]
dS(BSg!as) =14
i=4!
i=1
dS(BSg!BAp) + dS(BSg!i) $ dS(BAp!i)
2, for i # [BBp, BCc,Ec, St]
dS(e!BBp) =16
i=3!
i=1
k=2!
k=1
dS(BBp!i) + dS(BBp!k) $ dS(i!k)
2, for "i # [BAp, BSg, BCc] ( "k # [Ec, St]
dS(e!BCc) =16
i=3!
i=1
k=2!
k=1
dS(BCc!i) + dS(BCc!k) $ dS(i!k)
2, for "i # [BAp, BSg,BBp] ( "k # [Ec, St]
dS(e!as) =14
i=2!
i=1
k=2!
k=1
(dS(BAp!i)+dS(BSg!i))+(dS(BAp!k)+dS(BSg!k))!2(dS(i!k)+dS(BAp!BBp)
4, for "i # [BBp, BCc] ( "k # [Ec, St]
95

Chapter 5. The Role of Translational Robustness in the Evolution of Buchnera aphidicola
dS(e!f) =15
i=2!
i=4
k=1!
k=i!1
dS(Ec!i)+dS(Ec!k)!2dS(i!k)+dS(St!i)+dS(St!k)!dS(Ec!St)
4, for "i, k # [BAp, BSg,BBp,BCc]
where dS(a!b) is the synonymous distance between sequences a and b, f is the ancestral node of Ec
and St, e is the ancestral node of the four B. aphidicola’s, and ae is the ancestral node of BAp and
BSg. We applied the same methodology to dN .
5.4.5 Constructing sub-alignments with unpreferred codons
To investigate if we have translational robustness we create sub-alignments, which only contain
unpreferred codes, such that we remove the codons that are e"ciently translated. As we are using
CAI for Ec as a proxy for CAI in B. aphidicola we went through each of the alignments and removed
codon columns that have CAI > 0.5 in Ec. Only the sub-alignments with more than 30 codons were
kept to make sure that we have su"cient statistical power.
5.4.6 Statistical analyses
We identified and quantified Pearson’s correlations ($) between three main parameters, CAI, dS
and dN . All the statistical analyses were carried out using the statistical package SPSS v10. For the
correlation analyses, we also adjusted the model that better accounts for the data comparing linear,
quadratic and logarithmic relationships between the variables. We used other complex adjustments
but none improved the fit to the data. We also analyzed relaxed constraints in B. aphidicola’s syn-
onymous and non-synonymous sites by estimating the percentage di!erence of dS and dN between the
comparison BAp-BSg and Ec-St using the fractions:
R(dS) =dS(BAp!BSg)
dS(Es!St); R(dN ) =
dN(BAp!BSg)
dN(Es!St)
Then we analysed the correlation of R(dS) and R(dN ) with CAI and other parameters. For
example, to identify the relationship between protein structure compactness (e.g., number of amino
acids solvent accessible) and increments of substitutions rates from free-living to endosymbiotic bac-
teria we analysed the correlation between the molecular density of proteins and R(dNe)). To obtain
the molecular density of proteins, we calculated the median number of amino acids surrounding each
amino acid in each protein structure. Number of amino acids was calculated by calculating the average
Euclidean distance between the atoms of amino acids in a three-dimensional structure.
96

5.5 Results
For the analyses of translational robustness, we tested the significance in the increments of corre-
lation ("$) between dNe and CAI after removing preferred codons from the genome alignments. We
measured this increment as:
"$ =$ ($total $ $unpreferred)
$total
where $total and $unpreferred account for the correlations using the total number of codon sites in
the alignment and using alignments excluding highly adapted codons, respectively. We also measured
the "$ for the di!erent functional categories in the Cluster of Orthologous Groups (COGs) in the
same way. This allowed us to identify significant negative increments in the correlation coe"cients of
each one of the COGs classes, indicating decreased translational robustness at that class.
5.5 Results
5.5.1 Expression levels correlate with evolutionary rates in B. aphidicola
Analysis of free-living bacteria shows that expression levels measured using Codon Adaptation
Index (CAI) in Escherichia coli (Ec) negatively correlate with nucleotide substitutions at synonymous
sites between free-living bacteria (dSf ) (Figure 5.1 a: Pearson’s correlation; $ = $0.629 , P =
2.45 ! 10!57). We found this relationship to also be true between the number of replacements per
non-synonymous sites in free-living bacteria (dNf ) and CAI (Figure 5.1 b: Pearson’s correlation;
$ = $0.600, P = 3.59!10!51). Thus evolutionary rates are constrained by protein’s expression levels.
Analysis of these correlations between the synonymous (dSe) and non-synoymous (dNe) endosymbiont
distances of B. aphidicola Acyrthosiphon pisum to Schizaphis graminum (BAp-BSg) distances and
CAI in Ec, shows that unlike dSe-CAI correlation, dNe-CAI correlation was negative and strongly
significant in the full dataset (Table 5.1). This suggested that selective constraints became relaxed
in endosymbiotic bacteria compared to free-living bacteria and this e!ect was more significant in
synonymous sites than in non-synonymous sites. Accordingly, the ratios between endosymbiont and
free-living bacteria distances R(dS) and R(dN ) were strongly correlated with CAI (Figure 5.1 c) mainly
due to relaxed constraints in synonymous sites (Pearson’s correlation coe"cients between R(dS) and
dSf ; $ = $0.793, p = 4.83 ! 10!111) and, to a lesser extent, in non-synonymous sites (Pearson’s
correlation coe"cients between R(dN ) and dNf ; $ = $0.707, P = 2.10! 10!78).
Interestingly at values of R(dN ) < 10 (for example, considering genes showing a maximum in-
crement of 10 fold in dN values from free-living to endosymbiotic bacteria) the relationship between
this parameter and CAI switched from logarithmic to linear. Further, when we used the set of genes
showing R(dN ) < 10, the dNe-CAI linked correlation increased significantly in comparison with the
97

Chapter 5. The Role of Translational Robustness in the Evolution of Buchnera aphidicola
Figure 5.1: Correlation of nucleotide substitutions and codon adaptation index in Escherichia coli(a) Correlation between substitutions per synonymous site between Escherichia coli and Salmonellatyphimurium (dSf ) and CAI. (b) Correlation between substitutions per non-synonymous site betweenEscherichia coli and Salmonella typhimurium (dNf ) and CAI. (c) Correlation between CAI and thelogarithmic increments in dS and dN [R(dS) and R(dN ), respectively] from free-living bacteria toendosymbions. R is the ratio of the nucleotide distance of endosymbionts to that of free-living bacteria.
Table 5.1: Correlation between codon adaptation index (CAI) in Escherichia coli and synonymous(dSe) and non-synonymous replacements (dNe) in B. aphidicola.
$Total codons Codons with relative
adaptedness < 0.5dSe $ CAI dNe $ CAI # Genes dSe $ CAI dNe $ CAI # Genes
Fulla 0.115** -0.383*** 509 -0.009 -0.253*** 424R(dN ) < 10b 0.160* -0.411*** 391 0.045 -0.291*** 378R(dN ) & 10c 0.166 -0.217 118 -0.230 -0.03 43
aTotal number of genesbGenes with less than 10 times greater dN in endosymbionts than in their free-living relatives.cGenes showing at least 10 times greater dN in endosymbionts than in their free-living relatives
P < 0.01("); P < 10!4(""); P < 10!6(" " ")
98

5.5 Results
full dataset, while dSe-CAI showed no negative correlation (Table 5.1). This suggests that synony-
mous and non-synonymous sites have been under di!erent and independent selective constraints in
endosymbiotic bacteria. When we considered genes with R(dN ) > 10, the dN -CAI linked correlation
vanished (Table 5.1). These results support the fact that the set of less conserved genes in endosym-
biotic bacteria in comparison with free-living bacteria have been accumulating slightly deleterious
mutations in a stochastic manner in B. aphidicola.
5.5.2 Evolutionary rates in B. aphidicola are under structural constraints
Previous studies have shown significant correlation between the evolutionary rates of proteins
and structural and functional protein characteristics in yeast (Pal et al., 2001; Drummond et al.,
2005). We sought to analyse if such a relationship is present even in a biological system with high
genetic drift e!ects such as is seen in the case of B. aphidicola. We calculated the molecular density
of proteins from B. aphidicola for which crystal structures from its closest free-living relative Ec exist
in the databases (A total of 327 proteins; see table E.1 for details about individual atomic densities
of proteins). Protein molecular densities were calculated as the arithmetic mean of the densities of
the component amino acids. Atomic densities were estimated as the number of residues surrounding
each amino acid in the structure a distance at less than 8Å. The relationship between R(dN ) and
the average molecular density of proteins is negative and strongly significant (Pearson’s correlation;
$ = $0.241, P = 7.65!10!8), yielding similar values to the correlation obtained for yeast (Drummond
et al., 2005). This confirms that the e!ect of protein structure on the evolutionary rates of proteins is
stronger than previously suspected (Pal et al., 2001). Because of the significant di!erences between the
correlations coe"cients of dNe and CAI at low and high R(dN ) we divided the set of 327 proteins into
those showing R(dN ) > 10 and those with R(dN ) < 10. If increases in non-synonymous substitutions
are more related to expression levels at low R(dN ) than to structural constraints then we would expect
the correlation between R(dN ) and protein density to vanish in these genes. Conversely, R(dN ) will
not be correlated with expression levels while showing a strong correlation with structural protein
density at R(dN ) > 10 if amino acid replacements were stochastically accumulating at these genes
and fixed at amino acid sites with little e!ect on protein structure stability (mutations at highly dense
amino acids would be deleterious). Indeed, while correlation between R(dN ) and protein density was
not significant at R(dN ) < 10 (Pearson’s correlation; $ = $0.033, P = 0.514) this correlation was
strongly significant at R(dN ) > 10 (Pearson’s correlation; $ = $0.436, P = 8.20! 10!6).
99

Chapter 5. The Role of Translational Robustness in the Evolution of Buchnera aphidicola
5.5.3 Translational robustness determines the evolution of B. aphidicola
Selection for translational robustness acts at the nucleotide level, by optimising codon usage and
hence increasing translational accuracy (Akashi, 1994), and at the amino acid level, to increase the
number of proteins that fold properly despite mistranslation (Drummond et al., 2005). In B. aphidi-
cola the overexpression of GroEL bu!ers the e!ect of mistranslational errors (Moran, 1996; Fares
et al., 2002a,b), although this alone is insu"cient to explain endosymbiont stability. Selective pres-
sures to maintain abundance of translationally e"cient codons will constrain synonymous evolution
(selection for translation e"ciency) and, as a consequence, protein evolution. If dSe and dNe were
independent, then the dNe-CAI linked correlation would remain significant when using the portions
of genes consisting only of unpreferred (not e"ciently translated) codons. We used in the alignment
all the codons except those showing a “relative adaptedness” (Sharp & Li, 1987) in Ec > 0.5. We
then recomputed dNe and dSe and performed the correlation analyses with expression levels. We
discarded proteins with less than 30 codons and the final set included 424 proteins. We observed that
the CAI-dN correlation remained highly significant at these alignments (Table 5.1). Moreover, genes
with R(dN ) < 10 showed stronger correlation than the entire dataset while this correlation vanished
for genes showing R(dN ) > 10 (Table 5.1). Proteins hence have been very resistant to the genetic
drift e!ects in B. aphidicola and evolved following the general laws of protein evolution.
5.5.4 Heterogeneous translational robustness among functional categories
in B. aphidicola
Because of the symbiotic relationship, aphid and bacterium are intimate through the inter-change
of molecules that satisfy the biochemical requirements of both organisms. In B. aphidicola, this has
out of necessity translated into a dramatic modification of genome contents and organisation (Gil
et al., 2002, 2006; Perez-Brocal et al., 2006). In this case, we would expect translational robustness
to vary among functional categories in the endosymbionts. To examine this possibility we tested the
significance of correlations between CAI and dNe in three functional categories generated using the
Cluster of Orthologous Groups (COG) (Tatusov et al., 2003) terms available at GenBank (Metabolism:
Met; cellular processes and signaling: CPS; and information storage and processing: ISP). The mean
CAI as well as the number of genes was similar between categories (163, 98 and 144 genes for Met,
CPS and ISP categories respectively, the remaining genes were unclassified). While the correlation
between R(dN ) and CAI holds similar for all three categories, metabolic genes (Met) genes show on
average as much as twice R(dN )-CAI linked correlation as the other two categories, indicating more
100

5.5 Results
Table 5.2: Correlation between codon adaptation index (CAI) in Escherichia coli and non-synonymous replacements (dNe) in B. aphidicola.
CAI-dNe linked correlations (# Genes)Full alignments Excluding codons with
adaptedness < 0.5R(dN ) < 10 R(dN ) & 10 R(dN ) < 10 R(dN ) &10
Meta -0.330**(141) -0.116 (32) -0.079 (140) 0.234 (18)CPSb -0.418**(84) -0.131 (14) -0.304*(77) -0.581 (5)ISPc -0.498***(91) -0.188 (53) -0.490***(89) -0.292 (11)
aMetabolic proteinsbProteins involved in cellular processing and signallingcProteins involved in information storage and processing
P < 0.01("); P < 10!4(""); P < 10!6(" " ")
dramatic relaxed constraints in this functional category. Interestingly, the strong negative correlation
of CAI-dNe in the category Metabolism vanished (Table 5.2) when considering alignments excluding
preferential codons, indicating that protein’s evolutionary rates are fully dictated by the existence of
preferentially expressed codons in these genes. Conversely, cellular processing and signaling (CPS)
and information storage and processing (ISP) showed strong CAI-dNe linked negative correlations
at these modified alignments indicating that proteins evolution is under selection for translational
robustness rather than under selection for translational e"ciency (Table 5.2). A more in-depth analysis
of the di!erent sub-functional categories (Figure 5.2 a) reveals that metabolic genes have dramatically
reduced the CAI-dNe linked correlations in almost all its sub-categories, while CPS and ISP maintained
almost identical correlations when using protein alignment excluding adapted codons (median of
Pearson’s correlation increments were -0.80, -0.075 and -0.076 for the functional categories Met, CPS
and ISP, respectively, Figure 5.2 a). Interestingly, Figure 5.2 a shows that in some categories the
CAI-dNe linked correlations increased (for example "$ > 0), with many of these categories, such as
chaperones, coenzyme transport and metabolism and cell wall membrane biogenesis having important
functions for the evolutionary stability of the endosymbiont and its biochemical communication with
the aphid host.
5.5.5 The magnitude of translational robustness is lineage dependent
Because of the di!erent ecological niches occupied by the di!erent aphid species, we tested if this
di!erence has a!ected the evolution of the di!erent proteins in B. aphidicola. We thus conducted the
same analyses as above estimating "$ for each one of the lineages in the di!erent protein functional
categories. Table 5.3 shows that, when considering all the genes as well as each functional category
for each lineage, the correlation between CAI and dNe remains significant once preferred codons were
101

Chapter 5. The Role of Translational Robustness in the Evolution of Buchnera aphidicola
Figure 5.2: Variation of correlation of codon adaptation index (CAI) and non-synonymous nucleotidesubstitutions in endosymbionts (dNe) between di!erent proteins’ functional classes. Y-axis representsincrements from comparing correlations when considering using the full protein alignments ($total)to those of alignments excluding preferentially translated codons ($unpreferred). Increments weremeasured as "$ = !1("total!"unpreferred)/"total. Definition of functional classes is based on the clusterof orthologous groups (COG) from GenBank. We performed the analysis for the comparison ofB. aphidicola Acyrthosiphon pisum (BAp) and Schizaphis graminum (BSg) (a); and for each B.aphidicola lineages, including in addition B. aphidicola Bayzongia pistaciae (BBp) and Cinara cedri(BCc) (b). The three global classes, metabolism, cellular processes and signaling and informationstorage and processing are further divided into several subclasses. We indicate significant CAI-dNe
linked correlations for each subclass with a dark star, while we label significant average correlationsfor each global class with a color-coded star. Bars for global classes indicate the median "$.
102

5.6 Discussion
Table 5.3: Correlation between codon adaptation index (CAI) in Escherichia coli and non-synonymous replacements (dNe) in B. aphidicola lineages
CAI-dNe linked correlationLineage All categories Met CPS ISPBAp -0.160* 0.096 -0.441** -0.258*BSg -0.245** 0.124 -0.456** -0.419**BBp -0.143* 0.078 -0.380* -0.250*BCc -0.293*** -0.158 -0.630*** -0.242*
BAp-BSg -0.089 0.025 -0.160 -0.269*MCSA -0.343*** -0.053 -0.617*** -0.499***
Significance values [P < 0.01 (*); P < 10!4 (**); P < 10!6 (***)] are a!ected by number of genes(250 genes in total: 90 Metabolic (Met), 42 for cellular processes and signaling (CPS), and 103 forinformation storage and processing (ISP) and 15 undefined).
removed from the alignments in all the cases except in metabolic genes. Even the correlation though
remained significant, the correlation coe"cients magnitudes decreased in each one of the lineages
and functional categories (Figure 5.2 b). This reduction implies that selection on nucleotides (for
example translational e"ciency) has partially driven selection at the amino acid level. Interestingly,
the lineage leading to the ancestor of BAp and BSg only showed evidence of translational robustness in
the category IPS. Conversely, BCc presented evidence of translational robustness in all the categories
and also included the genes for Metabolism as the only B. aphidicola lineage to do so (Table 5.3). We
also tested each functional sub-category for translational robustness following the approach described
above. Figure 5.2 b shows that CAI-dNe linked correlation dropped significantly in the genes involved
in metabolism in comparison with the other two functional categories in all lineages. Correlation
coe"cients remained however similar in the other two categories to those estimated for the alignments
including preferentially translated codons. The lineages leading to BCc or the most common symbiotic
ancestor (MCSA) presented the greatest evidence of translational robustness, with a decrease in the
CAI-dNe correlation being insignificant after removing preferred codons from the alignments (Figure
5.2 b). This may indicate greater structural stability at these proteins.
5.6 Discussion
We provide evidence that expression level remains the main factor determining protein evolution-
ary rates in B. aphidicola despite its increasing genome load of mildly deleterious mutations and its
genome streamlining (Gil et al., 2002, 2006; Perez-Brocal et al., 2006). Assuming that most of the genes
became non-functionalised and lost immediately after the establishment of symbiosis, the remaining
genome may represent the pool of genes having undergone strong selective constraints and possible
103

Chapter 5. The Role of Translational Robustness in the Evolution of Buchnera aphidicola
functional divergence (Toft & Fares, 2008) dependent on the population and evolutionary character-
istics of the host and the bacterium. Our main conclusions are: i) gene expression levels explain most
of the variation of protein evolutionary rates; ii) protein structure constrains the accumulation of
mildly deleterious mutations in the endosymbiont; iii) expression levels determine evolutionary rates
by constraining the protein sequence directly (translational robustness) rather than through trans-
lational e"ciency; iv) translational robustness is asymmetrically distributed among the functional
categories and B. aphidicola lineages; and v) unlike metabolic genes, genes for cellular processes and
post-translational modification are under strong translational robustness pressures.
Selection has dramatically relaxed at synonymous and non-synonymous sites in the endosymbiotic
bacteria, mainly due to genetic drift e!ects as previously reported (Lynch, 1996; Moran, 1996; Lynch,
1997; Brynnel et al., 1998; Clark et al., 1999; Rispe & Moran, 2000; Funk et al., 2001). The strong
correlations between the CAI in Ec and the increments in dS and dN (namely R) indicate that there
is a threshold on the mutational load in proteins irrespective of the strength of selection above which
fixed mutations become deleterious and the organism does not survive. Using CAI of E. coli as a
proxy to gene expression in B. aphidicola, we have confirmed this by showing that at high R(dN )
values the correlation between structural constraints and proteins’ evolutionary rates is significant.
This upper-limit threshold for mutational load is also supported by the resistances of genes with high
CAI to AT enrichment in B. aphidicola as noticed here and elsewhere (Rispe et al., 2004). We would
like however to drawn the attention to that results must be taken with caution since slight changes are
expected to happen in gene expression from E. coli to B. aphidicola. For example, taking into account
the direct positive correlation between gene expression and essentiality and its negative correlation
with gene evolutionary rate, it has been shown that B. aphidicola genome contains 32% of essential
genes versus only 6% for the E. coli genome (Vinuelas et al., 2007). This implies a change in the
selective constraints on the genes in B. aphidicola in comparison with E. coli possibly accompanied
by a change in expression levels, although we have shown that CAI in E. coli correlates with that in
B. aphidicola.
Drummond and colleagues proposed that the cost of misfolding can be counteracted through a
slowing of dN , which explains why highly expressed genes evolve slowly, they called this phenomenon
translational robustness (Drummond et al., 2005). In the case of B. aphidicola translational robustness
becomes an important and fundamental hypothesis to explain the stability of a system with a large
mutational load. This hypothesis predicts that protein misfolding costs dependent on expression levels
favour rare proteins structurally robust to translation errors (Drummond et al., 2005). Translation
errors in B. aphidicola are a frequent phenomenon because most of the repair and recombination genes
104

5.6 Discussion
have been lost to di!erent extents in the di!erent genomes compared (Shigenobu et al., 2000; Tamas
et al., 2002; van Ham et al., 2003; Perez-Brocal et al., 2006). The dependence between translational
robustness and functional categories in B. aphidicola provides an explanation for the slight correlations
between evolutionary rates and protein’s function as observed previously in other systems (Pal et al.,
2001; Rocha & Danchin, 2004). In agreement with Drummond et al. (2005), we show that the
expression level and not a protein’s functional importance is the factor determining the proteins’
evolutionary rates because its correlation with protein’s evolution varies among functional categories
in the di!erent B. aphidicola lineages.
The sole e!ect of genetic drift on the evolution of B. aphidicola would yield similar levels of
selection for its di!erent strains and an early demise of these lineages as a result of a sharp decline
in fitness. Our results show a clear di!erence in the correlation of proteins’ evolutionary rates and
expression levels between lineages as well as functional categories. In general, proteins of the cellular
processing and signalling functional category as well as information storage and processing present
strong evidence of translational robustness. These categories include chaperone systems and all essen-
tial components for protein translation, which are preserved at the evolutionary level in these lineages
in comparison with other proteins. Metabolism genes however seem to present strong selection at the
nucleotide level, which may be coincidental with weak selection for translational e"ciency to favor
expression of genes providing amino acids to the host. BCc is the lineage presenting the most similar
pattern of selection to that of the MCSA in comparison with the other lineages and the only lineage
presenting evidence for translational robustness in all the functional categories. This bacterium shares
the symbiosis lifestyle with a secondary bacteriocyte-housed symbiont (Candidatus Serratia symbiot-
ica: Ss), present in large numbers in the aphid host (Perez-Brocal et al., 2006). Because of the more
streamlined genome of BCc in comparison with the other lineages and the apparent contribution of
Ss to the metabolism of the aphid, Perez-Brocal and colleagues postulated that BCc is undergoing
genome degradation and functional replacement by the secondary endosymbiont (Perez-Brocal et al.,
2006). They support this suggestion by observing greater dN values in BCc lineage than other strains
in most of the genes. Even though genome degradation may be the final fate for this bacterium as pos-
tulated earlier, our results however support a stronger role for translational robustness on determining
the rates of evolution in BCc, which is only obvious when we account for expression levels. Hence, we
postulate that BCc has become entrenched into a static evolutionary dynamic because it has reached
the minimum required genome to support the symbiotic life-style. Significant changes in the genome
content of the secondary endosymbiont may however lead to the final degradation of BCc and its
final replacement by the secondary endosymbiont. If degradation were the final unavoidable fate for
105

Chapter 5. The Role of Translational Robustness in the Evolution of Buchnera aphidicola
this bacterium, we postulate that endosymbiotic bacteria of aphids would undergo punctual genome
degradation events separated by long periods of genomic stasis. These punctual events in BCc will
be very likely determined by dramatic evolutionary genome dynamics in the secondary endosymbiont
of aphids Ss. This is supported by a recent study that unearths a beautiful biological consortium
between BCc, Ss and the aphid host (Gosalbes et al., 2008). In their insightful work, Gosalbes and
colleagues conducted evolutionary and microscopic studies that show a split of the genes involved in
the tryptophan biosynthesis between BCc and Ss. BCc contains the gene trpEG codifying for the
anthranilate synthase, the first protein of the tryptophan biosynthesis pathway, while Ss contains all
the other genes trpDCBA. The conclusion is that the anthranilic acid synthesized in BCc is exported
to Ss to enter the tryptophan biosynthesis pathway resulting in the production of tryptophan that is
further exported to BCc and the host. This tight metabolic consortium between the three partners
of the symbiotic relationship lends support to out conclusions that point to a high stability of the
BCc-host symbiotic system. We then provide further and independent evidence of such stability and
uncover the complexity evolutionary dynamic reached by such an apparently simple organism as BCc.
The question remaining is how is this translation robustness achieved? Such a dramatic change
in the robustness of protein structures is only possible though the modification of the interactions
architecture of the amino acid sites. The reshaping of the fitness landscape associated with mutations
is only possible though complex epistatic interactions between mutations. Given the e!ect of genetic
drift we hypothesise that these interactions have mainly occurred though compensatory e!ects of
mutations or antagonistic epistasis.
5.7 Acknowledgements
This work was supported by a grant from Science Foundation Ireland to M.A.F. C.T. is supported
by a grant from the Irish Research Council for Science, Engineering and Technology: funded by the
National Development Plan.
106

Chapter 6
Dobzhansky-Müller Amino Acid Sites
Interact to Ameliorate Müller’s
Ratchet E!ects in Buchnera
aphidicola
6.1 Related publications
Toft C and Fares MA. Dobhanzky-Müller Amino Acid Sites Interact to Ameliorate Müller’s
Ratchet E!ects in Endosymbiotic Proteobacteria of insects.
In preparation.
This chapter follows closely the contents of the above manuscrip, although some sections have
been extended to better contextualise the other chapters and/or to give feather depth to the subject.
Novel tool to predict SDMs and DMIs have been created and implemented by Mario Fares.
6.2 Abstract
Because of its mode of transmission to next host generations, endosymbiontic bacteria of insects
have evolved under Müller’s ratchet e!ect such that they accumulate slightly deleterious mutations in
107

Chapter 6. Dobzhansky-Müller Amino Acid Sites Interact to Ameliorate Müller’s Ratchet E!ects inBuchnera aphidicola
an irreversible manner. The consequent increasing number of mildly deleterious mutations through
generations has destabilised the proteome of this endosymbionts and led to the loss of a!ected genes
that were redundant for the bacterium in its endoymbiotic lifestyle. The continuous strong e!ect of
genetic drift in essential genes however could not be resolved by gene disintegration and other evolu-
tionary pathways may have allowed the survival of endosymbiotic bacteria for long geological periods.
It has been shown that the heat-shock protein GroEL is able to bu!er the destabilising e!ects of fixed
slightly deleterious mutations on its protein clients. This however is insu"cient to explain the equilib-
rium at non-GroEL client proteins or the sustainable bu!ering e!ect despite the continuous build up
of mutations at GroEL protein clients. Here we investigate other evolutionary mechanisms that may
have intrinsically ameliorated the e!ects of mildly deleterious mutations in the proteome of the endo-
cellular symbiont of aphids, Buchnera aphidicola. As well as investigating the robustness of the protein
structures to misfolding translation errors we also tested the Dobzhansky-Müller interactions (DMIs)
at the protein structure level. We observe that there is a negative correlation between the evolution-
ary rate and the structure location of an amino acid site in endosymbionts indicating that the same
selection principles operating in free-living organisms have shaped the evolution of non-redundant
proteins. It was possible to identify DMIs in the genomes of B. aphidicola through a novel computa-
tional method and find strong positive correlation between numbers of slightly deleterious mutations
and compensatory mutations, sparking speculation that DMIs may be responsible for counteracting
Müller ratchet e!ects. We find strong correlation between numbers of slightly deleterious mutations
and DMIs and the condition of being a client for GroEL. This provides a mechanistic explanation
whereby both, GroEL and DMIs, can preclude the demise of endosymbionts lineages. Overall we can
conclude that DMIs and GroEL have counterbalanced the e!ects of the ratchet through a tight con-
trol of antagonistic epistasis between slightly deleterious mutations. This may have been responsible
for biological innovation and increasing complexity for these bacteria allowing for their biochemical
communication with the insect host.
6.3 Introduction
Endosymbiotic bacteria of insects with a strict intra-cellular life and maternal transmission (ver-
tical transmission) are characterised by evolving at fast rates due to the e!ect of genetic drift (Lynch,
1996; Moran, 1996; Lynch, 1997; Brynnel et al., 1998; Clark et al., 1999; Rispe & Moran, 2000).
Because of the clonal transmission of these bacteria to the next host generations, mutations are verti-
cally inherited, with the mutational load increasing from one generation to the next in an irreversible
108

6.3 Introduction
manner. This irreversible increase of the mutational load has been identified as being an example
of a phenomenon called Müller’s ratchet (Muller, 1964). Müller’s ratchet has been identified and
characterised in the genome of all endosymbiotic bacteria of insects so far examined (For example,
Moran, 1996; Gil et al., 2003). Among other syndromes, endosymbiotic bacteria of insects and other
host species also present high AT load and a marked genome reduction. This may have been due to
non-functionalisation fuelled by the lack of selection on non-essential biosynthetic genes for the host
(Andersson & Kurland, 1998) and severe population bottlenecks leading to accumulation of deleterious
mutations followed by gene disintegration (for example see Andersson & Kurland 1998; Andersson &
Andersson 1999; Moran & Wernegreen 2000; Gil et al. 2002, 2003; Kneib et al. 2008). Whether genome
reduction occurs in big chunks (Moran & Mira, 2001; Nilsson et al., 2005), through a gradual process
(Silva et al., 2003) or through a gradual accumulation of mutations until gene non-functionalisation
followed by bursts of deletion of functionally related genes (Dagan et al., 2006) remains a debated
issue.
The convention in the field of endosymbiosis is that, despite the genomic stasis achieved in some
endosymbionts (such as in the case of B. aphidicola Acyrthosyphon pisum and Schizaphis graminum;
Tamas et al., 2002), they remain to be under strong genetic drift e!ects as a result of the intergen-
erational bottlenecks, with some of the slightly deleterious mutations (SDMs) neutrally drifting to
fixation. Because of the stochastic generation of mutations, most of these are deemed to be dele-
terious and are expected to lead to the demise of the organisms carrying them. The endosymbiont
proteome composition we observe today hence is the result of a massive filtering out of genes that are
non-essential for either or both of the partners of the symbiotic relationship. SDMs however can still
be fixed at these bacterial populations due to their small e!ective population sizes and leading thus to
decreased stability of RNAs (Lambert & Moran, 1998) and of proteins (van Ham et al., 2003). Strik-
ingly however, endosymbiotic bacteria of insects seem to have successfully challenged the expected
decline in their e!ective biological fitness. The mechanistic, genetic and proteomic explanation for
the bu!ering e!ect of SDMs remains as yet obscure although previous reports have hypothesised the
important role of the heat-shock protein GroEL in attenuating the structural destabilising e!ects of
SDMs over the endosymbiont proteome (Moran, 1996). As we mentioned in previous chapters and
demonstrated elsewhere, GroEL may have accomplished this through the coupled action of two main
mechanisms: i) functional divergence towards the fixation of functionally advantageous mutations to
improve its ability to bind and fold destabilised proteins (Fares et al., 2002a); and ii) Over-expression
of GroEL to cope with the increasing load of destabilising mutations (Fares et al., 2002a,b; Maisnier-
Patin et al., 2005). We believe however that in addition to the bu!ering action of GroEL, other
109

Chapter 6. Dobzhansky-Müller Amino Acid Sites Interact to Ameliorate Müller’s Ratchet E!ects inBuchnera aphidicola
mechanisms may have ensured the survival of the endosymbiotic bacterial lineages because the ca-
pacity of GroEL to counteract the e!ects of SDMs maybe be limited by the saturation of proteins by
structure destabilising mutations. Moreover, proteins not folded by GroEL had to utilise alternative
ways to counteract the e!ects of SDMs.
Evolution of protein sequences can be metaphorically represented in a fitness landscape where
its e!ects unfold to interlink genotype to phenotype (Wright, 1932). In such a landscape, protein
sequences traverse peaks and valleys as several sequence combinations may result in deleterious, neu-
tral or advantageous e!ects on the organism. Although a minority of the newly generated mutations
may involve an adaptive conflict between two mutations (for example mutations that are function-
ally advantageous but structurally unstable) and that could be solved through gene duplication and
functional divergence (Des Marais & Rausher, 2008), the vast majority of mutations are slightly dele-
terious and do not lead to adaptive conflict. Fixation of such mutations in large populations is strongly
hampered by inter-organismal competition that ensures their removal, although co-adapted genetic
interactions may challenge this outcome. In fact, this hypothesis previously championed by Sewall
Wright (1932) was demonstrated to occur in large populations such as those of the fruitfly Drosophila
melanogaster and Drosophila pseudoobscura (Kulathinal et al., 2004) at the same level as in small
human populations (Kondrashov et al., 2002). This showed therefore that occurrence of co-adaptive
mutations is independent of the population size. The importance of such covariation has also been
shown to lead evolution through the inter-species lethality of Drosophila hybrids due to the interaction
of Dobzhansky-Müller genes (Brideau et al., 2006).
In this chapter, we conducted two types of analyses, including a study of the mechanisms of
amino acid substitutions based on the three-dimensional characteristics of a!ected proteins’ regions;
and the quantification of Dobzhansky-Müller amino acid sites’ interactions in endosymbiotic bacteria
of aphids. We define a Dobzhansky-Müller pair as the fixation of a pair of SDMs which combined
e!ect is evolutionary neutral. The hypothesis we test is whether the e!ects of mutational load in
endosymbiotic bacteria have been bu!ered by the combined e!ects of: i) over-expression and functional
divergence of GroEL; ii) the fixation of mutations ensuring structural robustness; and iii) the epistatic
intra-molecular amino acid sites’ interactions.
6.4 Material and methods
The objective of the chapter is to identify the main parameters governing mutational dynamics
in symbiotic bacteria. We investigated the main molecular parameters shaping the propensity of an
110

6.4 Material and methods
amino acid site to accumulate amino acid transitions.
6.4.1 Genome sequences
To understand the molecular traits constraining the mutational dynamics of amino acid sites we
first tested whether the three-dimensional location of an amino acid site in the protein crystal struc-
ture can limit the amino acid transition space for that site. To conduct such analyses we gathered
information for genomes and protein crystal structures for available !-3-proteobacteria. We used Es-
cherichia coli K12 (Ec: NC_000913) as the reference genome in our search for orthologous proteins
in other bacterial genomes. In principle we investigated 58 di!erent genomes the accession numbers
of which are available in table F.1. We then filtered these genomes according to the available protein
structure information. As endosymbionts we used the endosymbiotic bacteria of aphids, B. aphidi-
cola strains Acyrthosiphon pisum (BAp: NC_002528), Schizaphis graminum (BSg : NC_004061),
Baizongia pistaciae (BBp: NC_004545) and Cinara cedri (BCc: NC_008513).
6.4.2 Identifying orthologs
Using Ec as reference sequence we searched for orthologs in the other 58 free-living gamma-3-
proteobacteria and four B. aphidicola genomes and identified those with Reciprocal Best Hits (RBH)
that presented an e-value less than 10!4. We built three sets of multiple protein sequence alignments.
The first set consists of the amino acid sequence from the crystal structure of the protein, the orthologs
from the three largest B. aphidicola genomes and orthologs from as many of the 58 free-living genomes
where present. The second set consists of the amino acid sequence from the crystal structure of the
protein and the orthologs from the four largest B. aphidicola genomes. The third set comprise of
the amino acid sequence from the crystal structure of the protein and ortholougs from at least 38
of the 59 free-living genomes. The first set comprises of both three B. aphidicola and free-living
bacteria are used to determine the SDMs in the B. aphidicola lineages. Where the other two sets only
contain sequences form free-living or B. aphidicola, are used to determine the relationship between
atomic density and Poisson distances for the two sets of organisms. We built all the multiple sequence
alignments using the program ClustalW (Thompson et al., 1994) and we inspected the alignments
thereafter.
111

Chapter 6. Dobzhansky-Müller Amino Acid Sites Interact to Ameliorate Müller’s Ratchet E!ects inBuchnera aphidicola
6.4.3 Identifying protein crystall structures
We searched for protein structures for all the genes aligned by exploring the databases UniProt
(UniProt-Consortium, 2008) and KEGG (Kanehisa et al., 2002). These databases cross-references/link
to other databases such that each entry points to related entries of other databases – this allows to
obtain structural information if present for sequence entry in these two databases. We downloaded the
database flat file from UniProt and obtained protein structure information for all the genes present
in the 59 bacterial genomes. Whenever available we used the structure of the protein present in Ec.
When no structure was available for particular proteins in Ec we searched the remaining 58 genomes
for the presence of a structure and if this structure was not present in UniProt we conducted a manual
search in KEGG. In total we identified 1092 structures for the bacterial genomes present (for example
an approximate average yield of 24% of the proteins for the bacteria utilised in this study had the
crystallised structure available; See table reftable:PDB-structures for the accession numbers).
6.4.4 Estimating evolutionary rates and propensity for fast evolution
The determinant of protein’s evolution in bacteria has been proposed to be the “essentiality” of
genes (Jordan et al., 2002) or genes’ expression rates (Rocha & Danchin, 2004; Wall et al., 2005).
This same result was not supported by data conducted in eukaryotic genomes (Hurst & Smith, 1999).
Even though Jordan et al. found negative correlation between “essentiality” of genes and protein
evolutionary rates, these correlations were not strong enough to definitively propose this parameter
as the sole force shaping protein’s evolution. On the contrary in this work we aimed to identifying a
parameter that explains evolution of proteins regardless of their essentiality. We tested the parameter
atomic density of amino acid sites (here density should be understood as the opposite to the solvent
accessible surface) as an intrinsic property of proteins able to constrain protein’s evolution. There are
several reasons why this parameter may be a useful measure of constraints: i) the higher the atomic
density of an amino acid (for example, the greater the number of amino acids surrounding this amino
acid in the three-dimensional structure of the protein) the greater is the number of atomic interactions
it establishes and the greater e!ect a mutation at this site would have on the stability of the protein;
and ii) location of amino acids in the three-dimensional structure provides them with di!erent weights
in the structural robustness of proteins, which has been shown to be a main determinant of protein
evolution (Drummond et al., 2005; Bloom et al., 2006; Drummond et al., 2006).
In each one of the 1092 protein structures for which we had multiple alignments in at least 38
bacteria used in this study we estimated the atomic density of each one of the amino acid sites in
the structure. To estimate atomic densities we first calculated the Euclidean (vectorial) distance from
112

6.4 Material and methods
that amino acid to each one of the remaining amino acids in the protein structure. The Euclidean
distance between any two amino acids i and j was calculated as
dij =(
(xi $ xj)2 + (yi $ yj)
2 + (zi $ zj)2
Here, x, y and z stand for the mean three-dimensional coordinates (for example, the mean vectorial
location of each amino acid in the protein) being compared. We then, counted the number of amino
acids that were less than 4 Å away in any direction from each amino acid, and this number was
considered representative of the atomic density. We also estimated two more parameters, the Poisson
distance for each one of the multiple sequence alignments corresponding to the protein structures and
the mean Poisson distance for each one of the sites in the multiple sequence alignments corresponding
to the amino acids in the protein structure. Then we categorised protein alignments into 5 main
categories depending on the average protein divergence levels. These categories were named 10%,
20%, 30%, 40% and >40%, and they included proteins with divergence levels varied between 0-10%,
10-20%, 20-30%, 30-40% and more than 40%, respectively. We only split proteins into categories up
until the first three (10%, 20% and 30%) divergence level. This was done for two reasons, i) it is widely
accepted that beyond 40-50% proteins no longer are expected to present the same structure and/or
function, and ii) B. aphidicola did not contain any genes in the divergence level of 30-40%. For each
one of the protein divergence categories, we split the di!erent alignments into five subcategories each
containing sub-alignments that comprised amino acids with similar atomic densities. These categories
were named 3, 6, 9, 12 and >12, and they included amino acids with atomic densities ranging between
1-3, 3-6, 6-9, 9-12 and more than 12 amino acids, respectively. Finally, we conducted the same
procedure with the alignments containing the four B. aphidicola genomes but using the divergence
levels obtained for the free-living as representatives.
6.4.5 Identifying slightly deleterious mutations (SDMs)
We identified SDMs in particular sequences (for example in sequences of endosymbiotic bacteria
of insects) using a novel and simple statistical approach. We first defined what a SDM is by consid-
ering the following rationale. A mutation will be deleterious or slightly deleterious if it occurs at a
functionally/structurally important site for the protein and if the mutation is a radical amino acid
transition in only one B. aphidicola lineage. It is widely accepted that functional sites are conserved
from the evolutionary perspective (so they present little to no amino acid substitutions along evolu-
tion). Based on this assumption and considering a multiple protein sequence alignment, we identified
a site to have fixed a SDM in a particular lineage or sequence if that site has been physically and chem-
113

Chapter 6. Dobzhansky-Müller Amino Acid Sites Interact to Ameliorate Müller’s Ratchet E!ects inBuchnera aphidicola
Figure 6.1: Identification of a slightly deleterious mutation at site i in sequence 12. A BLOSUMtransition matrix is created for site i and a distribution of the pairwise comparisons between thesequences is drawn. If the mean transition between the sequence of interest (seq 12) and the otherfall beyond 99% of the drawn distribution it is considered a radical change and therefore slightlydeleterious mutation for sequence 12.
ically conserved in all the other sequences of the multiple sequence alignment except in the lineage of
interest (see Figure 6.1). Since the aim of this study was to identify SDMs in B. aphidicola lineages,
we tested whether a site accumulated a radical amino acid substitution within the B. aphidicola clade.
To measure how radical an amino acid is we used the amino acid BLOSUM transition matrix scores
(Heniko! & Heniko!, 1996). We estimated all pairwise amino acid transition scores for each amino
acid site and drew the distribution of these transitions scores. We then estimated the transition score
from a particular B. aphidicola lineage to all the other lineages and compared these transitions against
the distribution of scores for that site. We compared the transition of amino acids at that site between
B. aphidicola and free-living bacteria. When transitions were beyond 99% of the distribution these
were considered significantly radical. To distinguish amino acid transitions neutrally fixed in a B.
aphidicola lineage from those fixed by adaptive evolution or functional divergence, we only considered
a mutation to be slightly deleterious if this mutation occurred in the terminal branch of B. aphidi-
cola’s cluster (see Figure 6.1), while the other B. aphidicola lineages conserved a non-radical amino
acid transition when compared to the free-living bacterial lineage.
114

6.5 Results
6.4.6 Identifying compensatory mutations (Dobzhansky-Müller incompat-
ibilities: DMI)
To identify DMI, we explored the multiple protein alignments that have a representative protein
structure available. The total number of proteins present in all three B. aphidicola with a crystal
structure available was 221 (more than 40% of the total B. aphidicola’s genome). We identified a
pair of mutations in a B. aphidicola lineage to be indicative of DMI when these were classified as
SDMs following our criteria and when they were no more than 4Å distant from one another in the
crystal structure (Figure 6.2 a). To make our test more conservative, we only considered a pair of
SDMs to be compensatory if both were surrounded by significantly conserved sites (for example sites
showing low divergence levels, Figure 6.2 a). Here we assumed that divergence levels are related to the
functional/structural importance of amino acid sites. Alternatively, if sites were distant in the protein
structure, we tested whether they were connected through a structural path of conserved amino acid
sites (Figure 6.2 b). The detection of DMI relies on the assumption that the pair of SDMs occurred in
the same lineages (Figure 6.2 c). To identify a structural path, we first draw three-dimensional spheres
around the sites considered to have fixed SDM in one of the B. aphidicola lineages, then we tested
the conservation of the amino acid sites within those spheres by comparison to the distribution of
conservation values for the remaining pair-wise comparisons along the alignment. For each one of the
conserved sites we drew new spheres of the same radius (4Å) and identified conserved sites as before.
We continued this procedure until no new conserved sites could be identified and finally searched for
a path through the drawn spheres to connect accumulated SDMs in the same lineage (Figure 6.2 b).
Structural paths were defined through the overlapping spheres. If paths coming from each site with
SDMs did not overlap through their spheres they could not be considered as DMI pair.
6.5 Results
6.5.1 Evolutionary rates correlate with atomic density
We tested the correlation between the three-dimensional location of amino acid sites and their
evolutionary rates measured as the corrected Poisson amino acids substitution rates. We tested first
alignments containing only free-living bacteria and approximately 1092 protein structures. The cor-
relation between the atomic density of a particular amino acid and its evolutionary rate was highly
significant (Figure 6.3 and Table 6.1). Within the same protein divergence levels, amino acid sites
surrounded by many others and presenting high numbers of atomic interactions showed lower evolu-
115

Chapter 6. Dobzhansky-Müller Amino Acid Sites Interact to Ameliorate Müller’s Ratchet E!ects inBuchnera aphidicola
Figure 6.2: Identification of compensatory mutations and Dobzhansky-Müller incompatibilities(DMI). A DMI is a pair of sites with two mutations each with slightly deleterious e!ects and whichcombination produces a neutral e!ect over the relative biological fitness contribution of the protein.We assumed a pair of mutations to compensate one another if they were in close proximity in thecrystal structure (a) or when they could be connected through a structural path (b). To consider twomutations conditionally advantageous to one another they have to have occurred simultaneously ontime (they should be detected in the same lineage of the phylogenetic tree) (c). Once coevolving siteshave been detected (red and blue spheres in a) and identified as being three-dimensionally close (forexample they show a distance from one another of ) 4 Å) we draw spheres of 4 Å radius surroundingeach of the sites and identified evolutionarily conserved sites (for example sites showing low divergencelevels in the multiple protein sequence alignment). When the coevolving sites are distant from eachother in the protein crystal structure (b) (> 4 Å) we proceed with a recursive approach to identifyconvergent interacting paths between them. Conservation of amino acid sites is tested by comparisonto the distribution of conservation values for the remaining pair-wise comparisons at those sites inthe alignment. Briefly, for each one of the conserved sites we drew new spheres of the same radius(4Å) and identified conserved sites as before. We continued this procedure in a recursive way until nonew conserved sites could be identified and finally searched for a path from one DMI pair to anotherthrough the drawn spheres that are overlapping. If no overlapping paths were found, sites were notconsidered to be a DMI.
Table 6.1: Correlation between atomic density and evolutionary rate for di!erent divergence levels
% Divergence Levels10 20 30
Free-living -0.997±0.086 -0.990±0.110 -0.942±0.113Endosymbiont -0.995±0.176 -0.982±0.215 -0.960±0.181
116

6.5 Results
Figure 6.3: Curves showing the correlation between evolutionary rate and atomic density at di!erentprotein divergence levels for free-living bacteria (a) and for the endosymbiotic bacteria of aphids B.aphidicola (b). Each point in the plot represents the mean divergence (measured as the mean Poissoncorrected distance between pairs of sequences in the alignment) for the sub-alignment containing aminoacid sites that fall within a particular category of atomic densities. The standard deviation of eachone of the divergence curves was considered to be the minimum standard deviation of the points toconserve the scale comparison between the atomic densities. Divergence levels were classified into 10%,20% and 30%, and comprised proteins sub-alignments showing 0-10%, 10-20% and 20-30% divergencelevels, respectively. Even though we could classify proteins within the category of 40% divergencelevel in free-living bacteria, the amount of data available for endosymbiotic bacteria in that categorywas very limited and hence we removed that category from downstream subsequent analyses. Atomicdensities represent the average number of amino acid sites surrounding each site in the protein. Thecategories were 3, 6, 9, 12, 15, 18 and represented sites surrounded by 1-3, 3-6, 2-9, 9-12, 12-15 and15-18 amino acid sites, respectively.
117

Chapter 6. Dobzhansky-Müller Amino Acid Sites Interact to Ameliorate Müller’s Ratchet E!ects inBuchnera aphidicola
Table 6.2: Slope of the curves from the comparison between atomic density and evolutionary rate
% Divergence Levels10 20 30
Overall Free-living -0.014 -0.030 -0. 035Endosymbiont -0.047 -0.049 -0.071
Ratio(Endosymbionts/free!living) 3.20 1.66 2.07Met Free-living -0.014 -0.030 -0.028
Endosymbiont -0.067 -0.055 -0.072Ratio(Endosymbionts/free!living) 4.77 1.85 2.53
CPS Free-living -0.019 -0.026 -0.025Endosymbiont -0.052 -0.048 -0.064
Ratio(Endosymbionts/free!living) 2.81 1.85 2.61ISP Free-living -0.012 -0.022 -0.032
Endosymbiont -0.034 -0.047 -0.086Ratio(Endosymbionts/free!living) 2.91 2.11 2.69
tionary rates than those with low atomic densities (Figure 6.3 a). This result is in agreement with the
assumption that mutations at amino acid sites that are more internalised in the protein may have more
structurally destabilising e!ects and are more likely to be removed by purifying selection. Strikingly,
sites presenting the same atomic density showed di!erent evolutionary rates when comparing proteins
with di!erent divergence levels. This di!erence in the evolutionary rates may be due to other factors
controlling the rate of protein evolution including protein expression levels and structural robustness.
In order to determine whether endosymbiotic genomes also present equivalent relationships be-
tween evolutionary rate and atomic density we also built curves for the 202 protein structures available
for B. aphidicola endosymbiotic proteomes. These curves yielded several interesting observations (Fig-
ure 6.3 b). The di!erence in the evolutionary rates for high atomic density categories between the
di!erent divergence levels was outstandingly similar to those of free-living bacteria. This point may
be due to the fact that the proteins in B. aphidicola are among those most conserved of free-living
bacteria. In analysing the slopes of the curves we also observed that these slopes were meaningfully
sharper than those in free-living bacteria, particularly at low protein divergence levels (see Table 6.2).
The di!erence in the conservation levels at amino acid sites suggests that proteins kept in B. aphidi-
cola lineages may be those that presented greater levels of conservation in their free-living ancestors.
If proved to be true, this would point to the fact that only complex proteins that are highly expressed
(for example indispensable proteins or proteins with high number of protein-protein interactions) may
have been kept in B. aphidicola because evolutionary distance and these parameters are negatively
correlated (Ingram, 1961; Dickerson, 1971; Wilson et al., 1977; Brookfield, 2000; Hirsh & Fraser, 2001;
Jordan et al., 2002; Fraser et al., 2003; Jordan et al., 2003; Hahn & Kern, 2005).
118

6.5 Results
To test this hypothesis, we analysed the 1092 protein alignments in free-living bacteria and divided
them into two main categories, one including the alignments of the proteins present in B. aphidicola
lineages and the other including the alignments of proteins that have been lost after symbiosis. We
then estimated the mean Poisson amino acid distance for each one of the protein alignments and
classified them into di!erent categories to produce a distribution of these distances in both groups of
protein alignments. The number and extension of the distance categories was obtained applying the
Stugart’s formula with the number of categories C being calculated as C = 1 + 3.3 log(n). Here n is
the total number of data. Both sets of data, alignments including proteins present in B. aphidicola
and those containing proteins lost after symbiosis, presented distributions di!ering from one another
(Figure 6.4 a), with the distribution of distances in proteins lost in B. aphidicola shifted towards
higher evolutionary distances than in the case of proteins present in B. aphidicola (Median distance of
proteins present in B. aphidicola DBuchnera = 0.385± 0.197; Median of protein in free-living bacteria
Dfree!living = 0.667± 0.227; Figure 6.4 b).
Finally, we conducted the same analyses subdividing the data into three functional categories
based on the Cluster of Orthologous Groups (COG). The three categories were metabolism, cellular
processing & signalling, and information storage & processing. The three categories showed the same
slope patterns between the di!erent curves of protein divergence levels although genes within the
metabolism category seem to present greater di!erence in slope with free-living bacterial proteins
compared to those in the other two categories (Table 6.2).
6.5.2 Pervasive fixations of SDMs during the evolution of B. aphidicola
To test the pervasiveness of SDMs in B. aphidicola as a result of genetic drift after symbiosis with
the aphid, we analysed the distribution of SDMs detected with our new approach among the di!erent
genes in B. aphidicola. For the sake of comparison, we subdivided our alignments into those including
B. aphidicola genomes and free-living bacteria, and those including only free-living bacterial genomes.
We used the first type of alignments to identify SDMs in B. aphidicola lineages and the second type
of alignments to identify SDMs in free-living bacteria. To remove spurious results where SDMs are
simply identified either due to the great distance between endosymbionts and free-living bacteria, due
to adaptive evolution in endosymbiotic bacteria or due to functional divergence, we only considered a
mutation in B. aphidicola to be slightly deleterious if that amino acid transition at that particular site
occurred only in one B. aphidicola genome while the other B. aphidicola genomes kept the ancestral
amino acid state.
Our analysis showed that a burst of SDMs was fixed in the lineages leading to B. aphidicola
119

Chapter 6. Dobzhansky-Müller Amino Acid Sites Interact to Ameliorate Müller’s Ratchet E!ects inBuchnera aphidicola
Figure 6.4: Distribution for the mean Poisson amino acid distance for proteins retained in B. aphidi-cola and those lost before symbiosis. The number and extension of the distance categories was obtainedapplying the Stugart’s formula with the number of categories C being calculated as C = 1+3.3 log(n).Here n is the total number of data.
120

6.5 Results
Figure 6.5: Distribution of slightly deleterious mutations in proteins retained in B. aphidicola andthose lost before symbiosis. Represented as the percentage of amino acid of an alignment that carriesa slightly deleterious mutation.
while free-living bacteria showed a very low proportion of SDMs (Figure 6.5). This distribution was
identical among the B. aphidicola genomes examined. The next question we asked was whether a
relationship existed between the conservation level of the protein in the free-living bacteria and their
propensity to accumulate SDMs. In examining the percentage of variable sites having fixed SDMs in
B. aphidicola and the evolutionary rates of the corresponding proteins in free-living bacteria, we found
that indeed both variables were slightly but significantly positively correlated (Pearson’s correlation:
$ = 0.24, P < 10!6). Most of this correlation was due to the strong interdependence between these two
parameters when considering genes involved in cellular processing and signalling (Pearson’s correlation:
$ = 0.389, P < 0.001) and genes involved in metabolism (Pearson’s correlation: $ = 0.250, P < 0.001).
Only when we looked at all the genes we observed a V-shape distribution in the comparison between
divergence and percentage of SDMs (Figure 6.6 a) . We then split the data into proteins showing
mean Poisson distances less or equal to 1 in free-living bacteria (conserved proteins) and proteins
showing distances greater than 1 (more relaxed proteins). Conserved proteins showed a slight but
significant negative correlation between distance and %SDM (Pearson’s correlation: $ = $0.131,
P < 0.05; Figure 6.6 b), while variable proteins showed a strong positive correlation between these
two parameters (Pearson’s correlation: $ = 0.42, P < 10!4; Figure 6.6 c).
121

Chapter 6. Dobzhansky-Müller Amino Acid Sites Interact to Ameliorate Müller’s Ratchet E!ects inBuchnera aphidicola
Figure 6.6: Correlation between percentage of variable sites having fixed SDM in B. aphidicola andthe evolutionary rate of corresponding proteins in free-living bacteria. The whole dataset gives aV-shape distributions around Poisson 1(a) where there is a negative correlation with Poisson < 1 (b)and positive for Poisson > 1 (c).
122

6.5 Results
Figure 6.7: Comparison between the mean percentage of variable sites having fixed slightly delete-rious mutation in B. aphidicola for GroEL and non-GroEL clients.
6.5.3 Protein clients of GroEL accumulate greater proportion of SDMs
The hypothesis we were testing was whether GroEL and the accumulation of Dobzhansky-Müller
incompatibilities were two simultaneously working evolutionary phenomena enabling the survival of
the endosymbiotic bacteria despite the e!ects of genetic drift. If this hypothesis were true we would
expect that proteins classified as clients for GroEL (for example, GroEL is essential to ensure their
folding and functional activation) should be more protected against SDMs than non-clients, as previ-
ously suggested (Moran, 1996) and demonstrated (Fares et al., 2002b,a). Consequently, the %SDMs
in client proteins should be greater than in non-client proteins. We considered as clients those proteins
that strictly require GroEL for their folding based on a previous publication (Kerner et al., 2005).
Then we calculated the %SDMs in these proteins and compared them with that for proteins that do
not require GroEL for the folding into their native conformation. The comparison of the %SDMs
between these two groups indeed showed that protein clients accumulated on average greater %SDMs
than non-clients (%2 = 3.904, P < 0.05; Figure 6.7).
6.5.4 Dobzhansky-Müller incompatibilities bu!er SDMs in B. aphidicola
Once SDMs were identified we tested for the distribution of compensatory mutations in the
di!erent endosymbionts. We only utilised BAp, BSg and BBp because their phylogenetic position is
123

Chapter 6. Dobzhansky-Müller Amino Acid Sites Interact to Ameliorate Müller’s Ratchet E!ects inBuchnera aphidicola
known and no secondary endosymbionts has been detected to be involved in substituting some of the
metabolic links between B. aphidicola and the host. In the case of B. aphidicola Cinara cedri (BCc)
however it has been shown to be on the verge of degeneration and to establish another relationship
with a secondary endosymbiont, making the analyses of SDMs and compensatory mutations rather
di"cult to interpret. We first analysed the correlation between the number of SDMs and the number
of compensatory mutations. Since a compensatory mutation is assumed to be a SDM that is three-
dimensionally close to another SDMs (both mutations should be less or equal than 4Å distance), and
considering the stochastic nature of the fixation of SDMs, the likelihood of observing two mutations
close by chance is slim. In theory increments of SDMs should not be accompanied by increments
of compensatory mutations due to chance or to simply an increasing number of SDMs fixed in the
protein. In fact, the %SDMs was very low which ensures the probability of detecting any two sites
three-dimensionally close to be low.
We detected very high correlation coe"cients between the number of SDMs and the number
of compensatory mutations in BAp (Pearson correlation coe"cients; $ = 0.534, P < 10!10), in
BSg ($ = 0.554, P < 10!10) and in BBp ($ = 0.957, P < 10!20). Interestingly, the correlation
coe"cient in BBp was significantly greater than that in the other two B. aphidicola lineages. We
also analysed the di!erence in the proportion of sites having undergone SDM fixations that have
also been compensated for by other mutations in the genome of the three B. aphidicola when data
were sub-divided into proteins that are clients of GroEL and those that do not need GroEL for
folding. In the first two lineages examined, BAp and BSg, both showed a close to significantly greater
percentage of compensated sites in proteins that do not use GroEL for their final folding (56% and
47% in BAp and BSg respectively) than in GroEL client proteins (38% and 39% in BAp and BSg,
respectively). In the case of BBp this di!erence was meaningless (52% of sites being compensated by
compensatory mutations in proteins that do not require GroEL and 49% of sites being compensated
in client proteins). Interestingly, we did not observe a proportional increase in both percentages but
rather client proteins showed a sharp increase in the proportion of compensated mutations in BBp
compared to the other two B. aphidicola lineages.
6.6 Discussion
In this work we carried out a study with the aim of understanding the evolutionary dynamics
of the fixation of slightly deleterious mutations in B. aphidicola. We specifically concentrated on the
endosymbiotic bacterium of the aphid B. aphidicola because its ecological, evolutionary and metabolic
124

6.6 Discussion
features have been characterised from a general perspective. There is no doubt that these endosym-
biotic bacteria have undergone a di!erential evolutionary way compared to their free-living cousins.
This dynamic has been extensively studied and it has been shown to consist of accelerated rates of evo-
lution (Buades et al., 1999; Wernegreen & Moran, 1999; Woolfit & Bromham, 2003; Canback et al.,
2004), protein destabilisation (van Ham et al., 2003) and extensive genome reduction (Mira et al.,
2001; Delmotte et al., 2006; Gomez-Valero et al., 2007). The assumptions and facts underlying the
evolution of endosymbiotic bacteria makes it di"cult to understand how the di!erent lineages have
not undergone extinction after tens of thousands of years of evolution. Given the strong e!ects of ge-
netic drift we would expect that each bacterium become evolutionarily overwhelmed by a continuously
growing irreversible mutational load. This means that the argument of the asymptotic stabilisation of
endosymbiont mutational load due to the deleterious e!ects of additional mutations is less convincing.
Alternatively we show in this chapter that other evolutionary mechanisms may have contributed
significantly to halting the deleterious e!ects of mutations. For instance we present evidence that
proteins did not accumulate mutations stochastically but amino acid sites’ evolutionary rates have
been very much governed by structural parameters. Although this rational is in apparent stark contrast
to previous insights (van Ham et al., 2003) we conclude that both insights are not mutually exclusive
and that gene degradation may be a process directly linked to the capacity of the bacterium to accept
SDMs. Only permissible mutations (those not a!ecting the whole protein structure) have been allowed
to accumulate. We provide two pieces of evidence in support of this; i) only the most conserved proteins
have been kept in B. aphidicola, probably because they are the ones o!ering ample opportunity for
accumulating SDMs due to the fact they are not saturated by these mutations; and, ii) we show that
at a low evolutionary rates a negative correlation exists between evolutionary rate and the percentage
of SDMs. This hypothesis however would only be plausible if we took other evolutionary scenarios
into account, such as translational robustness and functional divergence. Although these mutations
may have slight negative e!ects on protein structures, cells perform complex processes and hence it
is the combined e!ects of the components of the proteome rather than those due to single proteins
that should be considered. Previous works however did not consider the epistatic structural e!ects
of mutations of di!erent proteins, which we comfortably predict they may surely be antagonistic as
previously proved (Sanjuan & Elena, 2006).
How did proteins then survive their entrenchment into a narrowly variable dynamic of fixation of
SDMs? To shed light on this question we analysed how SDMs have accumulated in two sets of proteins.
The first set included those proteins that do require the Heat shock protein GroEL to acquire their
functionally active folding every time they undergo a denaturation or unfolding process. The second
125

Chapter 6. Dobzhansky-Müller Amino Acid Sites Interact to Ameliorate Müller’s Ratchet E!ects inBuchnera aphidicola
set includes those proteins that could acquire their native conformation in the absence of GroEL. We
showed that in those cases were GroEL is not needed, the amount of SDMs accumulated is less than
in those where GroEL is needed, pointing to that GroEL allows its clients to accumulate structurally
destabilising mutations because of its bu!ering e!ect. This also provides more evidence pinpointing
the powerful ameliorating e!ect of GroEL previously hypothesised and simulated (Moran, 1996; Fares
et al., 2002a,b; Maisnier-Patin et al., 2005). The universality of this fact and its link with the folding
activity of heat-shock proteins is also magnified by previous experiments where compromising these
molecules unfolds an astonishing phenotypic variability (for example, see Rutherford & Lindquist,
1998; Queitsch et al., 2002). We however propose here that GroEL in fact canalises evolution by
ensuring the survival of slightly destabilised proteins due to the fixation of a first SDM making possible
the fixation of other compensatory mutations that would stabilise the structure while allowing the
possibility for emerging functions and complexity. Consequently, the intrinsic ability of protein clients
of GroEL to compensate SDMs by fixing compensatory mutations may be delayed by the bu!ering
e!ect of GroEL.
To test this hypothesis, we searched for the presence of compensatory mutations in the three B.
aphidicola genomes using a novel approach based on protein crystal structures. Our results show that
the three lineages have accumulated di!erent percentages of compensatory mutations, with BBp being
the one showing a compensation of nearly every SDM. Because of the more ancestral establishment
of endosymbiosis in this lineage compared to BAp and BSg, we propose that the ultimate fate for
the evolutionary behaviour of the di!erent genomes is the combination of mutation e!ects in such a
way that the median of the e!ects becomes null (neutral) while allowing the possibility for emerging
complexity and functional novelties. Once more, examination of the proteins bu!ered by GroEL
showed much less compensation than in the case of proteins not bu!ered by GroEL demonstrating that
both systems, GroEL bu!ering and Dobzhansy-Müller incompatibilities have been working hand-in-
hand to avoid the final demise of these bacteria. Interestingly we also observed that in GroEL protein
clients the compensation e!ect is slower than in the case of non-clients probably because the selective
pressure over GroEL client proteins is relaxed by the bu!ering e!ect of GroEL. Nonetheless, the power
of GroEL is limited as the weight of compensatory mutations becomes as high as in non-client proteins
in the older lineage of the B. aphidicola (BBp).
Given our results we can conclude a general evolutionary scenario for the endosymbiotic bacteria
of aphids that would be parsimonious with the consequential degenerative e!ects of Müller ratchet.
Once a bacterium established endosymbiosis with the ancestral aphid insect and lost genes enabling a
free lifestyle, this bacterium started to accumulate mutations with slightly negative e!ects on proteins
126

6.6 Discussion
due to genetic drift. Proteins with an already high mutational load (highly variable proteins) under-
went degeneration caused by fixation of SDMs the e!ects of which amplified those of the pre-existing
mutations in a cascade reaction. As a result this burst of gene degeneration and disintegration followed
immediately (in geological terms) by the establishment of endosymbiosis leading to a dramatic genome
reduction. The more conserved proteins were, the more they accumulated mutations at permissible
amino acid sites that whose e!ects were probably mitigated by the antagonistic inter-protein mu-
tational interactions (inter-protein Dobzhansky-Müller interactions). This hypothesis predicts that
proteins kept in B. aphidicola were those with complex interactions in a scale-free manner and in
forming part of a highly plastic and promiscuous protein-protein interaction network. Moreover,
intra-protein epistatic interactions between mutations (intra-protein Dobzhansky-Müller interactions)
enabled the bu!ering of the accumulated SDMs. This process has also been enabled by the bu!ering
e!ect of GroEL that, in addition to the compensatory mutations, made possible the stabilisation of
the proteome in B. aphidicola.
127


Chapter 7
General Discussion and Conclusions
The genomic era that commenced two decades ago has left us with a plethora of complete genomes
sequenced at the di!erent organismal levels, from bacteria to multi-cellular eukaryotes. Since then and
during the post-genomic era, scientists have attempted to address projects with ambitious objectives
all of them focused on understanding the emergence of organismal complexity and its evolvability.
This thesis o!ers a flavour of some of this ambitious work aimed at increasing the understanding
of life on earth by providing a mechanistic explanation to the sustainability and success of one of
the most important mechanisms in the emergence of biological complexity, symbiosis. Against all
odds, not only did symbiosis overcome all the evolutionary and molecular challenges that mutational
dynamics and metabolic communication between organisms with extraordinary di!erences in their
biological complexities have involved but also it is the main mechanism responsible for the emergence
of various degrees of biological novelties.
The fact that symbiosis or fusion between two organisms ranges from the facultative interlink
between them, to the formation of an organelle in a proto-eukaryote is a testament to the combinatorial
innovative power of such evolutionary invention. Because of the impossibility to perform a holistic
study of symbiosis, we rather concentrated on the analyses of symbioses in a time point close to its
completion as the degenerative remains of a past endosymbiotic organism or as an organelle generating
a new level of complexity. The strict endo-cellular symbiotic bacteria of insects, such as the case of
symbionts of aphids and carpenter ants, provide a perfect model to understand how an organism on
the verge of extinction can generate innovation. These bacteria present several features that are at
the least surprising, among these are their high mutational load, their reduced genomes and their
unstable proteomes. It is astonishing however the convergent success of this lifestyle in evolutionarily
129

Chapter 7. General Discussion and Conclusions
unrelated organisms’ lineages.
The dogmatic scientific belief that selection ensures the survival of the fittest through a well-
understood mechanism is at the best under question when we try to understand the survival success
of endosymbiotic bacteria. Even though apparent, at the start of this PhD thesis we believed that we
could provide a mechanistic explanation in the light of the Darwinian evolution to this challenging
evolutionary puzzle (for example the survival of endosymbiotic bacteria despite their inconvenient
genome and proteome instability). To demonstrate our point we decided to perform comparative
genomic analyses of two endosymbiotic bacterial systems, including the endosymbionts of aphids
Buchnera aphidicola and the endosymbionts of Carpenter ants Blochmannia sp. These two types
of endosymbionts have been extensively characterised from the ecological as well as the molecular
perspectives and genomes for endosymbionts of di!erent host species have been fully sequenced and
annotated. This fact along comparing them to their free-living relatives allowed us to infer processes
at the root of the endosymbiosis events and hence reconstruct the temporal progression and succession
of the di!erent evolutionary dynamic events.
Before starting with the comparative genomics of endosymbiotic bacteria we had to face one
of the most important challenges, which was the development of computational resources to handle
such comparisons. The GRAST and PhyGRAST tools developed during the course of this thesis
have enabled the comparisons of genomes with di!erent sizes and the production of user-friendly
interpretable results. Not only do these tools allow the confirmation of already published data but they
have also yielded insightful results pointing to the first evidence of the dominance in the endosymbiotic
system of the general rules compiled in the “Origin of Species” by Charles Darwin (1859). Put
simply, evolution has followed di!erent paths to purge undesired components such as deficient genes
and unstable proteins and these mechanisms have been at their maximum potency in the case of
endosymbiotic bacteria of insects. Gene degeneration and disintegration has occurred in endosymbiotic
genomes in a controlled way and always obeying the basic Darwinian rules, deleterious events (for
example, deleterious mutations) are removed by negative selection, whereas advantageous mutations
are fixed because of their positive contribution to the biological fitness of the system. The removal of
fitness-compromising components does not occur randomly but follows the rules of biological economy
so that expensive processes including cell motility or unnecessary metabolic genes for the bacterium
or the insect host having been rapidly removed by selection despite the genetic drift e!ects associated
to the vertical transmission of these organisms between host generations. The extraordinary beauty
of endosymbiosis resides in the enormous shift in the selection-drift balance that has unveiled the
astonishing plasticity of evolution. Mechanisms such as epistasis that are barely apparent in a system
130

Chapter 7. General Discussion and Conclusions
under strong selection pressure become magnified as a backup plan to ameliorate the e!ects of such
a balance shift and even to take the opportunity for the generation and emergence of novel functions
and lifestyles.
One of the main conclusions of this thesis is that mutations do not fix randomly in endosymbiotic
bacterial proteins despite their stochastic emergence but rather follow a clear evolutionary pattern that
follows the physico-chemical and thermodynamic rules of nature. In conclusion, we show in chapter
5 that proteins in endosymbionts evolved towards structures robust to misfolding mutations. Such
a hypothesis “Translational robustness” have been shown to explain evolutionary rates of proteins in
organisms with dense populations such as the Baker’s yeast, Saccharomyces cerevisiae, but we show
here that the evidence supporting this hypothesis is magnified in a system with a selection-drift balance
shifted towards drift. Important and fundamental cellular processes have been the ones showing the
strongest signals of translational robustness which further supports the fact that symbiosis is not
exempt from following selection rules.
The neutral drift to fixation of SDMs in endosymbiotic bacteria of insects has unearthed an in-
credible potential for the emergence of functionally advantageous mutations despite their destabilising
e!ects that would be doomed under strong selective pressures. These have completely reshaped the
fitness landscape of endosymbiotic bacteria by the functional divergence of the proteome in a way
that allowed the intimate interlink of two biological systems, an eukaryotic organism and a bacterium,
while avoiding any decline in the relative biological fitness of the endosymbiont. Indeed, processes
such as the export of metabolites from the bacterium to the host have possibly been re-using existing
biological material (for example, genes) instead of inventing new material previously dedicated to cell
motility. For instance we show, in chapter 3, that flagella genes have reduced their complex proteomic
apparatus to the necessary genes for protein export in a reverse evolution way. This again supports the
view that evolution is highly dependent on the pre-existing material and hence the solution adopted
is not always the best of the solutions but the most parsimonious under given conditions. Going from
this point to the understanding of the enormous biological diversity is a trivial intellectual exercise,
since local optima would always ensure the emergence of new biological forms, while global optima
will stabilise organismal diversity. To understand this in the context of endosymbiotic bacteria we
have developed and identified genome wide functional divergence events and showed that functional
divergence of pre-existing proteins in endosymbiotic bacteria is dependent not only on the ecological
requirements of the bacterium but also upon those of their host. Hosts with di!erent ecological needs
would thus lead to the functional divergence of di!erent subsets of endosymbiotic bacterial proteins
as shown in chapter 4.
131

Chapter 7. General Discussion and Conclusions
In the last research chapter of this thesis we addressed and provided an evolutionary plausible
explanation for the survival of the endosymbiotic bacteria of insects despite the built up of degenerative
mutations in their genomes. Endosymbiotic bacteria of insects have utilised two main ingenious
mechanisms to ameliorate the e!ects of SDMs, one direct mechanism provided by the ubiquitous and
over-expressed heat-shock protein GroEL and an indirect mechanism due to the Dobzhansky-Müller
within-protein interactions between amino acid sites. Previous work has speculated and proposed a
mechanism to ameliorate the e!ects of SDMs in B. aphidicola through the folding of partially unstable
proteins through GroEL, others have demonstrated this theoretically and experimentally. However,
here we provide an additional elegant mechanism of which goes beyond the simple bu!ering-through-
folding to explain how this bu!ering is a generator of functional innovation per se. Proteins that are
GroEL clients have been allowed to accumulate greater number of SDMs for longer periods due to the
structurally bu!ering e!ects of GroEL and had ample opportunity for the generation and emergence
of functionally advantageous mutations and their structural compensatory mutations. Non-GroEL
client proteins have however been evolving under stronger constraints and the compensation of SDMs
has been a must to ensure the survival of the symbiotic system.
Based on all the evidence provided by our analyses and elsewhere we then proposed the following
evolutionary scenario for the establishment and survival of the endosymbiotic system in insects. This
scenario is the most parsimonious according to our point of view, because the number of evolutionary
turnovers is the least possible. Once symbiosys is established between the bacterium and the insect
host, the facultative proto-symbiont started to accumulate SDMs in redundant genes for the host
and/or the bacterium. Such genes became non-functionalised and their gradual initial degeneration
led to the unfolding of a cascade of genetic disintegration events that ultimately led to the rapid
genome reduction. Simultaneous to these events, functional divergences enabled by the accumulation
of functionally advantageous mutations whose structural destabilising events became neutralised by
GroEL and compensatory mutations made possible the intimate metabolic communication between the
host and the bacterium. Such a biological marriage succeeded despite the evolutionary inconveniences
due to the purging of expensive and redundant processes and to the re-shaping of the fitness landscape
of mutations through the Dobzhansky-Müller incompatibilities.
Despite the important contribution of this thesis to the understanding of the emergence and
success of endosymbiosis, several points remain to be investigated. How did the symbiosis allowed
the reshaping of the epistatic interactions between the di!erent proteins? Did more complex proteins
(for example proteins with more complex interaction networks) remain to allow better bu!ering of the
functionally destabilising mutations? How functionally promiscuous are these proteins in comparison
132

Chapter 7. General Discussion and Conclusions
with their homologs in free-living bacteria? What is the minimum genome composition for the endo-
cellular symbiosis? What is the final outcome of symbiotic phenomena? and many others. Even
though our results provide first indications and partial answers to these questions much has to be
done to complete the puzzle that is symbiosis. In our modest attempt to resolve the puzzle we realised
that symbiosis is yet another example of a complex evolutionary dynamic of apparently simple genomes
working in tandem with the elegant ways Darwinian evolution generate biological innovation.
133


Appendix A
Functional Categories deficed by COG
Table A.1: Functional Categories deficed by the Cluster of Orthologous Groups (COG)
Information Storage and Processing (ISP)J Translation, ribosomal structure and biogenesisA RNA processing and modificationK TranscriptionL Replication, recombination and repair
Cellular Processes and SignalingD Cell cycle control, cell division, chromosome partitioningV Defense mechanismsT Signal transduction mechanismsM Cell wall/membrane/envelope biogenesisN Cell motilityU Intracellular tra!cking, secretion, and vesicular transporO Posttranslational modification, protein turnover, chaperones
MetabolismC Energy production and conversionG Carbohydrate transport and metabolismE Amino acid transport and metabolismF Nucleotide transport and metabolismH Coenzyme transport and metabolismI Lipid transport and metabolismP Inorganic ion transport and metabolismQ Secondary metabolites biosynthesis, transport and catabolism
Poorly CharacterisedR General function prediction onlyS Function unknown
135

Appendix B
Functional Divergence of Buchnera
aphidicola genes
Table B.1: Analysis of functional divergence in genes of the endosmbiont of B. aphidicola. Datamissing or that could not be estimated are indicated by -. S stand for symbiont so is the comparisonbetween BAp and BSg. F stands for free-ling and referes to the comparison between Escherichia coliand Salmonellar. R is the ratio between symbionts and free-living (so symbionts over free-living).
Gene dN(S)1 dS(S)2 "(S)3 dN(F )4 dS(F )5 "(F )6 R7
aceE 0.071 4.3593 0.0163 0.0216 0.3661 0.059 0.276aceF 0.2048 1.9782 0.1035 0.0341 0.4805 0.071 1.4588ackA 0.1614 3.7221 0.0434 0.012 0.4485 0.0268 1.6207acpS 0.189 2.2643 0.0835 0.0399 1.2562 0.0318 2.6279adk 0.2894 3.3314 0.0869 0.0238 0.7151 0.0333 2.6101ahpC 0.1212 3.1822 0.0381 0.0047 0.4688 0.0100 3.799alaS 0.1732 2.7662 0.0626 0.027 0.7129 0.0379 1.6532amiB 0.2198 1.4434 0.1523 0.0676 2.7297 0.0248 6.1491apaH 0.1643 3.4328 0.0479 0.037 1.469 0.0252 1.9002argA 0.0679 3.2074 0.0212 0.0434 1.5782 0.0275 0.7698argB 0.0983 3.5699 0.0275 0.0299 0.8597 0.0348 0.7917
1Non-synonymous substitutions per site in the comparison of the endosymbionts of B. aphidicola Acyrthosiphonpisum and B. aphidicola Schizaphis graminum.
2Synonymous nucleotide substitutions per site in the comparison of the endosymbionts of B. aphidicola Acyrthosiphonpisum and B. aphidicola Schizaphis graminum.
3Non-synonymous to synonymous rates ratio for endosymbiotic bacteria4Non-synonymous substitutions per site in the comparison of the free-living bacteria Escherichia coli and Salmonella
typhimurium.5Synonymous substitutions per site in the comparison of the free-living bacteria Escherichia coli and Salmonella
typhimurium.6Non-synonymous to synonymous rates ratio for free-living bacteria.7The ratio between non-synonymous-to-synonymous rates ratios of endosymbionts and free-living bacteria.
136

Appendix B. Functional Divergence of Buchnera aphidicola genes
argC 0.1438 3.5808 0.0402 0.0547 1.2262 0.0446 0.9002argD 0.1192 3.7873 0.0315 0.0501 1.1729 0.0427 0.7368argE 0.1699 1.6658 0.102 0.0453 1.6367 0.0277 3.685argG 0.1061 3.8173 0.0278 0.0142 1.1484 0.0124 2.2478argH 0.1424 3.8741 0.0368 0.0352 0.9989 0.0352 1.0431argI 0.1141 3.5678 0.032 0.0683 1.4149 0.0483 0.6625argS 0.1645 1.9164 0.0858 0.0282 0.8921 0.0316 2.7155aroA 0.1438 3.8476 0.0374 0.0692 1.5512 0.0446 0.8378aroB 0.089 2.1493 0.0414 0.0425 0.9091 0.0467 0.8858aroC 0.1145 3.7656 0.0304 0.0282 1.1837 0.0238 1.2763aroE 0.1981 3.377 0.0587 0.0965 1.6945 0.0569 1.0301aroH 0.0445 1.6711 0.0266 0.0544 1.3588 0.04 0.6651aroK 0.0807 2.9924 0.027 0.0147 0.4035 0.0364 0.7403asd 0.1606 3.7123 0.0433 0.0201 0.9522 0.0211 2.0494asnS 0.1289 3.9363 0.0327 0.0376 0.6621 0.0568 0.5766aspS 0.1789 2.1636 0.0827 0.0325 0.7198 0.0452 1.8313atpA 0.0832 3.9966 0.0208 0.0064 0.2195 0.0292 0.714atpB 0.1077 2.5364 0.0425 0.0224 0.2614 0.0857 0.4955atpC 0.144 1.8918 0.0761 0.0166 0.3229 0.0514 1.4806atpD 0.0417 3.9819 0.0105 0.0045 0.195 0.0231 0.4538atpE 0.0291 1.5709 0.0185 0 0.016 0 10atpF 0.2345 1.4272 0.1643 0.0139 0.1838 0.0756 2.1726atpG 0.1188 1.8898 0.0629 0.0158 0.2356 0.0671 0.9374atpH 0.2683 1.2756 0.2103 0.0345 0.2285 0.151 1.3931bacA 0.2401 1.5602 0.1539 0.0223 0.9859 0.0226 6.8036bamA 0.2933 2.0629 0.1422 0.0271 0.7567 0.0358 3.97bamD 0.2381 1.7052 0.1396 0.0198 0.5927 0.0334 4.1798bioA 0.1199 3.8477 0.0312 0.0914 1.8012 0.0507 0.6141bioB 0.1238 3.5514 0.0349 0.0337 1.207 0.0279 1.2485bolA 0.245 1.885 0.13 0.0427 0.7639 0.0559 2.3252carA 0.0861 2.0384 0.0422 0.0352 0.6945 0.0507 0.8334carB 0.0608 4.5866 0.0133 0.0098 0.4796 0.0204 0.6487cca 0.2019 3.7271 0.0542 0.0619 1.182 0.0524 1.0344clpP 0.0829 3.3211 0.025 0.0046 0.5525 0.0083 2.9981clpX 0.1011 3.8563 0.0262 0.0065 0.5455 0.0119 2.2002cls 0.0956 2.2231 0.043 0.0361 2.7061 0.0133 3.2236coaD 0.088 1.5396 0.0572 0.0433 1.5524 0.0279 2.0492coaE 0.1964 1.3075 0.1502 0.0752 1.4019 0.0536 2.8003crr 0.1258 1.494 0.0842 0.0088 0.2778 0.0317 2.6582cspE 0 1.3731 0 0.0066 0.1432 0.0461 0csrA 0.007 0.4198 0.0167 0 0.1885 0 10cyaY 0.1257 1.3431 0.0936 0.0366 0.6571 0.0557 1.6803cyoA 0.1792 1.9795 0.0905 0.0246 0.5635 0.0437 2.0737cyoB 0.0857 4.1688 0.0206 0.0241 0.6007 0.0401 0.5124cyoC 0.187 1.504 0.1243 0.022 0.2062 0.1067 1.1654
137

Appendix B. Functional Divergence of Buchnera aphidicola genes
cyoD 0.3076 0.655 0.4696 0.0306 0.3475 0.0881 5.3331cyoE 0.2394 3.5587 0.0673 0.0201 0.7136 0.0282 2.3883cysC 0.1512 3.2272 0.0469 0.1069 0.9322 0.1147 0.4086cysE 0.2044 3.4527 0.0592 0.0171 1.2518 0.0137 4.3337cysJ 0.208 3.9718 0.0524 0.0555 0.7714 0.0719 0.7279cysK 0.1165 3.6634 0.0318 0.0156 0.8938 0.0175 1.822cysS 0.1903 3.1453 0.0605 0.0348 1.1014 0.0316 1.9149dapA 0.0837 3.6126 0.0232 0.0511 0.535 0.0955 0.2426dapB 0.1893 2.1274 0.089 0.0624 1.2188 0.0512 1.738dapD 0.1458 3.5696 0.0408 0.0162 0.9925 0.0163 2.5024dapE 0.1722 3.6656 0.047 0.0324 1.2502 0.0259 1.8127dapF 0.1902 3.5029 0.0543 0.0265 1.0156 0.0261 2.0809dcd 0.1519 3.227 0.0471 0.0275 0.9624 0.0286 1.6473deaD 0.0651 2.4812 0.0262 0.0154 0.403 0.0382 0.6866def 0.1605 2.7584 0.0582 0.0118 0.8286 0.0142 4.0858degP 0.1144 3.8816 0.0295 0.0403 0.8844 0.0456 0.6468deoB 0.1706 3.7448 0.0456 0.0405 0.6397 0.0633 0.7196deoD 0.1374 3.3877 0.0406 0.0177 0.4997 0.0354 1.145der 0.2064 2.5543 0.0808 0.014 0.8206 0.0171 4.7363dksA 0.0716 3.0243 0.0237 0.011 0.5622 0.0196 1.21dnaA 0.0865 1.5719 0.055 0.0155 0.5771 0.0269 2.0489dnaB 0.033 3.925 0.0084 0.0484 1.2964 0.0373 0.2252dnaC 0.0269 3.3879 0.0079 0.031 1.6784 0.0185 0.4299dnaE 0.1619 4.5945 0.0352 0.0194 0.6442 0.0301 1.1701dnaG 0.1439 1.5742 0.0914 0.095 1.1414 0.0832 1.0983dnaJ 0.0767 3.7243 0.0206 0.0257 0.8936 0.0288 0.7161dnaK 0.0464 4.1448 0.0112 0.0165 0.3753 0.044 0.2546dnaN 0.225 1.9666 0.1144 0.0313 0.8254 0.0379 3.0171dnaQ 0.2222 3.2423 0.0685 0.0431 1.219 0.0354 1.9383dnaT 0.2287 3.0938 0.0739 0.1174 0.7789 0.1507 0.4904dnaX 0.1758 2.4558 0.0716 0.0229 0.8878 0.0258 2.7753dsbA 0.27 1.5352 0.1759 0.0953 0.7743 0.1231 1.4289dut 0.2109 3.0915 0.0682 0.0468 0.7261 0.0645 1.0584dxr 0.1632 2.0177 0.0809 0.0721 1.0388 0.0694 1.1654dxs 0.1324 4.1302 0.0321 0.0235 0.8411 0.0279 1.1474efp 0.0674 1.967 0.0343 0.0051 0.5889 0.0087 3.9566eno 0.1077 3.8419 0.028 0.0068 0.2723 0.025 1.1226era 0.2759 2.0061 0.1375 0.0149 0.7033 0.0212 6.4916erpA 0.2005 1.4824 0.1353 0.0041 0.4979 0.0082 16.4251fabB 0.1529 3.7955 0.0403 0.0171 0.5882 0.0291 1.3857fabG 0.1474 2.3068 0.0639 0.0322 0.4473 0.072 0.8876fabI 0.2157 3.5106 0.0614 0.0147 0.7018 0.0209 2.9334fbaA 0.1301 3.715 0.035 0.0076 0.3022 0.0251 1.3925fdx 0.1338 2.7379 0.0489 0.0289 0.9828 0.0294 1.6619!h 0.1364 1.7061 0.0799 0.0131 0.6877 0.019 4.197
138

Appendix B. Functional Divergence of Buchnera aphidicola genes
fis 0.2123 1.268 0.1674 0 0.0586 0 10fkpA 0.2105 3.4651 0.0607 0.0494 0.9456 0.0522 1.1628fldA 0.1634 3.0689 0.0532 0.003 0.5234 0.0057 9.2893flgA 0.2793 1.6381 0.1705 0.2458 1.4691 0.1673 1.0191flgB 0.2573 2.9098 0.0884 0.1265 1.8816 0.0672 1.3153flgC 0.1605 3.0595 0.0525 0.0493 1.3458 0.0366 1.4321flgD 0.29 2.4327 0.1192 0.0995 1.4797 0.0672 1.7728flgE 0.215 4.538 0.0618 0.0768 1.4029 0.0547 0.8661flgF 0.2201 1.9291 0.1141 0.0787 1.8699 0.0421 2.7109flgG 0.0479 3.4567 0.0139 0.005 1.757 0.0028 4.8694flgH 0.1272 1.6884 0.0753 0.0557 2.3499 0.0237 3.1784flgI 0.1553 2.4813 0.0626 0.0485 1.3658 0.0355 1.7625flgJ 0.1999 1.6974 0.1178 0.043 1.1147 0.0386 3.0529flgK 0.2807 7.8969 0.0355 0.1451 1.4685 0.0988 0.3597flhA 0.1117 2.5084 0.0445 0.0332 1.3467 0.0247 1.8063flhB 0.2208 1.6147 0.1367 0.0609 1.4021 0.0434 3.1482fliE 0.2142 1.199 0.1786 0.0822 0.9293 0.0885 2.0197fliF 0.2549 4.1804 0.061 0.089 1.1019 0.0808 0.7549fliG 0.2457 1.3112 0.1874 0.0208 0.8268 0.0252 7.4486fliH 0.3563 1.5584 0.2286 0.1029 1.3468 0.0764 2.9924fliI 0.1636 3.5154 0.0465 0.0526 1.3738 0.0383 1.2155fliK 0.4877 4.1271 0.1182 0.3665 1.647 0.2225 0.531fliM 0.5188 3.5337 0.1468 0.156 0.75 0.208 0.7058fliN 0.4465 5.9017 0.0757 0.048 0.577 0.0832 0.9093fliP 0.0699 1.6772 0.0417 0.0555 1.9338 0.0287 1.4521fliQ 0.0953 1.4882 0.064 0.0263 1.29 0.0204 3.141fliR 0.2513 1.8019 0.1395 0.0826 1.4317 0.0577 2.4173fmt 0.2282 2.1373 0.1068 0.0522 1.4774 0.0353 3.0219folA 0.1598 3.122 0.0512 0.0169 3.009 0.0056 9.1134folC 0.244 3.8446 0.0635 0.091 1.0913 0.0834 0.7611folD 0.1472 3.7239 0.0395 0.0261 0.8583 0.0304 1.2999fpr 0.1469 3.3854 0.0434 0.0656 1.9488 0.0337 1.2891frr 0.1901 1.8017 0.1055 0.0328 0.531 0.0618 1.7081ftsA 0.1217 3.8378 0.0317 0.0034 0.5603 0.0061 5.2258ftsI 0.1701 4.1043 0.0414 0.0227 0.5353 0.0424 0.9773ftsL 0.14 2.3973 0.0584 0 0.4962 0 10ftsW 0.123 1.2933 0.0951 0.0539 1.0939 0.0493 1.9302ftsY 0.1617 3.6103 0.0448 0.0351 0.7133 0.0492 0.9102ftsZ 0.0495 2.1654 0.0229 0.0061 0.6712 0.0091 2.5153fusA 0.0569 2.1813 0.0261 0.0173 0.1973 0.0877 0.2975gapA 0.091 4.6805 0.0194 0.0069 0.2442 0.0283 0.6881glmS 0.125 4.1091 0.0304 0.0062 0.2944 0.0211 1.4445glmU 0.1765 2.1966 0.0804 0.0546 1.1827 0.0462 1.7405glnS 0.1324 4.0001 0.0331 0.0191 0.6955 0.0275 1.2053gloB 0.2877 3.4702 0.0829 0.1323 1.2581 0.1052 0.7884
139

Appendix B. Functional Divergence of Buchnera aphidicola genes
glpF 0.2651 2.8291 0.0937 0.0328 0.8516 0.0385 2.4329gltX 0.2024 3.0365 0.0667 0.0278 1.0547 0.0264 2.5288glyA 0.1088 3.7917 0.0287 0.0383 0.3879 0.0987 0.2906glyQ 0.0981 1.4219 0.069 0.003 0.388 0.0077 8.923glyS 0.266 1.8563 0.1433 0.0452 0.5904 0.0766 1.8717gmk 0.0736 1.7319 0.0425 0.025 0.6014 0.0416 1.0223gnd 0.1323 3.9115 0.0338 0.0177 1.1033 0.016 2.1083gntY 0.1962 3.2722 0.06 0.0154 0.9149 0.0168 3.5621gpmA 0.1648 2.0022 0.0823 0.01 0.6204 0.0161 5.1065gpt 0.0802 1.6852 0.0476 0.0094 0.8013 0.0117 4.0569greA 0.1039 2.1931 0.0474 0.0149 0.8672 0.0172 2.7573groL 0.0181 1.6722 0.0108 0.0069 0.2402 0.0287 0.3768groS 0.0482 1.1981 0.0402 0.0614 0.3354 0.1831 0.2198grpE 0.2904 1.9258 0.1508 0.037 0.5219 0.0709 2.127grxD 0.1214 3.0072 0.0404 0.0042 0.8837 0.0048 8.494gshA 0.1868 1.511 0.1236 0.0409 3.909 0.0105 11.8156gshB 0.1552 2.6926 0.0576 0.0583 1.1388 0.0512 1.1259guaC 0.0762 3.7338 0.0204 0.036 1.0505 0.0343 0.5955gyrA 0.0877 4.4158 0.0199 0.044 0.5684 0.0774 0.2566gyrB 0.1147 4.3546 0.0263 0.0184 0.4904 0.0375 0.702hflB 0.0487 4.1664 0.0117 0.0144 0.5047 0.0285 0.4097hflC 0.094 3.5743 0.0263 0.0199 0.728 0.0273 0.9621hflK 0.1507 3.6898 0.0408 0.0335 0.7587 0.0442 0.925hinT 0.1864 2.2818 0.0817 0.0082 2.0912 0.0039 20.8329hisA 0.2061 3.5473 0.0581 0.0387 0.6942 0.0557 1.0422hisB 0.1754 3.7239 0.0471 0.0289 1.608 0.018 2.6207hisC 0.1662 3.7409 0.0444 0.0629 0.8235 0.0764 0.5817hisD 0.1552 4.479 0.0347 0.0466 1.4133 0.033 1.0509hisF 0.1336 2.8445 0.047 0.0323 0.8705 0.0371 1.2658hisG 0.071 1.5474 0.0459 0.0313 0.772 0.0405 1.1317hisH 0.2077 3.2606 0.0637 0.0554 1.6827 0.0329 1.9348hisI 0.1701 2.127 0.08 0.0529 1.314 0.0403 1.9864hisS 0.1758 2.1078 0.0834 0.0294 0.6451 0.0456 1.8301holA 0.3261 2.2451 0.1452 0.0769 2.1732 0.0354 4.1048holB 0.2423 1.8827 0.1287 0.1479 2.3515 0.0629 2.0462hpt 0.0583 1.6818 0.0347 0.0143 0.7811 0.0183 1.8935hscA 0.2045 4.0896 0.05 0.0328 1.1516 0.0285 1.7557hscB 0.2763 1.7129 0.1613 0.0512 0.6938 0.0738 2.1858hslU 0.0595 3.8952 0.0153 0.0163 0.7289 0.0224 0.6831hslV 0.0482 2.8535 0.0169 0.0136 0.6673 0.0204 0.8288htpG 0.1059 4.0807 0.026 0.0294 0.8002 0.0367 0.7063htpX 0.1045 2.3691 0.0441 0.0241 1.0886 0.0221 1.9924hupA 0.0748 1.2957 0.0577 0.0053 0.1689 0.0314 1.8397ibpA 0.1393 2.8166 0.0495 0.0148 1.4988 0.0099 5.0085ihfA 0.1032 3.4075 0.0303 0.0046 0.1395 0.033 0.9185
140

Appendix B. Functional Divergence of Buchnera aphidicola genes
ihfB 0.1255 2.368 0.053 0.005 0.2209 0.0226 2.3415ileS 0.1565 2.5606 0.0611 0.0888 0.6591 0.1347 0.4536ilvC 0.1312 3.9498 0.0332 0.0073 0.5311 0.0137 2.4166ilvD 0.1101 4.1265 0.0267 0.0245 0.7428 0.033 0.8089ilvH 0.0955 2.3113 0.0413 0.0141 0.9851 0.0143 2.8867ilvI 0.071 2.692 0.0264 0.0458 1.8662 0.0245 1.0747infA 0.0376 1.6434 0.0229 0 0.1081 0 10infB 0.1489 4.3804 0.034 0.0197 0.318 0.0619 0.5487infC 0.036 1.2322 0.0292 0.0026 0.13 0.02 1.4608iscS 0.0705 3.8339 0.0184 0.0128 0.617 0.0207 0.8864iscU 0.0443 2.8347 0.0156 0.007 0.7393 0.0095 1.6505ispA 0.2098 1.8037 0.1163 0.067 0.9131 0.0734 1.5852ispD 0.182 1.4529 0.1253 0.0642 0.8224 0.0781 1.6047ispE 0.2242 2.0569 0.109 0.0714 0.6134 0.1164 0.9364ispF 0.1352 1.5162 0.0892 0.0121 0.7944 0.0152 5.8543ispG 0.1481 3.7243 0.0398 0.007 0.8118 0.0086 4.6117ispH 0.1534 3.5342 0.0434 0.0403 1.0005 0.0403 1.0776ispU 0.1861 3.3555 0.0555 0.0392 0.3877 0.1011 0.5485ksgA 0.1997 2.0233 0.0987 0.0311 0.5607 0.0555 1.7795lepA 0.1024 4.1025 0.025 0.0215 0.8952 0.024 1.0393lepB 0.2166 1.68 0.1289 0.039 1.0924 0.0357 3.6113leuS 0.179 2.109 0.0849 0.0262 0.7235 0.0362 2.3438lipA 0.1205 3.5572 0.0339 0.0181 1.2942 0.014 2.4222lipB 0.2286 1.8953 0.1206 0.0504 1.2311 0.0409 2.9462lolC 0.3066 1.2995 0.2359 0.0433 0.8583 0.0504 4.6768lolD 0.2494 3.4581 0.0721 0.0307 1.4028 0.0219 3.2955lon 0.0646 2.2726 0.0284 0.0036 0.4778 0.0075 3.7727lpcA 0.125 2.3554 0.0531 0.0119 0.7214 0.0165 3.2172lpd 0.1741 3.8597 0.0451 0.0074 0.3462 0.0214 2.1103lspA 0.2258 1.7269 0.1308 0.0332 0.6061 0.0548 2.3871lysA 0.1391 3.8904 0.0358 0.0791 1.3273 0.0596 0.6map 0.1157 1.8769 0.0616 0.0699 0.7469 0.0936 0.6587mdlA 0.1167 2.2561 0.0517 0.072 1.4691 0.049 1.0554mdlB 0.1251 2.0731 0.0603 0.0756 1.5935 0.0474 1.2719metE 0.1264 4.2737 0.0296 0.0352 1.1809 0.0298 0.9922metF 0.167 3.5138 0.0475 0.0236 1.1455 0.0206 2.3069metG 0.155 4.7294 0.0328 0.0235 1.1777 0.02 1.6425metK 0.0677 3.7271 0.0182 0.0123 0.6935 0.0177 1.0241miaB 0.1088 2.2262 0.0489 0.0077 0.7287 0.0106 4.6251minC 0.1502 1.8267 0.0822 0.1001 0.7713 0.1298 0.6336minD 0.066 2.0439 0.0323 0.0161 0.7585 0.0212 1.5213minE 0.0504 0.9049 0.0557 0.0056 1.2941 0.0043 12.8709mltA 0.1921 1.7376 0.1106 0.0537 1.5954 0.0337 3.2845mnmA 0.1393 3.7095 0.0376 0.0251 0.9655 0.026 1.4445mnmE 0.2068 2.1109 0.098 0.0289 1.4204 0.0203 4.815
141

Appendix B. Functional Divergence of Buchnera aphidicola genes
mnmG 0.1219 4.104 0.0297 0.0145 1.2537 0.0116 2.5682mraW 0.1522 3.6056 0.0422 0.0207 0.7194 0.0288 1.467mscS 0.0757 3.3257 0.0228 0.0436 1.6254 0.0268 0.8486mtlA 0.197 2.5453 0.0774 0.0324 0.6165 0.0526 1.4727mtlD 0.2376 3.8272 0.0621 0.04 0.6755 0.0592 1.0484mtn 0.2505 2.4921 0.1005 0.0259 2.252 0.0115 8.74murA 0.1483 1.6145 0.0919 0.0192 0.9173 0.0209 4.3885murB 0.1854 1.8389 0.1008 0.1202 1.5568 0.0772 1.3058murD 0.1771 2.135 0.083 0.0482 1.5117 0.0319 2.6016murG 0.1825 3.7716 0.0484 0.0491 1.152 0.0426 1.1353murI 0.2369 1.5515 0.1527 0.057 1.033 0.0552 2.7672mutL 0.3189 2.397 0.133 0.0782 1.7585 0.0445 2.9917mutS 0.1689 1.9568 0.0863 0.0358 1.455 0.0246 3.508mutT 0.3012 2.8282 0.1065 0.1603 1.1154 0.1437 0.741mutY 0.1972 2.2266 0.0886 0.064 0.9605 0.0666 1.3292nadD 0.2227 3.2623 0.0683 0.0807 2.5181 0.032 2.1301nadE 0.1965 3.5488 0.0554 0.0793 1.415 0.056 0.988nadK 0.1195 3.5927 0.0333 0.0248 1.3252 0.0187 1.7774nfo 0.1261 3.4238 0.0368 0.0629 1.2553 0.0501 0.735nrdA 0.0835 4.2832 0.0195 0.0211 0.9379 0.0225 0.8665nrdB 0.0798 1.588 0.0503 0.0097 1.1435 0.0085 5.924nth 0.1918 3.3266 0.0577 0.0298 1.7511 0.017 3.388nuoA 0.1655 3.0381 0.0545 0.0165 0.1394 0.1184 0.4602nuoB 0.0944 1.6176 0.0584 0.0042 0.6414 0.0065 8.9121nuoC 0.0904 4.0664 0.0222 0.0293 0.6265 0.0468 0.4753nuoE 0.1525 3.0312 0.0503 0.017 0.6071 0.028 1.7967nuoF 0.1069 3.8742 0.0276 0.0083 0.6811 0.0122 2.2643nuoG 0.1675 4.3396 0.0386 0.0298 0.7357 0.0405 0.9529nuoH 0.1504 1.6282 0.0924 0.0212 0.4063 0.0522 1.7703nuoI 0.1102 3.0996 0.0356 0.0025 0.3872 0.0065 5.5064nuoJ 0.14 2.7874 0.0502 0.0167 0.4452 0.0375 1.339nuoK 0.084 1.4882 0.0564 0.0097 0.3279 0.0296 1.908nuoL 0.2261 1.7749 0.1274 0.0264 0.5414 0.0488 2.6124nuoM 0.1984 2.1373 0.0928 0.02 0.548 0.0365 2.5435nuoN 0.2168 2.7095 0.08 0.0246 0.588 0.0418 1.9125nusA 0.0775 1.8894 0.041 0.0301 0.4481 0.0672 0.6106nusB 0.0728 3.6808 0.0198 0.0146 0.4552 0.0321 0.6166nusG 0.0401 3.2978 0.0122 0.0026 0.4234 0.0061 1.9801obgE 0.1362 3.7002 0.0368 0.0149 0.5687 0.0262 1.4049ompA 0.2087 3.6108 0.0578 0.043 0.3177 0.1353 0.427orn 0.1458 1.7129 0.0851 0.0275 0.7135 0.0385 2.2084panB 0.1548 3.5272 0.0439 0.0484 1.2459 0.0388 1.1297panC 0.2139 1.6356 0.1308 0.0817 1.2806 0.0638 2.0499pepA 0.2091 3.4545 0.0605 0.0112 0.9815 0.0114 5.3045pfkA 0.0535 3.7682 0.0142 0.0226 0.6548 0.0345 0.4114
142

Appendix B. Functional Divergence of Buchnera aphidicola genes
pgi 0.1161 3.9246 0.0296 0.0291 0.7997 0.0364 0.813pgk 0.1189 2.0348 0.0584 0.0119 0.304 0.0391 1.4927pgl 0.2172 2.2904 0.0948 0.0551 1.4714 0.0374 2.5324pheA 0.1366 1.5743 0.0868 0.0622 2.2549 0.0276 3.1456pheS 0.1608 1.8025 0.0892 0.0135 0.7044 0.0192 4.6547pheT 0.2579 2.016 0.1279 0.0445 0.6497 0.0685 1.8677pitA 0.1274 4.8321 0.0264 0.0423 0.9554 0.0443 0.5955pmbA 0.1777 2.2939 0.0775 0.0205 1.0552 0.0194 3.9874pncB 0.1123 3.6723 0.0306 0.0545 2.1883 0.0249 1.2279pnp 0.074 4.2804 0.0173 0.0169 0.3691 0.0458 0.3776polA 0.196 1.6744 0.1171 0.0244 1.6148 0.0151 7.7469ppa 0.0974 3.1718 0.0307 0.0284 0.3303 0.086 0.3571ppiD 0.2991 2.504 0.1194 0.0751 0.9556 0.0786 1.5199prfA 0.0996 3.4662 0.0287 0.0202 0.8876 0.0228 1.2626prfC 0.1522 3.9743 0.0383 0.0206 0.8088 0.0255 1.5036priA 0.3307 1.8574 0.178 0.064 1.0522 0.0608 2.9272prmC 0.2119 3.4845 0.0608 0.1673 1.4056 0.119 0.5109proS 0.2025 2.3366 0.0867 0.0297 0.7314 0.0406 2.1342prs 0.0331 3.7145 0.0089 0.003 0.4422 0.0068 1.3135pta 0.2711 2.0288 0.1336 0.0186 0.6127 0.0304 4.4017pth 0.1883 3.2133 0.0586 0.0404 1.2298 0.0329 1.7838ptsG 0.0911 1.9212 0.0474 0.0178 0.5717 0.0311 1.523ptsH 0.1099 2.6541 0.0414 0 0.1911 0 10ptsI 0.1146 2.7857 0.0411 0.0165 0.3107 0.0531 0.7747purA 0.157 3.8295 0.041 0.0032 0.1019 0.0314 1.3055purB 0.1322 2.0584 0.0642 0.028 1.0337 0.0271 2.371purH 0.1931 3.9928 0.0484 0.0297 0.6056 0.049 0.9861pykA 0.1155 3.9908 0.0289 0.0124 0.8938 0.0139 2.0861pyrB 0.0773 2.0045 0.0386 0.0333 1.4572 0.0229 1.6875pyrC 0.1717 2.6989 0.0636 0.0713 1.0637 0.067 0.9491pyrD 0.1458 3.6019 0.0405 0.0332 0.9162 0.0362 1.1171pyrF 0.0984 1.398 0.0704 0.086 1.4129 0.0609 1.1564pyrG 0.0871 4.0293 0.0216 0.0305 0.5759 0.053 0.4082pyrH 0.124 3.5481 0.0349 0.0078 0.5031 0.0155 2.2542pyrI 0.1169 3.0839 0.0379 0.0331 0.9599 0.0345 1.0993queA 0.1749 3.5694 0.049 0.0412 0.7503 0.0549 0.8923rbfA 0.1548 2.4664 0.0628 0.0154 0.4512 0.0341 1.8389recB 0.2725 1.8348 0.1485 0.0996 1.2795 0.0778 1.9079recC 0.3269 1.7485 0.187 0.066 1.8354 0.036 5.1992recD 0.253 1.6841 0.1502 0.1122 1.3985 0.0802 1.8725rep 0.158 1.7611 0.0897 0.0179 2.4536 0.0073 12.2977rfaE 0.1001 3.7034 0.027 0.0403 1.2426 0.0324 0.8334rho 0.0075 1.7712 0.0042 0.0021 0.4094 0.0051 0.8255ribA 0.0872 2.5403 0.0343 0.0336 1.1404 0.0295 1.1651ribB 0.0946 3.3945 0.0279 0.025 0.7857 0.0318 0.8759
143

Appendix B. Functional Divergence of Buchnera aphidicola genes
ribC 0.2163 2.6572 0.0814 0.0697 1.5182 0.0459 1.7731ribD 0.174 3.1684 0.0549 0.098 2.1675 0.0452 1.2146ribE 0.1008 2.1704 0.0464 0.0572 0.5077 0.1127 0.4122ribF 0.2253 1.9593 0.115 0.0734 0.9662 0.076 1.5137rimM 0.2813 1.2495 0.2251 0.033 0.3263 0.1011 2.2261rimN 0.1629 2.6919 0.0605 0.092 1.109 0.083 0.7295rlmL 0.1982 1.863 0.1064 0.0441 1.069 0.0413 2.5789rlmN 0.1773 5.7088 0.0311 0.0149 0.8564 0.0174 1.7851rluB 0.2671 3.1703 0.0843 0.0137 1.0408 0.0132 6.4006rluC 0.1556 3.6839 0.0422 0.0161 1.1745 0.0137 3.0813rluD 0.2612 2.9643 0.0881 0.0345 0.9225 0.0374 2.3561rnb 0.1207 3.7282 0.0324 0.0528 1.0149 0.052 0.6223rnc 0.0402 2.7278 0.0147 0.0142 0.6178 0.023 0.6412rne 0.2387 4.3068 0.0554 0.0927 1.0287 0.0901 0.615rnpA 0.1965 1.4975 0.1312 0.0131 0.1298 0.1009 1.3002rnr 0.1339 2.9708 0.0451 0.0205 0.8863 0.0231 1.9487rnt 0.0564 3.4434 0.0164 0.0723 1.2533 0.0577 0.2839rpe 0.103 3.4044 0.0303 0.0166 1.015 0.0164 1.8499rpiA 0.1167 3.4453 0.0339 0.0108 1.0288 0.0105 3.2266rplA 0.1178 3.4802 0.0338 0.0093 0.2323 0.04 0.8455rplB 0.0599 3.49 0.0172 0.0034 0.1009 0.0337 0.5093rplC 0.0909 2.31 0.0394 0.009 0.1702 0.0529 0.7442rplD 0.0809 1.9133 0.0423 0 0.0572 0 10rplE 0.0594 3.1554 0.0188 0.0051 0.0437 0.1167 0.1613rplF 0.1283 3.2135 0.0399 0.0052 0.1207 0.0431 0.9267rplI 0.0958 3.5253 0.0272 0.0232 0.168 0.1381 0.1968rplJ 0.1073 1.7975 0.0597 0.009 0.0584 0.1541 0.3873rplK 0.0982 3.0313 0.0324 0 0.1827 0 10rplL 0.0739 0.947 0.078 0.0114 0.0885 0.1288 0.6058rplM 0.0926 2.9667 0.0312 0 0.025 0 10rplN 0.0462 2.9845 0.0155 0.0077 0.0919 0.0838 0.1848rplO 0.1329 3.0081 0.0442 0.0033 0.0571 0.0578 0.7645rplP 0.0618 3.0924 0.02 0.0103 0.0843 0.1222 0.1636rplQ 0.1273 1.4459 0.088 0.0037 0.0729 0.0508 1.7347rplR 0.1192 2.904 0.041 0.0042 0.0287 0.1463 0.2805rplS 0.1179 2.9679 0.0397 0.0116 0.0633 0.1833 0.2168rplT 0.0571 1.6049 0.0356 0 0.0847 0 10rplU 0.1397 4.1203 0.0339 0.0046 0.084 0.0548 0.6191rplV 0.0632 1.8292 0.0346 0 0.0106 0 10rplW 0.1412 1.3335 0.1059 0.0047 0.0475 0.0989 1.0701rplX 0.0879 1.2298 0.0715 0 0.0999 0 10rplY 0.2606 1.8746 0.139 0.0578 0.2092 0.2763 0.5032rpmA 0.0554 2.6816 0.0207 0.0249 0.3283 0.0758 0.2724rpmB 0.1507 1.6955 0.0889 0.019 0.0476 0.3992 0.2227rpmC 0.1613 0.4823 0.3344 0.0071 0.0662 0.1073 3.1183
144

Appendix B. Functional Divergence of Buchnera aphidicola genes
rpmD 0.1039 2.2951 0.0453 0.0158 0.0219 0.7215 0.0627rpmE 0.0695 1.5593 0.0446 0.0801 0.3515 0.2279 0.1956rpmF 0.1064 2.2696 0.0469 0 0.0589 0 10rpmG 0.0212 2.2978 0.0092 0 0.0716 0 10rpmH 0.0087 1.2837 0.0068 0 0.0259 0 10rpmI 0.0562 0.9831 0.0572 0 0.0573 0 10rpoA 0.0575 3.055 0.0188 0.0015 0.0809 0.0185 1.0151rpoB 0.0503 4.748 0.0106 0.0081 0.2579 0.0314 0.3373rpoC 0.0335 4.7519 0.007 0.0089 0.2299 0.0387 0.1821rpoD 0.0638 2.8073 0.0227 0.0113 0.483 0.0234 0.9714rpoH 0.0721 1.5868 0.0454 0.0183 0.4702 0.0389 1.1675rpsA 0.066 4.0123 0.0164 0.0025 0.1062 0.0235 0.6988rpsB 0.0899 2.8409 0.0316 0.0145 0.1192 0.1216 0.2601rpsC 0.0382 3.5055 0.0109 0 0.0769 0 10rpsD 0.0717 3.2865 0.0218 0.0022 0.0537 0.041 0.5325rpsE 0.0363 2.2917 0.0158 0 0.0882 0 10rpsF 0.1449 1.4032 0.1033 0.0041 0.1071 0.0383 2.6975rpsG 0.038 1.7085 0.0222 0.0029 0.1241 0.0234 0.9518rpsH 0.1198 1.8826 0.0636 0 0.065 0 10rpsI 0.0721 3.0006 0.024 0.0071 0.0681 0.1043 0.2305rpsJ 0.0159 1.6511 0.0096 0.0142 0.1307 0.1086 0.0886rpsK 0.0117 2.8087 0.0042 0.0037 0.0745 0.0497 0.0839rpsL 0.0411 3.0057 0.0137 0 0.0841 0 10rpsM 0.085 1.8362 0.0463 0.0118 0.0895 0.1318 0.3511rpsN 0.0627 2.7365 0.0229 0.0095 0.114 0.0833 0.2749rpsO 0.142 0.9862 0.144 0.0159 0.2333 0.0682 2.1127rpsP 0.1984 2.6732 0.0742 0.0117 0.1175 0.0996 0.7454rpsQ 0.0931 2.3947 0.0389 0.0058 0.054 0.1074 0.362rpsR 0.0409 2.3732 0.0172 0.0125 0.0158 0.7911 0.0218rpsS 0.0406 1.7494 0.0232 0.0051 0.0259 0.1969 0.1179rpsT 0.1754 1.9257 0.0911 0.0104 0.0152 0.6842 0.1331rpsU 0.0054 2.2245 0.0024 0 0.0299 0 10rrmJ 0.162 1.2625 0.1283 0 0.3747 0 10rsmC 0.2478 1.9635 0.1262 0.0765 1.0156 0.0753 1.6755rsmE 0.2735 3.4508 0.0793 0.0478 0.9239 0.0517 1.5319rsxA 0.1365 0.9494 0.1438 0.0178 0.9577 0.0186 7.7356rsxB 0.199 3.0486 0.0653 0.0749 0.9156 0.0818 0.798rsxD 0.234 2.2716 0.103 0.0918 1.4263 0.0644 1.6005rsxE 0.1824 1.7524 0.1041 0.0544 1.2203 0.0446 2.3349rsxG 0.1689 3.0462 0.0554 0.1217 1.5483 0.0786 0.7054sbcB 0.2128 2.7023 0.0787 0.0469 3.0584 0.0153 5.1352secA 0.1314 2.3041 0.057 0.0285 0.8679 0.0328 1.7367secB 0.1962 2.8655 0.0685 0.0211 0.3239 0.0651 1.0511secE 0.2841 1.3591 0.209 0.0301 0.1639 0.1836 1.1382secY 0.1021 2.0601 0.0496 0.0022 0.0822 0.0268 1.8518
145

Appendix B. Functional Divergence of Buchnera aphidicola genes
serC 0.1446 3.67 0.0394 0.0657 1.2496 0.0526 0.7494serS 0.1542 2.4592 0.0627 0.0119 0.6685 0.0178 3.5225sirA 0.1395 2.5773 0.0541 0.0623 0.797 0.0782 0.6924smg 0.1678 1.5221 0.1102 0.0414 0.6346 0.0652 1.6899smpB 0.2222 2.4604 0.0903 0.0414 1.8727 0.0221 4.0851sodA 0.1193 3.1297 0.0381 0.0113 0.5089 0.0222 1.7167sohB 0.167 1.6881 0.0989 0.0737 1.1774 0.0626 1.5804speD 0.0595 1.8094 0.0329 0.0173 0.7532 0.023 1.4317speE 0.1646 1.5681 0.105 0.0283 1.753 0.0161 6.5021ssb 0.0824 2.9356 0.0281 0.0542 0.6465 0.0838 0.3348sucA 0.1975 4.3182 0.0457 0.0275 0.7037 0.0391 1.1704sucB 0.1967 3.7656 0.0522 0.0139 0.4737 0.0293 1.7802sufA 0.2616 1.6719 0.1565 0.0947 1.0689 0.0886 1.7661suhB 0.1926 1.8546 0.1038 0.0131 0.7247 0.0181 5.745surA 0.3736 1.6909 0.2209 0.0473 0.9967 0.0475 4.6558tadA 0.2162 2.3434 0.0923 0.055 1.2936 0.0425 2.1699talA 0.1133 3.6008 0.0315 0.0644 1.3421 0.048 0.6557tgt 0.1288 3.6197 0.0356 0.011 0.6999 0.0157 2.2641thiL 0.1395 3.6864 0.0378 0.0858 1.0702 0.0802 0.472thrA 0.1899 3.8248 0.0496 0.035 1.441 0.0243 2.0441thrB 0.0841 1.8309 0.0459 0.0416 1.3695 0.0304 1.5122thrC 0.0729 4.0611 0.018 0.0418 1.3138 0.0318 0.5642thrS 0.1372 1.7494 0.0784 0.0185 0.5883 0.0314 2.494thyA 0.1166 2.3454 0.0497 0.019 0.9951 0.0191 2.6037tig 0.2717 1.0067 0.2699 0.0255 0.3384 0.0754 3.5816tilS 0.1943 1.4324 0.1356 0.1869 1.0974 0.1703 0.7965tldD 0.1421 3.9557 0.0359 0.0363 1.0948 0.0332 1.0834tmk 0.1476 1.9619 0.0752 0.0674 1.1415 0.059 1.2742topA 0.1962 4.2989 0.0456 0.0222 1.0339 0.0215 2.1255tpiA 0.2502 2.7053 0.0925 0.023 0.5604 0.041 2.2534trmD 0.1619 1.6698 0.097 0.027 0.2737 0.0986 0.9829trmI 0.1994 1.9055 0.1046 0.0447 0.52 0.086 1.2173trpA 0.1679 4.7178 0.0356 0.1012 2.3317 0.0434 0.82trpB 0.1005 3.7653 0.0267 0.0212 1.4433 0.0147 1.8171trpC 0.178 3.9143 0.0455 0.0777 1.642 0.0473 0.961trpD 0.1767 3.6364 0.0486 0.015 1.0102 0.0148 3.2725trpS 0.1709 3.6919 0.0463 0.0198 0.937 0.0211 2.1906truA 0.2024 3.4052 0.0594 0.0206 0.9447 0.0218 2.7258truB 0.2234 3.6621 0.061 0.0336 1.1274 0.0298 2.0469trxA 0.1046 2.6239 0.0399 0 0.3035 0 10trxB 0.1401 3.6468 0.0384 0.0181 1.342 0.0135 2.8484tsf 0.2223 3.5763 0.0622 0.0203 0.3026 0.0671 0.9266tsgA 0.168 1.5204 0.1105 0.0495 1.0539 0.047 2.3526typA 0.0874 4.154 0.021 0.019 0.4112 0.0462 0.4553tyrS 0.1683 2.5569 0.0658 0.0195 0.7048 0.0277 2.379
146

Appendix B. Functional Divergence of Buchnera aphidicola genes
uup 0.2103 2.8069 0.0749 0.0363 0.9906 0.0366 2.0446valS 0.1552 2.7366 0.0567 0.0219 0.5273 0.0415 1.3655yabI 0.16 1.4448 0.1107 0.0713 0.8528 0.0836 1.3246yajC 0.1211 2.146 0.0564 0.0086 0.3276 0.0263 2.1496yajR 0.1961 2.2306 0.0879 0.0583 1.3167 0.0443 1.9855ybaB 0.0308 3.1758 0.0097 0 1.0167 0 10ybeD 0.0294 1.6693 0.0176 0.0109 0.4041 0.027 0.6529ybeX 0.0867 3.5089 0.0247 0.0147 0.6864 0.0214 1.1537ybeY 0.1836 0.8662 0.212 0.0672 0.672 0.1 2.1196ybgI 0.1506 3.7249 0.0404 0.0245 1.3716 0.0179 2.2635yccK 0.1669 3.6428 0.0458 0.0609 1.7131 0.0355 1.2888yceA 0.1767 3.5079 0.0504 0.0743 1.4259 0.0521 0.9667yceN 0.2237 2.9419 0.076 0.0409 1.595 0.0256 2.9653ycfH 0.21 3.4781 0.0604 0.038 1.2895 0.0295 2.0489ychA 0.0895 3.9905 0.0224 0.0887 1.1082 0.08 0.2802ychE 0.1055 3.7164 0.0284 0.0481 1.6556 0.0291 0.9771ychF 0.1374 3.6515 0.0376 0.0313 0.9172 0.0341 1.1026yciA 0.1039 2.7342 0.038 0.0634 2.1602 0.0293 1.2948yciB 0.1507 0.5921 0.2545 0.0387 0.9977 0.0388 6.5616yciC 0.2351 1.1334 0.2074 0.0874 1.8427 0.0474 4.3733ydiK 0.1153 1.4821 0.0778 0.0734 1.0275 0.0714 1.089yeaZ 0.3081 1.4672 0.21 0.092 1.1432 0.0805 2.6094yeeX 0.0738 1.1626 0.0635 0.0133 0.6391 0.0208 3.0503yfcN 0.1805 3.0499 0.0592 0.0428 1.3768 0.0311 1.9038yfgM 0.3066 1.1425 0.2684 0.0561 0.9998 0.0561 4.7826yfjF 0.2683 1.8064 0.1485 0.0916 1.1084 0.0826 1.7972ygfZ 0.2637 1.7229 0.1531 0.0856 1.0625 0.0806 1.8998yggS 0.2683 1.9355 0.1386 0.0758 0.8387 0.0904 1.5338yggW 0.1967 2.8177 0.0698 0.061 2.7573 0.0221 3.1555yggX 0.1345 2.1239 0.0633 0.0219 2.1694 0.0101 6.2731ygjD 0.1462 1.4132 0.1035 0.0293 0.7103 0.0413 2.5079yheL 0.1436 1.4323 0.1003 0.2233 0.8444 0.2644 0.3791yheM 0.1678 2.8203 0.0595 0.1121 1.6015 0.07 0.85yheN 0.148 2.9054 0.0509 0.0836 3.6862 0.0227 2.2461yhiQ 0.2415 3.0973 0.078 0.0306 1.0851 0.0282 2.7649yibN 0.3468 1.4406 0.2407 0.0395 0.799 0.0494 4.8695yidC 0.1479 4.0071 0.0369 0.0257 0.5874 0.0438 0.8436yigL 0.1841 1.6421 0.1121 0.0477 0.9147 0.0521 2.1499yihA 0.2176 3.3436 0.0651 0.0331 1.7959 0.0184 3.531ynfM 0.1564 2.3443 0.0667 0.0572 1.6389 0.0349 1.9115yoaE 0.0762 1.485 0.0513 0.0546 0.9837 0.0555 0.9245yqgF 0.1485 1.5854 0.0937 0.0345 1.8396 0.0188 4.9945yraL 0.1476 1.8512 0.0797 0.0136 0.3788 0.0359 2.2208yrbA 0.295 1.368 0.2156 0.0122 0.5054 0.0241 8.9333ytfN 0.3851 2.3179 0.1661 0.1018 2.5664 0.0397 4.1885
147

Appendix B. Functional Divergence of Buchnera aphidicola genes
znuB 0.1841 1.6118 0.1142 0.0261 3.1984 0.0082 13.997znuC 0.1381 2.2518 0.0613 0.0402 1.7057 0.0236 2.6022zwf 0.1742 3.9228 0.0444 0.0152 1.2242 0.0124 3.5765
148

Appendix C
The Ratio between the Intensities of
Selection in the Endosymbiont
Genomes and their Free-living Cousins
Table C.1: The ratio between the intensities of selection in the endosymbiont genomes and theirfree-living cousins. Data missing or that could not be estimated are indicated by -.
Buchnera aphidicola BlochmanniaGene Name Gene tag R(") Gene tag R(")accA - - Bfl287 1.8625accB - - Bfl292 1.7176accC - - Bfl291 1.0699accD - - Bfl495 5.0035aceE BU205 0.2667 Bfl153 0.4409aceF BU206 1.3844 Bfl152 2.5489ackA BU175 4.0426 - -acpP - - Bfl403 -acpS BU256 1.4595 Bfl538 3.5473adk BU484 5.8838 Bfl302 2.4795ahpC BU182 3.4344 Bfl228 2.5909alaS BU403 2.5206 Bfl168 1.5093amiB BU576 1.5 Bfl078 2.0758apaH BU142 2.6569 Bfl125 3.5898apt - - Bfl300 1.6016argA BU456 0.4868 - -argB BU049 1.3579 - -
149

Appendix C. The Ratio between the Intensities of Selection in the Endosymbiont Genomes and theirFree-living Cousins
argC BU048 1.0565 - -argD BU534 1.0398 - -argE BU047 1.1966 - -argG BU050 0.9732 - -argH BU051 2.4065 - -argI BU368 1.1507 - -argS BU242 1.1122 Bfl453 3.2871aroA BU311 4.7395 Bfl382 1.0993aroB BU538 0.3981 Bfl571 1.1091aroC BU097 1.703 Bfl500 1.1748aroE BU493 1.0417 Bfl221 1.2674aroF - - Bfl177 2.3809aroH BU124 0.182 - -aroK BU539 1.4946 Bfl572 1.2238asd BU448 0.097 Bfl574 2.2356asnS BU360 13.1037 Bfl421 1.4752aspC - - Bfl422 4.4645aspS BU316 1.007 Bfl452 1.3331atpA BU006 1.0085 Bfl006 1.0318atpB BU002 1.4646 Bfl002 1.3305atpC BU009 5.1775 Bfl009 2.325atpD BU008 0.4415 Bfl008 2.0166atpE BU003 0.026 Bfl003 -atpF BU004 6.7882 Bfl004 1.9851atpG BU007 0.8527 Bfl007 1.5314atpH BU005 3.9918 Bfl005 1.7356bacA BU062 2.324 - -bamA BU237 6.7606 Bfl279 1.0752bamD BU402 1.9108 Bfl180 7.7873bcp - - Bfl519 3.4791bfr - - Bfl189 1.4112bioA BU292 1.1824 - -bioB BU291 1.5955 - -birA - - Bfl184 6.5904bolA BU473 4.189 - -carA BU145 0.4321 Bfl122 1.1278carB BU144 0.5502 Bfl123 1.5929cca BU061 2.0491 Bfl062 1.1961cdsA - - Bfl277 4.9211clpB - - Bfl182 1.5722clpP BU475 1.6416 Bfl246 5.0082clpX BU476 4.3777 Bfl247 3.9695cls BU273 1.1235 Bfl433 3.0157cmk - - Bfl381 3.3907coaD BU583 0.3576 - -
150

Appendix C. The Ratio between the Intensities of Selection in the Endosymbiont Genomes and theirFree-living Cousins
coaE BU203 2.3828 - -corA - - Bfl577 4.725crr BU063 1.7664 - -cspC - - Bfl448 -cspE BU489 0 - -csrA BU404 - Bfl169 -cutA - - Bfl069 4.4978cyaY BU590 0.9174 - -cyoA BU472 1.7422 Bfl245 2.9116cyoB BU471 1.2894 Bfl244 1.7424cyoC BU470 3.2871 Bfl243 1.4638cyoD BU469 1.4415 Bfl242 5.5102cyoE BU468 12.1649 Bfl241 4.7241cysA - - Bfl511 0.754cysC BU422 0.8624 Bfl164 0.7119cysD - - Bfl162 2.4351cysE BU054 0.8621 Bfl603 3.7885cysG - - Bfl161 1.0894cysH - - Bfl160 3.225cysI - - Bfl159 0.9842cysJ BU428 2.4033 Bfl158 0.9198cysK BU066 1.0605 Bfl508 1.4483cysN - - Bfl163 0.9745cysP - - Bfl514 2.1221cysQ - - Bfl088 0.9904cysS BU487 0.971 Bfl304 1.8597cysU - - Bfl513 2.0129cysW - - Bfl512 5.9739dapA BU096 1.2044 Bfl518 0.4035dapB BU146 1.3733 Bfl121 1.9253dapD BU229 - Bfl269 3.2312dapE BU095 1.057 Bfl517 3.6223dapF BU589 1.8051 Bfl579 2.0278dcd BU108 6.2783 - -ddlA - - Bfl474 1.4776deaD BU372 0.8346 Bfl109 1.8551def BU496 2.428 Bfl219 5.1483degP BU228 2.0795 - -degQ - - Bfl047 0.4886deoB BU542 3.0813 - -deoD BU541 1.8112 - -der BU607 2.1125 Bfl530 9.7607dksA BU198 0.6316 Bfl149 4.223dnaA BU012 0.8115 - -dnaB BU546 0.4362 Bfl027 0.8142
151

Appendix C. The Ratio between the Intensities of Selection in the Endosymbiont Genomes and theirFree-living Cousins
dnaC BU021 0.1999 - -dnaE BU238 3.324 Bfl286 2.765dnaG BU056 1.4321 Bfl057 1.774dnaJ BU152 0.6748 Bfl115 1.0195dnaK BU153 1.0098 Bfl114 0.326dnaN BU011 4.2396 Bfl016 3.4324dnaQ BU248 3.5979 Bfl225 2.4277dnaT BU022 6.9131 - -dnaX BU481 1.8541 Bfl301 1.4296dsbA BU430 1.814 - -dsbB - - Bfl438 4.4212dut BU560 1.2498 Bfl613 1.1508dxr BU235 1.5237 Bfl275 2.0037dxs BU464 5.2331 Bfl238 1.2431efp BU020 0.8474 Bfl072 16.7436emrE - - Bfl550 0.2626emtA - - Bfl391 1.9461eno BU417 3.3537 Bfl157 1.8501era BU257 5.2604 - -erpA BU211 1.2074 Bfl155 8.5612fabA - - Bfl420 2.9375fabB BU092 1.8163 Bfl498 1.3316fabD - - Bfl405 2.0179fabG BU351 2.0836 Bfl404 0.6201fabH - - Bfl406 0.9383fabI BU265 16.0127 Bfl424 2.8026fabZ - - Bfl282 2.3909fbaA BU451 1.3925 Bfl255 1.5952fdx BU606 1.6842 - -!h BU393 1.9448 Bfl172 4.1697fis BU400 - - -fkpA BU533 3.7807 - -fldA BU299 0.6547 Bfl325 2.1052flgA BU336 2.8398 - -flgB BU337 1.4076 - -flgC BU338 1.0868 - -flgD BU339 1.4952 - -flgE BU340 2.8153 - -flgF BU341 2.4954 - -flgG BU342 0.2239 - -flgH BU343 0.5214 - -flgI BU344 1.9128 - -flgJ BU345 4.995 - -flgK BU346 1.9655 - -flhA BU241 0.6315 - -
152

Appendix C. The Ratio between the Intensities of Selection in the Endosymbiont Genomes and theirFree-living Cousins
flhB BU240 1.0783 - -fliE BU072 0.5459 - -fliF BU073 2.2713 - -fliG BU074 1.2354 - -fliH BU075 3.994 - -fliI BU076 3.5484 - -fliK BU079 7.2897 - -fliM BU080 5.1252 - -fliN BU081 1.1505 - -fliP BU082 0.1685 - -fliQ BU083 0.5533 - -fliR BU084 0.7284 - -fmt BU497 1.8891 Bfl218 2.7972folA BU143 0.5407 Bfl124 8.9582folB - - Bfl061 2.8674folC BU167 2.1924 Bfl494 0.8351folD BU486 1.4188 Bfl305 1.4697folE - - Bfl472 1.289folK - - Bfl150 0.9671folP - - Bfl099 1.7425fpr BU581 4.9534 Bfl600 3.3689frr BU234 1.6787 Bfl274 1.9004ftsA BU213 1.6473 Bfl145 6.3522ftsB - - Bfl165 1.4438ftsI BU222 1.7126 Bfl136 1.5656ftsK - - Bfl386 4.1955ftsL BU223m - Bfl135 19.2767ftsQ - - Bfl144 2.651ftsW BU217 0.5305 Bfl141 1.6416ftsY BU024 3.4067 Bfl627 6.6791ftsZ BU212 0.8491 Bfl146 1.7049fumC - - Bfl373 1.6405fusA BU527 0.5931 Bfl565 0.2266gapA BU298 1.6978 Bfl437 1.6258glmM - - Bfl100 1.3923glmS BU026 1.4445 - -glmU BU027 0.9341 Bfl010 1.5112glnA - - Bfl618 3.5547glnS BU415 1.3657 Bfl324 1.6813gloB BU246 3.0345 Bfl223 1.3876glpF BU306 3.5141 - -gltP - - Bfl030 0.7466gltX BU070 1.5507 Bfl504 2.1138glyA BU289 3.2454 Bfl536 0.4708glyQ BU136 0.6578 Bfl020 5.6059
153

Appendix C. The Ratio between the Intensities of Selection in the Endosymbiont Genomes and theirFree-living Cousins
glyS BU135 0.784 Bfl021 1.4691gmk BU434 0.8512 Bfl616 1.4001gnd BU107 2.1839 Bfl470 2.974gntY BU544 2.0424 Bfl573 5.6098gpmA BU304 2.7551 Bfl342 4.9283gpsA - - Bfl604 2.5578gpt BU251 0.9366 - -greA BU384 0.6463 Bfl096 3.0632groL BU019 0.163 Bfl071 0.1461groS BU018 0.2127 Bfl070 0.1808grpE BU184 10.8196 Bfl544 1.2855grxC - - Bfl605 1.8098grxD BU187 1.8484 Bfl367 4.5832gshA BU407 2.9517 - -gshB BU547 0.5691 - -guaA - - Bfl527 2.4614guaB - - Bfl528 1.2593guaC BU204 1.014 - -gutQ - - Bfl459 1.0383gyrA BU180 0.3166 Bfl476 0.3258gyrB BU010 4.6543 Bfl017 0.7504hemC - - Bfl580 1.4391hemD - - Bfl581 0.7361hflB BU382 1.1125 Bfl098 0.6277hflC BU567 1.1995 Bfl082 1.1316hflK BU568 1.878 Bfl081 1.1411hflX - - Bfl080 2.2616hinT BU357 1.5741 Bfl398 9.5478hisA BU104 1.631 Bfl467 2.2212hisB BU102 2.2452 Bfl465 2.7882hisC BU101 0.6125 Bfl464 0.5942hisD BU100 0.7141 Bfl463 2.8603hisF BU105 2.4562 Bfl468 1.9181hisG BU099 0.582 Bfl462 0.7161hisH BU103 2.8849 Bfl466 4.3281hisI BU106 1.1634 Bfl469 1.3205hisS BU288 0.889 Bfl531 2.316holA BU445 3.0801 Bfl311 6.5685holB BU354 0.8841 Bfl400 1.0286holC - - Bfl034 1.387holD - - Bfl110 0.9834hpt BU195 1.631 - -hscA BU605 1.439 - -hscB BU604 2.1689 - -hslU BU579 1.3351 - -
154

Appendix C. The Ratio between the Intensities of Selection in the Endosymbiont Genomes and theirFree-living Cousins
hslV BU578 0.1991 - -hspQ - - Bfl419 0.4136htpG BU483 0.66 - -htpX BU321 0.5354 - -hupA BU032 0.7462 - -ibpA BU580 0.3721 Bfl018 1.3909ihfA BU131 1.9212 - -ihfB BU308 6.1972 - -ileS BU149 2.5395 Bfl118 0.437ilvA - - Bfl589 0.9512ilvC BU599 3.9774 Bfl588 2.8094ilvD BU600 1.1928 Bfl590 0.9158ilvE - - Bfl591 4.0895ilvH BU225 0.8034 - -ilvI BU226 0.3524 - -ilvM - - Bfl592 1.7683imp - - Bfl129 5.9363infA BU315 - Bfl388 -infB BU377 3.7773 Bfl104 1.1373infC BU126 1.5304 Bfl352 2.7882iscS BU602 0.8851 Bfl534 2.6686iscU BU603 0.3632 - -ispA BU465 2.0181 - -ispB - - Bfl092 4.4958ispD BU420 2.2244 - -ispE BU170 2.3249 Bfl347 1.919ispF BU419 0.8853 - -ispG BU287 2.338 - -ispH BU147 6.0596 - -ispU BU236 1.8687 Bfl276 0.4158kdsA - - Bfl350 1.117kdsB - - Bfl376 7.6396ksgA BU141 4.4594 Bfl126 2.8189lepA BU260 5.8031 Bfl542 1.5389lepB BU259 4.7285 Bfl541 3.8903leuA - - Bfl133 1.0967leuB - - Bfl132 1.8213leuC - - Bfl131 1.3385leuD - - Bfl130 2.9009leuS BU444 1.0928 Bfl313 2.3348lgt - - Bfl265 4.0563ligA - - Bfl507 2.9065lipA BU269 1.4075 - -lipB BU268 1.7577 - -lnt - - Bfl314 3.3908
155

Appendix C. The Ratio between the Intensities of Selection in the Endosymbiont Genomes and theirFree-living Cousins
lolA - - Bfl385 5.8939lolC BU295 4.8113 Bfl396 3.7811lolD BU296 27.451 Bfl395 5.7015lolE - - Bfl394 4.8359lon BU477 0.5383 Bfl299 3.814lpcA BU250 1.3158 Bfl226 3.6526lpd BU207 3.1649 Bfl151 3.4926lplA - - Bfl357 2.5277lpp - - Bfl364 0.3025lptA - - Bfl043 5.506lptB - - Bfl042 3.8505lpxA - - Bfl283 0.2969lpxB - - Bfl284 3.282lpxC - - Bfl147 2.8589lpxD - - Bfl281 2.036lpxH - - Bfl303 1.0705lpxK - - Bfl378 0.4284lpxL - - Bfl411 1.3973lspA BU148 7.5943 Bfl119 1.9797lysA BU438 1.8099 Bfl263 0.7215lysS - - Bfl262 1.4495manX - - Bfl445 3.3058manY - - Bfl446 1.2162manZ - - Bfl447 0.5527map BU230 0.5672 Bfl270 0.4674mdlA BU479 0.63 - -mdlB BU480 0.366 - -mdtH - - Bfl455 1.7916metA - - Bfl630 4.9091metB - - Bfl598 1.106metC - - Bfl067 0.6399metE BU030 1.8997 Bfl625 2.2788metF BU046 1.582 Bfl597 1.8336metG BU109 2.0295 Bfl471 2.9968metK BU408 0.6961 Bfl252 2.0589miaA - - Bfl079 1.747miaB BU441 1.6616 - -minC BU327 2.0078 Bfl439 0.4956minD BU326 0.6849 Bfl440 1.3296minE BU325 - Bfl441 14.6248mltA BU458 0.5567 - -mnmA BU261 0.7114 Bfl392 2.7862mnmE BU016 1.4767 Bfl011 2.3592mnmG BU001 0.9644 Bfl001 3.0982mnmG BU001 0.9644 Bfl001 3.0982
156

Appendix C. The Ratio between the Intensities of Selection in the Endosymbiont Genomes and theirFree-living Cousins
mntH - - Bfl502 1.2957mraW BU224 1.1 Bfl134 2.8974mraY - - Bfl139 9.227mrcB - - Bfl154 1.9333mrdA - - Bfl309 3.6239mrdB - - Bfl308 6.8342mreB - - Bfl294 -mreC - - Bfl295 7.79mreD - - Bfl296 4.2962msbA - - Bfl379 3.0256mscS BU452 0.8591 - -mtlA BU572 5.2281 - -mtlD BU571 2.1533 - -mtn BU210 3.1216 - -murA BU386 2.7587 Bfl046 1.3999murB BU045 1.4349 Bfl183 0.6962murC - - Bfl143 3.6442murD BU218 0.4853 Bfl140 1.9973murE - - Bfl137 1.0703murF - - Bfl138 0.8684murG BU216 1.9645 Bfl142 2.7884murI BU554 2.2419 - -mutL BU570 3.4868 - -mutS BU429 0.8782 - -mutT BU202 1.054 - -mutY BU552 1.9967 Bfl249 2.5478nadD BU446 0.4776 - -nadE BU174 2.2559 - -nadK BU185 1.2034 Bfl545 3.2891nagA - - Bfl322 1.0272nagB - - Bfl323 1.3398ndk - - Bfl533 1.7966nfo BU137 0.259 - -nlpD - - Bfl167 1.0938nrdA BU179 0.7532 Bfl478 0.9512nrdB BU178 0.6237 Bfl479 5.7614nth BU119 0.5723 Bfl372 4.0889nuoA BU154 1.2292 Bfl493 0.551nuoB BU155 1.3867 Bfl492 10.222nuoC BU156 1.5673 Bfl491 0.6446nuoE BU157 2.0151 Bfl490 4.9615nuoF BU158 1.2594 Bfl489 4.9366nuoG BU159 9.5525 Bfl488 1.1807nuoH BU160 1.5851 Bfl487 2.2605nuoI BU161 0.9939 Bfl486 9.0005
157

Appendix C. The Ratio between the Intensities of Selection in the Endosymbiont Genomes and theirFree-living Cousins
nuoJ BU162 0.3893 Bfl485 4.4213nuoK BU163 0.4826 Bfl484 2.1487nuoL BU164 3.5269 Bfl483 3.3577nuoM BU165 2.1023 Bfl482 4.302nuoN BU166 6.4155 Bfl481 3.9284nupC - - Bfl503 5.9146nusA BU378 1.8045 Bfl103 1.1053nusB BU463 1.3217 Bfl236 4.9236nusG BU039 0.8502 Bfl562 1.9666obgE BU389 1.115 Bfl095 3.2274ompA BU332 0.8114 - -orn BU574 1.3711 Bfl075 2.3088pabA - - Bfl568 0.6035pabB - - Bfl443 0.8549pabC - - Bfl402 0.4882pal - - Bfl339 3.9309panB BU197 0.7898 - -panC BU196 0.9578 - -pdxA - - Bfl127 1.4859pdxB - - Bfl497 1.1006pdxH - - Bfl370 1.4692pdxJ - - Bfl539 2.0459pepA BU367 1.5143 Bfl035 4.406pfkA BU305 0.5822 Bfl602 0.8235pgi BU573 0.337 Bfl629 1.4938pgk BU450 3.0602 Bfl254 0.9784pgl BU293 1.3426 Bfl341 2.1864pgm - - Bfl326 4.3385pgpA - - Bfl237 8.6958pgsA - - Bfl415 6.9659pheA BU392 0.3844 Bfl179 3.381pheS BU129 0.8741 Bfl355 5.8299pheT BU130 4.6255 Bfl356 2.0966pitA BU587 1.2185 Bfl024 1.8053plsC - - Bfl066 2.3973plsX - - Bfl407 0.7333pmbA BU089 1.5855 Bfl298 2.7797pncB BU361 1.0589 - -pnp BU373 0.0562 Bfl108 0.7165polA BU431 1.7726 Bfl619 3.3132ppa BU088 1.5814 Bfl091 0.6045ppiD BU478 3.4928 - -prfA BU171 0.4368 Bfl348 3.9821prfB - - Bfl261 1.6962prfC BU543 1.3968 - -
158

Appendix C. The Ratio between the Intensities of Selection in the Endosymbiont Genomes and theirFree-living Cousins
priA BU120 3.8178 - -prlC - - Bfl023 2.6417prmB - - Bfl499 4.2308prmC BU172 1.4133 Bfl349 1.13proS BU239 0.4144 Bfl289 3.7776prs BU169 0.2503 Bfl346 2.9929psd - - Bfl074 1.7851pssA - - Bfl551 2.2457pta BU176 2.7279 - -pth BU190 1.3227 Bfl345 1.934ptsG BU356 2.1578 - -ptsH BU065 0.024 Bfl509 -ptsI BU064 2.8186 Bfl510 1.0802purA BU566 3.2496 Bfl083 1.6593purB BU263 0.8911 Bfl393 2.2236purH BU031 0.355 Bfl555 1.8038pykA BU319 1.8406 Bfl450 4.7988pyrB BU369 0.4504 - -pyrC BU334 1.5994 - -pyrD BU362 1.3359 - -pyrF BU270 0.4151 - -pyrG BU416 0.363 Bfl156 0.703pyrH BU233 4.9206 Bfl273 2.4605pyrI BU370 1.8592 - -queA BU132 0.9081 - -rbfA BU376 12.0486 Bfl105 3.0988recB BU454 6.275 Bfl268 2.7051recC BU453 0.8833 Bfl266 3.9784recD BU455 1.4643 Bfl267 1.9675rep BU598 0.4947 - -rfaC - - Bfl609 0.974rfaD - - Bfl607 2.361rfaE BU060 0.5215 Bfl063 3.5312rfaF - - Bfl608 3.6493rho BU596 0.0868 Bfl586 1.058ribA BU271 0.7023 Bfl425 1.3746ribB BU059 1.182 Bfl065 2.1123ribC BU112 0.6747 Bfl366 4.2622ribD BU462 1.2878 Bfl234 1.6448ribE BU459 1.3517 Bfl235 0.6228ribF BU150 0.941 Bfl117 1.0721rimM BU395 4.9689 Bfl174 1.3936rimN BU494 2.8011 Bfl220 0.6391rlmB - - Bfl084 7.099rlmL BU363 0.7947 - -
159

Appendix C. The Ratio between the Intensities of Selection in the Endosymbiont Genomes and theirFree-living Cousins
rlmN BU286 5.4555 - -rlpB - - Bfl312 3.6674rluB BU282 3.3176 - -rluC BU348 2.8134 Bfl409 6.0811rluD BU401 2.2125 Bfl181 2.7153rmuC - - Bfl623 1.6107rnb BU266 0.7387 - -rnc BU258 0.6287 Bfl540 2.5407rne BU347 2.8097 Bfl410 0.7982rnhA - - Bfl224 1.0664rnhB - - Bfl285 3.8863rnpA BU014 6.0887 Bfl014 1.3587rnr BU565 1.3064 - -rnt BU188 0.5344 Bfl368 0.9732rpe BU537 1.7173 Bfl570 3.7287rpiA BU411 1.2656 Bfl256 3.5189rplA BU037 1.0484 Bfl560 1.4217rplB BU521 - Bfl194 0.9185rplC BU524 3.2874 Bfl191 1.2503rplD BU523 - Bfl192 -rplE BU512 - Bfl203 0.4175rplF BU509 0.738 Bfl206 2.0563rplI BU562 0.7261 Bfl087 0.6667rplJ BU036 8.7901 Bfl559 0.6441rplK BU038 0.0193 Bfl561 -rplL BU035 0.489 Bfl558 0.5981rplM BU391 - Bfl049 -rplN BU514 - Bfl201 0.2909rplO BU505 - Bfl210 0.9844rplP BU517 - Bfl198 0.2843rplQ BU498 3.9902 Bfl217 1.2132rplR BU508 - Bfl207 0.4679rplS BU397 - Bfl176 0.2454rplT BU128 - Bfl354 -rplU BU387 - Bfl093 1.5833rplV BU519 - Bfl196 -rplW BU522 7.0554 Bfl193 1.7477rplX BU513 - Bfl202 -rplY BU138 4.6258 Bfl473 1.2948rpmA BU388 1.1734 Bfl094 0.7999rpmB BU086 48.2451 Bfl612 0.1924rpmC BU516 0.438 - -rpmD BU506 - - -rpmE BU577 1.4724 Bfl599 0.3835rpmF BU349 - Bfl408 -
160

Appendix C. The Ratio between the Intensities of Selection in the Endosymbiont Genomes and theirFree-living Cousins
rpmG BU085 0.8315 Bfl611 -rpmH BU013 0.0345 Bfl015 -rpmI BU127 - Bfl353 -rpmJ - - Bfl212 -rpoA BU499 - Bfl216 1.9913rpoB BU034 1.5232 Bfl557 0.6027rpoC BU033 2.3439 Bfl556 0.3617rpoD BU055 0.3418 Bfl056 1.3508rpoH BU025 0.6248 Bfl626 1.7321rpoZ - - Bfl617 -rppH - - Bfl264 5.7691rpsA BU309 - Bfl380 1.6261rpsB BU231 1.3246 Bfl271 0.453rpsC BU518 - Bfl197 -rpsD BU500 - Bfl215 0.8648rpsE BU507 - Bfl208 -rpsF BU564 2.669 Bfl085 5.0405rpsG BU528 0.8941 Bfl566 1.5068rpsH BU510 - Bfl205 -rpsI BU390 - Bfl050 0.6119rpsJ BU525 0.9286 Bfl190 0.2526rpsK BU501 - Bfl214 0.8211rpsL BU529 - Bfl567 -rpsM BU502 0.2 Bfl213 0.3123rpsN BU511 0.8544 Bfl204 0.6411rpsO BU374 1.5536 Bfl107 1.2504rpsP BU394 18.0461 Bfl173 1.6644rpsQ BU515 - Bfl200 1.6058rpsR BU563 0.3447 Bfl086 0.0711rpsS BU520 - Bfl195 0.1229rpsT BU151 - Bfl116 0.1397rpsU BU057 0.0273 Bfl058 -rrmJ BU383 - Bfl097 -rseP - - Bfl278 1.178rsmC BU328 1.6599 - -rsmD - - Bfl628 0.8071rsmE BU410 2.6106 - -rsxA BU113 1.0418 - -rsxB BU114 2.0371 - -rsxD BU116 1.9482 - -rsxE BU118 0.9453 - -rsxG BU117 1.5507 - -sbcB BU555 1.0899 Bfl461 4.1395sdhA - - Bfl329 -sdhB - - Bfl330 2.7883
161

Appendix C. The Ratio between the Intensities of Selection in the Endosymbiont Genomes and theirFree-living Cousins
sdhC - - Bfl327 2.778sdhD - - Bfl328 5.9253secA BU201 1.0018 Bfl148 1.0368secB BU053 4.9946 - -secD - - Bfl232 1.5942secE BU040 2.438 Bfl563 0.8959secF - - Bfl233 1.7905secY BU504 4.3841 Bfl211 1.3349serC BU312 0.2792 Bfl383 1.885serS BU313 1.3238 Bfl384 2.838sirA BU447 1.2348 - -skp - - Bfl280 0.7405slyA - - Bfl369 0.977smg BU495 1.4093 - -smpB BU254 3.9953 Bfl548 5.1079sodA BU189 1.6067 Bfl022 3.3587sohB BU283 1.5467 - -speB - - Bfl253 4.1955speD BU208 0.3401 - -speE BU209 0.6563 - -sppA - - Bfl436 1.4857ssb BU545 0.6502 Bfl028 0.7515sucA BU302 2.6649 Bfl331 1.2291sucB BU303 3.453 Bfl332 2.6528sucC - - Bfl333 7.8753sucD - - Bfl334 0.853sufA BU122 1.446 Bfl358 2.2622sufB - - Bfl359 1.4616sufC - - Bfl360 1.4503sufD - - Bfl361 1.0103sufE - - Bfl363 2.2005sufS - - Bfl362 1.7789suhB BU285 2.0948 Bfl535 7.9595surA BU140 2.3388 Bfl128 5.5702tadA BU255 1.4596 Bfl537 2.3668talA BU093 1.321 Bfl515 14.8186tdk - - Bfl434 4.3449tgt BU133 1.651 Bfl230 2.3977thiI - - Bfl239 3.4559thiL BU460 0.7814 - -thrA BU194 8.2684 Bfl111 1.4369thrB BU193 0.4299 Bfl112 1.6915thrC BU192 1.5141 Bfl113 1.4205thrS BU125 3.3109 Bfl351 1.9573thyA BU440 1.6328 - -
162

Appendix C. The Ratio between the Intensities of Selection in the Endosymbiont Genomes and theirFree-living Cousins
tig BU474 17.1857 - -tilS BU110 1.1326 Bfl288 0.4451tktA - - Bfl516 0.9037tldD BU398 6.6276 Bfl297 1.4751tmk BU353 0.5166 Bfl401 3.2605tolA - - Bfl337 1.0386tolB - - Bfl338 1.3649tolQ - - Bfl335 9.8659tolR - - Bfl336 2.2717tonB - - Bfl432 2.6586topA BU284 2.9928 - -tpiA BU307 1.8326 Bfl601 1.7582trmD BU396 5.6487 Bfl175 0.762trmI BU551 2.1276 - -trpA BU277 1.2686 Bfl431 1.818trpB BU278 0.9305 Bfl430 2.0436trpC BU279 4.283 Bfl429 1.8954trpD BU280 1.2587 Bfl428 7.6268trpE - - Bfl426 0.8543trpS BU536 3.4352 Bfl569 2.5766truA BU199 1.5131 Bfl496 4.4966truB BU375 3.3839 Bfl106 2.9753trxA BU597 0.0059 Bfl587 -trxB BU314 4.5502 Bfl387 3.9296tsf BU232 2.0596 Bfl272 1.7665tsgA BU535 1.4742 - -typA BU433 2.0056 - -tyrA - - Bfl178 3.8158tyrS BU121 0.487 Bfl371 3.2791ubiA - - Bfl025 2.9446ubiB - - Bfl621 2.0854ubiD - - Bfl620 1.4111ubiE - - Bfl622 3.4757ubiF - - Bfl318 3.0163ubiG - - Bfl477 4.8768ubiH - - Bfl259 1.087ubiX - - Bfl375 1.4193udp - - Bfl624 2.6381ung - - Bfl543 3.4151upp - - Bfl520 2.8476uup BU364 1.1617 - -valS BU366 3.5253 Bfl033 4.0808waaA - - Bfl610 3.9215xthA - - Bfl435 1.4429yabI BU139 1.5333 - -
163

Appendix C. The Ratio between the Intensities of Selection in the Endosymbiont Genomes and theirFree-living Cousins
yajC BU134 0.3871 Bfl231 4.6249yajR BU466 2.796 Bfl240 3.3012ybaB BU482 - - -ybeB - - Bfl310 3.2078ybeD BU488 2.2353 - -ybeX BU443 4.3857 Bfl315 2.2309ybeY BU442 0.4517 Bfl316 2.2464ybeZ - - Bfl317 13.0972ybgF - - Bfl340 1.6221ybgI BU301 1.6787 - -ybhL - - Bfl343 1.0881ycaR - - Bfl377 3.879ycbL - - Bfl423 1.4585yccK BU467 2.6774 Bfl418 2.091yceA BU365 1.0565 - -yceN BU333 3.5679 Bfl454 4.0276ycfH BU355 1.0671 Bfl399 2.3133ycfM - - Bfl397 4.5378ychA BU173 1.3373 - -ychE BU267 0.5516 - -ychF BU191 1.4525 Bfl344 2.103yciA BU274 1.5768 - -yciB BU275 0.7587 - -yciC BU276 1.0719 - -ydiK BU123 0.5669 - -yeaZ BU324 2.1507 Bfl442 1.0261yebA - - Bfl451 3.9694yeeX BU556 0.405 Bfl460 1.2738yfaE - - Bfl480 7.7717yfcN BU098 0.0961 - -yfgM BU608 1.7455 - -yfjF BU253 3.5847 - -yfjG - - Bfl547 8.9379ygfA - - Bfl257 1.1724ygfZ BU435 2.0778 Bfl260 2.0147yggS BU549 2.2723 - -yggW BU550 2.9773 - -yggX BU553 0.6813 Bfl248 5.5153ygiH - - Bfl060 3.4676ygjD BU058 1.0533 Bfl059 2.0003yhcB - - Bfl048 16.4386yheL BU530 2.9894 - -yheM BU531 3.7267 - -yheN BU532 0.825 - -yhiQ BU586 3.198 - -
164

Appendix C. The Ratio between the Intensities of Selection in the Endosymbiont Genomes and theirFree-living Cousins
yibN BU052 3.3171 Bfl606 6.7885yicC - - Bfl614 4.9134yidC BU015 4.0893 Bfl012 3.5519yidZ - - Bfl038 1.8996yigB - - Bfl578 1.2588yigL BU028 1.289 Bfl576 1.1679yihA BU432 1.9185 - -yjcE - - Bfl029 1.4102yjeE - - Bfl077 2.5647yjeP - - Bfl073 3.7207yjgF - - Bfl031 1.2081yjgP - - Bfl036 2.7942yjgQ - - Bfl037 10.2813ynfM BU588 1.3501 - -yoaE BU323 1.2146 Bfl444 1.3094yqeI - - Bfl390 0.3913yqgE - - Bfl251 1.0567yqgF BU548 3.085 Bfl250 8.928yqjA - - Bfl054 6.2785yraL BU091 0.2181 Bfl052 1.5766yraP - - Bfl051 2.6797yrbA BU385 2.1609 Bfl045 11.1041yrbK - - Bfl044 3.6642ytfF - - Bfl307 1.3315ytfN BU087 1.6083 Bfl090 4.3045zapA - - Bfl258 2.2147znuB BU317 0.486 Bfl041 7.7383znuC BU318 3.2159 - -zur - - Bfl026 4.194zwf BU320 2.2083 Bfl449 3.9884
165

Appendix D
Codon Adaptaion Index for Buchnera
aphidicola Genes
Table D.1: Codon adaptation Index for genes in B. aphidicola - calculated for Eshichia coli becauseof codon bias in B. aphidicola.
gene CAI(NC_000913) gene CAI(NC_000913)accA 0.5356 accB 0.5174accC 0.5636 accD 0.4522aceE 0.6690 aceF 0.6238acpP 0.6637 acpS 0.3064adk 0.6435 ahpC 0.7975alaS 0.4918 amiB 0.2878apaH 0.3676 apt 0.5459argS 0.5175 aroA 0.3537aroB 0.2753 aroC 0.3941aroE 0.2548 aroF 0.3606aroK 0.3727 asd 0.3649asnS 0.4998 aspC 0.4681aspS 0.6003 atpA 0.6634atpB 0.4105 atpC 0.4897atpD 0.6558 atpE 0.6247atpF 0.4815 atpG 0.4501atpH 0.3702 bamA 0.4595bamD 0.3733 bcp 0.4444bfr 0.3322 birA 0.2567carA 0.3961 carB 0.5603cca 0.3372 cdsA 0.2435clpB 0.4047 clpP 0.3900
166

Appendix D. Codon Adaptaion Index for Buchnera aphidicola Genes
clpX 0.4980 cls 0.2606cmk 0.3066 corA 0.4529cspC 0.6690 csrA 0.4059cutA 0.3064 cyoA 0.4088cyoB 0.4987 cyoC 0.5017cyoD 0.4411 cyoE 0.3618cysA 0.4147 cysC 0.2559cysD 0.4529 cysE 0.3784cysG 0.3453 cysH 0.3856cysI 0.4327 cysJ 0.3883cysK 0.4014 cysN 0.3745cysP 0.4831 cysQ 0.4074cysS 0.4854 cysU 0.3376cysW 0.3877 dapA 0.3378dapB 0.3387 dapD 0.5270dapE 0.3002 dapF 0.3293ddlA 0.3443 deaD 0.6267def 0.3785 degQ 0.2953der 0.4176 dksA 0.4558dnaB 0.3899 dnaE 0.3803dnaG 0.2601 dnaJ 0.4989dnaK 0.7119 dnaN 0.4455dnaQ 0.2863 dnaX 0.3453dsbB 0.4018 dut 0.4144dxr 0.3127 dxs 0.3896efp 0.6729 emrE 0.1696emtA 0.3026 eno 0.8341erpA 0.6132 fabA 0.5350fabB 0.6327 fabD 0.4670fabG 0.4508 fabH 0.3843fabI 0.6098 fabZ 0.4351fbaA 0.7709 !h 0.4519fldA 0.5680 fmt 0.3418folA 0.3843 folB 0.3573folC 0.3373 folD 0.3843folE 0.3528 folK 0.2706folP 0.3290 fpr 0.2568frr 0.5585 ftsA 0.3113ftsB 0.2827 ftsI 0.3645ftsK 0.3566 ftsL 0.2569ftsQ 0.2967 ftsW 0.3294ftsY 0.4328 ftsZ 0.5229fumC 0.3331 fusA 0.7345gapA 0.8275 glmM 0.4488glmU 0.4559 glnA 0.6331
167

Appendix D. Codon Adaptaion Index for Buchnera aphidicola Genes
glnS 0.5571 gloB 0.1739gltP 0.3836 gltX 0.5643glyA 0.6735 glyQ 0.5461glyS 0.5702 gmk 0.3558gnd 0.5363 gntY 0.4692gpmA 0.5722 gpsA 0.3310greA 0.4997 groL 0.7937groS 0.5155 grpE 0.4993grxC 0.4100 grxD 0.6184guaA 0.5884 guaB 0.6286gutQ 0.3814 gyrA 0.5274gyrB 0.5529 hemC 0.3029hemD 0.2157 hflB 0.5283hflC 0.5138 hflK 0.4508hflX 0.3289 hinT 0.3462hisA 0.4116 hisB 0.4237hisC 0.3628 hisD 0.3909hisF 0.4279 hisG 0.4633hisH 0.4348 hisI 0.3812hisS 0.4270 holA 0.2448holB 0.2681 holC 0.3485holD 0.2626 hspQ 0.3531ibpA 0.4780 ileS 0.5323ilvA 0.4073 ilvC 0.5896ilvD 0.4643 ilvE 0.4893ilvM 0.2428 imp 0.4151infA 0.4892 infB 0.5953infC 0.3619 iscS 0.5799ispB 0.3926 ispE 0.2456ispU 0.2291 kdsA 0.4969kdsB 0.4103 ksgA 0.3450lepA 0.4809 lepB 0.3745leuA 0.4116 leuB 0.4104leuC 0.4706 leuD 0.4213leuS 0.5866 lgt 0.3794ligA 0.3947 lnt 0.3599lolA 0.4081 lolC 0.3016lolD 0.4088 lolE 0.3013lon 0.4737 lpcA 0.4870lpd 0.6521 lplA 0.3433lpp 0.8599 lptA 0.4564lptB 0.4062 lpxA 0.3990lpxB 0.3248 lpxC 0.4478lpxD 0.3721 lpxH 0.3120lpxK 0.2934 lpxL 0.3571
168

Appendix D. Codon Adaptaion Index for Buchnera aphidicola Genes
lspA 0.3662 lysA 0.3254lysS 0.5921 manX 0.4267manY 0.5462 manZ 0.5219map 0.4662 mdtH 0.3156metA 0.3085 metB 0.3330metC 0.3021 metE 0.4251metF 0.3959 metG 0.5391metK 0.6164 miaA 0.2449minC 0.2804 minD 0.3215minE 0.3234 mnmA 0.4604mnmE 0.3417 mnmG 0.4116mntH 0.2886 mraW 0.3537mraY 0.3734 mrcB 0.3954mrdA 0.4021 mrdB 0.3178mreB 0.5564 mreC 0.3638mreD 0.2752 msbA 0.3979murA 0.4508 murB 0.2850murC 0.3667 murD 0.3810murE 0.3818 murF 0.3855murG 0.3232 mutY 0.2714nadK 0.2902 nagA 0.4153nagB 0.5006 ndk 0.6353nlpD 0.3207 nrdA 0.5144nrdB 0.5026 nth 0.3239nuoA 0.4078 nuoB 0.4550nuoC 0.4999 nuoE 0.4430nuoF 0.4744 nuoG 0.5082nuoH 0.4491 nuoI 0.4844nuoJ 0.4097 nuoK 0.3388nuoL 0.4655 nuoM 0.4327nuoN 0.4210 nupC 0.5160nusA 0.5414 nusB 0.4809nusG 0.5802 obgE 0.4992orn 0.4078 pabA 0.2776pabB 0.3190 pabC 0.2265pal 0.6864 pdxA 0.2782pdxB 0.2927 pdxH 0.3723pdxJ 0.4528 pepA 0.4057pfkA 0.6650 pgi 0.5581pgk 0.7262 pgl 0.3720pgm 0.5265 pgpA 0.3083pgsA 0.3140 pheA 0.3004pheS 0.5114 pheT 0.5114pitA 0.3832 plsC 0.3290plsX 0.1969 pmbA 0.3566
169

Appendix D. Codon Adaptaion Index for Buchnera aphidicola Genes
pnp 0.6815 polA 0.3826ppa 0.6639 prfA 0.4536prfB 0.4825 prlC 0.4828prmB 0.4597 prmC 0.2966proS 0.5685 prs 0.5526psd 0.4387 pssA 0.3437pth 0.2915 ptsH 0.6361ptsI 0.4872 purA 0.6214purB 0.5094 purH 0.4925pykA 0.4485 pyrG 0.4861pyrH 0.5024 rbfA 0.5666recB 0.3203 recC 0.3253recD 0.2698 rfaC 0.2485rfaD 0.5440 rfaE 0.3878rfaF 0.3298 rho 0.5386ribA 0.3524 ribB 0.4676ribC 0.2967 ribD 0.2692ribE 0.5748 ribF 0.2974rimM 0.3716 rimN 0.2392rlmB 0.4104 rlpB 0.3440rluC 0.3431 rluD 0.3986rmuC 0.3404 rnc 0.3065rne 0.4860 rnhA 0.3631rnhB 0.3742 rnpA 0.2227rnt 0.3919 rpe 0.3770rpiA 0.4321 rplA 0.7628rplB 0.7030 rplC 0.7076rplD 0.6863 rplE 0.6121rplF 0.6100 rplI 0.7243rplJ 0.6376 rplK 0.6994rplL 0.8375 rplM 0.6560rplN 0.4963 rplO 0.6818rplP 0.5996 rplQ 0.5374rplR 0.6031 rplS 0.6290rplT 0.6862 rplU 0.6331rplV 0.5756 rplW 0.6636rplX 0.5858 rplY 0.7593rpmA 0.7166 rpmB 0.6114rpmE 0.7384 rpmF 0.6322rpmG 0.7082 rpmH 0.7442rpmI 0.7206 rpmJ 0.4537rpoA 0.4389 rpoB 0.6303rpoC 0.6949 rpoD 0.5896rpoH 0.5558 rpoZ 0.5868rppH 0.2796 rpsA 0.7676
170

Appendix D. Codon Adaptaion Index for Buchnera aphidicola Genes
rpsB 0.7730 rpsC 0.7327rpsD 0.5395 rpsE 0.5929rpsF 0.6853 rpsG 0.5264rpsH 0.6062 rpsI 0.7725rpsJ 0.5718 rpsK 0.5871rpsL 0.6467 rpsM 0.4383rpsN 0.5334 rpsO 0.6604rpsP 0.6574 rpsQ 0.6887rpsR 0.6619 rpsS 0.4453rpsT 0.6490 rpsU 0.7259rrmJ 0.3389 rseP 0.2559rsmD 0.2930 sbcB 0.3089sdhA 0.5269 sdhB 0.3278sdhC 0.3116 sdhD 0.4127secA 0.5394 secD 0.4600secE 0.3765 secF 0.4250secY 0.3668 serC 0.3946serS 0.5270 skp 0.6226slyA 0.2757 smpB 0.3721sodA 0.7213 speB 0.5179sppA 0.3893 ssb 0.6324sucA 0.5091 sucB 0.5688sucC 0.5812 sucD 0.6249sufA 0.3033 sufB 0.3501sufC 0.2735 sufD 0.3161sufE 0.2941 sufS 0.3033suhB 0.6262 surA 0.4851tadA 0.3127 talA 0.3444tdk 0.2514 tgt 0.4296thiI 0.4603 thrA 0.3198thrB 0.3222 thrC 0.3514thrS 0.4639 tilS 0.2552tktA 0.6987 tldD 0.4036tmk 0.3569 tolA 0.3769tolB 0.4369 tolQ 0.3560tolR 0.3242 tonB 0.2899tpiA 0.7448 trmD 0.2675trpA 0.3311 trpB 0.4106trpC 0.3054 trpD 0.3449trpE 0.3503 trpS 0.4878truA 0.3224 truB 0.4153trxA 0.5613 trxB 0.4463tsf 0.7659 tyrA 0.3205tyrS 0.4997 ubiA 0.2699ubiB 0.2943 ubiD 0.3495
171

Appendix D. Codon Adaptaion Index for Buchnera aphidicola Genes
ubiE 0.3816 ubiF 0.2979ubiG 0.3557 ubiH 0.3091ubiX 0.2825 udp 0.5308ung 0.2800 upp 0.5371valS 0.6239 waaA 0.3170xthA 0.4090 yajC 0.5581yajR 0.3121 ybeB 0.4578ybeX 0.4394 ybeY 0.3658ybeZ 0.4792 ybgF 0.3328ybhL 0.2816 ycaR 0.3914ycbL 0.3363 yccK 0.4384yceN 0.2982 ycfH 0.3507ycfM 0.3011 ychF 0.5126yeaZ 0.3536 yebA 0.3486yeeX 0.5993 yfaE 0.3983yfjG 0.2469 ygfA 0.2401ygfZ 0.4055 yggX 0.4028ygiH 0.2407 ygjD 0.3703yhcB 0.4716 yibN 0.4083yicC 0.4497 yidC 0.5642yidZ 0.3125 yigB 0.3262yigL 0.3914 yjcE 0.3308yjeE 0.2585 yjeP 0.3191yjgF 0.6143 yjgP 0.3265yjgQ 0.3979 yoaE 0.3586yqeI 0.2064 yqgE 0.3468yqgF 0.3657 yqjA 0.2534yraL 0.3459 yraP 0.3796yrbA 0.3862 yrbK 0.2662ytfF 0.2581 ytfN 0.3350zapA 0.2786 znuB 0.2648zur 0.3522 zwf 0.4283
172

Appendix E
Mean Atomic Density for the Genes in
Buchnera aphidicola
Table E.1: Mean atomic density for the genes in B. aphidicola whose proteins have been crystalisedin gamma-proteobacteria. Mean atomic density has been measured as the mean number of aminoacids surrounding at less than 8 Å each particular amino acid in the structure.
Gene Name Mean Atomic Density Gene Name Mean Atomic DensityaceE 9.7615 aceF 9.625adk 8.8505 argB 9.0698argD 9.6353 argG 9.2642argH 9.6681 argI 9.6126aroA 9.74 aroE 9.363aroH 9.484 aroK 9.1772asd 9.1635 aspS 9.0205atpB 9.8451 atpC 7.875atpE 2.9747 atpF 8.6721atpG 9.3288 atpH 10.7143bamA 8.5094 bioA 9.4813bioB 9.1026 bolA 8.4579carA 9.1693 carB 9.5784clpP 9.1075 clpX 8.4737coaD 9.0127 coaE 8.8137crr 8.24 csrA 7.459cyaY 9.9434 cyoA 7.9572cyoB 9.4032 cyoC 8.6432cyoD 7.9572 cysE 9.332cysJ 9.1711 cysK 9.2935cysS 9.7098 dapA 9.637
173

Appendix E. Mean Atomic Density for the Genes in Buchnera aphidicola
dapB 8.6691 dapD 8.9636dcd 8.3368 def 9.0121degP 7.6756 deoD 8.9494dksA 9.1103 dnaA 9.0652dnaB 9.4902 dnaE 8.9841dnaG 9.4645 dnaJ 9.1266dnaK 8.9894 dnaN 8.4098dnaQ 9.0229 dnaX 9.1648dsbA 9.2021 dut 7.7857dxr 9.6096 dxs 9.0256eno 9.8399 era 2.9658fabB 9.5383 fabG 9.2798fabI 9.0233 fbaA 9.1302fdx 8.5413 !h 9.2105fis 8.6438 fkpA 8.5769fldA 9.3669 fliI 9.1706fliM 5.9333 fmt 8.7962folA 8.4969 folC 9.1902folD 9.007 fpr 8.9754frr 2.9676 ftsY 10.078ftsZ 6.4118 fusA 3.0116gapA 9.0667 glmS 9.5329glmU 8.6036 glnS 8.9622glpF 9.9291 gltX 9.1905glyA 9.399 gmk 8.8537gpmA 9.4519 gpt 8.493greA 9.4768 groL 9.132groS 7.2796 grpE 8.481grxD 11.1043 gshA 9.6314gshB 8.9459 gyrA 9.2306gyrB 9.2967 hflB 9.1514hisB 9.5 hisC 8.9887hisD 8.8729 hisG 8.5069hisS 9.3846 holA 8.9349holB 8.9641 hpt 8.7619hscA 8.6916 hscB 9.4211hslU 8.4314 hslV 8.9655htpG 8.4674 hupA 7.9211ihfA 7.7917 ihfB 7.6596ilvC 9.9362 ilvH 8.4684ilvI 9.0912 infA 9.9577infB 7.6946 infC 10.5604iscS 9.4416 ispA 10.2148ispD 8.9061 ispE 9.0433ispF 8.8089 ispU 9.1385
174

Appendix E. Mean Atomic Density for the Genes in Buchnera aphidicola
ksgA 9.4286 lepB 8.4231leuS 8.7634 lon 8.7989lpcA 9.2682 lpd 8.9955lysA 9.2625 map 9.6231mdlA 3.0385 mdlB 3.0385metF 9.3358 metG 9.822metK 9.679 minE 8.4828mltA 8.8498 mnmA 8.7437mnmE 8.7791 mscS 8.6772mtlA 10.8333 mtn 9.0862murA 9.7081 murB 9.1588murD 9.3411 murG 9.2914murI 9.5113 mutL 8.9219mutS 9.2225 mutT 10.7054mutY 9.7022 nadD 8.8873nadE 9.1456 nfo 9.7599nrdA 9.7585 nrdB 9.9677nth 9.1611 nusA 9.2941nusB 10.7842 ompA 8.1638orn 9.08 panB 9.6107panC 9.0284 pepA 9.5368pfkA 9.3588 pgk 9.342pgl 9.1441 pheA 8.956pnp 9.4474 polA 9.5464ppa 8.3452 prfA 8.3933prfC 2.9713 priA 7.019prmC 8.6277 pta 9.2741pth 9.1451 ptsG 10.3247ptsH 10.5765 ptsI 9.4332purA 9.3016 purB 9.3699pykA 9.4741 pyrB 9.3097pyrC 9.6023 pyrD 9.31pyrF 9.1875 pyrG 9.2247pyrH 8.5644 pyrI 8.0759rbfA 10.1852 recB 8.8687recC 9.1604 recD 8.7217rep 9.2264 rho 9.0196ribA 8.9532 ribB 10.8894ribC 8.5243 ribD 8.5884rimN 8.8478 rluC 8.8515rluD 8.444 rnb 8.3569rne 8.1039 rnr 8.3569rnt 8.6447 rpiA 8.2025rplA 8.4375 rplB 7.1873rplC 7.201 rplD 6.9005
175

Appendix E. Mean Atomic Density for the Genes in Buchnera aphidicola
rplE 7.7865 rplF 7.6136rplI 7.3624 rplK 8.3475rplL 9.9333 rplM 7.3571rplN 7.8595 rplO 6.1389rplP 6.9118 rplQ 7.8031rplR 7.6838 rplS 6.9474rplT 8.0427 rplU 6.9417rplV 7.8182 rplW 6.8788rplX 6.2941 rplY 9.9362rpmA 6.881 rpmB 7.5974rpmC 7.0635 rpmD 7.7586rpmE 6.9429 rpmF 6.3214rpmG 6.7778 rpmH 7.2174rpmI 6.5938 rpoA 8.1416rpoC 8.1534 rpoD 9.9508rpsA 6 rpsB 8.789rpsC 8.1068 rpsD 8.4341rpsE 8.0933 rpsF 7.92rpsG 8.2895 rpsH 8.0388rpsI 8.0551 rpsJ 7.2041rpsK 8.1282 rpsL 7.2276rpsM 8.0442 rpsN 7.5rpsO 8.7273 rpsP 7.75rpsQ 7.3704 rpsR 8.3091rpsS 7.3 rpsT 8.7647rpsU 6.5686 rrmJ 9.1222rsmC 8.7933 sbcB 9.1438secA 8 secB 8.3881secE 2.982 secY 3serC 8.9889 sirA 10.7531sodA 9.2244 ssb 7.1579sucA 9.3123 sucB 8.7425sufA 7.5439 suhB 9.2137surA 8.8505 tadA 9.3846talA 9.8317 thrA 9.1298thrC 9.729 thrS 9.181thyA 9.053 tig 8.2067tilS 8.5701 tmk 9.5429topA 9.0675 tpiA 9.1961trmD 8.5574 trpA 9.1226trpB 9.6526 trpC 9.292truA 9 truB 8.7554trxA 8.6111 trxB 8.9811tsf 9.1702 tyrS 9.4161ybaB 8.4255 ybeD 10.5632
176

Appendix E. Mean Atomic Density for the Genes in Buchnera aphidicola
ybeY 9.1974 ybgI 9.2753ycfH 9.6189 yeaZ 9.0905ygfZ 8.6433 yggS 9.3805yggX 9.7174 yheL 8.8526yheM 8.5798 yheN 8.7538yhiQ 8.527 yidC 8.2464yihA 8.7988 yqgF 9.6522yrbA 9.3711
177

Appendix F
Fully Sequenced Free-living Genomes
in gamma-3-proteobacteria
Table F.1: Fully sequenced free-living genomes in gamma-3-proteobacteria
Genome accession NameNC_009085 Acinetobacter baumannii ATCC 17978NC_005966 Acinetobacter sp. ADP1NC_007963 Chromohalobacter salexigens DSM 3043NC_009792 Citrobacter koseri ATCC BAA-895NC_009778 Enterobacter sakazakii ATCC BAA-894NC_009436 Enterobacter sp. 638NC_004547 Erwinia carotovora subsp. atroseptica SCRI1043NC_008253 Escherichia coli 536NC_008563 Escherichia coli APEC O1NC_004431 Escherichia coli CFT073NC_009801 Escherichia coli E24377ANC_009800 Escherichia coli HSNC_000913 Escherichia coli K12NC_002655 Escherichia coli O157:H7 EDL933NC_002695 Escherichia coli O157:H7 str. SakaiNC_007946 Escherichia coli UTI89AC_000091 Escherichia coli W3110 DNANC_009648 Klebsiella pneumoniae subsp. pneumoniae MGH 78578NC_005126 Photorhabdus luminescens subsp. laumondii TTO1NC_009656 Pseudomonas aeruginosa PA7NC_002516 Pseudomonas aeruginosa PAO1NC_008463 Pseudomonas aeruginosa UCBPP-PA14NC_008027 Pseudomonas entomophila L48
178

Appendix F. Fully Sequenced Free-living Genomes in gamma-3-proteobacteria
NC_004129 Pseudomonas fluorescens Pf-5NC_007492 Pseudomonas fluorescens PfO-1NC_009439 Pseudomonas mendocina ympNC_009512 Pseudomonas putida F1NC_002947 Pseudomonas putida KT2440NC_009434 Pseudomonas stutzeri A1501NC_005773 Pseudomonas syringae pv. phaseolicola 1448ANC_007005 Pseudomonas syringae pv. syringae B728aNC_004578 Pseudomonas syringae pv. tomato str. DC3000NC_007204 Psychrobacter arcticus 273-4NC_007969 Psychrobacter cryohalolentis K5NC_009524 Psychrobacter sp. PRwf-1NC_010067 Salmonella enterica subsp. arizonae serovar 62:z4,z23:–NC_006905 Salmonella enterica subsp. enterica serovar Choleraesuis str. SC-B67NC_006511 Salmonella enterica subsp. enterica serovar Paratyphi A str. ATCC 9150NC_010102 Salmonella enterica subsp. enterica serovar Paratyphi B str. SPB7NC_003198 Salmonella enterica subsp. enterica serovar Typhi str. CT18NC_004631 Salmonella enterica subsp. enterica serovar Typhi Ty2NC_003197 Salmonella typhimurium LT2NC_009832 Serratia proteamaculans 568NC_007613 Shigella boydii Sb227NC_007606 Shigella dysenteriae Sd197NC_004741 Shigella flexneri 2a str. 2457TNC_004337 Shigella flexneri 2a str. 301NC_008258 Shigella flexneri 5 str. 8401NC_007384 Shigella sonnei Ss046NC_008800 Yersinia enterocolitica subsp. enterocolitica 8081NC_010159 Yersinia pestis AngolaNC_008150 Yersinia pestis AntiquaNC_005810 Yersinia pestis biovar Microtus str. 91001NC_003143 Yersinia pestis CO92NC_004088 Yersinia pestis KIMNC_008149 Yersinia pestis Nepal516NC_009381 Yersinia pestis Pestoides FNC_009708 Yersinia pseudotuberculosis IP 31758NC_006155 Yersinia pseudotuberculosis IP 32953
179

Appendix G
Gene Names and their Corresponding
Crystal Structures
Table G.1: Gene names and their corresponding crystal structures. The crystal structures have beenidentified in gamma-3-proteobacteria.
Name locusTag PDB structure Name locusTag PDB structurethrA b0002 2J0X:A thrC b0004 1VB3:AtalB b0008 1UCW:A mog b0009 1DI7:AdnaK b0014 1DKG:D dnaJ b0015 1EXK:AnhaA b0019 1ZCD:A rpsT b0023 1VS7:TdapB b0031 1DRW:A carA b0032 1KEE:HcarB b0033 1KEE:G caiB b0038 1XA4:AfolA b0048 1DDS:A apaH b0049 2DFJ:AksgA b0051 1QYR:A pdxA b0052 1PTM:AsurA b0053 1M5Y:A rluA b0058 2I82:ApolB b0060 1Q8I:A araD b0061 1JDI:FaraA b0062 2HXG:A araC b0064 2AAC:AtbpA b0068 2QRY:A leuB b0073 1CM7:AilvI b0077 2PAN:A ilvH b0078 2F1F:BfruR b0080 2IKS:A murE b0085 1E8C:AmurF b0086 1GG4:A murD b0088 4UAG:AmurG b0090 1NLM:A murC b0091 2F00:AddlB b0092 2DLN:A ftsQ b0093 2VH1:AftsZ b0095 1F47:A secA b0098 1TM6:AmutT b0099 1TUM:A yacG b0101 1LV3:AcoaE b0103 1T3H:A nadC b0109 1QAP:AaceE b0114 2G67:A aceF b0115 1QJO:Alpd b0116 1GEU:A acnB b0118 1L5J:A
180

Appendix G. Gene Names and their Corresponding Crystal Structures
cueO b0123 2FQG:A hpt b0125 1GRV:Acan b0126 2ESF:A panD b0131 1PPY:ApanC b0133 1IHO:A panB b0134 1M3U:AfolK b0142 2F65:A yadB b0144 1NZJ:AdksA b0145 1TJL:J fhuA b0150 1BY5:AfhuD b0152 1K2V:N clcA b0155 2EXY:AbtuF b0158 1N4D:A mtn b0159 1Z5P:AdegP b0161 1KY9:A dapD b0166 3BXY:Amap b0168 2EVO:A rpsB b0169 1VS7:Btsf b0170 1EFU:B pyrH b0171 2BNF:Bfrr b0172 1ZN1:A dxr b0173 1ONP:AispU b0174 1X07:A bamA b0177 2QDF:Askp b0178 1U2M:A lpxA b0181 2AQ9:AdnaE b0184 2HQA:A accA b0185 2F9Y:AtilS b0188 1NI5:A rof b0189 1SG5:AyaeQ b0190 3C0U:A nlpE b0192 2Z4I:AgmhB b0200 2GMW:A mltD b0211 1E0G:AgloB b0212 2QED:A rnhA b0214 2RN2:AdnaQ b0215 2IDO:C ivy b0220 1XS0:AlpcA b0222 2I22:A dinB b0231 1UNN:Cgpt b0238 1NUL:A phoE b0241 1PHO:AproB b0242 2J5V:A yahK b0325 1UUF:AprpR b0330 2PJU:A prpB b0331 1OQF:AprpD b0334 1SZQ:A codA b0337 1K70:AcynR b0338 2HXR:A cynS b0340 1DWK:AlacY b0343 2V8N:A lacZ b0344 1JZ2:AlacI b0345 1LBI:A mhpC b0349 1U2E:AmhpD b0350 1SV6:A tauD b0368 1OTJ:AhemB b0369 1L6Y:B ddlA b0381 2DLN:AphoA b0383 1Y6V:B rdgC b0393 2OWL:AphoB b0399 1B00:A yajC b0407 2RDD:Btsx b0411 1TLZ:A yajI b0412 2JWY:AribD b0414 2OBC:A nusB b0416 1EY1:Adxs b0420 2O1S:D ispA b0421 1RQI:ByajL b0424 2AB0:A panE b0425 1YON:AcyoD b0429 1FFT:G cyoC b0430 1FFT:HcyoB b0431 1FFT:F cyoA b0432 1FFT:GbolA b0435 2DHM:A tig b0436 1W26:AclpP b0437 2FZS:M clpX b0438 1OVX:Alon b0439 1RRE:A hupB b0440 2O97:BybaW b0443 1NJK:A queC b0444 2PG3:AmdlA b0448 3B5W:A mdlB b0449 3B5W:AglnK b0450 2NUU:L amtB b0451 2NS1:AtesB b0452 1C8U:A ybaA b0456 2OKQ:Amaa b0459 1OCX:A hha b0460 1JW2:A
181

Appendix G. Gene Names and their Corresponding Crystal Structures
acrB b0462 2RDD:A acrA b0463 2F1M:AacrR b0464 3BCG:A apt b0469 2DY0:AdnaX b0470 1XXH:I ybaB b0471 1PUG:AhtpG b0473 2IOQ:A adk b0474 4AKE:AushA b0480 2USH:B ybaK b0481 2DXA:AybaQ b0483 2EBY:A ybaS b0485 1U60:AcueR b0487 1Q07:A tesA b0494 1U8U:AallA b0505 1XSQ:A allR b0506 1TF1:Agcl b0507 2PAN:A glxR b0509 1YB4:AylbA b0515 1RC6:A allC b0516 2IMO:AallD b0517 1XRH:A purK b0522 1B6S:DpurE b0523 2ATE:A ppiB b0525 2NUL:AcysS b0526 1LI7:A ybcJ b0528 1P9K:AfolD b0529 1B0A:A emrE b0543 2I68:AybcL b0545 1FUX:A rusA b0550 1Q8R:AompT b0565 1I78:A cusF b0573 2VB3:XybdK b0581 1R8G:A fepA b0584 1FEP:Afes b0585 2B20:A entB b0595 2FQ1:BentA b0596 2FWM:X ybdB b0597 1VH9:AybdL b0600 1U08:A dsbG b0604 1V58:AahpC b0605 1YEP:E ahpF b0606 1FL2:Arna b0611 2PQY:A pagP b0622 1THQ:AybeD b0631 1RWU:A dacA b0632 1Z6F:AybeA b0636 1NS5:A nadD b0639 1K4M:AholA b0640 1XXI:F leuS b0642 2AJI:ArihA b0651 1YOE:A ybeY b0659 1XM5:AasnB b0674 1CT9:A nagD b0675 2C4N:AnagA b0677 1YRR:A nagB b0678 1HOT:AglnS b0680 1O0C:A fur b0683 2FU4:BfldA b0684 1AHN:A ybfF b0686 3BF8:AseqA b0687 1LRR:A pgm b0688 2FUV:AkdpE b0694 1ZH4:A kdpB b0697 2A29:Aphr b0708 1DNP:A ybgI b0710 1NMP:FybgL b0713 1XW8:A nei b0714 1Q39:AgltA b0720 1OWC:A sdhC b0721 2ACZ:CsdhD b0722 2ACZ:D sdhA b0723 2ACZ:AsdhB b0724 2ACZ:B sucA b0726 2JGD:BsucB b0727 1SCZ:A sucC b0728 2SCU:BsucD b0729 2SCU:A ybgC b0736 1S5U:AtolA b0739 1TOL:A tolB b0740 2IVZ:Dpal b0741 1OAP:A aroG b0754 1QR7:DgpmA b0755 1E59:A galT b0758 1HXQ:AgalE b0759 2UDP:A modE b0761 1O7L:DmodA b0763 1WOD:A pgl b0767 1RI6:AybhB b0773 1FJJ:A bioA b0774 1QJ5:A
182

Appendix G. Gene Names and their Corresponding Crystal Structures
bioB b0775 1R30:A bioF b0776 2G6W:AbioD b0778 1DBS:A uvrB b0779 1QOJ:AmoaB b0782 1MKZ:B moaC b0783 1EKR:AmoaD b0784 3BII:D moaE b0785 1NVI:EybiH b0796 1T33:A ybiA b0798 2B3W:AybiC b0801 2G8Y:B glnH b0811 1WDN:Adps b0812 1F33:A ompX b0814 1QJ9:AmntR b0817 2H09:A ybiU b0821 2DBN:AybiV b0822 1RLT:D fsaA b0825 1L6W:JmoeB b0826 1JWB:B moeA b0827 1G8R:BiaaA b0828 3C17:A gsiB b0830 1UQW:ByliI b0837 2G8S:A grxA b0849 1EGR:ApotF b0854 1A99:A ybjQ b0866 1Y2I:AamiD b0867 2BH7:A aqpZ b0875 2ABM:AclpS b0881 1R6Q:D clpA b0882 1R6B:XinfA b0884 1AH9:A aat b0885 2DPT:AtrxB b0888 1CL0:A ftsK b0890 2IUS:AlolA b0891 1UA8:A ycaC b0897 1YAC:ApflB b0903 3PFL:A serC b0907 1BJO:AaroA b0908 2AAY:A cmk b0910 2CMK:ArpsA b0911 2BH8:A ihfB b0912 1OWG:BmsbA b0914 3B5W:A kdsB b0918 1VH1:AmukF b0922 1T98:A mukB b0924 1QHL:AaspC b0928 1X2A:A pepN b0932 2DQM:AssuD b0935 1NQK:A pyrD b0945 1F76:EfabA b0954 1MKB:A ompA b0957 2GE4:AmgsA b0963 1IK4:F hspQ b0966 1VBV:AyccX b0968 2GV1:A hyaE b0976 2HFD:AappA b0980 1DKL:A torR b0995 1ZGZ:Aagp b1002 1NT4:A wrbA b1004 3B6M:ArutR b1013 1PB6:A putA b1014 1K87:AycdX b1034 1PB0:C ymdB b1045 1SPV:AmdoG b1048 1TXK:A yceI b1056 1Y0G:AdinI b1061 1GHH:A pyrC b1062 1J79:AgrxB b1064 1G7O:A yceM b1068 1TLT:AflgE b1076 2BGZ:A flgK b1082 2D4Y:AflgL b1083 2D4X:A rne b1084 2C4R:LrluC b1086 1XPI:A rpmF b1089 1VS8:0fabH b1091 1MZS:A fabD b1092 1MLA:AfabG b1093 1Q7B:D acpP b1094 1L0H:AfabF b1095 1KAS:A pabC b1096 1I2L:AyceG b1097 2R1F:B tmk b1098 5TMP:AholB b1099 1XXI:J ycfH b1100 1YIX:AptsG b1101 1O2F:B mfd b1114 2EYQ:AnagK b1119 2AP1:A cobB b1120 1S5P:A
183

Appendix G. Gene Names and their Corresponding Crystal Structures
potD b1123 1POT:A pepT b1127 1VIX:BphoQ b1129 1ID0:A phoP b1130 2PL1:ApurB b1131 2PTS:A hflD b1132 1SDI:AmnmA b1133 2DER:B rluE b1135 2OLW:Aicd b1136 9ICD:A ariR b1166 2OXL:AminE b1174 1EV0:A ycgL b1179 2H7A:AycgM b1180 1NR9:A umuD b1183 1I4V:AdsbB b1185 2HI7:B fadR b1187 1HW2:AtreA b1197 2JG0:A dhaL b1199 2BTD:AdhaK b1200 1UOD:A pth b1204 2PTH:AispE b1208 1OJ4:A lolB b1209 1IWN:AprfA b1211 2B3T:B prmC b1212 1T43:AkdsA b1215 1X8F:A chaB b1217 1SG7:AychN b1219 1JX7:A narL b1221 1RNL:AnarG b1224 1Q16:A narH b1225 1Y5N:BnarI b1227 1Y4Z:C galU b1236 2E3D:AoppA b1243 2Z23:A kch b1250 1ID1:AtonB b1252 1XX3:A ompW b1256 2F1V:AyciF b1258 2GS4:A trpA b1260 1WQ5:BtrpB b1261 2DH6:A trpC b1262 1PII:AtrpD b1263 1I1Q:B trpE b1264 1K0G:AyciO b1267 1KK9:A btuR b1270 1G64:AtopA b1274 1CY8:A ribA b1277 2BZ1:ApyrF b1281 1L2U:A yciH b1282 1D1R:Arnb b1286 2ID0:A fabI b1288 1QSG:ApspF b1303 2C99:A tpx b1324 1QXH:AycjG b1325 1JPD:X paaI b1396 1PSU:AazoR b1412 1TIK:A ydcF b1414 3CA8:AaldA b1415 2IMP:A rimL b1427 1Z9U:AydcK b1428 2PIG:A tehB b1430 2I6G:BydcW b1444 1WND:A nhoA b1463 1E2T:HyddE b1464 1QYA:A fdnG b1474 1KQG:AfdnH b1475 1KQG:B fdnI b1476 1KQG:CyddM b1477 2ICT:A osmC b1482 1NYE:Ados b1489 1VB6:A lsrG b1518 2GFF:AmarR b1530 1JGS:A marA b1531 1XS9:Adcp b1538 1Y79:1 dmsD b1591 1S9U:AdgsA b1594 1Z6R:A pntB b1602 2BRU:CpntA b1603 2BRU:A tus b1610 2I06:AfumC b1611 1YFE:A hdhA b1619 1FMC:AmalY b1622 1D2F:A nth b1633 2ABK:Agst b1635 1N2A:A pdxY b1636 1TD2:AtyrS b1637 1X8X:A pdxH b1638 1WV4:AydhA b1639 2F09:A sodC b1646 1ESO:AydhF b1647 1UR3:M gloA b1651 1FA8:A
184
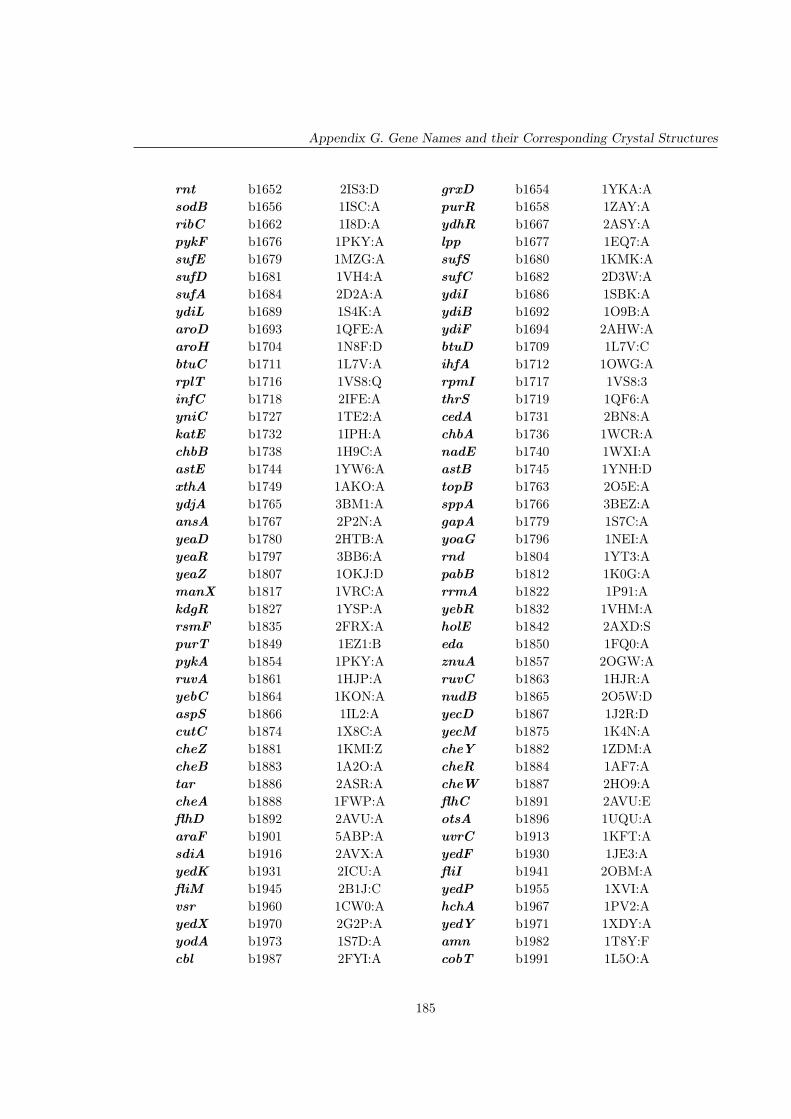
Appendix G. Gene Names and their Corresponding Crystal Structures
rnt b1652 2IS3:D grxD b1654 1YKA:AsodB b1656 1ISC:A purR b1658 1ZAY:AribC b1662 1I8D:A ydhR b1667 2ASY:ApykF b1676 1PKY:A lpp b1677 1EQ7:AsufE b1679 1MZG:A sufS b1680 1KMK:AsufD b1681 1VH4:A sufC b1682 2D3W:AsufA b1684 2D2A:A ydiI b1686 1SBK:AydiL b1689 1S4K:A ydiB b1692 1O9B:AaroD b1693 1QFE:A ydiF b1694 2AHW:AaroH b1704 1N8F:D btuD b1709 1L7V:CbtuC b1711 1L7V:A ihfA b1712 1OWG:ArplT b1716 1VS8:Q rpmI b1717 1VS8:3infC b1718 2IFE:A thrS b1719 1QF6:AyniC b1727 1TE2:A cedA b1731 2BN8:AkatE b1732 1IPH:A chbA b1736 1WCR:AchbB b1738 1H9C:A nadE b1740 1WXI:AastE b1744 1YW6:A astB b1745 1YNH:DxthA b1749 1AKO:A topB b1763 2O5E:AydjA b1765 3BM1:A sppA b1766 3BEZ:AansA b1767 2P2N:A gapA b1779 1S7C:AyeaD b1780 2HTB:A yoaG b1796 1NEI:AyeaR b1797 3BB6:A rnd b1804 1YT3:AyeaZ b1807 1OKJ:D pabB b1812 1K0G:AmanX b1817 1VRC:A rrmA b1822 1P91:AkdgR b1827 1YSP:A yebR b1832 1VHM:ArsmF b1835 2FRX:A holE b1842 2AXD:SpurT b1849 1EZ1:B eda b1850 1FQ0:ApykA b1854 1PKY:A znuA b1857 2OGW:AruvA b1861 1HJP:A ruvC b1863 1HJR:AyebC b1864 1KON:A nudB b1865 2O5W:DaspS b1866 1IL2:A yecD b1867 1J2R:DcutC b1874 1X8C:A yecM b1875 1K4N:AcheZ b1881 1KMI:Z cheY b1882 1ZDM:AcheB b1883 1A2O:A cheR b1884 1AF7:Atar b1886 2ASR:A cheW b1887 2HO9:AcheA b1888 1FWP:A flhC b1891 2AVU:EflhD b1892 2AVU:A otsA b1896 1UQU:AaraF b1901 5ABP:A uvrC b1913 1KFT:AsdiA b1916 2AVX:A yedF b1930 1JE3:AyedK b1931 2ICU:A fliI b1941 2OBM:AfliM b1945 2B1J:C yedP b1955 1XVI:Avsr b1960 1CW0:A hchA b1967 1PV2:AyedX b1970 2G2P:A yedY b1971 1XDY:AyodA b1973 1S7D:A amn b1982 1T8Y:Fcbl b1987 2FYI:A cobT b1991 1L5O:A
185

Appendix G. Gene Names and their Corresponding Crystal Structures
cobU b1993 1CBU:A sbmC b2009 1JYH:AsbcB b2011 1FXX:A yefM b2017 2A6Q:AhisG b2019 1Q1K:A hisD b2020 1KAR:AhisC b2021 1IJI:A hisB b2022 2FPX:Acld b2027 3B8P:A rfbC b2038 1DZT:BrfbA b2039 1H5T:D rfbD b2040 1N2S:ArfbB b2041 1KEW:A gmm b2051 2GT2:Afcl b2052 1GFS:A gmd b2053 1DB3:Awzb b2061 2FEK:A dcd b2065 1XS1:FalkA b2068 1PVS:A yegS b2086 2BON:AgatB b2093 1TVM:A gatZ b2095 2FIQ:AthiD b2103 1JXI:A metG b2114 1F4L:AyehR b2123 2JOE:A dld b2133 1F0X:Acdd b2143 1CTU:A mglB b2150 2GBP:AfolE b2153 1GTP:T cirA b2155 2HDI:Anfo b2159 1QUM:A rihB b2162 3B9X:Dspr b2175 2K1G:A rsuA b2183 1KSV:ArplY b2185 487D:N yejL b2187 2JRX:AccmG b2195 2B1K:A ccmE b2197 1SR3:AnapA b2206 2NYA:A napD b2207 2JSX:Aeco b2209 1N8O:E alkB b2212 2FDK:Aada b2213 1SFE:A apbE b2214 2O18:AompC b2215 2J4U:P rcsD b2216 1SR2:ArcsC b2218 2AYX:A atoD b2221 1K6D:AgyrA b2231 1AB4:A nrdA b2234 3R1R:AnrdB b2235 1XIK:B glpQ b2239 1YDY:AglpT b2240 1PW4:A yfaW b2247 2I5Q:AarnB b2253 1MDZ:A arnA b2255 1Z7E:FpmrD b2259 2JSO:A menC b2261 1FHU:AmenF b2265 2EUA:A rbn b2268 2CBN:AyfbR b2291 2PAQ:A pta b2297 1VMI:AyfcD b2299 2FKB:C yfcE b2300 1SU1:DyfcF b2301 3BBY:A folX b2303 1B9L:AhisP b2306 1B0U:A hisJ b2309 1HSL:AargT b2310 2LAO:A ubiX b2311 1SBZ:ApurF b2312 1ECJ:A folC b2315 1W7K:AaccD b2316 2F9Y:B truA b2318 1DJ0:AfabB b2323 2BUI:D mnmC b2324 2QY6:AmepA b2328 1U10:F sixA b2340 1UJC:AfadL b2344 1T1L:A frc b2374 1PT8:Aglk b2388 1SZ2:A gltX b2400 1NZJ:AxapA b2407 1YR3:F ligA b2411 2OWO:AzipA b2412 1F7X:A cysK b2414 2BHT:AptsH b2415 3EZE:B ptsI b2416 2HWG:Acrr b2417 2F3G:A pdxK b2418 2DDW:A
186

Appendix G. Gene Names and their Corresponding Crystal Structures
cysM b2421 2BHS:A cysA b2422 2AWO:AyfeY b2432 2QZB:A ypeA b2434 2PDO:HeutN b2456 2Z9H:F eutD b2458 1VMI:AeutQ b2460 2PYT:A talA b2464 1UCW:AnudK b2467 1VIU:A purC b2476 2GQS:BdapA b2478 1YXD:A upp b2498 2EHJ:ApurM b2499 1CLI:A purN b2500 1JKX:Appk b2501 1XDP:A ppx b2502 1U6Z:AguaA b2507 1GPM:D yfgJ b2510 2JRP:AhisS b2514 1KMN:D ndk b2518 2HUR:FsseA b2521 1URH:A iscX b2524 2BZT:Afdx b2525 1I7H:A hscA b2526 1U00:AhscB b2527 1FPO:A iscA b2528 1S98:AiscS b2530 1P3W:B suhB b2533 2QFL:AglyA b2551 1DFO:D hmp b2552 1GVH:AglnB b2553 2PII:A purL b2557 1T3T:AtadA b2559 1Z3A:A pdxJ b2564 1M5W:Hera b2566 1X1L:X lepB b2568 1T7D:AlepA b2569 3CB4:D rseB b2571 2V43:ArseA b2572 1OR7:C rpoE b2573 1OR7:AnadB b2574 1CHU:A ung b2580 1UUG:AclpB b2592 1JBK:A yfiH b2593 1Z9T:ArluD b2594 1QYU:A raiA b2597 1N3G:ApheA b2599 1ECM:A aroF b2601 1QR7:DrplS b2606 1VS8:P trmD b2607 1P9P:ArpsP b2609 2AW7:P !h b2610 1HQ1:AgrpE b2614 1DKG:A nadK b2615 2AN1:AcsiD b2659 1JR7:A gabT b2662 1SFF:AygaC b2671 2G7J:A nrdH b2673 1H75:AnrdE b2675 2BQ1:E nrdF b2676 2R2F:AproX b2679 1R9Q:A gshA b2688 2D33:AcsrA b2696 1Y00:A mltB b2701 1QUT:AhypF b2712 1GXT:A ascG b2714 3BRQ:AhycI b2717 2I8L:A hypC b2728 2OT2:AmutS b2733 1W7A:A ygbM b2739 1K77:AtruD b2745 1SZW:A ispF b2746 1H48:AispD b2747 1INJ:A cysH b2762 1SUR:AcysI b2763 8GEP:A cysJ b2764 1DDI:Aeno b2779 2FYM:A pyrG b2780 2AD5:ArumA b2785 2BH2:A gudD b2787 1ECQ:DyqcC b2792 2HGK:A fucO b2799 1RRM:AfucA b2800 4FUA:A fucI b2802 1FUI:AygdI b2809 2RA2:A csdE b2811 1NI7:AmltA b2813 2GAE:A recD b2819 1W36:DrecB b2820 1W36:B ptrA b2821 1Q2L:A
187

Appendix G. Gene Names and their Corresponding Crystal Structures
recC b2822 1W36:C thyA b2827 3TMS:AmutH b2831 2AZO:A ygdR b2833 2JN0:Atas b2834 1LQA:A lysA b2838 1KO0:AkduI b2843 1X8M:A idi b2889 2VNQ:AlysS b2890 1BBW:A prfB b2891 1ML5:ZdsbC b2893 1TJD:A xerD b2894 1A0P:AygfY b2897 1X6J:A ygfZ b2898 1VLY:AyqfB b2900 1TE7:A gcvT b2905 1VLO:ApepP b2908 2BN7:A serA b2913 1YBA:DrpiA b2914 1O8B:A mscS b2924 2OAU:AfbaA b2925 1ZEN:A pgk b2926 1ZMR:AyggD b2929 3C8G:A cmtB b2934 2OQ3:AtktA b2935 1QGD:A metK b2942 1XRC:AgshB b2947 2GLT:A yqgF b2949 1OVQ:AyggS b2951 1W8G:A yggU b2953 1YH5:ArdgB b2954 1K7K:A ansB b2957 3ECA:AmutY b2961 1MUY:A yggX b2962 1YHD:AglcB b2976 1Y8B:A gsp b2988 2IOB:AhybD b2993 1CFZ:F exbD b3005 2PFU:AmetC b3008 1CL2:A yqhD b3011 1OJ7:DdkgA b3012 1MZR:A parC b3019 1ZVU:AygiW b3024 1NNX:A mdaB b3028 2B3D:AygiN b3029 1TUV:A parE b3030 1S16:AnudF b3034 1KHZ:A tolC b3035 1TQQ:AygiD b3039 2PW6:A ribB b3041 1IEZ:AglgS b3049 1RRZ:A glnE b3053 1V4A:AfolB b3058 2O90:A rpsU b3065 2AW7:UdnaG b3066 1DDE:A rpoD b3067 1SIG:Amug b3068 1MWJ:A ygjH b3074 1PXF:AfadH b3081 1PS9:A tdcF b3113 2UYP:AtdcD b3115 2E20:A tdcB b3117 2GN2:AgarR b3125 1VPD:A garL b3126 1DXF:AagaS b3136 3C3J:A kbaY b3137 1GVF:BdiaA b3149 2YVA:A yhbO b3153 1OI4:AnlpI b3163 1XNF:A pnp b3164 1SRO:ArpsO b3165 2AW7:O truB b3166 1R3F:ArbfA b3167 1KKG:A infB b3168 1ZO1:InusA b3169 1U9L:A argG b3172 1KP3:AsecG b3175 2AKI:X folP b3177 1AJZ:AhflB b3178 1LV7:A rrmJ b3179 1EJ0:AyhbY b3180 1LN4:A greA b3181 1GRJ:AdacB b3182 2EXB:A rpmA b3185 1VS8:WrplU b3186 2AWB:R murA b3189 1UAE:AyrbA b3190 1NY8:A lptA b3200 2R1A:HptsN b3204 1A6J:A elbB b3209 1OY1:A
188

Appendix G. Gene Names and their Corresponding Crystal Structures
arcB b3210 2A0B:A nanK b3222 2AA4:AnanA b3225 1HL2:A sspB b3228 1YFN:ArpsI b3230 1VS7:I rplM b3231 2AWB:JdegQ b3234 1KY9:A degS b3235 1TE0:Amdh b3236 2PWZ:A argR b3237 1AOY:AyhcO b3239 2CX6:A yhdH b3253 1O8C:AaccB b3255 1A6X:A accC b3256 1DV1:Afis b3261 3FIS:A aroE b3281 1NYT:DrimN b3282 1HRU:A def b3287 1XEO:Afmt b3288 2FMT:A zntR b3292 1Q0A:ArplQ b3294 2AWB:N rpoA b3295 1BDF:ArpsD b3296 1VS7:D rpsK b3297 1VS7:KrpsM b3298 1VS7:M rpmJ b3299 2AWB:4secY b3300 2AKI:Y rplO b3301 2AWB:LrpmD b3302 1VS8:Y rpsE b3303 1VS7:ErplR b3304 2AWB:O rplF b3305 1VS8:GrpsH b3306 1VS7:H rpsN b3307 1VS7:NrplE b3308 1VS8:F rplX b3309 1VS8:UrplN b3310 2AWB:K rpsQ b3311 1VS7:QrpmC b3312 2AWB:X rplP b3313 2AWB:MrpsC b3314 1VS7:C rplV b3315 2AWB:SrpsS b3316 1VS7:S rplB b3317 2AWB:CrplW b3318 2AWB:T rplD b3319 2AWB:ErplC b3320 2AWB:D rpsJ b3321 2AW7:Jbfr b3336 2HTN:A tufA b3339 2FX3:AfusA b3340 1JQM:B rpsG b3341 1VS7:GrpsL b3342 1VS7:L yheL b3343 2D1P:CyheM b3344 2D1P:B yheN b3345 2D1P:AfkpA b3347 1Q6I:A yhfA b3356 1ML8:Acrp b3357 2CGP:A argD b3359 1SFF:AppiA b3363 1CLH:A nirD b3366 2JO6:AcysG b3368 1PJS:A php b3379 1BF6:AyhfZ b3383 2OZZ:A dam b3387 2ORE:DaroK b3390 1KAG:A nudE b3397 1VHZ:AhslR b3400 1DM9:A hslO b3401 1I7F:Apck b3403 1AYL:A envZ b3404 1BXD:AompR b3405 1ODD:A feoA b3408 2GCX:AfeoC b3410 1XN7:A bioH b3412 1M33:AmalP b3417 1QM5:A malT b3418 1HZ4:AglpG b3424 2NRF:A glpE b3425 1GN0:AglpD b3426 2R4E:A glgB b3432 1M7X:Aasd b3433 1GL3:A gntK b3437 1KOF:AyhhW b3439 1TQ5:A ggt b3447 2E0W:AlivK b3458 1USK:A livJ b3460 1Z18:AftsY b3464 1FTS:A rsmD b3465 2FPO:F
189

Appendix G. Gene Names and their Corresponding Crystal Structures
zntA b3469 1MWZ:A sirA b3470 1DCJ:AnikA b3476 1ZLQ:A nikR b3481 2HZV:AyhiQ b3497 2PGX:A prlC b3498 1Y79:1gor b3500 1GET:A hdeA b3510 1DJ8:AgadA b3517 1XEY:A dppA b3544 1DPP:Atag b3549 1P7M:A cspA b3556 3MEF:AxylB b3564 2NLX:A yiaJ b3574 1YSQ:AyiaK b3575 1S20:H selB b3590 2PJP:AmtlA b3599 1J6T:A cysE b3607 1T3D:AsecB b3609 1QYN:A grxC b3610 1FOV:Akbl b3617 1FC4:A rfaD b3619 1EQ2:ArfaF b3620 1PSW:A rfaC b3621 2H1H:ArfaG b3631 2IW1:A coaD b3634 1H1T:AmutM b3635 1K82:D rpmG b3636 1VS8:1rpmB b3637 2Z4N:Z dfp b3639 1U80:Adut b3640 1SEH:A pyrE b3642 1ORO:Agmk b3648 2F3T:A yicI b3656 1XSK:AemrD b3673 2GFP:A yidA b3697 1RKQ:AyidB b3698 1Z67:A gyrB b3699 1EI1:AdnaN b3701 2POL:A dnaA b3702 1J1V:ArpmH b3703 2AWB:2 yidC b3705 3BLC:AmnmE b3706 1RFL:A tnaA b3708 2C44:DpstS b3728 2ABH:A glmS b3729 2J6H:AglmU b3730 1HV9:A atpC b3731 1FS0:EatpG b3733 1FS0:G atpA b3734 2A7U:AatpH b3735 2A7U:B atpF b3736 1L2P:AatpE b3737 1QO1:O atpB b3738 1C17:MgidB b3740 1JSX:A mnmG b3741 3CP2:AmioC b3742 2HNB:A asnC b3743 2CG4:AasnA b3744 12AS:A rbsB b3751 2DRI:ArbsK b3752 1RKS:A ilvE b3770 1IYE:AilvA b3772 1TDJ:A ilvC b3774 1YRL:DppiC b3775 1JNT:A rep b3778 1UAA:AtrxA b3781 2TRX:A rho b3783 1PVO:Fr!E b3786 1F6D:D r!G b3788 1BXK:Ar!H b3789 1MC3:A hemC b3805 2YPN:AcyaY b3807 1SOY:A pldA b3821 1QD5:ArecQ b3822 1OYY:A udp b3831 1T0U:ArfaH b3842 2OUG:A ubiD b3843 2IDB:AyigZ b3848 1VI7:A mobB b3856 1NP6:AmobA b3857 1FRW:A rdoA b3859 1ZYL:AdsbA b3860 1FVK:A polA b3863 1KFD:AyihA b3865 1PUI:A hemN b3867 1OLT:AglnG b3868 1NTR:A glnL b3869 1R62:AglnA b3870 2GLS:A yihS b3880 2AFA:A
190

Appendix G. Gene Names and their Corresponding Crystal Structures
yihT b3881 1TO3:A yihX b3885 2B0C:Adtd b3887 1JKE:D rhaM b3901 1X8D:ArhaD b3902 1GT7:M rhaA b3903 1DE6:DrhaB b3904 2CGL:A sodA b3908 1VEW:DyiiM b3910 1O67:A fieF b3915 2QFI:ApfkA b3916 2PFK:A sbp b3917 1SBP:Acdh b3918 2POF:A tpiA b3919 1TRE:Afpr b3924 1FDR:A glpX b3925 1NI9:AglpK b3926 1GLF:X glpF b3927 1LDI:AyiiU b3928 2JEE:A rraA b3929 1Q5X:AhslU b3931 1YYF:A hslV b3932 1HT2:LftsN b3933 1UTA:A priA b3935 2DWN:ArpmE b3936 2AWB:Z yiiX b3937 2IF6:AmetJ b3938 1CMC:A metB b3939 1CS1:AmetF b3941 1ZRQ:C katG b3942 1U2L:Appc b3956 1QB4:A argC b3958 2G17:AargB b3959 1OHB:A argH b3960 1TJ7:AoxyR b3961 1I6A:A btuB b3966 2YSU:AmurI b3967 2JFN:A murB b3972 1MBT:AbirA b3973 2EWN:A coaA b3974 1ESN:DtufB b3980 1DG1:G secE b3981 2AKI:ZrplK b3983 1VS8:I rplA b3984 487D:HrplL b3986 1RQV:A rpoC b3988 2AUK:AthiF b3992 1ZUD:1 rsd b3995 2P7V:AnudC b3996 2GB5:A hupA b4000 1MUL:AzraR b4004 1OJL:F purD b4005 1GSO:AaceA b4015 1IGW:A iclR b4018 2O9A:DmetH b4019 3BUL:A pepE b4021 1FYE:ArluF b4022 2GML:A lysC b4024 2J0X:AmalG b4032 2R6G:G malF b4033 2R6G:FmalE b4034 1Y4C:A malK b4035 2AWO:AlamB b4036 1MPQ:A ubiC b4039 1G1B:AyjbJ b4045 1RYK:A qor b4051 1QOR:AdnaB b4052 1B79:A tyrB b4054 3TAT:AaphA b4055 2G1A:A yjbR b4057 2FKI:Assb b4059 1EQQ:A soxR b4063 2ZHH:Aacs b4069 2P2F:A nrfA b4070 2RDZ:DnrfB b4071 2P0B:A nrfG b4076 2E2E:AfdhF b4079 2IV2:X rpiB b4090 1NN4:AphnH b4100 2FSU:A phnF b4102 2FA1:AproP b4111 1R48:A dcuS b4125 1OJG:AlysU b4129 1LYL:A dipZ b4136 1UC7:AcutA b4137 1NAQ:A aspA b4139 1JSW:AgroS b4142 2C7D:O groL b4143 2CGT:Mblc b4149 1QWD:A ampC b4150 3BLS:A
191

Appendix G. Gene Names and their Corresponding Crystal Structures
frdD b4151 3CIR:P frdC b4152 3CIR:OfrdB b4153 3CIR:N frdA b4154 1L0V:ArsgA b4161 2RCN:A orn b4162 1YTA:AmutL b4170 1B62:A hfq b4172 1HK9:ApurA b4177 1KJX:A rnr b4179 2ID0:ArlmB b4180 1GZ0:H ulaD b4196 1XBV:ArpsF b4200 2I2U:F priB b4201 1TXY:ArpsR b4202 1VS7:R rplI b4203 2AW4:HytfH b4212 1YYV:A msrA b4219 2GT3:AytfP b4222 1XHS:A ppa b4226 2EIP:Afbp b4232 2QVR:A treR b4241 1BYK:AyjgF b4243 1QU9:A pyrI b4244 2H3E:BpyrB b4245 1EKX:A yjgH b4248 1PF5:AargI b4254 1DUV:G holC b4259 1EM8:ApepA b4260 1GYT:L fecA b4291 1KMP:AnanM b4310 2UVK:A fimC b4316 3BWU:CfimD b4317 3BWU:D fimF b4318 2JMR:AfimG b4319 3BFW:A fimH b4320 1QUN:LiadA b4328 1POK:B hsdM b4349 2AR0:ByjiA b4352 1NIJ:A tsr b4355 2D4U:ArsmC b4371 2PJD:A holD b4372 1EM8:BrimI b4373 2CNT:D prfC b4375 2O0F:AyjjV b4378 1ZZM:A deoC b4381 1P1X:AdeoA b4382 2TPT:A deoD b4384 1PW7:AlplA b4386 1X2H:A slt b4392 1QTE:AtrpR b4393 3WRP:A yjjX b4394 1U5W:Hrob b4396 1D5Y:A thiS b4407 1ZUD:2rtcA b4475 1QMI:A dgoA b4477 2V82:AtatD b4483 1XWY:A yoeB b4539 2A6S:A
192

References
Abbot, P., & Moran, N. A. (2002). Extremely low levels of genetic polymorphism in endosym-
bionts (buchnera) of aphids (pemphigus). Molecular Ecology , 11 (12), 2649–2660.
Abhiman, S., & Sonnhammer, E. L. L. (2005). Large-scale prediction of function shift in protein
families with a focus on enzymatic function. Proteins, 60 (4), 758–768.
Akashi, H. (1994). Synonymous codon usage in drosophila melanogaster: natural selection and
translational accuracy. Genetics, 136 (3), 927–935.
Akman, L., Yamashita, A., Watanabe, H., Oshima, K., Shiba, T., Hattori, M., & Aksoy, S.
(2002). Genome sequence of the endocellular obligate symbiont of tsetse flies, wigglesworthia
glossinidia. Nature Genetics, 32 (3), 402–407.
Aksoy, S. (1995). Wigglesworthia gen. nov. and wigglesworthia glossinidia sp. nov., taxa con-
sisting of the mycetocyte-associated, primary endosymbionts of tsetse flies. International
Journal of Systematic Bacteriology , 45 (4), 848–851.
Aksoy, S., & Rio, R. V. M. (2005). Interactions among multiple genomes: tsetse, its symbionts
and trypanosomes. Insect Biochemistry and Molecular Biology, 35 (7), 691–698.
Alexander, C., & Hadley, G. (1985). Carbon movement between host and mycorrhizal endophyte
during the development of the orchid goodyera repens br. The New Phytologist , 101 (4), 657–
665.
Allen, M. (1991). The Ecology of Mycorrhizae. Cambridge University Press.
Altschul, S. F., Gish, W., Miller, W., Myers, E. W., & Lipman, D. J. (1990). Basic local
alignment search tool. Journal of Molecular Biology , 215 (3), 403–410.
Altschul, S. F., Madden, T. L., Scha!er, A. A., Zhang, J., Zhang, Z., Miller, W., & Lipman, D. J.
(1997). Gapped blast and psi-blast: a new generation of protein database search programs.
Nucleic Acids Research, 25 (17), 3389–3402.
193

REFERENCES
Andersson, J. O., & Andersson, S. G. (1999). Genome degradation is an ongoing process in
rickettsia. Molecular Biology and Evolution, 16 (9), 1178–1191.
Andersson, J. O., & Andersson, S. G. (2001). Pseudogenes, junk dna, and the dynamics of
rickettsia genomes. Molecular Biology and Evolution, 18 (5), 829–839.
Andersson, S. G., & Kurland, C. G. (1998). Reductive evolution of resident genomes. Trends in
Microbiology , 6 (7), 263–268.
Andersson, S. G., Zomorodipour, A., Andersson, J. O., Sicheritz-Ponten, T., Alsmark, U. C.,
Podowski, R. M., Naslund, A. K., Eriksson, A. S., Winkler, H. H., & Kurland, C. G.
(1998). The genome sequence of rickettsia prowazekii and the origin of mitochondria. Nature,
396 (6707), 133–140.
Arakawa, K., Kono, N., Yamada, Y., Mori, H., & Tomita, M. (2005). Kegg-based pathway
visualization tool for complex omics data. In Silico Biology , 5 (4), 419–423.
Bandi, C., Damiani, G., Magrassi, L., Grigolo, A., Fani, R., & Sacchi, L. (1994). Flavobacteria as
intracellular symbionts in cockroaches. Proceedings. Biological Sciences / The Royal Society,
257 (1348), 43–48.
Bandi, C., Sironi, M., Damiani, G., Magrassi, L., Nalepa, C. A., Laudani, U., & Sacchi, L. (1995).
The establishment of intracellular symbiosis in an ancestor of cockroaches and termites.
Proceedings. Biological Sciences / The Royal Society, 259 (1356), 293–299.
Bandi, C., Sironi, M., Nalepa, C. A., Corona, S., & Sacchi, L. (1997). Phylogenetically distant
intracellular symbionts in termites. Parassitologia, 39 (1), 71–75.
Baumann, P. (2005). Biology bacteriocyte-associated endosymbionts of plant sap-sucking insects.
Annual Review of Microbiology , 59 , 155–89.
Baumann, P., Baumann, L., Lai, C. Y., Rouhbakhsh, D., Moran, N. A., & Clark, M. A. (1995).
Genetics, physiology, and evolutionary relationships of the genus buchnera: intracellular
symbionts of aphids. Annual Review of Microbiology , 49 , 55–94.
Baumann, P., & Moran, N. A. (1997). Non-cultivable microorganisms from symbiotic associa-
tions of insects and other hosts. Antonie Van Leeuwenhoek , 72 (1), 39–48.
Beadle, B. M., & Shoichet, B. K. (2002). Structural bases of stability-function tradeo!s in
enzymes. Journal of Molecular Biology , 321 (2), 285–296.
Begon, M., Harper, J. L., & Townsend, C. R. (1990). Ecology : individuals, populations and
communities, (2nd ed. ed.). Blackwell Scientific. Michael Begon, John L. Harper, Colin R.
194

REFERENCES
Townsend.
Belda, E., Moya, A., & Silva, F. J. (2005). Genome rearrangement distances and gene order
phylogeny in gamma-proteobacteria. Molecular Biology and Evolution, 22 (6), 1456–1467.
Bensadia, F., Boudreault, S., Guay, J. F., Michaud, D., & Cloutier, C. (2006). Aphid clonal
resistance to a parasitoid fails under heat stress. Journal of Insect Physiology , 52 (2), 146–
57.
Berchtold, & M. Konig, H. (1996). hylogenetic position of the two uncultivated trichomonads
pentatrichomonoides scroa kirby and metadevescovina extranea kirby from the hindgut of
the termite mastotermes darwiniensis froggatt. Systematic and Applied Microbiology , 18 (4),
567–573.
Bigliardi, E., Selmi, M., Corona, S., Bandi, C., & Sacchi, L. (1995). Membrane systems in
endocytobiosis. iii: Ultrastructural features of symbionts and vacuolar membrane in bacteri-
ocytes of the wood-eating cockroach cry ptocercus punctulatus(dictyoptera, cryptocercidae).
Bollettino di Zoologia, 62 (3), 235–238.
Blackman, R., & Eastop, V. (1984). Aphids on the world’s crops an identification and informa-
tion guide.. Wiley Chichester, United Kingdom.
Blattner, F. R., Plunkett, r., G., Bloch, C. A., Perna, N. T., Burland, V., Riley, M., Collado-
Vides, J., Glasner, J. D., Rode, C. K., Mayhew, G. F., Gregor, J., Davis, N. W., Kirkpatrick,
H. A., Goeden, M. A., Rose, D. J., Mau, B., & Shao, Y. (1997). The complete genome
sequence of escherichia coli k-12. Science, 277 (5331), 1453–74.
Bloom, J. D., Labthavikul, S. T., Otey, C. R., & Arnold, F. H. (2006). Protein stability promotes
evolvability. Proceedings of the National Academy of Sciences of the United States of America,
103 (15), 5869–5874.
Bloom, J. D., Meyer, M. M., Meinhold, P., Otey, C. R., MacMillan, D., & Arnold, F. H. (2005).
Evolving strategies for enzyme engineering. Current Opinion in Structural Biology, 15 (4),
447–452.
Bloom, J. D., Raval, A., & Wilke, C. O. (2007). Thermodynamics of neutral protein evolution.
Genetics, 175 (1), 255–266.
Bolton, B. (1994). Identification guide to the ant genera of the world.
Borror, D., Triplehorn, C., & Johnson, N. (1989). An introduction to the study of insects.
195

REFERENCES
Boursaux-Eude, C., & Gross, R. (2000). New insights into symbiotic associations between ants
and bacteria. Research in Microbiology, 151 (7), 513–519.
Breeuwer, J. A., & Werren, J. H. (1990). Microorganisms associated with chromosome destruc-
tion and reproductive isolation between two insect species. Nature, 346 (6284), 558–560.
Bren, A., & Eisenbach, M. (1998). The n terminus of the flagellar switch protein, flim, is the
binding domain for the chemotactic response regulator, chey. Journal of Molecular Biology ,
278 (3), 507–514.
Brideau, N. J., Flores, H. A., Wang, J., Maheshwari, S., Wang, X., & Barbash, D. A. (2006). Two
dobzhansky-muller genes interact to cause hybrid lethality in drosophila. Science, 314 (5803),
1292–1295.
Brookfield, J. F. (2000). What determines the rate of sequence evolution? Current Biology ,
10 (11), R410–R0411.
Brown, J. K., Coats, S. A., Bedford, I. D., Markham, P. G., Bird, J., & Frohlich, D. R. (1995).
Characterization and distribution of esterase electromorphs in the whitefly, bemisia tabaci
(genn.) (homoptera: Aleyrodidae). Biochemical genetics, 33 (7-8), 205–214.
Brown, P. N., Mathews, M. A. A., Joss, L. A., Hill, C. P., & Blair, D. F. (2005). Crystal structure
of the flagellar rotor protein flin from thermotoga maritima. Journal of Bacteriology , 187 (8),
2890–2902.
Brynnel, E. U., Kurland, C. G., Moran, N. A., & Andersson, S. G. (1998). Evolutionary rates
for tuf genes in endosymbionts of aphids. Molecular Biology and Evolution, 15 (5), 574–582.
Buades, C., Michelena, J. M., Latorre, A., & Moya, A. (1999). Accelerated evolution in bacterial
endosymbionts of aphids. International Microbiology , 2 (1), 11–14.
Buchner, P. (1965). Endosymbiosis of animals with plant microorganisms. New York ; London:
Interscience Publishers. 8vo. Revised translation, by B. Mueller, of "Endosymbiose der Tiere
mit pflanzlichen Mikroorganismen", Basel, Stuttgart, 1953. Bibliog. (51p).
Butterfoss, G. L., & Kuhlman, B. (2006). Computer-based design of novel protein structures.
Annual Review of Biophysics and Biomolecular Structure, 35 , 49–65.
Campbell, B., & Dreyer, D. (1985). Host-plant resistance of sorghum: Di!erential hydrolysis
of sorghum pectic substances by polysaccharases of greenbug biotypes(schizaphis graminum,
homoptera: Aphididae). Archives of Insect Biochemistry and Physiology, 2 (2), 203–215.
196
REFERENCES
Campbell, N. A. (1990). Biology , (2nd ed. ed.). Redwood City, Calif.: Benjamin/Cummings
Pub. Co. Neil A. Campbell.
Camps, M., Herman, A., Loh, E., & Loeb, L. A. (2007). Genetic constraints on protein evolution.
Critical Reviews in Biochemistry and Molecular Biology, 42 (5), 313–326.
Canback, B., Tamas, I., & Andersson, S. G. E. (2004). A phylogenomic study of endosymbiotic
bacteria. Molecular Biology and Evolution, 21 (6), 1110–1122.
Celamkoti, S., Kundeti, S., Purkayastha, A., Mazumder, R., Buck, C., & Seto, D. (2004).
Geneorder3.0: software for comparing the order of genes in pairs of small bacterial genomes.
BMC Bioinformatics, 5 , 52.
Chadsey, M. S., Karlinsey, J. E., & Hughes, K. T. (1998). The flagellar anti-sigma factor flgm
actively dissociates salmonella typhimurium sigma28 rna polymerase holoenzyme. Genes and
Development , 12 (19), 3123–3136.
Chamary, J. V., Parmley, J. L., & Hurst, L. D. (2006). Hearing silence: non-neutral evolution
at synonymous sites in mammals. Nature Reviews. Genetics, 7 (2), 98–108.
Chang, K. P., & Musgrave, A. J. (1973). Morphology, histochemistry, and ultrastructure of
mycetome and its rickettsial symbiotes in cimex lectularius l. Canadian Journal of Microbi-
ology , 19 (9), 1075–1081.
Charles, H., Heddi, A., Guillaud, J., Nardon, C., & Nardon, P. (1997). A molecular aspect of
symbiotic interactions between the weevil sitophilus oryzae and its endosymbiotic bacteria:
over-expression of a chaperonin. Biochemical and Biophysical Research Communications,
239 (3), 769–774.
Chen, D. Q., Campbell, B. C., & Purcell, A. H. (1996). A new rickettsia from a herbivorous
insect, the pea aphid acyrthosiphon pisum (harris). Current Microbiology , 33 (2), 123–128.
Chen, T., Abbey, K., Deng, W.-j., & Cheng, M.-c. (2005). The bioinformatics resource for oral
pathogens. Nucleic Acids Research, 33 (Web Server issue), W734–40.
Chen, X., Li, S., & Aksoy, S. (1999). Concordant evolution of a symbiont with its host insect
species: molecular phylogeny of genus glossina and its bacteriome-associated endosymbiont,
wigglesworthia glossinidia. Journal of Molecular Evolution, 48 (1), 49–58.
Cheng, Q., & Aksoy, S. (1999). Tissue tropism, transmission and expression of foreign genes in
vivo in midgut symbionts of tsetse flies. Insect Molecular Biology, 8 (1), 125–32.
197

REFERENCES
Choi, K., Ma, Y., Choi, J.-H., & Kim, S. (2005). Platcom: a platform for computational com-
parative genomics. Bioinformatics, 21 (10), 2514–2516.
Clark, A. G. (1994). Invasion and maintenance of a gene duplication. Proceedings of the National
Academy of Sciences of the United States of America, 91 (8), 2950–2954.
Clark, M. A., Baumann, L., & Baumann, P. (1998). Buchnera aphidicola (aphid endosymbiont)
contains genes encoding enzymes of histidine biosynthesis. Current Microbiology , 37 (5), 356–
358.
Clark, M. A., Baumann, L., Munson, M. A., Baumann, P., Campbell, B. C., Du!us, J. E.,
Osborne, L. S., & Moran, N. A. (1992). The eubacterial endosymbionts of whiteflies (ho-
moptera: Aleyrodoidea) constitute a lineage distinct from the endosymbionts of aphids and
mealybugs. Current Microbiology , 25 (2), 119–123.
Clark, M. A., Moran, N. A., & Baumann, P. (1999). Sequence evolution in bacterial endosym-
bionts having extreme base compositions. Molecular Biology and Evolution, 16 (11), 1586–
1598.
Clay, K. (1990). Fungal endophytes of grasses. Annual Review of Ecology and Systematics, 21 ,
275–297.
Cochran, D. (1985). Nitrogen excretion in cockroaches. Annual Reviews in Entomology , 30 (1),
29–49.
Curtis, H., & Barnes, N. S. (1989). Biology , (5th ed. ed.). New York, N.Y.: Worth Publishers.
Helena Curtis, N. Sue Barnes.
Dadd, R. (1985). Nutrition: organisms. Comprehensive Insect Physiology, Biochemistry and
Pharmacology , 4 , 313–390.
Dagan, T., Blekhman, R., & Graur, D. (2006). The "domino theory" of gene death: gradual
and mass gene extinction events in three lineages of obligate symbiotic bacterial pathogens.
Molecular Biology and Evolution, 23 (2), 310–316.
Dale, C., & Maudlin, I. (1999). Sodalis gen. nov. and sodalis glossinidius sp. nov., a mi-
croaerophilic secondary endosymbiont of the tsetse fly glossina morsitans morsitans. Inter-
national Journal of Systematic Bacteriology , 49 Pt 1 , 267–275.
Dale, C., & Moran, N. A. (2006). Molecular interactions between bacterial symbionts and their
hosts. Cell , 126 (3), 453–65.
198

REFERENCES
Darling, A. C. E., Mau, B., Blattner, F. R., & Perna, N. T. (2004). Mauve: multiple alignment
of conserved genomic sequence with rearrangements. Genome Research, 14 (7), 1394–1403.
Dasch, G. (1975). Morphological and molecular studies on intracellular bacterial symbiotes of
insects. Ph.D. thesis, Yale.
Dasch, G., Weiss, E., & Chang, K. (1984). Endosymbionts of insects. Bergey’s manual of sys-
tematic bacteriology , 1 , 811–833.
Davidson, D. (1997). The role of resource imbalances in the evolutionary ecology of tropical
arboreal ants. Biological Journal of the Linnean Society, 61 (2), 153–181.
Davidson, D. (1998). Resource discovery versus resource domination in ants: a functional mech-
anism for breaking the trade-o!. Ecological Entomology , 23 (4), 484–490.
Davidson, S. K., & Stahl, D. A. (2006). Transmission of nephridial bacteria of the earthworm
eisenia fetida. Applied and Environmental Microbiology , 72 (1), 769–75.
Degnan, P. H., Lazarus, A. B., Brock, C. D., & Wernegreen, J. J. (2004). Host-symbiont stability
and fast evolutionary rates in an ant-bacterium association: cospeciation of camponotus
species and their endosymbionts, candidatus blochmannia. Systematic Biology , 53 (1), 95–
110.
Degnan, P. H., Lazarus, A. B., & Wernegreen, J. J. (2005). Genome sequence of blochmannia
pennsylvanicus indicates parallel evolutionary trends among bacterial mutualists of insects.
Genome Research, 15 (8), 1023–33.
Degnan, P. H., & Moran, N. A. (2008). Evolutionary genetics of a defensive facultative symbiont
of insects: exchange of toxin-encoding bacteriophage. Molecular Ecology , 17 (3), 916–29.
Delmotte, F., Rispe, C., Schaber, J., Silva, F. J., & Moya, A. (2006). Tempo and mode of early
gene loss in endosymbiotic bacteria from insects. BMC Evolutionary Biology , 6 , 56.
Deluca, T. F., Wu, I.-H., Pu, J., Monaghan, T., Peshkin, L., Singh, S., & Wall, D. P. (2006).
Roundup: a multi-genome repository of orthologs and evolutionary distances. Bioinformat-
ics, 22 (16), 2044–2046.
DePristo, M. A., Weinreich, D. M., & Hartl, D. L. (2005). Missense meanderings in sequence
space: a biophysical view of protein evolution. Nature Reviews. Genetics, 6 (9), 678–687.
Des Marais, D. L., & Rausher, M. D. (2008). Escape from adaptive conflict after duplication in
an anthocyanin pathway gene. Nature, 454 (7205), 762–765.
199

REFERENCES
Dickerson, R. E. (1971). The structures of cytochrome c and the rates of molecular evolution.
Journal of Molecular Evolution, 1 (1), 26–45.
Dixon, A. (1973). Biology of Aphids. Edward Arnold London.
Dolling, W., & Plamer, J. (1991). Pameridea(hemiptera: Miridae): predaceous bugs specific to
the highly viscid plant genus roridula. Systematic entomology , 16 (3), 319–328.
Douglas, A. (1996). Reproductive failure and the free amino acid pools in pea aphids
(acyrthosiphon pisum) lacking symbiotic bacteria. Journal of Insect Physiology , 42 (3), 247–
255.
Douglas, A. E. (1989). Mycetocyte symbiosis in insects. Biological Reviews of the Cambridge
Philosophical Societ , 64 (4), 409–434.
Douglas, A. E. (1998). Nutritional interactions in insect-microbial symbioses: aphids and their
symbiotic bacteria buchnera. Annual Review of Entomology , 43 , 17–37.
Drummond, D. A., Bloom, J. D., Adami, C., Wilke, C. O., & Arnold, F. H. (2005). Why highly
expressed proteins evolve slowly. Proceedings of the National Academy of Sciences of the
United States of America, 102 (40), 14338–14343.
Drummond, D. A., Raval, A., & Wilke, C. O. (2006). A single determinant dominates the rate
of yeast protein evolution. Molecular Biology and Evolution, 23 (2), 327–337.
Dubchak, I., & Ryaboy, D. V. (2006). Vista family of computational tools for comparative
analysis of dna sequences and whole genomes. Methods in Molecular Biology , 338 , 69–89.
Durden, L. A. (1991). Pseudoscorpions associated with mammals in papua new guinea. Biotrop-
ica, 23 (2), 204–206.
Ehrlich, P. R., & Roughgarden, J. (1987). The science of ecology . New York: Macmillan ; London
: Collier Macmillan. Paul R. Ehrlich, Jonathan Roughgarden.
Fares, M. A. (2002). El papel de la selección en la endosimbiosis bacteriana en insectos. Ph.D.
thesis, University of Valencia.
Fares, M. A., Barrio, E., Sabater-Munoz, B., & Moya, A. (2002a). The evolution of the heat-
shock protein groel from buchnera, the primary endosymbiont of aphids, is governed by
positive selection. Molecular Biology and Evolution, 19 (7), 1162–1170.
Fares, M. A., Moya, A., & Barrio, E. (2005). Adaptive evolution in groel from distantly related
endosymbiotic bacteria of insects. Journal of Evolutionary Biology , 18 (3), 651–660.
200

REFERENCES
Fares, M. A., Ruiz-Gonzalez, M. X., Moya, A., Elena, S. F., & Barrio, E. (2002b). Endosymbiotic
bacteria: groel bu!ers against deleterious mutations. Nature, 417 (6887), 398.
Feldhaar, H., Straka, J., Krischke, M., Berthold, K., Stoll, S., Mueller, M. J., & Gross, R. (2007).
Nutritional upgrading for omnivorous carpenter ants by the endosymbiont blochmannia.
BMC Biology , 5 , 48.
Ferrari, J., Darby, A. C., Daniell, T. J., Godfray, H. C. J., & Douglas, A. E. (2004). Linking
the bacterial community in pea aphids with host-plant use and natural enemy resistance.
Ecological Entomology , 29 (1), 60–65.
Fitch, W. M., & Markowitz, E. (1970). An improved method for determining codon variability
in a gene and its application to the rate of fixation of mutations in evolution. Biochemical
genetics, 4 (5), 579–593.
Fleischmann, R. D., Adams, M. D., White, O., Clayton, R. A., Kirkness, E. F., Kerlavage, A. R.,
Bult, C. J., Tomb, J. F., Dougherty, B. A., & Merrick, J. M. (1995). Whole-genome random
sequencing and assembly of haemophilus influenzae rd. Science, 269 (5223), 496–512.
Force, A., Lynch, M., Pickett, F. B., Amores, A., Yan, Y. L., & Postlethwait, J. (1999). Preserva-
tion of duplicate genes by complementary, degenerative mutations. Genetics, 151 (4), 1531–
1545.
Foster, J., Ganatra, M., Kamal, I., Ware, J., Makarova, K., Ivanova, N., Bhattacharyya, A., Ka-
patral, V., Kumar, S., Posfai, J., Vincze, T., Ingram, J., Moran, L., Lapidus, A., Omelchenko,
M., Kyrpides, N., Ghedin, E., Wang, S., Goltsman, E., Joukov, V., Ostrovskaya, O., Tsuker-
man, K., Mazur, M., Comb, D., Koonin, E., & Slatko, B. (2005). The wolbachia genome of
brugia malayi: endosymbiont evolution within a human pathogenic nematode. PLoS Biology ,
3 (4), e121.
Fraser, C. M., Gocayne, J. D., White, O., Adams, M. D., Clayton, R. A., Fleischmann, R. D.,
Bult, C. J., Kerlavage, A. R., Sutton, G., Kelley, J. M., Fritchman, R. D., Weidman, J. F.,
Small, K. V., Sandusky, M., Fuhrmann, J., Nguyen, D., Utterback, T. R., Saudek, D. M.,
Phillips, C. A., Merrick, J. M., Tomb, J. F., Dougherty, B. A., Bott, K. F., Hu, P. C., Lucier,
T. S., Peterson, S. N., Smith, H. O., Hutchison, C. A. r., & Venter, J. C. (1995). The minimal
gene complement of mycoplasma genitalium. Science, 270 (5235), 397–403.
Fraser, H. B., Wall, D. P., & Hirsh, A. E. (2003). A simple dependence between protein evolution
rate and the number of protein-protein interactions. BMC Evolutionary Biology , 3 , 11.
Fryxell, K. J. (1996). The coevolution of gene family trees. Trends in Genetics, 12 (9), 364–369.
201

REFERENCES
Fukatsu, T., Aoki, S., Kurosu, U., & Ishikawa, H. (1994). Phylogeny of cerataphidini aphids
revealed by their symbiotic microorganisms and basic structure of their galls : Implications
for host-symbiont coevolution and evolution of sterile soldier castes. Zoological science, 11 (4),
613–623.
Fukatsu, T., & Ishikawa, H. (1993). Occurrence of chaperonin 60 and chaperonin 10 in primary
and secondary bacterial symbionts of aphids: implications for the evolution of an endosym-
biotic system in aphids. Journal of Molecular Evolution, 36 (6), 568–77.
Fukatsu, T., & Ishikawa, H. (1996). Phylogenetic position of yeast-like symbiont of hamiltonaphis
styraci (homoptera, aphididae) based on 18s rdna sequence. Insect Biochemistry and Molec-
ular Biology , 26 (4), 383–388.
Fukatsu, T., & Nikoh, N. (1998). Two intracellular symbiotic bacteria from the mulberry psyllid
anomoneura mori (insecta, homoptera). Applied and Environmental Microbiology, 64 (10),
3599–606.
Fukatsu, T., & Nikoh, N. (2000). Endosymbiotic microbiota of the bamboo pseudococcid anton-
ina crawii (insecta, homoptera). Applied and Environmental Microbiology , 66 (2), 643–50.
Funk, D. J., Helbling, L., Wernegreen, J. J., & Moran, N. A. (2000). Intraspecific phylogenetic
congruence among multiple symbiont genomes. Proceedings. Biological Sciences / The Royal
Society , 267 (1461), 2517–2521.
Funk, D. J., Wernegreen, J. J., & Moran, N. A. (2001). Intraspecific variation in symbiont
genomes: bottlenecks and the aphid-buchnera association. Genetics, 157 (2), 477–489.
Futuyma, D. J. (1986). Evolutionary biology , (2nd ed. ed.). Sunderland, Mass.: Sinauer. Douglas
J. Futuyama. 27cm.
Gaucher, E. A., Gu, X., Miyamoto, M. M., & Benner, S. A. (2002). Predicting functional
divergence in protein evolution by site-specific rate shifts. Trends in Biochemical Sciences,
27 (6), 315–321.
Ghai, R., & Chakraborty, T. (2007). Comparative microbial genome visualization using
genomeviz. Methods in Molecular Biology , 395 , 97–108.
Gil, R., Sabater-Munoz, B., Latorre, A., Silva, F. J., & Moya, A. (2002). Extreme genome
reduction in buchnera spp.: toward the minimal genome needed for symbiotic life. Proceedings
of the National Academy of Sciences of the United States of America, 99 (7), 4454–8.
Gil, R., Sabater-Munoz, B., Perez-Brocal, V., Silva, F. J., & Latorre, A. (2006). Plasmids in the
202

REFERENCES
aphid endosymbiont buchnera aphidicola with the smallest genomes. a puzzling evolutionary
story. Gene, 370 , 17–25.
Gil, R., Silva, F. J., Zientz, E., Delmotte, F., Gonzalez-Candelas, F., Latorre, A., Rausell, C.,
Kamerbeek, J., Gadau, J., Holldobler, B., van Ham, R. C. H. J., Gross, R., & Moya, A.
(2003). The genome sequence of blochmannia floridanus: comparative analysis of reduced
genomes. Proceedings of the National Academy of Sciences of the United States of America,
100 (16), 9388–9393.
Goetz, M., Bubert, A., Wang, G., Chico-Calero, I., Vazquez-Boland, J. A., Beck, M., Slaghuis,
J., Szalay, A. A., & Goebel, W. (2001). Microinjection and growth of bacteria in the cytosol
of mammalian host cells. Proceedings of the National Academy of Sciences of the United
States of America, 98 (21), 12221–12226.
Gomez-Valero, L., Latorre, A., Gil, R., Gadau, J., Feldhaar, H., & Silva, F. (2008). Patterns
and rates of nucleotide substitution, insertion and deletion in the endosymbiont of ants
blochmannia floridanus. Molecular Ecology .
Gomez-Valero, L., Latorre, A., & Silva, F. J. (2004). The evolutionary fate of nonfunctional
dna in the bacterial endosymbiont buchnera aphidicola. Molecular Biology and Evolution,
21 (11), 2172–2181.
Gomez-Valero, L., Silva, F. J., Christophe Simon, J., & Latorre, A. (2007). Genome reduction
of the aphid endosymbiont buchnera aphidicola in a recent evolutionary time scale. Gene,
389 (1), 87–95.
Gosalbes, M. J., Lamelas, A., Moya, A., & Latorre, A. (2008). The striking case of tryptophan
provision in the cedar aphid cinara cedri. Journal of Bacteriology , 190 (17), 6026–6029.
Gould, S. J., & Eldredge, N. (1993). Punctuated equilibrium comes of age. Nature, 366 (6452),
223–227.
Grant, J. R., & Stothard, P. (2008). The cgview server: a comparative genomics tool for circular
genomes. Nucleic Acids Research, 36 (Web Server issue), W181–4.
Grassé, P., & Noirot, C. (1959). The development of symbiosis in isoptera. Experientia, 15 ,
365–372.
Gray, M. W., Burger, G., & Lang, B. F. (1999). Mitochondrial evolution. Science, 283 (5407),
1476–1481.
203

REFERENCES
Gray, M. W., & Doolittle, W. F. (1982). Has the endosymbiont hypothesis been proven? Mi-
crobiological Reviews, 46 (1), 1–42.
Gregory, T. (2003). Is small indel bias a determinant of genome size? Trends in Genetics, 19 (9),
485–488.
Gu, J., Neary, J. L., Sanchez, M., Yu, J., Lilburn, T. G., & Wang, Y. (2007). Genome evolution
and functional divergence in yersinia. Journal of Experimental Zoology. Part B. Molecular
and Developmental Evolution, 308 (1), 37–49.
Gu, X. (2001). Maximum-likelihood approach for gene family evolution under functional diver-
gence. Molecular Biology and Evolution, 18 (4), 453–464.
Gu, X. (2003). Evolution of duplicate genes versus genetic robustness against null mutations.
Trends in Genetics, 19 (7), 354–356.
Haas, B. J., Delcher, A. L., Wortman, J. R., & Salzberg, S. L. (2004). Dagchainer: a tool for
mining segmental genome duplications and synteny. Bioinformatics, 20 (18), 3643–3646.
Hahn, M. W., & Kern, A. D. (2005). Comparative genomics of centrality and essentiality in three
eukaryotic protein-interaction networks. Molecular Biology and Evolution, 22 (4), 803–806.
Heddi, A., Charles, H., Khatchadourian, C., Bonnot, G., & Nardon, P. (1998). Molecular char-
acterization of the principal symbiotic bacteria of the weevil sitophilus oryzae: a peculiar g
+ c content of an endocytobiotic dna. Journal of Molecular Evolution, 47 (1), 52–61.
Heniko!, J. G., & Heniko!, S. (1996). Blocks database and its applications. Methods Enzymol ,
266 , 88–105.
Herbeck, J. T., Degnan, P. H., & Wernegreen, J. J. (2005). Nonhomogeneous model of sequence
evolution indicates independent origins of primary endosymbionts within the enterobacteri-
ales (gamma-proteobacteria). Molecular Biology and Evolution, 22 (3), 520–532.
Hirano, T., Yamaguchi, S., Oosawa, K., & Aizawa, S. (1994). Roles of flik and flhb in determi-
nation of flagellar hook length in salmonella typhimurium. Journal of Bacteriology , 176 (17),
5439–5449.
Hirsh, A. E., & Fraser, H. B. (2001). Protein dispensability and rate of evolution. Nature,
411 (6841), 1046–1049.
Ho!mann, A., Turelli, M., & Simmons, G. (1986). Unidirectional incompatibility between pop-
ulations of drosophila simulans. Evolution, 40 (4), 692–701.
204

REFERENCES
Hohl, M., Kurtz, S., & Ohlebusch, E. (2002). E"cient multiple genome alignment. Bioinformat-
ics, 18 Suppl 1 , S312–20.
Holldobler, B., & Wilson, E. (1990). The Ants. Springer-Verlag Berlin and Heidelberg GmbH
and Co. K.
Honegger, R. (1993). Developmental biology of lichen. The New Phytologist , (4), 659–677.
Horn, M., Collingro, A., Schmitz-Esser, S., Beier, C. L., Purkhold, U., Fartmann, B., Brandt,
P., Nyakatura, G. J., Droege, M., Frishman, D., Rattei, T., Mewes, H. W., & Wagner, M.
(2004). Illuminating the evolutionary history of chlamydiae. Science, 304 (5671), 728–30.
Houk, E., & Gri"ths, G. (1980). Intracellular symbiotes of the homoptera. Annual Reviews in
Entomology , 25 (1), 161–187.
Howe, H. F., & Westley, L. C. (1988). Ecological relationships of plants and animals. Oxford
University Press. GB8917096 bnb 2020 Henry F. Howe, Lynn C. Westley.
Hughes, A. L. (1994). The evolution of functionally novel proteins after gene duplication. Pro-
ceedings. Biological Sciences / The Royal Society, 256 (1346), 119–124.
Hurst, L. D., & Smith, N. G. (1999). Do essential genes evolve slowly? Current Biology , 9 (14),
747–750.
Hypsa, V., & Aksoy, S. (1997). Phylogenetic characterization of two transovarially transmitted
endosymbionts of the bedbug cimex lectularius (heteroptera:cimicidae). Insect Molecular
Biology , 6 (3), 301–4.
Ingram, V. M. (1961). Gene evolution and the haemoglobins. Nature, 189 , 704–708.
Ishikawa, H. (1989). Biochemical and molecular aspects of endosymbiosis in insects. International
Review of Cytology , 116 , 1–45.
Itoh, T., Martin, W., & Nei, M. (2002). Acceleration of genomic evolution caused by enhanced
mutation rate in endocellular symbionts. Proceedings of the National Academy of Sciences
of the United States of America, 99 (20), 12944–12948.
Jones, C. J., & Macnab, R. M. (1990). Flagellar assembly in salmonella typhimurium: analysis
with temperature-sensitive mutants. Journal of Bacteriology , 172 (3), 1327–1339.
Jordan, I. K., Rogozin, I. B., Wolf, Y. I., & Koonin, E. V. (2002). Essential genes are more
evolutionarily conserved than are nonessential genes in bacteria. Genome Research, 12 (6),
962–968.
205

REFERENCES
Jordan, I. K., Wolf, Y. I., & Koonin, E. V. (2003). No simple dependence between protein evo-
lution rate and the number of protein-protein interactions: only the most prolific interactors
tend to evolve slowly. BMC Evolutionary Biology , 3 , 1.
Jucci, C. (1932). Sulla presenza di bactteriociti nel tessuto adiposo dei termitidi. Ach Zool Ital ,
16 , 1422–1429.
Jucci, C. (1952). Symbiosis and phylogenesis in the isoptera. Nature, 169 (4307), 837.
Kambhampati, S. (1995). A phylogeny of cockroaches and related insects based on dna sequence
of mitochondrial ribosomal rna genes. Proceedings of the National Academy of Sciences of
the United States of America, 92 (6), 2017–2020.
Kanehisa, M., Goto, S., Kawashima, S., & Nakaya, A. (2002). The kegg databases at genomenet.
Nucleic Acids Research, 30 (1), 42–46.
Keeton, W. T., Gould, J. L., & Gould, C. G. (1986). Biological science, (4th ed. ed.). New York:
Norton. William T. Keeton, James L. Gould, with Carol Grant Gould.
Kerner, M. J., Naylor, D. J., Ishihama, Y., Maier, T., Chang, H.-C., Stines, A. P., Georgopoulos,
C., Frishman, D., Hayer-Hartl, M., Mann, M., & Hartl, F. U. (2005). Proteome-wide analysis
of chaperonin-dependent protein folding in escherichia coli. Cell , 122 (2), 209–220.
Klasson, L., Walker, T., Sebaihia, M., Sanders, M. J., Quail, M. A., Lord, A., Sanders, S., Earl,
J., O’Neill, S. L., Thomson, N., Sinkins, S. P., & Parkhill, J. (2008). Genome evolution of
wolbachia strain wpip from the culex pipiens group. Molecular Biology and Evolution, 25 (9),
1877–87.
Kneib, T., Hothorn, T., & Tutz, G. (2008). Variable selection and model choice in geoadditive
regression models. Biometrics.
Kondrashov, A. S. (1988). Deleterious mutations and the evolution of sexual reproduction.
Nature, 336 (6198), 435–440.
Kondrashov, A. S. (1995). Contamination of the genome by very slightly deleterious mutations:
why have we not died 100 times over? Journal of Theoretical Biology, 175 (4), 583–594.
Kondrashov, A. S., Sunyaev, S., & Kondrashov, F. A. (2002). Dobzhansky-muller incompati-
bilities in protein evolution. Proceedings of the National Academy of Sciences of the United
States of America, 99 (23), 14878–14883.
Kormondy, E. J. (1984). Concepts of ecology , (3rd ed. ed.). Englewood Cli!s, N.J.: Prentice-Hall.
Edward J. Kormondy.
206

REFERENCES
Koroyasu, S., Yamazato, M., Hirano, T., & Aizawa, S. I. (1998). Kinetic analysis of the growth
rate of the flagellar hook in salmonella typhimurium by the population balance method.
Biophysical journal , 74 (1), 436–443.
Koski, L. B., & Golding, G. B. (2001). The closest blast hit is often not the nearest neighbor.
Journal of Molecular Evolution, 52 (6), 540–542.
Kulathinal, R. J., Bettencourt, B. R., & Hartl, D. L. (2004). Compensated deleterious mutations
in insect genomes. Science, 306 (5701), 1553–1554.
Kutsukake, K., & Iino, T. (1994). Role of the flia-flgm regulatory system on the transcriptional
control of the flagellar regulon and flagellar formation in salmonella typhimurium. Journal
of Bacteriology , 176 (12), 3598–3605.
Kutsukake, K., Ohya, Y., & Iino, T. (1990). Transcriptional analysis of the flagellar regulon of
salmonella typhimurium. Journal of Bacteriology , 172 (2), 741–747.
Kuwahara, H., Yoshida, T., Takaki, Y., Shimamura, S., Nishi, S., Harada, M., Matsuyama,
K., Takishita, K., Kawato, M., Uematsu, K., Fujiwara, Y., Sato, T., Kato, C., Kitagawa,
M., Kato, I., & Maruyama, T. (2007). Reduced genome of the thioautotrophic intracellular
symbiont in a deep-sea clam, calyptogena okutanii. Current Biology , 17 (10), 881–886.
Lambert, J. D., & Moran, N. A. (1998). Deleterious mutations destabilize ribosomal rna in
endosymbiotic bacteria. Proceedings of the National Academy of Sciences of the United States
of America, 95 (8), 4458–4462.
Lanham, U. N. (1968). The blochmann bodies: hereditary intracellular symbionts of insects.
Biological Reviews of the Cambridge Philosophical Societ , 43 (3), 269–286.
Law, R., & Lewis, D. H. (1983). Biotic environments and the maintenance of sex-some evidence
from mutualistic symbioses. Biological journal of the Linnean Society, 20 (3), 249–276.
Leader, D. P. (2004). Bugview: a browser for comparing genomes. Bioinformatics, 20 (1), 129–
130.
Li, W. H., & Gojobori, T. (1983). Rapid evolution of goat and sheep globin genes following gene
duplication. Molecular Biology and Evolution, 1 (1), 94–108.
Lin, Y.-S., Hsu, W.-L., Hwang, J.-K., & Li, W.-H. (2007). Proportion of solvent-exposed amino
acids in a protein and rate of protein evolution. Molecular Biology and Evolution, 24 (4),
1005–1011.
207

REFERENCES
Liu, X., & Matsumura, P. (1994). The flhd/flhc complex, a transcriptional activator of the
escherichia coli flagellar class ii operons. Journal of Bacteriology , 176 (23), 7345–7351.
Liu, X., & Matsumura, P. (1995). An alternative sigma factor controls transcription of flag-
ellar class-iii operons in escherichia coli: gene sequence, overproduction, purification and
characterization. Gene, 164 (1), 81–84.
Lo, N., Bandi, C., Watanabe, H., Nalepa, C., & Beninati, T. (2003). Evidence for cocladogen-
esis between diverse dictyopteran lineages and their intracellular endosymbionts. Molecular
Biology and Evolution, 20 (6), 907–13.
Lopez, P., Casane, D., & Philippe, H. (2002). Heterotachy, an important process of protein
evolution. Molecular Biology and Evolution, 19 (1), 1–7.
Lynch, M. (1996). Mutation accumulation in transfer rnas: molecular evidence for muller’s
ratchet in mitochondrial genomes. Molecular Biology and Evolution, 13 (1), 209–220.
Lynch, M. (1997). Mutation accumulation in nuclear, organelle, and prokaryotic transfer rna
genes. Molecular Biology and Evolution, 14 (9), 914–925.
Lynch, M., Burger, R., Butcher, D., & Gabriel, W. (1993). The mutational meltdown in asexual
populations. The Journal of Heredity , 84 (5), 339–344.
Lynn, D. J., Lloyd, A. T., Fares, M. A., & O’Farrelly, C. (2004). Evidence of positively selected
sites in mammalian alpha-defensins. Molecular Biology and Evolution, 21 (5), 819–827.
Ma, R., Reese, J., Black, W., & Bramel-Cox, P. (1990). Detection of pectinesterase and poly-
galacturonase from salivary secretions of living greenbugs, schizaphis graminum (homoptera:
Aphididae). Journal of Insect Physiology , 36 , 507–512.
Macnab, R. M. (2003). How bacteria assemble flagella. Annual Review of Microbiology , 57 ,
77–100.
Maezawa, K., Shigenobu, S., Taniguchi, H., Kubo, T., Aizawa, S.-I., & Morioka, M. (2006).
Hundreds of flagellar basal bodies cover the cell surface of the endosymbiotic bacterium
buchnera aphidicola sp. strain aps. Journal of Bacteriology , 188 (18), 6539–6543.
Maisnier-Patin, S., Roth, J. R., Fredriksson, A., Nystrom, T., Berg, O. G., & Andersson, D. I.
(2005). Genomic bu!ering mitigates the e!ects of deleterious mutations in bacteria. Nature
Genetics, 37 (12), 1376–1379.
Margulis, L. (1991). Symbiogenesis and symbionticism. Symbiosis as a source of evolutionary
innovation: speciation and morphogenesis. MIT Press, Cambridge, Mass, (pp. 1–14).
208

REFERENCES
Margulis, L., & Fester, R. (1991). Bellagio conference and book. symbiosis as source of evo-
lutionary innovation: Speciation and morphogenesis. conference–june 25-30, 1989, bellagio
conference center, italy. Symbiosis, 11 , 93–101.
Mayrose, I., Doron-Faigenboim, A., Bacharach, E., & Pupko, T. (2007). Towards realistic codon
models: among site variability and dependency of synonymous and non-synonymous rates.
Bioinformatics, 23 (13), i319–27.
McClelland, M., Sanderson, K. E., Clifton, S. W., Latreille, P., Porwollik, S., Sabo, A., Meyer,
R., Bieri, T., Ozersky, P., McLellan, M., Harkins, C. R., Wang, C., Nguyen, C., Bergho!, A.,
Elliott, G., Kohlberg, S., Strong, C., Du, F., Carter, J., Kremizki, C., Layman, D., Leonard,
S., Sun, H., Fulton, L., Nash, W., Miner, T., Minx, P., Delehaunty, K., Fronick, C., Magrini,
V., Nhan, M., Warren, W., Florea, L., Spieth, J., & Wilson, R. K. (2004). Comparison
of genome degradation in paratyphi a and typhi, human-restricted serovars of salmonella
enterica that cause typhoid. Nature Genetics, 36 (12), 1268–1274.
McClelland, M., Sanderson, K. E., Spieth, J., Clifton, S. W., Latreille, P., Courtney, L., Por-
wollik, S., Ali, J., Dante, M., Du, F., Hou, S., Layman, D., Leonard, S., Nguyen, C., Scott,
K., Holmes, A., Grewal, N., Mulvaney, E., Ryan, E., Sun, H., Florea, L., Miller, W., Stonek-
ing, T., Nhan, M., Waterston, R., & Wilson, R. K. (2001). Complete genome sequence of
salmonella enterica serovar typhimurium lt2. Nature, 413 (6858), 852–6.
McCutcheon, J. P., & Moran, N. A. (2007). Parallel genomic evolution and metabolic interde-
pendence in an ancient symbiosis. Proceedings of the National Academy of Sciences of the
United States of America, 104 (49), 19392–19397.
McKittrick, F., Station, C. U. A. E., & of Agriculture, N. Y. S. C. (1964). Evolutionary studies
of cockroaches.
Messier, W., & Stewart, C. B. (1997). Episodic adaptive evolution of primate lysozymes. Nature,
385 (6612), 151–154.
Minamino, T., & Namba, K. (2004). Self-assembly and type iii protein export of the bacterial
flagellum. Journal of Molecular Microbiology and Biotechnology, 7 (1-2), 5–17.
Minks, A. K., & Harrewijn, P. (1987). Aphids: Their Biology, Natural Enemies and Control .
Elsevier Science Ltd.
Mira, A., Ochman, H., & Moran, N. A. (2001). Deletional bias and the evolution of bacterial
genomes. Trends in Genetics, 17 (10), 589–596.
209
REFERENCES
Moran, N., & Baumann, P. (1994). Phylogenetics of cytoplasmically inherited microorganisms
of arthropods. Trends in Ecology and Evolution, 9 , 15–20.
Moran, N., & Wernegreen, J. (2000). Lifestyle evolution in symbiotic bacteria: insights from
genomics. Trends in Ecology and Evolution, 15 (8), 321–326.
Moran, N. A. (1996). Accelerated evolution and muller’s rachet in endosymbiotic bacteria. Pro-
ceedings of the National Academy of Sciences of the United States of America, 93 (7), 2873–
2878.
Moran, N. A., & Mira, A. (2001). The process of genome shrinkage in the obligate symbiont
buchnera aphidicola. Genome Biology , 2 (12), RESEARCH0054.
Moran, N. A., Munson, M. A., Baumann, P., & Ishikawa, H. (1993). A molecular clock in
endosymbiotic bacteria is calibrated using the insect hosts. Proceedings. Biological Sciences
/ The Royal Society , 253 (1337), 167.
Moran, N. A., & Plague, G. R. (2004). Genomic changes following host restriction in bacteria.
Current Opinion in Genetics and Development , 14 (6), 627–633.
Moran, N. A., Plague, G. R., Sandstrom, J. P., & Wilcox, J. L. (2003). A genomic perspective on
nutrient provisioning by bacterial symbionts of insects. Proceedings of the National Academy
of Sciences of the United States of America, 100 Suppl 2 , 14543–8.
Moya, A., Pereto, J., Gil, R., & Latorre, A. (2008). Learning how to live together: genomic
insights into prokaryote-animal symbioses. Nature Reviews. Genetics, 9 (3), 218–229.
Muller, H. J. (1964). The relatio of recombination to mutational advance. Mutation Research,
106 , 2–9.
Munson, M. A., Baumann, P., Clark, M. A., Baumann, L., Moran, N. A., Voegtlin, D. J., &
Campbell, B. C. (1991). Evidence for the establishment of aphid-eubacterium endosymbiosis
in an ancestor of four aphid families. Journal of Bacteriology , 173 (20), 6321–4.
Munson, M. A., Baumann, P., & Moran, N. A. (1992). Phylogenetic relationships of the en-
dosymbionts of mealybugs (homoptera: Pseudococcidae) based on 16s rdna sequences. Molec-
ular Phylogenetics and Evolution, 1 (1), 26–30.
Nakabachi, A., Yamashita, A., Toh, H., Ishikawa, H., Dunbar, H. E., Moran, N. A., & Hat-
tori, M. (2006). The 160-kilobase genome of the bacterial endosymbiont carsonella. Science,
314 (5797), 267.
210

REFERENCES
Nakagawa, S., Takaki, Y., Shimamura, S., Reysenbach, A.-L., Takai, K., & Horikoshi, K. (2007).
Deep-sea vent epsilon-proteobacterial genomes provide insights into emergence of pathogens.
Proceedings of the National Academy of Sciences of the United States of America, 104 (29),
12146–12150.
Nei, M., & Gojobori, T. (1986). Simple methods for estimating the numbers of synonymous and
nonsynonymous nucleotide substitutions. Molecular Biology and Evolution, 3 (5), 418–426.
Nei, M., Gu, X., & Sitnikova, T. (1997). Evolution by the birth-and-death process in multigene
families of the vertebrate immune system. Proceedings of the National Academy of Sciences
of the United States of America, 94 (15), 7799–7806.
Newton, I. L., Woyke, T., Auchtung, T. A., Dilly, G. F., Dutton, R. J., Fisher, M. C., Fontanez,
K. M., Lau, E., Stewart, F. J., Richardson, P. M., Barry, K. W., Saunders, E., Detter, J. C.,
Wu, D., Eisen, J. A., & Cavanaugh, C. M. (2007). The calyptogena magnifica chemoau-
totrophic symbiont genome. Science, 315 (5814), 998–1000.
Nikoh, N., & Fukatsu, T. (2000). Interkingdom host jumping underground: phylogenetic analysis
of entomoparasitic fungi of the genus cordyceps. Molecular Biology and Evolution, 17 (4),
629–38.
Nilsson, A. I., Koskiniemi, S., Eriksson, S., Kugelberg, E., Hinton, J. C. D., & Andersson,
D. I. (2005). Bacterial genome size reduction by experimental evolution. Proceedings of the
National Academy of Sciences of the United States of America, 102 (34), 12112–12116.
Noda, H., & Kodama, K. (1996). Phylogenetic position of yeastlike endosymbionts of anobiid
beetles. Applied and Environmental Microbiology , 62 (1), 162–7.
Ochman, H., Elwyn, S., & Moran, N. A. (1999). Calibrating bacterial evolution. Proceedings of
the National Academy of Sciences of the United States of America, 96 (22), 12638–12643.
Ochman, H., & Moran, N. A. (2001). Genes lost and genes found: evolution of bacterial patho-
genesis and symbiosis. Science, 292 (5519), 1096–1099.
Odum, E. P. (1989). Ecology and our endangered life-support systems. Sunderland, Mass.: Sin-
auer Associates. Eugene P. Odum.
Ogata, H., La Scola, B., Audic, S., Renesto, P., Blanc, G., Robert, C., Fournier, P. E., Claverie,
J. M., & Raoult, D. (2006). Genome sequence of rickettsia bellii illuminates the role of
amoebae in gene exchanges between intracellular pathogens. PLoS Genetics, 2 (5), e76.
Ohnishi, K., Kutsukake, K., Suzuki, H., & Iino, T. (1990). Gene flia encodes an alternative
211

REFERENCES
sigma factor specific for flagellar operons in salmonella typhimurium. Molecular and General
Genetics, 221 (2), 139–147.
Ohno, S. (1970). Evolution by Gene Duplication.
Ohtaka, C., & Ishikawa, H. (1993). Accumulation of adenine and thymine in a groe-homologous
operon of an intracellular symbiont. Journal of Molecular Evolution, 36 (2), 121–126.
Oliver, K. M., Russell, J. A., Moran, N. A., & Hunter, M. S. (2003). Facultative bacterial
symbionts in aphids confer resistance to parasitic wasps. Proceedings of the National Academy
of Sciences of the United States of America, 100 (4), 1803–7.
O’Neill, S. L., Gooding, R. H., & Aksoy, S. (1993). Phylogenetically distant symbiotic microor-
ganisms reside in glossina midgut and ovary tissues. Medical and Veterinary Entomology,
7 (4), 377–383.
Pal, C., Papp, B., & Hurst, L. D. (2001). Highly expressed genes in yeast evolve slowly. Genetics,
158 (2), 927–931.
Pal, C., Papp, B., & Lercher, M. J. (2006). An integrated view of protein evolution. Nature
Reviews. Genetics, 7 (5), 337–348.
Pamilo, P., Nei, M., & Li, W. H. (1987). Accumulation of mutations in sexual and asexual
populations. Genetical Research, 49 (2), 135–146.
Parmley, J. L., Chamary, J. V., & Hurst, L. D. (2006). Evidence for purifying selection against
synonymous mutations in mammalian exonic splicing enhancers. Molecular Biology and Evo-
lution, 23 (2), 301–309.
Perez-Brocal, V., Gil, R., Ramos, S., Lamelas, A., Postigo, M., Michelena, J. M., Silva, F. J.,
Moya, A., & Latorre, A. (2006). A small microbial genome: the end of a long symbiotic
relationship? Science, 314 (5797), 312–313.
Peterson, J. D., Umayam, L. A., Dickinson, T., Hickey, E. K., & White, O. (2001). The com-
prehensive microbial resource. Nucleic Acids Research, 29 (1), 123–125.
Pfei!er, M., & Linsenmair, K. (2000). Contributions to the life history of the malaysian giant
ant camponotus gigas (hymenoptera, formicidae). Insectes Sociaux , 47 (2), 123–132.
Plague, G. R., Dunbar, H. E., Tran, P. L., & Moran, N. A. (2008). Extensive proliferation
of transposable elements in heritable bacterial symbionts. Journal of Bacteriology , 190 (2),
777–779.
212

REFERENCES
Poelwijk, F. J., Kiviet, D. J., Weinreich, D. M., & Tans, S. J. (2007). Empirical fitness landscapes
reveal accessible evolutionary paths. Nature, 445 (7126), 383–386.
Queitsch, C., Sangster, T. A., & Lindquist, S. (2002). Hsp90 as a capacitor of phenotypic
variation. Nature, 417 (6889), 618–624.
Raven, P. H., & Johnson, G. B. (1992). Biology , (3rd ed. ed.). St. Louis ; London: Mosby Year
Book. Peter H. Raven, George B. Johnson.
Resch, A. M., Carmel, L., Marino-Ramirez, L., Ogurtsov, A. Y., Shabalina, S. A., Rogozin, I. B.,
& Koonin, E. V. (2007). Widespread positive selection in synonymous sites of mammalian
genes. Molecular Biology and Evolution, 24 (8), 1821–1831.
Ricklefs, R. E. (1990). Ecology , (3rd ed. ed.). Freeman. GB9141483 bnb 2170.
Rispe, C., Delmotte, F., van Ham, R. C. H. J., & Moya, A. (2004). Mutational and selective
pressures on codon and amino acid usage in buchnera, endosymbiotic bacteria of aphids.
Genome Research, 14 (1), 44–53.
Rispe, C., & Moran, N. A. (2000). Accumulation of deleterious mutations in endosymbionts:
Muller’s ratchet with two levels of selection. The American Naturalist , 156 (4), 425–441.
Rocha, E. P. C., & Danchin, A. (2004). An analysis of determinants of amino acids substitution
rates in bacterial proteins. Molecular Biology and Evolution, 21 (1), 108–116.
Romualdi, A., Felder, M., Rose, D., Gausmann, U., Schilhabel, M., Glockner, G., Platzer, M.,
& Suhnel, J. (2007). Gencolors: annotation and comparative genomics of prokaryotes made
easy. Methods in Molecular Biology , 395 , 75–96.
Rowan, R., & Powers, D. (1991). A molecular genetic classification of zooxanthellae and the
evolution of animal-algal symbioses. Science, 251 (4999), 1348–1351.
Russell, J. A., Latorre, A., Sabater-Munoz, B., Moya, A., & Moran, N. A. (2003). Side-stepping
secondary symbionts: widespread horizontal transfer across and beyond the aphidoidea.
Molecular Ecology , 12 (4), 1061–1075.
Rutherford, S. L., & Lindquist, S. (1998). Hsp90 as a capacitor for morphological evolution.
Nature, 396 (6709), 336–342.
Sacchi, L., Corona, S., Grigolo, A., Laudani, U., Selmi, M., & Bigliardi, E. (1996). The fate of
the endocytobionts of blattella germanica (blattaria: Blattellidae) and periplaneta americana
(blattaria: Blattidae) during embryo development. The Italian Journal of Zoology , 63 , 1–12.
213

REFERENCES
Sacchi, L., & Grigolo, A. (1989). Endocytobiosis in blattella germanica (blattodea) recent ac-
quisitions. Endocytobiosis and Cell Research, 6 , 121–147.
Sacchi, L., Nalepa, C., Bigliardi, E., Corona, S., Grigolo, A., Laudani, U., & Bandi, C. (1998a).
Ultrastructural studies of the fat body and bacterial endosymbionts of cryptocercus punctu-
latus scudder(blattaria: Cryptocercidae. Symbiosis, 25 (1), 251–269.
Sacchi, L., Nalepa, C. A., Bigliardi, E., Lenz, M., Bandi, C., Corona, S., Grigolo, A., Lambi-
ase, S., & Laudani, U. (1998b). Some aspects of intracellular symbiosis during embryo de-
velopment of mastotermes darwiniensis (isoptera: Mastotermitidae). Parassitologia, 40 (3),
309–316.
Sa!o, M. B. (1992). Coming to terms with a field: words and concepts in symbiosis. Symbiosis,
14 , 17–31.
Sameshima, S., Hasegawa, E., Kitade, O., Minaka, N., & Matsumoto, T. (1999). Phylogenetic
comparison of endosymbionts with their host ants based on molecular evidence. Zoological
Science, 16 (6), 993–1000.
Sandstroem, J., & Pettersson, J. (1994). Amino acid composition of phloem sap and the relation
to intraspecific variation in pea aphid (acyrthosiphon pisum) performance. Journal of Insect
Physiology , 40 , 947–947.
Sandström, J., & Moran, N. (1999). How nutritionally imbalanced is phloem sap for aphids?
Entomologia Experimentalis et Applicata, 91 (1), 203–210.
Sandstrom, J., Telang, A., & Moran, N. (2000). Nutritional enhancement of host plants by
aphids - a comparison of three aphid species on grasses. Journal of Insect Physiology , 46 (1),
33–40.
Sanjuan, R., & Elena, S. F. (2006). Epistasis correlates to genomic complexity. Proceedings of
the National Academy of Sciences of the United States of America, 103 (39), 14402–14405.
Sato, S., & Ishikawa, H. (1997). Expression and control of an operon from an intracellular
symbiont which is homologous to the groe operon. Journal of Bacteriology , 179 (7), 2300–
2304.
Sauer, C., Dudaczek, D., Holldobler, B., & Gross, R. (2002). Tissue localization of the endosym-
biotic bacterium "candidatus blochmannia floridanus" in adults and larvae of the carpenter
ant camponotus floridanus. Applied and Environmental Microbiology , 68 (9), 4187–93.
214

REFERENCES
Sauer, C., Stackebrandt, E., Gadau, J., Holldobler, B., & Gross, R. (2000). Systematic rela-
tionships and cospeciation of bacterial endosymbionts and their carpenter ant host species:
proposal of the new taxon candidatus blochmannia gen. nov. International Journal of Sys-
tematic and Evolutionary Microbiology , 50 Pt 5 , 1877–1886.
Schroder, D., Deppisch, H., Obermayer, M., Krohne, G., Stackebrandt, E., Holldobler, B.,
Goebel, W., & Gross, R. (1996). Intracellular endosymbiotic bacteria of camponotus species
(carpenter ants): systematics, evolution and ultrastructural characterization. Molecular Mi-
crobiology , 21 (3), 479–89.
Sharp, P. M., & Li, W. H. (1987). The codon adaptation index–a measure of directional syn-
onymous codon usage bias, and its potential applications. Nucleic Acids Research, 15 (3),
1281–1295.
Shigenobu, S., Watanabe, H., Hattori, M., Sakaki, Y., & Ishikawa, H. (2000). Genome sequence
of the endocellular bacterial symbiont of aphids buchnera sp. aps. Nature, 407 (6800), 81–86.
Siefert, J. L., Martin, K. A., Abdi, F., Widger, W. R., & Fox, G. E. (1997). Conserved gene
clusters in bacterial genomes provide further support for the primacy of rna. Journal of Insect
Physiology , 45 (5), 467–472.
Silva, F. J., Latorre, A., & Moya, A. (2001). Genome size reduction through multiple events of
gene disintegration in buchnera aps. Trends in Genetics, 17 (11), 615–618.
Silva, F. J., Latorre, A., & Moya, A. (2003). Why are the genomes of endosymbiotic bacteria so
stable? Trends in Genetics, 19 (4), 176–180.
Smith, S. E. (1967). Carbohydrate translocation in orchid mycorrhizas. The New Phytologist ,
66 (3), 371–378.
Stephens, R. S., Kalman, S., Lammel, C., Fan, J., Marathe, R., Aravind, L., Mitchell, W.,
Olinger, L., Tatusov, R. L., Zhao, Q., Koonin, E. V., & Davis, R. W. (1998). Genome
sequence of an obligate intracellular pathogen of humans: Chlamydia trachomatis. Science,
282 (5389), 754–759.
Stepkowski, T., & Legocki, A. B. (2001). Reduction of bacterial genome size and expansion
resulting from obligate intracellular lifestyle and adaptation to soil habitat. Acta biochimica
Polonica, 48 (2), 367–381.
Stiling, P. D. (1992). Introductory ecology. Englewood Cli!s, N.J. ; London: Prentice Hall.
GB9236328 bnb 2203 Peter Stiling. Includes bibliographical references (p520-579) and index.
215
REFERENCES
Tamames, J., Gil, R., Latorre, A., Pereto, J., Silva, F. J., & Moya, A. (2007). The frontier be-
tween cell and organelle: genome analysis of candidatus carsonella ruddii. BMC Evolutionary
Biology , 7 , 181.
Tamas, I., Klasson, L., Canback, B., Naslund, A. K., Eriksson, A.-S., Wernegreen, J. J., Sand-
strom, J. P., Moran, N. A., & Andersson, S. G. E. (2002). 50 million years of genomic stasis
in endosymbiotic bacteria. Science, 296 (5577), 2376–2379.
Tang, H., Billings, S., Wang, X., Sharp, L., & Blair, D. F. (1995). Regulated underexpression and
overexpression of the flin protein of escherichia coli and evidence for an interaction between
flin and flim in the flagellar motor. Journal of Bacteriology , 177 (12), 3496–3503.
Tatusov, R. L., Fedorova, N. D., Jackson, J. D., Jacobs, A. R., Kiryutin, B., Koonin, E. V.,
Krylov, D. M., Mazumder, R., Mekhedov, S. L., Nikolskaya, A. N., Rao, B. S., Smirnov,
S., Sverdlov, A. V., Vasudevan, S., Wolf, Y. I., Yin, J. J., & Natale, D. A. (2003). The cog
database: an updated version includes eukaryotes. BMC Bioinformatics, 4 , 41.
Tatusov, R. L., Koonin, E. V., & Lipman, D. J. (1997). A genomic perspective on protein
families. Science, 278 (5338), 631–637.
Tawfik, O. W., Papasian, C. J., Dixon, A. Y., & Potter, L. M. (1989). Saccharomyces cerevisiae
pneumonia in a patient with acquired immune deficiency syndrome. Journal of Clinical Mi-
crobiology , 27 (7), 1689–1691.
Thao, M. L., Moran, N. A., Abbot, P., Brennan, E. B., Burckhardt, D. H., & Baumann, P.
(2000). Cospeciation of psyllids and their primary prokaryotic endosymbionts. Applied and
Environmental Microbiology , 66 (7), 2898–905.
Thompson, A. R., Thacker, C. E., & Shaw, E. Y. (2005). Phylogeography of marine mutualists:
parallel patterns of genetic structure between obligate goby and shrimp partners. Molecular
Ecology , 14 (11), 3557–72.
Thompson, J. D., Higgins, D. G., & Gibson, T. J. (1994). Clustal w: improving the sensitivity
of progressive multiple sequence alignment through sequence weighting, position-specific gap
penalties and weight matrix choice. Nucleic Acids Research, 22 (22), 4673–4680.
Toft, C., & Fares, M. (2009). Selection for translational robustness in buchnera aphidicola,
endosymbiotic bacteria of aphids. Molecular Biology and Evolution.
Toft, C., & Fares, M. A. (2006). Grast: a new way of genome reduction analysis using compar-
ative genomics. Bioinformatics, 22 (13), 1551–1561.
216

REFERENCES
Toft, C., & Fares, M. A. (2008). The evolution of the flagellar assembly pathway in endosymbiotic
bacterial genomes. Molecular Biology and Evolution, 25 (9), 2069–2076.
Toh, H., Weiss, B. L., Perkin, S. A., Yamashita, A., Oshima, K., Hattori, M., & Aksoy, S.
(2006). Massive genome erosion and functional adaptations provide insights into the symbi-
otic lifestyle of sodalis glossinidius in the tsetse host. Genome Research, 16 (2), 149–56.
Treangen, T. J., & Messeguer, X. (2006). M-gcat: interactively and e"ciently constructing
large-scale multiple genome comparison frameworks in closely related species. BMC Bioin-
formatics, 7 , 433.
Tzika, A. C., Helaers, R., Van de Peer, Y., & Milinkovitch, M. C. (2008). Mantis: a phylogenetic
framework for multi-species genome comparisons. Bioinformatics, 24 (2), 151–157.
UniProt-Consortium (2008). The universal protein resource (uniprot). Nucleic Acids Research,
36 (Database issue), D190–5.
Unterman, B. M., Baumann, P., & McLean, D. L. (1989). Pea aphid symbiont relationships
established by analysis of 16s rrnas. Journal of Bacteriology , 171 (6), 2970–4.
van den Burg, B., & Eijsink, V. G. H. (2002). Selection of mutations for increased protein
stability. Current Opinion in Biotechnology, 13 (4), 333–337.
van Ham, R. C. H. J., Kamerbeek, J., Palacios, C., Rausell, C., Abascal, F., Bastolla, U.,
Fernandez, J. M., Jimenez, L., Postigo, M., Silva, F. J., Tamames, J., Viguera, E., Latorre,
A., Valencia, A., Moran, F., & Moya, A. (2003). Reductive genome evolution in buchnera
aphidicola. Proceedings of the National Academy of Sciences of the United States of America,
100 (2), 581–586.
Vinuelas, J., Calevro, F., Remond, D., Bernillon, J., Rahbe, Y., Febvay, G., Fayard, J.-M., &
Charles, H. (2007). Conservation of the links between gene transcription and chromosomal
organization in the highly reduced genome of buchnera aphidicola. BMC Genomics, 8 , 143.
Wall, D. P., Fraser, H. B., & Hirsh, A. E. (2003). Detecting putative orthologs. Bioinformatics,
19 (13), 1710–1711.
Wall, D. P., Hirsh, A. E., Fraser, H. B., Kumm, J., Giaever, G., Eisen, M. B., & Feldman,
M. W. (2005). Functional genomic analysis of the rates of protein evolution. Proceedings of
the National Academy of Sciences of the United States of America, 102 (15), 5483–5488.
Wang, S., Fleming, R. T., Westbrook, E. M., Matsumura, P., & McKay, D. B. (2006). Structure
of the escherichia coli flhdc complex, a prokaryotic heteromeric regulator of transcription.
217

REFERENCES
Journal of Molecular Biology , 355 (4), 798–808.
Wang, X., Minasov, G., & Shoichet, B. K. (2002). Evolution of an antibiotic resistance enzyme
constrained by stability and activity trade-o!s. Journal of Molecular Biology , 320 (1), 85–95.
Wernegreen, J. J. (2002). Genome evolution in bacterial endosymbionts of insects. Nature Re-
views. Genetics, 3 (11), 850–861.
Wernegreen, J. J. (2005). For better or worse: genomic consequences of intracellular mutualism
and parasitism. Current Opinion in Genetics and Development , 15 (6), 572–83.
Wernegreen, J. J., & Moran, N. A. (1999). Evidence for genetic drift in endosymbionts (buchn-
era): analyses of protein-coding genes. Molecular Biology and Evolution, 16 (1), 83–97.
Wernegreen, J. J., & Moran, N. A. (2000). Decay of mutualistic potential in aphid endosymbionts
through silencing of biosynthetic loci: Buchnera of diuraphis. Proceedings. Biological Sciences
/ The Royal Society , 267 (1451), 1423–1431.
Werren, J., & O’Neill, S. (1997). The evolution of heritable symbionts. In Influential passengers:
inherited microorganisms and arthropod reproduction. Oxford University Press.
Wessells, N. K., & Hopson, J. L. (1988). Biology , (1st ed. ed.). New York: Random House.
Norman K. Wessells, Janet L. Hopson.
Wheeler, D. L., Barrett, T., Benson, D. A., Bryant, S. H., Canese, K., Chetvernin, V., Church,
D. M., Dicuccio, M., Edgar, R., Federhen, S., Feolo, M., Geer, L. Y., Helmberg, W., Ka-
pustin, Y., Khovayko, O., Landsman, D., Lipman, D. J., Madden, T. L., Maglott, D. R.,
Miller, V., Ostell, J., Pruitt, K. D., Schuler, G. D., Shumway, M., Sequeira, E., Sherry,
S. T., Sirotkin, K., Souvorov, A., Starchenko, G., Tatusov, R. L., Tatusova, T. A., Wag-
ner, L., & Yaschenko, E. (2008). Database resources of the national center for biotechnology
information. Nucleic Acids Research, 36 (Database issue), D13–21.
Wilcox, J. L., Dunbar, H. E., Wolfinger, R. D., & Moran, N. A. (2003). Consequences of reductive
evolution for gene expression in an obligate endosymbiont. Molecular Microbiology, 48 (6),
1491–1500.
Wilson, A. C., Carlson, S. S., & White, T. J. (1977). Biochemical evolution. Annual Review of
Biochemistry , 46 , 573–639.
Wilson, A. C. C., Dunbar, H. E., Davis, G. K., Hunter, W. B., Stern, D. L., & Moran, N. A.
(2006). A dual-genome microarray for the pea aphid, acyrthosiphon pisum, and its obligate
bacterial symbiont, buchnera aphidicola. BMC Genomics, 7 , 50.
218
REFERENCES
Wilson, E. O., Carpenter, F. M., & Brown, J., W. L. (1967). The first mesozoic ants. Science,
157 (3792), 1038–1040.
Wolschin, F., Holldobler, B., Gross, R., & Zientz, E. (2004). Replication of the endosymbiotic
bacterium blochmannia floridanus is correlated with the developmental and reproductive
stages of its ant host. Applied and Environmental Microbiology, 70 (7), 4096–102.
Woolfit, M., & Bromham, L. (2003). Increased rates of sequence evolution in endosymbiotic
bacteria and fungi with small e!ective population sizes. Molecular Biology and Evolution,
20 (9), 1545–1555.
Wright, S. (1932). General, group and special size factors. Genetics, 17 (5), 603–619.
Wu, D., Daugherty, S. C., Van Aken, S. E., Pai, G. H., Watkins, K. L., Khouri, H., Tallon,
L. J., Zaborsky, J. M., Dunbar, H. E., Tran, P. L., Moran, N. A., & Eisen, J. A. (2006).
Metabolic complementarity and genomics of the dual bacterial symbiosis of sharpshooters.
PLoS Biology , 4 (6), e188.
Wu, M., Sun, L. V., Vamathevan, J., Riegler, M., Deboy, R., Brownlie, J. C., McGraw, E. A.,
Martin, W., Esser, C., Ahmadinejad, N., Wiegand, C., Madupu, R., Beanan, M. J., Brinkac,
L. M., Daugherty, S. C., Durkin, A. S., Kolonay, J. F., Nelson, W. C., Mohamoud, Y.,
Lee, P., Berry, K., Young, M. B., Utterback, T., Weidman, J., Nierman, W. C., Paulsen,
I. T., Nelson, K. E., Tettelin, H., ONeill, S. L., & Eisen, J. A. (2004). Phylogenomics of the
reproductive parasite wolbachia pipientis wmel: a streamlined genome overrun by mobile
genetic elements. PLoS Biology , 2 (3), E69.
Xie, T., & Hood, L. (2003). Acgt-a comparative genomics tool. Bioinformatics, 19 (8), 1039–
1040.
Yang, J., Wang, J., Yao, Z.-J., Jin, Q., Shen, Y., & Chen, R. (2003). Genomecomp: a visu-
alization tool for microbial genome comparison. Journal of Microbiological Methods, 54 (3),
423–426.
Yang, Z. (1997). Paml: a program package for phylogenetic analysis by maximum likelihood.
Computer Applications in the Biosciences, 13 (5), 555–556.
Yang, Z. (2002). Inference of selection from multiple species alignments. Current Opinion in
Genetics and Development , 12 (6), 688–694.
Yang, Z. (2007). Paml 4: phylogenetic analysis by maximum likelihood. Molecular Biology and
Evolution, 24 (8), 1586–1591.
219

REFERENCES
Yang, Z., & Nielsen, R. (2000). Estimating synonymous and nonsynonymous substitution rates
under realistic evolutionary models. Molecular Biology and Evolution, 17 (1), 32–43.
Young, G. M., Schmiel, D. H., & Miller, V. L. (1999). A new pathway for the secretion of
virulence factors by bacteria: the flagellar export apparatus functions as a protein-secretion
system. Proceedings of the National Academy of Sciences of the United States of America,
96 (11), 6456–6461.
Zientz, E., Beyaert, I., Gross, R., & Feldhaar, H. (2006). Relevance of the endosymbiosis of
blochmannia floridanus and carpenter ants at di!erent stages of the life cycle of the host.
Applied and Environmental Microbiology , 72 (9), 6027–6033.
220
Related Documents