Complements or Substitutes? Immigrant and Native Task Specialization in Spain * Catalina Amuedo-Dorantes Department of Economics San Diego State University & IZA e-mail: [email protected] Sara de la Rica Depto. Fundamentos del Análisis Económico II Universidad del País Vasco, FEDEA & IZA e-mail: [email protected] April 17, 2009 Abstract Learning about the impact that immigration has on the labor market of the receiving nation is a topic of major concern, particularly in Spain, where immigration has more than doubled from 4 percent to roughly 10 percent of the population within a decade. Yet, very little is known about the impact that large immigrant inflows have had on the labor market outcomes of Spanish natives. Furthermore, most studies assume that natives and immigrants are perfect substitutes within skill groups –a questionable assumption given recent findings in the literature. In this paper, we first document that foreign-born workers are not perfect substitutes of similarly skilled native Spanish workers, which may help explain why immigration has not significantly lowered natives’ wages. Instead, immigration has affected the occupational distribution of natives. Specifically, owing to the comparative advantage of foreign-born workers in manual as opposed to interactive tasks, natives relocated to occupations with a lower content of manual tasks –an effect reinforced by the significant increase in the share of native female workers over the time span under consideration. Additionally, the increase in the share in foreign-born workers may have raised the manual to interactive task supply of the economy; however, the simultaneous increase in the share of native female workers may have worked in the opposite direction. (*) We are grateful to David Autor, David Dorn, Giovanni Peri, and Chad Sparber for their support with the data and for their comments, as well as participants in seminars at….

Welcome message from author
This document is posted to help you gain knowledge. Please leave a comment to let me know what you think about it! Share it to your friends and learn new things together.
Transcript

Complements or Substitutes? Immigrant and Native Task Specialization in Spain*
Catalina Amuedo-Dorantes Department of Economics
San Diego State University & IZA e-mail: [email protected]
Sara de la Rica Depto. Fundamentos del Análisis Económico II
Universidad del País Vasco, FEDEA & IZA e-mail: [email protected]
April 17, 2009
Abstract
Learning about the impact that immigration has on the labor market of the receiving nation is a topic of major concern, particularly in Spain, where immigration has more than doubled from 4 percent to roughly 10 percent of the population within a decade. Yet, very little is known about the impact that large immigrant inflows have had on the labor market outcomes of Spanish natives. Furthermore, most studies assume that natives and immigrants are perfect substitutes within skill groups –a questionable assumption given recent findings in the literature. In this paper, we first document that foreign-born workers are not perfect substitutes of similarly skilled native Spanish workers, which may help explain why immigration has not significantly lowered natives’ wages. Instead, immigration has affected the occupational distribution of natives. Specifically, owing to the comparative advantage of foreign-born workers in manual as opposed to interactive tasks, natives relocated to occupations with a lower content of manual tasks –an effect reinforced by the significant increase in the share of native female workers over the time span under consideration. Additionally, the increase in the share in foreign-born workers may have raised the manual to interactive task supply of the economy; however, the simultaneous increase in the share of native female workers may have worked in the opposite direction.
(*) We are grateful to David Autor, David Dorn, Giovanni Peri, and Chad Sparber for their support with the data and for their comments, as well as participants in seminars at….
1
1. Introduction
The impact of immigration on the labor market of the host country is a topic of major
concern for many immigrant-receiving nations. Spain is no exception following the rapid
increase in immigrant flows experienced over the past decade. In 1991, only 1.2 percent of
the Spanish adult population (about 300,000 individuals) was foreign-born. Within a decade,
this percentage quadrupled to 4.0 percent (1,370,000 individuals) and, by 2007, it has roughly
reached 10 percent (4,500,000 individuals).
While there is a large and growing literature on the consequences of migration on the
wages of native workers in the U.S. (see Borjas (1994, 1995, 1999, 2003, 2005), Borjas and
Katz (2007), Card (1990, 2001, 2005), Card and Di Nardo (2000), Card and Lewis (2007),
Lewis (2003), Ottaviano and Peri (2005, 2006), among others), with a few exceptions, very
little is known about the impact of migration on the employment patterns and wages of
Spanish natives. Take, for instance, the well-accepted fact that, if workers’ skills are
differentiated mainly by their level of educational attainment and workers of different
education levels are imperfect substitutes, a large flow of immigrants with limited schooling
should (i) increase wages paid to highly-educated natives and (ii) reduce wages paid to less-
educated ones. Yet, in general, the effect of immigration on the wages of less-educated
natives has been, if any, of very small magnitude in the U.S. as well as in Spain (e.g.
Amuedo-Dorantes and De la Rica (2008), González and Ortega (2007), Carrasco et al
(2008)). However, as recently noted by Ottaviano and Peri (2006), this is not surprising
given that the effect of immigration depends on the degree of substitution between native and
immigrant workers within each education group. If native and immigrant workers of similar
educational attainment posses productive skills that lead them to specialize in different
occupations, it is reasonable to find a small or null impact of immigration on natives’ wages
as immigrants and natives are not competing for the same jobs.
2
Therefore, in order to learn about the impact of immigration on the host country
economy, it is first crucial to empirically assess the degree of substitution between native and
immigrant workers of comparable educational attainment. Yet, in the Spanish case, it is also
crucial to simultaneously account for the significant increase in the native female labor force
participation over the period under consideration. Female employment rates in Spain rose
from 25 percent in the mid 1980s to about 65 percent by the year 2008 –a period of time
during which male employment rates remained practically unchanged. Because native
female workers may differ from immigrant and native male workers in their comparative
advantages, failure to account for their increased presence in the labor market during the
period under consideration may bias our findings regarding the impact of immigration on
natives’ employment outcomes.
We proceed in two steps. First, we provide evidence of immigrants and natives being
imperfect substitutes within skill categories. Subsequently, we proceed to examine some of
the reasons as for why that may be the case. In particular, we explore whether, once we take
into account the simultaneous increase in native female labor force participation over the time
period under analysis, immigration encourages native specialization in occupations that differ
from those held by immigrants. The latter would help explain recent native and immigrant
employment patterns, as well as the lack of a negative wage impact of immigration on
natives’ wages. We find that natives seem to relocate to jobs with a lower content of manual,
as opposed to interactive or non-manual tasks1 –an effect reinforced by the significant
increase in the share of native female workers over the time span under consideration.
Additionally, the increase in the share in foreign-born workers may have raised the manual to
interactive task supply of the economy; however, the simultaneous increase in the share of
native female workers may have worked in the opposite direction.
1 Throughout the paper, we will be using the terms “interactive” and “non-manual” interchangeably.

3
The rest of the paper is organized as follows. Section 2 presents the theoretical model
upon which we base our empirical analysis. A detailed data description and some motivating
descriptive statistics are provided in Section 3 of the manuscript. In Section 4, we discuss our
empirical methodology and findings and Section 5 concludes the paper.
2. Theoretical Model
We develop an extension to Peri and Sparber’s (2008) general equilibrium model. In
their model, immigrants, compared to natives, have a comparative advantage in performing
manual relative to interactive tasks owing to their limited language proficiency and their
often missing Spanish-specific human capital skills. Given these comparative advantage
differences, Peri and Sparber (2008) solve for the equilibrium provision of relative manual to
interactive tasks by natives and in the entire economy and derive some testable hypotheses
regarding the impact of low-skill immigration on such provisions.
We extend Peri and Sparber’s (2008) model to allow for gender differences in natives’
comparative advantage in manual as opposed to interactive tasks. As noted in the
Introduction, this extension is quite relevant in a country like Spain for a couple of reasons.
First, Spain has experienced a significant increase in female labour force participation in
recent years. Second, as we shall show later on in the descriptives, women’s task provision is
less manual than men’s. This gender difference may have, in turn, significantly impacted the
manual to interactive nature of the task provision by native men as well as in the overall
economy. Thus, we assume that native women, relative to their male counterparts, have a
comparative advantage in performing interactive, as opposed to manual, tasks. Figure 1
shows the evolution of male and female employment rates in Spain between 1976 and the
year 2008. Starting in the mid 1980’s, female employment rates started to rise from
approximately 25 percent to about 65 percent by the year 2008. In fact, during the period
under examination in this study, that is: between 1999 and the year 2007, female employment
4
rates have risen by approximately 20 percentage points, from 45 percent to about 65 percent.
In contrast, over the same time period, male employment rates have stayed fairly stable at
around 85 percent.
In what follows, we present a simple theoretical model from which we derive the
equilibrium provisions of relative manual tasks by natives and in the economy when there are
three heterogeneous agents in the economy, i.e., immigrants, native women and native men.
Each of these agents has different comparative advantages in performing manual as opposed
to interactive tasks. From the equilibrium provision of relative manual tasks, we then derive
testable hypotheses regarding the effect of immigration on the relative tasks supplied by (i)
natives and (ii) by the overall economy.
2.1. Aggregate Demand Function
We start with an economy that produces one tradable final consumption good we call
Y, which only requires a low skilled intermediate input: YL.2 The production of YL is carried
out by less educated workers and requires a technology that combines two different types of
tasks: manual (M) and interactive or interactive (I) tasks. Manual tasks can be routine or non-
routine in nature. Examples of manual tasks include body coordination and physical strength,
whereas interactive tasks require interactive skills, such as being able to easily communicate
with other people, being capable of performing team work or supervising the work of others.
Both tasks are combined to produce YL according to the following CES production function:
111
])1([ −−−
−+= λλ
λλ
λλ
ββ IMY LLL (1)
where βL measures the productivity of manual versus interactive tasks in the production of YL
and λ captures the elasticity of substitution between manual (M) and interactive (I) tasks.
2 For simplicity, we focus on low skilled goods given that competition among natives and immigrants is more likely to occur in low-skilled jobs. Regarding high-skilled goods, we are implicitly assuming that they are produced by high skilled workers.

5
Profit maximization in a competitive market then yields the following relative demand
function for manual versus interactive tasks:
( ) λλ
ββ −
⎟⎟⎠
⎞⎜⎜⎝
⎛−
== mL
L wmI
M1
(2)
where wm is the relative compensation for manual versus interactive tasks, i.e., I
Mm w
ww = .
2.2. Comparative Advantages of Immigrant, Native Female and Native Male
Workers
In order to focus on native specialization in occupations that differ from those held by
immigrants as a potential explanation for the imperfect substitutability of natives and
immigrants within skill cell, we first assume that less educated natives and immigrants differ
in their comparative advantage in manual versus interactive tasks Specifically, we assume
that immigrants have, relative to their native counterparts, a comparative advantage in
performing manual as opposed to interactive tasks. This is a reasonable assumption given
that, unlike manual tasks, interactive tasks require the usage of communication skills that
most immigrants may still lack upon arrival owing to their limited language proficiency, lack
of Spanish-specific human capital, and overall imperfect transferability of skills. If we
denote by emi and emn as the efficiency in manual relative to interactive tasks of native and
immigrant workers, respectively, the stated assumption implies that: mnmi ee > , where the
subscripts i and n refer to immigrants and natives, respectively.
Additionally, we assume that, among natives and possibly due to the physical
demands of certain jobs, women have a comparative advantage in interactive relative to
manual tasks, that is: ( ) ( )nmmnwm ee < .
Now consider a representative worker j, who dedicates his/her work time (e.g. one
unit) to perform manual and interactive tasks. If we denote by sM the share of time each

6
worker dedicates to work on manual tasks, then each worker j will choose how to allocate his
time among manual and interactive tasks so as to maximize his/her labor income (wLj):
( ) ( ) IjiMMjmLj wtswtw αα −+= 1sM (3)
where mjt and ijt refer to the work time each worker j dedicates to manual and interactive
tasks, respectively. The superscript α (where: α<1) reflects decreasing returns in performing
either manual or interactive tasks –which guarantees that workers do not completely
specialize in performing one particular type of tasks. Maximization of equation (3) with
respect to sM yields the optimal relative supply of manual versus interactive tasks, mjη , which
is directly related to the relative task compensation in manual versus interactive tasks, ( mw ),
and to the worker relative efficiency in performing manual versus interactive tasks (emj) :
( ) ααα
η −−= 11
1 mjmm ew (4)
2.3. The Equilibrium Relative Provision of Manual versus Interactive Tasks
In order to find the equilibrium relative provision of manual to interactive tasks, we
need to aggregate equation (4) across all workers to obtain the market relative supply of
manual relative to interactive or interactive tasks, denoted by m:
( ) ( ) ααα
−−= 11
1*
mm ewm (5)
Using equations (5) and (2), we can solve for the aggregate equilibrium provision of manual
versus interactive tasks as well as for the equilibrium relative compensation:
αλαλ
αλααλ
ββ +−
+−
⎟⎟⎠
⎞⎜⎜⎝
⎛−
= )1()1(
* )(1 m
L
L em (6)
αλααλα
λα
ββ +−
−+−
−
⎟⎟⎠
⎞⎜⎜⎝
⎛−
= )1(1
)1()1
* )(1 m
L
Lm ew (7)

7
2.4. Immigrant and Native Task Supplies
We have solved for the equilibrium relative task provision of manual versus
interactive tasks of a representative worker assuming that all workers are homogeneous with
regards to their efficiency in performing manual and interactive tasks. However, one of the
key assumptions of the model is the existence of heterogeneity in the comparative advantage
of manual versus interactive tasks across workers. In particular, we assume that (i)
immigrants are more efficient in providing manual relative to interactive tasks than natives,
and (ii) among natives, women are more efficient in providing interactive relative to manual
tasks than their male counterparts. Therefore, we now expand the model to take into account
these two assumptions.
We first rewrite the aggregate supply of manual versus interactive tasks in this
economy as a weighted average of the relative supply by natives and immigrants of both
tasks, where the weight is the share of interactive tasks provided by immigrants (which is a
monotonic transformation of the foreign-born share of low-educated workers, Li/(LN+Li)) :
ninini
ni mffmI
MfI
MfIIMM
IMm )1()1( −+=⎟
⎠⎞
⎜⎝⎛−+⎟
⎠⎞
⎜⎝⎛=⎟⎟
⎠
⎞⎜⎜⎝
⎛++
=⎟⎠⎞
⎜⎝⎛= (8)
If we further disaggregate the native provision of relative tasks (i.e. nm ) by gender, equation
(8) can be rewritten as follows:
( )nmnwi mggmffmm )1()1( −+−+= (9)
where g is the share of interactive tasks provided by native women among all native workers,
which is a monotonic transformation of the native female share of our sample of native
workers. The subscript nm stands for native men and nw for native women.
The average relative efficiency of all low educated workers in performing manual
versus interactive tasks, me , can also be rewritten as a weighted average of natives and
immigrants’ relative efficiency in manual and interactive tasks as follows:

8
( ) ( )
)1(
11
,)1()1(
11
α
α
α
α
−
−
⎥⎥
⎦
⎤
⎢⎢
⎣
⎡
⎟⎟
⎠
⎞
⎜⎜
⎝
⎛
++=
⎥⎥⎦
⎤
⎢⎢⎣
⎡−+=
−
−immnmimm
efeefefe (10)
The average relative efficiency of the economy increases with the share of foreign born given
the assumption that ( )nmim ee >)( and with the average relative efficiency of manual tasks of
immigrants for a given share of foreign born workers. Once more, if we further assume that
the relative efficiency in manual versus interactive tasks of native men and women differs,
we have that:
( ) ( ) ( )
)1(
11
,,,
)1()1(
)1(
11
11
11
α
α
α
ααα
−
−
⎥⎥
⎦
⎤
⎢⎢
⎣
⎡
⎟⎟⎟
⎠
⎞
⎜⎜⎜
⎝
⎛
++−+=
=⎥⎥⎥
⎦
⎤
⎢⎢⎢
⎣
⎡
⎥⎦
⎤⎢⎣
⎡−+−+=
−
−−−
nwmimm
nmmnwmimm
eegfe
egegfefe
(11)
Given the assumption that ( ) ( )nmmnwm ee < , an increase in the female share among
native workers decreases, ceteris paribus, the average efficiency of relative manual tasks of
the whole economy. Similarly, an increase in the relative efficiency of manual to non-
manual tasks of native women would increase the average relative efficiency of the total
workforce.
We need to obtain an expression for the optimal supply of manual to interactive tasks
by natives, ( )*nm , and for the equilibrium provision of relative tasks in the economy, ( )*m , as
a function of the relative efficiency in performing tasks by each group. With that purpose,
we make use of equation (5) and obtain the optimal supply of tasks provided by all native
workers:

9
( ) ( ) ( ) ( ) ( )
( )α
αα
αααα
αα
αα
−
−
−−−−
⎥⎥
⎦
⎤
⎢⎢
⎣
⎡
⎟⎟
⎠
⎞
⎜⎜
⎝
⎛
+−=
=⎥⎦
⎤⎢⎣
⎡−+==
−
−
11
1*
11
11
1*1**
,
)1(1
1
11
nwmmm
nmmnwmmnmmn
egew
egegwewm
(12)
In addition, the equilibrium compensation of relative tasks can be written as:
( ) ( ) ( )
αλαα
αλαλα
αλαα
ααααλα
λα
ββ
ββ
α
+−−−
+−−
+−−−
−−−+−
−
⎪⎭
⎪⎬⎫
⎪⎩
⎪⎨⎧
⎟⎟
⎠
⎞
⎜⎜
⎝
⎛
++−+⎟⎟⎠
⎞⎜⎜⎝
⎛−
=
=⎟⎟⎟⎟
⎠
⎞
⎜⎜⎜⎜
⎝
⎛
⎥⎦
⎤⎢⎣
⎡−+−+⎟⎟
⎠
⎞⎜⎜⎝
⎛−
=−
)1()1(
)1()1(
)1()1(
11
11
11)1(
)1
*
,,,1
)1()1(1
11
nwmimmL
L
nmmnwmimL
Lm
eegfe
egegfefw
(13)
By substituting equation (13) into equation (12), we can solve for the optimal supply of
relative tasks of natives as a function of the relative efficiency of native men, native women,
and immigrants in performing manual versus interactive tasks, which is given by:
( ) ( ) ( )
( ) ( )
ααλαα
αλααλ
ααα
αλαα
αααα
αλααλ
ββ
ββ
−+−−
+−
−−−
+−−
−−−−
+−
⎥⎥
⎦
⎤
⎢⎢
⎣
⎡
⎟⎟
⎠
⎞
⎜⎜
⎝
⎛
+−⎪⎭
⎪⎬⎫
⎪⎩
⎪⎨⎧
⎟⎟
⎠
⎞
⎜⎜
⎝
⎛
++−+⎟⎟⎠
⎞⎜⎜⎝
⎛−
=⎥⎦
⎤⎢⎣
⎡−+
⎥⎥⎥
⎦
⎤
⎢⎢⎢
⎣
⎡
⎥⎦
⎤⎢⎣
⎡−+−+⎟⎟
⎠
⎞⎜⎜⎝
⎛−
=
11
)1()1(
11
11
11
)1(1
1
11
11
11)1(
*
,,,,1
)1(
)1()1(1
nwmmnwmimmL
L
nmmnwm
nmmnwmimL
Ln
egeeegfe
egeg
egegfefm
n
(14)
In order to obtain the expression of the equilibrium provision of relative tasks in the
economy, we can substitute equation (10) into equation (6) and rewrite the equilibrium
provision of manual to interactive tasks as a function of the relative efficiency of each of the
three groups under consideration, i.e., native men, native women and immigrants, in manual
relative to interactive tasks:
10
( )
αλααλ
αλααλ
αλααλ
αααα
αλααλ
ββ
ββ
+−−
+−
+−−
−−−−
+−
⎪⎭
⎪⎬⎫
⎪⎩
⎪⎨⎧
⎥⎥
⎦
⎤
⎢⎢
⎣
⎡
⎟⎟⎟
⎠
⎞
⎜⎜⎜
⎝
⎛
++−+⎟⎟⎠
⎞⎜⎜⎝
⎛−
=
=⎥⎥⎥
⎦
⎤
⎢⎢⎢
⎣
⎡
⎥⎦
⎤⎢⎣
⎡−+−+⎟⎟
⎠
⎞⎜⎜⎝
⎛−
=
)1()1(
)1(
)1()1(
11
11
11
11)1(
*
2
,,,1
))(1()()1(1
nwmimmL
L
nmmnwmimL
L
eegfe
egegfefm
(15)
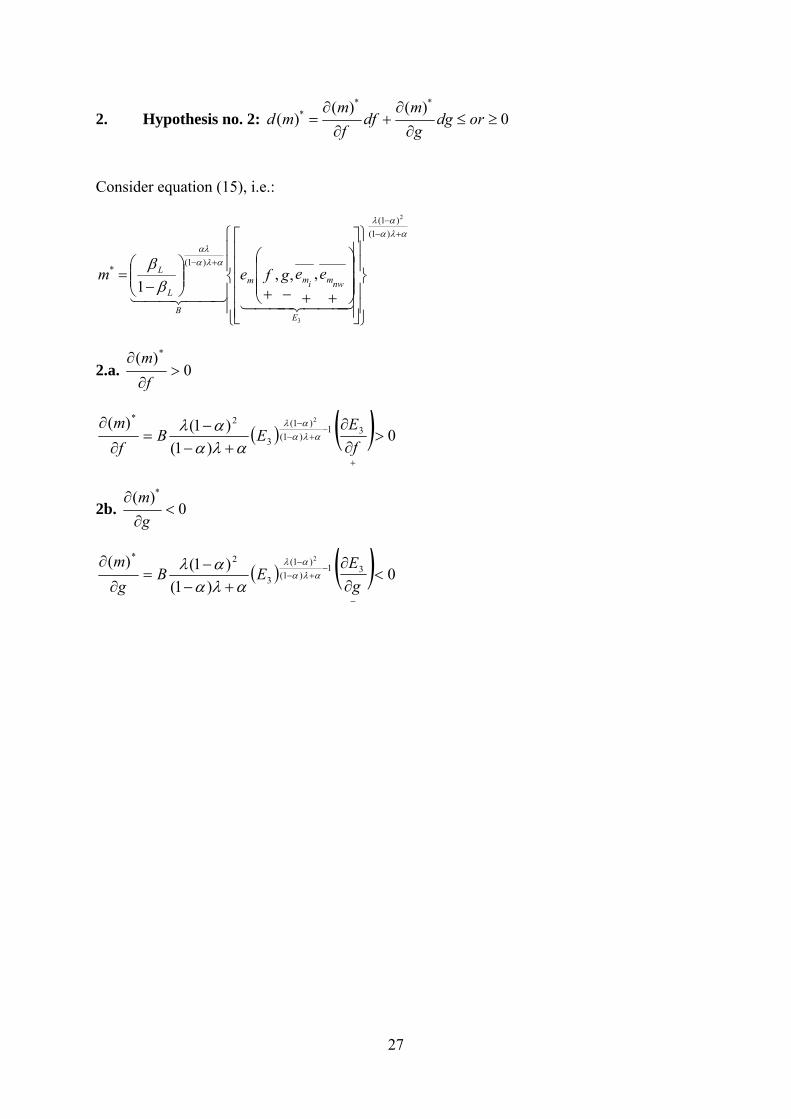
2.5. Key Assumptions and Testable Hypotheses
As pointed out earlier, there are two critical assumptions made in the model. The first
one is that, relative to natives, immigrants have a comparative advantage in providing manual
as opposed to interactive tasks, i.e. ( )nmim ee >)( . This assumption implies that the average
supply of manual to interactive tasks by immigrants will be greater than that of natives or:
( ) ( )**
ni mm > . The second assumption is that, among natives, women have a comparative
advantage in interactive as opposed to manual tasks, i.e., ( ) ( )nmmnwm ee < which implies that:
( ) ( )**
nmnw mm < . Using these assumptions, and assuming that the two supply shocks take
place simultaneously, we derive two testable hypotheses:3
i) Hypothesis no.1: As native women and immigrants enter the labour force, the
provision of manual to interactive tasks by less educated natives decreases.
According to equation (14), these two supply shocks unambiguously lower the
provision of manual to interactive tasks by low-educated native men and women. That is:
0)()(
)(**
* <∂
∂+
∂∂
= dgg
mdf
fm
md nnn
given that f
m n
∂∂ *)(
<0 and g
m n
∂∂ *)( <0 (see appendix for proof).
3 Peri and Sparber (2008) examine the impact of immigration on the relative compensation of manual versus interactive tasks as well. However, owing to the lack of adequate data on wages, we do not test the model predictions regarding the relative manual to interactive compensation.

11
Hypothesis no. 2: As native women and immigrants enter the Spanish labour force, the
provision of manual to non-manual tasks in the overall economy may increase, decrease or
remain the same depending on which supply shock dominates.
According to equation (15), due to their opposite signs, these two simultaneous supply
shocks have an ambiguous effect on the overall provision of manual to non-manual tasks in
the economy depending on whether the immigration or the female supply shock dominates or
cancel out. That is:
0)()(
)(**
* ≥≤∂
∂+
∂
∂= ordg
gm
dff
mmd
given that f
m∂
∂ *)( >0 but g
m∂
∂ *)( <0 (see appendix for the proof).
3. Data and Some Descriptive Evidence
We use the 1999-2007 Spanish Current Population Survey (Encuesta de Población
Activa, EPA), which provides the most representative sample of the Spanish workforce. For
the descriptive analysis, we also use the wage information contained for Spain in the
European Union Standard Living Conditions (EU-SILC) – a micro data panel that currently
spans from 2004 to 2006. Because of the limited variables contained in this dataset, as well
as the reduced number of years for which these data are available, we are unable to use it in
the empirical analysis. We restrict our analysis to recent immigration inflows as recent
immigrants (i.e. those with five or fewer years in Spain) are less likely to have yet acquired
the language proficiency and Spanish-specific human capital skills than longer-term migrants
may enjoy. As a result, they are less likely to display a comparative advantage in interactive
tasks relative to long-term migrants who may have already acquired the needed skills to
perform well in such tasks. Additionally, since our intent is to explore the implications of
low-skilled immigrants’ comparative advantage in performing manual as opposed to

12
interactive tasks relative to similarly skilled natives, we focus on immigrants and natives with
less than a university degree.4
Table 1 presents some descriptive statistics of the sample of natives and immigrants
taken from the pooled EPA 1999-2007. We define immigrants as holding a foreign
nationality (those with a double nationality are excluded – less than 4 percent), and
distinguish recent immigrants, i.e. those with 5 or fewer years in Spain, from all immigrants
in the sample. About 3 percent of the sample is foreign-born and a total of 2 percent entered
the country recently. Immigrants differ from natives in various regards. First, immigrants, in
particular recent immigrants, are younger than their native counterparts. For instance, among
recent immigrants, sixty-four percent of immigrants are 35 years old or younger relative to 38
percent and 40 percent of native men and women, respectively. In contrast, sixty-two percent
of native men and 57 percent of native women are older than forty-five compared to 12
percent of recent immigrants. Second, a higher fraction of immigrant women work relative to
native women (i.e. forty-three of all immigrant workers and 46 percent of all recent
immigrant workers are women relative to 39 percent for of all native workers). Third, there
are also some differences in the educational attainment of immigrants and natives. Native
women are the most highly educated, followed by native men and immigrants. Furthermore,
although we cannot distinguish recent from non-recent migrants in the EU-SILC data, natives
earn, on average, significantly higher wages than foreign-born workers, which would
possibly be indicative of the fact that natives perform different tasks than immigrants.
3.1. Substitutability among Native Men, Native Women and Immigrants
The first empirical evidence on the lack of substitutability among native men, native
women and immigrants emerges from Figure 3, which displays the relative position of low-
educated immigrants and low-educated native women in the wage distribution of low-
4 Nonetheless, it is worth noting that our results are robust to the inclusion of all immigrants since the vast majority of them are concentrated in occupations with greater manual task content.

13
educated native men (pooled 2004-2006 from EU-SILC). We have divided the native male
wage distribution in deciles and, for each decile, we have calculated the percentage of
immigrants and native women within each native male wage decile. The horizontal line
shows that 10 percent of native men fall within each wage decile. However, immigrants and
native women are concentrated to a greater extent in the lowest wage deciles of natives,
whereas the opposite is true in higher wage deciles. As such, Figure 3 suggests that
immigrants and, to a lesser extent, native women basically compete with low-wage native
men.
Additional evidence on the lack of substitutability between natives and immigrants
emerges from differences in their occupational distribution in Table 2. For the purposes of
our analysis, we focus on working-age individuals (i.e. between 16 and 65 years of age)
without a university education. The concentration of immigrant workers in a few occupations
is remarkable. About 82 percent of immigrants and an astonishing 87 percent of recent
immigrants (relative to 60 percent of native women and 54 percent of native men) work in
three broad occupational categories: 1) Low skill jobs that only require an elementary
education, 2) service and sales occupations, and 3) craft and related trade jobs. Furthermore,
two of those three occupations are among the worse paid.
Additionally, the figures in Table 2 indicate that there are also important gender
differences among natives. Between 25 and 30 percent of native women are employed in the
very low-skilled occupations or as service and sales workers relative to 14 and 11 percent of
native men, respectively. Likewise, only 5 percent of native women are craft and related
trade workers compared to 30 percent of native men. These gender differences underscore
the significance of paying close attention to the separate impact of immigration on native men
and women and of distinguishing between the effect of immigrants and native women on the
labor supply of native men.
14
Is the occupational concentration of immigrants and native women, as compared to
native men, a by-product of their distinct educational attainment? Table 3 displays the
occupational distribution of immigrants and natives with a primary or lower education as well
as with a secondary education. It is worth noting that 80 to 85 percent of immigrants with
secondary education and 87 to 90 percent of immigrants with a primary or lower education
are concentrated in three occupations (i.e. low skill jobs that only require an elementary
education, service and sale related occupations, and craft and related trade jobs). The latter
figures compare to 53 percent and 57 percent of native men and women with secondary
education, respectively, and to 57 percent and 70 percent of native men and women with
primary education, correspondingly. Therefore, immigrants, particularly more recent
immigrants, are concentrated in poorly paid occupations than native men and, to a lesser
extent, than native women, regardless of their educational attainment.
In most studies, the skill level is not measured only in terms of the educational
attainment, but rather in terms of education and experience (usually proxied by age), which
better reflect the acquired human capital. Table 4 shows the distribution of immigrants,
native men and native women across ten skill groups (five age categories and 2 educational
groups), along with their average wages. Native men earn consistently more than native
women and immigrants within any given skill group and young native women earn less than
immigrants. These wage differences within skill groups indicate that native men, native
women and immigrants cannot be considered close substitutes within the traditional skill
categories either. The observed imperfect substitutability of immigrants, native men and
native women of comparable age and educational attainment may be the result of the distinct
sorting of each group across occupations. More specifically, as Peri and Sparber (2008)
suggest, most immigrants, due to their lack of language proficiency and other necessary
production skills (interactive skills), may feel that they have a comparative advantage in
15
occupations that do not require such abilities and that, instead, require more manual than
interactive tasks. In that case, immigrants may choose occupations with a greater manual, as
opposed to interactive, task content. In the case of native women, physical demands of the
job may induce them to choose occupations characterized by a lower manual to interactive
task content than that of occupations chosen by native men and immigrants.
3.2. Measuring Task Specialization
To examine whether, indeed, immigration leads native men and, overall, natives to
relocate in jobs demanding greater interactive skills, thus allowing for immigrants to occupy
more manual intensive jobs, we rely on information on the job task requirements assembled
by Peri and Sparber (2008). In their paper, Peri and Sparber (2008) merged data on job task
requirements based on the U.S. Department of Labor’s O*Net abilities survey5 with Census
occupation classifications to examine task specialization patterns of natives and immigrants
in the U.S.6 They transform the O*Net abilities in percentile scores that represent the relative
importance of each skill among all U.S. workers in 2000. We merge the O*Net abilities data
to the Spanish labor force survey (i.e. Encuesta de Población Activa) by occupation.7 After
properly weighting each occupation’s ability raw scores so as to reflect the importance of that
particular ability in the Spanish labor force, we transform the ability scores into percentages
to facilitate the interpretation of our findings. This is done by dividing each weighted ability
score by the maximum score of the ability in question in other occupations. As such, each
final ability score ranges between 0 and 1 and is indicative of the relative importance of that
5 They use version 11.0 of the survey, available at: http://www.onetcenter.org/ 6 The O*NET, initiated in the year 2000, rates the importance of 52 employee abilities –to which we refer to as tasks in this paper– in each occupation in the Standard Occupation Classification (SOC). 7 U.S. 2000 Census codes in the O*Net dataset are first matched to the International Standard Classification of Occupations (ISCO88) using a crosswalk made available by the Center for Longitudinal Studies in the U.K. at: http://www.cls.ioe.ac.uk/text.asp?section=00010001000500160002. Subsequently, the Spanish occupation codes (CNO94) are matched to ISCO88 codes. Finally, both datasets (the O*Net abilities and the Spanish labor force survey) are then merged using the ISCO88 classification.
16
particular task in the occupation at hand –as opposed to in other occupations in the Spanish
labor force survey.8
Using the ability scores in question, we construct two measures of manual and
interactive skills. As Peri and Sparber (2008), we have a somehow restrictive definition of
manual skills that comprises the following skills: “Limb, Hand, and Finger Dexterity”, “Body
Coordination and Flexibility”, and “Strength”, as well as an extended measure of manual
skills that adds “Sensory and Perception” abilities to the aforementioned skill categories.
Likewise, our restrictive measure of interactive skills includes measures of oral and written
expression and comprehension, whereas the extended measure adds “Cognitive and
Analytical” and “Vocal” abilities.9
Table 5 displays the restrictive manual and interactive task summary measures for
each of the 2-digit ISCO88 occupations included in our analysis. As it would be expected,
high skill occupations with lower classification codes in Table 5 have a greater content of
interactive tasks and a smaller content of manual tasks than low skill occupations with higher
codes. In contrast, low skill occupations in Table 5 on average display a greater content of
manual, as compared to interactive, tasks than the high skill occupations in Table 5. As such,
the relative manual content (i.e. manual/interactive task ratio) of managers and professionals
in categories no. 12, 13, 21, 24 and 34 are amongst the lowest. Table 5 also displays the
share of foreign-born workers employed in each of the occupations, which is the largest for
three occupations with the highest relative manual content, i.e. agricultural, fishery and
related laborers, sales and service workers, and laborers in mining, construction,
manufacturing and transportation.
9 We acknowledge the arbitrary choices that one makes when trying to assign the O*NET skill variables into a manual vs. interactive task category; hence, we also carry out the analysis using the more extended measures of manual and interactive skills.

17
3.3. Comparative Advantages in the Relative Manual Task Provision by Nativity
Evidence of our assumption of a greater comparative advantage in the provision of
manual as opposed to interactive tasks by immigrants is provided by Figure 4, which plots the
relative manual content of the jobs performed by less educated immigrants and natives using
the more restrictive measure discussed in Section 3.2.10 It is worth noting that immigrants
with a secondary education or less take jobs with a greater manual, relative to interactive,
component as compared to similarly educated natives. Further support for the higher manual
to interactive intensity of job tasks performed by immigrants as compared to natives with a
similar educational attainment is provided in Figure 5. Each dot is a (province, year) cell, i.e.
our unit of observation in the empirical analysis. Specifically, each dot provides a measure of
the relative manual to interactive intensity of tasks carried out by immigrants as compared to
natives in those Spanish provinces with more than the average share of less educated
immigrant workers in each of the years being plotted, i.e. over 2.5 percent for the entire 1999-
2007 period. Overall, most points lie above the 45-degree line, thus indicating that, for high
immigrant-receiving regions, the ratio of manual to interactive tasks in jobs performed by the
foreign-born exceeds that of jobs performed by similarly educated natives.
3.4. Comparative Advantages in the Relative Manual Task Provision by Gender
As noted earlier, the immigration shock in Spain has coincided with a notable growth
in native women’s employment rates between 1999 and 2007, even among less educated
women. Figure 6 shows the evolution of male and female employment rates among less
educated workers in our sample. Over the time period under consideration, employment rates
for less educated women rose by an average of 5 percentage points while those of similarly
educated men remained practically constant.
10 Figures using the more extended measure are available from the authors upon request. Similar features emerge.
18
More importantly, women have primarily occupied jobs with lower relative manual
task content. Indeed, regardless of the task measure being used, Figure 7 indicate that, during
the time period under consideration, native women with a secondary education or less have
been taking jobs with a significantly lower manual, relative to interactive component as
compared to similarly educated men. Further support for the higher manual to interactive
intensity of job tasks performed by native men as compared to native women with a similar
educational attainment is provided in Figure 8. As in Figure 5, each dot provides a measure
of the relative manual to interactive intensity of tasks carried out by native men as compared
to native women in each province with more than the average share of less educated native
female workers in each of the years being plotted. Regardless of the measure used for the
relative manual content of job tasks, most points lie below the 45-degree line. Hence, for
regions with above average shares of native female workers, the ratio of manual to interactive
tasks in jobs performed by native men exceeds that of jobs performed by similarly educated
native women. Overall, Figure 7 and Figure 8 suggest that, along with the increase in the
relative manual task supply provided by foreign-born workers, Spain may have also
witnessed a significant reduction in the relative manual task supply provided by native female
workers.
4. Methodology and Results
Figures 4, 5, 7 and 8 provide evidence of the greater relative supply of manual tasks
by immigrants compared to natives, as well as of the greater relative supply of interactive
tasks by native females compared to native males –both central assumptions to the model.
We now proceed to testing the hypotheses derived from the model.
4.1. Immigration and the Relative Task Provision by Natives
Hypotheses no. 1 predicts that the equilibrium relative supply of manual tasks by less
educated natives decreases as the share of foreign-born rises. To test hypothesis no.1, we
19
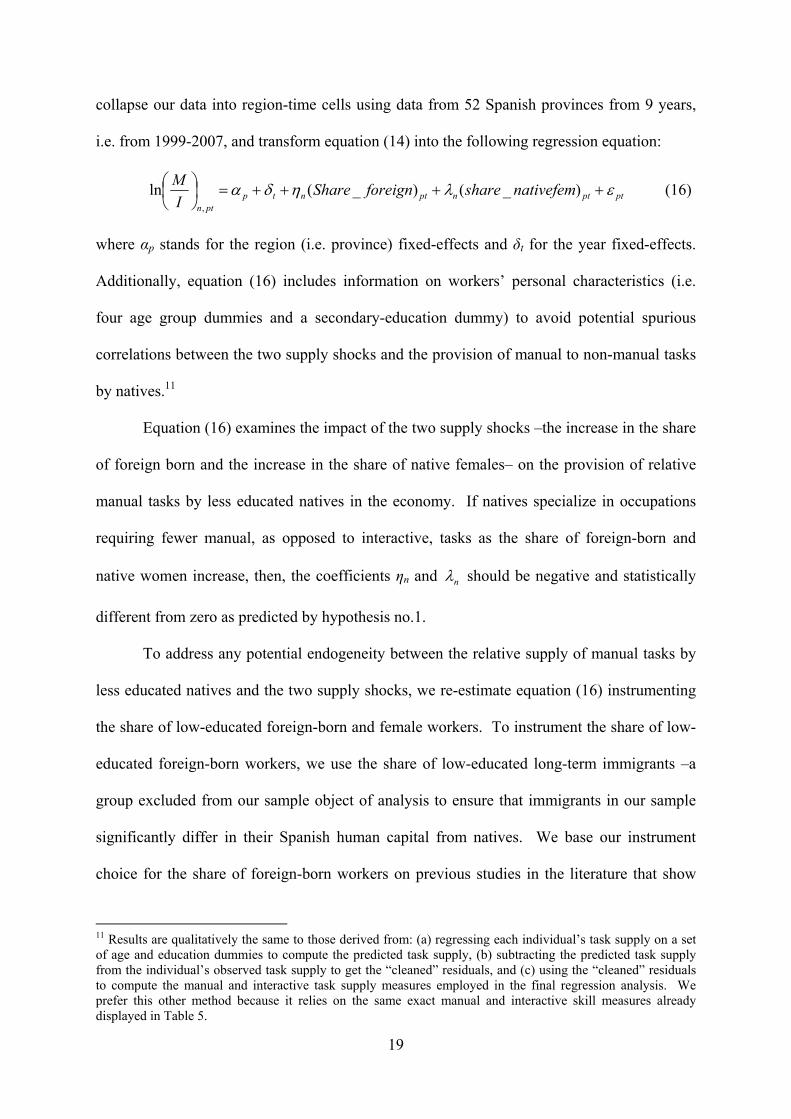
collapse our data into region-time cells using data from 52 Spanish provinces from 9 years,
i.e. from 1999-2007, and transform equation (14) into the following regression equation:
ptptnptntpptn
nativefemshareforeignShareI
M εληδα ++++=⎟⎠⎞
⎜⎝⎛ )_()_(ln
,
(16)
where αp stands for the region (i.e. province) fixed-effects and δt for the year fixed-effects.
Additionally, equation (16) includes information on workers’ personal characteristics (i.e.
four age group dummies and a secondary-education dummy) to avoid potential spurious
correlations between the two supply shocks and the provision of manual to non-manual tasks
by natives.11
Equation (16) examines the impact of the two supply shocks –the increase in the share
of foreign born and the increase in the share of native females– on the provision of relative
manual tasks by less educated natives in the economy. If natives specialize in occupations
requiring fewer manual, as opposed to interactive, tasks as the share of foreign-born and
native women increase, then, the coefficients ηn and nλ should be negative and statistically
different from zero as predicted by hypothesis no.1.
To address any potential endogeneity between the relative supply of manual tasks by
less educated natives and the two supply shocks, we re-estimate equation (16) instrumenting
the share of low-educated foreign-born and female workers. To instrument the share of low-
educated foreign-born workers, we use the share of low-educated long-term immigrants –a
group excluded from our sample object of analysis to ensure that immigrants in our sample
significantly differ in their Spanish human capital from natives. We base our instrument
choice for the share of foreign-born workers on previous studies in the literature that show
11 Results are qualitatively the same to those derived from: (a) regressing each individual’s task supply on a set of age and education dummies to compute the predicted task supply, (b) subtracting the predicted task supply from the individual’s observed task supply to get the “cleaned” residuals, and (c) using the “cleaned” residuals to compute the manual and interactive task supply measures employed in the final regression analysis. We prefer this other method because it relies on the same exact manual and interactive skill measures already displayed in Table 5.

20
that settlement patterns of previous immigrants are a main determinant of immigrants’
location choices (e.g. Card 2001, Cortes 2006, Lewis 2003, Ottaviano and Peri 2006, Peri
2006, Saiz 2003, and Peri and Sparber 2008, among other ones, for similar strategies). Our
instrument is strongly correlated to the share of foreign-born workers. Regardless of the task
measure being used as the dependent variable, the first stage regressions from the two-stage
instrumental variable estimation procedures yield coefficients that are statistically significant
at the 1 percent level.12
The share of low-educated female workers is instrumented using information on the
fraction of university-educated natives who are female – a group excluded from the analysis.
Our choice of instrument is based on the fact that the increase in female labor force
participation has occurred simultaneously and has been possibly enhanced by the increased
educational attainment of native women. Therefore, using the fraction of university-educated
natives who are female proves to be a good instrument owing to its high correlation with the
share of female native workers. Indeed, regardless of the task measure being used as the
dependent variable, the first stage regressions from the two-stage instrumental variable
estimation procedures yield coefficients that are statistically significant at the 1 percent level.
Table 6 displays the results from estimating equation (16) using the two measures of
the relative manual content of tasks performed by workers, the more restrictive as well as the
extended measure. The figures in the first row of Table 6 help confirm our first hypothesis,
that is, the fact that the relative supply of manual versus interactive tasks among natives
generally decreases as the shares of foreign-born and native female workers rise.13 Of
particular interest to us given the purpose of this study is the impact of an increase in the
share of foreign-born workers on the native task supply. As predicted by hypothesis 1a) in
the appendix, such an increase clearly reduces the manual to interactive task content of jobs 12 First-stage results are available from the authors upon request. 13 The exception is the lost significance of the native female shock when using the first (more restrictive) task measure and the IV methodology.

21
held by both native men and native women regardless of the task measure or estimation
method (OLS vs. IV) being used. A 5-percentage point increase in the share of foreign-born
workers –similar to the one observed in Figure 2 for the 1999-2007 period and for the sample
under consideration– lowers the native supply of manual to interactive tasks by
approximately 2.5 percent.14 The impact appears to be similar among native men and a bit
larger among native women, whose relative manual task supply drops by approximately 3.5
to 4 percent, depending on the task measure being used.
4.2. The Relative Task Provision of Manual Tasks in the Economy following
Increases in the Shares of Foreign-Born and Native Female Workers
We now turn to the overall economy and examine the impact of both, an increase in
the share of foreign-born and native female workers, on the supply of manual as opposed to
interactive tasks. According to hypothesis no.2, the relative provision of manual tasks in the
economy could remain unchanged, increase or decrease depending on which of the two
supply shocks prevail. To look at it from an empirical perspective, we transform equation
(15) to derive the following regression equation:
( ) ptptpttppt
nativefemShareforeignShareI
M εληδα ++++=⎟⎠⎞
⎜⎝⎛ _)_(ln (17)
Note that, in accordance to their comparative advantages and as specified in greater
detail in the appendix, an increase in foreign-born workers is expected to increase the manual
to interactive task supply in the economy, whereas an increase in the share of native female
workers is predicted to do exactly the opposite. Unlike in the case of just natives, where both
shocks are expected to lower the manual to interactive task supply of all natives –on the one
hand immigrants have a comparative advantage in manual tasks as opposed to natives and, on
14 As a reference, it is worth noting that Peri and Sparber find that a 10 percentage-point increase in the share of less-educated foreign-born workers is associated with a 2 percent decline in the relative supply of manual versus interactive tasks among natives. As such, the rapid immigration growth experienced by the Spanish economy within a period of two decades appears to have had a much stronger impact than in the U.S.

22
the other hand, the entry of native women who tend to occupy jobs less intensive in manual
tasks, reduces the overall native supply of manual to interactive tasks– here the two shocks
have opposing signs. As a result, it is difficult to assess how the overall supply of manual to
interactive tasks in the economy will change following both shocks due to their opposite
signs.
The bottom panel of Table 6 displays the results from estimating equation (17) by
OLS as well as using IV methods correcting for the endogeneity of our two key regressors as
we did in the estimation of equation (16). In general, we find no clear evidence of significant
impacts of increases in neither the share of foreign-born nor the share of native female
workers on the relative task supply of the overall economy. Yet, it is possible that, due to
their simultaneous nature, both shocks cancel each other out, forbidding us to see the
individual impact of each shock on the manual to interactive task supply in the economy.
To partially address this problem, we try to control for the size of the increase in any
given share when looking at the impact of the other one by interacting both supply shocks.
Results are displayed in Table 7. Regardless of the task measure or methodology being used,
the interaction term is negative, thus reflecting the different impact that each shock has on the
relative manual to interactive supply of tasks in the overall economy. What is, however, the
impact of an increase in the share of foreign-born workers on the economy’s relative manual
to interactive task supply? Using the IV results from the more restrictive task measure, a 5-
percentage point increase in the share of foreign-born workers raises the relative manual to
interactive task supply in the economy by 0.85 percent ((1.58 – 3.97*0.355)*5).15 Likewise,
using the broader task measure, the IV estimates indicate that a 10 percentage point increase
15 Note that, because of the interaction term, we cannot simply look at the coefficient for the share of foreign-born and conclude that, because is it not significantly different from zero, an increase in the share of foreign-born workers has no impact on the relative manual to interactive task supply of the economy. Instead, and because the coefficient on the share of foreign-born and the interaction term are jointly different from zero, we need to take into account what the impact of an increase in the share of foreign-born workers would be at the mean of the share of native female workers as indicated above.

23
in the share of foreign-born workers raises the manual to interactive task supply in the
economy by 0.7 percent ((1.37 -3.48*0.355)*5). Hence, as predicted by hypothesis 2a in the
appendix, an increase in the share of foreign-born workers raises the manual to interactive
task supply of the Spanish economy.
What about an increase in the share of native female workers? Do native women
lower the manual to interactive task supply of the economy due to their comparative
advantage in non-manual tasks? The answer is yes. As predicted by hypothesis 2b) in the
appendix, a 5 percentage-point increase in the share of native female workers –similar to the
one experienced between 1999 and 2007– lowers the manual to interactive task supply in the
economy anywhere between 0.2 percent and 1.5 percent.
5. Conclusions
Learning about the impact that immigration has on the labor market of the receiving
nation is a topic of major concern to economists given the ever growing percentage of the
world population living in a country other than her own. Spain is no exception following the
rapid increase in immigrant flows experienced over the past decade. While there is a large
and growing literature on the consequences of migration on the wages of native workers in
the U.S., very little is known about the impact of migration on the employment patterns and
wages of Spanish natives. Furthermore, the literature has generally failed to document a
significant effect of immigration on the wages of less-educated natives, both in the U.S. as
well as in Spain. As recently noted by Ottaviano and Peri (2006), this is not surprising given
that the effect of immigration depends on the degree of substitution between native and
immigrant workers within each education group. If native and immigrant workers of similar
educational attainment posses productive skills that lead them to specialize in different
occupations, it is reasonable to find a small or null impact of immigration on natives’ wages
as immigrants and natives are not competing for the same jobs. As such, the assumption of
24
perfect substitutability between native and immigrant labor may not be a reasonable one to
make. In this vein, some studies (e.g. Dustmann, Frattini and Preston (2008)) have shown
that natives and immigrants in the U.K. of comparable skills do not compete for the same
jobs, which can help explain the lack of a significant impact of immigration on native wages.
With the purpose of gaining a better understanding of the impact of recent
immigration inflows on the Spanish economy, we first empirically assess the degree of
substitution between native and immigrant workers of comparable educational attainment.
Subsequently, we proceed to examining the implication that the increase in the share of
foreign-born may have had on the manual to interactive task supply of (a) Spanish natives
and of (b) the Spanish economy. This type of analysis has previously been performed by Peri
and Sparber (2008) for the U.S. In addition to our focus on Spain, our study differs from
theirs in that we also take into account the simultaneous increase in the share of native female
workers experienced by the Spanish economy during the time period under consideration.
This twist is crucial, not just because of the magnitude of the increase in the native female
labor supply itself, but because native women display different comparative advantages with
regards to manual as opposed to interactive tasks than native men and immigrants.
Therefore, failure to account for their massive entry into the labor market could significantly
bias our findings.
Using data from the 1999 through 2007 Encuesta de Población Activa (EPA), we find
evidence of immigrant and native workers of similar skill levels being employed in different
occupations, hinting on the fact that native and foreign-born workers may not compete for the
same jobs. Thus, using a variant of the model proposed by Peri and Sparber (2008) in their
analysis of the impact of immigration on the U.S. labor market, we look for an explanation of
the impact that recent immigration inflows have had on the Spanish labor market. We find
that the increase in the share of foreign-born workers experienced by the Spanish economy
25
may have resulted in the relocation of natives to jobs with a lower intensity of manual (as
opposed to interactive) tasks. Indeed, the 5 percentage-point increase in the share of foreign-
born workers over the 1999-2007 period appears to have lowered the native relative manual
task supply by approximately 2.5 percent. This relocation may have been intensified by the
massive entry of native women, who display a clear comparative advantage in interactive, as
opposed to manual, tasks.
How have the increase in the share of foreign-born and native female workers
impacted the manual to interactive task supply in the overall economy? We find that this is a
harder question to answer due to the predicted opposite effects of these two supply shocks on
the manual to interactive task supply of the economy. In particular, the increase of 5
percentage-points in the share in foreign-born workers over the time period under
consideration may have raised the manual to interactive task supply of the economy
anywhere between 0.7 (using the broader task measure) and 0.85 percent (using the more
restrictive task measure). In contrast, the 5 percentage-points increase in the share of native
female workers may have helped lowered it between 0.2 (using the more restrictive task
measure) and 1.5 percent (using the broader task measure).

26
Appendix – Proofs of Hypotheses 1 and 2
1. Hypothesis no.1: 0)()(
)(**
* <∂
∂+
∂∂
= dgg
mdf
fm
md nnn
1.a. 0)( *
<∂
∂f
m n
Consider the equilibrium provision of relative tasks supplies offered by natives – eq. (14):
{l
43421
321
444 3444 2144 344 21
α
ρ
αλαα
αλααλ
ββ
−
+−−
+−
⎥⎥⎥⎥⎥
⎦
⎤
⎢⎢⎢⎢⎢
⎣
⎡
⎟⎟
⎠
⎞
⎜⎜
⎝
⎛
+−⎪⎭
⎪⎬⎫
⎪⎩
⎪⎨⎧
⎟⎟
⎠
⎞
⎜⎜
⎝
⎛
++−+⎟⎟⎠
⎞⎜⎜⎝
⎛−
=
11
)1(,)1(
*
21
,,,1
E
nwmm
E
nwmimm
B
L
Ln egeeegfem
If we take the partial derivative with respect to f:
0)1(1
..)(
111
)1()1(
1112
*
<∂∂
⎟⎟⎠
⎞⎜⎜⎝
⎛+−
−⎟⎟⎠
⎞⎜⎜⎝
⎛−
=∂∂
=∂
∂−
+
−+−
−+−−
ααλαααλα
αλ
ρ
αλαα
ββ
ρ nmm
mL
Ln ef
ee
fE
EEBf
m l
1.b. 0)( *
<∂
∂g
m n
⎭⎬⎫
⎩⎨⎧
∂∂
+∂∂
=∂
∂ −−
gEEE
gEEEB
gm n 21
2111
12
*
...)( ll
lρρρ
Given that ρ <0, and 01 <∂∂
gE , 02 <
∂∂
gE , the partial derivative is negative if:
gEEE∂∂− 21
21 . ll
ρ >gEEE∂∂− 11
12 . ρρl
or:
gEEE∂∂− 21
21 . ll
ρ
gEEE∂∂− 11
12 . ρρl>1
However, it is immediate to see that the above inequality is satisfied if we take into account
that : , .l > | | and g
E∂∂ 2 >
gE∂∂ 1 .
27
2. Hypothesis no. 2: 0)()(
)(**
* ≥≤∂
∂+
∂∂
= ordggm
dff
mmd
Consider equation (15), i.e.:
αλααλ
αλααλ
ββ
+−−
+−
⎪⎪
⎭
⎪⎪
⎬
⎫
⎪⎪
⎩
⎪⎪
⎨
⎧
⎥⎥⎥⎥⎥
⎦
⎤
⎢⎢⎢⎢⎢
⎣
⎡
⎟⎟⎟
⎠
⎞
⎜⎜⎜
⎝
⎛
++−+⎟⎟⎠
⎞⎜⎜⎝
⎛−
=
)1()1(
)1(*
2
3
,,,1
444 3444 2144 344 21E
nwmimm
B
L
L eegfem
2.a. 0)( *
>∂
∂
fm
( ) ( ) 0)1(
)1()( 31)1(
)1(
3
2* 2
>∂∂
+−−
=∂
∂
+
−+−
−
fE
EBf
mαλα
αλ
αλααλ
2b. 0)( *
<∂
∂gm
( ) ( ) 0)1(
)1()( 31)1(
)1(
3
2* 2
<∂∂
+−−
=∂
∂
−
−+−
−
gE
EBg
mαλα
αλ
αλααλ
28
References
Amuedo-Dorantes, Catalina and Sara De la Rica. 2008. “Does Immigration Raise Natives’ Income? National and Regional Evidence from Spain”, IZA Discussion Paper # 3486.
Autor, David H., Frank Levy, and Richard J. Murnane. 2003. “The Skill Content of Recent
Technological Change: An Empirical Exploration” Quarterly Journal of Economics, 118(4), pp: 1279-1334.
Bentolila, Samuel. 2001. “Las Migraciones Interiores in España”, Working Paper FEDEA # 2001-07.
Borjas, George. 1994. “The Economics of Immigration,” Journal of Economic Literature, December 1994, pp. 1667-1717.
Borjas, George. 1995. “The Economic Benefits of Immigration”, Journal of Economic Perspectives, vol. 9, no. 2. Borjas, George. 1999. “The Economic Analysis of Immigration,” in Handbook of Labor Economics, Volume 3A, edited by Orley Ashenfelter and David Card, North-Holland, pp. 1697-1760.
Borjas, George. 2003. “The Labor Demand Curve is Downward Sloping: Reexamining the impacts of Immigration on the Labor Market” Quarterly Journal of Economics, 118, pages: 1334-1374. Borjas, George. 2005. “The Labor Market Impact of High Skill Immigration,” American Economic Review, May. Borjas, George and Larry Katz. 2007. “The Evolution of the Mexican-Born Workforce in
the United States” (with Lawrence F. Katz), in Mexican Immigration to the United States, edited by George J. Borjas, University of Chicago Press.
Card, David. 1990. “The Impact of the Mariel Boatlift on the Miami Labor Market.” Industrial and Labor Relations Review, 43 (January 1990).
Card, David. 2001. “Immigrant Inflows, Native Outflows and the Local Labor Market Impacts of Higher Immigration” Journal of Labor Economics, 19 (January).
Card, David. 2005. “Is the New Immigration Really So Bad?” Economic Journal, 115. Card, David and John E. Dinardo. 2000. “Do Immigrant Inflows Lead to Native Outflows?” American Economic Review, 90, May. Card, David and Ethan Lewis. 2007. “The Diffusion of Mexican Immigrants During the
1990s: Explanations and Impacts.” in Mexican Immigration to the United States, edited by George J. Borjas, University of Chicago Press.
Carrasco, R., JF. Jimeno and AC Ortega (2008), “The effect of immigration on the labor
market performance of native-born workers: some evidence for Spain”, Journal of Population Economics, 21, (3), pp: 627-649
29
Cortes, Patricia. 2006. How Low-Skilled Immigration Is Changing United States Prices and Labor Markets: Three Essays. Ph.D. Dissertation, Massachusetts Institute of Technology.
Dustmann, Christian, Tommaso Frattini and Ian Preston. 2008. “The Effect of Immigration along the Distribution of Wages”, CReAM Discussion Paper # 03/08.
Furtado, Delia and Heinrich Hock. 2008. “Immigrant Labor, Child-Care Services, and the Work-Fertility Trade-Off in the United States”. IZA Working Paper.
Gonzalez, Libertad and Francesc Ortega. 2007. “How do Very Open Economies Absorb Large Immigration Flows? Recent Evidence from Spanish Regions”, Mimeo.
Lewis, Ethan. 2003. “Local Open Economies within the US: How do industries respond to Immigration?” Working Paper No. 04-1, Federal Reserve Bank of Philadelphia.
Ottaviano, Gianmarco and Giovanni Peri. 2005. “Rethinking the Gains from Immigration: Theory and Evidence from the U.S.” NBER Working Paper # 11672.
Ottaviano, Gianmarco and Giovanni Peri. 2006. “Rethinking the Gains from Immigration on Wages” NBER Working Paper # 12497.
Peri, Giovanni. 2006. “Immigrants’ Complementarities and Native Wages: Evidence from California”, Working Paper, University of California.
Peri, Giovanni and Chad Sparber. 2008. “Task Specialization, Immigration and Wages”, NBER Discussion Paper # 02/08.
Saiz, Albert. 2003. “Room in the Kitchen for the Melting Pot: Immigration and Rental
Prices,” Review of Economics and Statistics, 85:3, pp. 502-21. Zellner, Arnold. 1962. “An efficient method of estimating seemingly unrelated regression
equations and tests for aggregation bias”. Journal of the American Statistical Association 57: 348–368.

30
Table 1 Descriptive Statistics - Natives and Immigrants (1999-2007)
Variables Native Men
Native Women
Recent Immigrants
All Immigrants
Average Age 40.23 38.6 33.1 35.3 Distribution by age categories (%):
<30 years 25.3 25.9 44.1 36.08 31-35 years 12.5 13.7 19.4 19.2 36-40 years 13.3 14.4 14.7 16.6 41-45 years 13.6 14.1 10.2 11.8 >45 years 35.2 28.8 11.6 16.3 Percentage Female (%) Education (%):
38.8 45.5 42.9
Primary or Less 24.8 18.0 23.09 25.9 Secondary 51.0 46.8 55.04 52.05 University 24.1 35.2 21.04 21.9 Average Hourly Log Wage 7.13
(4.20) 6.30
(3.97) (*) 4.83
(2.96) Observations (in Spanish CPS) 353,797 223,675 12,324 19,167
Note: Working individuals between 16 and 65 years of age. The sample of recent immigrants contains immigrants whose length of stay in Spain is at most 5 years. All features are taken from the Spanish Current Population Sample, except for Average Wages, which are taken from a pooled sample of 2004-2006 European Survey of Living Conditions for Spain. (*) We cannot report average wages of recent immigrants because the EU-SILC does not contain information on the length of stay of immigrants in Spain.

31
Table 2 Occupational Distribution (%) – Non-University Natives and Immigrants (1999-2007)
Occupations Native Men
Native Women
Recent Immigrants
All Immigrants
Average Hourly Log
Wage
Managers 8.32 8.01 1.4 3.5 8.41 Professionals 0.53 0.65 0.3 0.5 9.97 Technicians and Assoc. professionals 7.18 8.10 1.8 2.6 7.41 Clerical support workers 5.18 13.69 2.1 2.7 6.70 Service and sales workers 10.61 30.39 19.3 19.4 5.08 Skilled agricultural/fishery workers 7.04 3.97 2.2 2.2 4.62 Craft and related trade workers 30.34 4.62 19.6 20.2 5.57 Plant/machine operators and assemblers
17.24 5.22 5.5 6.6 6.21
Elementary Occupations 13.55 25.36 47.7 42.4 4.74
N. observations 268,410 144,905 9683 14800
Note: The Occupational Distribution is taken from a Pooled sample of 1999-2007 Current Population Survey. Data on average Hourly wage are taken from the 2004-2006 EU-SILC survey for Spain. Natives are of all working-age individuals with less than a university education. Recent Immigrants include only those with at most 5 years of stay in Spain.

Table 3 Occupational Distribution (%) of Natives and Immigrants by Educational Level
Secondary Primary or less
Native
Men Native
Women Recent
Immigrant All
Immigrants Native Men
Native Women
Recent Immigrant
All Immigrants
Managers 8.41 6.78 1.6 3.8 8.15 11.19 1.1 2.7 Professionals 0.73 0.84 0.4 0.7 0.13 0.16 0.0 0.02 Technicians and professionals 9.45 10.49 2.3 3.6 2.53 1.88 0.5 0.56 Clerical support workers 6.59 17.48 2.5 3.4 2.29 3.82 1.06 1.16 Service and sales workers 12.08 33.61 22.2 22.6 7.61 22.00 12.3 12.41 Skilled agricultural/fishery workers 4.73 1.99 2.05 1.8 11.79 9.13 2.7 3.02 Craft and related trade workers 28.96 4.26 19.6 19.5 33.17 5.53 19.5 21.8 Plant/machine operators and assemblers 16.94 5.39 6.03 6.7 17.86 4.78 4.12 5.5 Elementary Occupations 12.12 19.15 43.2 37.7 16.47 41.51 58.5 52.8
Note: The Occupational Distribution is taken from a Pooled sample of 1999-2007 Current Population Survey. Data on average Hourly wage are taken from the 2004-2006 EU-SILC survey for Spain. Natives are of all working-age individuals with less than a university education. Recent Immigrants include only those with at most 5 years of stay in Spain.
Table 4 Average Log Wages of Natives and Immigrants across Skill Groups
Average Wage Gap within Skills
Skills
Native Men Native Women All Immigrants
Mean Log Wage
Distribution across Skills
(%)
Mean Log Wage
Distribution across Skills
(%)
Mean Log Wage
Distribution across Skills
(%)
<30, Primary or less 1.41
(.57) 4.14 1.07
(.84) 2.71 1.33
(.45) 7.02
<30, Secondary 1.46 (.58)
23.11 1.26 (.61)
24.43 1.37 (.56)
33.25
31-35, Primary or less 1.60 (.44)
2.33 1.31 (.65)
1.81 1.19 (.84)
4.51
31-35, Secondary 1.74 (.42)
9.62 1.48 (.55)
11.38 1.45 (.48)
16.04
36-40, Primary or less 1.66 (.46)
2.81 1.30 (.67)
2.50 1.56 (.39)
3.59
36-40, Secondary 1.78 (.50)
11.51 1.53 (.60)
12.13 1.41 (.53)
11.95
41-45, Primary or less 1.60 (.50)
3.81 1.40 (.56)
3.66 1.23 (.47)
3.01
41-45, Secondary 1.87 (.47)
11.01 1.56 (.62)
13.12 1.37 (.60)
8.77
>45, Primary or less 1.73 (.48)
13.87 1.40 (.59)
11.46 1.47 (.42)
4.43
>45, Secondary 1.94 (.50)
17.80 1.68 (.54)
16.82 1.38 (.51)
7.44
Source: 2004-2006 Pooled EU-SILC Survey for Spain.

34
Table 5 Tasks Intensity in each of the ISCO88-2digit Occupations
Occupations (ISCO88 code) Manual Interactive
Ratio Manual/
Interactive No. of
Workers
Share of Foreign-born (%)
12. Corporate Managers 0.49 0.99 0.49 9912 0.2
13. Managers of Small Enterprises 0.49 0.94 0.52 24168 0.4
21. Physics, Mathematics and Engineering Science Professionals
0.47 0.93 0.50 309 0.3
22. Life Science and Health Professional 0.57 0.96 0.59 71 1.4
23. Teaching Professionals 0.54 0.94 0.57 1145 1.4
24. Other Professionals 0.47 0.98 0.48 887 1.3
31. Physical and Engineering Science Associated Professionals
0.67 0.87 0.77 4382 0.6
32. Life Science and Health Professionals 0.67 0.91 0.73 1467 0.5
33. Teaching Associated Professionals 0.48 0.85 0.56 574 0.5
34. Other Associated Professionals 0.48 0.94 0.51 24756 0.5
41. Office Clerks 0.53 0.87 0.60 16598 0.3
42. Customer Services Clerks 0.53 0.89 0.59 17344 0.8
51. Personal and Protect. Service Workers 0.71 0.84 0.84 48376 3.2
52. Models, Salespersons and Demonstrators
0.66 0.78 0.84 26012 1.1
61. Skilled Agriculture and Fishery Workers
0.86 0.72 1.18 24878 0.8
71. Extraction and Building Trades Workers
0.87 0.66 1.32 47508 2.6
72. Metal, Machinery and Related Trade Workers
0.86 0.269 1.24 998 0.4
73. Precision, Handicraft, Craft Printing and Related Trade
0.80 0.62 1.30 33933 1.4
74. Other Craft and Related Trade Workers 0.80 0.59 1.35 7577 1.9
81. Stationary Plant and Related Operators 0.85 0.68 1.25 5170 1.9
82. Machine Operators and Assemblers 0.81 0.65 1.25 19976 1.0
83. Drivers and Mobile Plant Operations 0.86 0.72 1.18 29224 0.9
91. Sales and Services Elementary Operations
0.70 0.73 0.95 41916 5.8
92. Agricultural, Fishery and Related Labourers
0.92 0.58 1.56 9185 9.4
93. Labourers in Mining, Construction, Manufacturing and Transportation
0.86 0.82 1.49 26634 4.9
35
Table 6 Impact of the Share of Foreign Born and of the Share of Native Women on the Supply of Tasks
Dependent Variable (in Logs)
Task Measure 1 Task Measure 2
OLS IV OLS IV
Share of Foreign-
born
Share of Native Female
Workers
Share of Foreign-born
Share of Native Female
Workers
Share of Foreign-born
Share of Native Female
Workers
Share of Foreign-born
Share of Native Female
Workers
Hypothesis 1:
All Natives -0.33**
(0.09) -0.17**
(0.06) -0.54**
(0.18) -0.22(0.17)
-0.29** (0.09)
-0.16**
(0.05) -0.48** (0.16)
-0.21*
(0.15) All Native Men -0.34**
(0.11) -0.07 (0.06)
-0.47** (0.15)
-0.20 (0.19)
-0.30**
(0.10) -0.01 (0.05)
-0.41** (0.26)
-0.18 (0.18)
All Native Women -0.44**
(0.15) - -0.81**
(0.28) - -0.40**
(0.14) - -0.72**
(0.26) -
Hypothesis 2:
All the Economy 0.05 (0.07)
-0.20**
(0.05) -0.14 (0.15)
-0.23(0.16)
0.03 (0.06)
-0.19***
(0.04) -0.13 (0.13)
-0.21*
(0.14) All Males 0.07
(0.10) -0.04(0.05)
-0.05(0.26)
-0.21 (0.18)
0.05 (0.09)
-0.04 (0.05)
-0.05 (0.23)
-0.19 (0.17)
All Women -0.06 (0.13)
- -0.42* (0.25)
- -0.07 (0.12)
- -0.39 (0.22)
-
N. observations 468
Notes: *** indicates significant at the 1% level, ** indicates significant at the 5% level and * indicates significant at the 10% level. Each reported coefficient is the impact of the share of foreign-born or of the share of Native Female Workers on each of the dependent variables stated in the left column. For each Task Measure, the coefficients reported in each row are the result of different regressions. All regressions include a full set of region dummies (50) plus controls for time (7 dummies), average age and the proportion of workers with secondary education at cell level. All regressions are weighted by the cell (province, year) size and standard errors are corrected for clustering at cell level. The Instrument for the share of foreign-born in the IV regressions is the share of non-recent immigrants with more than five years of residence. The instrument for the share of native females is the share of native females among workers with university education excluded from our sample of study.

36
Table 7 Impact of the Share of Foreign Born and of the Share of Native Women on the Supply of Tasks - Interactions between the two supply shocks
Dependent Variable (in Logs)
OLS IV
Share of Foreign-born
Share of Native Female Workers
Share of Foreign-
born*Share Native Women
Share of Foreign-born
Share of Native Female Workers
Share of Foreign-
born*Share Native Women
Task Measure 1
All Economy 1.73**
(0.51) -0.10**
(0.05) -4.34* (1.30)
1.58 (1.08)
-0.16**
(0.15) -3.97 (2.51)
Task Measure 2
All Economy 1.54
(0.47) -0.11**
(0.10) -3.89** (1.19)
1.37 (0.97)
-0.39**
(0.30) -3.48* (2.25)
N. observations 468
Notes: *** indicates significant at the 1% level, ** indicates significant at the 5% level and * indicates significant at the 10% level. Each reported coefficient is the impact of the share of foreign-born or of the share of Native Female Workers on each of the dependent variables stated in the left column. For each Task Measure, the coefficients reported in each row are the result of different regressions. All regressions include a full set of region dummies (50) plus controls for time (7 dummies), average age and the proportion of workers with secondary education at cell level. All regressions are weighted by the cell (province, year) size and standard errors are corrected for clustering at cell level. The Instrument for the share of foreign-born in the IV regressions is the share of non-recent immigrants with more than five years of residence. The instrument for the share of native females is the share of native females among workers with university education excluded from our sample of study.

37
Figure 1 Evolution of Employment Rate by Gender
Source: EPA – All individuals between 16-65 years. Employment rate is the ratio between the total employed and the total number of working age individuals.
25
35
45
55
65
75
85
95
Years
Empl
oym
ent R
ate
Employment Rate - Men Employment Rate - Women
38
Figure 2 Employment Rate of Low Educated Native Women and of Foreign-Born (%)
Source: EPA 1999-2007 – 2nd terms. The calculations are based on working individuals aged 16-65 with less than university education.
0
5
10
15
20
25
30
35
1999 2000 2001 2002 2003 2004 2005 2006 2007
Share of Native Women Share of Foreign Born

39
Figure 3 Distribution of Less Educated Immigrants and Native Women along
the Male Native Wage Distribution
Source: European Survey of Living Conditions, Spain. Pooled 2004-2006 Data.
0
5
10
15
20
25
1,15 1,4 1,55 1,65 1,74 1,84 1,94 2,07 0,27 >2.27
% Im
mig
rant
s an
d of
Nat
ive
Wom
en
Deciles of Male Native Wage Distribution
Native Men Native Women Immigrants
40
Figure 4 Relative Manual to Interactive Task Supply by Native and Foreign-Born Workers
Figure 5 Relative Manual to Interactive Intensity of Native versus Immigrant Tasks
Note: Each dot represents a (province, year) cell for those Spanish provinces with at least 2.5 percent of foreign-born workers over the entire period.
11.
051.
11.
15R
elat
ive
Man
ual/I
nter
activ
e Ta
sk S
uppl
y
1998 2000 2002 2004 2006 2008Year
Foreign-born Natives
01
2Fo
reig
n-B
orn
0 1 2Natives
Time Period: 1999-2007

41
Figure 6 Employment Rate of Low Educated Natives over the Sample Period
Source: EPA 1999-2007 – 2nd terms. The calculations are based on native individuals aged 16-65 with less than university education.
30
35
40
45
50
55
60
65
70
1999 2000 2001 2002 2003 2004 2005 2006 2007
Women Men

42
Figure 7 Relative Manual to Interactive Task Supply by Native Men and Women
Figure 8 Relative Manual to Interactive Intensity of Native Male and Female Tasks
Note: Each dot represents a (province, year) cell for those Spanish provinces with at least 2.5 percent of foreign-born workers over the entire period.
.85
.9.9
51
1.05
1.1
Rel
ativ
e M
anua
l/Int
erac
tive
Task
Sup
ply
1998 2000 2002 2004 2006 2008Year
Native Women Native Men
.5.7
51
1.25
1.5
Nat
ive
Wom
en
.5 .75 1 1.25 1.5Native Men
Time Period: 1999-2007
Related Documents


