Enterprise and Industry Performance and Implementation of EU Industrial Policy Scoreboard Competitiveness Performance Member States’ Industrial A Europe 2020 Initiative 2013 EDITION

Welcome message from author
This document is posted to help you gain knowledge. Please leave a comment to let me know what you think about it! Share it to your friends and learn new things together.
Transcript
Enterpriseand Industry
Performance and Implementation of EU Industrial Policy
Scoreboard
Competitiveness
Performance
Member States’
Industrial
A Europe 2020 Initiative2013 EDITION
Commission staff working document
Industrial Performance Scoreboard
and
Member States’ Competitiveness
Performance and Implementation of EU
Industrial Policy SWD(2013) 346
A Europe 2020 Initiative 2013 EDITION

This report has been written by the staff of the Directorate-General for Enterprise and Industry,
European Commission. Any comments are welcome to the following e-mail address:
More information on the European Union is available on the Internet (http://europa.eu).
© European Union, 2013
Reproduction of the text is authorised provided the source is acknowledged.

1
Foreword by Vice-President Antonio Tajani
Growth and employment can only be achieved through competitive enterprises. The task of policy-makers is to
create an environment where entrepreneurs can fulfil their ambitions and contribute to a sustainable and balanced
growth of our economies. This has been and continues to be my goal.
The purpose of this annual report drafted by the Commission – pursuant to Article 173 of the Treaty – is to
review and compare the industrial performance and policies of the EU as a whole and of individual Member
States. It builds upon the country-specific recommendations and supporting documents of the May 2013
European Semester, feeds into the policy monitoring cycle of the next cycle, and focuses on microeconomic
policies where it deepens the analysis. This report will help policy-makers to focus on obstacles to growth, and
advocates the learning of lessons from good practices. There is considerable scope for this, as the differences in
competitiveness between the Member States are considerable.
In addition to country-specific problems like low productivity, lacking innovation capacity, and high
administrative burden, there are common problems that affect many Member States. These include access to
finance, access to markets, the price of energy, and the lack of investment. You will find a deeper analysis of
these issues in this report.
For my part, I would like to emphasise the importance of industry as the cornerstone of our economies. Those
Member States with a diversified economy and strong industrial base have fared much better in the crisis. But a
strong industrial base is not built on sand. It needs high levels of skills, it needs constant innovation and
investment.
We need a better single market for the products and services of our industries. But Europe is not enough,
especially as 70% of the growth by 2020 will be in the emerging countries. To support our exporting industries, I
have initiated missions of growth to Latin America, the United States, North Africa, Russia and China. I will
continue these missions, in particular to Burma, Thailand and Vietnam.
I hope that his report will help to put the performance and policies of Europe and its Member States into a wider
context, and that it will promote reform and renewal.
Antonio TAJANI
Vice-President
European Commission
2
CONTENTS
Executive Summary ............................................................................. 4
1 Industrial performance scoreboard ............................................. 8
1.1. Introduction........................................................................................................................................... 8
1.2. The real magnitude of the impact of this crisis on industry .................................................................. 9
1.3. Why is recovery taking so long? ......................................................................................................... 12
1.4. Why is investment unresponsive? ....................................................................................................... 22
1.5. Overall performance in Member States .............................................................................................. 24
1.6. Innovation and Sustainability ............................................................................................................. 30
1.7. Export performance ............................................................................................................................ 34
1.8. Business environment and infrastructure ............................................................................................ 37
1.9. Finance and investment ...................................................................................................................... 42
1.10. Productivity and skills ........................................................................................................................ 44
2 Implementation of EU industrial policy .................................... 47
2.1. Introduction......................................................................................................................................... 47
2.2. Investment in innovation: state of play in the six priority action lines ............................................... 47
2.3. Access to markets ............................................................................................................................... 55
2.4. Access to finance ................................................................................................................................ 60
2.5. Human capital and skills development ............................................................................................... 63
3 Overview of progress by policy area in Member States .......... 65
3.1. Innovation and sustainability .............................................................................................................. 66
3.2. Business environment, services and infrastructure ............................................................................. 74
3.3. Improvements in public administration .............................................................................................. 78
3.4. Finance and investment ...................................................................................................................... 84
3.5. Skills ................................................................................................................................................... 89
4 Country chapters .......................................................................... 92
4.1. Belgium .............................................................................................................................................. 92
4.2. Bulgaria .............................................................................................................................................. 98
4.3. Czech Republic ................................................................................................................................. 103
4.4. Denmark ........................................................................................................................................... 110
4.5. Germany ........................................................................................................................................... 116
4.6. Estonia .............................................................................................................................................. 122
3
4.7. Ireland ............................................................................................................................................... 128
4.8. Greece ............................................................................................................................................... 134
4.9. Spain ................................................................................................................................................. 142
4.10. France ............................................................................................................................................... 150
4.11. Croatia .............................................................................................................................................. 156
4.12. Italy ................................................................................................................................................... 163
4.13. Cyprus ............................................................................................................................................... 169
4.14. Latvia ................................................................................................................................................ 174
4.15. Lithuania ........................................................................................................................................... 180
4.16. Luxembourg ...................................................................................................................................... 186
4.17. Hungary ............................................................................................................................................ 191
4.18. Malta ................................................................................................................................................. 197
4.19. Netherlands ....................................................................................................................................... 202
4.20. Austria .............................................................................................................................................. 208
4.21. Poland ............................................................................................................................................... 215
4.22. Portugal ............................................................................................................................................. 221
4.23. Romania ............................................................................................................................................ 228
4.24. Slovenia ............................................................................................................................................ 235
4.25. Slovakia ............................................................................................................................................ 241
4.26. Finland .............................................................................................................................................. 247
4.27. Sweden .............................................................................................................................................. 253
4.28. United Kingdom ............................................................................................................................... 260
5 Annex: Methodology and indicators used ............................... 266
5.1. Definitions of the indicators.............................................................................................................. 266
5.2. Methodological note on clustering .................................................................................................... 281
5.3. Methodological note on the introductory graph in the country chapters .......................................... 282

4
Executive Summary
This annual report is prepared by the Commission
pursuant to Article 173 of the Treaty on the
Functioning of the European Union. The report
reviews and compares the industrial performance of
the EU as a whole and of individual Member States,
based on indicators in the areas of industrial
innovation and sustainability; business environment
services and infrastructure; public administration;
finance and investment; and skills. This year the
report also covers the implementation of European
industrial policy. The report focuses on the
microeconomic policy aspects of growth and
competitiveness, complementing the analysis of the
European Semester 2013.1
Unusually harsh economic conditions, global
macroeconomic uncertainties and structural
difficulties have kept the short term outlook
negative for European industry. Although the
industrial performance of the economy has
stabilised and our external performance has been
improving, we have not yet returned to pre-crisis
levels.
Annual figures at the end of June 2013 indicate that
the contribution of manufacturing to gross value
added in the EU has fallen from 15.4 % to 15.1 % a
year ago, keeping us far from the 20 % goal as set
by the October 2012 Industrial Policy
Communication Update.2 In some countries there
has been a decline, but the manufacturing sectors in
Germany, Austria, Ireland, the Netherlands and the
UK have been largely able to maintain their pre-
crisis share in the EU’s manufacturing production.
In Greece and Portugal manufacturing increased its
relative size in 2012, and manufacturing grew
strongly also in several catching-up economies such
as Bulgaria, Romania, Czech Republic, Slovakia,
Hungary, Lithuania and Latvia. There are
successful elements of industrial policy on national
level in several Member States and lessons can
often be learned from partners within the EU.
1 Many of the reform areas referred to below and further in
this report have been the objects of recommendations in
the context of the European Semester 2013; see
http://ec.europa.eu/europe2020/making-it-happen/country-specific-recommendations/index_en.htm.
2 COM (2012) 582.
We are now in the second dip of the industrial
recession that, albeit less severe than the 2009
slump, risks stagnating European industry in the
long run. Downside risks in financial markets and
subdued macroeconomic conditions can only be
dispelled if there is a return to growth. However,
private investment remains low and unresponsive to
Member State efforts as well as supply side
measures at EU level.
Internationalisation efforts have produced results
that are visible in the very strong export
performance of European industry, but adjustment
has been sluggish and there is a risk of fragmenting
the single market. The scarcity of high technology
skills and the need for retraining also constitute
obstacles to speedy restructuring in the EU.
Two major factors jeopardise the successful
implementation of industrial policy in Europe. First,
remaining barriers in the internal market, fiscal
consolidation, the prolonged period of bank
deleveraging and low demand are contributing to a
sluggish performance. Second, investment has
remained well below its long-term trend, partly due
to economic and political uncertainties. In 2012,
investment in machinery and equipment – initially
relatively resilient to the crisis – followed the
decline of other components of gross fixed capital
formation.
While the economies of individual Member States
differ, their industrial competitiveness is affected
by many common factors. In 2012, the Commission
launched the Industrial Performance Scoreboard,
assessing Member States’ performance across
several dimensions: manufacturing productivity;
educational attainment in manufacturing; export
performance; innovation capacity; energy intensity;
business environment; electricity prices;
satisfaction with infrastructure; and bank lending
and investment in equipment.
To facilitate the analysis and comparison of
countries with roughly similar features, the report
has used cluster analysis to group Member States in
three groups. These groups are by definition only
roughly similar, and some countries are further
away from the core of a group than others.
Executive Summary
5
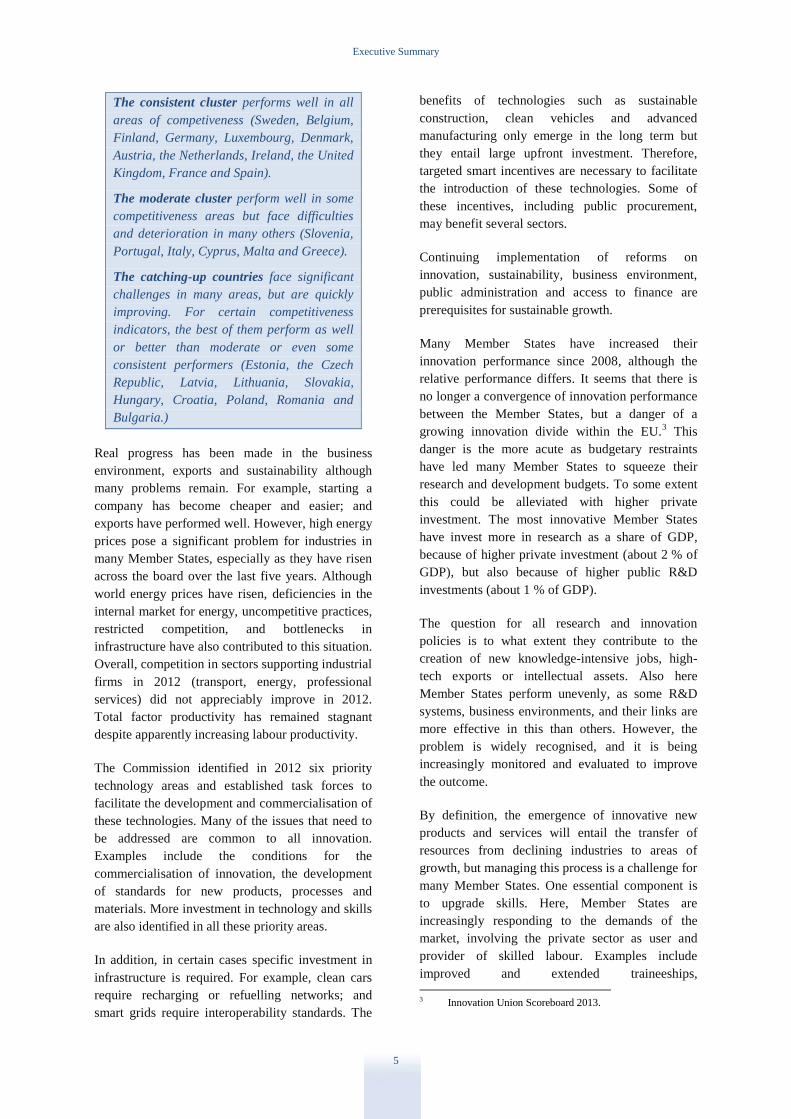
The consistent cluster performs well in all
areas of competiveness (Sweden, Belgium,
Finland, Germany, Luxembourg, Denmark,
Austria, the Netherlands, Ireland, the United
Kingdom, France and Spain).
The moderate cluster perform well in some
competitiveness areas but face difficulties
and deterioration in many others (Slovenia,
Portugal, Italy, Cyprus, Malta and Greece).
The catching-up countries face significant
challenges in many areas, but are quickly
improving. For certain competitiveness
indicators, the best of them perform as well
or better than moderate or even some
consistent performers (Estonia, the Czech
Republic, Latvia, Lithuania, Slovakia,
Hungary, Croatia, Poland, Romania and
Bulgaria.)
Real progress has been made in the business
environment, exports and sustainability although
many problems remain. For example, starting a
company has become cheaper and easier; and
exports have performed well. However, high energy
prices pose a significant problem for industries in
many Member States, especially as they have risen
across the board over the last five years. Although
world energy prices have risen, deficiencies in the
internal market for energy, uncompetitive practices,
restricted competition, and bottlenecks in
infrastructure have also contributed to this situation.
Overall, competition in sectors supporting industrial
firms in 2012 (transport, energy, professional
services) did not appreciably improve in 2012.
Total factor productivity has remained stagnant
despite apparently increasing labour productivity.
The Commission identified in 2012 six priority
technology areas and established task forces to
facilitate the development and commercialisation of
these technologies. Many of the issues that need to
be addressed are common to all innovation.
Examples include the conditions for the
commercialisation of innovation, the development
of standards for new products, processes and
materials. More investment in technology and skills
are also identified in all these priority areas.
In addition, in certain cases specific investment in
infrastructure is required. For example, clean cars
require recharging or refuelling networks; and
smart grids require interoperability standards. The
benefits of technologies such as sustainable
construction, clean vehicles and advanced
manufacturing only emerge in the long term but
they entail large upfront investment. Therefore,
targeted smart incentives are necessary to facilitate
the introduction of these technologies. Some of
these incentives, including public procurement,
may benefit several sectors.
Continuing implementation of reforms on
innovation, sustainability, business environment,
public administration and access to finance are
prerequisites for sustainable growth.
Many Member States have increased their
innovation performance since 2008, although the
relative performance differs. It seems that there is
no longer a convergence of innovation performance
between the Member States, but a danger of a
growing innovation divide within the EU.3 This
danger is the more acute as budgetary restraints
have led many Member States to squeeze their
research and development budgets. To some extent
this could be alleviated with higher private
investment. The most innovative Member States
have invest more in research as a share of GDP,
because of higher private investment (about 2 % of
GDP), but also because of higher public R&D
investments (about 1 % of GDP).
The question for all research and innovation
policies is to what extent they contribute to the
creation of new knowledge-intensive jobs, high-
tech exports or intellectual assets. Also here
Member States perform unevenly, as some R&D
systems, business environments, and their links are
more effective in this than others. However, the
problem is widely recognised, and it is being
increasingly monitored and evaluated to improve
the outcome.
By definition, the emergence of innovative new
products and services will entail the transfer of
resources from declining industries to areas of
growth, but managing this process is a challenge for
many Member States. One essential component is
to upgrade skills. Here, Member States are
increasingly responding to the demands of the
market, involving the private sector as user and
provider of skilled labour. Examples include
improved and extended traineeships,
3 Innovation Union Scoreboard 2013.

Executive Summary
6
apprenticeships and vocational training, as many
Member States have introduced reforms and action
plans aimed at improving the involvement of
employers and the coordination of the provision of
vocational education and training and the skills
demands emerging from the market.
For growth to be sustainable, we need to continue
to reduce the energy and carbon intensity of our
economies. Considerable improvement has been
achieved by industrial restructuring in the catching-
up Member States, although many still have some
distance to go to reach the EU average. This is
likely to be economically profitable as EU energy
prices increased in 2012 (5.8 % for industrial
users), despite the weakness of the economy.
Member States are also seeking to extend resource
efficiency beyond energy to waste and raw
materials.
Businesses that focus on environmental goods and
services are benefiting from the trend towards
sustainability, although estimates vary.4 But for full
benefits to materialise, stable policies in resource
efficiency, climate and energy, and robust
regulatory environment, including virtual platforms,
would be beneficial in order to facilitate the
efficient matching of supply and demand.
Member States have improved their business
environment considerably, keeping the EU average
high. The time needed to start a company has
decreased in 13 and start-up costs have come down
in 22 Member States. However, many competitors
are improving their business environment even
faster. While the top EU performers are among the
best in the world, the worst Member States can be
found in the lowest quartile. Clearly, there is a lot
of room for improvement. And in many cases the
Member States have been focusing on the narrow
set of indicators of the World Bank’s Doing
Business that are not enough to achieve a fully
favourable business environment.
Modernising public administration requires
strengthening strategic design and implementation:
ministries and public authorities at national,
regional and local levels should improve their
4 Employment in eco-industries grew an estimated 2. 8 %
annually between 2000 and 2008, although estimates for 2009-12 are much higher at over 8 %.
http://ec.europa.eu/environment/enveco/jobs/pdf/jobs.pdf.
capacities to define key challenges, identify the
main priorities to address these challenges, assess
the economic, social and environmental impact of
interventions, and design appropriate action plans
with clear milestones. However, an integrated
approach is crucial: in order to avoid a proliferation
of strategies on public administration reform, the
development and implementation of such strategies
should be closely coordinated across all relevant
departments.
An efficient public administration is an essential
factor in policies promoting jobs, growth and
competitiveness. They need to implement a stable,
transparent and consistent regulatory framework
that crucial for new investment. Further, reduction
of the administrative burden on businesses, and
strengthening the administrative capacity to support
business services, in particular online, and
modernisation information infrastructures, are all
essential. Sustainable growth and competitiveness
therefore require more effective, client-oriented,
and forward-looking public administrations that can
manage risks, have a systematic innovation policy,
can manage scarce resources well, and can
effectively coordinate and implement policies.
Similarly, an effective high-quality and independent
justice system contributes to trust and stability.5
Predictable, timely and enforceable judicial
decisions are an important part of an attractive
business environment, and conversely, slow and
outdated legal systems have a major negative
economic impact.
The most prominent areas of reform are reducing
the administrative burden on firms, enhancing
capacity for strategic and budgetary planning, and
ensuring strategic and effective human resources
management. Further, in particular for countries
with multi-tiered administrative structures,
improving coordination between levels of
administration has been on the agenda. Reforms
have also sought to strengthen the corporate
governance of state-owned enterprises, and to
improve the efficiency, quality and independence of
the judicial system. Many Member States have a lot
to do in fighting corruption, as well as trying to
5 More details are available in the EU Justice Scoreboard: A
tool to promote effective justice and growth COM (2013) 160, http://ec.europa.eu/justice/effective-
justice/files/justice_scoreboard_communication_en.pdf
Executive Summary
7
improve the efficiency of local government, tax
collection authorities and various regulatory bodies.
In many ways e-government can help in achieving
reform goals, but in many cases there is a need to
adapt administrative procedures to its use, and it is
necessary to link the different administrative
information systems.
Access to finance has deteriorated in many Member
States, also in the past year. Euro area banks have
tightened their credit standards because of their risk
perceptions, cost of funds and balance sheet
constraints. Combined with borrower risk and
macroeconomic uncertainty, this has led to
constrained lending volumes and high interest rates,
in particular in the countries most affected by the
crisis. For a lasting solution, a stabilisation of the
banking sector is needed.
As most firms are dependent on bank lending for
their working capital and investments, policy
measures, including loan guarantees and equity
investment programmes, have been adopted in
almost all Member States. In the longer run, it is
likely that corporate finance will be more market
and less bank-based, in the short term, no
alternative source can replace bank loans. The
agreements to gradually pay the arrears due by the
public administrations in many of the crisis
countries have been clear and positive results for
many SMEs.
Investment is essential for growth and the EU
remains an attractive environment for investments
despite its share of global foreign investment
declining substantially, from 45 % in 2001 to 23 %
in 2012. Foreign direct investment has concentrated
on business services, software and cars. Many
Member States have introduced measures that seek
to attract more investment by targeting sectors and
countries, and improving cooperation among
investment promotion actors.
Foreign investment is only one road to increased
openness and internationalisation.
Internationalisation and competitiveness of firms
are linked, as exposure to global competition forces
firms to improve. In addition, the a large share of
global growth will come from outside of Europe,
and to benefit from this, many Member States have
introduced policies to support the
internationalisation of SMEs.

8
1 Industrial performance scoreboard
1.1. Introduction
The worst financial and sovereign debt crisis in the
history of the EU first hit European industry more
than five years ago. Despite the resulting
instabilities, European industry has remained
competitive in international comparison. Although
manufacturing exports were hit in 2008, they have
since then grown 20 % compared to the pre-crisis
level. In particular, European exports to emerging
markets have grown faster than their GDP.
Currently, Europe’s trade surplus in manufactured
products is over a billion euros a day, making
EUR 365 billion per year, almost three times more
than in 2006.
However, as the Commission’s industrial policy
communication pointed out last October,6 there are
serious reasons for concern. Economic activity
remains weak and the impressive trade surplus is
not just the result of a good export performance but
also due to the very low imports because of the
length of the crisis.
Most importantly, investment remains subdued.
Over five years European industry has endured the
consequences of both an intense deleveraging of
balance sheets, and the fall in internal demand,
which has depressed our investment and innovation
rates thereby compromising our future
competitiveness.
But industry is reacting positively. The process of
reallocation of resources is under way – they are
moving away from non-tradable sectors into
productive industrial activities. However, this
process has not been rapid enough. Adjustments
have also been slow in the trade and investment
flows within the internal market, across sectors of
activity, production locations, and between firms,
hampering the growth of efficient emerging SMEs.
The result is excess capacity in some industrial
sectors and high unemployment rates.
This chapter presents a snapshot of the current state
of European manufacturing, a sort of thermometer
6 A stronger European industry for growth and economic
recovery. Industrial policy communication update.
COM(2012) 582.
reading of the state of our industry, identifying key
impact of the crisis on our current and future
competitiveness. This should contribute to
improving the development and implementation of
EU policies to speed up the recovery and get us
back on track for increased competitiveness in the
medium and long term. It also presents the
developments in Member States. The Industrial
Performance Scoreboard is designed to indicate
changes in the industrial competitiveness of
Member States over time. It is based on ten policy
indicators in five areas that all affect the
competitiveness of industry: innovation and
sustainability; export performance; business
environment and infrastructure; finance and
investment; and productivity and skills.
The long-term competitiveness and productivity of
European industry are tied to the ability to
successfully invest in research and innovation.
Higher innovation capacity then drives structural
change in Member States’ economies towards
production with higher added value and more jobs.
Technological innovation in turn facilitates the
transition to a more resource-efficient economy.
And an efficient use of raw materials and energy
can mitigate the negative impact of their rising and
volatile prices on industry’s competitiveness.
Exports are an important source of growth, in
particular when domestic demand is subdued. The
ability to integrate production into global value
chains and to participate in international trade is an
essential part of a competitive economy. However,
some Member States have been better at using the
growth potential of international trade than others.
The most successful of them increasingly export
advanced products that are close to the technology
frontier, as well as knowledge-intensive services,
relying on their strength in non-price
competitiveness. The catching-up economies have
expanded their export market shares by benefiting
from foreign investments in export-oriented
manufacturing.
In a business-friendly environment it is easier for
enterprises to successfully transform production
inputs into new goods and services. A transparent
Industrial Performance Scoreboard – The real magnitude of the impact of this crisis on industry
9
and smart regulatory framework, coupled with
efficient public administration and effective judicial
systems, will enable businesses to focus on their
core activities and to minimise unnecessary
compliance burden and transaction costs. In
particular, an easy start-up environment,
competition-promoting regulation, easy access to
finance, and openness to trade are important in
creating new business activity and investment.
In the EU, bank loans have traditionally been the
dominant source of investment funding, in
particular for SMEs. The tightening of credit
standards and the banks’ continued deleveraging
have caused the supply of credit to deteriorate in
many Member States, and rising interest rate
differentials reflect new fragmentation and a
reversal in the integration of the EU financial
markets.
Finally, a transition to a more innovative and
knowledge-intensive economy is only possible if
the skills base improves. Modern manufacturing
needs a highly-skilled workforce, and in a fast-
changing environment, continuous upgrading of
acquired skills is essential to ensure their
continuing relevance in the labour market.
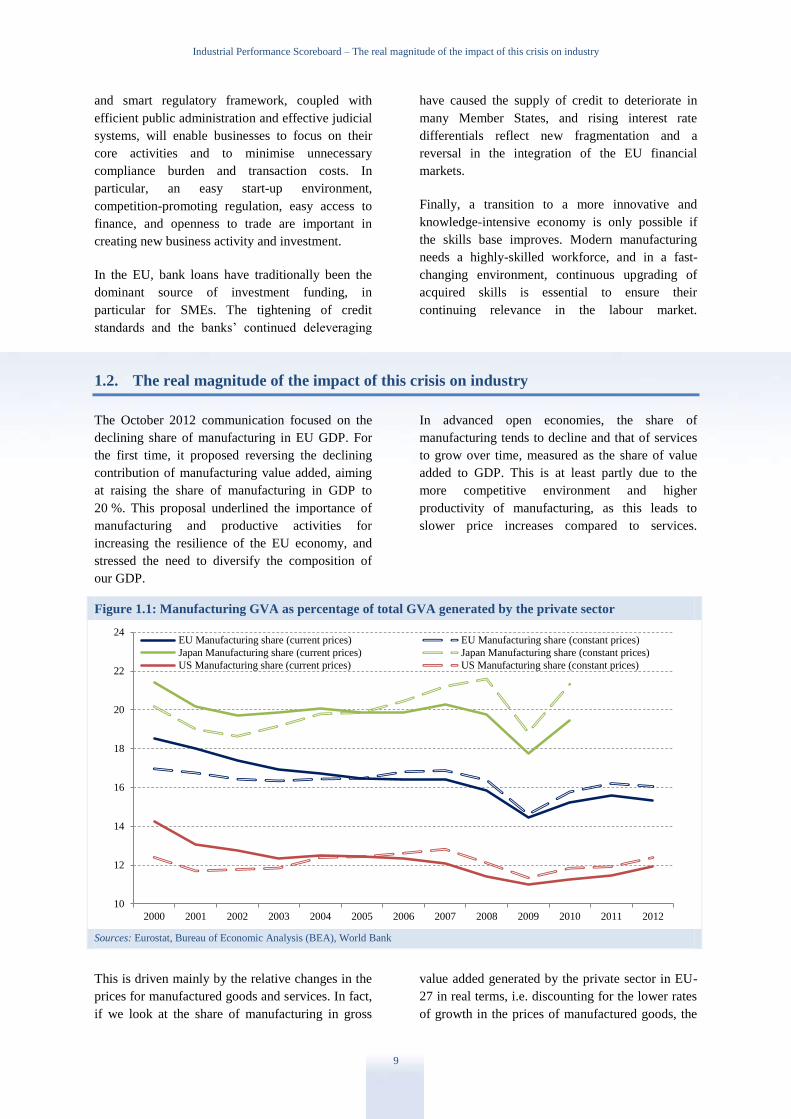
1.2. The real magnitude of the impact of this crisis on industry
The October 2012 communication focused on the
declining share of manufacturing in EU GDP. For
the first time, it proposed reversing the declining
contribution of manufacturing value added, aiming
at raising the share of manufacturing in GDP to
20 %. This proposal underlined the importance of
manufacturing and productive activities for
increasing the resilience of the EU economy, and
stressed the need to diversify the composition of
our GDP.
In advanced open economies, the share of
manufacturing tends to decline and that of services
to grow over time, measured as the share of value
added to GDP. This is at least partly due to the
more competitive environment and higher
productivity of manufacturing, as this leads to
slower price increases compared to services.
Figure 1.1: Manufacturing GVA as percentage of total GVA generated by the private sector
Sources: Eurostat, Bureau of Economic Analysis (BEA), World Bank
This is driven mainly by the relative changes in the
prices for manufactured goods and services. In fact,
if we look at the share of manufacturing in gross
value added generated by the private sector in EU-
27 in real terms, i.e. discounting for the lower rates
of growth in the prices of manufactured goods, the
10
12
14
16
18
20
22
24
2000 2001 2002 2003 2004 2005 2006 2007 2008 2009 2010 2011 2012
EU Manufacturing share (current prices) EU Manufacturing share (constant prices)
Japan Manufacturing share (current prices) Japan Manufacturing share (constant prices)
US Manufacturing share (current prices) US Manufacturing share (constant prices)
Industrial Performance Scoreboard – The real magnitude of the impact of this crisis on industry
10
share of manufacturing over private gross value
added remained relatively stable around the 20 %
mark until 2008, when it dropped considerably. The
same applies for instance to the US throughout the
period considered, where the share of
manufacturing in GDP increased by nearly one
percentage point during the latest recovery.
However, after 2009 there has been a considerable
difference between the US and the EU. While
industrial production in the US has recovered back
to pre-crisis levels, in Europe it had a short-lived
recovery and a second dip in 2012. In other words,
despite the excellent performance of EU
manufacturing exports, the fall in internal demand
and the deleveraging process have again lowered
the value added of manufactured goods produced in
Europe. This development justifies the attention
paid by the Commission on the evolution of
manufacturing in the EU.
There are two main elements in the evolution of the
crisis that call for the attention of policy makers.
The first is the protracted impact of the crisis. If we
compare the impact in the three most developed
industrial areas of the world, Japan, the US and
Europe, interesting differences appear in
production, employment and access to credit.
Figure 1.2 shows that contrary to the US
experience, it is taking longer for the EU industry to
recover, although not as long as in the case of
Japan,
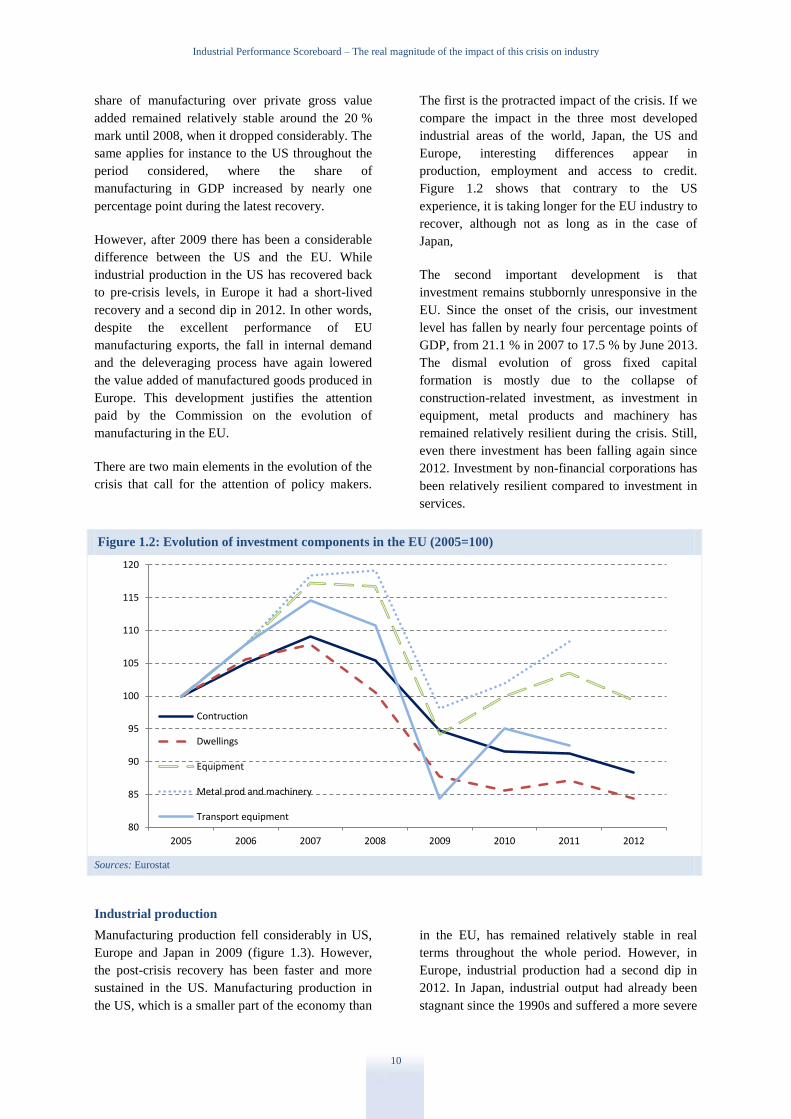
The second important development is that
investment remains stubbornly unresponsive in the
EU. Since the onset of the crisis, our investment
level has fallen by nearly four percentage points of
GDP, from 21.1 % in 2007 to 17.5 % by June 2013.
The dismal evolution of gross fixed capital
formation is mostly due to the collapse of
construction-related investment, as investment in
equipment, metal products and machinery has
remained relatively resilient during the crisis. Still,
even there investment has been falling again since
2012. Investment by non-financial corporations has
been relatively resilient compared to investment in
services.
Figure 1.2: Evolution of investment components in the EU (2005=100)
Sources: Eurostat
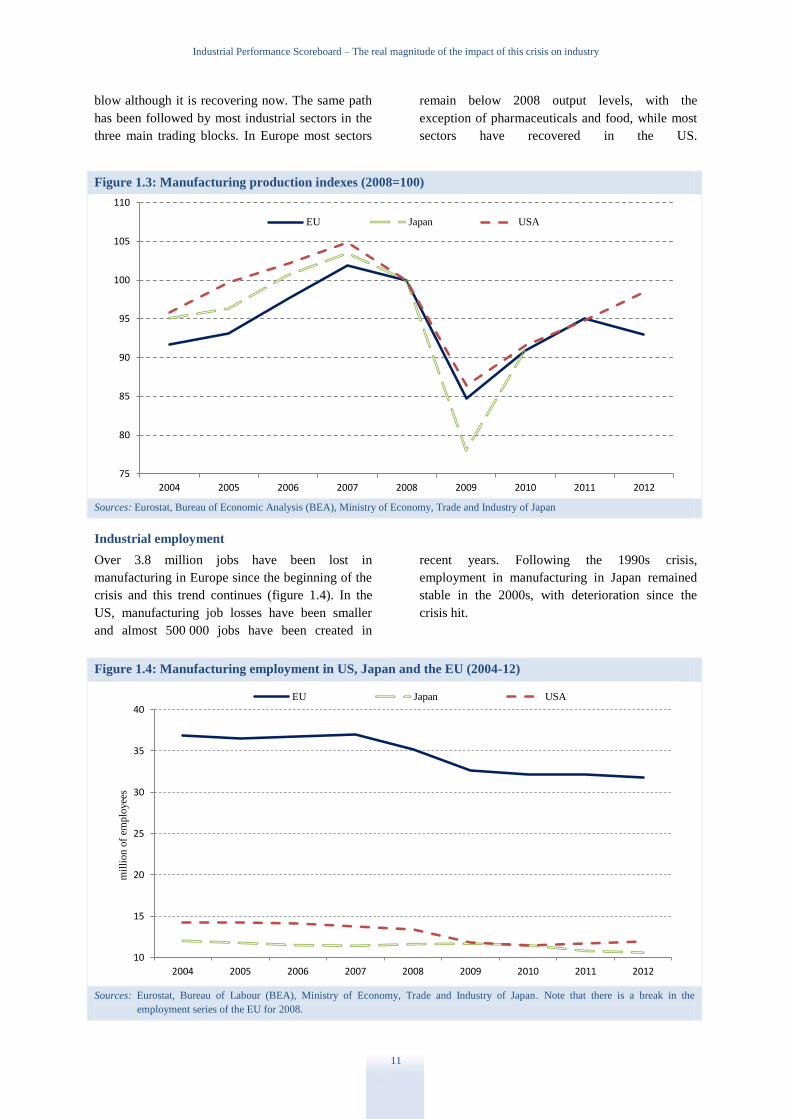
Industrial production
Manufacturing production fell considerably in US,
Europe and Japan in 2009 (figure 1.3). However,
the post-crisis recovery has been faster and more
sustained in the US. Manufacturing production in
the US, which is a smaller part of the economy than
in the EU, has remained relatively stable in real
terms throughout the whole period. However, in
Europe, industrial production had a second dip in
2012. In Japan, industrial output had already been
stagnant since the 1990s and suffered a more severe
80
85
90
95
100
105
110
115
120
2005 2006 2007 2008 2009 2010 2011 2012
Contruction
Dwellings
Equipment
Metal prod and machinery
Transport equipment
Industrial Performance Scoreboard – The real magnitude of the impact of this crisis on industry
11
blow although it is recovering now. The same path
has been followed by most industrial sectors in the
three main trading blocks. In Europe most sectors
remain below 2008 output levels, with the
exception of pharmaceuticals and food, while most
sectors have recovered in the US.
Figure 1.3: Manufacturing production indexes (2008=100)
Sources: Eurostat, Bureau of Economic Analysis (BEA), Ministry of Economy, Trade and Industry of Japan
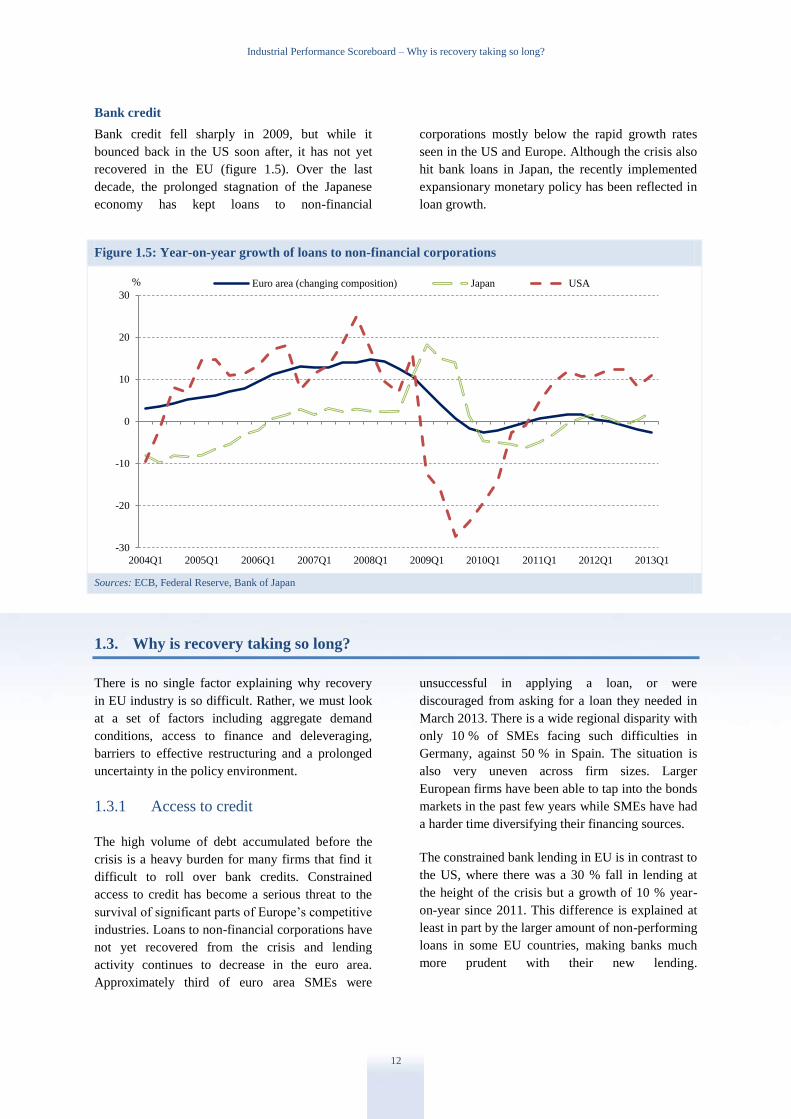
Industrial employment
Over 3.8 million jobs have been lost in
manufacturing in Europe since the beginning of the
crisis and this trend continues (figure 1.4). In the
US, manufacturing job losses have been smaller
and almost 500 000 jobs have been created in
recent years. Following the 1990s crisis,
employment in manufacturing in Japan remained
stable in the 2000s, with deterioration since the
crisis hit.
Figure 1.4: Manufacturing employment in US, Japan and the EU (2004-12)
Sources: Eurostat, Bureau of Labour (BEA), Ministry of Economy, Trade and Industry of Japan. Note that there is a break in the
employment series of the EU for 2008.
75
80
85
90
95
100
105
110
2004 2005 2006 2007 2008 2009 2010 2011 2012
EU Japan USA
10
15
20
25
30
35
40
2004 2005 2006 2007 2008 2009 2010 2011 2012
EU Japan USA
mil
lion
of
emp
loyee
s
Industrial Performance Scoreboard – Why is recovery taking so long?
12
Bank credit
Bank credit fell sharply in 2009, but while it
bounced back in the US soon after, it has not yet
recovered in the EU (figure 1.5). Over the last
decade, the prolonged stagnation of the Japanese
economy has kept loans to non-financial
corporations mostly below the rapid growth rates
seen in the US and Europe. Although the crisis also
hit bank loans in Japan, the recently implemented
expansionary monetary policy has been reflected in
loan growth.
Figure 1.5: Year-on-year growth of loans to non-financial corporations
Sources: ECB, Federal Reserve, Bank of Japan
1.3. Why is recovery taking so long?
There is no single factor explaining why recovery
in EU industry is so difficult. Rather, we must look
at a set of factors including aggregate demand
conditions, access to finance and deleveraging,
barriers to effective restructuring and a prolonged
uncertainty in the policy environment.
1.3.1 Access to credit
The high volume of debt accumulated before the
crisis is a heavy burden for many firms that find it
difficult to roll over bank credits. Constrained
access to credit has become a serious threat to the
survival of significant parts of Europe’s competitive
industries. Loans to non-financial corporations have
not yet recovered from the crisis and lending
activity continues to decrease in the euro area.
Approximately third of euro area SMEs were
unsuccessful in applying a loan, or were
discouraged from asking for a loan they needed in
March 2013. There is a wide regional disparity with
only 10 % of SMEs facing such difficulties in
Germany, against 50 % in Spain. The situation is
also very uneven across firm sizes. Larger
European firms have been able to tap into the bonds
markets in the past few years while SMEs have had
a harder time diversifying their financing sources.
The constrained bank lending in EU is in contrast to
the US, where there was a 30 % fall in lending at
the height of the crisis but a growth of 10 % year-
on-year since 2011. This difference is explained at
least in part by the larger amount of non-performing
loans in some EU countries, making banks much
more prudent with their new lending.
-30
-20
-10
0
10
20
30
2004Q1 2005Q1 2006Q1 2007Q1 2008Q1 2009Q1 2010Q1 2011Q1 2012Q1 2013Q1
Euro area (changing composition) Japan USA%

Industrial Performance Scoreboard – Why is recovery taking so long?
13
Figure 1.6: Non-performing loans as a share of total loans
Source: World Development Indicators, World Bank
Difficulties encountered by many European firms in
gaining access to credit are reflected in the
increasing trend displayed by nonperforming loans
in Europe, which feeds back into the difficulties of
obtaining credit (Figure 1.6). These difficulties are
due to several factors. First, the process of
deleveraging reduces the small volumes of credit
available to roll over existing debt and to finance
new projects. In addition, the crisis and the subdued
economic conditions have an impact on the volume
of nonperforming loans that has increased
considerably in some countries. According to the
ECB, this percentage has doubled in Spain or Italy
since 2008 while it has remained low or constant, or
has even decreased in others (Germany).
Figure 1.7: Share of non-performing loans of the total in Spain by sector
Source: Bank of Spain
0
2
4
6
8
10
12
2000 2001 2002 2003 2004 2005 2006 2007 2008 2009 2010 2011 2012
DE ES FR EU IT JP UK USA%
0
5
10
15
20
25
30
35
Mar
-04
Jun
-04
Sep
-04
Dec
-04
Mar
-05
Jun
-05
Sep
-05
Dec
-05
Mar
-06
Jun
-06
Sep
-06
Dec
-06
Mar
-07
Jun
-07
Sep
-07
Dec
-07
Mar
-08
Jun
-08
Sep
-08
Dec
-08
Mar
-09
Jun
-09
Sep
-09
Dec
-09
Mar
-10
Jun
-10
Sep
-10
Dec
-10
Mar
-11
Jun
-11
Sep
-11
Dec
-11
Mar
-12
Jun
-12
Sep
-12
Dec
-12
Mar
-13
Industry Construction Services Real Estate
%
Industrial Performance Scoreboard – Why is recovery taking so long?
14
There is no detailed information about the sectoral
distribution of these nonperforming loans at EU
level but information from one of these countries
suggests that industry is not the main sector
responsible for the growth in ‘bad loans’ (Figure
1.7).
Restoring bank credit flows will be essential to
avoid the strangling of perfectly viable business in
many Member States. This must inevitably start by
a healthy banking sector that can restore credit
flows to firms. Yet, many firms are suffering
disruptions in payments and the accumulation of
arrears is representing a serious burden for the
financing of the working capital in many parts of
Europe.
1.3.2 Aggregate demand conditions
Aggregate demand remains subdued in the EU,
being affected in particular by deleveraging by non-
financial corporations that have moved from being
borrowers to being savers since 2009. Given the
fiscal balance imperative to ensure the
sustainability of debt levels, governments have not
been able to compensate by supplying internal
demand.
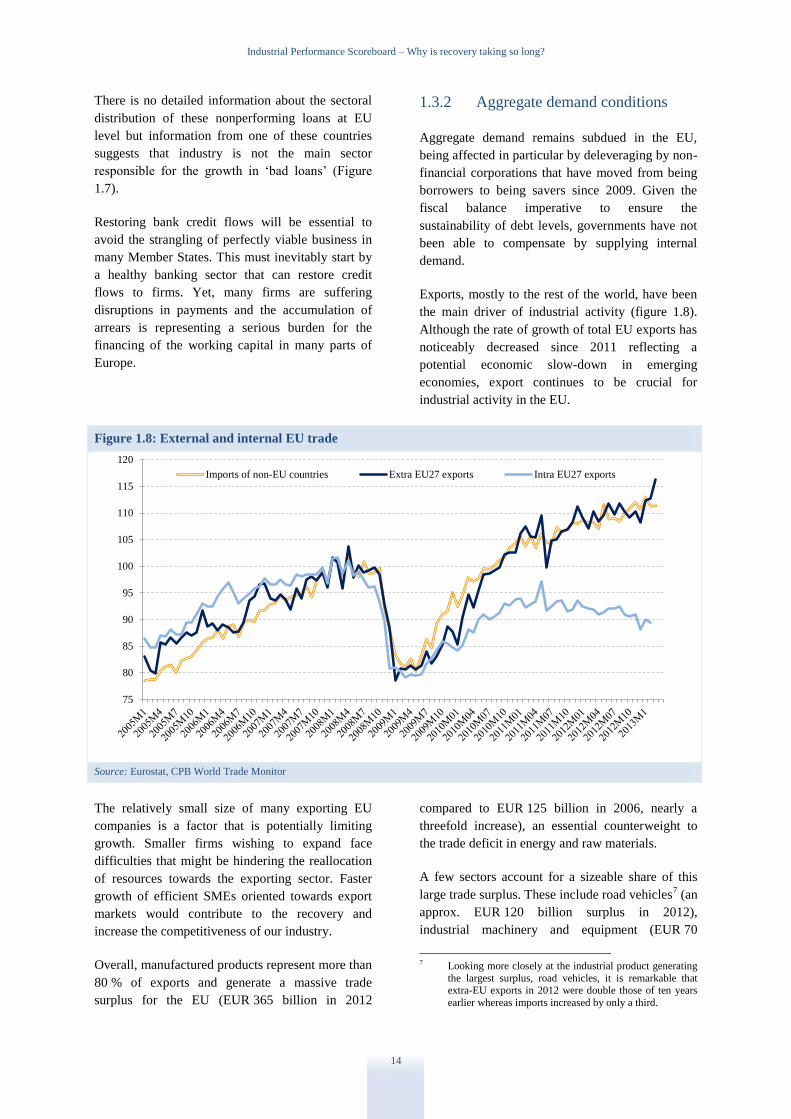
Exports, mostly to the rest of the world, have been
the main driver of industrial activity (figure 1.8).
Although the rate of growth of total EU exports has
noticeably decreased since 2011 reflecting a
potential economic slow-down in emerging
economies, export continues to be crucial for
industrial activity in the EU.
Figure 1.8: External and internal EU trade
Source: Eurostat, CPB World Trade Monitor
The relatively small size of many exporting EU
companies is a factor that is potentially limiting
growth. Smaller firms wishing to expand face
difficulties that might be hindering the reallocation
of resources towards the exporting sector. Faster
growth of efficient SMEs oriented towards export
markets would contribute to the recovery and
increase the competitiveness of our industry.
Overall, manufactured products represent more than
80 % of exports and generate a massive trade
surplus for the EU (EUR 365 billion in 2012
compared to EUR 125 billion in 2006, nearly a
threefold increase), an essential counterweight to
the trade deficit in energy and raw materials.
A few sectors account for a sizeable share of this
large trade surplus. These include road vehicles7 (an
approx. EUR 120 billion surplus in 2012),
industrial machinery and equipment (EUR 70
7 Looking more closely at the industrial product generating
the largest surplus, road vehicles, it is remarkable that extra-EU exports in 2012 were double those of ten years
earlier whereas imports increased by only a third.
75
80
85
90
95
100
105
110
115
120
Imports of non-EU countries Extra EU27 exports Intra EU27 exports
Industrial Performance Scoreboard – Why is recovery taking so long?
15
billion), pharmaceutical products (EUR 55 billion),
aircrafts (EUR 28 billion), beverages (EUR 20
billion) and paper (EUR 14 billion). In all these
sectors, the EU industry remains, sometime with a
wide margin, the largest global player. Conversely,
large trade deficits are sustained by the EU in a
minority of industrial products such as clothing
(EUR 47 billion.), office machines (EUR 48
billion), telecommunications equipment (EUR 40
billion) or non-ferrous metals (EUR 11 billion).
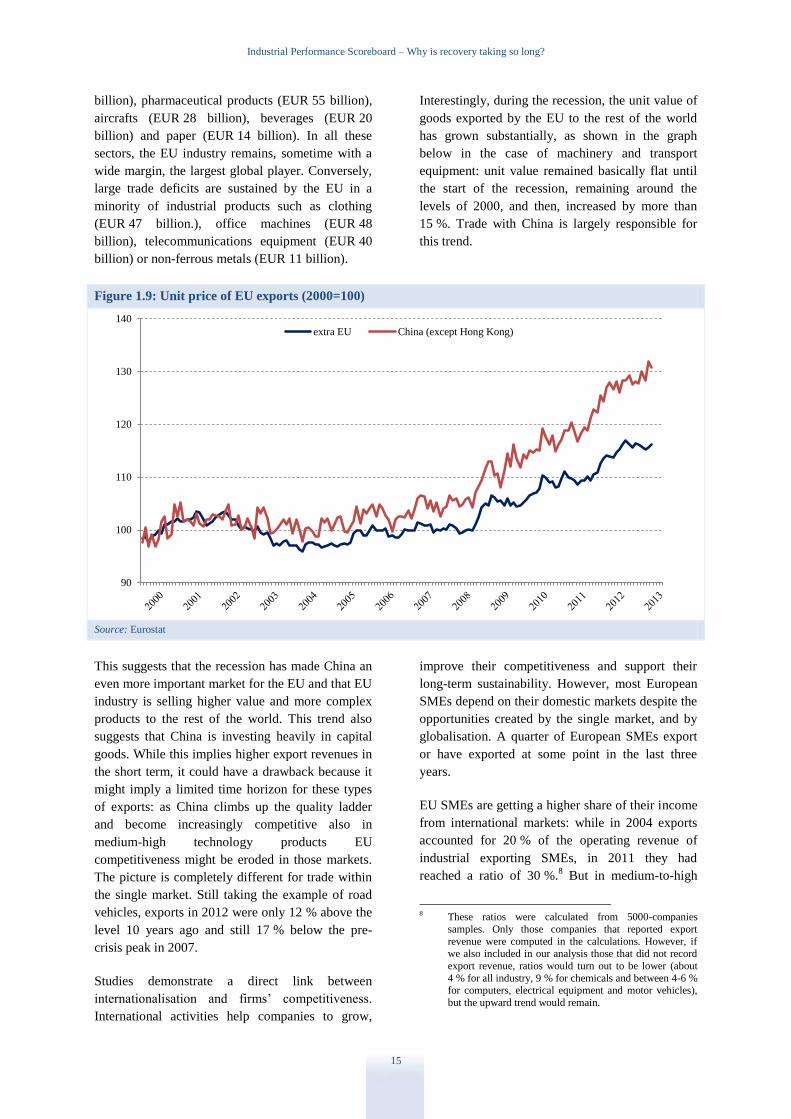
Interestingly, during the recession, the unit value of
goods exported by the EU to the rest of the world
has grown substantially, as shown in the graph
below in the case of machinery and transport
equipment: unit value remained basically flat until
the start of the recession, remaining around the
levels of 2000, and then, increased by more than
15 %. Trade with China is largely responsible for
this trend.
Figure 1.9: Unit price of EU exports (2000=100)
Source: Eurostat
This suggests that the recession has made China an
even more important market for the EU and that EU
industry is selling higher value and more complex
products to the rest of the world. This trend also
suggests that China is investing heavily in capital
goods. While this implies higher export revenues in
the short term, it could have a drawback because it
might imply a limited time horizon for these types
of exports: as China climbs up the quality ladder
and become increasingly competitive also in
medium-high technology products EU
competitiveness might be eroded in those markets.
The picture is completely different for trade within
the single market. Still taking the example of road
vehicles, exports in 2012 were only 12 % above the
level 10 years ago and still 17 % below the pre-
crisis peak in 2007.
Studies demonstrate a direct link between
internationalisation and firms’ competitiveness.
International activities help companies to grow,
improve their competitiveness and support their
long-term sustainability. However, most European
SMEs depend on their domestic markets despite the
opportunities created by the single market, and by
globalisation. A quarter of European SMEs export
or have exported at some point in the last three
years.
EU SMEs are getting a higher share of their income
from international markets: while in 2004 exports
accounted for 20 % of the operating revenue of
industrial exporting SMEs, in 2011 they had
reached a ratio of 30 %.8 But in medium-to-high
8 These ratios were calculated from 5000-companies
samples. Only those companies that reported export
revenue were computed in the calculations. However, if
we also included in our analysis those that did not record
export revenue, ratios would turn out to be lower (about
4 % for all industry, 9 % for chemicals and between 4-6 % for computers, electrical equipment and motor vehicles),
but the upward trend would remain.
90
100
110
120
130
140
extra EU China (except Hong Kong)

Industrial Performance Scoreboard – Why is recovery taking so long?
16
value added sectors such as chemicals, computer,
electronic and optical products, and electrical
equipment, the increase is even more remarkable
especially after 2009. Most exports have been to
other EU countries and only about 13 % of SMEs
export to markets outside the EU.
Figure 1.10: Average export revenue/operating revenue ratio of exporting SMEs
Source: AMADEUS; Commission calculations
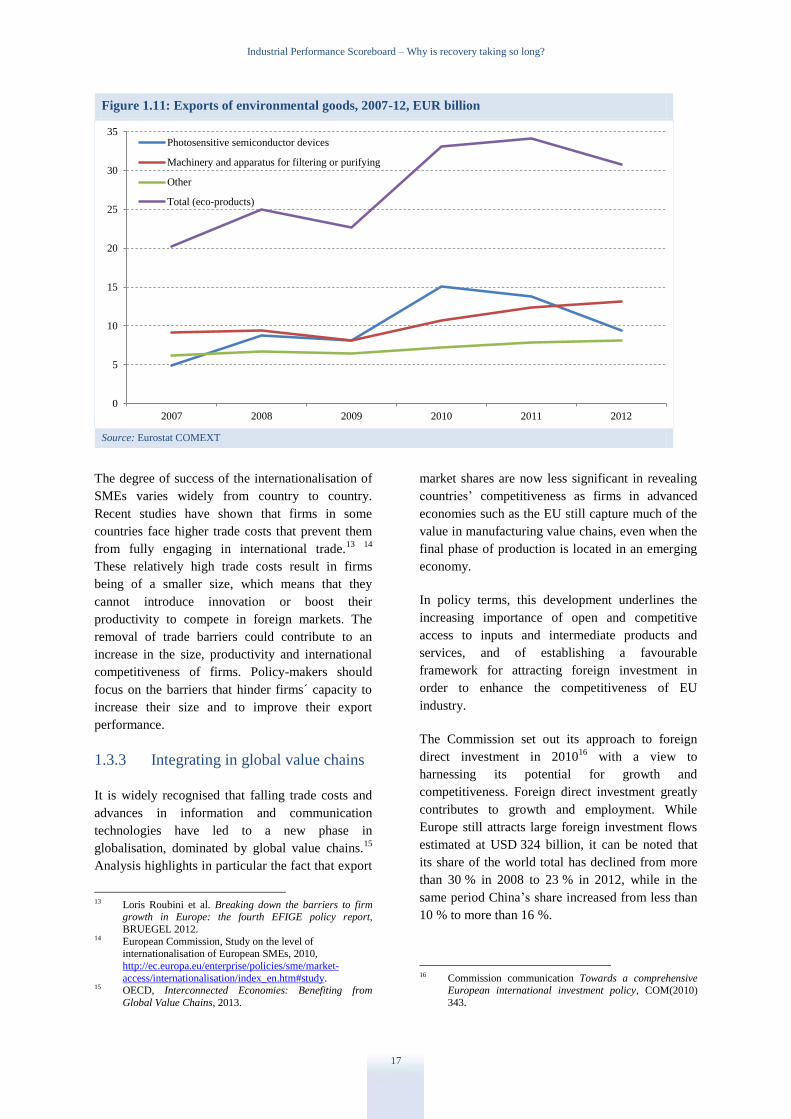
Trends in eco-industries
Employment in eco-industries has grown considerably9 in recent years, and these sectors have been
identified10
as having future growth potential. Exports also show that eco-industries are doing well; the
value of exports of environmental goods11
has gone up by about 50 % since 2007, although they did fall
between 2011 and 2012, and their share of total EU exports rose from 0.28 % in 2005 to 0.68 % in 2012.
The relative composition of these environmental goods exports has changed over time. The value of
exports of photosensitive semiconductor devices (including solar panels) tripled between 2007 and 2010.
However, it has fallen since then due to competition, slower growth in some key markets, and falling
prices.12
Currently the largest export category is air, gas and liquid filtering machinery, apparatus and
components. In this area German, French, British and Italian firms have a significant share of a growing
global market. Other environmental goods exports belong to numerous smaller categories, such as analysis
apparatus, light-emitting diodes or non-electric water heaters, that in aggregate amount to about a quarter
of the total and have shown as much more stable evolution pattern.
9 It has increased by about 180 000 jobs per year between 1999 and 2008, an annual growth rate of 7 %. Source: the European
Commission brochure ‘Sustainable Industry: Going for growth and resource efficiency’ and its related studies, available at
http://ec.europa.eu/enterprise/index_en.htm. More recent and harmonised data are not available for the EU as a whole. However national and sector-specific data already published point in the same direction.
10 See the Employment package by the European Commission ‘Towards a job-rich recovery’, COM(2012) 173. 11 Exports of environmental goods refers to intra- and extra- EU-27 exports of goods from ‘eco-industries’ divided by total intra- and
extra-EU-27 exports of goods (in nominal values). ‘Eco-industry’ refers to sectors whose products measure, prevent, limit, minimise
or correct environmental damage. The trade codes considered to cover eco-industry goods are those identified in the Ecorys study on
the ‘Competitiveness of the EU eco-industry’ (p 190/191) of 22 October 2009, carried out for DG Enterprise and Industry. 12 As photosensitive semiconductor devices are diverse products, it is difficult to cite a single figure for the sector as a whole. Market
research (for instance by the Frauenhofer Institute http://www.ise.fraunhofer.de/en/renewable-energy-data and Bloomberg New
Energy Finance http://about.bnef.com) suggests that the price of photovoltaic modules fell by around 50 % in the period 2007-12. This confirms Swanson’s law, according to which the price of solar photovoltaic cells would drop 20 % each time industry capacity
doubles.
15
20
25
30
35
40
45
2003 2004 2005 2006 2007 2008 2009 2010 2011
All industrial Chemicals
Computers, electronical and optical products Electrical equipment
Motor vehicles
Industrial Performance Scoreboard – Why is recovery taking so long?
17
Figure 1.11: Exports of environmental goods, 2007-12, EUR billion
Source: Eurostat COMEXT
The degree of success of the internationalisation of
SMEs varies widely from country to country.
Recent studies have shown that firms in some
countries face higher trade costs that prevent them
from fully engaging in international trade.13
14
These relatively high trade costs result in firms
being of a smaller size, which means that they
cannot introduce innovation or boost their
productivity to compete in foreign markets. The
removal of trade barriers could contribute to an
increase in the size, productivity and international
competitiveness of firms. Policy-makers should
focus on the barriers that hinder firms´ capacity to
increase their size and to improve their export
performance.
1.3.3 Integrating in global value chains
It is widely recognised that falling trade costs and
advances in information and communication
technologies have led to a new phase in
globalisation, dominated by global value chains.15
Analysis highlights in particular the fact that export
13 Loris Roubini et al. Breaking down the barriers to firm
growth in Europe: the fourth EFIGE policy report,
BRUEGEL 2012. 14 European Commission, Study on the level of
internationalisation of European SMEs, 2010,
http://ec.europa.eu/enterprise/policies/sme/market-
access/internationalisation/index_en.htm#study. 15 OECD, Interconnected Economies: Benefiting from
Global Value Chains, 2013.
market shares are now less significant in revealing
countries’ competitiveness as firms in advanced
economies such as the EU still capture much of the
value in manufacturing value chains, even when the
final phase of production is located in an emerging
economy.
In policy terms, this development underlines the
increasing importance of open and competitive
access to inputs and intermediate products and
services, and of establishing a favourable
framework for attracting foreign investment in
order to enhance the competitiveness of EU
industry.
The Commission set out its approach to foreign
direct investment in 201016
with a view to
harnessing its potential for growth and
competitiveness. Foreign direct investment greatly
contributes to growth and employment. While
Europe still attracts large foreign investment flows
estimated at USD 324 billion, it can be noted that
its share of the world total has declined from more
than 30 % in 2008 to 23 % in 2012, while in the
same period China’s share increased from less than
10 % to more than 16 %.
16 Commission communication Towards a comprehensive
European international investment policy, COM(2010)
343.
0
5
10
15
20
25
30
35
2007 2008 2009 2010 2011 2012
Photosensitive semiconductor devices
Machinery and apparatus for filtering or purifying
Other
Total (eco-products)
Industrial Performance Scoreboard – Why is recovery taking so long?
18
Attractiveness for foreign investors is largely
determined by business environment, which
requires appropriate policies at national and
regional levels, in particular as part of the smart
specialisation strategies to be put in place in the
2014-20 programming period of the European
Structural and Investment Funds, with the support
of EIB loans (see section 2.4).
1.3.4 Slow adjustment within the
internal market
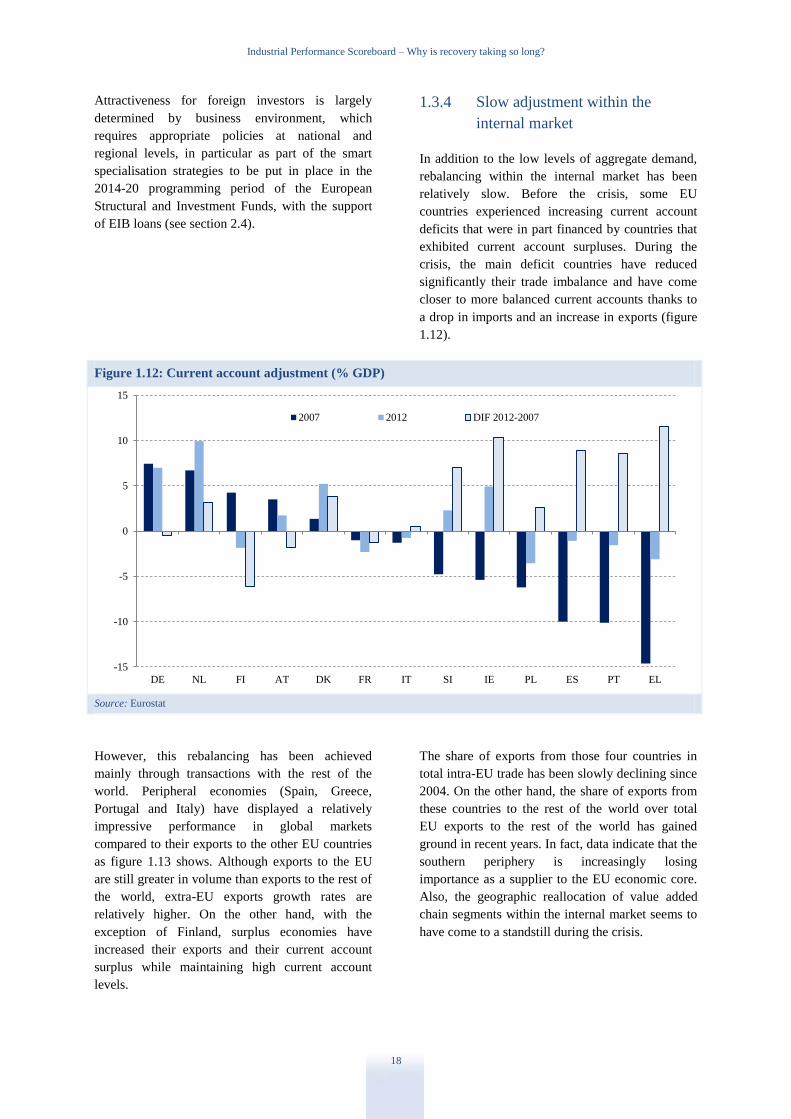
In addition to the low levels of aggregate demand,
rebalancing within the internal market has been
relatively slow. Before the crisis, some EU
countries experienced increasing current account
deficits that were in part financed by countries that
exhibited current account surpluses. During the
crisis, the main deficit countries have reduced
significantly their trade imbalance and have come
closer to more balanced current accounts thanks to
a drop in imports and an increase in exports (figure
1.12).
Figure 1.12: Current account adjustment (% GDP)
Source: Eurostat
However, this rebalancing has been achieved
mainly through transactions with the rest of the
world. Peripheral economies (Spain, Greece,
Portugal and Italy) have displayed a relatively
impressive performance in global markets
compared to their exports to the other EU countries
as figure 1.13 shows. Although exports to the EU
are still greater in volume than exports to the rest of
the world, extra-EU exports growth rates are
relatively higher. On the other hand, with the
exception of Finland, surplus economies have
increased their exports and their current account
surplus while maintaining high current account
levels.
The share of exports from those four countries in
total intra-EU trade has been slowly declining since
2004. On the other hand, the share of exports from
these countries to the rest of the world over total
EU exports to the rest of the world has gained
ground in recent years. In fact, data indicate that the
southern periphery is increasingly losing
importance as a supplier to the EU economic core.
Also, the geographic reallocation of value added
chain segments within the internal market seems to
have come to a standstill during the crisis.
-15
-10
-5
0
5
10
15
DE NL FI AT DK FR IT SI IE PL ES PT EL
2007 2012 DIF 2012-2007

Industrial Performance Scoreboard – Why is recovery taking so long?
19
Figure 1.13: Exports of Spain and Greece, per cent of GDP
Source: Eurostat
Intra-EU foreign direct investment has been
drastically reduced during the recession, especially
towards the periphery. There is some evidence of
return to the core. This is indicated in the chapter
on the Manufacturing Imperative included in the
2013 European Competitiveness Report
accompanying this report. There is also evidence of
intra-EU direct investment in core countries such as
Austria in recent years.
There is no doubt that subdued internal demand
must be largely responsible for this development
but it would be useful to consider what impact the
crisis has had on internal market integration, and
how the internal market could contribute to
speeding up the adjustment after the crisis
correcting trade and investment imbalances.
1.3.5 Insufficient structural adjustment
A final factor that can help to explain why the
economic crisis is taking so long to resolve in
Europe is the lack of dynamism of the EU economy
due to structural problems such as administrative
obstacles and the difficulties faced by firms wishing
to expand.
The emergence of new large players has
traditionally been a rare occurrence in Europe,
where the attitude towards entrepreneurship is less
positive than in other regions of the world. There is
no EU equivalent of new giants such as Apple,
Google or Facebook, and completely new sectors
have struggled to emerge from scratch. Even within
a sector, firm renewal in Europe is slow. Large
firms tend to fail less than in more dynamic
economies such as the US and small firms tend to
have difficulties growing. This has hindered both
the development and penetration of new high-
growth sectors and the reallocation of resources to
more innovative parts of the economy.
Structural and institutional rigidities prevailing in
European in labour, product and services markets
are not conducive to speedy reallocation of factors
in the economy. The ability to access markets with
a new product and to reach an efficient scale is
often hindered by a heavy regulatory environment.
Skills mismatch is an also an issue with several
high-growth sectors struggling to find trained
specialists. Education and training systems do not
always provide the right skills sets needed for fast-
growing high technology sectors.
In addition, research and innovation systems are
underfunded but also, the overall incentives for
innovation require attention. There is a bias towards
fundamental research in Europe and an insufficient
amount of innovation that is close to market or that
relates to new ways of commercialising a
technology. This is evidenced by the situation in
2
4
6
8
10
12
14
2005 2006 2007 2008 2009 2010 2011 2012
Spain´s EU27 EXTRA Exports Spain´s EU27 INTRA Exports
Greece´s EU27-EXTRA Exports Greece´s EU27 INTRA Exports
Industrial Performance Scoreboard – Why is recovery taking so long?
20
many sectors such as microelectronics where the
prominence of the EU in research is not reflected in
its share in commercialisation. In addition, process
innovations are not properly taken into account in
the systems of incentives developed by national
authorities. Giving attention to this important form
of innovation at EU level could be a catalyst to
encourage Member States to rebalance the
incentives currently in place.
1.3.6 Skills mismatch
The impact of the crisis on industrial employment
has been particularly severe. Since the adoption of
the 2012 communication, the seasonally adjusted
unemployment in the EU-27 has climbed to record-
levels at 12.2 % corresponding to over 26.5 million
unemployed persons.17
Almost 6 million young
people were unemployed in the EU-27 area in
March 2013 corresponding to an unemployment
rate of over 23 %. Between the first quarter of 2008
and the end of 2012, over 3.8 million jobs or 11 %
of total employment have been lost in
manufacturing in the European Union. The
construction sector suffered an even more severe
loss (17 %), while other sectors such as the
distributive trades (2 %) and the financial sector
(1.2 %) that was at the origin of the crisis, suffered
relatively lower job losses.18
Job losses in manufacturing have been unevenly
distributed across sectors and countries, with Spain,
Lithuania, the Baltic Countries and Portugal being
the worst hit and Germany and Austria suffering
only small losses in manufacturing jobs. By sectors,
only the pharmaceutical sector reported positive net
job creation figures by the end of the third quarter
of 2012. The intense job destruction has revealed
structural mismatch since the start of the crisis. The
recession has hit the low-skilled and the youngest
the hardest while demand of high skilled labour
remains.
The long-standing trend towards ever higher skill
requirements means young people without the
necessary skills and low educational attainments
will find it increasingly difficult to find
17 Eurostat, News release, 31 May 2013. 18 2013 March Monthly Note, Industrial Policy Indicators
and Analysis, DG Enterprise and industry.
employment.19
In tackling skill shortages and
mismatches, youth unemployment therefore
requires specific attention, which is addressed by
the communication on youth unemployment,
adopted by the European Commission in June
2013.20
Within the manufacturing sector, 70 % of workers
have medium-level skills and highly-skilled
workers represent 27 %. Low skilled workers are a
mere 3 % of the industrial labour force. But the
demand for highly skilled labour in manufacturing
is estimated to rise by 22.7 %, more than for any
other sector, while the demand for medium skilled
labour in manufacturing is estimated to fall.
19 Education at a glance 2013, OECD. 20 COM(2013) 447, 19.06.2013.

Industrial Performance Scoreboard – Why is recovery taking so long?
21
Figure 1.14: Change in demand for skills in the manufacturing sector between 2010 and 2020
Source: CEDEFOP
The manufacturing sector is increasingly
experiencing skill shortages that may limit
production, in particular when growth picks up. A
cluster of manufacturing sub-sectors (motor
vehicles, machinery and equipment, electrical
equipment, computer, electronic and optical
products) has been experiencing high levels of
labour shortages.
Figure 1.15: Labour shortages and employment growth in manufacturing sub-sectors
Source: Commission's Business Survey (2009) and Eurostat
Note: Labour shortage is measured by the labour shortage indicator (LSI); sector averages.
-30%
-20%
-10%
0%
10%
20%
30%
40%
All sectors Total manufacturing Food, drink and
tobacco
Engineering Rest of manufacturing
High skills Medium skills Low skills
Food products
Beverages
Tobacco products
Textiles
Wearing apparel
Coke and refined
petroleum products
Rubber and plastics
Non-metallic mineral
products
Fabricated metal
products
Electrical equipment
Machinery and
equipment n.e.c.
Motor Vehicles
Other transport
equipment
Furniture
Other manufacturing
-5%
0%
5%
10%
15%
20%
25%
0% 2% 4% 6% 8% 10% 12%
Ch
an
ge i
n e
mp
loy
men
t (2
00
8 -
20
10
)
Average Labour Shortage Indicator (2008 - 2010)

Industrial Performance Scoreboard – Why is investment unresponsive?
22
The chart above shows the change in employment
growth and average annual labour shortage by
sector for 2008–10. The bubble size indicates the
relative mass of sectoral employment in 2010. The
centre of the chart shows a cluster of medium to
large manufacturing sectors that have experienced
high growth in employment but also serious labour
shortages. Among these sectors, the latest 2012
labour shortage indicators remain significant:
machinery and equipment (7.7 %), motor vehicles
(6.4 %), computer, electronic and optical products
(6.1 %) and electrical equipment (5.0 %).
As testimony to the skill gap in the manufacturing
labour force, a persistently high number of workers
in EU manufacturing sectors feel under-qualified
(11.5 %); the situation seems particularly acute in
sub-sectors such as the manufacture of basic metals,
electrical equipment, computer, electronic and
optical products and basic metals.
Finally, obsolescence and the lack of retraining
seem to be an issue. A high percentage of
manufacturing workers (31 % of lower skilled and
33 % of older workers) report that their skills have
become obsolete due to rapid technological change.
However, only 54 % of all manufacturing
companies provide training and of these only 55 %
assess their future skills needs.
1.4. Why is investment unresponsive?
Economic recovery requires investment to pick up.
Until now, investment has stayed well below long-
term values and seems to be unresponsive to policy
actions. There is considerable variance in the
official forecasts of the future evolution of
investment in the EU. While Commission forecasts
in May expected a recovery in gross fixed capital
formation of 2.6 % in 2014 for the EU and of 2.3 %
for the Euro Area, the IMF and the OECD predicted
a mere 1.3 % for the euro area. Until now, the
expectations of the Commission for a recovery of
gross fixed capital formation have been dampened
by actual figures. It is very difficult to identify
when investment will recover but cost conditions
and uncertainties have been identified as major
factors delaying this recovery.
1.4.1 Cost conditions – productivity
Figure 1.16: Unit labour costs (2005=100)
Source: AMECO
70
80
90
100
110
120
130
140
2000 2001 2002 2003 2004 2005 2006 2007 2008 2009 2010 2011 2012
Euro area (17 countries) Japan USA
Industrial Performance Scoreboard – Why is investment unresponsive?
23
Labour productivity measured by unit labour costs
has remained relatively stable in the EU over the
last twelve years (figure 1.16). Behind this apparent
stability there is a considerable variation over time
and across countries. While some countries have
experienced a considerable reduction in recent
years due to the impact of the crisis, they had
relatively higher labour costs before the crisis hit.
On the other hand, Member States that have fared
better during the crisis show moderate but
increasing labour remuneration albeit compensated
by productivity gains.
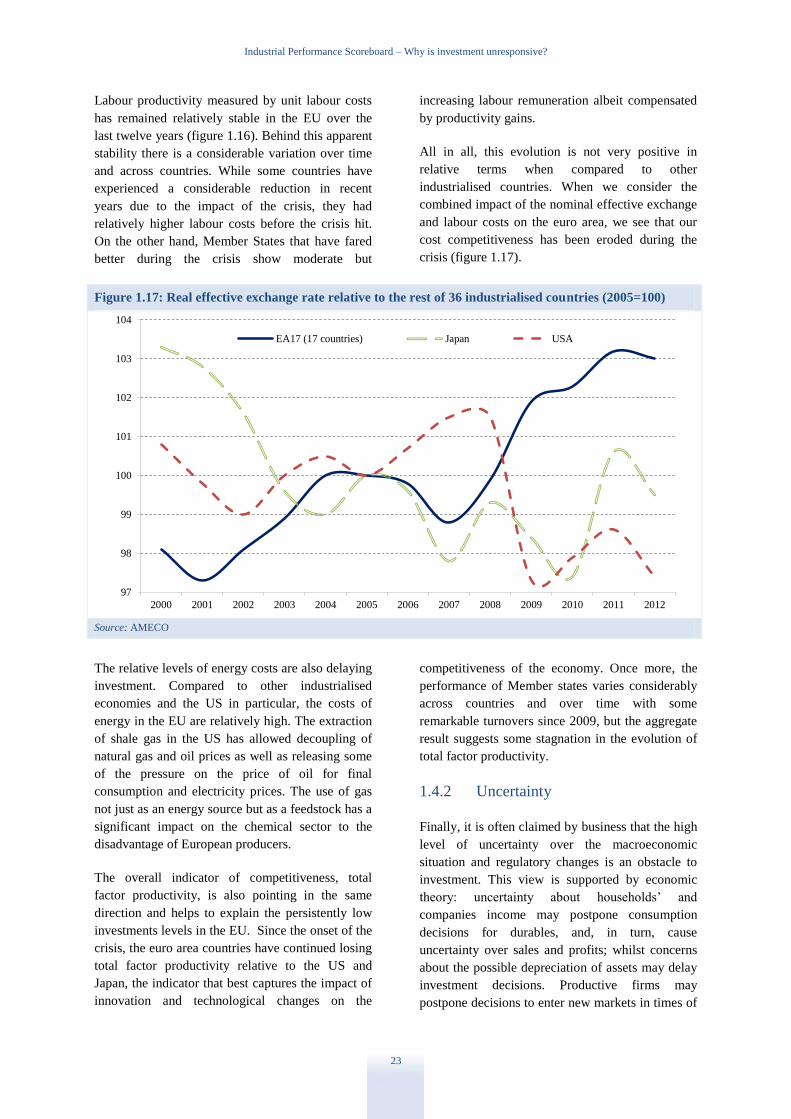
All in all, this evolution is not very positive in
relative terms when compared to other
industrialised countries. When we consider the
combined impact of the nominal effective exchange
and labour costs on the euro area, we see that our
cost competitiveness has been eroded during the
crisis (figure 1.17).
Figure 1.17: Real effective exchange rate relative to the rest of 36 industrialised countries (2005=100)
Source: AMECO
The relative levels of energy costs are also delaying
investment. Compared to other industrialised
economies and the US in particular, the costs of
energy in the EU are relatively high. The extraction
of shale gas in the US has allowed decoupling of
natural gas and oil prices as well as releasing some
of the pressure on the price of oil for final
consumption and electricity prices. The use of gas
not just as an energy source but as a feedstock has a
significant impact on the chemical sector to the
disadvantage of European producers.
The overall indicator of competitiveness, total
factor productivity, is also pointing in the same
direction and helps to explain the persistently low
investments levels in the EU. Since the onset of the
crisis, the euro area countries have continued losing
total factor productivity relative to the US and
Japan, the indicator that best captures the impact of
innovation and technological changes on the
competitiveness of the economy. Once more, the
performance of Member states varies considerably
across countries and over time with some
remarkable turnovers since 2009, but the aggregate
result suggests some stagnation in the evolution of
total factor productivity.
1.4.2 Uncertainty
Finally, it is often claimed by business that the high
level of uncertainty over the macroeconomic
situation and regulatory changes is an obstacle to
investment. This view is supported by economic
theory: uncertainty about households’ and
companies income may postpone consumption
decisions for durables, and, in turn, cause
uncertainty over sales and profits; whilst concerns
about the possible depreciation of assets may delay
investment decisions. Productive firms may
postpone decisions to enter new markets in times of
97
98
99
100
101
102
103
104
2000 2001 2002 2003 2004 2005 2006 2007 2008 2009 2010 2011 2012
EA17 (17 countries) Japan USA
Industrial Performance Scoreboard – Overall performance in Member States
24
uncertainty. Finally, firms may be reluctant to hire
new workers, thus reducing expectations of
employment and income for job seekers.
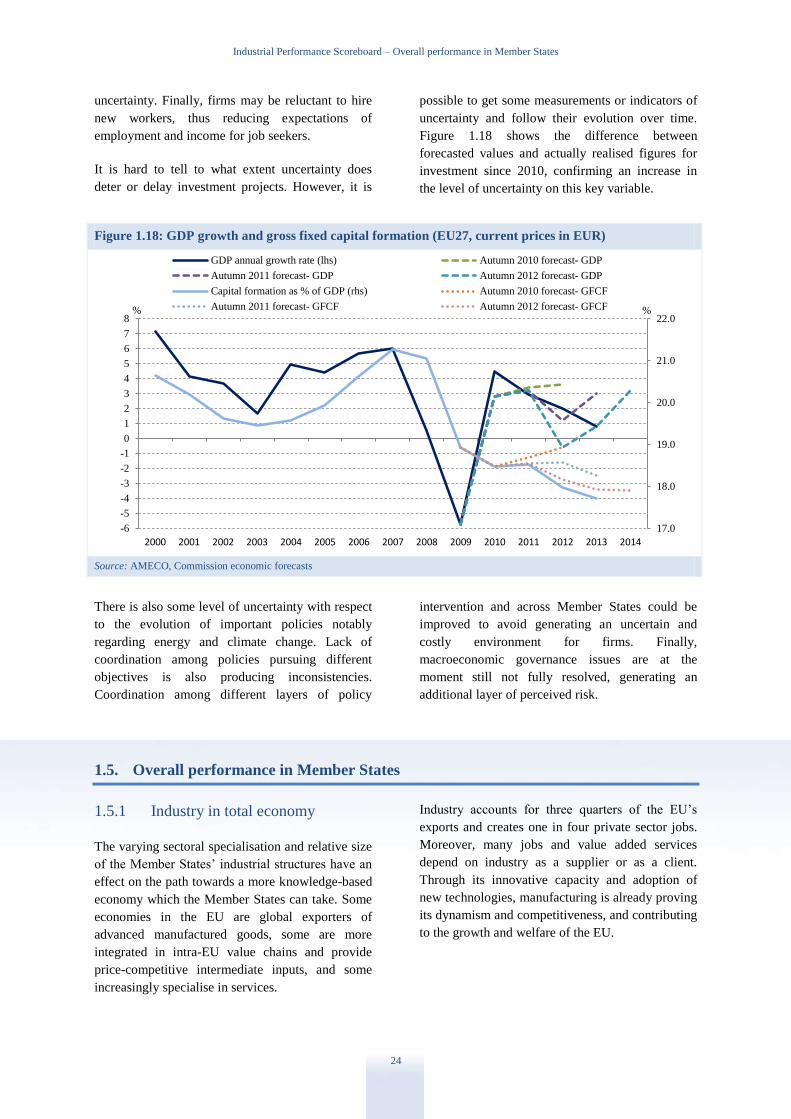
It is hard to tell to what extent uncertainty does
deter or delay investment projects. However, it is
possible to get some measurements or indicators of
uncertainty and follow their evolution over time.
Figure 1.18 shows the difference between
forecasted values and actually realised figures for
investment since 2010, confirming an increase in
the level of uncertainty on this key variable.
Figure 1.18: GDP growth and gross fixed capital formation (EU27, current prices in EUR)
Source: AMECO, Commission economic forecasts
There is also some level of uncertainty with respect
to the evolution of important policies notably
regarding energy and climate change. Lack of
coordination among policies pursuing different
objectives is also producing inconsistencies.
Coordination among different layers of policy
intervention and across Member States could be
improved to avoid generating an uncertain and
costly environment for firms. Finally,
macroeconomic governance issues are at the
moment still not fully resolved, generating an
additional layer of perceived risk.
1.5. Overall performance in Member States
1.5.1 Industry in total economy
The varying sectoral specialisation and relative size
of the Member States’ industrial structures have an
effect on the path towards a more knowledge-based
economy which the Member States can take. Some
economies in the EU are global exporters of
advanced manufactured goods, some are more
integrated in intra-EU value chains and provide
price-competitive intermediate inputs, and some
increasingly specialise in services.
Industry accounts for three quarters of the EU’s
exports and creates one in four private sector jobs.
Moreover, many jobs and value added services
depend on industry as a supplier or as a client.
Through its innovative capacity and adoption of
new technologies, manufacturing is already proving
its dynamism and competitiveness, and contributing
to the growth and welfare of the EU.
17.0
18.0
19.0
20.0
21.0
22.0
-6
-5
-4
-3
-2
-1
0
1
2
3
4
5
6
7
8
2000 2001 2002 2003 2004 2005 2006 2007 2008 2009 2010 2011 2012 2013 2014
GDP annual growth rate (lhs) Autumn 2010 forecast- GDP
Autumn 2011 forecast- GDP Autumn 2012 forecast- GDP
Capital formation as % of GDP (rhs) Autumn 2010 forecast- GFCF
Autumn 2011 forecast- GFCF Autumn 2012 forecast- GFCF % %

Industrial Performance Scoreboard – Overall performance in Member States
25
The indicators of the scoreboard
The industrial performance scoreboard draws on the 26 indicators that are annually monitored for each
country in the report on Member States’ Competitiveness Performance and Policies. To construct the
scoreboard, a set of ten individual policy indicators was selected to represent the key areas of industrial
competitiveness according to these criteria: (i) the indicators are closely related to policy instruments and the
economic reform agenda; (ii) they are available on a reasonably timely basis; (iii) there is (almost) full
country coverage; (iv) there is a time series available for the last five or so years, so that a country can be
compared with its own past performance.
1. Overall industry performance can be gauged through manufacturing productivity, as
productivity levels are an important element of cost competitiveness.
2. The quality of the workforce in the manufacturing sector is assessed by educational attainment.
3. The share of exports in GDP published by Eurostat is an indication of the openness of the
economy, with domestic value added, and exports of medium-and-high-tech goods and non-
financial knowledge-intensive services, reflecting specific aspects of export performance.
4. For innovation performance, the main indicator is the innovation index published annually in the
Innovation Union Scoreboard (IUS), drawing together the overall innovation performance.
5. For sustainability, energy intensity in industry and the energy sector is used.
6. For business environment and infrastructure, the goal is to measure improvements in the
business environment and efforts directed towards better regulation. An overall business
environment score has been calculated by the Commission, based on the annual survey data of the
World Bank.
7. Electricity prices (excluding VAT) for small and medium-sized enterprises, published by
Eurostat, represent one of the most significant costs of inputs and therefore directly affect industry
competitiveness.
8. Enterprises need modern and efficient transport networks to operate. Business satisfaction with
infrastructure (rail, road, port and airport) is recorded by an annual indicator published in the
Global Competitiveness Report.
9. Bank lending is still by far the main source of access to finance for SMEs and, therefore, a score
for access to bank lending has been calculated by the Commission.
10. Business investment in equipment is an indicator of how well businesses can keep up their
manufacturing capability over a period of time.
The scoreboard has been designed to be as simple and stable as possible, enabling comparison over time.
However, each year the scoreboard contains a number of supplementary charts which help to illustrate
progress in a particular indicator or to improve understanding of the underlying phenomena. Taking into
account possible improvements in available statistical data, and changing policy priorities, the choice of
indicators may evolve over time.
For the EU as a whole, the share of manufacturing
shrank slightly from 15.6 % in 2011 to 15.3 % in
2012. It is clear that in advanced economies the
share of services tends to grow, and the higher
productivity in manufacturing leads to relative
changes in prices for goods and services,
contributing to the lower share of manufacturing –
although the EU is above 2009 level. In Germany
and several catching-up Member States
manufacturing represents over 20 % of the total
economy (figure 1.19).
The share of manufacturing shrank in many
Member States from 2011 to 2012. In Denmark,
Sweden, Italy, and France, as well as in Cyprus and
Malta, this has been a long-term gradual trend that
started in the wake of the crisis. Finland’s
manufacturing has seen the most dramatic decline
within the EU, falling by more than six percentage
points relative to its economy since 2007. An
above-average share of manufacturing reflects the
ability to produce globally competitive goods with
high value added. In the catching-up economies, the
lower share of services and the smaller general
government relative to their GDP contribute to the
larger share of manufacturing.
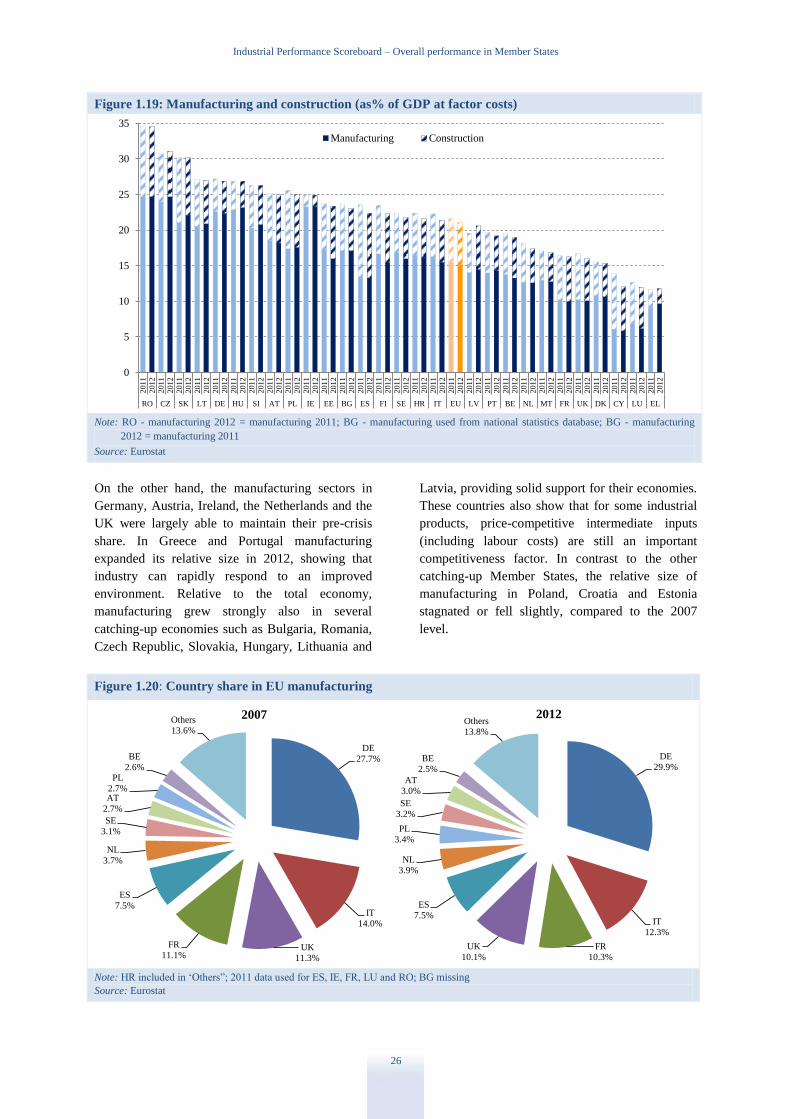
Industrial Performance Scoreboard – Overall performance in Member States
26
Figure 1.19: Manufacturing and construction (as% of GDP at factor costs)
Note: RO - manufacturing 2012 = manufacturing 2011; BG - manufacturing used from national statistics database; BG - manufacturing
2012 = manufacturing 2011
Source: Eurostat
On the other hand, the manufacturing sectors in
Germany, Austria, Ireland, the Netherlands and the
UK were largely able to maintain their pre-crisis
share. In Greece and Portugal manufacturing
expanded its relative size in 2012, showing that
industry can rapidly respond to an improved
environment. Relative to the total economy,
manufacturing grew strongly also in several
catching-up economies such as Bulgaria, Romania,
Czech Republic, Slovakia, Hungary, Lithuania and
Latvia, providing solid support for their economies.
These countries also show that for some industrial
products, price-competitive intermediate inputs
(including labour costs) are still an important
competitiveness factor. In contrast to the other
catching-up Member States, the relative size of
manufacturing in Poland, Croatia and Estonia
stagnated or fell slightly, compared to the 2007
level.
Figure 1.20: Country share in EU manufacturing
Note: HR included in ‘Others”; 2011 data used for ES, IE, FR, LU and RO; BG missing
Source: Eurostat
0
5
10
15
20
25
30
35
2011
2012
2011
2012
2011
2012
2011
2012
2011
2012
2011
2012
2011
2012
2011
2012
2011
2012
2011
2012
2011
2012
2011
2012
2011
2012
2011
2012
2011
2012
2011
2012
2011
2012
2011
2012
2011
2012
2011
2012
2011
2012
2011
2012
2011
2012
2011
2012
2011
2012
2011
2012
2011
2012
2011
2012
2011
2012
RO CZ SK LT DE HU SI AT PL IE EE BG ES FI SE HR IT EU LV PT BE NL MT FR UK DK CY LU EL
Manufacturing Construction
DE
27.7%
IT
14.0%
UK
11.3%
FR
11.1%
ES
7.5%
NL
3.7%
SE
3.1%
AT
2.7%
PL
2.7%
BE
2.6%
Others
13.6%
2007
DE
29.9%
IT
12.3%
FR
10.3%
UK
10.1%
ES
7.5%
NL
3.9%
PL
3.4%
SE
3.2%
AT
3.0%
BE
2.5%
Others
13.8%
2012
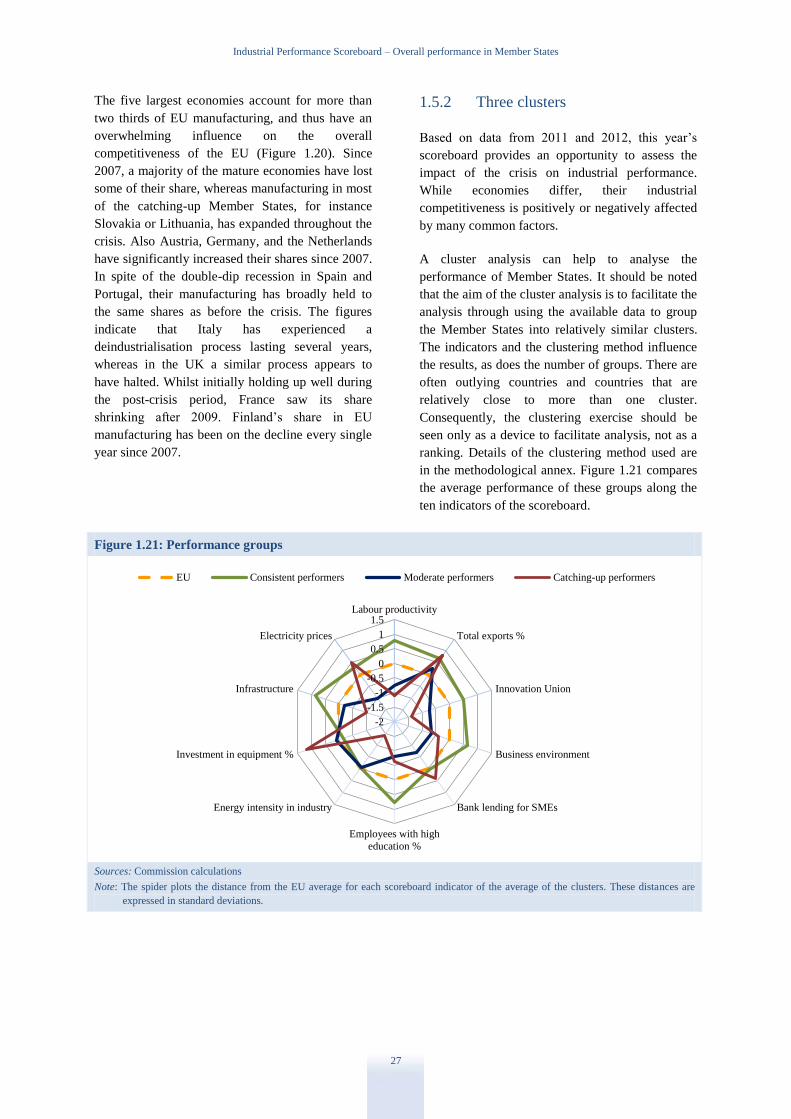
Industrial Performance Scoreboard – Overall performance in Member States
27
The five largest economies account for more than
two thirds of EU manufacturing, and thus have an
overwhelming influence on the overall
competitiveness of the EU (Figure 1.20). Since
2007, a majority of the mature economies have lost
some of their share, whereas manufacturing in most
of the catching-up Member States, for instance
Slovakia or Lithuania, has expanded throughout the
crisis. Also Austria, Germany, and the Netherlands
have significantly increased their shares since 2007.
In spite of the double-dip recession in Spain and
Portugal, their manufacturing has broadly held to
the same shares as before the crisis. The figures
indicate that Italy has experienced a
deindustrialisation process lasting several years,
whereas in the UK a similar process appears to
have halted. Whilst initially holding up well during
the post-crisis period, France saw its share
shrinking after 2009. Finland’s share in EU
manufacturing has been on the decline every single
year since 2007.
1.5.2 Three clusters
Based on data from 2011 and 2012, this year’s
scoreboard provides an opportunity to assess the
impact of the crisis on industrial performance.
While economies differ, their industrial
competitiveness is positively or negatively affected
by many common factors.
A cluster analysis can help to analyse the
performance of Member States. It should be noted
that the aim of the cluster analysis is to facilitate the
analysis through using the available data to group
the Member States into relatively similar clusters.
The indicators and the clustering method influence
the results, as does the number of groups. There are
often outlying countries and countries that are
relatively close to more than one cluster.
Consequently, the clustering exercise should be
seen only as a device to facilitate analysis, not as a
ranking. Details of the clustering method used are
in the methodological annex. Figure 1.21 compares
the average performance of these groups along the
ten indicators of the scoreboard.
Figure 1.21: Performance groups
Sources: Commission calculations
Note: The spider plots the distance from the EU average for each scoreboard indicator of the average of the clusters. These distances are
expressed in standard deviations.
-2
-1.5
-1
-0.5
0
0.5
1
1.5Labour productivity
Total exports %
Innovation Union
Business environment
Bank lending for SMEs
Employees with high
education %
Energy intensity in industry
Investment in equipment %
Infrastructure
Electricity prices
EU Consistent performers Moderate performers Catching-up performers
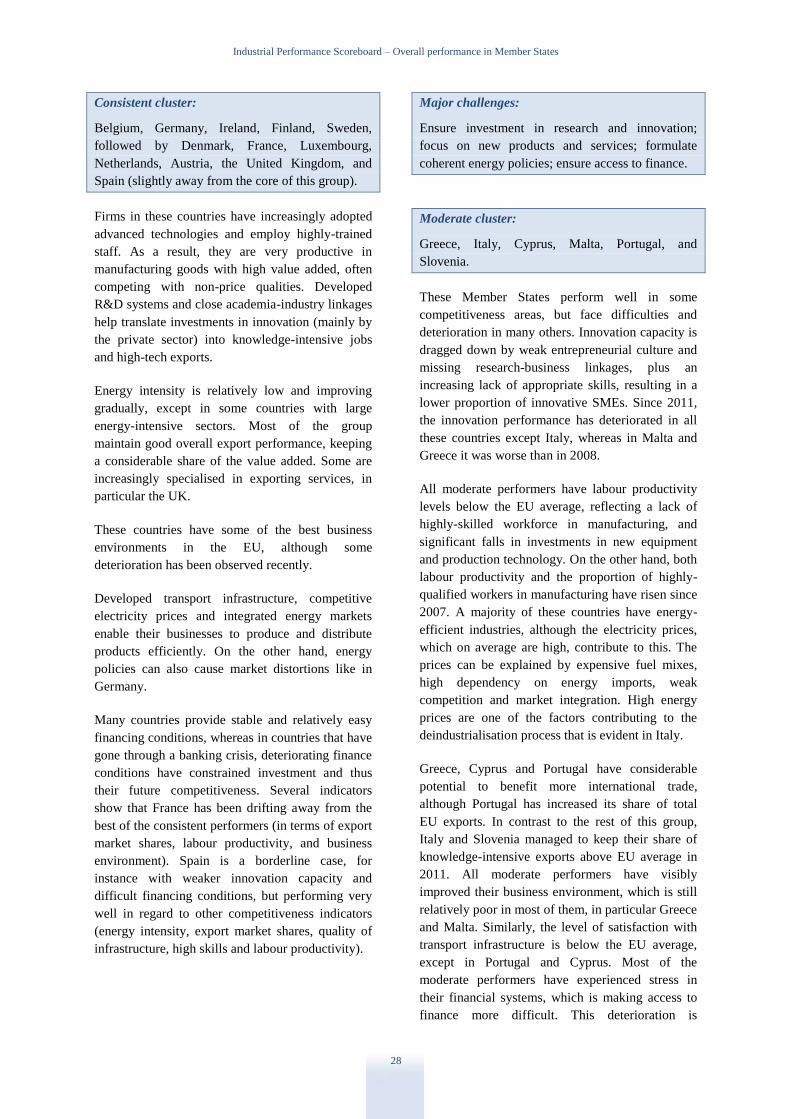
Industrial Performance Scoreboard – Overall performance in Member States
28
Consistent cluster:
Belgium, Germany, Ireland, Finland, Sweden,
followed by Denmark, France, Luxembourg,
Netherlands, Austria, the United Kingdom, and
Spain (slightly away from the core of this group).
Firms in these countries have increasingly adopted
advanced technologies and employ highly-trained
staff. As a result, they are very productive in
manufacturing goods with high value added, often
competing with non-price qualities. Developed
R&D systems and close academia-industry linkages
help translate investments in innovation (mainly by
the private sector) into knowledge-intensive jobs
and high-tech exports.
Energy intensity is relatively low and improving
gradually, except in some countries with large
energy-intensive sectors. Most of the group
maintain good overall export performance, keeping
a considerable share of the value added. Some are
increasingly specialised in exporting services, in
particular the UK.
These countries have some of the best business
environments in the EU, although some
deterioration has been observed recently.
Developed transport infrastructure, competitive
electricity prices and integrated energy markets
enable their businesses to produce and distribute
products efficiently. On the other hand, energy
policies can also cause market distortions like in
Germany.
Many countries provide stable and relatively easy
financing conditions, whereas in countries that have
gone through a banking crisis, deteriorating finance
conditions have constrained investment and thus
their future competitiveness. Several indicators
show that France has been drifting away from the
best of the consistent performers (in terms of export
market shares, labour productivity, and business
environment). Spain is a borderline case, for
instance with weaker innovation capacity and
difficult financing conditions, but performing very
well in regard to other competitiveness indicators
(energy intensity, export market shares, quality of
infrastructure, high skills and labour productivity).
Major challenges:
Ensure investment in research and innovation;
focus on new products and services; formulate
coherent energy policies; ensure access to finance.
Moderate cluster:
Greece, Italy, Cyprus, Malta, Portugal, and
Slovenia.
These Member States perform well in some
competitiveness areas, but face difficulties and
deterioration in many others. Innovation capacity is
dragged down by weak entrepreneurial culture and
missing research-business linkages, plus an
increasing lack of appropriate skills, resulting in a
lower proportion of innovative SMEs. Since 2011,
the innovation performance has deteriorated in all
these countries except Italy, whereas in Malta and
Greece it was worse than in 2008.
All moderate performers have labour productivity
levels below the EU average, reflecting a lack of
highly-skilled workforce in manufacturing, and
significant falls in investments in new equipment
and production technology. On the other hand, both
labour productivity and the proportion of highly-
qualified workers in manufacturing have risen since
2007. A majority of these countries have energy-
efficient industries, although the electricity prices,
which on average are high, contribute to this. The
prices can be explained by expensive fuel mixes,
high dependency on energy imports, weak
competition and market integration. High energy
prices are one of the factors contributing to the
deindustrialisation process that is evident in Italy.
Greece, Cyprus and Portugal have considerable
potential to benefit more international trade,
although Portugal has increased its share of total
EU exports. In contrast to the rest of this group,
Italy and Slovenia managed to keep their share of
knowledge-intensive exports above EU average in
2011. All moderate performers have visibly
improved their business environment, which is still
relatively poor in most of them, in particular Greece
and Malta. Similarly, the level of satisfaction with
transport infrastructure is below the EU average,
except in Portugal and Cyprus. Most of the
moderate performers have experienced stress in
their financial systems, which is making access to
finance more difficult. This deterioration is
Industrial Performance Scoreboard – Overall performance in Member States
29
reflected in higher interest rates, falling stock of
bank loans and lower investment.
Major challenges:
Ensure skills mix that supports innovation and
manufacturing; facilitate private investment;
formulate coherent energy policies; facilitate
exports; facilitate access to finance.
Catching-up cluster:
Bulgaria, Czech Republic, Estonia, Croatia21
,
Latvia, Lithuania, Hungary, Poland, Romania, and
Slovakia.
These countries still face significant challenges in
many areas, but are quickly improving. For certain
competitiveness indicators, the best of them keep
pace with or perform better than moderate or even
some consistent performers. However, their
innovation capacity is well below the EU average,
although Slovakia and Czech Republic already
score better than for instance Greece or Malta.
In general, faster progress towards an knowledge-
intensive economy is slowed down by poorly
developed research and innovation systems, low
R&D investments, and insufficient cooperation
between the science base and enterprises, as well as
less effective policy implementation. Despite this,
Estonia, Latvia, Slovakia and Lithuania have made
the most progress in the EU since 2008.
The industrial structures of the catching-up
countries continue to be highly energy intensive,
although many have become significantly more
efficient because of structural changes and
technology transfer. Foreign direct investment has
improved the export performance of most countries
in this group, which is reflected also in their rising
export market shares. In comparison to the other
clusters, they are more specialised in intra-EU
exports.
As is the case with moderate performers, most
catching-up countries could improve their business
environment. They tend to have less stringent
regulatory regimes but weaker legal institutions and
21 Note that Croatia was not included in the cluster analysis
due to data problems. However, for analytical purposes it
is dealt with in the group of ‘catching-up countries’.
public administrations. However, all have improved
since 2007, with Latvia and Lithuania now having a
business environment above the EU average.
Electricity prices are in most cases relatively low,
although this is partly due to price regulation (e.g.
Bulgaria). While transport infrastructures are
generally much less developed than elsewhere in
the EU, satisfaction with the infrastructure has
significantly improved in almost all catching-up
countries as they have benefited from EU Structural
Funds.
The financing conditions are relatively favourable,
except in Hungary and Slovenia where banking
sector restructuring has constrained the availability
of bank loans. In spite of a large drop recently, most
catching-up economies still have above-average
investment in equipment. Investments in new
technology and production capacity have greatly
improved their labour productivity, although it
remains below the EU average. Except for
Lithuania and Estonia, the proportion of highly-
qualified workforce in manufacturing is relatively
low. Consequently the combination of technology
transfer (often through foreign investment) and low
labour costs still forms the basis of their
competitiveness.
Major challenges:
Facilitate investment in innovation; improve energy
efficiency; improve the business environment.
1.5.3 Change in performance
The three groups identified above are based on
recent performance figures. However, it is also
interesting to look at changes in performance over
the last five years to have an idea of the direction in
which a country is moving. Compared to the EU
average, developments in 2007-12 reveal how some
Member States have improved or maintained their
performance whereas others have worsened.

Industrial Performance Scoreboard – Innovation and Sustainability
30
Figure 1.22: Change in performance 2007-12 (2007=100)
Note: For each scoreboard indicator, distances from the EU average, in 2007 and in the most recent year available, are calculated for each
Member State. These distances are expressed in terms of standard deviations (a similar approach to that of the country graphs). Graph
1.4 shows the average distance over the scoreboard indicators for each Member State and each year; later year were used instead of
2007 for some indicators; respectively one for BE, LU,MT, UK, two for MT and three for HR of the scoreboard indicators (2007)
were missing.
Source: Commission calculations
The consistent performers are found mostly in the
two quadrants on the right. For the countries in the
top corner industrial performance has improved
since 2007, while the countries in the bottom right
corner saw their performance deteriorate. The
moderate performers are found in the bottom left
quadrant. Except Italy and Slovenia, they all saw
their performance drop. The catching-up Member
States are found mostly in the upper left quadrant;
with a low starting point but a markedly improved
performance, their catch-up characteristics are
confirmed.
1.6. Innovation and Sustainability
1.6.1 Innovation performance
Innovation performance of the EU has improved
since 2008. However, the innovation gap has
started to widen as the performance of some of the
less innovative economies has deteriorated, while
the innovation leaders continue to advance.22
As a
22 For a more detailed analysis, please see EC (2013),
‘Research and Innovation performance in EU Member
States and Associated countries, Innovation Union
progress at country level, 2013”, available at:
http://ec.europa.eu/research/innovation-union/pdf/state-of-
the-union/2012/innovation_union_progress_at_country_level
_2013.pdf.
result, the previously observed convergence process
seems to have ended.
BE
BG
CZ
DK
DE
EE
IE
EL
ES
FR
HR
IT
CY
LV
LT LU
HU
MT
NL
AT
PL
PT
RO
SI SK
FI
SE UK
-0.5
-0.4
-0.3
-0.2
-0.1
0
0.1
0.2
0.3
0.4
-1 -0.8 -0.6 -0.4 -0.2 0 0.2 0.4 0.6 0.8 1
Ch
an
ge 2
00
7-2
01
2
Member States' performance relative to the EU average in 2007
EU
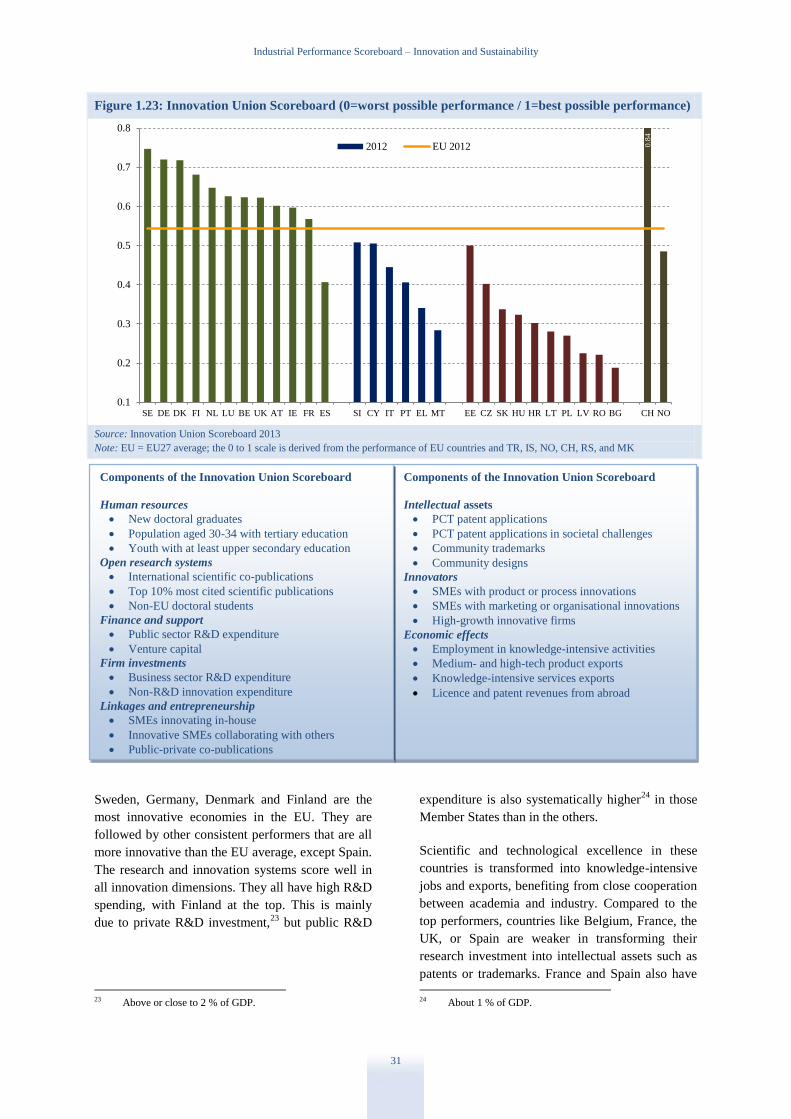
Industrial Performance Scoreboard – Innovation and Sustainability
31
Figure 1.23: Innovation Union Scoreboard (0=worst possible performance / 1=best possible performance)
Source: Innovation Union Scoreboard 2013
Note: EU = EU27 average; the 0 to 1 scale is derived from the performance of EU countries and TR, IS, NO, CH, RS, and MK
Sweden, Germany, Denmark and Finland are the
most innovative economies in the EU. They are
followed by other consistent performers that are all
more innovative than the EU average, except Spain.
The research and innovation systems score well in
all innovation dimensions. They all have high R&D
spending, with Finland at the top. This is mainly
due to private R&D investment,23
but public R&D
23 Above or close to 2 % of GDP.
expenditure is also systematically higher24
in those
Member States than in the others.
Scientific and technological excellence in these
countries is transformed into knowledge-intensive
jobs and exports, benefiting from close cooperation
between academia and industry. Compared to the
top performers, countries like Belgium, France, the
UK, or Spain are weaker in transforming their
research investment into intellectual assets such as
patents or trademarks. France and Spain also have
24 About 1 % of GDP.
0.1
0.2
0.3
0.4
0.5
0.6
0.7
0.8
SE DE DK FI NL LU BE UK AT IE FR ES SI CY IT PT EL MT EE CZ SK HU HR LT PL LV RO BG CH NO
2012 EU 2012 0.8
4
Components of the Innovation Union Scoreboard
Intellectual assets
PCT patent applications
PCT patent applications in societal challenges
Community trademarks
Community designs
Innovators
SMEs with product or process innovations
SMEs with marketing or organisational innovations
High-growth innovative firms
Economic effects
Employment in knowledge-intensive activities
Medium- and high-tech product exports
Knowledge-intensive services exports
Licence and patent revenues from abroad
Components of the Innovation Union Scoreboard
Human resources
New doctoral graduates
Population aged 30-34 with tertiary education
Youth with at least upper secondary education
Open research systems
International scientific co-publications
Top 10% most cited scientific publications
Non-EU doctoral students
Finance and support
Public sector R&D expenditure
Venture capital
Firm investments
Business sector R&D expenditure
Non-R&D innovation expenditure
Linkages and entrepreneurship
SMEs innovating in-house
Innovative SMEs collaborating with others
Public-private co-publications
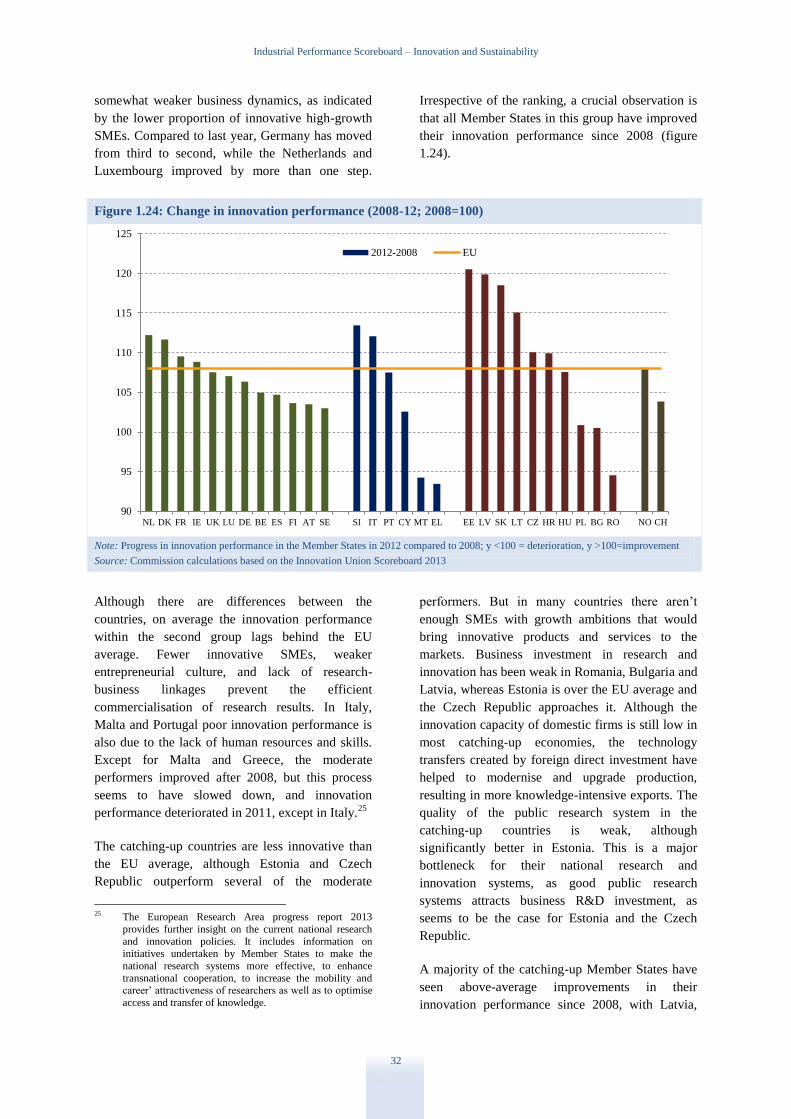
Industrial Performance Scoreboard – Innovation and Sustainability
32
somewhat weaker business dynamics, as indicated
by the lower proportion of innovative high-growth
SMEs. Compared to last year, Germany has moved
from third to second, while the Netherlands and
Luxembourg improved by more than one step.
Irrespective of the ranking, a crucial observation is
that all Member States in this group have improved
their innovation performance since 2008 (figure
1.24).
Figure 1.24: Change in innovation performance (2008-12; 2008=100)
Note: Progress in innovation performance in the Member States in 2012 compared to 2008; y <100 = deterioration, y >100=improvement
Source: Commission calculations based on the Innovation Union Scoreboard 2013
Although there are differences between the
countries, on average the innovation performance
within the second group lags behind the EU
average. Fewer innovative SMEs, weaker
entrepreneurial culture, and lack of research-
business linkages prevent the efficient
commercialisation of research results. In Italy,
Malta and Portugal poor innovation performance is
also due to the lack of human resources and skills.
Except for Malta and Greece, the moderate
performers improved after 2008, but this process
seems to have slowed down, and innovation
performance deteriorated in 2011, except in Italy.25
The catching-up countries are less innovative than
the EU average, although Estonia and Czech
Republic outperform several of the moderate
25 The European Research Area progress report 2013
provides further insight on the current national research
and innovation policies. It includes information on
initiatives undertaken by Member States to make the
national research systems more effective, to enhance
transnational cooperation, to increase the mobility and career’ attractiveness of researchers as well as to optimise
access and transfer of knowledge.
performers. But in many countries there aren’t
enough SMEs with growth ambitions that would
bring innovative products and services to the
markets. Business investment in research and
innovation has been weak in Romania, Bulgaria and
Latvia, whereas Estonia is over the EU average and
the Czech Republic approaches it. Although the
innovation capacity of domestic firms is still low in
most catching-up economies, the technology
transfers created by foreign direct investment have
helped to modernise and upgrade production,
resulting in more knowledge-intensive exports. The
quality of the public research system in the
catching-up countries is weak, although
significantly better in Estonia. This is a major
bottleneck for their national research and
innovation systems, as good public research
systems attracts business R&D investment, as
seems to be the case for Estonia and the Czech
Republic.
A majority of the catching-up Member States have
seen above-average improvements in their
innovation performance since 2008, with Latvia,
90
95
100
105
110
115
120
125
NL DK FR IE UK LU DE BE ES FI AT SE SI IT PT CY MT EL EE LV SK LT CZ HR HU PL BG RO NO CH
2012-2008 EU
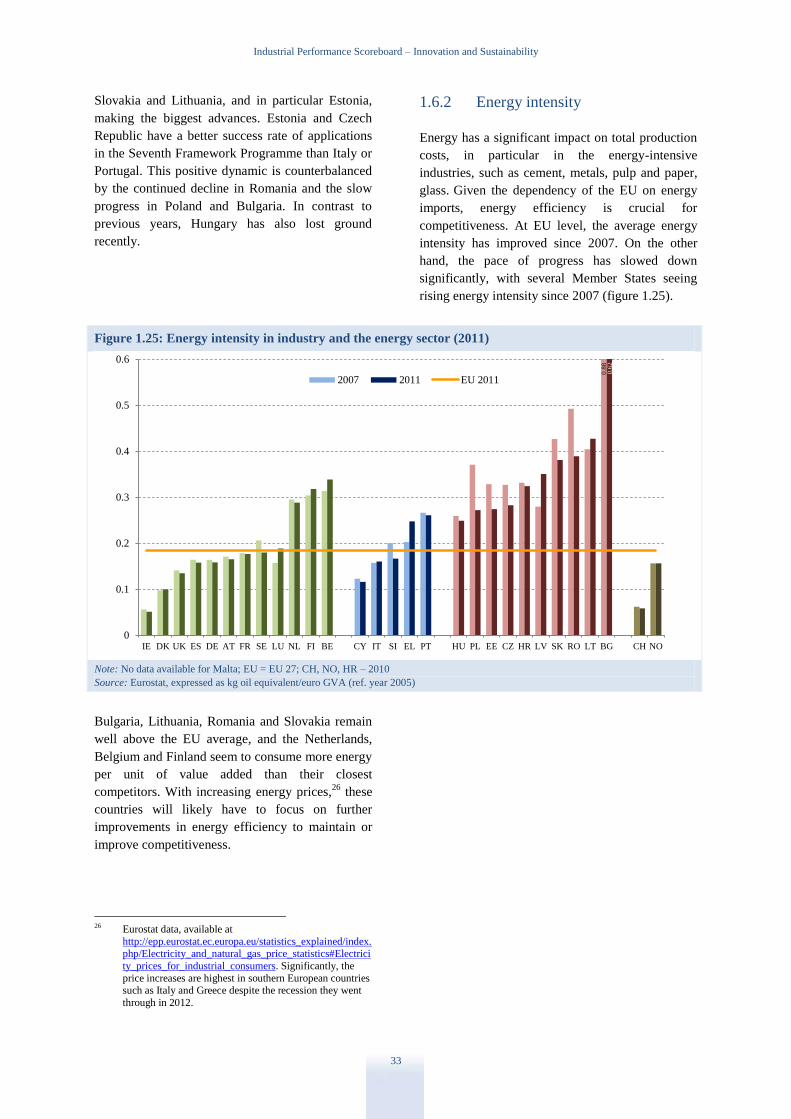
Industrial Performance Scoreboard – Innovation and Sustainability
33
Slovakia and Lithuania, and in particular Estonia,
making the biggest advances. Estonia and Czech
Republic have a better success rate of applications
in the Seventh Framework Programme than Italy or
Portugal. This positive dynamic is counterbalanced
by the continued decline in Romania and the slow
progress in Poland and Bulgaria. In contrast to
previous years, Hungary has also lost ground
recently.
1.6.2 Energy intensity
Energy has a significant impact on total production
costs, in particular in the energy-intensive
industries, such as cement, metals, pulp and paper,
glass. Given the dependency of the EU on energy
imports, energy efficiency is crucial for
competitiveness. At EU level, the average energy
intensity has improved since 2007. On the other
hand, the pace of progress has slowed down
significantly, with several Member States seeing
rising energy intensity since 2007 (figure 1.25).
Figure 1.25: Energy intensity in industry and the energy sector (2011)
Note: No data available for Malta; EU = EU 27; CH, NO, HR – 2010
Source: Eurostat, expressed as kg oil equivalent/euro GVA (ref. year 2005)
Bulgaria, Lithuania, Romania and Slovakia remain
well above the EU average, and the Netherlands,
Belgium and Finland seem to consume more energy
per unit of value added than their closest
competitors. With increasing energy prices,26
these
countries will likely have to focus on further
improvements in energy efficiency to maintain or
improve competitiveness.
26 Eurostat data, available at
http://epp.eurostat.ec.europa.eu/statistics_explained/index.
php/Electricity_and_natural_gas_price_statistics#Electrici
ty_prices_for_industrial_consumers. Significantly, the
price increases are highest in southern European countries such as Italy and Greece despite the recession they went
through in 2012.
0
0.1
0.2
0.3
0.4
0.5
0.6
IE DK UK ES DE AT FR SE LU NL FI BE CY IT SI EL PT HU PL EE CZ HR LV SK RO LT BG CH NO
2007 2011 EU 2011
0.8
8
0.6
2
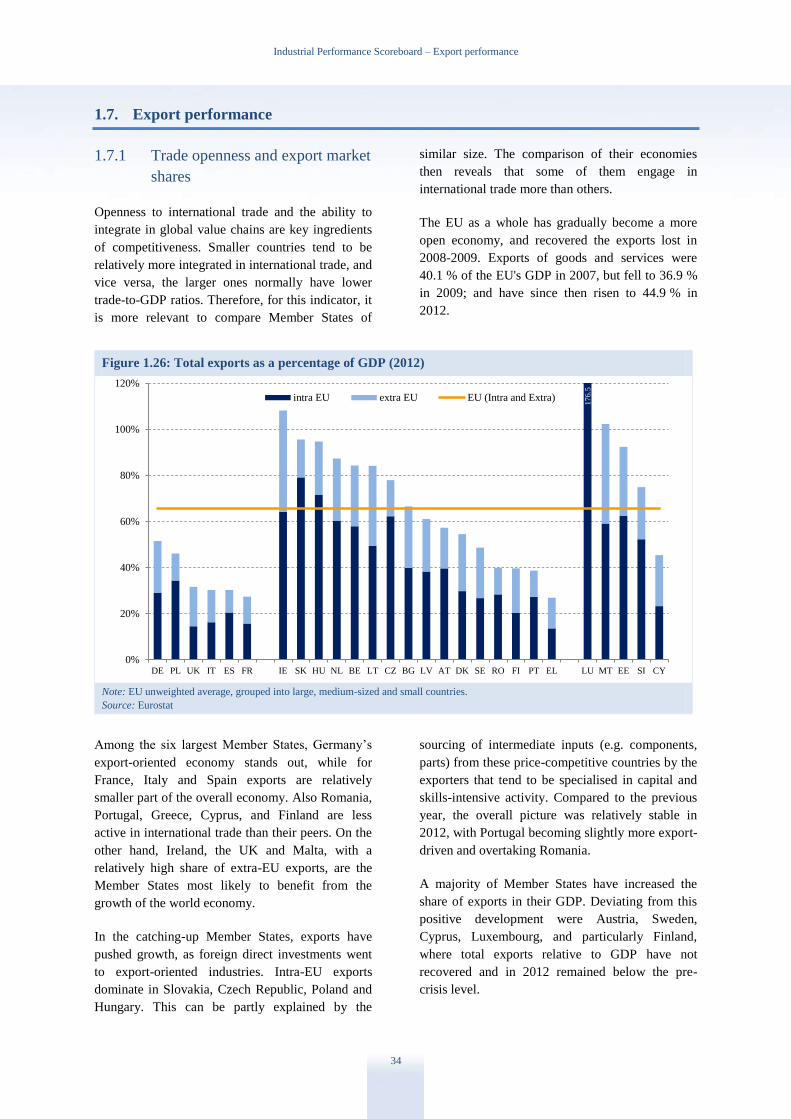
Industrial Performance Scoreboard – Export performance
34
1.7. Export performance
1.7.1 Trade openness and export market
shares
Openness to international trade and the ability to
integrate in global value chains are key ingredients
of competitiveness. Smaller countries tend to be
relatively more integrated in international trade, and
vice versa, the larger ones normally have lower
trade-to-GDP ratios. Therefore, for this indicator, it
is more relevant to compare Member States of
similar size. The comparison of their economies
then reveals that some of them engage in
international trade more than others.
The EU as a whole has gradually become a more
open economy, and recovered the exports lost in
2008-2009. Exports of goods and services were
40.1 % of the EU's GDP in 2007, but fell to 36.9 %
in 2009; and have since then risen to 44.9 % in
2012.
Figure 1.26: Total exports as a percentage of GDP (2012)
Note: EU unweighted average, grouped into large, medium-sized and small countries.
Source: Eurostat
Among the six largest Member States, Germany’s
export-oriented economy stands out, while for
France, Italy and Spain exports are relatively
smaller part of the overall economy. Also Romania,
Portugal, Greece, Cyprus, and Finland are less
active in international trade than their peers. On the
other hand, Ireland, the UK and Malta, with a
relatively high share of extra-EU exports, are the
Member States most likely to benefit from the
growth of the world economy.
In the catching-up Member States, exports have
pushed growth, as foreign direct investments went
to export-oriented industries. Intra-EU exports
dominate in Slovakia, Czech Republic, Poland and
Hungary. This can be partly explained by the
sourcing of intermediate inputs (e.g. components,
parts) from these price-competitive countries by the
exporters that tend to be specialised in capital and
skills-intensive activity. Compared to the previous
year, the overall picture was relatively stable in
2012, with Portugal becoming slightly more export-
driven and overtaking Romania.
A majority of Member States have increased the
share of exports in their GDP. Deviating from this
positive development were Austria, Sweden,
Cyprus, Luxembourg, and particularly Finland,
where total exports relative to GDP have not
recovered and in 2012 remained below the pre-
crisis level.
0%
20%
40%
60%
80%
100%
120%
DE PL UK IT ES FR IE SK HU NL BE LT CZ BG LV AT DK SE RO FI PT EL LU MT EE SI CY
intra EU extra EU EU (Intra and Extra)
176.5
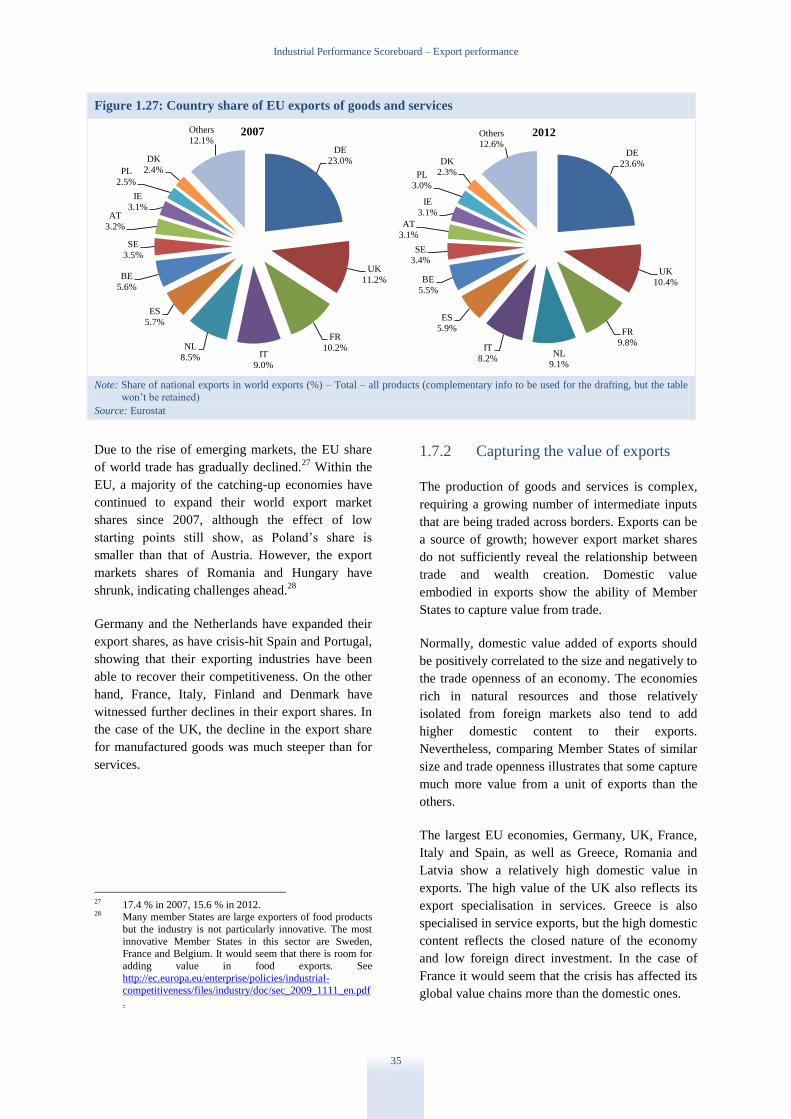
Industrial Performance Scoreboard – Export performance
35
Figure 1.27: Country share of EU exports of goods and services
Note: Share of national exports in world exports (%) – Total – all products (complementary info to be used for the drafting, but the table
won’t be retained)
Source: Eurostat
Due to the rise of emerging markets, the EU share
of world trade has gradually declined.27
Within the
EU, a majority of the catching-up economies have
continued to expand their world export market
shares since 2007, although the effect of low
starting points still show, as Poland’s share is
smaller than that of Austria. However, the export
markets shares of Romania and Hungary have
shrunk, indicating challenges ahead.28
Germany and the Netherlands have expanded their
export shares, as have crisis-hit Spain and Portugal,
showing that their exporting industries have been
able to recover their competitiveness. On the other
hand, France, Italy, Finland and Denmark have
witnessed further declines in their export shares. In
the case of the UK, the decline in the export share
for manufactured goods was much steeper than for
services.
27 17.4 % in 2007, 15.6 % in 2012. 28 Many member States are large exporters of food products
but the industry is not particularly innovative. The most
innovative Member States in this sector are Sweden,
France and Belgium. It would seem that there is room for
adding value in food exports. See
http://ec.europa.eu/enterprise/policies/industrial-competitiveness/files/industry/doc/sec_2009_1111_en.pdf
.
1.7.2 Capturing the value of exports
The production of goods and services is complex,
requiring a growing number of intermediate inputs
that are being traded across borders. Exports can be
a source of growth; however export market shares
do not sufficiently reveal the relationship between
trade and wealth creation. Domestic value
embodied in exports show the ability of Member
States to capture value from trade.
Normally, domestic value added of exports should
be positively correlated to the size and negatively to
the trade openness of an economy. The economies
rich in natural resources and those relatively
isolated from foreign markets also tend to add
higher domestic content to their exports.
Nevertheless, comparing Member States of similar
size and trade openness illustrates that some capture
much more value from a unit of exports than the
others.
The largest EU economies, Germany, UK, France,
Italy and Spain, as well as Greece, Romania and
Latvia show a relatively high domestic value in
exports. The high value of the UK also reflects its
export specialisation in services. Greece is also
specialised in service exports, but the high domestic
content reflects the closed nature of the economy
and low foreign direct investment. In the case of
France it would seem that the crisis has affected its
global value chains more than the domestic ones.
DE
23.0%
UK
11.2%
FR
10.2%IT
9.0%
NL
8.5%
ES
5.7%
BE
5.6%
SE
3.5%
AT
3.2%
IE
3.1%
PL
2.5%
DK
2.4%
Others
12.1%2007
DE
23.6%
UK
10.4%
FR
9.8%
NL
9.1%
IT
8.2%
ES
5.9%
BE
5.5%
SE
3.4%
AT
3.1%
IE
3.1%
PL
3.0%
DK
2.3%
Others
12.6%
2012
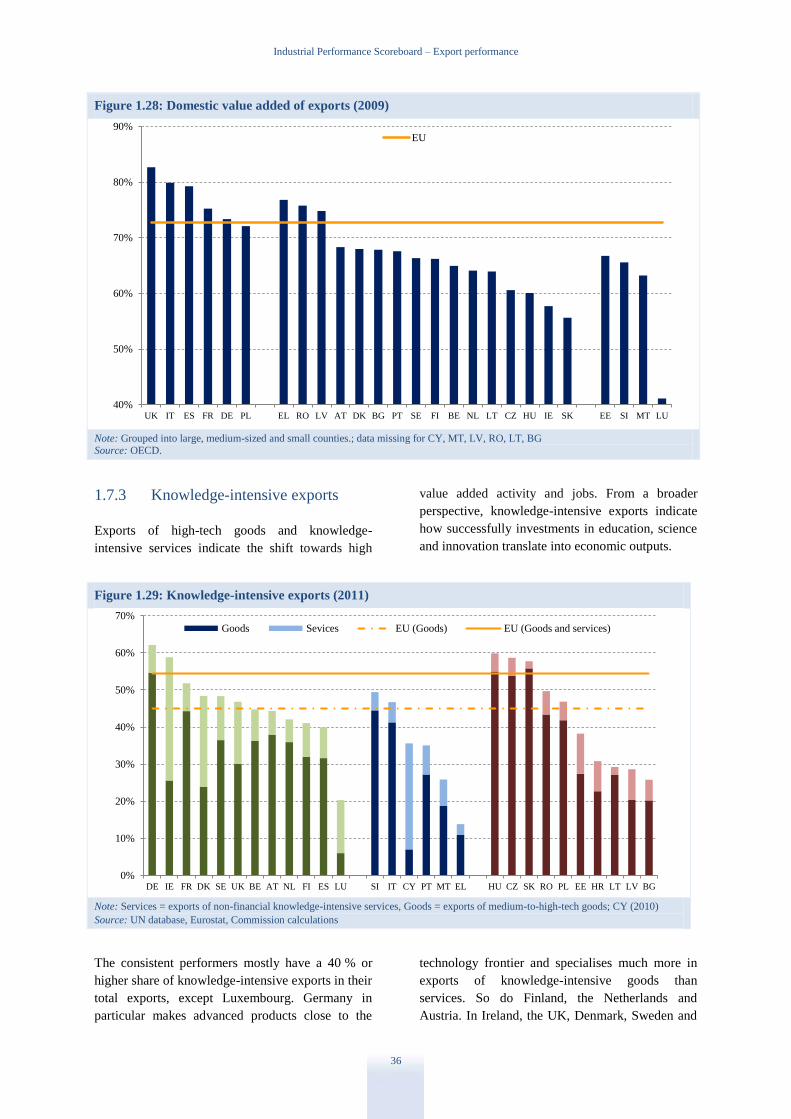
Industrial Performance Scoreboard – Export performance
36
Figure 1.28: Domestic value added of exports (2009)
Note: Grouped into large, medium-sized and small counties.; data missing for CY, MT, LV, RO, LT, BG Source: OECD.
1.7.3 Knowledge-intensive exports
Exports of high-tech goods and knowledge-
intensive services indicate the shift towards high
value added activity and jobs. From a broader
perspective, knowledge-intensive exports indicate
how successfully investments in education, science
and innovation translate into economic outputs.
Figure 1.29: Knowledge-intensive exports (2011)
Note: Services = exports of non-financial knowledge-intensive services, Goods = exports of medium-to-high-tech goods; CY (2010)
Source: UN database, Eurostat, Commission calculations
The consistent performers mostly have a 40 % or
higher share of knowledge-intensive exports in their
total exports, except Luxembourg. Germany in
particular makes advanced products close to the
technology frontier and specialises much more in
exports of knowledge-intensive goods than
services. So do Finland, the Netherlands and
Austria. In Ireland, the UK, Denmark, Sweden and
40%
50%
60%
70%
80%
90%
UK IT ES FR DE PL EL RO LV AT DK BG PT SE FI BE NL LT CZ HU IE SK EE SI MT LU
EU
0%
10%
20%
30%
40%
50%
60%
70%
DE IE FR DK SE UK BE AT NL FI ES LU SI IT CY PT MT EL HU CZ SK RO PL EE HR LT LV BG
Goods Sevices EU (Goods) EU (Goods and services)
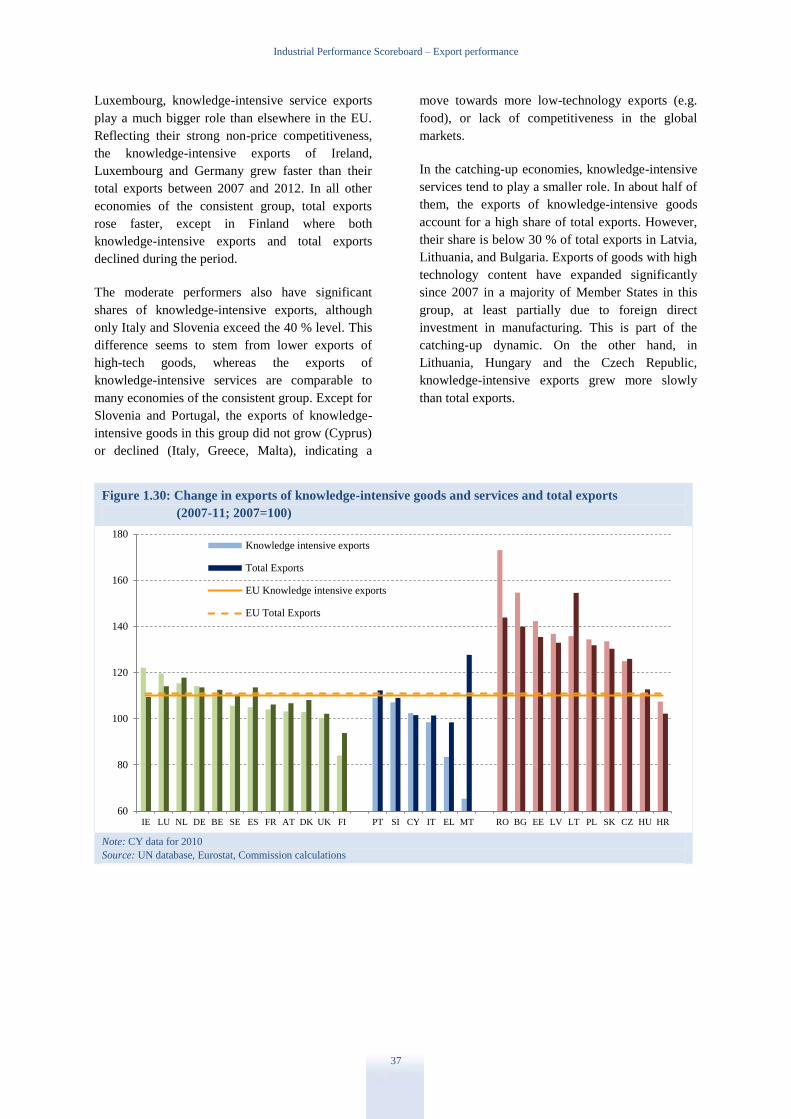
Industrial Performance Scoreboard – Export performance
37
Luxembourg, knowledge-intensive service exports
play a much bigger role than elsewhere in the EU.
Reflecting their strong non-price competitiveness,
the knowledge-intensive exports of Ireland,
Luxembourg and Germany grew faster than their
total exports between 2007 and 2012. In all other
economies of the consistent group, total exports
rose faster, except in Finland where both
knowledge-intensive exports and total exports
declined during the period.
The moderate performers also have significant
shares of knowledge-intensive exports, although
only Italy and Slovenia exceed the 40 % level. This
difference seems to stem from lower exports of
high-tech goods, whereas the exports of
knowledge-intensive services are comparable to
many economies of the consistent group. Except for
Slovenia and Portugal, the exports of knowledge-
intensive goods in this group did not grow (Cyprus)
or declined (Italy, Greece, Malta), indicating a
move towards more low-technology exports (e.g.
food), or lack of competitiveness in the global
markets.
In the catching-up economies, knowledge-intensive
services tend to play a smaller role. In about half of
them, the exports of knowledge-intensive goods
account for a high share of total exports. However,
their share is below 30 % of total exports in Latvia,
Lithuania, and Bulgaria. Exports of goods with high
technology content have expanded significantly
since 2007 in a majority of Member States in this
group, at least partially due to foreign direct
investment in manufacturing. This is part of the
catching-up dynamic. On the other hand, in
Lithuania, Hungary and the Czech Republic,
knowledge-intensive exports grew more slowly
than total exports.
Figure 1.30: Change in exports of knowledge-intensive goods and services and total exports
(2007-11; 2007=100)
Note: CY data for 2010
Source: UN database, Eurostat, Commission calculations
60
80
100
120
140
160
180
IE LU NL DE BE SE ES FR AT DK UK FI PT SI CY IT EL MT RO BG EE LV LT PL SK CZ HU HR
Knowledge intensive exports
Total Exports
EU Knowledge intensive exports
EU Total Exports
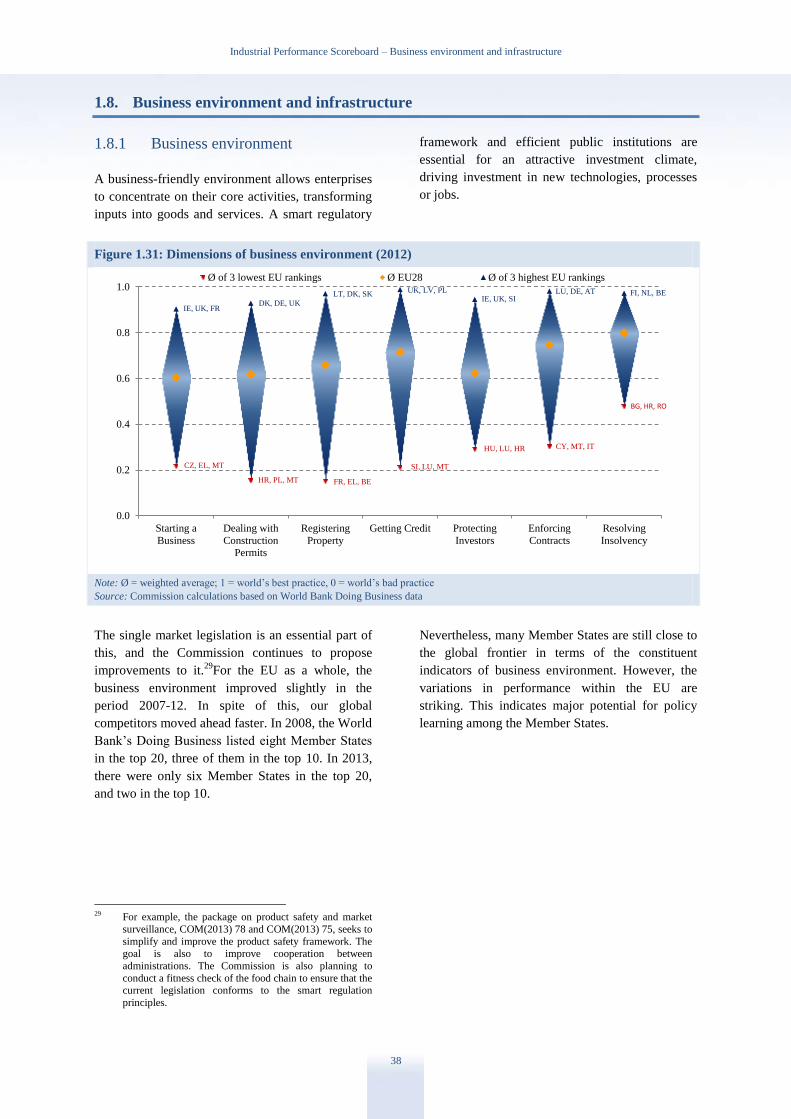
Industrial Performance Scoreboard – Business environment and infrastructure
38
1.8. Business environment and infrastructure
1.8.1 Business environment
A business-friendly environment allows enterprises
to concentrate on their core activities, transforming
inputs into goods and services. A smart regulatory
framework and efficient public institutions are
essential for an attractive investment climate,
driving investment in new technologies, processes
or jobs.
Figure 1.31: Dimensions of business environment (2012)
Note: Ø = weighted average; 1 = world’s best practice, 0 = world’s bad practice
Source: Commission calculations based on World Bank Doing Business data
The single market legislation is an essential part of
this, and the Commission continues to propose
improvements to it.29
For the EU as a whole, the
business environment improved slightly in the
period 2007-12. In spite of this, our global
competitors moved ahead faster. In 2008, the World
Bank’s Doing Business listed eight Member States
in the top 20, three of them in the top 10. In 2013,
there were only six Member States in the top 20,
and two in the top 10.
29 For example, the package on product safety and market
surveillance, COM(2013) 78 and COM(2013) 75, seeks to
simplify and improve the product safety framework. The
goal is also to improve cooperation between
administrations. The Commission is also planning to
conduct a fitness check of the food chain to ensure that the current legislation conforms to the smart regulation
principles.
Nevertheless, many Member States are still close to
the global frontier in terms of the constituent
indicators of business environment. However, the
variations in performance within the EU are
striking. This indicates major potential for policy
learning among the Member States.
0.0
0.2
0.4
0.6
0.8
1.0
Starting a
Business
Dealing with
ConstructionPermits
Registering
Property
Getting Credit Protecting
Investors
Enforcing
Contracts
Resolving
Insolvency
Ø of 3 lowest EU rankings Ø EU28 Ø of 3 highest EU rankings
DK, DE, UK
LT, DK, SK UK, LV, PL
IE, UK, FR
IE, UK, SI LU, DE, AT FI, NL, BE
CZ, EL, MT
HR, PL, MT FR, EL, BE
SI, LU, MT
HU, LU, HR CY, MT, IT
BG, HR, RO
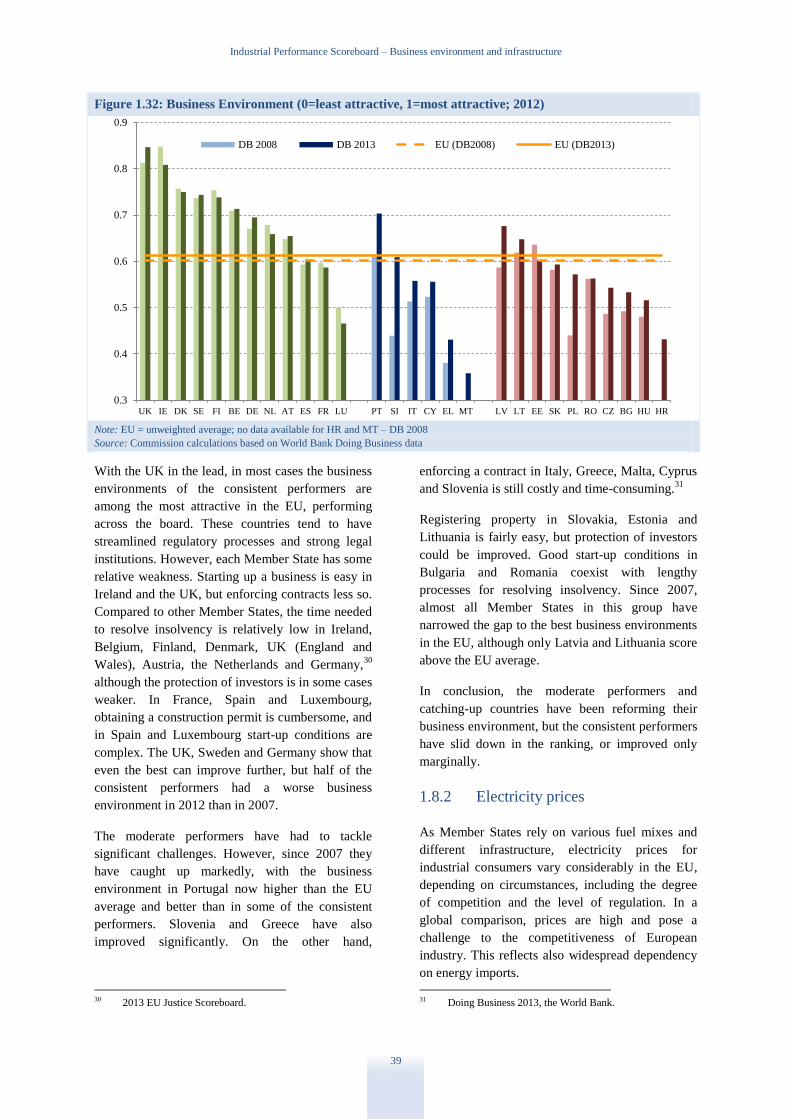
Industrial Performance Scoreboard – Business environment and infrastructure
39
Figure 1.32: Business Environment (0=least attractive, 1=most attractive; 2012)
Note: EU = unweighted average; no data available for HR and MT – DB 2008
Source: Commission calculations based on World Bank Doing Business data
With the UK in the lead, in most cases the business
environments of the consistent performers are
among the most attractive in the EU, performing
across the board. These countries tend to have
streamlined regulatory processes and strong legal
institutions. However, each Member State has some
relative weakness. Starting up a business is easy in
Ireland and the UK, but enforcing contracts less so.
Compared to other Member States, the time needed
to resolve insolvency is relatively low in Ireland,
Belgium, Finland, Denmark, UK (England and
Wales), Austria, the Netherlands and Germany,30
although the protection of investors is in some cases
weaker. In France, Spain and Luxembourg,
obtaining a construction permit is cumbersome, and
in Spain and Luxembourg start-up conditions are
complex. The UK, Sweden and Germany show that
even the best can improve further, but half of the
consistent performers had a worse business
environment in 2012 than in 2007.
The moderate performers have had to tackle
significant challenges. However, since 2007 they
have caught up markedly, with the business
environment in Portugal now higher than the EU
average and better than in some of the consistent
performers. Slovenia and Greece have also
improved significantly. On the other hand,
30 2013 EU Justice Scoreboard.
enforcing a contract in Italy, Greece, Malta, Cyprus
and Slovenia is still costly and time-consuming.31
Registering property in Slovakia, Estonia and
Lithuania is fairly easy, but protection of investors
could be improved. Good start-up conditions in
Bulgaria and Romania coexist with lengthy
processes for resolving insolvency. Since 2007,
almost all Member States in this group have
narrowed the gap to the best business environments
in the EU, although only Latvia and Lithuania score
above the EU average.
In conclusion, the moderate performers and
catching-up countries have been reforming their
business environment, but the consistent performers
have slid down in the ranking, or improved only
marginally.
1.8.2 Electricity prices
As Member States rely on various fuel mixes and
different infrastructure, electricity prices for
industrial consumers vary considerably in the EU,
depending on circumstances, including the degree
of competition and the level of regulation. In a
global comparison, prices are high and pose a
challenge to the competitiveness of European
industry. This reflects also widespread dependency
on energy imports.
31 Doing Business 2013, the World Bank.
0.3
0.4
0.5
0.6
0.7
0.8
0.9
UK IE DK SE FI BE DE NL AT ES FR LU PT SI IT CY EL MT LV LT EE SK PL RO CZ BG HU HR
DB 2008 DB 2013 EU (DB2008) EU (DB2013)
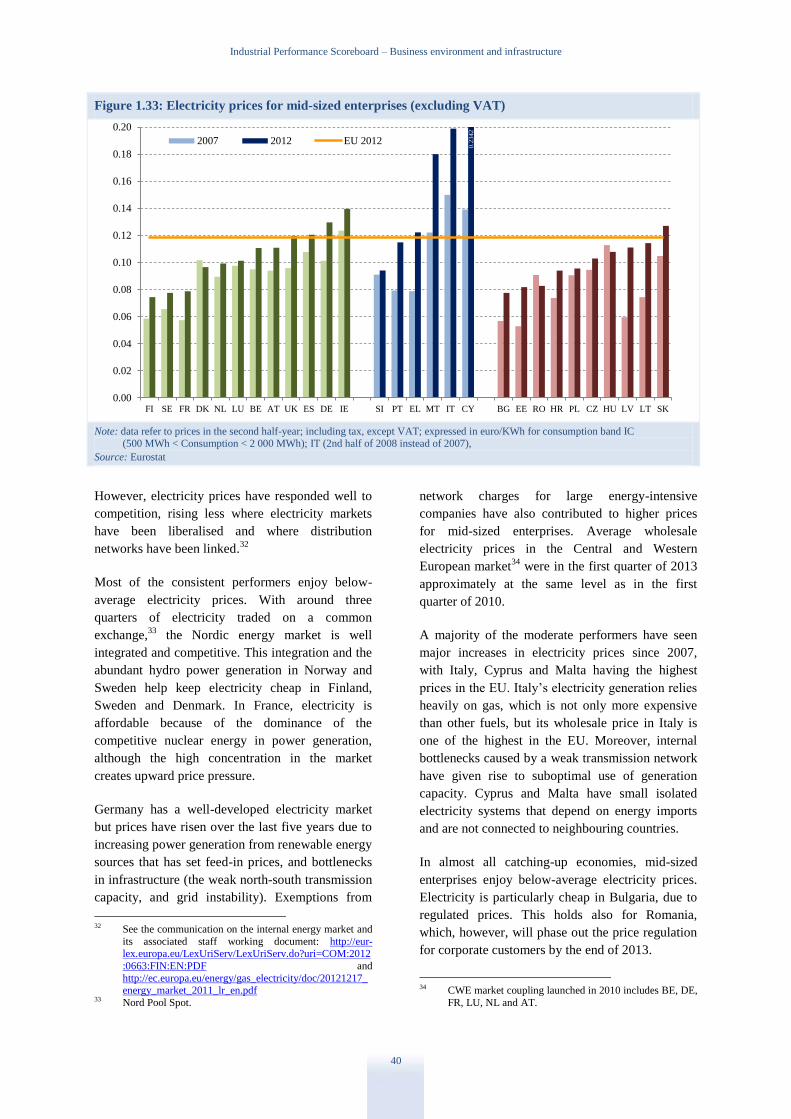
Industrial Performance Scoreboard – Business environment and infrastructure
40
Figure 1.33: Electricity prices for mid-sized enterprises (excluding VAT)
Note: data refer to prices in the second half-year; including tax, except VAT; expressed in euro/KWh for consumption band IC (500 MWh < Consumption < 2 000 MWh); IT (2nd half of 2008 instead of 2007),
Source: Eurostat
However, electricity prices have responded well to
competition, rising less where electricity markets
have been liberalised and where distribution
networks have been linked.32
Most of the consistent performers enjoy below-
average electricity prices. With around three
quarters of electricity traded on a common
exchange,33
the Nordic energy market is well
integrated and competitive. This integration and the
abundant hydro power generation in Norway and
Sweden help keep electricity cheap in Finland,
Sweden and Denmark. In France, electricity is
affordable because of the dominance of the
competitive nuclear energy in power generation,
although the high concentration in the market
creates upward price pressure.
Germany has a well-developed electricity market
but prices have risen over the last five years due to
increasing power generation from renewable energy
sources that has set feed-in prices, and bottlenecks
in infrastructure (the weak north-south transmission
capacity, and grid instability). Exemptions from
32 See the communication on the internal energy market and
its associated staff working document: http://eur-
lex.europa.eu/LexUriServ/LexUriServ.do?uri=COM:2012
:0663:FIN:EN:PDF and
http://ec.europa.eu/energy/gas_electricity/doc/20121217_energy_market_2011_lr_en.pdf
33 Nord Pool Spot.
network charges for large energy-intensive
companies have also contributed to higher prices
for mid-sized enterprises. Average wholesale
electricity prices in the Central and Western
European market34
were in the first quarter of 2013
approximately at the same level as in the first
quarter of 2010.
A majority of the moderate performers have seen
major increases in electricity prices since 2007,
with Italy, Cyprus and Malta having the highest
prices in the EU. Italy’s electricity generation relies
heavily on gas, which is not only more expensive
than other fuels, but its wholesale price in Italy is
one of the highest in the EU. Moreover, internal
bottlenecks caused by a weak transmission network
have given rise to suboptimal use of generation
capacity. Cyprus and Malta have small isolated
electricity systems that depend on energy imports
and are not connected to neighbouring countries.
In almost all catching-up economies, mid-sized
enterprises enjoy below-average electricity prices.
Electricity is particularly cheap in Bulgaria, due to
regulated prices. This holds also for Romania,
which, however, will phase out the price regulation
for corporate customers by the end of 2013.
34 CWE market coupling launched in 2010 includes BE, DE,
FR, LU, NL and AT.
0.00
0.02
0.04
0.06
0.08
0.10
0.12
0.14
0.16
0.18
0.20
FI SE FR DK NL LU BE AT UK ES DE IE SI PT EL MT IT CY BG EE RO HR PL CZ HU LV LT SK
2007 2012 EU 2012
0.2
34
2
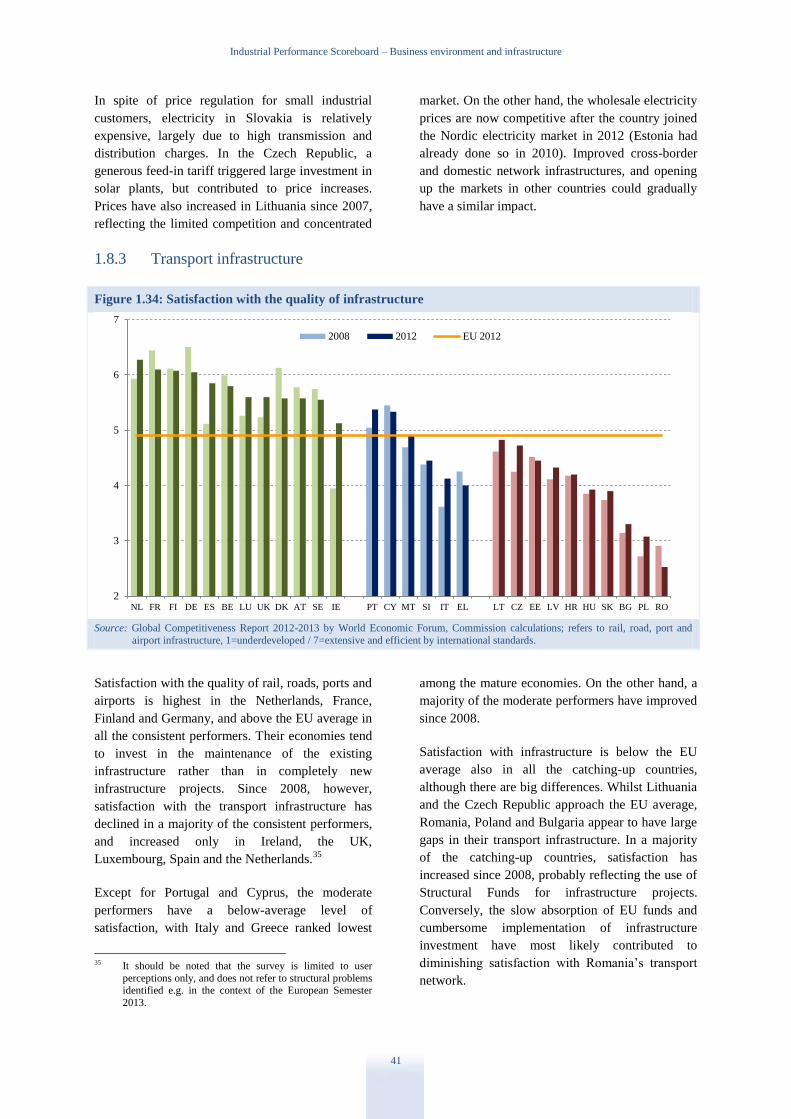
Industrial Performance Scoreboard – Business environment and infrastructure
41
In spite of price regulation for small industrial
customers, electricity in Slovakia is relatively
expensive, largely due to high transmission and
distribution charges. In the Czech Republic, a
generous feed-in tariff triggered large investment in
solar plants, but contributed to price increases.
Prices have also increased in Lithuania since 2007,
reflecting the limited competition and concentrated
market. On the other hand, the wholesale electricity
prices are now competitive after the country joined
the Nordic electricity market in 2012 (Estonia had
already done so in 2010). Improved cross-border
and domestic network infrastructures, and opening
up the markets in other countries could gradually
have a similar impact.
1.8.3 Transport infrastructure
Figure 1.34: Satisfaction with the quality of infrastructure
Source: Global Competitiveness Report 2012-2013 by World Economic Forum, Commission calculations; refers to rail, road, port and
airport infrastructure, 1=underdeveloped / 7=extensive and efficient by international standards.
Satisfaction with the quality of rail, roads, ports and
airports is highest in the Netherlands, France,
Finland and Germany, and above the EU average in
all the consistent performers. Their economies tend
to invest in the maintenance of the existing
infrastructure rather than in completely new
infrastructure projects. Since 2008, however,
satisfaction with the transport infrastructure has
declined in a majority of the consistent performers,
and increased only in Ireland, the UK,
Luxembourg, Spain and the Netherlands.35
Except for Portugal and Cyprus, the moderate
performers have a below-average level of
satisfaction, with Italy and Greece ranked lowest
35 It should be noted that the survey is limited to user
perceptions only, and does not refer to structural problems identified e.g. in the context of the European Semester
2013.
among the mature economies. On the other hand, a
majority of the moderate performers have improved
since 2008.
Satisfaction with infrastructure is below the EU
average also in all the catching-up countries,
although there are big differences. Whilst Lithuania
and the Czech Republic approach the EU average,
Romania, Poland and Bulgaria appear to have large
gaps in their transport infrastructure. In a majority
of the catching-up countries, satisfaction has
increased since 2008, probably reflecting the use of
Structural Funds for infrastructure projects.
Conversely, the slow absorption of EU funds and
cumbersome implementation of infrastructure
investment have most likely contributed to
diminishing satisfaction with Romania’s transport
network.
2
3
4
5
6
7
NL FR FI DE ES BE LU UK DK AT SE IE PT CY MT SI IT EL LT CZ EE LV HR HU SK BG PL RO
2008 2012 EU 2012
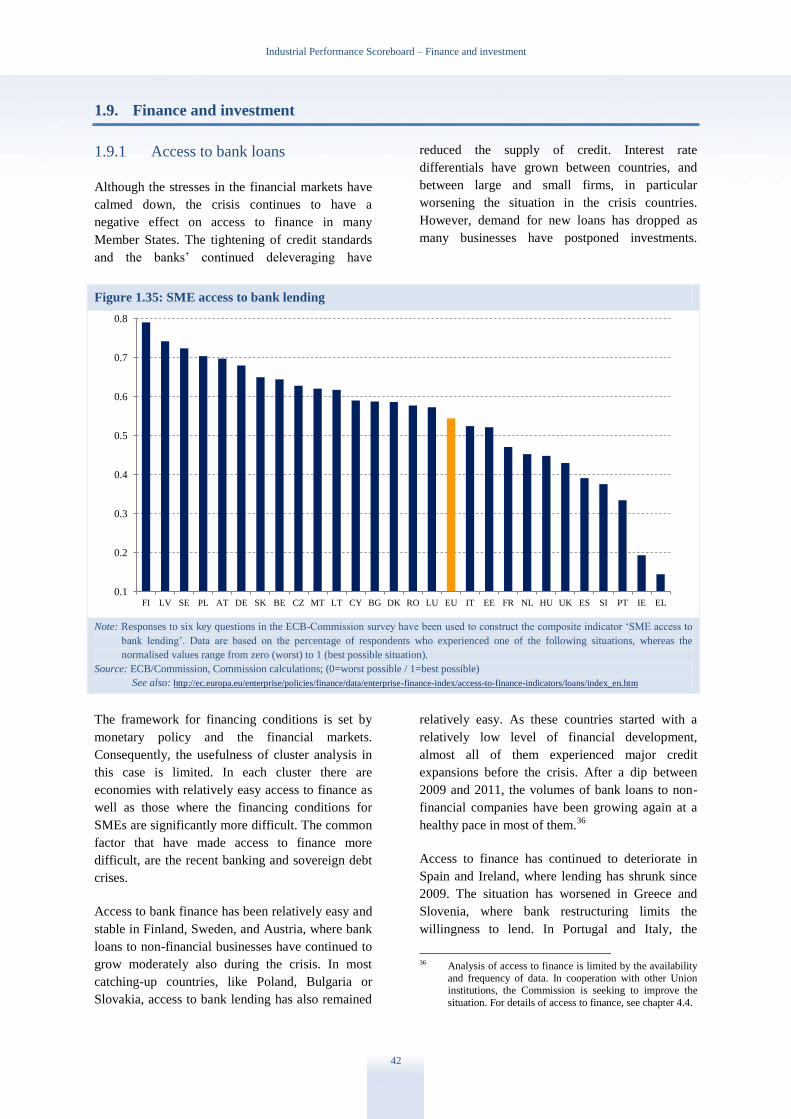
Industrial Performance Scoreboard – Finance and investment
42
1.9. Finance and investment
1.9.1 Access to bank loans
Although the stresses in the financial markets have
calmed down, the crisis continues to have a
negative effect on access to finance in many
Member States. The tightening of credit standards
and the banks’ continued deleveraging have
reduced the supply of credit. Interest rate
differentials have grown between countries, and
between large and small firms, in particular
worsening the situation in the crisis countries.
However, demand for new loans has dropped as
many businesses have postponed investments.
Figure 1.35: SME access to bank lending
Note: Responses to six key questions in the ECB-Commission survey have been used to construct the composite indicator ‘SME access to
bank lending’. Data are based on the percentage of respondents who experienced one of the following situations, whereas the
normalised values range from zero (worst) to 1 (best possible situation).
Source: ECB/Commission, Commission calculations; (0=worst possible / 1=best possible)
See also: http://ec.europa.eu/enterprise/policies/finance/data/enterprise-finance-index/access-to-finance-indicators/loans/index_en.htm
The framework for financing conditions is set by
monetary policy and the financial markets.
Consequently, the usefulness of cluster analysis in
this case is limited. In each cluster there are
economies with relatively easy access to finance as
well as those where the financing conditions for
SMEs are significantly more difficult. The common
factor that have made access to finance more
difficult, are the recent banking and sovereign debt
crises.
Access to bank finance has been relatively easy and
stable in Finland, Sweden, and Austria, where bank
loans to non-financial businesses have continued to
grow moderately also during the crisis. In most
catching-up countries, like Poland, Bulgaria or
Slovakia, access to bank lending has also remained
relatively easy. As these countries started with a
relatively low level of financial development,
almost all of them experienced major credit
expansions before the crisis. After a dip between
2009 and 2011, the volumes of bank loans to non-
financial companies have been growing again at a
healthy pace in most of them.36
Access to finance has continued to deteriorate in
Spain and Ireland, where lending has shrunk since
2009. The situation has worsened in Greece and
Slovenia, where bank restructuring limits the
willingness to lend. In Portugal and Italy, the
36 Analysis of access to finance is limited by the availability
and frequency of data. In cooperation with other Union institutions, the Commission is seeking to improve the
situation. For details of access to finance, see chapter 4.4.
0.1
0.2
0.3
0.4
0.5
0.6
0.7
0.8
FI LV SE PL AT DE SK BE CZ MT LT CY BG DK RO LU EU IT EE FR NL HU UK ES SI PT IE EL
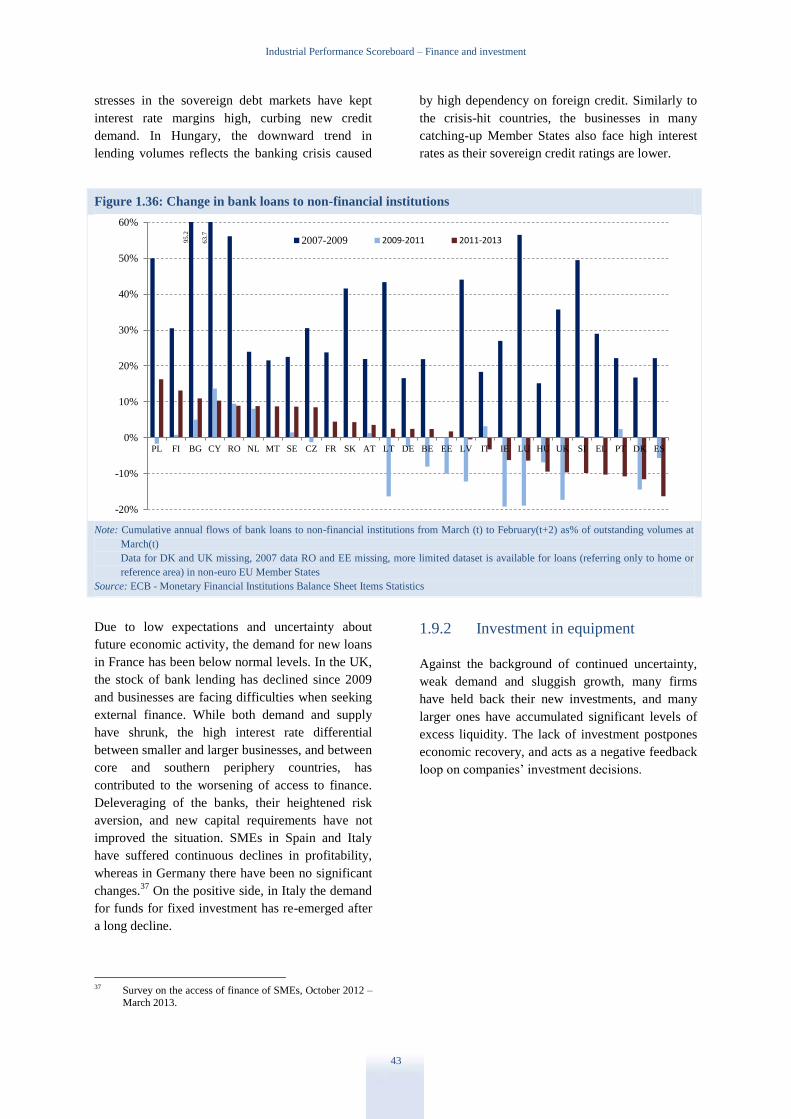
Industrial Performance Scoreboard – Finance and investment
43
stresses in the sovereign debt markets have kept
interest rate margins high, curbing new credit
demand. In Hungary, the downward trend in
lending volumes reflects the banking crisis caused
by high dependency on foreign credit. Similarly to
the crisis-hit countries, the businesses in many
catching-up Member States also face high interest
rates as their sovereign credit ratings are lower.
Figure 1.36: Change in bank loans to non-financial institutions
Note: Cumulative annual flows of bank loans to non-financial institutions from March (t) to February(t+2) as% of outstanding volumes at
March(t)
Data for DK and UK missing, 2007 data RO and EE missing, more limited dataset is available for loans (referring only to home or
reference area) in non-euro EU Member States
Source: ECB - Monetary Financial Institutions Balance Sheet Items Statistics
Due to low expectations and uncertainty about
future economic activity, the demand for new loans
in France has been below normal levels. In the UK,
the stock of bank lending has declined since 2009
and businesses are facing difficulties when seeking
external finance. While both demand and supply
have shrunk, the high interest rate differential
between smaller and larger businesses, and between
core and southern periphery countries, has
contributed to the worsening of access to finance.
Deleveraging of the banks, their heightened risk
aversion, and new capital requirements have not
improved the situation. SMEs in Spain and Italy
have suffered continuous declines in profitability,
whereas in Germany there have been no significant
changes.37
On the positive side, in Italy the demand
for funds for fixed investment has re-emerged after
a long decline.
37 Survey on the access of finance of SMEs, October 2012 –
March 2013.
1.9.2 Investment in equipment
Against the background of continued uncertainty,
weak demand and sluggish growth, many firms
have held back their new investments, and many
larger ones have accumulated significant levels of
excess liquidity. The lack of investment postpones
economic recovery, and acts as a negative feedback
loop on companies’ investment decisions.
-20%
-10%
0%
10%
20%
30%
40%
50%
60%
PL FI BG CY RO NL MT SE CZ FR SK AT LT DE BE EE LV IT IE LU HU UK SI EL PT DK ES
2007-2009 2009-2011 2011-201395
.2
63
.7
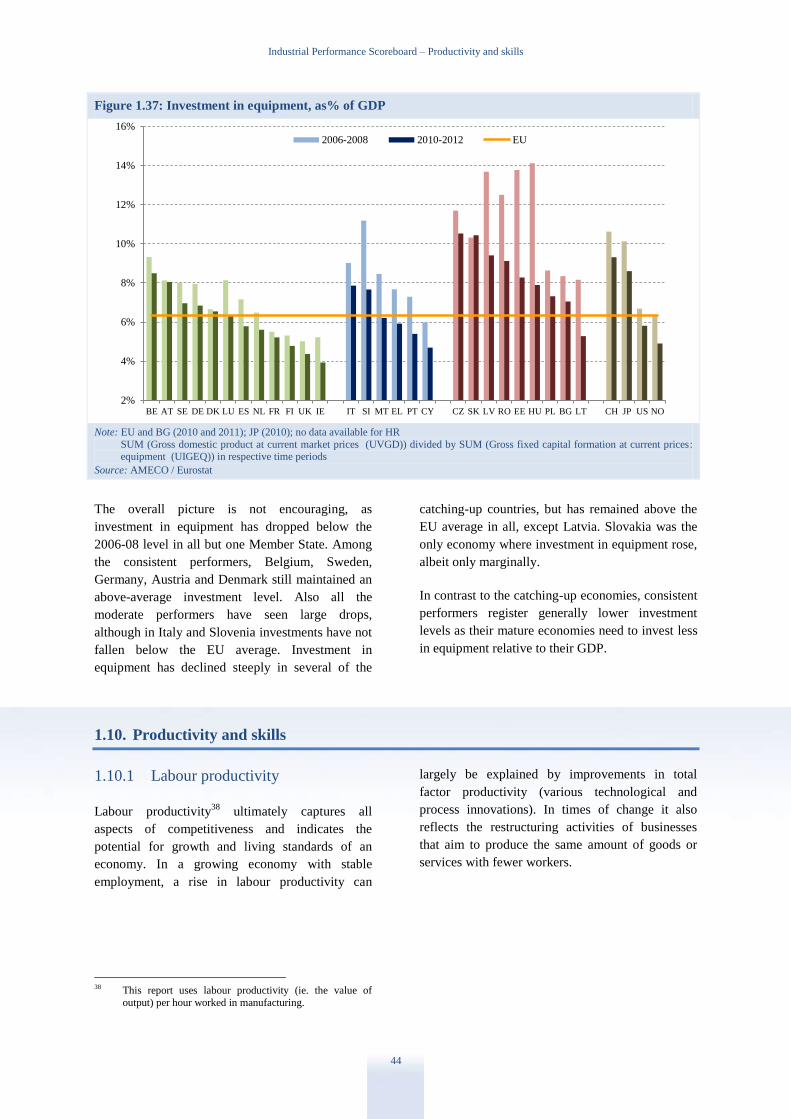
Industrial Performance Scoreboard – Productivity and skills
44
Figure 1.37: Investment in equipment, as% of GDP
Note: EU and BG (2010 and 2011); JP (2010); no data available for HR
SUM (Gross domestic product at current market prices (UVGD)) divided by SUM (Gross fixed capital formation at current prices: equipment (UIGEQ)) in respective time periods
Source: AMECO / Eurostat
The overall picture is not encouraging, as
investment in equipment has dropped below the
2006-08 level in all but one Member State. Among
the consistent performers, Belgium, Sweden,
Germany, Austria and Denmark still maintained an
above-average investment level. Also all the
moderate performers have seen large drops,
although in Italy and Slovenia investments have not
fallen below the EU average. Investment in
equipment has declined steeply in several of the
catching-up countries, but has remained above the
EU average in all, except Latvia. Slovakia was the
only economy where investment in equipment rose,
albeit only marginally.
In contrast to the catching-up economies, consistent
performers register generally lower investment
levels as their mature economies need to invest less
in equipment relative to their GDP.
1.10. Productivity and skills
1.10.1 Labour productivity
Labour productivity38
ultimately captures all
aspects of competitiveness and indicates the
potential for growth and living standards of an
economy. In a growing economy with stable
employment, a rise in labour productivity can
38 This report uses labour productivity (ie. the value of
output) per hour worked in manufacturing.
largely be explained by improvements in total
factor productivity (various technological and
process innovations). In times of change it also
reflects the restructuring activities of businesses
that aim to produce the same amount of goods or
services with fewer workers.
2%
4%
6%
8%
10%
12%
14%
16%
BE AT SE DE DK LU ES NL FR FI UK IE IT SI MT EL PT CY CZ SK LV RO EE HU PL BG LT CH JP US NO
2006-2008 2010-2012 EU
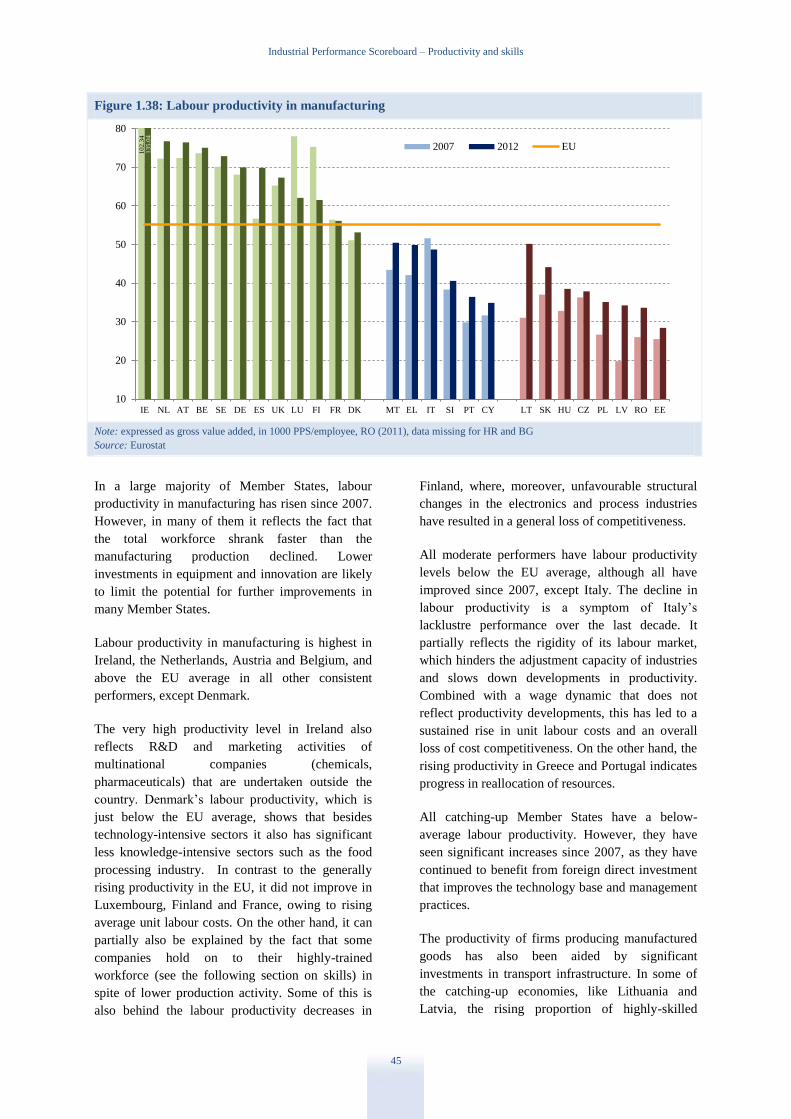
Industrial Performance Scoreboard – Productivity and skills
45
Figure 1.38: Labour productivity in manufacturing
Note: expressed as gross value added, in 1000 PPS/employee, RO (2011), data missing for HR and BG
Source: Eurostat
In a large majority of Member States, labour
productivity in manufacturing has risen since 2007.
However, in many of them it reflects the fact that
the total workforce shrank faster than the
manufacturing production declined. Lower
investments in equipment and innovation are likely
to limit the potential for further improvements in
many Member States.
Labour productivity in manufacturing is highest in
Ireland, the Netherlands, Austria and Belgium, and
above the EU average in all other consistent
performers, except Denmark.
The very high productivity level in Ireland also
reflects R&D and marketing activities of
multinational companies (chemicals,
pharmaceuticals) that are undertaken outside the
country. Denmark’s labour productivity, which is
just below the EU average, shows that besides
technology-intensive sectors it also has significant
less knowledge-intensive sectors such as the food
processing industry. In contrast to the generally
rising productivity in the EU, it did not improve in
Luxembourg, Finland and France, owing to rising
average unit labour costs. On the other hand, it can
partially also be explained by the fact that some
companies hold on to their highly-trained
workforce (see the following section on skills) in
spite of lower production activity. Some of this is
also behind the labour productivity decreases in
Finland, where, moreover, unfavourable structural
changes in the electronics and process industries
have resulted in a general loss of competitiveness.
All moderate performers have labour productivity
levels below the EU average, although all have
improved since 2007, except Italy. The decline in
labour productivity is a symptom of Italy’s
lacklustre performance over the last decade. It
partially reflects the rigidity of its labour market,
which hinders the adjustment capacity of industries
and slows down developments in productivity.
Combined with a wage dynamic that does not
reflect productivity developments, this has led to a
sustained rise in unit labour costs and an overall
loss of cost competitiveness. On the other hand, the
rising productivity in Greece and Portugal indicates
progress in reallocation of resources.
All catching-up Member States have a below-
average labour productivity. However, they have
seen significant increases since 2007, as they have
continued to benefit from foreign direct investment
that improves the technology base and management
practices.
The productivity of firms producing manufactured
goods has also been aided by significant
investments in transport infrastructure. In some of
the catching-up economies, like Lithuania and
Latvia, the rising proportion of highly-skilled
10
20
30
40
50
60
70
80
IE NL AT BE SE DE ES UK LU FI FR DK MT EL IT SI PT CY LT SK HU CZ PL LV RO EE
2007 2012 EU1
35
.04
1
02
.34
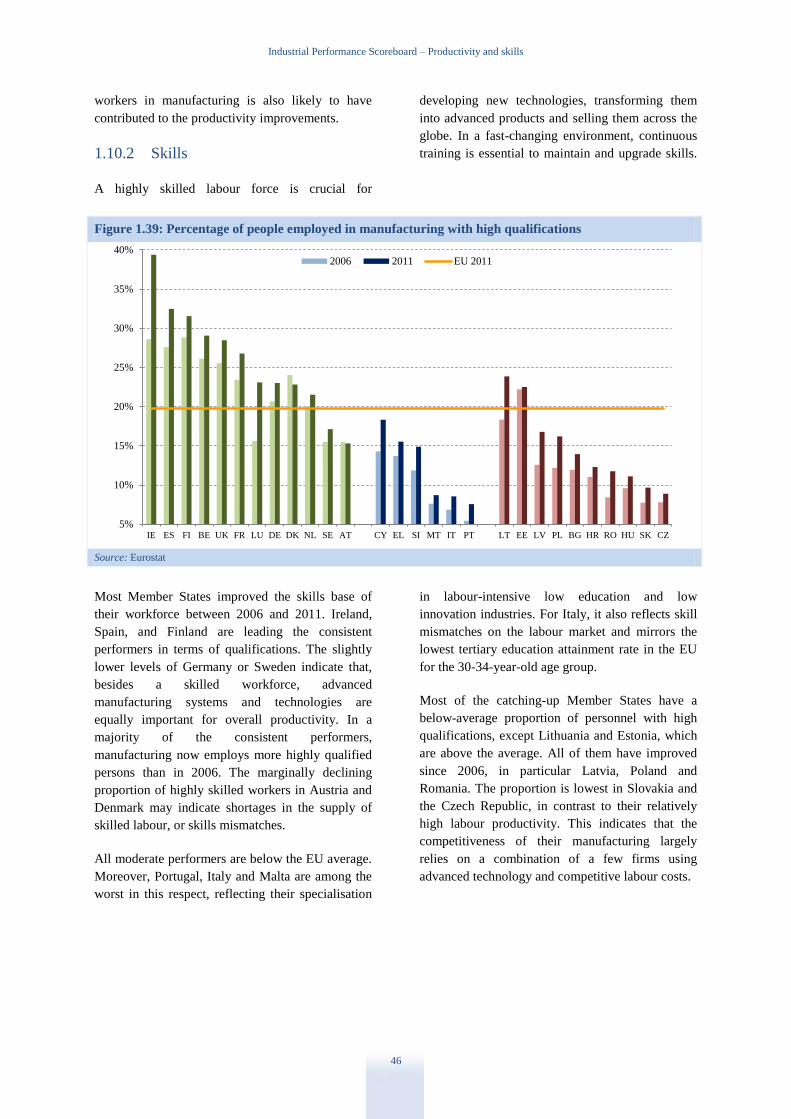
Industrial Performance Scoreboard – Productivity and skills
46
workers in manufacturing is also likely to have
contributed to the productivity improvements.
1.10.2 Skills
A highly skilled labour force is crucial for
developing new technologies, transforming them
into advanced products and selling them across the
globe. In a fast-changing environment, continuous
training is essential to maintain and upgrade skills.
Figure 1.39: Percentage of people employed in manufacturing with high qualifications
Source: Eurostat
Most Member States improved the skills base of
their workforce between 2006 and 2011. Ireland,
Spain, and Finland are leading the consistent
performers in terms of qualifications. The slightly
lower levels of Germany or Sweden indicate that,
besides a skilled workforce, advanced
manufacturing systems and technologies are
equally important for overall productivity. In a
majority of the consistent performers,
manufacturing now employs more highly qualified
persons than in 2006. The marginally declining
proportion of highly skilled workers in Austria and
Denmark may indicate shortages in the supply of
skilled labour, or skills mismatches.
All moderate performers are below the EU average.
Moreover, Portugal, Italy and Malta are among the
worst in this respect, reflecting their specialisation
in labour-intensive low education and low
innovation industries. For Italy, it also reflects skill
mismatches on the labour market and mirrors the
lowest tertiary education attainment rate in the EU
for the 30-34-year-old age group.
Most of the catching-up Member States have a
below-average proportion of personnel with high
qualifications, except Lithuania and Estonia, which
are above the average. All of them have improved
since 2006, in particular Latvia, Poland and
Romania. The proportion is lowest in Slovakia and
the Czech Republic, in contrast to their relatively
high labour productivity. This indicates that the
competitiveness of their manufacturing largely
relies on a combination of a few firms using
advanced technology and competitive labour costs.
5%
10%
15%
20%
25%
30%
35%
40%
IE ES FI BE UK FR LU DE DK NL SE AT CY EL SI MT IT PT LT EE LV PL BG HR RO HU SK CZ
2006 2011 EU 2011

Implementation of EU industrial policy
47
2 Implementation of EU industrial policy
2.1. Introduction
In 2010, the Commission adopted the flagship
initiative entitled ‘An integrated industrial policy
for the globalisation era’ in the context of the
Europe 2020 strategy for smart, sustainable and
inclusive growth. The initiative has progressed well
with a high rate of implementation of the 70 key
actions announced.
In October 2012, the Commission issued an update
communication ‘A stronger European industry for
growth and economic recovery’. The underlying
theme of this communication was the need to make
sure that the impact of the reforms initiated already
under previous industrial policy communication
make themselves felt more quickly. To this end, the
Commission focused on establishing a broad
partnership between the EU, its Member States and
industry to dramatically step up investments in new
technologies. The Commission remains convinced
that it is Europe’s capacity to take up new
technologies that will determine the speed of our
recovery and the strength that the EU will wield in
the coming decades. The EU needs innovation and
new technologies to be employed in practice in
order to boost the productivity of our
manufacturing and services sectors. Europe has
world-class research and innovation capacity, but a
well- designed Industrial policy framework is
needed to make sure that technical developments
originating in Europe make a greater contribution to
European competitiveness and growth.
The new technologies and innovations emerging
from Europe’s research communities are therefore
an important part of the picture, but not enough in
themselves. Public policy must shift up a gear to
embrace innovation-friendly market conditions that
encourage demand for innovations, while providing
appropriate supply-side conditions.
This means that the necessary deployment of new
technologies and innovations is only the first step.
To achieve sustainable competitiveness, greater
access must also be secured on access to
international markets, and the single market must
be made to function better. In addition, basic
conditions in the form of access to finance and
relevant skills will provide the foundation both for
the development of technologies to deploy, and for
their long-term success on the markets.
These issues were all addressed in the 2012
communication. They formed the basis for the
Commission’s proposal that investment and
innovation be jointly focused on six priority action
lines: advanced manufacturing technologies, key
enabling technologies (KETs), bio-based products,
sustainable industrial and construction policy and
raw materials, clean vehicles, and smart grids. The
communication announced that a task force would
be established for each of these areas.
All six priority action lines have a sustainability
perspective. This means that the final objective of
the European policy is not only to achieve the long-
term goals on environment and resource efficiency,
but also to maintain the related manufacturing
activities in Europe, thus fostering growth and
employment.
This chapter takes stock of the implementation of
EU industrial policy. The accompanying
communication presents a number of proposals for
action based on the experiences drawn from the
implementation of our industrial policy so far.
2.2. Investment in innovation: state of play in the six priority action lines
The six priority action lines of the 2012
communication were selected after a public
consultation and careful analysis. The task forces
work on a number of implementation measures
which can produce tangible results already in the
short to medium term. This section provides an
overview of the background in each of the
particular priority action areas, and how the task
forces address any problems identified.
Implementation of EU industrial policy
48
The task forces have reached in different stages in
their work, depending on the priority area
concerned. The task forces for key enabling
technologies (KET) and for clean vehicles and
vessels are building on existing structures,
continuing the approach of high-level groups that
were previously in place. The task force for
sustainable industry, construction and raw
materials also has well-established implementation
frameworks since the adoption of the 2012
communication on that topic.
The task force for bio-based products is building on
activities under the lead market initiative (where
bio-based products was one of the areas addressed)
and the Commission’s strategy and action plan for
the bioeconomy (‘Innovating for sustainable
growth: A bioeconomy for Europe’). It is also
cooperating closely with a range of Commission
groupings, mainly from the research field. The task
force for smart grids will function as an expert
group. The task force for advanced manufacturing
technologies is being established from scratch,
although there were precedents in the public-private
partnership for the Factories for the Future and
significant progress is being made.
Such background features are reflected in the
degree of advancement. Hence, concrete progress
can already be seen in the area of clean vehicles,
and the work on KETs is clearly outlined.
Advanced manufacturing has made an ambitious
start and covered the first aspects of the issues, and
the task force on bio-based products has a clear
implementation strategy and has produced its first
deliverables. An expert group on industrial policy
for smart grids has identified, with the help of
industry stakeholders, a number of areas requiring
policy attention in order to speed up the deployment
of smart grids and is in the process of
recommending actions to be taken in these areas.
This process is expected to end in September 2013,
after which the expert group will move to
implementation. During the last quarter of 2013 this
group will start working on an implementation plan
for its recommended policy actions in conjunction
with the Member States. So far, the task force for
sustainable construction does not have much to
present in terms of concrete results. The discussions
are on-going, however, and it would seem that there
is scope for progress with a more concentrated
approach in these important areas. A greater sense
of urgency will be needed.
Standardisation is a common feature of some of the
priority action lines. As announced in the 2010
communication, the Commission has presented a
proposal for modernising the European
standardisation system. It is too early to see any
results of this on the priority action lines, but action
in these areas will be helped by a smoothly
functioning standardisation system.
2.2.1 Markets for advanced
manufacturing technologies for
clean production
The commercialisation and industrial application of
results stemming from research efforts undertaken
in the EU needs to be improved in many industrial
areas, particularly in advanced manufacturing
technologies. In addition, it is clear that demand is
currently low in Europe. This is due to decreasing
investments in equipment, problems in gaining
access to finance, a low propensity to invest in a
more efficient, clean manufacturing production
(process innovation), and conflicting investment
priorities.
Task force on advanced manufacturing
In line with the 2012 communication, a task force is
addressing these issues through providing support
for market oriented pre-competitive research in
manufacturing and in process development via
public-private partnerships (‘Factories of the
future’ and ‘SPIRE’).39
The task force is
contributing to the roadmaps for these public-
private partnerships and is exploring stronger
incentives to commercialise the results of publicly
co-funded research. It is also supporting demand for
advanced manufacturing technologies, e.g. by
organising match-making events and awareness-
raising activities on advanced manufacturing
technologies for clean production. Work towards a
better regulatory framework for manufacturing has
started through screening for needs relating to
standards or legislation.
39 SPIRE: Sustainable Process Industry through Resource
and Energy Efficiency.
Implementation of EU industrial policy
49
In conclusion, the problems faced in this action line
are common across several sectors of European
industry. European competitiveness will have to be
based on cutting edge technologies, and continuous
innovations and improvements. The first role of
policy makers is to set the appropriate framework
conditions. Where this is not enough to make
Europe globally competitive, measures to stimulate
demand and deployment will have to be attempted.
The task force has made good efforts in this
direction. The communication has also invited
Member States to promote the commercialisation
and deployment of advanced manufacturing
technologies and to develop cross-border
collaboration taking into account their national
specialisations and needs. Such work will need
further impetus, possibly by spreading good
practice from the task force to Member States.
2.2.2 Clean vehicles and vessels
2.2.2.1 Clean road vehicles
Sales of motor vehicles on the EU markets fell
sharply in 2012 and are expected to decline further
in 2013. Even if exports outside Europe have
developed more positively, several companies have
embarked on restructuring processes aimed at
adjusting production capacity in Europe. In the
current adverse economic situation, clean and
energy efficient vehicles40
can be a factor that could
help the European automotive industry to overcome
the crisis and return to the path of growth and
profitability. Further investments in new
technologies and skills are therefore required in
order to strengthen the global competitiveness of
the sector, stimulate its growth and enable it to
create high-skilled jobs.The European automotive
industry has a leading position in the development
of clean and energy-efficient technologies for
transport. It possesses unique competences, which
have enabled it to place on the market a portfolio of
low-emission technologies including modern
internal combustion engines; and hybrid, electric,
fuel cell and alternative fuel vehicles. The
40 The term ‘clean vehicles’ indicates low pollutant
emissions (NOx, PM, CO and hydrocarbons). This covers
vehicles based on energy-efficient conventional internal
combustion engines, alternative fuels to burn in
combustion engines, electric vehicles, and hydrogen fuel
cell vehicles. http://eur-lex.europa.eu/LexUriServ/LexUriServ.do?uri=COM:2013
:0017:FIN:EN:PDF.
development and deployment of innovative, low-
emitting powertrains has not, however, been
without problems. High costs, low consumer
confidence and the lack of refilling infrastructure
are the main stumbling blocks holding back faster
market uptake of green vehicles. Despite heavy
investments in research and innovation projects,
electric and fuel cell vehicles still constitute just a
fraction of the market. Similarly, despite being
considered mature technologies, alternative
combustion fuels including natural gas and LPG are
still not able to increase their market penetration
significantly. There is a need to further promote the
uptake of alternative fuel vehicles through
coordinated investments in research and alternative
fuel infrastructure, and incentives for the purchase
of low-emitting vehicles.
Task force on clean vehicles
The task force is addressing these issues by
contributing to policy initiatives such as:
* Developing and harmonising at global level
type-approval legislation for electric and fuel
cell vehicles making them at least as safe as
those with a traditional powertrain.
* Publishing guidelines on financial incentives
that will serve as a reference for Member
States wishing to introduce demand-side
measures promoting clean and energy-
efficient vehicles.
Adopting the clean power for transport package
including a communication on ‘Clean Power for
Transport: A European alternative fuels strategy’
and a Directive requiring Member States to provide
minimum infrastructure coverage with harmonised
standards in the EU.
In order to boost research in the area of energy
efficiency and alternative powertrains, the
Commission will initiate, from the beginning of
2014, a ‘European Green Vehicle Initiative’ public-
private partnership. This will replace the European
green cars initiative which between 2008 and 2013
provided a strong financial stimulus to EU
automotive R&D, successfully leveraging public
funding for investments in clean technologies. A
budget of EUR 700 million is envisaged, which is
almost double the amount earmarked for the
previous initiative. In addition, on-going
cooperation with the EIB will enable supplementary
funding to be obtained for innovative projects in the
Implementation of EU industrial policy
50
area of low emission technologies. In terms of
providing the workforce with a high level of
competences, a European Skills Council will be
established in order to identify long-term trends in
skills needs in the automotive industry.
The CARS 2020 monitoring exercise to coordinate
European, national and regional policies together
with actions by the industry and civil society is
currently under way and will end in the second half
of 2014. A European Electromobility Observatory
has been set up to facilitate the co-ordination at all
level.
Thus, this action line has advanced in its tasks and
has considerable policy support. The actions
announced in the 2012 communication are well
underway, and in line with the structure that had
already been established.
2.2.2.2 Vessels
While the production of standard cargo vessels has
virtually ceased in Europe, some companies
producing specialised tonnage and advanced marine
equipment are showing good resilience or even
growth. Clean vessels clearly offer a major market
opportunity, especially for the marine equipment
industry, but also for new-building and repair yards.
The European maritime technology industry has a
leading role to play in the development of clean and
energy-efficient technologies for maritime
transport.
Key specific issues for shipbuilding and shipping
include overcapacity, low demand, limited
incentives for the installation of emission reduction
equipment, and regulatory uncertainty. With
today’s and expected future fuel prices, many of the
technical or operational measures to reduce CO2
emissions are cost-efficient. The uptake of these
cost-efficient measures is often blocked by market
barriers and the difficulty of obtaining finance.
Notwithstanding, forthcoming legislation and
customers' expectations for cleaner shipping will be
driving change in the industry and enable clean ship
technology take-up.
Task force on clean vessels
This task force forms part of the LeaderSHIP
initiative. It is currently preparing a workshop with
the EIB in September 2013 to make the best out of
the possibilities of the bank in the financing of
green vessels and for environmental retrofitting of
existing vessels. These activities will be
supplemented by the European Sustainable
Shipping Forum (ESSF) being established by the
Commission. This forum will in particular deal with
and further develop the actions outlined in the first
progress report on the implementation of the
Sustainable Waterborne Transport Toolbox.41
Further, a Regulation on the monitoring, reporting
and verification of greenhouse gas emissions from
maritime transport was adopted in June 2013.
2.2.3 Bio-based product markets
Fostering the development of bio-based industries
involves addressing two important and
interdependent issues: the ‘cascade’ principle and
adequate biomass supply. The task force is already
focusing on cascade (also called smart or
pyramidal) use of biomass, which is its phased use
through a sequence of integrated stages in order to
optimise resource and energy efficiency while
maximising added value and job creation or
maintenance. Such optimal exploitation of the
economic, social and environmental potential of
biomass would require using the market to ensure
prices reflect value, with biomass first used for
food, feed or high value-added products (solid
wood and paper goods, pharmaceuticals and
cosmetics, bio-based chemical building blocks,
polymers, lubricants, detergents, plant bio-
stimulants, etc.) and the simultaneous use of their
residues and co-products, the re-use and recycling
of all these, and using biomass as a source for
bioenergy and biofuels, according to their market
value.
In such a sequence, one partner’s by-product or
waste becomes the raw material for other partners’
production, paving the way towards interdependent,
cross-sectorial innovative value chains and a
circular economy. However, the choices between
competing uses at any given stage would have to be
based on, for example, affordability, logistics, value
41 COM (2013) 475 final
Implementation of EU industrial policy
51
added and whether or not jobs are maintained or
created. Accordingly, these factors must be
incorporated into the sustainability criteria in the
socio-economic evaluation.
To develop this virtuous circle of significant bio-
based industries adequate biomass supply will need
to be assured hand-in-hand with its more efficient
(cascade) use. However, policy instruments are
currently used in an attempt to foster the
development of biofuels and other biomass and
have introduced greater competition (e.g. higher
prices, tighter supplies) in the use of the biomass.
There is also fierce competition from non-EU
countries. The US in particular has implemented a
BioPreferred programme since 2002. This involves
a federal government procurement initiative, with
mandatory preference for bio-based products, and a
product certification effort. Minimum bio-based
content has been established for each category
designated for federal procurement. Such
promotion of a fast-growing product sector means
incentives for innovation and product development
that risk leaving European competitors behind, in
the absence of similar initiatives on the EU market.
The priority recommendations arising from the final
evaluation of the Lead market initiative for bio-
based products have formed a basis for this work.
There is a need to better align Commission
industrial, innovation, agricultural, environmental,
market, energy and research policies in the field of
bio-based products and to create more effective
mechanisms to attract industry and SMEs to
participate in EU research and innovation
programmes. Furthermore, most actions of the task
force were announced already in the 2010
communication.
In order to ensure the implementation of the LMI
recommendations with regard to biomass use,
standardisation, public procurement and awareness-
raising, a Commission expert group for bio-based
products has been established. This group will also
continue to contribute to the work of the
bioeconomy panel and the European Bioeconomy
Observatory focusing on specific topics relating to
the bio-based sector.
Task force on bio-based products
The development of European standards for bio-
based products is a key component of the initiative
to underpin the future sustainability of the sector.
For bio based polymers and lubricants technical
specifications and reports are already available.
Standards play a central role in developing the
market by providing market players with the
necessary tool to make a complete description of
the products. As regards public procurement and
the related standardisation, work has started on
informing public purchasers and raising their
awareness about bio-based products. A compilation
of lists and databases of bio-based products is now
available. Standardisation is in progress in different
areas ranging from nomenclature, via measuring
bio-based contents to sustainability assessment and
certification of bio-based products.
As mentioned above, one of the key issues is to
foster the cascading use of biomass at EU level.
The task force will deepen this discussion within
Commission departments, and in various forums
(e.g. the Chemical Industry Roundtable in June
2013). The Commission’s recently published
Renewable energy progress report recognises the
need for policy coherence, since there is currently a
significant increase in competition for bio-
resources, as bioenergy demand competes with
traditional bio-based products. Other links are being
developed in the context of the new EU forest-
based sector strategy and the work of the EU expert
group on forest-based industries.
The task force has substantially contributed to the
establishment of the European Bioeconomy
Observatory in collaboration with the Joint
Research Centre, building on existing information
systems. The Observatory will perform EU capacity
mapping, technology watch, bioeconomy policy
outlook, and market monitoring in various areas
relating to the bioeconomy, together with forward-
looking analyses at EU and global levels.
The task force is also contributing to the creation of
the Bio-based and renewable industries for
development and growth in Europe (BRIDGE)
public-private partnership as a Joint Technology
Initiative including an effective link with the

Implementation of EU industrial policy
52
SPIRE42
partnership. Concrete work on is expected
to start in 2014.
2.2.4 Key enabling technologies
The Commission announced already in the 2010
communication that it would launch an initiative on
key enabling technologies (KET). The current task
force builds upon that initiative. The six KETs
(nanotechnology, micro and nanoelectronics,
industrial biotechnology, advanced materials,
photonics and advanced manufacturing
technologies) have applications in a number of
industries such as the automotive, food, chemicals,
electronics, energy, pharmaceuticals, construction,
and telecommunication sectors, and more
applications are expected in a variety of other
industries. Depending on the particular KET,
growth potential of 10 to 20 % is expected in the
coming years. For particular submarkets, the
growth potential is even larger.
The Commission has proposed a comprehensive
long-term strategy that includes all relevant EU
instruments and key stakeholders. The strategy
marks a move away from individual actions
towards a coordinated approach across different
policy fields with the aim to boost the deployment
of KETs into products. The implementation of the
strategy is on-going and many actions have already
been launched.
Task force on key enabling technologies
In order to leverage the funding instruments at the
EU’s disposal, the priorities of Horizon 2020, the
Structural Funds and the European Investment
Bank have been aligned to support the deployment
of KETs into products and services. A
memorandum of understanding with the European
Investment Bank will pave the way for improved
access to finance for investments in KETs.
One of the main goals of Horizon 2020 is to help
capture a larger share of the rapidly expanding
markets of KETs. There will be dedicated support
for pilot lines and demonstrator projects in order to
facilitate industrial take-up and commercialisation.
A dedicated budget has been assigned to KETs.
There are provisions in the new cohesion policy to
42 SPIRE: Sustainable Process Industry through Resource
and Energy Efficiency.
foster the adoption and diffusion of KETs for the
benefit of industry. The rules have been changed to
make it possible to combine research and
innovation funds with resources from the Structural
Funds. KETs have been defined as one of the
priority investment areas in which the Structural
Funds can be used to finance projects that are much
closer to the market, all the way to first production.
This opens up wider opportunities for regions to
support all the crucial stages of technology and
product development. The Commission has
established a Member States’ group on KETs to
ensure synergies and promote complementarity
with national and regional KET policies.
In this context, public-private partnerships (PPPs)
with a strong commitment from industry will be
essential to the successful implementation of the
KET strategy, as already shown by the
achievements of the ENIAC joint technology
initiative in the domain of nanoelectronics. They
will ensure close interaction between research and
innovation activities and support the cooperation of
all stakeholders, including end-users, across the
entire value chain. Horizon 2020 will have public-
private partnerships on key enabling technologies in
the sectors of nanoelectronics, photonics, advanced
manufacturing, and bio-based industries.
In the memorandum of understanding signed
between the Commission and the European
Investment Bank, the bank agreed to reinforce its
focus on close-to-the-market KET projects. Since
the signature of the memorandum in February 2013,
the number of projects supported by the EIB has
been increasing. In the first half of 2013, EIB
signatures have almost reached the lending volume
of the whole of last year (EUR 2.6 bn).
The high-level group on KETs ensures smooth
implementation of policy as outlined in the
communication of 2012. It presented a first set of
recommendations to the Commission in July
2013,43
covering framework conditions for further
industrial deployment of KETs such as skills,
intellectual property, state aid (projects of common
European interest) and trade issues, smart
specialisation44
and support for multi-KET pilot
lines of high industrial interest in four identified
43 See http://ec.europa.eu/enterprise/sectors/ict/files/kets/hlg
_ket_status_implementation_report_final_en.pdf. 44 See http://s3platform.jrc.ec.europa.eu/.

Implementation of EU industrial policy
53
areas: smart structures, embedded energy, high
performance production and industrial processes
using renewable resources.
In the context of the work of the high-level group,
the development of Europe-wide KET technology
platforms that are open to SMEs is encouraged.
Such platforms could be an excellent way to foster
innovation among SMEs as SMEs often do not
have the required technical knowledge or the means
to test the feasibility of their ideas and projects.
As new technologies cannot be developed and
brought to the market if the necessary skills are not
available, a strategy is being initiated to identify
skills, to assess the competencies needed, and to
strengthen the partnerships between industry,
academia and education systems to ensure the
availability of the necessary skills. A contribution
will be made by the European Institute of
Innovation and Technology (EIT), as KETs will be
a part of the Knowledge and Innovation
Community (KIC) on added-value manufacturing.
This will be a forum for interaction and for the
promotion of multidisciplinary skills for
combinations of key enabling technologies.
In the course of 2013, a KET Observatory will be
established to provide relevant market data on the
supply of and demand for KETs in the EU and
other regions.45
This Observatory will monitor the
implementation of the European strategy to boost
KETs deployment in Europe.
2.2.5 Sustainable construction
The construction industry, including products
manufacturers and professional services, accounts
for almost 10 % of EU GDP and provides about 17
million direct jobs. Besides this economic weight,
the construction value chain has a vital role in
reducing the EU’s demand for energy and in
improving resource efficiency.In 2012, the
Commission presented a strategy for the sustainable
competitiveness of construction.46
In order to
streamline and coordinate various initiatives
currently underway at EU, national and sectoral
levels with respect to the strategy, the Commission
has set up in 2013 a high-level forum and five
thematic groups, involving more than 150
45 As announced in COM(2012) 341 final. 46 COM(2012)433 final of 31.07.2012.
representatives from national administrations and
sector associations.
Task force on sustainable construction
The task force will take stock on the
implementation of this strategy to make
recommendations in seven domains:
* It will develop a common understanding of
requirements for the sustainable use of natural
resources in construction. This would require
the screening of national building regulations
in order to prepare an interpretative document
on these requirements.
* It will support a pro-active policy to
encourage building renovation. The
Commission will follow up on the recent
report on the impact of EU financial schemes
on energy efficiency in buildings by
communicating more effectively the financial
facilities offered by EU cohesion policy funds.
There is also a need to map skill needs for
energy efficiency in building renovation.
* It will promote innovation to improve the
performance and sustainability of the
construction value chain. It will decide what
issues are at stake to improve the innovation
process in construction and to identify the
possible initiatives to be supported within the
context of Horizon 2020 and COSME.47
It will
also identify initiatives – such as SILC
(Sustainable industry, low carbon) – to foster
the production of resource-efficient and low-
carbon raw materials used for construction.
* It will establish guidelines for the transition
towards a new energy and industrial paradigm.
The task force will contribute to the smart
cities48
initiative and to the new ‘Connect &
construct’49
initiative that aims to develop the
smart use of information and communication
technologies for the integration of services in
the construction sector value chain.
47 A Conference will be organised in October 2013 to
discuss these issues. 48 http://setis.ec.europa.eu/implementation/technology-
roadmap/european-initiative-on-smart-cities. 49 http://www.connectandconstruct.eu/aboutConnect
Construct.html
Implementation of EU industrial policy
54
* It will develop a better understanding of the
economic and regulatory issues associated
with increased recycling of construction and
demolition wastes in the manufacturing of
construction products and other types of
industrial products. The task force will first
analyse two waste streams in detail: the
recycling of glass and plasterboard.
* It will identify priorities for ensuring fair
business opportunities for European
companies vis-à-vis international competitors
and for continuing and stepping up
international cooperation on regulation and
standards, such as the Eurocodes. It will also
address the issue of access to finance and
guarantees, particularly for high-risk regions
or those where EU contractors suffer from
unfair competition.
2.2.6 Smart grids
A smart grid is an electricity network that can cost
efficiently integrate the behaviour and actions of all
users connected to it – generators, consumers and
those that do both.50
The technologies for deploying
smart grids already exist, and a Commission
mandate in the area of standardisation has helped to
move this forward. The focus should now be on
how to bring the already available technologies
onto the market. This is the objective of the task
force on industrial policy for smart grids, the new
working group that was set up under the leadership
of the smart grids task force.According to the 2012
communication, the task force should identify
further targets for the deployment of smart grid
50 SWD to COM(2011)202, 12 April 2011, at: http://eur-
lex.europa.eu/LexUriServ/LexUriServ.do?uri=SEC:2011:
0463:FIN:EN:PDF.
components, revise and broaden standardisation
mandates. Much of the work remains to be done.
The expert group on industrial policy for smart
grids has identified, with the help of industry
stakeholders, a number of areas requiring policy
attention in order to speed up the deployment of
smart grids and is in the process of recommending
actions to be taken in these areas. This process is
expected to end in September 2013, after which the
expert group will move to implementation. During
the last quarter of 2013 the expert group will start
working on an implementation plan for its
recommended policy actions in conjunction with
the Member States.
Task force on smart grids
The policy actions suggested by the members of the
expert group are:
* Framework to stimulate investment in smart
grid projects that do not fall under TEN-E
guidelines
* Action to promote investment in smart
appliances
* Legislative action (Directive/Regulation) for
low voltage side networks
* Addition of ‘effect on jobs’ aspect to cost-
benefit analysis methodology
* Study to analyse lighthouse projects and what
has already been achieved so far in this area.
2.2.7 Accompanying measures
The development of novel technologies requires
changes in the skills needed by the workforce and
changes the way workplaces are organised. The
2012 communication therefore stated that the
Commission will promote the transformation of
workplaces. To that end, the European Workplace
Innovation Network (EUWIN) was launched in
April 2013 and already consists of some 500
‘ambassadors’. Activities are on-going in all
countries and regions in Europe to gather evidence
and persuade more companies to implement such
organisational and related internal changes, so as to
enhance their productivity and competitive position.
Implementation of EU industrial policy
55
Design is increasingly recognised as a key
discipline and activity to bring ideas to the market.
Though still often associated solely with aesthetics,
the application of design is much broader. Analyses
of the contribution of design to competitiveness
show that companies investing strategically in
design tend to be more profitable and grow faster.
User-centred and non-technological aspects of
innovation are, however, still insufficiently
integrated into innovation policy and support. The
Innovation Union flagship initiative made a
commitment to improve this situation. In response
to this commitment, the Commission set up a
European design leadership board in 2011 which
was tasked with developing proposals on how
design could be more widely used to spur non-
technological innovation.
One of the action points in the 2012 communication
update is that the Commission will implement an
action plan to accelerate the take-up of design in
innovation policy. The staff working document on
implementing the action plan for design-driven
innovation will describe current and upcoming
actions endorsed by the Commission and for
promoting design-driven innovation in different
policy fields.
The action lines of the plan build on the
recommendations of the European design
leadership board and on the outcome of a
consultation with stakeholders. The key strategic
areas for action are:
- Promoting understanding of design’s
impact on innovation;
- Promoting design-driven innovation in
industries to boost Europe’s
competitiveness;
- Promoting the adoption of design to drive
renewal in the public sector.
Implementation of the action plan will be supported
by the European design innovation platform. This is
an EU co-financed project that will provide a web-
based platform for cooperation and dissemination
of information along with other initiatives to
promote the adoption of design as a driver for
innovation.
Linking supply-side innovation policies with
demand-side innovation policies is starting to
receive strong support within the Commission and
among Member States. Following the
announcement in the 2012 communication that it
would further promote demand-led innovation by
launching an action plan to boost demand for
innovative European goods and services, the
Commission will provide support for the
completion of targeted market-specific roadmaps
starting in 2014 and will launch an innovation
demand-side monitoring system (to be finalised in
2016) to spread knowledge about demand-side
innovation policies and to facilitate mainstreaming
of these policies into EU research and industrial
policy.
2.3. Access to markets
European firms will have more opportunities to
innovate and grow if conditions for accessing
markets are favourable. The ability of the single
market to work as an integrated area that is
favourable to entrepreneurship and commerce is all
the more important in the current context of
subdued demand across the EU. Current
macroeconomic governance requires countries that
have to make particularly tough adjustments to rely
in the short term on external demand for growth.
The single market should be a key instrument to
provide all European enterprises with an
opportunity for doing business. Also, many of the
efficiency gains brought about by technological
innovation are due to interconnectivity and
networked operations. Such efficiencies will be all
the greater if they can take place on a European
scale within a favourable regulatory framework.
2.3.1 Improving the internal market for
goods
As announced in the 2012 communication, the
Commission has adopted a proposal on product
safety and market surveillance, which includes two
proposals for Regulations and a multi-annual plan
for market surveillance. This package will allow
better coherence and improve coordination amongst
national surveillance authorities, to the benefit of
both consumers and companies. The proposal,

Implementation of EU industrial policy
56
following a commitment made in the industrial
policy communication of 2010, also include
measures to improve the traceability of consumer
products throughout the supply chain and an
obligation on manufacturers and importers to
ensure that products bear an indication of the
country of origin of products.
The Commission performed a thorough evaluation
of the single market legislation for industrial
products. The results of the public consultation and
the recommendations of the final report on the
evaluation provide a complete picture of the status
quo of the single market for products and allow the
Commission to prepare a review of the single
market for industrial products as envisaged in its
work programme 2013.
In order to improve the regulatory framework for
industry and better take into account costs and
benefits of EU regulations on specific industrial
sectors, the Commission launched as announced in
the 2012 communication a fitness check for the
petroleum refining sector, to be completed in 2014,
and cumulative cost assessments for the steel
(already completed) and aluminium sectors (to be
completed in 2013). These industrial sectors have in
common their strategic importance in the European
industrial value chain and the fact that they are
directly impacted by relatively high energy prices
in Europe.
As announced in the 2012 communication, a high-
level group on business services was set up in
March 2013. The group is focusing on innovation,
internationalisation, skills, single market rules and
other regulatory instruments. The group will
examine these themes in sectors such as technical
and engineering services, marketing and
advertising, private security services and design.
The business services sector has been identified as
having a great deal of untapped potential and the
high level group should impart a new impetus to
policy development by identifying ways to improve
the level of productivity and innovation of
business-services. The recommendations also look
at how to improve the interaction between business
services and manufacturing. The group will finish
its work and deliver its report in March 2014.
2.3.2 Fostering entrepreneurship
Entrepreneurs and SMEs are the driving force of
European economic growth and job creation. As
many as 85 % of new jobs in the private sector are
created by SMEs and more than 4 million new jobs
are created by newly founded businesses. However,
according to the latest 'Eurobarometer' on this topic,
only 37 % of Europeans today prefer being self-
employed or running a business to being a paid
employee. As a comparison, the figure is 51 % in
the US, 56 % in China – and it was 45 % in Europe
just three years ago.
In order to unleash Europe's entrepreneurial
potential, the Entrepreneurship 2020 action plan
was adopted by the Commission in January 2013. It
is based on three pillars:
- Entrepreneurial education and training to
support growth and business creation, to
give our young the necessary entrepreneurial
knowledge and skills and educate the future
generations of entrepreneurs;
- Creating an environment where
entrepreneurs can flourish and grow; where
the public administration ‘effectively helps
entrepreneurs or gets out of their way’;
- Promoting role models and reaching out to
specific groups whose entrepreneurial
potential is not being tapped to its fullest
extent or who are not reached by traditional
outreach for business.
Examples of key actions include introducing
entrepreneurial education throughout Europe,
promoting digital entrepreneurship and smart use of
digital technologies by SMEs and strengthening
their e-skills and e-competences, and reducing the
regulatory burden for SMEs. Special support
initiatives have been launched, such as a European
mentors’ network, reaching out to and including
specific groups in entrepreneurship support and
development (women, seniors, migrants,
unemployed and young people). Other measures
include the digital entrepreneurship monitor, a tool
to monitor emerging digital trends and new
business opportunities, and measure progress at
pan-European level, a pan-European awareness and
media campaign for entrepreneurs on new business
paradigm shifts empowered by digital technologies
and the creation of a European e-mentors
Implementation of EU industrial policy
57
ecosystem, bringing together potential
entrepreneurs, mentors, role models and investors
to spark, support and expand new business ideas in
the digital era
2.3.3 Intellectual property
In the industrial policy communication of 2010 the
Commission invited the Council and the European
Parliament to adopt as a matter of urgency the
proposals for an EU patent and a unified patent
litigation system to allow the first patents to be
issued in 2014. In October 2012, the Commission
stressed the need to ensure that the intellectual
property framework serves the needs of the new
economy, in particular the need for open and
collaborative innovation. Patents are key rights for
collaborative innovation.
Significant progress was made since the
communication: the unitary patent package
consisting of two Regulations implementing
enhanced cooperation in the area of the creation of
unitary patent protection and with regard to the
applicable translation arrangements, and an
international agreement among Member States
setting up a specialised patent jurisdiction (the
‘Unified Patent Court’) common to the Member
States have been approved. The two Regulations
were adopted by the European Parliament and the
Council in December 2012. The Unified Patent
Court agreement was signed in February 2013 by
24 member states with one more joining in March
2013. For the whole package to be operational, the
Unified Patent Court agreement needs to be ratified
by 13 Member States, including the three with the
highest number of European patents.
The use of patents in Europe is extensive.
According to the latest data available, patent
applications at the European Patent Office have
made a rebound growing by a rate of 4 % on an
annual basis in 2012 compared to a decrease of
5.5 % the year before. Most of the increase should
be ascribed to non-European applicants as
applications from Europe grew by only 0.9 %.
However, this figure hides steady growth from
large countries such as Spain, France and Germany
and two-digit growth rates from a number of
countries in central and eastern Europe, notably
Estonia, Lithuania, Poland and Romania.
Still, the maze of national patent systems and the
lack of a unitary protection throughout Europe
make the life of EU innovators complicated. The
work on the unitary patent and the unified patent
litigation system in Europe will reduce costs and
the fragmentation of patent protection in the single
market. In view of the progress already achieved,
the Commission believes that the first European
patent with unitary effect could be granted already
in early 2015.
The Commission announced in 2012 that it is
examining the very fragmented legal framework for
trade secrets protection. Following a study
completed in 2012 and a public consultation in
spring 2013, the Commission is continuing to
examine whether existing differences in national
approaches to protect confidential business
information against misappropriation may
undermine the smooth functioning of the single
market. A legislative or non-legislative initiative is
scheduled in the Commission’s work programme
for 2013.
The Commission committed itself in 2012 to
considering measures that can contribute to increase
transparency and improve the treatment of
intellectual property rights (IPR) in standardisation
and it has started together with industry to review
the current framework for transfers of standard-
related patents. The Commission is closely
cooperating with patent offices, standard setting
bodies and companies active in standardisation. It is
also maintaining and will step up the dialogue with
its counterparts in the US to provide industry with
more global solutions where appropriate.
The Commission is following the development on
the most critical points of the current framework for
licensing standard-related patents, such as the
conditions for transferring ownership of standard-
essential patents, the conditions for the use of
injunctive relief in these patents, the use of
alternative dispute resolution mechanisms for
disputes, the transparency of declarations of such
patents and the further clarification of fair,
reasonable, and non-discriminatory licencing terms.
Work is also progressing in the area of pro-
competitive patent pools which can reduce
transaction costs and overcome the problem of
royalty stacking. The Commission has consulted
stakeholders on the idea of creating an antitrust safe
Implementation of EU industrial policy
58
harbour for such patent pools and in line with the
broad support received will consider adopting new
rules in early 2014 in the context of its reform of
the antitrust rules for technology transfers.
A further area of intensive work is transparency
surrounding standard-essential patents. Such
transparency is a crucial pre-condition for smooth
licensing and minimising transaction costs, such as
search costs. In its push for more transparency the
Commission announced in 2012 that it will foster
cooperation between patent offices and standard
setting organisations including initiatives such as
patent landscaping and database linking.
Lastly, the Commission initiated in 2012 a wide-
ranging fact-finding exercise, aimed at identifying
further areas where the current framework
governing IPRs in standardisation could possibly be
improved. A study has been commissioned and will
bring results in late 2013. This work will feed into
the independent review of the European
standardisation system which the Commission will
launch by the end of 2013.
In 2012 the Commission announced that it would
work on possible options to make it efficient and
less costly for business and research bodies to
invest in, license, transfer and share valuable
knowledge and information throughout the single
market. A report was issued in January 2013 and a
high-level expert group is working on the
development of a comprehensive policy approach
to open innovation and knowledge transfer. The
group will deliver a final report in November 2013.
A study is underway that will provide an
international comparison and analysis of the impact
of patent costs on the exploitation of R&D results
by SMEs, universities and public research
organisations.
The Commission announced in 2012 that it would
consider the most appropriate IPR valuation
methods and the relationship between the IPR
market and the appropriate valuation and disclosure
of IPR in accounting. An expert group for
intellectual property valuation will issue a report at
the end of 2013.
Counterfeiting is a commercial threat to legitimate
business and can result in health and safety risks to
consumers. According to the report on customs
enforcement produced by the Commission for 2011
the volume of illegal products is on the increase and
the danger is becoming more and more evident
worldwide. Industries suffer huge economic losses;
according to customs enforcement data, almost 115
million suspect articles were stopped at the EU’s
borders in 2011. The estimated value of the
equivalent genuine products was over EUR 1.2
billion.
In order to strengthen the legislative framework and
facilitate the enforcement of IPR at the borders, a
new customs Regulation was approved and will be
applicable from January 2014. It will bring more
clarity and efficiency to the procedure and make the
rules friendlier towards right holders.
In the 2010 industrial policy communication, the
Commission indicated that it would set out its
future action to enhance the enforcement of
intellectual property rights, including in particular
an initiative to strengthen the European
Observatory on Counterfeiting and Piracy.
In June 2012, a Regulation51
entered into force
entrusting the Office for Harmonisation in the
Internal Market (OHIM) with tasks relating to the
enforcement of intellectual property rights,
including bringing together public and private-
sector representatives as a European observatory on
infringements of intellectual property rights.
Currently the multiannual plan 2014-18 for the
observatory is being discussed.
The Commission is also drawing consumers’
attention to the economic losses, potential job
losses and health and safety risks linked to
counterfeiting through a broad awareness
campaign: ‘Too good to be true: the real price of
fake products’ under the patronage of Vice-
President Antonio Tajani. The campaign is a call
for action and co-operation with national authorities
engaged in IPR protection, including national
customs. It targets consumers as they are the most
vulnerable part of the trade chain and most exposed
to health and safety risks.
51 (EU) 386/2012.

Implementation of EU industrial policy
59
2.3.4 The internationalisation of EU
firms: exports as a driver of
growth
Industrial exports to the rest of the world have been
the main factor alleviating the impact of the crisis.
Internationalisation of EU firms is a major
objective of our industrial policy. In a very
depressed economic context, net exports have been
the most dynamic component of EU GDP growth
since 2010 and in fact the only positive one both in
2012 and 2013.
As highlighted by the communication ‘Small
Business, big world: A new partnership to help
SME’s seize global opportunities”,52
and by the
2010 and 2012 industrial policy communications,
fostering the internationalisation of firms means:
- Implementing an ambitious and wide-
ranging trade and investment agenda, and
ensuring that effects on industrial sectors are
fully taken into account when identifying
objectives and assessing different outcomes
(e.g. competitiveness proofing of trade
negotiations mandates);
- Ensuring a level playing field throughout the
world for EU companies, not least by
fighting trade and investment barriers and
using whenever necessary trade defence
instruments, which the Commission has
recently proposed reforming;
- Fostering further integration of EU
companies in global value chains, in
particular by ensuring that the EU is an
attractive location for inward foreign direct
investment;
- Promoting the internationalisation of SMEs,
including through ‘Missions for growth’
around the world and with specific support
such as that provided by the IPR SME
helpdesks.
An industry-friendly trade and investment
agenda
The Commission is currently implementing a very
ambitious trade and investment agenda. While the
WTO talks are deadlocked, the focus has switched
52 COM (2011)702.
to bilateral negotiations, which now involve the
three largest national economies in the world, the
United States, China and Japan.
- Negotiations for a transatlantic trade and
investment partnership (TTIP) with the
United States were launched in June 2013. It
is estimated that an agreement could see EU
exports to the US (EUR 292 billion. in 2012)
rise by 28 %.
- The Commission proposed in May 2013
launching negotiations for an investment
agreement with China. Such an agreement
could be the first of its kind following the
new competencies for investment granted to
the EU by the Lisbon Treaty.
- In April 2013, negotiations for a free trade
agreement (FTA) were launched with Japan.
- Negotiations were concluded with
Singapore, are almost completed with
Canada, and are progressing with India and
with other economies such as Malaysia,
Thailand or Vietnam.
The Commission is delivering on its commitment,
as announced in the 2010 industrial policy
communication, to better assess the impact of trade
negotiations on industrial competitiveness
(competitiveness proofing). The impact
assessments with a view to the negotiations with the
United States and Japan both include estimates of
the sectoral impact and provide important pointers
to identify ex ante the most suitable outcome.
For example, while the impact assessment for the
Japan FTA suggests that the motor vehicles sector
in the EU could be adversely affected by a possible
agreement, it also stresses the need to be extremely
ambitious regarding the removal of non-tariffs
barriers such as technical regulations and standards
in order to neutralise these negative impacts.
Consequently, the mandate for the negotiations
includes the principle of strict and clear parallelism
between the elimination of EU duties and non-tariff
barriers in Japan and an unprecedented review
clause that allows the Commission, one year from
the start of the negotiations to take stock of
progress made by Japan in removing non-tariff
barriers and possibly suspend the negotiations as a
result.

Implementation of EU industrial policy
60
Ensuring a level playing field throughout the
world
Trade agreements are fundamental to providing EU
industry with a level playing field, but they usually
take years to complete and to deliver their impact.
This is why it remains fundamental on a day-to-day
basis to defend and uphold EU companies’ rights,
among other things by pursuing a pro-active market
access strategy, constantly fighting against trade
and investment barriers and combating unfair trade
practices such as dumping and subsidies.
Enforcing trade agreements can involve, as a last
resort, using the WTO Dispute Settlement Body.
The EU has launched 32 offensive cases since 2001
including recently against China’s restrictions on
exports of rare earths and against Argentina’s
restrictions on imports. As acknowledged by the
2013 report on trade and investment barriers,
progress is still required in many areas, including
investment barriers in China and a number of
protectionist measures in Brazil.
The Commission has stepped up its fight against
dumping and subsidies as highlighted by some
recent cases and the proposal it put forward in April
2013 for a reform of trade defence instruments.
This proposed modernisation should make these
instruments more effective and also, as promised in
the 2010 industrial policy communication, more
accessible to SMEs.
Promoting the internationalisation of firms
On SME internationalisation there is some evidence
of progress although there are no new data on
number of SMEs exporting beyond the EU. The
Commission is increasingly giving pro-active
support to EU industry’s internationalisation, and is
favouring contacts, dialogue and cooperation with
non-member countries. SME internationalisation
support projects are established in China, India,
Japan and Thailand. More such projects are in
preparation in a number of ASEAN countries.
Commission-led ‘Missions for Growth’ are a key
example of such pro-active support. The goal of
these missions is to strengthen cooperation between
the EU and other countries and regions of the world
by combining political meetings with a business
dimension dealing with enterprise and industry
policy issues. Between December 2011 and July
2013, ‘Missions for Growth’ took place in 12
different countries (Chile, Brazil, Argentina,
Uruguay, Mexico, Colombia, Peru, Morocco,
Tunisia, Egypt, Russia and China), with the
participation of more than 300 EU companies
representing a wide range of sectors and with a
specific focus on SMEs.
Increasing the internationalisation of SMEs beyond
EU borders is an important target to render the EU
economy more stable and resilient. It is a key
feature of the international dimension of our
industrial policy. When SMEs launch their
internationalisation process (through trade or
investment), they require assistance to protect and
enforce intellectual property rights. This is the role
played by the China IPR SME helpdesk since 2009.
Following the 2012 communication, a similar SME
support desk has been established for the ASEAN
region and it will be followed by a third helpdesk
for South American countries to be launched before
the end of this year.
2.4. Access to finance
Despite the expansionary monetary policy pursued
by the ECB, the supply of credit, particularly to
SMEs, has not fully recovered. The growth of loans
to non-financial corporations is well below
historical level and companies, especially SMEs in
those Member States worst hit by the crisis, are
facing tighter lending conditions. This is due to
market fragmentation, continued deleveraging of
the financial sector, the link between sovereign and
bank risk, economic uncertainty and the low level
of demand in the economy. There is a substantial
amount of unsatisfied demand for credit in these
countries reflecting tougher bank lending
conditions. The increase in non-performing loans in
many countries is also both a testament to the
difficulty faced by firms and a cause for further
credit tightening.
Therefore, even if monetary easing by the ECB has
been significant, transmission of the monetary
policy by the banking system is not working
Implementation of EU industrial policy
61
effectively, as was already highlighted in the 2012
communication.
Because of their traditionally high dependence on
bank credit, the banking crisis is having a heavy
impact on many European firms and especially on
SMEs, while alternative sources of funding remain
underused. Thus, broadening the choice of funding
sources available to firms appears a necessary
strategy not just to ensure access to capital, but also
to sustain the growth of SMEs.
The 2012 communication paid special attention to
the role of the public sector in facilitating access to
finance for entrepreneurs and to the diversification
of potential sources of finance for firms. One goal
was to leverage the funds of the EIB and the
Structural Funds to attract private capital. Also, the
communication called for the development of
alternative instruments in the fields of private
equity, project bonds and venture capital with an
emphasis on facilitating cross-border operations.
The chapters below describe a series of European
initiatives in that direction that have been
implemented.
2.4.1 EU financial measures to facilitate
access to capital
Covering the timeframe 2014-20, the new
Programme for the Competitiveness of Enterprises
and Small and Medium-sized Enterprises (COSME)
will replace the current Competitive and Innovation
Programme (CIP) as a dedicated fund to promote
the competitiveness of enterprises and especially
SMEs.
Measures to improve SME access to finance
include an Equity Facility and a Loan Guarantee
Facility. The Equity Facility will provide SMEs
with commercially-oriented reimbursable equity
financing primarily in the form of venture capital
through financial intermediaries. The Loan
Guarantee Facility will provide SMEs with direct or
other risk-sharing arrangements with financial
intermediaries to cover loans. The COSME
instruments will be supplemented by the Horizon
2020 research programme instruments for financing
research and innovation. The proposed budget of
COSME is over EUR 2 billion (in 2011 prices),
with more than half of this budget allocated to
financial instruments. In addition, the European
Agricultural Fund for Rural Development (or
European Structural and Investment Funds in
general) offer possibilities for development and
support to national/regional financial instruments,
which target SMEs.
The European Investment Bank (EIB) Group will
provide EUR 15.8 billion of financing to SMEs via
loans and guarantees each year during the bank's
2013-15 business plan, equivalent to approximately
a quarter of its total lending. It is expected that
EUR 14 billion or 89 % of this SME support will be
delivered through intermediated loans via partner
banks.
In order to respond to the increased urgency of
facilitating SMEs financing, the Commission and
the EIB presented a joint report for the European
Council of June 2012,53
setting out three concrete
options for restoring normal lending to the real
economy. The thrust of this approach is in
developing joint risk-sharing mechanisms by
combining resources from COSME, the EU
Structural and Investment Funds (ESIF), the EIB
and the European Investment Fund (EIF). The
report proposes a mechanism to securitise SME
loans under a joint guarantee instrument. The
options vary in term of the scope of loans covered
and the range of the pooling, with a higher degree
of pooling requiring more Member State
involvement. The potential leverage would vary
between EUR 55-58 billion and up to EUR 100
billion.
2.4.2 Initiatives relating to banking and
alternative channels
In March 2013 the Commission issued a green
paper that launched a public consultation on how to
foster the supply of finance for long-term
investment and how to improve and diversify the
system of financial intermediation for long-term
investment in Europe. One section of the paper was
devoted to SME access to bank and non-bank
financing. It asked for views on the fostering of
venture capital markets, dedicated markets and
networks, new securitisation instruments, standards
for credit scoring assessments, and whether other
‘non-traditional’ sources of finance should be
53 Joint Commission-EIB report to the European Council,
27-28 June 2013,
http://ec.europa.eu/europe2020/pdf/eib_en.pdf
Implementation of EU industrial policy
62
promoted such as leasing, supply chain finance, or
internet-based sources of funding such as
crowdfunding.
The Regulation and Directive translating the latest
international bank capital requirements into EU law
will be applicable as from January 2014. The new
more restrictive capital requirements will not apply
to loans granted to SMEs up to an amount of
EUR 1.5 million since the new rules will introduce
a reduction in the capital charges for exposures to
SMEs. This will provide credit institutions with an
appropriate incentive to increase the credit available
to SMEs.
The new EU venture capital framework has been
applied since July 2013. It created a genuine single
market for venture capital funds as it enables
venture capitals to operate more efficiently within
the Union. Fund managers are able to have a
European passport and market their funds across
the EU.
In order to make SME markets and listed SMEs
more visible, the Commission has included in its
proposals for the financial markets an SME growth
market label in the EU capital markets legislation.
The prospectus regime has also been made more
efficient54
through the implementation of a
proportionate disclosure regime for SMEs and
small caps by reducing administrative burdens for
such types of issuers where they were considered to
be disproportionate.55
The amendment of the
accounting and transparency Directives will
simplify and improve accounting rules for SMEs
and reduce the regulatory burden for small issuers.
54 Directive 2010/73/EU of the European Parliament and of the
Council of 24 November 2010 amending Directives 2003/71/EC
on the prospectus to be published when securities are offered to
the public or admitted to trading and 2004/109/EC on the
harmonisation of transparency requirements in relation to
information about issuers whose securities are admitted to trading
on a regulated market, OJ L 327, 11.12.2010, p. 1.
Commission Delegated Regulation (EU) No 486/2012 of 30
March 2012 amending Regulation (EC) No 809/2004 as regards
the format and the content of the prospectus, the base prospectus,
the summary and the final terms and as regards the disclosure
requirements, OJ L 150, 9.6.2012, p. 1. 55 The reduction of disclosure requirements has been carefully
calibrated in order to reach the right balance between the reduction
of the administrative burden for the issuers and the need to
preserve a sufficient level of investor protection not to discourage
potential investors from investing and not to hinder confidence in
relation to the issuer. The proportionate disclosure regimes have
also taken into account the amount of information already
disclosed to the markets.
The 2011 Directive on combating late payment in
commercial transactions is due to have been
transposed into national legislation since March
2013. The aim of the Directive is to reduce late
payments by setting maximum deadlines for
payment. These measures are designed to reduce
the vulnerability of SMEs to late payment and
thereby place them in a better financial position.
Implementation of EU industrial policy
63
2.5. Human capital and skills development
Both the 2010 and 2012 industrial policy
communications56
pointed to the skill mismatches
hampering growth and employment and argued that
investment in education and training is also
investment in innovation. In fact, much
technological change results from incremental
innovations by skilled workers and engineers on the
factory floor.
The 2012 communication presented a number of
accompanying measures to create jobs and increase
investment in human capital and skills. With special
focus on the six priority action lines identified in
the 2012 communication, the Commission has been
working to ensure that the necessary skills are
available for the development of production and
markets with a high potential for boosting growth
and employment. Some of the initiatives have also
helped to bring together a wide spectrum of
relevant stakeholders and to build consensus on key
issues and the way forward. Overall, several key
measures have already been adopted, including new
initiatives to address youth unemployment, while
others are well under way.
For example, in November 2012 the Commission
adopted the communication ‘Rethinking Education:
Investing in skills for better socio-economic
outcomes’. The communication makes the case for
immediate action and investment in education and
training focusing on learning outcomes and areas,
such as education for entrepreneurship and better
partnerships between education, business and
research.
Moreover, the EU Skills Panorama was launched in
December 2012, providing a single access point to
data, information and intelligence on skills trends in
occupations and sectors at national and EU levels.
It will help improve the response of education and
training systems to changing skill trends and to
ensure that people are equipped for those areas
where job demand is set to increase.
On the validation of non-formal and informal
learning, the Commission proposed a Council
Recommendation, which was adopted in December
56 COM(2010)614 and COM(2012)582.
2012. It invites Member States to have in place no
later than 2015 national systems for the validation
of skills and competences gained outside school or
university. The aim is to increase job opportunities
in particular for the young unemployed and those
with few formal qualifications such as older and
low-skilled workers.
The Commission also supports several instruments
such as Ploteus, Euroguidance and the European
Lifelong Guidance Policy Network on educational
counselling, vocational guidance and career
orientation, which are crucial for addressing skills
mismatches.
On high-level skills, the Commission has taken
several initiatives to develop the skills and careers
of researchers in view of combatting existing
mismatches. Building on the Marie Curie Actions
of the 7th Framework Programme (2007-13), the
Marie Skłodowska Curie Actions (MSCA) in the
Horizon 2020 will support excellence in research
with top-quality international, inter-sectorial and
interdisciplinary training that fosters innovation
skills. The EURAXESS Jobs portal, which
facilitates matching skills with available jobs, has
grown to over 10 000 job offers and fellowships for
researchers in industry and academia and over
20 000 CVs posted by researchers.
A new tool that the Commission is coordinating in
collaboration with stakeholders is the development
of the European Skills/Competences, Qualifications
and Occupations (ESCO) classification, which will
go live in autumn 2013. It will enable online job
tools to match people with jobs across all EU
Member States and be of benefit to labour market
and education and training stakeholders, along with
other interested parties.
In addition, the Commission adopted in November
2012 a decision reforming the European Job
Mobility Portal (EURES)57
, which is due to be
implemented by January 2014. It will make it easier
for jobseekers to contact employers looking for
particular skills, to focus on sectors and occupations
57 https://ec.europa.eu/eures/home.jsp?lang=en.

Implementation of EU industrial policy
64
with skills shortages and to support targeted
mobility schemes for young people.
The transition from education to work was a central
theme of the Youth Employment Package, which
proposed two specific initiatives to facilitate this
transition: the European Alliance for
Apprenticeships,58
launched in July 2013, and the
Quality Framework for Traineeships.
The Commission has also adopted in June 2013 a
communication on youth unemployment urging the
Member States and the private sector to step up
measures to get young people back into work,
education or training without delay.
As regards structural change, the Commission is
committed to improving the anticipation and
management of restructuring operations, in
particular through targeted action at sector level. As
mentioned in the CARS 2020 communication of
November 2012, a European Automotive Skills
Council will be set up in 2013. It will bring together
existing national organisations conducting research
on skills development and employment in the
automotive sector. Similar initiatives are planned
for the construction and steel sectors.
Following the January 2012 Green Paper on
restructuring and anticipation of change, the
Commission will also propose a communication on
a quality framework on restructuring presenting
best practices in this field.
In the area of vocational education and training, a
call for pilot proposals for a new initiative, Sector
Skills Alliances, was launched in 2012 in five
economic sectors: the automotive industry, the
aeronautic industry, health and social work, energy
saving including sustainable construction, and
tourism and catering. Four proposals, one from
each sector except for aeronautics, have been
selected and work started in 2013.
Following the success of the Knowledge Alliances
pilot calls in 2011 and 2012, the call for proposals
on Knowledge Alliances in 2013 was organised as
part of the Lifelong Learning Programme with a
budget of around EUR 5 million. The Knowledge
Alliances are designed to provide structured
58 http://ec.europa.eu/education/apprenticeship/index_en.htm
partnerships for collaborative projects between
higher education and the business/industrial sector.
On the specific and crucial area of e-skills, the
Commission launched in March 2013 a Grand
Coalition for Digital Jobs59
to address up to
900 000 job vacancies expected to exist in Europe
by 2015. Its aim is to increase the overall supply of
digitally skilled professionals and to better match
the supply of and demand for digital skills.
BUILD UP Skills60
is a new strategic initiative
under the Intelligent Energy Europe (IEE)
programme to boost the education and training of
craftsmen and other on-site construction workers
and systems installers in the building sector. It
addresses skills in relation to energy efficiency and
renewable in all types of buildings.
As Europe struggles to overcome the biggest
economic crisis in its recent history, it has become
ever more imperative to convert the potential of an
increasingly higher-skilled workforce into job-rich
growth. Along with a substantial pool of idle
workers finding it difficult to get a job, the skills of
about a third of the European workforce are
currently under-utilised.61
At the same time,
employers in Europe continually draw attention to
skill gaps and shortages that constrain their
productivity and competitiveness. Efficient
implementation and enhancing synergies between
EU-led actions and Member States’ industrial
policies in the area of human capital and skills are
therefore crucial components in the overall delivery
of the EU Industrial Policy Strategy and in
reversing the declining industry trend from the
current 15.1 % of EU GDP (Q1 2013) to as much as
20 % by 2020.
59 http://ec.europa.eu/digital-agenda/en/grand-coalition-
digital-jobs-0. 60 http://www.buildupskills.eu/en/about. 61 SWD(2013)2 final – Volume VIII/IX, Employment and
Social Developments in Europe 2012.
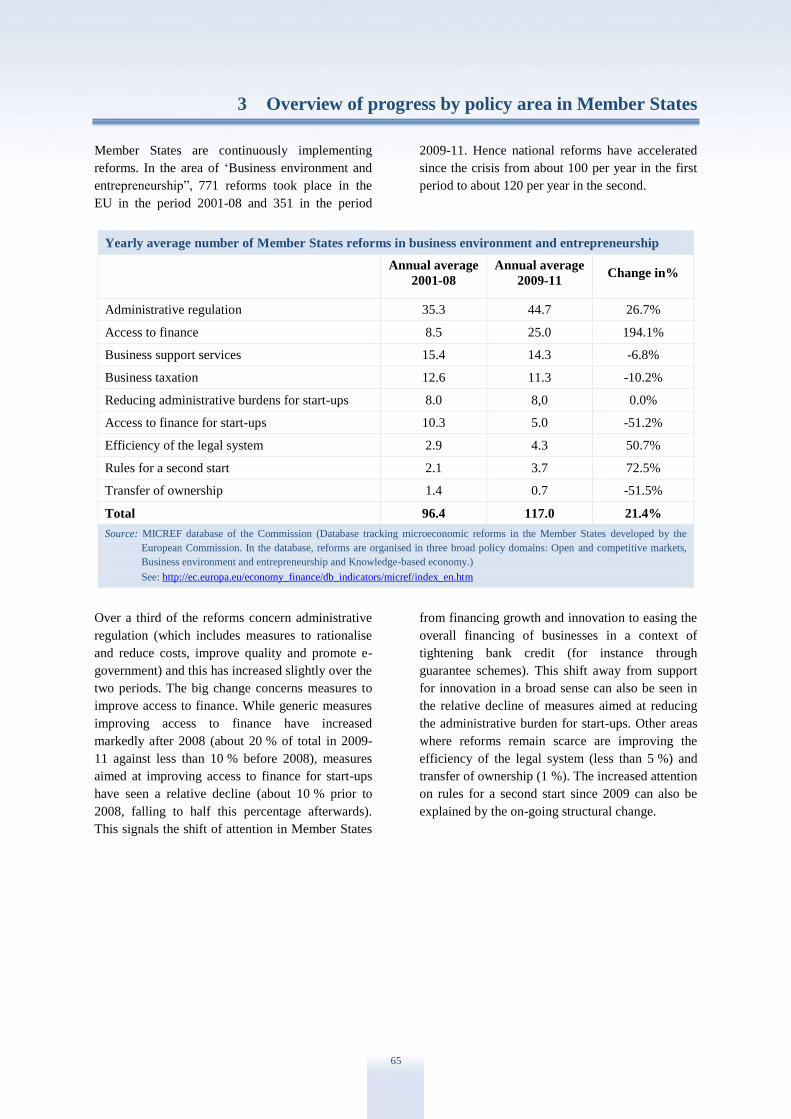
Overview of progress by policy area in Member States
65
3 Overview of progress by policy area in Member States
Member States are continuously implementing
reforms. In the area of ‘Business environment and
entrepreneurship”, 771 reforms took place in the
EU in the period 2001-08 and 351 in the period
2009-11. Hence national reforms have accelerated
since the crisis from about 100 per year in the first
period to about 120 per year in the second.
Yearly average number of Member States reforms in business environment and entrepreneurship
Annual average
2001-08
Annual average
2009-11 Change in%
Administrative regulation 35.3 44.7 26.7%
Access to finance 8.5 25.0 194.1%
Business support services 15.4 14.3 -6.8%
Business taxation 12.6 11.3 -10.2%
Reducing administrative burdens for start-ups 8.0 8,0 0.0%
Access to finance for start-ups 10.3 5.0 -51.2%
Efficiency of the legal system 2.9 4.3 50.7%
Rules for a second start 2.1 3.7 72.5%
Transfer of ownership 1.4 0.7 -51.5%
Total 96.4 117.0 21.4%
Source: MICREF database of the Commission (Database tracking microeconomic reforms in the Member States developed by the
European Commission. In the database, reforms are organised in three broad policy domains: Open and competitive markets,
Business environment and entrepreneurship and Knowledge-based economy.)
See: http://ec.europa.eu/economy_finance/db_indicators/micref/index_en.htm
Over a third of the reforms concern administrative
regulation (which includes measures to rationalise
and reduce costs, improve quality and promote e-
government) and this has increased slightly over the
two periods. The big change concerns measures to
improve access to finance. While generic measures
improving access to finance have increased
markedly after 2008 (about 20 % of total in 2009-
11 against less than 10 % before 2008), measures
aimed at improving access to finance for start-ups
have seen a relative decline (about 10 % prior to
2008, falling to half this percentage afterwards).
This signals the shift of attention in Member States
from financing growth and innovation to easing the
overall financing of businesses in a context of
tightening bank credit (for instance through
guarantee schemes). This shift away from support
for innovation in a broad sense can also be seen in
the relative decline of measures aimed at reducing
the administrative burden for start-ups. Other areas
where reforms remain scarce are improving the
efficiency of the legal system (less than 5 %) and
transfer of ownership (1 %). The increased attention
on rules for a second start since 2009 can also be
explained by the on-going structural change.

Overview of progress by policy area in Member States
66
3.1. Innovation and sustainability
3.1.1 Innovation
3.1.1.1 Main trends in innovation in
2012-13
Successful investment in research and innovation
drives long-term productivity and economic
growth. It also fosters structural change towards
high value-added and knowledge-intensive
economic activities. The EU produces high-
quality science, and has many competitive and
innovative industries. It captures the largest
share (25 %) of income generated in global
manufacturing value chains.62
The EU is
continuing to improve its innovation
performance and has closed almost half the
innovation gap with the US and Japan.63
Meanwhile, China is rapidly catching up and
South Korea has already become a global
innovation leader.
Within the EU, most Member States have improved
their innovation performance since 2008. However,
nine countries64
have become less innovative since
the launch of the Europe 2020 Innovation Union
flagship initiative in 2010. The convergence
process has come to a halt, signalling the risk of an
innovation divide within the EU.65
The EU has maintained its strategic target of
investing 3 % of GDP in research and development
(R&D) by 2020. Although the total spending on
R&D increased from 1.85 % in 2007 to 2.03 %
in 2011, it has stagnated since 2009. The US
invested 2.7 % and South Korea 3.74 % of GDP in
R&D in 2011, with the latter targeting 5 %. Japan
aims for 4 % by 2020 and reached 3.67 % in 2012,
while China’s higher level of investment in recent
years has taken it to 1.97 %.
62 Figure from 2011, ‘State of the Innovation Union 2012:
Accelerating change”; and WIOD database. 63 Innovation Union Scoreboard 2013. 64 UK, PL, CZ, HU, PT, RO, EL, BG ,MT. 65 For a detailed analysis, see EC (2013), ‘Research and
Innovation performance in EU Member States and
Associated countries, Innovation Union progress at
country level, 2013”,
http://ec.europa.eu/research/innovation-union/pdf/state-of-the-union/2012/innovation_union_progress_at_country
_level_2013.pdf.
Although public R&D investment in Europe
held steady in the early years of the financial
crisis, it fell slightly in 2011. Despite the
difficult economic outlook, R&D investment by
businesses grew from 1.18 % of GDP in 2007 to
1.27 % in 2011. However, there are large
differences between Member States, and between
industries. If we compare against global
competitors, US businesses invest more than their
EU counterparts, while the public R&D expenditure
of the EU and the US are roughly at the same
level.66
Venture capital markets in particular, which
are essential for the growth of new innovative
firms, are generally less developed in Europe than
in the US.
Public R&D spending in Sweden, Germany,
Denmark, Finland and the Netherlands was high, at
around 1 % of GDP in 2011. The same countries
plus Austria and Slovenia saw high levels of private
R&D investment, which is crucial for
competitiveness, at around 2 % of GDP. Although
Finland reduced its public R&D investment, it still
had the highest R&D intensity in the EU (3.78 %)
in 2011. Denmark exceeded its 2020 target of 3 %.
Germany is approaching its target (3 %), and it has
been recommended to increase it to 3.5 %.67
R&D
investment in France and Italy has not grown and
was at 2.25 % and 1.25 % respectively in 2011.
Spain and Portugal have seen a slight decline to
around 1.3 % and 1.5 %. Private R&D
investment has fallen since 2007 in the
Netherlands, Luxembourg and Romania.
For many Member States with less developed R&D
systems, European structural and investment funds
offer a major and stable source of R&D funding. In
Greece the crisis has affected innovation budgets
only slightly, and the country finds it difficult to
absorb all the available funding. The aim of the new
smart specialisation strategies under the European
structural and investment funds is to align the
priorities for the 2014-20 programming period with
66 Funding Research and Innovation in the EU and Beyond
2010-12. 67 Expertenkommission Forschung und Innovation
http://www.e-fi.de/gutachten.html.

Overview of progress by policy area in Member States
67
investment objectives under the EU industrial
policy.
A strong entrepreneurship culture and access to
venture capital are crucial for the growth of
new businesses. Only the UK, Sweden, Finland,
Denmark, the Netherlands, France and Belgium
have reasonable venture capital markets
(investment of around 0.1 % of GDP in 2012).
There were no major shifts in innovation policy in
the EU in 2012 despite R&D policies being under
budget pressure. Many Member States have
focused on getting more value out of research and
innovation investment, including by prioritising by
theme or sector. Such policies emphasise better
commercialisation of knowledge, science-business
partnerships, and unlocking businesses’ growth
potential. At the same time, they help create
synergies by linking innovation with broader
policies on entrepreneurship, the business
environment, education and skills.
3.1.1.2 Improving innovation output and
policy implementation
Many Member States have focused their research
and innovation policies to try to have the greatest
effect on growth and job creation. There are large
differences between Member States: Germany,
Denmark, Finland, Ireland and Sweden have been
able to benefit most from innovation.
Figure 3.1: Employment in knowledge-intensive activities (manufacturing and services) as % of total
employment
Source: Innovation Union Scoreboard 2013
The share of knowledge-intensive employment in
manufacturing and services has risen since 2008 in
a majority of Member States. This reflects the
relative resilience of knowledge-intensive jobs in
times of recession, while sectors with lower added
value saw weaker activity and higher
unemployment. 68
68 Innovation Union progress at country level 2013,
http://ec.europa.eu/research/innovation-union/pdf/state-of-the-union/2012/innovation_union_progress_at_country
_level_2013.pdf#view=fit&pagemode=none.
One of the tools to improve the effectiveness of
national innovation systems is to monitor and
evaluate them. Several Member States, including
Austria, Belgium, Denmark, Estonia, France,
Romania, Slovenia and the UK have recently
evaluated some aspects of their innovation systems.
Although Sweden performs very strongly in
innovation, an evaluation69
identified the ‘Swedish
paradox’, whereby high R&D expenditure is not
69 Ett ramverk for innovationspolitiken, 2012; Braunerhjelm,
Eklund, Henrekson.
5%
10%
15%
20%
LU IE UK SE MT DK FI DE CY NL BE FR AT SI EU IT HU CZ ES EL EE SK HR PL LV PT LT BG RO CH NO
2008 2011
24.8
23.6
Overview of progress by policy area in Member States
68
being fully translated into high levels of growth. In
Denmark, businesses think that the innovation
support system is too complex.70
The evaluation of
the French ‘Competitiveness clusters 2.0’71
noted
its positive impact on innovation in SMEs. The
evaluation72
recommended strengthening the role of
the regions and focusing the next cluster policy
even more closely on SMEs. Finland is
implementing recommendations set out in the
report of a high-level group on information and
communication technologies (ICT) competitiveness
(‘Frictionless Finland’).
Policy example: Denmark’s new national
innovation strategy
In 2012, Denmark initiated its new innovation
strategy ‘Denmark — a nation of solutions’. Its
main objective is to translate Denmark’s knowledge
and business strengths into more jobs, growth and
welfare, and to make the national R&D system
simpler and more flexible. It supports a more goal-
oriented approach by targeting innovative solutions
to global societal challenges such as the green
economy. With 27 policy initiatives in research,
innovation and education, the strategy promotes
better collaboration between science and industry,
both at home and abroad. It is also looking to
achieve a cultural change within the education
system, putting a greater focus on innovation and
value creation.
The assessment of Estonia’s research and
innovation policies has found them to be
fragmented, and the government has committed to
focus its efforts using smart specialisation.73
The
review of Slovenia’s innovation policy highlighted
the absence of a long-term policy, which gives rise
to a lack of continuity in innovation support and to
multiple measures with overlapping objectives.74
In
the Netherlands, specific innovation subsidies have
been largely transformed into generic R&D tax
incentives,75
including tax deductions for the wages
70 ERAC, 2012. 71 Les pôles de Compétitivité 2.0 was implemented in 2009-
2012 and supported 71 clusters. 72 http://competitivite.gouv.fr/l-evaluation-de-la-2e-phase/le-
rapport-complet-de-l-evaluation-888.html. 73 ERAC, 2012. 74 OECD, 2012. 75 http://www.agentschapnl.nl/programmas-
regelingen/wbso-research-and-development-rd-tax-credit.
of R&D workers. The evaluation76
of this scheme
noted the positive impact it has had on private R&D
expenditure, with a successful focus on SMEs. Italy
has established a new framework77
to support
innovative start-ups, with evaluation parameters
built in.
Policy example: Finland’s evaluation of SHOKs
Finland has six public-private partnerships called
Strategic Centres for Science, Technology and
Innovation (SHOKs). These aim to cultivate
breakthrough innovation, for instance in the bio-
economy, forestry and health. The centres were
evaluated in 2013 and the conclusion was that, so
far, they have not fully lived up to their promise.78
The managers of the centres (private companies)
are taking steps to sharpen the centres’ focus,
enhance networking and competition for funding.
Improving coordination, in particular between
federal and regional authorities can improve
efficiency and Austria, Spain and Belgium have
taken steps in this direction.
3.1.1.3 Prioritising R&D investments
and rationalising innovation
support
To increase the efficiency of their innovation
support, many countries have reduced the number
of funding instruments to prioritise certain sectors,
themes or specific technologies. While only 31 %
of support measures in 2012 had a thematic or
sector-specific focus, most Member States
increased their focus, with 66 % prioritising energy,
55 % ICT, 55 % sustainable development and 50 %
new materials and technology.79
Many Member States, including Denmark, Finland,
Germany, Sweden and the UK as well as the
Flemish region of Belgium, have shifted the
orientation of their innovation policies towards
meeting societal challenges. Specifically
76 http://www.rijksoverheid.nl/documenten-en-
publicaties/rapporten/2012/04/02/hoofdrapport-evaluatie-wbso-2006-2010.html.
77 Innovative start-ups are companies that: invest more than
30% of costs in R&D; employ researchers representing
more than 30% of workforce; and produce industrial
property rights. 78 http://www.tekes.fi/u/Licence_to_SHOK.pdf. 79 Funding Research and Innovation in the EU and Beyond
2010-12.
http://competitivite.gouv.fr/l-evaluation-de-la-2e-phase/le-rapport-complet-de-l-evaluation-888.html
Overview of progress by policy area in Member States
69
technology-oriented approaches are also widely
used. An example of this is Germany’s ‘High-Tech
Strategy 2020’80
that concentrates R&D funding on
key enabling technologies that help address global
challenges. Estonia is focusing its R&D support on
ICT.
Some countries have a more broad-based approach.
For instance, Ireland has 14 key areas for public
investment in research, development and
innovation. In France, funding is focused on
projects with immediate market potential, on
technology transfer, and on increasing the reach of
digital and key enabling technologies. Austria,
Belgium, Bulgaria, the Czech Republic, Estonia,
Hungary, and Latvia also pursue a more generic
innovation policy.
Policy example: UK’s Catapult centres and focus
on disruptive technologies
The UK’s Technology Strategy Board focuses on
disruptive technologies that have high growth
potential. The UK has also introduced Catapult
Centres to house leading businesses, scientists and
engineers, allowing them to work side by side on
late-stage research and development projects. Four
centres are already operational (focusing on high
value manufacturing, cell therapy, offshore
renewable energy, and satellite applications) and
three others (connected digital economy, future
cities, and transport systems) are set to start
operations in 2013.
Finland has decided to move its main innovation
support institutions to joint premises to increase
synergies and to provide a variety of support
instruments from a single location. France has
created the Banque Publique d’Investissement
(BPI), merging three existing entities81
that
financed innovation and SMEs. The newly created
bank’s task is to support businesses at all stages of
development. Portugal has rationalised its clusters
to foster competitiveness and exports. It is focusing
on international high-growth sectors,82
and on
natural endogenous resources.83
80 http://www.hightech-strategie.de. 81 Oseo, Fonds Stratégique d’Investissement, CDC
Entreprise. 82 Such as ICT, health, advanced manufacturing fashion and
engineering. 83 Such as wine, the sea and natural stone.
3.1.1.4 Facilitating private research
Many Member States have increased incentives for
businesses to invest in R&D. These include new or
revised tax exemptions in Belgium, France,
Finland, Romania, Slovenia and the UK. Innovation
vouchers have been launched in Belgium,
Lithuania, Latvia, Slovenia, Slovakia, Romania and
the UK. These vouchers can be exchanged for
innovation services like external studies or hiring
researchers. Ireland focuses on attracting foreign
investment with a large R&D component.84
In
Germany, the Central Innovation Programme for
SMEs85
assists SMEs in developing innovative
products, processes and services; over 10 000
companies have been supported. Poland has
adopted the Strategy for Innovation and an Efficient
Economy 202086
that has modernised the regulatory
and financial framework for stimulating innovation.
Spain has introduced new rules for researchers in
public institutions. They can now take leave of
absence for up to five years to work in private
companies on R&D projects and return to their
previous career more easily. Germany lifted some
restrictions on foreign researchers in specific areas
of technology. Belgium has a payroll tax incentive
to cut R&D personnel costs and a special tax
regime to attract highly skilled foreign
professionals. In France, young innovative firms
can benefit from reduced social charges and taxes
through the Jeunes Entreprises Innovantes (JEI)
scheme.
3.1.1.5 Commercialising research
through academia-business
partnerships
Many Member States have recently adopted
measures to improve the commercialisation of
research and innovation. For example, Sweden has
increased funding and has made access to early-
stage finance easier through business incubators
and risk funds.87
Malta has launched a new
Commercialisation Programme to assist innovative
companies in bringing their technologies closer to
market. In Poland, the Top 500 Innovators initiative
84 Innovation Union progress at country level 2013. 85 Zentrales Innovationsprogramm Mittelstand; Chamber of
Industry and Commerce identified the scheme as a ‘best
practice’. 86 Programme for the Development of Enterprises. 87 Innovationsbron, Industrifonden, Almi.

Overview of progress by policy area in Member States
70
provides training to researchers and business
professionals to improve their technology transfer
skills. Portugal has renewed the US-Portugal
partnership with a focus on innovation and
entrepreneurship, and created the Global
Acceleration Innovation Network (GAIN) to speed
up innovation and technology transfer.
Figure 3.2: Licence and patent revenues from abroad (% of GDP)
Source: Innovation Union Scoreboard 2013
The UK supports interaction between academia and
business88
through the Higher Education Innovation
Fund. This fund backs collaborative projects
between higher education institutions, and between
academia and businesses. The Czech Republic has
set up Competence Centres that encourage medium
to long-term public-private R&D projects. It has
also used European structural and investment funds
for a knowledge-transfer pilot project between
universities and SMEs. This project has been
successful and may be extended. In Latvia, nine
national research centres have been established to
improve the commercialisation of science results.
In Slovenia support is focused on networking,
clustering and collaboration between firms and
research institutions. Italy has also emphasised
public-private partnerships in new initiatives.
88 The World Economic Forum ranked UK second in the
world in 2011 regarding industry/university collaboration http://www.globalinnovationindex.org/gii/main/fullreport/
files/Chap4/5/5.2.1.pdf .
Policy example: The Netherland’s Top
Consortiums for Knowledge and Innovation (TKIs)
The ‘To the Top’89
enterprise policy aims to
improve collaboration between science and
business by putting businesses in the driving seat in
designing public-private partnerships for
innovation. ‘Top teams’ involving various
stakeholders have agreed on innovation contracts,
which have, in turn, defined the investment
priorities in nine sectors. In 2012, 19 Top Consortia
for Knowledge and Innovation (TKIs) were founded
and started implementing the innovation contracts.
Several private investment commitments were also
announced.
Lithuania, Latvia and Croatia have improved or
expanded their support for clusters. France has a
new investment fund for patents that helps public
and private research institutions benefit more fully
from the value of their patent portfolios.
89 Naar de top.
0.0%
0.2%
0.4%
0.6%
0.8%
1.0%
1.2%
1.4%
NL IE FI SE DK LU HU EU UK FR BE DE MT AT SI IT RO EE ES PL CZ HR LV BG PT EL CY SK LT CH NO
2007 20113.7
1
.8
2.3
3.0
2
.1
Overview of progress by policy area in Member States
71
Policy example: Ireland’s Intellectual Property
Protocol
Ireland has published the Intellectual Property
Protocol (IPP), which helps businesses to access
R&D performed at Irish universities and public
research institutes. A new central technology
transfer office hosted by Enterprise Ireland will act
as a one-stop-shop for businesses seeking to use
intellectual property originating from publicly
funded research.
3.1.1.6 Restructuring and
reindustrialisation
Some Member States have been less than
successful in moving their industrial focus to
growing sectors, leading to deindustrialisation
through the closure of industrial sites, with a
negative impact on employment. To help workers
through this re-adjustment process, many countries
have designed specific reindustrialisation or
adjustment initiatives.
The Czech Investment and Business Development
Agency focuses on developing and regenerating
industrial sites. Italy has adopted two initiatives to
support restructuring and industrial investment90
and to simplify the regeneration of disused
industrial sites. In France, a reindustrialisation
programme91
supports strategic investment projects.
Many Member States have also used European
structural and investment funds to help upgrade
previously industrial regions. Examples include
projects to upgrade infrastructure, support
innovation and provide training for new skills and
qualifications, and entrepreneurship schemes.
3.1.2 Sustainability
3.1.2.1 Energy use and CO2 emissions
Both the EU and the Member States have
committed to reduce their energy and carbon
intensity92
by working towards specific targets.
Most Member States have taken steps to reduce
their energy intensity and to increase the share of
renewable sources in their energy mix.
90 Progetto di riconversione e riqualificazione industriale. 91 L’aide à la réindustrialisation. 92 For information on their calculation, see the
methodological annex.
The most ambitious is Denmark as it aspires to
have a zero-emission economy by 2050. Countries
promote renewable energy production by giving
easier access to finance and relatively stable long
term support. Austria, for example, targets wind
energy in particular. In Germany, energy producers
are required to have a minimum share of renewable
energy in the total they sell to their clients.
Policies on energy consumption are more mixed.
Most Member States have policies to improve the
energy efficiency of buildings. However, many also
provide tax relief for energy-intensive industries,
which go against incentives for energy efficiency.
Policy example: Photovoltaic parks in Cyprus
Cypriots have long paid the highest electricity
prices in the EU as all power is generated using
imported oil. Cyprus is also below the EU average
in terms of energy and carbon intensity. In 2013 the
government issued a large tender, comprising 23
projects ranging from 1.5 to 10 megawatts, with a
view to tackling both of these issues. The very
competitive bidding led to a very low average price
of 0.0866 EUR/kWh, about half of current energy
price in Cyprus. The companies involved (both
Cypriot and foreign) are expected to complete the
projects in a relatively short time. They will be able
to draw on the experience of the well-developed
and large solar panel industry.
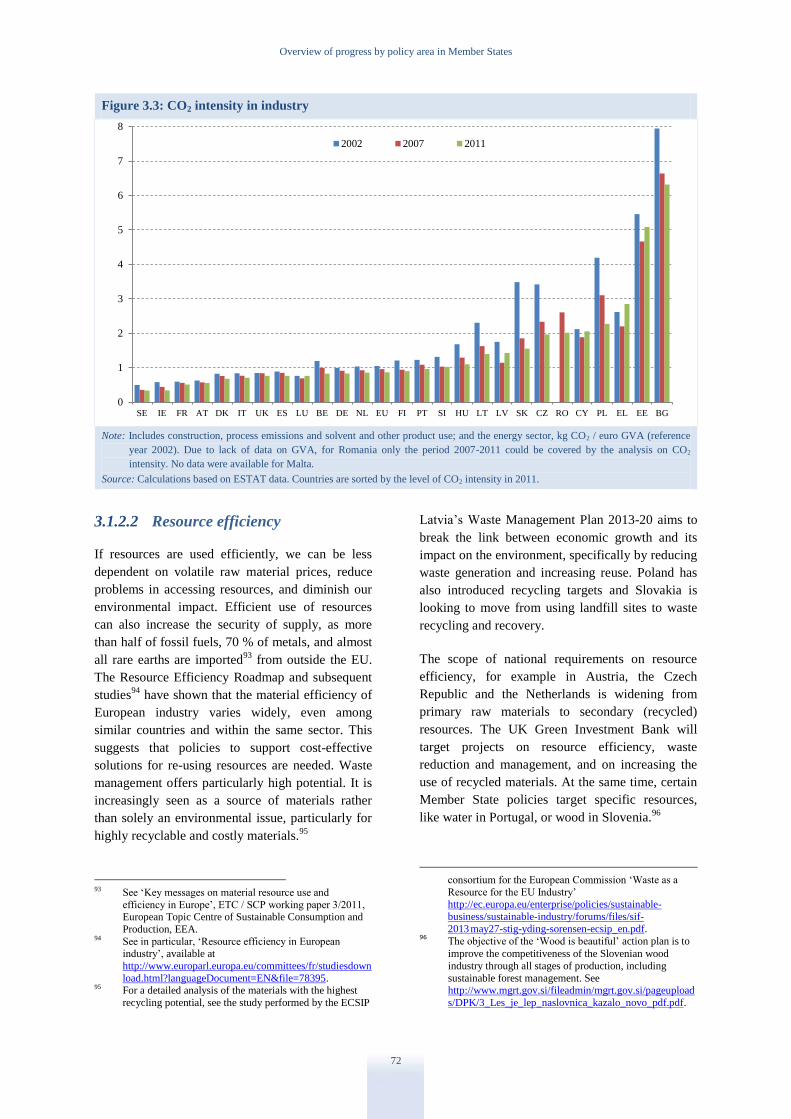
Overview of progress by policy area in Member States
72
Figure 3.3: CO2 intensity in industry
Note: Includes construction, process emissions and solvent and other product use; and the energy sector, kg CO2 / euro GVA (reference
year 2002). Due to lack of data on GVA, for Romania only the period 2007-2011 could be covered by the analysis on CO2
intensity. No data were available for Malta.
Source: Calculations based on ESTAT data. Countries are sorted by the level of CO2 intensity in 2011.
3.1.2.2 Resource efficiency
If resources are used efficiently, we can be less
dependent on volatile raw material prices, reduce
problems in accessing resources, and diminish our
environmental impact. Efficient use of resources
can also increase the security of supply, as more
than half of fossil fuels, 70 % of metals, and almost
all rare earths are imported93
from outside the EU.
The Resource Efficiency Roadmap and subsequent
studies94
have shown that the material efficiency of
European industry varies widely, even among
similar countries and within the same sector. This
suggests that policies to support cost-effective
solutions for re-using resources are needed. Waste
management offers particularly high potential. It is
increasingly seen as a source of materials rather
than solely an environmental issue, particularly for
highly recyclable and costly materials.95
93 See ‘Key messages on material resource use and
efficiency in Europe’, ETC / SCP working paper 3/2011, European Topic Centre of Sustainable Consumption and
Production, EEA. 94 See in particular, ‘Resource efficiency in European
industry’, available at
http://www.europarl.europa.eu/committees/fr/studiesdown
load.html?languageDocument=EN&file=78395. 95 For a detailed analysis of the materials with the highest
recycling potential, see the study performed by the ECSIP
Latvia’s Waste Management Plan 2013-20 aims to
break the link between economic growth and its
impact on the environment, specifically by reducing
waste generation and increasing reuse. Poland has
also introduced recycling targets and Slovakia is
looking to move from using landfill sites to waste
recycling and recovery.
The scope of national requirements on resource
efficiency, for example in Austria, the Czech
Republic and the Netherlands is widening from
primary raw materials to secondary (recycled)
resources. The UK Green Investment Bank will
target projects on resource efficiency, waste
reduction and management, and on increasing the
use of recycled materials. At the same time, certain
Member State policies target specific resources,
like water in Portugal, or wood in Slovenia.96
consortium for the European Commission ‘Waste as a
Resource for the EU Industry’ http://ec.europa.eu/enterprise/policies/sustainable-
business/sustainable-industry/forums/files/sif-
2013 may27-stig-yding-sorensen-ecsip_en.pdf. 96
The objective of the ‘Wood is beautiful’ action plan is to
improve the competitiveness of the Slovenian wood
industry through all stages of production, including
sustainable forest management. See http://www.mgrt.gov.si/fileadmin/mgrt.gov.si/pageupload
s/DPK/3_Les_je_lep_naslovnica_kazalo_novo_pdf.pdf.
0
1
2
3
4
5
6
7
8
SE IE FR AT DK IT UK ES LU BE DE NL EU FI PT SI HU LT LV SK CZ RO CY PL EL EE BG
2002 2007 2011

Overview of progress by policy area in Member States
73
3.1.2.3 Policies on green business
models
Many governments have set up policies to
encourage green businesses, due to the potential97
they have to produce economic and environmental
benefits. Nordic countries have been at the
forefront,98
both in terms of developing policies and
subsequently implementing them. Building on a
study,99
the Commission organised an exchange of
good practices from within and outside the EU,
focusing on the most important policy lessons.
The most direct way of supporting green businesses
is to help the take-up of environmentally friendly
products and services. This can be done by making
it easier to get access to finance, placing value on
the environmental credentials of the product or
service, or reducing administrative requirements.
Widely used measures include tax credits, direct
subsidies, access to loans at favourable conditions
and feed-in tariffs. On the demand side, rules on
green public procurement quotas are often used.
Another way of levelling the playing field is to
oblige environmentally-unfriendly activities to pay
for the externalities they produce through
mechanisms such as taxes on petrol or airfares, or
car registration fees. Many such schemes seem to
have been very effective, including in Denmark and
Austria, where cars’ fuel efficiency and public
transport usage have increased. However,
additional taxes and fees can encounter stronger
opposition than tax incentives.
Policy measures have proven to be particularly
effective if they have created a stable and
predictable economic and regulatory environment.
As renewable energy projects are often long-term in
nature and need large-scale investment, backers of
such projects need some certainty about the
financial and regulatory environment. The
97 See the OECD background paper ‘The Role of Business
Models in Green Transformation’ http://www.oecd.org/sti/inno/49224244.pdf.
98 See ‘Green Business Model Innovation’ by Nordic
Innovation http://www.nordicinnovation.org/Global/_Publications/Re
ports/2012/. 99 Idea Consult et al.: ‘Exchange of good policy practices
promoting Innovative/Green business models’ — Final
report July
2013,.http://ec.europa.eu/enterprise/policies/industrial-competitiveness/monitoring-member-states/good-
practice/index_en.htm
Commission’s forthcoming guidance on renewable
energy support schemes should facilitate
improvements in this area.
Projects of industrial symbiosis consist in
companies exchanging non-product outputs (for
instance, heat or energy) and/or sharing inputs in a
mutually beneficial manner, and can thus count on
strong economic reasons for their development;
however, public authorities often play a vital role in
getting them off the ground by building the
necessary trust among the actors involved and by
providing a clear and long-term regulatory
framework. In the case of Kalundborg in Denmark,
this role has been played by the city administration;
now the gas produced by an oil refinery is used to
produce electricity and the excess heat is used for
district heating, a fish farm and a pharmaceutical
plant.
On a national scale, the British National Industrial
Symbiosis Programme has played a similar role.
Under this programme, channels to share
information and best practices have been
developed, and pilot projects have been undertaken
and promoted. More than 10 000 industrial
companies now participate in it and it has been
selected as a best practice in the context of the
European Waste Framework Directive. Successful
industrial symbiosis cases are most likely to be
found in countries that impose high waste disposal
standards, such as the UK and Denmark, as these
create incentives for the shared use of resources and
by-products.
To build green cities and neighbourhoods, many
policy areas need to be considered. As an example,
congestion charges to reduce the number of cars
entering a city and to improve its air quality can
only be effective if alternative means of transport
are available and have additional capacity. These
could include cycle lanes or public transport, but
also electric vehicles or vehicle-sharing schemes.
Other utilities such as waste management, heating
and electricity could also benefit from close
coordination. Copenhagen100
has had an integrated
transport and land use policy for decades. This has
100 Copenhagen came first in the latest Economist
Intelligence Unit’s European Green City ranking, and is
cited as best practice in the study ‘Going green: How
cities are leading the next economy’ by LSE Cities, available at http://lsecities.net/publications/reports/going-
green-3gf-edition/.
Overview of progress by policy area in Member States
74
made it easier to implement a wider green policy
that covers renewable energy, district heating,
waste management and the cleaning of industrial
areas. Such a policy can create cost savings for both
the city and its inhabitants.
Green businesses often need long-term
relationships based on trust with their suppliers and
with their customers. From a policy perspective, a
coherent, predictable and stable regulatory
framework is required, but often policymakers also
need to act as honest brokers between the parties
involved. This can be done through establishing a
forum to coordinate activity and to ensure that rules
are followed and benefits shared. When customers
need assurance about quality as it is difficult for
them to control it, standards and labelling schemes
have proven to be effective policy tools.
Policy example: FISCH, Flanders Innovation Hub
for Sustainable Chemistry
FISCH helps companies to collaborate in order to
come up with sustainable chemical solutions for
Flemish industrial enterprises, including systemic
projects. It is a knowledge centre for chemistry,
supported by the Flemish government and brings
together various companies in the sector and all
Flemish university associations. It is coordinated by
Essenscia, the Belgian federation for the chemical
industry and life sciences.
3.2. Business environment, services and infrastructure
3.2.1 Introduction: trends in 2012-2013
Over the last five years, half of the EU Member
States have slid down in international rankings
measuring the legal and regulatory framework for
businesses101
and this trend continued in 2012-13.
While Poland and Greece have noticeably improved
their rankings in terms of the ease of doing
business, many others saw a further gradual
decline. This does not necessarily mean that the
business environment has worsened in absolute
terms but rather that other countries in the world
have improved faster. In a global context in which
many countries are rapidly improving their business
conditions, no country can afford to stand still.
3.2.2 Business environment
The aim of the Small Business Act for Europe
(SBA)102
is to improve the business environment
for SMEs. The annual SME Performance Review
and the SBA Fact Sheets103
analyse the situation
101 For example, the IMD Competitiveness Index, the World
Economic Forum Global Competitiveness Report and the
World Bank Doing Business report. 102 European Commission, Small Business Act for Europe
http://ec.europa.eu/enterprise/policies/sme/small-business-
act/index_en.htm. 103 European Commission, SME Performance Review
http://ec.europa.eu/enterprise/policies/sme/facts-figures-
analysis/performance-review/index_en.htm.
across the EU and look at initiatives that Member
States have taken in the individual priority areas of
the SBA. The Commission and the Member States
have implemented many actions set out in the SBA
to lighten the administrative burden, make it easier
for SMEs to get access to finance and to support
them in entering new markets. Although much
progress has been achieved, further efforts are
needed to improve the conditions under which
SMEs do business.
Many Member States support the
internationalisation of SMEs.104
Many Member
States, including Finland, Greece, Italy, Ireland and
Portugal105
have streamlined and improved the
entities responsible for exports and
internationalisation. France is opening business
incubators (Maisons de l’international) in major
cities throughout the world (in particular in the
United States and Asia) to encourage SMEs to
export their goods and services.
104 European Commission, Study on Support Services for
SMEs in International Business, 2013
http://ec.europa.eu/enterprise/policies/sme/market-access/internationalisation/index_en.htm#h2-1.
105 Strategy board for the internationalisation of the economy.
Overview of progress by policy area in Member States
75
Policy example: Support for SME
internationalisation in Germany
German businesses benefit from a range of
measures to support internationalisation. For
example, an internet portal gives information on
how to expand abroad, including information on
key export markets, customs procedures, legal
aspects of doing business abroad and information
on export financing and credit insurance. The portal
also facilitates exchanges between German and
foreign companies. Other measures include trade
fairs, information campaigns, missions and
networking events. Of particular importance is the
support provided by diplomatic missions abroad;
the German Chamber Network, which is
represented in important export markets; the
Germany Trade and Invest agency; and other
business associations. The development bank
‘KfW’ uses intermediary banks to provide
entrepreneurs with financing at market conditions,
including if they wish to expand their business
activities abroad. If private export insurance or
financing is not sufficiently available, the federal
government also facilitates export guarantees and
export financing. In recent years, the federal
government’s ‘new target markets’ initiative has
focused particularly on increasing German
businesses’ penetration in new emerging markets
besides Brazil, Russia, India or China.
In the Entrepreneurship 2020 Action Plan,106
the
Commission proposed a number of actions and
encouraged Member States to exploit Europe’s
entrepreneurial potential. Continuing a
longstanding policy of promoting entrepreneurship
and helping people to start businesses, many
Member States have further improved the
conditions for entrepreneurs. In particular, over the
last five years, it has become cheaper and much
quicker to start a business in many countries, and
entrepreneurship education has been introduced in
many places. For further details, see the section
3.3.4 on administrative burden below.
106 European Commission, Entrepreneurship 2020 Action
Plan http://ec.europa.eu/enterprise/policies/sme/entrepreneurshi
p-2020/index_en.htm.
Policy example: Encouraging entrepreneurship in
the Swedish education system
Promoting entrepreneurial skills is being
systematically embedded in the Swedish education
system. Since 2009, the National Agency for
Education has encouraged entrepreneurship in
schools in line with the new steering documents for
compulsory and upper secondary school. In 2012, it
allocated grants to support entrepreneurial learning
in schools at all levels. In total, 72 projects and five
programmes were funded to improve the
competence and teaching of entrepreneurship.
Entrepreneurship has also been integrated in higher
education programmes. The measures are seen as
helping improve young people’s independence,
self-confidence and decision-making skills.
3.2.3 Competition and regulation in
services and network industries
Services account for about three-quarters of the EU
economy, and are closely intertwined with
manufacturing. Business-related services107
account
for over a third of the production inputs in
manufacturing, and an efficient market in these
services can strengthen an industry’s
competitiveness. The Services Directive was a
major step towards making the single market for
services a reality as the services it covers account
for more than 45 % of EU GDP. Economic analysis
showed that the implementing measures are
bringing an additional 0.8 % of EU GDP over time;
if Member States were to abolish almost all
remaining barriers to trade, the total economic gain
would raise to about 2.6 %.108
A number of Member States have launched
initiatives to strengthen access to regulated
professions. For example, in 2012, Poland launched
reforms of a total of 250 professions. Liberalisation
has also continued in Greece, but some key
professions are yet to be tackled. The Czech
Republic carried out a public consultation in 2012
with a view to reviewing its regulatory framework.
107 Business-related services include network industries
(energy, telecommunications, transport, etc.), distributive
trade and other services such as consulting, engineering,
R&D and IT services. 108 European Commission, The economic impact of the
Services Directive: A first assessment following
implementation http://ec.europa.eu/economy_finance/publications/econom
ic_paper/2012/pdf/ecp_456_en.pdf.

Overview of progress by policy area in Member States
76
Portugal eased the rules governing access to and
exercise of various professional services such as
lawyers, accountants and architects. Slovenia
started the process of reforming some services,
activities and occupations in 2012. Spain
announced that it would reassess the existing
reserves of activity and requirements for
membership of professional bodies.
Telecommunications, energy and transport are
important inputs for most industrial firms. The EU
regulatory framework for telecommunications has
led to the liberalisation of the sector, which has
become increasingly competitive. In recent years,
liberalisation has led to lower prices, in particular
for mobile communications, and a wider range of
services being offered to customers. Further
efficiencies should be achieved through the Single
Telecom Market initiative.109
The energy market is not yet fully liberalised, as
Member States have been very slow in adapting
their national legislation to bring it into line with
the Third Energy Package. The Commission has
opened several infringement cases against Member
States for non-transposition of that legislation.
Ultimately, the package should boost competition,
increase transparency and make it easier for
consumers to switch suppliers. The energy
generation market remains highly concentrated in
many Member States. In eight Member States more
than 80 % of power generation is controlled by the
incumbent. There is a particularly high
concentration in Estonia (89.0 %), Latvia (88.0 %),
France (86.5 %), Luxembourg (85.4 %), Greece
(85.1 %) and Slovakia (80.9 %).110
The transport sector has seen some progress, but
there are still legal barriers to market entry in the
majority of Member States. This is especially true
in the rail sector, where the lack of competition
considerably reduces the efficiency of services.
Improvements in the sector could particularly
benefit the entire Union when made by large or
important transit countries.111
109 Conclusions of the European Council 14 March 2013. 110 European Commission, Key areas: comparing Member
States’ performances, Energy Networks,
http://ec.europa.eu/europe2020/making-it-happen/key-
areas/index_en.htm. 111 European Commission, Key areas: comparing Member
States’ performances, Network Industries — Transport,
Policy example: Reform of regulated professions
in Poland
Poland has taken important steps to enhance the
registration of property, ensure taxes are paid,
enforce contracts and resolve insolvency. The time
necessary to register a firm has also been cut
further. In addition, Poland has been active in
reforming how professional services are regulated.
These reforms started in 2012 and aim to reduce or
eliminate regulatory barriers of up to 230
professions. The first stage in the reform, covering
about 50 professions, was due to be completed in
June 2013, and work on the remaining professions
has started.
3.2.4 Infrastructure
For businesses, road and rail networks, electricity
grids, and communications networks are an
essential part of their operating environment, but
quality and availability of such infrastructure varies
significantly across the EU. Overall satisfaction
with the quality of infrastructure is highest in the
Netherlands, closely followed by France, Finland
and Germany.112
Over the last decade,
improvements have been noted in many Member
States, partly as a result of using European
structural and investment funds for investment in
transport infrastructure. Progress has been slower in
Poland, and has decreased Romania, which suffer
from underdeveloped road infrastructure and delays
in construction projects. In the more mature
economies, satisfaction is lowest in Italy and
Greece, due in part to how difficult it is to prepare
and implement infrastructure investment.
Significant investment in building and more
modern infrastructure is still needed in many
Member States, as is the support of European
structural and investment funds and the Connecting
Europe Facility. Some Member States have already
invested in modernisation using these funds.113
http://ec.europa.eu/europe2020/making-it-happen/key-
areas/index_en.htm. 112 World Economic Forum, Global Competitiveness Report
2012-2013. 113 European Commission, Key areas: comparing Member
States’ performances, Network Industries — Transport, http://ec.europa.eu/europe2020/making-it-happen/key-
areas/index_en.htm.
Overview of progress by policy area in Member States
77
The EU’s energy infrastructure can be outdated and
poorly connected, although the situation varies
across the EU. Better energy infrastructure would
improve security of supply, allow renewable energy
sources to be integrated into energy supplies,
increase energy efficiency and help consumers to
benefit from new technologies and intelligent
energy use.114
The construction of smart grids has
accelerated in recent years and over 280 smart grid
projects have so far been identified in 30
countries115
accounting for a total investment of
EUR 1.8 billion. However, over 90 % of the
projects are in EU-15 countries with the UK,
Germany, France and Italy the leading investors.116
Under the provisions of the third energy package,117
Member States must ensure the implementation of
intelligent metering systems and 14 of them118
have
already decided to roll out smart meters for
electricity by 2020, with others following.119
Thus
an estimated EUR 5 billion have so far been
invested in smart metering.
Information and communications technologies
account for 6 % of GDP and are responsible for a
fifth of business R&D spending. These sectors
provide other businesses with platforms for growth,
including e-commerce, the fastest-growing segment
of European retail sales. It is estimated that the
internet economy will grow from 3.8 % of EU GDP
in 2010 to 5.7 % in 2016.120
Fast broadband
connections are increasingly important for business
competitiveness and many Member States are
working on improving their infrastructure, although
many challenges remain. The level of fixed
broadband coverage is below the EU average in
Poland, Slovenia, Slovakia, Latvia, Estonia,
Bulgaria Romania, Hungary, Finland and Croatia.
In many Member States, European structural and
114 European Commission, Key areas: comparing Member
States’ performances, Energy networks, http://ec.europa.eu/europe2020/making-it-happen/key-
areas/index_en.htm. 115 The EU-28, Switzerland and Norway. 116 European Commission, Smart Grid projects in Europe:
Lessons learned and current developments — 2012,
http://publications.jrc.ec.europa.eu. 117 Third Energy Package, available at:
http://ec.europa.eu/energy/gas_electricity/legislation/legisl
ation_en.htm 118 Austria, Denmark, Estonia, Finland, France, Greece,
Ireland, Italy, Luxemburg, Malta, Netherlands, Spain,
Sweden and UK. 119 Poland and Romania. 120 European Commission, Digital Agenda: Broadband and
E-communications, http://ec.europa.eu/europe2020/pdf/themes/11_digital_age
nda.pdf.
investment funds play an important role in
supporting investments in broadband
infrastructure.121
Policy example: Denmark’s smart grid projects
Denmark is a forerunner in applying smart grid
technology. It spends the most per capita and per
KWh consumed on smart grid projects and is
involved in numerous R&D projects in this field. In
April 2013, it launched a new smart grid strategy to
combine electricity meters with variable tariffs and
a data hub to enable consumers to use power when
it is least expensive. This strategy should bring
Danish consumers much closer to managing their
own energy consumption. In addition, a funding
programme has supported a large number of small-
scale projects, to help develop environmentally
friendly power generation technologies and connect
them to the grid.
121 European Commission, Key areas: comparing Member
States’ performances, Digital Agenda, http://ec.europa.eu/europe2020/making-it-happen/key-
areas/index_en.htm.
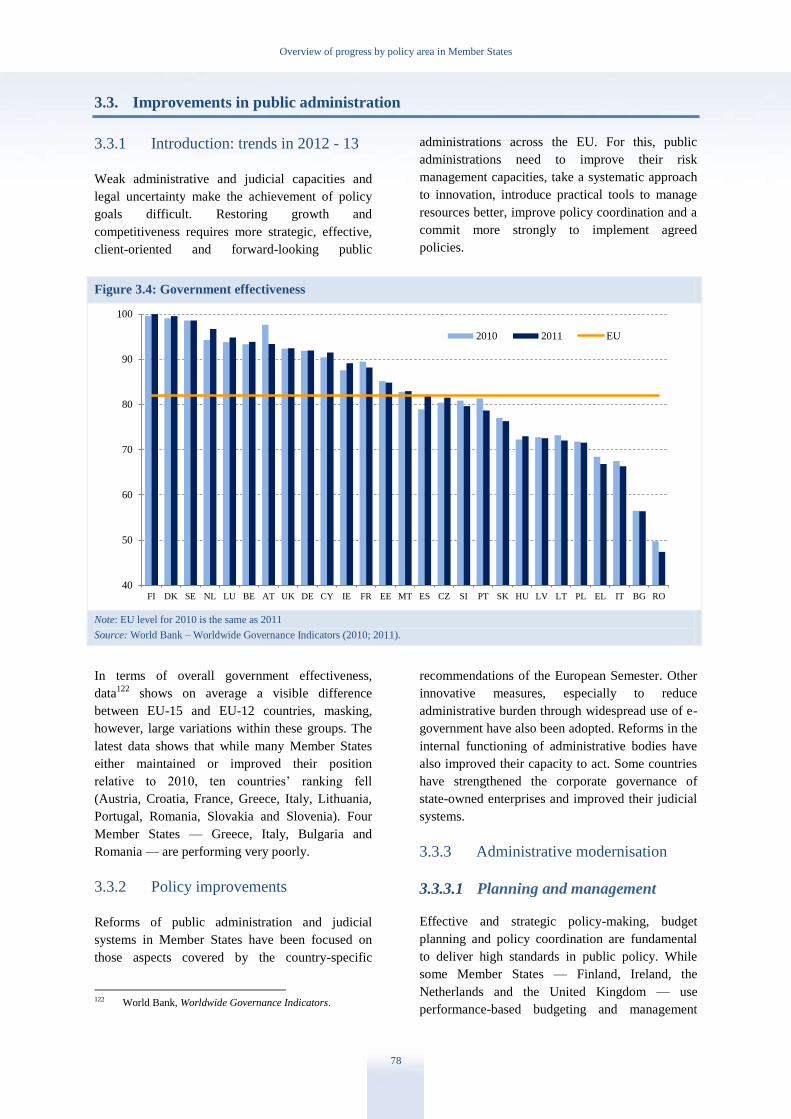
Overview of progress by policy area in Member States
78
3.3. Improvements in public administration
3.3.1 Introduction: trends in 2012 - 13
Weak administrative and judicial capacities and
legal uncertainty make the achievement of policy
goals difficult. Restoring growth and
competitiveness requires more strategic, effective,
client-oriented and forward-looking public
administrations across the EU. For this, public
administrations need to improve their risk
management capacities, take a systematic approach
to innovation, introduce practical tools to manage
resources better, improve policy coordination and a
commit more strongly to implement agreed
policies.
Figure 3.4: Government effectiveness
Note: EU level for 2010 is the same as 2011
Source: World Bank – Worldwide Governance Indicators (2010; 2011).
In terms of overall government effectiveness,
data122
shows on average a visible difference
between EU-15 and EU-12 countries, masking,
however, large variations within these groups. The
latest data shows that while many Member States
either maintained or improved their position
relative to 2010, ten countries’ ranking fell
(Austria, Croatia, France, Greece, Italy, Lithuania,
Portugal, Romania, Slovakia and Slovenia). Four
Member States — Greece, Italy, Bulgaria and
Romania — are performing very poorly.
3.3.2 Policy improvements
Reforms of public administration and judicial
systems in Member States have been focused on
those aspects covered by the country-specific
122 World Bank, Worldwide Governance Indicators.
recommendations of the European Semester. Other
innovative measures, especially to reduce
administrative burden through widespread use of e-
government have also been adopted. Reforms in the
internal functioning of administrative bodies have
also improved their capacity to act. Some countries
have strengthened the corporate governance of
state-owned enterprises and improved their judicial
systems.
3.3.3 Administrative modernisation
3.3.3.1 Planning and management
Effective and strategic policy-making, budget
planning and policy coordination are fundamental
to deliver high standards in public policy. While
some Member States — Finland, Ireland, the
Netherlands and the United Kingdom — use
performance-based budgeting and management
40
50
60
70
80
90
100
FI DK SE NL LU BE AT UK DE CY IE FR EE MT ES CZ SI PT SK HU LV LT PL EL IT BG RO
2010 2011 EU
Overview of progress by policy area in Member States
79
systems, others have only recently started to
integrate policy and financial planning to improve
prioritisation and policy direction.
Strategic and effective human resources
management is essential for efficient and
professional administrative staff. Streamlining of
public administration has often been accompanied
by reforms in human resources management. The
tools used by Member States differ significantly but
some practices, such as introducing performance
management and merit-based systems, are
common. For example, Bulgaria has adopted a
legislative framework for performance-based
remuneration for civil servants; Denmark recently
introduced a new performance management system;
and Ireland has made significant changes to its own
system.
Some Member States have improved their
recruitment processes, either by updating
requirements (France, Malta and Portugal) or
standardising procedures (Italy, Lithuania). Many
countries pool services such as procurement,
finance and payroll functions (Estonia, the
Netherlands, Portugal, Spain, Sweden and the
United Kingdom). As demands on public services
grow, effective management is particularly
important to ensure the appropriate skills are
available to cope with future challenges.
Nevertheless, a survey by the OECD123
shows that
many Member States still lack a forward-looking
planning system.
Policy example: The workforce planning
framework in Ireland
In Ireland, the Department of Public Expenditure
and Reform has developed a workforce planning
framework for the 16 government ministries. The
approach is to promote staff development in a
broader context of performance budgeting to align
resourcing policies more closely with business
needs and longer term strategy.
3.3.3.2 Governance issues
Efforts in many countries to decentralise and
streamline municipalities and state bodies have
123 OECD, Survey on Strategic Human Resources
Management in Central Governments of OECD countries
(2010).
shown that managing governance levels is a
challenging task. The Czech Republic, Denmark
and Slovakia, for example, have created regional
levels to deliver public services that require a large
population base (health care, economic
development, territorial planning, etc.).
The competences of national and sub-national
authorities — and the rules governing their
relations — are key factors in providing efficient
services. Coordination is required both vertically,
i.e. across administrative levels, and horizontally,
i.e. between units on the same administrative level.
Many countries use legislation and binding
standards to regulate their vertical and horizontal
cooperation. In the Netherlands, cooperation
between municipalities, provinces and other sub-
national public bodies is regulated by a law on
mutual agreements. Denmark and the United
Kingdom set standards to ensure similar levels of
service quality across levels of government. Mutual
contracts can be used in multi-level governance
relations.124
The merging of municipalities is used to
help pool resources to deliver cheaper and more
efficient services. Estonia is encouraging voluntary
mergers of municipalities by providing financial
support and by allowing mergers between
municipalities without a common border. In
Portugal, the number of municipalities has been
reduced by about 25 %, and France and Finland are
using municipal cooperation as an alternative to
mergers.
3.3.3.3 Regulations and services
Improving the quality of legislation and facilitating
compliance is vital for SME-friendly business
environments. Both the EU and Member States
continually seek opportunities to simplify, reduce
costs, and scrap obsolete measures.125
A recent
example is REFIT – EU regulatory fitness at EU
124 This is the case, for example, with Contrat de Plan État
Région in France, convenios in Spain, joint tasks in Germany, and accordi in Italy. See Charbit, C. and M.
Michaun (2009) Mind the gaps: Managing Mutual
Dependence in Relations among Levels of Government, OECD Working Papers on Public Governance, No 14,
OECD Publishing, OECD. 125 COM(2012) 746 final
http://ec.europa.eu/governance/better_regulation/documen
ts/com_2013_en.pdf.
Overview of progress by policy area in Member States
80
level126
seeking to improve the regulatory
framework. At the same time, lighter regulatory
regimes for SMEs are being looked at,127
including
exemptions for micro-enterprises.128
The United
Kingdom, for example, no longer requires routine
health and safety checks on premises, such as small
shops, considered to be low risk.
Policy example: Common commencement dates
To increase the level of predictability and legal
certainty, the Netherlands, Slovakia, Sweden and
the United Kingdom have implemented a system of
common commencement dates, whereby all new or
amended regulations come into force on a limited
number of pre-defined dates each year.
The use of impact assessments, competitiveness
proofing, SME tests, and fitness checks are
essential to clarify the impacts and costs of
regulation for businesses. Although impact
assessments of new regulations are being applied
by all Member States, the methodology used, the
content and the level of detail vary significantly,
especially on the analysis of policy options and
stakeholder interests. Only a few Member States
(Belgium, Denmark, Finland, Germany, Poland,
Slovenia, Sweden and the United Kingdom) have
integrated an SME test into their national decision-
making approach.129
Austria, France and the United
Kingdom have recently taken steps to improve their
impact assessment systems.
Policy example: ‘One-in, two-out’ in the United
Kingdom
To reduce the number of new regulations for
businesses, the government has operated a ‘one-in,
two-out’ rule since January 2013. Every new
regulation that imposes a new quantifiable burden
on firms must be offset by removing or modifying
an existing regulation to save double the costs.
126
http://ec.europa.eu/governance/better_regulation/documen
ts/com_2013_en.pdf 127 Some EU legislation leaves it to each Member State to
decide whether it wants to introduce lighter regimes for
SMEs, for example in the area of information and consultation of workers, food hygiene, waste and annual
accounts. 128 COM(2013) 122 final,
http://ec.europa.eu/governance/better_regulation/documen
ts/1_EN_ACT_part1_v4.pdf. 129 COM(2011) 78 final http://eur-
lex.europa.eu/LexUriServ/LexUriServ.do?uri=COM:2011
:0078:FIN:en:PDF.
This rule applies to all domestic regulations
affecting businesses and voluntary organisations.
This policy replaces the ‘one-in, one-out’ rule that
was effective from January 2011 and which saw
net costs for business reduced by almost GBP 1
billion.
3.3.3.4 E-government
Although the eight basic business-related e-
government services have been available in half of
the Member States, many continue to expand their
use of e-government (Austria, Croatia, Cyprus, the
Czech Republic, Germany, Ireland, Latvia, Poland,
Portugal, Slovenia and the United Kingdom), and
have focused on the use of information and
communication technologies (ICT) to reduce
administrative burden. Points of single contact
enable businesses to complete procedures easily.
Austria is implementing an online business service
portal to reduce administrative costs by about
EUR 200 million and has created points of single
contact that help service providers to establish a
business in Austria or to provide cross-border
services into Austria.
While most Member States have now e-enabled
some government services for businesses (social
contributions, VAT and corporate tax declarations),
more advanced service provision is lagging behind.
This includes the use of information technology in
courts for case management and communication
with parties.130
Procedures linked to business
services are not always easily available.131
A
further challenge is the low take-up by SMEs.132
More interactive and transactional e-government
requires reorganising services to get them online,
and using common technical platforms and data
exchanges. As an example, Denmark has made
digital reporting and processing mandatory at all
government levels by 2015. In the United
Kingdom, all information or transactional services
must be ‘digital by default’ by 2015.
130 The EU Justice Scoreboard 2013. 131 Eurostat — Community survey on ICT usage and e-
Commerce in enterprises (2011). 132 According to Eurostat (see footnote 1), 85 % of small
businesses in the EU used the internet to communicate
with public authorities in 2012. Internet use by small
businesses for communications with public authorities is
below the EU average in Bulgaria, Germany, Hungary,
Italy and Spain. Romania lags behind all other EU countries (59 %, 18 percentage points below the second
last).

Overview of progress by policy area in Member States
81
3.3.3.5 Innovation in public
administration
The results of the 2013 pilot European Public
Sector Innovation Scoreboard show that innovation
in public administration has positive effects on user
access to information, user satisfaction and faster
delivery of services. Although the public sector in
Europe is innovative, it does face a number of
obstacles. The majority of innovations have been in
relation to services and to communication with
users. Management systems, organising work and
decision-making have also been improved in many
public organisations.
Figure 3.5: Incidence of innovations in public administrations, by type (%)
Sources: European Public Sector Innovation Scoreboard 2013 based on Innobarometer 2010 (A pilot exercise)
http://ec.europa.eu/enterprise/policies/innovation/files/epsis-2013_en.pdf
Public procurement can also contribute to increased
efficiency in the government sector. Overall, almost
24 % of EU companies have sold innovative
products and services to the public sector since
2009. The countries that see high levels of
innovation in public procurement are Denmark
(49 % of companies), Cyprus (48 %) and Malta
(40 %), while Hungary has only 1 % of companies
selling innovative products or services to the public
sector.
Figure 3.6: Government procurement as driver of business innovation
Sources: European Public Sector Innovation Scoreboard (2013) based on Innobarometer 2010
0% 10% 20% 30% 40% 50% 60% 70%
First time commercialisation (for sale) of services or goods
New or improved delivery or logistics systems for your
inputs
New or improved management systems
New or improved methods of organising work
responsibilities or decision making
New or improved methods of influencing the behaviour of
users, citizens or others
New or improved supporting activities such as maintenance
systems, purchasing, accounting, or computing systems, etc
New or improved methods of promoting your organisation
or your services
New or improved methods of providing services or
interacting with your users
New or improved services
49%
48%
42%
40%
33%
33%
33%
30%
29%
25
%
23%
22%
21%
21%
20%
19%
19%
18%
17%
17%
14%
13%
12%
12%
10%
4%
1%
51%
51%
58%
59%
64%
64%
65%
48%
68%
72%
77%
77%
75%
76%
79%
81%
78%
79%
82%
78%
84%
85%
85%
88%
87%
96%
99%
0%
1%
0%
1%
3%
3%
2%
22%
3%
3%
0%
1%
4%
3%
1%
0%
3%
3%
1%
5%
2%
2%
3%
0%
3%
0%
0%
0%
10%
20%
30%
40%
50%
60%
70%
80%
90%
100%
DK CY MT ES PT IT AT EE SE DE FI CZ UK NL LU LV IE SI PL FR LT SK RO BG BE HR HU
Yes No Don't Know EU
Overview of progress by policy area in Member States
82
In Spain, public authorities must spend 3 % of their
budgets on innovative products and services.
France has set an indicative objective of 2 % of
total public procurement to be purchased from
innovative SMEs by 2020. Italy began a
programme in 2013 for innovation procurement in
southern regions while Germany launched a support
programme for public procurers of innovation in
early 2013.
3.3.3.6 State-owned enterprises
State-owned enterprises are facing a difficult
operating environment and cannot always rely on
support from the state. Governance challenges also
arise from undue political interference. Several
Member States have addressed problems through
capital injections, writing off debts, restructuring or
privatisation.133
Strengthening the corporate
governance of state-owned enterprises, in particular
by separating the state’s ownership and regulatory
functions, has also been pursued by Cyprus,
Lithuania, Portugal, Romania and Slovenia.
Policy example: Strengthening corporate
governance of state-owned enterprises in Lithuania
In 2011, Lithuania had 149 state-owned enterprises
employing 40 000 people, with revenue of EUR 2
billion and a net profit of EUR 32 million. An
ambitious reform programme to improve corporate
governance was launched in 2010. Features of the
programme included: attracting private sector
professionals; linking pay to performance;
increasing transparency (e.g. through quarterly
reports); separating ownership and regulatory
functions; and setting clear objectives on
performance and financial results. The reform is
being implemented following OECD guidelines on
the management of state-owned enterprises; and
setting clear objectives on performance and
financial results. The reform is being implemented
following OECD guidelines on the management of
state-owned enterprises.
133 European Commission Staff Working Document
Guidance Paper on state aid-compliant financing, restructuring and privatisation of State-owned
enterprises, SWD(2012) 14 final.
3.3.4 Reducing administrative burden
The EU had a goal to reduce the start-up time and
costs for new businesses — to three days and
EUR 100 — by 2012. A target was also set for the
time needed to obtain licences: a maximum of three
months by the end of 2013 and one month by the
end of 2015.134
However, there are still large differences between
Member States. The average time to start a business
in the EU is close to 14 days and the average cost is
5 % of income per capita. The time is shortest in
Belgium, the Netherlands and Portugal whereas
Malta and Spain score less well. The cost is lowest
in Denmark, Ireland and Slovenia with Greece and
Italy performing less well.
Policy example: Simplifying industrial licensing in
Portugal
Portugal is implementing a comprehensive
programme to tackle excessive licensing
procedures. The new industrial licensing regime
classifies industries in three groups according to the
risk they pose to citizens and the environment.
Those in the low or medium category (more than
90 % of all industries) will be subject to a system of
ex-ante declaration with ex-post control. At the
same time, licensing procedures for industries in the
highest category will be speeded up.
The time and costs to start a business have
improved over last the five years.135
Thirteen
Member States have cut the time needed to start a
company and start-up costs have gone down in 22
Member States. Although there has been progress
in the EU, other countries have been improving
their business environment at an even faster rate.
134 SBA Action Plan (SBA Fact Sheet 2012). 135
World Bank, Doing Business report (2013).

Overview of progress by policy area in Member States
83
Figure 3.7: Time and cost required to start a company
Source: World Bank – Doing Business (2013)
Many Member States, including Denmark, France,
Hungary, Malta, the Netherlands, Slovenia and
Spain, have reduced administrative burdens on
businesses. These programmes cover issues such as
property registration, declarations to authorities,
and ‘one-in, one-out’ rules.
Policy example: ‘Express licence’ for retail outlets
in Spain
In 2012, Spain launched an express licence regime
for retail outlets. This permits retail businesses of
up to 300 m2 to start operating without any local
authorisation. Instead, businesses only have to
provide the administration with a declaration
confirming their compliance with relevant
legislation and requirements. The government now
plans to extend this regime to businesses of up to
500 m2.
3.3.5 Facilitating tax payments
The time firms spend on complying with tax rules
is driven by the number and complexity of taxes
and the administrative procedures used to calculate
and pay them. Electronic filing of VAT and social
contributions is used by more than 70 % of firms,136
and by 54 % for corporate tax.
136 Eurostat — Community survey on ICT usage and e-
Commerce in enterprises (2011).
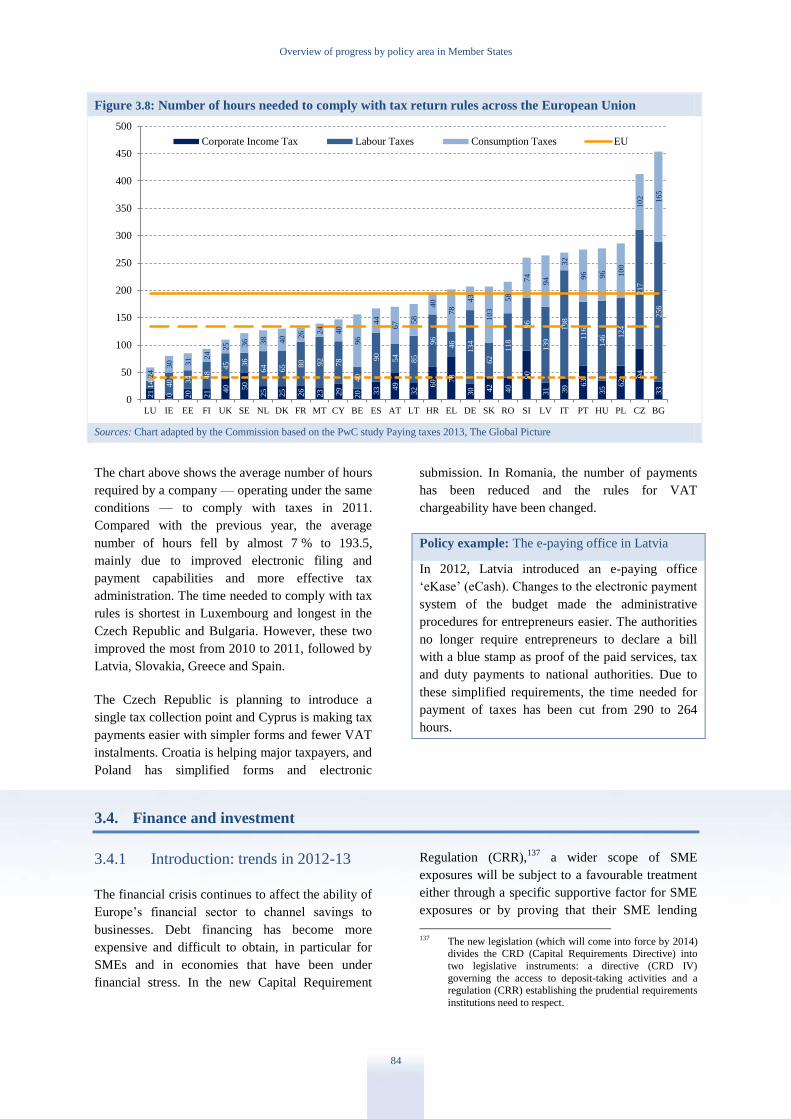
Overview of progress by policy area in Member States
84
Figure 3.8: Number of hours needed to comply with tax return rules across the European Union
Sources: Chart adapted by the Commission based on the PwC study Paying taxes 2013, The Global Picture
The chart above shows the average number of hours
required by a company — operating under the same
conditions — to comply with taxes in 2011.
Compared with the previous year, the average
number of hours fell by almost 7 % to 193.5,
mainly due to improved electronic filing and
payment capabilities and more effective tax
administration. The time needed to comply with tax
rules is shortest in Luxembourg and longest in the
Czech Republic and Bulgaria. However, these two
improved the most from 2010 to 2011, followed by
Latvia, Slovakia, Greece and Spain.
The Czech Republic is planning to introduce a
single tax collection point and Cyprus is making tax
payments easier with simpler forms and fewer VAT
instalments. Croatia is helping major taxpayers, and
Poland has simplified forms and electronic
submission. In Romania, the number of payments
has been reduced and the rules for VAT
chargeability have been changed.
Policy example: The e-paying office in Latvia
In 2012, Latvia introduced an e-paying office
‘eKase’ (eCash). Changes to the electronic payment
system of the budget made the administrative
procedures for entrepreneurs easier. The authorities
no longer require entrepreneurs to declare a bill
with a blue stamp as proof of the paid services, tax
and duty payments to national authorities. Due to
these simplified requirements, the time needed for
payment of taxes has been cut from 290 to 264
hours.
3.4. Finance and investment
3.4.1 Introduction: trends in 2012-13
The financial crisis continues to affect the ability of
Europe’s financial sector to channel savings to
businesses. Debt financing has become more
expensive and difficult to obtain, in particular for
SMEs and in economies that have been under
financial stress. In the new Capital Requirement
Regulation (CRR),137
a wider scope of SME
exposures will be subject to a favourable treatment
either through a specific supportive factor for SME
exposures or by proving that their SME lending
137 The new legislation (which will come into force by 2014)
divides the CRD (Capital Requirements Directive) into
two legislative instruments: a directive (CRD IV)
governing the access to deposit-taking activities and a regulation (CRR) establishing the prudential requirements
institutions need to respect.
21
10
20
21 40
50
25
25
26
23
29
20
33 49
32 60 78
30
42
40
90
31
39 63
35 62 9
4
33 14
40
34 48 4
5
36
64
65 80
92
78
40
90
54
85
96
46
134
62
118
96
139
198
116
146 124
217
256
24 3
0
31 24 2
5
36
38
40 26 24
40
96
44
67 58
40
78
43
103
58
74
94
32
96
96
100
102
165
0
50
100
150
200
250
300
350
400
450
500
LU IE EE FI UK SE NL DK FR MT CY BE ES AT LT HR EL DE SK RO SI LV IT PT HU PL CZ BG
Corporate Income Tax Labour Taxes Consumption Taxes EU

Overview of progress by policy area in Member States
85
policies have a lower loss history, leading to a
lower risk weighting.
Even though lack of access to finance has
dampened domestic investment, the EU remains the
largest destination for global foreign direct
investment (FDI) flows, explained by the size of the
EU market, its openness and the economic
integration among Member States. However, over
the past decade, the share of global FDI destined for
the EU has declined substantially.
3.4.2 Moving towards market-based finance
Figure 3.9: Financial obstacles of SMEs for receiving a bank loan across Euro Area Countries
Source: ECB
As described in section 1.3.1, access to finance
remains difficult for businesses in many Member
States, as they have been severely affected by the
tightening of bank lending.138
These difficulties are
exacerbated for SMEs, as they are more dependent
on external financing, and have fewer financing
alternatives through debt and equity markets.139
The
flow of new bank loans has dropped sharply in
many Member States. Although it is difficult to
separate these factors, there are indications that
supply factors have played a critical role in Member
138
Bank financing remains the most important source of
external financing for SMEs and the second source for
large corporations (after leasing & factoring). The
banking sector provides about 80 % of total debt financing to the non-financial private sector in the euro area,
compared with less than 50 % in the US. Source:
European Central Bank, Survey on the access to finance of SMEs in the euro area; European Commission, Quarterly
report on the euro area, volume 12 (2013) issue 1. 139
In 2012, SMEs reported a continued deterioration in the
availability of bank loans, overdrafts and credit lines.
However, the pace of this deterioration seems to have slowed in the second half of 2012. Cf. Survey on the
access to finance of SMEs in the euro area, ECB.
States under financial stress, such as Italy, Portugal,
Slovenia and Spain. Improvements in capital
market-based financing would seem necessary to
restore the flow of finance to the economy. While
public resources have been mobilised to ease access
to finance, their impact has been limited given the
sheer volume of bank lending, budgetary
constraints and the long-term nature of some
measures.
In its Survey on the Access to Finance of Small and
Medium-Sized Enterprises, the ECB reported a
decrease in the percentage of Eurozone's companies
facing financing problems for the period between
October 2012 and March 2013. However, the
differences across Euro Area member States are
stark: while German SMEs were experiencing a
continuous softening in bank lending conditions, in
other countries the percentage of SMEs facing
financing obstacles reached 51 % in Spain and
64 % in Greece in the period between October 2012
and March 2013.
0
10
20
30
40
50
60
70
80
Greece Spain Italy France Germany EA
Mar-11 Sep-11 Mar-12 Sep-12 Mar-13Mar-13
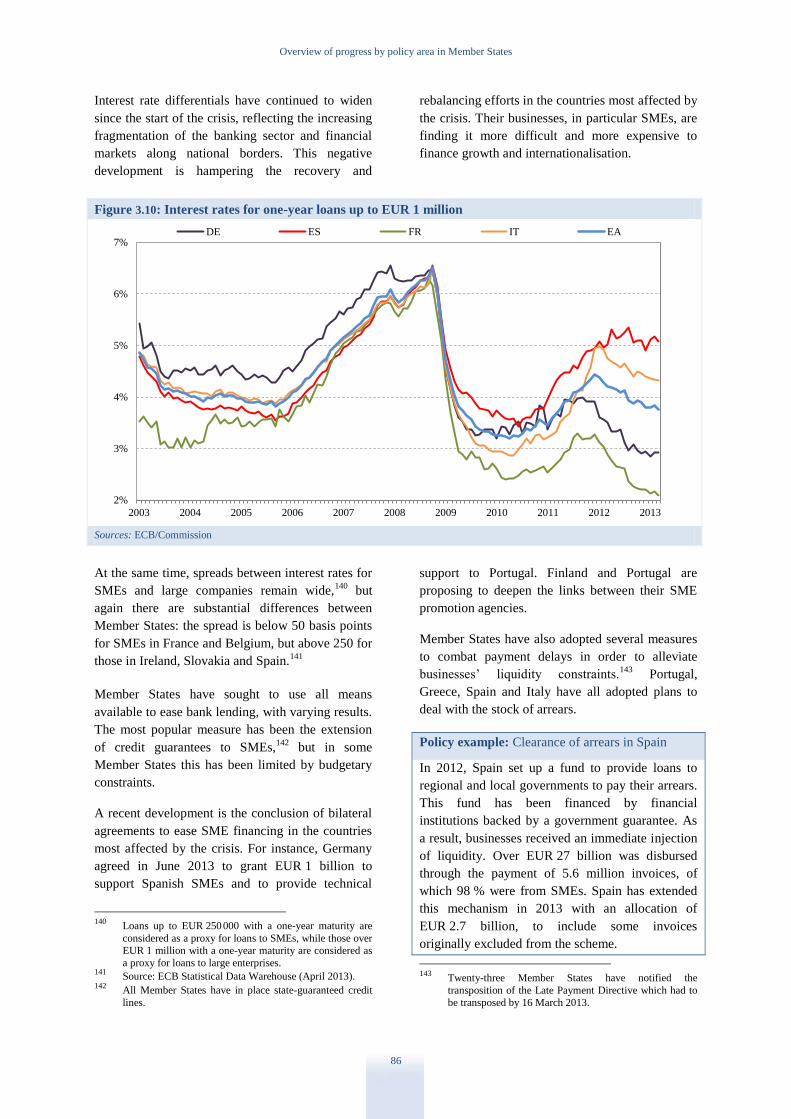
Overview of progress by policy area in Member States
86
Interest rate differentials have continued to widen
since the start of the crisis, reflecting the increasing
fragmentation of the banking sector and financial
markets along national borders. This negative
development is hampering the recovery and
rebalancing efforts in the countries most affected by
the crisis. Their businesses, in particular SMEs, are
finding it more difficult and more expensive to
finance growth and internationalisation.
Figure 3.10: Interest rates for one-year loans up to EUR 1 million
Sources: ECB/Commission
At the same time, spreads between interest rates for
SMEs and large companies remain wide,140
but
again there are substantial differences between
Member States: the spread is below 50 basis points
for SMEs in France and Belgium, but above 250 for
those in Ireland, Slovakia and Spain.141
Member States have sought to use all means
available to ease bank lending, with varying results.
The most popular measure has been the extension
of credit guarantees to SMEs,142
but in some
Member States this has been limited by budgetary
constraints.
A recent development is the conclusion of bilateral
agreements to ease SME financing in the countries
most affected by the crisis. For instance, Germany
agreed in June 2013 to grant EUR 1 billion to
support Spanish SMEs and to provide technical
140
Loans up to EUR 250 000 with a one-year maturity are
considered as a proxy for loans to SMEs, while those over
EUR 1 million with a one-year maturity are considered as
a proxy for loans to large enterprises. 141
Source: ECB Statistical Data Warehouse (April 2013). 142
All Member States have in place state-guaranteed credit
lines.
support to Portugal. Finland and Portugal are
proposing to deepen the links between their SME
promotion agencies.
Member States have also adopted several measures
to combat payment delays in order to alleviate
businesses’ liquidity constraints.143
Portugal,
Greece, Spain and Italy have all adopted plans to
deal with the stock of arrears.
Policy example: Clearance of arrears in Spain
In 2012, Spain set up a fund to provide loans to
regional and local governments to pay their arrears.
This fund has been financed by financial
institutions backed by a government guarantee. As
a result, businesses received an immediate injection
of liquidity. Over EUR 27 billion was disbursed
through the payment of 5.6 million invoices, of
which 98 % were from SMEs. Spain has extended
this mechanism in 2013 with an allocation of
EUR 2.7 billion, to include some invoices
originally excluded from the scheme.
143
Twenty-three Member States have notified the
transposition of the Late Payment Directive which had to
be transposed by 16 March 2013.
2%
3%
4%
5%
6%
7%
20132012201120102009200820072006200520042003
DE ES FR IT EA

Overview of progress by policy area in Member States
87
As countries have injected funds to recapitalise
their banking sectors,144
this should free the banks
to resume lending, although it will take time to see
the full effects of these measures. Meanwhile, other
initiatives are being taken to expand lending. Last
year, for example, the UK introduced an innovative
scheme whereby banks and building societies that
increase lending to households and businesses are
able to borrow from the Bank of England at less
than market rates. Furthermore, new state-owned
financial institutions, with a mandate to support
lending to SMEs, are being launched in France and
the UK.
In parallel, growing attention is being paid to the
potential role of SME loan securitisation145
in
unlocking credit supply. This market has been
dormant since 2007146
although the securities issued
have performed relatively well during the crisis and
have had low default rates.147
In addition to
reviewing the details of regulatory treatment, other
measures may help revive investors’ interest and
confidence. Spain, for example, is planning to
guarantee the availability of securitisation funds for
loans to SMEs.
3.4.3 Alternative financing mechanisms
In periods of bank financing constraints, the ability
of businesses to find alternative sources of
financing could be an important mitigating factor.
However, only the largest firms in Europe have
been able to tap the capital markets to meet their
financing requirements. The market for less
creditworthy borrowers, especially SMEs, has been
extremely thin, leaving them with fewer
alternatives.
Many Member States, such as Denmark, Estonia,
Italy and Portugal, are trying to support the
development of a corporate bond market. However,
the issuance of standard corporate bonds is a viable
144
In addition to the countries covered by programmes, other
Member States have injected funds to recapitalise their
banking sectors since the start of the crisis. These include Denmark, Italy, Sweden and the United Kingdom.
145 Securitisation is the transfer of a portfolio of assets from a
bank — or any other financial institution or corporation
— to the capital market. 146
Overall securitisation activity has been high during the
crisis, but volumes were almost exclusively due to the eligibility of asset backed securities (ABS) as collateral
for ECB liquidity operations. 147
European Investment Fund, European small business
finance outlook, December 2012.
alternative only for firms with an external rating
and large borrowing needs.148
This excludes the
majority of SMEs.
Furthermore, for SMEs at the early stages of their
development, there seems to be a constant structural
‘equity gap’ in the market for financing, aggravated
by the deteriorating economic outlook and the
sovereign debt crisis.149
In times of stress, private
investors and fund managers tend to focus on
fewer, larger investments in established businesses,
leaving small businesses with growth potential
without access to equity finance.
The average European venture capital fund is still
too small to make a real impact and to nurture firms
through the necessary financing rounds.150
To help
venture capital markets to develop, most Member
States have put measures in place, in particular
setting up venture capital funds with public
funding. For example, the Czech Republic,
Germany and Spain are launching new public
venture capital funds, while Portugal has
consolidated existing funds in order to maximise
their impact. In addition, various Member States,
including Estonia, the Netherlands, Poland and
Spain, are setting up ‘funds of funds’ to promote
the emergence of a true venture capital market with
numerous privately managed venture capital funds.
France has announced a five-year tax relief for
148
In view of the fixed transaction costs involved when
tapping market financing, the issuance of a bond requires a minimum amount to make economic sense.
149 The amount of venture capital as a percentage of GDP has
fallen in most Member States, although there are
significant differences between countries. The situation is
especially acute in Bulgaria, Greece and Slovakia. At EU level, in 2012, the total amount of venture capital raised
(EUR 3.6 billion) and the amount of investment (EUR 3.2
billion) fell on an annual basis, by 31 % and 14 % respectively. As regards exits, trade sale, write-off and
sale to another private equity firm were the three most
prominent types; Initial Public Offerings (IPOs) were almost non-existent. Source: Eurostat, European Private
Equity and Venture Capital Association (EVCA), 2012
Pan-European Private Equity and Venture Capital Activity.
150 Economic studies show that venture capital funds can
make a real difference to the industries they invest in once
their size reaches approximately EUR 280 million,
whereas the average venture capital fund in the EU has
approximately EUR 60 million. See Josh Lerner, Yannis
Pierrakis, Liam Collins and Albert Bravo Biosca, Atlantic
Drift — Venture Capital performance in the UK and the
US, NESTA research report June 2011, see section 4.1; K.
Raade and C.T. Machado, Recent developments in the
European private equity markets, Economic Papers 319,
April 2008.
Overview of progress by policy area in Member States
88
equity investments in start-ups. Since 2013, a new
programme in Germany has provided private
investors — particularly business angels — with
additional financial incentives to invest in young
and innovative companies.
Recent years have also seen the emergence of stock
markets specialised in listing SMEs and high
growth companies, such as New Connect in Poland
and MAB (Mercado Alternativo Bursatil) in Spain.
France is also planning to launch a stock market
specifically for SMEs in 2013. However, the impact
of these stock markets has been limited by their
size, lack of liquidity, and the costs and
requirements associated with listing. Some
countries, such as Spain, are trying to ease these
requirements in order to promote SME listings. The
SME growth market labelling proposed by the
Commission151
should raise the visibility of SMEs
and profile and help lead to common pan European
regulatory standards for such markets.
Finally, crowdfunding152
— an expanding field of
internet-based financing of new projects still in its
infancy — could help businesses to raise capital or
secure loans to supplement traditional funding
sources. Given the variety of funding mechanisms
on offer and the nascent form of the models, the
regulation of crowdfunding is work in progress.
Austria recently proposed limited changes to its
legal framework to facilitate crowdfunding, Italy is
adopting an equity crowdfunding law and the UK is
regulating peer-to-peer lending.
Policy example: Crowdfunding for innovative
start-ups in Italy
Italy has been one of the first countries to adopt a
new law on crowdfunding for equity. In particular,
the new regulation ‘Decreto Crescita 2.0’
introduces ‘equity crowdfunding’ for innovative
start-ups. It allows raising limited risk capital
through online portals managed by banks,
investment firms and other registered financial
intermediaries.
151 Part of the Commission’s MiFID proposal; see 3.4.2. 152 Crowdfunding can be defined as the collective effort of
many individuals who network and pool their resources to
support efforts initiated by other people or organisations.
This is usually done with the help of the internet.
Individual projects and businesses are financed by small
contributions from a large number of individuals, allowing innovators, entrepreneurs and business owners to
utilise their social networks to raise capital.
3.4.4 Attracting foreign direct
investment
FDI in Europe has concentrated on business
services, the software industry and the automotive
sector. These sectors topped the lists for numbers of
FDI projects and jobs created.153
Measures to facilitate FDI include investment
promotion and incentives, and Member States’
investment promotion agencies providing project
planning assistance for firms seeking investment. In
particular, when domestic investment is low, FDI is
considered essential for employment, growth and
productivity. For many countries, further benefits
include transfers of technology and skills.
Policy example: Slovakia’s focus on investments
The Slovak Investment and Trade Development
Agency (SARIO) seeks to attract new investment in
sectors with higher value added. The focus of the
agency has shifted towards fast-growing markets
such as Russia, China, South Korea and south-east
Asia. In line with the objective of Slovakia’s
cohesion policy, FDI support programmes favour
the less developed eastern regions of Slovakia.
To help Member States attract FDI successfully, a
study on the exchange of good practice154
identified
three key ingredients in building good policies:
successful targeting of FDI activities; better
cooperation among investment promotion actors;
and more efficient working methods and internal
organisation.
Experience shows that investment promotion
agencies can enhance their effectiveness and
efficiency by devoting resources to a limited set of
sectors and countries. A study has clearly
demonstrated a link between targeting sectors and
increased FDI inflows. The importance of an
overarching investment strategy, endorsed by key
stakeholders, was also highlighted as contributing
to success in attracting FDI.
153 http://www.ey.com/GL/en/Issues/Business-
environment/2011-European-attractiveness-survey 154 Exchange of good practice in foreign direct investment
promotion, Ecorys 2013.
http://ec.europa.eu/enterprise/policies/industrial-competitiveness/monitoring-member-states/good-
practice/index_en.htm
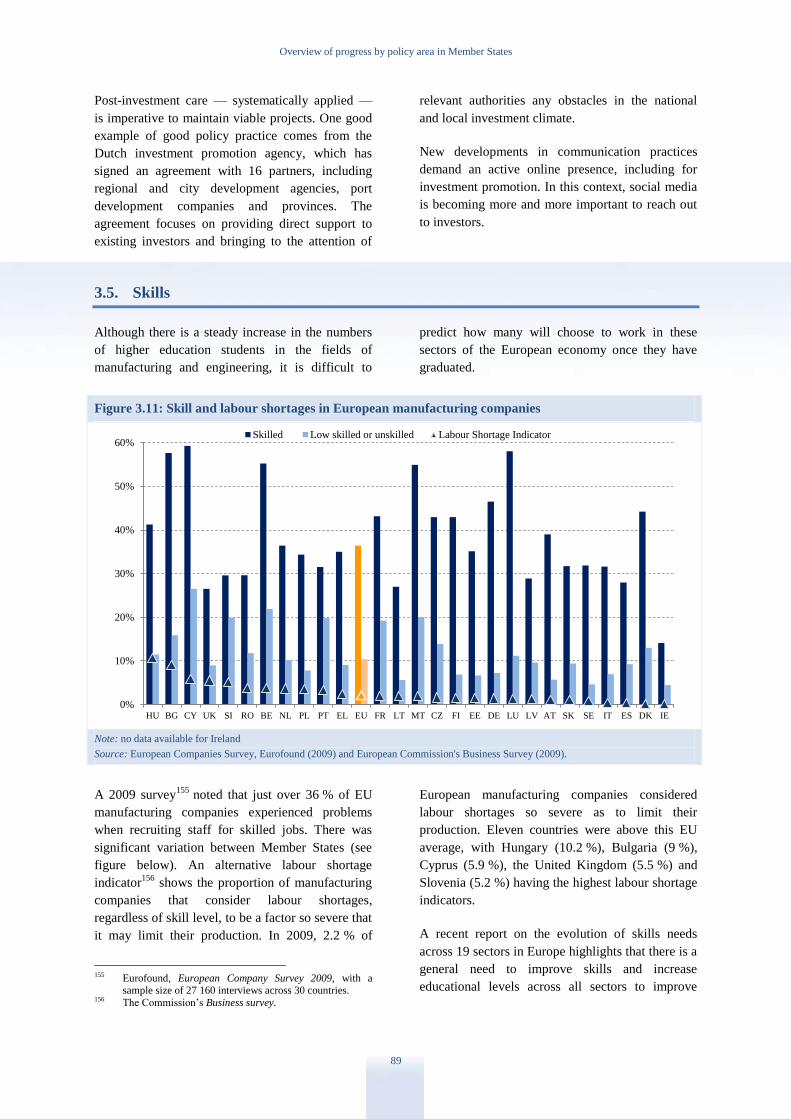
Overview of progress by policy area in Member States
89
Post-investment care — systematically applied —
is imperative to maintain viable projects. One good
example of good policy practice comes from the
Dutch investment promotion agency, which has
signed an agreement with 16 partners, including
regional and city development agencies, port
development companies and provinces. The
agreement focuses on providing direct support to
existing investors and bringing to the attention of
relevant authorities any obstacles in the national
and local investment climate.
New developments in communication practices
demand an active online presence, including for
investment promotion. In this context, social media
is becoming more and more important to reach out
to investors.
3.5. Skills
Although there is a steady increase in the numbers
of higher education students in the fields of
manufacturing and engineering, it is difficult to
predict how many will choose to work in these
sectors of the European economy once they have
graduated.
Figure 3.11: Skill and labour shortages in European manufacturing companies
Note: no data available for Ireland
Source: European Companies Survey, Eurofound (2009) and European Commission's Business Survey (2009).
A 2009 survey155
noted that just over 36 % of EU
manufacturing companies experienced problems
when recruiting staff for skilled jobs. There was
significant variation between Member States (see
figure below). An alternative labour shortage
indicator156
shows the proportion of manufacturing
companies that consider labour shortages,
regardless of skill level, to be a factor so severe that
it may limit their production. In 2009, 2.2 % of
155 Eurofound, European Company Survey 2009, with a
sample size of 27 160 interviews across 30 countries. 156 The Commission’s Business survey.
European manufacturing companies considered
labour shortages so severe as to limit their
production. Eleven countries were above this EU
average, with Hungary (10.2 %), Bulgaria (9 %),
Cyprus (5.9 %), the United Kingdom (5.5 %) and
Slovenia (5.2 %) having the highest labour shortage
indicators.
A recent report on the evolution of skills needs
across 19 sectors in Europe highlights that there is a
general need to improve skills and increase
educational levels across all sectors to improve
0%
10%
20%
30%
40%
50%
60%
HU BG CY UK SI RO BE NL PL PT EL EU FR LT MT CZ FI EE DE LU LV AT SK SE IT ES DK IE
Skilled Low skilled or unskilled Labour Shortage Indicator
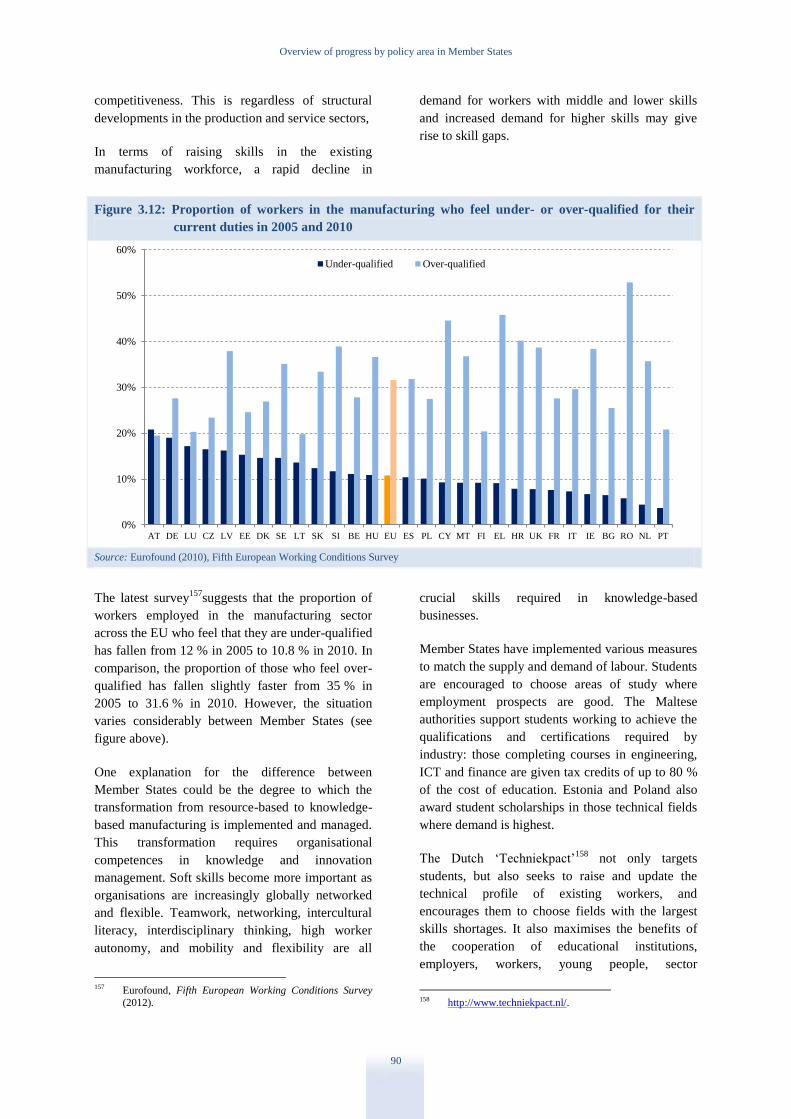
Overview of progress by policy area in Member States
90
competitiveness. This is regardless of structural
developments in the production and service sectors,
In terms of raising skills in the existing
manufacturing workforce, a rapid decline in
demand for workers with middle and lower skills
and increased demand for higher skills may give
rise to skill gaps.
Figure 3.12: Proportion of workers in the manufacturing who feel under- or over-qualified for their
current duties in 2005 and 2010
Source: Eurofound (2010), Fifth European Working Conditions Survey
The latest survey157
suggests that the proportion of
workers employed in the manufacturing sector
across the EU who feel that they are under-qualified
has fallen from 12 % in 2005 to 10.8 % in 2010. In
comparison, the proportion of those who feel over-
qualified has fallen slightly faster from 35 % in
2005 to 31.6 % in 2010. However, the situation
varies considerably between Member States (see
figure above).
One explanation for the difference between
Member States could be the degree to which the
transformation from resource-based to knowledge-
based manufacturing is implemented and managed.
This transformation requires organisational
competences in knowledge and innovation
management. Soft skills become more important as
organisations are increasingly globally networked
and flexible. Teamwork, networking, intercultural
literacy, interdisciplinary thinking, high worker
autonomy, and mobility and flexibility are all
157 Eurofound, Fifth European Working Conditions Survey
(2012).
crucial skills required in knowledge-based
businesses.
Member States have implemented various measures
to match the supply and demand of labour. Students
are encouraged to choose areas of study where
employment prospects are good. The Maltese
authorities support students working to achieve the
qualifications and certifications required by
industry: those completing courses in engineering,
ICT and finance are given tax credits of up to 80 %
of the cost of education. Estonia and Poland also
award student scholarships in those technical fields
where demand is highest.
The Dutch ‘Techniekpact’158
not only targets
students, but also seeks to raise and update the
technical profile of existing workers, and
encourages them to choose fields with the largest
skills shortages. It also maximises the benefits of
the cooperation of educational institutions,
employers, workers, young people, sector
158 http://www.techniekpact.nl/.
0%
10%
20%
30%
40%
50%
60%
AT DE LU CZ LV EE DK SE LT SK SI BE HU EU ES PL CY MT FI EL HR UK FR IT IE BG RO NL PT
Under-qualified Over-qualified
Overview of progress by policy area in Member States
91
associations, regions and central government. Such
models are also becoming more common
elsewhere.
Cooperation between the public and private sectors
is particularly evident in the case of traineeships,
apprenticeships and vocational training, where
many Member States have introduced reforms and
action plans to increase the involvement of
employers. The goal is to increase the matching of
vocational training provision with the skills needed
in the market. Greece, Italy, Poland, Portugal and
Slovakia have all introduced measures to this effect.
A dual education system that combines
apprenticeships in a firm with education at a
vocational school has proven to be very effective,
particularly in Germany, and is being introduced or
strengthened in other countries, including Cyprus
and Spain.
Another way of achieving similar results is the UK
‘Employer Ownership of Skills’ pilot, where the
government and employers pool resources to raise
the skills of employees, having for effect that
education providers will in turn become more
attentive to the needs of the economy.
For its part, Ireland is seeking to address skills
shortages in the ICT sector and aims to double the
number of graduates in this sector by 2018. It is
also providing reskilling and conversion
programmes for workers with qualifications and
skills in related disciplines. Currently 55 % of ICT
posts are filled by non-nationals, which is a quick
fix solution compared to producing new graduates.
To attract highly-skilled migrants, Austria has
introduced the Red-White-Red Card, and Estonia
has simplified procedures for hiring foreign
workers. These solutions are, however, only
feasible when the political conditions are right, and
even then the actual numbers attracted can remain
small.
Emerging skill shortages are becoming an
increasing concern in Germany. An initiative on
skills159
recognises that mobilising domestic labour
potential will not be sufficient to address these
shortages. The long-term success of the German
economy will therefore depend on the ability to
attract skilled workers from other EU and non-EU
countries, and a wide range of policy measures are
already being taken at both federal and regional
levels
Member States are also seeking to provide doctoral
candidates with the skills they need for careers in
business in line with the ‘Principles for Innovative
Doctoral Training’. Denmark has inspired the
introduction of ‘European Industrial Doctorates’ of
the Marie Sklodowska Curie Actions under the
Seventh Framework Programme.
159 Bundesarbeitsagentur Perspektive 2025: Fachkräfte für
Deutschland, http://www.arbeitsagentur.de.
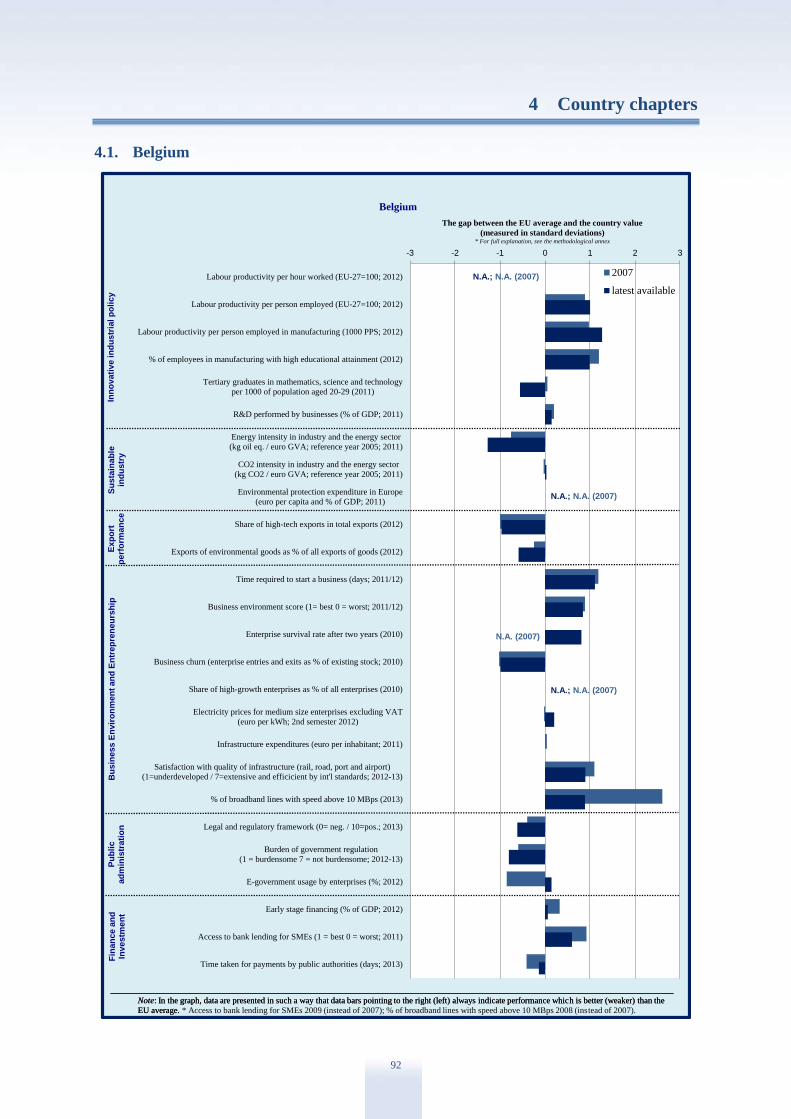
92
4 Country chapters
4.1. Belgium
-3 -2 -1 0 1 2 3
Labour productivity per hour worked (EU-27=100; 2012)
Labour productivity per person employed (EU-27=100; 2012)
Labour productivity per person employed in manufacturing (1000 PPS; 2012)
% of employees in manufacturing with high educational attainment (2012)
Tertiary graduates in mathematics, science and technology
per 1000 of population aged 20-29 (2011)
R&D performed by businesses (% of GDP; 2011)
Energy intensity in industry and the energy sector
(kg oil eq. / euro GVA; reference year 2005; 2011)
CO2 intensity in industry and the energy sector
(kg CO2 / euro GVA; reference year 2005; 2011)
Environmental protection expenditure in Europe
(euro per capita and % of GDP; 2011)
Share of high-tech exports in total exports (2012)
Exports of environmental goods as % of all exports of goods (2012)
Time required to start a business (days; 2011/12)
Business environment score (1= best 0 = worst; 2011/12)
Enterprise survival rate after two years (2010)
Business churn (enterprise entries and exits as % of existing stock; 2010)
Share of high-growth enterprises as % of all enterprises (2010)
Electricity prices for medium size enterprises excluding VAT
(euro per kWh; 2nd semester 2012)
Infrastructure expenditures (euro per inhabitant; 2011)
Satisfaction with quality of infrastructure (rail, road, port and airport)
(1=underdeveloped / 7=extensive and efficicient by int'l standards; 2012-13)
% of broadband lines with speed above 10 MBps (2013)
Legal and regulatory framework (0= neg. / 10=pos.; 2013)
Burden of government regulation
(1 = burdensome 7 = not burdensome; 2012-13)
E-government usage by enterprises (%; 2012)
Early stage financing (% of GDP; 2012)
Access to bank lending for SMEs (1 = best 0 = worst; 2011)
Time taken for payments by public authorities (days; 2013)
The gap between the EU average and the country value
(measured in standard deviations)* For full explanation, see the methodological annex
Belgium
2007
latest available
Note: In the graph, data are presented in such a way that data bars pointing to the right (left) always indicate performance which is better (weaker) than the
EU average.
Inn
ovati
ve in
du
str
ial p
oli
cy
Su
sta
inab
lein
du
str
yB
usin
ess E
nvir
on
men
t an
d E
ntr
ep
ren
eu
rsh
ipF
inan
ce a
nd
Investm
en
t
Note: In the graph, data are presented in such a way that data bars pointing to the right (left) always indicate performance which is better (weaker) than the
EU average. * Access to bank lending for SMEs 2009 (instead of 2007); % of broadband lines with speed above 10 MBps 2008 (instead of 2007).
Ex
po
rtp
erf
orm
an
ce
Pu
bli
cad
min
istr
ati
on
N.A.; N.A. (2007)
N.A.; N.A. (2007)
N.A. (2007)
N.A.; N.A. (2007)

Country chapter: Belgium
93
Figure 4.1: Manufacturing sectors – Belgium (2010)
Note: No data available for sectors C12 (tobacco products), C15 (leather and related products), C21 (manufacture of basic pharmaceutical
products and pharmaceutical preparations)
Source: Eurostat
4.1.1 Introduction
In relation to manufacturing industry by individual
sector, Belgium is specialised in capital-intensive
industries, such as fabricated and base metals,
chemicals, food and electronic equipment. At the
more aggregated sector level, it is specialised in
sectors featuring medium-high educational and
innovation intensity, such as chemicals, petroleum
industries, and textiles. Overall, in 2012,
manufacturing produced 13.3 % of total value
added, as compared with the EU average of 15.3 %.
Belgium is more service-oriented than the average
EU economy, as services represent over 77 % of
value added (EU average: 73 %) and contribute
over 75 % of employment (EU average: 69.1 %).
While, in absolute terms, Belgium still has among
the highest productivity levels in the EU,
productivity growth has been weak in recent years.
In 2011, for instance, labour productivity declined
by 1.3 %, while the euro area as a whole increased
productivity by 1.2 %. However, the average
number of hours worked per person in Belgium was
higher than the EU average.
Given Belgium’s low productivity growth,
emphasis should be placed on factors promoting
non-cost competitiveness such as infrastructure,
innovation and human capital.160
In terms of
infrastructure, Belgium would benefit greatly from
effective measures to reduce road congestion which
is a considerable burden on the Belgian economy.
With regard to innovation, the key challenge for
Belgium is to broaden its innovation base and to
strive for a broader distribution of business R&D
expenditure across a wider range of sectors.
Belgium has already a relatively qualified
workforce and its 2020 target for people aged 30-34
completing higher education is 47 %, which would
be a 3.1 percentage point increase compared to
2012. Nevertheless, the number of graduates in
science, mathematics, engineering and technology
is lower than the EU average and labour market
mismatch hampers growth. Measures have been
taken at federal, regional and community levels to
support professional training and increase linkages
between the education system and the business
sector.
160 SWD (2013) 351.
Food, beverages and
tobacco
14.32%
Textiles, apparel and
leather
2.83%
Wood, paper and
printing
6.12%
Chemicals, pharma,
petroleum, minerals
and rubber 25.03%
Metals
13.84%
Electronics, electrics
and machinery
13.52%
Cars and transport
6.67%
Other
3.72%
Country chapter: Belgium
94
4.1.2 Innovation, skills and
sustainability
Innovation
According to the Innovation Union Scoreboard
2013, Belgium is an ‘innovation follower’ with a
performance above the EU average. Its relative
strengths are in the indicator categories ‘open,
excellent and attractive research systems’, ‘linkages
and entrepreneurship’ and ‘innovators’. Relative
weaknesses are in ‘finance and support’ and
‘intellectual assets’.
The business enterprise sector, the main contributor
to R&D, reduced its investment from 1.51 % of
GDP in 2001 to 1.37 % in 2011, although this is still
above the EU average. This decrease was mainly
due to three factors: the economy becoming more
service-oriented;161
a reduction in R&D activities in
the telecommunications and chemicals (excluding
pharmaceuticals) sectors; and the shift of R&D
activities to other countries. Services are dominant
and are growing at a faster rate than manufacturing,
which would justify specific measures to improve
the knowledge intensity of the service sector.162
Despite a slightly positive trend since 2005,163
Belgium is unlikely to reach its 2020 R&D
expenditure target of 3 % of GDP. Business R&D is
highly concentrated in only a few sectors, and in a
small number of large companies and
multinationals.
A challenge for Belgium is how to speed up the
transition towards a more knowledge-intensive and
innovation-based economy by fully exploiting the
strengths of its research and innovation systems,
including by translating R&D results into
innovative products and services. This requires
further improving the support to clusters, and better
conditions for the growth of innovative firms.
Moreover, despite the availability of highly-
qualified human capital, there appears to be a
mismatch between labour demand and supply in
some sectors. Shortages of skilled professionals,
161 From 2000 to 2009, the services share under business
expenditure increased from 26 % to 33 %. 162 For details see “Research and Innovation performance in
EU Member States and Associated Countries, Innovation
Union progress at country level, 2013”. 163 In the period 2005 to 2012, private expenditure on
research and development (R&D) increased from 1.24 %
to 1.37 % of GDP. In the same period, public R&D
expenditure increased from 0.56 % to 0.65 % of GDP.
particularly in sciences and engineering, could
become a major barrier to improving the innovation
performance of the Belgian economy.
The authorities have acknowledged that innovation
is essential for productivity growth and for
improving the competitiveness of the economy.
This is reflected in budgetary decisions taken by all
political entities in recent years.164
Federal level
measures include a payroll tax incentive to decrease
R&D personnel costs and a tax credit to decrease
the costs of R&D investment, and more flexible
conditions for tax exemptions on royalty income
from patents.165
The Belgian regions have developed strategic
innovation approaches covering all major aspects of
a comprehensive innovation strategy. In the
Walloon region, the focus has been on supporting a
limited number of competitiveness poles (a cluster
approach); in 2012, EUR 40 million was allocated
to R&D projects on competitiveness clusters under
the ‘Plan Marshall 2.Vert’.166
New approaches
have been developed under the ‘Creative Wallonia’
programme to support market take-up of new
products and services (whether technology-based or
not), and the promotion of cultural and creative
industries. In the Flemish Region, a main driver of
research and innovation policy is to address major
economic and societal challenges through
innovation. For instance, five living-labs platforms
were set up to facilitate innovation in the area of
electric vehicles. In the Brussels Capital region, an
updated innovation strategy, including a ‘smart
specialisation’ approach, was launched in 2012.
The region is intending in 2013 to implement
innovation vouchers to support financing for
innovation. The communities and the regions
continue to support excellence in science and they
have increased participation in EU cooperation
initiatives such as joint programming or the
European Strategy Forum on Research
Infrastructures. Initiatives are developed to foster
better coordination of the efforts made by the
164 Public R&D budgets increased from EUR 2.29 billion in
2009 to EUR 2.47 billion in 2012. 165 The existence of a research centre constituting a separate
activity branch is no longer a condition to exempt 80 % of
royalty income from patents. 166 Plan Marshall 2.Vert is an action plan to take up the
economic, social and environmental challenges facing
Wallonia, with a budget of EUR 2.75 billion for the
period 2009-14.
Country chapter: Belgium
95
communities, regions and federal government on
R&D, and technological innovation.
Skills
Although participation in higher education is high,
and while Belgium pursues ambitious targets in this
field, there are skills mismatches in terms of levels
and relevance to labour needs, which makes it more
difficult to tackle unemployment and support
growth. There are skills shortages for technical and
future-oriented occupations at all levels of
education. The number of graduates in science,
mathematics, engineering and technology is lower
than the EU average, as in 2010, there were 12.2
graduates per 1 000 in the age group 20-29
compared to 15.2 in the EU.
There are concerns on the level of entrepreneurship.
According to the latest Eurobarometer167
survey,
the proportion of people who would like to be self-
employed is lower than the EU average.168
Entrepreneurship readiness has been an issue for
some time, and policies will have to be maintained
to achieve a shift in attitudes, especially among
young potential entrepreneurs. Although there is a
need to increase occupational and interregional
mobility, adult participation in lifelong learning is
below the EU average (6.6 % vs. 9 % in 2012),
notably for older and low-skilled169
workers, and
has declined recently.
In Flanders, a project to reform secondary
education and vocational training was initiated in
2010. An agreement on an orientation note aiming
at a profound reform of secondary education was
reached in 2013 with the final decision to be taken
by 2016. The francophone community has also
taken measures to reform its vocational education,
with a draft decree on higher education
modernisation currently under debate.
Sustainability
The high energy use of industry and the low energy
efficiency performance of households make the
economy highly energy-intensive, although some
167 Flash Eurobarometer 354, 2012
http://ec.europa.eu/public_opinion/flash/fl_354_en.pdf. 168 At 30.4 % this figure is much lower thatn the EU average
of 45 %. 169 Learning participation rate of adults is 7.1 %, older
workers 3.9 %, and low-skilled 3.1 % - Eurostat 2011.
progress is being made in reaching the 2020 targets.
The target of increasing the share of renewable
energy in energy consumption is likely to be met
but probably not for greenhouse gas emissions in
sectors like buildings, transport and farming. Road
transport and energy are the largest sources of
greenhouse gases.
The high energy use of industry is explained by the
importance of energy-intensive metals and
chemicals production. These two activities
represent one-fifth of all industrial value added170
and consume almost two-thirds of all final energy
used in industry.
There is a series of measures on energy efficiency
that cover most sectors, with a particular focus on
the refurbishment of existing buildings. The
economy’s emissions intensity is high in some
significant sectors (such as heavy industry or
residential heating), but this is mitigated overall by
the importance of nuclear energy production. In
particular, emissions from road transport have
increased over the past two decades, whereas most
other sectors have cut emissions. In 2010, road
transport produced 17.7 % of all greenhouse gas
emissions, indicating that it should be a central part
of future emission reduction policies.
4.1.3 Export performance
Exports of goods and services have been growing at
a lower rate than exports from the euro area (23.9 %
from 2006 to 2012 compared with 28.02 % for the
euro area).171
Exports consist mainly of
intermediate goods to the euro area, in particular
neighbouring countries. Export specialisation is in
low and medium-technology goods, for which price
competition is higher and which are easier for other
countries to copy or replace. Over the past decade,
there has been increasing specialisation in
intermediate goods. It should be noted that although
the proportion of high-tech exports has increased
since 2000, it is still relatively small.
The range of destinations of exports has become
more diverse. In 2012, 69 %172
of exports of goods
and services were directed to other EU member
170 ‘Greenhouse Gas Emissions and Price Elasticities of
Transport Fuel Demand in Belgium’, OECD Economics Department Working Paper No 955 p.9.
171 L’Institut des Comptes Nationaux (ICN). 172 L’Institut des Comptes Nationaux (ICN).
Country chapter: Belgium
96
States (notably Germany, France and the
Netherlands) but the share of exports going to the
largest emerging markets (China, Brazil, Russia,
India, Mexico, Indonesia and Turkey) has increased
from 4.7 % in 2000 to 8.4 % in 2011. Exports
outside the EU accounted for 28.8 % of the total in
2011 and 30.6 % in 2012.173
It is worth noting that
Belgian exporters have benefited indirectly from
new markets through exports to Germany.
Belgium appears to be losing some share of goods
exports — partly as a result of delocalisation of the
production of certain goods — but it is performing
better in services. The share of goods exports as a
proportion of total EU exports has decreased
slightly in the past six years.174
However, the share
of services as a proportion of total EU service
exports has increased from 4.5 % in 2006 to 5.1 %
in 2011. Services may be partially replacing goods
in international trade, but their contribution remains
small. Hence, increasing the competitiveness of
Belgian goods exports remains a challenge.
4.1.4 Business environment and public
administration
Business environment
In general, the business environment is considered
to be good. The World Bank ranks the country 33rd
out of 185 for doing business. The World Economic
Forum views Belgium as one of the 20 most
competitive economies in the world. It was also
ranked 13th by Bloomberg’s Best Countries for
Business in 2013.
Strengths of the business environment include the
short time it takes to start a business, the ease of
enforcing contracts and resolving insolvency,
although the ease of obtaining business licences
differs between regions.175
However, the picture
concerning competition is mixed, as there continue
to be operational constraints in the retail sector.
Competition could be improved by easing
173 l’Institut des Comptes Nationaux (ICN). 174 From 5.6 % of total EU exports to 5.5 %. 175 Brussels Capital Region and Wallonia have one-stop-
shops while Flanders is lagging behind. Sources: Commission assessment on Belgium’s National Reform
Programme, SWD(2013) 351; and World Bank — Doing
Business. Note that information on the time needed to resolve litigious civil and commercial cases for Belgium
has not been made available for the EU Justice
Scoreboard 2013.
procedures for obtaining authorisations for
commercial premises. In general, though, business
operations are characterised by high levels of
professional management and sophistication.176
Infrastructure is well-developed and the country is
ranked 21st in the world by the World Economic
Forum. The penetration rate of fixed broadband in
January 2012 was 32.4 % of the population (EU
average 27.7 %). However, mobile broadband
penetration is still among the lowest in the EU, and
the rollout of mobile networks is slow, hampered
by administrative obstacles.177
Some indicators, such as the procedures for
property registration in Belgium, signal that there
are further weaknesses.178
Belgium has fallen two
places in the Global Competitiveness Report and is
now ranked 17th. There are some concerns
regarding government inefficiency and the tax
system; the country would benefit from shifting
taxes away from labour to less growth-distortive
areas such as environmental taxes.179
The
macroeconomic environment also suffers from
persistent deficit spending and high public debt.
Public administration
According to the World Bank’s government
effectiveness indicator, Belgium continues to do
better than the EU average for overall public
administration performance. The perceived quality
of public services is considered to be good, and the
rule of law prevalent.180
There has been some
reduction in the administrative burden in the last
decade but inefficient government is still listed as
one of the three major problems for doing business,
176 Commission assessment on Belgium’s National Reform
Programme, SWD(2013) 351; and World Economic Forum, The Global Competitiveness Report 2012-13.
177 Commission assessment on Belgium’s National Reform
Programme, SWD(2013) 351. 178 The World Bank’s Doing Business report ranks Belgium
176th out of 185 for registering property. 179 This was captured by the 2013 country-specific
recommendation no 5: “Establish concrete and time-
specific proposals for shifting taxes from labour to less
growth-distortive tax bases, notably by exploring the potential of environmental taxes, for example on diesel,
heating fuels and the taxation of the private use of
company cars. Simplify the tax system by reducing tax expenditures in income taxation, increasing VAT
efficiency and improving tax compliance by closing
existing loopholes.” http://register.consilium.europa.eu/pdf/en/13/st10/st10623
-re01.en13.pdf. 180 Government Efficiency Index, World Bank.
Country chapter: Belgium
97
and other countries have improved more. The use
of tools such as ICT solutions to improve public
administration could be more widespread. Belgium
is, however, one of the forerunners in the recent
European ‘e-government benchmark’, in particular
in back-office automation.
A package has been introduced to modernise public
procurement legislation and initiatives have been
taken at federal level to simplify investment
procedures. Examples include the introduction by
the Flemish government of a single permit
integrating environmental and urban planning
licences, and the implementation of the
administrative simplification plan by Wallonia and
the French community. Further measures have also
been taken to extend the confidence principle — i.e.
streamlining administrative procedures by replacing
documents with a declaration of honour and the use
of internal sources to locate data.
4.1.5 Finance and investment
Small and medium-sized enterprises (SMEs) rely
mostly on bank loans for accessing external sources
of finance. According to the European
Commission’s 2012 Small Business Act (SBA) fact
sheet, access to finance is on average better than in
the EU. According to the survey, SMEs continue to
have greater access to public financial support
(including guarantees) than similar firms in other
EU countries. Also, the share of loans to SMEs is
higher than the EU average. On venture capital,
there continues to be strong flow to early-stage
investments, running at the level of almost three
times the EU average.
The World Bank ranks Belgium 70th of 185 for
obtaining credits. In particular, the strength of
investors’ legal rights is slightly below the EU
average, as is the availability of credit information.
The federal level and the regions have taken
measures to stimulate access to finance for SMEs.
Examples of measures taken by the federal
government include the Initio scheme providing
loans to small enterprises and aiming to finance the
launch of companies. The Brussels Capital region
has developed the Brussels Regional Investment
Company to offer financial support for firms to
start, reorganise or expand in the region. Flanders
has provided guarantees through the Gigarant
programme totalling EUR 203.9 million. The
Flemish government has approved a banking sector
plan that proposes a number of ideas to bolster the
economy and channel funding to the real economy.
In 2011, Flanders introduced a consultancy service
that gives entrepreneurs the opportunity to present
their projects to a panel of financial experts who
will advise them on the optimal financing mix for
their specific situation. Wallonia offers a variety of
financing schemes through its specialised SME
financing institutions, including micro-credits.
Furthermore, the Walloon government, in
partnership with the banking sector, has set up an
automatic guarantee scheme (up to 75 % of a loan)
to a limit of EUR 25 000, with the possibility of
additional funding (up to 50 %). The measure
targets micro-enterprises, the self-employed,
artisans and freelance workers.
4.1.6 Conclusions
In many ways, the competitiveness profile of
Belgium reflects the average of the northern EU
Member States. The good competitive position has
been deteriorating in recent years, in particular
because exports are mainly composed of low and
medium-tech goods, facing international
competition from lower-cost countries. The exports
are mainly oriented towards the EU market.
The key challenge ahead, therefore, is to regain
both cost and non-cost competitiveness, and to
speed up the transition towards a more knowledge-
intensive economy by increasing and improving the
use of innovation, and addressing the skills
mismatch. The implementation of burden-reduction
initiatives at the federal and regional levels is
important to accelerate the simplification and
streamlining of procedures.
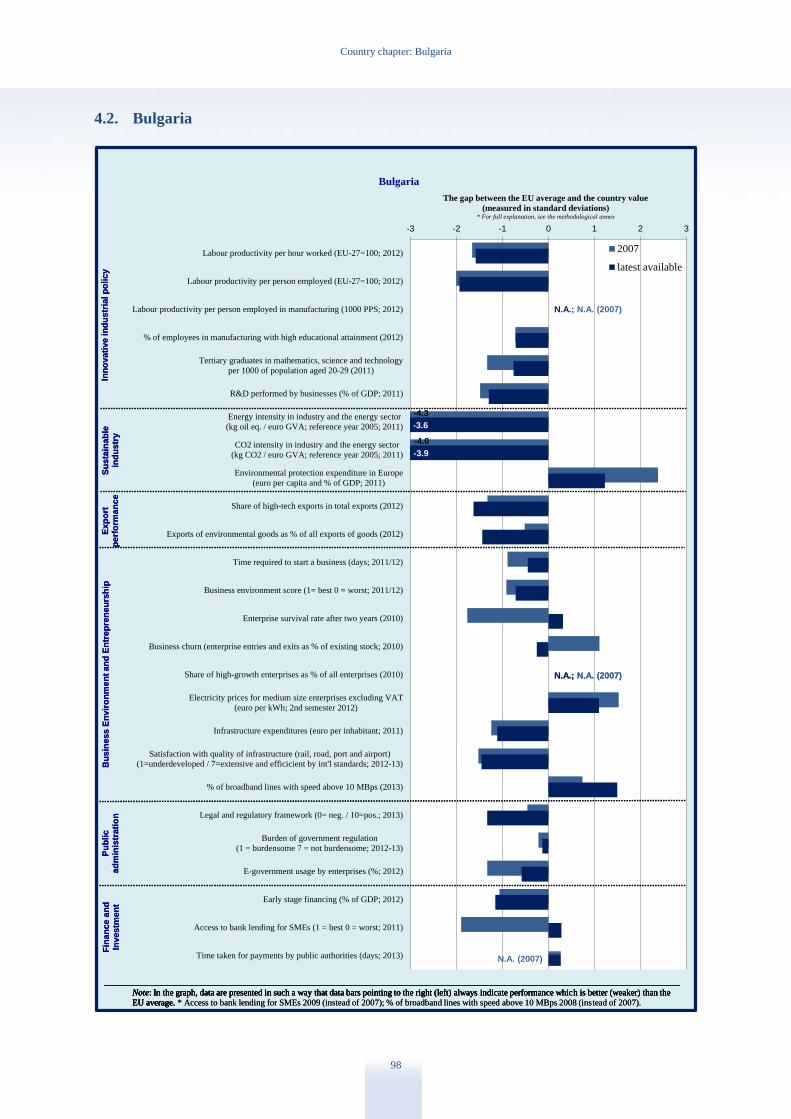
Country chapter: Bulgaria
98
4.2. Bulgaria
-3 -2 -1 0 1 2 3
Labour productivity per hour worked (EU-27=100; 2012)
Labour productivity per person employed (EU-27=100; 2012)
Labour productivity per person employed in manufacturing (1000 PPS; 2012)
% of employees in manufacturing with high educational attainment (2012)
Tertiary graduates in mathematics, science and technology
per 1000 of population aged 20-29 (2011)
R&D performed by businesses (% of GDP; 2011)
Energy intensity in industry and the energy sector
(kg oil eq. / euro GVA; reference year 2005; 2011)
CO2 intensity in industry and the energy sector
(kg CO2 / euro GVA; reference year 2005; 2011)
Environmental protection expenditure in Europe
(euro per capita and % of GDP; 2011)
Share of high-tech exports in total exports (2012)
Exports of environmental goods as % of all exports of goods (2012)
Time required to start a business (days; 2011/12)
Business environment score (1= best 0 = worst; 2011/12)
Enterprise survival rate after two years (2010)
Business churn (enterprise entries and exits as % of existing stock; 2010)
Share of high-growth enterprises as % of all enterprises (2010)
Electricity prices for medium size enterprises excluding VAT
(euro per kWh; 2nd semester 2012)
Infrastructure expenditures (euro per inhabitant; 2011)
Satisfaction with quality of infrastructure (rail, road, port and airport)
(1=underdeveloped / 7=extensive and efficicient by int'l standards; 2012-13)
% of broadband lines with speed above 10 MBps (2013)
Legal and regulatory framework (0= neg. / 10=pos.; 2013)
Burden of government regulation
(1 = burdensome 7 = not burdensome; 2012-13)
E-government usage by enterprises (%; 2012)
Early stage financing (% of GDP; 2012)
Access to bank lending for SMEs (1 = best 0 = worst; 2011)
Time taken for payments by public authorities (days; 2013)
The gap between the EU average and the country value
(measured in standard deviations)* For full explanation, see the methodological annex
Bulgaria
2007
latest available
Note: In the graph, data are presented in such a way that data bars pointing to the right (left) always indicate performance which is better (weaker) than the
EU average.
Inn
ovati
ve in
du
str
ial p
oli
cy
Su
sta
inab
lein
du
str
yB
usin
ess E
nvir
on
men
t an
d E
ntr
ep
ren
eu
rsh
ipF
inan
ce a
nd
Investm
en
t
Note: In the graph, data are presented in such a way that data bars pointing to the right (left) always indicate performance which is better (weaker) than the
EU average. * Access to bank lending for SMEs 2009 (instead of 2007); % of broadband lines with speed above 10 MBps 2008 (instead of 2007).
Ex
po
rtp
erf
orm
an
ce
Pu
bli
cad
min
istr
ati
on
N.A.; N.A. (2007)
N.A.; N.A. (2007)
N.A. (2007)
-3.6
-3.9
-4.3
-4.0
Note: In the graph, data are presented in such a way that data bars pointing to the right (left) always indicate performance which is better (weaker) than the
EU average.
Inn
ovati
ve in
du
str
ial p
oli
cy
Su
sta
inab
lein
du
str
yB
usin
ess E
nvir
on
men
t an
d E
ntr
ep
ren
eu
rsh
ipF
inan
ce a
nd
Investm
en
t
Note: In the graph, data are presented in such a way that data bars pointing to the right (left) always indicate performance which is better (weaker) than the
EU average. * Access to bank lending for SMEs 2009 (instead of 2007); % of broadband lines with speed above 10 MBps 2008 (instead of 2007).
Ex
po
rtp
erf
orm
an
ce
Pu
bli
cad
min
istr
ati
on
N.A.; N.A. (2007)
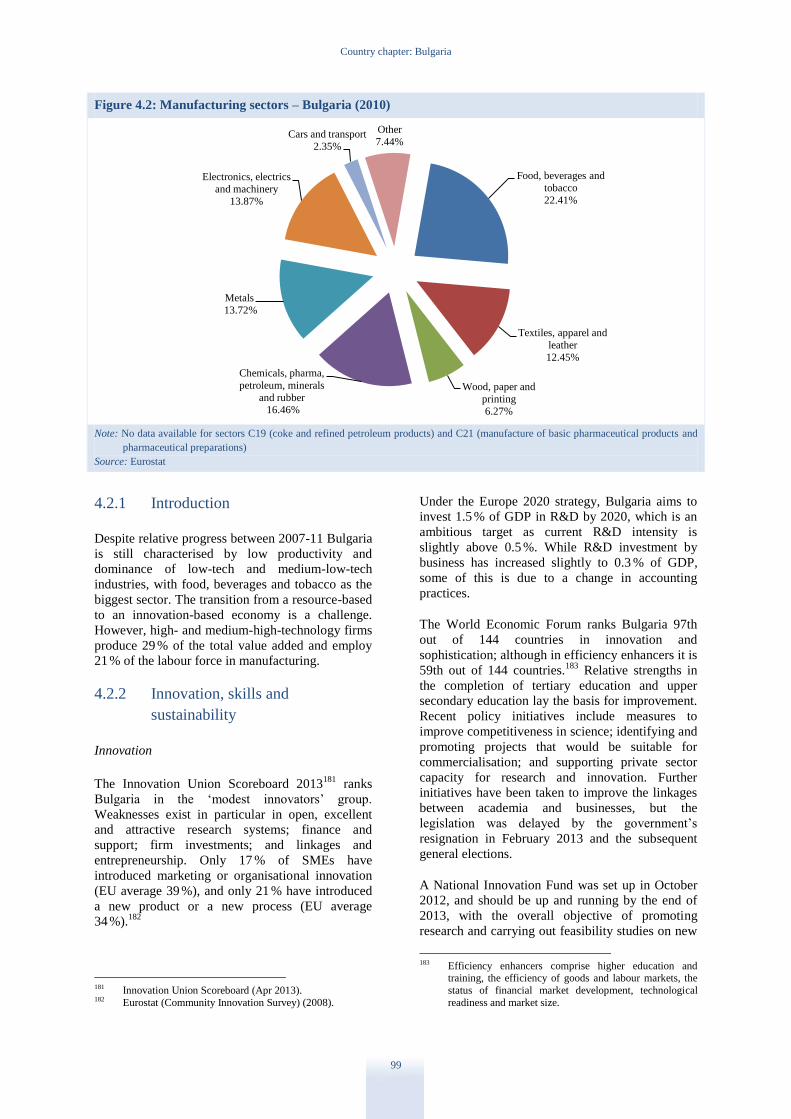
Country chapter: Bulgaria
99
Figure 4.2: Manufacturing sectors – Bulgaria (2010)
Note: No data available for sectors C19 (coke and refined petroleum products) and C21 (manufacture of basic pharmaceutical products and
pharmaceutical preparations)
Source: Eurostat
4.2.1 Introduction
Despite relative progress between 2007-11 Bulgaria
is still characterised by low productivity and
dominance of low-tech and medium-low-tech
industries, with food, beverages and tobacco as the
biggest sector. The transition from a resource-based
to an innovation-based economy is a challenge.
However, high- and medium-high-technology firms
produce 29 % of the total value added and employ
21 % of the labour force in manufacturing.
4.2.2 Innovation, skills and
sustainability
Innovation
The Innovation Union Scoreboard 2013181
ranks
Bulgaria in the ‘modest innovators’ group.
Weaknesses exist in particular in open, excellent
and attractive research systems; finance and
support; firm investments; and linkages and
entrepreneurship. Only 17 % of SMEs have
introduced marketing or organisational innovation
(EU average 39 %), and only 21 % have introduced
a new product or a new process (EU average
34 %).182
181 Innovation Union Scoreboard (Apr 2013). 182 Eurostat (Community Innovation Survey) (2008).
Under the Europe 2020 strategy, Bulgaria aims to
invest 1.5 % of GDP in R&D by 2020, which is an
ambitious target as current R&D intensity is
slightly above 0.5 %. While R&D investment by
business has increased slightly to 0.3 % of GDP,
some of this is due to a change in accounting
practices.
The World Economic Forum ranks Bulgaria 97th
out of 144 countries in innovation and
sophistication; although in efficiency enhancers it is
59th out of 144 countries.183
Relative strengths in
the completion of tertiary education and upper
secondary education lay the basis for improvement.
Recent policy initiatives include measures to
improve competitiveness in science; identifying and
promoting projects that would be suitable for
commercialisation; and supporting private sector
capacity for research and innovation. Further
initiatives have been taken to improve the linkages
between academia and businesses, but the
legislation was delayed by the government’s
resignation in February 2013 and the subsequent
general elections.
A National Innovation Fund was set up in October
2012, and should be up and running by the end of
2013, with the overall objective of promoting
research and carrying out feasibility studies on new
183 Efficiency enhancers comprise higher education and
training, the efficiency of goods and labour markets, the
status of financial market development, technological
readiness and market size.
Food, beverages and
tobacco
22.41%
Textiles, apparel and
leather
12.45%
Wood, paper and
printing
6.27%
Chemicals, pharma,
petroleum, minerals
and rubber 16.46%
Metals
13.72%
Electronics, electrics
and machinery
13.87%
Cars and transport
2.35%
Other
7.44%
Country chapter: Bulgaria
100
or significantly improved products or processes.
Two grant schemes to support research and
innovation activities by SMEs either in-house or in
partnership with R&D organisations were set up in
2011. Seventy-seven grant agreements were signed
for research, and 110 start-ups received innovation
support in 2012.
Skills
Labour productivity in Bulgaria is low, and the
percentage of employees in manufacturing who
have completed higher education is below the EU
average. To increase competitiveness by enabling
specialisation in higher value added sectors,
Bulgaria needs to improve the education system
and introduce basic business training.
Unemployment varies across the regions, with the
national unemployment rate at 12.3 %. Youth
unemployment has been increasing constantly since
2010, and in the fourth quarter of 2012 reached
28.4 %.184
This has to be seen in the context of a
structural labour market mismatch: the annual
demand for graduates with engineering and
technical skills has been estimated at 64 000,
against 23 000 available graduates with those skills.
At the same time, there are 46 000 graduates in
business and economy against a demand of 23 000,
and 24 000 humanities graduates with an estimated
need of 2000. Investment in education is below EU
average at 3 % of GDP against 5.6 % for the EU.
The gap between the supply of graduates and labour
market demand worsens structural unemployment
and hampers the development of high-value,
innovative sectors. Implementation of the reform of
higher education, effective governance and
sufficient investment would help to promote growth
and competitiveness.
Sustainability
The Eco-Innovation Observatory ranks Bulgaria
seventeenth in the EU on its eco-innovation
scoreboard,185
although only a quarter of SMEs
have introduced environmentally friendly
innovations or received public support for their
resource efficiency measures. A grant scheme is in
place to help SMEs to improve the efficiency and
productivity of environmentally friendly
technologies.
Bulgaria is heavily dependent on a single source of
energy and energy system liberalisation and
modernisation has not been completed. Energy
prices have remained regulated as they are seen to
have an impact on economic and political stability.
184 Eurostat, Unemployment Statics, April 2013. 185 Eco-innovation in Bulgaria, EIO Country Profile 2012.
Although a large majority of SMEs have taken
resource-efficiency measures, there is room for
improvement, especially in the energy front.
Benefiting from very low electricity prices, industry
is Bulgaria is the most energy intensive in the
EU;186
and the CO2 intensity is also the highest.
Reducing energy intensity should also increase
energy independence.
Bulgaria is committed to reaching its goal of
renewable energy sources representing 16 % of its
final energy consumption, and 10 % in transport, by
2020. In 2010, the renewables accounted for
13.8 %, which exceeded the first interim target of
10.7 % set for 2011.187
In the transport sector,
renewables accounted for 0.4 % in 2011. The law
on renewable energy sources was amended in
February 2013 to introduce a mandatory share of
bio-fuels in the fuel mix used for transport.188
The political developments in January and February
2013, with the resignation of the government and
the general elections, were partly prompted by
flawed energy sector liberalisation and a resulting
rise in the price of electricity. Energy-sector reform
and strategic targeting of energy and resource
efficiency, along with improvements in household
energy intensity, are essential to economic
development, and will have beneficial effects on
both competitiveness and political stability.
The energy efficiency law requires certificates for
all buildings, industrial, public or private. An
amendment reduced the minimum size from 1000
square metres to 500 square metres as from March
2013.189
4.2.3 Export performance
In 2012, total exports of goods and services
increased to 68.8 % of GDP from 47.5 % in 2009,
and were 163 % of the 2006 level, indicating a
recovery after a fall of over 20 % between 2008 and
2009. Extra-EU exports rose by 40 % between 2010
and 2012 while intra-EU exports rose by 28 %, but
the EU is still the destination for 63.4 % of total
exports.
186 Eurostat and EAA data figures indicate that industry in
Bulgaria is the most energy intensive in the EU, at 0 618
kg oil eq./EUR GVA against 0 184 for the EU-27. CO2 intensity is also the highest at 5 998 kg CO2 eq./EUR
GVA against 0 919 for the EU-27. 187 Renewable energy progress report (COM/2013/0175
final). 188 Law on energy from renewable sources, published in the
Official Journal, No 35, 03.05.2011, as amended on 15 February 2013.
189 Law on energy efficiency, published in the Official
Journal, No 24, 12.03.2013.

Country chapter: Bulgaria
101
Exports of non-financial knowledge-intensive
services and high-tech manufacturing rose by
almost 156 % between 2007 and 2012. Exports in
these two categories represent only 3.8 % of the
total value of exports, which rose by 144 %. In
2013, the time required for imports was 17 days,
and for exports 21 days, against an EU average of
11.
Support for SME access to international markets is
provided by the agency for the promotion of SMEs.
Available schemes include participation in
international professional fairs and trade missions.
A national export portal has been part-funded by
the ERDF and provides export strategies for 18
sectors.190
The Bulgarian Development Bank
provides loans of between EUR 250 000 and
EUR 3 000 000, and loan guarantees, for export-
oriented companies.191
4.2.4 Business environment and public
administration
Business environment
Bulgaria’s ranking in the World Bank’s Doing
Business report fell in 2013 to 66th out of 185
countries, largely due to the stagnation in
institutional modernisation.192
The World Economic
Forum’s 2012 Global Competitiveness Report
indicated an improvement in its global
competitiveness index, at 62nd out of 144 countries
in 2012-13 (as compared to 74 out of 142 in 2011-
12). The country is characterised as efficiency-
driven, and its performance as better than many
other countries in this group, except for the
‘institutions’ ranking of 108th out of 144.193
Recent measures to improve the business
environment include lowering the starting capital
requirement; introducing e-government services to
facilitate tax compliance; enabling tax payments
using a single account and internet banking; and
lowering bank charges.194
Tax compliance remains
burdensome, although the average total compliance
time fell from 500 hours in 2010 to 454 in 2011.195
190 See export.government.bg. 191 See http://www.bbr.bg/bg/кредити-по-програма-
партньори.html 192 Doing Business 2013; Bulgaria ranked 57th in 2010 and
59th in 2011. 193 The ‘institutions’ indicator measures bureaucracy and red
tape, overregulation, corruption, dishonesty in dealing with public contracts, lack of transparency and
trustworthiness, inability to provide appropriate services
for the business sector, and political dependence of the judicial system.
194 National reform programme 2013. 195 PWC Paying Taxes 2013: The Global Picture.
A package of 24 measures was adopted in August
2013 aiming at reducing time, cost and number of
documents to be provided. These concern for
instance administrative services provided by local
authorities, and by the food safety and maritime
agencies. Further 70 measures are announced for
adoption in autumn 2013.
Corporate income tax is charged at a flat rate of
10 %, and there is the possibility to take advantage
of a shorter period for VAT refunds and apply self-
billing for VAT on imports of equipment for
investment projects worth over EUR 5 million with
maximum duration of two-years that create at least
50 jobs. This is designed to attract foreign direct
investment. An automotive cluster196
was set up in
July 2012 with more than 20 multinational and
local businesses, complementing the existing
Electromobil industrial cluster.197
A national action
plan for sustainable automotive transport, including
electronic vehicles, has also been adopted.198
The licensing complexity index, measuring the
economic impact of legal and administrative
procedures for post-registration licensing, is 25 %
higher in Bulgaria than elsewhere in the EU.199
It is
easier to start a business than last year, as both the
time needed, and the cost have fallen.
Investment in infrastructure could unlock wider
growth and investment, particularly in railways and
ports, but also in multimodal hubs, as these would
allow Bulgaria to exploit its geographical location
at the crossroads of EU, the Balkans and Turkey.
A national programme ‘Digital Bulgaria 2015’ was
adopted in 2012.200
Although fixed broadband
covers about 90 % of homes, the take-up is 51 %,
which is below the European average of 73% of
homes. Broadband infrastructure is still lacking, in
particular in rural areas.201
Equipment providers and
infrastructure operators have suffered delays in
payment by the public authorities, although the late
payments directive should change this.
Overall, businesses would benefit from more
transparent and simpler regulations and procedures.
The results of the action plan to reduce the
administrative burden (2012-14) that was adopted
in June 2012 remain to be seen.
196 http://www.automotive.bg/?go=news 197 http://www.emic-bg.org/content/item/1 198 http://www.emic-bg.org/files/files/SAP-NPD_EV_2012-
2014-final.pdf 199 SBA (Small Business Act) Fact Sheets 2013. 200 Decision of Council of Ministers No 953, 16.11.2012. 201 Digital Agenda for Europe Scoreboard, 2013.
Country chapter: Bulgaria
102
Public administration
Government effectiveness is below the EU
average202
and deficiencies in administrative
capacity limit the absorption of EU funds.
However, improvements have started to be made.
The recent incorporation of management of the
competitiveness Operating Programme in the
Ministry of Economy and Energy is aimed at
reducing the administrative burden on beneficiaries
and could simplify reporting obligations.
Legislative improvements to public procurement
have been introduced, but require sound
implementation, including broader ex-ante control
of procedures. Further amendments were proposed
by the Government in summer 2013, with the stated
objective of improving transparency and access to
public procurement markets, including by SMEs.
Transparency International’s 2012 corruption
perceptions index203
ranks Bulgaria 75th. To
improve the stability and competitiveness of the
business environment, the government has made
tackling corruption a major objective.
The EU Justice Scoreboard204
shows that the
judicial system has improved, as the disposition
time of civil cases has shortened to 67 days in 2010
from 148 days in 2008. The clearance rate is 99 %,
with a slight increase in pending cases.
An integrated strategy for the prevention of
corruption and organised crime has been drafted.
Further action on the independence of the judicial
system and on the efficiency of the legal framework
in settling disputes would be warranted, however.
Strengthening customs performance would also
help to protect national and EU financial interests.
4.2.5 Finance and investment
The financial system is stable but the operating
environment is challenging, with low growth and
decreasing asset quality. Innovative start-ups and
SMEs have problems in accessing finance, in
particular bank loans, because banks’ balance
sheets adjustments and the upward trend in non-
performing loans (rising from 6.4 % in December
2009 to 16.9 % in June 2012).
202 Excellence in Public Administration for Competitiveness
in EU Member States, 2013. 203 Transparency International Corruption Perceptions Index
2012. 204 EU Justice Scoreboard 2013.
A new funding scheme was adopted in 2012 to
support start-ups,205
and Structural Funds are being
used for SME finance under the Jeremie scheme.
Further, a new initiative has been announced this
year to support SMEs in rural areas with investment
in areas such as technology. However, there are
some doubts about the effectiveness of the
government schemes.206
The World Bank is
providing technical assistance to help to absorb the
Structural Funds.
More progress has to be made in improving the
insolvency procedure and to fight the upward trend
in non-performing loans. The time needed to wind
up a business has remained constant at 3.3 years.207
4.2.6 Conclusions
Bulgaria faces considerable challenges in
improving its competitiveness. In the short term,
industry needs to move towards products and
services with higher added value, and labour
productivity needs to be improved. Higher
productivity should also be pursued in service
sectors, including tourism.
A national strategy for SMEs 2014-20 is being
prepared. It indicates that Bulgarian authorities are
grasping the problem, as the draft aims to improve
Bulgarian competitiveness by covering issues
concerning both SMEs and industrial sectors .
These require a favourable operating environment
for businesses, particularly with regard to the
administrative burden on businesses; improved
energy and resource efficiency; and access to
finance. In the medium term, the move towards a
more knowledge-oriented economy requires
improvements in the quality of infrastructure, in
education, and in research and innovation.
205 The Entrepreneurship Acceleration and Seed Financing
Instrument, worth € 21 million, is currently operating with
investment in innovative projects, mostly in ICT. 206 Economist Intelligence Unit (2013): ‘Country report:
Bulgaria’, World Bank (2013), AECM (2013). 207 World Bank (2013): ‘Doing Business: Bulgaria’,
European Commission (2012): ‘SBA Fact Sheet: Bulgaria’, Minutes of the meeting between the European
Commission Secretariat-General and the Bulgarian
Ministry of Finance (February 2013).
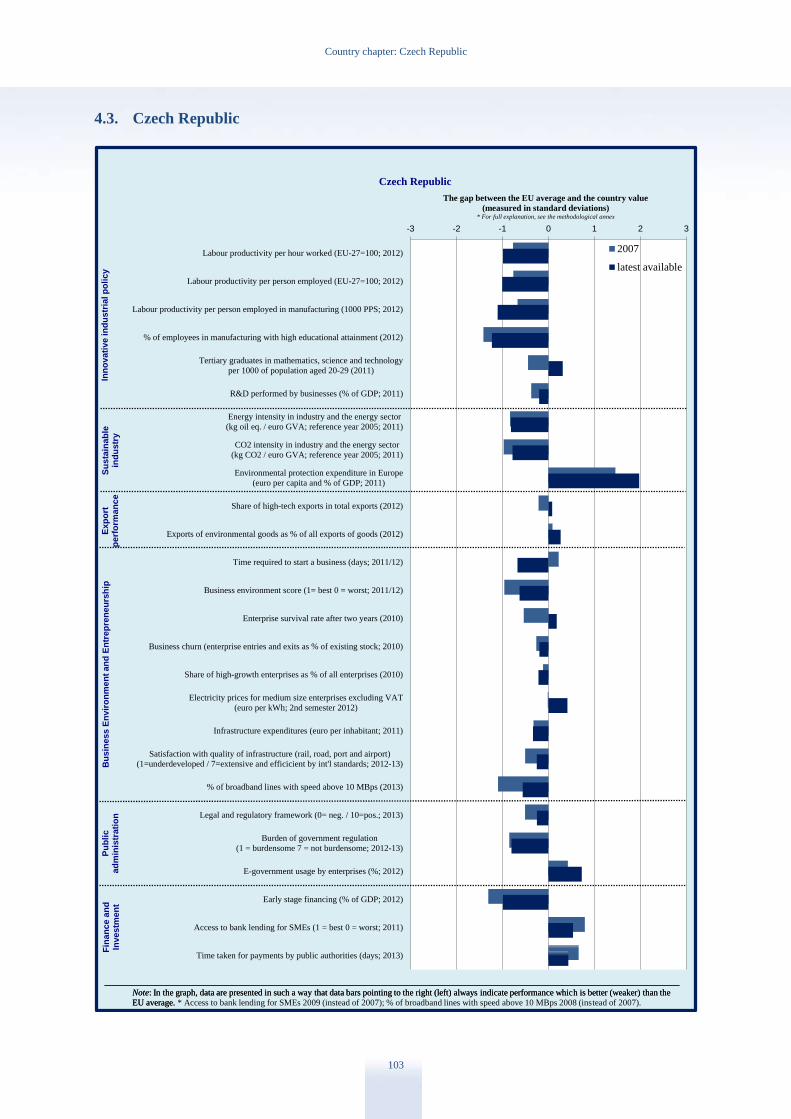
Country chapter: Czech Republic
103
4.3. Czech Republic
-3 -2 -1 0 1 2 3
Labour productivity per hour worked (EU-27=100; 2012)
Labour productivity per person employed (EU-27=100; 2012)
Labour productivity per person employed in manufacturing (1000 PPS; 2012)
% of employees in manufacturing with high educational attainment (2012)
Tertiary graduates in mathematics, science and technology
per 1000 of population aged 20-29 (2011)
R&D performed by businesses (% of GDP; 2011)
Energy intensity in industry and the energy sector
(kg oil eq. / euro GVA; reference year 2005; 2011)
CO2 intensity in industry and the energy sector
(kg CO2 / euro GVA; reference year 2005; 2011)
Environmental protection expenditure in Europe
(euro per capita and % of GDP; 2011)
Share of high-tech exports in total exports (2012)
Exports of environmental goods as % of all exports of goods (2012)
Time required to start a business (days; 2011/12)
Business environment score (1= best 0 = worst; 2011/12)
Enterprise survival rate after two years (2010)
Business churn (enterprise entries and exits as % of existing stock; 2010)
Share of high-growth enterprises as % of all enterprises (2010)
Electricity prices for medium size enterprises excluding VAT
(euro per kWh; 2nd semester 2012)
Infrastructure expenditures (euro per inhabitant; 2011)
Satisfaction with quality of infrastructure (rail, road, port and airport)
(1=underdeveloped / 7=extensive and efficicient by int'l standards; 2012-13)
% of broadband lines with speed above 10 MBps (2013)
Legal and regulatory framework (0= neg. / 10=pos.; 2013)
Burden of government regulation
(1 = burdensome 7 = not burdensome; 2012-13)
E-government usage by enterprises (%; 2012)
Early stage financing (% of GDP; 2012)
Access to bank lending for SMEs (1 = best 0 = worst; 2011)
Time taken for payments by public authorities (days; 2013)
The gap between the EU average and the country value
(measured in standard deviations)* For full explanation, see the methodological annex
Czech Republic
2007
latest available
Note: In the graph, data are presented in such a way that data bars pointing to the right (left) always indicate performance which is better (weaker) than the
EU average.
Inn
ovati
ve in
du
str
ial p
oli
cy
Su
sta
inab
lein
du
str
yB
usin
ess E
nvir
on
men
t an
d E
ntr
ep
ren
eu
rsh
ipF
inan
ce a
nd
Investm
en
t
Note: In the graph, data are presented in such a way that data bars pointing to the right (left) always indicate performance which is better (weaker) than the
EU average. * Access to bank lending for SMEs 2009 (instead of 2007); % of broadband lines with speed above 10 MBps 2008 (instead of 2007).
Ex
po
rtp
erf
orm
an
ce
Pu
bli
cad
min
istr
ati
on
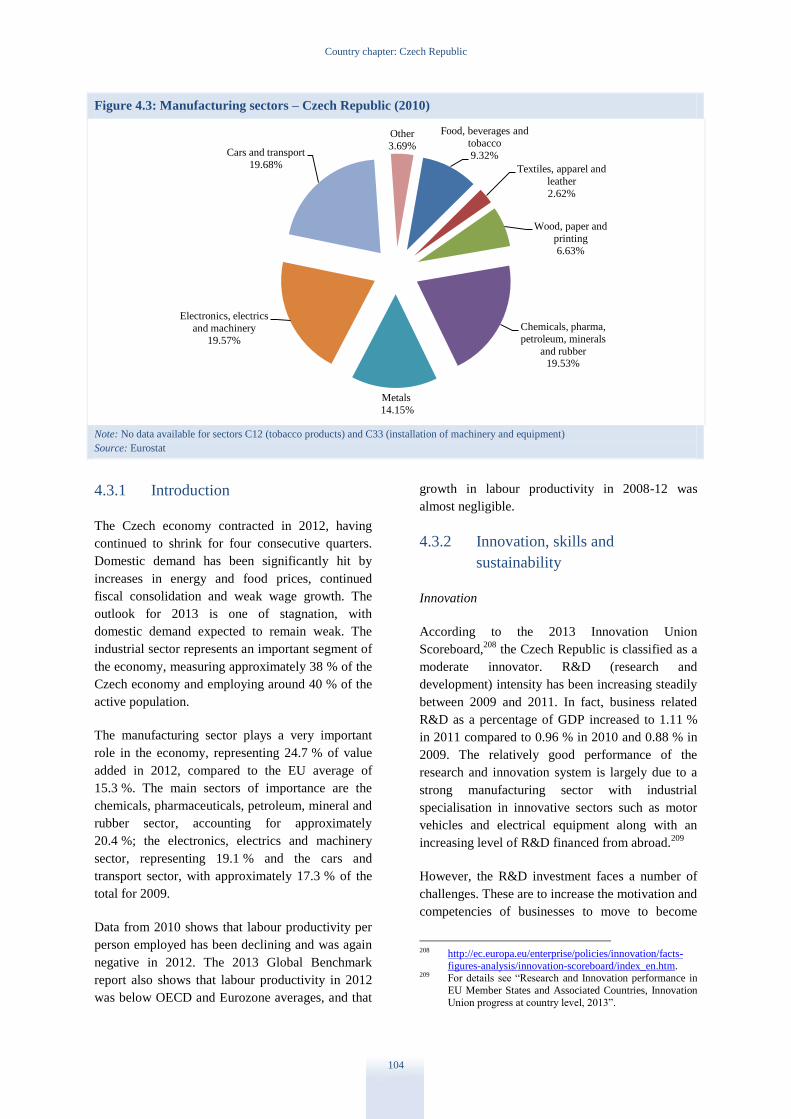
Country chapter: Czech Republic
104
Figure 4.3: Manufacturing sectors – Czech Republic (2010)
Note: No data available for sectors C12 (tobacco products) and C33 (installation of machinery and equipment)
Source: Eurostat
4.3.1 Introduction
The Czech economy contracted in 2012, having
continued to shrink for four consecutive quarters.
Domestic demand has been significantly hit by
increases in energy and food prices, continued
fiscal consolidation and weak wage growth. The
outlook for 2013 is one of stagnation, with
domestic demand expected to remain weak. The
industrial sector represents an important segment of
the economy, measuring approximately 38 % of the
Czech economy and employing around 40 % of the
active population.
The manufacturing sector plays a very important
role in the economy, representing 24.7 % of value
added in 2012, compared to the EU average of
15.3 %. The main sectors of importance are the
chemicals, pharmaceuticals, petroleum, mineral and
rubber sector, accounting for approximately
20.4 %; the electronics, electrics and machinery
sector, representing 19.1 % and the cars and
transport sector, with approximately 17.3 % of the
total for 2009.
Data from 2010 shows that labour productivity per
person employed has been declining and was again
negative in 2012. The 2013 Global Benchmark
report also shows that labour productivity in 2012
was below OECD and Eurozone averages, and that
growth in labour productivity in 2008-12 was
almost negligible.
4.3.2 Innovation, skills and
sustainability
Innovation
According to the 2013 Innovation Union
Scoreboard,208
the Czech Republic is classified as a
moderate innovator. R&D (research and
development) intensity has been increasing steadily
between 2009 and 2011. In fact, business related
R&D as a percentage of GDP increased to 1.11 %
in 2011 compared to 0.96 % in 2010 and 0.88 % in
2009. The relatively good performance of the
research and innovation system is largely due to a
strong manufacturing sector with industrial
specialisation in innovative sectors such as motor
vehicles and electrical equipment along with an
increasing level of R&D financed from abroad.209
However, the R&D investment faces a number of
challenges. These are to increase the motivation and
competencies of businesses to move to become
208 http://ec.europa.eu/enterprise/policies/innovation/facts-
figures-analysis/innovation-scoreboard/index_en.htm. 209 For details see “Research and Innovation performance in
EU Member States and Associated Countries, Innovation
Union progress at country level, 2013”.
Food, beverages and
tobacco
9.32%
Textiles, apparel and
leather
2.62%
Wood, paper and
printing
6.63%
Chemicals, pharma,
petroleum, minerals
and rubber 19.53%
Metals
14.15%
Electronics, electrics
and machinery
19.57%
Cars and transport
19.68%
Other
3.69%
Country chapter: Czech Republic
105
innovation leaders in their markets; to achieve or
maintain excellence in selected areas of research; to
enhance the quality of education system; and to set
up an appropriate institutional framework. There is
no overall authority effectively to govern the R&D
and innovation system. While there is a research,
development and innovation council, which acts as
an advisory body, there is a lack of back-office
support to implement strategies. There is also still
little co-operation between research institutions and
businesses, which is hindering economic progress.
The international competitiveness strategy 2012-20
is trying to address these shortcomings, and the
government has proposed practical training for
students of upper secondary and higher education.
Competence centres have been set up, aiming at
encouraging medium to long-term partnerships
between the public and private sectors on research
and innovation. A first call was undertaken in mid-
2012, with a significant amount of proposals being
submitted and 22 projects being selected. A second
call was undertaken in March with 12 to 16 projects
aimed at being supported.
Most research and innovation support for
businesses are grants, in particular through the
Alpha programme, which has the largest available
financial resources, the Beta and Omega
programmes which are administered by the Czech
Technology Agency. Other useful programmes
include the TIP (technology, information systems
and products) programme and the operational
programme entrepreneurship and innovation.
During 2011 and 2012, a number of projects were
successfully carried out under the knowledge
transfer partnership pilot project, introduced in
2009, to support the transfer of knowledge between
universities and SMEs. The Government is
currently considering whether this project should be
extended on a larger scale in the next programming
period.
In addition, there is an R&D tax incentive which
has been recently amended to extend the scope of
eligible expenses to outsourced R&D, but this is not
yet in force. Finally, while the Government has set
an R&D target of 1 % of GDP by 2020 for public
expenditure, which increased from 0.58 % in 2010
to 0.78 % in 2011, it is has not set an overall R&D
target to cover both private and public R&D.
Skills
The quality of compulsory and tertiary education is
currently an issue, and as such it has been the scope
of a country-specific recommendation from the
Council. While performance is better than the EU
headline target regarding early school leaving,
measuring 5.5 % in 2012 as compared to the EU
target of 10 %, its tertiary attainment rate is
significantly lower than the EU average.
Nevertheless, from 2006 to 2012 it has nearly
doubled to 25.6% (EU average of 35.7%), covering
some distance towards the national 2020 target of
32%, which is likely to be achieved.
On ICT skills, 51% of 16-24 years-old have high
computer skills (2012), above the EU average of
40 %.210
With respect to entrepreneurship, only
39.2 % of Czechs believe that they have the
required knowledge, skills and competence to set
up a business which is rather low compared to other
EU countries.211
There have also been calls from
stakeholders for more attention to be given to
support entrepreneurship in schools, notably at
university level.
The Government is preparing a revision of the
higher education act which aims at amending the
accreditation procedure from 2016, notably to help
develop more professionally-oriented bachelor
degrees to improve the labour market relevance of
higher education. Another goal is to link funding of
higher education institutions to their performance.
Generally students at schools are obtaining results
comparable to international educational
achievements, but in mathematics and science the
outcomes have worsened over time. In response,
the authorities are developing minimum standards
and a national computer-based testing. Another set
of measures aim at improving the quality and
attractiveness of teaching through increasing initial
salaries and developing a new career system and in-
service training for pedagogical staff from 2015.
Sustainability
In the last decade, industrial production has
decreased and there has been a continuing decline
in electricity generated from coal-burning power
plants. However, given the significant share of
210 Eurostat ICT household survey. 211 2011 Global Entrepreneurship Monitor.

Country chapter: Czech Republic
106
industry in the national economy, the country
remains highly energy intensive. In fact, data for
2010 shows that industry accounts for
approximately 34.2 % of energy consumption in the
economy, while transport accounts for
approximately 24.6 %.212
When compared to other
Member States, data for 2011 shows that it is the
one of the most energy and carbon intensive
Member States in the industry and energy sector.
As a result, the energy intensity of the economy is
still amongst the highest in the EU. Nuclear power
and solid fuels account for almost 90 % of gross
electricity consumption. In 2012, a proposal for an
update of the state energy strategy was adopted by
the Government.213
The share of renewable energy in gross final energy
consumption for 2011 measured 9.4 %.214
The
renewable energy target is 13 % by 2020, with a
10 % target of renewables in all modes of transport.
Investment has been made in wind and photovoltaic
generation over the past years. The national
renewable energy action plan seeks to develop
renewable energy sources but these are not
considered to be strong in all sectors, particularly in
transport and grid reinforcements.215
An updated raw materials policy, also covering
secondary raw materials, was prepared in the
summer of 2012 but has not yet been approved.
Amongst the goals of this policy is to create the
conditions to secure reserves and sustainable
extraction of raw materials and to support material
saving technologies.
The most prominent eco-innovation areas are waste
management, small scale hydropower technologies,
and specific developments in nanotechnologies.
There are initiatives on improving energy efficiency
of buildings and development of cleaner vehicles. It
is pertinent to note however that the Czech
Republic has still not set its energy efficiency target
under the Europe 2020 strategy which was due in
April 2013.
212 Country factsheets of DG Energy (2012):
http://ec.europa.eu/energy/observatory/countries/doc/2012
-country-factsheets.pdf. 213 Government Resolution no 803/2012. 214 Eurostat data. 215 Europe2020 Staff Working Document for the Czech
Republic.
By the end of 2013 the Government is aiming to
present a waste prevention programme. Some goals
of the waste prevention plan will be part of the
newly prepared waste management plan. Currently
the country relies significantly on landfilling of
municipal waste.
4.3.3 Export performance
Exports accounted for approximately 75 % of GDP
in 2012, with approximately 6 % annual growth
rate in 2008-12, which is higher than the OECD and
Eurozone averages.216
The total value of exports
from the Czech Republic has steadily increased
from 2009 with the internal EU market representing
approximately 83 % of the total in 2011.217
Germany is a particular important destination. The
share of high-tech exports in total exports measured
16.2 % in 2011.
The Czech export strategy 2012-20 remains the
Government’s strategic document aimed at
improving export performance. The strategy
focuses mainly on SMEs, aiming at increasing the
number of SMEs exporting to third markets by
50 % by 2020. An annual progress report was also
prepared. CzechTrade is the Government agency
responsible for export promotion with over 30
offices worldwide. It is envisaged that a one-stop-
shop for exports will be set up to offer information
to interested entrepreneurs in various regions.
4.3.4 Business environment and public
administration
Business environment
The ownership of the competitiveness strategy
2012-20 has moved to the Office of the
Government from the Ministry of Industry and
Trade, which should allow for improved execution
given the co-ordination role of the Office of the
Government.
The SME support strategy for 2014-20 was
launched and adopted by Government in December
2012. The strategy sets out 50 specific measures
and defines the priority areas for support for the
2014-20 programming period. The four policy
216 Global Benchmark Report 2013. 217 Czech Statistics Office.

Country chapter: Czech Republic
107
priorities are enhancing business environment;
development of enterprise based on R&D and
innovation; SME internationalisation; and
sustainable energy management and development.
According to the World Bank Doing Business
Report 2013, the Czech Republic ranks 65th
on ease
of doing business out of 185 countries. Some of the
main bottlenecks for businesses identified relate to
starting a business,218
getting electricity, protecting
investors and paying taxes.
As in many other Member States, the tax rates
change often, placing additional administrative
burden on businesses. The establishment of a single
tax collection point for personal and company
income taxes should start operating in 2015,
focusing on the collection of direct taxes and health
and social insurance contribution in one place. This
should help to reduce the administrative burden of
paying taxes, even though it is not cover all types of
taxation.
There are also a number of services which aim at
assisting businesses, in particular SMEs, such as the
points of single contact (PSC), SOLVIT centres and
the contact point for products that have been
integrated into a single platform through the
internet portal for entrepreneurs.219
In 2012, the Government carried out a successful
pilot project on the introduction of common
commencement days. The project foresees the
introduction of the majority of legal acts concerning
the business environment on two days only, namely
1 January and 1 July, thus decreasing uncertainty
and administrative burden. The evaluation of the
pilot project should be submitted to the
Government for a decision on whether the common
commencement days will be introduced on a
broader scale.
There have been a number of legislative acts
recently which may have a positive effect on the
business environment, such as the new act on
business corporations, which is to be effective from
2014. This act should provide improvements for
limited liability companies. There have also been
218 World Bank Doing Business 2013 calculates that it takes
20 days to start a business in the Czech Republic. The Czech Republic disputes this figure, stating it takes 10
days to start a business. 219 Businessinfo.cz.
amendments to the trade licensing act. Moreover, a
new law on investment incentives extended the
five-year reduction in corporate tax rate to a 10-
year period.
Services account for approximately 58 % of the
total value added.220
The importance of services is
also reflected in the fact that according to data for
2011, export of services as a percentage of total
exports accounted for 16.3 % as opposed to 6.6 %
of goods accounting for total exports.
The Czech Republic is the Member State with the
highest number of regulated professions. A public
consultation on the review of the regulatory
framework for professions has been conducted in
2012 and results are to be presented in 2013.221
The transport infrastructure faces challenges with
respect to its quality and functionality and as such it
hinders possible economic growth. As highlighted
in the 2013 national reform programme, the
completion of backbone infrastructure, and
connecting remaining regions and main industrial
centres to Czech and European routes is a pre-
requisite to improving the business situation.
The transport system suffers from a lack of
interconnectivity between railways and other forms
of transport. Given the difficult economic climate,
the completion of planned rail and highway projects
is now uncertain. The government intends to adopt
a new transport policy for 2014-2020, as well as a
medium-term plan of transport infrastructure
development, both of which should improve the
strategic planning in transport development.
Public administration
Issues relating to public administration and
corruption are some of the most pressing issues for
the Czech Republic. In June 2013, a draft public
servants act was approved by the Government (an
act had been approved in 2002 but entry into force
was postposed). In the effort to ensure a stable,
220 OECD Economic Survey Czech Republic November
2011. 221 The 2013 country-specific recommendations for the
Czech Republic included “Drawing on the on-going
review, proceed with a reform of regulated professions, by
reducing or eliminating entry barriers and reserves of activities where they are unjustified.”
http://ec.europa.eu/europe2020/making-it-
happen/country-specific-recommendations/index_en.htm

Country chapter: Czech Republic
108
more transparent and professional public service, it
should be noted that a strategic policy framework
for reinforcing the administrative efficiency with
several elements to be put in place and in the
process of being implemented is known as ex-
conditionality for the use of EU funds in 2014-20.
Another important area of action is to ensure the
appropriate enforcement of the public procurement
act which was substantially amended on 1 April
2012. The adoption of this amendment was a good
example of wide consultation between government,
businesses and NGOs. While Government advisory
and support services for bidders currently exist, the
time taken to respond to requests is still quite long
(in particular the capacity of the office for the
protection of competition is not sufficient). Further
administrative capacity at local and regional level
would be useful.
The Czech Republic also permits anonymous
shareholding, whereby a lack of transparency of
ownership of shares can lead to issues related to
corruption, money laundering and tax evasion. A
legal act to address this has been approved by
Parliament.222
According to it, bearer shares will
now be permitted to exist, but only if they are
deposited in the collective depository of a securities
trader, the records of which allow for the
identification of share ownership, with access
limited to selected public authorities. Measures will
enter into force in 2014.
There is a two-year anti-corruption strategy, with
the strategy for 2013-14 building on that of 2011-
12. While a number of measures have been
completed, a significant amount of legislative
proposals from the previous strategy were
transferred to the new strategy. Even though
monitoring is done on a quarterly basis, the
department dealing with this strategy within the
Office of the Government has limited resources and
limited political clout when measures are not
fulfilled.
The administrative burden on businesses has been
reduced by 23 % by the end of 2012, when
compared to 2005 levels, narrowly missing the
25 % target. An eco-audit exercise is being
continued which aims at reducing unjustifiable
administrative and finance burdens on businesses
222 Law No 134/2013 Coll.
with respect to environmental legislation. Efforts
were also undertaken to consult with the business
sector on the most troublesome issues for
entrepreneurs.
Finally, in July 2012, the basic registry system, i.e.
the unifying of fragmented data stored by public
authorities, came into operation. As a result there
has been a rise in e-government use to 92 % of
businesses in 2012.
4.3.5 Finance and investment
SMEs tend to suffer the same difficulties in access
to finance as in other Member States, including
difficulties to obtain credit due to lack of collateral,
short business history etc. Moreover, the current
economic climate is causing banks to be more risk-
averse, leading to banks tightening credit. Banks
have recently launched a guarantee facility for
innovative start-ups. These types of projects tend to
be aimed towards companies with a high return and
have been taken up by solar energy, ICT, and
machinery sectors.
However, there is also a lack of seed and growth
capital, and so equity financing has been limited.
The Government, however, is to launch a venture
capital fund financed through the operational
programme enterprise and innovation. The fund
will have EUR 53 million at its disposal and
financing will go towards early stage financing and
growth capital. EUR 31.7 million will be dedicated
to early-stage funding, while the remaining EUR 21
million will go to growth capital, for more
developed companies. Private co-financing will
consist of 30 % for those applying for the seed
financing and 50 % for the growth financing. There
is significant interest from SMEs to take up these
funds. The aim is for the funds to become
operational at the end of 2013.
With respect to foreign direct investment, the
inflow was the highest in the last five years.
Investors have increased mostly reinvested profits
but also equity of their companies.223
The strong
inflow of direct investment has resulted in a
significant surplus in the financial account of the
balance of payments.
223 Czech Statistical Office.

Country chapter: Czech Republic
109
4.3.6 Conclusions
Issues pertaining to public administration, such as
an effective implementation of the anti-corruption
strategy and a robust public servants act, are some
of the major challenges. Sustainable industry and
improving the quality of education and skills are
also areas where there are significant challenges.
On the other hand, with respect to business
environment, it is encouraging that a venture capital
is being set up by the Government, given the lack
of such instruments in the past. There is keen
interest in this by enterprise and is likely to be taken
up rapidly.
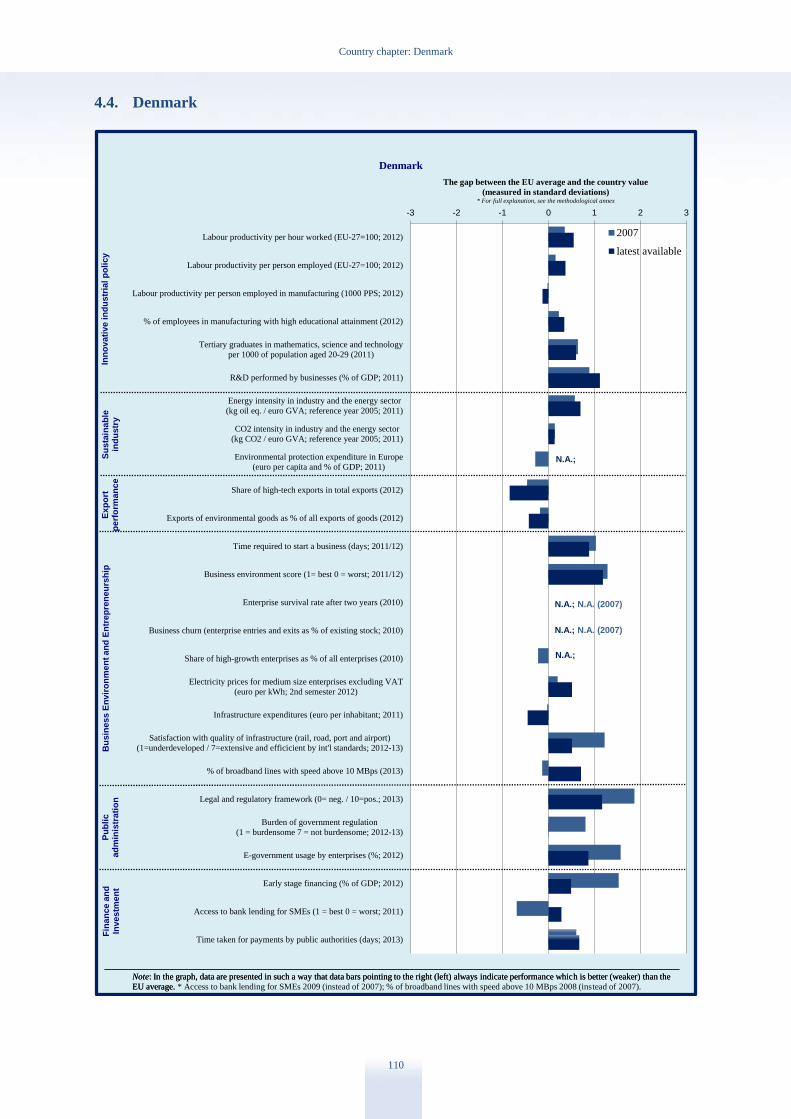
Country chapter: Denmark
110
4.4. Denmark
-3 -2 -1 0 1 2 3
Labour productivity per hour worked (EU-27=100; 2012)
Labour productivity per person employed (EU-27=100; 2012)
Labour productivity per person employed in manufacturing (1000 PPS; 2012)
% of employees in manufacturing with high educational attainment (2012)
Tertiary graduates in mathematics, science and technology
per 1000 of population aged 20-29 (2011)
R&D performed by businesses (% of GDP; 2011)
Energy intensity in industry and the energy sector
(kg oil eq. / euro GVA; reference year 2005; 2011)
CO2 intensity in industry and the energy sector
(kg CO2 / euro GVA; reference year 2005; 2011)
Environmental protection expenditure in Europe
(euro per capita and % of GDP; 2011)
Share of high-tech exports in total exports (2012)
Exports of environmental goods as % of all exports of goods (2012)
Time required to start a business (days; 2011/12)
Business environment score (1= best 0 = worst; 2011/12)
Enterprise survival rate after two years (2010)
Business churn (enterprise entries and exits as % of existing stock; 2010)
Share of high-growth enterprises as % of all enterprises (2010)
Electricity prices for medium size enterprises excluding VAT
(euro per kWh; 2nd semester 2012)
Infrastructure expenditures (euro per inhabitant; 2011)
Satisfaction with quality of infrastructure (rail, road, port and airport)
(1=underdeveloped / 7=extensive and efficicient by int'l standards; 2012-13)
% of broadband lines with speed above 10 MBps (2013)
Legal and regulatory framework (0= neg. / 10=pos.; 2013)
Burden of government regulation
(1 = burdensome 7 = not burdensome; 2012-13)
E-government usage by enterprises (%; 2012)
Early stage financing (% of GDP; 2012)
Access to bank lending for SMEs (1 = best 0 = worst; 2011)
Time taken for payments by public authorities (days; 2013)
The gap between the EU average and the country value
(measured in standard deviations)* For full explanation, see the methodological annex
Denmark
2007
latest available
Note: In the graph, data are presented in such a way that data bars pointing to the right (left) always indicate performance which is better (weaker) than the
EU average.
Inn
ovati
ve in
du
str
ial p
oli
cy
Su
sta
inab
lein
du
str
yB
usin
ess E
nvir
on
men
t an
d E
ntr
ep
ren
eu
rsh
ipF
inan
ce a
nd
Investm
en
t
Note: In the graph, data are presented in such a way that data bars pointing to the right (left) always indicate performance which is better (weaker) than the
EU average. * Access to bank lending for SMEs 2009 (instead of 2007); % of broadband lines with speed above 10 MBps 2008 (instead of 2007).
Ex
po
rtp
erf
orm
an
ce
Pu
bli
cad
min
istr
ati
on
N.A.;
N.A.; N.A. (2007)
N.A.;
N.A.; N.A. (2007)
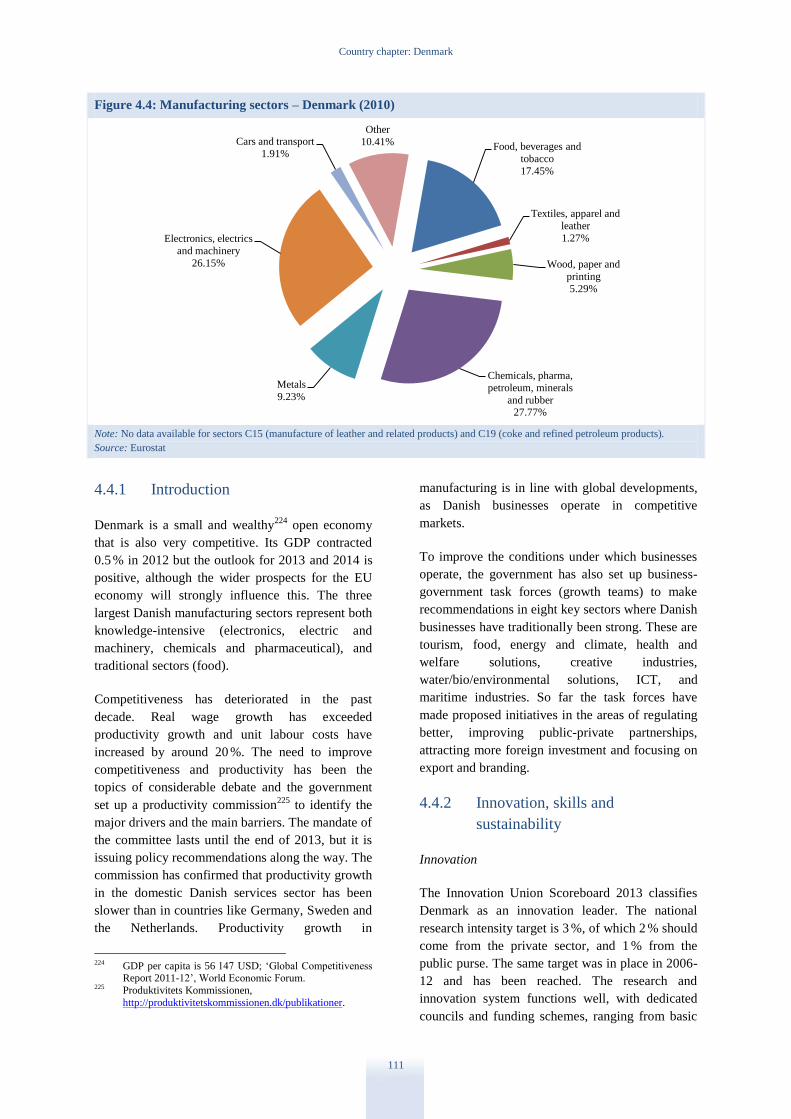
Country chapter: Denmark
111
Figure 4.4: Manufacturing sectors – Denmark (2010)
Note: No data available for sectors C15 (manufacture of leather and related products) and C19 (coke and refined petroleum products).
Source: Eurostat
4.4.1 Introduction
Denmark is a small and wealthy224
open economy
that is also very competitive. Its GDP contracted
0.5 % in 2012 but the outlook for 2013 and 2014 is
positive, although the wider prospects for the EU
economy will strongly influence this. The three
largest Danish manufacturing sectors represent both
knowledge-intensive (electronics, electric and
machinery, chemicals and pharmaceutical), and
traditional sectors (food).
Competitiveness has deteriorated in the past
decade. Real wage growth has exceeded
productivity growth and unit labour costs have
increased by around 20 %. The need to improve
competitiveness and productivity has been the
topics of considerable debate and the government
set up a productivity commission225
to identify the
major drivers and the main barriers. The mandate of
the committee lasts until the end of 2013, but it is
issuing policy recommendations along the way. The
commission has confirmed that productivity growth
in the domestic Danish services sector has been
slower than in countries like Germany, Sweden and
the Netherlands. Productivity growth in
224 GDP per capita is 56 147 USD; ‘Global Competitiveness
Report 2011-12’, World Economic Forum. 225 Produktivitets Kommissionen,
http://produktivitetskommissionen.dk/publikationer.
manufacturing is in line with global developments,
as Danish businesses operate in competitive
markets.
To improve the conditions under which businesses
operate, the government has also set up business-
government task forces (growth teams) to make
recommendations in eight key sectors where Danish
businesses have traditionally been strong. These are
tourism, food, energy and climate, health and
welfare solutions, creative industries,
water/bio/environmental solutions, ICT, and
maritime industries. So far the task forces have
made proposed initiatives in the areas of regulating
better, improving public-private partnerships,
attracting more foreign investment and focusing on
export and branding.
4.4.2 Innovation, skills and
sustainability
Innovation
The Innovation Union Scoreboard 2013 classifies
Denmark as an innovation leader. The national
research intensity target is 3 %, of which 2 % should
come from the private sector, and 1 % from the
public purse. The same target was in place in 2006-
12 and has been reached. The research and
innovation system functions well, with dedicated
councils and funding schemes, ranging from basic
Food, beverages and
tobacco
17.45%
Textiles, apparel and
leather
1.27%
Wood, paper and
printing
5.29%
Chemicals, pharma,
petroleum, minerals
and rubber 27.77%
Metals
9.23%
Electronics, electrics
and machinery
26.15%
Cars and transport
1.91%
Other
10.41%
Country chapter: Denmark
112
research to commercialisation and
entrepreneurship.226
The new innovation strategy that was launched in
December 2012 aims to improve effectiveness and
increase productivity. The strategy involves moving
to a simpler and more flexible research and
innovation system, in particular through the
integration of the existing research bodies. It also
focuses on research and development (R&D)
initiatives to support advanced manufacturing, such
as automation and robot technologies. By 2020, the
policy aim for Denmark is to be among the top five
OECD countries in terms of the proportion of
innovative firms, level of business investment in
R&D, and the proportion of firms that employ
highly-skilled workers. Reaching this goal would
require strong, consistent and long-term policies
Commercialisation of research is one of the weak
points of the Danish research and innovation
system, in particular taking new technologies into
marketable products. Stronger links between
research and businesses and more effective
knowledge transfer could help in combining
business skills to research and innovation
competencies. In practice, work along these lines is
progressing, and some of the Danish research
centres provide good examples of effective
cooperation.
Skills
On skills and education, Denmark has already
met227
its two headline objectives of the Europe
2020 strategy, as early school leaving rate was
9.1 %, and tertiary attainment rate was 43 %
(2012). However, the education system could be
more cost-effective, there is a lack of apprentice
places, and drop-out levels are high. Denmark is
above the EU targets in reading, mathematics and
science, but the performance in mathematics
worsened significantly between 2006 and 2009,
whereas the share of low-achievers in reading and
science fell during the same period.
To address the deficiencies, the main skills
initiatives are the youth package of August 2012
and the reform of the public school system
226 ERAC Peer Review of the Danish Research and
Innovation System Outcomes Report 2012. 227 ‘Rethinking education’, European Commission 2013.
launched in December 2012. The youth package
finances job rotations and apprenticeship
programmes to help young people improve their
skills to match industry demand.
The aim of the school reforms is to reduce early
school leaving through more hours spent on core
subjects such as Danish, maths and English, and
more emphasis on practical training.228
Furthermore, a committee of experts, including
representatives of trade unions and employers, is
due to make proposals in autumn 2013 to find a
solution to the problem of a lack of private
apprenticeships and high drop-out rates. There are
discussions on introducing flexible, shorter
vocational training cycles for the most vulnerable
learners. Denmark is one of the EU leaders in adult
participation in lifelong learning with a rate of
31.6 % in 2012 against an EU average of 9 %.
Sustainability
The national energy efficiency action plan sets out
the energy efficiency policies required to reach the
2050 target of achieving independence from fossil
fuels. Steps have been taken to increase the energy
efficiency of public buildings, increase green
procurement and make energy consumption and
energy savings more transparent. A long-term
roadmap sets out how the minimum energy
performance standards of buildings will be
improved. Some of the policies that apply to
industry include energy saving obligations and
higher tax rates for energy. Cars are also subject to
a high tax rate, as part of the ‘green transport’
policy.
4.4.3 Export performance
Danish exports are characterised by the large
proportion of food and beverages, albeit with a
focus on the higher value segments of these
markets. Exports of high-tech, higher value added
products have grown, although at a slower pace
than in many competing countries.
Between 2000 and 2012, Denmark lost export
market share in goods, partly reflecting the
228 The country-specific recommendation no 2 of 2013
specifically concentrated on the Danish education system.
http://ec.europa.eu/europe2020/making-it-
happen/country-specific-recommendations/index_en.htm.

Country chapter: Denmark
113
deteriorated competitiveness.229
More than two
thirds of exports go to other EU countries. Certain
sectors, including renewable energies and
pharmaceuticals, are likely to benefit from
increasing demand from outside Europe. However,
exports to the BRIC countries (Brazil, Russia,
India, and China) have not grown in line with the
opportunities provided by these countries, and the
government developed strategies to improve trade
and investment cooperation with them. It is also
focusing on its strengths and competencies in fields
such as climate and energy, architecture, research,
education and food.230
4.4.4 Business environment and public
administration
Business environment
An annual survey of investors231
tries to identify the
features of the economy that are the most attractive
for foreign businesses. The latest survey cited the
competent workforce as the most important reason
for investing in Denmark. Other reasons were R&D
competence, market access to Nordic countries and
to the EU in general, the flexible labour rules, and
the quality of infrastructure and services. The high
level of taxes and the high living costs were
investors’ main concerns.
The national regulatory framework is being
examined with a view to making life easier for
SMEs. A business forum advises the government
on how to reduce the administrative burden, and an
on-going impact assessment programme seeks to
ensure a net reduction in that administrative burden.
Furthermore, the Danish authorities have
established a market development fund to promote
growth, employment and exports, help SMEs to
bring new products to market and make it easier for
public institutions to purchase innovative products
and services.
The low level of competition in services and
construction lowers productivity growth and
229 ‘In-depth review for Denmark’, 2013, European
Commission. 230 ’Aftale om Danmark som vækstnation.’ Danish
Government (2011).
http://www.fm.dk/Nyheder/Pressemeddelelser/2011/05/~/media/Files/Nyheder/Pressemeddelelser/2011/05/Vaekstn
ation/Aftaletekst_danmark%20som%20vaekstnation.ashx. 231 ‘Invest in Denmark’, Danish Ministry for Foreign Affairs.
innovation. For construction, one reason seems to
be the national building standards that make it
difficult for foreign competitors to enter the market.
The government is seeking to address the issue by
enforcing competition legislation better,
modernising authorisation schemes and reforming
the national standards.
The Danish Competition and Consumer Authority
has identified four service markets that should be
further reformed, namely telecommunications,
postal services, taxis and pharmacies. The
competition policy package of October 2012
consisted of initiatives to tighten up the competition
law, including in public procurement. Options for
the liberalisation of pharmacies, taxis and plumbing
services are being analysed, and the extent of the
reforms remains to be decided. A new competition
act came into force in March 2013 that introduced
the possibility of custodial penalties and increased
fines in cartel cases.
The wholesale energy market was liberalised in
1999 and Denmark is part of the Nordic electricity
pool, with continuous spot trading. Since 2003
consumers have been able to switch their electricity
supplier, although only about 20 % have done so.
This has been due in part to regulations restraining
competition,232
in particular fixed retail prices that
do not fluctuate with the wholesale price. A number
of initiatives are expected to increase competition
and the government is considering abandoning the
regulation of the retail electricity prices. In 2014 the
network operators will become wholesale suppliers
of transport capacity, which implies that consumers
will only have to pay one bill regardless of whether
they have switched supplier or not. Smart meters
will be supplied to more than 50 % of users in the
next couple of years, and the government has
recommended that every consumer should have a
smart meter installed before 2020. With smart
meters, consumers will be able to choose a price
that fluctuates with the wholesale price. Taken
together, these measures are expected to increase
competition in the retail electricity market.
The tax reforms of 2009 and 2012 are gradually
lowering taxes on labour. In 2013, the government
announced that it would gradually reduce the
corporate tax rate from 25 % to 22 %, reduce excise
232 ‘Detailmarkedet for elektricitet’, Danish Competition and
Consumer Authority, 2011.
Country chapter: Denmark
114
duties on energy and packaging, and lower the costs
of waste water, and reintroduce previous tax credits
for construction work in private homes. These
measures have the potential to contribute to
stimulating demand, including for small-scale
construction work.
While it is relatively easy to start a company in
Denmark, stakeholders complain that the
administrative burden increases at the later stages
of firm life. This may be having an effect on the
survival rate of firms, as about half of them cease
operations within five years.233
Public administration
The public administration system performs well.
The indicators on government effectiveness,
corruption and fraud, business start-up and ease of
acquiring licenses, public procurement, tax
compliance and administration and civil justice are
all better than the EU average.234
Denmark ranks
sixth in the EU in terms of payment delays from
public authorities, with an average payment period
of less than 15 days.235
Widespread use is made of
ICT applications, modern human resources
management techniques and evidence-based
steering and planning instruments.
However, public procurement rules and practices
could be improved, as the burden on firms
participating in tenders is slightly above the EU
average, both in terms of costs and time needed. In
civil justice there seems to be room for
improvement as regards the costs of contract
disputes, including court costs, enforcement costs
and average legal fees.
4.4.5 Finance and investment
The financial sector is stable and banks are well
capitalised, but despite this, it seems unlikely that
lending to SMEs will get back to the pre-crisis level
in the near future.236
In 2012, the volume of
outstanding loans to non-financial corporations fell
by 2 % and the cumulative decrease since 2008
233 http://erhvervsstyrelsen.dk/file/291799/
Ivaerksaetterindeks-2012-endelig-version.pdf. 234 ‘Excellence in public administration for competitiveness
in EU Member States’, European Commission (2011-12). 235 ‘Industrial policy indicators and analysis — April 2013’,
European Commission. 236 Danish Business Authority (ERST).
amounts to almost 5 %.237
Access to loans has
become increasingly difficult for SMEs since the
beginning of the economic crisis and the rejection
rate for loan applications is 20 %, as against an EU
average of 15 %. The cost of credit for SMEs is
50 % higher than for large companies. This is likely
to deter SMEs from investing in research and
innovation, which will not help in solving the
identified problems with commercialising
research.238
Many newly established businesses find
it particularly difficult to find financing to build
proofs-of-concept, stage technological
demonstrations, and develop pilot lines. Another
potential concern as regards access to finance is that
Danish SMEs are often not well known, making it
difficult for them to attract investment.
The authorities have launched several initiatives239
to tackle the issue of access to finance. In
particular, loans to new businesses with high
growth potential are administered by Vækstfonden,
a fully state-owned investment fund. Second, there
is a credit guarantee scheme for smaller bank loans
of up to DKK 2 million for 2013-15. Third, the
Export Credit Fund will provide guarantees to help
finance export-oriented production facilities in
Denmark.
Furthermore, in the budget negotiations of 2013, an
agreement was reached to establish a special green
guarantee scheme of up to DKK 350 million. The
purpose of this scheme is to improve the conditions
and provide support to SMEs to finance new green
investment in resource efficiency and resource
recycling.
The latest initiative being launched by the Danish
government is the Growth Plan DK (April 2013)
that aims to improve the conditions under which
businesses operate. Several of the plan’s initiatives
target access to finance for SMEs, including
boosting the small growth guarantees by an
additional DKK 350 million. A new type of loan
will target skilled entrepreneurs with solid business
projects, providing additional funding of about
237 European Commission, Small Business Act Fact Sheet
2012. 238 As set out in the ‘Member States’ Competitiveness
Performance and Policies’ report of (European
Commission, 2012). 239 ‘Danish Growth Capital Fund’ (Dansk Vækstkapital, a
partially owned state investment fund), the ‘Development
Package’ (Udviklingspakken, March 2012) and a ‘Credit
Package’ (Kreditpakken, November 2012).
Country chapter: Denmark
115
DKK 1 billion in 2015-17. The guarantee capacity
of the Export Credit Fund has been increased, with
a further DKK 15 billion made available to finance
export projects and investment.
The government is also preparing a legislative
proposal to improve the Danish corporate bond
market. Legislation will be presented this year that
would allow the use of a representative (‘trustee’)
for bond issues. The government will also give
banks more opportunities to securitise corporate
loan portfolios.
4.4.6 Conclusions
Denmark is one of Europe’s most competitive
economies, with highly skilled workforce, strong
research and innovation capacity, flexible labour
rules and high-quality infrastructure as its strong
points. Danish exports are diversified, and
government policies seek to build on the identified
strengths. However, in the longer term, some
weaknesses in the education and training system
could endanger its position.
There is scope for improvement in the research and
innovation environment, as better links between
research and businesses could help investment in
research and innovation to be more effective. In this
spirit the new innovation strategy that was launched
in December 2012 aims to improve effectiveness
and increase productivity. Further, the low level of
competition in services and construction restricts
productivity growth and innovation and measures
are being taken to enforce competition legislation
and removing obstacles from competition.
The Danish public administration works well and
widespread use is made of ICT applications,
modern human resources management techniques
and evidence-based steering and planning
instruments.
In line with other Member States where access to
finance is a problem, the government has taken
measures to improve the provision of publicly
funded financial instruments for SMEs and widen
the potential financing sources, in particular for
SMEs.

Country chapter: Germany
116
4.5. Germany
-3 -2 -1 0 1 2 3
Labour productivity per hour worked (EU-27=100; 2012)
Labour productivity per person employed (EU-27=100; 2012)
Labour productivity per person employed in manufacturing (1000 PPS; 2012)
% of employees in manufacturing with high educational attainment (2012)
Tertiary graduates in mathematics, science and technology
per 1000 of population aged 20-29 (2010)
R&D performed by businesses (% of GDP; 2011)
Energy intensity in industry and the energy sector
(kg oil eq. / euro GVA; reference year 2005; 2011)
CO2 intensity in industry and the energy sector
(kg CO2 / euro GVA; reference year 2005; 2011)
Environmental protection expenditure in Europe
(euro per capita and % of GDP; 2009)
Share of high-tech exports in total exports (2012)
Exports of environmental goods as % of all exports of goods (2012)
Time required to start a business (days; 2011/12)
Business environment score (1= best 0 = worst; 2011/12)
Enterprise survival rate after two years (2010)
Business churn (enterprise entries and exits as % of existing stock; 2010)
Share of high-growth enterprises as % of all enterprises (2010)
Electricity prices for medium size enterprises excluding VAT
(euro per kWh; 2nd semester 2012)
Infrastructure expenditures (euro per inhabitant; 2011)
Satisfaction with quality of infrastructure (rail, road, port and airport)
(1=underdeveloped / 7=extensive and efficicient by int'l standards; 2012-13)
% of broadband lines with speed above 10 MBps (2013)
Legal and regulatory framework (0= neg. / 10=pos.; 2013)
Burden of government regulation
(1 = burdensome 7 = not burdensome; 2012-13)
E-government usage by enterprises (%; 2012)
Early stage financing (% of GDP; 2012)
Access to bank lending for SMEs (1 = best 0 = worst; 2011)
Time taken for payments by public authorities (days; 2013)
The gap between the EU average and the country value
(measured in standard deviations)* For full explanation, see the methodological annex
Germany
2007
latest available
Note: In the graph, data are presented in such a way that data bars pointing to the right (left) always indicate performance which is better (weaker) than the
EU average.
Inn
ovati
ve in
du
str
ial p
oli
cy
Su
sta
inab
lein
du
str
yB
usin
ess E
nvir
on
men
t an
d E
ntr
ep
ren
eu
rsh
ipF
inan
ce a
nd
Investm
en
t
Note: In the graph, data are presented in such a way that data bars pointing to the right (left) always indicate performance which is better (weaker) than the
EU average. * Access to bank lending for SMEs 2009 (instead of 2007); % of broadband lines with speed above 10 MBps 2008 (instead of 2007).
Ex
po
rtp
erf
orm
an
ce
Pu
bli
cad
min
istr
ati
on
3.6
N.A.; N.A. (2007)
N.A. (2007)

Country chapter: Germany
117
Figure 4.5: Manufacturing sectors – Germany (2010)
Source: Eurostat
4.5.1 Introduction
Manufacturing plays an important role in the
German economy and contributes 22.3 % to the
total value added, as compared with an average of
15.3 % in the EU as a whole.240
Germany is
particularly specialised in technology-driven and
capital-intensive industries. The World Economic
Forum’s Global Competitiveness Report ranks the
country in fourth place.241
Cost competitiveness has
improved over the last decade, as indicated by a
depreciation of the real effective exchange rate.
Labour productivity per hour worked is about 24
percentage points above the EU average and about
11 percentage points above the euro-area
average.242
Overall, industry is very competitive,
although it faces important challenges in securing
its competitive position in both the medium and
long term.
240 Eurostat data for 2012. 241 http://www.weforum.org/issues/global-competitiveness. 242 Eurostat data for 2012.
4.5.2 Innovation, skills and
sustainability
Innovation
The Innovation Union Scoreboard 2013243
confirmed Germany’s position among the
‘innovation leaders’ of the EU.244
Despite the
overall good performance, a decline was observed
in non-R&D innovation expenditure and sales of
new-to-market and new-to-firm innovations. The
capacity of Germany’s industry to innovate – and to
remain at the technological frontier – is of
increasing importance in securing Germany’s
competitive position. Innovation strategies of small
and medium-sized enterprises (SMEs) often
concentrate on high value added and high-quality
products in niche markets. The resulting
innovations are often modifications or further
developments, and not so much real market
innovations.245
243 Innovation Union Scoreboard 2013,
http://ec.europa.eu/enterprise/policies/innovation. 244 Together with Denmark, Finland and Sweden. 245 KFW Economic Research, To be the leader of the pack?
Innovation strategies in the SME sector, November 2012
https://www.kfw.de.
Food, beverages and
tobacco
7.78%
Textiles, apparel and
leather
1.43%
Wood, paper and
printing
5.09%
Chemicals, pharma,
petroleum, minerals
and rubber 20.47%
Metals
13.14%
Electronics, electrics
and machinery
28.45%
Cars and transport
16.71%
Other
6.94%
Country chapter: Germany
118
Germany is close to achieving its R&D expenditure
target of 3 % of GDP,246
but some leading
economies are investing even more in research and
innovation, and emerging markets are catching up
in traditional areas of competence. The Expert
Commission on Research and Innovation appointed
by the federal government has recommended
increasing the R&D expenditure target to 3.5 %.247
Moreover, significant disparities exist at regional
level in terms of R&D investments as well as
innovation performance.
The High-Tech Strategy 2020248
defines the central
goals of research and innovation policy. It
concentrates public R&D resources for scientific
and technological research in areas that face
particular global challenges.249
The strategy also
supports the development of key enabling
technologies, which act as drivers of innovation and
provide the basis for new products, processes and
services. Some stakeholders consider that the
strategy could be further strengthened, including by
increasing awareness and involvement of SMEs.250
The Central Innovation Programme for SMEs251
has been a success in helping SMEs, in particular in
enhancing their research and innovation efforts to
develop new products, processes and services. Over
10 000 companies have been supported so far.252
Skills
Skill shortages are emerging in various sectors and
regions; these are becoming an increasingly
important obstacle to future growth and innovation
performance, in particular for SMEs.253
A way to
246 R&D intensity in 2011: 2.9 % of GDP with about two-
thirds by the private sector (Eurostat). 247 Expertenkommission Forschung und Innovation (EFI),
ʻJahresgutachten zu Forschung, Innovation und technologischer Leistungsfähigkeit Deutschlands 2013ʻ.
http://www.e-fi.de/gutachten.html. 248 High-Tech Strategy 2020 for Germany
http://www.hightech-strategie.de. 249 These include energy and climate protection, health and
nutrition, mobility, security and communication. 250 http://www.e-fi.de/gutachten.html and
http://www.dihk.de/innovationsreport. 251 ʻZentrales Innovationsprogramm Mittelstandʼ
http://www.zim-bmwi.de. For 2013, the planned annual
budget is EUR 500 million, which is estimated to finance
about 5 000 new applications. 252 The Association of German Chambers of Commerce and
Industry identifies the programme in its ‘Innovation
Report 2012’ as a ‘best practice’ example; http://www.dihk.de.
253 See also the Staff Working Document ‘Assessment of the
2013 national reform programme and stability
alleviate these shortages would be to labour market
participation through better the education and
training.254
Current initiatives on skills have
recognised that mobilising domestic labour
potential will not be sufficient and that economic
progress will also depend on attracting skilled
workers from other EU and non-EU countries. The
introduction of a nationally standardised system for
the assessment of qualifications acquired in foreign
countries helps in this respect.255
A recent report noted some positive developments
but also highlighted that further progress will be
necessary.256
Measures include an information
campaign257
and a web portal258
to provide
information on job opportunities and the conditions
for taking up employment in Germany. The
University Pact aims to better use all available
capacities; the “Qualitätspakt Lehre” improves
teaching; and the “Ausbildungspakt” has been
extended until 2014 to ensure additional 60 000
training places a year. A competence centre has
been established to support SMEs in attracting and
retaining skilled employees.259
Moreover, a new
employment regulation aims to make it easier for
medium-skilled people to work in Germany,
supplementing the ‘blue card’ for highly-qualified
workers introduced in 2012.
Sustainability
Overall, the environmental performance of industry
can be characterised as good, but further
improvements should still be possible. Green
technologies, products and services play an
increasingly important role. In 2012, about 34 % of
companies offered green products or services,
compared to 26 % in the EU.260
In 2012, a resource
programme for Germany’, http://ec.europa.eu/europe2020.
254 Commision Staff Working Document to assess the
National Reform Programme 2013. 255 Bundesarbeitsagentur ʻPerspektive 2025: Fachkräfte für
Deutschlandʼ, http://www.arbeitsagentur.de.;
Berufsqualifikationsfeststellungsgesetz (2011). 256 ʻFortschrittsbericht 2012 zum Fachkräftekonzept der
Bundesregierungʻ http://www.bmas.de. 257 ʻFachkräfteoffensiveʻ http://www.bundesregierung.de. 258 http://www.make-it-in-germany.com. 259 ʻKompetenzzentrum Fachkräftesicherung, Unterstützung
für kleine und mittlere Unternehmenʻ http://www.kompetenzzentrum-fachkraeftesicherung.de.
260 Flash Eurobarometer 2012, European Commission,
http://ec.europa.eu/public_opinion.
Country chapter: Germany
119
efficiency programme261
was adopted, aimed at
further improving the environmental performance
of industry. The dependence on high quality raw
materials of many industry sectors, and further
price increases, could weigh on the competitiveness
of German industry in the future.
The new energy strategy opens the door to new
growth opportunities for German industry, but it
also involves significant challenges. Electricity
prices are already among the highest in Europe.262
If the energy strategy is to be successful, overall
economic costs need to be minimised, including by
increasing the cost-effectiveness of renewable
energy, by stimulating competition in energy
markets, by further enhancing energy efficiency
and by improving the coordination of its energy
policy with neighbouring countries. The timely
deployment of the required infrastructure is an
important prerequisite for achieving the strategy’s
objectives.263
Due to its size, the public procurement system has
considerable potential to support the deployment of
environmentally friendly products. Public
procurement is increasingly integrating innovation
and sustainability aspects.264
For example, current
legislation requires high standards of energy
efficiency performance.265
Since 2012, a
competence centre has assisted federal, regional
and local administrations in integrating
sustainability aspects in their procurement
processes. In addition, in early 2013, a competence
centre for innovative public procurement was
launched.266
4.5.3 Export performance
Overall, Germany accounts for 23.6 % of EU
exports.267
In 2012, motor vehicles and their parts
were the main export products (accounting for
17.3 % of exports), followed by machinery (15.0 %)
and chemical products (9.5 %). About 69 % of
261 ʻDeutsches Ressourceneffizienzprogramm (ProgRess)ʻ,
http://www.bmu.de. 262 DG Energy, Market observatory & Statistics:
http://ec.europa.eu/energy/observatory/index_en.htm. 263 See also the Staff Working Document Assessment of the
2013 national reform programme and stability programme for Germany, http://ec.europa.eu/europe2020.
264 Allianz für nachhaltige Beschaffung, http://www.bmwi.de. 265 Novellierte Vergabeverordnung (VgV), 20 August 2011. 266 http://bmwi.de/DE/Themen/Technologie/innovation-
beschaffungswesen.html. 267 Eurostat, 2012.
exports went to European countries. The second
most important sales market was Asia (about 16 %),
followed by the Americas (about 12 %). In 2012,
exports increased by 3.4 %.268
Compared with the
EU average, German SMEs tend to be more active
internationally269
and their relatively strong
presence in emerging markets indicates further
growth potential.
The federal government supports the
internationalisation of businesses, especially SMEs,
through a wide range of measures, including by
providing information about key export markets
and customs procedures, but also through trade fairs
and export credit guarantees.270
Of particular
importance is the support provided by chambers of
commerce and other craft and business
associations, both in Germany and abroad. The
iXPOS internet portal271
serves enterprises as a one-
stop shop for information on how to expand their
business abroad. In recent years, the initiative ‘new
target markets’272
has focused on increasing the
presence of German businesses in new emerging
markets beyond the BRIC countries.
4.5.4 Business environment and public
administration
Business environment
In general, the business environment is favourable,
encouraging the competitiveness of enterprises,
although there may still be scope for further
improvement in some areas. It scores particularly
well for overall satisfaction with the quality of
infrastructure, while it is around average for the
administrative burden of the regulatory
framework.273
The business environment is also favourable for
entrepreneurial activities, and there are federal and
regional programmes in place to support the
development of SMEs through a broad range of
services. Due to low unemployment, emerging skill
shortages and demographic trends, however, the
268 Statistisches Bundesamt, https://www.destatis.de. 269 Small Business Act Fact Sheets, European Commission,
http://ec.europa.eu/enterprise/policies/sme. . 270 http://www.bmwi.de/DE/Themen/Aussenwirtschaft. 271 http://www.ixpos.de. 272 Initiative Neue Zielmärkte
http://www.bmwi.de/DE/Themen/Aussenwirtschaft. 273 Germany is ranked 20th of 185 in the World Bank Doing
Business 2013 report.
Country chapter: Germany
120
number of entrepreneurs274
is expected to decline
further, which could hamper Germany’s future
growth and innovation performance. Moreover,
women still represent only one-third of
entrepreneurs, indicating further untapped potential.
A systematic integration of entrepreneurship in the
school curriculum could contribute to reversing this
trend.
Germany is systematically assessing the
administrative burden associated with newly
proposed regulations at federal level. An expert
committee scrutinises new legislative proposals and
publishes an index of estimated overall changes in
compliance costs.275
According to this index,
overall compliance costs have increased by
EUR 1.3 billion since 2011. So far, not all the
simplification measures agreed by the federal
government in December 2011 have been
implemented.276
Defining a new target for
additional simplification measures could help
stimulate this process. Recently, there has been
progress in defining standards for e-government
and electronic invoicing.
Overall, the tax system is relatively complex. While
Germany still scores slightly better than the EU
average in terms of the tax compliance burden,
SMEs in particular would benefit from further
simplification. Despite the complexity of the tax
system, the corresponding administrative costs are
less than the EU average.277
There is scope for further increasing competition in
the services sector.278
While competition has
increased noticeably in telecommunications, it
seems to be making less headway in other sectors,
including in particular postal and railway
services.279
In 2012, the long-distance bus transport
market was partially opened up, which may in time
contribute to stimulating competition in the
passenger transport sector. Market transparency
agencies are currently being set up to ensure better
274 DIHK-Gründerreport 2012, http://www.dihk.de. 275 http://www.normenkontrollrat.bund.de. 276 Eckpunkte zur weiteren Entlastung der Wirtschaft von
Bürokratiekosten, 14 December 2011
http://www.bundesregierung.de. 277 Paying Taxes Report 2013, World Bank. Costs measured
as a percentage of tax receipts: Germany 0.8 %, EU
average 1.3 %. 278 See also the Staff Working Document Assessment of the
2013 national reform programme and stability
programme for Germany, http://ec.europa.eu/europe2020. 279 www.monopolkommission.de.
monitoring of competition and pricing in the fuel,
gas and electricity sector.280
Public administration
Overall, Germany has an efficient and transparent
public administration281
and the perceived quality
of public services is ranked above the EU average.
Nevertheless, there is still scope for further
improvement in certain areas.
In general, enterprises benefit from relatively short
payment times by public authorities.282
Also public
procurement processes seem to be well-organised
and transparent, although they often remain
complex and the value of the contracts published
under EU procurement legislation is below the EU
average.283
Although the online availability of both information
and basic public services seems satisfactory, small
enterprises still use e-government services less
often than their counterparts in some other Member
States.284
While the time required and costs for
starting a business and for obtaining the necessary
licences are broadly in line with the EU average,
there may still be room for further simplification.
Moreover, the single points of contact differ across
Länder in terms of procedures and information
provided, indicating possible scope for further
improvement.
4.5.5 Finance and investment
German businesses mainly rely on bank loans. At
the moment, access to bank finance is good and,
given the current level of interest rates, firms
(including SMEs) benefit from very favourable
financing conditions.285
While the availability of
risk capital is broadly in line with the EU average,
there is potential to do better in this respect.286
Risk
280 www.bundeskartellamt.de. 281 European Commission, Excellence in public
administration for competitiveness in EU Member States,
http://ec.europa.eu/enterprise/policies/industrial-
competitiveness/monitoring-member-states. 282 European Payment Index, Intrum Justitia. 283 European Commission, Cost and effectiveness of public
procurement in Europe, http://ec.europa.eu/internal_market.
284 Survey on ICT use, 2012, Eurostat. 285 European Central Bank (2013), Bank lending survey and
Survey on the access to finance of SMEs in the euro area. 286 European Commission, SME Access to Finance Index,
http://ec.europa.eu/enterprise/policies/finance.

Country chapter: Germany
121
capital is particularly important for fast-growing,
innovative start-ups in the ICT and other high-tech
sectors.287
Publicly funded programmes provide
new firms with a range of financing instruments to
start and develop their business, and a number of
additional measures were introduced in 2012 and
2013.288
It remains to be seen if these additional
measures can further stimulate the relatively under-
developed risk capital market. While changes in the
regulatory framework may further contribute to
promoting private investment, market
characteristics and cultural aspects also seem to be
important factors.
The Germany Trade and Investment Agency289
provides international investors with a wide range
of information and support services. Of all FDI
stocks, 76 % originate from within the EU. North
America accounts for about 10 %, while Asia holds
a 5 % share. Investments from outside the EU,
especially Asian countries, continue to grow.
4.5.6 Conclusions
Overall, Germany ranks among the top performers
in many of the competitiveness indicators of the
Industrial Performance Scoreboard and the
manufacturing sector remains one of the key drivers
of value added and employment. Firms benefit
greatly from a favourable and stable business
environment, a strong competitive position, and the
global reach of Germany’s external trade. While the
regulatory environment is generally good, there is
room for improvement and SMEs in particular
would benefit from further simplification.
Despite the currently favourable conditions,
industry faces important challenges in securing its
287 Studie über schnell wachsende Jungunternehmen
(Gazellen), February 2012, Federal Ministry of
Economics and Technology, http://www.existenzgruender.de.
288 The most important existing programmes which provide
financing for start-up companies include the High-Tech Gründerfonds, the ERP Startfonds and the various
programmes under the EXIST initiative.
In 2012 the European Angels Fund Germany was launched in cooperation with the European Investment
Bank. Since March 2013, the WIN programme by KFW
Bank can provide additional later stage financing of up to EUR 5 million per company. Finally, since May 2013, the
new programme Investitionszuschuss Wagniskapital has
been able to provide private investors — particularly business angels — with financial incentives of up to 20 %
of their investments in young and innovative companies. 289 Germany Trade and Invest, http://www.gtai.de.
competitiveness in the medium and long term. In
particular, demographic challenges may act as a
brake on growth and innovation in the future.
Moreover, the declining number of entrepreneurs
could have an increasingly negative impact over
time. At the global level, Germany is in danger of
losing ground as emerging markets are catching up
in its traditional areas of competence. In order to
remain at the technological frontier and to secure its
competitive position in the future, continued
investments in education, R&D and innovation are
essential.
The new energy strategy is creating growth
opportunities for many sectors, but also presenting
considerable challenges in terms of energy costs,
and timely deployment of the required
infrastructure.
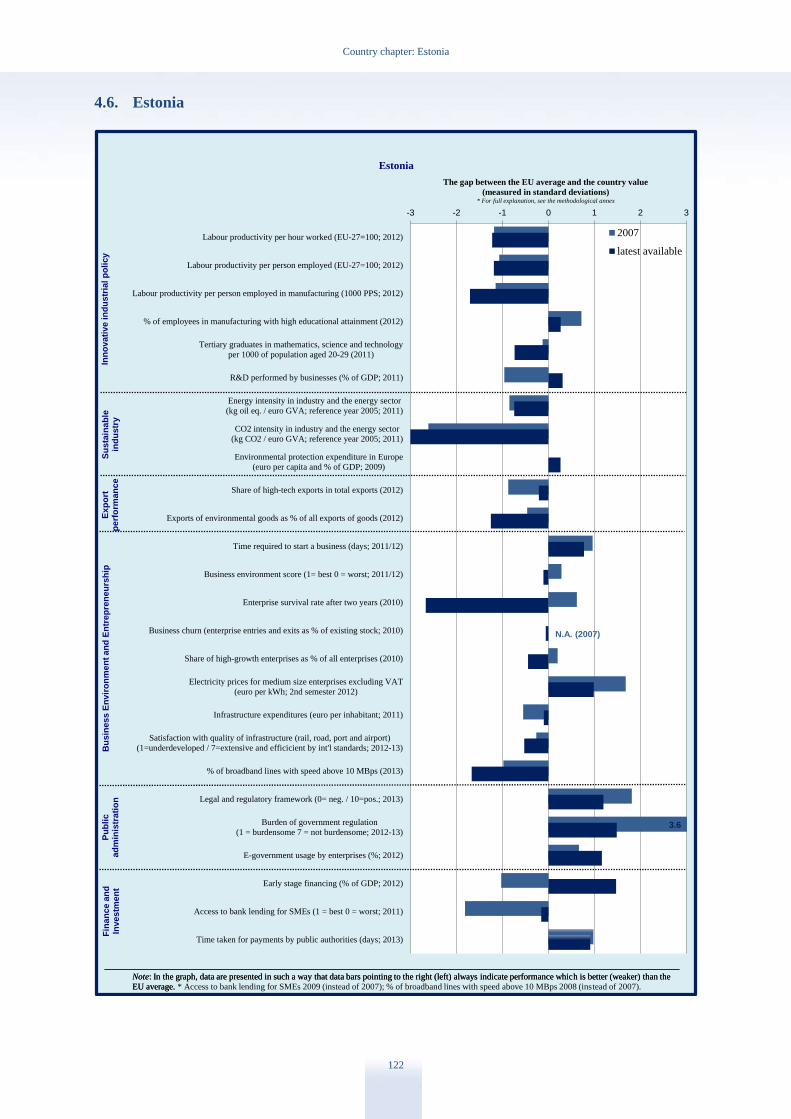
Country chapter: Estonia
122
4.6. Estonia
-3 -2 -1 0 1 2 3
Labour productivity per hour worked (EU-27=100; 2012)
Labour productivity per person employed (EU-27=100; 2012)
Labour productivity per person employed in manufacturing (1000 PPS; 2012)
% of employees in manufacturing with high educational attainment (2012)
Tertiary graduates in mathematics, science and technology
per 1000 of population aged 20-29 (2011)
R&D performed by businesses (% of GDP; 2011)
Energy intensity in industry and the energy sector
(kg oil eq. / euro GVA; reference year 2005; 2011)
CO2 intensity in industry and the energy sector
(kg CO2 / euro GVA; reference year 2005; 2011)
Environmental protection expenditure in Europe
(euro per capita and % of GDP; 2009)
Share of high-tech exports in total exports (2012)
Exports of environmental goods as % of all exports of goods (2012)
Time required to start a business (days; 2011/12)
Business environment score (1= best 0 = worst; 2011/12)
Enterprise survival rate after two years (2010)
Business churn (enterprise entries and exits as % of existing stock; 2010)
Share of high-growth enterprises as % of all enterprises (2010)
Electricity prices for medium size enterprises excluding VAT
(euro per kWh; 2nd semester 2012)
Infrastructure expenditures (euro per inhabitant; 2011)
Satisfaction with quality of infrastructure (rail, road, port and airport)
(1=underdeveloped / 7=extensive and efficicient by int'l standards; 2012-13)
% of broadband lines with speed above 10 MBps (2013)
Legal and regulatory framework (0= neg. / 10=pos.; 2013)
Burden of government regulation
(1 = burdensome 7 = not burdensome; 2012-13)
E-government usage by enterprises (%; 2012)
Early stage financing (% of GDP; 2012)
Access to bank lending for SMEs (1 = best 0 = worst; 2011)
Time taken for payments by public authorities (days; 2013)
The gap between the EU average and the country value
(measured in standard deviations)* For full explanation, see the methodological annex
Estonia
2007
latest available
Note: In the graph, data are presented in such a way that data bars pointing to the right (left) always indicate performance which is better (weaker) than the
EU average.
Inn
ovati
ve in
du
str
ial p
oli
cy
Su
sta
inab
lein
du
str
yB
usin
ess E
nvir
on
men
t an
d E
ntr
ep
ren
eu
rsh
ipF
inan
ce a
nd
Investm
en
t
Note: In the graph, data are presented in such a way that data bars pointing to the right (left) always indicate performance which is better (weaker) than the
EU average. * Access to bank lending for SMEs 2009 (instead of 2007); % of broadband lines with speed above 10 MBps 2008 (instead of 2007).
Ex
po
rtp
erf
orm
an
ce
Pu
bli
cad
min
istr
ati
on
3.6N.A. (2007)
3.6
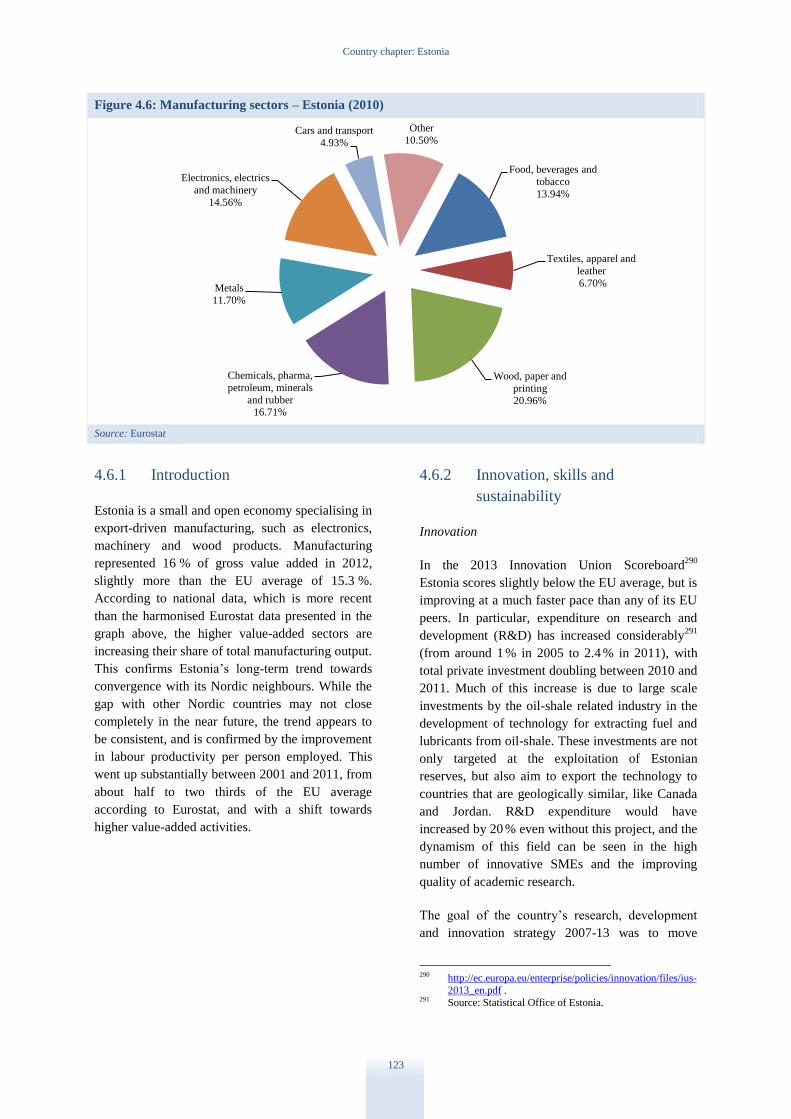
Country chapter: Estonia
123
Figure 4.6: Manufacturing sectors – Estonia (2010)
Source: Eurostat
4.6.1 Introduction
Estonia is a small and open economy specialising in
export-driven manufacturing, such as electronics,
machinery and wood products. Manufacturing
represented 16 % of gross value added in 2012,
slightly more than the EU average of 15.3 %.
According to national data, which is more recent
than the harmonised Eurostat data presented in the
graph above, the higher value-added sectors are
increasing their share of total manufacturing output.
This confirms Estonia’s long-term trend towards
convergence with its Nordic neighbours. While the
gap with other Nordic countries may not close
completely in the near future, the trend appears to
be consistent, and is confirmed by the improvement
in labour productivity per person employed. This
went up substantially between 2001 and 2011, from
about half to two thirds of the EU average
according to Eurostat, and with a shift towards
higher value-added activities.
4.6.2 Innovation, skills and
sustainability
Innovation
In the 2013 Innovation Union Scoreboard290
Estonia scores slightly below the EU average, but is
improving at a much faster pace than any of its EU
peers. In particular, expenditure on research and
development (R&D) has increased considerably291
(from around 1 % in 2005 to 2.4 % in 2011), with
total private investment doubling between 2010 and
2011. Much of this increase is due to large scale
investments by the oil-shale related industry in the
development of technology for extracting fuel and
lubricants from oil-shale. These investments are not
only targeted at the exploitation of Estonian
reserves, but also aim to export the technology to
countries that are geologically similar, like Canada
and Jordan. R&D expenditure would have
increased by 20 % even without this project, and the
dynamism of this field can be seen in the high
number of innovative SMEs and the improving
quality of academic research.
The goal of the country’s research, development
and innovation strategy 2007-13 was to move
290 http://ec.europa.eu/enterprise/policies/innovation/files/ius-
2013_en.pdf . 291 Source: Statistical Office of Estonia.
Food, beverages and
tobacco
13.94%
Textiles, apparel and
leather
6.70%
Wood, paper and
printing
20.96%
Chemicals, pharma,
petroleum, minerals
and rubber 16.71%
Metals
11.70%
Electronics, electrics
and machinery
14.56%
Cars and transport
4.93%
Other
10.50%
Country chapter: Estonia
124
upwards in the international value chain. Recent
data has rewarded this decision: highly skilled, high
value-added industries have weathered the crisis
better and have recovered faster. Furthermore, as
the labour pool is set to shrink in the future, a shift
from labour-intensive to innovative and capital-
intensive sectors will be necessary. Estonia is
unlikely to be able to compete on the basis of
labour costs in the long term.
Support programmes for innovative enterprises are
continuing, although with a more targeted
approach. In 2014-20 the government will focus on
market segments that appear more promising (smart
specialisation), and on key companies (based on
their importance to the economy and their growth
potential). The segments identified are ICT as a key
enabling technology, i.e. with the potential to
support other sectors; health and medical
technologies; and the efficient use of resources. The
latter category includes healthy food, smart
housing, materials science, shale oil and chemistry.
Targeted support makes it easier to access finance
but also to tap into skills and knowledge, such as
through strategic partners. The strategy is mostly
being implemented by Enterprise Estonia, which
will gradually move from being a simple grant
provider to playing a more strategic and active role.
Rather than just financing a project, it will help to
shape it in a way that increases its chances of
success. The Estonian development fund will
monitor the smart specialisation process; the
strategy could be further enhanced by stronger
inter-ministerial cooperation.
Skills
One of the priorities for the economy is to reduce
the skills mismatch,292
as these lead to the
coexistence of unemployment and unfilled
positions. Also the longer-term demographic
challenges require adaptations. Areas where skills
are lacking include the high-tech sectors,
management, and specialised crafts. To improve the
situation, Estonia has modernised its vocational
education and training293
, and has undertaken other
292 The parliament is discussing a VET Institutions Act and
the government is studying a Life-Long Learning Strategy for 2014-20.
293 The VET Institutions Act to be adopted and implemented
by September 2013.
initiatives, for example on ICT skills.294
Lifelong
learning capacity has been strengthened but there is
room for further improvements.295
A task force was
set up in 2012 to investigate the situation, draw up
forecasts of future demand for skills, target the right
sectors and groups, and provide the necessary
support and financing. The government will
provide a quantitative forecast of demand for skills,
and the Estonian Qualifications Authority will map
the occupational fields and develop the required
qualification standards. The first steps are a register
of competencies in the state register of occupational
qualifications, and a link between online registers,
with full implementation of the scheme foreseen for
2014-15.
One of the main bottlenecks in the economy is a
dearth of trained managers who have experience in
customer management and can call on a network of
contacts. The current initiatives to increase the
supply of qualified technical personnel, such as
scholarships for students in the technical fields
where the demand is greatest, are unlikely to solve
this problem. Estonian companies have indicated
that it is easier for them to produce interesting
technology than to find a market for it, or to find
the managerial skills needed to grow and
internationalise a business. Training providers and
the government are aware of the issue, and are
trying to remedy it. However, this is a long-term
project; in the short term, many companies are
forced to bring in expertise from abroad. This
solution might lead to companies leaving the
country, as foreign managers can be less committed
to Estonia, but can still have positive effects: for
example, Skype kept development in Estonia
despite the headquarters being moved elsewhere.
Procedures for hiring foreign workers in sectors
with high demand have been streamlined. Foreign
workers are able to enter and work in Estonia
before the paperwork has been completed, instead
of waiting abroad.
294 Updating the ICT skills of students and teachers; “Õppiv
Tiiger” - The Learning Tiger Programme 2008-13 in
general as well as vocational education and the
“Tiigriülikool” Tiger Programme 2009-12 in higher education.
295 Adult participation in lifelong learning has increased from
6.5 % in 2006 to 12.9 % in 2012. But it remains much lower for the 50+ age group and the population of Russian
origin. A new national LLL Strategy for 2014-20 is under
discussion.
Country chapter: Estonia
125
Sustainability
As regards the sustainability of its industrial policy,
Estonia lags behind the EU average in terms of the
energy intensity of GDP. This is largely due to the
oil shale industry, which accounts for a high
proportion of the energy mix. In addition, the
district heating system uses energy inefficiently.
The government is developing plans to reduce
energy consumption and to let efficient users sell
the resulting CO2 permits, as successfully done with
the creation of an electric car pool (500 cars) for
social workers, a project including also purchase
grants for private persons and a quick charging
network to cover the whole country. The related
CO2 permits have been sold, and the project had
also a spin-off effect, as Mitsubishi established a
research project on electric car batteries and their
performance in cold climates. The most advanced
new project is for upgrading street lighting.
Given the low energy efficiency of residential
buildings and businesses, there is potential for
economically sound environmental policies.
However these need to be supported with the
necessary technical skills. To achieve this, a
certification system for energy auditors is planned.
This should improve the technical expertise through
government-approved training schemes. However,
there are financial constraints to be overcome.
SMEs tend to have a short time horizon and limited
funds, and therefore might not be interested in
investing in energy efficiency even when their
payback time is relatively short. Therefore,
KredEx296
will provide loans to support such
investment.
Road transportation has very low energy efficiency,
but for now there is no political will to introduce
vehicle taxation to foster the use of smaller and/or
more energy-efficient cars or to favour energy-
efficient alternatives, as this would be unpopular
among Estonians. Noticeable progress has been
made with upgrades to the public transport fleet
under the national environmentally-friendly
investment programme for 2007-14. The passenger
train fleet will gradually be replaced, with the first
units already operating. The Tallinn tramway and
bus infrastructure is being renovated, with new
trams and buses purchased. Many buses operating
296 The Estonian SME finance institution.
elsewhere under public service contracts have been
replaced.
The green innovation programme will help to create
and distribute green products and services, with a
strong focus on ICT. The programme is supported
by a EUR 6 million grant from Innovation Norway,
and is managed by Energy Estonia. However,
effectiveness of these measures is hindered by the
fact that share of trips made by public transport
continues to drop in Estonia.
4.6.3 Export performance
Estonian exports have one of the highest shares of
GDP in the EU and how exports perform is
correspondingly important. The recovery that
followed the 2009 recession was mainly driven by
exports as domestic demand remained weak.
Recently manufacturing production has continued
to increase relatively strongly, growing 2.7 %297
in
April 2013 year-on-year, but it has been partly
driven by a surge in domestic demand.
Consequently, the current account balance has
deteriorated, moving from 3.2 % of GDP in 2010 to
-3.1 % of GDP in 2012, and is expected298
to stay
negative in 2013 and 2014 as well.
The policy of moving up the value added chain
seems to have brought results. In 2012,299
the
proportion of medium- to high-tech exports
increased substantially, with electronics and
electrical equipment representing 33.4 % of the
total. Some of these exports reflect sub-contracting
by multinationals and are not a sign of local
technology development, but still add value. As
international firms move more sophisticated
functions to Estonia, goods produced by or for them
will add more and more value.
Exporters are supported by two main agencies,
KredEx and Enterprise Estonia, with the first
focusing on credit insurance and the other on
finance. Enterprise Estonia also offers information
and skills development services, including specific
297 Source: Eurostat data reported in the Euro area monthly
note on industrial production available at
http://epp.eurostat.ec.europa.eu/cache/ITY_PUBLIC/4-12062013-AP/EN/4-12062013-AP-EN.PDF.
298 EU spring forecast, as well as Eurostat data, both
available at http://ec.europa.eu/economy_finance/eu/forecasts/2013_s
pring_forecast_en.htm 299 Source: Statistical Office of Estonia.
Country chapter: Estonia
126
services for selected target markets. The penetration
of the support measures appears to be excellent.
According to government estimates, companies
accounting in total for 50 % of exports are clients of
Enterprise Estonia, while KredEx clients account
for more than 5 % of private sector employment.
4.6.4 Business environment and public
administration
The regulatory environment is cost-effective and
business-friendly, and scores particularly well on e-
government as the availability and use of e-
government tools are exceptionally high. Electronic
filing is used by almost all taxpayers (97 %), and all
procedures can be completed without visiting the
tax authority’s offices. The authority reports that
there were substantially fewer such visits last year,
dropping from about 300 000 to 200 000. A EUR 25
million project to improve public services was
launched with support from the European Social
Fund. Since standard software for e-procurement
was introduced, its use has increased significantly,
from 5 % in 2011 to 25 % now and an estimated
50 % by the end of 2013. Some 7 % of all invoices
are electronic, but a common standard still has to be
developed.
The government is also looking to improve its
insolvency procedure, one of the few areas300
where
Estonia lags behind its EU peers. The goal is to
facilitate an agreed debt restructuring, to find
alternative ways of dealing with insolvencies (i.e.
through out of court resolution), while raising the
competence of judges that deal with such cases.
Rationalising the municipalities, which are often
small and lack the resources to provide certain
services, could increase the efficiency of public
administration. Moreover, the financing system of
municipalities does not currently include incentives
for local governments to support entrepreneurship
and job creation. However, as such a reform would
be politically challenging, the goal is instead to
coordinate their activities and pool resources to
achieve many of the benefits of rationalisation with
less opposition. At the same time, incentives are
being set for their merger on a voluntary basis.
300 See http://ec.europa.eu/enterprise/policies/industrial-
competitiveness/monitoring-member-states/improving-
public-administration/index_en.htm .
The administrative burden on businesses appears to
be reasonable; in December 2012 a methodology to
assess the impact of legislative acts has been
adopted, which should increase their quality and
transparency. There is an electronic system for
consulting on new laws and regulations, but some
stakeholders report that the minimum time of two
weeks is insufficient, and is sometimes not
respected. Further, a more robust assessment of the
costs and benefits of new regulations could be
useful, as in some case the costs imposed on
businesses may be disproportionate. This could be
the case for the increase in the amount of
information collected on sales, which is a measure
to enhance VAT collection and fight the black
market. This requirement has resulted in an
additional burden on 75 000 payers, but has only
resulted in EUR 25 to 30 million more being
collected.
In some cases the government’s preference for a
small number of simple rules may have negative
consequences. In particular, social charges on
labour cannot be lower than a minimum
contribution based on the minimum wage, with no
exceptions for part-time workers. At the same time
the government also needs to be alert to VAT fraud,
as it estimates that 22 % of the 18 000 new
companies founded in 2012 were involved in such
activities. The government is working on extending
a warranty system that has been successful in
reducing fraudulent claims in the fuel sector.
4.6.5 Finance and investment
Access to finance has shown signs of improvement,
but remains a priority for Estonian firms. Since the
onset of the crisis, access to sources of financing
such as the stock and bond markets has been
limited. Some large firms, especially utilities that
enjoy steady cash flows, have continued to access
bond markets, but this has not been possible for
SMEs. Many larger firms have been forced to tap
foreign markets, mainly London.
The government is considering the possibility of
supporting a local stock and bond market, but this
would be a medium to long-term project. For
SMEs, there is little alternative to bank lending.
The banking sector is doing well with rising
numbers of clients, deposits, foreign transactions,
leasing contracts and card usage. The growth of
their loan portfolios that started in 2012 continued
Country chapter: Estonia
127
at a moderate speed in early 2013 with the
corporate loan portfolio increasing by 5 %301
.The
composition of the loan portfolios is also changing,
with little lending going to real estate. This suggests
that firms in other sectors are getting better access
to loans, although the loan approval criteria
continue to be strict.
Entrepreneurs often use their own assets as
collateral to get loan approval. The growth of
leasing can be an indication of a preference for
collateralised loans. Such risk aversion can lead to
constrained credit and lower growth. On the other
hand, it also guards against excessive leverage.
Firms have adjusted to the situation by becoming
more efficient, reducing their need for capital, and
limiting their exposure to external financing. This
makes them more resilient, but also curbs their
ability to grow.
KredEx, Enterprise Estonia and the Estonian
development fund are the government’s tools to
support firms. The development fund is being
reformed and made more project-based. Two new
organisations were established in 2012 to facilitate
access to seed and equity capital. EstBAN is a
network of angel (early stage) investors with 25
members, offering investment in sizes from
EUR 20 000 to 500 000. These investors expect to
invest in 10-15 firms to a total of EUR 1 million in
2013. Although the amounts are low, the effect of
such ‘smart money’ investment should be more
than proportional to their size, since recipients will
benefit from the experience of the investor, and the
funds will be channelled to firms with rapid growth
potential.
Another new institution is the Baltic Innovation
Fund, a EUR 100 million fund of funds which will
invest in private equity and venture capital funds in
the Baltic countries. The EIF is investing EUR 40
million, along with EUR 20 million each from the
different national promotional agencies. Foreign
direct investment focuses on five priority sectors302
(metals/machinery, electronics, ICT, shared
services and logistics), and grew from 27
investments in 2011 to 35 in 2012.
301 Financial Stability Review 1/2013, Bank of Estonia.
Available at
http://www.eestipank.ee/en/publication/financial-stability-review/2013/financial-stability-review-12013.
302 Data from the Estonian Investment and Trade Agency (a
branch of Enterprise Estonia).
4.6.6 Conclusions
Estonia has recovered quickly from the crisis of
2008-09. Although the growth rate has slowed
somewhat, the country is still outperforming the EU
average. It is also improving its position in the
international value chain, moving towards more
innovative and knowledge-intensive sectors and
benefiting from growing investment in research and
development.
However, efforts will be needed to keep this
positive trend going. Particular efforts need to be
made to address the high energy intensity of the
economy, and the shortage of skills necessary for
further growth. Although there have been signs of
improvement, many companies, especially new
ones, find it difficult to get access to finance. The
good business environment is to be admired, and is
being further improved.

Country chapter: Ireland
128
4.7. Ireland
-3 -2 -1 0 1 2 3
Labour productivity per hour worked (EU-27=100; 2012)
Labour productivity per person employed (EU-27=100; 2012)
Labour productivity per person employed in manufacturing (1000 PPS; 2012)
% of employees in manufacturing with high educational attainment (2012)
Tertiary graduates in mathematics, science and technology
per 1000 of population aged 20-29 (2010)
R&D performed by businesses (% of GDP; 2011)
Energy intensity in industry and the energy sector
(kg oil eq. / euro GVA; reference year 2005; 2011)
CO2 intensity in industry and the energy sector
(kg CO2 / euro GVA; reference year 2005; 2011)
Environmental protection expenditure in Europe
(euro per capita and % of GDP; 2011)
Share of high-tech exports in total exports (2012)
Exports of environmental goods as % of all exports of goods (2012)
Time required to start a business (days; 2011/12)
Business environment score (1= best 0 = worst; 2011/12)
Enterprise survival rate after two years (2010)
Business churn (enterprise entries and exits as % of existing stock; 2010)
Share of high-growth enterprises as % of all enterprises (2010)
Electricity prices for medium size enterprises excluding VAT
(euro per kWh; 2nd semester 2012)
Infrastructure expenditures (euro per inhabitant; 2011)
Satisfaction with quality of infrastructure (rail, road, port and airport)
(1=underdeveloped / 7=extensive and efficicient by int'l standards; 2012-13)
% of broadband lines with speed above 10 MBps (2013)
Legal and regulatory framework (0= neg. / 10=pos.; 2013)
Burden of government regulation
(1 = burdensome 7 = not burdensome; 2012-13)
E-government usage by enterprises (%; 2012)
Early stage financing (% of GDP; 2012)
Access to bank lending for SMEs (1 = best 0 = worst; 2011)
Time taken for payments by public authorities (days; 2013)
The gap between the EU average and the country value
(measured in standard deviations)* For full explanation, see the methodological annex
Ireland
2007
latest available
Note: In the graph, data are presented in such a way that data bars pointing to the right (left) always indicate performance which is better (weaker) than the
EU average.
Inn
ovati
ve in
du
str
ial p
oli
cy
Su
sta
inab
lein
du
str
yB
usin
ess E
nvir
on
men
t an
d E
ntr
ep
ren
eu
rsh
ipF
inan
ce a
nd
Investm
en
t
Note: In the graph, data are presented in such a way that data bars pointing to the right (left) always indicate performance which is better (weaker) than the
EU average. * Access to bank lending for SMEs 2009 (instead of 2007); % of broadband lines with speed above 10 MBps 2008 (instead of 2007).
Exp
ort
perf
orm
an
ce
Pu
bli
cad
min
istr
ati
on
N.A.
3.6
N.A.; N.A. (2007)
N.A.; N.A. (2007)
N.A.; N.A. (2007)
N.A.

Country chapter: Ireland
129
Figure 4.7: Manufacturing sectors – Ireland (2010)
Note : No data available for sectors C12 (tobacco products), C19 (coke and refined petroleum products), C30 (manufacture of other transport
equipment) and C31 (furniture)
Source: Eurostat
4.7.1 Introduction
Ireland has done relatively well in carrying out the
necessary reforms as prescribed under the financial
assistance programme. The main focus of the
programme has been to restore financial market
confidence by reducing the government deficit and
shrinking the banking sector, while reforming the
economy at the same time. Real GDP growth
figures show that Ireland is rebounding from the
crisis with 2.2 % growth in 2011 and 0.2 % for
2012.303
Ireland’s efforts at economic reform would
suggest that it may be ready to exit the programme
at the end of 2013, as was originally foreseen.
The Irish economy is principally based on SMEs,
which account for 99.7 % of companies.
Microenterprises account for the bulk of these,
representing 89 % of enterprises. However, while
only roughly 0.3 % of companies are large
enterprises, they account for approximately 31 % of
employment and 48.5 % of Ireland’s value added.304
Ireland has a large foreign multinational sector with
comparative advantages in sectors such as
pharmaceuticals and chemicals. In fact, this sector
accounted for 51.8 % of manufacturing in Ireland in
303 Revised national Accounts data; European Commission
Spring 2013 Economic Forecasts. 304 Ireland SBA Fact Sheet 2012:
http://ec.europa.eu/enterprise/policies/sme/facts-figures-
analysis/performance-review/files/countries-
sheets/2012/ireland_en.pdf.
2009. The other main sectors were the food,
beverages and tobacco sector, at 17.4 %, and the
electronics, electrics and machinery sector,
registering 13.7 % of the total. The services sector is
also becoming increasingly important, in particular
high-technology and knowledge-intensive services.
The Irish economy ranks second highest with
respect to labour productivity per person employed
and ranks first with respect to labour productivity
per person employed in the manufacturing sector.
However, this data should be treated with caution,
given the effect of the large number of foreign
multinationals and their use of adapted transfer
pricing.
4.7.2 Innovation, skills and
sustainability
Innovation
According to the 2013 Innovation Union
Scoreboard,305
Ireland is an innovation follower
with an above average performance.
The ‘Strategy for Science, Technology and
Innovation 2006-13’ has been the main tool used
for achieving the goal of making Ireland a leading
knowledge economy. In 2012, the government
305 http://ec.europa.eu/enterprise/policies/innovation/facts-
figures-analysis/innovation-scoreboard/index_en.htm.
Food, beverages and
tobacco
20.19%
Textiles, apparel and
leather
0.39%
Wood, paper and
printing
2.71%
Chemicals, pharma,
petroleum, minerals
and rubber 48.14%
Metals
2.15%
Electronics, electrics
and machinery
12.93%
Cars and transport
0.45%
Other
11.71%
Country chapter: Ireland
130
adopted the report of the Research Prioritisation
Steering Group. The group identified 14 priority
areas, along with six underpinning platform
technologies and infrastructures that will become
the focus of the majority of competitive funding in
research for the next five years.
Ireland has an R&D target of 2 % of GDP by 2020.
This stood at 1.72 % in 2011 with business R&D
accounting for 1.17 % of the total. R&D investment
by firms does not appear to have been seriously
affected by the crisis, to the extent that business
R&D investment in real terms continued to increase
until 2010 and remained constant in 2011. The
provisional estimate of gross domestic expenditure
on R&D (GERD) financed from abroad stood at
19.2 % in 2011.306
This reflects the policy of
attracting foreign investment with a large R&D
component.307
The key areas of focus are the food
sector, agriculture and fisheries, medical
technologies, and nano and bio-technologies.
Ireland is also strong in ICT compared to the EU
and also to the US.
Fiscal measures play an important role. R&D tax
credits were established in 2004, providing a 25 %
tax credit on incremental expenditure and a 25 %
volume-based credit for eligible capital
expenditure. This was complemented with an
expansion of tax credits in 2010 to enhance
investment in intellectual property by excluding
royalty income from withholding tax. The 2013
budget stated that credit would be reviewed with
the objective of ensuring that tax credit remains
‘best-in-class’ internationally and represents value
for money for taxpayers.
An Intellectual Property Protocol (IPP) was
published in June 2012 as part of the Action Plan
for Jobs 2012. The protocol aims to help industry
access R&D done in Irish universities, institutes of
technology and other public research institutions. It
also aims to commercialise IP generated from such
research. Among the measures included in the
protocol is a new Central Technology Transfer
Office which will be hosted by Enterprise Ireland.
It will act as a one-stop shop for businesses seeking
to use IP from public-funded research. While this
has not yet become fully operational, work has
commenced on setting up a portal.
306 Eurostat estimated EU average for 2010 stood at 8.9 % of
GDP. 307 Ireland country report — Research & Innovation
Performance in EU Member States and Associated
countries 2013: http://ec.europa.eu/research/innovation-union/pdf/state-of-the-
union/2012/innovation_union_progress_at_country_level
_2013.pdf.
However, Ireland also has a number of challenges
in research and innovation, in particular the
relatively low number of patent applications as well
as a decline in the number of innovative SMEs.
Skills
One of Ireland’s strengths has always been its well-
educated workforce. This is reflected in the fact that
it ranks as top among Member States with respect
to the percentage of employees in the
manufacturing sector with high education
attainment levels. Moreover, it currently has the
highest tertiary education attainment rate in the EU
at 51.1 % (2012), with a target of 60 % for 2020.
Ireland is also making progress in the early school
leaving target of 8 % by 2020, reaching 9.7 % in
2012.
Nevertheless, increasingly long-term
unemployment and high levels of youth
unemployment are a source of concern. In an effort
to return to growth, the government is seeking to
up-skill, re-skill and provide education and training
opportunities to the unemployed. With this goal in
mind, a series of education and training
programmes have been set up, such as Momentum,
Springboard and Youthreach. In 2010, there were
2 385 Youthreach participants that achieved
certification, of which 15% progressed to
employment, while 52% continued to further
education and training. The development of new
training opportunities, in particular the up-skilling
of the work force and of the unemployed as well as
re-entry into education, is essential to ensure that
long-term-unemployed jobseekers do not become
permanently excluded from work.
The National Skills Bulletin 2012 pointed to skills
gaps, mainly in science, engineering and IT. A joint
government-industry ICT action plan was launched
in 2012, including the doubling of ICT graduates by
2018. The ICT graduate skills conversion
programme has also been developed to tackle this
shortage. This is particularly important given the
importance of the IT sector in Ireland.
Sustainability
Ireland is the best performer in the EU for both
energy intensity and CO2 intensity. The reason for
this is the importance of services and high value-
added manufacturing. The key environmental
challenges are inefficient building stock, fossil-fuel-
Country chapter: Ireland
131
based electricity generation and a culture of car
dependency.308
As part of the Action Pan for Jobs 2012, the
government published the policy document
‘Delivering Our Green Potential’ aimed at
developing the green economy. According to this
report, 18 750 people were employed in six key
sub-sectors of the green economy in 2010309
and the
value of sales of low-carbon environmental goods
and services was estimated at approximately 4 % of
GDP in 2010-11.
The report mentions firms that have developed
innovative clean-tech products in areas such as
insulation materials, efficient heating equipment,
energy management systems and energy-efficient
lighting. As envisaged under the policy, a
consultative committee involving the ministry and
key stakeholders has been established. The
committee meets on a quarterly basis to examine
key thematic areas of the green economy with a
view to identifying opportunities and activities to
address barriers and help enterprises take advantage
of opportunities. The identified actions may be
included in the Action Plan for Jobs in subsequent
years.
There are a number bottlenecks preventing business
from improving the uptake of cleaner technology,
mainly related to access to finance. For smaller
companies, another factor is a lack of awareness of
low-cost solutions. In an effort to address this
problem, a number of specific programmes are
being offered to businesses, as is mentoring.310
In March 2013, the government also announced that
it was setting up a new energy-efficiency fund,
worth EUR 70 million (EUR 35 million to be made
available by the government with the rest coming
from the private sector), as part of the second
National Energy Efficiency Action Plan. The fund
provides finance to energy-efficiency projects
across all sectors of the economy. It is envisaged
that lending will start in 2013.
308 Eco-innovation Report on Ireland 2011: http://www.eco-
innovation.eu/index.php?option=com_content&view=article&id=474&Itemid=62.
309 Taken from the Expert Group on Future Skills Needs
(EGFSN) the sub-sectors being renewable energies; efficient energy use and management; water and waste
water treatment; waste management, recovery and
recycling; environmental consultancy services; and Green ICT applications/software.
310 Such as www.cleanerproduction.ie; www.begreen.ie;
www.seai.ie/Your_Business.
4.7.3 Export performance
Exports account for over 100 % of GDP and Ireland
has the largest share of exports as a percentage of
GDP, given the significant number of international
companies. While the recession has had an
extremely negative effect on the economy, it has
recovered in part due to the strength of exports by
firms in the high-tech sectors. These firms are
mainly affiliates of multinational enterprises.
Data for 2012 shows that the current-account
surplus surged to 4.9 % of GDP in 2012, reflecting
not only a contraction in domestic demand, but also
competitiveness gains achieved through increased
productivity, inflation below the euro-area average,
and cost-cutting measures, including on wages.
Persistent weakness in trading-partner demand is
nevertheless affecting demand for merchandise
exports, which contracted on a quarterly basis in the
last two quarters of 2012, as a result of the
anticipated expiry of pharmaceutical patents.
However, the rise in services exports, which have
expanded by around 10 % in annual terms every
quarter since the second half of 2010, has however
substituted for weak goods export developments.311
In fact, 2012 was a notable year in that it was the
first year that the value of exports of services
exceeded that of goods, and that services exports
exceeded services imports.
The Action Plan for Jobs plays a role by helping
indigenous companies to export. In 2012, a new
potential exporters division within Enterprise
Ireland started to provide assistance and guide
clients in their international export strategies. A
new microenterprise and small business division
has also been established within Enterprise Ireland.
As of 2013, local enterprise offices will be
established to provide support to small and
microenterprises on behalf of Enterprise Ireland.
4.7.4 Business environment and public
administration
Business Environment
Ireland remains one of the most attractive places to
do business in Europe, ranking fifth in the EU and
fifteenth globally.312
Its strengths include protecting
investors, paying taxes and resolving insolvencies.
It scores relatively low in dealing with construction
permits and obtaining electricity. It is also ranked
as the easiest place to start a business in the EU and
it achieves two of the three main goals of the May
311 European Commission Spring 2013 Economic Forecasts. 312 World Bank Doing Business Report 2013.
Country chapter: Ireland
132
2011 Competitiveness Council recommendations,
as it takes approximately two to five days to open a
business at a cost of EUR 50.313
The Action Plan for Jobs contained 270 individual
actions for 2012, with over 90 % of these being
completed. The plan covered a series of small
measures aiming to improve the research,
innovation and skills base; measures to help SMEs
to enter new markets and access finance; attracting
entrepreneurs from the diaspora to Ireland; and
focusing on some of the most promising sectors.
A new Action Plan for Jobs 2013 has been
launched, building upon previous initiatives, but
including 333 actions. The new plan is more
ambitious, including projects that require cross-
government collaboration. Nonetheless, there are
still issues of concern for local businesses, in
particular for SMEs. While cost competitiveness
has improved over recent years, small businesses
still face relatively high electricity prices. In fact,
Ireland has one of the highest costs of electricity in
the EU, because it depends on imported fuel and
has under-invested in distribution networks.
Services have become increasingly important in
recent years. These mainly consist of high-
technology services, such as computer services, and
knowledge-intensive services, such as financial
services, insurance and other business services. In
fact, it has been estimated that while the services
sector accounted for 21 % of all exports in 2000, for
the third quarter of 2012, services accounted for
50 % of total exports.314
Legal services remain expensive,315
and the high
price is hampering cost and external
competitiveness. The Legal Services Regulation
Bill, which is a programme requirement, addresses
many of these issues, in particular by establishing a
new Legal Services Regulatory Authority. The bill
is expected to be enacted by the end of 2013.
Public Administration
While tax compliance burden is among the lowest
in the EU, SMEs see VAT compliance as a major
burden. In the 2013 budget, the government
increased the VAT cash receipts basis accounting
313 The conclusions of the Competitiveness Council of 31
May 2011 are namely to create a one-stop-shop for
starting up a business, and a call to Member States to
reduce the start-up time for new enterprises to 3 days and EUR 100 by 2012. DG Enterprise and Industry data.
314 Irish Central Bank Report, Quarter 1 2013. 315 The World Bank Doing Business 2013 report estimates
that as a percentage of the value of a standardised claim in
a commercial dispute, the enforcement cost is 26.9 % in
Ireland, as opposed to an OECD average of 20.1 %.
threshold from a turnover of EUR 1 million to
EUR 1.25 million to help companies with cash
flow. However, many businesses felt that doubling
the threshold to EUR 2 million would have been
more useful. The government has also launched a
consultation concerning taxation of
microenterprises in an effort to identify ways of
easing the administrative burden of tax compliance.
The government is pursuing a public-service reform
plan which aims to maximise new and innovative
service delivery channels. This includes the e-
government strategy 2012-15, which is the main
policy tool for pushing e-government so as to
reduce the administrative burden on businesses and
consumers. In all, 91 % of enterprises currently use
e-government services (2012).
As regards the administrative burden and the goal
of achieving a 25 % reduction by 2012, a reduction
of approximately 20 % across all ministries has
been achieved. The goal is to reach the 25 % target
by the end of 2013. This will include creating a
business portal where retailers can register once and
apply for all licensing requirements. The aim is
complete this portal by October 2013.
On the issue of corruption, according to
Transparency International, the corruption
perception index for 2012, Ireland ranks 25th
in the
world and 10th
in the EU. While this is a relatively
good score, since 2009 there has been deterioration
in the perception of corruption in Ireland.
4.7.5 Finance and investment
One of the major challenges facing SMEs remains
access to finance. This is due both to generally
weak demand for credit in a deleveraging
environment and to supply side constraints. A
recent report316
noted that access to finance was the
third largest problem facing SMEs, after finding
customers and competition.317
Loan rejection rates
are among the highest in the EU318
and the general
perception among SMEs is that banks are not
lending.319
This may be due to the fact that many of
those who are refused credit do not agree with the
reasons for the refusal, or are not given any reasons.
Moreover, long time lags for processing can add to
firms’ difficulties.
Improving access to finance is one of the key
objectives of the Action Plan for Jobs 2013 with a
316 By the Economic and Social Research Institute (ESRI). 317 ‘SME Credit Constraints and Macroeconomic Effects’,
Gerlach-Kristin, O’Connell & O’Toole, ESRI, April 2013. 318 Access to Finance Report, ECB April 2012. 319 Irish Department of Finance Report on SME Credit
Demand Survey September 2012.
Country chapter: Ireland
133
number of initiatives being undertaken. The
objectives are governed by a cross-departmental
steering group, known as the SME State Bodies
Group, which oversees the activities related to SME
bank and non-bank access to finance.
Another government initiative was the
establishment of the Credit Review Office (CRO)
in 2010. It is designed to resolve disputes between
banks and their SME clients about loan refusal,
with a power to overturn loan decisions. Leading
banks have been set lending targets of
EUR 4 billion each in 2013. Banks are required to
process loan applications within 15 days, although
the average time is 29 days.320
Banks also need to
enhance their capacity to assess SMEs
creditworthiness based on cash flow rather than
property collateral.
SMEs are used to working with bank overdrafts and
tend to renew or restructure bank overdraft
facilities. There are also skills gaps, in particular
among microenterprises, when it comes to
presenting the necessary business plans required by
banks. While banks have prepared a joint guidance
plan to help businesses in this regard, further
assistance by government may be warranted. A
one-stop website321
for Irish business has been
useful and is jointly supported by banks, businesses
and government.
Ireland has an active seed and venture capital
market and the Seed and Venture Capital
Programme 2013-18 will provide up to
EUR 175 million in funding. The majority of these
funds will be invested in high-growth innovative
firms in fast-growing sectors such as ICT, life
sciences, high-tech manufacturing and the green
economy. The government is aiming for an
additional EUR 525 million in funding from the
private sector, which will mean a total of
EUR 700 million for investment throughout the
lifetime of the programme.
In 2012, a credit guarantee scheme and a
microfinance scheme were launched. The former
will facilitate access to up to EUR 150 million in
additional lending. The latter will provide for an
additional EUR 90 million in lending. However, the
take-up of these schemes is relatively low.
Innovation Fund Ireland has been created to
increase the availability of capital for early-stage
and high-growth companies. Moreover, the
National Pensions Reserve Fund has undertaken to
320 Irish Department of Finance Report on SME Credit
Demand Survey September 2012. 321 www.smallbusinessfinance.ie.
put funds in place to help meet SME financing
needs.322
Foreign direct investment was provisionally
estimated at EUR 22.8 billion in 2012, a significant
increase in relation to the 2011 level of EUR 8.2
billion. This is a significant improvement following
a decline in inflows between 2010 and 2011. It was
also estimated that inflows for 2012 accounted for
14.3 % of Irish GDP.323
4.7.6 Conclusions
Ireland is slowly returning to growth, which is also
becoming more broad-based. The economic
adjustment programme has been implemented
consistently, which has had a positive impact,
including restored competitiveness.
However, some key challenges remain. The fight
against high unemployment, in particular youth and
long-term unemployment, is a priority for the
government and the ‘Action Plan for Jobs’ has been
at the heart of efforts to foster job creation.
The skills mismatches resulting from structural
changes in the economy over the past years also
present a significant challenge. Thus, ongoing
reforms to provide appropriate further education
and training are crucial. Access to finance, in
particular for SMEs, is yet another challenge.
Although cleaning the banking system has been
going on for quite a while, it has not yet reached its
conclusion, and further deleveraging of the whole
economy would help to establish the credit flows
again restore the health of domestic banks, thereby
restoring normal lending channels to the economy.
322 Namely, the SME Equity Fund, the SME Turnaround
Fund and the SME Credit Fund. 323 http://www.oecd.org/daf/inv/FDIinfigures.pdf.
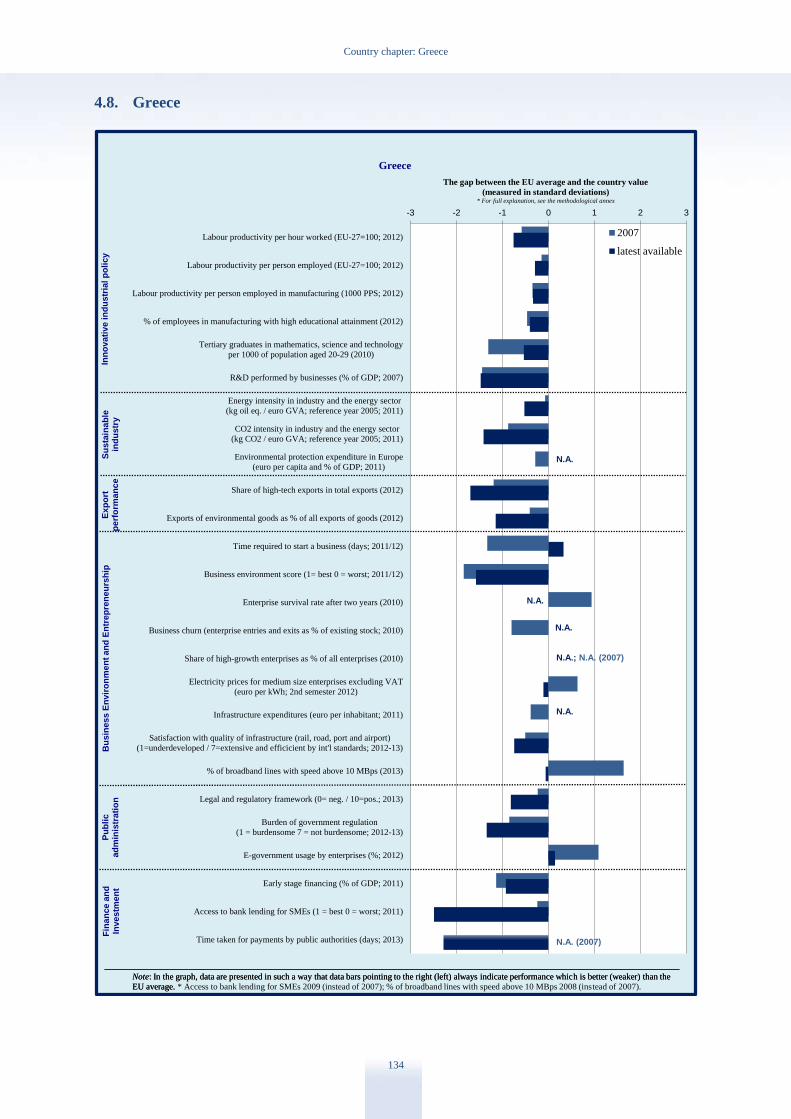
Country chapter: Greece
134
4.8. Greece
-3 -2 -1 0 1 2 3
Labour productivity per hour worked (EU-27=100; 2012)
Labour productivity per person employed (EU-27=100; 2012)
Labour productivity per person employed in manufacturing (1000 PPS; 2012)
% of employees in manufacturing with high educational attainment (2012)
Tertiary graduates in mathematics, science and technology
per 1000 of population aged 20-29 (2010)
R&D performed by businesses (% of GDP; 2007)
Energy intensity in industry and the energy sector
(kg oil eq. / euro GVA; reference year 2005; 2011)
CO2 intensity in industry and the energy sector
(kg CO2 / euro GVA; reference year 2005; 2011)
Environmental protection expenditure in Europe
(euro per capita and % of GDP; 2011)
Share of high-tech exports in total exports (2012)
Exports of environmental goods as % of all exports of goods (2012)
Time required to start a business (days; 2011/12)
Business environment score (1= best 0 = worst; 2011/12)
Enterprise survival rate after two years (2010)
Business churn (enterprise entries and exits as % of existing stock; 2010)
Share of high-growth enterprises as % of all enterprises (2010)
Electricity prices for medium size enterprises excluding VAT
(euro per kWh; 2nd semester 2012)
Infrastructure expenditures (euro per inhabitant; 2011)
Satisfaction with quality of infrastructure (rail, road, port and airport)
(1=underdeveloped / 7=extensive and efficicient by int'l standards; 2012-13)
% of broadband lines with speed above 10 MBps (2013)
Legal and regulatory framework (0= neg. / 10=pos.; 2013)
Burden of government regulation
(1 = burdensome 7 = not burdensome; 2012-13)
E-government usage by enterprises (%; 2012)
Early stage financing (% of GDP; 2011)
Access to bank lending for SMEs (1 = best 0 = worst; 2011)
Time taken for payments by public authorities (days; 2013)
The gap between the EU average and the country value
(measured in standard deviations)* For full explanation, see the methodological annex
Greece
2007
latest available
Note: In the graph, data are presented in such a way that data bars pointing to the right (left) always indicate performance which is better (weaker) than the
EU average.
Inn
ovati
ve in
du
str
ial p
oli
cy
Su
sta
inab
lein
du
str
yB
usin
ess E
nvir
on
men
t an
d E
ntr
ep
ren
eu
rsh
ipF
inan
ce a
nd
Investm
en
t
Note: In the graph, data are presented in such a way that data bars pointing to the right (left) always indicate performance which is better (weaker) than the
EU average. * Access to bank lending for SMEs 2009 (instead of 2007); % of broadband lines with speed above 10 MBps 2008 (instead of 2007).
Ex
po
rtp
erf
orm
an
ce
Pu
bli
cad
min
istr
ati
on
N.A.
3.6
N.A. (2007)
N.A.; N.A. (2007)
N.A.
N.A.
N.A.
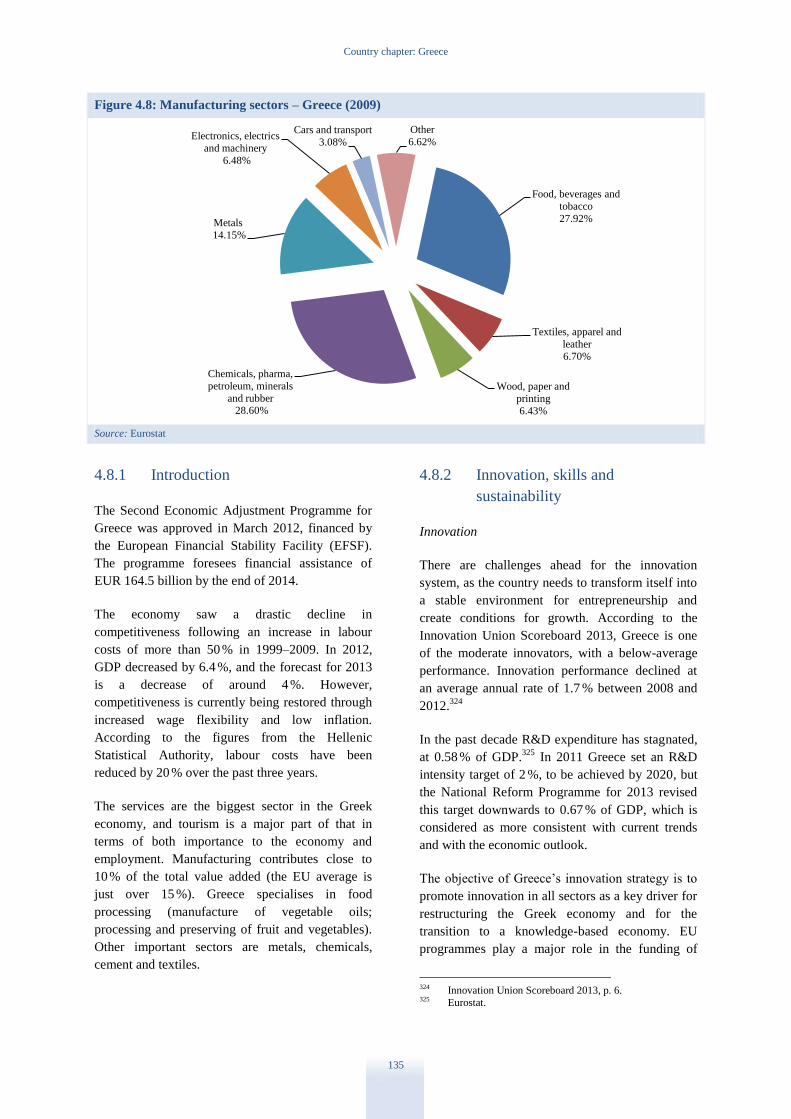
Country chapter: Greece
135
Figure 4.8: Manufacturing sectors – Greece (2009)
Source: Eurostat
4.8.1 Introduction
The Second Economic Adjustment Programme for
Greece was approved in March 2012, financed by
the European Financial Stability Facility (EFSF).
The programme foresees financial assistance of
EUR 164.5 billion by the end of 2014.
The economy saw a drastic decline in
competitiveness following an increase in labour
costs of more than 50 % in 1999–2009. In 2012,
GDP decreased by 6.4 %, and the forecast for 2013
is a decrease of around 4 %. However,
competitiveness is currently being restored through
increased wage flexibility and low inflation.
According to the figures from the Hellenic
Statistical Authority, labour costs have been
reduced by 20 % over the past three years.
The services are the biggest sector in the Greek
economy, and tourism is a major part of that in
terms of both importance to the economy and
employment. Manufacturing contributes close to
10 % of the total value added (the EU average is
just over 15 %). Greece specialises in food
processing (manufacture of vegetable oils;
processing and preserving of fruit and vegetables).
Other important sectors are metals, chemicals,
cement and textiles.
4.8.2 Innovation, skills and
sustainability
Innovation
There are challenges ahead for the innovation
system, as the country needs to transform itself into
a stable environment for entrepreneurship and
create conditions for growth. According to the
Innovation Union Scoreboard 2013, Greece is one
of the moderate innovators, with a below-average
performance. Innovation performance declined at
an average annual rate of 1.7 % between 2008 and
2012.324
In the past decade R&D expenditure has stagnated,
at 0.58 % of GDP.325
In 2011 Greece set an R&D
intensity target of 2 %, to be achieved by 2020, but
the National Reform Programme for 2013 revised
this target downwards to 0.67 % of GDP, which is
considered as more consistent with current trends
and with the economic outlook.
The objective of Greece’s innovation strategy is to
promote innovation in all sectors as a key driver for
restructuring the Greek economy and for the
transition to a knowledge-based economy. EU
programmes play a major role in the funding of
324 Innovation Union Scoreboard 2013, p. 6. 325 Eurostat.
Food, beverages and
tobacco
27.92%
Textiles, apparel and
leather
6.70%
Wood, paper and
printing
6.43%
Chemicals, pharma,
petroleum, minerals
and rubber 28.60%
Metals
14.15%
Electronics, electrics
and machinery
6.48%
Cars and transport
3.08%
Other
6.62%
Country chapter: Greece
136
innovation initiatives, but the level of funding
available exceeds the amount that the business
sector can absorb. Besides the general economic
environment, financial constraints can play a role,
as many eligible companies cannot provide bank
guarantees to receive an advance payment.326
The
commitments to specific innovation policy
initiatives for 2010-12 amounted to
EUR 596 million and are aimed at programmes
supporting technological and knowledge transfer,
cluster cooperation and the creation and growth of
enterprises.327
Despite the progress achieved in
recent years, further efforts would help, in
particular closer links between researchers and
industry, and improved technology transfer.
Although policy is emphasising the use of new
financial instruments, including funds dedicated to
supporting innovation, there are substantial
difficulties as almost no national co-finance and no
private investment is available. Consequently,
subsidies continue to be the main type of support
for R&D, though tax incentives are also used. In an
effort to boost development through R&D, the
government has recently adopted new legislation328
that further enhances tax incentives for enterprises
engaged in R&D.
Skills
Greece faces many challenges to improve its skills
base through improvements in education and
training aiming to better adapt to labour market
needs. This includes in particular teacher training
and the quality and relevance of vocational
education and training as well as lifelong learning.
Reforms in tertiary education are only partially
implemented. Among other issues, these reforms
would include better use of universities to provide
lifelong learning opportunities to local and regional
populations and better monitoring of inputs and
outputs.329
An action plan to support youth employment and
entrepreneurship was adopted by the Greek
government in January 2013. It has been allocated a
budget of EUR 600 million, EUR 517 million of
which is provided through the European Social
326 Innovation Policy trends in Greece, 4/9 2012. 327 Ibid. 328 Law 4110/2013. 329 Assessment of the 2013 national reform programme for
Greece; SWD(2013) 358
Fund and the European Regional Development
Fund. The plan comprises a set of programmes that
should benefit 350 000 young people in the age
group 15 to 35. The objective is to target
employment and entrepreneurship for young people
in the two age groups of 15-24 and 25-35. The plan
stresses apprenticeship, traineeship and the
transition from education to employment.
Active labour market policies seek to facilitate the
transition of workers between sectors; improve the
quality of training, and promote the employment of
vulnerable groups. Further opportunities for
apprenticeships and vocational training are due to
be introduced over the medium term, with stronger
links with employers to increase graduates’ chances
of professional integration.330
Sustainability
Between 2005 and 2010 Greece cut by 10 % the
emission of greenhouse gases that are not part of
the EU emissions trading system. The reduction
seems to be a result mainly of the economic
slowdown. Projections show that Greece will
increase emissions by 3 % by 2020 and will not
achieve its reduction target.
Progress has been made on renewable sources of
energy. Under the renewable energy Directive,
331
Greece is required to produce 18 % of its final
energy consumption and 10 % of the transport use
from renewable sources by 2020. In the national
renewable energy action plan Greece committed
itself to 20 % instead of 18 %. In 2011 the share of
renewable energy sources in gross final energy
consumption was 11.5 %. Greece has over recent
years granted generous tariffs in particular for
photovoltaic installations; as a result 97 % of the
capacity has been installed over the past three
years.
4.8.3 Export performance
Although the economy as a whole remains oriented
towards the domestic market, export performance
continues to improve, albeit from a low base. The
national export strategy has set ambitious goals for
boosting exports of goods to 16 % of GDP by 2015.
330 Assessment of the 2013 national reform programme for
Greece; SWD(2013) 358 331 Directive 2009/28/EC.

Country chapter: Greece
137
Greek exports in 2012 were EUR 27.6 billion or
13.8 % of GDP, itself a record.332
The national export strategy seeks to improve the
international competitiveness of Greek companies
through export promotion and export facilitation. It
is based on three pillars:
1. Enlarging the export base by formulating
industry-specific policies to encourage
companies to produce and offer
internationally competitive goods and
services.
2. Trade and promotion of foreign direct
investment by integrating economic
diplomacy efforts, building a national
brand and overall support for companies to
engage in international trade networks and
find trading partners abroad.
3. Trade facilitation. The national trade
facilitation strategy was announced in
November 2012. It features 25 measures
aimed at reducing the time needed for
export by 50 % and costs by 20 % by 2015.
The strategy is focused on simplifying the
cumbersome pre-customs and customs
procedures. Some changes have already
been made to the customs procedures:
a. electronic submission of customs
clearance declaration for exports
(April 2012);
b. mandatory presence of a customs
broker for customs clearance
formalities repealed (December
2012);
c. free access to the customs broker
profession (December 2012);
d. indirect representation for
customs clearance (December
2012).
e. customs operations launched 24/7
or double-shifts for exports in the
pilot offices of Athens airport and
Piraeus Port (June 2013);
f. simplified pre-customs and
customs procedures for kiwi and
feta cheese (June 2013).
332 Greek national export initiative.
In an effort to strengthen entrepreneurship and the
internationalisation of SMEs, a programme was
launched, co-funded by the EU structural funds
under the action ‘Internationalisation and
competitiveness of SMEs’. In total 746 projects
have been selected with a total budget of EUR 143
million.
4.8.4 Business environment and public
administration
Business environment
The difficult economic conditions and continuing
uncertainty have taken a heavy toll on Greek
businesses and the government is grappling with
the challenge of balancing budget cuts with
structural reforms to spur growth, as economic
reforms are fundamental for sustainable growth.
The high level of regulation and bureaucracy, as
well as corruption, have been a constraint on
businesses and hampered entrepreneurship. In
addition, the lack of competition has held back
productivity and competitiveness.
In the context of the Economic Adjustment
Programme, steps are being taken to tackle many of
the structural barriers and regulatory failings that
have traditionally restricted business. Efforts
undertaken in a number of areas are starting to
show results, which were reflected in Greece’s
improved ranking in the World Bank’s ‘Doing
Business’ indicators. Greece was up from 100th
place in 2012 to 78th, which is proof that the efforts
made to improve the business environment are
starting to bear fruit. In particular, there was
progress in reducing the time required to get
construction permits; more transparency for and
protection of investors; and an improved process
for resolving insolvent firms. The government has
also adopted ten measures in the areas of starting a
business, registering property, dealing with
construction permits and protecting investors.
The EU Task Force for Greece provides technical
assistance for a wide range of projects to improve
the business environment. Projects are on-going in
areas like the simplification and streamlining of
licencing and permit systems for investment, trade
facilitation and customs reform, export promotion,
and the screening of administrative burden for
business. EU structural funds are seen as key to
Country chapter: Greece
138
boosting the economy; the available funds came to
EUR 20.4 billion for the 2007-13 financing period.
Well-known deficiencies in the business
environment have been addressed over recent years.
Important measures have been taken to ease the
creation of companies and to simplify licence
procedures and investment authorisations. The time
needed to set up a business is now below the EU
average (11 days in Greece against the EU average
of 14). Starting up a company and registering
property remain expensive, and the cost and time
for exports and imports need to be further reduced.
It is still four times more expensive to start a
business in Greece (% of income/capita) than the
EU average, and it is more costly to register
property.333
The full entry into force of the law on simplifying
and accelerating the licencing of manufacturing
activities334
and its implementing acts provide an
integrated institutional framework for the
modernisation and simplification of licencing
procedures, covering technical professions,
manufacturing and business parks. On technical
professions, the right to provide certain services
was expanded, while the total number of licences
was reduced. As regards manufacturing, there has
been a reduction of up to 75 % in the time and cost
needed to obtain an operating licence for low-
nuisance activities.
With support of the OECD, the authorities are
reviewing laws and regulations for harmful effects
on competition in tourism, retail, building materials
and food processing; as well as for administrative
burden on businesses in 13 sectors. The government
has also presented a strategic vision to streamline
and unify investment licenses and strengthen self-
compliance with standards and controls. The
strategy will be implemented in 2013 and 2014.
SMEs have been hit hard by the crisis, and there are
fewer enterprises in 2013 than there were in 2005.
The size distribution of firms deviates from the EU
average, with the number of large enterprises only
half the EU average. Also, SMEs are heavily
weighted towards the small end, with
microenterprises accounting for 96.6 % of all
enterprises. In total, SMEs employ 85.2 % of the
333 SBA Fact Sheet 2012. 334 Law 3982/2011.
labour force in private employment, whereas the
EU average is 67.4 %. This reflects the fact that
Greeks are more likely than the EU average to be
self-employed.335
The SMEs are more oriented
towards trade than elsewhere in the EU, and the
share of SMEs specialising in high-tech
manufacturing or knowledge-intensive services is
only 18 %, whereas the EU average is one-third.
Greece does not always ‘think small first’, as the
authorities perform less well than their EU peers in
terms of communication and simplification of rules
and procedures, and impose a higher burden on
companies. However, steps are being taken,
including simplified provisions on entrepreneurship
and a new private company status with a capital of
one euro, seeking to facilitate the life of SMEs. 336
The General Electronic Business Registry (GEMI)
is being complemented with a self-registration
option for companies. This is a state-owned
electronic database hosted by the chambers of
commerce. Data stored in GEMI include key
personnel, annual accounts, tax identification
number, company status, company number and
relevant court decisions. To date 76 000 companies
have been started through GEMI. The registry is
linked to the one-stop shop for business start-ups
that was launched in 2011.
A new, more flexible, corporate form for private
limited companies (IKE) was adopted in July
2012.337
Judging by the number of firms using this
form, it seems to be a success. The advantage
compared to other limited companies is that IKEs
have a minimum capital requirement of only
EUR 1, whereas for regular limited companies it is
EUR 4 500.
Reforms to the public procurement procedures are
being planned. The aim is to promote sound public
procurement by making the newly created single
Public Procurement Authority fully operational.
The establishment of an e-procurement platform is
expected to lead to less bureaucracy, prevention of
corruption, more transparency and better
participation of economic operators. It should also
reduce the time and cost of procurement.
335 Ibid. 336 SBA Fact Sheet 2012. 337 Law 4072/2012.
Country chapter: Greece
139
The contribution of services to GDP was 71.7 % in
2011,338
which makes them the most important
sector of the economy. Tourism alone contributes
18.2 % of GDP339
and over 7 % of total
employment340
(over 18 % if indirectly supported
jobs are counted). The shipping industry is another
important sector for the economy, as Greek firms
have 16.2 % of the world’s shipping capacity
measured in deadweight tonnage.341
Public administration
Greece’s overall public administration
performance, as measured by the World Bank’s
government effectiveness indicator, is well below
the EU average. The perceived quality of public
services, including quality of the civil service and
policy implementation, is low (a score of 0.52
compared to 1.18 in the EU).342
Public services are also less likely to be available
online.343
E-government use by small enterprises in
2012 was slightly above the EU average (86 % and
85 % respectively) whilst e-government use by
citizens in 2013 was below the EU average (43.8 %
and 52.5 % respectively).344
The duration of
payments by the public authorities is above the EU
average (174 days compared to the EU average of
66 days).345
With the support of the EU Task Force for Greece,
technical assistance is provided for reforming the
public administration. A high-level transformation
steering group under the prime minister has been
set up to supervise the reform of the central
administration.346
The Greek judicial system is inadequate and, in
particular, the length of judicial procedures is long
in all areas, including in civil and commercial
justice. The rate of resolving cases is low, resulting
338 Eurostat. 339 http://www.investingreece.gov.gr/default.asp?pid=
36§orID=37&la=1. 340 OECD Tourism trends and policies 2012
http://www.oecd-ilibrary.org. 341 United Nations conference on trade and development,
Review of Maritime Transport 2011, p.41, accessible at
http://unctad.org/en/Docs/rmt2011_en.pdf. 342 European Commission (2012),’Excellence in public
administration for competitiveness in EU Member States’. 343 SBA Fact sheet Greece 2012. 344 Eurostat. 345 European Payment Index by Intrum Justitia, 2012. 346 Task Force for Greece, Quarterly Report of December
2012.
in increasing delays and a significant case backlog.
ICT systems for the management of cases and for
communications between the courts and parties,
which could help improving the management of
cases, are poorly developed. In addition, the
perceived independence of justice in Greece gets
the fourth worst rating in the EU. 347
In the framework of the Economic Adjustment
Programme, Greece has committed to reforming the
judicial system. These include reviewing the civil
code, introducing an administrative review of cases,
improving the organisation of the magistrates’
courts, developing e-justice applications, bringing
the insolvency legislation and practice in line with
best practice and promoting alternative dispute
resolution mechanisms.
4.8.5 Finance and investment
Bank credit to the corporate sector is contracting,
making it increasingly difficult to finance
production and investments. The main factors
contributing to this are the difficulties of the bank
sector, state arrears to suppliers (standing at around
4.4 % of GDP at the end of 2012), the drop in the
market value of collateral assets (real estate), and
the country risk, that makes any financing of large
businesses by foreign banks almost impossible. In
the ECB survey on SME access to finance (March-
September 2012), only 36 % of Greek SMEs said
they had received the loan requested (Eurozone
61 %).
To facilitate the financing of the Greek economy,
the government with the support of the task Force
for Greece has analysed the extent of credit
financing gaps in view of setting up an “Institution
for Growth”.348
The main findings show that:
- There is an equity funding gap and a
structural debt funding gap of the order of
EUR 5-10 billion each;
- The current situation in the banking market
leads to insufficient supply of project
finance, working capital and import/export
financing;
- Greece suffers from a lack of specialised
financing institutions;
347 EU Justice Scoreboard 2013. 348 TFGR Quarterly Report, April 2013.
Country chapter: Greece
140
- A financing vehicle, such as a specialised
financing institution for growth, could help
to improve the situation, at least partially.
Government efforts to ease financing conditions
have focused on the European Investment Bank
(EIB) lending to Greek commercial banks so that
they can lend to SMEs. Further efforts have been
made to provide banks with risk-sharing and
additional liquidity facilities. In March 2012, the
Greek government and the EIB signed an
agreement for the creation of a dedicated guarantee
fund supporting lending to small and medium-sized
enterprises. It will guarantee EIB loans to SMEs via
partner banks, up to EUR 1 billion. The first
disbursements under this fund (EUR 150 million)
took place in December 2012. Another EUR 212
million of SME loans were lent by the EIB to Greek
banks separately in the same month. In December
2012 the EIB launched a pilot project under which
it would (counter-) guarantee up to EUR 500
million of export financing for Greek SMEs and
mid-caps.
The Hellenic Fund for Entrepreneurship and
Development (ETEAN), a wholly owned state
corporation, was created in February 2011 with
start-up capital of EUR 1.7 billion. It manages and
runs projects financed via various channels: the
state budget; the public investment programme; an
operational programme (on competitiveness and
entrepreneurship) under the EU’s national strategic
reference frameworks; the European Regional
Development Fund; and the European Fisheries
Fund (EFF). ETEAN provides guarantees for loans,
or letters of guarantee, in favour of small and
medium-sized enterprises for banks and other
financial institutions (such as leasing and venture
capital companies). It also co-invests in other funds
and uses financial engineering instruments, and has
thus far created three funds for energy conservation
with a grant of EUR 200 million from the European
Union’s national strategic reference frameworks;
for fisheries promotion with a support from the
European Fisheries Fund (EFF) grant of EUR 35
million; and for entrepreneurship with a grant of
EUR 460 million, likewise from the national
strategic reference frameworks.
ETEAN recently announced the creation of two
new funds, operating through the entrepreneurship
fund; (a) the fund for business restarting; and (b)
the fund for island entrepreneurship. Both aim to
support SMEs’ access to working capital for
development activities.
The second Economic Adjustment Programme for
Greece contains detailed provisions regarding the
recapitalisation of Greek banks, which should be
completed by the end of June 2013.
Net capital inflows were EUR 2.3 billion in 2012
(vs. EUR 1.3 billion in 2011). The total inflows of
foreign direct investment in Greece fell in 2010-12
and are today at the same level as in 2003-05.
Between 2003 and 2012, fully 69 % of all foreign
direct investments were made in the services
sector.349
A new law on the creation of a development-
friendly environment for strategic and private
investments350
aims to accelerate and simplify
procedures. It includes provisions on developing
the seaside front of Attica and improving the
institutional framework for the founding and
operation of seaplane ports. For strategic
investments, there are proposals for simplified
licencing procedures through the General
Directorate for Licencing, which will handle all
strategic investment requests. The time restrictions
for the submission of investment plans (previously
every April and October), have been removed, and
such plans can now be accepted throughout the
year.
4.8.6 Conclusions
The Economic Adjustment Programme has sought
to adjust the imbalances in the economy. Greece
has started the process of transformation, from an
economy based on consumption to one with a
bigger focus on investments and exports. Exports
have already increased over recent years but, as a
result of the recession and the credit crunch,
investments are still disappointing.
The regulatory environment has constrained
businesses and entrepreneurship, and these,
combined with the lack of competition, have led to
lacklustre productivity and competitiveness.
However, steps are being taken to tackle many of
the structural barriers and regulatory failings.
Encouragingly, many efforts are starting to show
349 http://www.investingreece.gov.gr. 350 Law 4146/2013.

Country chapter: Greece
141
results, and the ranking of Greece in the World
Bank’s ‘Doing Business’ indicators has improved.
Further significant measures have been taken to
ease the creation of companies, and to simplify
licensing procedures and investment
authorisations. With the technical assistance of the
Task Force for Greece, cumbersome export
procedures are being simplified.
The difficult economic conditions, continuing
uncertainty, and in particular the credit crunch
continue to make conducting business difficult, in
particular for SMEs. Economic growth is one of the
top priorities of the government, and in this context,
reforming the public administration remains central
in terms of securing the capacity and competence to
implement newly adopted legislation and to
improve the business environment. Reforming the
economy must remain a priority in order for the
required changes to take place. A dynamic
corporate sector is crucial to re-starting the
economy and achieving growth. By tapping the
entrepreneurial potential of citizens and creating the
right business environment, Greece can overcome
its difficulties and achieve sustainable economic
and employment growth.
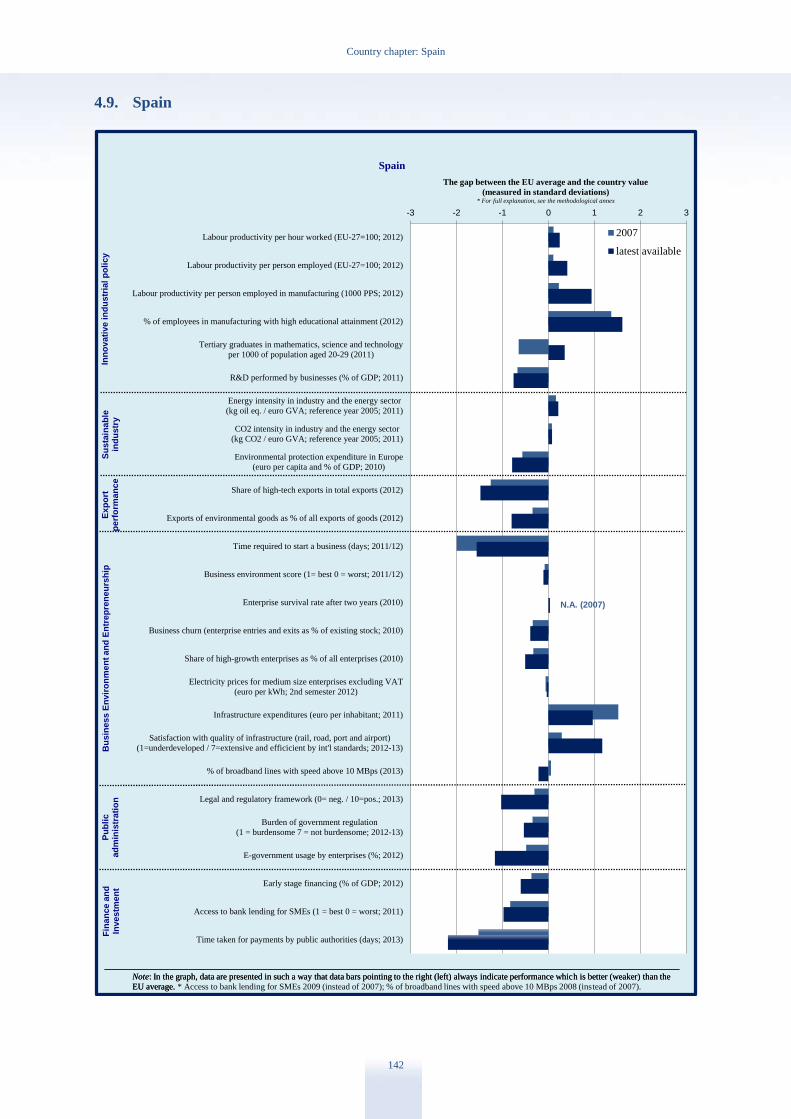
Country chapter: Spain
142
4.9. Spain
-3 -2 -1 0 1 2 3
Labour productivity per hour worked (EU-27=100; 2012)
Labour productivity per person employed (EU-27=100; 2012)
Labour productivity per person employed in manufacturing (1000 PPS; 2012)
% of employees in manufacturing with high educational attainment (2012)
Tertiary graduates in mathematics, science and technology
per 1000 of population aged 20-29 (2011)
R&D performed by businesses (% of GDP; 2011)
Energy intensity in industry and the energy sector
(kg oil eq. / euro GVA; reference year 2005; 2011)
CO2 intensity in industry and the energy sector
(kg CO2 / euro GVA; reference year 2005; 2011)
Environmental protection expenditure in Europe
(euro per capita and % of GDP; 2010)
Share of high-tech exports in total exports (2012)
Exports of environmental goods as % of all exports of goods (2012)
Time required to start a business (days; 2011/12)
Business environment score (1= best 0 = worst; 2011/12)
Enterprise survival rate after two years (2010)
Business churn (enterprise entries and exits as % of existing stock; 2010)
Share of high-growth enterprises as % of all enterprises (2010)
Electricity prices for medium size enterprises excluding VAT
(euro per kWh; 2nd semester 2012)
Infrastructure expenditures (euro per inhabitant; 2011)
Satisfaction with quality of infrastructure (rail, road, port and airport)
(1=underdeveloped / 7=extensive and efficicient by int'l standards; 2012-13)
% of broadband lines with speed above 10 MBps (2013)
Legal and regulatory framework (0= neg. / 10=pos.; 2013)
Burden of government regulation
(1 = burdensome 7 = not burdensome; 2012-13)
E-government usage by enterprises (%; 2012)
Early stage financing (% of GDP; 2012)
Access to bank lending for SMEs (1 = best 0 = worst; 2011)
Time taken for payments by public authorities (days; 2013)
The gap between the EU average and the country value
(measured in standard deviations)* For full explanation, see the methodological annex
Spain
2007
latest available
Note: In the graph, data are presented in such a way that data bars pointing to the right (left) always indicate performance which is better (weaker) than the
EU average.
Inn
ovati
ve in
du
str
ial p
oli
cy
Su
sta
inab
lein
du
str
yB
usin
ess E
nvir
on
men
t an
d E
ntr
ep
ren
eu
rsh
ipF
inan
ce a
nd
Investm
en
t
Note: In the graph, data are presented in such a way that data bars pointing to the right (left) always indicate performance which is better (weaker) than the
EU average. * Access to bank lending for SMEs 2009 (instead of 2007); % of broadband lines with speed above 10 MBps 2008 (instead of 2007).
Ex
po
rtp
erf
orm
an
ce
Pu
bli
cad
min
istr
ati
on
N.A. (2007)

Country chapter: Spain
143
Figure 4.9: Manufacturing sectors – Spain (2010)
Source: Eurostat
4.9.1 Introduction
Manufacturing plays a slightly smaller role in Spain
than in the EU on average (13.3 % of total value
added versus 15.3 % for the EU). Spanish firms are
specialised in low-tech manufacturing
(manufacturing of food products and beverages,
textiles and wearing apparel, etc.) and less-
knowledge-intensive services (trade,
accommodation and food services, travel agencies,
etc.). High value added sectors such as high-tech
manufacturing and knowledge intensive services
are still under-represented in terms of the number of
firms, employment and value added.
Spain continues to adapt to the correction of
imbalances that started in 2008. In the last couple of
years it has recovered about half of the cost
competitiveness lost between 2000 and 2008,351
although this is partly as a result of massive labour
shedding in low value added sectors, and longer
working hours. The adjustment of current account
deficit, investment in construction, and credit
growth has progressed. Restoring sustainable
external equilibrium requires a move to a sizeable
current account surplus, backed by reallocation of
resources to the tradable sector. Some improvement
351 Measured as Unit Labour Cost and based on data from
Eurostat and European Central Bank calculations.
is apparent in various indicators, including strong
export performance.
4.9.2 Innovation, skills and
sustainability
Innovation
Over the last decade, efforts have been made to
improve research and innovation performance.
However, the impact seems to have been limited, as
there has been little movement towards a more
knowledge-based economy. Research and
innovation suffer from low R&D investment by the
private sector and the increasingly regional
dimension of innovation policy. These challenges
have been aggravated by the crisis, with a fall in
public investment in R&D352
and a significant loss
of technologically innovative firms.353
The latest Innovation Union Scoreboard places
Spain, as before, in the group of moderate
innovators with performance below the EU
average. In that group, the country had the second-
lowest growth rate in the period 2008-12, and has
352 In relative terms (as percentage of GDP), Spain has
managed to overall maintain its level of expenditure with
a slight decrease in 2011 to 1.33 % (versus 1.39 % in 2010
and 2009, and 1.35 % in 2008). Source: Eurostat. . 353 Spain accounted for 44 888 technologically innovative
SMEs in 2007, compared to only 25 461 in 2011. Source:
Ministry of Economy and Competitiveness, Spain.
Food, beverages and
tobacco
19.24%
Textiles, apparel and
leather
4.10%
Wood, paper and
printing
8.00%
Chemicals, pharma,
petroleum, minerals
and rubber 24.25%
Metals
15.14%
Electronics, electrics
and machinery
11.64%
Cars and transport
10.95%
Other
6.68%
Country chapter: Spain
144
been unable to catch up with ‘innovation followers’
and ‘innovation leaders’ – in addition, regional
innovation performance is uneven and, taken
separately, the regions range from innovation
leaders to moderate innovators.354
Spain’s relative
strengths are seen in research (scientific
publications); in the percentage of population aged
30-34 with tertiary education; and in the
commercialisation of innovation. The main
weaknesses lie in the low level of private R&D
investment; the small number of innovative SMEs;
and the low licence and patent revenues from
abroad. The diminishing number of tertiary students
in sciences (-27.3% over the last ten years) is a
problem for the innovation potential.
The authorities are addressing these challenges with
a new ‘Spanish strategy for science, technology and
innovation’ and the implementing ‘State plan for
scientific and technical research and innovation’,
both adopted in February 2013. The new strategy
seeks to increase business R&D expenditure, ease
the transfer of knowledge between actors, and
foster smart specialisation at regional level. The
proposed reforms cover the governance system, the
quality of human resources, the funding allocation
system, knowledge transfer, strengthened public-
private cooperation, key challenges for society, and
the internationalisation of the system. Although the
aims of the strategy are laudable, the impact of the
strategy will depend on its effective implementation
through the state plan and the regional plans for
scientific and technical research, and innovation.
The government has also announced new fiscal
incentives to foster private investment in R&D and
the transfer of technology.355
In particular, R&D
deductions that are not applicable to a financial year
could be recovered subject to the creation or
maintenance of employment, and a bigger part356
of
the income that originates from the transfer of
certain intangible assets, such as patents, will be
exempted.
Skills
The most pressing issues are the difficult transition
from education to work, the high rate of early
354 Source: Regional Innovation Scoreboard 2012, European
Commission. 355 This measure will be part of the forthcoming law to
support entrepreneurs and their internationalisation. 356 60 %, instead of the current 50 %.
school leavers, and the skills mismatches between
education and labour market. Indeed, the Spanish
labour market is characterised by a mix of workers
with high skills and even over-qualification357
(especially among young people) as well as a high
proportion of low-skilled workers.358
This reflects
the dominance of construction and tourism
activities. The over-qualification points to skills
mismatch and lack of relevance of education359
and
training, and poor transition from school to work.
Further, the education system puts insufficient
focus on entrepreneurial skills.
The labour market reform of 2012 significantly
amended the system for training and
apprenticeship. This was followed by the launch of
a dual vocational training system360
to better adapt
the training supply to business needs, as well as the
Entrepreneurship and Youth Employment Strategy
2013-2016. The percentage of 18-64 olds believing
they have the right skills and knowledge to start
business is above the EU average.361
In May 2013 the government approved a reform of
the education system that is now waiting for
parliamentary approval. It seeks to introduce
entrepreneurship-related content in the secondary
school curriculum.. The main goal is to reduce the
number of early school leavers and to improve the
transition from school to working life.
Sustainability
Various measures were adopted in 2012 to contain
the so-called tariff deficit362
of the electricity sector,
including a single tax rate (7 %) on all power
generation. In addition, premiums for new
357 22 % of all employees in Spain are over-qualified for their
post. In the case of young people (25-34), 38 % of them
are over-qualified for their position. Source: Social Developments Employment and in Europe 2012,
European Commission. 358 The employment rate of people with pre-primary, primary
and lower secondary education was 48.2 % in 2012
(versus 61.2 % in 2007). 359 About 40 % of young people between 25 and 34 years old
with a tertiary education degree are not employed in
occupations that typically require this qualification.
Source: OECD Economic Surveys Spain 2012. 360 Royal decree law 1529/2012 of 8 November. 361 Global Entrepreneurship Monitor. 362 Access tariffs to the electricity system do not cover
regulated costs (e.g. transportation costs, distribution
costs, subsidies for renewable energy production or
adjustment services). As a result, a so-called tariff deficit is generated within the system at the expense of utilities.
The cumulative tariff debt is EUR 29 billion (equivalent
to almost 3 % of GDP).
Country chapter: Spain
145
renewable projects were withdrawn.363
To complete
these measures, the government has also presented
a plan for a comprehensive reform of the electricity
sector. There are several projects with France364
and
Portugal365
that aim to double the capacity of the
electricity interconnections with these countries.
The Government has also taken steps366
to promote
efficient use of energy, including through
environmental taxes;367
the suppression of some
exemptions of the tax rates for gas and coal; and the
establishment of a fee for the use of water for
producing electricity. Further new measures are in
the pipeline to reduce carbon emissions, including
the adoption of green taxes, a law to promote
calculation of the carbon footprint, and the national
framework plan for waste.
Finally, the government is working on a new bill on
environmental impact evaluation with the aim of
simplifying procedures and bringing together
existing legislation on strategic environmental
evaluation and on the evaluation of environmental
impact.
4.9.3 Export performance
Exports have grown considerably since 2009,
although the pace of growth decelerated in 2012.368
This comes on top of a decade-long strong
performance, as the export share stayed relatively
stable in spite of sustained losses in price
competitiveness, and the rise of emerging
economies. However, exports as a share of GDP are
below that of other European economies, and the
share of knowledge-intensive service exports with
high added value is well below the EU average.369
363 Royal decree law 1/2012 suspended temporarily all new
renewable capacity registration. 364 A study on the viability of the routes for the proposed
interconnections will be finalised in 2013. The aim is to
duplicate the current capacity to 2 800 MW in 2014 and
4 000 MW in 2020. 365 Spain is working on two projects to reach an
interconnection capacity of 3 000 MW, which would be in
force in 2014 and 2016 respectively. 366 Law 15/2012 of 27 December 2012. 367 A single tax (7 %) on the value of electrical production, a
tax on the production of nuclear fuel and waste, and a tax on the storing of nuclear waste and fuel.
368 Spanish exports grew 3.8 % in 2012, 15.2 % in 2011 and
16.8 % in 2010 in current prices according to customs data.
369 The weight of exports in Spain’s GDP has risen from
23.9 % in 2009 to 32.2 % in 2012 but remains below the
The recent export dynamism reflects improvement
in both cost and non-cost factors. As unit labour
costs have decreased, product and geographical
diversification have helped to sustain export
performance. Indeed, exports of services have
grown more rapidly than goods, and now account
for about one third of the total. In addition, the
services exported have become more diversified,
and besides tourism they include transport and
business services. There has also been some
reorientation towards emerging markets, which has
limited the negative impact of the weakness in
Europe.
Spain lags slightly behind the EU-average in most
indicators on SME internationalisation.370
The costs
of trading are higher than the EU average, although
this does not appear to influence the time required
to import or export, which is shorter than in the
EU.371
Moreover, almost 88 % of exports in 2012
were by the largest 10 % of exporters,372
suggesting
a dichotomy between a small number of very
competitive large exporters and a large number of
less competitive exporting firms.
In 2012, two previous programmes for export
promotion373
were merged into a new programme
called ICEX-next, which provides tailored advice
and financial support for the internationalisation of
SMEs.374
There are also plans to develop new
export markets375
in 2013, with a focus on Asia.
Spain has also strengthened the links between
internationalisation and innovation by integrating
the external network of the Centre for industrial
technological development376
into the ICEX
network.
EU average (42.6 %). Source: World Bank, OECD and
Instituto Nacional de Estadística. 370 For further details, see SBA factsheet 2012, Spain.
European Commission. 371 Source SBA fact sheet for Spain 2012, European
Commission. 372 Source: ICEX statistics. 373 APEX was a programme to raise awareness of the benefits
of internationalisation among SMEs with no or minimal
exporting experience; and ICEX PIPE provided
consultancy services and economic support to new exporters.
374 Around 8000 have benefited from ICEX PIPE over the
last 7 years. ICEX-next is expected to support around 400 enterprises per year in the short term, and 500 to 600 per
year in the medium term. 375 ‘Planes integrales de desarrollo de mercado’. 376 The Centre for industrial technological development
(CDTI) is a public entity which fosters the technological
development and innovation of Spanish companies

Country chapter: Spain
146
As part of the forthcoming law to support
entrepreneurs and their internationalisation, the
government plans to strengthen support bodies, as
well as to improve financial instruments for this
purpose and firms’ access to foreign public
procurement of international financial institutions.
Further, the government plans to adopt a new law
on chambers of commerce to enhance their role in
supporting internationalisation.
4.9.4 Business environment and public
administration
Business environment
The legal and regulatory framework remains very
burdensome, despite improvements over the years.
In particular, it is difficult to start a business.377
Although the time needed has come down from 47
to 28 days, it remains above the EU average. The
licensing system is very complex, and the time
needed to obtain an operating licence is the longest
in the EU, at 116 days.378
However, the government has generalised the use
of the ‘express licence’ regime, whereby a
declaration is enough to launch the economic
activity, in the case of small and medium retail and
other services. The government now plans to extend
this regime to larger outlets and other types of
activities as part of the forthcoming law to support
entrepreneurs and their internationalisation.
Promotional activities in retail have been
liberalised; the requirements for road transport
firms simplified; and the opening of petrol stations
facilitated. Liberalisation of passenger rail transport
has started with the long-distance tourist train
segment that has been opened to competition.
In February 2013 the government announced an
‘Economic stimulus plan and support for the
entrepreneur’. The first measures379
included
facilitating access to finance; a flat rate of EUR 50
for social security charges for new self-employed
persons during the first six months; reconciling
through channelling the funding and support applications
for national and international R&D&I projects of Spanish
companies. 377 In the World Bank’s ‘Doing Business’ Indicators for
starting a business, Spain ranks 136th for this specific area,
while its overall ranking is 44th. 378 Source SBA fact sheet for Spain 2012, European
Commission. 379 Through the Royal decree law 4/2013, of 22 February.
unemployment benefits with self-employment for
up to nine months; and lower taxes for new firms
and self-employed persons for two years. Other
measures are planned for 2013, including a law on
market unity, and the omnibus law to support
entrepreneurs and their internationalisation that
should be adopted by the parliament in 2013. This
would include the creation of a ‘limited liability
entrepreneur’; the establishment of new out-of-
court settlement mechanisms for bankruptcies;
fiscal incentives;380
measures to facilitate access to
finance;381
exempting more activities from local
licences; removing barriers to accessing public
procurement; measures to foster the
internationalisation of the economy;382
and
measures to reduce the administrative burden.383
The draft law on market unity384
aims at addressing
the regulatory fragmentation of the domestic
market, which hinders competition and prevents
businesses from taking advantage of economies of
scale and scope. If effectively implemented, it
could facilitate the movement of goods and
services, as well as simplify licensing requirements.
In parallel, the government has launched a review
of the existing regulatory framework in the interests
of simplification, rationalisation and coherence.
According to the authorities, about 5 000 pieces of
legislation have already been identified for revision.
Moreover, the government is working to reduce red
tape in the fields of restoration and electronic
communications.
Finally, the delayed reform of professional services
is scheduled for 2013. The government plans inter
alia to reassess the activities restricted to a selected
380 In particular, tax deductions for the reinvestment of profits
and investments in R&D, a special VAT voluntary regime for SMEs to defer the payment of VAT to the State until
the invoice has been collected, and tax incentives for
providing capital to start-ups in the form of income tax reductions and partial exemption from taxation of capital
gains. 381 Including the elimination of charges linked to the issuance
of corporate debt, and new instruments for financing the
internationalisation of businesses. 382 Including a new visa regime for attracting talent and
investment, and the formulation of an internationalisation
strategy for Spain. 383 This includes speeding up and simplifying certain
procedures necessary to start up a business, reducing
statistical and accounting requirements, and establishing a
‘one in one out’ clause guaranteeing that at least one burden of equivalent cost is removed for each
administrative burden introduced. 384 Adopted by the Council of Ministers in July 2013.

Country chapter: Spain
147
group of professions and the rules on membership
of professional associations.
Public administration
The government set up a commission for the reform
of public administration whose final report was
issued in June 2013. The report included proposals
to be implemented between 2013 and 2015 around
the following four axis: reducing the overlap
between central and regional governments;
streamlining and rationalising public bodies;
merging of horizontal services (e.g. procurement);
and administrative simplification. In parallel, the
reform of local administration will clarify
competencies to avoid any overlap with other
levels. The government plans to set up a body to
report back every quarter on the implementation of
the proposed measures.
The law on transparency currently being debated by
the parliament will establish good governance
requirements for public administration, contributing
to simplification of administrative burden and
easing access to public information.
The areas of concern in the judiciary include low
clearance rates, a high case backlog and relatively
lengthy proceedings,385
but reforms aim at tackling
some of these issues. The reorganisation of the
courts and judiciary is scheduled for the end of
2013. Information and communication technologies
for the judiciary are not yet readily available
everywhere.
4.9.5 Finance and investment
Access to finance remains one of the most
problematic areas for SMEs,386
including the need
for working capital. They rely heavily on bank
lending for their financing needs, but loans are not
readily available387
despite the improvement in
385 EU Justice Scoreboard 2013 – Note that there was a
country-specific recommendation on these issues in 2013. 386 27 % of SMEs point to access to finance as the worst
problem of all. Source: survey on the access to finance of SMEs in the euro area, April to September 2012,
European Central Bank. 387 79 % of SMES consider that the situation has deteriorated
(37 %) or remained unchanged (41 %) over the previous 6
months, while only 8 % consider that it has improved. The
level of interest rates increased (76 %) and other costs of financing (80 %), collaterals (61) increased, while the
available size of loans remain unchanged (42) or
decreased (45). Source: Survey on the access to finance of
bank balance sheets. This has been in particular due
to the difficult macroeconomic and firm-specific
outlooks, and the stress in sovereign debt markets.
The stresses have been reflected in higher interest
rate differentials compared to other countries.
Meanwhile, alternative sources of financing remain
limited, due to lack of both demand and supply.
The authorities are implementing a comprehensive
strategy aimed at restoring the credit flow. This is
based on restructuring the financial system and
fostering non-bank intermediation. The government
is redirecting support towards working capital
needs, as this is seen as a higher priority than
investment. Despite this, the necessary
deleveraging of the private sector weighs on
economic growth and defaults are soaring,
especially in the construction and real estate
sectors, although the number of non-performing
loans with a public guarantee remains stable.
The counter-cyclical role of the Public Credit
Institute (ICO) has become more important. In
2012, over 10 % of business financing for maturities
over one year was granted through ICO credit
lines.388
It has simplified its facilities, focusing on
two actions: boosting funding for firms and
entrepreneurs, and financing internationalisation.
The credit lines for 2013 have been supplemented
with additional EUR 11.5 billion.
The restructuring of the banking sector389
has led to
the disappearance of some savings banks that were
merged with or acquired by other entities. This has
left some SMEs, in particular smaller firms, without
their traditional banker, increasing the costs caused
by information asymmetry at a time when banks are
generally reluctant to lend. The government is
reinforcing the mutual guarantee companies by
increasing the capital of the public counter-
guarantor. Its budget for 2013 has been increased to
EUR 32 million, an increase of 67 % compared to
SMEs in the euro area, April to September 2012, European Central Bank.
388 ICO granted EUR 11.5 billion through second-floor
facilities (which ICO provides through Spanish Credit Institutions) to over 160 000 SMEs.
389 In June 2012, Spain formally requested financial
assistance for the recapitalisation of the Spanish financial institutions. The assistance was granted in July in the form
of a programme for the repair and reform of the Spanish
financial sector. The core of the programme involves sufficient recapitalisation of Spanish banks, where
needed, for which up to EUR 100 billion were made
available by EFSF/ESM.
Country chapter: Spain
148
2012. It has also increased the coverage rate of
loans for working capital (up to 60 %) and the
internationalisation of SMEs (up to 75 %).
The government has also adopted measures to
promote alternative financing mechanisms,
including the launch of a ‘Spain start-up co-
investment’ targeting early-stage equity and
mezzanine finance. Further, it seeks to reduce the
credit requirements for asset securitisation funds,
and launch an incubator programme with a budget
of EUR 50 million. As regards venture capital,
other developments include the launch of the
‘Isabel la Católica’ fund, with a budget of
EUR 30 million, and the creation of a fund of funds
with EUR 1 200 million to invest. In addition, an
Alternative Bond Market should become
operational in 2013. The existing support
programme for the operating costs of business
angel networks will also be extended.
The government also intends to introduce an
‘Elevator Law’ to facilitate transition from the
regulated stock market to the alternative market and
vice versa. In addition, planned regulatory changes
will facilitate the operations of venture capital
funds. The omnibus law to support entrepreneurs
and their internationalisation includes a number of
measures to facilitate access to finance, like tax
incentives, amendments to the regulatory
framework for out-of-court refinancing settlements,
and new instruments to promote export credit.
Finally, the JEREMIE scheme of the European
Regional Development Fund (ERDF) has been
restructured to ease SMEs’ access to credit, with
EUR 320 million from the ERDF.
The liquidity problems of firms have been
aggravated by long delays in receiving payments, in
particular from the public sector.390
To ease this
situation, the government has approved a set of
measures aimed at regularising the arrears that
390 Spain remains one of the Member States with the longest
payment delays attributable to public authorities, well
above the EU average. At European level the public sector pays its bills, on average, after 65 days, about 13 days
later than the private sector (52). National averages are
however very different, and in some countries, in some sectors (health, constructions) the bills are settled after
more than six months. At national level Spanish public
authorities are paying their invoices after 160 days on average. In business to business commercial transactions
it takes an average of 97 days to be paid. European
Payment Index 2012. Intrum Justitia.
regional and local governments have built up.391
This provided about EUR 27 billion392
of liquidity
to firms in 2012, and has been extended to 2013
with an allocation of EUR 2.7 billion. In parallel,
the government set up in June 2012 a voluntary
scheme for the centralisation of public debt
issuance, to provide liquidity to regional
governments. This mechanism provided
EUR 17 billion to regional administrations in 2012,
of which EUR 6.7 billion constituted payments to
SMEs. Further, the late payments directive393
has
been transposed, and effective implementation is
crucial to avoid new arrears.
There has been increased interest in investing in
Spain from emerging economies (Brazil, Mexico,
India and China). The main incentives for such
investment are infrastructure, the level of
technology, and the structural reforms. The
promotional structures have been streamlined and
the focus is on attracting foreign direct investment
and helping firms to finance their expansion. A new
directorate on financing and investor relations has
been set up to offer services to businesses that seek
international investors. ‘Invest in Spain’ is also
linked with the ‘Marca España’ project, which
seeks to improve the image of the country abroad.
Finally, the omnibus law to support entrepreneurs
and their internationalisation will reform visas and
residence permits to attract talent and investment
from abroad.
4.9.6 Conclusions
Spain is undergoing a profound structural
adjustment to correct the large internal and external
imbalances built up during the housing and credit
booms. Firms are still struggling with the impact of
the recession and the worsening credit conditions.
The government’s reform agenda has focused on
two key areas, easing access to finance, and
improving the business environment.
Lack of access to credit remains one of the biggest
concerns of SMEs. Bank credit for SMEs is
relatively costly and difficult to attain, and the
interest rate differential is high compared to other
391 Royal decree law 4/2012 of 24 February, and Royal
decree law 7/2012 of 9 March. 392 5.6 million invoices were paid for a total amount of EUR
27.3 million, of which 98 % constituted payments to
SMEs. All debts had been paid by end of November 2012. 393 Royal decree law 4/2013 of 22 February.
Country chapter: Spain
149
Member States. Although measures adopted under
the banking sector recapitalisation programme
should ultimately help to alleviate this situation, for
now there are no signs of significant improvement.
The government is trying to ease credit constraints
through financial instruments, in particular loan
guarantees, and promoting alternative financial
instruments.
Measures have also been adopted to simplify the
business environment. Overall, progress has been
slow and some flagship reforms are still pending,
such as the law to support entrepreneurs and their
internationalisation; the reform of professional
services; and the law to guarantee the unity of the
market.
The structural reforms need to be completed before
their full impact on growth and competitiveness is
felt. In particular, this applies to improving the
business environment, and to enhancing non-cost
competitiveness.

Country chapter: France
150
4.10. France
-3 -2 -1 0 1 2 3
Labour productivity per hour worked (EU-27=100; 2011)
Labour productivity per person employed (EU-27=100; 2012)
Labour productivity per person employed in manufacturing (1000 PPS; 2012)
% of employees in manufacturing with high educational attainment (2012)
Tertiary graduates in mathematics, science and technology
per 1000 of population aged 20-29 (2010)
R&D performed by businesses (% of GDP; 2011)
Energy intensity in industry and the energy sector
(kg oil eq. / euro GVA; reference year 2005; 2011)
CO2 intensity in industry and the energy sector
(kg CO2 / euro GVA; reference year 2005; 2011)
Environmental protection expenditure in Europe
(euro per capita and % of GDP; 2010)
Share of high-tech exports in total exports (2012)
Exports of environmental goods as % of all exports of goods (2012)
Time required to start a business (days; 2011/12)
Business environment score (1= best 0 = worst; 2011/12)
Enterprise survival rate after two years (2010)
Business churn (enterprise entries and exits as % of existing stock; 2010)
Share of high-growth enterprises as % of all enterprises (2009)
Electricity prices for medium size enterprises excluding VAT
(euro per kWh; 2nd semester 2012)
Infrastructure expenditures (euro per inhabitant; 2011)
Satisfaction with quality of infrastructure (rail, road, port and airport)
(1=underdeveloped / 7=extensive and efficicient by int'l standards; 2012-13)
% of broadband lines with speed above 10 MBps (2013)
Legal and regulatory framework (0= neg. / 10=pos.; 2013)
Burden of government regulation
(1 = burdensome 7 = not burdensome; 2012-13)
E-government usage by enterprises (%; 2012)
Early stage financing (% of GDP; 2012)
Access to bank lending for SMEs (1 = best 0 = worst; 2011)
Time taken for payments by public authorities (days; 2013)
The gap between the EU average and the country value
(measured in standard deviations)* For full explanation, see the methodological annex
France
2007
latest available
Note: In the graph, data are presented in such a way that data bars pointing to the right (left) always indicate performance which is better (weaker) than the
EU average.
Inn
ovati
ve in
du
str
ial p
oli
cy
Su
sta
inab
lein
du
str
yB
usin
ess E
nvir
on
men
t an
d E
ntr
ep
ren
eu
rsh
ipF
inan
ce a
nd
Investm
en
t
Note: In the graph, data are presented in such a way that data bars pointing to the right (left) always indicate performance which is better (weaker) than the
EU average. * Access to bank lending for SMEs 2009 (instead of 2007); % of broadband lines with speed above 10 MBps 2008 (instead of 2007).
Ex
po
rtp
erf
orm
an
ce
Pu
bli
cad
min
istr
ati
on
N.A. (2007)
N.A.

Country chapter: France
151
Figure 4.10: Manufacturing sectors – France (2010)
Source: Eurostat
4.10.1 Introduction
Manufacturing plays a smaller role in France than
in the EU as a whole (10 % of value added vs.
15.3 % for the EU in 2012). In terms of the sectoral
breakdown, France is specialised both in
technology-driven (aerospace) and marketing-
driven industries (luxury). Most of the goods and
services belong to the category of medium-high
innovation, but there is less activity in high
innovation sectors.
Although productivity is high, the competitiveness
gap vis-à-vis the best performers is widening,
driven by both cost and non-cost factors, also in the
context of a deteriorating external position and high
public debt.394
To restore competitiveness, the
government adopted in November 2012 an
overarching strategy — the Pact for Growth,
Competitiveness and Employment — structured
around eight competitiveness policy levers and 35
decisions aimed at lowering taxes and business
costs, facilitating access to finance, supporting
innovation, and ensuring a simpler and a more
stable regulatory, administrative and tax
environment. Further, in April 2013, a set of ten
enterprise-friendly measures were announced
following the Assises de l’entrepreneuriat, most of
which will take effect in 2014. The government has
394 In-Depth Review, COM(2013) 199 final.
also announced a complementary set of measures to
further reduce red tape and administrative cost for
companies.
4.10.2 Innovation, skills and
sustainability
Innovation
The Innovation Union Scoreboard 2013 classifies
France as an innovation follower, although R&D
intensity has grown from 2.08 % in 2007 to 2.27 %
in 2009, and was stable in 2010 and 2011, leaving it
well below the national target of 3 %. In particular
business R&D intensity, which has increased
slightly despite the crisis, from 1.31 % of GDP in
2007 to 1.42 % of GDP in 2011,395
remains
significantly below the 2020 target.
The level of business R&D intensity is relatively
low compared to the innovation leader countries.
Besides a few highly innovative and exporting
firms, many small firms are not investing in
innovation, particularly in non-R&D innovation, as
the percentage of SMEs innovating in-house and
introducing product or process innovations is below
395 Business R&D intensity progressed from 1.33 % of GDP
in 2008 to 1.40 % in 2009 and to 1.43 % of GDP in 2010
and 2011.
Food, beverages and
tobacco
17.25%
Textiles, apparel and
leather
2.98%
Wood, paper and
printing
5.66%
Chemicals, pharma,
petroleum, minerals
and rubber
23.91%
Metals
12.53%
Electronics, electrics
and machinery
15.52%
Cars and transport
12.66%
Other
9.49%

Country chapter: France
152
the EU average.396
While France is a net exporter of
services, the share of knowledge-intensive services
with high added value is well below the EU
average. There is potential to draw larger benefits
from the science and technology base, besides
making technology transfer more efficient. In
particular, non-technological innovation
(marketing, branding, product customisation,
advanced customer support) and non-breakthrough
innovation (e.g. embedded software) provide high
added value and contribute to firm growth,
promoting competitiveness.
The competitiveness pact identified innovation as
the route to improved competitiveness, and a set of
measures has been announced, including further
public support for innovation by businesses by
extending the research tax credit beyond 2013,
retargeting the Pôles de compétitivité to better focus
on projects with market potential, increasing the
transfer of public R&D, spreading digital and key
enabling technologies, steering public procurement
towards innovative goods and services, and setting
up a working group at national level to reflect on
the various levers of innovation (economic sectors,
taxation, innovation culture, support schemes).
Also, the Investment for the future programme is
expected to facilitate investment in innovation
through disruptive technologies, including by
SMEs. Further, the tax credit for innovative new
companies should allow about 2 600 companies
(jeunes entreprises innovantes) to enjoy full
exemption from social security contributions for
eight years, with a broader definition of eligible
expenses.
Overall, the innovation system would benefit from
a stable and clear environment for business research
and innovation, and where redundancies and
overlaps would be limited.
Skills
The share of the population with tertiary education
is above the EU average. However, the skills
acquired do not seem to fully match the needs of
businesses, in particular for ICT engineering and
management skills.397
Moreover, participation in
396 Research and Innovation Performance in France: Country
profile 2013. 397 29 % of employers report recruiting difficulties, which is
the second highest in Europe. EU skills panorama 2012,
lifelong learning is low compared to EU average,
which may further aggravate the skills mismatch.
The 2013 reforms of compulsory and higher
education, and the research system, seek to adapt to
the digital age.398
The guidance available does not seem sufficient to
allow students to identify courses offering the
greatest employment opportunities despite major
reforms since 2007 that have introduced measures
to support more informed choice and guidance for
students.
Increasing the availability of support services to
enhance the capacity of SMEs to anticipate their
employment and skills needs, and to manage
restructuring would help to manage structural
change and improve the use of human capital. A
bill on further decentralisation of national
competencies would increase the role of regions in
training, and improve the match with regional skills
needs.
Sustainability
Energy intensity in industry and the energy sector is
slightly lower than the EU average, and due to the
energy mix, carbon intensity is one of the lowest in
the EU. In addition, electricity prices for mid-sized
enterprises are well below the EU average.
However, increasing energy demand, and the plans
to reduce the use of nuclear power, mean that other
energy sources will have to be developed. This
could lead to higher electricity prices for industrial
consumers in the medium term, in particular for
energy-intensive industries. However, the
electricity generation market remains very
concentrated and a commitment to further open it to
competition could mitigate price developments.
To reach the Europe 2020 target,399
significant
investment will be necessary in renewables. This
may create potential for French suppliers to
specialise in technologies such as offshore wind
http://euskillspanorama.ec.europa.eu/KeyIndicators/Country/NationalData.aspx?lookupid=10&.
398 The first one encompasses the setting up of a ‘public
service for digital education ’and legal measures to facilitate the use of OER by teachers. The bill on higher
education (HE) and research foresees the provision of
OER by the public HE institutions as well as related services.
399 23 % of renewable energy in final energy consumption
(13.1 % in 2011).
Country chapter: France
153
and tidal power, or to develop activities such as
maintenance and recycling.
A new tax on lorries (above 3.5 tonnes) has been
announced and is due to enter into force in October
2013. It is expected to increase the cost of freight
by 5 % and lead to optimisation of road freight (e.g.
a higher load factor). A significant shift to rail
freight remains the long-term objective, but this
would require significant investment in
infrastructure and an appropriate competition
framework.
4.10.3 Export performance
As underlined by the in-depth review,400
France has
a growing trade deficit, which reflects the long-term
decline in export market shares: the trade balance
has been deteriorating since 1997 and showed a
deficit of 2.5 % of GDP in 2011. The market share
of exports fell by 11.2 % between 2006 and 2011.
In 2012 the current account improved because of
slow domestic demand and larger exports (in
particular in aerospace).
This situation is due to persistent losses in cost and
non-price competitiveness. Unit labour costs in
business services are higher than in comparable
Member States, and the cost of services is an
important part of production costs in
manufacturing. Compared to Germany, unit labour
costs are higher for companies below 1 000
employees. At the same time, the structural
weaknesses in areas such as taxation, labour
rigidities, the regulatory environment, regulated
professions, and competition in product markets
slow down productivity growth and weigh on the
profitability of firms.
France remains the third largest exporter of goods
in the EU, accounting for 10.7 % of EU exports to
non-member countries.401
France exports mainly
aircraft, food, chemicals, industrial machinery, iron
and steel, electronics, motor vehicles and
pharmaceuticals. The share of high-tech exports in
total exports is the fifth highest in the EU.
The competitiveness pact sets a national target to
achieve a trade surplus by 2017, excluding energy.
400 COM(2013) 199 final (under Regulation (EU) No
1176/2011). 401 Eurostat, International trade in goods (July 2012).
Supplementary measures to stimulate exports were
announced in December 2012, for example
accompanying a limited number of SMEs and mid-
caps with high export potential on foreign markets
or promoting France as a quality brand abroad.
4.10.4 Business environment and public
administration
According to various competitiveness rankings,
France scores well but has slipped back slightly
compared to previous years.402
While the
infrastructure is the fourth best in the world, the
labour market appears relatively less flexible than
in its peers, and the tax regime is considered as
particularly distorting.403
The procedures for starting up a business are less
complex in France than in the EU on average, and
the cost of starting a company is lower — as is the
cost of enforcing contracts. France is close to the
EU average in the availability of business-related e-
government services, the use of evidence-based
instruments and the administrative cost of taxation.
However, the perception of the legal and regulatory
framework by businesses still scores clearly below
the EU average, ranking 17th among the Member
States.
The complexity of the legal and regulatory
environment was acknowledged in the
competitiveness pact and a ‘simplification shock’
was included in the national reform programme.
Several measures have been announced, including
some streamlining of public subsidies to enterprises
(including state aid), some reduction in the existing
‘gold-plating’ of EU legislation, and the inclusion
of an SME test in the impact assessment
methodology.404
Other measures include the target
to eliminate ten information obligations by 2016,
402 In the 2013 World Bank Doing Business Report, France
ranks 34th (out of 185 countries), slightly down on
previous years (32nd in 2012 and 28th in 2011).
According to the Global Competitiveness Index, France ranked 21st in 2012-13 (out of 144 economies), losing
three places compared to 2011-12 mainly due to falling
confidence in public and private institutions (down four places) and the financial sector (down 13 places in
trustworthiness). 403 Global Competitiveness Report 2013-14. 404 Detailed guidance is available to Ministries since 2009.
Although the impact assessment methodology is not
publicly available, many impact assessments are now published. Their content and level of detail varies
significantly, not least as regards the analysis of policy
options and of stakeholder interests.

Country chapter: France
154
and a moratorium on new rules (one-in, one-out
policy).
The taxation system remains highly complex
because of multiple exemptions and derogations,
and constant changes. This leads to a lack of
transparency for businesses, especially SMEs and
foreign investors. The tax wedge on labour is
high,405
and the overall tax burden on businesses
has substantially increased since 2010.
However, new measures like the tax credit for
competitiveness and employment406
are expected to
decrease the tax burden on labour for companies by
EUR 20 billion. The impact of this measure will
mostly be felt from 2014 onwards, although a pre-
financing has been set up for SMEs, and it is too
early to assess its impact on corporate investment in
the medium term, particularly in manufacturing. In
any case, this tax credit will only partially offset the
increases in the tax burden on companies enacted
since 2010. Further steps would help in shifting the
tax burden from labour to other forms of taxation
that weigh less on growth and external
competitiveness.407
Despite the absence of minimum standards of
stakeholder consultation, such as minimum
consultation deadlines, stand-alone processes such
as the Assises de l’entrepreneuriat or the
consultation during the preparation of the Gallois
report, have offered significant opportunities for
business stakeholders to express their views and
have led to something of a consensus on the nature
and causes of competitiveness losses, if not on
policy priorities and appropriate remedies. A
permanent consultation of enterprises on
simplification has recently been announced.
In April 2013, as a result of discussions within the
Assises de l’entrepreneuriat, a set of enterprise-
friendly measures were announced, most of which
will take effect in 2014. The measures include the
encouragement of a second chance in the event of
failure (by abolishing the blacklist for single
business failure); dedicated funding through the
Public Investment Bank to help business start-ups
in disadvantaged areas; special visas for foreign
405 OECD Economic Surveys: France, March 2013. 406 Crédit d’impôt pour la compétitivité et l’emploi. 407 France is among the EU countries with the lowest share of
environmental taxes and VAT in GDP.
start-up investors; tax relief over five years for
equity investments in start-ups; the creation of
business incubators (Maisons de l’international) in
major cities throughout the world (in particular in
the United States and Asia) to encourage French
SMEs to export their goods and services; the
introduction of a student entrepreneur scheme
enabling anyone setting up a company after
completing their studies to continue to benefit from
their student status; and introducing
entrepreneurship and innovation learning in
secondary school.
If fully implemented, such measures can have a
positive impact on the business environment.
However, in order to boost competitiveness, it
would be helpful to address the challenging
structural weaknesses, in particular the competition
framework. The cost of services could be lowered
by increasing competition. As highlighted by the
Commission and the Council in the country-specific
recommendations, unjustified barriers persist in
several areas, including regulated professions (in
particular the legal form, shareholding structure,
quotas and territorial restrictions); retail trade
(spatial planning restrictions, authorisation
procedures for retail outlets); network industries, in
particular the electricity market (high concentration
with only limited connections to neighbouring
countries); and rail transport (no competition in
domestic passenger transport).
Public administration
In terms of overall government effectiveness as
measured by the World Bank, France performs just
above the EU average, but not as well as in the
previous year.
Coordination among administrative levels and
communication with enterprises could benefit from
further improvement. There is no single contact
point at local level for enterprises on state aid or
other public support. The creation of the Public
Investment Bank is expected to provide a single
contact point for public loans, guarantees and
export financing, and may enable the rules for
access to be harmonised. The management of other
forms of public financial support, including state
aid, remains scattered between numerous local
authorities (municipalities, ‘inter-municipal’
bodies, ‘departments’, regions, future
‘metropoles’). Policies on economic development
Country chapter: France
155
and innovation are adopted and implemented by
several layers of government. The draft law on
decentralisation provides for the creation of
‘conferences’ to coordinate activities between all
local authorities.
4.10.5 Finance and investment
The amount of overall outstanding credit to
enterprises remained stable in 2012, with variations
between sectors and types of firm. In December
2012, the amount of outstanding credit had
increased by 0.8 % compared to December 2011.408
Outstanding credit to SMEs, excluding individual
entrepreneurs and real estate activities, grew by
2.5 % year-on-year. Credit to the building (+7.5 %)
and retail (+5.4 %) sectors increased, while that to
the manufacturing sector decreased by 3.3 %.
However, short-term cash facilities tightened by
3.5 %.
As a whole, greater non-price competitiveness
would require significant additional investment by
businesses, not least in R&D and human resources,
while the profitability of non-financial companies is
declining and at its lowest level since 1985. Most
firms are dependent on credit, particularly in the
manufacturing sector, as self-financing capacity has
tended to deteriorate in recent years, while
alternative sources of financing such as venture
capital, business angels, equity markets and other
equity funding remain limited, in particular for
SMEs. In addition, payment times have not
improved sufficiently to help to address this lack of
financing. However, the situation in France is much
better than in many other Member States.
The competitiveness pact has identified these
challenges and included several commitments to
improve access to finance, in particular through
additional public schemes (guarantees and loans);
measures on savings taxation (including tax
incentives to encourage investment in stocks and
corporate debt issued by SMEs and mid-cap firms);
and measures to facilitate access to equity markets
by SMEs and mid-caps (including the creation of a
new stock exchange).
Although the regulated savings accounts are not
meant for the financing of enterprises, one option is
408 Source: Banque de France.
that a small part could go to the new public
investment bank, Bpifrance, for equity financing of
(non-listed) SMEs and mid-caps. Similarly, a new
life insurance contract could be created to allow
insurance companies to invest more in listed
companies and corporate bonds, which could
mainly benefit larger companies. A new specific
savings account has also been planned to favour
investment by banks in (listed) SMEs. The take-up
of pre-financing provided by the Crédit d’impôt
pour la compétitivité et l’emploi seems to benefit
microenterprises that need immediate cash flows.
Such measures could improve the external
financing of businesses, in particular SMEs, but the
impact depends on their effective implementation.
As regards foreign direct investment, the inward
stock amounted to 35 % of GDP in 2011 compared
with 29 % in 2000. Overall, foreign companies
account for a third of exports and 20 % of business
expenditure on R&D. The Invest in France Agency
is the official body that provides information and
support to foreign investors in France and promotes
France’s business image and attractiveness abroad.
4.10.6 Conclusions
Improving competitiveness has become the key
challenge of the French public reform agenda and a
number of measures have been announced, notably
as part of the competitiveness pact, and following
the suggestions of the Assises de l’entrepreneuriat.
These initiatives relate to better access to finance,
improved support for innovation, encouraging
entrepreneurship and improving the regulatory and
administrative environment.
While the measures announced would represent
steps in the right direction, most of them still have
to be effectively implemented. The final impact
depends on how effective this implementation is,
and how well the measures are coordinated, with a
view to avoid overlaps and further complexity, and
to maximise synergies.
To achieve a significant improvement in
competitiveness, it would be necessary to
supplement these reforms with measures removing
the structural weaknesses that slow down
productivity growth and hamper the profitability of
firms, in particular labour market rigidities,
regulatory burden, complex taxation and limited
competition.
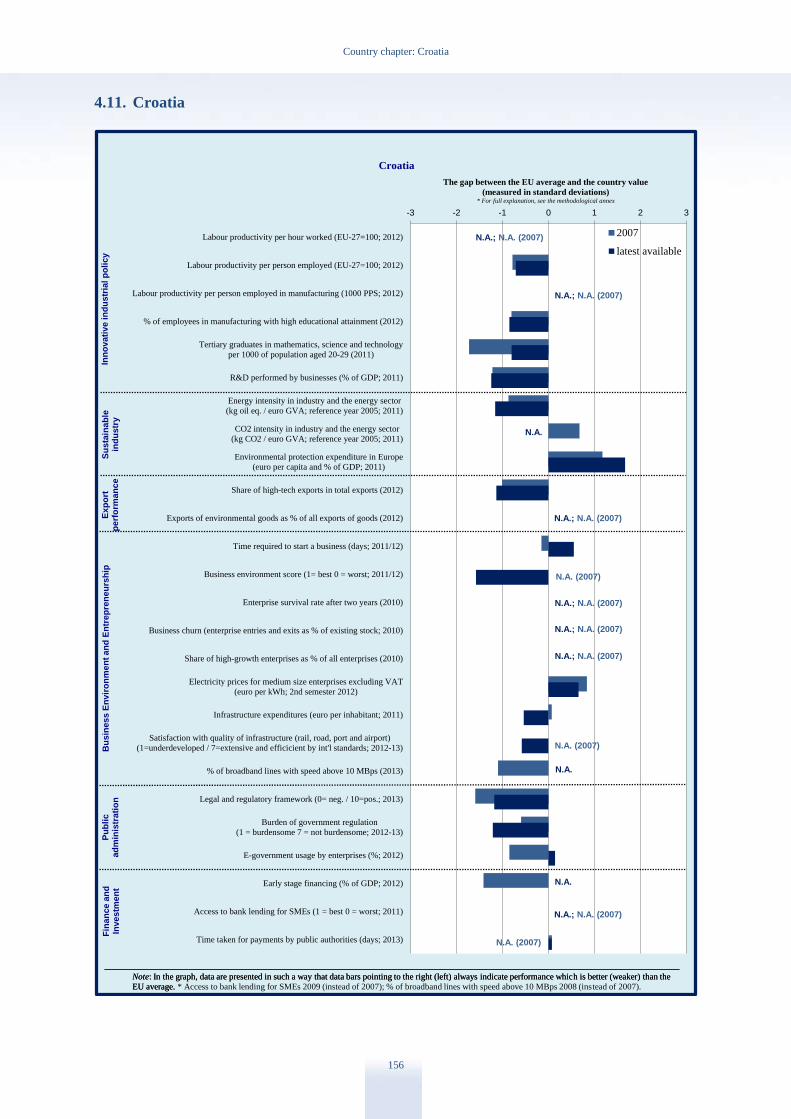
Country chapter: Croatia
156
4.11. Croatia
-3 -2 -1 0 1 2 3
Labour productivity per hour worked (EU-27=100; 2012)
Labour productivity per person employed (EU-27=100; 2012)
Labour productivity per person employed in manufacturing (1000 PPS; 2012)
% of employees in manufacturing with high educational attainment (2012)
Tertiary graduates in mathematics, science and technology
per 1000 of population aged 20-29 (2011)
R&D performed by businesses (% of GDP; 2011)
Energy intensity in industry and the energy sector
(kg oil eq. / euro GVA; reference year 2005; 2011)
CO2 intensity in industry and the energy sector
(kg CO2 / euro GVA; reference year 2005; 2011)
Environmental protection expenditure in Europe
(euro per capita and % of GDP; 2011)
Share of high-tech exports in total exports (2012)
Exports of environmental goods as % of all exports of goods (2012)
Time required to start a business (days; 2011/12)
Business environment score (1= best 0 = worst; 2011/12)
Enterprise survival rate after two years (2010)
Business churn (enterprise entries and exits as % of existing stock; 2010)
Share of high-growth enterprises as % of all enterprises (2010)
Electricity prices for medium size enterprises excluding VAT
(euro per kWh; 2nd semester 2012)
Infrastructure expenditures (euro per inhabitant; 2011)
Satisfaction with quality of infrastructure (rail, road, port and airport)
(1=underdeveloped / 7=extensive and efficicient by int'l standards; 2012-13)
% of broadband lines with speed above 10 MBps (2013)
Legal and regulatory framework (0= neg. / 10=pos.; 2013)
Burden of government regulation
(1 = burdensome 7 = not burdensome; 2012-13)
E-government usage by enterprises (%; 2012)
Early stage financing (% of GDP; 2012)
Access to bank lending for SMEs (1 = best 0 = worst; 2011)
Time taken for payments by public authorities (days; 2013)
The gap between the EU average and the country value
(measured in standard deviations)* For full explanation, see the methodological annex
Croatia
2007
latest available
Note: In the graph, data are presented in such a way that data bars pointing to the right (left) always indicate performance which is better (weaker) than the
EU average.
Inn
ovati
ve in
du
str
ial p
oli
cy
Su
sta
inab
lein
du
str
yB
usin
ess E
nvir
on
men
t an
d E
ntr
ep
ren
eu
rsh
ipF
inan
ce a
nd
Investm
en
t
Note: In the graph, data are presented in such a way that data bars pointing to the right (left) always indicate performance which is better (weaker) than the
EU average. * Access to bank lending for SMEs 2009 (instead of 2007); % of broadband lines with speed above 10 MBps 2008 (instead of 2007).
Ex
po
rtp
erf
orm
an
ce
Pu
bli
cad
min
istr
ati
on
N.A.; N.A. (2007)
N.A.; N.A. (2007)
N.A.; N.A. (2007)
N.A.; N.A. (2007)
N.A.; N.A. (2007)
N.A.; N.A. (2007)
N.A. (2007)
N.A. (2007)
N.A.; N.A. (2007)
N.A. (2007)
N.A.
N.A.
N.A.

Country chapter: Croatia
157
Figure 4.11: Manufacturing sectors – Croatia (2010)
Note: No data available for sectors C12 (tobacco products), C19 (coke and refined petroleum products) and C26 (manufacture of computer,
electronic and optical products)
Source: Eurostat
4.11.1 Introduction
In recent years, economic developments in Croatia
have been dominated by two issues: recession —
GDP growth averaged 4 %409
in 2000-08, but under
-2 % since, and EU accession, which has involved
increasing political support, technical assistance
and commitment to reform. These factors have had
an effect on all aspects of competitiveness. Also,
the country is characterised by a problematic degree
of regional disparity, with significant differences in
performance between Zagreb and peripheral
regions.
As part of the process of EU accession, a number of
long-term strategies have been developed that did
not exist previously. While the final shape of all of
these strategies is not yet clear and their effect will
depend on proper implementation and enforcement,
they present an opportunity to improve
competitiveness. One example is the industrial
strategy covering 12 priority industry sectors: food
and wood processing, automotive, pharmaceuticals,
medical equipment, ICT, textiles, defence, the
creative sector, chemicals, maritime technologies,
and civil engineering. This list immediately raises a
number of issues — not only are there too many
409 http://epp.eurostat.ec.europa.eu/tgm/table.do?tab=table
&init=1&plugin=1&language=en&pcode=tec00115.
sectors for a proper focus to develop, but the sectors
are largely low in value added and knowledge
intensity, indicating a lack of smart specialisation.
Currently, manufacturing accounts for 16.2 %
of GDP. While employment in industry in 2009 (at
25.8 %) was slightly higher than the EU average
(22.9 %), the value added (23.2 %) was below the
EU average (25 %).410
The main industries were
food, beverages and tobacco, chemicals,
pharmaceuticals, petroleum, minerals and rubber,
and metals. These reflect specialisation in low and
medium technology.
In 2012, labour productivity per person employed
was 80.2 % of the EU average.411
The gap has
narrowed narrowed considerably since 2007 —
including a significant setback after 2008.
410 Eurostat (2013) NACE Section C. 411 Eurostat
http://epp.eurostat.ec.europa.eu/tgm/table.do?tab=table&i
nit=1&plugin=1&language=en&pcode=tec00116.
Food, beverages and
tobacco
25.53%
Textiles, apparel and
leather
7.13%
Wood, paper and
printing
7.49%
Chemicals, pharma,
petroleum, minerals
and rubber 18.97%
Metals
10.22%
Electronics, electrics
and machinery
8.99%
Cars and transport
5.53%
Other
11.62%
Country chapter: Croatia
158
4.11.2 Innovation, skills and
sustainability
Innovation
According to the 2013 Innovation Union
Scoreboard, Croatia is a below-average moderate
innovator, one of the ten worst performers when
compared with the EU-27 Member States.
However, a set of measures are being implemented
to strengthen research and innovation capacity.412
Expenditure on R&D is 0.75 % of GDP, business
expenditure on R&D 0.34 % (EU average 1 %) —
the 2020 target is 1.4 %. The country’s relative
strength is in human resources – it has had the
fastest improvement in the proportion of secondary
education attainment – but this has not translated
into improved performance. The research system
and intellectual assets are rated low, and industrial
value added is also low. High-tech manufacturing
accounts for 0.4 % of total employment and
knowledge-intensive services 2.3 %, as compared
with 1.1 % and 2.7 % respectively for the EU.413
There is a high degree of regional disparity, with
Zagreb clearly ahead of the rest of the country.
Since 2004, the Ministry of Economy, Labour and
Entrepreneurship, and since 2011 the Ministry of
Entrepreneurship and Crafts, have been operating a
system of grants for innovation, distributing EUR 7
million to 1 407 projects, 77 % of which has gone to
small and medium-sized enterprises (SMEs). In
recent years, R&D investment has decreased due to
the recession, spurring the government to launch a
number of reforms aimed at increasing innovation.
In the first half of 2013, the government plans to
complete the national innovation strategy, which
aims to strengthen cooperation between industry
and research institutions. The strategy includes a
plan for a network of competence centres in the 12
priority industries, of which three are already
operational. The aim is to promote advanced
technologies and market innovative solutions,
including in nanotechnology in wood processing.
Stakeholders agree that some of the priority
412 Assessment of the 2013 economic programme for Croatia,
SWD(2013) 361. 413 http://epp.eurostat.ec.europa.eu/statistics_explained/
index.php?title=File:Statistics_on_employment_in_high_-_tech_sectors,_EU-
27_and_selected_countries,_2010.PNG&filetimestamp=2
0120207155622.
industries, in particular ICT and chemicals, have
growth potential. The strategy also seeks to
improve the quality of research through an
industrial PhDs fund, providing scholarships for
post-graduate doctoral studies, in coordination with
the private sector.
Skills
Tertiary education attainment is low, at 23.7 %
(well below the EU average of 35.8 %).414
There is
a brain drain issue; while Croatia performs well on
human capital, especially at secondary school level,
its economy suffers from low research quality and
lack of knowledge intensity. There are also
problems of skills mismatch and low participation
in lifelong learning. The recession has led to a
reduction in the already low provision of training.
As unemployment increases the supply of available
labour, employers have fewer incentives to train
their workforce.
In 2012, the government started to implement a
skills needs verification system, monitoring the
structure of the economy (by region and sector),
integrating results from three surveys (covering
employers, entrants to unemployment and
education) and forecasts. The system has identified
skills gaps and surpluses at regional level,
especially deficits in tourism-related service skills
in peripheral regions and technical skills for
industry.
Reforms are being implemented to improve the
links between the education system and the labour
market. The Croatian qualifications framework is
geared to increasing the quality and flexibility of
the education system. It will also link higher
education funding to output indicators.
Sustainability
Croatia scores relatively well on energy intensity
and the use of renewable energy sources. Energy
intensity is better than the EU average and
improving at a similar pace. Between 1995 and
2010, there was general improvement, including in
manufacturing.415
In particular, the renewable
energy sector has potential for further growth. In
414 Eurostat (2013) t2020_41. 415 Odyssee Mure (2012), Energy Efficiency Policies and
Measures in Croatia.
Country chapter: Croatia
159
2010, hydroelectric power accounted for 19.4 % of
primary energy supply and biomass a further 3.9 %,
while other renewables contributed 0.5 %.416
The
target for electricity generation from renewable
sources is 20 % by 2020.417
Investments in the transmission and distribution
network will be necessary to accommodate an
increasing uptake of intermittent electricity in the
system. The liquidified natural gas terminal and its
connecting pipelines are a very important element
of the North-South gas corridor and as such a
security of supply asset for the region.
The Croatian Cleaner Production Centre was
established in 2000 to promote efficient and
environment-friendly solutions for industry,
services and the state administration. Its activities
include training 204 environmental management
system experts and implementing 146 cleaner
production projects.
A number of legislative projects are currently being
planned that may influence the sustainability of
Croatian industry. The Sustainable Waste
Management Act is due to be adopted in 2013.
Electricity grid operators will propose plans for the
development of smart grids in 2013. A climate
change adaptation strategy, aimed at controlling
greenhouse gas emissions, is planned for 2014.
The plan is for the industrial strategy to include
incentives for sustainable production and the
development of a green economy; measures include
the introduction of sustainability criteria in public
procurement and the creation of an environmental
protection logo.
4.11.3 Export performance
In 2011, exports accounted for 42 % of GDP.418
Between 2000 and 2008, Croatian exports more
than doubled in nominal terms and grew 15% from
2011 to 2012.419
The main exports are transport
416 Hrvoje Pozar Energy Institute (2010) Country Energy
Profile — Croatia,
http://www.eihp.hr/hrvatski/projekti/unece/pdf/bibilioteka
/Energy%20profile%20-%202010.pdf. 417 Eurostat
http://epp.eurostat.ec.europa.eu/portal/page/portal/europe_
2020_indicators/headline_indicators 418 World Bank Indicator for 2011. 419 http://epp.eurostat.ec.europa.eu/tgm/table.do?tab=table&
init=1&plugin=1&language=en&pcode=tec00110.
equipment, machinery, textiles, chemicals,
foodstuffs and fuels. As Croatia’s main trading
partner, the EU is the destination for 63 % of its
exports.420
The trade balance has been in deficit, but
has improved slightly since 2008 due to falling
domestic demand.421
The Croatian Chamber of Economy and Chamber
of Trades and Crafts represent Croatian exporters’
interests abroad. The Entrepreneurial Impulse
initiative in 2012 was aimed at raising the
international profile of Croatian businesses through
international fairs and in new markets. 83 projects
received EUR 2.3 million in support. A new export
strategy is also being developed, the previous one
having run its course.
With Croatia’s accession to the EU, trade is likely
increase, even though most barriers have already
been removed. Exports of services are significant
— mainly as regards tourism but also software
development and business process outplacement.
4.11.4 Business environment and public
administration
Business environment
Croatia’s business environment is one of the major
problem areas for competitiveness, but also a major
area of reform. The World Bank’s Doing Business
2013 report ranks Croatia 84th globally, behind all
EU countries except Malta. Although the position
has improved significantly since 2005, making the
country the 14th fastest reformer in the world
(faster than any EU country), its position worsened
as compared with the previous ranking. Two
aspects of the business environment are especially
problematic: access to finance, and inefficient
public administration plagued by corruption. The
former is largely due to the effects of the recession
on growth, export performance and the investment
climate. The latter can be traced back to the
prolonged transition to a market economy,
combined with ageing infrastructure systems,
decentralised public administration with many
decision-making competences at local level, and the
existence of monopolistic state-owned enterprises.
420 Eurostat 2009. 421 Eurostat
http://epp.eurostat.ec.europa.eu/tgm/table.do?tab=table&i
nit=1&language=en&pcode=tec00043.
Country chapter: Croatia
160
The World Bank has emphasised the need for
reform in dealing with construction permits,
registering property, protecting investors, and
trading across borders.
In 2012-13, the government has implemented a
number of reforms aimed at improving the business
environment. The procedures for registering a
company have been simplified. Registration times
and costs have been reduced, in particular by
introducing a two-day online procedure for crafts,
and a five-day procedure for limited liability
companies. The public-private dialogue, a forum
for consultation on aspects of legislation affecting
SMEs, has been set up. Also, an SME observatory
has been established to collect and provide
information.
Furthermore, because of issues raised as part of the
EU accession process, the role of the state in the
economy is being reduced. The privatisation
contract for the Brodosplit shipyard was signed in
February 2013 and it is expected that the
privatisation process for the Brodotrogir shipyard
will be completed in time for Croatia’s accession.422
Further privatisation, albeit slow, is planned.
Adopted in September 2012, the Act on Investment
Promotion and Development of the Investment
Climate established a working group to monitor the
implementation of investment projects and identify
and remove administrative obstacles. Businesses
can also submit direct requests to the working
group to investigate specific barriers.
Significant investment (backed by EU funds) is
planned for developing railway infrastructure, sea
ports and inland waterways, as improvements are
needed, in particular in peripheral regions. The
programme for the development of broadband
access infrastructure is also being developed, which
is necessary as Croatia is below the EU average in
all areas on the Digital Agenda Scoreboard.423
There are plans to adopt in 2013 the Strategy for
Entrepreneurship 2020, aimed at further improving
the business environment and promoting SMEs’ use
of R&D and innovation. Plans to reform the public
procurement system include introducing non-price
422 http://europa.eu/rapid/press-release_IP-13-252_en.htm. 423 Digital Agenda Scoreboard http://digital-agenda-
data.eu/index.php?scenario=4&year=2011&countries[]=H
R.
criteria and reducing the size of tender lots in order
to attract more SMEs.
Public administration
Dealing with the public administration remains a
major burden for businesses, especially because of
corruption. A 2013 report by Ernst and Young
ranks Croatia as the second most corrupt of the EU-
28 countries, with 90 % of respondents saying
corruption is widespread in business.424
Transparency International ranks Croatia 62nd, the
5th most corrupt of the EU-28 countries.425
It seems
that corruption has been reduced in recent years at
central level, but remains a problem at the regional
and local levels.
Although the compliance burden of the tax system
is a relative strong point,426
significant work
remains to be done to ensure uniform and
competent application of the tax code throughout
the country, for which the tax administration needs
more and better training. The VAT rate has been
increased from 23 % to 25 %, while healthcare
contributions lowered from 15 % to 13 %.
Reforms were implemented in 2012-13 to make the
tax system more business-friendly, and the Office
for Large Taxpayers was established to provide
targeted services and improve tax governance.
Amendments to the General Tax Act have
established a standard tax declaration form and
made it possible to submit forms online.
In February 2012, a Freedom of Information Act
was adopted, aiming to make public administration
more transparent and efficient, and creating the post
of Information Commissioner.
A reform of the judiciary has included a mediation
and conciliation process to facilitate insolvency and
contract enforcement procedures. Further changes
to the civil code and bankruptcy legislation have
also promoted alternative dispute resolution. A new
Enforcement Agency has been established. Despite
this, a large backlog of unresolved cases remains,
although case resolution has improved – the
clearance rate for enforcement cases was 93.7 % in
424 Ernst and Young (2013) Europe, Middle East, India and
Africa Fraud Survey 2013. 425 Transparency International (2012) Corruption Perceptions
Index cpi.transparency.org/cpi2012/results/. 426 Croatia ranks 42nd on the PWC Paying Taxes report.

Country chapter: Croatia
161
2010. However, the length of proceedings is very
high compared to the majority of Member States.
Shortcomings in the functioning of the justice
system undermine the confidence of citizens and
businesses in the public institutions and weigh on
Croatia’s business environment.
4.11.5 Finance and investment
Access to finance is a major problem area for
competitiveness. The investment climate has
worsened considerably since 2008 and there has
been a marked fall in the accessibility of
commercial bank loans. Interest rates have
increased, with SMEs facing rates of over 8 %,427
and banks are demanding higher collateral.
Alternative funding sources, such as venture
capital, remain essentially unavailable — in 2008-
11, fewer than 1 % of SMEs used equity finance.428
A report by the Croatian SME Policy Centre
described in detail the available funding options
(banks, microfinance, venture capital funds,
business angels, government incentive programmes
and subsidised credit lines), concluding that the
dominance of traditional banking products is a
systemic problem.429
The report also criticised
government financing programmes for insufficient
coordination and lack of evaluation. Again, access-
to-finance conditions are significantly worse in
peripheral regions.
Two state agencies provide financing for
enterprises: the Croatian Bank for Reconstruction
and Development (HBOR) and HAMAG Invest.
HAMAG provides microloans and loan guarantees,
and issues letters of intent for SMEs with a good
business plan but no credit history. The HBOR
provides loans on favourable terms – 1 352 in 2012,
27 % more than in 2011. Its 2013 budget for SME
loans is EUR 603 million. Currently, only two
Croatian financial institutions channel EU funds
from the Competitiveness and Innovation
Framework Programme to SMEs.
Under a new programme being introduced in 2013
on the basis of a venture capital investment fund
with a budget of EUR 46 million, 25 % to 50 %
stakes will be purchased in projects in the 12
427 Croatian Ministry of Entrepreneurship and Crafts. 428 DG ENTR, EC (2011), SME’s Access to Finance Survey
2011. 429 CEPOR (2011), SME Report for Croatia 2011.
priority industrial sectors. The HBOR is also
exploring the possibility of establishing a venture
capital fund of EUR 134-201 million for export
businesses.
The Act on Investment Promotion and
Development of Investment Climate provides
incentives for job creation and training, especially
in areas of high unemployment, and eases access to
incentive measures for micro-entrepreneurs and
foreign investors. It concentrates on innovative
sectors, manufacturing and high value-added
services, including tourism.
Historically, foreign direct investment has played
an important role. From 1993 to 2012, this
amounted to EUR 26.1 billion, concentrated in the
financial sector and the wholesale and retail
trade.430
However, since 2008, FDI inflows have
decreased by over 75 %.431
In May 2012, the
government responded by establishing an agency
for investments and competitiveness. Active
promotion programmes aimed at improving the
image of Croatia as a safe place for investment
include the targeted investors campaign, which
presents comprehensive business plans to potential
investors. Croatia operates a network of 13 free
economic zones.
4.11.6 Conclusions
Croatia has recently implemented a considerable
number of reforms. In the framework of EU
accession, it has completed all the reforms called
for in its progress reports, including those
concerning the judiciary and privatisation. Many
weaknesses have been acknowledged by the
authorities and are partly reflected in the already
adopted measures, and in reform intentions.
However, large obstacles remain as regards access
to finance, corruption (especially in business), the
efficiency of public administration, and the
innovation infrastructure. The action plans currently
being drafted therefore need to be of high quality
and properly implemented. Full implementation of
reform plans already adopted is a precondition for
better competitiveness.
430 Croatian Ministry of Entrepreneurship and Crafts. 431 World Bank Indicator for 2003-12.

Country chapter: Croatia
162
While Europe’s economy continues to suffer,
Croatia is likely to experience limited access to
finance, depressed demand for exports, lagging
competitiveness and lower foreign direct
investment. In the medium term, the benefits of
joining the single market and the impact of EU
funds could contribute considerably to the growth
of the Croatian economy.
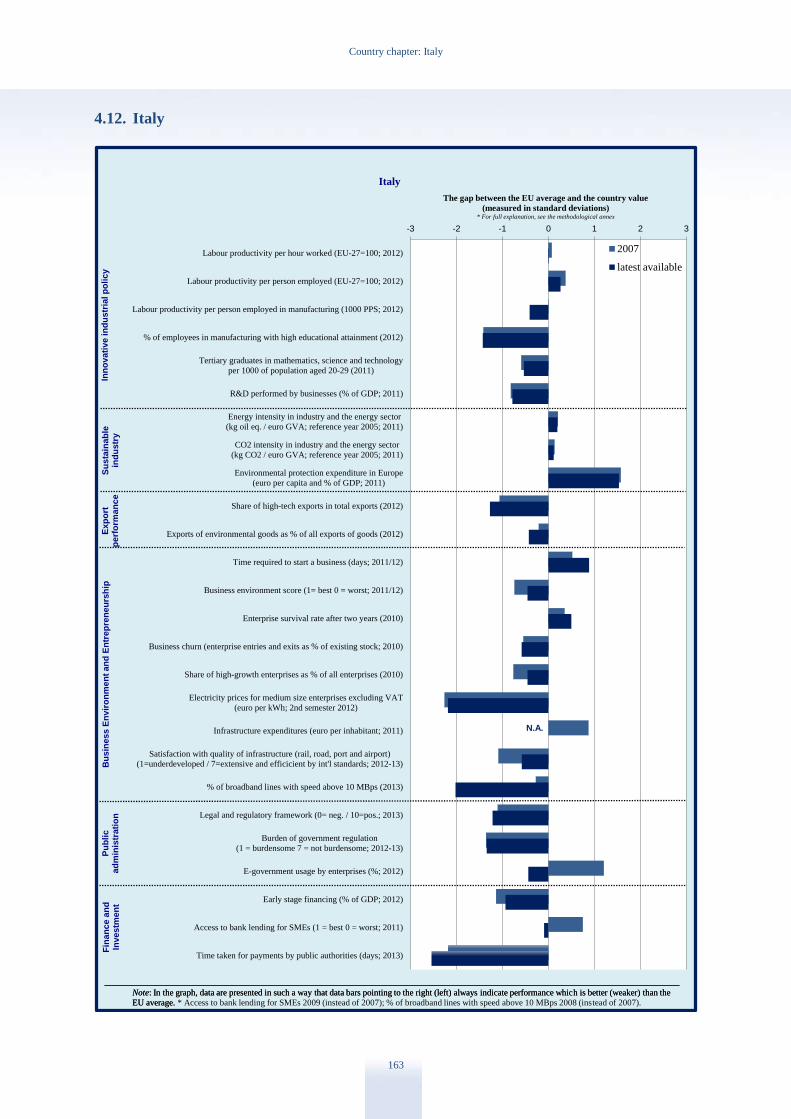
Country chapter: Italy
163
4.12. Italy
-3 -2 -1 0 1 2 3
Labour productivity per hour worked (EU-27=100; 2012)
Labour productivity per person employed (EU-27=100; 2012)
Labour productivity per person employed in manufacturing (1000 PPS; 2012)
% of employees in manufacturing with high educational attainment (2012)
Tertiary graduates in mathematics, science and technology
per 1000 of population aged 20-29 (2011)
R&D performed by businesses (% of GDP; 2011)
Energy intensity in industry and the energy sector
(kg oil eq. / euro GVA; reference year 2005; 2011)
CO2 intensity in industry and the energy sector
(kg CO2 / euro GVA; reference year 2005; 2011)
Environmental protection expenditure in Europe
(euro per capita and % of GDP; 2011)
Share of high-tech exports in total exports (2012)
Exports of environmental goods as % of all exports of goods (2012)
Time required to start a business (days; 2011/12)
Business environment score (1= best 0 = worst; 2011/12)
Enterprise survival rate after two years (2010)
Business churn (enterprise entries and exits as % of existing stock; 2010)
Share of high-growth enterprises as % of all enterprises (2010)
Electricity prices for medium size enterprises excluding VAT
(euro per kWh; 2nd semester 2012)
Infrastructure expenditures (euro per inhabitant; 2011)
Satisfaction with quality of infrastructure (rail, road, port and airport)
(1=underdeveloped / 7=extensive and efficicient by int'l standards; 2012-13)
% of broadband lines with speed above 10 MBps (2013)
Legal and regulatory framework (0= neg. / 10=pos.; 2013)
Burden of government regulation
(1 = burdensome 7 = not burdensome; 2012-13)
E-government usage by enterprises (%; 2012)
Early stage financing (% of GDP; 2012)
Access to bank lending for SMEs (1 = best 0 = worst; 2011)
Time taken for payments by public authorities (days; 2013)
The gap between the EU average and the country value
(measured in standard deviations)* For full explanation, see the methodological annex
Italy
2007
latest available
Note: In the graph, data are presented in such a way that data bars pointing to the right (left) always indicate performance which is better (weaker) than the
EU average.
Inn
ovati
ve in
du
str
ial p
oli
cy
Su
sta
inab
lein
du
str
yB
usin
ess E
nvir
on
men
t an
d E
ntr
ep
ren
eu
rsh
ipF
inan
ce a
nd
Investm
en
t
Note: In the graph, data are presented in such a way that data bars pointing to the right (left) always indicate performance which is better (weaker) than the
EU average. * Access to bank lending for SMEs 2009 (instead of 2007); % of broadband lines with speed above 10 MBps 2008 (instead of 2007).
Ex
po
rtp
erf
orm
an
ce
Pu
bli
cad
min
istr
ati
on
N.A.
3.6
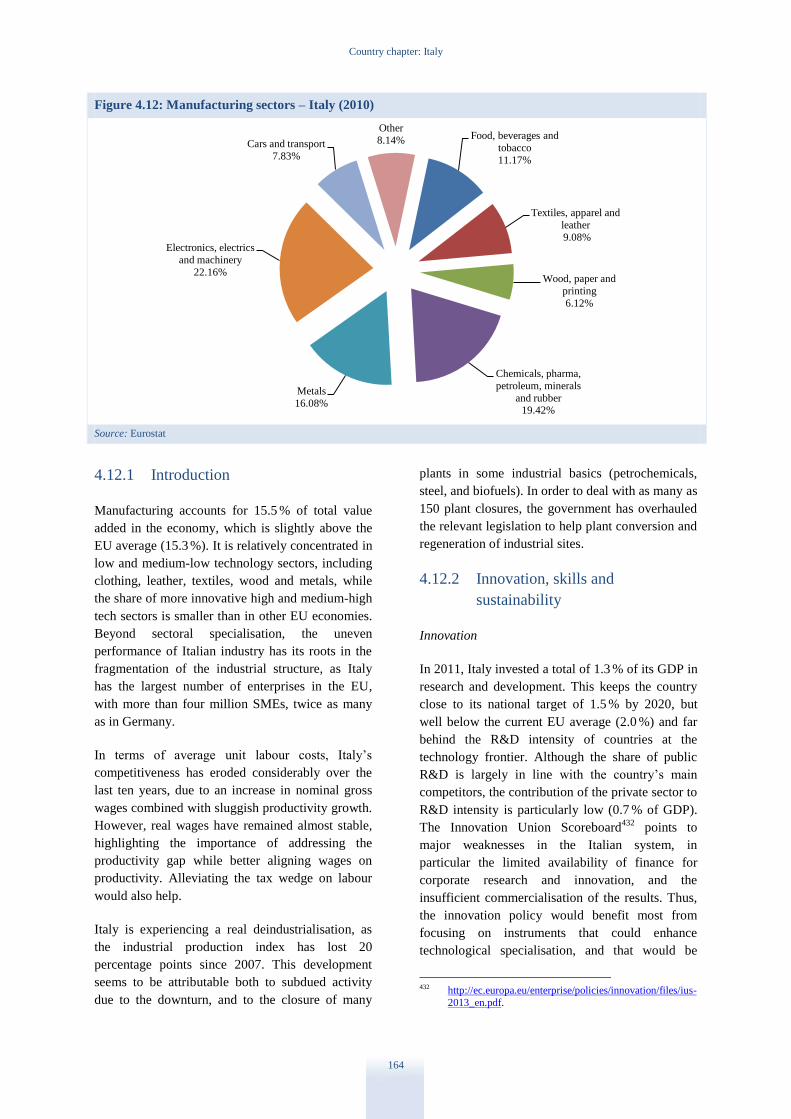
Country chapter: Italy
164
Figure 4.12: Manufacturing sectors – Italy (2010)
Source: Eurostat
4.12.1 Introduction
Manufacturing accounts for 15.5 % of total value
added in the economy, which is slightly above the
EU average (15.3 %). It is relatively concentrated in
low and medium-low technology sectors, including
clothing, leather, textiles, wood and metals, while
the share of more innovative high and medium-high
tech sectors is smaller than in other EU economies.
Beyond sectoral specialisation, the uneven
performance of Italian industry has its roots in the
fragmentation of the industrial structure, as Italy
has the largest number of enterprises in the EU,
with more than four million SMEs, twice as many
as in Germany.
In terms of average unit labour costs, Italy’s
competitiveness has eroded considerably over the
last ten years, due to an increase in nominal gross
wages combined with sluggish productivity growth.
However, real wages have remained almost stable,
highlighting the importance of addressing the
productivity gap while better aligning wages on
productivity. Alleviating the tax wedge on labour
would also help.
Italy is experiencing a real deindustrialisation, as
the industrial production index has lost 20
percentage points since 2007. This development
seems to be attributable both to subdued activity
due to the downturn, and to the closure of many
plants in some industrial basics (petrochemicals,
steel, and biofuels). In order to deal with as many as
150 plant closures, the government has overhauled
the relevant legislation to help plant conversion and
regeneration of industrial sites.
4.12.2 Innovation, skills and
sustainability
Innovation
In 2011, Italy invested a total of 1.3 % of its GDP in
research and development. This keeps the country
close to its national target of 1.5 % by 2020, but
well below the current EU average (2.0 %) and far
behind the R&D intensity of countries at the
technology frontier. Although the share of public
R&D is largely in line with the country’s main
competitors, the contribution of the private sector to
R&D intensity is particularly low (0.7 % of GDP).
The Innovation Union Scoreboard432
points to
major weaknesses in the Italian system, in
particular the limited availability of finance for
corporate research and innovation, and the
insufficient commercialisation of the results. Thus,
the innovation policy would benefit most from
focusing on instruments that could enhance
technological specialisation, and that would be
432 http://ec.europa.eu/enterprise/policies/innovation/files/ius-
2013_en.pdf.
Food, beverages and
tobacco
11.17%
Textiles, apparel and
leather
9.08%
Wood, paper and
printing
6.12%
Chemicals, pharma,
petroleum, minerals
and rubber 19.42%
Metals
16.08%
Electronics, electrics
and machinery
22.16%
Cars and transport
7.83%
Other
8.14%
Country chapter: Italy
165
oriented towards the commercialisation of
innovation.
This is the logic behind the bottom-up approach of
the ‘smart cities and communities’ platform, to
which EUR 890 million have been allocated. The
Ministry of Research has identified it as a driver of
R&D investments in the priority areas for the
improvement of urban services: security, ageing,
welfare technologies, waste management, health,
transport, last mile logistics, smart grids,
sustainable architecture, cultural heritage and cloud
computing technologies for smart government.
Another strand in innovation policy is the
development of national technology clusters,
identified as catalysts for growth and structural
change. Nine priority themes have been identified:
green chemistry, agrifood, ambient intelligence and
ambient assisted living, life sciences, smart
communities technologies, advanced mobility
systems, aerospace, innovative energy systems, and
intelligent manufacturing.
Italy lags behind in the adoption of information and
communication technologies, and the government’s
growth initiative433
has created a new digital agency
with the task of promoting demand-led innovation,
including through innovative and pre-commercial
procurement.
One explanation of the limited investment of the
private sector in R&D is the preponderance of small
firms, as the average size of Italian firms is much
smaller than that of other leading European
economies. Thus, an important objective would
seem to be to encourage firm growth, while at the
same time encouraging cooperation in order to
increase the capacity to bear the risks associated
with R&D activity. The government has addressed
this weakness by simplifying the procedures for
concluding network contracts,434
identified as a tool
to promote research and innovation. The
government has also adopted tax incentives for
hiring researchers, but these have not yet been
implemented. The European structural funds will
also contribute to investment in research and
innovation in 2014-2020.435
433 The decree is called ‘Crescita 2.0’. 434 ‘Contratti di rete’. 435 European Structural and Innovation Funds for 2014-2020.
As the venture capital market remains weak, other
measures are needed to enhance the equity capital
of many firms as the debt/equity ratio is higher than
the EU average, which hampers access to finance
and investment, in particular in intangibles (see the
section on finance and investment below).436
Finally, the government has devised a new legal
framework to support innovative start-ups.437
The
scheme can provide welcome funding for many
firms that have been denied credit due to the risk
aversion of the Italian banking system. It should be
noted that the framework contains an ambitious
scheme on crowdfunding that is one of the first
equity crowdfunding frameworks in the world.
Skills
There are observed shortages of skilled labour in
the manufacturing sector. In recent years a series of
reforms have aimed to strengthen the provision of
technical and vocational training to better respond
to labour demand. Of particular importance are the
certification of skills, and the introduction of post-
secondary technical institutes438
to provide two-year
tertiary qualifications focused on key sectors of the
economy. Although they still involve only a limited
number of students, the 62 institutes have the
potential to further develop the vocational higher
education system. In the same vein, the government
has reformed the apprenticeship system, but at least
for the time being, its use remains marginal.
Discussions are ongoing about possibilities to
improve the attractiveness of the system.
Sustainability
According to estimates,439
almost one in four
enterprises (23.6 %) have invested in green products
and technologies in the last three years. In the
context of overall diminishing fixed investment,
these figures show that there is business confidence
in the potential of the green economy. Further, over
37 % of firms that invested in green technologies
436 Also in the Council recommendation on Italy's 2013
national reform programme and delivering a Council opinion on Italy's stability programme for 2012-17:
“Promote further the development of capital markets to
diversify and enhance firms' access to finance, especially into equity, and in turn foster their innovation capacity
and growth.” 437 The decree is called ‘Sviluppo 2.0’. 438 Istituti Tecnici Superiori. 439 http://www.symbola.net/assets/files/Rapporto_Green
Italy_2012_1358333078.pdf.

Country chapter: Italy
166
were active on international markets (against about
22 % of firms that didn’t). Such firms tend also to
be innovative, as about 38 % of firms that invest in
the green economy introduced product or service
innovations (against slightly more than 18 % of
firms that didn’t). Even when taking into account
employment changes in the difficult period in
question, these firms proved more resilient than
others, as their workforce decreased by 0.7 %
against 1.4 %.
As far as policy measures are concerned, the
government has adopted tax incentives for hiring
young workers in the green economy. The network
contracts referred to above are also helping firms to
go green, as out of 458 contracts, 87 are related to
sustainability.
4.12.3 Export performance
Italy’s share of world trade trended down between
2002 and 2011 (from 3.9 % to 2.9 %). However,
exports increased by 5 % in 2012, helping the trade
balance to reach its best level since 1999 – although
improvements in trade balance are also driven by a
decline in imports owing to weak domestic demand.
Italy's exports are now back to pre-crisis levels in
value terms, but they remain below in volume
terms. The export performance is hampered by two
constraints. Geographically, exports go to countries
whose economic growth has tended to be below
average. Italy is also specialised in low-tech
sectors, where the competition from countries with
a lower cost base is stronger. Clearly, it would be
beneficial to move along the international value
chains to activities with higher technological and
knowledge intensity.
In 2012, the government made a considerable
effort, welcomed by the business community, to
improve the governance of its internationalisation
policy. Primarily it reactivated and rationalised the
operations of the Istituto Commercio Estero, a
government agency for the promotion and
internationalisation of firms. In addition to
providing business intelligence, consulting services
and investment promotion to Italian firms, one of
its main tasks is to implement the National plan for
exports 2013-15.440
The aim is to increase the value
440 This plan was established by the ‘Cabina di regia per
l’Italia internazionale’, a policy body composed of four
ministers, the Conferenza delle Regioni and social
of exports in three years to EUR 620 billion (35-
38 % of GDP), from EUR 473 billion in 2012, by
improving the coordination of internationalisation
policies.
The government has also sought to attract more
foreign direct investment. To this end it has
established Desk Italia, which is a one-stop access
point for foreign investors on all administrative
matters relating to investment projects. In addition,
the recourse to the judicial system has been
streamlined, as cases involving foreign investors
will be dealt with by only three courts (Milan,
Rome and Naples), to allow for higher certainty in
the decisions.
4.12.4 Business Environment and public
administration
Business environment
Overall, Italy ranks 73rd
in the World Bank Doing
Business, drawn down in particular by construction
permits, getting electricity, getting credit, and
enforcing contracts. There seem to be too many
obstacles to firm growth, as few firms become
international players. Although there are policy
initiatives to improve its business environment and
facilitate the life of SMEs, their implementation is
lagging and the administrative burden on businesses
remains high. Entrepreneurship issues continue to
be problematic, as the relative ranking of Italy
worsened in the ease of starting a business,441
and
schools are not able to create an entrepreneurial
mindset.442
Competitiveness may improve if the
domestic electricity grid is upgraded to remove
existing bottlenecks and new gas storage and
import facilities are improved.
Italy has introduced market-opening reforms in
many of its product and service market regulations.
However, challenges remain in local public
services, transport and the energy sector, and there
are signs that the reform process is slowing down.
High electricity and gas prices reflect limited
competition and infrastructure bottlenecks. In many
cases the necessary decrees to implement the
general liberalisation measures have not been
partners (Unioncamere, Confindustria, ABI and Rete Imprese).
441 World Bank Doing Business 2013. 442 SBA factsheet Italy 2012.
Country chapter: Italy
167
adopted yet. In some cases the liberalisation
initiatives have been diluted, and the recent reform
of the legal profession seems to backtrack on the
previous reform of professions. The implementation
of the proposal aimed at eliminating all regulations
across the board — except where strictly necessary
— is not progressing.
Public administration
Despite the efforts made in recent years, the
performance of public administration as measured
by the World Bank’s Government Effectiveness
Indicator is well below the EU average. The main
shortcomings include the long proceedings in civil
justice, and a burdensome administrative and
regulatory framework. The often unclear division of
responsibilities between the state and the regions
that ensued from the 2001 constitutional reform
reduces the effectiveness of simplification measures
introduced at the central level.
The regions' exclusive right to regulate economic
activities, combined with inadequate inter-regional
coordination, has increased differences between
regions' administrative requirements. In the same
way, the inefficient power-sharing between the
state and regions, for example regarding energy, is
hampering the development of essential
infrastructure. Overall, the administrative
complexities place a heavy burden on enterprises.
The annual costs of complying with administrative
procedures have been estimated at EUR 26.5
billion.
The government has stepped up efforts to reform
the judiciary in order to streamline judicial
procedures.443
A geographical reorganisation of
courts should be completed by September 2013. For
civil cases the right to appeal has been limited to
controversial cases. Commercial courts have been
introduced for cases concerning intellectual
property, limited companies and public
procurement. However, they will not have
jurisdiction in commercial disputes. The
government has adopted a decree-law on the
compulsory use of mediation in some private law
subjects. Further, a range of measures regarding
civil justice have been adopted. Additional staff
443 For indicators on Justice see EU Justice Scoreboard 2013
available at http://ec.europa.eu/justice/effective-
justice/files/justice_scoreboard_communication_en.pdf.
will help to reduce the case backlog in the Courts of
Appeal, and in the courts of first instance; case-
handling in the Court of Cassation is being
strengthened; and compulsory mediation is being
reintroduced with slight adjustments.444
4.12.5 Finance and investment
Bank lending to non-financial firms has continued
to contract and was in June 2013 down 4.8 % year-
on-year.445
This reflects weak demand, higher firm
risk and tightening credit standards. The average
cost of credit, albeit decreasing, remains 90 basis
points higher than the euro-area average. However,
survey results446
point to some easing of the overall
financing conditions for SMEs.
The government has sought to mitigate credit risk
by strengthening the guarantee fund for SMEs.
With its new operational provisions, in many cases
the guarantee can cover 80 % of funding and the
amounts guaranteed can be up to EUR 2.5 million.
Other initiatives have been taken to strengthen the
balance sheets of firms. The government has
introduced rules to make it easier for SMEs to raise
debt, in particular through issuing short-term
commercial paper and long-term bonds and similar
instruments. The introduction of an allowance for
corporate equity allows companies to deduct part of
the notional cost of newly injected equity from
taxable income.
The introduction of the fund for sustainable growth
has been a step away from subsidies. It replaces 43
different support schemes, with an allocation of
about EUR 600 million in 2012 and EUR 200
million in subsequent years. The fund is organised
along three priorities: research and innovation;
strengthening the industrial structure; and
internationalisation.
In April 2013, the government acted on one of the
major problems for businesses, the payment of an
estimated EUR 90 billion in commercial debt
arrears owed by the public authorities to businesses.
444 The compulsory mediation had been repealed by the
Constitutional Court last October; it has been adjusted regarding the areas concerned, the maximum duration of
mediation and the fees due in case of failure to reach an
agreement. Decree-law 69 of 21 June 2013, “Decreto del Fare”.
445 Bank of Italy, Money and banking statistics. 446 European Central Bank Monthly Bulletin, August 2013.
Country chapter: Italy
168
An immediately effective provision clears the
payment of EUR 40 billion of arrears over the next
two years. If correctly implemented, the measure
will have a positive impact on the survival rate of
businesses, as according to estimates a third of
bankruptcies are due to late payments. Effective
implementation of the late payment directive,
entered into force in January 2013, could also make
firms’ management and planning easier and their
operations more efficient.
4.12.6 Conclusions
Many of the problems that drag down
competitiveness in Italy like low private investment
in R&D, lack of innovative start-ups, problems in
the supply of skills, lack of equity financing,
meagre growth of firms, and internationalisation
can be at least partially traced back to the
administrative and regulatory constraints of the
business environment. In particular, paying taxes
and enforcing contracts are particularly difficult.
Continuing coherent structural reforms of the public
sector are needed for a modern and efficient
administration to evolve.
The government has continued to pursue reforms
improving the business environment and making it
more conducive to growth. The reform of the
judiciary system in 2013 has introduced some novel
provisions (e.g. reduction of judiciary offices,
appointment of new auxiliary staff helping judges),
the outcome of which in terms of efficiency of
justice still needs to be proven. The anti-corruption
legislation that was finalised in 2012 is also a
promising step.
Encouraging entrepreneurship has been addressed
by allowing the possibility of setting up a business
with a capital of one euro and by increasing support
for innovative start-ups. The system of subsidies to
enterprises has been reformed, even if more radical
proposals were dropped, including a plan to restrict
the use of subsidies to clear cases of market failure,
and to use the savings to reduce the tax wedge on
labour.447
The tax allowance for new corporate
equity has potential to enhance growth when the
recovery starts. However, these effects are likely to
be visible only in the longer run, as operating
profits will still be low early on in the upturn.
447 The Giavazzi Report.
An important message for policy focus can be
found in the performance of firms that have adopted
a strategy of innovation and internationalisation.
These firms have fared far better in the crisis and it
appears that the choice to compete internationally is
a key factor leading to innovation. While research
shows that this choice ultimately rests on the
productivity of the firm, the reform of the
governance of the internationalisation system can
help reduce the productivity threshold at which a
firm may enter the international markets and
therefore increase the number of exporting firms.
From this point of view, the reform of the
governance of the internationalisation system can
prove a pivotal step for Italian competitiveness.

Country chapter: Cyprus
169
4.13. Cyprus
-3 -2 -1 0 1 2 3
Labour productivity per hour worked (EU-27=100; 2012)
Labour productivity per person employed (EU-27=100; 2012)
Labour productivity per person employed in manufacturing (1000 PPS; 2012)
% of employees in manufacturing with high educational attainment (2012)
Tertiary graduates in mathematics, science and technology
per 1000 of population aged 20-29 (2011)
R&D performed by businesses (% of GDP; 2011)
Energy intensity in industry and the energy sector
(kg oil eq. / euro GVA; reference year 2005; 2011)
CO2 intensity in industry and the energy sector
(kg CO2 / euro GVA; reference year 2005; 2011)
Environmental protection expenditure in Europe
(euro per capita and % of GDP; 2010)
Share of high-tech exports in total exports (2012)
Exports of environmental goods as % of all exports of goods (2012)
Time required to start a business (days; 2011/12)
Business environment score (1= best 0 = worst; 2011/12)
Enterprise survival rate after two years (2010)
Business churn (enterprise entries and exits as % of existing stock; 2010)
Share of high-growth enterprises as % of all enterprises (2010)
Electricity prices for medium size enterprises excluding VAT
(euro per kWh; 2nd semester 2012)
Infrastructure expenditures (euro per inhabitant; 2011)
Satisfaction with quality of infrastructure (rail, road, port and airport)
(1=underdeveloped / 7=extensive and efficicient by int'l standards; 2012-13)
% of broadband lines with speed above 10 MBps (2013)
Legal and regulatory framework (0= neg. / 10=pos.; 2013)
Burden of government regulation
(1 = burdensome 7 = not burdensome; 2012-13)
E-government usage by enterprises (%; 2012)
Early stage financing (% of GDP; 2012)
Access to bank lending for SMEs (1 = best 0 = worst; 2011)
Time taken for payments by public authorities (days; 2013)
The gap between the EU average and the country value
(measured in standard deviations)* For full explanation, see the methodological annex
Cyprus
2007
latest available
Note: In the graph, data are presented in such a way that data bars pointing to the right (left) always indicate performance which is better (weaker) than the
EU average.
Inn
ovati
ve in
du
str
ial p
oli
cy
Su
sta
inab
lein
du
str
yB
usin
ess E
nvir
on
men
t an
d E
ntr
ep
ren
eu
rsh
ipF
inan
ce a
nd
Investm
en
t
Note: In the graph, data are presented in such a way that data bars pointing to the right (left) always indicate performance which is better (weaker) than the
EU average. * Access to bank lending for SMEs 2009 (instead of 2007); % of broadband lines with speed above 10 MBps 2008 (instead of 2007).
Ex
po
rtp
erf
orm
an
ce
Pu
bli
cad
min
istr
ati
on N.A.; N.A. (2007)
4.8
N.A.
N.A. (2007)
N.A.; N.A. (2007)
-3.1
N.A. (2007)
N.A. (2007)

Country chapter: Cyprus
170
Figure 4.13: Manufacturing sectors – Cyprus (2010)
Note: No data available for sectors C12 (tobacco products), C19 (coke and refined petroleum products), C26 (manufacture of computer,
electronic and optical products) and C27 (manufacture of electrical equipment)
Source: Eurostat
4.13.1 Introduction
Any assessment of microeconomic reforms aimed
at enhancing the competitiveness of Cyprus has to
take into account the dire macroeconomic
environment. Economic activity in industry
weakened significantly in 2012, with a real GDP
decrease of 2.4 %. The introduction of the economic
adjustment programme in April 2013, which
involves the downsizing and restructuring of the
banking sector, will have an effect on day-to-day
business transactions and could threaten the
viability of many firms and further reduce
confidence. In 2013, real GDP is expected to
decline by 8.7 %. The structural measures and
reforms of the economic adjustment programme
will support competitiveness and underpin
sustainable and balanced growth in the long term,
but will have a negative effect in the short term.
Cyprus is a small service-oriented open economy,
with tourism, financial services and real estate the
most important sectors. The role of manufacturing
is less important than on average in the EU (6.1 %
of value added against 15.4 % in the EU as a
whole), employing slightly over 10 % of the total
workforce, the lowest rate in the EU (EU average
17.5 %).
The cost competitiveness of the economy has
deteriorated significantly since EU accession in
2004. While labour productivity has since grown by
seven percentage points, nominal unit wage costs
have gone up by 20 percentage points, leading to
the gradual decline of the manufacturing sector.
4.13.2 Innovation, skills and
sustainability
Innovation
The Innovation Union Scoreboard places Cyprus
among the ‘innovation followers’, with an
innovation performance close to the EU average.
Cyprus has a very low level of R&D expenditure as
a percentage of GDP (0.49 %), which is in line with
its national commitments under the Europe 2020
Strategy, but far short of the EU average (2.0 %).
Moreover, the innovation system relies mainly on
public expenditure, as business contributions to
R&D investment are among the lowest in the EU
(0.1 % of GDP against an EU average of 1.25 %).
However, a closer look reveals a degree of vitality
in Cypriot SMEs when it comes to innovation
activities. Their level of participation in European
research programmes is the second highest in the
EU, and the INSEAD Global Innovation Index
ranks Cyprus 27th. Still, less than 15 % of the
Food, beverages and
tobacco
36.11%
Textiles, apparel and
leather
2.06%
Wood, paper and
printing
11.83%
Chemicals, pharma,
petroleum, minerals
and rubber 25.16%
Metals
12.67%
Electronics, electrics
and machinery
2.24%
Cars and transport
0.60%
Other
6.63%
Country chapter: Cyprus
171
Research Promotion Foundation’s budget went to
enterprises in 2008-12. According to the Cyprus
Association of Research and Innovation
Enterprises, this is because firms are discouraged
from declaring R&D expenditure by the absence of
fiscal incentives, despite several attempts to
introduce such measures in recent years.
On the policy side, the crisis and the fiscal austerity
measures had led to a considerable reduction in
budget allocations to R&D even before agreement
was reached on the adjustment programme. A
National Strategy for Research has been announced
but not yet adopted and it is now expected that
nothing will happen until the completion of the
smart specialisation strategy for the next Structural
Funds programming period. In this context, the
Ministry of Commerce, Industry and Tourism
(MCIT) is coordinating the bottom-up approach of
smart specialisation and has called on enterprises to
express their views during public consultation
meetings. A web page has been developed where
stakeholders can make proposals.
The MCIT has also been charged with managing
project grants to enhance business innovation. A
scheme with a total budget of EUR 4 million has
been set up to support SMEs investing in research
and innovation in developing competitive products
and services that they plan to bring to market. In the
evaluation process, extra points are given to
proposals that fall within one of the six priority
action lines of the EU’s industrial policy
communication. So far, proposals have been
submitted in the field of sustainable construction.
The creation of five mediation agencies in various
universities signals an effort to strengthen
cooperation between academia and business, which
is one of the major weaknesses of the R&D system.
However, the MCIT is aware of the need for a
cultural shift in universities, in particular by giving
professors the right incentives to build links with
local industry.
Skills
Wage indexation has affected competitiveness, but
the government has taken steps to reform the
indexation mechanism by reducing the frequency
with which it is adjusted (once instead of twice a
year), introducing a mechanism for automatic
suspension in response to adverse economic
conditions, and moving from full to partial
indexation (50 % of past inflation). However, the
application of indexation is now suspended in the
public sector, while it is expected that the new
system will be extended to the private sector under
a tripartite agreement. Cyprus also has one of the
highest minimum wages in the EU and this has
risen in recent years to EUR 870 a month (EUR 924
after six months of employment).
Links between the labour market needs and the
educational system are still weak. There is little
upper secondary vocational education and training
and Cyprus has one of the lowest shares of young
graduates in mathematics, science and
technology.448
There is no intermediate level of
certification, especially for engineers and IT
specialists due to low participation in vocational
training (the lowest in the EU), and there is a great
need for skills in the energy sector. Adult
participation in lifelong learning remains below the
EU average, although there is a need to increase
occupational mobility and to prepare people for the
coming structural change.
The government has sought to address this by
creating new post-secondary vocational education
and training institutes in 2012, with a view to
combating youth unemployment and skills
mismatches. A new modern apprenticeship system
directed to 14-25 year olds will be fully operational
in the 2014/15 academic year. Additionally, an
initiative seeks to facilitate the employment of
tertiary education graduates, another has
accelerated initial training of newcomers, and there
is a scheme for the enhancement of youth
entrepreneurship.
Sustainability
High electricity prices (the 2012 prices for industry
were the highest in the EU) are pushing Cyprus to
build a more diversified, secure and sustainable
energy system. In particular, Cyprus should ensure
the full implementation of the Third Energy
Package, particularly during and after the
transformation of the energy sector related to the
foreseen introduction of natural gas, though it is
unlikely that this will improve the situation in the
short term as the import of gas is expected to start
448 The 2011 share of MST graduates among 20-29 years old
in CY is 5.1 % versus an EU average of 14.4 %.
Country chapter: Cyprus
172
in 2015 the earliest. The domestic offshore gas
fields will not be exploited before 2018, when a
pipeline to shore is scheduled to be completed.
Also promising are the developments in
photovoltaic energy generation, where a bidding
process was completed in January that resulted in
the selection of 23 firms to construct photovoltaic
parks for electricity production with a total capacity
of 50 megawatts. Once completed, the projects are
expected to generate around 80 GWh of energy
annually. The offers received led to an average
tender price of EUR 0.0866/kWh. Thus, the
incumbent state-owned electricity company EAC,
which is required to purchase all power from
renewable energy sources, might be able to buy the
generated power at lower prices and generate
savings in the process.
Transport represents more than half of the total
CO2 emissions from non-ETS activities in Cyprus,
and it is around 75% more energy intensive than
EU average. Reversing the trend in CO2 emissions
from transport is essential for Cyprus to meet its
2020 targets. The state of transport infrastructure is
relatively good. However, the main challenge
relates to the excessive reliance on car while public
transport, which could contribute to reducing
emissions and congestion, is underdeveloped.
4.13.3 Export performance
About 57 % of Cyprus’ domestic exports go to other
EU Member States. The island’s main export
partners are Greece, Germany, the United Kingdom
and also Israel. The main export commodities are
pharmaceuticals and photosensitive semiconductor
devices. However, despite a relatively strong
performance in high-tech and environmental
exports, overall the revealed comparative advantage
of Cyprus is concentrated in low and medium-to-
low technology sectors: food, beverages and
tobacco.
Cyprus’ trade balance is traditionally in deficit,
because it has to import extensively to satisfy
domestic demand and depends on oil imports for
energy. However, the trade deficit shrank to
EUR 4.9 billion in 2011, down from EUR 5.4
billion in 2010, with exports up by 24 % and
imports down by 4.3 %.
On the policy side, the MCIT coordinates efforts to
help firms raise their international profile, in
particular by participating in international trade
fairs, providing financial assistance to SMEs
wishing to participate in such events or to carry out
market surveys and offering business advice
through trade centres in 11 other countries.
4.13.4 Business environment and public
administration
According to the World Bank’s government
effectiveness measure (2012-13), a comprehensive
assessment of the overall quality of a public
administration, inefficient government bureaucracy
is the second biggest problem for those wishing to
do business in Cyprus. Along with the wastefulness
of government spending and perceived favouritism,
particularly complicated areas are services for
improved business performance and corporate
governance.
Cyprus has failed to address some of the main
problems in the business environment. The
performance of the judicial system could be
considerably improved – the time needed to resolve
civil and commercial cases is particularly long as
compared with that in other Member States. The
trial and judgment period makes up 73 % of the
total time it takes to enforce a contract. Some of the
shortcomings449
are going to be tackled under the
economic adjustment programme,450
which also
contains measures to improve the real estate
market, notably the slow pace of proceedings
before national courts.
Further, dealing with construction permits is also
time-consuming, as it takes six months on average
to obtain a planning permit in towns and another six
months to obtain a building permit. Once the
building has been completed, it takes another 75
days on average for the final inspection to take
place and the conformity certificate to be issued.
However, Cyprus has taken steps to reduce by 20 %
the administrative burden caused by national
legislation. A number of proposals have been
449 See EU Justice Scoreboard 2013 at
http://ec.europa.eu/justice/effective-justice/files/justice_scoreboard_communication_en.pdf
450 Memorandum of Understanding on Specific Economic
Policy Conditionality.
Country chapter: Cyprus
173
submitted in each national priority area, based on a
consultant’s recommendations and wide
consultation of relevant government departments
and the private sector.451
In particular, these
concern the promotion of electronic government,
simplifying tax return forms,452
and the reduction of
administrative burden on businesses by measuring
the time and cost for taxpayers to complete revenue
administration procedures, and achieving voluntary
compliance to the widest possible extent.
The majority of these proposals (19 out of 23) have
already been implemented and it is expected that
the remainder will be implemented soon. Those
already implemented reduce the administrative
burden by around 18 %, but their full efficacy
remains to be seen. For example, the Nicosia
Chamber of Commerce and Industry has
complained that some measures, e.g. on e-
government, have led only to putting existing
services online, while procedures remain the same
and there is still a need for integration and
coordination between the different services.
Although this initiative was announced in the
broader context of a better regulation project,
improvements to the impact assessment of
legislation have yet to be introduced due to
budgetary restrictions and a lack of human
resources.
4.13.5 Finance and investment
The problems in the banking sector and new
restrictions on both domestic and external banking
transactions have limited liquidity in the financial
markets and led to problems of access to working
capital, which may threaten firms’ viability. Over
95 % of Cypriot businesses have fewer than 10
employees and small firms are less likely to have
large reserves of cash and are therefore more
vulnerable to any liquidity crisis that may be caused
by the capital controls. Thus, there is a high degree
of uncertainty about the ultimate effects of banking
sector downsizing and capital controls on the real
451 Civil Registry and Migration Department, Department of
Agriculture, Inland Revenue Department, Department of
the Registrar of Companies and Official Receiver, Department of Social Insurance Services, Department of
Environment, VAT Service, Cyprus Tourism
Organisation. 452 By enhancing the use of e-filling of tax returns and e-
payment, and by facilitating information exchange
between tax administration entities.
economy, directly and indirectly through business
and consumer confidence.
In December 2012, the lending spreads for loans to
non-financial corporations were already more than
6.5 pps above the financial institutions’ interest
rates. Shortage of capital, banks’ difficulties in
attracting deposits, concerns about the economy
and potential loan repayment problems have since
further increased loan spreads and margins, without
commensurate changes in the respective terms and
conditions, i.e. non-interest rate charges and
maturity of loans.
Negotiations are ongoing between the Ministry of
Finance and the European Investment Fund (EIF)
on a National Guarantee Scheme for SMEs, with a
total budget of EUR 100 million (50 % from the
EIF and 50 % from the Finance Ministry). The
Scheme will involve the creation of a holding fund,
to be managed by the EIF, and provide guarantees
to commercial banks and subsidised loans to
improve SMEs’ access to finance.
4.13.6 Conclusions
The crisis has revealed the risks of an economic
model heavily dependent on financial services.
There is now an opportunity to restructure and
modernise the economy along more sustainable
lines. Advantage could be taken of the negotiations
for the new Structural Funds programming period
to provide partial funding to develop a more
balanced economic model and fund projects in
sectors that suit Cyprus’ infrastructure and human
capital.
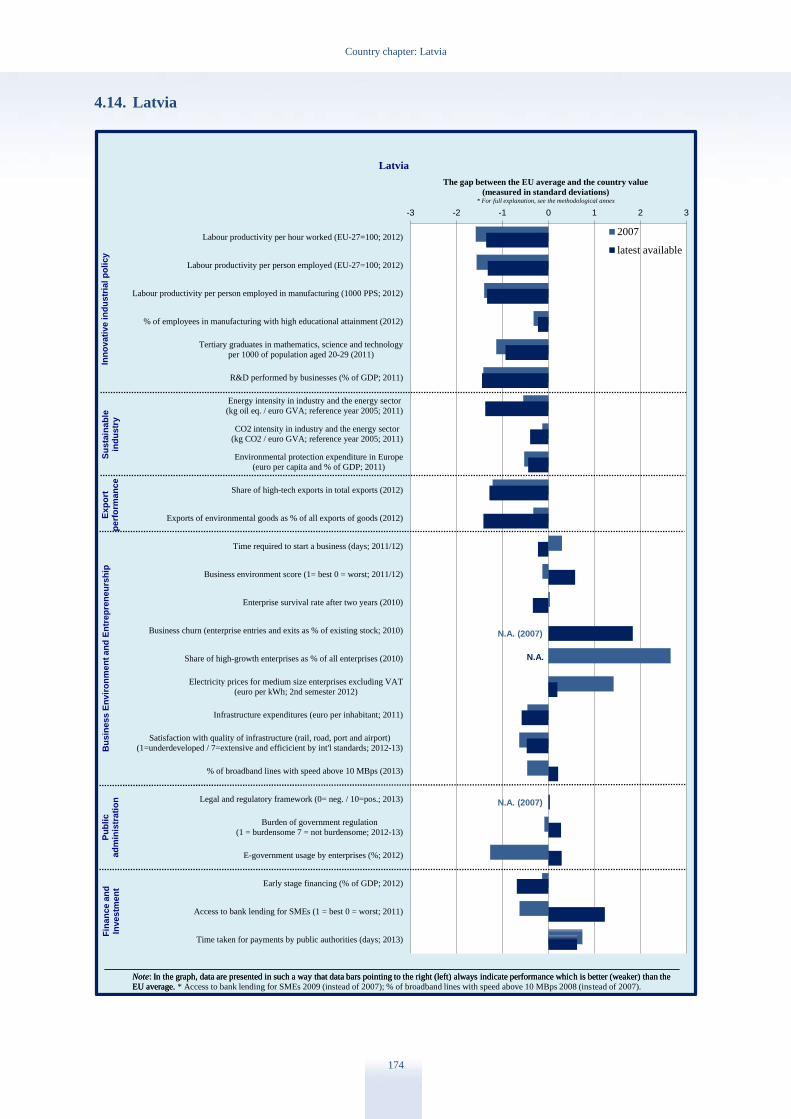
Country chapter: Latvia
174
4.14. Latvia
-3 -2 -1 0 1 2 3
Labour productivity per hour worked (EU-27=100; 2012)
Labour productivity per person employed (EU-27=100; 2012)
Labour productivity per person employed in manufacturing (1000 PPS; 2012)
% of employees in manufacturing with high educational attainment (2012)
Tertiary graduates in mathematics, science and technology
per 1000 of population aged 20-29 (2011)
R&D performed by businesses (% of GDP; 2011)
Energy intensity in industry and the energy sector
(kg oil eq. / euro GVA; reference year 2005; 2011)
CO2 intensity in industry and the energy sector
(kg CO2 / euro GVA; reference year 2005; 2011)
Environmental protection expenditure in Europe
(euro per capita and % of GDP; 2011)
Share of high-tech exports in total exports (2012)
Exports of environmental goods as % of all exports of goods (2012)
Time required to start a business (days; 2011/12)
Business environment score (1= best 0 = worst; 2011/12)
Enterprise survival rate after two years (2010)
Business churn (enterprise entries and exits as % of existing stock; 2010)
Share of high-growth enterprises as % of all enterprises (2010)
Electricity prices for medium size enterprises excluding VAT
(euro per kWh; 2nd semester 2012)
Infrastructure expenditures (euro per inhabitant; 2011)
Satisfaction with quality of infrastructure (rail, road, port and airport)
(1=underdeveloped / 7=extensive and efficicient by int'l standards; 2012-13)
% of broadband lines with speed above 10 MBps (2013)
Legal and regulatory framework (0= neg. / 10=pos.; 2013)
Burden of government regulation
(1 = burdensome 7 = not burdensome; 2012-13)
E-government usage by enterprises (%; 2012)
Early stage financing (% of GDP; 2012)
Access to bank lending for SMEs (1 = best 0 = worst; 2011)
Time taken for payments by public authorities (days; 2013)
The gap between the EU average and the country value
(measured in standard deviations)* For full explanation, see the methodological annex
Latvia
2007
latest available
Note: In the graph, data are presented in such a way that data bars pointing to the right (left) always indicate performance which is better (weaker) than the
EU average.
Inn
ovati
ve in
du
str
ial p
oli
cy
Su
sta
inab
lein
du
str
yB
usin
ess E
nvir
on
men
t an
d E
ntr
ep
ren
eu
rsh
ipF
inan
ce a
nd
Investm
en
t
Note: In the graph, data are presented in such a way that data bars pointing to the right (left) always indicate performance which is better (weaker) than the
EU average. * Access to bank lending for SMEs 2009 (instead of 2007); % of broadband lines with speed above 10 MBps 2008 (instead of 2007).
Ex
po
rtp
erf
orm
an
ce
Pu
bli
cad
min
istr
ati
on
N.A.
N.A. (2007)
-3.1
N.A. (2007)
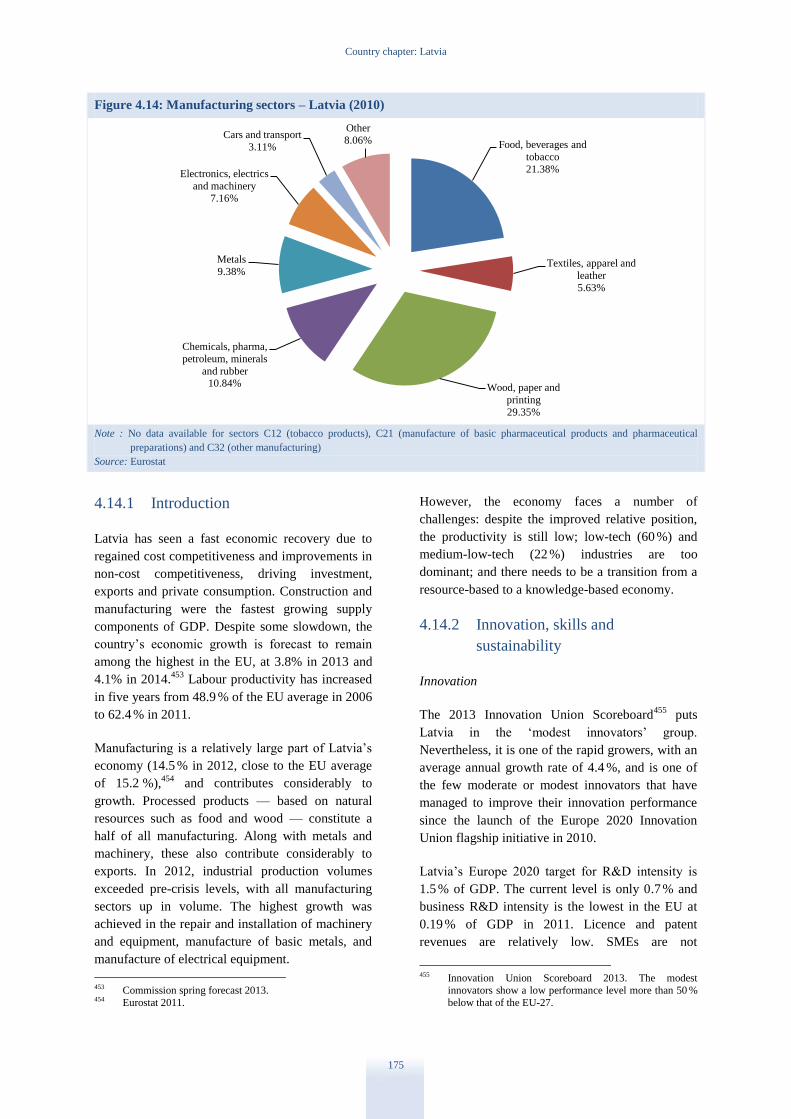
Country chapter: Latvia
175
Figure 4.14: Manufacturing sectors – Latvia (2010)
Note : No data available for sectors C12 (tobacco products), C21 (manufacture of basic pharmaceutical products and pharmaceutical
preparations) and C32 (other manufacturing)
Source: Eurostat
4.14.1 Introduction
Latvia has seen a fast economic recovery due to
regained cost competitiveness and improvements in
non-cost competitiveness, driving investment,
exports and private consumption. Construction and
manufacturing were the fastest growing supply
components of GDP. Despite some slowdown, the
country’s economic growth is forecast to remain
among the highest in the EU, at 3.8% in 2013 and
4.1% in 2014.453
Labour productivity has increased
in five years from 48.9 % of the EU average in 2006
to 62.4 % in 2011.
Manufacturing is a relatively large part of Latvia’s
economy (14.5 % in 2012, close to the EU average
of 15.2 %),454
and contributes considerably to
growth. Processed products — based on natural
resources such as food and wood — constitute a
half of all manufacturing. Along with metals and
machinery, these also contribute considerably to
exports. In 2012, industrial production volumes
exceeded pre-crisis levels, with all manufacturing
sectors up in volume. The highest growth was
achieved in the repair and installation of machinery
and equipment, manufacture of basic metals, and
manufacture of electrical equipment.
453 Commission spring forecast 2013. 454 Eurostat 2011.
However, the economy faces a number of
challenges: despite the improved relative position,
the productivity is still low; low-tech (60 %) and
medium-low-tech (22 %) industries are too
dominant; and there needs to be a transition from a
resource-based to a knowledge-based economy.
4.14.2 Innovation, skills and
sustainability
Innovation
The 2013 Innovation Union Scoreboard455
puts
Latvia in the ‘modest innovators’ group.
Nevertheless, it is one of the rapid growers, with an
average annual growth rate of 4.4 %, and is one of
the few moderate or modest innovators that have
managed to improve their innovation performance
since the launch of the Europe 2020 Innovation
Union flagship initiative in 2010.
Latvia’s Europe 2020 target for R&D intensity is
1.5 % of GDP. The current level is only 0.7 % and
business R&D intensity is the lowest in the EU at
0.19 % of GDP in 2011. Licence and patent
revenues are relatively low. SMEs are not
455 Innovation Union Scoreboard 2013. The modest
innovators show a low performance level more than 50 %
below that of the EU-27.
Food, beverages and
tobacco
21.38%
Textiles, apparel and
leather
5.63%
Wood, paper and
printing
29.35%
Chemicals, pharma,
petroleum, minerals
and rubber 10.84%
Metals
9.38%
Electronics, electrics
and machinery
7.16%
Cars and transport
3.11%
Other
8.06%
Country chapter: Latvia
176
particularly innovative. Only 17 % of SMEs
innovate by introducing a new product or a new
process, the lowest level (along with Hungary) in
the EU.456
The main challenges in research are the shortage of
qualified staff, a poor and fragmented
infrastructure, and a lack of cooperation between
research institutions and businesses. This results in
an inadequate commercialisation of research
results. The Global Competitiveness Report of the
World Economic Forum457
assessed that business
sophistication and innovation could be greatly
improved, and the Latvian competitiveness report458
attributed low research performance and limited
innovation activity in part to a lack of highly-
qualified scientists and engineers. Latvia has one of
the lowest numbers of scientific publications in the
EU.
Policy measures seek to improve science
competitiveness by: involving state scientific
institutes in the training of doctoral students and
young scientists; promoting international
cooperation; developing infrastructure for R&D
projects; promoting projects suitable for
commercialisation; implementing fundamental and
applied research projects; and supporting the
development of private sector capacity for research
and innovation.
Nine national research centres have been
established recently. The centres concentrate
research infrastructure and stimulate business-
science collaboration and thereby seek to promote
scientific excellence and improve
commercialisation of science results. A voucher
programme for micro, small and medium-sized
enterprises is under consideration to support
entrepreneurs in the purchase of external services,
such as industrial research. In addition, 11 cluster
projects are being implemented under the ‘cluster
programme’ (2012-15). These promote cooperation
between companies and research and education
institutions to increase exports from cluster firms,
enhance innovation and develop new products.
Skills
456 Research and Innovation performance in EU Member
States and associated countries (2013). 457 World Economic Forum Global Competitiveness Report
(September 2012). 458 Latvian Competitiveness Report 2011.
The skills mismatch is high,459
and there is a
problem of over qualification,460
as institutions of
higher and vocational education do not seem to be
able to provide the necessary skills for the
workforce, and the availability of high-quality
work-linked training is limited.
The employment pattern is likely to become more
polarised, with large increases both in jobs
requiring high qualifications, and in low-skill jobs.
Low-skill jobs are projected to be 16% of total jobs
in 2020, below the EU average (18%). Employers
are pointing to skills shortages in ICT,
pharmaceuticals and engineering, as the higher
education system has not produced enough
graduates in mathematics, science and technology.
To reduce unemployment and to improve the
matching of jobs and jobseekers, a legal framework
has been developed to make it possible for the long-
term unemployed to accept jobs in regions outside
their place of residence. A limited pilot project on
regional mobility grants is being implemented.
Measures to reduce youth unemployment include
support for job creation by employers and
promoting volunteering in non-governmental
organisations.
Sustainability
The goal is that renewable energy sources should
represent 40 % of final energy consumption, and
10 % in the transport sector, by 2020. In 2011, the
energy consumption mix had the second-highest
proportion of renewables (32.6 %) in the EU-27.
Although the Government is committed to the
target, there has been practically no improvement
since 2004. The Government has expressed its
intention to develop a new stable, coherent,
predictable and cost-effective support framework
for renewables, while avoiding changes that affect
the legitimate expectations of investors.
Latvia’s energy and carbon intensities are more
than double the EU-27 averages, with the largest
consumers being households and the transport
sector. A new law on the energy performance of
buildings was adopted in 2012; it also includes
rules on certification, inspection of heating and air
459 Skills mismatches and labour mobility,
http://ec.europa.eu/europe2020/pdf/themes/27_skills_gaps
_and_labour_mobility.pdf. 460 See figure 4.15 below.
Country chapter: Latvia
177
conditioning systems, and promotion of near-zero-
energy buildings.
Ten projects have recently received financing
through an aid scheme that supports the
construction of co-generation plants utilising
renewable energy resources. In 2012, several
projects were completed using the climate change
financial instrument that promotes energy
efficiency, the increase in the use of renewable
energy resources in energy production and the
reduction of greenhouse gas emissions.
The Eco-Innovation Observatory ranks Latvia 20th
in the EU on its eco-innovation scoreboard.461
It
was less likely to introduce resource-efficiency
measures than other Member States, and such
measures were unlikely to benefit from public
support. A programme on green industry innovation
that primarily targets SMEs was launched in 2012,
with funding from the Norwegian government. The
programme is designed to make new and existing
businesses greener, and to stimulate green
entrepreneurship and environmental innovation.
Waste generation remains low compared to the EU
average. However, 88 % of municipal waste goes to
landfills and only 10 % is recycled — and many
agglomerations do not even collect all waste water.
A new waste management plan for 2013-20 is
looking to break the link between economic growth
and waste generation and its impact on the
environment. It seeks to reduce the generation of
waste, promote re-use and extended use, and reduce
the materials and products used in the production of
harmful substances. Water supply and waste water
treatment services were upgraded in 2012, and
waste management projects concerning landfills
and collection were implemented in 2012.
4.14.3 Export performance
Growth has recently been driven by an increase in
exports, mainly in goods. The value of exports
increased by 15.5 % from 2011 to 2012, and the
exports of goods and services were growing faster
than imports. The main export partners are the EU
(69 %) and the Commonwealth of Independent
States (16 %).
461 Eco-innovation in Latvia, EIO Country Profile 2011.
Although exports remain to a large extent
dependent on low value-added industries with low
technology intake, exports of knowledge-intensive
goods and services have grown more rapidly than
total exports over the last five years.462
The most
important exports are agriculture and food products
(20 %), wood and wood products (15 %), metal and
metal articles (14 %) and machinery products
(14 %). Domestic demand and exports are projected
to expand at similar rates in 2013.463
To improve access to export markets, export
guarantees and advice are available. In addition, the
integration of businesses into international supply
chains is promoted by encouraging them to
participate in international exhibitions and trade
missions. The network of Latvian foreign economic
representative offices abroad expanded in 2012 and
there are currently 14 such offices.
4.14.4 Business environment and public
administration
Business environment
Latvia was ranked 25th of 185 countries (8th
in EU)
in the World Bank’s Doing Business report 2013.464
It increased its global competitiveness ranking from
64th to 55th in the 2012–13 report of the World
Economic Forum. Its administration is responsive
according to the Small Business Act fact sheets on
implementation.465
Latvia scores substantially
below the EU average only in the indicator on the
time needed to comply with major taxes, but
considerably above the EU average in four
indicators: paid-in minimum capital, cost required
to transfer property, number of tax payments by
year and full online availability of basic public
services to businesses.
The joint state and municipal e-services portal
(latvija.lv) provides access to 60 e-services, of
which 11 were introduced in 2012. The main
achievements of the 2012 action plan to improve
the business environment have been the
462 See figure 1.12. 463 EU Economic forecasts, Spring forecast 2013. 464 Doing Business 2013: Smarter Regulations for Small and
Medium-Size Enterprises. It should be noted that the
adoption of a Construction Law, which will step into force in February 2014, should lead to improvements in the next
edition. 465 The SBA Fact Sheets (2012).
Country chapter: Latvia
178
introduction of electronic registration of businesses
in the commercial register, and an e-treasury (no
need to submit a statement as a proof of paid
services, state fees and tax payments). Further,
amendments were made to the commercial code to
protect investor rights. After changes in VAT
regulations, the time required to register a business
in the state revenue service was reduced from 10
working days to 5 from the beginning of 2013.
Several programmes promote entrepreneurship, in
particular the creation and growth of new
businesses, especially innovative ones. So far, more
than 28 000 businesses have opted for the simplified
taxation regime for micro-enterprises introduced in
2010.
A national broadband strategy for a substantial
upgrade to broadband infrastructure was adopted in
December 2012. In terms of internet connection
speeds, Latvia is already ranked the best country in
Europe.466
However, there is room for further
improvement in rural broadband coverage. In 2012,
a procurement procedure was launched for the
‘Next generation network for rural areas’
programme, and construction will begin in 2013.
Investments in transport infrastructure have not
been sufficient in the last 20 years. EU financing is
gradually improving it, but not enough to radically
improve the road network quality.
Public administration
The quality of public administration is considerably
below the EU average as measured by the World
Bank’s government effectiveness indicator.467
Perceptions of the quality of public services were in
particular below average. Better than average
performance was seen in the use of tools for
administrative modernisation. The costs of starting
a business are significantly lower than the EU
average and licensing procedures are convenient.
However, obtaining licences and permits is still
problematic in construction.
The 2012 Corruption Perceptions Index ranks
Latvia 21st in the EU.468
The Corruption Prevention
466 Akamai: State of the Internet report Q4 2012. 467 Excellence in public administration for competitiveness in
EU Member States. 468 Transparency International Corruption Perceptions Index
2012.
and Combating Bureau has identified specific
corruption risks in public procurement and utilities,
local government and state-owned companies, and
also in other areas where legal norms are
ambiguous.
According to the 2013 EU justice scoreboard,469
the
Latvian judicial system has lengthy proceedings for
civil and commercial first instance cases, and low
clearance rates increase the backlog of court cases.
The human resource management and professional
development within the judiciary could be
improved. Recent reforms include amendments to
the law on judicial power, and to civil,
administrative and criminal procedural law, but it is
too early to assess whether they are sufficient to
fully address all the shortcomings. The reforms
have been proposed or partly implemented, and
amendments have also been proposed to certain
aspects of insolvency law. Communication between
courts and the general public has been improved
through information and communications
technologies (ICT), which should increase quality
and transparency in the system.
To reduce labour taxes, Latvia has a three-year
strategy to lower the personal income tax rate from
25 % to 20 %. The first step (lowering to 24 %)
came into effect in January 2013. The standard
VAT rate, which had previously been increased
significantly during the crisis, was lowered by one
percentage point to 21 % from 1 July 2012.
Since the end of 2011, Latvia has introduced new
measures to fight VAT fraud in the fields of
construction and scrap metal. Several legislative
measures were carried out in 2012 as part of the
plan for combating the grey economy and ensuring
fair competition for 2010–13. Measures included
amendments to the law on taxes and fees,
simplification of tax payment regimes, and
promotion of closer, more efficient cooperation
between taxpayers and the tax administration by
reducing administrative burden. Moreover, the new
law on individual property declarations and
reporting of undeclared income makes it possible to
regularise previously undeclared taxable income. It
aims to improve oversight of an individual’s
financial position. The impact of recent policy
measures is gradually translating into improved tax
469 EU Justice scoreboard 2013.
Country chapter: Latvia
179
collection rates, particularly visible in 2012, when
the annual increase in total tax revenue as reported
by Eurostat was above GDP growth. According to
the World Bank Paying Taxes Report 2013,470
the
costs of tax compliance in Latvia are relatively high
despite recent improvements.
4.14.5 Finance and investment
On average, relatively few SMEs indicate that
access to finance is their most important
problem.471
Most indicators on access to finance are
considerably better that the EU average, including
in access to public financial support, the perceived
willingness of banks to give a loan, the strength of
legal rights and the interest rate difference between
loans above or below EUR 1 million. The World
Bank472
ranks Latvia among the top performers for
ease of getting credit and for the level of legal
rights for borrowers and lenders. An important
initiative — long awaited by business organisations
— is the creation of a single institute responsible
for all support instruments; a one-stop shop for
access to finance should be operational by the end
of 2013.
Investment incentives include corporate income tax
rebates on large-scale investment projects, a
beneficial depreciation ratio for new technological
equipment, a carry-forward of losses, and several
labour-related incentives at different stages of the
hiring process. There are also four special economic
zones and a corporate income tax rate of 15 %,
which is one of the lowest in the EU. Financial
incentives include state and EU-supported loans,
credit guarantees and venture capital. A recently
implemented investment strategy focuses on an
alliance between seven major stakeholders from the
public, private and academic sectors aiming to
promote foreign direct investment in Latvia.
At the end of 2012, investment from EU Member
States was 72 % of total foreign investment stock,
with Swedish firms the biggest investors (24 %).
The main sectors were financial services and
insurance (27 %), wholesale and retail trade (14 %),
real estate (13 %) and manufacturing (12 %).
Efficient company start-up procedures and free
tailor-made services are examples of support for
470 Paying Taxes 2013, The global picture. 471 See the SBA Fact Sheet for Latvia 2012. 472 The World Bank Doing Business (Oct 2012).
foreign investors. The total number of foreign direct
investment projects has almost doubled to 90, with
initial inquiries tripling to 381 between 2009 and
2012.
4.14.6 Conclusions
One of the main challenges for Latvia is the
transition from low to medium and high technology
sectors. This would require investment in research
and innovation, but R&D funding and involvement
from industry, and the current R&D intensity, are
low.
However, Latvia offers an attractive financing
environment, and many well-established and
export-oriented companies seem to have little
trouble accessing credit. Growth is expected to
continue to rely on improved competitiveness,
driving investment, exports and private
consumption.
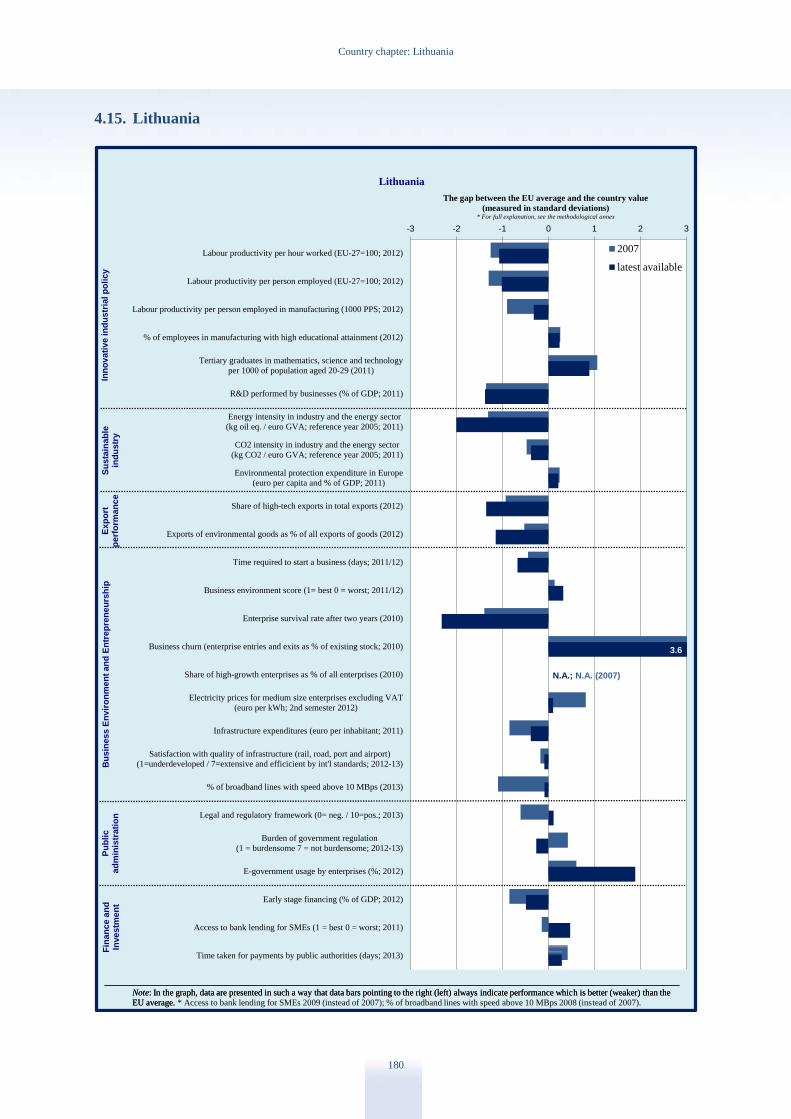
Country chapter: Lithuania
180
4.15. Lithuania
-3 -2 -1 0 1 2 3
Labour productivity per hour worked (EU-27=100; 2012)
Labour productivity per person employed (EU-27=100; 2012)
Labour productivity per person employed in manufacturing (1000 PPS; 2012)
% of employees in manufacturing with high educational attainment (2012)
Tertiary graduates in mathematics, science and technology
per 1000 of population aged 20-29 (2011)
R&D performed by businesses (% of GDP; 2011)
Energy intensity in industry and the energy sector
(kg oil eq. / euro GVA; reference year 2005; 2011)
CO2 intensity in industry and the energy sector
(kg CO2 / euro GVA; reference year 2005; 2011)
Environmental protection expenditure in Europe
(euro per capita and % of GDP; 2011)
Share of high-tech exports in total exports (2012)
Exports of environmental goods as % of all exports of goods (2012)
Time required to start a business (days; 2011/12)
Business environment score (1= best 0 = worst; 2011/12)
Enterprise survival rate after two years (2010)
Business churn (enterprise entries and exits as % of existing stock; 2010)
Share of high-growth enterprises as % of all enterprises (2010)
Electricity prices for medium size enterprises excluding VAT
(euro per kWh; 2nd semester 2012)
Infrastructure expenditures (euro per inhabitant; 2011)
Satisfaction with quality of infrastructure (rail, road, port and airport)
(1=underdeveloped / 7=extensive and efficicient by int'l standards; 2012-13)
% of broadband lines with speed above 10 MBps (2013)
Legal and regulatory framework (0= neg. / 10=pos.; 2013)
Burden of government regulation
(1 = burdensome 7 = not burdensome; 2012-13)
E-government usage by enterprises (%; 2012)
Early stage financing (% of GDP; 2012)
Access to bank lending for SMEs (1 = best 0 = worst; 2011)
Time taken for payments by public authorities (days; 2013)
The gap between the EU average and the country value
(measured in standard deviations)* For full explanation, see the methodological annex
Lithuania
2007
latest available
Note: In the graph, data are presented in such a way that data bars pointing to the right (left) always indicate performance which is better (weaker) than the
EU average.
Inn
ovati
ve in
du
str
ial p
oli
cy
Su
sta
inab
lein
du
str
yB
usin
ess E
nvir
on
men
t an
d E
ntr
ep
ren
eu
rsh
ipF
inan
ce a
nd
Investm
en
t
Note: In the graph, data are presented in such a way that data bars pointing to the right (left) always indicate performance which is better (weaker) than the
EU average. * Access to bank lending for SMEs 2009 (instead of 2007); % of broadband lines with speed above 10 MBps 2008 (instead of 2007).
Ex
po
rtp
erf
orm
an
ce
Pu
bli
cad
min
istr
ati
on
N.A.; N.A. (2007)
3.6
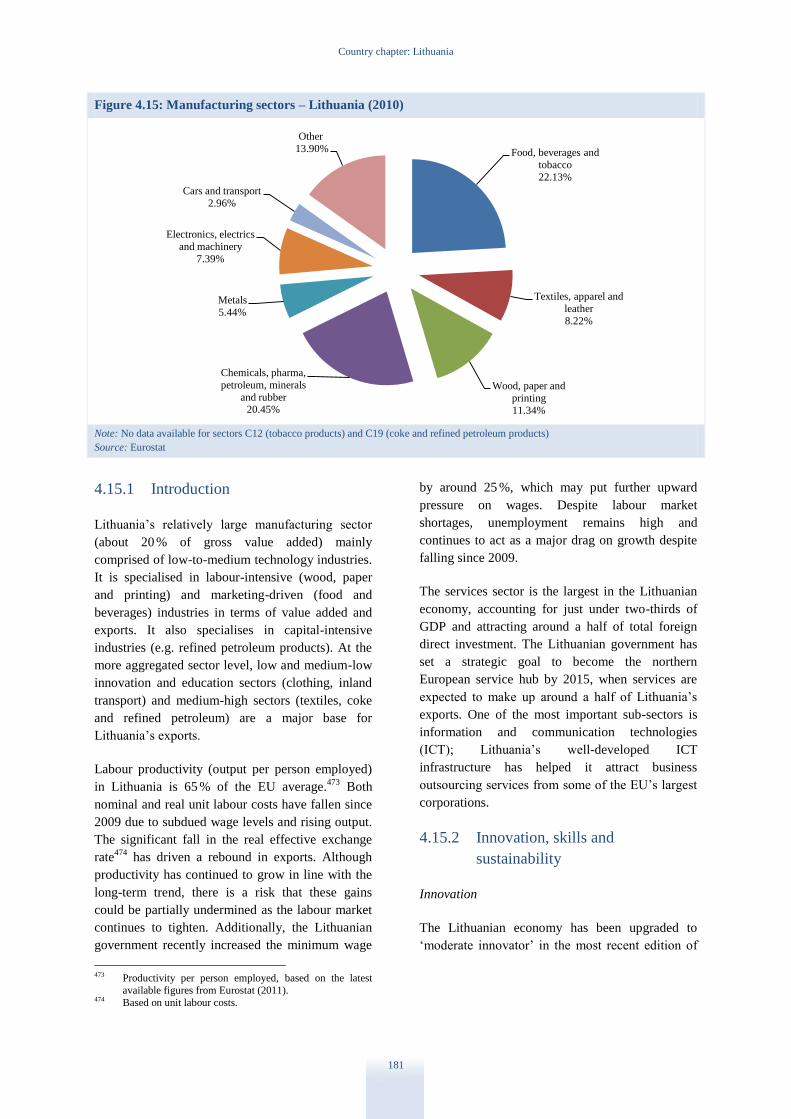
Country chapter: Lithuania
181
Figure 4.15: Manufacturing sectors – Lithuania (2010)
Note: No data available for sectors C12 (tobacco products) and C19 (coke and refined petroleum products)
Source: Eurostat
4.15.1 Introduction
Lithuania’s relatively large manufacturing sector
(about 20 % of gross value added) mainly
comprised of low-to-medium technology industries.
It is specialised in labour-intensive (wood, paper
and printing) and marketing-driven (food and
beverages) industries in terms of value added and
exports. It also specialises in capital-intensive
industries (e.g. refined petroleum products). At the
more aggregated sector level, low and medium-low
innovation and education sectors (clothing, inland
transport) and medium-high sectors (textiles, coke
and refined petroleum) are a major base for
Lithuania’s exports.
Labour productivity (output per person employed)
in Lithuania is 65 % of the EU average.473
Both
nominal and real unit labour costs have fallen since
2009 due to subdued wage levels and rising output.
The significant fall in the real effective exchange
rate474
has driven a rebound in exports. Although
productivity has continued to grow in line with the
long-term trend, there is a risk that these gains
could be partially undermined as the labour market
continues to tighten. Additionally, the Lithuanian
government recently increased the minimum wage
473 Productivity per person employed, based on the latest
available figures from Eurostat (2011). 474 Based on unit labour costs.
by around 25 %, which may put further upward
pressure on wages. Despite labour market
shortages, unemployment remains high and
continues to act as a major drag on growth despite
falling since 2009.
The services sector is the largest in the Lithuanian
economy, accounting for just under two-thirds of
GDP and attracting around a half of total foreign
direct investment. The Lithuanian government has
set a strategic goal to become the northern
European service hub by 2015, when services are
expected to make up around a half of Lithuania’s
exports. One of the most important sub-sectors is
information and communication technologies
(ICT); Lithuania’s well-developed ICT
infrastructure has helped it attract business
outsourcing services from some of the EU’s largest
corporations.
4.15.2 Innovation, skills and
sustainability
Innovation
The Lithuanian economy has been upgraded to
‘moderate innovator’ in the most recent edition of
Food, beverages and
tobacco
22.13%
Textiles, apparel and
leather
8.22%
Wood, paper and
printing
11.34%
Chemicals, pharma,
petroleum, minerals
and rubber 20.45%
Metals
5.44%
Electronics, electrics
and machinery
7.39%
Cars and transport
2.96%
Other
13.90%
Country chapter: Lithuania
182
the Commission’s Innovation Union Scoreboard.475
Previously, it had been a ‘modest innovator’ – the
lowest performance group – for several years. The
upgrading is due to marginal improvements in
innovation performance across all eight dimensions
measured. Lithuania’s innovation performance
grew by 5 % compared with 2012, exceeded only
by Estonia, and the five-year innovation growth rate
accelerated from 4.2 % to 5 %. Lithuania is the
growth leader in the group of ‘moderate
innovators’. However, despite recent progress,
Lithuania’s innovation performance is still well
below the EU average.
The Lithuanian economy is still comparatively
weak in the categories of ‘open, excellent and
attractive research systems’, ‘linkages and
entrepreneurship’, ‘intellectual assets’, ‘innovators’
and ‘economic effects’, where it scores well below
the EU average. The only category where Lithuania
scores above the average is in ‘human resources’.
As for ‘firm investments’, weak private sector R&D
expenditure is offset by comparatively high non-
R&D innovation expenditure. Lithuania’s R&D
intensity increased substantially in 2011 to reach
0.92 % of GDP, after five years of relative
stagnation at around 0.8 %. However, this is still
less than half of Lithuania’s target of 1.9 % for
2020. Most of Lithuania’s R&D investment gap
with the other EU countries is due to a lack of
business investment, which was 0.24 % of GDP in
2011. The Innovation Union Scoreboard also
indicates underperformance in collaboration
between public research organisations and
businesses, knowledge transfer and
commercialisation of research results. The
composition of Lithuanian industry, which is biased
towards less R&D-intensive industries, is a further
contributing factor to the gap.
Lithuania’s authorities are continuing to implement
measures to foster innovative businesses and
collaboration between science and industry, in
particular, through the development of five clusters
(‘valleys’) which bring together universities,
research institutes and businesses. Lithuania has
also introduced financial incentives, including R&D
tax credits and innovation vouchers, to help
businesses procure R&D services and to contract
technical feasibility studies from universities and
475 Moderate innovators are 50-90 % of the EU average in
terms of innovation performance.
research institutes. Although there has been robust
growth in intellectual assets over the last year, this
has been from a low base.
Skills
Business organisations have indicated the lack of
technical and business skills as a restraining factor
on employment growth. Significant skills
mismatches hinder labour force adaptability and
productivity. This is further aggravated by the low
participation in vocational and educational training,
apprenticeships and childhood education.
Participation in lifelong learning is one of the
lowest in the EU476
, further amplifying challenges
to equip low-skilled and older workers with the
possibility to respond better to labour market needs.
The schools produce relatively weak results in
terms of basic skills: 15-year olds' performance on
PISA tests remains below the EU average in
reading (the share of low-achievers is 24.3% vs. the
EU average of 20% in 2009) and maths (the share
of low-achievers is 26.2% vs. the EU average of
22.2% in 2009). However, Lithuania reached two
European targets in education – tertiary attainment
rate was 48.7% and early school leaving was 6.5%
(2012). While tertiary educational attainment
among women aged 30-34 is high at 53.3 %, the
figure for men is much lower (37.6 %) and the early
school leaving rate for men is twice as high (10.6 %
as compared with 5.0 % for women in 2011).
Sustainability
Lithuania is one of the EU’s most energy and
carbon-intensive economies, with a level of
environmental taxation below the EU average. Its
energy consumption is more than twice the average
and has been increasing over the last decade,
mostly because of the emissions-intensive transport
sector, but also due to the residential and service
sectors. Household heating, particularly in
apartment blocks, is inefficient and in need of
renewal. Although the quantity of waste per capita
in Lithuania is amongst the lowest of EU Member
States, the waste management system remains
heavily dependent on landfill, and the re-cycling
level (6 % in 2010) is one of the lowest in the EU.
476 Latvia 5.2 %, EU average 9 %.

Country chapter: Lithuania
183
The authorities are continuing to consolidate local
landfill sites into upgraded regional facilities and
have introduced several green waste composting
facilities.
4.15.3 Export performance
Lithuania’s exports are mainly composed of goods,
which make up around 83 % of all exports, in line
with the slight industrial bias of the economy
compared to the EU average. Lithuania’s goods
exports are mainly concentrated in low-to-medium
technology sectors, notably mineral fuels (25 %),
transport (7 %), machinery and mechanical
appliances (6 %), plastics (6 %) and furniture (5 %).
Exports of high value-added industries, such as
electronics, computing, and pharmaceuticals, are
comparatively small but growing. The computer
and optical equipment sector, the most sizeable
high value-added industry, has been able to expand
into niche export markets. Lithuanian lasers for
scientific research have proven to be competitive in
international markets. High-tech exports currently
represent 5.6 % of overall exports, compared to
15.4 % in the EU. Services exports are a small
proportion of overall exports, but have been
growing rapidly in recent years. The main sectors
are transportation (including freight forwarding and
warehousing) and tourism, which has been boosted
by improved transport links, IT services and
construction services.
Lithuania’s main export partners in 2012 were the
EU and the Commonwealth of Independent States
(CIS), accounting for 61 % and 30 % of exports
respectively. Within the EU, Latvia is by far the
largest export destination, receiving around 11 % of
exports, followed by Estonia and Germany. Since
2009, exports to the EU have declined by two
percentage points, on account of weak demand,
while exports to the CIS have grown significantly
by seven percentage points, partly due to an
expansionary fiscal policy in Russia. Net exports
were the main driver of growth in 2012, aided by a
continuing decline in the real effective exchange
rate, which has helped sustain a rebound in exports
since 2009. Exports rose 15 % year-on-year, pulled
by strong demand from Russia as well as a bumper
harvest that boosted the supply of food exports. The
trade balance turned marginally positive in 2012,
helped by an improvement in the terms of trade,
partly driven by higher cereal prices and lower oil
prices.
Export policy is based on various elements: support
and advice to businesses provided by the
government agency, Enterprise Lithuania, and the
network of overseas trade delegations; EU-
supported schemes to encourage businesses to forge
partnerships with other EU businesses; and
guarantees for export credit insurance, provided by
the agency Invega, which promotes small and
medium-sized enterprises (SMEs). Lithuania is well
positioned to take advantage of EU export markets
in high value-added industries given its well
educated workforce and comparatively low labour
costs.
4.15.4 Business environment and public
administration
Business environment
Lithuania’s overall rank in the World Bank’s 2013
Doing Business report fell one place from 26 to 27,
compared with 2012. The regulatory burden (e.g.
number of procedures and time required to
complete them) associated with individual business
indicators remained roughly the same, or in some
cases showed some slight improvement as
compared with the previous year. The cost of
completing business procedures fell in most cases,
in terms of percentage of income per capita,
particularly for ‘starting a business’; online
registration was implemented for limited liability
companies and the need for a notary was removed.
The required level of paid-in capital is still
comparatively high but fell slightly in 2012. A new
category of limited liability company — ‘small
partnership’ — was created in 2012, characterised
by no minimum level of paid-in capital, simple and
flexible management structure, possibility to
register online (in no more than three working days
after filing the necessary documents), and lower
registration costs (less than EUR 100). Export and
import procedures were revised to reduce costs for
businesses and administrative delays. Lithuania’s
rank on ‘getting electricity’ is brought down by the
length of time necessary to complete procedures,
even though the costs to businesses associated with
the procedures themselves are comparatively low.
Electricity and gas prices for businesses are high
compared with the EU average, partly on account
of weak interconnectivity. Lithuania has some of
the highest electricity network costs in the EU,
which account for a significant portion of the price.
Country chapter: Lithuania
184
Several initiatives to connect with EU gas and
electricity networks are on-going and are at
contractual and implementation stages. For the gas
sector, authorities have launched several projects to
improve transmission, interconnectivity and
diversification of supply. In June 2012, Lithuania
joined the Nord Pool Spot international electricity
exchange to increase integration into the EU
electricity market. The Lithuanian authorities are
also developing a liquefied natural gas (LNG)
terminal and plan to construct an interconnector
between Lithuania and Poland. For the electricity
sector, the Lithuanian and Swedish authorities have
recently given their approval to the
Nordbalt/SwedLit project, involving the
construction of a submarine power cable between
Klaipėda in Lithuania and Nybro in Sweden. The
project aims to promote trading between Baltic and
Nordic electricity markets and increase the security
of power supply.
Improving the transport infrastructure, in particular
rail transport, could facilitate business transports
considerably. Electrification and a north-south link
as part of the Rail Baltic project would also help
access to European markets.
Public administration
Lithuania plans to introduce systemic changes in its
administration by implementing the Public
Management Development Programme for 2012-
20, which was adopted in 2012. Additionally, the
government has pledged to continue improving the
efficiency and client orientation of public
administration, by simplifying administrative
procedures for citizens and businesses, improving
impact assessment and public financial
management, and increasing public involvement in
decision-making processes. Lithuania is
undertaking a major regulatory reform project to
streamline business inspection institutions.
Currently business inspections are carried out by 60
public institutions; the reform aims to consolidate
and optimise their functions by 2016. In 2012,
authorities began to evaluate the effectiveness of
business inspection institutions as part of the
exercise. The Lithuanian authorities have also
started to review business permits, with the aim of
reducing the number of permits for which
businesses have to apply. The review should be
completed by the end of 2014.
Since 2010, the government has been undertaking a
far-reaching reform of state-owned enterprises
(SOEs), covering 136 entities engaged in economic
activities with a combined asset value of around
25 % of GDP. The objective is to restructure
corporate governance, increase transparency and
enhance competition and efficiency. The reform
involves legislative and organisational changes, and
performance targets. The legislative aspects of the
reform have been completed. Transparency and
accountability have significantly improved as
reports are now published on a quarterly and annual
basis and clear enterprise objectives have been
established. The government should continue
monitoring progress on implementation of the
resolutions adopted.
4.15.5 Finance and investment
The banking sector remains stable with improving
fundamentals: the level of non-performing loans,
albeit still high, has fallen, capital adequacy has
risen and profitability has recovered. Interest rates
for private sector loans are at record low levels and
the central bank has maintained its commitment to
the LTS/EUR currency peg, which continues to
underpin euro-based lending. Only a very small
number of businesses have reported a negative
impact on the supply of lending from the collapse
of Bankas Snoras.477
A second bank, Ukio Bankas,
with a share of around 4 % of market lending,
collapsed in February 2013. The good assets and
insured liabilities of the bank have been taken over
by Siauliu Bankas, while the bad loans and
uninsured liabilities will be offered to the market in
the course of bankruptcy proceedings.
There is not expected to be any negative impact on
lending to businesses. In spite of these factors,
lending to business rose only slightly in 2012 as
demand remained weak. This is mainly due to the
uncertain economic outlook, while some SMEs
have found credit restricted due to the sharp fall in
collateral values as a consequence of the crisis. The
latest indicators have shown some improvement in
confidence, in both manufacturing and service
sectors, which may spur credit growth in future.
Optimism amongst SMEs is also starting to grow,
but they are continuing to reduce their debts
477 Based on a recent government survey, 1 % of businesses
reported a negative impact on the availability of finance
due to the collapse of AB Bankas Snoras.
Country chapter: Lithuania
185
(deleverage) and remain cautious about embarking
on new investment.
The government continues to support SMEs
through EU structural funds.478
In 2012, the
government launched a new Creation Innovation
Fund to support innovative start-ups, administered
by the national holding fund Invega. A call for
tender for a fund manager is currently ongoing. In
September, the European Investment Fund (EIF)
and the governments of Lithuania, Latvia and
Estonia launched a new and innovative investment
initiative, dedicated to boosting equity investments
in Baltic SMEs. The Baltic Innovation Fund will
invest EUR 100 million in private equity and
venture capital funds focused on the Baltic States
over the next four years. The EIF will require
private investors to provide 50 % of the finance, so
the total amount of funds available for investments
will double to EUR 200 million.
The global financial crisis has had a profound
impact on the Lithuanian economy. The level of
investment fell sharply in 2009, forcing some
restructuring of industry. Partly as a consequence,
the economy has undergone a shift to higher value-
added services and goods. Investment recovered in
2011, reaching the pre-crisis level of foreign direct
investment. Expenditure on infrastructure (euros
per inhabitant) is approximately 11 % below the EU
average. The weak economic outlook, at home and
for Lithuania’s main trading partners, has
diminished confidence in further expansion.
According to business surveys, up to 90 % of
businesses consider their production capacity to be
sufficient or even excessive.
4.15.6 Conclusions
The Lithuanian economy has rebounded quickly
from the crisis mainly due to rising exports partly
driven by an improvement in price competitiveness.
The economy has the potential to continue to grow
strongly, thanks to a well-educated workforce,
strong trade links and a strategic position. Industry
is gradually shifting from low-to-medium to higher
value-added manufacturing and Lithuania is
478 There are two holding funds in operation funded by the
ERDF with a total allocation of EUR 228 million: the JEREMIE Fund administered by the EIF (EUR 170
million), and a fund administered by Invega (EUR 58
million).
developing expertise in knowledge-intensive
services, such as IT outsourcing.
Nevertheless, there are challenges remaining.
Electricity and gas prices for businesses are high
compared to the EU average and Lithuania is one of
the most energy and carbon-intensive economies in
the EU. Although the administrative burden for
businesses has been lightened, there is still room for
further progress in several areas, particularly for
licences and permits and the number of inspections
by government agencies. Businesses still report a
lack of technical and business skills and investment
remains weak, particularly in R&D, which is
restraining potential growth. Finally, reform of
state-owned enterprises should be completed to
ensure transparency.

Country chapter: Luxembourg
186
4.16. Luxembourg
-3 -2 -1 0 1 2 3
Labour productivity per hour worked (EU-27=100; 2011)
Labour productivity per person employed (EU-27=100; 2012)
Labour productivity per person employed in manufacturing (1000 PPS; 2012)
% of employees in manufacturing with high educational attainment (2012)
Tertiary graduates in mathematics, science and technology
per 1000 of population aged 20-29 (2010)
R&D performed by businesses (% of GDP; 2011)
Energy intensity in industry and the energy sector
(kg oil eq. / euro GVA; reference year 2005; 2011)
CO2 intensity in industry and the energy sector
(kg CO2 / euro GVA; reference year 2005; 2011)
Environmental protection expenditure in Europe
(euro per capita and % of GDP; 2011)
Share of high-tech exports in total exports (2012)
Exports of environmental goods as % of all exports of goods (2012)
Time required to start a business (days; 2011/12)
Business environment score (1= best 0 = worst; 2011/12)
Enterprise survival rate after two years (2010)
Business churn (enterprise entries and exits as % of existing stock; 2010)
Share of high-growth enterprises as % of all enterprises (2010)
Electricity prices for medium size enterprises excluding VAT
(euro per kWh; 2nd semester 2012)
Infrastructure expenditures (euro per inhabitant; 2011)
Satisfaction with quality of infrastructure (rail, road, port and airport)
(1=underdeveloped / 7=extensive and efficicient by int'l standards; 2012-13)
% of broadband lines with speed above 10 MBps (2013)
Legal and regulatory framework (0= neg. / 10=pos.; 2013)
Burden of government regulation
(1 = burdensome 7 = not burdensome; 2012-13)
E-government usage by enterprises (%; 2012)
Early stage financing (% of GDP; 2012)
Access to bank lending for SMEs (1 = best 0 = worst; 2011)
Time taken for payments by public authorities (days; 2013)
The gap between the EU average and the country value
(measured in standard deviations)* For full explanation, see the methodological annex
Luxembourg
2007
latest available
Note: In the graph, data are presented in such a way that data bars pointing to the right (left) always indicate performance which is better (weaker) than the
EU average.
Inn
ovati
ve in
du
str
ial p
oli
cy
Su
sta
inab
lein
du
str
yB
usin
ess E
nvir
on
men
t an
d E
ntr
ep
ren
eu
rsh
ipF
inan
ce a
nd
Investm
en
t
Note: In the graph, data are presented in such a way that data bars pointing to the right (left) always indicate performance which is better (weaker) than the
EU average. * Access to bank lending for SMEs 2009 (instead of 2007); % of broadband lines with speed above 10 MBps 2008 (instead of 2007).
Ex
po
rtp
erf
orm
an
ce
Pu
bli
cad
min
istr
ati
on
N.A. (2007)
N.A.
N.A.
N.A.; N.A. (2007)
N.A. (2007)
3.7
3.5
Country chapter: Luxembourg
187
4.16.1 Introduction
Luxembourg’s economy is strongly service-
oriented, as manufacturing industries represented
less than 7 % of value added in 2012 (15.3 % in the
EU). Luxembourg is specialised in capital-intensive
industries (basic iron and steel, cement, basic non-
ferrous metals), mainstream manufacturing
industries (rubber products) and technology-driven
industries (media, information and communication
technologies). Manufacturing industries employ
about 9 % of the labour force (22.6 % in the EU).
Labour productivity is among the highest in the EU,
but it has lost some of its price competitiveness
over the last decade mostly due to high wage
increases coupled with low or negative productivity
growth. Economic growth was sluggish in 2012,
and this is projected continue through 2013. GDP
growth was on average 3.1 % over the period 2000-
11. The domestic consumption and export of
services, in particular financial intermediation but
also transport, communications, insurance and other
business services, largely contributed to this result.
The factors that supported employment in 2012,
such as labour hoarding or a reduction in the
number of hours worked, are projected to have a
smaller impact on the labour market in 2013
because of the continuing uncertainty, and
unemployment that has already been rising since
the second half of 2012 is likely to continue to rise,
also due to the growing labour force. Youth
unemployment is relatively high at 18.0 % of the
total active population in 2012, compared to an
overall unemployment rate of 5.0 %. The situation
for migrants and young people with low skills
remains difficult, despite a number of policy
initiatives. Added to the recent slowdown of the
economy’s main growth engine, the financial
sector, the country’s vulnerability has become more
visible.
4.16.2 Innovation, skills and
sustainability
Innovation
The 2013 Innovation Union Scoreboard ranks
Luxembourg as an innovation follower with
innovation performance above the EU average.
Despite an open and attractive research system,
relative weaknesses remain in corporate
investments (business R&D expenditure,
innovation by non-R&D firms) and in the diffusion
of innovation (sales of new-to-market products).479
Public funding of research and innovation has
increased,480
with the second generation of
performance contracts for 2011-13 signed between
the Ministry of Higher Education and Research
(MESR) and the National Research Fund and
Public Research Centres (PRCs), and between the
MESR and the Ministry of the Economy and
Foreign Trade and Luxinnovation. A contract for
2010-13 has also been concluded between the state
and the University of Luxembourg. Under the law
that provides subsidies to private-sector R&D and
innovation, the goal is to support 240 programmes
and projects during 2011-13, compared to 143 in
2008-10. The funds allocated are expected to
increase from EUR 46 million in 2011 to
EUR 65 million in 2013.
Despites the increase in public R&D funding, the
R&D and innovation system faces several
challenges. There is a requirement for public
research institutions to generate third-party funding
as a prerequisite for receiving government funding,
and the funding received is expected to generate
spin-offs, patents and other forms of IP, these goals
have not been met. Further, a critical mass of
researchers is needed for R&D in order that enough
of the output results in innovation.481
Third, there is
a need to increase participation in international
consortia482
through programmes such as FP7; and
fourth, innovation in services should be enhanced483
(special action plans for the benefit of logistics,
health technologies, eco-technologies and eco-
innovation are currently being implemented —
some of them comprising the development of
clusters).
Luxembourg has over the last two decades rapidly
built up its public research capacities, from a
479 For details see “Research and Innovation performance in
EU Member States and Associated Countries, Innovation
Union progress at country level, 2013”. 480 Source: PRO INNO Europe. 481 The ATTRACT and PEARL 2008-13 programmes of the
National Fund for Research (FNR — Fonds national de la
recherche) aim to attract researchers to Luxembourg and keep them in the country.
482 Luxembourg already has numerous cross-border
cooperation agreements, in particular with other EU Member States.
483 This is one of the priorities of the CORE programme of
the National Fund for Research.
Country chapter: Luxembourg
188
situation where, 25 years ago, the public research
system was non-existent. The contribution of these
efforts to the economy remains limited, in particular
in terms of the relatively modest level of
cooperation between public research institutions
and firms, and taking into account the sharp decline
of business R&D intensity (from 1.53 % in 2000 to
0.98 % in 2011). The development of a more
focused smart specialisation strategy could play a
crucial role in maximising the economic impact of
public research funding, in particular through
ensuring a more significant leverage effect on
private investments. In this context, support for
clusters has the potential to play a much more
important role in the R&D and innovation policy.
Skills
The situation for workers with low skills (in
particular migrants and young residents) is difficult
despite a large number of government and business
initiatives. Young residents face fierce competition
for jobs from non-residents, who are often more
skilled. This raises the question of the performance
of the education system, as PISA tests484
indicate it
is around or below the EU average. A further
challenge are the language requirements that are
especially challenging given the high proportion of
foreign-born people in the population (40 %) who
have an additional family language.
Further, specific skills are required by the highly
specialised labour market (in particular in financial
and legal services, and in technologically advanced
professions). A reform of secondary schools is
currently being prepared and new guidance will be
given this year for classes from primary education
to the lower secondary school. Adult participation
in lifelong learning has increased over the last few
years and reached 13.6 % in 2011, but an even
higher adult participation rate is needed to tackle
the country’s structural unemployment, as residents
are facing competition from a large pool of often
highly skilled potential workers from neighbouring
countries. Further focus on employability of the
population aged 55-64 with a low education level is
needed.485
484 There has been a negative trend in reading, mathematics
and science since 2006. 485 A White Paper on lifelong learning strategies was
published in November 2012. LLL in the private sector
will be co-financed by the state at a rate of 20 % instead of
Sustainability
Luxembourg has committed itself to reducing its
greenhouse gas emissions not covered by the
European trading system (ETS) by 20 % in 2020
compared to 2005. It is unlikely to meet the target
solely through national measures — based on
existing actions, emissions are projected to increase
0.3 % by 2020 compared to 2005, leading to a gap
of over 20 percentage points. This issue was
included in a country-specific recommendation
both in 2012 and 2013.
The transport sector was responsible for 68 % of
non-ETS emissions in 2011. In January 2013, the
excise tax on diesel was increased from EUR 330
per 1 000 litres to EUR 335. However, the still
relatively low fuel taxes weaken incentives to use
public transport, and create strong incentives for
both private car owners in the region and drivers of
heavy vehicles in transit to make a detour to fill up
their tanks in Luxembourg. The efficiency of newly
registered vehicles improved substantially between
2005 and 2012, but at 138.4 g CO2/km driven they
were still 5 % above the EU average.
The efforts to promote energy efficiency focus
mainly on buildings, with various initiatives to
reduce energy use in the residential sector. A
voluntary agreement is in place with 66 private
companies to implement an energy management
system and to establish an action programme to
conserve energy. The effect is expected to be
relatively limited in terms of energy efficiency.
Several energy efficiency programmes aim to
increase cooperation and sharing of best practices,
both within Luxembourg — in the context of the
climate pact with municipalities — and with its
neighbours. Between 2005 and 2011, renewable
energy consumption as a proportion of total
consumption doubled in Luxembourg to 2.9 %,
which is still far from the 11 % target for 2020. The
use of renewable energy in transport is lagging
behind: in 2011, the share of renewable energy
(mainly biofuels) in all energy consumed in
transport was only 2 %, some distance from the
2020 target of 10 %.
14.5 % (35 % for young unskilled workers and older
workers), in line with Euro Plus Pact commitments.

Country chapter: Luxembourg
189
4.16.3 Export performance
Luxembourg has achieved excellent export
performance in terms of knowledge-intensive
services (about 80 % of total service exports, three
quarters of which are financial services) and in
high-tech exports of goods (about 30 % of total
goods exports).
However, although largely positive in the 2000s,
the contribution of the balance of goods and
services to GDP has been negative since 2010 —
whereas trade has contributed positively to growth
both in the EU as a whole, and in the euro area,
which is Luxembourg’s principal export market.
The economy remains very sensitive to the export
performance of financial services. Even with a
return of growth to the euro area, any further unrest
in financial markets worldwide could limit the
contribution of trade to growth in Luxembourg.
4.16.4 Business environment and public
administration
The results of the World Bank’s 2013 Doing
Business survey are in line with those of the
previous survey. Enforcing contracts and paying
taxes remain very strong points. Out of 185
economies, Luxembourg ranks first for the first
item and 14th for the second one, thanks to the very
short time needed to prepare and file tax returns and
to pay taxes. The time required to start-up a
company remains 19 days, well above the EU
average of 6.5 days.
The Small Business Act 2012 factsheet for
Luxembourg highlights that in terms of value
added, SMEs contribute much more to the
country’s economy (almost 73 %) than in the EU on
average (58 %).486
The sector distribution of SME
activity clearly underlines the fact that Luxembourg
is a service-based economy, where SMEs active in
services represent 58 % of all businesses (EU
average 45 %), account for 45 % of total
employment (EU average 40 %) and contribute two
thirds of total value added (EU average 43 %).
More than a third (36 %) of all service-oriented
486 The data cover the ‘business economy’, which includes
industry, construction, trade and services (NACE Rev. 2 Sections B to J, L, M and N). The data do not cover
enterprises in agriculture, forestry or fishing or largely
non-market services such as education and health.
SMEs are knowledge-intensive (EU average 28 %).
High- and medium-high-tech SMEs represent only
9 % of Luxembourg’s enterprises (EU average
12 %) and contribute only 17 % to total value added
(EU average 30 %).
Luxembourg’s economy remains open and
business-friendly. The efforts to provide an
environment conducive to SMEs are reflected in the
policy measures taken recently, such as the
National action plan for SMEs (the fourth one
being about to be put in place), or the creation this
year of a high-level committee for the support,
development and promotion of industry. The
national SME envoy (appointed in April 2011) has
been monitoring delays and advances in the
implementation of Luxembourg’s third action plan
for SMEs and has ensured that the interests of
SMEs are taken into account in major pieces of
relevant legislation. Hence, the government has
demonstrated a strong commitment to the interest
of businesses (and in particular SMEs), along with
a determination to learn from good international
practices. More comprehensive reforms would
include the need to further address issues such as
insolvency, reforming the rules on second-chance
entrepreneurship, transparency of the public
procurement system, and a more comprehensive
administrative reform.
In terms of overall public administration
performance, Luxembourg remains above the EU
average. The quality of public services is regarded
as high, and the same goes for policy
implementation. The take-up of e-government
services by citizens and enterprises is one of the
highest in Europe. One-stop-shop and e-
government services are multilingual and available
to businesses mainly through the ‘Guichet
Entreprises’, which is one of the two main sections
of the ‘Guichet.lu’ national website.
A report487
on the functioning of EU judicial
systems recommended that the procedure for
registering property should be simplified, the cost
of registering property sharply reduced, and the cost
of insolvency and bankruptcy procedures cut by
about 5 points to reach 10 %. The recovery rate
from such procedures should also be increased.
487 The functioning of judicial systems and the situation of
the economy in the European Union Member States,
CEPEJ, January 2013.

Country chapter: Luxembourg
190
4.16.5 Finance and investment
Credit tightening has been less marked in
Luxembourg than elsewhere in the euro area, and
SMEs have continued to enjoy good access to
finance. Smaller loans of less than EUR 1 million,
which are almost exclusively for SMEs, are much
less expensive in Luxembourg than elsewhere in
the EU. Venture capital is much more accessible
than in the EU on average. A fund targeted at SMEs
active in innovative fields (ICT included) was
launched in 2012, in close collaboration with the
European Investment Fund (EIF). Another fund
specialised in life sciences was launched on the
same date with a London-based venture capital
partner. With a lifespan of at least 15 years each,
both funds are aimed at diversifying Luxembourg’s
economy and rendering it more sustainable.
A set of different loan schemes for enterprises
continue to apply (equipment loan; start-
up/takeover loan), along with the vaccin anti-crise,
which provides counselling services to companies
suffering from financial difficulties.
There are remaining challenges revealed by
indicators that are directly affected by policy
decisions, including information on credit that is
perceived as relatively unclear in Luxembourg (thus
hampering the provision of loans). Public financial
support through EU funds (regional and structural)
is focused much less on SMEs in Luxembourg than
in the EU on average.488
4.16.6 Conclusions
Among EU countries, Luxembourg still scores well
in terms of overall competitiveness. Nevertheless,
the cost competitiveness of the economy poses the
main medium- to long-term challenge, in particular
due to high wage increases and coupled with low
productivity growth. Nominal unit labour costs,
especially in manufacturing, are increasing faster
than in neighbouring Member States. Luxembourg
has recently temporarily modified the automatic
indexation of wages by introducing a minimum
interval of 12 months between each wage
indexation and limiting the indexation to 2.5%.
However, from 2015 on the automatic indexation
will again be applied in the normal way. Further,
488 SBA factsheet 2012.
the system does not comprise mechanisms that
would keep unit labour cost developments in line
with neighbouring countries.
Financial services have been the prime source of
growth in the past decade, and only limited
progress has been made towards a more diversified,
knowledge-intensive economy. The development of
a more focused smart specialisation strategy could
give stronger leverage to research and innovation
funding, in particular through more support to
clusters.
The situation for workers with low skills (in
particular migrants and young residents) remains
difficult despite a large number of government and
business initiatives. Greater adult participation in
lifelong learning is needed to tackle the country’s
structural unemployment. Finally, another
challenge is achieving the national target for the
reduction of greenhouse gas emissions.
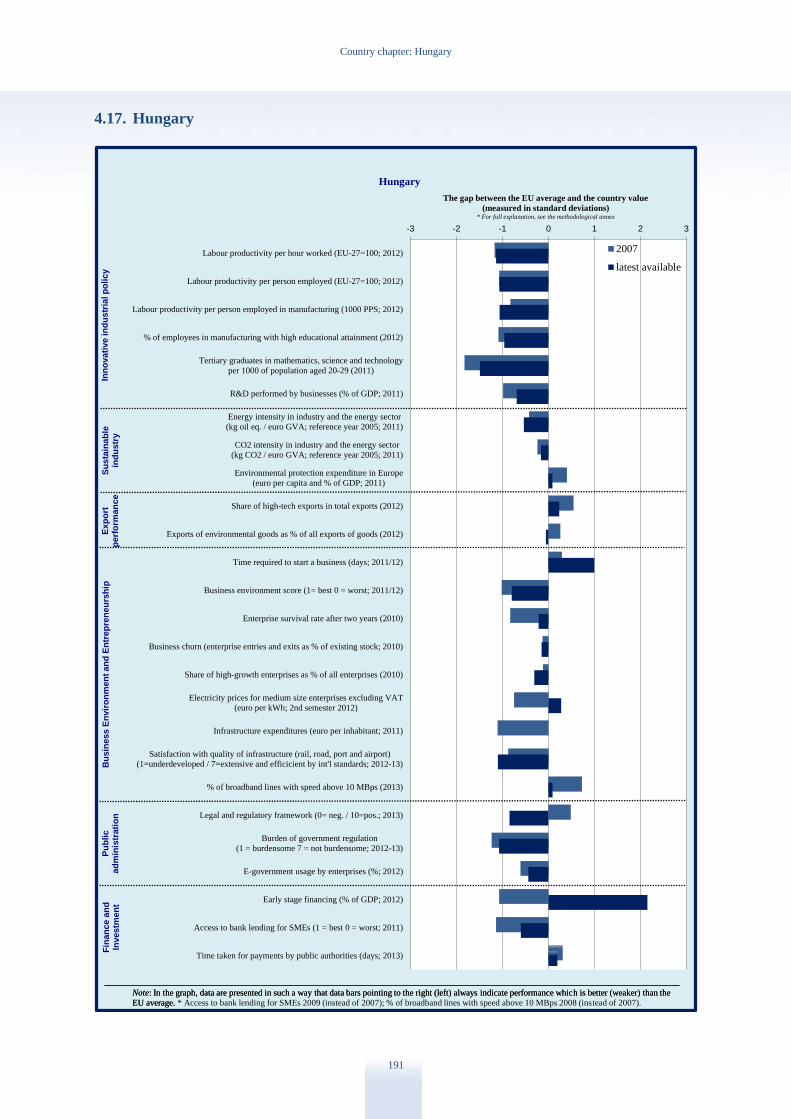
Country chapter: Hungary
191
4.17. Hungary
-3 -2 -1 0 1 2 3
Labour productivity per hour worked (EU-27=100; 2012)
Labour productivity per person employed (EU-27=100; 2012)
Labour productivity per person employed in manufacturing (1000 PPS; 2012)
% of employees in manufacturing with high educational attainment (2012)
Tertiary graduates in mathematics, science and technology
per 1000 of population aged 20-29 (2011)
R&D performed by businesses (% of GDP; 2011)
Energy intensity in industry and the energy sector
(kg oil eq. / euro GVA; reference year 2005; 2011)
CO2 intensity in industry and the energy sector
(kg CO2 / euro GVA; reference year 2005; 2011)
Environmental protection expenditure in Europe
(euro per capita and % of GDP; 2011)
Share of high-tech exports in total exports (2012)
Exports of environmental goods as % of all exports of goods (2012)
Time required to start a business (days; 2011/12)
Business environment score (1= best 0 = worst; 2011/12)
Enterprise survival rate after two years (2010)
Business churn (enterprise entries and exits as % of existing stock; 2010)
Share of high-growth enterprises as % of all enterprises (2010)
Electricity prices for medium size enterprises excluding VAT
(euro per kWh; 2nd semester 2012)
Infrastructure expenditures (euro per inhabitant; 2011)
Satisfaction with quality of infrastructure (rail, road, port and airport)
(1=underdeveloped / 7=extensive and efficicient by int'l standards; 2012-13)
% of broadband lines with speed above 10 MBps (2013)
Legal and regulatory framework (0= neg. / 10=pos.; 2013)
Burden of government regulation
(1 = burdensome 7 = not burdensome; 2012-13)
E-government usage by enterprises (%; 2012)
Early stage financing (% of GDP; 2012)
Access to bank lending for SMEs (1 = best 0 = worst; 2011)
Time taken for payments by public authorities (days; 2013)
The gap between the EU average and the country value
(measured in standard deviations)* For full explanation, see the methodological annex
Hungary
2007
latest available
Note: In the graph, data are presented in such a way that data bars pointing to the right (left) always indicate performance which is better (weaker) than the
EU average.
Inn
ov
ati
ve in
du
str
ial p
oli
cy
Su
sta
ina
ble
ind
ustr
yB
us
iness E
nv
iro
nm
en
t an
d E
ntr
ep
ren
eu
rsh
ipF
ina
nce a
nd
Investm
en
t
Note: In the graph, data are presented in such a way that data bars pointing to the right (left) always indicate performance which is better (weaker) than the
EU average. * Access to bank lending for SMEs 2009 (instead of 2007); % of broadband lines with speed above 10 MBps 2008 (instead of 2007).
Ex
po
rtp
erf
orm
an
ce
Pu
bli
cad
min
istr
ati
on
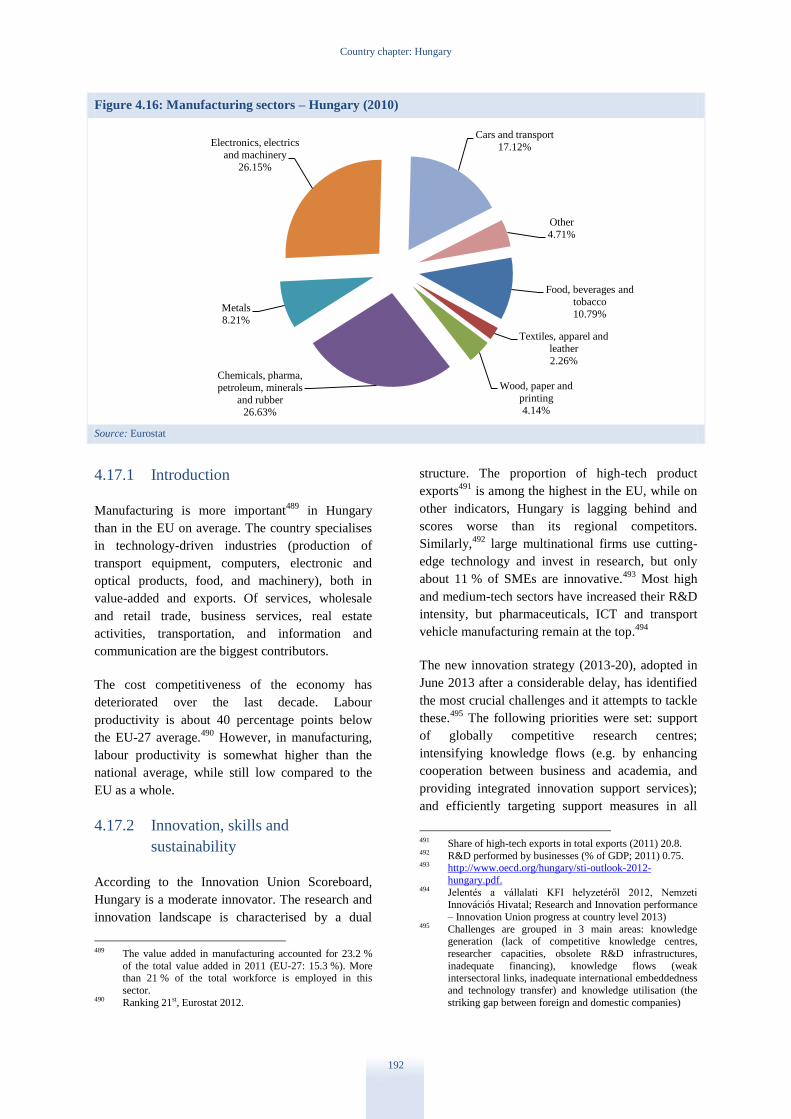
Country chapter: Hungary
192
Figure 4.16: Manufacturing sectors – Hungary (2010)
Source: Eurostat
4.17.1 Introduction
Manufacturing is more important489
in Hungary
than in the EU on average. The country specialises
in technology-driven industries (production of
transport equipment, computers, electronic and
optical products, food, and machinery), both in
value-added and exports. Of services, wholesale
and retail trade, business services, real estate
activities, transportation, and information and
communication are the biggest contributors.
The cost competitiveness of the economy has
deteriorated over the last decade. Labour
productivity is about 40 percentage points below
the EU-27 average.490
However, in manufacturing,
labour productivity is somewhat higher than the
national average, while still low compared to the
EU as a whole.
4.17.2 Innovation, skills and
sustainability
According to the Innovation Union Scoreboard,
Hungary is a moderate innovator. The research and
innovation landscape is characterised by a dual
489 The value added in manufacturing accounted for 23.2 %
of the total value added in 2011 (EU-27: 15.3 %). More than 21 % of the total workforce is employed in this
sector. 490 Ranking 21st, Eurostat 2012.
structure. The proportion of high-tech product
exports491
is among the highest in the EU, while on
other indicators, Hungary is lagging behind and
scores worse than its regional competitors.
Similarly,492
large multinational firms use cutting-
edge technology and invest in research, but only
about 11 % of SMEs are innovative.493
Most high
and medium-tech sectors have increased their R&D
intensity, but pharmaceuticals, ICT and transport
vehicle manufacturing remain at the top.494
The new innovation strategy (2013-20), adopted in
June 2013 after a considerable delay, has identified
the most crucial challenges and it attempts to tackle
these.495
The following priorities were set: support
of globally competitive research centres;
intensifying knowledge flows (e.g. by enhancing
cooperation between business and academia, and
providing integrated innovation support services);
and efficiently targeting support measures in all
491 Share of high-tech exports in total exports (2011) 20.8. 492 R&D performed by businesses (% of GDP; 2011) 0.75. 493 http://www.oecd.org/hungary/sti-outlook-2012-
hungary.pdf. 494 Jelentés a vállalati KFI helyzetéről 2012, Nemzeti
Innovációs Hivatal; Research and Innovation performance
– Innovation Union progress at country level 2013) 495 Challenges are grouped in 3 main areas: knowledge
generation (lack of competitive knowledge centres,
researcher capacities, obsolete R&D infrastructures,
inadequate financing), knowledge flows (weak intersectoral links, inadequate international embeddedness
and technology transfer) and knowledge utilisation (the
striking gap between foreign and domestic companies)
Food, beverages and
tobacco
10.79%
Textiles, apparel and
leather
2.26%
Wood, paper and
printing
4.14%
Chemicals, pharma,
petroleum, minerals
and rubber 26.63%
Metals
8.21%
Electronics, electrics
and machinery
26.15%
Cars and transport
17.12%
Other
4.71%
Country chapter: Hungary
193
segments of the economy to boost companies’ RDI
activity. Both large companies and SMEs are to be
targeted, with measures tailored to their needs.
Addressing horizontal problems such as lack of
financing (including funding for basic research,
availability of venture capital, seed capital) and the
changing regulatory environment496
would help to
create an environment favourable for research and
innovation. It will be crucial to implement the new
strategy effectively to maximise the effectiveness of
investment and its impact on growth and jobs.
The market for public procurement does not seem
to work properly, as in about half of the cases there
has been only one single bidder in 2010 and 2011.
This might be explained by the fact that below a
certain threshold only SMEs can submit offers,
which has a negative impact on competition.497
Skills
Tertiary education attainment has been improving,
but it is still well below the EU average. The
distribution of graduates by field is also out of
balance. The number of maths, science and
technology graduates is especially low compared to
the average in the EU. Since 2011, there have been
reforms to tackle these issues by cutting back the
number of state-financed places in many fields,498
but the final outcome of the reform is unclear, as
applicant numbers have also decreased.
There are also reforms underway in vocational
training. The training period has been shortened,
and apprenticeship and the vocational content are
being strengthened in cooperation with industry,499
while less time will be spent on formal
competencies.
On entrepreneurship, there was a drop in the share
of the population that believes it has the skills and
496 The high-level political body in the field of STI policy,
the National Research, Innovation and Science Policy
Council (NKITT),) was dissolved in July 2012, when the
Governmental Development Cabinet, body chaired by the prime minister, was set up. As of 2011, companies cannot
deduct the costs of their in-house R&D from the
innovation levy. 497 Assessment of the 2013 national reform programme and
convergence programme for Hungary, SWD(2013) 367. 498 Such as law, economics, and humanities. 499 The Hungarian Chamber of Industry and Commerce is in
charge of preparing the technical content of the new
curriculum to be used as of 1 September 2013.
knowledge to start a business, down by 3
percentage points between 2006 and 2011,500
and
the score fell to 40 % (EU average 42.0 % in
2012).501
Regarding life-long learning, Hungary has one of
the worst records in the EU, with a very low
participation rate.502
The content of courses on offer
is also a problem, as many of them do not match the
needs of the market. According to the 2013 national
reform programme, the government is also planning
reforms in this area.
Sustainability
The energy and CO2 intensity of the industry and
energy sector is higher503
than the EU average, due
to both inefficient infrastructure and obsolete
technology. The national energy efficiency action
plan was adopted in 2011, though its
implementation has been delayed. Government
support for energy efficiency projects504
seem to be
lacking, as available funding is quickly exhausted.
There is a plan to launch a new green economy
financing scheme in 2013,505
to improve the energy
efficiency of buildings and support other climate
protection measures. The share of renewable energy
sources in total energy consumption rose to
8.79 %506
in 2010.
The share of eco-industry goods in total exports has
risen to 0.75 %, reaching the EU average by 2010,
suggesting that it is gaining strength.507
4.17.3 Export performance
Exports continue to perform relatively well
compared to the EU average. Exports grew by 2 %
500 From 43.0 % to 40.0 %. 501
http://ec.europa.eu/education/news/rethinking/sw377_en.p
df. 502 2.7 % as opposed to 8.9 % EU average
http://ec.europa.eu/education/news/rethinking/sw377_en.p
df. 503 Eurostat. 504 Typically co-financed via the EU Structural Funds. 505 NRP 2013. 506 According to data provided by the Hungarian
Government. 507 Though most probably this strengthening can be attributed
to the increased investments (largely via Structural Funds) and to the activities of upgrading the environmental
infrastructure, such as water supply and treatment, and
waste management, etc.
Country chapter: Hungary
194
in 2013 and imports decreased by 0.1 %.508
Exports
of transport vehicles have grown dynamically,
though this was offset by a contraction in the
volume of ICT products exported, which fell by
20 %.509
High-tech exports continue to play an
important role at 22.3 % of total exports. Other
export sectors performing well are pharmaceuticals
and professional equipment manufacturing.
Three quarters of exports go to the EU-27. The
biggest trading partner is Germany, followed by
neighbouring countries. The Government has
started to formulate a strategy called “Opening to
the east”, to expand exports to Russia, China, India,
and the Middle East.510
Policies511
are in place to
support indirect exports to improve the capabilities
of SMEs to integrate into the supply chain of
multinationals in the country.
4.17.4 Business environment and public
administration
Improving the business environment has been an
important priority in recent years, but measures
adopted so far do not yet seem to have brought
about the expected positive impact. According to
the World Bank’s Doing Business 2013512
, Hungary
ranks 54th
, down from 51st in 2012. It also ranks
lower than last year in the World Economic Forum
Global Competitiveness Index (60th
from 48th
).513
The most problematic areas are policy instability,
tax burden (both financial and administrative),
access to finance, inefficient bureaucracy and
corruption. Such an unfavourable business climate
makes Hungary difficult for both domestic and
foreign firms, and hampers investment and
competition.
To reduce the administrative burden on businesses,
the government has started its programme514
of
508 For a detailed economic forecast see the Commission
services' 2013 spring forecast at:
http://ec.europa.eu/economy_finance/eu/forecasts/2013_s
pring/hu_en.pdf 509 Hungarian Central Statistical Office
http://www.ksh.hu/docs/hun/xftp/gyor/kul/kul21212.pdf. 510 Part of this strategy is the setting up so-called merchant
houses in the target countries, which would help SMEs
with competitive products to access these markets. 511 http://www.hita.hu/Supplier/register. 512 http://www.doingbusiness.org/~/media/GIAWB/Doing%
20Business/Documents/Annual-Reports/English/DB13-
Chapters/Country tables.pdf. 513 http://www3.weforum.org/docs/WEF_Global
CompetitivenessReport_2012-13.pdf. 514 http://egyszeruallam.kormany.hu/.
cutting red tape. This includes 114 measures
intended to save a total of about HUF 500 billion515
by 2012. However, implementation has been
somewhat delayed.516
By mid-2013, 93 measures
had been adopted.517
Some important measures,
such as e-government, have been postponed beyond
2014.
The most notable achievements so far are
shortening the time it takes for administrative
procedures from 30 days to 21, and simplification
of the procedure for construction licences.
Adequate monitoring arrangements518
will be
needed, together with an evaluation to check if
reforms have achieved the targeted savings, and
whether further measures are desirable.
Services such as trade, tourism, finance and other
business services account for most of the service
sector. However, Hungary continues to place
restrictions on various sectors,519
leading to further
deterioration of the business climate.
The potential for growth and jobs in the digital
economy has not been fully seized. Rolling out of
broadband infrastructure is proceeding well, but its
take-up remains below the EU average.520
The
motorway network is well developed, but the
secondary and lower level road network is quickly
deteriorating and would require maintenance.521
For
railways, the density of the network is above the
EU average, but the infrastructure and rolling stock
is obsolete, increasing travel time, energy
consumption and pollution. Commuting times to
county capitals by public transport are long, making
the mobility of employees more difficult.522
Similarly, the sub-optimal conditions for navigation
on the Danube remain a barrier to competitiveness.
515 Approximately 1.7 % of GDP. 516 Government Decision 1416/2012 (X.1.). 517 NRP 2013. 518 No information on the work of the committee that
oversees the Cutting red tape programme is publicly
available. 519 After the plaza-stop law, the pharmaceutical retail sector,
meal voucher providers, waste treatment, the financial
sector and the tobacco retail sector were also subject to extensive government regulation in 2012.
520 61 % of households and 87 % of business have broadband
connection as opposed to the EU average (67 % and 87 %, respectively).
521 A high share of roads is unable to take 115kn axle loads;
the proportion of public roads in poor condition was 30 % in 2000, but over 50 % in 2010; State Audit Office, 2012
522 Hungarian Partnership Agreement for the 2014–20
programming period, final draft, July 2013.

Country chapter: Hungary
195
Public administration
Reforms have also been implemented to improve
the efficiency of public administration, which has
been unfavourably assessed in international
comparisons.523
There were reforms in 2012524
that
had a positive impact on the business
environment.525
A simplification programme526
was
launched in 2011 to streamline administrative
procedures and make them more accessible to
citizens. Most of the measures will come into effect
in 2013, so it is too early to assess their impact.
The administrative structure of the country has been
reorganised so that previously autonomous sector-
specific bodies have been integrated into county
government offices, with the aim of cost-cutting. At
territorial527
level, the Government has set up
district offices. The system of the so-called
“government windows” (one-stop shops)528
will be
extended in 2013 to district offices.
Tax regulation in Hungary is identified as one of
the main problems. For businesses, the total tax
compliance time529
is estimated at 277 hours per
year. On average, firms need to make 12 tax
payments a year.530
To reduce the tax compliance
burden, a simplified electronic payment system has
been made legally possible, but it has not yet been
implemented. The corporate tax system has become
more complex, as it consists of six different rates.
Two new simplified tax schemes were introduced
in 2013531
for SMEs, on top of an already existing
simplified business tax scheme.532
Although the ordinary corporate income tax rates
are relatively low (10 % and 19 %), a significant
part of the tax burden on the corporate sector is
523 IMD World Competitiveness Yearbook 2011. 524 The implementation of which is aided by the OECD-
Hungary Strategic Partnership for Public Administration
Reform launched in 2012, see Government Decree
62/2012. (IV. 2.). 525 The administrative burden related to the identification of
companies and their representatives in administrative
procedures has been removed. 526 Government Decision 1304/2011 (IX.2.). 527 An organisational entity between local and county levels. 528 Set up as of 1st January 2011. 529 The time it takes to prepare, file and pay corporate income
tax, value added tax and social contributions. 530 World Bank Doing Business 2013. 531 Lump-sum Tax of Self-employed (“kata”) and Small
Business Tax (“kiva”). 532 Simplified Entrepreneurial tax (“eva”) introduced in 2003.
linked to specific additional taxes.533
The temporary
surtaxes introduced in 2010 for the telecom, energy
and financial sectors were increased534
and became
permanent while further surtaxes were introduced
on the utility service providers. As these sectors
provide crucial services to businesses, the negative
impact of additional taxes is felt right across the
economy.
The fight against corruption suffers from a lack of
transparency and perceived fairness.535
The
implementation of measures announced in the
corruption prevention programme for 2012-14536
is
underway, with some delays. In early 2013, the
government adopted a law on the integrity
management system. A new whistle-blower
regulation is being drafted and should be adopted in
2013. The Hungarian Accounting Office (ASZ) is
implementing an integrity programme that aims to
map risks of corruption in public administration.537
Besides the complexity of administrative
procedures, the uncertain regulatory framework, in
which rules change frequently at short notice, is
also an often evoked problem. In some cases, public
consultations do not leave adequate time for
stakeholders to contribute.538
There should be more
effort to make improvements in this area, especially
to optimise impact assessments, fitness checks and
monitoring arrangements.
An independent and efficient justice system is an
important structural component of an attractive
business environment and ensures the effective and
timely enforcement of contracts and competition
rules. Hungary ranks low on the perceived
independence of the judiciary: 21st out of 27 in the
533 European Commission: Macroeconomic Imbalances,
Hungary 2013, Occasional Papers 137 534 The design of these surtaxes have been reviewed over
time. 535 Hungary ranks in the bottom third out of 144 countries for
several indicators, e.g. diversion of public funds, wasteful government spending, favouritism in decision-making of
government officials
http://www3.weforum.org/docs/WEF_GlobalCompetitivenessReport_2012-13.pdf.
536 Government decree 1104/2012(IV.6.) on anticorruption
measures and the adoption of the Programme on Preventing Corruption in Public Administration.
537 http://integritas.asz.hu/uploads/files/2012-
es%20eredm%C3%A9nyek_%C3%B6sszefoglal%C3%B3.pdf The report shows no improvement in 2012 in
comparison to the previous year. 538 http://www.transparency.org/country#HUN.

Country chapter: Hungary
196
EU, and 72nd out of 144 in the world.539
Internal
developments in 2012 and 2013 have further
increased concerns about the independence of the
judiciary in Hungary540
and the 2013 country
specific recommendations included the requirement
to strengthen further the judiciary.
4.17.5 Finance and investment
The stock of foreign direct investment is about
EUR 78.5 billion,541
one of the highest per capita
figures in the region. Most of this is in service and
processing industries.542
Of all foreign direct
investment in Hungary, 77 % is from EU countries,
about 30 % of it from Germany. However, the
negative business climate is likely to hamper
further investment.
Bank lending contracted in 2012 due to the
recession. SMEs were particularly badly affected,
as banks seemed more risk averse and unwilling to
lend. However, as demand for investment has also
been lower, the relative weight of these factors is
difficult to estimate. The additional tax on the
financial sector has further restricted banks’
willingness to lend.
The Szechenyi Card Programme, which provides
credit card-based low-interest loans for micro- to
medium-sized enterprises, continues to be an
important tool in the financing of SMEs. Over
218 000 cards had been issued by 2012. New types
of loan were introduced in 2012 to help SMEs
participate in EU tenders.543
In December 2012, the
government decided to continue investing in this
programme.
After its 2011 reform, the Jeremie544
structural fund
scheme was successful in disbursing funding for
SMEs. However, quick absorption means that
Hungary is running out of EU funds for SME
539 World Economic Forum; based on data collected in 2011
– 2012 (reflected in the 2013 EU Justice Scoreboard) 540 See speech by President Barroso at the European
Parliament Plenary of 2 July 2013 on the situation of
fundamental rights.: standards and practices in Hungary,
http://europa.eu/rapid/press-release_SPEECH-13-608_en.htm.
541 According to Hungarian National Bank’s 2012 Q4 data. 542 Automotive, machinery, computer and electrical
equipment manufacturing. 543 (Széchenyi Önerő Kiegészítő Hitel and Széchenyi
Támogatást Megelőlegező Hitel, i.e. own contribution supplementary loan and pre-grant advancement loan).
544 Joint European Resources for Micro- to Medium-Sized
Enterprises.
support, limiting the availability of resources for
2013.545
4.17.6 Conclusions
On most indicators of competitiveness, Hungary’s
position is medium to low, though export
performance is very good. The ongoing reform of
public administration still has a lot of potential to
improve the business environment, preferably
complemented by a stable, predictable regulatory
framework, without artificial distortions or
corruption.
The business environment continues to be a major
obstacle to improving competitiveness. The
worsening business environment acts as a drag on
the growth performance, creating a rapidly-
changing regulatory framework, distortive effects
of government policies eroding trust, lack of
predictability and a low rate of investment.
In addition, there are concerns on the compatibility
of some Hungarian legislation with EU legislation
and with the principles of the rule of law, creating
further uncertainty.546
In the longer run, the need to switch to a more
knowledge-intensive economy poses major
challenges. A favourable research and innovation
policy is essential if growth-oriented innovative
enterprises are to emerge. To maintain and improve
international competitiveness, it would be helpful if
Hungary could address problems in labour
productivity and skills levels. Timely, effective and
consistent implementation of reforms is crucial to
improve competitiveness in the long term.
545 This happened in particular through the Combined
Microcredit Programme, which provides loans combined
with non-refundable grants to very small enterprises. New
calls focusing on seed financing have been published under JEREMIE’s Venture Capital Programme.
546 Assessment of the 2013 national reform programme and
convergence programme for Hungary, SWD(2013) 367.
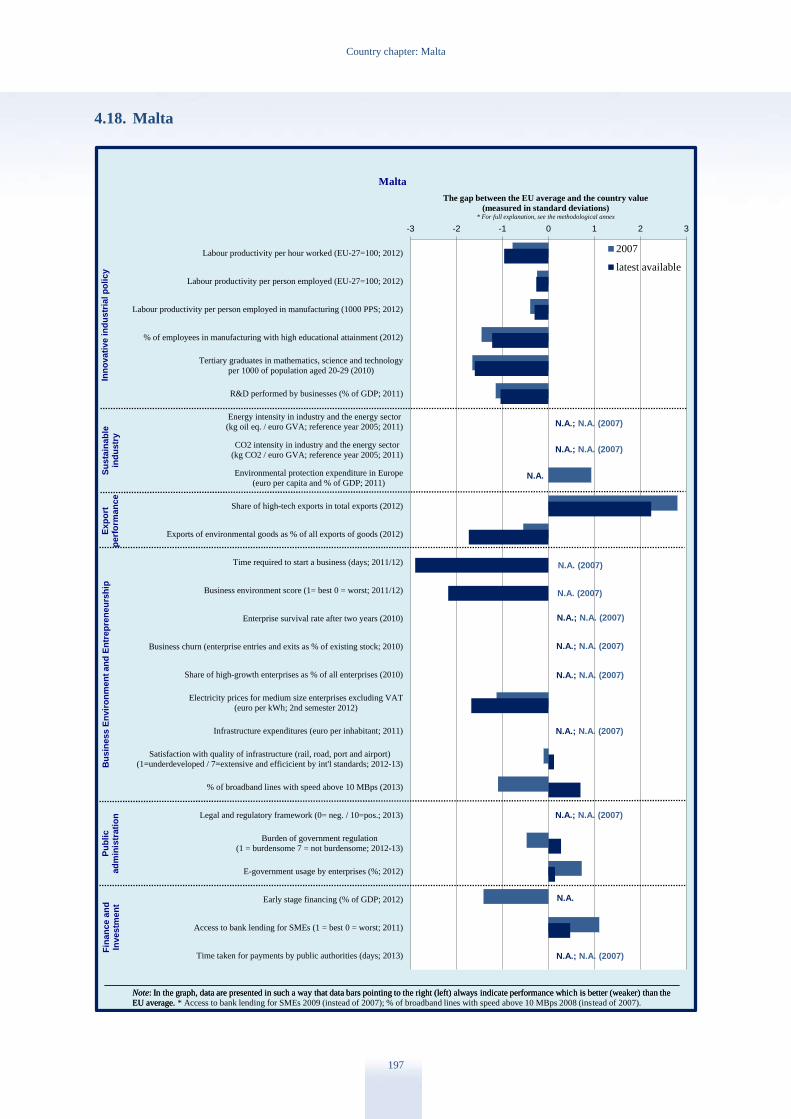
Country chapter: Malta
197
4.18. Malta
-3 -2 -1 0 1 2 3
Labour productivity per hour worked (EU-27=100; 2012)
Labour productivity per person employed (EU-27=100; 2012)
Labour productivity per person employed in manufacturing (1000 PPS; 2012)
% of employees in manufacturing with high educational attainment (2012)
Tertiary graduates in mathematics, science and technology
per 1000 of population aged 20-29 (2010)
R&D performed by businesses (% of GDP; 2011)
Energy intensity in industry and the energy sector
(kg oil eq. / euro GVA; reference year 2005; 2011)
CO2 intensity in industry and the energy sector
(kg CO2 / euro GVA; reference year 2005; 2011)
Environmental protection expenditure in Europe
(euro per capita and % of GDP; 2011)
Share of high-tech exports in total exports (2012)
Exports of environmental goods as % of all exports of goods (2012)
Time required to start a business (days; 2011/12)
Business environment score (1= best 0 = worst; 2011/12)
Enterprise survival rate after two years (2010)
Business churn (enterprise entries and exits as % of existing stock; 2010)
Share of high-growth enterprises as % of all enterprises (2010)
Electricity prices for medium size enterprises excluding VAT
(euro per kWh; 2nd semester 2012)
Infrastructure expenditures (euro per inhabitant; 2011)
Satisfaction with quality of infrastructure (rail, road, port and airport)
(1=underdeveloped / 7=extensive and efficicient by int'l standards; 2012-13)
% of broadband lines with speed above 10 MBps (2013)
Legal and regulatory framework (0= neg. / 10=pos.; 2013)
Burden of government regulation
(1 = burdensome 7 = not burdensome; 2012-13)
E-government usage by enterprises (%; 2012)
Early stage financing (% of GDP; 2012)
Access to bank lending for SMEs (1 = best 0 = worst; 2011)
Time taken for payments by public authorities (days; 2013)
The gap between the EU average and the country value
(measured in standard deviations)* For full explanation, see the methodological annex
Malta
2007
latest available
Note: In the graph, data are presented in such a way that data bars pointing to the right (left) always indicate performance which is better (weaker) than the
EU average.
Inn
ov
ati
ve in
du
str
ial p
oli
cy
Su
sta
ina
ble
ind
ustr
yB
us
iness E
nv
iro
nm
en
t an
d E
ntr
ep
ren
eu
rsh
ipF
ina
nce a
nd
Investm
en
t
Note: In the graph, data are presented in such a way that data bars pointing to the right (left) always indicate performance which is better (weaker) than the
EU average. * Access to bank lending for SMEs 2009 (instead of 2007); % of broadband lines with speed above 10 MBps 2008 (instead of 2007).
Ex
po
rtp
erf
orm
an
ce
Pu
bli
cad
min
istr
ati
on
N.A.
N.A.; N.A. (2007)
N.A.; N.A. (2007)
N.A.
N.A.; N.A. (2007)
N.A.; N.A. (2007)
N.A.; N.A. (2007)
N.A. (2007)
N.A. (2007)
N.A.; N.A. (2007)
N.A.; N.A. (2007)
N.A.; N.A. (2007)
Country chapter: Malta
198
4.18.1 Introduction
Manufacturing in Malta has a share of value added
of only about 13 %, but some sectors have seen
significant growth, in particular pharmaceuticals
(part of ‘chemical products’ in the graph) and the
aviation maintenance industry (‘transport’ or
‘electrical equipment’, and ‘other manufacturing’ in
the graph). The service economy has traditionally
been dominated by tourism (10 % of GDP at direct
impact level, rising to about a quarter of GDP when
the full impact is estimated). Tourism has grown
further recently, but the service economy is now
significantly more diversified as other activities are
also growing. These include financial
intermediation, business services (including
auditing and legal services), entertainment (film
production), online gaming and other computer-
related activities. Export market shares in a number
of these emerging industries are also increasing.
Productivity growth has lagged behind the euro-
area average over the past decade and has been
notably weaker than in the other “new” Member
States.
The Labour Party came to power at the beginning
of March, but the new government has retained the
great majority of measures to improve
competitiveness set out in the November 2012
budget speech.
4.18.2 Innovation, skills and
sustainability
Innovation
The government has stated its aim of building a
knowledge-based economy with research and
innovation at its core. The modest level of
expenditure on research and development (0.73 %
of GDP in 2011, up from 0.67 % in 2010) has
already exceeded Malta’s Europe 2020 target,
thanks to increases in higher education and business
spending (of which more than 80 % is spent by
foreign-owned companies). Central government
provides funding for public research, higher
education institutions and private sector research.
However, businesses largely fund their own
research and cross-funding between sectors is
limited. Nevertheless, the draft National Strategic
Plan for Research and Innovation 2011-20
maintains a strong business orientation in the areas
of ICT, health and biotechnology, energy and
environmental technologies, as well as value-added
manufacturing and services.
In 2012, the Malta Council for Science and
Technology launched a commercialisation
programme to assist research-oriented and
innovative firms. In particular, in the innovation
field, progress has been made with several
initiatives, such as Business First, a one-stop-shop
for businesses, and the R&D&I Trust Fund set up
by the University of Malta. In addition, a number of
industry sectors have been identified for future
specialisation, e.g. digital gaming, for which a
strategy was published in early 2012 to lay the
foundations for the development of a gaming
industry in Malta.
Further alignment of the draft National Strategic
Plan for Research and Innovation 2011-20 with the
requirements for a ‘research and innovation strategy
for smart specialisation’ is important if the progress
achieved so far is to be maintained. It would also
help if research and innovation capacity in support
of smart specialisation and links between
knowledge institutions and business were to be
strengthened. With ERDF funding, Malta
Enterprise is currently building a life-science
centre. It is envisaged that, when completed, this
project will contribute towards encouraging further
interaction between scientific centres, public
institutions (including hospitals), self-government
authorities and business.
Skills
The challenge of skills mismatches is related to the
high (though steadily falling) rate of early school
leaving, coupled with a modest level of tertiary
education attainment. According to some business
representatives, skill shortages are emerging and
coming more into focus in areas such as the green
economy and other areas in which expertise is
required, e.g. specialised printing and design. The
need to raise skill levels is set to become even more
relevant in the future as the employment pattern is
forecast to be characterised by a strong increase in
medium and high qualification jobs and a marked
decline in low qualification ones.547
547 By the year 2020. European Centre for the Development
of Vocational Training (Cedefop).

Country chapter: Malta
199
To address this skills challenge, significant
investments are being made to improve the
vocational training facilities and systems available.
A sector skills committee will be established by the
second quarter of 2013, composed of
representatives from industry, education and
training institutions, mainly to advise the National
Commission for Further and Higher Education on
matters relating to validation processes, while
assisting in the development of the corresponding
occupational standards wherever skills shortages
are identified. A number of schemes and initiatives
complement the policy development under way.
Sustainability
Malta is heavily dependent on imported oil, but the
energy sector is to undergo important, efficiency-
boosting changes in the near future. First, the
electricity interconnector with Sicily is expected to
become operational in 2014. This represents an
important change to the energy system, since Malta
will no longer be isolated in terms of energy supply.
Supply will therefore be more secure and electricity
generation is likely to become cheaper. Secondly,
the increased capacity will mean that the inefficient
Marsa power plant can be switched off, which will
improve overall efficiency.
The connection to the continental European grid
will also raise the capacity to integrate energy
produced from renewable sources, thereby helping
to reduce the overwhelming use of heavy oil in
electricity generation. Finally, the government is
taking steps towards switching to cheaper and more
environment-friendly liquefied natural gas (LNG)
as its main energy source, which would also
contribute towards lowering generation costs and
cutting carbon emissions. The available options
need to be carefully assessed to ensure that security
of energy supply is strengthened and the associated
costs are minimised.
There is room for improving efficiency and cutting
emissions in the transport sector. Road transport
accounts for about half of total emissions coming
from non-ETS sectors, and a strong increase in
emissions is likely by 2020. The number and
increasing age of cars, an inefficient road network
and the preference for driving have resulted in
significant road congestion problems and increased
carbon emissions. Therefore, measures to upgrade
the road network and to improve the effectiveness
of public transport will be important in ensuring
sustainable internal mobility. Measures introduced
to make the car fleet more sustainable, such as a
minimum level of biofuels in petroleum fuel in all
transport modes, a differentiated car registration
tax, a car scrapping scheme and continued financial
support to electric and hybrid vehicles are relevant
towards diversification and decreased dependency
on fuel imports.
4.18.3 Export performance
International trade remained a key driver of
economic growth in Malta in 2012, despite the
challenging environment, because of a favourable
composition of exports and geographical
orientation of trade, in particular in goods. During
2012, exports of goods and services increased by
5.2 % in real terms. Malta stands out in the EU for
the proportion of its exports accounted for by high-
tech products. The ‘strengthening market entry and
internationalisation’ incentive, available until the
end of 2017, aims to facilitate access to foreign
markets by allowing enterprises to explore growth
opportunities, establish business contacts and
consolidate existing markets. This scheme provides
part-financing for companies to participate in
international trade events, fairs and trade missions.
Towards the end of April 2013, Malta Enterprise
launched a continuous tracer study among
participants of its internationalisation events to
determine what the benefits have been.
4.18.4 Business environment and public
administration
Business environment
The Malta Small Business Act (SBA), which
emphasises the importance of small and medium-
sized enterprises (SMEs) for growth and
competitiveness, has been in place since October
2011. Stakeholders are looking forward to the
introduction of the ‘SME test’ (gauging the
potential impact on enterprise of all new proposed
legislation) and the two-month standstill period
between publication and entry into force of new
legislation. The SBA implementation unit has been
holding meetings with ministries and other entities
to explain its role and improve their understanding
regarding application of the SME test.

Country chapter: Malta
200
The Enterprise Consultative Council holds a regular
dialogue with the regulatory authorities and
business organisations in order to bring about
greater synergy for a better business environment,
particularly for SMEs. It meets every quarter and
has been quite effective as a channel for
communication with the business community,
mainly through its representative organisations. The
Council has held a number of meetings on specific
issues (family businesses, youth entrepreneurship,
the specific situation of the business sector in Gozo,
etc.). Some business representatives are calling for
it to be more sharply focused on the interests of
enterprise.
The Business First one-stop-shop run by Malta
Enterprise since the beginning of 2012 has been
quite successful. It is based on a network of service-
level agreements with a number of government
entities. In 2012, there were 25 cases registered
among these service providers of the prescribed
deadline not being kept, i.e. 5 % of the total number
of applications. It takes approximately two days to
register a company with the Malta Financial
Services Authority and, unlike the World Bank in
its Doing Business survey, Malta Enterprise
estimates that starting up a company in Malta takes
no longer than 13 working days, especially as
registration processes can run in parallel.
As regards business support infrastructure, works
being carried out by the authorities on existing
industrial estates will be continued with EU and
national funding. The 2013 budget provides for a
number of new projects, in the following areas in
particular: digital games hubs, an aviation centre, a
maritime park, a business centre in Gozo, and a
facility with flexible use of ICT in the incubation
centre in Kordin.
In 2012, the Department of Contracts sought to
achieve full transition from conventional to
electronic procurement. A number of initiatives
have been taken since March 2012 and the
complete transition to electronic procurement for
tenders published by the Department has been set
for 2013. All new tenders issued by the Department
since January 2013 have been e-tenders. The
transition to e-procurement and the parallel
streamlining of procedures are aimed at
encouraging greater participation from European
SMEs.
The Late Payments Directive was transposed into
Maltese law in August 2012, with ancillary training
activities ensuring its informed application. The
government has conducted three information
seminars on the topic for government departments,
public entities and local councils. In addition, the
Malta Association of Credit Management organised
an information session for the business community.
With regard to the simplification of administrative
procedures for accessing EU programmes, Malta
Enterprise is currently providing an exploratory
award scheme providing cash grants to help SMEs
develop project proposals for the Commission’s
Seventh Framework Programme (FP7) and the
Competitiveness and Innovation Programme (CIP).
The Employment and Training Corporation has
taken steps since 2011 to simplify the
administrative process for the training aid
framework and the employment aid programme.
The guidelines of the Entrepreneurship through
Education Scheme have been revised so as to
ensure better organisation. 28 projects were
identified for funding in 2013. The government has
indicated in the 2013 budget that it will be
preparing an entrepreneurship action plan ranging
from primary to tertiary levels. A Youth
Entrepreneurship Act to help prepare young people
for the world of business has also been signalled for
2013, along with the corresponding Youth
Entrepreneurship Scheme announced this year.
Although electricity prices in Malta are far above
the EU average, which dampens the
competitiveness of enterprises, positive changes are
expected in the medium term (see above) as a result
of the shift from heavy-oil to gas-fired energy
production based on a public-private partnership for
building new generation facilities, which will bring
cost savings of around 25 % to industry in 2015.
The electricity interconnector is also expected to be
completed in 2014, while the Ministry for Energy
and the Conservation of Water will promote
independent investment in the energy infrastructure
in the form of new facilities, favouring the import,
storage and processing of LNG.
Despite positive scores for Malta’s judicial system
on some points, the EU’s Justice Scoreboard
highlighted serious shortcomings in efficiency due
to the time needed to resolve non-criminal (in

Country chapter: Malta
201
particular, civil and commercial) cases, which is
among the longest in the EU.548
The courts’ backlog
has been increasing, with a high number of pending
cases at first instance and a seemingly low
clearance rate, indicating that more cases arise each
year than are being resolved. In March 2013, very
soon after taking office, the new government
announced the launch of a judicial reform. A
commission appointed to look into the judicial
system and recommend reforms as necessary is due
to submit a review report within three months, to be
followed by a consultation process. It is envisaged
that implementation of the main reforms suggested
by the report and the consultation process will start
by the end of 2013.
According to the 2012-13 Global Competitiveness
Report, users of Malta’s transport system are
reasonably satisfied overall with both the efficiency
and the extent of air, sea and land transport
infrastructures.
The last 15 years have seen heavy investment of
national funds, backed by EU co-financing
(Cohesion Fund, ERDF and TEN-T financial
instrument), which has directly resulted in a
substantial improvement in port and airport
infrastructure and visibly improved safety and
operational efficiency — relatively high levels of
satisfaction are now being expressed by users of
airport and seaport infrastructures.
Significant investment has also taken place in
upgrading road infrastructure, particularly under the
EU Cohesion Fund and ERDF following Malta’s
EU accession. By the end of the current operational
programme (2007-13), some 62 % of Malta’s roads
will have been upgraded in terms of quality, safety
and capacity. The last three years have seen
unprecedented levels of upgrading work at key road
traffic bottlenecks. Naturally, opinion surveys of
road users carried out in Malta in 2011-12 (such as
the poll in the 2012-13 Global Competitiveness
Report) reflect lower-than-expected levels of user
satisfaction given the network-wide impact that
major road works were then having on traffic
congestion and journey times. However, it is to be
expected that satisfaction rates for the road
infrastructure will match those for ports and
548 See EU Justice Scoreboard 2013 available at
http://ec.europa.eu/justice/effective-
justice/files/justice_scoreboard_communication_en.pdf.
airports once all work on the major TEN-T links
has been completed.
4.18.5 Finance and Investment
SMEs are benefiting from an increasing range of
access to finance and the 2013 budget contains a
number of measures to ensure that this remains the
case. The Microinvest scheme will be extended for
a further two years following the overwhelming
success of measures particularly relating to new job
creation. The Jeremie scheme (a first-loss portfolio
guarantee instrument for loans between EUR 25 000
and EUR 500 000) will also be extended.
A new tax incentive scheme will be launched to
encourage established enterprises to invest seed
capital in new undertakings. Another new scheme,
for the benefit of clusters and networks and local
small businesses, will be aimed at supporting
setting-up costs such as property rent and the
development of e-tools. The Investment Aid Tax
Credits Scheme supports firms in investment and
job creation and is mainly focused on attracting
new investment projects and promoting the
expansion or diversification of existing enterprises.
This scheme has been extended to hotels, with
support capped at 15 % of the amount invested.
4.18.6 Conclusions
Malta continues to withstand the impact of the
international crisis relatively well. Given the large
size of its financial sector and the high exposure of
domestic banks to the real estate sector, maintaining
financial stability remains crucial.In terms of
structural reforms, medium- and long-term
sustainable growth will depend on the successful
move to a more knowledge-based economy, further
improving skills and the utilisation of human
capital, and adopting more ambitious R&D targets
(the current ones have already been exceeded).
Investment plans for improving the energy supply
are encouraging as they promise to reduce
dependency, improve cost competitiveness and
boost efficiency. Policy measures to address the
challenges involved in meeting climate and
renewable energy targets need to be maintained and
stepped up. Efforts to implement the Small
Business Act with the support of the business
community should be maintained.

Country chapter: Netherlands
202
4.19. Netherlands
-3 -2 -1 0 1 2 3
Labour productivity per hour worked (EU-27=100; 2012)
Labour productivity per person employed (EU-27=100; 2012)
Labour productivity per person employed in manufacturing (1000 PPS; 2012)
% of employees in manufacturing with high educational attainment (2012)
Tertiary graduates in mathematics, science and technology
per 1000 of population aged 20-29 (2011)
R&D performed by businesses (% of GDP; 2011)
Energy intensity in industry and the energy sector
(kg oil eq. / euro GVA; reference year 2005; 2011)
CO2 intensity in industry and the energy sector
(kg CO2 / euro GVA; reference year 2005; 2011)
Environmental protection expenditure in Europe
(euro per capita and % of GDP; 2011)
Share of high-tech exports in total exports (2012)
Exports of environmental goods as % of all exports of goods (2012)
Time required to start a business (days; 2011/12)
Business environment score (1= best 0 = worst; 2011/12)
Enterprise survival rate after two years (2010)
Business churn (enterprise entries and exits as % of existing stock; 2010)
Share of high-growth enterprises as % of all enterprises (2010)
Electricity prices for medium size enterprises excluding VAT
(euro per kWh; 2nd semester 2012)
Infrastructure expenditures (euro per inhabitant; 2011)
Satisfaction with quality of infrastructure (rail, road, port and airport)
(1=underdeveloped / 7=extensive and efficicient by int'l standards; 2012-13)
% of broadband lines with speed above 10 MBps (2013)
Legal and regulatory framework (0= neg. / 10=pos.; 2013)
Burden of government regulation
(1 = burdensome 7 = not burdensome; 2012-13)
E-government usage by enterprises (%; 2012)
Early stage financing (% of GDP; 2012)
Access to bank lending for SMEs (1 = best 0 = worst; 2011)
Time taken for payments by public authorities (days; 2013)
The gap between the EU average and the country value
(measured in standard deviations)* For full explanation, see the methodological annex
Netherlands
2007
latest available
Note: In the graph, data are presented in such a way that data bars pointing to the right (left) always indicate performance which is better (weaker) than the
EU average.
Inn
ov
ati
ve in
du
str
ial p
oli
cy
Su
sta
ina
ble
ind
ustr
yB
us
iness E
nv
iro
nm
en
t an
d E
ntr
ep
ren
eu
rsh
ipF
ina
nce a
nd
Investm
en
t
Note: In the graph, data are presented in such a way that data bars pointing to the right (left) always indicate performance which is better (weaker) than the
EU average. * Access to bank lending for SMEs 2009 (instead of 2007); % of broadband lines with speed above 10 MBps 2008 (instead of 2007).
Ex
po
rtp
erf
orm
an
ce
Pu
bli
cad
min
istr
ati
on
N.A.
N.A.

Country chapter: Netherlands
203
Figure 4.17: Manufacturing sectors – Netherlands (2010)
Source: Eurostat
4.19.1 Introduction
The Netherlands is specialised in capital-intensive
manufacturing and medium-tech sectors such as
chemical products, refined petroleum, electronics
and machinery, transport equipment and foodstuffs.
Manufacturing contributes 12.9 % of the total value
added, which is slightly below the EU average
(15.3 %).549
The World Economic Forum’s Global
Competitiveness report ranks the Netherlands in
eighth place.550
The price and cost competitiveness
indicators are in line with euro area averages, and
with other industrialised countries. Labour
productivity per hour worked is about 30
percentage points above the EU average and about
17 percentage points above the euro area
average.551
Overall, Dutch industrial
competitiveness is good, but maintaining and
improving its competitive position in the future will
be a challenge.
549 Eurostat data for 2012. 550 http://www.weforum.org/issues/global-competitiveness. 551 Eurostat data for 2012.
4.19.2 Innovation, skills and
sustainability
Innovation
The Innovation Union Scoreboard 2013552
puts the
Netherlands in the group of ‘innovation followers’
with above-average performance. It has further
improved its ranking (from seventh to fifth place)
and is now the first in its group. It is further
catching up as regards non-R&D innovation
expenditure and the innovation performance of
SMEs.
The government has reaffirmed its intention to
reach an R&D intensity of 2.5 % of GDP by 2020.
However, in 2011 the R&D intensity was only
slightly above the EU average of 2.03 %, in
particular due to relatively low private R&D
expenditure, which declined on average 1.8 %
between 2000 and 2011, indicating a shift towards
less research-oriented activities.553
The economy
has a particularly large service sector, which is
generally less R&D intensive, and manufacturing is
geared towards medium-tech products with less
R&D. Moreover, a significant proportion of private
552 Innovation Union Scoreboard 2013, European
Commission, http://ec.europa.eu/enterprise/policies/innovation.
553 Research and Innovation performance – Innovation Union
progress at country level 2013.
Food, beverages and
tobacco
18.31%
Textiles, apparel and
leather
1.64%
Wood, paper and
printing
6.89%
Chemicals, pharma,
petroleum, minerals
and rubber 26.23%
Metals
12.85%
Electronics, electrics
and machinery
20.36%
Cars and transport
5.68%
Other
8.05%
Country chapter: Netherlands
204
R&D expenditure is concentrated in a few large
multinational firms.
Stronger innovation performance and further
private R&D investments are important objectives
of the enterprise strategy called ‘to the top’,554
which is being implemented. The strategy’s ‘top
sector approach’555
addresses a weakness in the
Dutch innovation system by bringing researchers
closer to businesses and by putting businesses in the
driving seat when designing public-private
partnerships for innovation. In 2012, there were 19
‘top consortiums for knowledge and innovation’,
and they have started to implement the research
agendas set out in their innovation contracts.556
Stakeholders are closely involved in the process
and SME participation is given particular attention.
Several investment commitments were announced
in 2012. Ongoing reforms of higher education
should contribute to further improving the linkage
to the human capital and R&D needs of the top
sectors. So far, the strategy seems promising,
though it is still too early to assess the extent to
which it will be able to mobilise additional private
investments while preserving sufficient public
funding.557
Over the last few years, specific innovation
subsidies have been considerably reduced and
transformed into generic tax incentives.558
A R&D
tax incentive scheme,559
which allows for the
deduction of R&D wages for tax purposes, was
evaluated in 2012.560
The results of the evaluation
point to a positive impact in terms of mobilising
additional private R&D expenditure, while the
thresholds used had ensured a particular focus on
554 ‘To the top: towards a new enterprise policy‘
http://www.rijksoverheid.nl/documenten-en-
publicaties/rapporten/2011/09/13/naar-de-top-het-bedrijvenbeleid-in-actie-s.html.
555 ‘Investing in top sectors’
www.government.nl/issues/entrepreneurship-and-innovation/investing-in-top-sectors.
556 National Reform Programme 2013. 557 See also the Staff Working Document ‘Assessment of the
2013 national reform programme and stability programme
for the Netherlands’, http://ec.europa.eu/europe2020. 558 The most important instruments are the SME+ Innovation
Fund (‘Innovatiefonds MKB+’) and tax facilities, such as
the tax credit for R&D (‘WBSO’), the Research &
Development Allowance (‘RDA’) and the tax relief for innovation (‘Innovation box’).
559 WBSO: http://www.agentschapnl.nl/programmas-
regelingen/wbso-research-and-development-rd-tax-credit. 560 http://www.rijksoverheid.nl/documenten-en-
publicaties/rapporten/2012/04/02/hoofdrapport-evaluatie-
wbso-2006-2010.html.
SMEs. In 2013, the budget for the scheme is
EUR 735 million. Moreover, since 2012 the
revolving SME innovation fund has been providing
innovation loans to SMEs and mid-cap companies.
The total budget of the fund is EUR 500 million
until 2015.561
Skills
The proportion of tertiary graduates in science and
technology has long been below the EU average,
reflecting the service orientation of the economy.
However, skills shortages, especially in engineering
and technology-related professions, are becoming
an increasing concern and a potential barrier to
growth.
In response to these challenges, the government
recently announced its Techniekpact strategy,562
under which concrete measures for better adapting
the educational system and the labour market to the
changing requirements of the technology sector are
currently being developed. Effective
implementation of the strategy will be crucial to
preserving and enhancing the innovative capacity of
high-tech companies in the Netherlands.
Sustainability
The 2012 coalition agreement says that the
Netherlands strives to create a resource-efficient
and ultimately regenerative circular economy, but
there is a need to further clarify how this will be
achieved, including how SMEs can genuinely
improve their resource and energy efficiency. The
main sustainability initiatives of the current
government are (i) the ‘top sector approach’
activities regarding the energy sector, (ii) the
incentive scheme SDE+ for renewable energy
investments and (iii) ‘green deals’ for energy
efficiency and other environmental projects.
Environmental sustainability is now officially
mainstreamed in all ‘top sectors’ and is also taken
up by the cross-cutting theme of bio-economy. The
effectiveness of integrating environmental aspects
and resource efficiency into the top sector approach
still needs to be evaluated.
561 Innovatiefonds MKB+. 562 Nationaal Techniekpact 2020’
http://www.rijksoverheid.nl/documenten-en-
publicaties/convenanten/2013/05/13/nationaal-
techniekpact-2020.html.

Country chapter: Netherlands
205
The share of renewables in energy use rose from
3.8 % in 2010 to 4.3 % in 2011, bringing the
2011/2012 interim target of 4.7 % within reach.
Nevertheless, despite more ambitious policies to
promote renewables, including continuation of the
sustainable energy production scheme with a
budget of EUR 3 billion for 2013, the gap between
the Netherlands’ current renewable energy share
and the 2020 target is still one of the widest in the
EU.563
The ‘Green deals’ instrument is proving successful
in supporting local projects and collaboration
among stakeholders. Over 150 ‘Green deals’ have
been signed since 2011.564
The scheme has been
broadened beyond sustainable energy and energy-
saving projects.
The criteria for green public procurement were
revised in 2011 on the advice of MVO, the main
corporate social responsibility organisation. For the
sake of simplicity, the number of environmental
aspects for award criteria has been reduced and the
use of functional requirements instead of detailed
technical requirements is encouraged. By 2015, all
public authorities aim to purchase products that are
100 % sustainable.
4.19.3 Export performance
Overall, the Netherlands accounts for 9.1 % of EU
exports 565
and has one of the highest current
account surpluses as a percentage of GDP in the
euro area.566
The goods balance is increasingly
driven by re-exports, due to the country’s role as a
major transit hub for global trade and supply
chains.
However, as the value added of re-exports is
relatively low, initiatives to maintain a competitive
edge across exporting industries, and to safeguard
the value added derived from the total export
volume, are important. Exports with high domestic
value added include agricultural products,
foodstuffs, chemical products, rubber and plastics,
563 See also the Staff Working Document ‘Assessment of the
2013 national reform programme and stability programme
for the Netherlands’, http://ec.europa.eu/europe2020. 564 http://www.rijksoverheid.nl/duurzame-economie/green-
deal. 565 Eurostat, 2012. 566 European Commission, In-depth review for the
Netherlands, 10.4.2013
http://ec.europa.eu/economy_finance.
machinery and transport equipment. Nearly 80 % of
goods exports go to the EU. Compared to the EU
average, Dutch SMEs tend to be more active
internationally.567
Since growth in many export
markets tends to be slow, especially in products like
foodstuffs, venturing into new markets will be
necessary if global export market shares are to be
maintained. The government supports the
internationalisation of businesses, especially SMEs,
through various measures, including spreading
information about key markets and customs
procedures, but also through export credit insurance
instruments. An internet portal568
provides
enterprises with useful information on how to
expand their business abroad.
4.19.4 Business environment and public
administration
Business environment
According to the World Bank’s Doing Business
2013, the Netherlands has a favourable business
environment that encourages the competitiveness of
enterprises, although there may still be scope for
further improvement in certain areas.569
Overall, the
Netherlands has maintained a very good network
infrastructure and a high level of service quality in
public transport, without overtly high levels of
subsidies.
The Netherlands has a tradition of efficient public
services and light administrative burden for
businesses. In April 2013 a new programme was
launched, focusing on a more qualitative approach
towards reducing all regulatory burdens.570
By
2017, a reduction of EUR 2.5 billion should be
achieved in the regulatory burden on businesses,
professionals and citizens, through the introduction
of new regulations linked to the revision or
scrapping of existing rules.
Tax compliance and tax administration are more
efficient than the EU average. It takes businesses
considerably less time to pay taxes and the
567 SBA Fact Sheets, European Commission,
http://ec.europa.eu/enterprise/policies/sme. 568 http://www.antwoordvoorbedrijven.nl and since 2013 the
new portal www.ondernemersplein.nl. 569 The Netherlands is ranked 31st out of 185 for doing
business by the World Bank. 570 www.rijksoverheid.nl/onderwerpen/regeldruk ‘Goed
geregeld, een verantwoorde vermindering van regeldruk
2012-17‘, 24 April 2013.

Country chapter: Netherlands
206
associated administrative costs are below the EU
average. New reforms have recently been
announced to further simplify wage taxes.
Moreover, a number of measures have been
introduced to promote the use of ICT, such as the
application of Standard Business Reporting in the
tax domain. The introduction of an electronic
business file for exchanging data with authorities is
expected to further contribute to increasing
efficiency and reducing the regulatory burden.
Since 2012, the procedures for starting a business
have been further simplified and the minimum
paid-in capital requirements abolished. The time
required to start a business is one of the shortest in
the EU.
Several important services are included in the ‘top
sector’ approach and therefore receive significant
policy attention (e.g. energy, transport/logistics and
creative industries). Competition in electricity
supply seems to work well and changing supplier is
relatively easy, unbundling has worked well and the
provision of information by suppliers to consumers
is supervised by the competition authority.571
Regardless of this, the number of consumers
switching supplier remains low.
Public administration
The perceived quality of public services is
relatively high.572
The use of tools to improve
public administration (such as e-government,
performance and service orientation) is more
widespread than average in the EU. By 2017 all
enterprises will have the right to communicate and
to do business with the authorities online.
In general, enterprises benefit from relatively swift
payment by public authorities and public
procurement processes seem to be quite efficient
and transparent. In 2011, the Dutch government
formally introduced an ex-ante framework to
systematically assess substantial impacts of new
policy and legislation. In 2013, an impact
assessment commission chaired by the Prime
Minister was introduced and the mandate of the
Dutch advisory board on regulatory burden will be
571 Autoriteit Consument & Markt. 572 European Commission, ’Excellence in public
administration for competitiveness in EU Member States’
http://ec.europa.eu/enterprise/policies/industrial-
competitiveness/monitoring-member-states.
extended until 2017. On implementation in practice,
however, there may be room for further
improvement.
The Chamber of Commerce and the innovation
agency Syntens are currently being merged and
restructured, which may lead to reduced local or
regional presence but should enhance electronic
information and services provided through a digital
one-stop shop for entrepreneurs.573
Moreover,
mandatory membership fees for enterprises have
been abolished and the Chamber of Commerce is
now directly financed by the state budget.
Alongside this streamlining it will be important to
ensure continued high quality and availability of
key business support services.
A large part of the planned state budget
consolidation should be achieved through reducing
the size of the public sector and modernising public
administration. Although this reduction entails
considerable potential efficiency gains, it is subject
to implementation risks, including preserving the
high quality of public services. In addition, the
government is planning to decentralise a large
number of responsibilities to municipalities. It
remains to be seen whether these efficiency gains
can be fully realised within the envisaged time
frames.
4.19.5 Finance and investment
Access to finance is not as good as in some other
euro area countries. The impact of the crisis on the
economy and the balance sheet composition of
banks arguably have been the factors behind the
relatively tight credit standards.574
Although there
has been improvement since last year, interest
margins and the rate of rejected loans remain higher
than the EU averages.
The authorities have taken a number of measures to
support access to finance for SMEs, for example by
continuing existing guarantee schemes, by
increasing available budgets and by increasing the
maximum ceiling for micro-credits.575
In order to
573 http://www.antwoordvoorbedrijven.nl and since 2013 the
new portal www.ondernemersplein.nl. 574 European Commission, In-depth review for the
Netherlands, 10.4.2013 http://ec.europa.eu/economy_finance.
575 For example, the budget for the guarantee scheme
‘Borgstellingskrediet MKB’ has been increased from
Country chapter: Netherlands
207
further improve access to risk capital, the
government cooperates closely with the European
Investment Fund and the European Investment
Bank in developing additional financial instruments
for SMEs. For example, in 2012 a fund-of-funds
was created that had an initial capital of EUR 150
million, which will provide later stage funding for
fast-growing innovative or high-tech businesses.576
The ‘Netherlands Foreign Investment Agency’577
provides investors with a wide range of information
and support services. The country attracts foreign
direct investment in particular from Asia and North
America. The location, good infrastructure and
favourable business environment are important
factors, but also the tax system offers a number of
advantages that are particularly attractive for
multinational firms.578
4.19.6 Conclusions
Overall, the Netherlands ranks among the top
performers in many of the competitiveness
indicators of the Industrial Performance
Scoreboard. The business environment supports the
competitiveness of enterprises and there is a
tradition of efficient public services and low
administrative burden on businesses. Strengths
include in particular the favourable business
environment, the quality of institutions, the
education system and science base, the efficient
goods market as well as the technological readiness.
Despite the favourable framework conditions, the
country is likely to face challenges in maintaining
and improving its competitive position in the future.
While the Netherlands has managed to improve its
innovation performance in some areas, the
relatively low private R&D investments may
weaken its competitiveness in the future. Moreover,
skills shortages are emerging especially in
engineering and technology-related professions, a
situation which is becoming an increasing concern
and a potential barrier to growth.
EUR 750 million to EUR 1 billion while other guarantee schemes such as ‘Garantie Ondernemingsfinanciering’
and ‘Groeifaciliteit’ are also being continued. Moreover,
the maximum ceiling for micro-credits has been raised from EUR 50 000 in 2012 to EUR 150 000 in 2013.
576 http://www.eif.org. 577 http://www.nfia.nl. 578 See also the Staff Working Document ‘Assessment of the
2013 national reform programme and stability programme
for the Netherlands’, http://ec.europa.eu/europe2020.
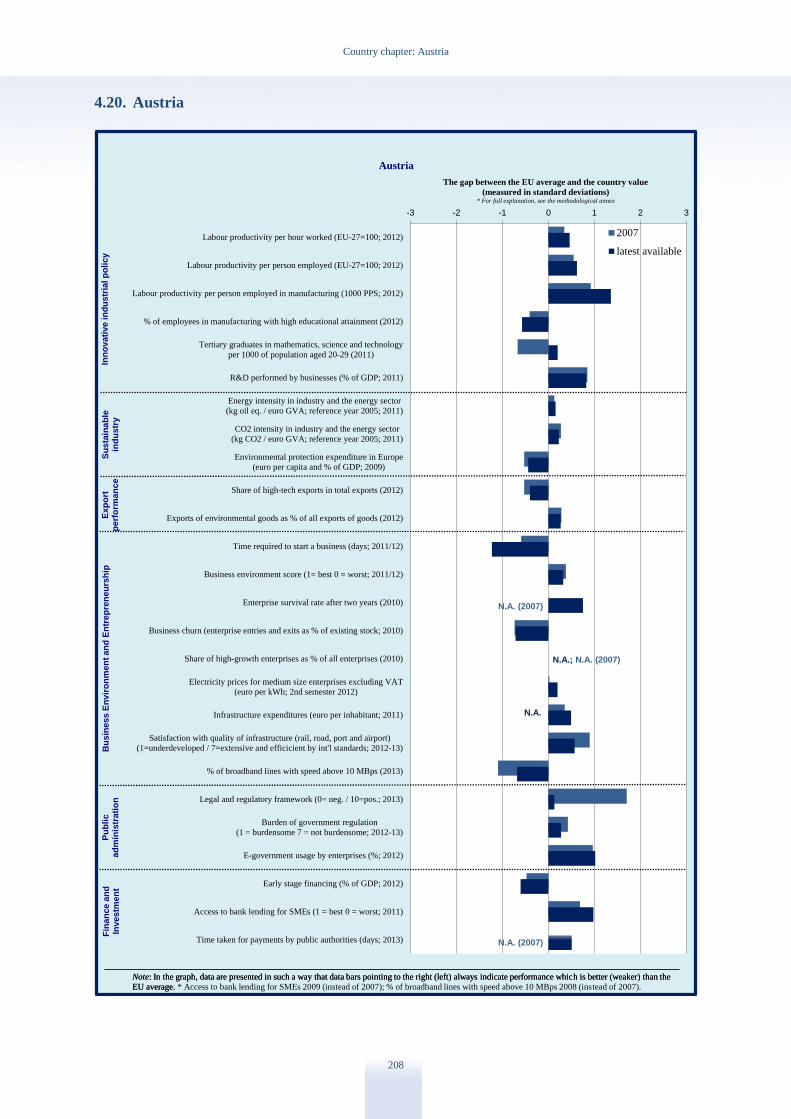
Country chapter: Austria
208
4.20. Austria
-3 -2 -1 0 1 2 3
Labour productivity per hour worked (EU-27=100; 2012)
Labour productivity per person employed (EU-27=100; 2012)
Labour productivity per person employed in manufacturing (1000 PPS; 2012)
% of employees in manufacturing with high educational attainment (2012)
Tertiary graduates in mathematics, science and technology
per 1000 of population aged 20-29 (2011)
R&D performed by businesses (% of GDP; 2011)
Energy intensity in industry and the energy sector
(kg oil eq. / euro GVA; reference year 2005; 2011)
CO2 intensity in industry and the energy sector
(kg CO2 / euro GVA; reference year 2005; 2011)
Environmental protection expenditure in Europe
(euro per capita and % of GDP; 2009)
Share of high-tech exports in total exports (2012)
Exports of environmental goods as % of all exports of goods (2012)
Time required to start a business (days; 2011/12)
Business environment score (1= best 0 = worst; 2011/12)
Enterprise survival rate after two years (2010)
Business churn (enterprise entries and exits as % of existing stock; 2010)
Share of high-growth enterprises as % of all enterprises (2010)
Electricity prices for medium size enterprises excluding VAT
(euro per kWh; 2nd semester 2012)
Infrastructure expenditures (euro per inhabitant; 2011)
Satisfaction with quality of infrastructure (rail, road, port and airport)
(1=underdeveloped / 7=extensive and efficicient by int'l standards; 2012-13)
% of broadband lines with speed above 10 MBps (2013)
Legal and regulatory framework (0= neg. / 10=pos.; 2013)
Burden of government regulation
(1 = burdensome 7 = not burdensome; 2012-13)
E-government usage by enterprises (%; 2012)
Early stage financing (% of GDP; 2012)
Access to bank lending for SMEs (1 = best 0 = worst; 2011)
Time taken for payments by public authorities (days; 2013)
The gap between the EU average and the country value
(measured in standard deviations)* For full explanation, see the methodological annex
Austria
2007
latest available
Note: In the graph, data are presented in such a way that data bars pointing to the right (left) always indicate performance which is better (weaker) than the
EU average.
Inn
ov
ati
ve in
du
str
ial p
oli
cy
Su
sta
ina
ble
ind
ustr
yB
us
iness E
nv
iro
nm
en
t an
d E
ntr
ep
ren
eu
rsh
ipF
ina
nce a
nd
Investm
en
t
Note: In the graph, data are presented in such a way that data bars pointing to the right (left) always indicate performance which is better (weaker) than the
EU average. * Access to bank lending for SMEs 2009 (instead of 2007); % of broadband lines with speed above 10 MBps 2008 (instead of 2007).
Ex
po
rtp
erf
orm
an
ce
Pu
bli
cad
min
istr
ati
on
N.A.; N.A. (2007)
N.A.
N.A. (2007)
N.A. (2007)

Country chapter: Austria
209
Figure 4.18: Manufacturing sectors – Austria (2010)
Note: No data available for sectors C12 (tobacco products) and C19 (coke and refined petroleum products)
Source: Eurostat
4.20.1 Introduction
Manufacturing contributes 18.2 % of total value
added, against an average of 15.3 % in the EU as a
whole. If construction is included, the share is over
25 %, also above the EU average. Productivity is
higher than the EU average regardless of the
indicator used (productivity per employee or per
hour worked; productivity in manufacturing); in
addition, productivity growth has been slightly
above the EU average recently. The relatively low
share of employees in manufacturing with tertiary
education does not seem to have had an impact on
this performance.
Austria is specialised in innovation-intensive
sectors such as machinery and, in exports, in
medium-innovation sectors (such as wood, basic
and fabricated metals), but also in sectors with low
innovation and educational attainment, such as
hotels and restaurants and auxiliary transport
activities. At the more detailed industry level, the
country is specialised in mainstream manufacturing
(manufacture of railway and rolling stock, electric
motors) and labour-intensive industries (builders’
carpentry and joinery, sawmilling, machine-tools).
Capital-intensive industries (man-made fibres)
generate considerable added value, and marketing-
driven industries (sports goods, beverages) are
prominent exporters.
Overall, competitiveness has been successfully
sustained in industries that are not markedly
knowledge-intensive, with sectoral upgrading in
terms of R&D and quality.
4.20.2 Innovation, skills and
sustainability
Innovation
In the Innovation Union Scoreboard 2013, Austria
is an innovation follower, with a developed
innovation system and an above-average innovation
performance. Its R&D intensity is higher than the
EU average. The overall investment in R&D grew
from 1.93 % in 2000 to 2.74 % in 2011. Although
this growth was faster than in most other EU
countries, it represented a slight decrease from
2010. The share of the private sector was about
60 % of the total, including a significant portion of
R&D investment coming from abroad.
Two-thirds of all enterprises are innovative,
specialising in sectors demanding high and low-
intermediate labour skills. After several years of
improvement from a low base, the number of
science and technology graduates was higher than
the EU average for the first time in 2011 (16.1 % vs.
14.2 %).
Food, beverages and
tobacco
10.44%
Textiles, apparel and
leather
2.19%
Wood, paper and
printing
10.40%
Chemicals, pharma,
petroleum, minerals
and rubber 17.55%
Metals
16.90%
Electronics, electrics
and machinery
25.21%
Cars and transport
7.29%
Other
8.84%

Country chapter: Austria
210
To boost businesses’ R&D expenditure, the
government increased the tax bonus on such
investments in 2011 from 8 % to 10 %, with an
estimated annual impact of over EUR 80 million.
This incentive is particularly important for the
sizeable investments coming from abroad and for
companies with high R&D investment relative to
their turnover. These are often SMEs that are
outsourcing research and innovation activities.
Another measure that is working well is an
innovation voucher scheme for SMEs.
There has been a decline in the private sector share
of R&D expenditure, from 49 % in 2007 to 44 % in
2012, and in this context the relative
underdevelopment of the venture capital market as
a source of growth capital has also attracted
attention.
Guidance on innovation-friendly public
procurement was adopted by the government in
September 2012, and a pilot project for pre-
commercial procurement in the transport sector is
ongoing.
An ICT strategy is under discussion following a
public consultation in early 2013 launched by the
Competence Centre for the Internet Society. The
focus is on mobility, healthcare, education and
security.
The innovation system suffers from a complex
division of competences between several ministries
and a number of public and semi-public agencies
and bodies. A high-level inter-ministerial task force
for research, technology and innovation was
established in 2011 to coordinate the activities of
government bodies, discuss reform projects and
consult stakeholders.
The strategy document from March 2011
‘Becoming an Innovation Leader’ outlined a series
of challenges to the innovation system, such as
strengthening links with the education system,
increasing the share of tertiary graduates,
promoting high-quality research infrastructure and
fundamental research, and using public
procurement to promote innovation. The strategy
addressed all major challenges and formulated
feasible objectives. Effective implementation,
strong prioritisation of research and innovation, and
streamlining of the governance structure will be
crucial to achieving higher outputs from the
considerable research and innovation investment.
Skills
Notwithstanding Austria’s high productivity, a
shortage of skilled workers and researchers is a risk
in the longer term. To overcome the effects of an
aging society and a more skills-intensive economy,
improved performance of the education and training
system would be warranted. The untapped skills
potential of citizens with an migrant background,
and early streaming in the school system contribute
to Austria’s workforce being under-utilised579
and
current efforts do not seem to be sufficient.580
The
Red-white-red card, a system for managing
demand-led labour migration, has made it possible
to fill some gaps in bottleneck sectors, though its
overall impact so far remains limited (only 2800
work permits in 19 months). Increasing enrolment
in higher education means that universities need to
overcome financial and organisational limitations to
increase the relatively low completion rates.
Sustainability
The energy and carbon intensity of Austrian
industry has improved over the last decade, and
both are below the EU averages. While industries
falling under the emissions trading scheme will
reduce CO2 emissions by 21 % by 2020, Austria is
aiming at a 16 % reduction for the other sectors.
The key policy document for addressing this and
other energy challenges is the national energy
strategy of 2010, with three pillars concerned with
increasing energy efficiency, energy security and
the share of renewables; the latter with an ambitious
target of 34 % by 2020.
The strategy outlines a mix of cross-cutting and
sector-specific regulatory, financial and information
measures. About half of the 42 measures have
already been or are being implemented. Two of the
funding measures appear particularly successful:
579 See also the Commission staff working document on the
assessment of the National Reform Programme and
stability programme on both challenges and on-going
reform measures in the education system. 580 The efforts include the introduction of the "Neue
Mittelschule" (lower secondary school); a Lifelong
Learning Strategy (2012); strengthened counselling services; and efforts to facilitate the recognition of
diplomas and skills in particular of the foreign-born
population.
Country chapter: Austria
211
the ‘greening of industries’, supporting sustainable
management measures in enterprises, with funding
of some EUR 90 million in 2011; and an improved
and extended instrument for thermal insulation of
residential (70 %) and industrial (30 %) buildings,
with a planned annual budget of EUR 100 million
up to 2016. In 2012, almost 16 000 projects (15 300
residential and 600 industrial buildings) with a total
investment volume of EUR 650 million received
funding. A key measure for boosting the share of
renewables is the ‘Green electricity act’ that entered
into force in July 2012. Austria is on track to
achieve its renewables target for 2020.
Since October 2010 an action plan for green public
procurement has been in place and in operation at
all administrative levels. Among other features, it
strengthens the use of ‘social’ criteria. The plan
establishes 16 groups of procured goods and
services with different criteria that have been fully
applied since May 2011, including in electricity, for
new contracts and for 70 % of all contracts.
Several environmental tax measures (increased
mineral oil tax; air ticket tax; and car registration
tax reform) have entered into force recently and are
expected to substantially reduce CO2 emissions.
Incentives from the car registration tax have helped
to reduce emissions: new cars below 120g CO2/km
have 32 % of the market. The airline ticket tax of
2011 has been reduced for short and medium-
distance flights because of competitiveness
concerns.
An implementation plan to boost electro-mobility
was adopted in June 2012. It contains measures to
promote Austrian technological know-how and
export potential in the field, as well as
infrastructure and awareness-raising measures to
increase the use of electric vehicles.
Austria adopted, in 2010, a plan on primary raw
materials and, in 2012, a resource efficiency action
plan, including secondary resources. The focus in
implementing the resource efficiency plan is on
improving data collection and monitoring tools on
resource use. One of the implementation challenges
is that land-use planning is a Land competence. The
Länder have to integrate the mineral resources plan
into their bodies of legislation.
4.20.3 Export performance
While Austria’s share of exports in GDP is clearly
above the EU average, the shares of high-tech and
green exports are slightly below it. Export intensity
grew substantially, from 35 % in 1995 to 57 % in
2011. The main export destinations are Germany
(by far the largest), Italy, the US, Switzerland and
France, followed by central and eastern European
neighbours and the UK; all EU countries together
account for about 70 % of exports.
While flows to European countries have been
mostly stagnating, those to Asia grew by 2 per cent
in 2012. Main export goods are machines and
automotive, manufactured goods, chemical
products and food products. With more than 24
million international visitors in 2012, tourism
contributed significantly to the balance of
payments, with a net contribution of EUR 6.8
billion.
Export promotion is run jointly and successfully by
the Ministry of Economy and the Chamber of
Commerce. A key tool is the ‘go-international’
initiative managed by the Chamber. It comprises
services like information, assistance and advice to
enterprises, and financial support for such things as
market entry costs and events, trade fairs and
missions. Measures are organised in five clusters
that focus on assistance to SMEs, development of
niche markets, exports in services, FDI and
communication.
4.20.4 Business environment and
infrastructure
Austria has a favourable business environment and
a competitive economy. In a continuing effort to
make it easier to run a business, it has an
administrative burden reduction programme. The
most significant measures belong to the second
phase of the one-stop e-government portal for
businesses Unternehmensserviceportal (estimated
reduction of EUR 200 million; see also below), the
recent introduction of e-invoicing (making them
legally equivalent to paper invoices; with an
estimated reduction potential of up to EUR 400
million) and the ‘SME initiative’, including
measures in trade law (e.g. establishment of a new
central trade register). Provided that these
reductions will materialise as expected, the EUR 1
Country chapter: Austria
212
billion reduction target set for 2012 will be met,
albeit with some delay.
While procedures for setting up a single-person
company are relatively light, there is room for
further improving start-up conditions for other legal
forms, such as limited liability companies.581
A
reform has been under discussion for several years,
and a proposal was forwarded to Parliament in May
2013. It proposes a reduction in the required
minimum capital and in the related costs for
notarial certification. The minimum corporate tax
would decrease proportionately, and the
announcement requirement would be abolished.
There is further room for promoting competition
and improving choice for businesses and consumers
in professional services, in particular pharmacies
and some medical professions (e.g. optometrists).
In particular, the possibilities of setting up an
interdisciplinary firm, including notaries and
lawyers, remain more restrictive than in many other
Member States. Such services from a one-stop shop
could offer substantial efficiency gains and reduce
transaction costs for professional and private
clients. Demand for them was confirmed by a
survey conducted by the Chamber of Commerce
among businesses and their associations in 2009.
In some network services and industries there is
room for further market opening. The relevant
performance indicators and assessment of ongoing
reforms were assessed recently by the
Commission.582
Austria’s overall public administration
performance, as assessed by the World Bank’s
government effectiveness indicator, is well above
the EU average. Perceived quality of public
services, including quality of the civil service and
policy implementation in Austria, is high.
E-government, impact assessment, performance and
service orientation, and accountability are used
more widely to modernise public administration
than in the EU on average. There is comprehensive
provision of business-related e-government
solutions, where Austria is well above the EU
average. On the other hand, modern human
581 World Bank ‘Doing Business’ survey 2013. 582 Commission Staff Working Document ‘Assessment of the
2013 national reform programme and stability programme
for Austria’ 29.5.2013, SWD(2013) 370 final.
resources management tools — like performance-
related rather than seniority-based pay or measures
to increase the internal flexibility of the civil
service— are used less than in the EU on average.
The composite public procurement index indicates
some scope for improvement concerning the time
needed, and especially the cost of taking part.
Whereas the EU average cost of taking part in a
tendering procedure amounts to 0.19 % of domestic
GDP per capita, the equivalent figure in Austria is
0.26 %. Payment delays on the part of public
authorities are less problematic than at the EU
average, amounting to 44 compared to 66 days.
The time needed by businesses to comply with tax
obligations is lower than the EU average (170 hours
vs. 193 for a benchmark model company), as is the
number of payments to be made (12 vs. 17 in the
EU on average). A widely used internet portal for
paying taxes has existed for some time, but will be
integrated in the e-government business service
portal.
Austrian states receive the lowest proportion of
total tax revenues among the federal states in
Europe.583
The share of local government revenues
(12.0 %) is slightly above the EU-27 average (10.8
%). The 2009 increase in tax shares of lower levels
of government is due to an increased share in
revenues agreed as part of the financial equalisation
procedure, replacing former transfers to lower
levels of government.584
While there have been no recent initiatives for a
major institutional reform to change the distribution
of competences between the national and regional
levels with a view to better aligned management of
public spending and revenues, there are examples
of more limited reforms. A comprehensive reform
of the system of administrative courts is being
implemented and will enter into force as planned in
2014. It will streamline the system to no more than
two instances (nine courts of first instance at
regional level; two at national level) with a view to
583 10 % as against more than 20 % in Belgium, Germany
and Spain. 584 European Commission: Taxation Trends in the European
Union 2013 (May 2013), http://ec.europa.eu/taxation_customs/resources/documents
/taxation/gen_info/economic_analysis/tax_structures/2013
/report.pdf

Country chapter: Austria
213
speeding up procedures. This will replace some 120
specific administrations.
Construction law is a Land competence585
and
remains a difficult area for businesses. In order to
lighten the burden, the approval procedures for
construction permits for plants586
are coordinated,
e.g. for constructing iron and steel production
plants. The powers of the federal competition
authority (BWB) have been increased.
Austrian administration offers a broad and
increasing range of e-government solutions to
businesses, thus boosting efficiency. Since May
2012, the e-government one-stop-shop business
service portal (USP) has been offering extended
functions based on a single sign-on for the most
important administrative procedures at federal
level, e.g. tax declarations (FinanzOnline), e-
invoicing to federal public authorities, management
of a virtual company data file, and data exchange
with social insurance bodies. One focus of the next
phase, planned for 2014, is the avoidance of
multiple declarations, something which also
contributes to burden reduction. Other key
advantages for businesses include reduced paper
use and partly direct interface between the USP and
companies’ internal systems. The reduction in
administrative costs is estimated at up to EUR 300
million, depending on the services provided.
An amendment to the Austrian e-government act
introduced an obligation for public authorities to
query public registers to verify the accuracy of data
used in official procedures before asking citizens or
enterprises to provide additional documents.
In January 2013 Austria launched an impact
assessment system based on an IT tool that guides
users through the assessment of different types of
impacts (budgetary, administrative burdens, SMEs,
gender equality, consumer protection, environment,
etc.). To back the implementation of the system
there is training for civil servants; a handbook;
monitoring by the federal chancellery; and annual
reporting. All this has introduced both an
organisational and a cultural challenge. However,
one drawback is that the main focus of the analysis
is on the envisaged proposal and not on comparing
alternative options.
585 ‘Länderzuständigkeit’. 586 ‘Betriebsanlagegenehmigung’.
4.20.5 Finance and investment
In most aspects of access to finance, Austria fares
better than the EU average. The relatively
diversified and stable banking system provides
sufficient debt financing for SMEs in the current
market environment. In the context of broader
diversification of financing sources, the country
will have to step up the development of alternatives
to bank lending if it is to ensure sufficient access to
finance in the long run.
Relative weaknesses persist as regards access to
and supply of equity finance. While some progress
has been made regarding business angels, the
relatively underdeveloped stock market for SMEs,
small- and mid-caps and the venture capital
industry do not generate sufficient alternatives for
raising capital, in particular for early-stage
financing. In particular, the size and depth of the
venture capital market remain well below the EU
average. Improving the legal framework for venture
capital thus remains a challenge for 2013, e.g. by
increasing the attractiveness and transparency of
legal forms used for (i) venture capital funds and
(ii) investment vehicles, including measures
mitigating possible tax disincentives. The recent
proposal to facilitate crowdfunding by making
limited changes to the legal framework (the
Kapitalmarktgesetz and, if appropriate, the
Bankwesengesetz) is an important step forward in
improving SME access to finance and would merit
implementation without delay. The government has
— notably via Austria Wirtschaftsservice GmbH
(aws) — implemented several new initiatives to
support young entrepreneurs and innovative SMEs.
The main purpose is to ensure stable access to
finance by mobilising private risk capital across the
different stages, up to and including the growth
phase.
4.20.6 Conclusions
Austria scores well in the overall competitiveness
of its economy; its labour productivity remains
above the EU average; and it has no major
bottlenecks to cope with in the short run. In the
context of a developed high-income country,
however, it faces structural weaknesses in some
areas, which may harm the long-term potential of
its economy.
Country chapter: Austria
214
The knowledge triangle (education, research and
innovation) is one of the areas in need of priority
action, as reflected in the ‘Becoming an Innovation
Leader’ strategy. Dedicated implementation of this
strategy will be instrumental in fully exploiting the
potential contribution of research and innovation to
the competitiveness of Austria’s economy, and thus
facilitating the structural shift towards more skill-
intensive, higher value-added activities. Other
measures that are important in this context are those
that increase the quantity and quality of the
available workforce and that optimise the utilisation
of available skills.
The favourable business environment could be
made even more attractive by streamlining start-up
procedures for limited liability companies and by
increasing the availability of non-banking
financing.
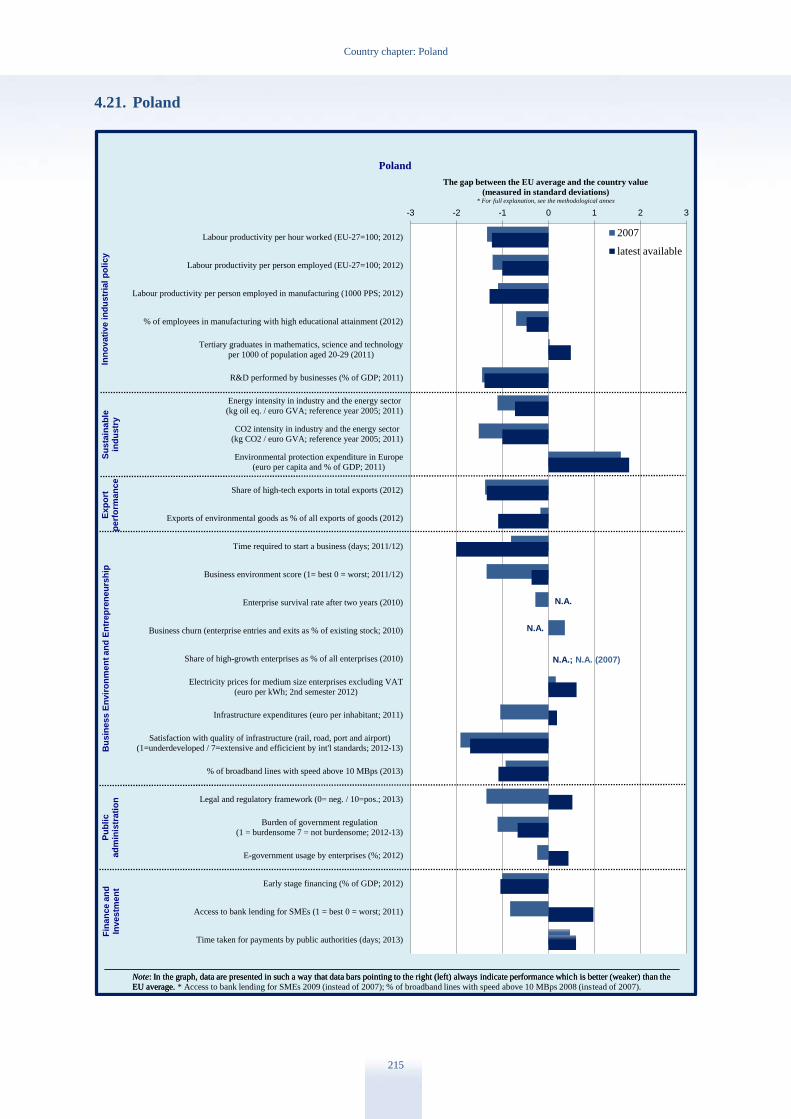
Country chapter: Poland
215
4.21. Poland
-3 -2 -1 0 1 2 3
Labour productivity per hour worked (EU-27=100; 2012)
Labour productivity per person employed (EU-27=100; 2012)
Labour productivity per person employed in manufacturing (1000 PPS; 2012)
% of employees in manufacturing with high educational attainment (2012)
Tertiary graduates in mathematics, science and technology
per 1000 of population aged 20-29 (2011)
R&D performed by businesses (% of GDP; 2011)
Energy intensity in industry and the energy sector
(kg oil eq. / euro GVA; reference year 2005; 2011)
CO2 intensity in industry and the energy sector
(kg CO2 / euro GVA; reference year 2005; 2011)
Environmental protection expenditure in Europe
(euro per capita and % of GDP; 2011)
Share of high-tech exports in total exports (2012)
Exports of environmental goods as % of all exports of goods (2012)
Time required to start a business (days; 2011/12)
Business environment score (1= best 0 = worst; 2011/12)
Enterprise survival rate after two years (2010)
Business churn (enterprise entries and exits as % of existing stock; 2010)
Share of high-growth enterprises as % of all enterprises (2010)
Electricity prices for medium size enterprises excluding VAT
(euro per kWh; 2nd semester 2012)
Infrastructure expenditures (euro per inhabitant; 2011)
Satisfaction with quality of infrastructure (rail, road, port and airport)
(1=underdeveloped / 7=extensive and efficicient by int'l standards; 2012-13)
% of broadband lines with speed above 10 MBps (2013)
Legal and regulatory framework (0= neg. / 10=pos.; 2013)
Burden of government regulation
(1 = burdensome 7 = not burdensome; 2012-13)
E-government usage by enterprises (%; 2012)
Early stage financing (% of GDP; 2012)
Access to bank lending for SMEs (1 = best 0 = worst; 2011)
Time taken for payments by public authorities (days; 2013)
The gap between the EU average and the country value
(measured in standard deviations)* For full explanation, see the methodological annex
Poland
2007
latest available
Note: In the graph, data are presented in such a way that data bars pointing to the right (left) always indicate performance which is better (weaker) than the
EU average.
Inn
ov
ati
ve in
du
str
ial p
oli
cy
Su
sta
ina
ble
ind
ustr
yB
us
iness E
nv
iro
nm
en
t an
d E
ntr
ep
ren
eu
rsh
ipF
ina
nce a
nd
Investm
en
t
Note: In the graph, data are presented in such a way that data bars pointing to the right (left) always indicate performance which is better (weaker) than the
EU average. * Access to bank lending for SMEs 2009 (instead of 2007); % of broadband lines with speed above 10 MBps 2008 (instead of 2007).
Ex
po
rtp
erf
orm
an
ce
Pu
bli
cad
min
istr
ati
on
N.A.; N.A. (2007)
N.A.
N.A.
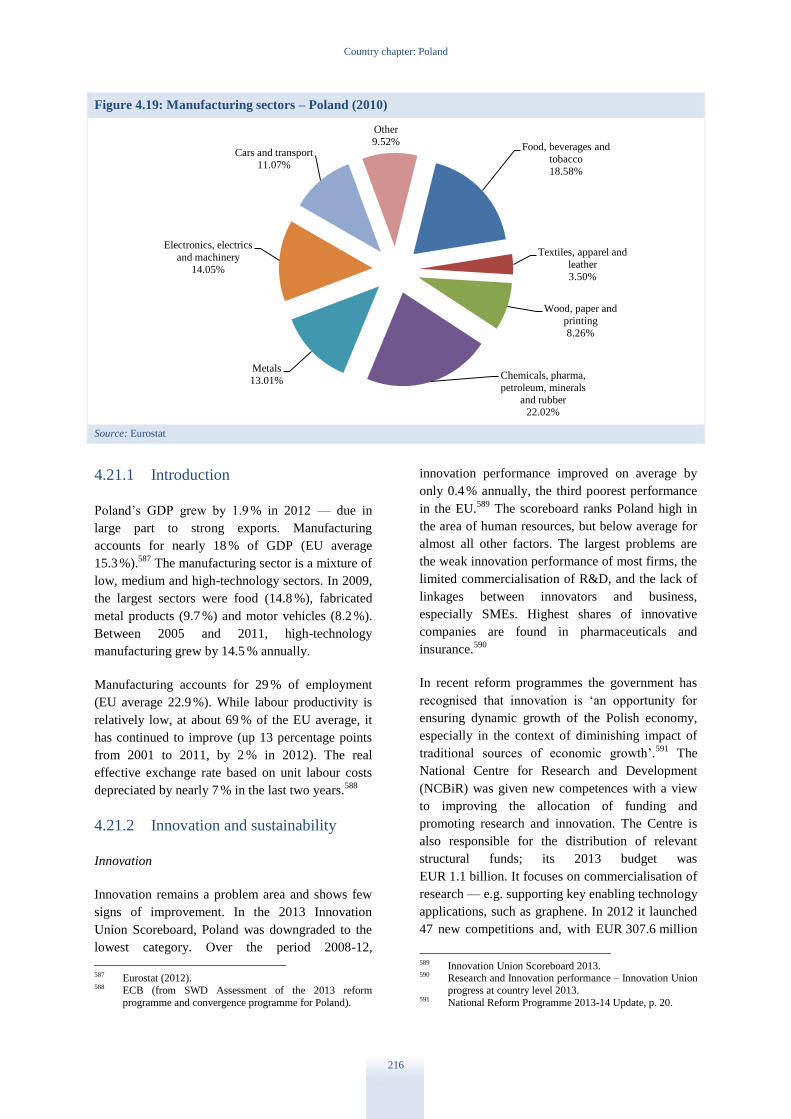
Country chapter: Poland
216
Figure 4.19: Manufacturing sectors – Poland (2010)
Source: Eurostat
4.21.1 Introduction
Poland’s GDP grew by 1.9 % in 2012 — due in
large part to strong exports. Manufacturing
accounts for nearly 18 % of GDP (EU average
15.3 %).587
The manufacturing sector is a mixture of
low, medium and high-technology sectors. In 2009,
the largest sectors were food (14.8 %), fabricated
metal products (9.7 %) and motor vehicles (8.2 %).
Between 2005 and 2011, high-technology
manufacturing grew by 14.5 % annually.
Manufacturing accounts for 29 % of employment
(EU average 22.9 %). While labour productivity is
relatively low, at about 69 % of the EU average, it
has continued to improve (up 13 percentage points
from 2001 to 2011, by 2 % in 2012). The real
effective exchange rate based on unit labour costs
depreciated by nearly 7 % in the last two years.588
4.21.2 Innovation and sustainability
Innovation
Innovation remains a problem area and shows few
signs of improvement. In the 2013 Innovation
Union Scoreboard, Poland was downgraded to the
lowest category. Over the period 2008-12,
587 Eurostat (2012). 588 ECB (from SWD Assessment of the 2013 reform
programme and convergence programme for Poland).
innovation performance improved on average by
only 0.4 % annually, the third poorest performance
in the EU.589
The scoreboard ranks Poland high in
the area of human resources, but below average for
almost all other factors. The largest problems are
the weak innovation performance of most firms, the
limited commercialisation of R&D, and the lack of
linkages between innovators and business,
especially SMEs. Highest shares of innovative
companies are found in pharmaceuticals and
insurance.590
In recent reform programmes the government has
recognised that innovation is ‘an opportunity for
ensuring dynamic growth of the Polish economy,
especially in the context of diminishing impact of
traditional sources of economic growth’.591
The
National Centre for Research and Development
(NCBiR) was given new competences with a view
to improving the allocation of funding and
promoting research and innovation. The Centre is
also responsible for the distribution of relevant
structural funds; its 2013 budget was
EUR 1.1 billion. It focuses on commercialisation of
research — e.g. supporting key enabling technology
applications, such as graphene. In 2012 it launched
47 new competitions and, with EUR 307.6 million
589 Innovation Union Scoreboard 2013. 590 Research and Innovation performance – Innovation Union
progress at country level 2013. 591 National Reform Programme 2013-14 Update, p. 20.
Food, beverages and
tobacco
18.58%
Textiles, apparel and
leather
3.50%
Wood, paper and
printing
8.26%
Chemicals, pharma,
petroleum, minerals
and rubber 22.02%
Metals
13.01%
Electronics, electrics
and machinery
14.05%
Cars and transport
11.07%
Other
9.52%

Country chapter: Poland
217
of entrepreneur contributions, approved 1064
research projects592
— many in cooperation with
venture capital funds.593
In January 2013, the government adopted the
Strategy for Innovation and an Efficient Economy
2020, which reflects the strategic goals of the
European Union. Its implementation programme594
was subject to public consultation in February and
now awaits adoption. The programme focuses on
improving the regulatory and financial environment
to stimulate innovation.
While reforms are moving in the right direction,
R&D expenditure is low, at 0.77 % of GDP (EU
average 2.03 %). Business expenditure on R&D is
especially low — around 0.23 %, compared with
over 1 % for the EU.595
It has also stagnated,
reflecting both low R&D investments in the
technology sectors, and the structural change
towards less R&D intensive sectors.596
Given the
recent level of performance, reaching the 2020
target of 1.7 % will be difficult. In the near future
expenditure is expected to rise due to the impact of
the 2014-20 Structural Funds.
Recent reforms have targeted two major underlying
problems of innovation performance. First, there is
the reliance of firms on technology take-up rather
than innovation that stems from the long period of
catching up. Second, efforts have been made to
reduce risk aversion, as previous innovation
programmes favoured large, mature firms and low
and medium-technology industries, with
insufficient support for SMEs and innovative start-
ups.
Skills
In the long term, improved productivity and the
transition to a knowledge economy will depend on
the quality of education and skills. In terms of basic
skills, 15-year olds' performance in the 2009 PISA
outperform the EU average in maths and reading,
and improving in science. However, the ICT skills
are low in comparison with the EU average.
Tertiary education attainment in Poland is above
592 PwC Report, ordered by NCBR, 2013. 593 BRIdge VC pilot programme. 594 Programme for the Development of Enterprises. 595 Innovation Union Scoreboard 2013, Annex B. 596 Research and Innovation performance – Innovation Union
progress at country level 2013.
the EU average (39.1% in 2012 vs.35.7% EU
average),597
and in case of early school leaving,
Poland is one of the best EU performers with 5.7%
vs. 12.7% EU average). However, there is a skills
mismatch598
and not enough attention is being given
to the future skills needs of the economy such as
problem solving, critical thinking and teamwork,
which could be developed at early stages of
education. In response, the government has
implemented reforms to improve the provision of
technical and science studies, vocational training
and transversal skills.
The vocational training system was reformed in
2012, involving employers in curriculum design
and flexible exams. A successful pilot programme
of ‘procured studies’ was concluded in 2012,
offering incentives to students in the priority areas,
succeeding in making science and technology the
second most chosen field. Funding for the next
round of the programme has been increased.
To improve the quality of education, the
government has introduced grants disbursed on a
competitive basis to higher education institutions,
based on their quality.599
Further, co-financing is
available for universities for implementing internal
quality assurance systems. The government also
presented proposals of amendments to higher
education laws in 2012 to differentiate between
academic and vocational higher education
institutions and introduced dual studies linking
academic studies with practical training in
companies, a list of faculties that received a
negative opinion from accreditors will be published
so that potential students are better informed before
making their choice.
Sustainability
In sustainability, Poland lags behind EU
performance, but is catching up in some areas. In
others, though, reforms have been slow. According
to the report Energy Efficiency Trends in the EU,600
the reduction in energy intensity for final users in
2000-09 was highest in Poland, at almost 3 % per
annum (EU average 1.2 %). Despite this, energy
intensity in 2011 was still half as much again as the
597 Rethinking Education: Country Analysis (2012). 598 See section 4.5. 599 Top institutions achieve KNOW status (Leading National
Research Centres) — 6 were chosen in 2012. 600 OdysseeMure (2012) Energy Efficiency Trends in the EU.
Country chapter: Poland
218
EU average.601
Large reductions were achieved in
industry — these were due to both structural
changes and efficiency improvements. Poland
continues to rely heavily on coal, oil and gas in its
energy mix, while renewable sources account for
7.3 %.602
The absolute level of greenhouse gas
emissions has also continued to rise.
New policy instruments in this area include the
white certificates that seek to give incentives to
suppliers of electricity, heat and gas to achieve
energy savings, or face a penalty payable to a
sustainability fund. Also, Polskie Inwestycje is a
new investment fund providing co-financing for
large-scale, commercially viable energy generation
and infrastructure projects, planned to start
operating in 2013.
Sustainability reforms are proceeding slowly, which
has led to infringement procedures against Poland
for incomplete transposition of EU directives on
renewable energy, the internal energy market and
waste management. The reforms (some with drafts
dating back to 2011) are awaiting adoption as part
of an ‘energy three-pack’. These would contain
measures for reducing the regulatory burden and
reforming the approach to renewable energy
sources, together with provisions for smart grids
and a prosumer energy market.
The government is completing its long-term
Strategy on Energy Security and the Environment.
It includes measures on developing nuclear energy
(by utilising domestic sources of uranium and
domestic research and industry), developing shale
gas resources; better reutilisation of waste; and
improving the water intensity of industry (which is
three times the EU average).
In the long term, improvements to energy efficiency
and changes to the energy mix will be needed to
comply with the Energy Roadmap 2050. As the
effects of the emissions trading scheme become
evident, new incentives for improving energy
efficiency will arise. A national emissions auction
platform is planned to come into operation by the
end of 2013.
601 0.272 kg oil equivalent /euro GVA, c.f. 0.184 for the EU
weighted average. 602 Making the Internal Energy Market Work, Country
Report: Poland (2011).
4.21.3 Export performance
Exports account for 42.3 % of GDP, making Poland
a relatively open economy given its size.603
It is a
net importer, but the current account deficit
improved from 4.9 % in 2011 to 3.5 % in 2012.604
The EU accounts for a large majority of Polish
exports.
Despite depressed demand due to the crisis, exports
rose throughout 2012,605
driven by sustained
competitiveness gains, a floating currency and a
large labour pool. Exports consist mainly of
electromechanical products, chemicals, furniture
and foodstuffs, although Polish exporters are trying
to strengthen their operations in sectors such as
sustainable construction and biotechnology.
Polish exporters are supported by a number of
public institutions. The Ministry of the Economy
runs a network of sections within embassies and
consulates that provide information and operational
support for exporters and importers. Also, with co-
financing from the Innovative Economy
Operational Programme 2007-13, the ministry
operates a programme of brand promotion in target
markets, and runs a network of service centres
within Poland, providing high-quality information
services to prospective exporters and foreign
investors.
Financial support is also available in the form of
favourable loans to firms intending to enter foreign
markets. Further, financial and training support for
the internationalisation of SMEs is available from
the agency for enterprise development,606
and there
is a dedicated organisation for export credit
insurance.607
The GreenEvo programme offers
support for innovators and start-ups in the green
economy, providing easy access to existing
programmes and promoting innovation.
Exports are expected to benefit in the medium term
from a recovery in the European economy. In the
long term, however, a shift towards higher value-
added sectors is needed for continued good
performance.
603 databank.worldbank.org (2012). 604 Central Statistical Office GUS (2013) Prices, Trade,
www.stat.gov.pl/gus/ceny_handel_ENG_HTML.htm. 605 OECD.StatExtracts International Trade (2013). 606 The Polish Agency for Enterprise Development (PARP). 607 The Export Credit Insurance Corporation (KUKE).

Country chapter: Poland
219
4.21.4 Business environment and public
administration
Business environment
Problems in the business environment create on
obstacle to competitiveness improvements. The
World Bank’s ‘Doing Business’ 2013 report ranks
Poland 55th globally. However, in 2012-13 Poland
was the top reformer worldwide. In a longer
perspective Poland has, since 2005, been the top
reformer among OECD countries.
Poland has recently made major advances in
making it easier to register property, pay taxes,
enforce contracts and resolve insolvency. The time
needed to register a firm has been reduced: two new
procedures have been introduced, making possible
the online registration of sole proprietorship
businesses and limited liability companies. The
procedure for limited liability companies has been
criticised as it offers only restricted options, but the
sole proprietorship business procedure is used
widely by SMEs. A new bankruptcy law is being
drafted, and a codification commission is scheduled
to conclude the reworking of the construction code
in 2014. However, employment in SMEs has fallen
since 2009, and SMEs are below the EU average in
terms of technology and knowledge intensity.
In many indicators much improvement is needed,
including the tax compliance burden (World Bank
rank 114th), and streamlining procedures for
construction permits (rank 161th).
The deregulation of professional services was
initiated in 2012 by reducing regulatory barriers
affecting 230 professions, by reducing or removing
qualification requirements and reserves of
activities. Currently the reform has been split into
three sections. The first, covering around 50
professions, has been adopted. The second,
affecting a further 91 professions, has been
proposed by the government and is being debated in
the parliament.
Infrastructure poses further challenges. Despite
sizeable investment in the road network, transport
infrastructure remains deficient, but it is the ageing
railway system that is especially problematic, as it
never enjoyed more than low priority in the past.
Some minor reforms have now been undertaken. In
2012, the government replaced the management
board of the state railways, and a task force has
been established to monitor implementation of EU-
funded railway projects and identify obstacles to
development. The budget of the regulator has also
been increased. These developments have not,
however, produced results so far; clear political and
financial commitment from the government would
be needed. On road transport, progress has been
uneven across regions, with work concentrating on
large cities and the TEN-T network. Energy prices
are kept high by insufficient competition among
incumbent energy providers, and by the ageing
generation capacity.
In ICT infrastructure, Poland had the lowest
broadband coverage in the EU, both nationally and
for rural areas, in 2011. Only around 28 % of
citizens used online public services in 2011, but
92 % of businesses did so, a figure higher than the
EU average of 84 %.608
In December 2012, public
consultation terminated on the National Broadband
Plan, coordinating the development of ICT
networks, and envisaging full national coverage in
2014.
Public administration
Public administration remains cumbersome and
causes high costs for businesses. In the World Bank
Worldwide Governance Index, Poland scores high
on stability, accountability and regulatory quality,
but lower on the rule of law, government
effectiveness and corruption. Transparency
International ranks Poland 11th most corrupt
country in the EU. Business stakeholders have
noted some improvement, with more cooperative
ministries and more frequent consultations.609
As
regards the judiciary, the increasing average length
of proceedings in civil and commercial cases,
difficult contract enforcement, long insolvency
proceedings and low recovery rates are a source of
concern.
Although the low level of taxation provides
incentives for businesses to grow, the tax
administration is inefficient and complex. From the
business perspective, the tax compliance burden is
high due to the large number of payments and time
needed to comply with tax regulations. Additional
608 Digital Agenda for Europe, Progress by Country: Poland
(2013). 609 Fact-Finding Mission Report 2013.
Country chapter: Poland
220
costs are caused by the low thresholds for
compulsory VAT registration.
In 2012-13, reforms aimed at improving the
efficiency of public administration concentrated
mainly on the increased use of e-government,
including the removal of certified signature
conditions for e-taxes. The act on the
standardisation of application forms in
administrative procedures was adopted by the
government. Moreover, a legislative amendment to
the code of civil procedure made proceedings in
business cases simpler and less formal.
In February 2013, the government adopted the
Efficient State Strategy 2020, outlining a
framework for an open, accountable and efficient
governance model based on cooperation between
civil society and all levels of government.
4.21.5 Finance and investment
Access to finance is significantly easier in Poland
than in the EU on average. In terms of the legal and
administrative environment as measured by the
World Bank, Poland ranks second in the EU, and is
tied for fourth place worldwide. Further, due to the
favourable macroeconomic conditions, the financial
sector has remained profitable. Lending to the non-
financial sector grew by 1.2 % in 2012,610
and long-
term interest rates have continued to fall, to 3.93 %
in March 2013.611
However, to ensure that the situation stays
favourable, the government has taken action. The
national loan guarantee scheme had been criticised
for operating on a commercial basis only, with fees
too high to be attractive. In March 2013, a new
guarantee scheme, operating on de minimis rules,
came into operation. The Polish Growth Fund of
Funds, created in 2013 by the European Investment
Fund and the state bank, seeks to stimulate
investment in venture capital, private equity and
mezzanine funds. The role of the National Capital
Fund is evolving, with a greater focus on the start-
up phase of innovative SMEs. Also in 2012, the
authorities took steps to address credit risk in the
banking sector. Nevertheless, the lack of venture
capital creates a funding gap for private, innovative
610 ECB (from SWD Assessment of the 2013 reform
programme and convergence programme for Poland). 611 ECB.
SMEs at early stages of development. Foreign
direct investment remains an important source of
funding, with inflows exceeding USD 15 billion in
2011.612
4.21.6 Conclusions
Poland’s competitiveness is an interesting mix of
weak institutions and good performance. In 2011,
Poland was the country with the second-highest
proportion of rapidly growing young firms in the
EU — as many as 5 % of businesses were so
classified.613
However, the time period in question
(2008-11) makes the comparison especially
favourable. Exports have been a strong engine for
growth — aided by the flexible currency regime. In
the medium to long term, the weaknesses in
innovation, sustainability and business environment
are likely to limit growth and competitiveness
unless appropriate reforms are implemented.
The government’s National Development
Programme 2020 features nine specific strategies
for the necessary reforms and changes. So far,
though, the implementation of these reforms has
been slow and often delayed, and the reforms have
been watered down, especially in the area of
renewable sources of energy. On the other hand, the
law on deregulation of professional services and the
procedures for business registration online are steps
in the right direction.
If it is to achieve the goals of its Europe 2020
strategy, Poland needs to become a more
knowledge-based economy, which would require
significant progress in the areas of innovation,
sustainability and the business environment.
612 UNCTAD, World Investment Report 2012. 613 SME’s Access to Finance Survey 2011.
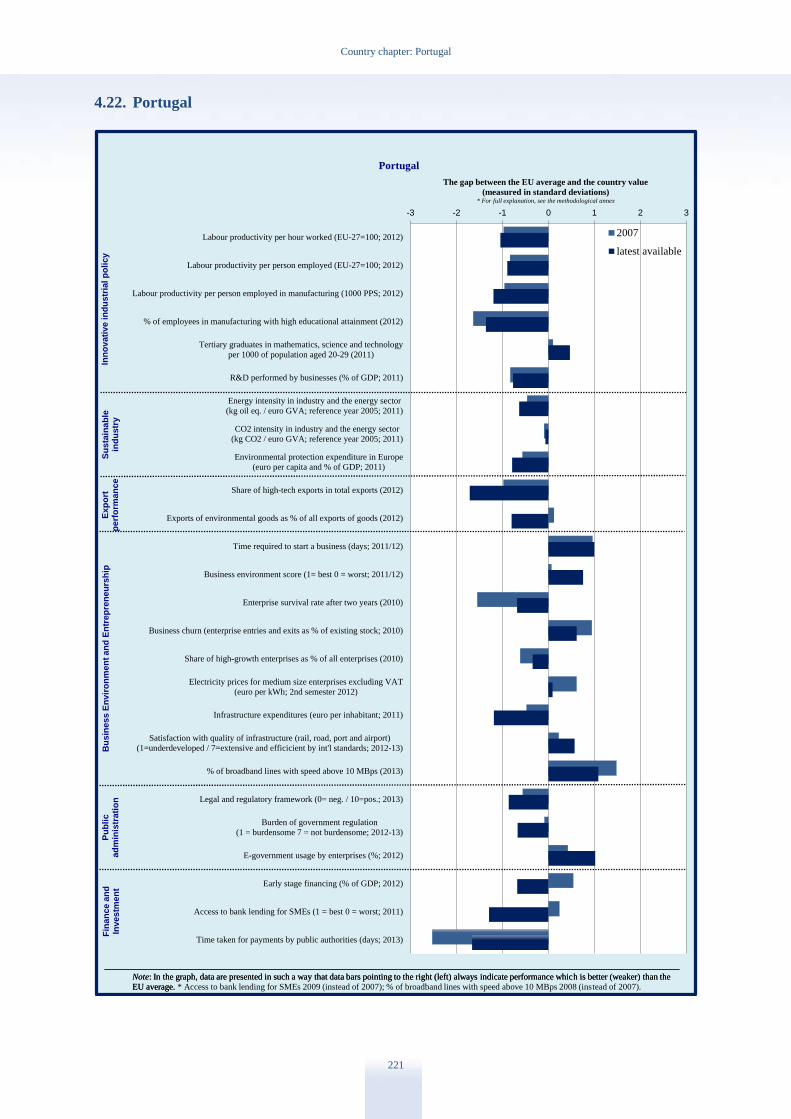
Country chapter: Portugal
221
4.22. Portugal
-3 -2 -1 0 1 2 3
Labour productivity per hour worked (EU-27=100; 2012)
Labour productivity per person employed (EU-27=100; 2012)
Labour productivity per person employed in manufacturing (1000 PPS; 2012)
% of employees in manufacturing with high educational attainment (2012)
Tertiary graduates in mathematics, science and technology
per 1000 of population aged 20-29 (2011)
R&D performed by businesses (% of GDP; 2011)
Energy intensity in industry and the energy sector
(kg oil eq. / euro GVA; reference year 2005; 2011)
CO2 intensity in industry and the energy sector
(kg CO2 / euro GVA; reference year 2005; 2011)
Environmental protection expenditure in Europe
(euro per capita and % of GDP; 2011)
Share of high-tech exports in total exports (2012)
Exports of environmental goods as % of all exports of goods (2012)
Time required to start a business (days; 2011/12)
Business environment score (1= best 0 = worst; 2011/12)
Enterprise survival rate after two years (2010)
Business churn (enterprise entries and exits as % of existing stock; 2010)
Share of high-growth enterprises as % of all enterprises (2010)
Electricity prices for medium size enterprises excluding VAT
(euro per kWh; 2nd semester 2012)
Infrastructure expenditures (euro per inhabitant; 2011)
Satisfaction with quality of infrastructure (rail, road, port and airport)
(1=underdeveloped / 7=extensive and efficicient by int'l standards; 2012-13)
% of broadband lines with speed above 10 MBps (2013)
Legal and regulatory framework (0= neg. / 10=pos.; 2013)
Burden of government regulation
(1 = burdensome 7 = not burdensome; 2012-13)
E-government usage by enterprises (%; 2012)
Early stage financing (% of GDP; 2012)
Access to bank lending for SMEs (1 = best 0 = worst; 2011)
Time taken for payments by public authorities (days; 2013)
The gap between the EU average and the country value
(measured in standard deviations)* For full explanation, see the methodological annex
Portugal
2007
latest available
Note: In the graph, data are presented in such a way that data bars pointing to the right (left) always indicate performance which is better (weaker) than the
EU average.
Inn
ov
ati
ve in
du
str
ial p
oli
cy
Su
sta
ina
ble
ind
ustr
yB
us
iness E
nv
iro
nm
en
t an
d E
ntr
ep
ren
eu
rsh
ipF
ina
nce a
nd
Investm
en
t
Note: In the graph, data are presented in such a way that data bars pointing to the right (left) always indicate performance which is better (weaker) than the
EU average. * Access to bank lending for SMEs 2009 (instead of 2007); % of broadband lines with speed above 10 MBps 2008 (instead of 2007).
Ex
po
rtp
erf
orm
an
ce
Pu
bli
cad
min
istr
ati
on
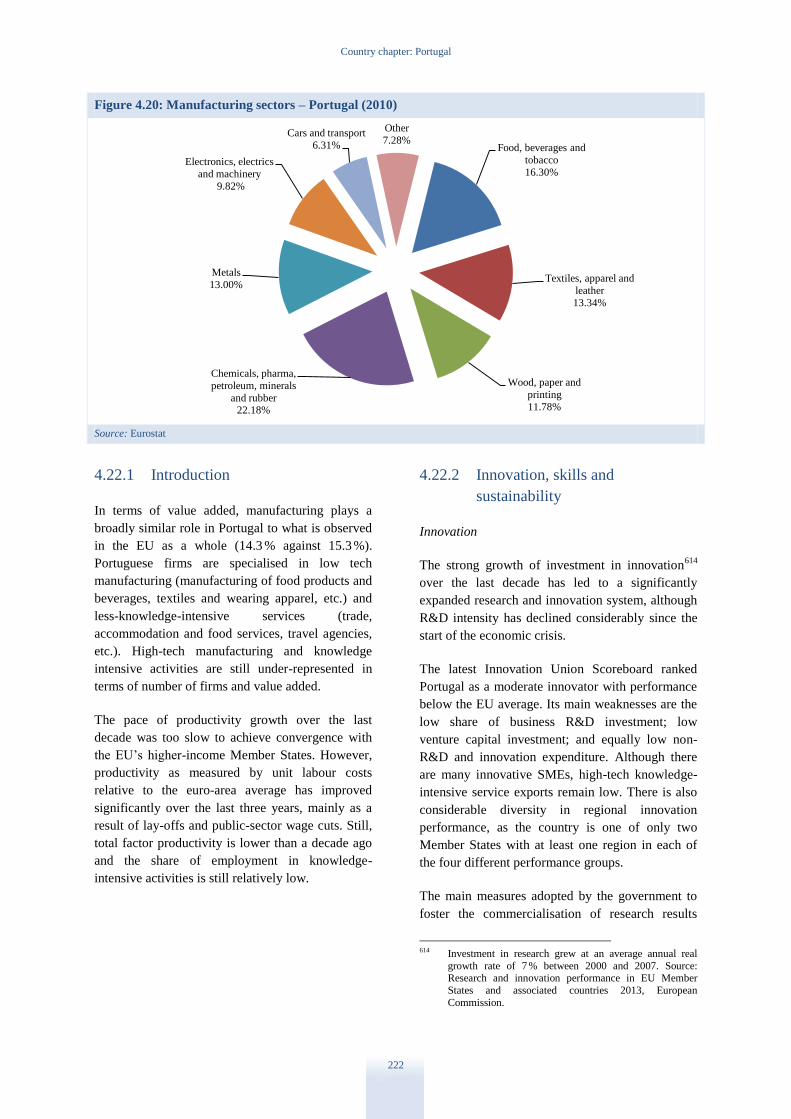
Country chapter: Portugal
222
Figure 4.20: Manufacturing sectors – Portugal (2010)
Source: Eurostat
4.22.1 Introduction
In terms of value added, manufacturing plays a
broadly similar role in Portugal to what is observed
in the EU as a whole (14.3 % against 15.3 %).
Portuguese firms are specialised in low tech
manufacturing (manufacturing of food products and
beverages, textiles and wearing apparel, etc.) and
less-knowledge-intensive services (trade,
accommodation and food services, travel agencies,
etc.). High-tech manufacturing and knowledge
intensive activities are still under-represented in
terms of number of firms and value added.
The pace of productivity growth over the last
decade was too slow to achieve convergence with
the EU’s higher-income Member States. However,
productivity as measured by unit labour costs
relative to the euro-area average has improved
significantly over the last three years, mainly as a
result of lay-offs and public-sector wage cuts. Still,
total factor productivity is lower than a decade ago
and the share of employment in knowledge-
intensive activities is still relatively low.
4.22.2 Innovation, skills and
sustainability
Innovation
The strong growth of investment in innovation614
over the last decade has led to a significantly
expanded research and innovation system, although
R&D intensity has declined considerably since the
start of the economic crisis.
The latest Innovation Union Scoreboard ranked
Portugal as a moderate innovator with performance
below the EU average. Its main weaknesses are the
low share of business R&D investment; low
venture capital investment; and equally low non-
R&D and innovation expenditure. Although there
are many innovative SMEs, high-tech knowledge-
intensive service exports remain low. There is also
considerable diversity in regional innovation
performance, as the country is one of only two
Member States with at least one region in each of
the four different performance groups.
The main measures adopted by the government to
foster the commercialisation of research results
614 Investment in research grew at an average annual real
growth rate of 7 % between 2000 and 2007. Source: Research and innovation performance in EU Member
States and associated countries 2013, European
Commission.
Food, beverages and
tobacco
16.30%
Textiles, apparel and
leather
13.34%
Wood, paper and
printing
11.78%
Chemicals, pharma,
petroleum, minerals
and rubber 22.18%
Metals
13.00%
Electronics, electrics
and machinery
9.82%
Cars and transport
6.31%
Other
7.28%
Country chapter: Portugal
223
include the renewal of US-Portugal partnerships
with a focus on innovation and entrepreneurship;
the creation of a new national organisation to speed
up innovation and technology transfer;615
and a
technology transfer initiative which groups together
various institutes and the European Space Agency
to facilitate the transfer of space technologies to
non-space markets. Furthermore, Portugal
continues to use the structural and investment funds
to support incentive schemes for promoting
innovation by businesses.
Cluster policy is also being rationalised and
refocused with the aim of fostering competitiveness
and exports. This new approach has served to
identify 11 clusters with an international dimension
in traditional and high-growth sectors,616
and eight
clusters with national and regional dimension
focusing on natural endogenous resources.617
Finally, a new digital agenda was approved in
December 2012 that aims to provide the managers
of firms with technological solutions customised to
SME needs and practical information on starting up
a digital business.
Skills
Portugal’s low productivity is partly explained by
the lower qualifications of its labour force when
compared to other Member States. Although
Portugal performs below or close to the EU average
in several of the most important indicators on
education and skills, it has a low tertiary
educational attainment. However, its progress in
recent years has been significant and steady.618
The
recent increase in cross-border mobility of educated
youth may adversely affect productivity growth in
the medium term.
In 2012, the government launched a major
restructuring of the vocational education and
training system to bring it more into line with
labour market needs, in particular those of
exporters. The reform includes a review of training
supply and curricula, the development of incentives
615 GAIN — Global acceleration innovation network. 616 Such as ICT, health, advanced manufacturing, mobility,
fashion, engineering and special tools. 617 Such as agribusiness, wine, the sea, natural stone. 618 Tertiary education attainment was 27.2 % in 2012. There
has been remarkable progress from rates of about 11 % at
the beginning of the last decade.
for promoting apprenticeships, and the creation of
professional schools in partnership with private
stakeholders. The dual training system is also being
strengthened with a view to raising its capacity
from 30 000 places in 2012 to 100 000 in 2020.
New centres for qualification and vocational
education were created in 2013 and aim at
providing people information and guidance on
education and training, and on labour market
integration. These centres also aim at developing
procedures for the recognition, validation and
certification of competences.
From school year 2013/14, work practice
requirement will be extended in vocational
education and training curricula. This will require
deeper involvement of companies in the process,
which is also one of the ways that have been
identified to achieve higher standards.
Substantial progress has also been made in the area
of activation and active labour market policy, with
about half of the recipients of unemployment
benefits being redirected to training measures. The
Vida activa scheme, which aims to develop high-
employability training modules, and the Impulso
jovem scheme to tackle youth unemployment are
playing an important role.
Sustainability
In the energy sector, full liberalisation of the
electricity and gas markets took place in January
2013, and legislation on a new energy regulator has
been adopted. To reduce the fragmentation of the
Iberian electricity market, the capacity of the
interconnectors with the Spanish transmission
network is being increased.619
During 2012, the
government also adopted various measures to
eliminate the tariff debt and to ensure the
sustainability of the system.
As regards resource efficiency, the national plan for
the efficient use of water has been updated. It
identifies specific measures to reduce water
consumption. In early 2013, Portugal transposed the
directive620
on energy performance of buildings,
and the government signed an agreement with the
619 An investment programme has been put in place to almost
double the existing capacity. It includes the construction of a new 400 kV line and the construction of two new 400
kV interconnections. 620 Directive 2010/31/EU.
Country chapter: Portugal
224
industry to promote resource efficiency in
construction activities. Several measures have been
implemented to lower energy prices, in particular
by decreasing subsidies to generators, although the
results have not yet been satisfactory. Further, the
government has also approved this year its national
plan for energy efficiency 2013-16 and its national
plan for renewable energy 2013-20. The launch of
an eco-innovation roadmap is planned for 2013.
There is a national strategy621
on raw materials, in
particular geological resources, that aims to make
the mining industry competitive and to ensure a
sustainable supply of raw materials. The strategy
establishes a funding strategy for the promotion of
the exploration phase with a view to attracting
foreign investment to exploitation.
4.22.3 Export performance
Export performance was strong in 2012 and
continued the upward trend of previous years,
despite weakening in the last quarter. This has
continued in the first half of 2013. The share of
exports in GDP progressed from 28 % in 2009 to
38.7 % in 2012, and at the same time exports have
become more diversified with more target
markets.622
Facilitating the access to finance of businesses in
tradable sectors is crucial to foster their
internationalisation. Therefore, various short-term
lines of credit insurance have been renewed to
enable enterprises to cover the commercial credit
risk of external transactions with a public guarantee
provided either directly or through the national
mutual guarantee system. In addition, a new credit
line has been created to support and promote
exports.
Portugal has also recently introduced a system
speeding up VAT exemptions for exporting firms.
This new system should reduce the time required to
provide all the necessary information from an
average of more than 42 days to just four days so
that VAT will be refunded much faster.
621 Resolution of the Council of Ministers No 78/2012. 622 The shares of exports to Angola, China, the US and Brazil
have grown, although starting from low levels.
A strategy board for the internationalisation of the
economy623
has been set up to bring together public
authorities and business trade associations624
with a
view to evaluating the coordination of public
policies and private initiatives to promote exports
and attract foreign direct investment.
4.22.4 Business environment and public
administration
Business environment
Portugal is carrying out a wide array of structural
reforms to reduce the regulatory burden on
businesses and to improve competition. As a result,
starting a business in Portugal and obtaining
licences is on average easier than in other Member
States, although licensing complexity remains high.
In the area of licensing, a comprehensive
programme was launched in 2012 to tackle
excessive procedures, regulations and other
administrative burdens.625
It included the revision
of legal regimes such as environmental and land-
use planning and industrial, commercial and
tourism licensing. The overall goal is to move to a
new system of ex-ante declarations by firms with
ex-post control by the authorities. In addition, the
government plans to launch a full stock-take of
regulations at all levels of administration, with a
view to eliminating overlaps and redundancies. It is
also considering adopting the ‘one-in, one-out’
principle626
and plans to extend the availability of
zero-licensing627
procedures to most industrial
activities.628
The government has also approved a
623 Conselho estratégico de internacionalização da economia. 624 This Council is chaired by the Prime Minister, and
includes the ministers of finance, foreign affairs, economy
and agriculture, together with the presidents of the confederations of industry (CIP), tourism (CTP), trade
(CCP) and agriculture (CAP) and the associations of
entrepreneurs (AEP) and industry (AIP). The Portuguese agency for foreign trade and investment (AICEP) serves
as its secretariat. 625 Programa da indústria responsável, government resolution
47/2012, published on 18 May 2012. 626 This principle prohibits the creation of a new regulation
without the elimination of an existing regulation or regulations with an equivalent cost.
627 The ‘zero licensing’ regime (‘licenciamento zero’) was
launched through decree-law No 48/2011. Its objective is to simplify the licensing procedures necessary to carry out
several economic activities by reducing red tape through
an electronic point of single contact. 628 The responsible industry system (‘sistema da indústria
responsável’) extends the zero-licensing initiative to most
industrial services.
Country chapter: Portugal
225
roadmap and work programme to enhance the
visibility of all simplification efforts in the point of
single contact.629
To give failed entrepreneurs a second chance, a
new programme has been launched, aimed at
changing the legal framework to make it easier to
recover businesses that are economically sound but
may be close to insolvency. The corporate
insolvency law was amended in May 2012 to
facilitate the early rescue of viable firms.630
The process for construction permits has been
simplified, and the land registry has been made one
of the world’s most efficient, according to the
World Bank. A law simplifying the regulatory
framework for real-estate activities has also been
adopted. Furthermore, draft laws on construction
and land reserves and amendments to the urban
planning rules and procedures are being prepared.
A new law aims to improve the regulatory
framework for regulated professions governed by
professional bodies, such as lawyers, accountants
and architects. This is a major step towards
liberalising the exercise and activity of regulated
professions. The new legal framework eases rules
governing access to professions and the provision
of professional services and ensures that profession-
specific regulations do not contain unjustified
requirements that could limit competition. In
addition, access to some professions not governed
by professional bodies will be eased through the
deregulation of the profession.631
A second phase of
the review of regulated professions is to be
launched to identify and ease requirements for
access that may no longer be justified or
proportionate.
Significant progress has been made in improving
the legal framework for the recognition of
professional qualifications632
and in implementing
629 ‘Balcão do empreendedor’. 630 Portugal made resolving insolvency easier by introducing
a new insolvency law that expedites liquidation procedures and creates fast-track mechanisms both in and
out of court. 631 Indeed, a law deregulating three professions was already
approved in 2012. 632 Amendments to the law transposing the professional
qualifications directive have entered into force in order to provide further information for professionals about their
rights, including advice on the various legally admissible
means for a professional to attest professional experience
the legislative changes required by the services
directive. More than two thirds of the sector-
specific amendments that are necessary to fully
implement the directive have been adopted or
submitted to parliament.
A new competition law entered into force in June
2012. This law should ensure that the competition
authority is able to effectively enforce the
competition rules, and is vested with adequate
investigation powers in line with other competition
authorities in the EU. The government has also
tabled before parliament a framework law setting
out the main principles for the functioning of the
main national regulatory authorities633
and the
competition authority. This legal framework is an
important milestone in conferring strong
independence on the regulators, which is a major
prerequisite for the efficient functioning of
important sectors and for the effective enforcement
of competition rules in the economy.
The authorities have worked on a reform of ports
by devising a comprehensive strategy to reduce the
costs by around 25-30 % over the next years. The
bulk of the cost reductions are expected to come
from the revision of concessions. Other relevant
measures include the reduction of port tariffs and
taxes634
and the improvement of port governance
through the creation of a centralised entity
composed of the ministry for transport and port
authorities.
A new legal basis for the transport regulator has
also been adopted. It merges the three former
regulators (rail, ports and road) into a single entity
and makes a clear distinction between
administrative and regulatory powers. The
principles for the functioning of this new regulatory
entity for the transport sector will also depend on
the framework law on regulators. The government
has also privatised the airport operator and aims to
privatise the national air carrier (TAP) and the
cargo handling subsidiary of the national railway
company in 2013.
acquired when there is no Portuguese competent authority.
633 Regulators of insurance, the securities market, energy,
communications, aviation, transport, health and water and waste services, in addition to the competition authority.
634 A 20 % reduction in tariffs levied by the port authorities
(TUP Carga) has been already approved.
Country chapter: Portugal
226
Public administration
Portugal has made significant advances in
rationalising the central administration. In
September 2012 it completed the plan for
restructuring the central administration, which has
significantly reduced the number of managers and
administrative units.635
A new information system
on the organisation of the state has been created to
provide relevant data on human resources in central
government, and new ICT rationalisation measures
have been designed for shared services. The
recruitment of top management positions is now
subject to open competitions for a five-year period,
and the mobility and flexibility of public servants
has been enhanced.636
The government is now
working on a broader reform of public
administration addressing training and
requalification with a view to allocating human
resources more efficiently.637
The aim is to simplify
procedures and limit compensation in all sectors of
the public administration.
In the area of taxation, the government has adopted
a special VAT regime allowing small companies to
defer the payment of VAT to the state until the
invoice has been collected. The tax regime for
supporting investment has been strengthened.638
Furthermore, a comprehensive reform of the
corporate income tax639
and tax credit schemes has
been launched to foster investment and
competitiveness.
To complement a local administration reform, the
government is also finalising a new law defining
competences at the local administration and inter-
municipal levels. The new law should avoid
potential overlaps between decentralised services of
the state and those of the local administration.
635 According to the Portuguese authorities, the outcome of
PREMAC has been a 27 % reduction in management
positions and a 40 % reduction in administrative units. 636 New legislation on working time and geographical
mobility has been submitted to parliament. 637 A reform of the ‘special mobility’ scheme is expected in
2013 to support a broader public administration reform with a view to allocating human resources more
efficiently. 638 The measures include: raising the threshold of deductible
tax benefits, reducing the minimum eligible investment
threshold, reducing the time taken to issue binding tax
information and creating a special unit in the tax administration to support international investments.
639 The following aspects are being considered: the rate
structure; the tax base; and international tax policy.
The reform to speed up the judicial system has been
continued. A comprehensive roadmap to reduce the
number of courts, streamline the court structure and
improve the management of courts has been
enacted by the parliament. There is now tighter
control and supervision of enforcement agents, and
the backlog of cases has been reduced. Specialised
courts on competition matters and on intellectual
property rights also became operational in 2012.
Further, alternative dispute resolution mechanisms
have been strengthened to facilitate out-of-court
settlement.640
A revised legal framework for public procurement
has also been adopted. It addresses in particular the
regime for awarding additional works and services,
errors and omissions; the elimination of exemptions
permitting direct awards; and the removal of the
requirement to invest in R&D projects for contracts
above EUR 25 million.
4.22.5 Finance and investment
Access to credit remains costly and difficult, in
particular for SMEs. Furthermore, the difficulties in
the sovereign debt markets have also been reflected
in higher interest-rate differentials than in many
other Member States. The credit constraints are
pushing companies to find alternative financing
mechanisms, although most of these remain
underdeveloped due to lack of both demand and
supply. The fiscal consolidation efforts have limited
the ability of the public bodies to grant further
financial support.
The government has taken various measures to ease
credit constraints, in particular for SMEs in the
tradable sectors. A state-guaranteed line of credit641
was introduced at the beginning of 2012 and has
been renewed in 2013 with an allocation of EUR 2
billion. The aim is to ensure and improve access to
credit for economically viable enterprises, and to
improve the growth and investment capacity of
firms. Further, Portugal has reprogrammed
640 The legal framework for financial institutions to engage in
out-of-court debt restructuring for households was enacted
by decree-law No 227/2012 (general regime). Among
other things, this instrument requires banks to develop risk management systems to monitor and prevent the risk of
default by households (PARI) and lays down a standard
negotiation procedure between the credit institution and the bank client aimed at amicable settlement of debts
(PERSI). 641 PME Crescimento (‘SME Growth’).

Country chapter: Portugal
227
structural funds to provide a credit line for
businesses to finance eligible projects. An
agreement with the European Investment Bank
allows the Portuguese state to counter-guarantee up
to EUR 2.8 billion of EIB lending via banks to
Portuguese firms.
The government has recently announced its plans to
create a financial development institution for
financing the private sector and promoting
industrial development, which would be fully
operational in 2014. Portugal is also adjusting the
mission of its public bank (‘Caixa geral de
depósitos’) to reinforce its financing role in the
economy.
As regards alternative financing mechanisms, the
reform of the public venture capital sector was
completed in June 2012 with the merging of three
previous institutions into a single operator,
Portugal ventures.642
The aim was to rationalise the
available resources and focus them on strategic
industries, particularly in tradable goods, services
and tourism. Portugal ventures has launched a seed
capital facility to invest in scientific and
technology-based projects. The government is also
preparing a pilot joint issue of corporate debt
instruments for the capital market, with a public
capital guarantee.
The liquidity problems of enterprises have been
aggravated by long delays in payments, in
particular by the public sector.643
Although the
arrears have been significantly reduced, particularly
in the health sector, further efforts are needed, in
particular in the local administration. The effective
implementation of the late payments directive will
be critical to avoid the build-up of additional
arrears.
642 Portugal ventures has EUR 140 million available to
pursue its investment policy. 643 Portuguese public authorities pay their invoices after 139
days on average, which is on average 82 days late with
respect to the due date. Source: European Payment Index
2012. Intrum Justitia.
4.22.6 Conclusions
Portugal’s biggest challenge is to restore the
competitiveness of its economy after a decade of
low productivity growth and growing indebtedness.
The economic adjustment programme644
is
contributing to the implementation of a series of
reforms to improve productivity and
competitiveness. Future economic growth should be
based on the ability to export goods and services
with high added value, together with the ability to
attract foreign investment. The government is
therefore rebalancing the economy towards export-
led growth by putting exporting companies at the
core of its policy initiatives in many areas, such as
innovation, education, transport, or access to
finance.
The lack of access to finance is a major factor
constraining the operations and growth of SMEs.
Businesses are disadvantaged by interest-rate
differentials compared to many other Member
States. The government is trying to ease these credit
constraints by strengthening its existing
instruments, e.g. state-guaranteed lines of credit,
and fostering the use of alternative financing
mechanisms.
Significant progress has been made in streamlining
the business environment, in particular in the area
of licensing, and enhancing competition in services.
Consequently, starting up a businesses and
obtaining licences is now mostly easier than in most
Member States, although some licensing
complexity remains.
Portugal has also adopted measures to raise the
quality of research and knowledge creation.
However, there is still a significant gap between
knowledge creation, knowledge transfer and its
translation into economic value through innovation,
which partially is due to the low share of research-
intensive sectors in the economy.
644 Following a request by Portugal on 7 April 2011, the
troika, consisting of the European Commission, the
European Central Bank and the International Monetary Fund, negotiated with the Portuguese authorities an
economic adjustment programme, which was agreed by
the European Council on 30 May 2011. The programme covers the period 2011-14. Its financial package
comprises up to EUR 78 billion for possible fiscal-
financing needs and support to the banking system.
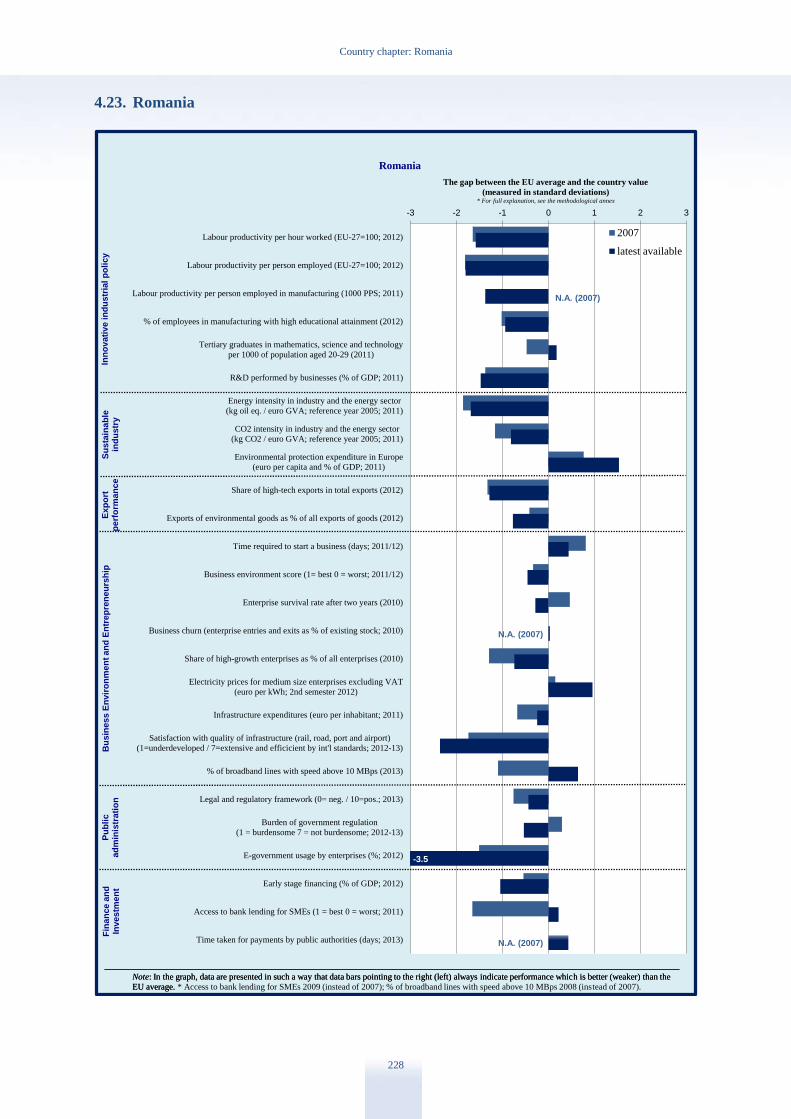
Country chapter: Romania
228
4.23. Romania
-3 -2 -1 0 1 2 3
Labour productivity per hour worked (EU-27=100; 2012)
Labour productivity per person employed (EU-27=100; 2012)
Labour productivity per person employed in manufacturing (1000 PPS; 2011)
% of employees in manufacturing with high educational attainment (2012)
Tertiary graduates in mathematics, science and technology
per 1000 of population aged 20-29 (2011)
R&D performed by businesses (% of GDP; 2011)
Energy intensity in industry and the energy sector
(kg oil eq. / euro GVA; reference year 2005; 2011)
CO2 intensity in industry and the energy sector
(kg CO2 / euro GVA; reference year 2005; 2011)
Environmental protection expenditure in Europe
(euro per capita and % of GDP; 2011)
Share of high-tech exports in total exports (2012)
Exports of environmental goods as % of all exports of goods (2012)
Time required to start a business (days; 2011/12)
Business environment score (1= best 0 = worst; 2011/12)
Enterprise survival rate after two years (2010)
Business churn (enterprise entries and exits as % of existing stock; 2010)
Share of high-growth enterprises as % of all enterprises (2010)
Electricity prices for medium size enterprises excluding VAT
(euro per kWh; 2nd semester 2012)
Infrastructure expenditures (euro per inhabitant; 2011)
Satisfaction with quality of infrastructure (rail, road, port and airport)
(1=underdeveloped / 7=extensive and efficicient by int'l standards; 2012-13)
% of broadband lines with speed above 10 MBps (2013)
Legal and regulatory framework (0= neg. / 10=pos.; 2013)
Burden of government regulation
(1 = burdensome 7 = not burdensome; 2012-13)
E-government usage by enterprises (%; 2012)
Early stage financing (% of GDP; 2012)
Access to bank lending for SMEs (1 = best 0 = worst; 2011)
Time taken for payments by public authorities (days; 2013)
The gap between the EU average and the country value
(measured in standard deviations)* For full explanation, see the methodological annex
Romania
2007
latest available
Note: In the graph, data are presented in such a way that data bars pointing to the right (left) always indicate performance which is better (weaker) than the
EU average.
Inn
ov
ati
ve in
du
str
ial p
oli
cy
Su
sta
ina
ble
ind
ustr
yB
us
iness E
nv
iro
nm
en
t an
d E
ntr
ep
ren
eu
rsh
ipF
ina
nce a
nd
Investm
en
t
Note: In the graph, data are presented in such a way that data bars pointing to the right (left) always indicate performance which is better (weaker) than the
EU average. * Access to bank lending for SMEs 2009 (instead of 2007); % of broadband lines with speed above 10 MBps 2008 (instead of 2007).
Ex
po
rtp
erf
orm
an
ce
Pu
bli
cad
min
istr
ati
on
N.A. (2007)
-3.5
N.A. (2007)
N.A. (2007)
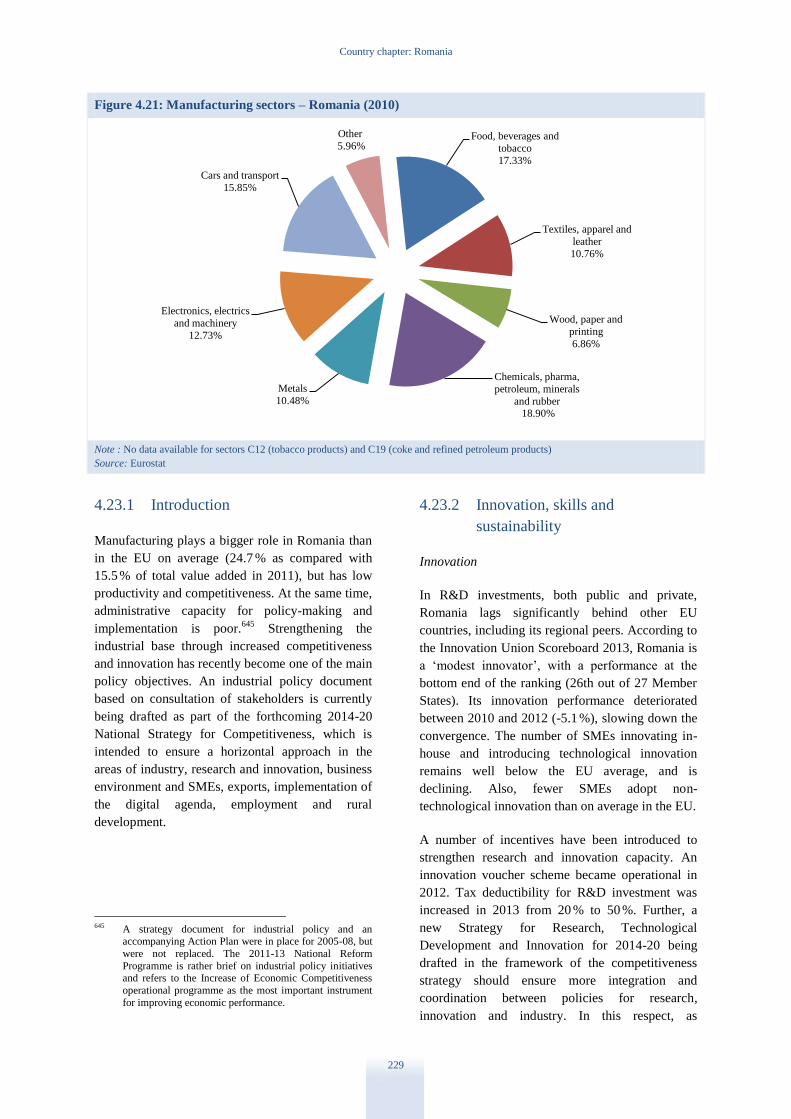
Country chapter: Romania
229
Figure 4.21: Manufacturing sectors – Romania (2010)
Note : No data available for sectors C12 (tobacco products) and C19 (coke and refined petroleum products)
Source: Eurostat
4.23.1 Introduction
Manufacturing plays a bigger role in Romania than
in the EU on average (24.7 % as compared with
15.5 % of total value added in 2011), but has low
productivity and competitiveness. At the same time,
administrative capacity for policy-making and
implementation is poor.645
Strengthening the
industrial base through increased competitiveness
and innovation has recently become one of the main
policy objectives. An industrial policy document
based on consultation of stakeholders is currently
being drafted as part of the forthcoming 2014-20
National Strategy for Competitiveness, which is
intended to ensure a horizontal approach in the
areas of industry, research and innovation, business
environment and SMEs, exports, implementation of
the digital agenda, employment and rural
development.
645 A strategy document for industrial policy and an
accompanying Action Plan were in place for 2005-08, but
were not replaced. The 2011-13 National Reform
Programme is rather brief on industrial policy initiatives and refers to the Increase of Economic Competitiveness
operational programme as the most important instrument
for improving economic performance.
4.23.2 Innovation, skills and
sustainability
Innovation
In R&D investments, both public and private,
Romania lags significantly behind other EU
countries, including its regional peers. According to
the Innovation Union Scoreboard 2013, Romania is
a ‘modest innovator’, with a performance at the
bottom end of the ranking (26th out of 27 Member
States). Its innovation performance deteriorated
between 2010 and 2012 (-5.1 %), slowing down the
convergence. The number of SMEs innovating in-
house and introducing technological innovation
remains well below the EU average, and is
declining. Also, fewer SMEs adopt non-
technological innovation than on average in the EU.
A number of incentives have been introduced to
strengthen research and innovation capacity. An
innovation voucher scheme became operational in
2012. Tax deductibility for R&D investment was
increased in 2013 from 20 % to 50 %. Further, a
new Strategy for Research, Technological
Development and Innovation for 2014-20 being
drafted in the framework of the competitiveness
strategy should ensure more integration and
coordination between policies for research,
innovation and industry. In this respect, as
Food, beverages and
tobacco
17.33%
Textiles, apparel and
leather
10.76%
Wood, paper and
printing
6.86%
Chemicals, pharma,
petroleum, minerals
and rubber 18.90%
Metals
10.48%
Electronics, electrics
and machinery
12.73%
Cars and transport
15.85%
Other
5.96%
Country chapter: Romania
230
highlighted by the Commission’s 2013
country-specific recommendations and
accompanying Staff Working Document, the main
challenge is to prioritise research and development
activities with potential to attract private
investment.
At the same time, more effort will be needed to
translate knowledge into the production of goods
and services, and improve the climate for private
research and innovation. A number of challenges
remain, in particular improving the matching of
research and innovation capacity with business
needs, increasing firms’ research and innovation
capacity, providing SMEs with tailored high-quality
innovation services, supporting knowledge-based
start-ups through appropriate support and funding
for product development and launch, and
developing incentives for collaboration between
large firms, innovative SMEs and universities.
Skills
There are mismatches between skills and labour
market demand in a large proportion of vocational
and tertiary education programmes, with the poor
level of vocational skills being a specific challenge.
The high unemployment rate among tertiary
graduates and the rate of over-qualification make a
further alignment of tertiary education with the
labour market a high priority. To address these
issues, a two-year vocational training system was
reintroduced in 2012 based on contracts concluded
with business enterprises and public bodies.
Qualitative skills mismatches are less significant in
Romania than on average in the EU.646
However,
the proportion of employees with an inappropriate
education for their current job is well above the EU
average.647
According to skills forecasts up to
2020,648
employment in services and knowledge-
based sectors will increase, while employment in
agriculture and other primary production will
decrease. There is thus a danger of a lack of
medium- and high-level skills by 2020.
646 Data from the European Labour Force Survey shows that
nearly 10 % of Romanian employees were over-qualified,
as compared with 15 % at EU level, and 10 % of
Romanian employees were under-qualified, as compared with 21 % at EU level.
647 EU Skills Panorama Analytical Highlight (March 2013). 648 CEDEFOP forecast.
There is no adequate skills forecasting system. The
inclusion of entrepreneurship, innovation,
marketing and management skills in university
curricula would help to ensure closer links between
education and business. Boosting SMEs’ capacity
to anticipate their employment and skills needs and
manage restructuring are vital for competitiveness.
Sustainability
While expenditure on environmental protection is
relatively high (Romania comes 6th in the EU-27),
the environmental performance of industry remains
poor: the economy is the third most carbon-
intensive in the EU, has the third-highest energy
intensity (2.5 times higher than the EU average) and
ranks 22nd649
for its eco-innovation performance.
The 2007-20 Energy Strategy is currently under
revision and will include provisions on energy
efficiency in industry and on renewable energy. The
2003-13 National Waste Management Strategy,
also being revised, aims to prevent waste generation
and increase the recycling of industrial waste. The
2013-20 National Strategy for Climate Change has
also been completed.
Other recent measures include support for the
purchase of new electric cars. Innovation
Norway’s650
Green Industry Innovation Programme
for Romania provides support for the development
and implementation of innovative environmentally
friendly technologies, green products and services.
There are a number of controversial foreign
investment projects in the areas of energy and non-
energy raw materials. Shale gas exploration rights
have been granted in the Dobrogea region, and a
gold mining project using cyanide (at Roșia
Montană) has raised concerns about environmental
consequences and costs, but also about transparency
and lobbying. A history of accidents and
environmental damage indicate that there is room
for improvement in the mines’ environmental
management and exploitation techniques. Illegal
logging is also a major concern and the forestry
code is currently being revised to tackle the
problem.
649 2011 Eco-innovation Scoreboard. 650 Innovation Norway (IN) is a public company owned by
the Norwegian Ministry of Trade and Industry and all
Norway’s county councils.
Country chapter: Romania
231
In general, the economic benefits of a resource-
efficient and greener economy are not sufficiently
reflected in policy-making, nor is there a broader
strategy on this that would encourage industries to
reduce their impact on the environment and become
greener and more resource-efficient.
4.23.3 Export performance
In 2012, Romania had a trade deficit of EUR 9.5
billion.651
Exports were driven by manufacturing, in
particular by machinery and transport equipment
(accounting for 40.4 % of the total) and other
manufactured goods (34.1 %). Other exports
included food products, beverages and tobacco,
chemical products, raw materials, and mineral
fuels, lubricants and related materials.
Over the past decade, Romania has increased its
export market share in goods by 50 %.652
High-tech
and medium-high-tech industries have increased
their share, in particular as regards road vehicles,
electrical machinery, telecommunication, and
machinery. Romania’s exports have a relatively low
but rising import content, which could be explained
by the fact that the country started from very low
export levels and has been catching up rapidly in
the past decade.
To facilitate access to international markets, the
SME export development programme provides
services such as trade missions, co-financing for
participation in international trade fairs, a trade
portal and market studies. A national export
strategy is being prepared for 2014-20.
However, several challenges remain, in particular in
providing SMEs with training and practical
guidance on export procedures and improving their
access to information on new opportunities, to
financing instruments, networks and contacts with
overseas partners.
4.23.4 Business environment and public
administration
The complex regulatory and administrative
environment, widespread corruption and poor
transport infrastructure create administrative
651 Source: Romanian National Institute of Statistics. 652 Source: UN COMTRADE data.
burdens that drag down performance in
international comparisons.653
Some progress has
been made on start-up procedures, fiscal reporting
requirements, and on the registration and transfer of
property, but complex procedures are still in place
when it comes to obtaining electricity, paying taxes,
dealing with construction permits and resolving
insolvency.
The implementation of the action plan resulted
from the functional review of the institutional
setting in the area of business environment
undertaken in the framework of the IMF and EU
assistance has been feeble. More political support
has been available since 2012, with the nomination
of a Minister Delegate for Business Environment,
but much remains to be done to ensure a
coordinated reform effort.
Building on previous efforts,654
a new Strategy for
the Development of Business Environment and
SMEs for 2014-20 will also be part of the new
competitiveness strategy. The challenge is to define
clear principles, objectives, priorities, targets and
monitoring indicators. In particular, a functioning
governance structure is needed to ensure that
policies are actually coordinated, monitored and
enforced.
A number of previous entrepreneurship
programmes are being continued in 2013. An
optional course topic, ‘Be active, prepare your
access to success’, will be introduced in secondary
schools. A new regulatory framework on
insolvency is being prepared and a new law will
incorporate the principles of the Small Business Act
into national legislation.
While some progress has been made on the
measuring of administrative costs, the application
of regulatory impact assessments is almost non-
653 The Global Competitiveness Index had Romania in 76th
position in 2013-14 (out of 1448 economies), as compared
with 76th in 2012-13 (out of 144 economies), 77th in 2011-12 and 67th in 2010-11. The country’s performance
is even poorer as regards some of the pillars considered as
drivers for competitiveness, such as institutions (114th), business sophistication (101th) and infrastructure (100th).
Romania’s World Bank ‘ease of doing business’ ranking
has also deteriorated, dropping to 72nd in 2013 from 56th in 2011 and 54th in 2010.
654 Two strategies have previously been drafted– the Strategy
for the improvement and development of the business environment until 2014, and the Strategy for the
development of the SME s sector until 2013 – but none of
them has been adopted so far.

Country chapter: Romania
232
existent. The 2008-13 Strategy for Better
Regulation has been implemented slowly. The key
challenge is to align this with the EU Smart
Regulation agenda and the strategy for business
environment and SMEs, so that costs for businesses
and the required performance improvement are
addressed immediately. This is likely to require
quantified impact assessments, competitiveness
proofing and fitness checks to reduce the overall
costs of regulation and increase clarity, accessibility
and ease of compliance.
Public administration
In terms of overall government effectiveness,
Romania performs worst of all Member States on
the World Bank index.
An inter-ministerial committee has been set up to
analyse the public administration and formulate
proposals to restructure it. A strategy on
strengthening administrative capacity should be
approved by the Government by the end of 2013.
For real change in the public administration, the
challenge is to base the strategy on an analysis of
the structural causes of administrative inefficiency.
These include the poor capacity for strategic and
financial planning, the lack of effectiveness in
policy implementation and service delivery,
insufficient cooperation and coordination between
levels of government and between ministries, weak
management and control systems, the poorly
functioning public procurement system and the
absence of strategic and effective human resources
management.
The take-up of e-government is still low,655
for
businesses the lowest in the EU. Only 5.3 % of the
population buy online, as compared with the EU
average of 44.8 %. A national strategy on the digital
agenda and a next generation access networks plan
are currently being developed.
Romania has sought to improve the quality of
justice and the independence of the judicial system
but a number of deficiencies persist. These include
delays in resolving cases and a lack of consistency
between judgments. Progress with judicial reform
and the fight against corruption is monitored by the
European Commission. Although the time needed
655 See the 2013 Digital Agenda Scoreboard.
to resolve non-criminal cases, administrative cases
and litigious civil and commercial cases is close to
EU average (but lags behind for insolvency cases),
the case resolution rate for all categories has been
falling.656
Significantly wider use of e-justice tools
could help, as could regular evaluations of courts’
activities and defined quality standards.657
The
perceived independence of justice in Romania has
the second worst rating in the EU.658
Unfortunately,
so far Romania has not been able to implement its
commitments aimed at enhancing the independence
of the judiciary and that politically motivated
attacks on the judiciary have not ended. 659
The level of corruption in Romania is perceived as
particularly high by European standards. This
dampens the efficiency of economic activity and is
a serious disincentive to inward investment. Fully
implementing the national anti-corruption strategy
would increase the confidence of economic
operators that commercially significant decisions
taken by public authorities are fully transparent.
In spite of the efforts made, further action could be
taken to address state capture and other forms of
administrative corruption, in particular by
establishing transparent lobbying rules, controlling
the movement of managers between the public and
private sectors, guaranteeing comprehensive access
to information legislation and ensuring
transparency and integrity in the procurement
process.660
The number of tax payments has been reduced from
113 in 2012 to 41, but there is room for further
improvement.661
The new 2012-16 fiscal
administration strategy extends the use of online tax
declarations. Tax rules for microenterprises have
been modified by having a single regime.662
Lastly,
the VAT rules have been changed so that VAT is
656 The EU Justice Scoreboard: a tool to promote effective
justice and growth, COM(2013) 160 final. 657 A comprehensive evaluation of the Romanian judicial
system http://courtoptimization.wix.com/ewmi# 658 The EU Justice Scoreboard, p.21. 659 January 2013 report of the Cooperation and Verification
Mechanism, COM(2013) 47 final. 660 According to the Commission’s last progress report under
the Cooperation and Verification Mechanisms, progress on the prevention and prosecution of corruption relating to
public procurement is very limited (COM(2013) 47 final). 661 An average firm spends 216 hours a year filing, preparing
and paying taxes. 662 All legal entities which fulfil the new criteria are liable for
3 % microenterprise tax.
Country chapter: Romania
233
payable on reception of payment (within 90 days)
and deducted on payment of the received invoice.
4.23.5 Finance and investment
Total lending volumes are the lowest in the EU and
interest rates second highest for loans of up to
EUR 1 million.663
Although the proportion of loan
applications rejected fell significantly from 48 % in
2009 to 18 % in 2011, the proportion of businesses
indicating that the banks are less willing to lend has
remained stable at 41 %, well above the EU average
of 30 %.664
This could be explained by the
tightening of credit standards that have discouraged
many entrepreneurs from applying for a loan.
Alternative forms of financing and new financial
products, in particular venture capital, are not
widely available. According to the European
Private Equity and Venture Capital Association,
venture capital investments have constantly
declined since 2007.665
The number of beneficiary
SMEs has also fallen.
Public financial support to SMEs is being provided
primarily via national programmes and guarantee
instruments. The Mihail Kogalniceanu Programme
aims to facilitate SMEs’ access to finance by
granting a credit line with subsidised interest and, if
need be, partial state guarantees under certain
conditions. The Programme for Young
Entrepreneurs aims to encourage small business
start-ups, targeting entrepreneurs under 35 years of
age. However, these programmes could be made
more accessible, in particular with easier
application procedures.
Before the crisis, investment was attracted by
strong GDP growth, large-scale privatisations, the
prospect of EU membership, low labour costs and
taxes, and the large Romanian market. However,
net foreign direct investment has declined since
2009666
and came to EUR 1.7 billion in 2012, which
663 European Central Bank (ECB) statistical data. 664 EC and ECB, SMEs’ Access to Finance Survey 2011:
Analytical Report (7 December 2011). 665 Total investments in 2007-10 amounted to EUR 947
million (no bank leverage included), falling year-on-year as follows: EUR 318 million in 2007; EUR 289 million in
2008; EUR 221 million in 2009; and EUR 119 million in
2010 (the equivalent of 0.101 % of GDP). 666 The net FDI flow amounted to EUR 1.8 billion in 2011;
EUR 2.2 billion in 2010; EUR 3.5 billion in 2009; and
EUR 9.3 billion in 2008.
was 6.7 % lower than the year before and almost
80 % lower than in 2008.
The main beneficiaries of FDI have been
manufacturing (31.5 % of the total stock), financial
intermediation and insurance, trade, construction
and real-estate transactions, and ICT. This reflects a
shift from exploiting low-cost advantages towards
higher value-added production, in particular in
manufacturing. New investment has been scarce in
clothing and apparel, but healthier in higher value-
added segments like furniture and transport
equipment.
A range of state aid schemes is available for various
investment categories, and assistance to foreign
investors is provided by the new Department for
Infrastructure Projects and Foreign Investment.
According to Ernst & Young’s 2012 European
Attractiveness survey, Romania is the 6th most
attractive country in Europe for investments over
the next three years. However, more could be done
to improve the quality of services to encourage
stronger commercial links between foreign
investors and local enterprises. Also, closer
connections between innovation policy and inward
investment promotion are needed in order to attract
more R&D-intensive FDI.
4.23.6 Conclusions
Romania’s declining competitiveness in
international comparisons reflects a policy failure,
in particular because the major changes to improve
the business environment have been postponed.
This has resulted in the heavy administrative
burden remaining, and there is a lack of moves
towards e-government that could improve the
situation.
Comprehensive, decisive and effective efforts to
foster structural change towards a more knowledge-
intensive economy would help to improve the
situation. However, the problems in access to
finance are dampening investment. Significant
improvements in the business climate require
solutions, tools and changes across the whole
administration. Similarly, considerable efforts
would be needed to ensure that the country were
able to implement its commitments aimed at
enhancing the independence of the judiciary.

Country chapter: Romania
234
Several national strategies are currently being
drafted and efforts are being made to strengthen
competitiveness in areas important for growth.
However, effective implementation is required for
visible and lasting results. In addition to policy
commitment, this would require mechanisms to
coordinate, monitor and enforce policy. Further
action would also be needed to address state capture
and other forms of administrative corruption.
The sustainable and transparent exploitation of raw
materials is another challenge, as environmental
and health damage will have a negative impact on
the medium- and long-term competitiveness of the
country.
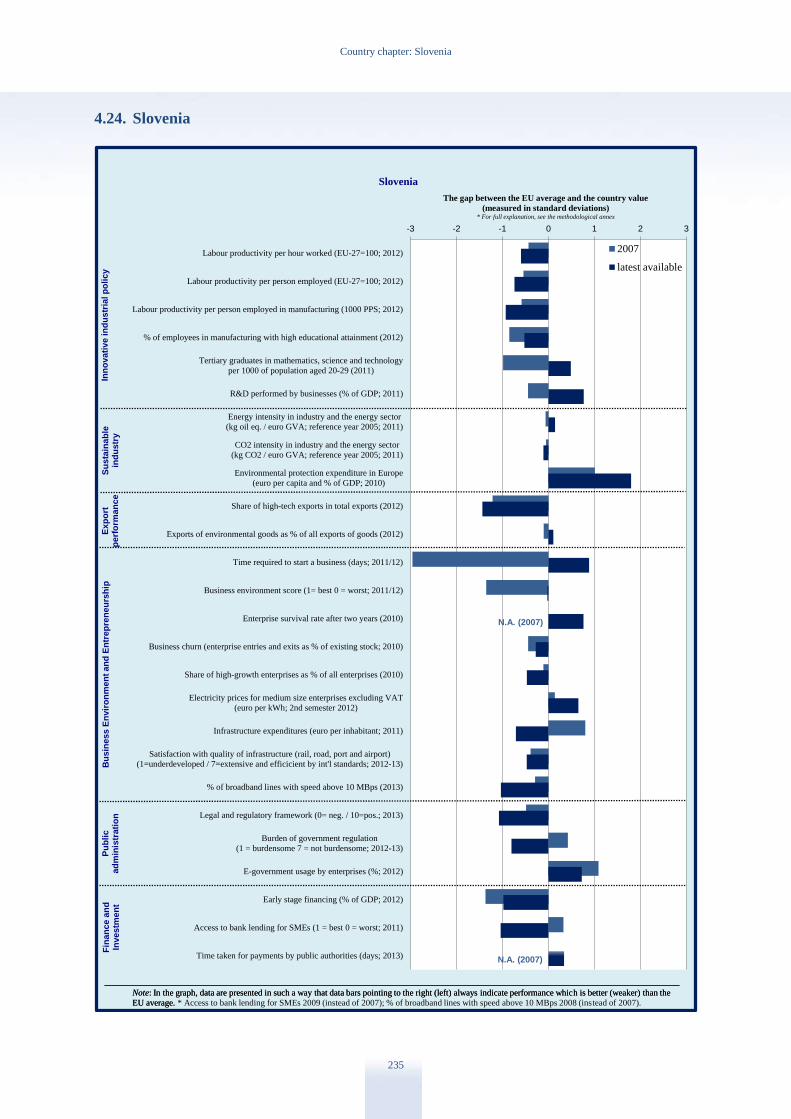
Country chapter: Slovenia
235
4.24. Slovenia
-3 -2 -1 0 1 2 3
Labour productivity per hour worked (EU-27=100; 2012)
Labour productivity per person employed (EU-27=100; 2012)
Labour productivity per person employed in manufacturing (1000 PPS; 2012)
% of employees in manufacturing with high educational attainment (2012)
Tertiary graduates in mathematics, science and technology
per 1000 of population aged 20-29 (2011)
R&D performed by businesses (% of GDP; 2011)
Energy intensity in industry and the energy sector
(kg oil eq. / euro GVA; reference year 2005; 2011)
CO2 intensity in industry and the energy sector
(kg CO2 / euro GVA; reference year 2005; 2011)
Environmental protection expenditure in Europe
(euro per capita and % of GDP; 2010)
Share of high-tech exports in total exports (2012)
Exports of environmental goods as % of all exports of goods (2012)
Time required to start a business (days; 2011/12)
Business environment score (1= best 0 = worst; 2011/12)
Enterprise survival rate after two years (2010)
Business churn (enterprise entries and exits as % of existing stock; 2010)
Share of high-growth enterprises as % of all enterprises (2010)
Electricity prices for medium size enterprises excluding VAT
(euro per kWh; 2nd semester 2012)
Infrastructure expenditures (euro per inhabitant; 2011)
Satisfaction with quality of infrastructure (rail, road, port and airport)
(1=underdeveloped / 7=extensive and efficicient by int'l standards; 2012-13)
% of broadband lines with speed above 10 MBps (2013)
Legal and regulatory framework (0= neg. / 10=pos.; 2013)
Burden of government regulation
(1 = burdensome 7 = not burdensome; 2012-13)
E-government usage by enterprises (%; 2012)
Early stage financing (% of GDP; 2012)
Access to bank lending for SMEs (1 = best 0 = worst; 2011)
Time taken for payments by public authorities (days; 2013)
The gap between the EU average and the country value
(measured in standard deviations)* For full explanation, see the methodological annex
Slovenia
2007
latest available
Note: In the graph, data are presented in such a way that data bars pointing to the right (left) always indicate performance which is better (weaker) than the
EU average.
Inn
ov
ati
ve in
du
str
ial p
oli
cy
Su
sta
ina
ble
ind
ustr
yB
us
iness E
nv
iro
nm
en
t an
d E
ntr
ep
ren
eu
rsh
ipF
ina
nce a
nd
Investm
en
t
Note: In the graph, data are presented in such a way that data bars pointing to the right (left) always indicate performance which is better (weaker) than the
EU average. * Access to bank lending for SMEs 2009 (instead of 2007); % of broadband lines with speed above 10 MBps 2008 (instead of 2007).
Ex
po
rtp
erf
orm
an
ce
Pu
bli
cad
min
istr
ati
on
N.A. (2007)
N.A. (2007)

Country chapter: Slovenia
236
Figure 4.22: Manufacturing sectors – Slovenia (2010)
Note: No data available for sectors C19 (manufacture of coke and refined petroleum products) and C30 (manufacture of other transport
equipment)
Source: Eurostat
4.24.1 Introduction
Slovenia has slipped back into recession as its real
GDP declined by 2.3 % in 2012 and is projected to
drop further by 2 % in 2013.667
Construction, the
second biggest sector after manufacturing, was the
hardest hit with a cumulative decline of 60 % over
the last four years.668
The year 2012 was also
marked by falling investment and domestic
consumption together with stagnant exports
(+0.3 %). Stabilisation is expected to come only in
2014.669
Notwithstanding wage moderation, declining
productivity prevented cost competitiveness from
improving in 2012. Other key challenges are the
unprecedented credit crunch, the low foreign direct
investment stock and weak export performance.
The manufacturing sector was a larger part of the
economy in 2011 (20.3 %) than in the EU on
average (15.5 %). Slovenia's manufacturing
industries are moving towards higher research
intensity in almost all sectors.
Labour productivity is below the EU average,
which is the result of many factors. Strict
667 Commission SWD: Assessment of the 2013 national
reform programme and stability programme for Slovenia. 668
Source: IMAD, Slovenian economic mirror, February
2013, p. 10. 669
Source: EC Spring Forecast 2013.
employment protection legislation has hindered the
re-allocation of labour across firms and sectors;
many are employed in state-owned enterprises with
low productivity; productivity-enhancing foreign
direct investment flows are low; and there is a
labour skill mismatch.
4.24.2 Innovation, skills and
sustainability
Innovation
The role of innovation in industrial policy is
outlined in three strategic documents,670
with the
goal of increasing productivity and focusing on
environmental technologies, sustainable mobility,
biotechnology, technology solutions for health and
ageing, and key enabling technologies.
Currently there is no active cluster policy, although
some clusters that were supported earlier continue,
the most important being in the automotive sector.
Support is now focused on networking, clustering
and collaboration between companies and
knowledge institutions, in particular through eight
centres of excellence, seven competence centres
and 17 development centres. All are co-funded with
structural funds, the first two types until the end of
670 ‘The Research and Innovation Strategy’, the ‘National
Higher Education Programme’ and the ‘Slovenian
Industrial Policy 2014-20’ (adopted on 6 February 2013).
Food, beverages and
tobacco
7.60%
Textiles, apparel and
leather
4.20%
Wood, paper and
printing
7.29%
Chemicals, pharma,
petroleum, minerals
and rubber 27.05%
Metals
17.38%
Electronics, electrics
and machinery
21.04%
Cars and transport
7.77%
Other
7.32%
Country chapter: Slovenia
237
2013, and the development centres until the end of
2015.
The country has implemented several measures to
stimulate innovation, including a new research
voucher (EUR 8 million) to help enterprises to
commission research work from research and
higher education institutions for a period of two
years. New creative centres (EUR 4 million) were
also created in 2012, with the aim of enhancing
cooperation between academia and enterprises in
different regions. R&D capacities of firms have
been strengthened as over 140 companies were
supported for a total of EUR 30.5 million, and more
than 815 research experts were financed. The R&D
tax subsidy has been increased to 100 % and loans
from SID Bank for R&D investment by businesses
have been expanded (EUR 150 million). The
Slovenian enterprise fund has offered guarantees
for bank loans with a favourable interest rate for
innovative projects undertaken by SMEs (EUR 50
million). Measures to encourage innovation and
entrepreneurial investment in research (the
estimated value of the co-financing in 2013-14 is
approximately EUR 136 million) include the co-
financing of development activities and
technological investments and the purchase of
technological equipment. Further, hiring of
researchers is supported, as is the strengthening of
research in firms, and investments made in the
priority areas of smart specialisation.
Slovenia is an innovation follower671
with
performance below but close to the EU average. In
this group the country performs well. However, in
order to preserve its relative performance, it has to
overcome some specific hurdles. Although R&D
intensity increased from 1.66 % in 2008 to 2.47 %
in 2011 (sixth place in the EU), the public
contribution decreased, which may jeopardise the
attainment of the 3 % R&D intensity target by 2020,
and it is one of the challenges that need to be
managed.
The challenge is to ensure that R&D policies are
consistent and coordinated, and that they are
implemented properly. This includes the efficient
use of available resources, including from the
European Regional Development Fund. Improved
governance and clear prioritisation are essential, in
particular as efficiency gains are likely to be
available in properly implementing these
policies.672
671 Source: 2013 Innovation Union scoreboard. 672 Assessment of the 2013 national reform programme and
stability programme for Slovenia; SWD(2013) 374.
Skills
The tertiary and vocational education systems are
insufficiently geared towards meeting emerging
labour market needs. This is also reflected in the
low percentage of people with high qualifications
employed in manufacturing.673
The Commission
has proposed improvements in the vocational
training system, better cooperation with
stakeholders and better labour market need
assessment. Improving competitiveness would
require a better level of basic skills, and preserving
investment in education and training even under
budgetary restraints.674
The recently adopted labour market reform aims to
tackle the duality of the labour market and to
increase labour market flexibility, including
through labour guidance. The reform reduces the
protection of workers under permanent contracts by
simplifying dismissal procedures and increases the
protection afforded by temporary contracts. While
the reform goes in the right direction, it remains to
be seen how effective it will be.
Sustainability
Slovenia’s geographical location gives it an
important role in transit, which increases the
importance of energy and transport infrastructure.
Both could be further improved. There is a need to
develop the electricity network and meet the needs
of increasing electricity transit flows. Slovenia has
improved its gas connection with Austria and
Croatia, while a gas connection with Hungary is
under consideration. The apparent lack of
administrative capacity to prepare a comprehensive
transport strategy contributes to the
underdevelopment of the railway infrastructure.
Slovenia also needs to speed up implementing EU
Energy legislation, mainly the Third Energy
Package. At the same time an opening of its gas and
energy market is a precondition for making the
energy market more competitive. Consumers would
benefit from enhanced competition as shown by the
end of 2012 when a new gas provider entered the
market.
The transport infrastructure requires special
attention, as the country’s CO2 intensity is higher
than the EU average.675
The high emissions
intensity stems from the significant transit traffic
and the unfavourable modal split. The high volume
of freight transport, the downward trend in the use
673 Source: Eurostat. 674 Assessment of the 2013 national reform programme and
stability programme for Slovenia; SWD(2013) 374. 675
Source: Eurostat.
Country chapter: Slovenia
238
of public passenger transport and the above-average
share of transport in total energy consumption
contribute to the country’s high energy intensity.
Greenhouse gas emission targets676
in the
forthcoming national energy programme (20 %
improvement in energy efficiency by 2020 and
27 % by 2030, compared to 2008 levels) will be
very difficult to attain, in particular because of the
high contribution of the transport sector (27 % of
total emissions in 2010, the third highest share in
the EU). Transport also accounts for 38 % of total
final energy consumption, which is well above the
EU average (31.7 %). Continuing investment in
large-scale non-renewable energy projects, such as
recent plans for a new coal-fired power plant, may
crowd out investment in renewable energy sources.
The measures taken to improve energy efficiency
include the introduction of feed-in tariffs for
electricity from combined heat and power; energy
efficiency obligations for utilities; refurbishment of
public buildings; and various efficiency measures
financed through a levy on energy.
Slovenian authorities adopted in June 2012 an
action plan ‘Wood is beautiful’, which identifies
timber as a strategic raw material and the wood
processing industry as a sector with much untapped
potential. The aim is to improve the
competitiveness of the forest-wood value chain in
Slovenia by 2020. The document includes a
concrete set of objectives and implementing
measures but the link with other strategic
documents, such as the industrial policy, remains to
be seen. Slovenia is lagging behind schedule in
transposing relevant EU energy laws regarding
energy efficiency, such as the Directives on energy
efficiency and on the energy performance of
buildings. Despite the problems it is facing, in the
2011 eco-innovation scoreboard Slovenia moved up
from 10th to 7th place and is the best performing
country among the EU-10 Member States.
4.24.3 Export performance
Exports increased by 0.3 % in 2012 compared to
2011,677
which in combination with the sharp fall in
imports led to a positive net balance (+3.3 %).
However, the export market share is declining, as
the cumulative three-year loss is 6.4 %.678
This is
mainly due to the strong focus on the EU, which
has been in recession. The loss in market share
reflects lower cost and non-cost competitiveness.
676 Refers to sectors not covered by the Emissions Trading
System. 677
Source: EC Spring Forecast. 678
Source: IDR 2013.
Competitiveness is harmed by challenges in the
business environment, a rigid labour market, and
high labour costs. On the non–cost competitiveness
side, the industrial structure is dominated by low-
to-medium technology and labour-intensive firms,
although the importance of service exports is
growing.
Internationalisation is supported through
information and educational campaigns, the
organisation of inward and outward business
delegations and conferences, co-financing of trade
fairs, business clubs abroad, the development of
market analysis, and a training programme for
export planning. Most of the measures are financed
by the Ministry of Economic Development and
Technology and are carried out by a specialised
agency.679
Diversification of export markets and products
would provide increased stability to exports.
However, export policy is fragmented as many
government and non-government bodies are
involved, while monitoring results and links with
other policies, such as industrial policy, are not
clear enough. While the new industrial policy
identifies priority technology fields and key
industrial sectors in which to invest, the necessary
action plans and concrete monitoring schemes are
lacking in order to move to a more knowledge-
based economy, thus providing a stronger base for
good export performance.
4.24.4 Business environment & public
administration
Business environment
Measures such as electronic filing, payment of
social security contributions and reduction of the
corporate income tax rate have helped the country
to improve its ranking in the World Bank’s Doing
Business report from 37th to 35th place. Although
the costs and time it takes to start a business are low
(the cost is close to zero, and the number of
procedures is only two), other factors such as
administrative procedures and the time and cost
involved in dealing with construction permits lower
the overall rank in the index. It takes considerable
time and is costly to obtain a construction permit.
Complex and time-consuming licensing procedures
make the country unattractive for foreign
investment.
Changes to insolvency legislation adopted in June
2013 will improve the insolvency framework, but
679 The Public Agency for Entrepreneurship, Innovation,
Development, Investment and Tourism (SPIRIT).
Country chapter: Slovenia
239
further measures may be needed to bring about
sufficient improvement in this area as a suitable
system of incentives for owners, creditors and
managers is still lacking.
Professional services, which account for about 10 %
of value added,680
remain heavily regulated, which
limits their growth potential. In 2012, the
authorities launched a reform to review numerous
regulated professions. An inter-ministerial group
was set up and the first professions and activities to
be deregulated include the craft, tourism and
construction sectors. A small business act has been
adopted focusing on crafts, and a similar process is
being planned for other sectors and professions in
2013 and 2014.
Slovenia has also developed its Point of Single
Contact (PSC), which is based on the e-government
e-VEM (“Vse na Enem Mestu” – One Stop Shop)
portal for the online registration of businesses and
its aim is to provide transparent online publication
of information on conditions and procedures for
performing activities and professions. Despite some
progress in 2012, the information currently
provided through the PSC is focused on a limited
number of regulated activities (e.g. crafts,
construction) while online completion of
procedures is not yet possible for foreign operators.
An SME test has already been designed and tried
out on legislation. The action plan for implementing
the small business act has been adopted by the
government. The Ministry of Justice and Public
Administration introduced a revised action plan for
the removal of administrative burdens by 25 %.
Based on legislative changes made at the end of
2011, the Competition Protection Agency (CPA)
was established in January 2013, replacing the
previous Competition Protection Office. While
additional staff was transferred to the agency, the
CPA suffers from limited financial resources which
are compounded by the budget cuts of 2013.
Further amendments to the legislation to establish a
separate budget line would help to ensure its
independence and sufficient financing.
Public administration
The government effectiveness indicator is slightly
below the EU average (1.03 as against 1.18).
Slovenia scores higher in the public procurement
indicator as the administrative regulations are more
business-friendly than the EU average. The time
and cost to take part in procurement are low and the
average payment period is 15 days (28.3 days is the
EU mean). However, Slovenia has not yet adopted
680
Source: IDR 2013.
a plan for the transition to e-procurement and is one
of the Member States with the least developed
infrastructure. Although a new electronic portal was
introduced recently, electronic tenders cannot be
submitted. Currently the benefits of e-procurement,
such as greater transparency, more competition and
faster procedures, cannot be fully exploited.
The justice system still suffers from inefficiencies.
Despite recent improvements, first-instance judicial
proceedings in litigious civil and commercial cases
remain long (disposition time was 431 days in
2010). The rate of resolving litigious civil and
commercial cases is low (in 2010, the clearance rate
was 98 %), while the number of pending non-
criminal cases per inhabitant is the highest among
the Member States, although there has been some
improvement in the clearance rate recently.
However, in 2010 the clearance rate for
administrative cases was the highest in Europe (rate
of over 120 %).681
Finally, Slovenia scores high in
the corruption perception gap index (bribery and
corrupt practices in business).682
4.24.5 Finance and investment
The recession and the associated credit crunch have
created a very difficult situation for most SMEs.
The collapse of major construction companies and
corporate arrears more generally have had a
negative effect on balance sheets of banks, which
have become very reluctant to lend, particularly
avoiding the remaining, mostly smaller,
construction companies. Many businesses are over-
indebted and asset quality is deteriorating. The
volume of loans to the domestic non-banking sector
declined considerably in 2012. The situation in the
domestic banking system continued to deteriorate in
the early months of 2013, as the year-on-year
contraction in the first five months of 2013 was
8.3 %.683
Financial instruments of the Slovenian Enterprise
Fund include equity and debt financing (guarantee
fund for bank loans with subsidised interest rates,
microloans, counter-guarantees). These have helped
in providing public guarantees and venture capital
to innovative firms. Financial instruments (credits,
guarantees) were used also by SID Bank. The
Slovenian Enterprise Fund has emphasised the
importance of start-ups by supporting them with
grants in the first three years of their life. A recent
681 Source: The EU Justice Scoreboard. 682 Fraud Survey 2013. 683 Bank of Slovenia monthly bulletin, May 2013.

Country chapter: Slovenia
240
external evaluation indicated that the results of
these instruments have been positive.684
While the instruments have supported many SMEs,
a sharp fall in economic activity nonetheless has
also reduced investment opportunities, including for
innovative firms. Repairing bank balance sheets
and recapitalising viable banks are two of the most
important conditions for stabilising the economy
and, in particular, for a resumption of bank
lending.685
Although relevant legislation is in place,
just cleaning up the state-owned banks’ balance
sheets may not be sufficient, and further measures
might be needed for lending to SMEs to resume.
In a weak macroeconomic context, facilitating
investment through improving the business
environment is crucial. The economy has a low
stock of foreign direct investment (31 % of GDP in
2012,686 one of the lowest among the new Member
States).
4.24.6 Conclusions
Slovenia’s economy needs structural measures
promoting growth and competitiveness and
improving productivity. An improved business
environment could help in attracting foreign
investment and boosting exports. Currently there
are bottlenecks that hinder investment, such as long
procedures, regulated professions, lengthy judicial
proceedings and inefficiencies in insolvency
procedures.
To monitor improvements in the business
environment, evaluation of policies and monitoring
of a coherent set of indicators — at the moment
missing — are needed for coherent policy-making.
These indicators could cover policy areas such as
the labour market and education system, regulated
professions, the judicial system, business licensing
procedures, the tax environment, environmental,
energy and land use policy, and in particular access
to finance.
The banking system remains fragile and lending
constrained. Publicly supported financial
engineering products of the Slovenian Enterprise
Fund and SID Bank have worked well and helped
in providing guarantees and venture capital to
innovative firms. It is important to build on such
policy successes.
684 Expert evaluation network delivering policy analysis on
the performance of cohesion policy 2007-13. 685 OECD Economic Surveys, Slovenia, April 2013. 686 Source: Commission SWD: Assessment of the 2013
national reform programme and stability programme for
Slovenia.
Measures to promote research and innovation
continue to be essential, as in the long run these are
the road to a more knowledge-intensive economy.
While the new industrial policy identifies priority
technology fields and key industrial sectors to
invest in, the necessary action plans, concrete
monitoring schemes and coordination between key
strategic policies are critical for the economy to
take off again.
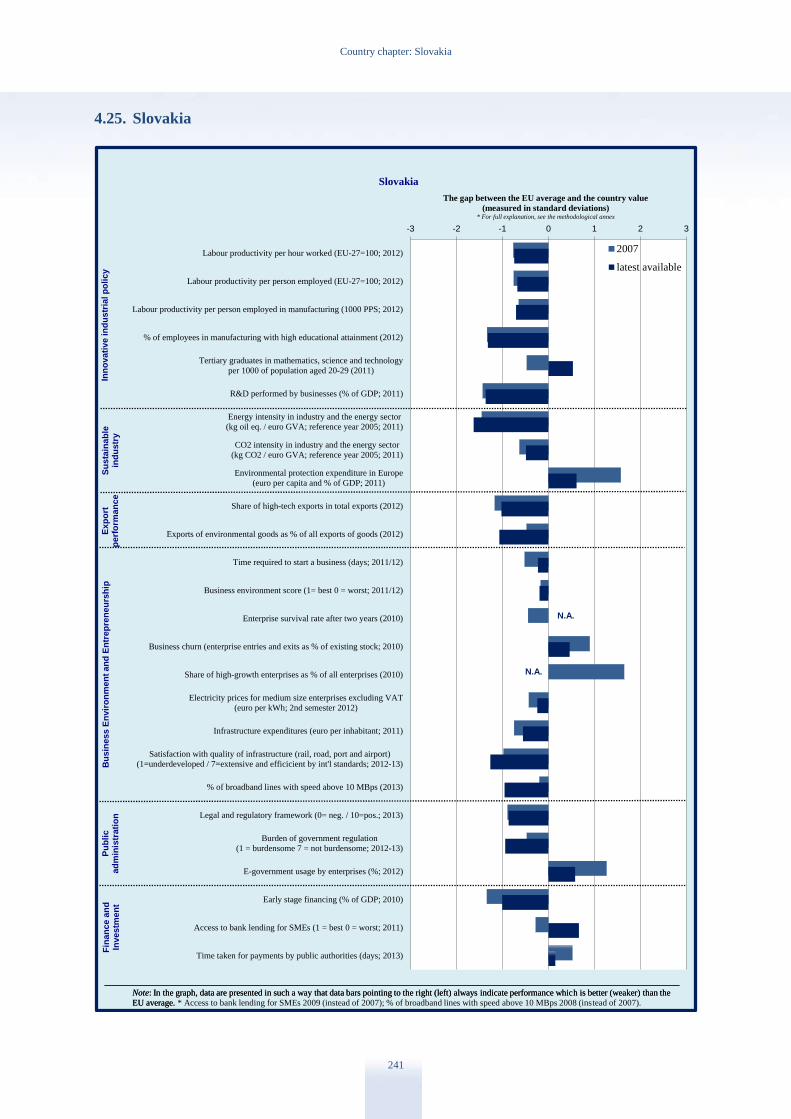
Country chapter: Slovakia
241
4.25. Slovakia
-3 -2 -1 0 1 2 3
Labour productivity per hour worked (EU-27=100; 2012)
Labour productivity per person employed (EU-27=100; 2012)
Labour productivity per person employed in manufacturing (1000 PPS; 2012)
% of employees in manufacturing with high educational attainment (2012)
Tertiary graduates in mathematics, science and technology
per 1000 of population aged 20-29 (2011)
R&D performed by businesses (% of GDP; 2011)
Energy intensity in industry and the energy sector
(kg oil eq. / euro GVA; reference year 2005; 2011)
CO2 intensity in industry and the energy sector
(kg CO2 / euro GVA; reference year 2005; 2011)
Environmental protection expenditure in Europe
(euro per capita and % of GDP; 2011)
Share of high-tech exports in total exports (2012)
Exports of environmental goods as % of all exports of goods (2012)
Time required to start a business (days; 2011/12)
Business environment score (1= best 0 = worst; 2011/12)
Enterprise survival rate after two years (2010)
Business churn (enterprise entries and exits as % of existing stock; 2010)
Share of high-growth enterprises as % of all enterprises (2010)
Electricity prices for medium size enterprises excluding VAT
(euro per kWh; 2nd semester 2012)
Infrastructure expenditures (euro per inhabitant; 2011)
Satisfaction with quality of infrastructure (rail, road, port and airport)
(1=underdeveloped / 7=extensive and efficicient by int'l standards; 2012-13)
% of broadband lines with speed above 10 MBps (2013)
Legal and regulatory framework (0= neg. / 10=pos.; 2013)
Burden of government regulation
(1 = burdensome 7 = not burdensome; 2012-13)
E-government usage by enterprises (%; 2012)
Early stage financing (% of GDP; 2010)
Access to bank lending for SMEs (1 = best 0 = worst; 2011)
Time taken for payments by public authorities (days; 2013)
The gap between the EU average and the country value
(measured in standard deviations)* For full explanation, see the methodological annex
Slovakia
2007
latest available
Note: In the graph, data are presented in such a way that data bars pointing to the right (left) always indicate performance which is better (weaker) than the
EU average.
Inn
ov
ati
ve in
du
str
ial p
oli
cy
Su
sta
ina
ble
ind
ustr
yB
us
iness E
nv
iro
nm
en
t an
d E
ntr
ep
ren
eu
rsh
ipF
ina
nce a
nd
Investm
en
t
Note: In the graph, data are presented in such a way that data bars pointing to the right (left) always indicate performance which is better (weaker) than the
EU average. * Access to bank lending for SMEs 2009 (instead of 2007); % of broadband lines with speed above 10 MBps 2008 (instead of 2007).
Ex
po
rtp
erf
orm
an
ce
Pu
bli
cad
min
istr
ati
on
N.A.
N.A.

Country chapter: Slovakia
242
Figure 4.23: Sectoral specialisation of manufacturing – Slovakia (2010)
Note: No data available for sectors C12 (tobacco products) and C19 (coke and refined petroleum products)
Source: Eurostat
4.25.1 Introduction
Slovakia’s economy grew by 2 % in 2012, one of
the highest growth rates in the EU. The production
of some export-driven manufacturing sectors
reached record levels, with car plants operating at
close to full capacity. However, construction
contracted by 12.5 % due to the weakness of
domestic demand. Good external competitiveness
and lower imports brought the current account into
balance in 2012. The recovery slowed down in the
first half of 2013, but is expected to rebound due to
stronger private investment and external demand.
Manufacturing continues to play a prominent role
in the economy. The capital-intensive and
technology-driven industrial sectors such as
automotive, electronics and metals in which
Slovakia specialises increased their share in total
EU manufacturing from 0.63 % in 2007 to 0.82 %
in 2012. Based on unit labour costs, Slovak industry
is among the most competitive in the ‘catching-up’
Member States. It has benefited from transfers of
advanced technology based on foreign direct
investment and manufacturing has become more
productive in the past decade. However, the short-
term potential for further leaps seems limited.
Services constitute a relatively small part of the
economy and have not been able to match the
productivity improvements in manufacturing.
4.25.2 Innovation, skills and
sustainability
Innovation
The innovation capacity of the economy has
improved somewhat in recent years, moving
gradually towards higher knowledge-intensity.
Overall, the performance of the R&D system
remains below the EU average. Technology spill-
overs from the foreign direct investment of the last
decade have been a major driver of innovation in
production. The lack of domestic R&D capacity has
given rise to a split between highly productive
export-oriented multinationals and a domestic
sector consisting largely of SMEs and a few large
companies with low productivity and innovation
capacity.
The lack of excellence in research and the quality
of tertiary education remain major challenges, as
can be seen from the low number of internationally
cited scientific publications. The generation of
intellectual assets and patent revenues has been low
by international comparison. Limited cooperation
between businesses and research institutions further
contributes to the low presence of innovative
enterprises. However, the number of new doctoral
graduates and young people with upper secondary
level education are relative strengths of the system.
Food, beverages and
tobacco
7.80%
Textiles, apparel and
leather
3.76%
Wood, paper and
printing
8.47%
Chemicals, pharma,
petroleum, minerals
and rubber 14.48%
Metals
9.51%
Electronics, electrics
and machinery
22.07%
Cars and transport
17.16%
Other
6.82%

Country chapter: Slovakia
243
After two decades of gradual decline, total R&D
expenditure recovered to 0.68 % of GDP in 2011 –
still one of the lowest in the EU.687
The limited
cooperation between science and business is also a
reflection of low private research investment.
Public R&D spending has increasingly relied on
EU structural funds.688
To achieve its national R&D
intensity target of 1.2 % by 2020, Slovakia would
need to increase its public and private investment
by about 5 % a year.
Slovakia’s innovation policy is based to a large
extent on grants. Tax breaks for applied research
have been used since 2009, but represent only a
very small part of total R&D support.689
The
innovation strategy for 2007-13 sets a general
framework and the 2011-13 innovation policy has
specified actions in three priority areas:
infrastructure, quality of human resources, and
support for innovation in industry. Most money is
spent on the latter.
In 2012, the government launched new calls to
support (i) applied research and development in
industry (EUR 34 million) and (ii) technology
transfer (EUR 150 million). Innovation vouchers
have also been launched which give SMEs access
to the services of public research facilities. A new
scheme comprising financial and non-financial
support has been designed for innovative clusters.
The government has also started preparing the
2014-20 innovation strategy, under which it plans
to further develop business incubators that will be
attached to university science parks and selected
research facilities. A new scheme similar to the
existing small business innovation research
programme is in preparation.
Skills
The number of tertiary graduates studying science
and technology has risen above the EU average in
recent years, but there is still a shortage in technical
studies. In addition, there are not enough job-
oriented bachelor degrees compared to competitors.
687 3.88 % in 1989, 0.66 % in 1999, 0.48 % in 2009, 0.63 % in
2010. 688 In 2012, 81 % of R&D funds came from the R&D
Operational Programme (OP), whereas innovation policy measures were almost completely funded by the
Competitiveness and Growth OP. 689 2.1 % in 2011.
The low proportion690
of people with high
qualifications (in particular with labour market
relevance) employed in manufacturing suggests that
shortcomings in the education system have created
skills shortages and structural mismatches in the
labour market. Although the vocational training
system was revised to improve the match with
labour demand, the provision of work-based
learning in companies for students in vocational
education and training is low. Tertiary level
education was also reformed, strengthening internal
quality assurance systems and encouraging
internationalisation. In the longer run, there are
concerns about the level of public spending on
education, which is one of the lowest in the EU as a
share of GDP.
Sustainability
High energy prices and structural and technological
changes have been the main drivers of a reduction
in energy intensity. In spite of continued progress,
Slovak industry691
was the fourth692
most energy-
intensive in the EU in 2011. The greening of the
economy is a policy challenge, in particular due to
the relatively high of energy-intensive industries
(e.g. aluminium and steel production). Although the
CO2 intensity of industry has continued to decline,
no improvement has been observed since 2009 for
the economy as a whole.693
The volume of waste generated by industry has
been declining since 2006, suggesting a decoupling
from growth. In 2011, Slovakia used landfills for
75 % of its municipal waste (80 % in 2010) and
material recycling has remained at 4 %, which is
one of the worst rates in the EU. Apart from a
recycling fund, there were no specific policies in
2012 on the industrial re-use of waste or spreading
green business models. On the basis of a new law,
preparations are being made for a transition from
landfills to waste recycling and recovering energy
and material. A new waste management strategy
will also be prepared by 2016.
Policy on energy efficiency is predominantly driven
by the implementation of EU structural fund
programmes. The national energy efficiency action
690 9.7 % as compared with the EU average of 19.2 % in
2011. 691 Including the energy sector. 692 Fifth in 2010. 693 0.47 CO2e/GDP in 2009 and 2010.
Country chapter: Slovakia
244
plan for 2011-13 is expected to achieve a 2.7 %
reduction in final energy consumption as compared
with the 2001-05 average. Most savings are to be
achieved by industry (30 %), the public sector
(27 %) and buildings (21 %). The national energy
efficiency monitoring system is now in operation.
Together with the European Bank for
Reconstruction and Development, the Slovak
Innovation and Energy Agency has implemented a
pilot programme on energy efficiency in public
buildings. In 2013, the government started
preparing the national energy efficiency action plan
for 2014-16.
4.25.3 Export performance
Exports have been a major source of recent
economic growth. Foreign direct investment has
primarily gone to export-oriented manufacturing
and has significantly contributed to the
restructuring of the economy, which is open and
well integrated in the global economy, in particular
the single market, as a result. The trade surplus was
over 3 % of GDP in 2012, bringing the current
account into balance. The share in EU exports of
goods and services went up from 0.98 in 2007 to
1.18 % in 2012. The export market share694
grew
annually by more than 50 % between 2004 and
2008, but growth has since slowed (to 4.8 % in
2012), partly due to lower inflows of foreign
investment.
The main exports include cars and car components,
consumer electronics, machinery and metal
products; services play a much smaller role. The
proportion of total exports accounted for by high-
tech goods increased slightly to 6.6 % in 2011,
whereas that accounted for by non-financial
knowledge-intensive services is one of the lowest in
the EU. In comparison to similar-sized economies
in the EU, the domestic value-added content of
exports was relatively low,695
as imports were
essential for the export capacity of a small
economy.
To facilitate exports by domestic enterprises, the
government has decided to increase the capital of
the state-owned Slovak Export-Import Bank. The
capital hike will boost the bank’s guarantee and
risk-coverage capacity by EUR 463 million and
694 Shares in world exports of goods and services. 695 OECD-WTO Trade in value added indicators.
enable it to focus more on fast-growing higher-risk
markets such as Russia, Vietnam and Indonesia.
4.25.4 Business environment and public
administration
Business environment
As in the previous year, Slovakia was 46th in the
World Bank ranking on the ease of doing business.
The legislative and regulatory framework for
businesses remains complex and is subject to
frequent change. A comprehensive strategy to
improve the business environment was adopted in
2011 and updated with new measures in 2013.
While over 50 measures have been implemented
since 2011, it appears that the goal of reducing the
administrative burden on business by 2012 has not
been fully achieved.696
The government will assess
the costs of the administrative burden again in
2014.
The 2013 national reform programme contained an
explicit target of reaching 15th position in the
World Bank ranking by 2020 and lowering the
OECD product market regulatory index to 1.2 (1.54
in 2008). To achieve this, the plan is to remove
regulations that may distort competition in
professional services, including possibly restricting
mandatory membership in professional chambers.
Competition in the energy sector has improved in
recent years, but the fact that few consumers are
switching their provider (1.6 % of industrial users
and 0.8 % of households) does not make for a
dynamic market. Electricity prices for medium-
sized industrial consumers are among the highest in
the EU. This appears to be due less to taxes or
generation prices than to high network tariffs. The
network tariffs cover not only costs and the profit
margin of distribution companies and the state-
owned grid operator, but also the support for
renewable energy sources, domestic coal
production and co-generation.
Feed-in tariffs for renewable energy sources have
been lowered because the costs of renewable
energy, particularly photovoltaic, have declined
significantly. To achieve the emission reduction
target in the energy sector, there are plans to review
696 The 2013 National Reform Programme indicates that it
has been achieved by about 60 %.
Country chapter: Slovakia
245
the support given to domestic coal production,
which has been cross-subsidised from higher
network tariffs.
The time needed to start a business was reduced to
three days for those needing a trade licence and to
two days for registering a company in court. Many
other entrepreneurship indicators are below EU
average, partly because attitudes towards
entrepreneurship are not positive enough and it is
not encouraged by schools.
The government intends to launch an e-building
code covering zoning procedures and regional
development, which would enable citizens and
entrepreneurs to handle the entire construction
permit procedure by electronic means. To avoid
frequent changes in legislation with significant
impact on businesses, the government’s legislative
rules contain a new vacatio legis obligation
whereby new legislation on taxation and social
security can enter into force only on 1 January of a
given year.
Slovakia’s location between eastern and western
European markets makes great demands on its
transport infrastructure. Although satisfaction with
the quality of infrastructure increased between 2008
and 2012, in eastern regions poor infrastructure is a
brake on productivity. The government plans to
start the construction of around 120 km of new
motorways by 2014, despite delays caused by
procurement difficulties.
Public administration
The public administration suffers from weaknesses
that reduce its effectiveness and undermine its
independence. The 2011 Worldwide Government
Effectiveness indicator ranked Slovakia 19th in the
EU. Modern human resources management
methods are not used enough. A high turnover of
staff and a lack of transparency in recruitment
practices increase the scope for political meddling,
which is not conducive to an independent civil
service. Weak analytical capacity hampers the
design and implementation of policies and the
ability to assess regulatory impact. There is no ex-
ante SME test and impact assessments are often
formalistic, with a tendency to focus only on fiscal
impact. There is no independent body to evaluate
the quality of impact assessments. To improve the
situation, the government has created analytical
units in key ministries.
In 2012, the government launched a major reform
of the public administration. Initially, the main
objective is to streamline the organisational
structure of local and district-level state
administrations and integrate their customer service
functions into single contact points. As part of the
reform, all ministries and central government
bodies will be subject to functional audits that will
identify duplication and the potential for process
improvements, and rationalise the management of
state assets (such as buildings). At a later stage, the
reform should be extended to human resources
management.
Judicial proceedings for civil and commercial cases
remain lengthy, in particular as regards
insolvencies.697
To address this, the government has
started to prepare a completely new code of civil
procedures that should come into force in 2015. It is
also improving courts’ IT systems so that case-file
life-cycles will be fully electronic by 2014.
Perceptions of corruption698
continue to be high.
Individual experiences of corruption and irregular
payments by firms are not uncommon. There are
serious concerns as to the capacity of law
enforcement and judicial authorities to investigate
and prosecute corruption offences.699
Despite improved transparency, irregularities in
public procurement have persisted and the average
number of bids was among the lowest in the EU in
2011, indicating a very low level of competition. To
address this, the Public Procurement Act has been
amended to create a central electronic market that is
obligatory for small tenders. A new appeals body700
consisting of a majority of external members has
been created to scrutinise decisions by the public
procurement office. Also, the office’s resources and
staffing have been strengthened significantly.
While the use and availability of e-government
services for businesses are above and close to the
EU average, respectively, a lot remains to be done
697 EU Justice Scoreboard 2013. 698 Transparency International ranked Slovakia 62nd in its
global corruption perception index. 699 OECD Report on implementing the OECD Anti-Bribery
Convention in the Slovak Republic, June 2012. 700 Board of the Public Procurement Office.
Country chapter: Slovakia
246
to improve such services for citizens.701
Other areas
for improvement are internal government
transactions and the interoperability of databases
across public institutions. To this end, a central
public administration portal is being implemented,
as is an act on electronic operations by public
authorities.
4.25.5 Finance and investment
The financing conditions and standards for SMEs
have been tightened since 2009. The share of loan
applications rejected went up from 19 % in 2010 to
25 % in 2011, as compared with an EU average of
15 %. Although the volume of loans to non-
financial firms702
continued to grow moderately for
a while, it started to decline in 2012 (- 3.6 %) as the
economy slowed.
Little progress has been achieved in developing
stock exchanges and the venture capital market.
The lack of equity finance means that bank loans
are crucial for SMEs and start-ups. As a part of the
Jeremie scheme for structural funds, the Slovak
Guarantee and Development Fund has introduced
(i) a first loss guarantee and (ii) a risk capital
instrument. The first guarantee agreements were
signed in April 2013, allowing participating banks
to provide up to EUR 170 million of new loans to
SMEs. The risk capital instrument should be
launched later in 2013.
In spite of shortcomings in the business
environment, Slovakia is a favourable investment
location due to its geographical position, cost
competitiveness and stable macroeconomic
environment. Investment in equipment remained
very strong in 2010-12, accounting for more than
10 % of GDP — one of the highest rates in the EU.
The Slovak Investment Promotion and Trade
Development Agency attracts more and more new
investment in sectors with high added value. The
regional focus has shifted more towards fast-
growing markets, including Russia, China, South
Korea and the rest of South-East Asia. In line with
the cohesion policy objective, investment support
701 Digital Agenda for Europa; Global e-government
development index (UN) in 2012. 702 National Bank of Slovakia — statistics on loans granted
between January and December 2012.
programmes and state aid rules favour Slovakia’s
less developed eastern regions.
4.25.6 Conclusions
Improving productivity and competitiveness have
made the Slovak economy more attractive. The
challenges in education and the R&D system limit
the longer-term potential, as innovation capacity
can be built up and the move towards a more
knowledge-based economy can take place only
relatively slowly.
The multinationals are highly productive, but the
main policy challenge is to boost innovation and
knowledge intensity in domestic firms, in particular
SMEs, and to invest more in education.
Improvements in public administration and the
judiciary would help businesses and the investment
climate. Further challenges are posed by the high
energy intensity and rather high energy prices, in
particular for some business segments.
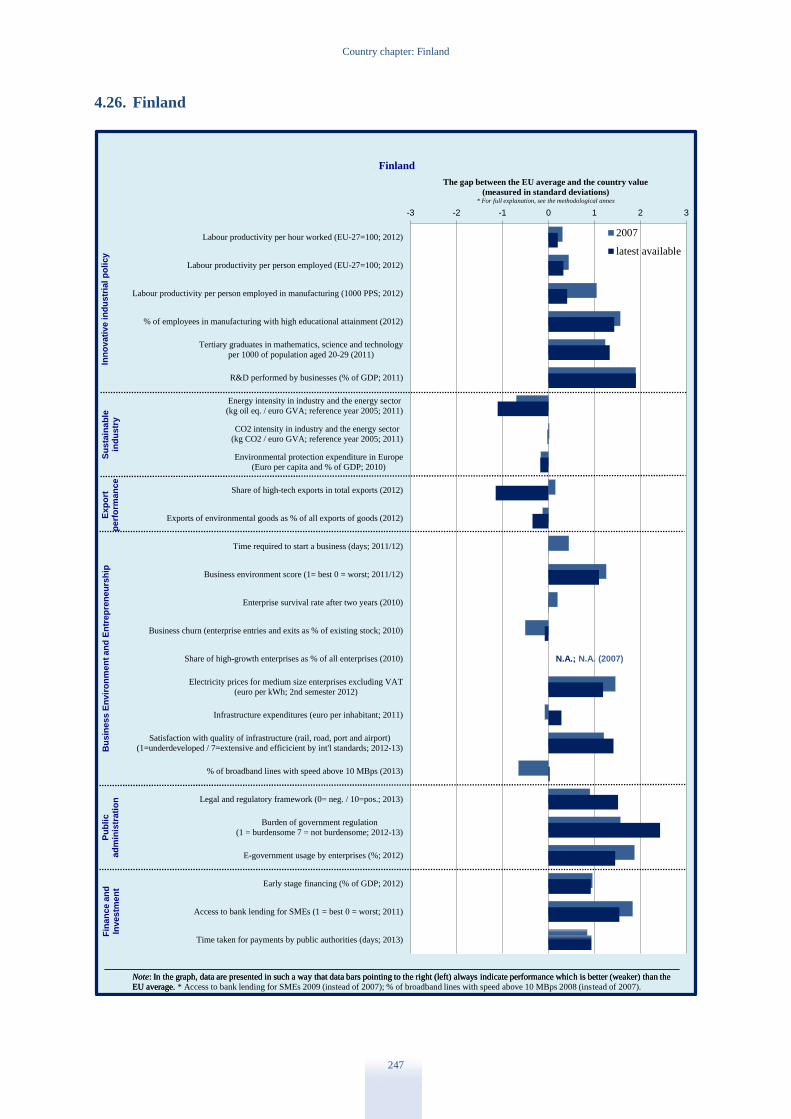
Country chapter: Finland
247
4.26. Finland
-3 -2 -1 0 1 2 3
Labour productivity per hour worked (EU-27=100; 2012)
Labour productivity per person employed (EU-27=100; 2012)
Labour productivity per person employed in manufacturing (1000 PPS; 2012)
% of employees in manufacturing with high educational attainment (2012)
Tertiary graduates in mathematics, science and technology
per 1000 of population aged 20-29 (2011)
R&D performed by businesses (% of GDP; 2011)
Energy intensity in industry and the energy sector
(kg oil eq. / euro GVA; reference year 2005; 2011)
CO2 intensity in industry and the energy sector
(kg CO2 / euro GVA; reference year 2005; 2011)
Environmental protection expenditure in Europe
(Euro per capita and % of GDP; 2010)
Share of high-tech exports in total exports (2012)
Exports of environmental goods as % of all exports of goods (2012)
Time required to start a business (days; 2011/12)
Business environment score (1= best 0 = worst; 2011/12)
Enterprise survival rate after two years (2010)
Business churn (enterprise entries and exits as % of existing stock; 2010)
Share of high-growth enterprises as % of all enterprises (2010)
Electricity prices for medium size enterprises excluding VAT
(euro per kWh; 2nd semester 2012)
Infrastructure expenditures (euro per inhabitant; 2011)
Satisfaction with quality of infrastructure (rail, road, port and airport)
(1=underdeveloped / 7=extensive and efficicient by int'l standards; 2012-13)
% of broadband lines with speed above 10 MBps (2013)
Legal and regulatory framework (0= neg. / 10=pos.; 2013)
Burden of government regulation
(1 = burdensome 7 = not burdensome; 2012-13)
E-government usage by enterprises (%; 2012)
Early stage financing (% of GDP; 2012)
Access to bank lending for SMEs (1 = best 0 = worst; 2011)
Time taken for payments by public authorities (days; 2013)
The gap between the EU average and the country value
(measured in standard deviations)* For full explanation, see the methodological annex
Finland
2007
latest available
Note: In the graph, data are presented in such a way that data bars pointing to the right (left) always indicate performance which is better (weaker) than the
EU average.
Inn
ov
ati
ve in
du
str
ial p
oli
cy
Su
sta
ina
ble
ind
ustr
yB
us
iness E
nv
iro
nm
en
t an
d E
ntr
ep
ren
eu
rsh
ipF
ina
nce a
nd
Investm
en
t
Note: In the graph, data are presented in such a way that data bars pointing to the right (left) always indicate performance which is better (weaker) than the
EU average. * Access to bank lending for SMEs 2009 (instead of 2007); % of broadband lines with speed above 10 MBps 2008 (instead of 2007).
Ex
po
rtp
erf
orm
an
ce
Pu
bli
cad
min
istr
ati
on
N.A.; N.A. (2007)
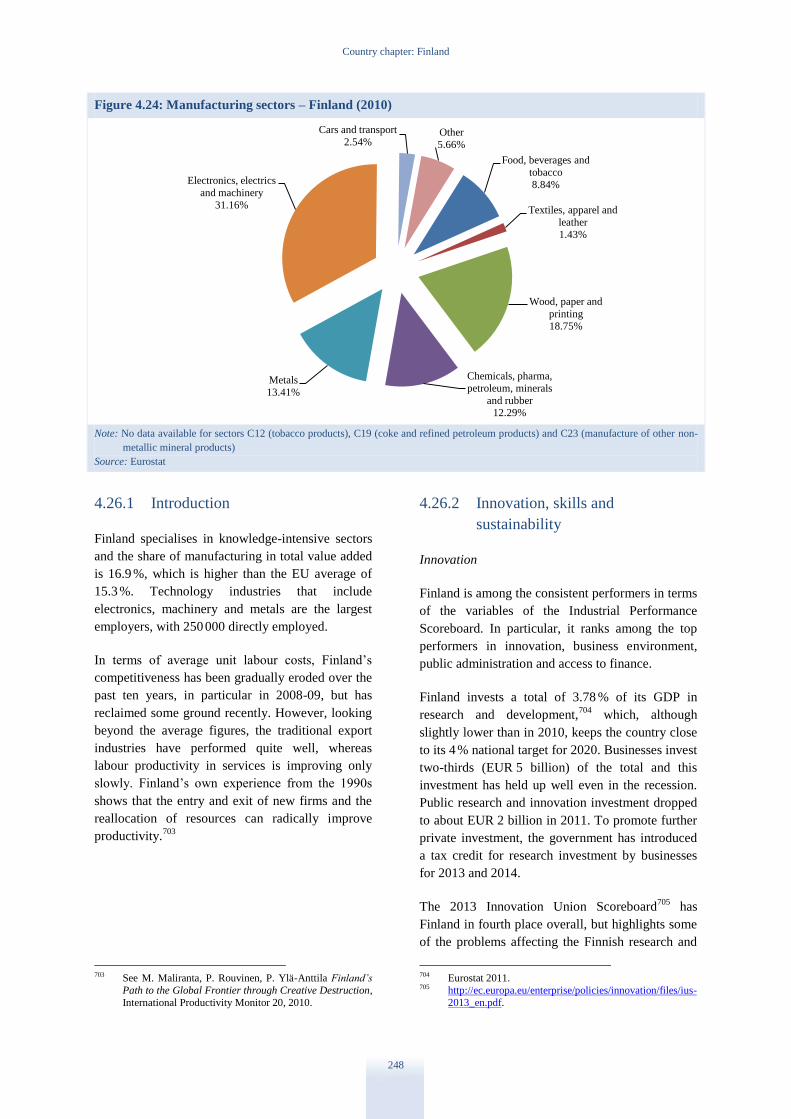
Country chapter: Finland
248
Figure 4.24: Manufacturing sectors – Finland (2010)
Note: No data available for sectors C12 (tobacco products), C19 (coke and refined petroleum products) and C23 (manufacture of other non-
metallic mineral products)
Source: Eurostat
4.26.1 Introduction
Finland specialises in knowledge-intensive sectors
and the share of manufacturing in total value added
is 16.9 %, which is higher than the EU average of
15.3 %. Technology industries that include
electronics, machinery and metals are the largest
employers, with 250 000 directly employed.
In terms of average unit labour costs, Finland’s
competitiveness has been gradually eroded over the
past ten years, in particular in 2008-09, but has
reclaimed some ground recently. However, looking
beyond the average figures, the traditional export
industries have performed quite well, whereas
labour productivity in services is improving only
slowly. Finland’s own experience from the 1990s
shows that the entry and exit of new firms and the
reallocation of resources can radically improve
productivity.703
703 See M. Maliranta, P. Rouvinen, P. Ylä-Anttila Finland’s
Path to the Global Frontier through Creative Destruction,
International Productivity Monitor 20, 2010.
4.26.2 Innovation, skills and
sustainability
Innovation
Finland is among the consistent performers in terms
of the variables of the Industrial Performance
Scoreboard. In particular, it ranks among the top
performers in innovation, business environment,
public administration and access to finance.
Finland invests a total of 3.78 % of its GDP in
research and development,704
which, although
slightly lower than in 2010, keeps the country close
to its 4 % national target for 2020. Businesses invest
two-thirds (EUR 5 billion) of the total and this
investment has held up well even in the recession.
Public research and innovation investment dropped
to about EUR 2 billion in 2011. To promote further
private investment, the government has introduced
a tax credit for research investment by businesses
for 2013 and 2014.
The 2013 Innovation Union Scoreboard705
has
Finland in fourth place overall, but highlights some
of the problems affecting the Finnish research and
704 Eurostat 2011. 705 http://ec.europa.eu/enterprise/policies/innovation/files/ius-
2013_en.pdf.
Food, beverages and
tobacco
8.84%
Textiles, apparel and
leather
1.43%
Wood, paper and
printing
18.75%
Chemicals, pharma,
petroleum, minerals
and rubber 12.29%
Metals
13.41%
Electronics, electrics
and machinery
31.16%
Cars and transport
2.54% Other
5.66%

Country chapter: Finland
249
innovation system. It is widely recognised,
including by the government, that the innovation
system lacks sufficient international exposure and
that attracting international knowledge workers to
Finland is difficult.
Although Finnish growth companies are growing
faster and become bigger than their rivals in other
Nordic countries, they are too few in number to
contribute decisively to structural change in the
economy. In particular, there are not enough new
innovation-based and growth-oriented enterprises.
One reason is that entrepreneurship and
management skills remain weak, although the
entrepreneurial culture has improved significantly
over the past few years.706
Currently, most new innovative activity in Finland
is focused on ICT, software and games.707
To
provide a broader base for innovation, the Smart
Cities programme708
has created platforms for
innovative solutions in urban environments by
bringing together the main players in the innovation
cycle. The government is also implementing the
recommendations of a high-level group report on
ICT competitiveness (Frictionless Finland),
including a new national service infrastructure and
increased seed and growth funding for start-ups.
To foster research cooperation aimed at
breakthrough innovations, there are six Strategic
Centres for Science, Technology and Innovation
(SHOKs), public-private partnerships focusing, for
example, on bio-economy, forestry and health. A
2013 evaluation of the Centres concluded that they
had not fully lived up to their promise and progress
could have been faster.709
On the basis of the
evaluation, the managers of the Centres (which are
private firms) have decided to take steps to sharpen
focus, enhance networking, increase competition
for funding, and improve management.
A sharper focus on knowledge transfer and on a
more active role for the universities could help to
bridge the gap between research and businesses. To
this end, the government is developing better
706 http://www.nordicinnovation.org/Global/_Publication
s/Reports/2013/NGER_2012_FINAL_inclApps.pdf. 707 Based on Tekes’ view of the funding proposals (see
footnote 9). 708 Run by Tekes:
http://www.tekes.fi/programmes/Kaupunki. 709 http://www.tekes.fi/u/Licence_to_SHOK.pdf.
indicators on knowledge transfer to compare
university performance. To achieve sufficient
critical mass in their commercial efforts, there is
plenty of scope for the universities to cooperate
more and become more specialised. They could
also strengthen the link between basic and applied
research. The government is looking at Tekes710
programmes to promote growth entrepreneurship
by combining technical research and
commercialisation.
Skills
The overall well-performing education system and
highly skilled workforce will help in reallocating
resources. Finland has a high share of science,
technology, engineering and mathematics (STEM)
graduates711
and has already reached its national
tertiary attainment target for 2020. However, there
is further potential to reform the sector, in particular
to achieve efficiency gains in higher education, and
shorten the time to graduate, which is now one of
the longest in the OECD.
Further targeted support for improving the skills of
particular groups such as older and low-skilled
workers and unemployed young people could help
overcoming emerging skills shortages. The new
youth guarantee system is based on public-private
partnership involving authorities, trade unions and
young people. The government has also reformed
and decentralised the guidance system for the
transition to working life.
Sustainability
On sustainable industrial policy, the government is
analysing how best to increase energy and material
efficiency, with material audits being gradually
deployed as planned in the government’s resource
efficiency programme. It is expected that a new
materials efficiency programme, currently in
preparation, will be presented by autumn 2013.
Meanwhile, waste streams to landfill sites have
been considerably reduced, with a tax of
EUR 50/tonne and increased energy recovery and
recycling.
710 Tekes is the Finnish Funding Agency for Technology and
Innovation. 711 Finland has 24.2 graduates per 1.000 young people age
20-29 in 2010, in comparison to 14.4 for the EU average
in 2009.
Country chapter: Finland
250
According to preliminary data, total greenhouse gas
emissions in 2012 amounted to 61.4 million tonnes
of carbon dioxide equivalent, which is 8 % lower
than in 2011, and well below the commitment made
in the Kyoto Protocol.712
The share of renewable
sources in gross final energy consumption in 2010
was over 32 %, which is almost three times as high
as the EU average of 12.5 %.
Finnish industry continues to be considerably more
energy-intensive than the EU average or its closest
competitors. Although this reflects the dominance
of process industries and the forestry industry, for
example, produces itself most of the energy it uses,
using less energy and raw materials for each euro of
value added would be desirable.
Electricity users continue to benefit from the
competitive Nordic electricity pool and electricity
prices for medium-sized enterprises are among the
lowest in the EU. A second electricity link to
Estonia is being constructed and possible ways of
exporting electricity to Russia are under
consideration. By 2014, smart electricity meters
will be installed for close to 100 % of all customers.
The government is preparing three action plans on
advanced manufacturing technologies: sustainable
mining, bio-economy, and an update on the energy
and climate strategy. The action plans are also
designed to support the implementation of the
government’s raw materials strategy. Specific
attention has been paid to bio-based products,
where the challenge is access to the requisite raw
materials. Currently, the focus is on expanding the
sustainable use of forest-based biomass in products
like bio-oil, nanocellulose or biodiesel.
The government is also trying to expand the
markets for cleantech products, in particular
through public procurement. The goal is to procure
cleantech solutions for EUR 300 million annually.
However, although there seems to be considerable
interest in cleantech among entrepreneurs, in
practice not many of them have been able to
develop tangible business activities.
712 Statistics Finland;
http://www.stat.fi/til/khki/index_en.html.
4.26.3 Export performance
Finland’s current account balance has been on a
downward trend for 10 years and is expected to stay
negative (forecast -1.2 % in 2015). Although there
was a slight trade surplus in 2012,713
this was due to
imports shrinking more than exports. Export growth
is expected to stay sluggish in 2013, but the
prospects should improve in 2014-15 as world
growth is likely to take off.
The difficulties in exports are caused by the
structural change in the electronics industry (Nokia
transferring production out of Finland) and the
difficulties of the forestry industry. This has been
echoed throughout the economy, as Finnish small
and medium-sized enterprises (SMEs) mostly serve
multinational companies instead of exporting
themselves. The difficulties of the leading
industries have made this strategy less viable and
SMEs’ growth prospects would benefit from
identifying potential for export growth and
expanding to international markets.
The gradual closing of Nokia production in Finland
has created a need for structural adjustment and a
transfer of resources to new growing enterprises.
By late 2012, about 70 % of ex-Nokia employees
were in employment, in training or had started a
business,714
but the net effect of the closures will
become evident only as the compensation packages
come to an end towards late 2013.
The government adopted a strategy on the
internationalisation of SMEs in 2011 and has
sought to give it new impetus by combining it with
the ‘Team Finland’ initiative, which has recently
brought all actors working for export and foreign
investment promotion under the same strategic
umbrella under the Prime Minister. The initiative
has a global network of 72 teams and a set of
regional contact points in Finland.
As regards its position in global value chains
through the domestic value-added content of
exports, Finland is among the middling performers,
with slightly less than 68 % of the value added
produced in the country. The government is
reviewing policy options as to how to increase the
713 Bank of Finland statistics. 714 Government estimates.
Country chapter: Finland
251
proportion of value added that Finland could
capture from global value chains.
4.26.4 Business environment and public
administration
Business environment
Finland scores highly on business environment,
entrepreneurship and SME-related indicators. The
effective and well-functioning public
administration, the stable legal system and lack of
corruption contribute to the high scores. In addition,
Finland remains the EU leader in entrepreneurship,
with the highest overall score of all EU countries.
Entrepreneurs are valued highly and growth
entrepreneurs are given a high profile in the media.
In total, 45 % of Finns think it would be feasible for
them to start their own business (EU average
28 %),715
but Finnish entrepreneurs are often
satisfied with moderate business growth and only
about 8 % are oriented towards rapid growth.
The modern and efficient environment is also
reflected in the use and availability of e-
government services, both of which are well above
the EU average.716
The use of e-commerce is also
well above EU average, although the penetration of
broadband lines is only just better.
The government has recently recognised many of
the challenges posed by the few growth firms717
and
has outlined a general strategy to increase labour
input and productivity in the economy. It seeks to
build a stronger ecosystem for growth, in particular
as regards management skills and smart money.
The administrative burden for businesses, though
not high, had not been reduced noticeably by the
first half of 2012,718
despite government policy
efforts. In particular, the burden relating to
employing people and paying taxes has not changed
and no substantial new reductions are in sight. The
715 http://ec.europa.eu/enterprise/policies/sme/facts-figures-
analysis/performance-review/files/countries-sheets/2012/finland_en.pdf.
716 https://ec.europa.eu/digital-agenda/node/640. 717 See Industrial Competitiveness Approach — Means to
Guarantee Economic Growth in Finland in the 2010s;
Ministry of Employment and the Economy, 2013. 718 https://www.tem.fi/files/32917/TEMrap_15_2012.pdf.
adoption of reverse VAT719
could bring down costs
for firms in the long run.
Legislative impact assessments have been
performed since 2007, but Finland does not
currently have an impact assessment board to
evaluate their quality. Efforts to improve the quality
of assessments include providing support for
ministries and reviewing assessments ex-post.
The positive environment for business start-ups is
reflected in the services available. The Enterprise
Finland website provides a one-stop shop for
information on assistance available to companies
and entrepreneurs, especially SMEs.720
For the
majority of firms, all paperwork can now be done
through this web portal, which also provides access
to the ‘point of single contact’ (PSC), with
information for businesses at all stages of business
life cycle.
The corporate tax rate was slightly above the EU
average in 2012721
but the government decided in
2013 to lower the nominal rate to 20 % to promote
growth and employment.
There is not enough competition in retail trade and
some services, and this reduces incentives to
improve productivity. The government has
introduced measures to promote retail competition
and a general initiative to promote sound and
efficient competition that will first affect utilities
and state-owned entities. A legislative initiative has
been taken which is designed to allow the
Consumer and Competition Authority to intervene
in cases where competition neutrality between
public and private operators is not respected. This
will be presented to parliament in the first half of
2013. The government is also evaluating obstacles
to competition in city planning and construction,
the non-profit sector, waste disposal,
pharmaceuticals and digital services.
719 In reverse VAT, the buyer pays the tax due to the
authorities, not the seller. 720 http://www.yrityssuomi.fi/web/enterprise-finland. 721 In 2012, the nominal rate was 24.5 % (EU average
23.2 %) and the mean effective rate 23.3 % (EU average 21.1 %). See “Final report 2012: Effective Tax Levels
Using the Devereux/Griffith Methodology”, ZEW Project
for the European Commission TAXUD/2008/CC/099.

Country chapter: Finland
252
Public administration
Public administration in Finland is generally
efficient and well-functioning. Currently, the
country is seeking to reform its municipalities,
aiming to establish larger, more efficient service
providers in health and social services. Besides the
scope for administrative efficiency, the reforms will
have other effects. The impact on public
procurement remains to be seen, but could include
increased competition and more impartial decision-
making. On the other hand, there is a danger that
bigger municipalities could mean bigger lots,
favouring bigger firms and discriminating against
SMEs. At central government level, this is being
addressed through specific procurement procedures
for SMEs, and similar approaches might also be
beneficial in larger municipalities.
4.26.5 Finance and investment
Although SMEs’ access to finance has not
traditionally been a problem in Finland, recent
anecdotal evidence suggests that the situation is
deteriorating. Loan conditions seem to be
tightening, although projects considered as ‘good’
by the banks can still secure financing. At the same
time, alternatives to bank lending are gradually
gaining a foothold, including venture capital and
emerging small-scale platforms for peer-to-peer
funding.
Productive investments are expected to continue to
shrink in 2013 and new investment in machinery, in
particular, is likely to be exceptionally low due to
the uncertain demand.722
To facilitate innovation and growth, the
government has committed itself to considerable
increases in its investments in venture capital funds.
It aims to attract private investors through an
asymmetrical reward structure favouring private
over public investors and make Tekes the key
investor for high-tech and high-growth firms.
The Team Finland initiative also seeks to attract
foreign direct investment to the country, a partial
response to close-to-zero net foreign direct
investment in 2008-11.723
722 Bank of Finland estimate. 723 Bank of Finland estimate.
4.26.6 Conclusions
Finland ranks among the top performers on many
competitiveness indicators, but has underlying
problems that need to be addressed to preserve its
good performance. In particular, the difficulties of
the telecommunications and forestry industries
mean that structural change is necessary. However,
whether resources are being reallocated to new
firms on a sufficient scale to have a visible effect on
growth and exports remains to be seen.
Some innovative enterprises are expanding rapidly
and contributing to growth, but they are too few in
number. Overall, the disappointing export
performance reflects the limited internationalisation
of SMEs, which need to become more international
and access new markets. Finnish SMEs would
benefit from a stronger ecosystem for firm growth,
in particular expanding access to management skills
and smart money. The government has initiated
policies that seek to address these deficiencies, but
the results will be evident only over time.
In a global environment where many countries are
rapidly reducing the administrative burden on
business, no country can afford to stand still.
Finland has the potential to further reduce this
burden, in particular as progress so far has been
very limited. It could also improve productivity by
increasing competition in retail trade and some
services.
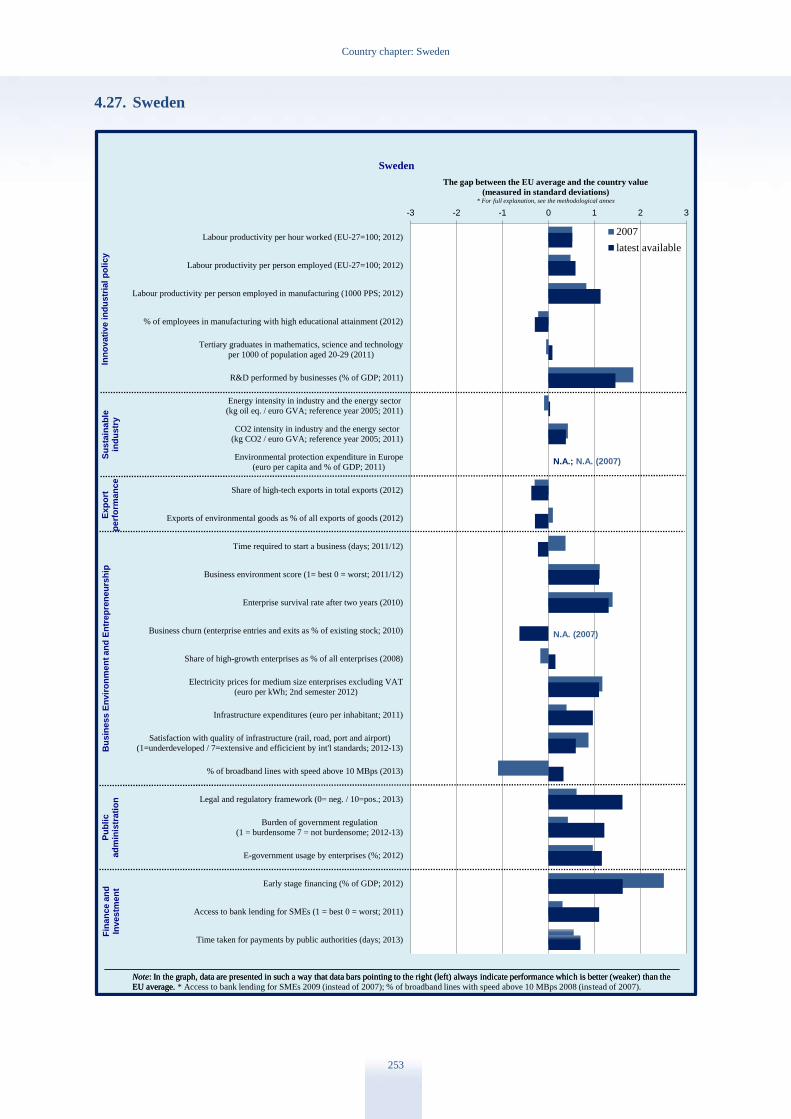
Country chapter: Sweden
253
4.27. Sweden
-3 -2 -1 0 1 2 3
Labour productivity per hour worked (EU-27=100; 2012)
Labour productivity per person employed (EU-27=100; 2012)
Labour productivity per person employed in manufacturing (1000 PPS; 2012)
% of employees in manufacturing with high educational attainment (2012)
Tertiary graduates in mathematics, science and technology
per 1000 of population aged 20-29 (2011)
R&D performed by businesses (% of GDP; 2011)
Energy intensity in industry and the energy sector
(kg oil eq. / euro GVA; reference year 2005; 2011)
CO2 intensity in industry and the energy sector
(kg CO2 / euro GVA; reference year 2005; 2011)
Environmental protection expenditure in Europe
(euro per capita and % of GDP; 2011)
Share of high-tech exports in total exports (2012)
Exports of environmental goods as % of all exports of goods (2012)
Time required to start a business (days; 2011/12)
Business environment score (1= best 0 = worst; 2011/12)
Enterprise survival rate after two years (2010)
Business churn (enterprise entries and exits as % of existing stock; 2010)
Share of high-growth enterprises as % of all enterprises (2008)
Electricity prices for medium size enterprises excluding VAT
(euro per kWh; 2nd semester 2012)
Infrastructure expenditures (euro per inhabitant; 2011)
Satisfaction with quality of infrastructure (rail, road, port and airport)
(1=underdeveloped / 7=extensive and efficicient by int'l standards; 2012-13)
% of broadband lines with speed above 10 MBps (2013)
Legal and regulatory framework (0= neg. / 10=pos.; 2013)
Burden of government regulation
(1 = burdensome 7 = not burdensome; 2012-13)
E-government usage by enterprises (%; 2012)
Early stage financing (% of GDP; 2012)
Access to bank lending for SMEs (1 = best 0 = worst; 2011)
Time taken for payments by public authorities (days; 2013)
The gap between the EU average and the country value
(measured in standard deviations)* For full explanation, see the methodological annex
Sweden
2007
latest available
Note: In the graph, data are presented in such a way that data bars pointing to the right (left) always indicate performance which is better (weaker) than the
EU average.
Inn
ov
ati
ve in
du
str
ial p
oli
cy
Su
sta
ina
ble
ind
ustr
yB
us
iness E
nv
iro
nm
en
t an
d E
ntr
ep
ren
eu
rsh
ipF
ina
nce a
nd
Investm
en
t
Note: In the graph, data are presented in such a way that data bars pointing to the right (left) always indicate performance which is better (weaker) than the
EU average. * Access to bank lending for SMEs 2009 (instead of 2007); % of broadband lines with speed above 10 MBps 2008 (instead of 2007).
Ex
po
rtp
erf
orm
an
ce
Pu
bli
cad
min
istr
ati
on
N.A.; N.A. (2007)
N.A. (2007)
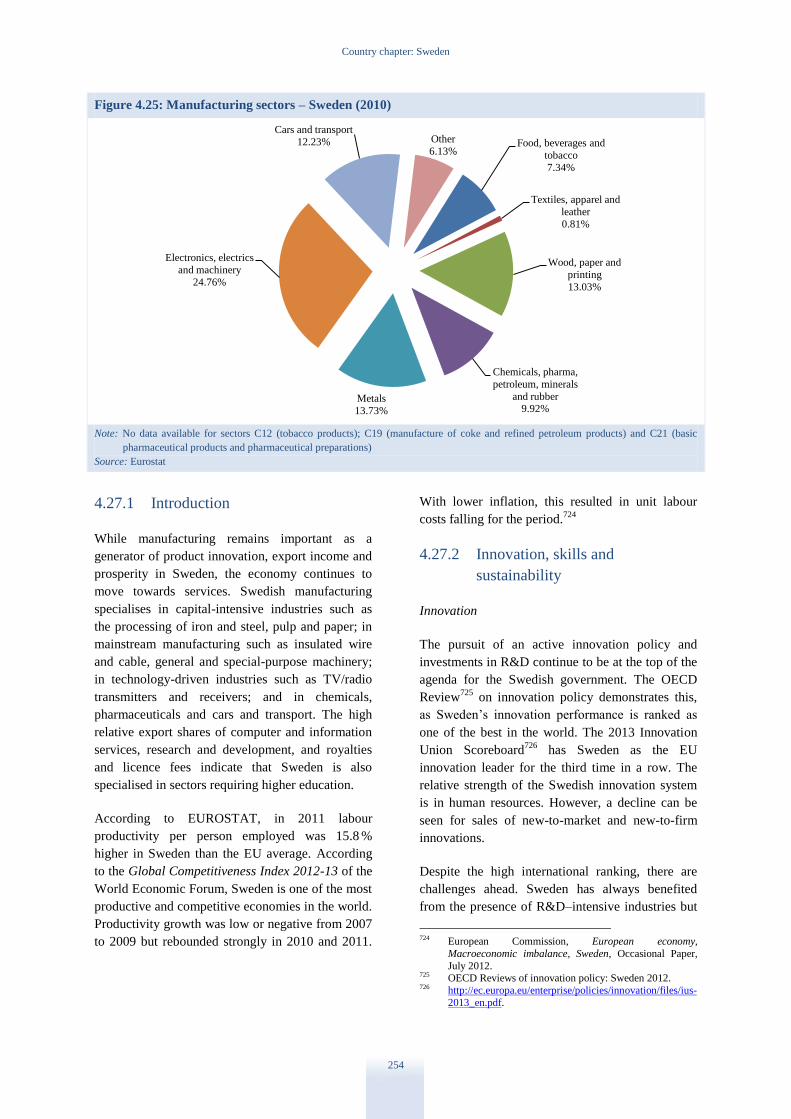
Country chapter: Sweden
254
Figure 4.25: Manufacturing sectors – Sweden (2010)
Note: No data available for sectors C12 (tobacco products); C19 (manufacture of coke and refined petroleum products) and C21 (basic
pharmaceutical products and pharmaceutical preparations)
Source: Eurostat
4.27.1 Introduction
While manufacturing remains important as a
generator of product innovation, export income and
prosperity in Sweden, the economy continues to
move towards services. Swedish manufacturing
specialises in capital-intensive industries such as
the processing of iron and steel, pulp and paper; in
mainstream manufacturing such as insulated wire
and cable, general and special-purpose machinery;
in technology-driven industries such as TV/radio
transmitters and receivers; and in chemicals,
pharmaceuticals and cars and transport. The high
relative export shares of computer and information
services, research and development, and royalties
and licence fees indicate that Sweden is also
specialised in sectors requiring higher education.
According to EUROSTAT, in 2011 labour
productivity per person employed was 15.8 %
higher in Sweden than the EU average. According
to the Global Competitiveness Index 2012-13 of the
World Economic Forum, Sweden is one of the most
productive and competitive economies in the world.
Productivity growth was low or negative from 2007
to 2009 but rebounded strongly in 2010 and 2011.
With lower inflation, this resulted in unit labour
costs falling for the period.724
4.27.2 Innovation, skills and
sustainability
Innovation
The pursuit of an active innovation policy and
investments in R&D continue to be at the top of the
agenda for the Swedish government. The OECD
Review725
on innovation policy demonstrates this,
as Sweden’s innovation performance is ranked as
one of the best in the world. The 2013 Innovation
Union Scoreboard726
has Sweden as the EU
innovation leader for the third time in a row. The
relative strength of the Swedish innovation system
is in human resources. However, a decline can be
seen for sales of new-to-market and new-to-firm
innovations.
Despite the high international ranking, there are
challenges ahead. Sweden has always benefited
from the presence of R&D–intensive industries but
724 European Commission, European economy,
Macroeconomic imbalance, Sweden, Occasional Paper,
July 2012. 725 OECD Reviews of innovation policy: Sweden 2012. 726 http://ec.europa.eu/enterprise/policies/innovation/files/ius-
2013_en.pdf.
Food, beverages and
tobacco
7.34%
Textiles, apparel and
leather
0.81%
Wood, paper and
printing
13.03%
Chemicals, pharma,
petroleum, minerals
and rubber 9.92%
Metals
13.73%
Electronics, electrics
and machinery
24.76%
Cars and transport
12.23% Other
6.13%

Country chapter: Sweden
255
increasingly firms have chosen to invest mainly
outside Sweden727
and some have relocated abroad.
As the importance of knowledge-intensive goods
and services in exports is increasing728
, there is
growing concern that the high investment in R&D
leads only to limited growth in the form of new
innovative ideas that prove to be commercially
viable.
Total R&D expenditure in 2011 amounted to
3.38 % of GDP, one of the highest levels in Europe.
Some studies have pointed out that the high R&D
expenditures do not appear to be fully delivering
economic growth and have called this the ‘Swedish
paradox’. Looking further along the chain,
according to another study, there is no clear
correlation between R&D expenditure and GDP
growth.729
However, despite these caveats, a Research and
Innovation Bill was adopted in October 2012
setting out priorities for 2013-16, including a
proposed SEK 4 billion (EUR 470 million) increase
in funding for research and innovation. The overall
aim of the bill is to increase the quality of research,
and to invest in areas of particular interest to
business and thereby strengthen the links between
R&D investments and economic growth. One
specific programme is aimed at strategic innovation
areas to develop collaboration between companies
and higher education institutions. The Research and
Innovation Bill is one of the first items under the
innovation strategy that focuses on how Sweden
should work in the long term to promote
innovation.
Skills
According to the World Economic Forum’s Global
Competitiveness Index 2012-13, Sweden has
maintained a strong focus on education over the
years, enabling it to achieve a high level of
technological readiness. The Swedish economy is
export-oriented and is highly dependent on its
industry maintaining a competitive edge in a global
marketplace.
727 Government Offices of Sweden, The Swedish Innovation
Strategy, p.15. 728 Government Offices of Sweden, The Swedish Innovation
Strategy, p.16. 729 Ett ramverk for innovationspolitiken, 2012; Braunerhjelm,
Eklund, Henrekson.
Due to its dependence on industry, there has been
some concern regarding the plummeting interest in
engineering and mathematics among students. The
latest Eurostat figures show that there was a lower
proportion of tertiary graduates in mathematics,
science and technology in Sweden than the EU
average.730
The government has proposed
increasing the time devoted to mathematics in
compulsory education and measures have been
taken to increase the number of university places
for engineering.
According to the 2012 Small BusinessAct Fact
Sheet, Entrepreneurship is being incorporated into
the curriculum as part of the reform of the Swedish
school system. In 2012 the Swedish National
Agency for Education funded 72 projects and five
programmes to enhance the competence of teachers
and the teaching of entrepreneurship in schools.
Altogether, the Government is taking measures to
tailor the education system to the industrial
structure of the country. Furthermore, Swedish
SMEs have a good record in the skills and
innovation area. In particular, they are well ahead in
the use of e-commerce, as more than half of
Swedish SMEs purchase online (EU average:
28 %).
Sustainability
Sweden has one of the lowest rates of carbon
emissions per capita in the EU. According to the
latest statistics from Energy in Sweden, in 2010,
48% of Sweden’s energy came from renewable
sources.731
Sweden is making progress in meeting
the Europe 2020 goal of 10 % renewable energy in
the transport sector.732
It has set the ambitious goal
of the country’s vehicle stock being independent of
fossil fuels by 2030.733
However, the goal of
reducing energy intensity by 20 % from 2008 to
2020 may prove difficult to achieve.734
730 According to EUROSTAT, in 2010 there were 15.2
graduates per 1 000 of the population aged 20-29 in the
EU-27, as compared with 14.0 in Sweden. 731 The Swedish Energy Agency, Energy in Sweden 2012,
p.6. 732 The Swedish Energy Agency, Långsiktsprognos 2012,
p.8. 733 Government Offices of Sweden, The Swedish energy
system, accessed via
http://www.government.se/sb/d/16022/nocache/true/dictionary/true.
734 The Swedish Energy Agency, Långsiktsprognos 2012,
p.8.

Country chapter: Sweden
256
Industry accounted for 37 % of Sweden’s total
energy use in 2010. Energy use by industry has
remained relatively constant since 1970, despite
increasing industrial output. From 1970 to 2010, the
proportion of total energy use by industry provided
by biofuels, peats, etc. increased from 21 % to
37 %.735
The use of taxation as an incentive for consumers
and enterprises to change their consumption pattern
in the direction of a green economy is well-
developed. Sweden has committed itself to using
taxation and other instruments to achieve the target
for carbon dioxide emissions.
The transport sector is a challenge for policy as its
energy use has increased since the 1970s.736
Current
policy efforts focus on modernisation, and the
promotion of electric cars and biofuels in the sector.
To further reduce carbon dioxide emissions,
taxation measures and pilot programmes enhancing
low-carbon technologies are being promoted by the
government.737
4.27.3 Export performance
Business Sweden was created through a merger of
the Swedish Trade Council and Invest Sweden. The
aim of the organisation is to strengthen the image of
Sweden as an attractive business partner and to
make it easier for Swedish companies to reach
international markets and to create opportunities for
small businesses to grow internationally.738
Sweden has a large and diversified export market
stretching beyond Europe. The level of Swedish
exports has helped the economy to perform well
despite the euro-area downturn. Sweden’s export
market shares, however, are on a downward trend.
Exports fell by 4 % in 2012 due to weak external
demand and the strengthening of the krona.
Sweden’s EU-27 exports decreased by 2 %, while
imports decreased by 5 %.739
The trade balance has shown a surplus of around
7 % of GDP since 2005. A structural shift appears
735 The Swedish Energy Agency, Energy in Sweden 2012, p.
21, 28. 736 The Swedish Energy Agency, Energy in Sweden 2012,
p.22, 29. 737 Government Offices of Sweden, Energy Efficiency,
accessed http://www.government.se/sb/d/16022/a/187772. 738 http://www.business-sweden.se/en. 739 http://www.scb.se/Pages/PressRelease____351447.aspx.
to be taking place towards increased service
exports. Traditionally, the surplus has been
attributed to the goods trade but 2009 saw the
surplus on services becoming larger than the goods
surplus. In fact, Sweden’s share in the global trade
of goods has been in decline for a long time. This
decline has been partly offset by the upward trend
in services. 740
Overall, Sweden’s share of world exports has
decreased from 1.5 % in 1995 to 1.2 % in 2010.
Half of the loss occurred from 2005 to 2010. The
product and country mix of Swedish exports is
partly responsible for the decline. Around two-
thirds of Swedish exports go to Europe. A shift has
occurred from motor vehicles and electronic and
telecommunication products to machinery and other
equipment and chemicals. The share of high-tech
exports remains constant at around 14 % of total
exports.741
4.27.4 Business environment and public
administration
Business environment
Sweden continues to be one of the most competitive
economies in the world, with a strong corporate
sector. It ranks sixth in the World Economic Forum
Global Competitiveness Report 2013-14.
In the spring fiscal policy bill, the Minister of
Finance noted that the uncertain global economic
situation required an adjustment to the growth
forecast. The government projects a slower GDP
growth of 1.2 % in 2013 and of 2.2 % in 2014. As a
reaction to the deterioration in the labour markets,
the government proposed creating an additional
14 000 vocational training places for adults in 2013-
14, an additional 8 000 work experience and
training places, and an additional 2 800 tertiary
education places in graduate engineering and
nursing programmes.
Companies are facing the problems of weaker
demand from traditional export markets and the
strong krona. Currency appreciation has an impact
740 European Commission, European economy —
Macroeconomic imbalances — Sweden, Occasional Paper,
July 2012, p.9. 741 Ibid.
Country chapter: Sweden
257
on profit margins and decisions on where
companies invest in future production.
According to the 2013 World Bank Doing Business
report, the time needed to start a business in
Sweden is 16 calendar days, which is slightly
longer than the EU average of 14 days and more
than five times longer than the agreed Small
Business Act target of three days by 2012.
Sweden scores very close to the EU average in
terms of the time to close a business. A new law on
insolvency was introduced aiming at easing the
debt relief procedure. Under this new insolvency
procedure, business owners and individuals who
fall into personal insolvency will be allowed a five-
year debt write-off programme. According to the
2012 SBA Fact Sheet, small firms that become
insolvent will be eligible for a simple and more
rapid form of reorganisation.
Sweden is above average as regards access for
small and medium-sized enterprises (SMEs) to
public procurement and Swedish SMEs are more
successful (47 % vs. 38 %) in winning public
contracts than their EU peers. The ‘Think small
first’ principle of the Small Business Act is well
applied in policy-making and legislation.
The 2013 budget contained a number of proposals
intended to improve competitiveness further.
SEK 23 billion (EUR 2.67 billion) was allocated to
reform measures to improve conditions for growth
and competitiveness. The previous corporate tax
rate of 26.3 % (above the EU average) was reduced
to 22 % (slightly below the EU average). The
government also proposed introducing tax credits
for investors in order to stimulate access to finance
for new and fast-growing companies. The
government has announced its intention to increase
research and innovation investment for 2013-16, in
particular for university research and research-
funding organisations. Compared with previous
budgets, significantly higher expenditure ceilings
for infrastructure investment — mainly road and
rail — will be in place in 2013-25.
In recent years, several reforms have been
implemented to facilitate company start-ups: the
minimum capital has been reduced to SEK 50 000
(EUR 5 814); there is no longer a requirement to
have an accountant in small firms; and improved
social and income security for entrepreneurs has
been introduced.
Value-added tax (VAT) for restaurants was reduced
in 2012 from 25 % to 12 %. As the Commission has
noted,742
the effects of this on employment are
uncertain, whereas the cost in terms of foregone
VAT revenue is high.743
Moreover, the measure
contributes to further differentiation in VAT
structure, therefore decreasing the efficiency of the
tax.
The Swedish economy has traditionally been based
on a strong manufacturing industry. However, the
service sector has grown in importance and now
accounts for approximately 65 % of growth in value
added. Over 60 % of all enterprises are active in this
sector.744
Three out of four Swedes are employed in
services. The knowledge-intensive service sector is
growing and employment in it has increased by
close to 20 % over the past 20 years.745
Since the mid-2000s, the rising surplus in services
trade has fully compensated for the steady
narrowing of the surplus in goods trade. This
development can be attributed mainly to a structural
shift in some industries away from goods
production to service provision (the
‘servicification’ of manufacturing).746
Public administration
Sweden’s public administration is considered to be
efficient and performs well.747
According to the
latest World Bank government effectiveness index,
Sweden was in the 98th percentile of government
effectiveness in 2011. Also, tax administration is
efficient, with high compliance rates and low
collection costs. The cost of tax administration is
only 0.4 % of revenues, as compared with an EU
average of 1.3 %.
742 The Commission assessment in May 2013:
http://ec.europa.eu/europe2020/pdf/nd/swd2013_sweden_
en.pdf 743 Estimated at 0.1 to 0.2 % of GDP, or between EUR 400m
and EUR 800m. 744 SCB:s Företagsdatabas. 745 http://www.almega.se/politik-och-
ekonomi/statistik/tjanstesektorn. 746 European Commission, European economy —
Macroeconomic imbalances 2012 — Sweden. 747 European Commission (2012), Excellence in public
administration for competitiveness in EU Member States.

Country chapter: Sweden
258
Although the Swedish government undertook in
2006 to reduce the administrative burden for
businesses by 25 % by 2010, the reduction achieved
by 2010 was only just over 7 %. Recognising the
need to step up its efforts, the government has taken
a series of initiatives, notably adopting a
simplification programme for 2011-14. It has also
commissioned a public inquiry, with a report to be
published in November 2013, on the scope for
reducing reporting requirements for companies.
In 2011, the government presented its focus areas
for continued efforts to improve regulation in
2011–14. The work on better regulation has been
broadened to include more aspects of the day-to-
day reality of companies and the challenges faced
by entrepreneurs. The work will focus on areas that
are considered to offer the greatest potential for
making a noticeable change for the better in day-to-
day business:
- Lower costs for companies: Since 2006,
the government has focused on reducing
administrative costs and has now opted
to increase the scope to cover other types
of cost arising from regulations.
- Reduced and simplified reporting
requirements: The aim is that, in future,
businesses will in most cases need to
submit information only once. The
government is also carrying out an
inquiry into the legal and technical
requirements for creating a system in
which information submitted by
businesses can be used by several
authorities, leading to information
exchange between authorities.
- Simpler procedures for contacting
authorities at regional and local level:
The Swedish Agency for Economic and
Regional Growth has been asked to take
action to simplify conditions for
businesses at municipal level. All county
administrative boards have been asked to
do the same at county level.
- Action on proposals for better regulation
from the business sector: In 2012, the
government decided on the terms of
reference for a committee of inquiry
aimed at providing feedback on the close
to 500 proposals for better regulation
submitted to government offices by the
business sector since 2007.
- A website where entrepreneurs can
submit proposals,748
has been developed
by the Swedish Agency for Economic
and Regional Growth. Entrepreneurs can
submit views and proposals for improved
rules and procedures in contacts with
government agencies.
- Better impact assessments: The Swedish
Better Regulation Council was
established in order to strengthen the
work relating to impact assessments. In
the 2013 budget, the government
presented new objectives and follow-up
measures for the process of better
business regulation. All the objectives
have a deadline of 2020, but are subject
to continuous development and follow-
up.
4.27.5 Finance and investment
Finance
Overall, Swedish SMEs enjoy financing conditions
that are better than the EU average. According to
the 2012 Small Business Act (SBA) fact sheet,
Sweden performs well in the area of access to
finance. The indicators show that Swedish SMEs
have a lower risk of seeing a loan application
rejected and are satisfied with access to public
financial support. As for venture capital, Swedish
firms are more likely than the EU average to attract
venture capital. Based on its assessment of legal
rights, investor protection and the availability of
credit information, the World Bank ranks Sweden
as number 40 out of 185 for obtaining credits.
Almi Företagspartner is the public body that works
to facilitate access of SMEs to finance in Sweden. It
is state-owned and has 40 offices in the country. It
offers credit, venture capital and counselling to
SMEs. Almi provides financing to SMEs directly,
not via intermediaries. It has own funds of
EUR 550 million for lending and finances
companies in all lines of business. In 2011,
EUR 202 million in lending was provided, with
748 www.enklareregler.se
Country chapter: Sweden
259
about 60 % going to micro companies. Write-offs
constituted less than 2 %.
Investment
The investment climate in Sweden is strong thanks
to political stability, an efficient civil justice system
and stable macro-economic conditions. Procedures
for new investment in Sweden are
straightforward.749
Measures have been taken to invest in innovation
infrastructure in Sweden. They include the
construction of the European Spallation Source
(ESS), a materials research facility for scientific
research using the neutron scattering technique. The
budget for ESS is estimated at around SEK 11.9
billion (EUR 1.38 billion). The ESS is expected to
be a world leader in material research and life
sciences.
Another major project is the Max IV, a synchrotron
light laboratory. Research will be carried out in the
fields of accelerator physics and nuclear physics. It
is believed that these research facilities will prove
to be fertile ground for scientific breakthroughs in
the years to come.
In addition, Sweden aims to create Europe’s most
attractive conditions for e-trade by 2015. To
establish a digital market, the government intends
to increase broadband access in rural areas.
4.27.6 Conclusions
Sweden is one of the most competitive economies
in the world, with a strong corporate sector. The
2013 budget contains a number of proposals
intended to improve Sweden’s competitiveness
further, including reform measures to enhance the
conditions for growth.
There is scope for improvement in the business
environment. The 16 day business start-up time is
slightly above the EU average of 14 days and over
five times longer than the Small Business Act target
of three days.
Sweden’s innovation performance is one of the best
in the world. According to the 2013 Innovation
Union Scoreboard, Sweden continues to be the EU
749 Sweden Taxation and Investment, Deloitte 2012.
innovation leader. A new Research and Innovation
Bill, which was adopted in October 2012, contains
priorities for 2013-16 as part of the new innovation
strategy aiming at strengthening the links between
R&D investments and economic growth.
A challenge for the Swedish innovation system is to
ensure that the high R&D expenditure is translated
into commercially viable products that yield
economic growth in the future. In addition, Sweden
needs to safeguard domestic R&D investments as
there are signs of increased investment and
relocations abroad.
Sweden’s public administration is considered to be
efficient and performs well with regard to
government effectiveness. The government has put
forward a series of initiatives to simplify the
administrative burden for businesses, taking into
account companies’ day-to-day reality.
The size of the export market has helped the
economy to perform well despite the euro-area
downturn. However, Sweden’s export market
shares are on a negative trend and companies are
facing problems arising from weaker demand from
traditional export markets. Exports fell by 4 % in
2012 due to weak external demand and the
strengthening of the Swedish currency. The
uncertain global economic situation has slowed
economic growth and required a downward
adjustment of the economic growth forecast.
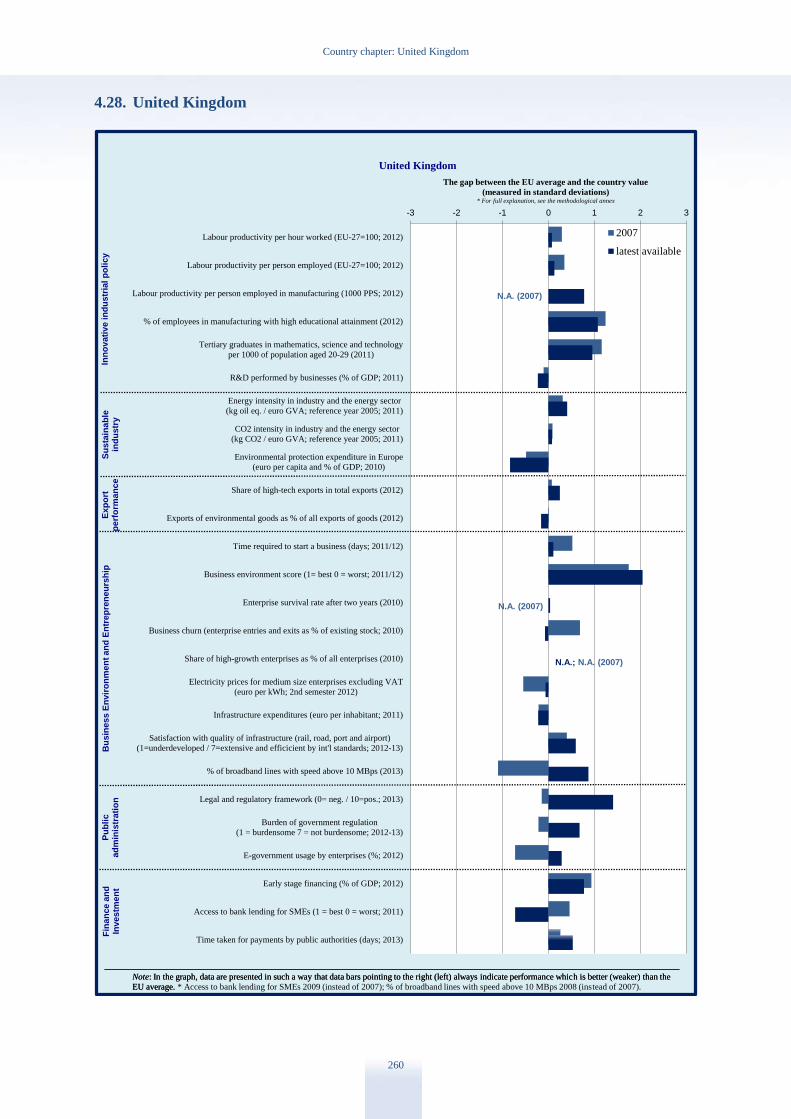
Country chapter: United Kingdom
260
4.28. United Kingdom
-3 -2 -1 0 1 2 3
Labour productivity per hour worked (EU-27=100; 2012)
Labour productivity per person employed (EU-27=100; 2012)
Labour productivity per person employed in manufacturing (1000 PPS; 2012)
% of employees in manufacturing with high educational attainment (2012)
Tertiary graduates in mathematics, science and technology
per 1000 of population aged 20-29 (2011)
R&D performed by businesses (% of GDP; 2011)
Energy intensity in industry and the energy sector
(kg oil eq. / euro GVA; reference year 2005; 2011)
CO2 intensity in industry and the energy sector
(kg CO2 / euro GVA; reference year 2005; 2011)
Environmental protection expenditure in Europe
(euro per capita and % of GDP; 2010)
Share of high-tech exports in total exports (2012)
Exports of environmental goods as % of all exports of goods (2012)
Time required to start a business (days; 2011/12)
Business environment score (1= best 0 = worst; 2011/12)
Enterprise survival rate after two years (2010)
Business churn (enterprise entries and exits as % of existing stock; 2010)
Share of high-growth enterprises as % of all enterprises (2010)
Electricity prices for medium size enterprises excluding VAT
(euro per kWh; 2nd semester 2012)
Infrastructure expenditures (euro per inhabitant; 2011)
Satisfaction with quality of infrastructure (rail, road, port and airport)
(1=underdeveloped / 7=extensive and efficicient by int'l standards; 2012-13)
% of broadband lines with speed above 10 MBps (2013)
Legal and regulatory framework (0= neg. / 10=pos.; 2013)
Burden of government regulation
(1 = burdensome 7 = not burdensome; 2012-13)
E-government usage by enterprises (%; 2012)
Early stage financing (% of GDP; 2012)
Access to bank lending for SMEs (1 = best 0 = worst; 2011)
Time taken for payments by public authorities (days; 2013)
The gap between the EU average and the country value
(measured in standard deviations)* For full explanation, see the methodological annex
United Kingdom
2007
latest available
Note: In the graph, data are presented in such a way that data bars pointing to the right (left) always indicate performance which is better (weaker) than the
EU average.
Inn
ov
ati
ve in
du
str
ial p
oli
cy
Su
sta
ina
ble
ind
ustr
yB
us
iness E
nv
iro
nm
en
t an
d E
ntr
ep
ren
eu
rsh
ipF
ina
nce a
nd
Investm
en
t
Note: In the graph, data are presented in such a way that data bars pointing to the right (left) always indicate performance which is better (weaker) than the
EU average. * Access to bank lending for SMEs 2009 (instead of 2007); % of broadband lines with speed above 10 MBps 2008 (instead of 2007).
Ex
po
rtp
erf
orm
an
ce
Pu
bli
cad
min
istr
ati
on
N.A. (2007)
N.A. (2007)
N.A.; N.A. (2007)
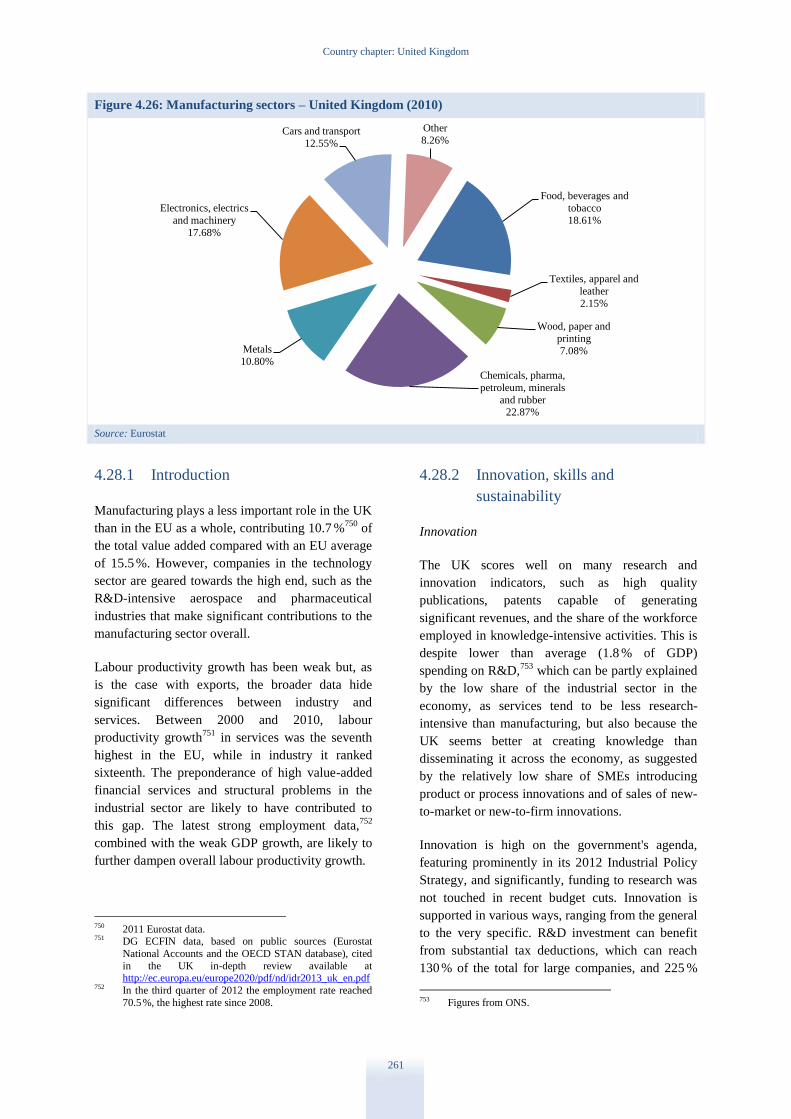
Country chapter: United Kingdom
261
Figure 4.26: Manufacturing sectors – United Kingdom (2010)
Source: Eurostat
4.28.1 Introduction
Manufacturing plays a less important role in the UK
than in the EU as a whole, contributing 10.7 %750
of
the total value added compared with an EU average
of 15.5 %. However, companies in the technology
sector are geared towards the high end, such as the
R&D-intensive aerospace and pharmaceutical
industries that make significant contributions to the
manufacturing sector overall.
Labour productivity growth has been weak but, as
is the case with exports, the broader data hide
significant differences between industry and
services. Between 2000 and 2010, labour
productivity growth751
in services was the seventh
highest in the EU, while in industry it ranked
sixteenth. The preponderance of high value-added
financial services and structural problems in the
industrial sector are likely to have contributed to
this gap. The latest strong employment data,752
combined with the weak GDP growth, are likely to
further dampen overall labour productivity growth.
750 2011 Eurostat data. 751 DG ECFIN data, based on public sources (Eurostat
National Accounts and the OECD STAN database), cited
in the UK in-depth review available at http://ec.europa.eu/europe2020/pdf/nd/idr2013_uk_en.pdf
752 In the third quarter of 2012 the employment rate reached
70.5 %, the highest rate since 2008.
4.28.2 Innovation, skills and
sustainability
Innovation
The UK scores well on many research and
innovation indicators, such as high quality
publications, patents capable of generating
significant revenues, and the share of the workforce
employed in knowledge-intensive activities. This is
despite lower than average (1.8 % of GDP)
spending on R&D,753
which can be partly explained
by the low share of the industrial sector in the
economy, as services tend to be less research-
intensive than manufacturing, but also because the
UK seems better at creating knowledge than
disseminating it across the economy, as suggested
by the relatively low share of SMEs introducing
product or process innovations and of sales of new-
to-market or new-to-firm innovations.
Innovation is high on the government's agenda,
featuring prominently in its 2012 Industrial Policy
Strategy, and significantly, funding to research was
not touched in recent budget cuts. Innovation is
supported in various ways, ranging from the general
to the very specific. R&D investment can benefit
from substantial tax deductions, which can reach
130 % of the total for large companies, and 225 %
753 Figures from ONS.
Food, beverages and
tobacco
18.61%
Textiles, apparel and
leather
2.15%
Wood, paper and
printing
7.08%
Chemicals, pharma,
petroleum, minerals
and rubber 22.87%
Metals
10.80%
Electronics, electrics
and machinery
17.68%
Cars and transport
12.55%
Other
8.26%
Country chapter: United Kingdom
262
for SMEs if they meet certain requirements, namely
that they be used for technological and scientific
innovation. Public procurement policies target
specific innovative projects, such as the
hybridisation of the existing truck fleet. There are
many other initiatives and support schemes,
including an interesting one to support disruptive
technologies that have high growth potential, as
identified by the Technology Strategy Board. The
Board is also continuing to build a network of
Catapult Centres to help commercialise research.
Four Catapults Centres are already operational
(high value manufacturing; cell therapy; offshore
renewable energy; and satellite applications) and
three others (connected digital economy; future
cities; and transport systems) are set to start
operating in 2013. The UK, according to a recent
higher education ranking754
, has four of the top five
universities in Europe and thus can have a
competitive advantage when trying to attract
investors in high technology; increase interaction
between researchers and companies; and
commercialise output from publicly funded
research. The good755
collaboration between
academia and business is supported through the
Higher Education Innovation Fund, which can call
on an annual budget of GBP 150 million. The
Knowledge Transfer Networks, created by the
Technology Strategy Board, have similar aims, and
currently connect over 43 000 business members
and 14 000 non-business ones.
Another of the government's goals is to encourage
innovation among SMEs that are less likely to
engage in innovative activities on their own. A
national innovation voucher scheme has been
created for this purpose. The business receiving the
voucher, worth GBP 5 000, can use it to explore
innovative ideas with a specialist firm or individual.
Skills
The UK performs much better than the EU average
(45.8 % as against 34.6 %) in terms of tertiary
education, i.e. the percentage of 30-34 year-olds
with a university or college degree. In terms of
entrepreneurship: the share of the population
754 http://www.timeshighereducation.co.uk/world-university-
rankings/2012-13/world-ranking/region/europe. 755 According to the WEF, the UK is the second highest
performer in the world in this regard:
http://www.globalinnovationindex.org/gii/main/fullreport/
files/Chap4/5/5.2.1.pdf.
believing to have the required skills and knowledge
to start a business is above the EU average (47 % as
opposed to 42 %). However the UK underperforms
in early school leaving has a relatively high number
of adults with low basic skills, and there are
shortcomings in the quality of vocational skills
training. This leads to a labour market characterised
by a shortage of workers with good vocational or
technical skills, while at the same time some
workers are over-qualified.
The government has consequently focused on
school education and vocational training in recent
years. There has been a significant increase in the
number of apprenticeships, in particular at the
higher vocational level, and further places will be
available for graduate and postgraduate levels in
engineering. This is important considering that
higher level vocational skills are needed for the
economy. In addition to apprenticeships, employers
and universities will cooperate establishing 24
University Technical Colleges emphasising
engineering and business skills.
Public-private partnerships are central to the
reforms. Under the Employer Ownership
programme, the government invests along with the
employer to raise employees' skills and to provide
incentives for employers to offer apprenticeships.
The aim is to move away from a centrally planned
approach and use sector-specific and local decision-
making through the involvement of local enterprise
partnerships. The belief is that colleges and training
providers can better respond to the needs of trainees
and employers. This approach should improve the
availability of the right skills and thus boost
productivity and job creation.
Sustainability
The UK is likely to meet its carbon emission targets
and the energy intensity and CO2 intensity of its
industry are lower than the EU average. The
government confirmed its commitment to
sustainable growth with several initiatives launched
in 2012. The Electricity Market Reform programme
that was part of the November 2012 energy bill
provides certainty to investors, speeding up
investment in new infrastructure. The government
has also increased funding for low-carbon
infrastructure through the levy control framework.
Under this scheme, spending will rise to GBP 7.6
billion in real terms in 2020/21.

Country chapter: United Kingdom
263
The 'green deal' scheme has become operational. It
enables energy efficiency in residential buildings to
be improved without the need to pay the full cost
upfront. Upgrades are financed through loans that
are repaid through energy bills. The green deal is
supported by a Green Investment Bank, for which
state aid has been approved. The Green Investment
Bank focuses on energy saving and emissions, but
also promotes issues like better waste disposal. The
government will provide the bank with funding of
up to GBP 3 billion. Its impact will be leveraged as
capital is being invested along with private
investors. According to the bank, the ratio is
currently at around one to three, as it has committed
GBP 635 million in its first five months of
operation for transactions totalling GBP 2.3 billion.
Additional efforts will target the construction
sector, following the low carbon roadmap for the
built environment, as launched by the Green
Construction Board. It provides for cooperation
between government and industry with a view to
achieving an 80 % emissions reduction target by
2050.
Finally, the Office for Low Emission Vehicles is
supporting initiatives to drive the emergence of a
market for such vehicles. In particular, the office is
prioritising the rollout of recharging infrastructure.
This is also being supported by the Local Transport
Sustainability Fund, which can call on GBP 600
million funding from the Department of Transport.
There are additional incentives for buyers of low
emission vehicles; GBP 300 million has been
allocated to grants for plug-in cars and plug-in
vans. These grants cover 25 % and 20 %
respectively of the cost of eligible vehicles, in order
to reduce the cost differential with conventional
vehicles. Sustainable transportation is also
supported by other measures to upgrade existing
fleets. Local authorities often have their own
schemes, ranging from financial incentives to free
or subsidised parking and charging.
4.28.3 Export performance
The current account has gradually deteriorated over
the last two decades, and has been consistently
negative. However, here again the average figures
mask a two-stream economy. The UK is the second
largest exporter of services in the world after the
US, but has a large deficit in the trade of goods. In
2012, exports of goods accounted for 62 %756
of
total British exports, while they make up 80 % of
global trade. The trade in goods is divided roughly
equally between the EU and third countries, but
three-fifths of services exports go outside the EU.
As these markets are growing more rapidly, this
suggests that there is still growth potential for
banking, ICT and consultancy services.
The drop in value of the pound has not lead to an
increase in exports, contrary to the situation after
the 1992 devaluation. This suggests that there are
deeper causes such as a scarcity of critical skills,
infrastructural bottlenecks, and a lack of access to
finance for would-be exporters. On the last point,
the government has taken action, as the UK Export
Finance agency has been given funding to provide
up to GBP 1.5 billion in loans for exports.
Furthermore, UK Trade & Investment, a
government agency, has been given GBP 140
million more for the next two years to help SMEs in
export markets, help them win contracts for high-
value projects and promote inward investment. For
example, more SMEs will be able to benefit from
the ‘Passport to Export’ programme which aims to
improve SMEs’ chances of export success by
helping them through a tailored, twelve month long
assistance programme.
4.28.4 Business environment and public
administration
Business environment
According to rankings, such as the World Bank’s
‘Doing Business’ report, the UK is a consistent top
performer in most aspects of the business
environment. However, there are still problems
concerning the planning rules and the slow and
uncertain planning process, despite renewed efforts
to remove bottlenecks. The government published a
new National Planning Policy Framework in 2012
that replaced over 1 000 pages of planning policy
guidance with around 50, and introduced new pro-
growth reforms such as the presumption in favour
of sustainable development.
Improving infrastructure has been recognised as a
critical issue by the government. To coordinate and
756 Source of this and the following figures: Office for
National Statistics.

Country chapter: United Kingdom
264
speed up procedures, a new infrastructure planning
unit has been set up to liaise between local
authorities and stakeholders. There are encouraging
signs that this is having an effect, although planning
is still difficult because of the political sensitivity at
local level and the number of people involved. The
National Infrastructure Plan was revised in
December 2012 to focus more closely on growth.
Most of the spending increases will go to energy
and transport infrastructure. However, other priority
areas will also benefit, including the roll-out of
broadband to rural areas. A GBP 310 billion
infrastructure funding pipeline will provide clarity
for investors on the timeline of future projects. The
UK authorities are launching initiatives to mobilise
private financing and funding for specific
infrastructure investment; such steps could reduce
the gap between identified needs and committed
funds, but their effectiveness remains to be proven.
Public administration
Firms are generally appreciative of the quality and
speed of public administration. The government
itself has set ambitious targets to further reduce the
regulatory burden and to use e-government tools as
much as possible. The ‘one in-one out’ regulatory
target has now been substituted with the even more
ambitious ‘one in-two out’ rule, whereby the
government commits to adding new regulations
only when a regulatory burden twice as heavy is
removed. To help to deliver on this, the government
has launched the 'red tape challenge', a project to
analyse all government regulations to determine
what is necessary and what can be made less
burdensome. While ‘one in, two-out’ is an
ambitious target to attain and measure, it helps
guide and focus the authorities' efforts to reduce red
tape, and makes it difficult to add burdensome new
rules. Another strategy currently being
implemented is 'digital by default', which underpins
the government’s digital strategy.757
SMEs in the UK find it more difficult than the EU
average to access public contracts. The government
has a target that 25 % of public procurement should
go to SMEs. The current figure is 12 %. The
government is reviewing its public procurement
system to make it easier to participate. For instance,
a variety of pre-qualification questionnaires have
757 See
http://publications.cabinetoffice.gov.uk/digital/strategy/.
been standardised. But there is resistance among the
ministries and agencies to centralising procurement.
Additional difficulties have been caused by the
devolution of powers to local governments, as this
makes it more difficult to streamline and coordinate
public procurement.
4.28.5 Finance and investment
Access to finance has become difficult in the
recession, in particular due to the banking crisis.
However, the situation differs depending on the
kind of finance needed, and on the type of business
needing it. Large firms can access the bond market
at low rates, but SMEs rely mainly on bank loans,
which are not easily obtained and only under
restrictive conditions.
Several factors have contributed to this situation,
including the lack of competition758
in banking; the
fact that non-banking sources of finance have been
slow to emerge; constraints on demand and
deleveraging in both the financial and non-financial
sectors.
Both companies and the government believe that
the Funding for Lending scheme, which aims to
boost lending to the real economy, has had a
positive effect. Wholesale bank funding costs have
fallen by over 1 percentage point since June 2012
and there has been a significant increase in credit
availability since the scheme started in August
2012, especially for larger firms. Improved credit
conditions have been more visible in the
construction and real estate sectors.759
The
government has announced expansions to the
scheme to extend its scope to non-bank credit
providers and to increase incentives to lend to
SMEs.
SMEs still report problems in accessing credit, and
the conditions for credit are worse than in other EU
countries. In particular, the interest rate differential
between smaller and larger loans is particularly
high. The government has sought to make banks
758 The six main players in the banking sector cover over
70 % of the market; there are encouraging but still small
signs of others (Santander, Handelsbanken) increasing their attention to the company loan market.
759 According to Bank of England data, lending to firms fell
by 3.1 % in 2012, despite banks drawing almost £ 14 billion from the FLS between August and December.
Funding can thus be considered to have flown into
mortgages rather than company loans.
Country chapter: United Kingdom
265
more resilient to shocks by requiring them to
increase their capital. This has resulted in strict
lending criteria which are keeping money from
flowing to the real economy. The outcome is a
complex situation whereby banks are under
pressure to make their balance sheets more solid
while at the same time numerous schemes to
improve access to finance for companies are being
introduced or expanded.
SMEs report difficulties in navigating the various
support programmes, which include not only the
access to finance schemes but also measures
managed by specialised institutions (mainly UK
Trade and Industry, and UK Export Finance), to
help companies to export. The government plans to
facilitate access by giving firms a full overview of
the different programmes through gov.uk, its online
portal for government services and information.
The government also wants to work closely with
professionals in the field, accountants in particular,
and use the British Business Bank as a catalyst for
all programmes and services. This bank will be a
wholesale provider of funds, created by
consolidating existing schemes. It has been given
over GBP 1 billion of new capital to provide the
economy with more long-term financing and to
increase the diversity of financing options. It has
been well received by the business community, and
state aid approval is currently pending.
The government is planning to facilitate equity
investment by expanding the tax relief offered to
early stage investors. It has introduced the Seed
Enterprise Investment Scheme, which provides
income tax relief of 50 % to individuals who invest
in start-ups. It has also introduced more targeted
schemes to encourage or scale-up equity investment
such as the Enterprise Capital Fund which
combines public and private funds to provide equity
financing to SMEs in high-tech sectors.
There are indications that new financing
alternatives are emerging. In particular, peer-to-
peer lending is expanding, as are platforms that
allow companies to exchanging their receivables for
cash and supply-chain financing by larger
companies, supported by the Business Finance
Partnership. All these alternatives are still small in
scale, but they show that there is potential for
further diversification. The government is also
actively encouraging alternative forms of financing.
Thus, there is potential for companies to access a
more diverse range of financing options and to be
better able to match their specific financing needs
with the right instrument.
4.28.6 Conclusions
The UK has a business-friendly environment, a
generally efficient public administration, and a
positive climate for research and innovation. In
particular, the strong links between business and
academia help to commercialise research and
innovation. It would seem that the credit flow is
improving, but so far the beneficiaries have been
large firms and the real estate sector. SMEs
continue to report difficulties in accessing finance;
but though bank loans are hard to get, small signs
of improvement are visible in the availability of
alternative finance, including peer-to-peer lending
and receivables exchange platforms.
The economy is advanced in terms of sustainability,
and is less energy and resource intensive than the
EU average. However, the industrial sector has
problems with competitiveness that can be seen in
the persistent deficit in the trade in goods. The main
reasons are the infrastructure bottlenecks, a lack of
skills (for instance in engineering), and a lack of
finance for SMEs. However, the service sector is
one of the most competitive in the world, and
contributes significantly to the current account
balance.
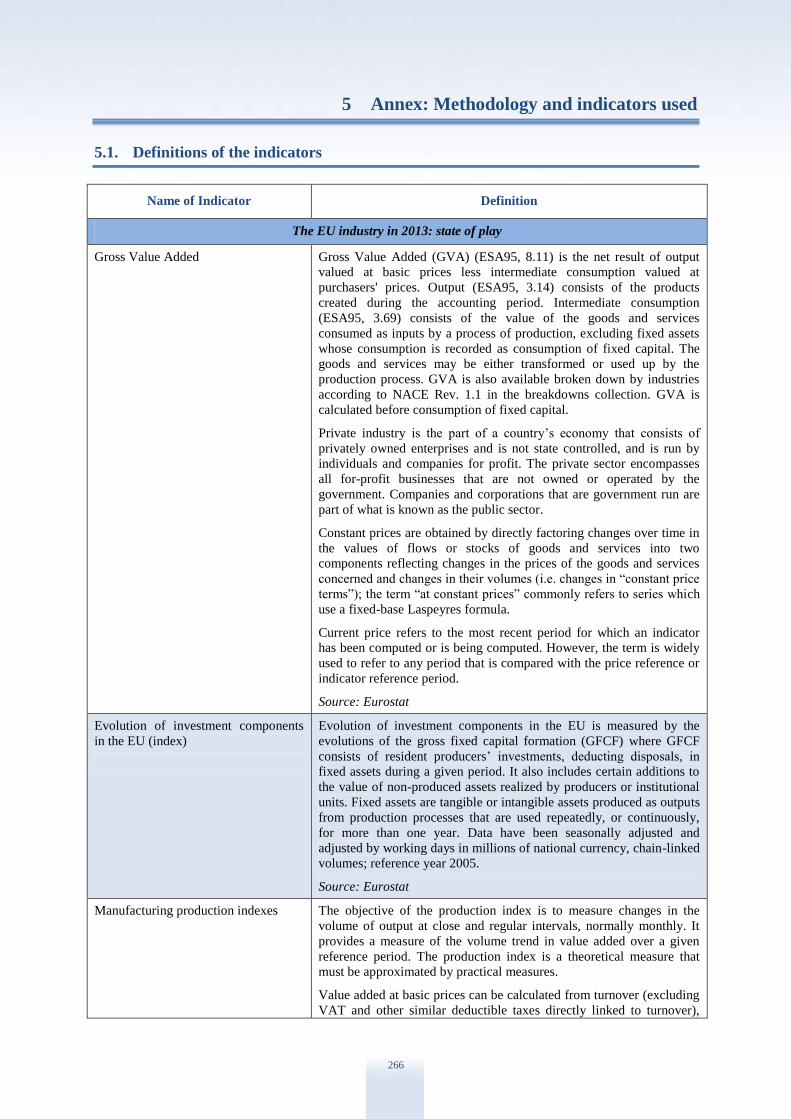
Methodology annex: Definitions of the indicators
266
5 Annex: Methodology and indicators used
5.1. Definitions of the indicators
Name of Indicator Definition
The EU industry in 2013: state of play
Gross Value Added
Gross Value Added (GVA) (ESA95, 8.11) is the net result of output
valued at basic prices less intermediate consumption valued at
purchasers' prices. Output (ESA95, 3.14) consists of the products
created during the accounting period. Intermediate consumption
(ESA95, 3.69) consists of the value of the goods and services
consumed as inputs by a process of production, excluding fixed assets
whose consumption is recorded as consumption of fixed capital. The
goods and services may be either transformed or used up by the
production process. GVA is also available broken down by industries
according to NACE Rev. 1.1 in the breakdowns collection. GVA is
calculated before consumption of fixed capital.
Private industry is the part of a country’s economy that consists of
privately owned enterprises and is not state controlled, and is run by
individuals and companies for profit. The private sector encompasses
all for-profit businesses that are not owned or operated by the
government. Companies and corporations that are government run are
part of what is known as the public sector.
Constant prices are obtained by directly factoring changes over time in
the values of flows or stocks of goods and services into two
components reflecting changes in the prices of the goods and services
concerned and changes in their volumes (i.e. changes in “constant price
terms”); the term “at constant prices” commonly refers to series which
use a fixed-base Laspeyres formula.
Current price refers to the most recent period for which an indicator
has been computed or is being computed. However, the term is widely
used to refer to any period that is compared with the price reference or
indicator reference period.
Source: Eurostat
Evolution of investment components
in the EU (index)
Evolution of investment components in the EU is measured by the
evolutions of the gross fixed capital formation (GFCF) where GFCF
consists of resident producers’ investments, deducting disposals, in
fixed assets during a given period. It also includes certain additions to
the value of non-produced assets realized by producers or institutional
units. Fixed assets are tangible or intangible assets produced as outputs
from production processes that are used repeatedly, or continuously,
for more than one year. Data have been seasonally adjusted and
adjusted by working days in millions of national currency, chain-linked
volumes; reference year 2005.
Source: Eurostat
Manufacturing production indexes The objective of the production index is to measure changes in the
volume of output at close and regular intervals, normally monthly. It
provides a measure of the volume trend in value added over a given
reference period. The production index is a theoretical measure that
must be approximated by practical measures.
Value added at basic prices can be calculated from turnover (excluding
VAT and other similar deductible taxes directly linked to turnover),
Methodology annex: Definitions of the indicators
267
plus capitalised production, plus other operating income plus or minus
the changes in stocks, minus the purchases of goods and services,
minus taxes on products which are linked to turnover but not
deductible plus any subsidies on products received. The division of
production in construction between building construction and civil
engineering is based on the classification of types of construction (CC).
The reference period is year 2010 and the unit is index or percentage
change (%).
Source: Eurostat, Bureau of Economic Analysis (BEA), Ministry of
Economy, Trade and Industry Japan
Manufacturing employment
Manufacturing employment measures employment expressed in person
in private industry subsection manufacturing. Population and
employment are auxiliary indicators in the national accounts
(macroeconomic indicators, which provide an overall picture of the
economic situation and are largely used for economic analysis and
forecasting).
Source: Eurostat, Bureau of Labour (BEA), Ministry of Economy,
Trade and Industry Japan
Year-to-year growth rate of loans to
non-financial corporations
Year-to-year growth rate of loans to non-financial corporations is
annual growth of the balance sheet item: loans to non-financial
corporations where the balance sheet is a financial statement that
summarizes a company’s assets, liabilities and shareholders’ equity at a
specific point in time. The balance sheet must follow the following
formula: Assets = Liabilities + Shareholders’ Equity.
BSI statistics refer to either the aggregated or the consolidated balance
sheet of the Monetary Financial Institutions (MFI) sector. The
aggregated balance sheet is the sum of the balance sheets of all the
MFIs resident in the euro area. The consolidated balance sheet is
obtained by netting the aggregated balance sheet positions between
MFIs in the euro area. The consolidated balance sheet provides the
basis for the regular analysis of euro area monetary aggregates and
counterparts.
The sector non-financial corporations consists of institutional units
whose distributive and financial transactions are distinct from those of
their owners and which are market producers, whose principal activity
is the production of goods and non-financial services.
The growth rate computations refer to an index of notional stocks,
rather than to the stock data directly. The index of notional stocks is
computed as a chain index I(t)=I(t-1)x[1+F(t)/S(t-1)], where F(t) are
transactions during the period and S(t-1) are stocks at the end of the
previous period.
Data collections are based on a census rather than a sample.
Source: ECB, Federal Reserve, Bank of Japan
Bank nonperforming loans to total
gross loans
Bank nonperforming loans to total gross loans are the value of
nonperforming loans divided by the total value of the loan portfolio
(including nonperforming loans before the deduction of specific loan-
loss provisions). The loan amount recorded as nonperforming should
be the gross value of the loan as recorded on the balance sheet, not just
the amount that is overdue.
Nonperforming loan is a sum of borrowed money upon which the
debtor has not made scheduled payments for at least 90 days.
Source: World Bank
Methodology annex: Definitions of the indicators
268
Percentage of non-performing loans by
sector of activity
Percentage of non-performing loans by sector of activity are the values
of nonperforming loans divided by the total value of the loans in a
breakdown by sector of activity (industry, construction, services and
real estate) and the non-performing loan is a sum of borrowed money
upon which the debtor has not made a schedules payments for at least
90 days.
Source: Bank of Spain
Extra and intra EU trade
International trade in goods statistics cover both extra- and intra-EU
trade: Extra-EU trade statistics cover the trading of goods between
Member States and a non-member countries. Intra-EU trade statistics
cover the trading of goods between Member States. "Goods" means all
movable property including electricity measured in volume indices
(2000=100).
Source: Eurostat, CPB World Trade Monitor
EU unit price of exports
Unit value is the expenditure or value of production of an item divided
by the quantity.
Foreign trade unit value indices are indicators describing price
dynamics of exported and imported goods. The export/import unit
value index characterises changes in the price level of exported and
imported goods within the reporting period against the base period.
The unit value index is a “price” index that measures average value
changes in a heterogeneous cluster of units. Therefore, it may be
influenced by changes both in the composition of this cluster and in
individual prices.
Indices are calculated by Eurostat, using a common methodology and
computer programs: monthly raw data are processed at the most
detailed level in order to calculate elementary unit-values defined by
trade value/quantity. These unit-values are divided by the average unit-
value of the previous year to obtain elementary unit-value indices, from
which outliers are detected and removed. Elementary unit-value indices
are then aggregated over countries and commodities, by using the
Laspeyres, Paasche and Fisher formulae. Finally, the Fisher unit-value
indices are chained back to the reference year (2000=100) and are used
to approximate the import and export price movements. Value-indices
are calculated as the percentage change between the trade value of the
current month and the average monthly trade value of the previous
year. These value indices are used to derive volume indices as follows:
value index = unit-value index x volume index. The growth rates of
unit-value and volume indices enable the user to decompose value
changes into price and volume components.
Source: Eurostat
Export revenue / operating average
ratio of SMEs
Export revenue divided by the operating average ratio of SMEs
Revenue is calculated by multiplying the price at which goods or
services are sold by the number of units or amount sold. It is the “top
line” or “gross income” figure from which costs are subtracted to
determine net income.
Operating ratio shows the efficiency of a company’s management by
comparing operating expenses to net sales or revenue. The smaller the
ratio, the greater the organization’s ability to generate profit if revenues
decrease.
Operating expenses refer to the on-going cost of running a product,
business or system and is a category of expenditure that a company
incurs as a result of performing its normal business operations.
Source: AMADEUS, own calculations

Methodology annex: Definitions of the indicators
269
Exports of environmental goods Intra- and extra-EU-27 exports of goods from ‘eco-industries’ divided
by total intra- and extra-EU-27 exports of goods (in nominal values).
The notion of ‘eco-industry’ refers to sectors whose products measure,
prevent, limit, minimise or correct environmental damage. The trade
codes considered to cover eco-industry goods are those identified in the
Ecorys study on the ‘Competitiveness of the EU eco-industry‘ (pages
190/191) of 22 October 2009, carried out for DG Enterprise and
Industry.
Due to the reclassification of the Comext products codes, please find
the updated list below (TABLE: Comext eco-products codes and
descriptions)
Source: European Commission (DG Enterprise and Industry)
calculations on the basis of Eurostat/COMEXT data
Current account adjustment (% GDP) Current account adjustment is expressed as the ratio between net
balance of payments and Gross Domestic Product main components at
current prices.
The balance of payments (BoP) is a statistical statement that
systematically summarises, over a given period of time, all the
transactions of an economy with the rest of the world. The balance of
payments records all economic transactions undertaken between the
residents and non-residents of a country during a given period. A
transaction is defined in the BPM5 as an economic flow that reflects
the creation, transformation, exchange, transfer, or extinction of
economic value and involves changes in ownership of goods and/or
financial assets, the provision of services, or the provision of labour
and capital.
Gross Domestic Product (GDP) is the monetary value of all the
finished goods and services produced within a country's borders in a
specific time period, though GDP is usually calculated on an annual
basis. It includes all of private and public consumption, government
outlays, investments and exports less imports that occur within a
defined territory.
Source: Eurostat
Change in demand for skills in the
manufacturing sector between 2010
and 2020
Comparison of change in demand for skills between 2010 and 2020 in
manufacturing sector with distinction for food, drink and tobacco,
engineering and rest of manufacturing, dynamics manufacturing was
also compared with change in all sectors.
Source: CEDEFOP
Skill and labour shortages in European
manufacturing companies
Skill and labour shortage in European manufacturing companies
expressed as percentage excess of demand over supply of available
workforce with distinction between skilled and low skilled and
unskilled.
Labour shortage indicator (LCI) shows proportion of manufacturing
companies that consider labour shortages, regardless of skill level,
being a factor so severe that it may limit their production.
Source: Eurofund, “European Company Survey”
European Commission “Business Survey”
Unit labour cost Unit labour costs (ULC) measure the average cost of labour per unit of
output and are calculated as the ratio of total labour costs to real output.
In broad terms, unit labour costs show how much output an economy

Methodology annex: Definitions of the indicators
270
receives relative to wages, or labour cost per unit of output. ULCs can
be calculated as the ratio of labour compensation to real GDP. It is also
the equivalent of the ratio between labour compensation per labour
input (per hour or per employee) worked and labour productivity.
Source: OECD
Fixed capital formation Evolution of investment components in the EU is measured by the
evolutions of the gross fixed capital formation (GFCF) where GFCF
consists of resident producers’ investments, deducting disposals, in
fixed assets during a given period. It also includes certain additions to
the value of non-produced assets realized by producers or institutional
units. Fixed assets are tangible or intangible assets produced as outputs
from production processes that are used repeatedly, or continuously,
for more than one year. Data have been seasonally adjusted and
adjusted by working days in millions of national currency, chain-linked
volumes, reference year 2005.
Source: Ameco
Real effective exchange rate Nominal effective exchange rate deflated by nominal unit labour costs
(total economy) relative to a panel of 36 countries (EU-27 + 9 other
industrial countries: Australia, Canada, United States, Japan, Norway,
New Zealand, Mexico, Switzerland, and Turkey). 1999=100 for all
countries. A rise in the index suggests deterioration in competitiveness.
The figure for each country is calculated against the rest of the
countries belonging to the panel. The EU aggregate figure is calculated
against the non-EU-27 countries belonging to the panel.
Source: European Commission (DG ECFIN)
Manufacturing and Construction (as %
of GDP at factor costs)
Share of manufacturing and construction in Member States’ total value
added (based on Gross value added at basic prices).
Source: Eurostat
Country share in EU manufacturing Share of manufacturing value added by Member State in total EU
manufacturing value-added.
Source: Eurostat
Innovation Union Scoreboard Composite indicator built on the basis of 24 indicators (0=lowest
possible performance, 1=maximum possible performance).
Source: Innovation Union Scoreboard 2013; European Commission
Energy intensity in industry (including
construction) and the energy sector
Energy consumption in kg of oil equivalent per euro of gross value-
added (chain-linked volumes, reference year 2000, at 2000 exchange
rates).
Due to data availability and to the structure of the Eurostat database on
energy and national accounts and of European Economic Area
greenhouse gas inventories, the indicators of energy and carbon
intensity include a broader, consistent definition of industry and
provide information for all Member States (with the exception of
Malta) for the most recent available year. Both aggregates (energy
consumption and emissions) are related to the consistent gross value
added data at constant prices (2000 as the reference year).
For ease of comparability between sectors and countries, energy
intensity is measured as the ratio between consumption and total gross
value added in the energy sector and industry (including construction
and the non-energy sector). In particular, energy intensity calculations
refer to final energy consumption in industry (including construction),
final non-energy consumption (i.e. for chemical reduction activities)
Methodology annex: Definitions of the indicators
271
and consumption in the energy sector.
Energy consumption refers to: B_101800 - Final energy consumption
in industry (including construction) + B_101600 - Final Non-energy
consumption + B_101300 - Consumption in Energy Sector.
GVA refers to NACE sections C: Mining and Quarrying, D:
Manufacturing, E: Electricity, Gas and Water Supply and F:
Construction.
Source: Eurostat (“environment and energy’ and ‘national accounts”)
Innovative industrial policy
Labour productivity per hour worked Gross Domestic Product in Purchasing Power Standards per hour
worked relative to EU-27 (EU-27=100)
Source: Eurostat
Labour productivity per person
employed
Gross Domestic Product in Purchasing Power Standards per person
employed relative to EU-27 (EU-27=100)
Source: Eurostat
Unit labour costs in manufacturing Development (2000=100) of the following ratio: Total compensation of
employees in manufacturing (in nominal values) divided by total
valued added in manufacturing (in constant prices).
Source: OECD
Tertiary graduates in science and
technology per 1000 of population
aged 20-29
Number of new science and technology graduates (levels 5 and 6 of the
International Standard Classification of Education-ISCED97) divided
by 20-29 years old population and then multiplying by 1000.
The term ‘science’ includes the following fields of education (ISCED):
life sciences, physical sciences, mathematics, statistics and computing,
while technology refers to graduates in engineering, manufacturing and
construction.
The indicator includes new tertiary graduates in a calendar year from
both public and private institutions completing graduate and post
graduate studies compared to the age group of 20-29 years old
population that corresponds to the typical graduation age in most
countries.
Source: Eurostat
R&D performed by businesses The indicator covers all expenditures for R&D performed within the
business enterprise sector (BERD) on the national territory during a
given period, regardless of the source of funds.
The data on this indicator are gathered by Eurostat which applies the
guidelines laid out in the Frascati Manual, the ‘Proposed standard
practice for surveys of research and experimental development’
(OECD, 2002).
Note: Gross domestic expenditure on R&D is composed of Business
enterprise expenditure on R&D, Higher education expenditure on
R&D, Government expenditure on R&D and Private non-profit
expenditure on R&D.
Source: Eurostat
Public R&D expenditure The indicator covers all R&D expenditures in the government sector
(GOVERD) and the higher education sector (HERD).
Source: Eurostat
Key enabling technologies (KETs) KETs are composed of six core technologies: micro-/nanoelectronics,
nanotechnology, photonics, advanced materials, industrial
Methodology annex: Definitions of the indicators
272
biotechnology and advanced manufacturing technologies.
Source: Calculations by European Commission/ZEW/NIW based on
Patstat and UN Comtrade data
Export performance
Total exports as % of GDP Value of Intra and Extra EU exports by Member State as % of GDP.
Source: Eurostat
Country share of total EU goods and
services exports
International trade in goods and services covers both extra- and intra-
EU trade. Extra-EU trade statistics cover the trading of goods between
Member States and non-member countries. Intra-EU trade statistics
cover the trading of goods between Member States. ‘Goods’ means all
movable property including electricity.
Source: Eurostat
Domestic value added of exports Value Added Export Ratio – Total domestic value added share of gross
exports, %.
Source: OECD – WTO; TiVA (Trade in Value Added)
Knowledge intensive exports Export values of Non-financial knowledge intensive services divided
by total exports of services, and export values of Medium and Hi-tech
goods divided by total exports of goods.
Non-financial knowledge intensive services
Following the same definition as that used in the Innovation Union
Scoreboard, Non-financial knowledge intensive services (NFKIS)
include the following: passenger and freight services for air and sea
transport, space transport, communications services, insurance
services, computer services, operational leasing services, legal,
accounting, management consulting and public relations, advertising,
market research and public opinion polling, research and development,
architectural, engineering, and other technical business services.
Source: data are calculated from the United Nations Balance of
Payments (exports of services)
Medium and Hi-Tech goods
Following the same definition as that used in the Innovation Union
Scoreboard, Medium and Hi-Tech goods (MHT) include (SITC rev 3
code in brackets): Synthetic and other man-made fibres suitable for
spinning (266-267), Alcohols, phenols, Carboxylic acids and their
derivatives (512-513), Radioactive and associated materials (525),
Pigments, paints, varnishes and related materials (533), Medicinal and
pharmaceutical products (54), Perfumery, cosmetic or toilet
preparations (553-554), fertilisers (562), plastics (57-58), Insecticides,
rodenticides, fungicides, herbicides, anti-sprouting products and plant-
growth regulators, disinfectants and similar products (591), Explosives
and pyrotechnic products (593), Prepared additives for mineral oils and
the like; prepared liquids for hydraulic transmission; anti-freezing
preparations and prepared de-icing fluids; lubricating preparations
(597), miscellaneous chemical products n.e.s. (598), articles of rubber,
n.e.s. (629), fabrics, woven, of man-made textile materials (not
including narrow or special fabrics) (653), Pig-iron and the like, ingots
and other primary forms, tubes, pipes, hollow profiles, pipe fittings of
iron or steel (671-672-679), power-generating machinery and
equipment and machinery specialised for particular industries (71-72),
machine tools except parts (731-733-737), general industrial machinery
and equipment, n.e.s. (74), office machines and automatic data-
processing machines (75), telecommunications and sound-recording
and reproducing apparatus and equipment (76), electrical machinery,
Methodology annex: Definitions of the indicators
273
apparatus and appliances, n.e.s., and electrical parts (77), road vehicles
(including air-cushion vehicles) (78), other transport equipment (79),
sanitary, plumbing and heating fixtures and fittings, n.e.s. (812),
professional, scientific and controlling instruments and apparatus, n.e.s.
(87), photographic apparatus, equipment and supplies and optical
goods, n.e.s.; watches and clocks (88) and miscellaneous manufactured
articles, n.e.s. (89).
Source: data are compiled from the UN database Comtrade (exports of
goods).
Knowledge-intensive services exports
as % of total services exports:
Numerator: Exports of knowledge-intensive services are measured by
the sum of credits in EBOPS (Extended Balance of Payments Services
Classification) 207, 208, 211, 212, 218, 228, 229, 245, 253, 260, 263,
272, 274, 278, 279, 280 and 284.
Denominator: Total services exports as measured by credits in EBOPS
200
The indicator measures the competitiveness of the knowledge-intensive
services sector. Knowledge-intensive services are defined as NACE
classes 61-62 and 64-72. These can be related to the above-mentioned
EBOPS classes using the correspondence table between NACE, ISIC
and EBOPS as provided in the UN Manual on Statistics of
International Trade in Services (UN, 2002).
Source: UN, Eurostat
Share of high-tech exports Share (in %) of intra- and extra-EU-27 exports of all high technology
products in total intra- and extra-EU-27 exports.
High technology products comprise: Aerospace, Computers office
machines, Electronics-telecommunications, Pharmacy, Scientific
instruments, Electrical machinery, Chemistry, Non-electrical
machinery, Armament.
Source: Eurostat
Business Environment and entrepreneurship
Business environment score Score calculated from Doing business data with seven indicators:
Starting a business, Dealing with construction permits, Registering
property, Getting credit, Protecting investors, Enforcing contracts and
Resolving insolvency. Each indicator is normalised to a figure between
0 and 1, where 0 is the worst possible member State performance and 1
the best one. The country score for a given year is the simple average
of the seven figures.
Source: World Bank Doing Business 2013
Performance in business environment
indicators
Calculation done on the basis of World Bank Doing business data with
seven indicators: Starting a business, Dealing with construction
permits, Registering property, Getting credit, Protecting investors,
Enforcing contracts and Resolving insolvency.
Source: World Bank Doing Business 2013
Electricity prices for medium-sized
enterprises
Average national price in Euro per kWh excluding taxes, applicable for
the first semester of each year for medium-sized industrial consumers
(annual consumption between 500 and 2000 MWh). The indicator does
not cover small enterprises for reasons of data availability, nor large
enterprises, since the latter often have individual contracts with energy
providers. Prices refer to the second half of the year.
Source: Eurostat
Methodology annex: Definitions of the indicators
274
Satisfaction with the quality of
infrastructure
Average mark given by business executives in a World Economic
Forum survey to the quality of rail, roads, ports and airports (1 =
underdeveloped; 7 = extensive and efficient by international
standards).
Source: Global Competitiveness Report 2013-14 of the World
Economic Forum.
Access to bank lending for SMEs Score calculated from the Eurobarometer survey data with six
indicators expressed as the percentage of respondents to the following
questions: Net increase in the need for bank loans in the past six
months; Not applying for a loan in the past six months for fear of
rejection; Applying for a loan in the past six months but being rejected,
or rejecting the offer because of too high costs; Net improvement in the
availability of loans in the past six months; Net increase in the size of
bank loans in the past six months; Net improved willingness of banks
to provide a loan in the past six months. 0 indicates the worst possible
situation and 1 the best possible one.
Source: Flash Eurobarometer
Investment in equipment, as % of GDP Gross fixed capital formation at current prices - equipment (UIGEQ; 3
years aggregate) divided by Gross domestic product at current market
prices (UVGD; 3 years aggregate).
Source: AMECO, Eurostat
Labour productivity in manufacturing
per person employed
Gross value added in Purchasing Power Standards per person
employed
Source: Eurostat
Percentage of employees in
manufacturing with high educational
attainment
Data are calculated from the annual labour force survey using the
International Standard Classification of Education (ISCED), levels 5
and 6 – i.e. employees in manufacturing with first and second stages of
tertiary education.
Source: Eurostat
Starting a business (days) Time needed to start a business, recorded in calendar days. It is the
median duration that incorporation lawyers indicate as necessary. It is
assumed that the minimum time required for each procedure is one
day.
Source: World Bank Doing Business 2013
Enterprise survival rate after 2 years Number of enterprises started in year t and which still existed in year
(t+2), divided by the total number of enterprises that started in year t
Source: Eurostat
Business churn Sum of the number of enterprise starts and exits (“births’ plus ‘deaths”)
in the reference period (year t), divided by the total number of
enterprises active in year t.
Source: Business Demography (Eurostat)
Share of high-growth enterprises Enterprises with average annualised growth greater than 20 % in the
number of employees, over a three-year period, and with ten or more
employees at the beginning of the observation period, divided by the
total number of active enterprises at the beginning of the three year
period.
Source : Eurostat
Venture capital Venture Capital: Data measure all venture capital investment as a
percentage of GDP.
Source: European Private Equity and Venture Capital Association

Methodology annex: Definitions of the indicators
275
(EVCA)
Licenses The indicator measures the time (in days) required to obtain licenses
following the Commission’s methodology and models, i.e.: the licenses
required for 5 ‘benchmark’ model companies: Hotel with a restaurant,
Plumbing company, Wholesale or retail distributor, Manufacturer of
steel products, Manufacturer of small IT devices.
Source: Graph adapted by the European Commission based on the
study: Business Dynamics: Start-ups, Business Transfers and
Bankruptcy, Final Report, January 2011
Infrastructure expenditures per
inhabitant
Sum of investment and maintenance expenditures on rail, road, inland
waterways, maritime ports and airports infrastructure.
Source: OECD International Transport Forum Statistics
Availability of high-speed broadband
infrastructure
Percentage of broadband lines with speed above 10 Mbps
Source: European Commission, DG INFSO Communications
Committee Working Document
Services in the overall economy Share of economic sectors in total gross value added (at basic prices)
belonging to the NACE categories: A+B; C+D+E; F; G+H+I; J; K;
L+M+N+O+P+Q
Source: Eurostat, National Accounts
Sustainable industry
Employment in knowledge-intensive
activities (manufacturing and services)
as % of total employment
Employment in knowledge-intensive activities (manufacturing and
services) as a % of total employment where knowledge-intensive
activities have been classified by Eurostat:
Knowledge-Intensive Activities (KIAs) are defined as economic
sectors in which more than 33 % of the employed labour force has
completed academic-oriented tertiary education (i.e. at ISCED 5 and 6
levels). They cover all sectors in the economy, including
manufacturing and services sectors, and can be defined at two and
three-digit levels of the statistical classification of economic activities.
Source: Eurostat, Innovation Union Scoreboard
License and patent revenues from
abroad as % of GDP
The export part of international transactions in royalties and license
fees.
Source: Eurostat, Innovation Union Scoreboard
Energy intensity in industry (including
construction) and the energy sector
Energy consumption in kg of oil equivalent per euro of gross value-
added (chain-linked volumes, reference year 2000, at 2000 exchange
rates).
Due to data availability and to the structure of the Eurostat database on
energy and national accounts and of European Economic Area
greenhouse gas inventories, the indicators of energy and carbon
intensity include a broader, consistent definition of industry and
provide information for all Member States (with the exception of
Malta) for the most recent available year. Both aggregates (energy
consumption and emissions) are related to the consistent gross value
added data at constant prices (2000 as the reference year).
For ease of comparability between sectors and countries, energy
intensity is measured as the ratio between consumption and total gross
value added in the energy sector and industry (including construction
and the non-energy sector). In particular, energy intensity calculations
refer to final energy consumption in industry (including construction),
final non-energy consumption (i.e. for chemical reduction activities)
and consumption in the energy sector.
Methodology annex: Definitions of the indicators
276
Energy consumption refers to: B_101800 - Final energy consumption
in industry (including construction) + B_101600 - Final Non-energy
consumption + B_101300 - Consumption in Energy Sector.
GVA refers to NACE sections C: Mining and Quarrying, D:
Manufacturing, E: Electricity, Gas and Water Supply and F:
Construction.
Source: Eurostat (“environment and energy’ and ‘national accounts”)
CO2 intensity in industry (including
construction) and the energy sector
CO2 emissions in kg per euro of gross value-added (chain-linked
volumes, reference year 2000, at 2000 exchange rates).
The carbon intensity indicator refers to CO2 emissions in industry
(including construction), from industrial processes and from solvent
and other product use in industry, and CO2 emissions from energy
industries.
Source: European Environmental Agency – for the figures on the CO2
emissions. The relevant categories are 1.A.1. (Energy Industries)
+1.A.2 (Manufacturing Industries and Construction) + 2. (Industrial
Processes) + 3 (Solvent and Other Product Use). Eurostat – for the
figures regarding GVA. GVA refers to NACE sections C: Mining and
Quarrying, D: Manufacturing, E: Electricity, Gas and Water Supply
and F: Construction.
Environment Protection Expenditures
in industry (% of GDP)
The Classification of Environmental Protection Activities (CEPA
2000) distinguishes nine environmental domains: protection of ambient
air and climate; wastewater management; waste management;
protection and remediation of soil, groundwater and surface water;
noise and vibration abatement; protection of biodiversity and
landscape; protection against radiation; research and development and
other environmental protection activities. Industry excludes recycling.
Source: Eurostat
Public administration
Government effectiveness Government effectiveness captures perceptions of the quality of the
public service, its degree of independence from political pressures, the
quality of policy formulation and implementation, and the credibility of
the government’s commitment to such policies (scale 0 to 100, 100 =
best).
Source: World Bank – Worldwide Governance Indicators (2010; 2011)
Incidence of innovations in public
administrations, by type (%)
Indicator based on the answers to the following three questions:
Q1. Since January 2008, did your organisation introduce any new or
significantly improved services?
Q5. Since January 2008, did your organisation introduce any new or
significantly improved methods of communicating your activities
to the public such as:
New and improved methods of promoting your organisation
or your services;
New or improved methods of influencing the behaviour of
users, citizens or others;
First time commercialisation (for sale) of services or goods?
Q6. Since January 2008, did your organisation introduce any new or
significantly improved processes or organisational methods, such
as:
New or improved methods of providing services or interacting
with your users;
New or improved delivery or logistics systems for your

Methodology annex: Definitions of the indicators
277
inputs;
New or improved supporting activities such as maintenance
systems, purchasing, accounting of computing systems, etc.;
New or improved management systems;
New or improved methods of organising work responsibilities
of decision making?
Survey covered 4000 randomly selected public administration
organisations with at least 10 employees ((defined as NACE 84.11
(General public administration activities) and NACE 84.12 (Regulation
of the activities of providing healthcare, education, cultural services
and other social services, excluding social security)) in EU27, Norway
and Switzerland.
Source: European Public Sector Innovation Scoreboard 2013 based
on Innobarometer 2010
Government procurement as driver of
business innovation
The indicator is constructed by calculating the share of “Yes” out of all
responses to the following question: Since January 2009, did the public
procurement activities of your company include the possibility to sell
one of your innovations to the government (i.e. new or significantly
improved products or services)? Answer categories: Yes / No /
[DK/NA]
Survey of 9500 randomly selected businesses employing 1 or more
persons in the manufacturing (NACE.C), retail (NACE.G), services
(NACE.I/J/K/H) and industry (NACE.B/D/E/F) in EU27, Croatia,
Iceland, Former Yugoslav Republic of Macedonia, Norway,
Switzerland and Turkey.
Source: European Public Sector Innovation Scoreboard (2013) based
on Innobarometer 2011
Time required and cost to start-up a
company
Time required to start a business is the number of calendar days needed
to complete the procedures to legally operate a business. If a procedure
can be speeded up at additional cost, the fastest procedure, independent
of cost, is chosen.
Cost to register a business is normalized by presenting it as a
percentage of gross national income (GNI) per capita.
Source: World Bank Doing Business 2013
Number of Hours to Comply Across
the European Union
Time is recorded in hours per year. The indicator measures the time
taken to prepare, file and pay three major types of taxes and
contributions: the corporate income tax, value added or sales tax, and
labour taxes, including payroll taxes and social contributions.
Source: European Commission based on the study PWC, Paying Taxes
2012, The Global Picture
Financial obstacles of SMEs for
receiving a bank loan across Euro area
countries
Every six months European Central Bank assess the latest
developments of the financial conditions of firms in the euro area but
conducting Survey on the access to finance of SMEs in the euro area
(SAFE). The survey covers micro, small, medium-sized and large firms
and it provides evidence on the financing conditions faced by SMEs
compared with those of large firms during the past six months.
Information on financial obstacles of SMEs for receiving a bank loan
across Euro Area is derived from SAFE in particular from the number
of positive responses to questions:
Q7A. Application to external finance in the past 6 months – euro area
Did not apply because of possible rejection
Q7B. Application success in the past 6 months – euro are
Methodology annex: Definitions of the indicators
278
Applied but refused because cost too high
Applied but was rejected
Applied but got limited part of it
Source: ECB
Interest rates for one-year loans up to
EUR 1 million
Annualized agreed rate/narrowly defined effective rate for the amount
up to EUR 1 million issued to counterpart sector of non-financial
corporations on loans other than revolving loans and overdrafts,
convenience and extended credit card debt maturing up to 1 year.
Source: ECB
Legal and regulatory framework Average evaluation (0 = negative; 10 = positive) of the statement ‘The
legal and regulatory framework encourages the competitiveness of
enterprises’ in an IMD survey of businesspeople.
Source: IMD (International Institute for Management Development)
Burden of government regulation Average mark given by business executives in a World Economic
Forum survey to the question ‘How burdensome is it for businesses in
your country to comply with governmental administrative requirements
(e.g., permits, regulations, reporting)?’ (1 = extremely burdensome; 7
= not burdensome at all)
Source: Global Competitiveness Report 2013-14 of the World
Economic Forum
E-government usage by enterprises Share of enterprises using the internet to interact with public authorities
(i.e. having used the Internet for one or more of the following
activities: obtaining information, downloading forms, filling-in web-
forms, full electronic case handling). Data are expressed in % of
enterprises with 10 or more persons employed and belonging to the
NACE 2.0 sections C, D, E, F, H, I, J, L, division 69-74 and group
95.1.
Source: Eurostat, Survey on ICT usage and e-commerce in enterprises
Tax compliance burden across the EU
(number of hours to pay taxes)
Number of hours a company operating in the same conditions would
need to spend to comply with tax regulations in the Member States in
2013
Source: World Bank Group “Paying Taxes 2013 The global picture”
Number of hours it takes to prepare,
file and pay three major types of taxes
Time to prepare and pay taxes is the time, in hours per year, it takes to
prepare, file, and pay (or withhold) three major types of taxes: the
corporate income tax, the value added or sales tax, and labor taxes,
including payroll taxes and social security contributions.
Source: World Bank Group “Paying Taxes 2013 The global picture”
Finance and Investment
Early stage financing The indicator measures early stage financing as % of GDP. Venture
capital investment data are broken down into ‘early stage’ (seed and
start-up) and ‘expansion and replacement’ capital. Seed capital is
defined as financing provided to research, assess and develop an initial
concept before a business has reached the start-up phase. Start-up is
defined as financing provided for product development and initial
marketing, manufacturing and sales.
Source: Eurostat, using data from the European Private Equity and
Venture Capital Association (EVCA).
Time taken for payments by public
authorities
Effective payment duration in days.
Source: European payment Index by Intrum Justitia
Methodology annex: Definitions of the indicators
279
Loans to non-financial corporations in
the euro are (EUR 1 billion, last three
months)
Cumulative annual flows of bank loans to non-financial institutions
from March(t) to February(t+2) as % of outstanding volumes at March(t).
Source: ECB – Monetary financial Institutions Balance Sheet Items
Statistics
The top 10 European countries for FDI Based on Ernst & Young’s European Investment Monitor, the database
tracks FDI projects that have resulted in new facilities and the creation
of new jobs. An investment in a company is normally included if the
foreign investor has more than 10% of its equity and a voice in its
management. FDI includes equity capital, reinvested earnings and
intra-company loans.
Source: Ernst & Young’s 2012 European attractiveness survey
Skills and productivity
Skill and labour shortages in European
manufacturing companies
Skill and labour shortage in European manufacturing companies
expressed as percentage excess of demand over supply of available
workforce with distinction between skilled and low skilled and
unskilled.
Labour shortage indicator (LCI) shows proportion of manufacturing
companies that consider labour shortages, regardless of skill level,
being a factor so severe that it may limit their production.
Source: Eurofund, “European Company Survey”
European Commission “Business Survey”
Proportion of workers in the
manufacturing who feel under- or
over-qualified for their current duties
in 2005 and 2010
Comparison across EU-27 and country by country of the percentage of
workers employed in manufacturing who feel that they are under or
over-qualified for their current duties.
Source: Eurofund “Fifth European Working Conditions”
Percentage of workforce who feel
under qualified for their current duty
Comparison across manufacturing subsectors of the percentage of
workers employed who feel that they are under qualified for their
current duties.
Answer to the Question 60 of the survey: Which of the following
alternatives would best describe your skills in your own work?
1 - I need further training to cope well with my duties
2 - My present skills correspond well with my duties
3 - I have the skills to cope with more demanding duties
8 - DK/no opinion (spontaneous)
9 - Refusal (spontaneous)
Source: Eurofund “Fifth European Working Conditions”
Real unit labour cost Real unit labour cost is the ratio of compensation per employee to
nominal GDP per person employed.
Source: European Commission (AMECO)
Changes in the annual growth rate of
GDP compared to the share of gross
fixed capital formation in total GDP
Comparison of the annual growth rate of GDP with the share of gross
fixed capital formation in the total GDP (ratio between GFCF and the
total GDP). Observed data between 2010 and 2013 have also been
compared with economic forecast by DG ECFIN (European
Commission). GDP and GFCF have been measured at current prices,
EUR in EU-27).
Gross domestic product (GDP) is the sum of final uses of goods and
services by resident institutional units (final consumption expenditure
and gross capital formation), plus exports and minus imports of goods
and services. At regional level the expenditure approach is not used in
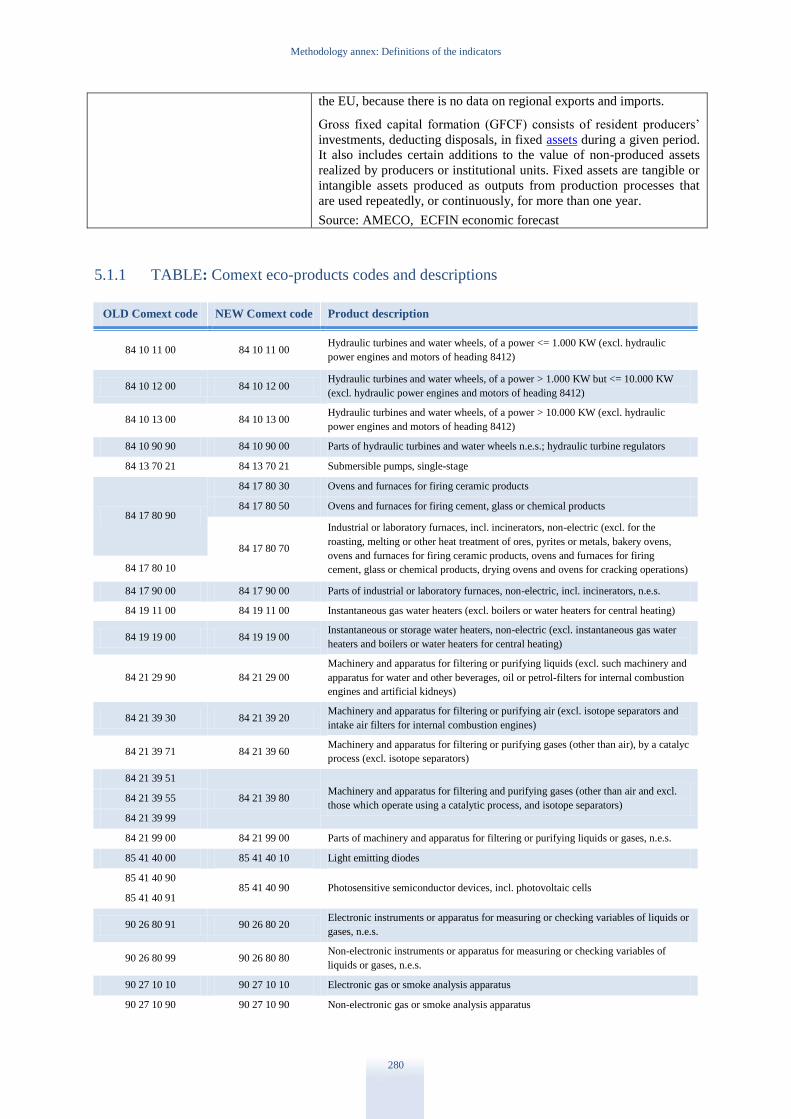
Methodology annex: Definitions of the indicators
280
the EU, because there is no data on regional exports and imports.
Gross fixed capital formation (GFCF) consists of resident producers’
investments, deducting disposals, in fixed assets during a given period.
It also includes certain additions to the value of non-produced assets
realized by producers or institutional units. Fixed assets are tangible or
intangible assets produced as outputs from production processes that
are used repeatedly, or continuously, for more than one year.
Source: AMECO, ECFIN economic forecast
5.1.1 TABLE: Comext eco-products codes and descriptions
OLD Comext code NEW Comext code Product description
84 10 11 00 84 10 11 00 Hydraulic turbines and water wheels, of a power <= 1.000 KW (excl. hydraulic
power engines and motors of heading 8412)
84 10 12 00 84 10 12 00 Hydraulic turbines and water wheels, of a power > 1.000 KW but <= 10.000 KW
(excl. hydraulic power engines and motors of heading 8412)
84 10 13 00 84 10 13 00 Hydraulic turbines and water wheels, of a power > 10.000 KW (excl. hydraulic
power engines and motors of heading 8412)
84 10 90 90 84 10 90 00 Parts of hydraulic turbines and water wheels n.e.s.; hydraulic turbine regulators
84 13 70 21 84 13 70 21 Submersible pumps, single-stage
84 17 80 90
84 17 80 30 Ovens and furnaces for firing ceramic products
84 17 80 50 Ovens and furnaces for firing cement, glass or chemical products
84 17 80 70
Industrial or laboratory furnaces, incl. incinerators, non-electric (excl. for the
roasting, melting or other heat treatment of ores, pyrites or metals, bakery ovens,
ovens and furnaces for firing ceramic products, ovens and furnaces for firing
cement, glass or chemical products, drying ovens and ovens for cracking operations) 84 17 80 10
84 17 90 00 84 17 90 00 Parts of industrial or laboratory furnaces, non-electric, incl. incinerators, n.e.s.
84 19 11 00 84 19 11 00 Instantaneous gas water heaters (excl. boilers or water heaters for central heating)
84 19 19 00 84 19 19 00 Instantaneous or storage water heaters, non-electric (excl. instantaneous gas water
heaters and boilers or water heaters for central heating)
84 21 29 90 84 21 29 00
Machinery and apparatus for filtering or purifying liquids (excl. such machinery and
apparatus for water and other beverages, oil or petrol-filters for internal combustion
engines and artificial kidneys)
84 21 39 30 84 21 39 20 Machinery and apparatus for filtering or purifying air (excl. isotope separators and
intake air filters for internal combustion engines)
84 21 39 71 84 21 39 60 Machinery and apparatus for filtering or purifying gases (other than air), by a catalyc
process (excl. isotope separators)
84 21 39 51
84 21 39 80 Machinery and apparatus for filtering and purifying gases (other than air and excl.
those which operate using a catalytic process, and isotope separators) 84 21 39 55
84 21 39 99
84 21 99 00 84 21 99 00 Parts of machinery and apparatus for filtering or purifying liquids or gases, n.e.s.
85 41 40 00 85 41 40 10 Light emitting diodes
85 41 40 90 85 41 40 90 Photosensitive semiconductor devices, incl. photovoltaic cells
85 41 40 91
90 26 80 91 90 26 80 20 Electronic instruments or apparatus for measuring or checking variables of liquids or
gases, n.e.s.
90 26 80 99 90 26 80 80 Non-electronic instruments or apparatus for measuring or checking variables of
liquids or gases, n.e.s.
90 27 10 10 90 27 10 10 Electronic gas or smoke analysis apparatus
90 27 10 90 90 27 10 90 Non-electronic gas or smoke analysis apparatus
Methodology annex: Methodological note on clustering
281
5.1.2 The country codes used in the tables
Country Code Country Code Country Code
Belgium BE Croatia HR Austria AT
Bulgaria BG Italy IT Poland PL
Czech Republic CZ Cyprus CY Portugal PT
Denmark DK Latvia LV Romania RO
Germany DE Lithuania LT Slovenia SI
Estonia EE Luxembourg LU Slovakia SK
Ireland IE Hungary HU Finland FI
Greece EL Malta MT Sweden SE
Spain ES Netherlands NL United Kingdom UK
France FR
5.2. Methodological note on clustering
To facilitate the description and analysis of the competitiveness of the Member States, they are classified into
performance groups. Their performance is defined by the ten indicators chosen for the scoreboard, with values
that are the latest available in the first half of 2013. In order to obtain full datasets missing data have been
estimated by an expectation maximisation algorithm.
The cluster analysis has been conducted on a full set of 10 indicators. Although some variables are correlated
with each other and are likely to move together, in order not lose any information contained in the dataset the
analysis has been conducted on the full set of indicators. Prior to the analysis the dataset has been standardised.
To gauge the stability of the clustering, a series of different methods were initially used. Each method produced
slight variations in the groupings, and the desired number of groups was an influential factor. As a representative
example, the clustering in this report has been performed by using the ‘k means’ method that in this case
suggests the optimal number of clusters to be three (using the error sum of squares criteria). The figure below
depicts the clusters in the space of the first two principal components that are extracted from the dataset.
The first two components account for 56.93% of the variability. The third component (not shown) accounts for
11.46% of the variance explained. Adding the third variable would not change the location of the countries that
are on the borders of their clusters. The first component seems not to be driven by any particular variable,
although it seems to be most influenced by labour productivity, educational attainment, business environment,
infrastructure satisfaction and innovation. Components two and three seem to be influenced by electricity prices
and bank landing.
In the case of Croatia, data problems have this time excluded it from the clustering analysis, but for analytical
purposes it has been included in the group of catching-up countries, as in many ways it shows similar behaviour.
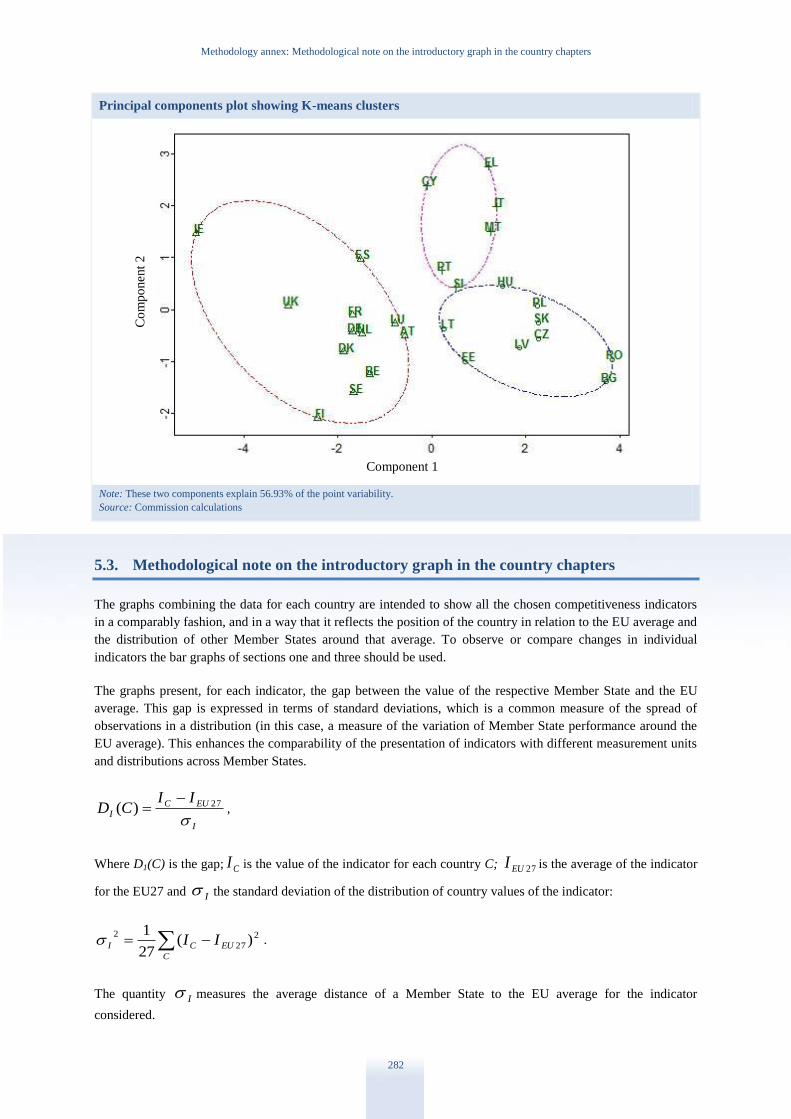
Methodology annex: Methodological note on the introductory graph in the country chapters
282
Principal components plot showing K-means clusters
Note: These two components explain 56.93% of the point variability.
Source: Commission calculations
5.3. Methodological note on the introductory graph in the country chapters
The graphs combining the data for each country are intended to show all the chosen competitiveness indicators
in a comparably fashion, and in a way that it reflects the position of the country in relation to the EU average and
the distribution of other Member States around that average. To observe or compare changes in individual
indicators the bar graphs of sections one and three should be used.
The graphs present, for each indicator, the gap between the value of the respective Member State and the EU
average. This gap is expressed in terms of standard deviations, which is a common measure of the spread of
observations in a distribution (in this case, a measure of the variation of Member State performance around the
EU average). This enhances the comparability of the presentation of indicators with different measurement units
and distributions across Member States.
I
EUCI
IICD
27)(
,
Where D1(C) is the gap; CI is the value of the indicator for each country C; 27EUI is the average of the indicator
for the EU27 and I the standard deviation of the distribution of country values of the indicator:
C
EUCI II 2
27
2)(
27
1 .
The quantity I measures the average distance of a Member State to the EU average for the indicator
considered.
Co
mp
onent
2
Component 1
Methodology annex: Methodological note on the introductory graph in the country chapters
283
The data are presented in the country graphs in such a way that a bar pointing to the right always indicates a
positive performance. Likewise, a bar pointing to the left always indicates a performance below average. This is
straightforward for indicators, e.g. labour productivity, where high values are strived for. However, for those
indicators where low values are the objective, the data bars in the graph have been converted so that a positive
deviation from the average (bar pointing to the right) represents a lower value of the indicator than the average.
These conversions enable an easy reading of the country profiles, since all bars presenting positive values in the
country profile suggest a level of performance of the respective Member State which is better than the EU
average and all bars presenting negative values suggest a level of performance of the respective Member State
which is below EU average.
The indicators for which such conversions have been carried out are: (1) energy intensity in industry in kg of oil
equivalent per euro of gross value-added at constant prices; (2) carbon intensity per ton of oil equivalent of
energy consumption; (3) electricity prices for medium-sized enterprises, (4) time required to start a business; (5)
time taken for payments by public authorities.
The indicators for which calculating a gap with the EU average would not be meaningful (exchange rates and
trade balances) are quoted in the text.The EU averages used to show the respective standard deviations in the
country profiles are the values for the EU as a whole and, hence, weighted averages of Member States
performance. For the following indicators, however, unweighted arithmetic averages have been used due to
missing EU totals: share of science and technology graduates, satisfaction with quality of infrastructure, legal
and regulatory framework, time required to start a business, business environment score, enterprise survival rate,
business churn, early stage financing, access to bank lending, duration of payments by public authorities, share
of high-growth enterprises as percent of all enterprises.
Data used to show the respective standard deviations in the country profiles are the values for the EU as a whole
and, hence, weighted averages of Member States performance where data are available. For the following
indicators, however, unweighted arithmetic averages have been used due to missing EU totals: share of science
and technology graduates, satisfaction with quality of infrastructure, legal and regulatory framework, time
required to start a business, business environment score, enterprise survival rate, business churn, early stage
financing, access to bank lending, duration of payments by public authorities, share of high-growth enterprises as
percentage of all enterprises.

The Europe 2020 strategy is about delivering growth that is smart, through more effective investments in edu-cation, research and innovation; sustainable, due to a
decisive move towards a low-carbon economy; and inclusive, with a strong emphasis on job creation and poverty reduction.
This report by DG Enterprise and Industry of the European Commission contains an overview of industrial policy at European level, and analyses Member States’ performance and policies on industrial competitiveness. It reviews and compares industrial performance based on a set of indicators in the areas of industrial innovation, sustainability of industries, business environment and entrepreneurship.
Through this analysis, the report aims to contribute to the achievement of the Europe 2020 goals by identifying areas needing attention, and presenting policy measures of the Member States that contribute to achieving the Europe 2020 targets.
The first part of the report is the ‘Industrial performance score-board’. It outlines the current situation of European industry and compares progress achieved by Member States. The scoreboard is based on a small number of indicators selected from the country chapters of the report. The analysis is divided into five areas: productivity and skills; export performance; innovation and sustainability; business environment and infrastructure; and finance and investment.
The second part of the report looks at how industrial policy has been implemented at European level, and the third part looks at broad policy implementation in the Member States. The fourth part is composed of 28 country chapters.
2013 EDITION
Member States’ Competitiveness Performance and Implementation of EU Industrial Policy
Industrial Performance Scoreboard
A Europe 2020 Initiative
imag
e: iS
tock
phot
o.co
m -
© G
orfe
r
Related Documents