MARKET ACCESS SECRETARIAT Global Analysis Report Competitive Trade Analysis Czech Republic June 2016 REPORT CONTENT SUMMARY This report looks to highlight the major sectors in the Czech Republic, and attempts to identify the best opportunities for Canadian exports. Specifically, the data analysis that follows focuses on the top ten Czech imports by major aggregate sector, of which Canada maybe a supplier. It identifies the gap between Czech Republic’s imports from the world and the proportion provided by Canada, and then outlines top international competitors. Unless otherwise specified, all figures in this document are based on import data as reported by Eurostat, and were sourced from Global Trade Atlas (2015). CZECH REPUBLIC MARKET SUMMARY In 2014, the Czech Republic was the 33 rd -largest importer of agri-food and seafood products in the world, and the 14 th - largest among members of the European Union (EU) with C$11.0 billion in imports. Czech Republic is also the world’s 36 th -largest agri-food and seafood exporter (14 th -largest in the EU) with C$9.7 billion in exports. However, the C$1.3 billion trade deficit in 2014 highlights the country dependency for agri- food and seafood imports. Czech Republic’s top agri-food and seafood trading partners include Germany with 24.1% of total import value, Poland (16.9%), and the Netherlands (9.2%). Canada was Czech Republic’s 29 th -largest import provider in 2014, representing C$29.0 million, or just 0.3% of the market. Note: Please see the Annex at the end of this document for a list of abbreviations that will be used throughout this report. CONTENTS Report Content Summary ...............1 Czech Republic Market Summary...1 Trade Overview ...............................2 Top Ten Agri-Food and Seafood Commodity Imports .........................4 1. Meat and Edible Offal.............4 2. Dairy, Eggs and Honey ..........6 3. Miscellaneous Edible Preparations ...........................8 4. Edible Fruit and Nuts........... 10 5. Beverages ........................... 12 6. Baking Related Goods and Pasta. ........................... 14 7. Food Waste And Animal Feed................. 16 8. Edible Vegetables ............... 18 9. Cocoa and Cocoa Preparations. ....................... 20 10. Coffee, Tea and Spices .... 22 Conclusion .................................... 24 For More Information .................... 24 Resources .................................... 24 Visit our online library of public reports for more information on this and other markets.

Welcome message from author
This document is posted to help you gain knowledge. Please leave a comment to let me know what you think about it! Share it to your friends and learn new things together.
Transcript
MARKET ACCESS SECRETARIAT Global Analysis Report
Competitive Trade Analysis
Czech Republic June 2016
REPORT CONTENT SUMMARY
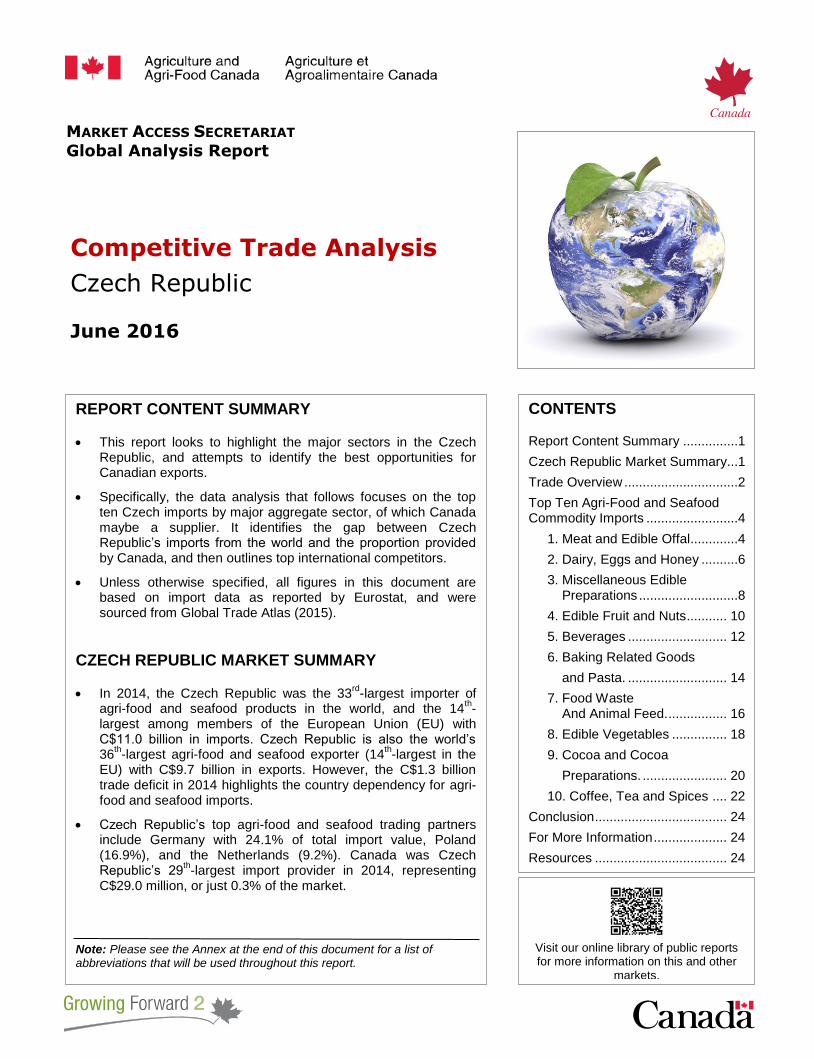
This report looks to highlight the major sectors in the Czech Republic, and attempts to identify the best opportunities for Canadian exports.
Specifically, the data analysis that follows focuses on the top ten Czech imports by major aggregate sector, of which Canada maybe a supplier. It identifies the gap between Czech Republic’s imports from the world and the proportion provided by Canada, and then outlines top international competitors.
Unless otherwise specified, all figures in this document are based on import data as reported by Eurostat, and were sourced from Global Trade Atlas (2015).
CZECH REPUBLIC MARKET SUMMARY
In 2014, the Czech Republic was the 33rd
-largest importer of agri-food and seafood products in the world, and the 14
th-
largest among members of the European Union (EU) with C$11.0 billion in imports. Czech Republic is also the world’s 36
th-largest agri-food and seafood exporter (14
th-largest in the
EU) with C$9.7 billion in exports. However, the C$1.3 billion trade deficit in 2014 highlights the country dependency for agri-food and seafood imports.
Czech Republic’s top agri-food and seafood trading partners include Germany with 24.1% of total import value, Poland (16.9%), and the Netherlands (9.2%). Canada was Czech Republic’s 29
th-largest import provider in 2014, representing
C$29.0 million, or just 0.3% of the market.
Note: Please see the Annex at the end of this document for a list of abbreviations that will be used throughout this report.
CONTENTS Report Content Summary ...............1
Czech Republic Market Summary ...1
Trade Overview ...............................2
Top Ten Agri-Food and Seafood Commodity Imports .........................4
1. Meat and Edible Offal .............4
2. Dairy, Eggs and Honey ..........6
3. Miscellaneous Edible Preparations ...........................8
4. Edible Fruit and Nuts ........... 10
5. Beverages ........................... 12
6. Baking Related Goods
and Pasta. ........................... 14
7. Food Waste And Animal Feed. ................ 16
8. Edible Vegetables ............... 18
9. Cocoa and Cocoa
Preparations. ....................... 20
10. Coffee, Tea and Spices .... 22
Conclusion .................................... 24
For More Information .................... 24
Resources .................................... 24
Annex: Abbreviations ................... 24
Visit our online library of public reports for more information on this and other
markets.
Page | 2
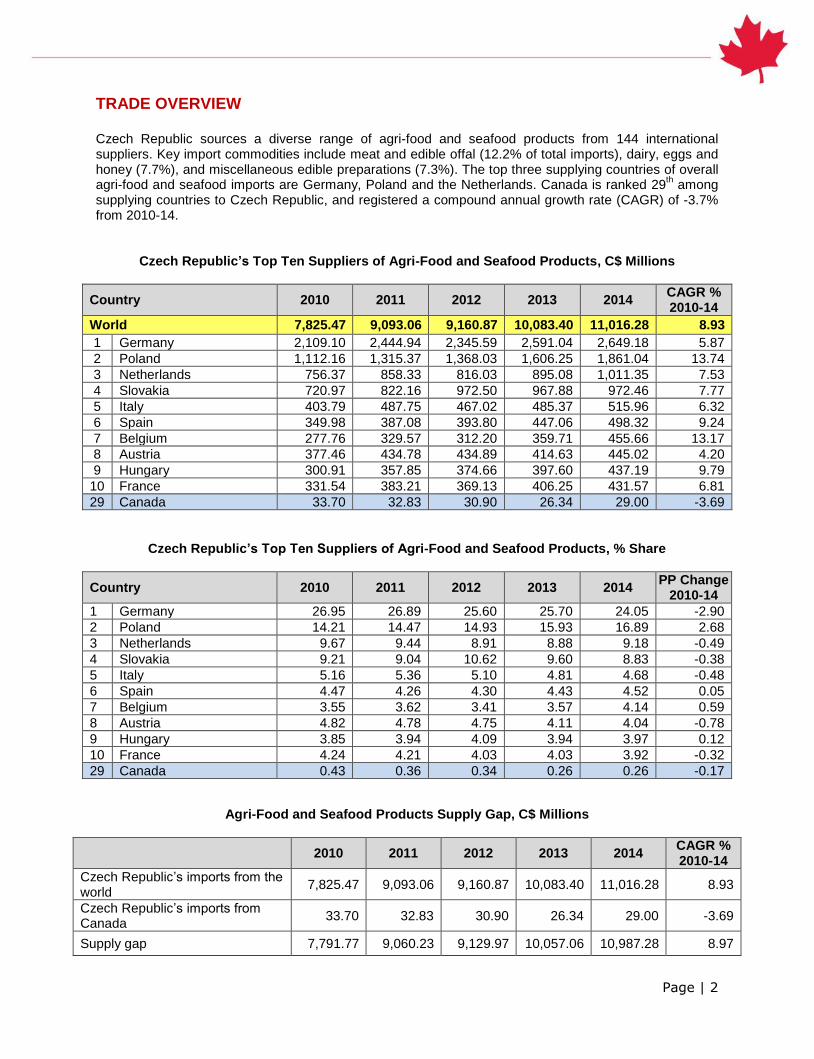
TRADE OVERVIEW Czech Republic sources a diverse range of agri-food and seafood products from 144 international suppliers. Key import commodities include meat and edible offal (12.2% of total imports), dairy, eggs and honey (7.7%), and miscellaneous edible preparations (7.3%). The top three supplying countries of overall agri-food and seafood imports are Germany, Poland and the Netherlands. Canada is ranked 29
th among
supplying countries to Czech Republic, and registered a compound annual growth rate (CAGR) of -3.7% from 2010-14.
Czech Republic’s Top Ten Suppliers of Agri-Food and Seafood Products, C$ Millions
Country 2010 2011 2012 2013 2014 CAGR % 2010-14
World 7,825.47 9,093.06 9,160.87 10,083.40 11,016.28 8.93
1 Germany 2,109.10 2,444.94 2,345.59 2,591.04 2,649.18 5.87
2 Poland 1,112.16 1,315.37 1,368.03 1,606.25 1,861.04 13.74
3 Netherlands 756.37 858.33 816.03 895.08 1,011.35 7.53
4 Slovakia 720.97 822.16 972.50 967.88 972.46 7.77
5 Italy 403.79 487.75 467.02 485.37 515.96 6.32
6 Spain 349.98 387.08 393.80 447.06 498.32 9.24
7 Belgium 277.76 329.57 312.20 359.71 455.66 13.17
8 Austria 377.46 434.78 434.89 414.63 445.02 4.20
9 Hungary 300.91 357.85 374.66 397.60 437.19 9.79
10 France 331.54 383.21 369.13 406.25 431.57 6.81
29 Canada 33.70 32.83 30.90 26.34 29.00 -3.69
Czech Republic’s Top Ten Suppliers of Agri-Food and Seafood Products, % Share
Country 2010 2011 2012 2013 2014 PP Change
2010-14
1 Germany 26.95 26.89 25.60 25.70 24.05 -2.90
2 Poland 14.21 14.47 14.93 15.93 16.89 2.68
3 Netherlands 9.67 9.44 8.91 8.88 9.18 -0.49
4 Slovakia 9.21 9.04 10.62 9.60 8.83 -0.38
5 Italy 5.16 5.36 5.10 4.81 4.68 -0.48
6 Spain 4.47 4.26 4.30 4.43 4.52 0.05
7 Belgium 3.55 3.62 3.41 3.57 4.14 0.59
8 Austria 4.82 4.78 4.75 4.11 4.04 -0.78
9 Hungary 3.85 3.94 4.09 3.94 3.97 0.12
10 France 4.24 4.21 4.03 4.03 3.92 -0.32
29 Canada 0.43 0.36 0.34 0.26 0.26 -0.17
Agri-Food and Seafood Products Supply Gap, C$ Millions
2010 2011 2012 2013 2014 CAGR % 2010-14
Czech Republic’s imports from the world
7,825.47 9,093.06 9,160.87 10,083.40 11,016.28 8.93
Czech Republic’s imports from Canada
33.70 32.83 30.90 26.34 29.00 -3.69
Supply gap 7,791.77 9,060.23 9,129.97 10,057.06 10,987.28 8.97

Page | 3
Meat and edible offal represented Czech Republic’s top-grossing import commodity in 2014, with a value of over C$10.0 billion, or 12.2% of overall agri-food and seafood imports. Across the 2010 to 2014 period, nine of the top ten categories had a compound annual growth rate (CAGR) over 8.0%. The categories of coffee, tea and spice, and food waste and animal feed were the strongest growing commodities over the period, with compound annual growth rates (CAGR) of 19.5% and 10.7%.
Czech Republic’s Top Ten Agri-Food and Seafood Commodity Imports from the World,
C$ Millions
Rank HS
Code Commodity 2010 2011 2012 2013 2014
CAGR % 2010-14
Total agri-food and seafood imports 7,825.47 9,093.06 9,160.87 10,083.40 11,016.28 8.93
1 02 Meat and edible offal 920.36 1,107.24 1,176.58 1,234.95 1,340.43 9.86
2 04 Dairy, eggs and honey 614.96 695.79 685.29 753.68 849.84 8.42
3 21 Miscellaneous edible preparations
552.20 643.64 691.95 749.46 804.78 9.87
4 08 Edible fruit and nuts 630.47 675.44 641.20 730.81 768.21 5.06
5 22 Beverages 525.05 639.53 576.12 657.45 751.87 9.39
6 19 Baking related goods and pasta
496.15 581.52 587.86 658.10 692.55 8.70
7 23 Food waste and animal feed
455.81 501.40 528.56 637.47 683.48 10.66
8 07 Edible vegetables 589.49 586.44 518.19 614.62 626.72 1.54
9 18 Cocoa and cocoa preparations
355.32 400.62 394.26 440.47 513.65 9.65
10 09 Coffee, tea, and spices 200.85 264.67 240.57 247.62 409.26 19.48

Page | 4
TOP TEN AGRI-FOOD AND SEAFOOD COMMODITY IMPORTS
1. MEAT AND EDIBLE OFFAL
Czech Republic’s Top Ten Suppliers of Meat and Edible Offal, C$ Millions
Country 2010 2011 2012 2013 2014 CAGR % 2010-14
World 920.36 1,107.24 1,176.58 1,234.95 1,340.43 9.86
Germany 320.07 346.33 341.20 397.36 410.08 6.39
Poland 173.29 189.78 202.39 237.39 287.48 13.49
Netherlands 89.46 135.46 135.37 110.82 122.21 8.11
Slovakia 57.12 83.15 110.76 90.74 89.52 11.88
Spain 38.92 44.60 59.31 74.38 86.88 22.24
Austria 65.68 87.12 82.88 81.49 86.49 7.13
Belgium 38.14 45.16 54.91 67.69 68.49 15.76
Denmark 19.52 27.22 35.67 29.90 43.36 22.09
Hungary 32.07 41.36 46.96 45.99 40.18 5.80
France 22.11 28.04 37.31 37.14 36.18 13.10
Czech Republic’s Top Ten Suppliers of Meat and Edible Offal, % Share
Country 2010 2011 2012 2013 2014 PP Change
2010-14
Germany 34.78 31.28 29.00 32.18 30.59 -4.19
Poland 18.83 17.14 17.20 19.22 21.45 2.62
Netherlands 9.72 12.23 11.51 8.97 9.12 -0.60
Slovakia 6.21 7.51 9.41 7.35 6.68 0.47
Spain 4.23 4.03 5.04 6.02 6.48 2.25
Austria 7.14 7.87 7.04 6.60 6.45 -0.69
Belgium 4.14 4.08 4.67 5.48 5.11 0.97
Denmark 2.12 2.46 3.03 2.42 3.23 1.11
Hungary 3.48 3.74 3.99 3.72 3.00 -0.48
France 2.40 2.53 3.17 3.01 2.70 0.30
Page | 5
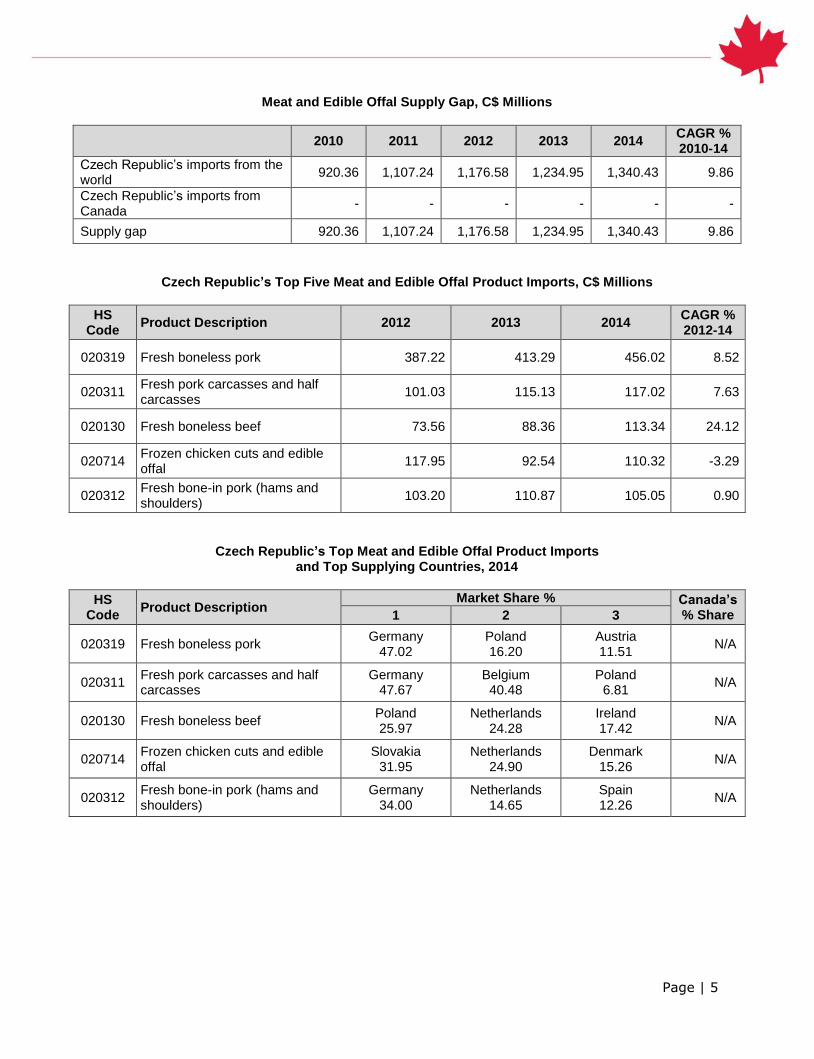
Meat and Edible Offal Supply Gap, C$ Millions
2010 2011 2012 2013 2014 CAGR % 2010-14
Czech Republic’s imports from the world
920.36 1,107.24 1,176.58 1,234.95 1,340.43 9.86
Czech Republic’s imports from Canada
- - - - - -
Supply gap 920.36 1,107.24 1,176.58 1,234.95 1,340.43 9.86
Czech Republic’s Top Five Meat and Edible Offal Product Imports, C$ Millions
HS Code
Product Description 2012 2013 2014 CAGR % 2012-14
020319 Fresh boneless pork 387.22 413.29 456.02 8.52
020311 Fresh pork carcasses and half carcasses
101.03 115.13 117.02 7.63
020130 Fresh boneless beef 73.56 88.36 113.34 24.12
020714 Frozen chicken cuts and edible offal
117.95 92.54 110.32 -3.29
020312 Fresh bone-in pork (hams and shoulders)
103.20 110.87 105.05 0.90
Czech Republic’s Top Meat and Edible Offal Product Imports and Top Supplying Countries, 2014
HS Code
Product Description Market Share % Canada’s
% Share 1 2 3
020319 Fresh boneless pork Germany
47.02 Poland 16.20
Austria 11.51
N/A
020311 Fresh pork carcasses and half carcasses
Germany 47.67
Belgium 40.48
Poland 6.81
N/A
020130 Fresh boneless beef Poland 25.97
Netherlands 24.28
Ireland 17.42
N/A
020714 Frozen chicken cuts and edible offal
Slovakia 31.95
Netherlands 24.90
Denmark 15.26
N/A
020312 Fresh bone-in pork (hams and shoulders)
Germany 34.00
Netherlands 14.65
Spain 12.26
N/A

Page | 6
2. DAIRY, EGGS AND HONEY
Czech Republic’s Top Ten Suppliers of Dairy, Eggs and Honey, C$ Millions
Country 2010 2011 2012 2013 2014 CAGR % 2010-14
World 614.96 695.79 685.29 753.68 849.84 8.42
Germany 241.10 263.46 267.34 305.32 332.50 8.37
Poland 187.72 212.20 182.66 194.52 221.65 4.24
Slovakia 76.06 99.97 105.93 117.20 124.35 13.07
Netherlands 20.92 19.76 25.02 30.41 42.34 19.28
France 18.07 27.91 28.12 28.09 30.12 13.63
Italy 13.35 16.40 18.45 21.20 25.41 17.46
Belgium 24.14 24.13 16.63 16.92 20.37 -4.16
Austria 8.28 7.67 9.19 7.48 7.88 -1.22
United Kingdom 2.09 1.90 3.19 4.00 7.64 38.22
Lithuania 2.91 3.32 4.03 6.87 7.49 26.72
(52) Canada 0.02 0.03 0.00 0.00 0.00 -100.00
Czech Republic’s Top Ten Suppliers of Dairy, Eggs and Honey, % Share
Country 2010 2011 2012 2013 2014 PP Change
2010-14
Germany 39.21 37.87 39.01 40.51 39.13 -0.08
Poland 30.53 30.50 26.65 25.81 26.08 -4.45
Slovakia 12.37 14.37 15.46 15.55 14.63 2.26
Netherlands 3.40 2.84 3.65 4.04 4.98 1.58
France 2.94 4.01 4.10 3.73 3.54 0.60
Italy 2.17 2.36 2.69 2.81 2.99 0.82
Belgium 3.93 3.47 2.43 2.24 2.40 -1.53
Austria 1.35 1.10 1.34 0.99 0.93 -0.42
United Kingdom 0.34 0.27 0.47 0.53 0.90 0.56
Lithuania 0.47 0.48 0.59 0.91 0.88 0.41
(52) Canada 0.00 0.00 0.00 0.00 0.00 0.00
Dairy, Eggs and Honey Supply Gap, C$ Millions
2010 2011 2012 2013 2014 CAGR % 2010-14
Czech Republic’s imports from the world
614.96 695.79 685.29 753.68 849.84 8.42
Czech Republic’s imports from Canada
0.02 0.03 0.00 0.00 0.00 -100.00
Supply gap 614.94 695.76 685.29 753.68 849.84 8.42
Page | 7
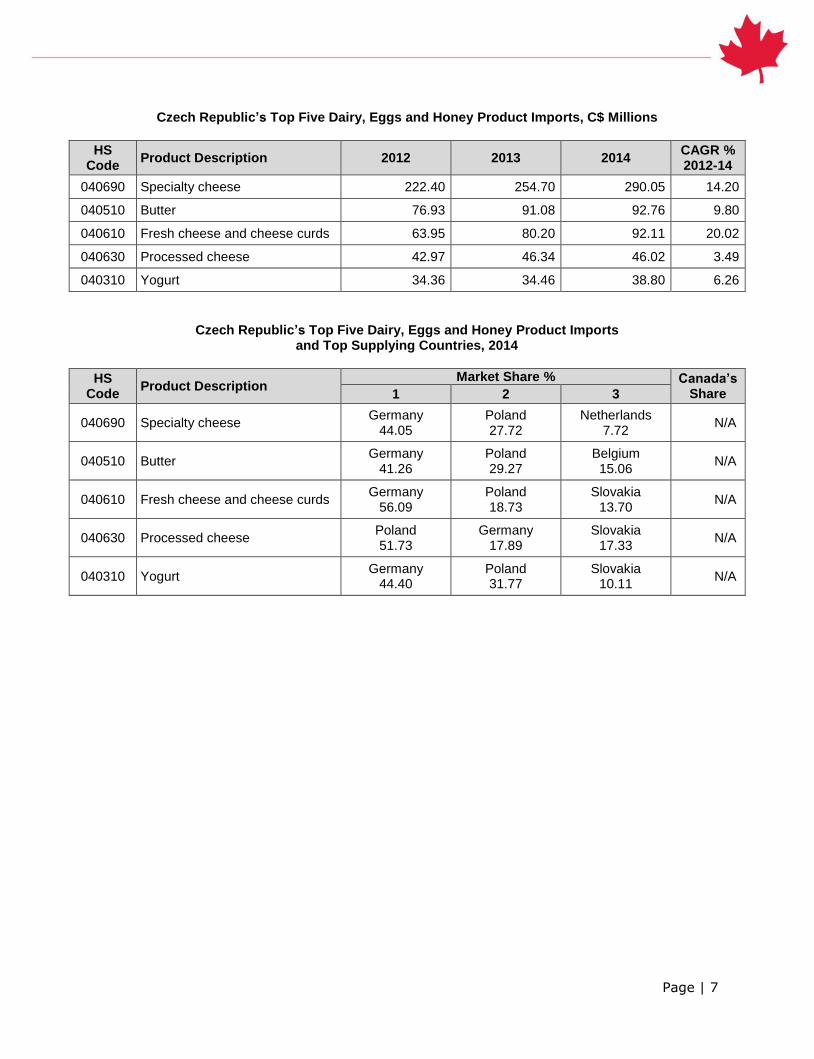
Czech Republic’s Top Five Dairy, Eggs and Honey Product Imports, C$ Millions
HS Code
Product Description 2012 2013 2014 CAGR % 2012-14
040690 Specialty cheese 222.40 254.70 290.05 14.20
040510 Butter 76.93 91.08 92.76 9.80
040610 Fresh cheese and cheese curds 63.95 80.20 92.11 20.02
040630 Processed cheese 42.97 46.34 46.02 3.49
040310 Yogurt 34.36 34.46 38.80 6.26
Czech Republic’s Top Five Dairy, Eggs and Honey Product Imports and Top Supplying Countries, 2014
HS Code
Product Description Market Share % Canada’s
Share 1 2 3
040690 Specialty cheese Germany
44.05 Poland 27.72
Netherlands 7.72
N/A
040510 Butter Germany
41.26 Poland 29.27
Belgium 15.06
N/A
040610 Fresh cheese and cheese curds Germany
56.09 Poland 18.73
Slovakia 13.70
N/A
040630 Processed cheese Poland 51.73
Germany 17.89
Slovakia 17.33
N/A
040310 Yogurt Germany
44.40 Poland 31.77
Slovakia 10.11
N/A
Page | 8
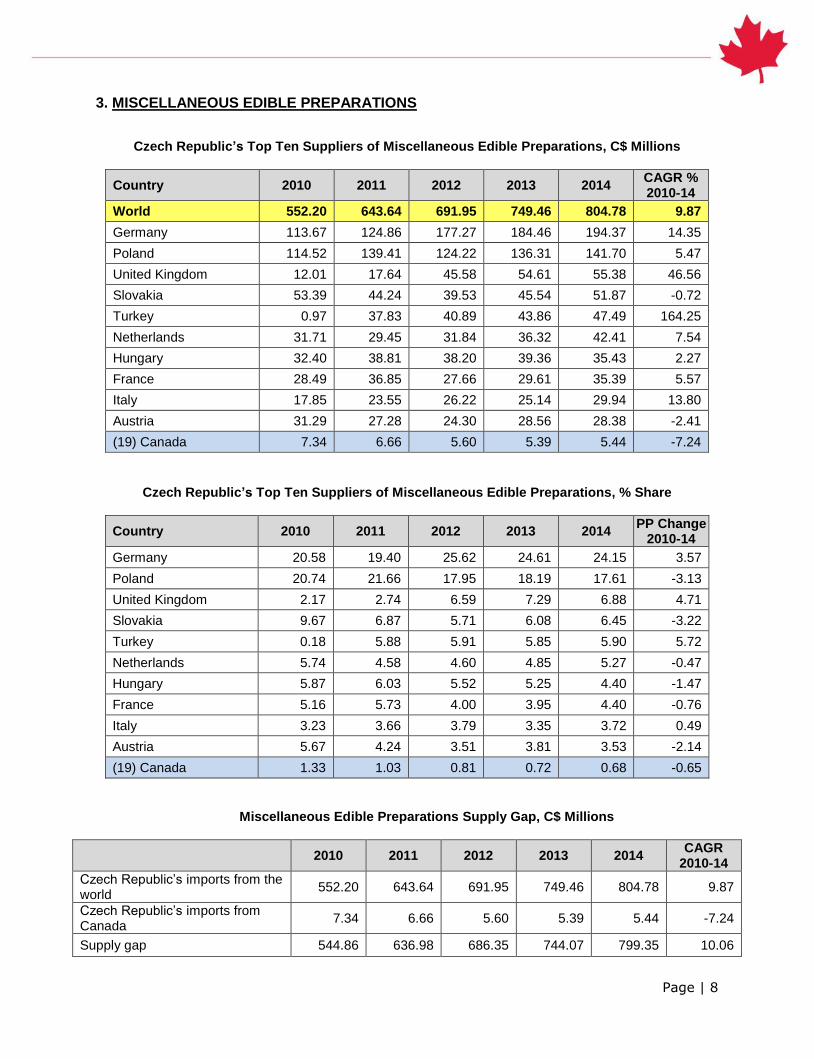
3. MISCELLANEOUS EDIBLE PREPARATIONS
Czech Republic’s Top Ten Suppliers of Miscellaneous Edible Preparations, C$ Millions
Country 2010 2011 2012 2013 2014 CAGR % 2010-14
World 552.20 643.64 691.95 749.46 804.78 9.87
Germany 113.67 124.86 177.27 184.46 194.37 14.35
Poland 114.52 139.41 124.22 136.31 141.70 5.47
United Kingdom 12.01 17.64 45.58 54.61 55.38 46.56
Slovakia 53.39 44.24 39.53 45.54 51.87 -0.72
Turkey 0.97 37.83 40.89 43.86 47.49 164.25
Netherlands 31.71 29.45 31.84 36.32 42.41 7.54
Hungary 32.40 38.81 38.20 39.36 35.43 2.27
France 28.49 36.85 27.66 29.61 35.39 5.57
Italy 17.85 23.55 26.22 25.14 29.94 13.80
Austria 31.29 27.28 24.30 28.56 28.38 -2.41
(19) Canada 7.34 6.66 5.60 5.39 5.44 -7.24
Czech Republic’s Top Ten Suppliers of Miscellaneous Edible Preparations, % Share
Country 2010 2011 2012 2013 2014 PP Change
2010-14
Germany 20.58 19.40 25.62 24.61 24.15 3.57
Poland 20.74 21.66 17.95 18.19 17.61 -3.13
United Kingdom 2.17 2.74 6.59 7.29 6.88 4.71
Slovakia 9.67 6.87 5.71 6.08 6.45 -3.22
Turkey 0.18 5.88 5.91 5.85 5.90 5.72
Netherlands 5.74 4.58 4.60 4.85 5.27 -0.47
Hungary 5.87 6.03 5.52 5.25 4.40 -1.47
France 5.16 5.73 4.00 3.95 4.40 -0.76
Italy 3.23 3.66 3.79 3.35 3.72 0.49
Austria 5.67 4.24 3.51 3.81 3.53 -2.14
(19) Canada 1.33 1.03 0.81 0.72 0.68 -0.65
Miscellaneous Edible Preparations Supply Gap, C$ Millions
2010 2011 2012 2013 2014 CAGR
2010-14
Czech Republic’s imports from the world
552.20 643.64 691.95 749.46 804.78 9.87
Czech Republic’s imports from Canada
7.34 6.66 5.60 5.39 5.44 -7.24
Supply gap 544.86 636.98 686.35 744.07 799.35 10.06
Page | 9
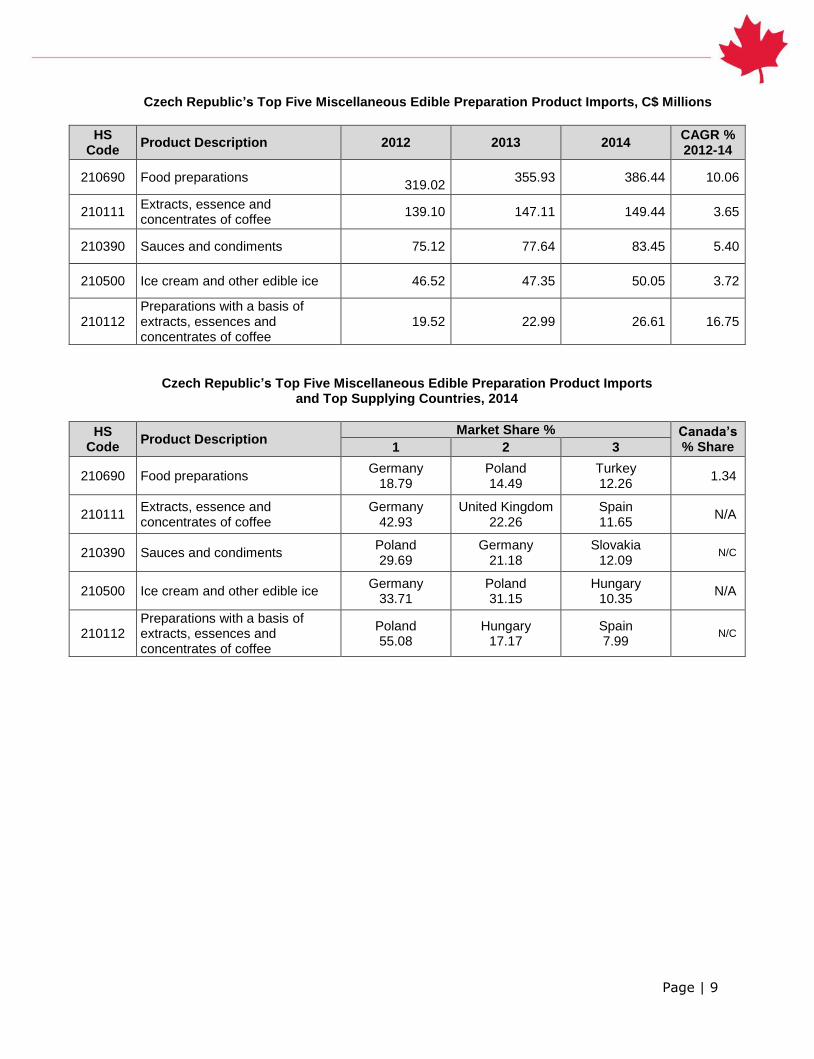
Czech Republic’s Top Five Miscellaneous Edible Preparation Product Imports, C$ Millions
HS Code
Product Description 2012 2013 2014 CAGR % 2012-14
210690 Food preparations
319.02 355.93 386.44 10.06
210111 Extracts, essence and concentrates of coffee
139.10 147.11 149.44 3.65
210390 Sauces and condiments 75.12 77.64 83.45 5.40
210500 Ice cream and other edible ice 46.52 47.35 50.05 3.72
210112 Preparations with a basis of extracts, essences and concentrates of coffee
19.52 22.99 26.61 16.75
Czech Republic’s Top Five Miscellaneous Edible Preparation Product Imports and Top Supplying Countries, 2014
HS Code
Product Description Market Share % Canada’s
% Share 1 2 3
210690 Food preparations Germany
18.79 Poland 14.49
Turkey 12.26
1.34
210111 Extracts, essence and concentrates of coffee
Germany 42.93
United Kingdom 22.26
Spain 11.65
N/A
210390 Sauces and condiments Poland 29.69
Germany 21.18
Slovakia 12.09
N/C
210500 Ice cream and other edible ice Germany
33.71 Poland 31.15
Hungary 10.35
N/A
210112 Preparations with a basis of extracts, essences and concentrates of coffee
Poland 55.08
Hungary 17.17
Spain 7.99
N/C
Page | 10
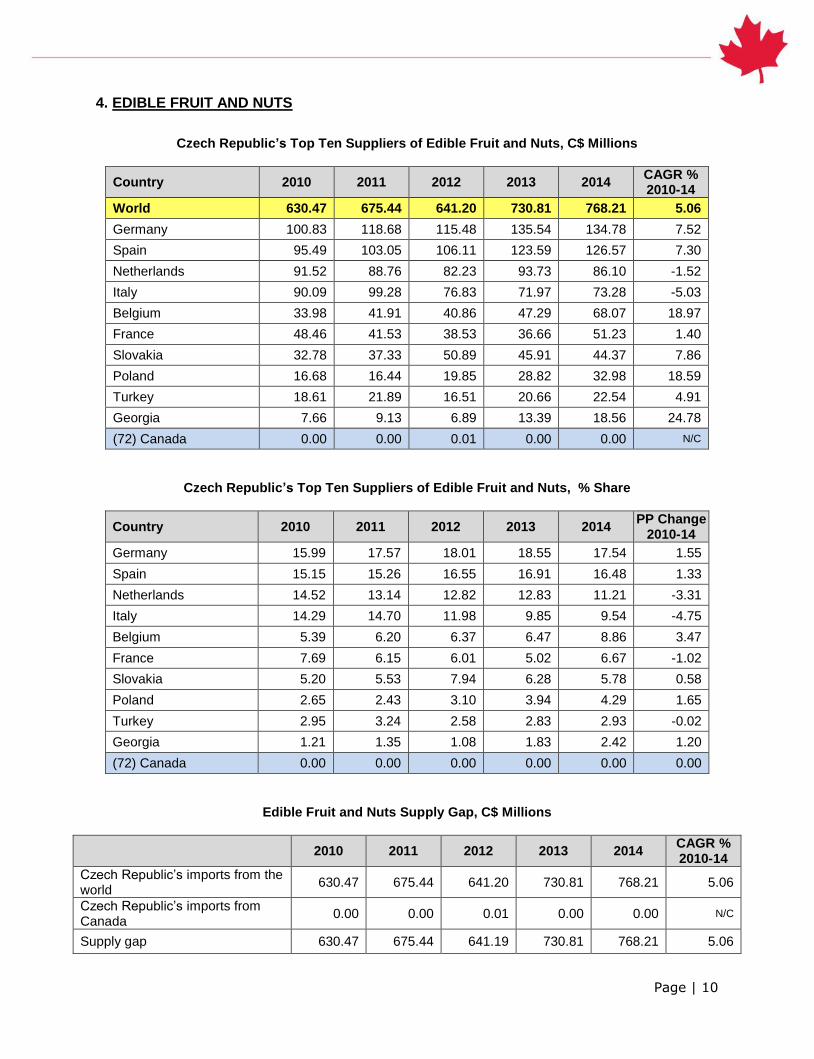
4. EDIBLE FRUIT AND NUTS
Czech Republic’s Top Ten Suppliers of Edible Fruit and Nuts, C$ Millions
Country 2010 2011 2012 2013 2014 CAGR % 2010-14
World 630.47 675.44 641.20 730.81 768.21 5.06
Germany 100.83 118.68 115.48 135.54 134.78 7.52
Spain 95.49 103.05 106.11 123.59 126.57 7.30
Netherlands 91.52 88.76 82.23 93.73 86.10 -1.52
Italy 90.09 99.28 76.83 71.97 73.28 -5.03
Belgium 33.98 41.91 40.86 47.29 68.07 18.97
France 48.46 41.53 38.53 36.66 51.23 1.40
Slovakia 32.78 37.33 50.89 45.91 44.37 7.86
Poland 16.68 16.44 19.85 28.82 32.98 18.59
Turkey 18.61 21.89 16.51 20.66 22.54 4.91
Georgia 7.66 9.13 6.89 13.39 18.56 24.78
(72) Canada 0.00 0.00 0.01 0.00 0.00 N/C
Czech Republic’s Top Ten Suppliers of Edible Fruit and Nuts, % Share
Country 2010 2011 2012 2013 2014 PP Change
2010-14
Germany 15.99 17.57 18.01 18.55 17.54 1.55
Spain 15.15 15.26 16.55 16.91 16.48 1.33
Netherlands 14.52 13.14 12.82 12.83 11.21 -3.31
Italy 14.29 14.70 11.98 9.85 9.54 -4.75
Belgium 5.39 6.20 6.37 6.47 8.86 3.47
France 7.69 6.15 6.01 5.02 6.67 -1.02
Slovakia 5.20 5.53 7.94 6.28 5.78 0.58
Poland 2.65 2.43 3.10 3.94 4.29 1.65
Turkey 2.95 3.24 2.58 2.83 2.93 -0.02
Georgia 1.21 1.35 1.08 1.83 2.42 1.20
(72) Canada 0.00 0.00 0.00 0.00 0.00 0.00
Edible Fruit and Nuts Supply Gap, C$ Millions
2010 2011 2012 2013 2014 CAGR % 2010-14
Czech Republic’s imports from the world
630.47 675.44 641.20 730.81 768.21 5.06
Czech Republic’s imports from Canada
0.00 0.00 0.01 0.00 0.00 N/C
Supply gap 630.47 675.44 641.19 730.81 768.21 5.06

Page | 11
Czech Republic’s Top Five Edible Fruit and Nut Product Imports, C$ Millions
HS Code
Product Description 2012 2013 2014 CAGR % 2012-14
080390 Fresh bananas 110.08 116.42 139.53 12.59
080610 Fresh grapes 63.73 74.23 68.81 3.91
080520 Fresh mandarins 49.15 49.41 49.29 0.14
080810 Fresh apples 56.21 57.34 47.36 -8.21
080550 Fresh or dried lemons and limes 31.77 40.32 46.27 20.69
Czech Republic’s Top Five Edible Fruit and Nut Product Imports and Top Supplying Countries, 2014
HS Code
Product Description Market Share % Canada’s
% Share 1 2 3
080390 Fresh bananas Belgium 38.40
France 29.89
Germany 21.23
N/A
080610 Fresh grapes Italy
33.40 Netherlands
28.86 Germany
21.54 N/A
080520 Fresh mandarins Spain 60.61
Germany 10.33
Croatia 9.75
N/A
080810 Fresh apples Poland 29.34
Italy 21.21
Slovakia 18.52
N/A
080550 Fresh or dried lemons and limes Spain 37.40
Germany 22.12
Netherlands 16.95
N/A

Page | 12
5. BEVERAGES (Excl. juices)
Czech Republic’s Top Ten Suppliers of Beverages, C$ Millions
Country 2010 2011 2012 2013 2014 CAGR % 2010-14
World 525.05 639.53 576.12 657.45 751.87 9.39
Germany 86.72 101.10 85.27 102.77 118.00 8.01
Slovakia 76.43 91.89 80.54 90.88 98.69 6.60
Italy 64.39 80.03 69.81 71.55 72.24 2.92
France 48.29 54.02 62.22 70.99 62.27 6.56
Poland 42.96 63.97 45.42 52.50 57.82 7.71
Netherlands 25.01 35.24 30.74 39.99 48.91 18.25
Spain 20.27 25.77 28.36 35.98 46.99 23.39
Hungary 36.88 35.18 28.78 33.47 46.86 6.17
Austria 30.70 36.25 38.52 34.56 37.22 4.93
Belgium 2.96 5.02 2.66 2.83 30.56 79.28
(20) Canada 2.06 2.63 2.60 2.85 3.02 10.13
Czech Republic’s Top Ten Suppliers of Beverages, % Share
Country 2010 2011 2012 2013 2014 PP Change
2010-14
Germany 16.52 15.81 14.80 15.63 15.69 -0.83
Slovakia 14.56 14.37 13.98 13.82 13.13 -1.43
Italy 12.26 12.51 12.12 10.88 9.61 -2.65
France 9.20 8.45 10.80 10.80 8.28 -0.92
Poland 8.18 10.00 7.88 7.98 7.69 -0.49
Netherlands 4.76 5.51 5.34 6.08 6.50 1.74
Spain 3.86 4.03 4.92 5.47 6.25 2.39
Hungary 7.02 5.50 5.00 5.09 6.23 -0.79
Austria 5.85 5.67 6.69 5.26 4.95 -0.90
Belgium 0.56 0.79 0.46 0.43 4.06 3.50
(20) Canada 0.39 0.41 0.45 0.43 0.40 0.01
Beverage Supply Gap, C$ Millions
2010 2011 2012 2013 2014 CAGR % 2010-14
Czech Republic’s imports from the world
525.05 639.53 576.12 657.45 751.87 9.39
Czech Republic’s imports from Canada
2.06 2.63 2.60 2.85 3.02 10.13
Supply gap 522.99 636.90 573.52 654.61 748.85 9.39

Page | 13
Czech Republic’s Top Five Beverage Product Imports, C$ Millions
HS Code
Product Description 2012 2013 2014 CAGR % 2012-14
220421 Grape wines, <2L 143.49 162.22 153.22 3.34
220290 Non-alcoholic beverages, including milk based drinks and non-alcoholic beer
78.70 99.42 117.50 22.19
220210 Mineral water 74.03 74.02 94.91 13.23
220429 Grape wines and must, >2L 51.30 62.24 69.04 16.00
220830 Whiskies 31.96 37.78 47.23 21.56
Czech Republic’s Top Five Beverage Product Imports and Top Supplying Countries, 2014
HS Code
Product Description Market Share % Canada’s
% Share 1 2 3
220421 Grape wines, <2L France 19.98
Italy 19.24
Germany 15.02
N/C
220290 Non-alcoholic beverages, including milk based drinks and non-alcoholic beer
Germany 25.12
Poland 25.03
Netherlands 14.24
0.39
220210 Mineral water Slovakia
36.92 Austria 22.88
Poland 14.09
2.18
220429 Grape wines and must, >2L Spain 25.95
Italy 24.08
Hungary 16.15
N/C
220830 Whiskies Ireland 34.97
Germany 16.39
United Kingdom 16.20
1.03

Page | 14
6. BAKING RELATED GOODS AND PASTA
Czech Republic’s Top Ten Suppliers of Baking Related Goods and Pasta, C$ Millions
Country 2010 2011 2012 2013 2014 CAGR % 2010-14
World 496.15 581.52 587.86 658.10 692.55 8.70
Germany 150.14 165.24 160.00 175.56 177.39 4.26
Poland 99.94 127.36 136.61 149.44 147.28 10.18
Slovakia 66.79 78.19 70.59 78.25 79.39 4.42
Italy 30.57 37.92 37.18 44.85 52.01 14.21
France 24.18 27.76 31.10 35.77 38.29 12.18
Belgium 19.38 24.17 23.73 27.66 34.27 15.31
Austria 30.19 31.83 28.46 31.67 32.76 2.06
United Kingdom 14.35 16.57 20.60 23.36 31.55 21.77
Hungary 12.53 18.95 25.96 31.93 29.69 24.07
Netherlands 12.27 13.51 13.71 16.21 21.97 15.68
(36) Canada 0.01 0.01 0.02 0.07 0.08 55.27
Czech Republic’s Top Ten Suppliers of Baking Related Goods and Pasta, % Share
Country 2010 2011 2012 2013 2014 PP Change
2010-14
Germany 30.26 28.41 27.22 26.68 25.61 -4.65
Poland 20.14 21.90 23.24 22.71 21.27 1.13
Slovakia 13.46 13.45 12.01 11.89 11.46 -2.00
Italy 6.16 6.52 6.32 6.82 7.51 1.35
France 4.87 4.77 5.29 5.44 5.53 0.66
Belgium 3.91 4.16 4.04 4.20 4.95 1.04
Austria 6.09 5.47 4.84 4.81 4.73 -1.36
United Kingdom 2.89 2.85 3.50 3.55 4.56 1.67
Hungary 2.52 3.26 4.42 4.85 4.29 1.77
Netherlands 2.47 2.32 2.33 2.46 3.17 0.70
(36) Canada 0.00 0.00 0.00 0.01 0.01 0.01
Baking Related Goods and Pasta Supply Gap, C$ Millions
2010 2011 2012 2013 2014 CAGR % 2010-14
Czech Republic’s imports from the world
496.15 581.52 587.86 658.10 692.55 8.70
Czech Republic’s imports from Canada
0.01 0.01 0.02 0.07 0.08 55.27
Supply gap 496.13 581.51 587.84 658.03 692.47 8.69

Page | 15
Czech Republic’s Top Five Baking Related Goods and Pasta Product Imports, C$ Millions
HS Code
Product Description 2012 2013 2014 CAGR % 2012-14
190590 Bread, pastry, cakes and puddings
223.46 248.86 269.88 9.90
190531 Cookies (sweet biscuits) 102.53 114.10 107.36 2.33
190190 Malt extract, flour, meal and milk 41.33 48.93 54.92 15.28
190532 Waffles and wafers 43.02 44.19 50.64 8.50
190110 Food preparations for infants 50.23 56.08 47.58 -2.67
Czech Republic’s Top Five Baking Related Goods and Pasta Product Imports and Top Supplying Countries, 2014
HS Code
Product Description Market Share % Canada’s
% Share 1 2 3
190590 Bread, pastry, cakes and puddings
Poland 26.25
Germany 25.70
Belgium 7.93
N/A
190531 Cookies (sweet biscuits) Slovakia
35.59 Poland 20.42
Germany 19.48
N/A
190190 Malt extract, flour, meal and milk Germany
61.41 Slovakia
13.48 United Kingdom
7.25 0.12
190532 Waffles and wafers Poland 53.55
Germany 13.33
Slovakia 11.58
N/A
190110 Food preparations for infants Germany
28.01 Netherlands
21.86 United Kingdom
21.34 N/A
Page | 16
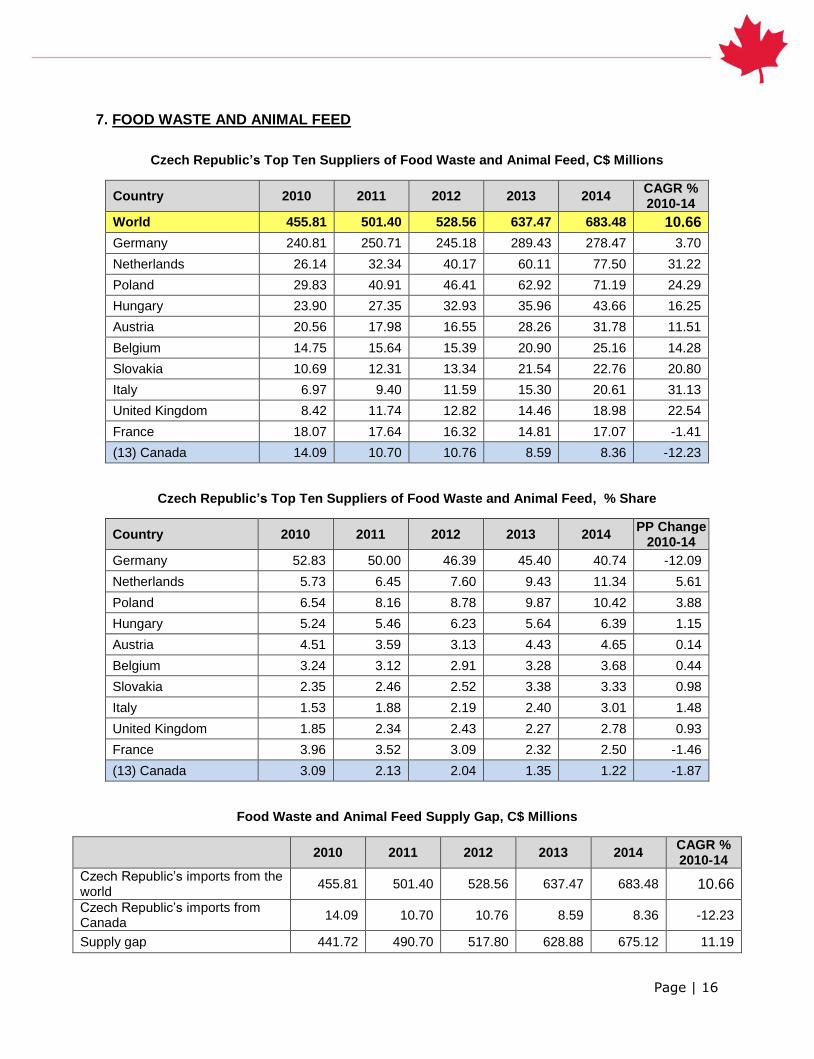
7. FOOD WASTE AND ANIMAL FEED
Czech Republic’s Top Ten Suppliers of Food Waste and Animal Feed, C$ Millions
Country 2010 2011 2012 2013 2014 CAGR % 2010-14
World 455.81 501.40 528.56 637.47 683.48 10.66
Germany 240.81 250.71 245.18 289.43 278.47 3.70
Netherlands 26.14 32.34 40.17 60.11 77.50 31.22
Poland 29.83 40.91 46.41 62.92 71.19 24.29
Hungary 23.90 27.35 32.93 35.96 43.66 16.25
Austria 20.56 17.98 16.55 28.26 31.78 11.51
Belgium 14.75 15.64 15.39 20.90 25.16 14.28
Slovakia 10.69 12.31 13.34 21.54 22.76 20.80
Italy 6.97 9.40 11.59 15.30 20.61 31.13
United Kingdom 8.42 11.74 12.82 14.46 18.98 22.54
France 18.07 17.64 16.32 14.81 17.07 -1.41
(13) Canada 14.09 10.70 10.76 8.59 8.36 -12.23
Czech Republic’s Top Ten Suppliers of Food Waste and Animal Feed, % Share
Country 2010 2011 2012 2013 2014 PP Change
2010-14
Germany 52.83 50.00 46.39 45.40 40.74 -12.09
Netherlands 5.73 6.45 7.60 9.43 11.34 5.61
Poland 6.54 8.16 8.78 9.87 10.42 3.88
Hungary 5.24 5.46 6.23 5.64 6.39 1.15
Austria 4.51 3.59 3.13 4.43 4.65 0.14
Belgium 3.24 3.12 2.91 3.28 3.68 0.44
Slovakia 2.35 2.46 2.52 3.38 3.33 0.98
Italy 1.53 1.88 2.19 2.40 3.01 1.48
United Kingdom 1.85 2.34 2.43 2.27 2.78 0.93
France 3.96 3.52 3.09 2.32 2.50 -1.46
(13) Canada 3.09 2.13 2.04 1.35 1.22 -1.87
Food Waste and Animal Feed Supply Gap, C$ Millions
2010 2011 2012 2013 2014 CAGR % 2010-14
Czech Republic’s imports from the world
455.81 501.40 528.56 637.47 683.48 10.66
Czech Republic’s imports from Canada
14.09 10.70 10.76 8.59 8.36 -12.23
Supply gap 441.72 490.70 517.80 628.88 675.12 11.19

Page | 17
Czech Republic’s Top Five Food Waste and Animal Feed Imports, C$ Millions
HS Code
Product Description 2012 2013 2014 CAGR % 2012-14
230400 Soymeal 201.00 235.84 226.42 6.14
230910 Dog and cat food, put up for retail
161.29 183.60 210.48 14.23
230990 Animal feed, except cat and dog food
113.47 133.91 145.74 13.33
230110 Flour meal and pellet meat 9.45 19.00 23.09 56.31
230800 Vegetable material and waste 11.48 13.87 20.33 33.07
Czech Republic’s Top Five Food Waste and Animal Feed Imports and Top Supplying Countries, 2014
HS Code
Product Description Market Share % Canada’s
% Share 1 2 3
230400 Soymeal Germany
75.46 Netherlands
17.35 Poland
5.20 N/A
230910 Dog and cat food, put up for retail
Germany 21.16
Poland 19.15
Hungary 15.75
3.81
230990 Animal feed, except cat and dog food
Germany 34.72
Netherlands 12.84
United Kingdom 10.06
0.23
230110 Flour meal and pellet meat Slovakia
27.52 Germany
18.77 Italy
15.15 N/A
230800 Vegetable material and waste Mexico 64.74
Netherlands 10.92
Poland 5.51
N/A

Page | 18
8. EDIBLE VEGETABLES
Czech Republic’s Top Ten Suppliers of Edible Vegetables, C$ Millions
Country 2010 2011 2012 2013 2014 CAGR % 2010-14
World 589.49 586.44 518.19 614.62 626.72 1.54
Netherlands 129.98 116.66 105.48 120.60 119.33 -2.12
Spain 93.60 102.74 94.43 102.51 107.66 3.56
Germany 89.89 90.43 72.52 110.03 101.46 3.07
Poland 54.19 54.31 54.41 64.13 74.79 8.39
France 41.99 47.71 29.94 39.95 42.11 0.08
Italy 34.32 38.53 38.18 42.71 40.21 4.04
Belgium 30.23 25.91 25.83 33.99 36.33 4.70
Slovakia 24.95 20.91 23.38 21.86 22.15 -2.94
Hungary 16.53 15.68 14.17 15.24 17.20 1.00
Austria 16.76 17.45 12.12 10.87 10.54 -10.96
(14) Canada 6.16 5.89 4.66 5.70 5.34 -3.49
Czech Republic’s Top Ten Suppliers of Edible Vegetables, % Share
Country 2010 2011 2012 2013 2014 PP Change
2010-14
Netherlands 22.05 19.89 20.36 19.62 19.04 -3.01
Spain 15.88 17.52 18.22 16.68 17.18 1.30
Germany 15.25 15.42 13.99 17.90 16.19 0.94
Poland 9.19 9.26 10.50 10.43 11.93 2.74
France 7.12 8.13 5.78 6.50 6.72 -0.40
Italy 5.82 6.57 7.37 6.95 6.42 0.60
Belgium 5.13 4.42 4.99 5.53 5.80 0.67
Slovakia 4.23 3.56 4.51 3.56 3.53 -0.70
Hungary 2.80 2.67 2.73 2.48 2.75 -0.05
Austria 2.84 2.98 2.34 1.77 1.68 -1.16
(14) Canada 1.04 1.00 0.90 0.93 0.85 -0.19
Edible Vegetable Supply Gap, C$ Millions
2010 2011 2012 2013 2014 CAGR % 2010-14
Czech Republic’s imports from the world
589.49 586.44 518.19 614.62 626.72 1.54
Czech Republic’s imports from Canada
6.16 5.89 4.66 5.70 5.34 -3.49
Supply gap 583.33 580.55 513.53 608.93 621.38 1.59
Page | 19
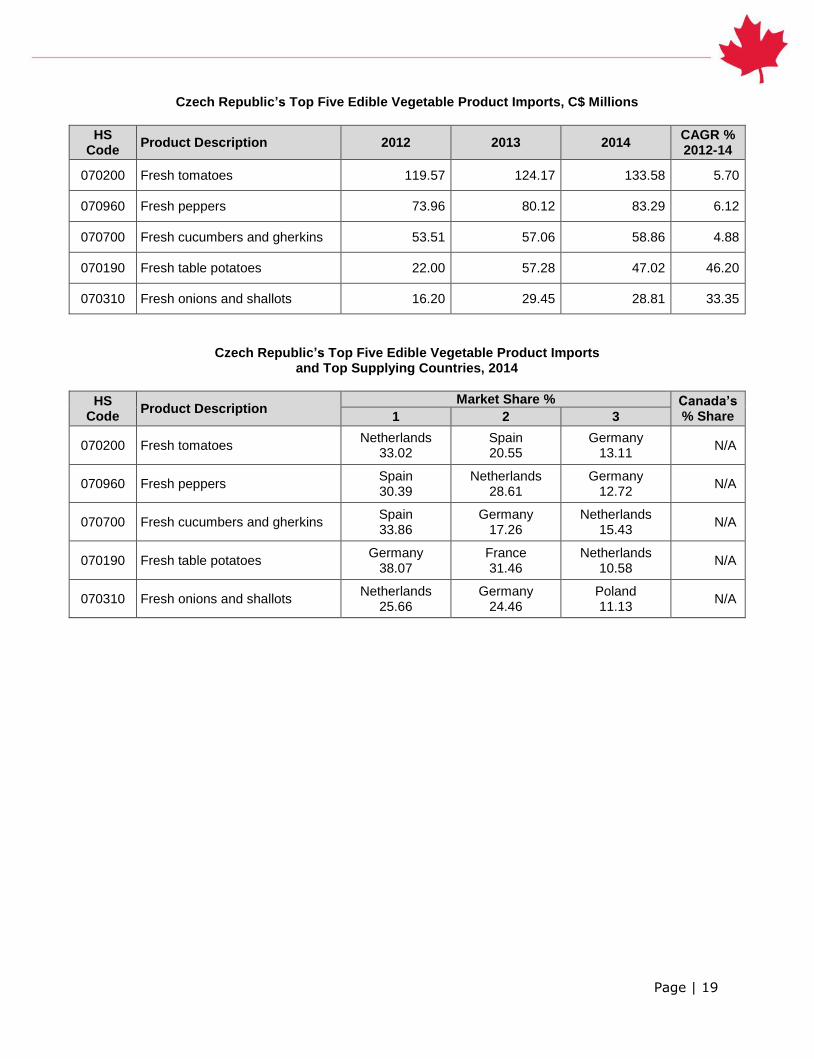
Czech Republic’s Top Five Edible Vegetable Product Imports, C$ Millions
HS Code
Product Description 2012 2013 2014 CAGR % 2012-14
070200 Fresh tomatoes 119.57 124.17 133.58 5.70
070960 Fresh peppers 73.96 80.12 83.29 6.12
070700 Fresh cucumbers and gherkins 53.51 57.06 58.86 4.88
070190 Fresh table potatoes 22.00 57.28 47.02 46.20
070310 Fresh onions and shallots 16.20 29.45 28.81 33.35
Czech Republic’s Top Five Edible Vegetable Product Imports and Top Supplying Countries, 2014
HS Code
Product Description Market Share % Canada’s
% Share 1 2 3
070200 Fresh tomatoes Netherlands
33.02 Spain 20.55
Germany 13.11
N/A
070960 Fresh peppers Spain 30.39
Netherlands 28.61
Germany 12.72
N/A
070700 Fresh cucumbers and gherkins Spain 33.86
Germany 17.26
Netherlands 15.43
N/A
070190 Fresh table potatoes Germany
38.07 France 31.46
Netherlands 10.58
N/A
070310 Fresh onions and shallots Netherlands
25.66 Germany
24.46 Poland 11.13
N/A
Page | 20
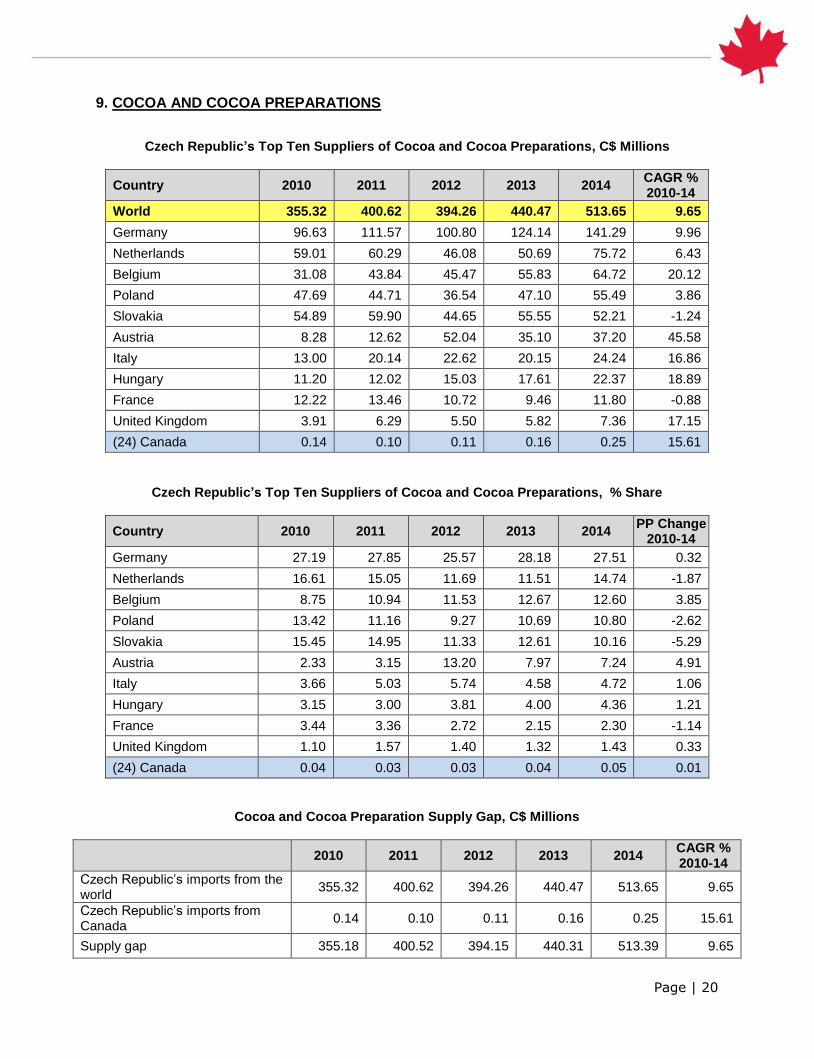
9. COCOA AND COCOA PREPARATIONS
Czech Republic’s Top Ten Suppliers of Cocoa and Cocoa Preparations, C$ Millions
Country 2010 2011 2012 2013 2014 CAGR % 2010-14
World 355.32 400.62 394.26 440.47 513.65 9.65
Germany 96.63 111.57 100.80 124.14 141.29 9.96
Netherlands 59.01 60.29 46.08 50.69 75.72 6.43
Belgium 31.08 43.84 45.47 55.83 64.72 20.12
Poland 47.69 44.71 36.54 47.10 55.49 3.86
Slovakia 54.89 59.90 44.65 55.55 52.21 -1.24
Austria 8.28 12.62 52.04 35.10 37.20 45.58
Italy 13.00 20.14 22.62 20.15 24.24 16.86
Hungary 11.20 12.02 15.03 17.61 22.37 18.89
France 12.22 13.46 10.72 9.46 11.80 -0.88
United Kingdom 3.91 6.29 5.50 5.82 7.36 17.15
(24) Canada 0.14 0.10 0.11 0.16 0.25 15.61
Czech Republic’s Top Ten Suppliers of Cocoa and Cocoa Preparations, % Share
Country 2010 2011 2012 2013 2014 PP Change
2010-14
Germany 27.19 27.85 25.57 28.18 27.51 0.32
Netherlands 16.61 15.05 11.69 11.51 14.74 -1.87
Belgium 8.75 10.94 11.53 12.67 12.60 3.85
Poland 13.42 11.16 9.27 10.69 10.80 -2.62
Slovakia 15.45 14.95 11.33 12.61 10.16 -5.29
Austria 2.33 3.15 13.20 7.97 7.24 4.91
Italy 3.66 5.03 5.74 4.58 4.72 1.06
Hungary 3.15 3.00 3.81 4.00 4.36 1.21
France 3.44 3.36 2.72 2.15 2.30 -1.14
United Kingdom 1.10 1.57 1.40 1.32 1.43 0.33
(24) Canada 0.04 0.03 0.03 0.04 0.05 0.01
Cocoa and Cocoa Preparation Supply Gap, C$ Millions
2010 2011 2012 2013 2014 CAGR % 2010-14
Czech Republic’s imports from the world
355.32 400.62 394.26 440.47 513.65 9.65
Czech Republic’s imports from Canada
0.14 0.10 0.11 0.16 0.25 15.61
Supply gap 355.18 400.52 394.15 440.31 513.39 9.65
Page | 21
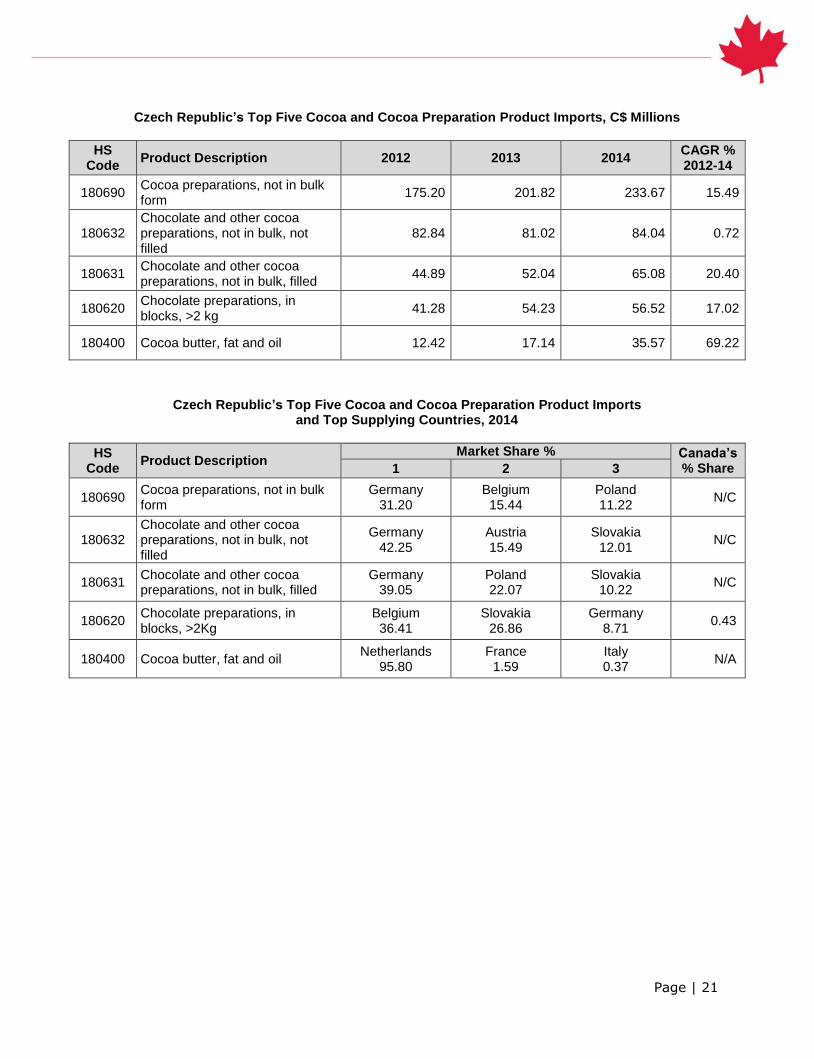
Czech Republic’s Top Five Cocoa and Cocoa Preparation Product Imports, C$ Millions
HS Code
Product Description 2012 2013 2014 CAGR % 2012-14
180690 Cocoa preparations, not in bulk form
175.20 201.82 233.67 15.49
180632 Chocolate and other cocoa preparations, not in bulk, not filled
82.84 81.02 84.04 0.72
180631 Chocolate and other cocoa preparations, not in bulk, filled
44.89 52.04 65.08 20.40
180620 Chocolate preparations, in blocks, >2 kg
41.28 54.23 56.52 17.02
180400 Cocoa butter, fat and oil 12.42 17.14 35.57 69.22
Czech Republic’s Top Five Cocoa and Cocoa Preparation Product Imports and Top Supplying Countries, 2014
HS Code
Product Description Market Share % Canada’s
% Share 1 2 3
180690 Cocoa preparations, not in bulk form
Germany 31.20
Belgium 15.44
Poland 11.22
N/C
180632 Chocolate and other cocoa preparations, not in bulk, not filled
Germany 42.25
Austria 15.49
Slovakia 12.01
N/C
180631 Chocolate and other cocoa preparations, not in bulk, filled
Germany 39.05
Poland 22.07
Slovakia 10.22
N/C
180620 Chocolate preparations, in blocks, >2Kg
Belgium 36.41
Slovakia 26.86
Germany 8.71
0.43
180400 Cocoa butter, fat and oil Netherlands
95.80 France
1.59 Italy 0.37
N/A

Page | 22
10. COFFEE, TEA AND SPICES
Czech Republic’s Top Ten Suppliers of Coffee, Tea and Spices, C$ Millions
Country 2010 2011 2012 2013 2014 CAGR % 2010-14
World 200.85 264.67 240.57 247.62 409.26 19.48
Poland 45.75 58.71 42.39 51.12 145.85 33.62
Germany 25.19 40.93 31.63 46.48 76.32 31.93
Slovakia 21.02 6.15 8.47 12.30 31.56 10.69
Netherlands 8.79 12.43 11.80 14.75 17.53 18.85
Brazil 16.69 30.58 25.93 16.30 17.35 0.97
Italy 10.07 11.06 13.68 14.39 15.63 11.61
Austria 7.02 11.49 20.17 15.21 15.39 21.68
United Kingdom 8.31 11.87 14.71 12.35 13.92 13.77
Hungary 8.89 8.78 7.87 8.13 9.18 0.80
Vietnam 5.77 6.82 7.38 7.21 9.17 12.27
(66) Canada 0.56 0.09 0.01 0.00 0.02 -59.25
Czech Republic’s Top Ten Suppliers of Coffee, Tea and Spices, % Share
Country 2010 2011 2012 2013 2014 PP Change
2010-14
Poland 22.78 22.18 17.62 20.64 35.64 12.86
Germany 12.54 15.47 13.15 18.77 18.65 6.11
Slovakia 10.47 2.32 3.52 4.97 7.71 -2.76
Netherlands 4.37 4.69 4.91 5.96 4.28 -0.09
Brazil 8.31 11.56 10.78 6.58 4.24 -4.07
Italy 5.01 4.18 5.69 5.81 3.82 -1.19
Austria 3.50 4.34 8.38 6.14 3.76 0.26
United Kingdom 4.14 4.49 6.12 4.99 3.40 -0.74
Hungary 4.43 3.32 3.27 3.28 2.24 -2.19
Vietnam 2.87 2.58 3.07 2.91 2.24 -0.63
(66) Canada 0.28 0.03 0.00 0.00 0.00 -0.28
Coffee, Tea and Spice Supply Gap, C$ Millions
2010 2011 2012 2013 2014 CAGR % 2010-14
Czech Republic’s imports from the world
200.85 264.67 240.57 247.62 409.26 19.48
Czech Republic’s imports from Canada
0.56 0.09 0.01 0.00 0.02 -59.25
Supply gap 200.28 264.58 240.56 247.62 409.24 19.56

Page | 23
Czech Republic’s Top Five Coffee, Tea and Spice Product Imports, C$ Millions
HS Code
Product Description 2012 2013 2014 CAGR % 2012-14
090121 Coffee, roasted and not decaffeinated
114.55 114.26 255.25 49.27
090111 Coffee, not roasted and not decaffeinated
65.13 65.15 56.48 -6.87
090190 Coffee substitutes with coffee 1.13 2.48 15.23 267.58
090230 Packaged black tea, < 3 kg 13.55 14.23 14.06 1.88
090411 Pepper of genus piper, neither crushed nor grounded
8.54 8.85 10.12 8.90
Czech Republic’s Top Five Coffee, Tea and Spice Product Imports and Top Supplying Countries, 2014
HS Code
Product Description Market Share % Canada’s
% Share 1 2 3
090121 Coffee, roasted and not decaffeinated
Poland 45.33
Germany 20.96
Slovakia 10.17
N/A
090111 Coffee, not roasted and not decaffeinated
Brazil 30.71
Vietnam 15.73
Honduras 9.43
N/A
090190 Coffee substitutes with coffee Poland 93.94
Austria 2.11
Netherlands 1.73
N/A
090230 Packaged black tea, < 3 kg Poland 36.97
Hungary 14.44
United Arab Emirates
14.40 0.01
090411 Pepper of genus piper, neither crushed nor grounded
Netherlands 37.27
Poland 23.02
Germany 16.40
N/A
Page | 24
CONCLUSION
Czech Republic is a developing market, and the world’s 33rd
-largest importer of agri-food and seafood products. Canada ranked as Czech Republic’s 29
th-largest supplier in 2014, having registered a decrease
in import value since 2010. Canada represented less than 1.0% of the Czech Republic’s agri-food and seafood imports, Canada remains marginal compared to other countries, such as Czech Republic’s European partners. This has created a significant supply gap between Czech Republic and Canada that has been widening at a rate similar to Czech Republic’s overall import growth in recent years. Czech Republic has a diversified agri-food and seafood suppliers; however, the top ten primary trading partners are European Union members.
Although Canada’s imports (less than 1.0% market share) to the Czech Republic are relatively small compared to their suppliers, Canada did see a slight increase in market share in three out of the ten commodities over the last five years. These commodities were beverages, baking related goods and pasta, and cocoa and cocoa preparations. Once the Canada-European Union comprehensive Economic and Trade Agreement (CETA) enters into force this will provide Canada with preferential market access to 10.5 million (the Czech Republic’s total population) consumers in the EU. The agreement will also eliminate approximately 95% of all of the EU tariff lines on the first day the agreement comes into force, creating significant opportunities in the agricultural and fish and seafood sectors for Canada.
FOR MORE INFORMATION
International Trade Commissioners can provide Canadian industry with on-the-ground expertise regarding market potential, current conditions and local business contacts, and are an excellent point of contact for export advice.
Overview of Trade Commissioner Services in Czech Republic http://www.tradecommissioner.gc.ca/eng/office.jsp?oid=260&cid=203
Find a Trade Commissioner www.tradecommissioner.gc.ca/eng/find-trade-contacts.jsp
For additional intelligence on this and other markets, the complete library of Global Analysis reports can be found under Statistics and Market Information at the following link, arranged by sector and region of interest:
ats-sea.agr.gc.ca
RESOURCES
Global Trade Atlas (October 2015).
ANNEX: ABBREVIATIONS
CAGR - compound annual growth rate N/A - not applicable N/C - not calculable PP - percentage point (difference between two percentage values)

Page | 25
Competitive Trade Analysis: Czech Republic Global Analysis Report Prepared by: Carlos Jaramillo, Student © Her Majesty the Queen in Right of Canada, represented by the Minister of Agriculture and Agri-Food (2015). Photo Credits All photographs reproduced in this publication are used by permission of the rights holders. All images, unless otherwise noted, are copyright Her Majesty the Queen in Right of Canada. For additional copies, to request an alternate format, and for all other inquiries regarding this publication, please contact: Agriculture and Agri-Food Canada, Global Analysis 1341 Baseline Road, Tower 5, 3
rd floor
Ottawa, ON Canada K1A 0C5 E-mail: [email protected] The Government of Canada has prepared this report based on primary and secondary sources of information. Although every effort has been made to ensure that the information is accurate, Agriculture and Agri-Food Canada (AAFC) assumes no liability for any actions taken based on the information contained herein. Reproduction or redistribution of this document, in whole or in part, must include acknowledgement of Agriculture and Agri-Food Canada as the owner of the copyright in the document, through a reference citing AAFC, the title of the document and the year. Where the reproduction or redistribution includes data from this document, it must also include an acknowledgement of the specific data source(s), as noted in this document. Agriculture and Agri-Food Canada provides this document and other report services to agriculture and food industry clients free of charge.
Related Documents