Competitive Dynamics during Resource-Driven Neurite Outgrowth J. J. Johannes Hjorth, Jaap van Pelt, Huibert D. Mansvelder, Arjen van Ooyen* Department of Integrative Neurophysiology, Center for Neurogenomics and Cognitive Research, VU University Amsterdam, Amsterdam, The Netherlands Abstract Neurons form networks by growing out neurites that synaptically connect to other neurons. During this process, neurites develop complex branched trees. Interestingly, the outgrowth of neurite branches is often accompanied by the simultaneous withdrawal of other branches belonging to the same tree. This apparent competitive outgrowth between branches of the same neuron is relevant for the formation of synaptic connectivity, but the underlying mechanisms are unknown. An essential component of neurites is the cytoskeleton of microtubules, long polymers of tubulin dimers running throughout the entire neurite. To investigate whether competition between neurites can emerge from the dynamics of a resource such as tubulin, we developed a multi-compartmental model of neurite growth. In the model, tubulin is produced in the soma and transported by diffusion and active transport to the growth cones at the tip of the neurites, where it is assembled into microtubules to elongate the neurite. Just as in experimental studies, we find that the outgrowth of a neurite branch can lead to the simultaneous retraction of its neighboring branches. We show that these competitive interactions occur in simple neurite morphologies as well as in complex neurite arborizations and that in developing neurons competition for a growth resource such as tubulin can account for the differential outgrowth of neurite branches. The model predicts that competition between neurite branches decreases with path distance between growth cones, increases with path distance from growth cone to soma, and decreases with a higher rate of active transport. Together, our results suggest that competition between outgrowing neurites can already emerge from relatively simple and basic dynamics of a growth resource. Our findings point to the need to test the model predictions and to determine, by monitoring tubulin concentrations in outgrowing neurons, whether tubulin is the resource for which neurites compete. Citation: Hjorth JJJ, van Pelt J, Mansvelder HD, van Ooyen A (2014) Competitive Dynamics during Resource-Driven Neurite Outgrowth. PLoS ONE 9(2): e86741. doi:10.1371/journal.pone.0086741 Editor: Yanmin Yang, Stanford University School of Medicine, United States of America Received August 16, 2013; Accepted December 17, 2013; Published February 3, 2014 Copyright: ß 2014 Hjorth et al. This is an open-access article distributed under the terms of the Creative Commons Attribution License, which permits unrestricted use, distribution, and reproduction in any medium, provided the original author and source are credited. Funding: JJJH was funded by grant 635.100.017, awarded to AvO, of the Computational Life Sciences program of the Netherlands Organization for Scientific Research (NWO). The funders had no role in study design, data collection and analysis, decision to publish, or preparation of the manuscript. Competing Interests: The authors have declared that no competing interests exist. * E-mail: [email protected] Introduction During development, neurons become assembled into function- al networks by growing out axons and dendrites (collectively called neurites) that connect synaptically to other neurons. The outgrowth of neurons is mediated by the dynamic behavior of growth cones, specialized structures at the tip of outgrowing neurites. Growth cone migration elongates or retracts the trailing neurite, whereas growth cone splitting creates two daughter branches. Through these growth cone actions, neurons gradually develop their characteristic, highly branched axonal and dendritic trees. An important but unexplained experimental observation is that elongation of neurite branches is often accompanied by simulta- neous retraction of other branches belonging to the same neuritic tree. For example, local calcium influx into an axonal branch [1] or local depolarization of a branch [2] induces rapid outgrowth of the stimulated branch, while at the same time a neighboring branch belonging to the same axon starts retracting. Conversely, cessation of outgrowth in one neurite branch, e.g., as a result of encountering a postsynaptic target neuron, often triggers the outgrowth of its sibling neurite branches [3]. This coordination of neurite outgrowth, occurring both during development and in the restructuring of connectivity during adulthood, is highly relevant for the development and rewiring of synaptic connections [4–6]. In the callosal pathway, competitive outgrowth among different neurite branches of the same neuron permits one axon branch to stall or retract while another branch of the same axon extends toward targets [7]. Similarly, depolariza- tion of axonal branches of sympathetic neurons induces outgrowth towards postsynaptic targets at the expense of other branches of the same neuron, which stall or regress [2]. This regulation of neurite outgrowth affects, in an activity-dependent way, the pattern of synaptic connections that will be established. Likewise, local changes in branch outgrowth induced by trophic factors or by chemical or physical cues in the extracellular environment [8] may influence the outgrowth of all the neuron’s axonal branches and hence the pattern of synaptic connectivity that will develop. Competitive interactions among neurites of the same neuron are little studied and the underlying mechanisms are unknown. None of the existing biophysical models of neurite outgrowth [9–13] account for competition and the coordinated outgrowth of neurite branches. A small preliminary simulation study [14], using a very simple model, suggested that coordinated outgrowth might emerge from competition for cytoskeletal building blocks produced in the soma and transported to the growth cones, but this mechanism has never been rigorously investigated. In the present computational study, we investigate this competition hypothesis more thoroughly PLOS ONE | www.plosone.org 1 February 2014 | Volume 9 | Issue 2 | e86741

Welcome message from author
This document is posted to help you gain knowledge. Please leave a comment to let me know what you think about it! Share it to your friends and learn new things together.
Transcript
Competitive Dynamics during Resource-Driven NeuriteOutgrowthJ. J. Johannes Hjorth, Jaap van Pelt, Huibert D. Mansvelder, Arjen van Ooyen*
Department of Integrative Neurophysiology, Center for Neurogenomics and Cognitive Research, VU University Amsterdam, Amsterdam, The Netherlands
Abstract
Neurons form networks by growing out neurites that synaptically connect to other neurons. During this process, neuritesdevelop complex branched trees. Interestingly, the outgrowth of neurite branches is often accompanied by thesimultaneous withdrawal of other branches belonging to the same tree. This apparent competitive outgrowth betweenbranches of the same neuron is relevant for the formation of synaptic connectivity, but the underlying mechanisms areunknown. An essential component of neurites is the cytoskeleton of microtubules, long polymers of tubulin dimers runningthroughout the entire neurite. To investigate whether competition between neurites can emerge from the dynamics of aresource such as tubulin, we developed a multi-compartmental model of neurite growth. In the model, tubulin is producedin the soma and transported by diffusion and active transport to the growth cones at the tip of the neurites, where it isassembled into microtubules to elongate the neurite. Just as in experimental studies, we find that the outgrowth of aneurite branch can lead to the simultaneous retraction of its neighboring branches. We show that these competitiveinteractions occur in simple neurite morphologies as well as in complex neurite arborizations and that in developingneurons competition for a growth resource such as tubulin can account for the differential outgrowth of neurite branches.The model predicts that competition between neurite branches decreases with path distance between growth cones,increases with path distance from growth cone to soma, and decreases with a higher rate of active transport. Together, ourresults suggest that competition between outgrowing neurites can already emerge from relatively simple and basicdynamics of a growth resource. Our findings point to the need to test the model predictions and to determine, bymonitoring tubulin concentrations in outgrowing neurons, whether tubulin is the resource for which neurites compete.
Citation: Hjorth JJJ, van Pelt J, Mansvelder HD, van Ooyen A (2014) Competitive Dynamics during Resource-Driven Neurite Outgrowth. PLoS ONE 9(2): e86741.doi:10.1371/journal.pone.0086741
Editor: Yanmin Yang, Stanford University School of Medicine, United States of America
Received August 16, 2013; Accepted December 17, 2013; Published February 3, 2014
Copyright: � 2014 Hjorth et al. This is an open-access article distributed under the terms of the Creative Commons Attribution License, which permitsunrestricted use, distribution, and reproduction in any medium, provided the original author and source are credited.
Funding: JJJH was funded by grant 635.100.017, awarded to AvO, of the Computational Life Sciences program of the Netherlands Organization for ScientificResearch (NWO). The funders had no role in study design, data collection and analysis, decision to publish, or preparation of the manuscript.
Competing Interests: The authors have declared that no competing interests exist.
* E-mail: [email protected]
Introduction
During development, neurons become assembled into function-
al networks by growing out axons and dendrites (collectively called
neurites) that connect synaptically to other neurons. The
outgrowth of neurons is mediated by the dynamic behavior of
growth cones, specialized structures at the tip of outgrowing
neurites. Growth cone migration elongates or retracts the trailing
neurite, whereas growth cone splitting creates two daughter
branches. Through these growth cone actions, neurons gradually
develop their characteristic, highly branched axonal and dendritic
trees.
An important but unexplained experimental observation is that
elongation of neurite branches is often accompanied by simulta-
neous retraction of other branches belonging to the same neuritic
tree. For example, local calcium influx into an axonal branch [1]
or local depolarization of a branch [2] induces rapid outgrowth of
the stimulated branch, while at the same time a neighboring
branch belonging to the same axon starts retracting. Conversely,
cessation of outgrowth in one neurite branch, e.g., as a result of
encountering a postsynaptic target neuron, often triggers the
outgrowth of its sibling neurite branches [3].
This coordination of neurite outgrowth, occurring both during
development and in the restructuring of connectivity during
adulthood, is highly relevant for the development and rewiring of
synaptic connections [4–6]. In the callosal pathway, competitive
outgrowth among different neurite branches of the same neuron
permits one axon branch to stall or retract while another branch of
the same axon extends toward targets [7]. Similarly, depolariza-
tion of axonal branches of sympathetic neurons induces outgrowth
towards postsynaptic targets at the expense of other branches of
the same neuron, which stall or regress [2]. This regulation of
neurite outgrowth affects, in an activity-dependent way, the
pattern of synaptic connections that will be established. Likewise,
local changes in branch outgrowth induced by trophic factors or
by chemical or physical cues in the extracellular environment [8]
may influence the outgrowth of all the neuron’s axonal branches
and hence the pattern of synaptic connectivity that will develop.
Competitive interactions among neurites of the same neuron are
little studied and the underlying mechanisms are unknown. None
of the existing biophysical models of neurite outgrowth [9–13]
account for competition and the coordinated outgrowth of neurite
branches. A small preliminary simulation study [14], using a very
simple model, suggested that coordinated outgrowth might emerge
from competition for cytoskeletal building blocks produced in the
soma and transported to the growth cones, but this mechanism has
never been rigorously investigated. In the present computational
study, we investigate this competition hypothesis more thoroughly
PLOS ONE | www.plosone.org 1 February 2014 | Volume 9 | Issue 2 | e86741

and in a more detailed model, examining neurite outgrowth in
complex arborizations, exploring the influence of transport rates
and morphology on competition, and testing whether competition
can account for experimental data.
Since microtubule polymers constitute the main cytoskeletal
structure in neurites, we chose tubulin as the principal resource
that neurites need in order to grow out. We constructed full
compartmental models of neuritic trees in which neurite
outgrowth is governed by tubulin dynamics. In the models,
tubulin dimers are produced in the soma and transported by
diffusion and active transport to the growth cones. In the growth
cones, the tubulin concentration, together with the rate constants
of tubulin assembly/disassembly into microtubules, determines the
rate of neurite elongation. The model does not include any other
processes involved in neurite outgrowth, such as tubulin polymer
transport [15–17], microtubule sliding [18], actin dynamics [19–
21], or transport of membrane vesicles [22] and mitochondria
[23]. We deliberately simplified the processes underlying neurite
outgrowth in order to investigate what behavior could emerge
from basic resource dynamics alone.
We address the following questions with our models: (1) Can the
apparent coordination of neurite outgrowth arise from competi-
tion for tubulin? When one neurite branch is stimulated to grow
out, will the neighboring branches retract (as seen in [1])? (2) How
is the retraction of neighboring branches modulated by the rate of
diffusion, rate of active transport, path distance (i.e., distance along
the neuritic tree) to the stimulated branch, and path distance to the
soma? (3) During normal development, neurons operate in an
inhomogeneous environment, where some neurite branches grow
out while others belonging to the same neuron retract (as observed
in [3]). To what extent is competition for tubulin able to predict
the growth of one branch on the basis of the growth of the other
branches?
The paper is organized as follows. In the Methods section, we
present the compartmental model and the equations governing
tubulin dynamics and neurite outgrowth, as well as the parameter
values that were used in the simulations. In the Results section, we
subsequently address competition in a simple branching tree
(mimicking the setup of [1]), competition in the complex neuritic
tree of a complete neuron, and the power of the model to account
for neurite outgrowth and retraction in an outgrowing neuron in
culture [3].
In summary, we find that competition between outgrowing
branches can emerge from basic dynamics of a growth resource
Figure 1. Illustration of the neurite outgrowth model. (A) Tubulin dynamics in the model. Tubulin molecules (green spheres) are produced inthe soma, in biological neurons via translation of mRNA on ribosomes (the brown structure). Tubulin is then transported by diffusion and activetransport; in biological neurons, the microtubule bundles (the light green fibers) act as railway tracks on which the tubulin molecules are bound viamotor proteins (the red molecules). Tubulin is transported to the growth cones at the tip of the neurites. At the growth cone, tubulin is integrated orpolymerized into the microtubule cytoskeleton (long polymers of tubulin dimers; the green fibers), which elongates the neurite. When themicrotubule depolymerizes, the neurite retracts and tubulin becomes free again. (B) The neuron is divided into multiple compartments. The soma isrepresented by a single compartment; it connects to a number of neurites consisting of a series of connected compartments. The compartment atthe tip of the neurite represents the growth cone (blue). To minimize artificial fluctuations in tubulin concentration, the growth cone is movedforward during growth but its size remains constant, while instead the second compartment (pink) is elongated. (C) The elongating compartmentdynamically splits if it becomes too large; likewise, if a shrinking compartment becomes too small, it merges with its proximal (parent) compartment.doi:10.1371/journal.pone.0086741.g001
Competition between Outgrowing Neurites
PLOS ONE | www.plosone.org 2 February 2014 | Volume 9 | Issue 2 | e86741

such as tubulin and that competition for such a resource may
account for experimental findings on outgrowing axonal arbori-
zations [1,3]. Furthermore, the model predicts how competition
between neurite branches changes with path distance between
growth cones, path distance to the cell body, and the diffusion
constant and rate of active transport of the growth resource.
Model and Methods
To investigate whether competition between sibling neurite
branches can emerge from the dynamics of a growth resource such
as tubulin, we developed a multi-compartmental model of neurite
growth. We assumed that neurite outgrowth is mainly governed by
the assembly of microtubules, long polymers of tubulin dimers
present throughout the whole neurite (see Fig. 1A). Indeed,
treating neurons with toxins that block tubulin polymerization also
inhibits neurite elongation [24]. The microtubule cytoskeleton is a
necessary component of neurites, functioning both as a stabilizing
skeleton and as a railway for active transport. Tubulin is
synthesized in the soma, and then transported by diffusion and
active transport to the growth cone, where it is polymerized into
microtubules [25–27].
The model consists of a soma represented by a single
compartment that connects to a number of neurites (Fig. 1B).
The neurites are divided into a series of connected compartments,
with the compartment at the tip of a neurite representing the
growth cone. The growth of a neurite is dependent on the local
tubulin concentration in the growth cone. However, for numerical
reasons, the growth cone is moved during growth but its size
remains constant, while instead the second compartment, directly
proximal to the growth cone compartment, is elongated. When the
second compartment exceeds a certain maximum length (2.5 mm),
it is split into two, and when it shrinks below the minimum allowed
length (0.5 mm), it is merged with its proximal (parent) compart-
ment (Fig. 1C). By adopting this scheme and not directly changing
the size of the growth cone compartment, we minimize artificial
fluctuations in volume and concentration [28].
The change in tubulin quantity in the compartments is given by
dQi
dt~D
Aii{1
dii{1
Qi{1
Vi{1{
Qi
Vi
� �zD
Aiz1i
diz1i
Qiz1
Viz1{
Qi
Vi
� �z
fv Aii{1
Qi{1
Vi{1{Aiz1
i
Qi
Vi
� �{bQi{X
dL
dt
where Qi is the quantity of tubulin in the ith compartment, Aii+1
and dii+1 are the cross-sectional area and distance between the
centres of the compartments i and i +1, respectively. Vi is the
volume of compartment i. Parameter f is the fraction of tubulin
present in the compartment that is bound to the active transport
system; this fraction is transported with speed v by the active
transport system. Parameter D is the diffusion constant of tubulin,
and b is the tubulin decay. The last term in the equation accounts
for the consumption of tubulin at the growth cone during growth,
and is only present in the growth cone compartment. L is the
length of the neurite, and X is the tubulin quantity per unit length.
Since experimental findings have shown that the majority of
tubulin is synthesized in the soma, with less than 1% synthesized in
the axon [26], production of tubulin in the model occurs only in
the soma. Also, there appears to be regulatory mechanisms
controlling the tubulin concentration [29], and in the model the
tubulin concentration in the soma is therefore fixed at a constant
value Q0/V0, where V0 is the soma volume.
The change in neurite length is determined by the concentra-
tion of tubulin in the growth cone compartment:
dLi
dt~p
Qi
Vi
{q
where p is the polymerization rate and q is the depolymerization
rate of microtubules. Note that depolymerization is independent of
tubulin concentration because it entails the disassembly of tubulin
from existing microtubule bundles.
The model parameters are given in Table 1. The polymeriza-
tion and depolymerization rates were chosen so that there was no
growth at 5 mM [30] and a growth of 0.033 mm/h at 10 mM [31].
With 1640 subunits per mm [32] and around 15 microtubules in a
mammalian axon [33], the tubulin quantity per unit length, X, is
estimated at 4*10214 mol/m. Different values for the tubulin
diffusion constant have been reported in the literature:
4.54*10213 m2/s [34], 4.3*10211 m2/s [35] under the assumption
of 1 mM of free Mg2+ [36], and 8.59*10212 m2/s in the giant
squid axon [37]. Here a default value of 10211 m2/s was used.
The degradation constant for tubulin was taken as 5.67*1027 s21
[38,39]. For the active transport rate of tubulin we used 440 nm/s,
well within the range of experimental values [37,40], and 0.6% of
tubulin was assumed to be bound to the transport network. In all
simulations the default values of the parameters were used
(Table 1) unless otherwise stated. The somatic tubulin concentra-
tion was fixed at 5.5 mM except in the simulations testing the
predictive power of the model, where the optimization procedure
yielded a value of 17 mM. Both values lie well within the range of
values reported experimentally [30,41,42]. In order to determine
how competition depended on the rates of diffusion and active
transport, we investigated a wide range of diffusion constants and
active transport rates.
The model was written in Python, and the source code of the
model is freely available online at the ModelDB database. Matlab
was used for the analysis of the model.
We subsequently address competition in a simple branching
tree, competition in a complex branching tree, and the power of
the model to account for the outgrowth dynamics of a developing
neuron in culture [3]. For the complex branching tree, we used the
morphology of two reconstructed rat hippocampal CA1 pyramidal
neurons (reconstructed and provided by Martine Groen, Depart-
ment of Integrative Neurophysiology, VU University Amsterdam).
The outgrowth dynamics of a developing neuron was obtained
from a time-lapse movie taken of a cerebellar neuron in culture
during early development (movie made by Ger Ramakers,
Table 1. Default and optimized values of the modelparameters.
Parameter Default value Optimized value Unit
D 10211 2.15*10211 m2/s
f 6*1023
v 440*1029 0 m/s
b 5.67*1027 5.67*1025 s21
X 4*10214 mol/m
p 1.83*1026 m/(s mM)
q 9.17*1029 m/s
Q0/V0 5.5 17 mM
doi:10.1371/journal.pone.0086741.t001
Competition between Outgrowing Neurites
PLOS ONE | www.plosone.org 3 February 2014 | Volume 9 | Issue 2 | e86741

Netherlands Institute for Brain Research, Amsterdam). The same
movie was also used in [3] for different purposes. Here, we
reanalyzed the movie and manually tracked the positions of all
growth cones in each frame.
Results
To investigate whether the apparent competition between
growing neurites can emerge from the dynamics of a growth
resource such as tubulin, we constructed a multi-compartmental
model of a neuron in which it is assumed that the rate of neurite
outgrowth depends on the concentration of free tubulin, the
building block of the polymerized microtubule cytoskeleton, and
the polymerization and depolymerization rates of microtubules.
The tubulin is produced in the soma, and transported by diffusion
and active transport into the neurites. In the growth cone, a
specialized structure at the end of growing neurites, the tubulin
concentration, together with the rate constants of tubulin
assembly/disassembly into microtubules, determines the rate of
neurite elongation.
Competition in a simple branching treeFirst, a simple morphology is used to investigate whether
competition between outgrowing branches can arise from tubulin
dynamics, and what the effects are of path distance and active and
diffusive transport on the interactions between the branches. The
model setup mimics the experiments in [1], in which it was
observed that stimulating the growth of one branch (by calcium
uncaging) triggered the simultaneous retraction of neighboring
branches. The model soma had a single neurite, which branched
after a path distance dA from the soma, and each of the two
branches had an initial length of dB (Fig. 2A). The tubulin
concentration at the soma was fixed at 5.5 mM.
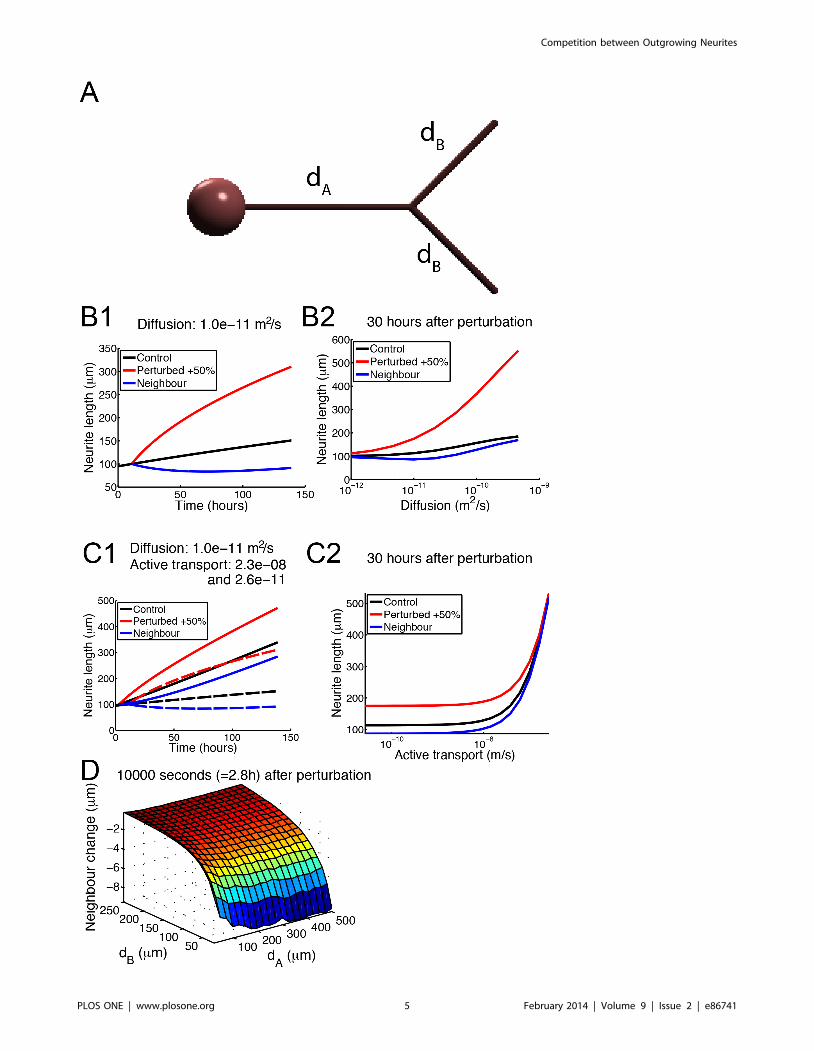
In the control case, the polymerization and depolymerization
rates at the two growth cones are the same, and the neurite
branches grow out at identical speed (Fig. 2B1, black line). When
after 10 hours of outgrowth the polymerization rate in one of the
growth cones (red line) is increased by 50%, the growth speed of
that branch (‘‘the modified branch’’) increases at the expense of
the neighboring branch (blue line), which starts retracting. Thus,
as in the experiments [1], stimulating the growth of one branch
induces the retraction of the neighboring branch. The growth
cone with the higher polymerization grows faster, uses up more
tubulin and has a lower tubulin concentration. As a result, the
modified branch has a steeper tubulin gradient and therefore a
higher diffusive influx of tubulin, at the expense of the other
branch. However, with increased path distance between the
growth cone and the branch point, the steepness of the tubulin
gradient between them decreases, reducing the tubulin flux into
the modified branch and causing the influence of the modified
branch on its neighbor to diminish, to the point where the
neighboring branch can start growing out again (around 75 hours;
see Fig. 2B1).
Fig. 2B2 shows the neurite lengths from the soma to the growth
cones 30 hours after the perturbation as a function of the tubulin
diffusion constant. The graph shows that, initially, increased
mobility of tubulin causes a larger retraction of the neighboring
branch. However, at higher rates of diffusion, the retraction
becomes smaller, as both branches can now receive enough
tubulin from the soma to grow out. Adding active transport to the
model causes a fraction of tubulin to be actively moved into each
branch, reducing the competition between the branches (Fig. 2C1).
Dashed lines in Fig. 2C1 indicate the scenario where active
transport represents a small share of the total transport of tubulin.
As can be seen, low active transport also results in retraction of the
neighboring branch, similarly to the scenario with only diffusion.
The solid lines in Fig. 2C1 indicate growth in a simulation with
high active transport. In this case, there is no retraction of the
neighboring branch after the perturbation, and both branches
keep growing out, although at different speeds. Fig. 2C2 shows the
neurite lengths from the soma to the growth cones 30 hours after
the perturbation as a function of the rate of active transport.
Increased active transport attenuates competition and causes the
growth of the two branches to become more similar because
tubulin resources are now actively moved to both growth cones.
Finally, the dependence on dA and dB of the growth change in
the neighboring branch is shown in Fig. 2D. In general, increased
path distance between the source of tubulin (soma) and the sink
(growth cone) causes the tubulin gradient to become shallower,
which reduces the diffusive flux. For short dB distances, we see
with increasing dA an increased competition between the two
branches (i.e., a larger retraction in the neighboring branch),
because the tubulin influx from the soma into the branches
decreases with increasing dA, implying that the modified branch
instead needs to recruit tubulin from the neighboring branch.
However, when the path distance dB is increased, the two growth
cones become more isolated from each other, and the diffusive flux
from one neighbor to the other becomes smaller, so competition
decreases.
Competition in a complex branching treeTo study competitive interactions in more complex branched
structures, we used the morphology of two reconstructed rat
hippocampal CA1 pyramidal neurons. Here, we show the results
of only one neuron (Fig. 3), but the findings of both neurons were
consistent with each other. The reconstructed morphology of the
apical and basal dendrites (Fig. 3A) was used as the initial
condition. In the control case, the neuron was allowed to grow out
for 10 hours with the soma tubulin concentration fixed at 5.5 mM.
The simulation was then repeated, but now one of the growth
cones had an increased polymerization rate (+100%). In Fig. 3B,
the dendritic morphology obtained in the last simulation is
represented by a dendrogram, colored according to the tubulin
concentration in the branches. The thickness of the branches is
proportional to the dendrite diameter in the reconstruction. The
gray vertical lines at the terminal segments indicate the starting
morphology, and the black vertical lines show the neurite length
after 10 hours in the control case. The black dot marks the growth
cone with increased polymerization rate. As can be seen in Fig. 3B,
the terminal branch with the modified growth cone increased its
length at the expense of its most nearby terminal branches, i.e., its
sibling terminal branch and its parent’s sibling branch, which both
retracted. The retraction is larger in the thicker terminal branch.
This may indicate that, as with higher diffusion rates (Fig. 2B2),
larger branch diameters cause more flux from the neighboring
branches into the modified branch and thus stronger competition
between the branches. The terminal branches that were more
remote from the modified branch showed very little retraction.
We then carried out more simulations with modified polymer-
ization rate, in each simulation selecting another growth cone that
had its polymerization rate increased. In each case, the total
retraction at all terminal branches divided by the growth of the
modified branch was calculated. In Fig. 3C, this total relative
retraction is plotted against the path length between the modified
growth cone and the soma. The data show that the total relative
retraction increases with larger path lengths between modified
growth cone and soma. This confirms what we observed in the
simplified morphology (see Fig. 2D), namely that the more isolated
Competition between Outgrowing Neurites
PLOS ONE | www.plosone.org 4 February 2014 | Volume 9 | Issue 2 | e86741
Competition between Outgrowing Neurites
PLOS ONE | www.plosone.org 5 February 2014 | Volume 9 | Issue 2 | e86741
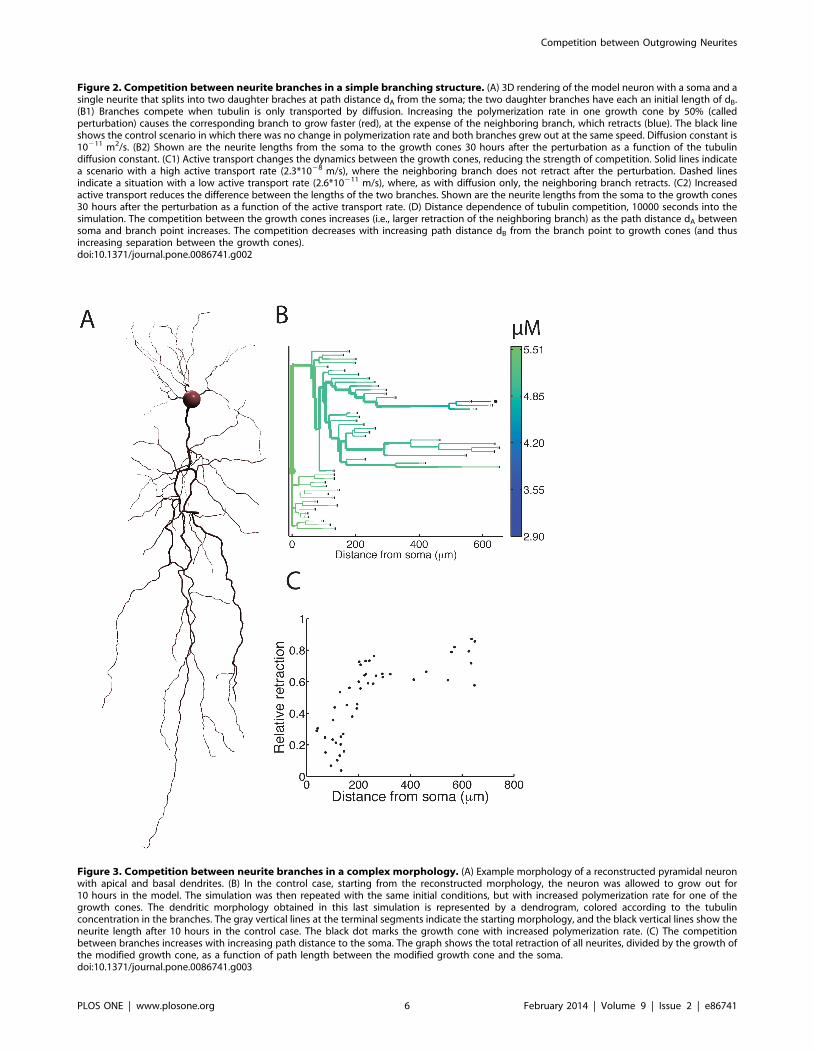
Figure 2. Competition between neurite branches in a simple branching structure. (A) 3D rendering of the model neuron with a soma and asingle neurite that splits into two daughter braches at path distance dA from the soma; the two daughter branches have each an initial length of dB.(B1) Branches compete when tubulin is only transported by diffusion. Increasing the polymerization rate in one growth cone by 50% (calledperturbation) causes the corresponding branch to grow faster (red), at the expense of the neighboring branch, which retracts (blue). The black lineshows the control scenario in which there was no change in polymerization rate and both branches grew out at the same speed. Diffusion constant is10211 m2/s. (B2) Shown are the neurite lengths from the soma to the growth cones 30 hours after the perturbation as a function of the tubulindiffusion constant. (C1) Active transport changes the dynamics between the growth cones, reducing the strength of competition. Solid lines indicatea scenario with a high active transport rate (2.3*1028 m/s), where the neighboring branch does not retract after the perturbation. Dashed linesindicate a situation with a low active transport rate (2.6*10211 m/s), where, as with diffusion only, the neighboring branch retracts. (C2) Increasedactive transport reduces the difference between the lengths of the two branches. Shown are the neurite lengths from the soma to the growth cones30 hours after the perturbation as a function of the active transport rate. (D) Distance dependence of tubulin competition, 10000 seconds into thesimulation. The competition between the growth cones increases (i.e., larger retraction of the neighboring branch) as the path distance dA betweensoma and branch point increases. The competition decreases with increasing path distance dB from the branch point to growth cones (and thusincreasing separation between the growth cones).doi:10.1371/journal.pone.0086741.g002
Figure 3. Competition between neurite branches in a complex morphology. (A) Example morphology of a reconstructed pyramidal neuronwith apical and basal dendrites. (B) In the control case, starting from the reconstructed morphology, the neuron was allowed to grow out for10 hours in the model. The simulation was then repeated with the same initial conditions, but with increased polymerization rate for one of thegrowth cones. The dendritic morphology obtained in this last simulation is represented by a dendrogram, colored according to the tubulinconcentration in the branches. The gray vertical lines at the terminal segments indicate the starting morphology, and the black vertical lines show theneurite length after 10 hours in the control case. The black dot marks the growth cone with increased polymerization rate. (C) The competitionbetween branches increases with increasing path distance to the soma. The graph shows the total retraction of all neurites, divided by the growth ofthe modified growth cone, as a function of path length between the modified growth cone and the soma.doi:10.1371/journal.pone.0086741.g003
Competition between Outgrowing Neurites
PLOS ONE | www.plosone.org 6 February 2014 | Volume 9 | Issue 2 | e86741

the neurites were (larger path distance dA from the soma), the
stronger the competition was between them.
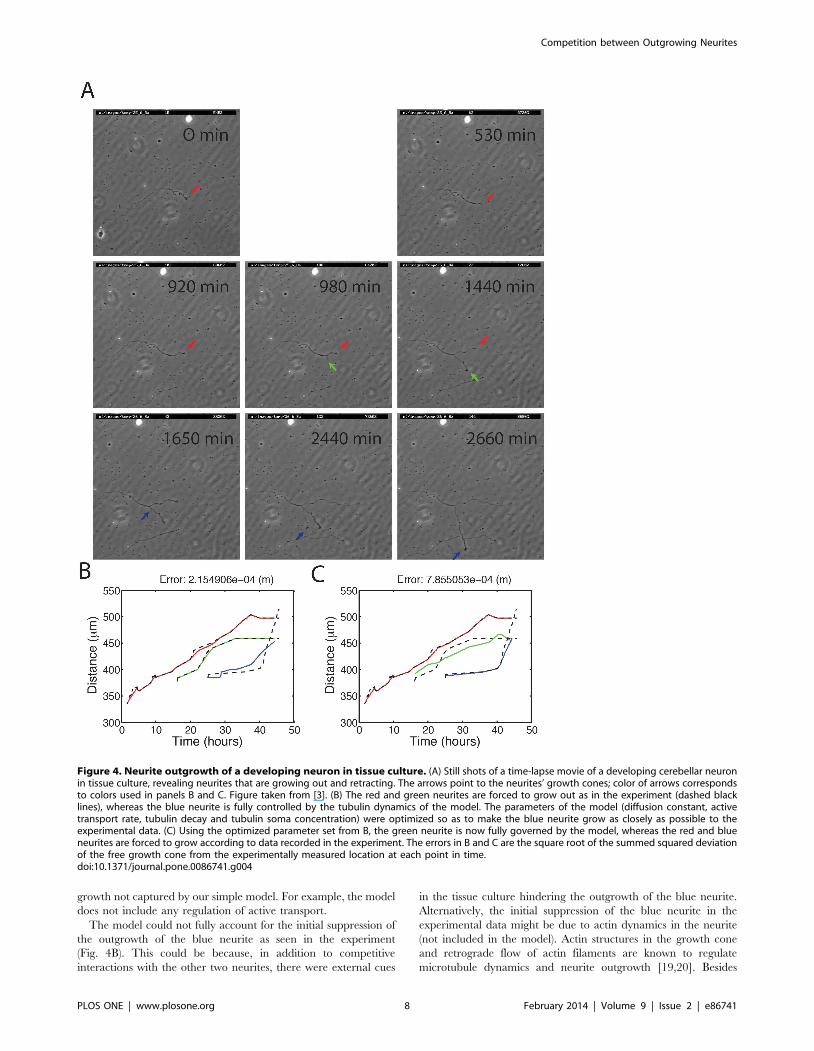
Predictive power of the modelTo investigate the predictive power of the model, we used as
reference a time-lapse movie of an outgrowing neuron in a culture
dish, revealing neurites that branch, grow out and retract in a
dynamical fashion [3]. A selection of video frames is shown in
Fig. 4A. The growth cone movements were manually detected in
each frame of the video. At the start of the movie a single neurite
(red) grows out. After 980 minutes a second neurite (green) has
formed and starts extending in parallel with the first neurite. After
1650 minutes a third neurite appears (blue), initially growing
slowly, but then starting to grow out more rapidly at the expense of
the other neurites. In tissue culture, the rate of neurite outgrowth
may be affected by molecular guidance molecules and other
chemical and physical cues in the cell’s environment. The model
does not explicitly include such cues.
The question we asked was whether the model could predict the
behavior of one growth cone given the behavior of the other two
growth cones. To this end, two of the neurites in the model were
forced to grow out at the same speed as the corresponding neurites
in the experiment, while the third neurite was fully controlled by
the model. A neurite’s growth was forced by changing the neurite’s
distal coordinate and removing the amount of tubulin in the
growth cone that was required for such a length change; however,
if that produced a negative tubulin concentration, the neurite was
not allowed to grow out. Depending on the growth and retraction
of the first two neurites (red and green), the tubulin concentration
in the third growth cone (blue) would fluctuate, resulting in varying
growth speeds of the neurite. The polymerization and depoly-
merization rates were fixed at their default values (see Methods).
The tubulin concentration in the soma, the active transport rate,
diffusion constant and the tubulin decay rate were optimized, but
fixed during the course of one simulation, to give as close a match
as possible between experiment and model result for the blue
growth cone (Fig. 4B). The parameters were optimized by
discretizing the parameter space and doing an exhaustive search
(whereby the diffusion constant D could vary from 1*10213 to
0.5*10210 m2/s, the rate of active transport v from 0 to
440*1027 m/s, the tubulin decay b from 5.67*1027 to
5.67*1024 s21, and the soma concentration Q0/V0 from 5.5 to
50 mM). The summed deviation of the free growth cone from the
experimentally measured location at each point in time was used
as an error measure.
As seen in Fig. 4B, at the start of the simulation the red neurite
grows out and follows the experimental trace quite closely; then
after 980 minutes the green neurite buds off and starts growing
out. The slight discrepancy of the red and green traces with the
experimental traces (dashed lines) is due to the model constraint
that if a forced growth cone does not have enough tubulin it
cannot grow out. By 1650 minutes into the experiment, the blue
neurite—the free neurite, whose growth is fully governed by the
model—forms but initially grows out very slowly. The fast
outgrowing red and green neurites create a steep tubulin gradient
and a large diffusive influx and consume most of the tubulin
resources, hampering the outgrowth of the blue neurite. When the
red and green neurites stall, more resources become available to
the blue growth cone, enabling the blue neurite to grow out faster.
Although the stalling of the red and green neurites are seen to
trigger the faster outgrowth of the blue neurite, as in the
experiment, none of the parameter sets we tried were able to
completely capture the sudden rapid elongation of the blue
neurite.
As a way of verifying the optimized parameter set, the
simulation was then repeated, but this time the red and the blue
neurites were forced to grow out as in the experimental movie, and
the green one was controlled by the model (Fig. 4C). This can be
regarded as a weak form of cross-validation: in the previous
simulation we searched for a parameter set that optimized the
outgrowth of the blue neurite, and in this simulation we tested,
using the same parameter set, the readout of the green neurite. As
expected, the blue neurite is now much closer to the experimental
trace (dashed line) because it is being forced to match it; however,
there is not quite enough tubulin available to precisely match the
rapid elongation commencing around 40 hours. The green
neurite—the free neurite controlled by the model—follows the
experimental trace approximately. As a result of the competitive
interactions between the neurites, around 32 hours the green
neurite slightly reduces its growth speed when the red neurite
increases its growth speed; the reduction in growth speed is not as
large as in the experiment, which shows that the green neurite
then stops growing out. Around 40 hours, the green neurite starts
retracting when the blue neurite exhibits a growth spurt.
Overall, the model is able to capture at least the qualitative
behavior of the experimental neuron. In tissue culture, external
chemical and physical cues in the neuron’s environment, which
are not implemented in the model, are also likely to influence
outgrowth. With that in mind, the model performs reasonably well
in accounting for the growth dynamics.
Discussion
During neuron outgrowth, the elongation of neurite branches is
often accompanied by the simultaneous retraction of other
branches in the same neuron [1–3]. These apparently competitive
interactions are important in the formation of synaptic connections
[2,4–7], but the biological processes underlying this coordination
of neurite outgrowth are poorly known. Using a multi-compart-
mental model of neurites, we have shown here that competition
between outgrowing neurite branches can already emerge from
relatively simple dynamics of a growth resource such as tubulin.
Tubulin is the building block of the microtubule cytoskeleton, a
key structure in neurites that provides stability and rigidity.
In the model, just as in experimental studies [1], stimulating the
outgrowth of a neurite branch can lead to the simultaneous
retraction of sibling branches. The model predicts that the amount
of retraction decreases with increasing path distance between the
branches’ growth cones, increases with increasing path distance
between growth cone and soma, decreases with increasing rate of
active transport, and initially increases with increasing diffusion
constant. We confirmed that competitive interactions between
outgrowing branches can occur not only in simple morphologies
but also in the complex dendritic morphology of pyramidal
neurons. Also in these complex morphologies, we found that the
more isolated the growth cones are from the soma, the stronger
they compete with each other. Furthermore, we showed that, in a
developing neuron in tissue culture [3], competition for a growth
resource such as tubulin may be able to predict, at least
qualitatively, the growth of one neurite branch on the basis of
the growth of the other branches.
As mentioned, the model shows that stimulating the outgrowth
of a neurite branch can lead to the simultaneous retraction of
neighboring branches. In the model, the length increase of the
growing branch was always larger than the length decrease of the
retracting branch. In the experiments [1], however, the retraction
was sometimes larger than the elongation. This difference between
model and experiment could be the result of internal regulation of
Competition between Outgrowing Neurites
PLOS ONE | www.plosone.org 7 February 2014 | Volume 9 | Issue 2 | e86741
growth not captured by our simple model. For example, the model
does not include any regulation of active transport.
The model could not fully account for the initial suppression of
the outgrowth of the blue neurite as seen in the experiment
(Fig. 4B). This could be because, in addition to competitive
interactions with the other two neurites, there were external cues
in the tissue culture hindering the outgrowth of the blue neurite.
Alternatively, the initial suppression of the blue neurite in the
experimental data might be due to actin dynamics in the neurite
(not included in the model). Actin structures in the growth cone
and retrograde flow of actin filaments are known to regulate
microtubule dynamics and neurite outgrowth [19,20]. Besides
Figure 4. Neurite outgrowth of a developing neuron in tissue culture. (A) Still shots of a time-lapse movie of a developing cerebellar neuronin tissue culture, revealing neurites that are growing out and retracting. The arrows point to the neurites’ growth cones; color of arrows correspondsto colors used in panels B and C. Figure taken from [3]. (B) The red and green neurites are forced to grow out as in the experiment (dashed blacklines), whereas the blue neurite is fully controlled by the tubulin dynamics of the model. The parameters of the model (diffusion constant, activetransport rate, tubulin decay and tubulin soma concentration) were optimized so as to make the blue neurite grow as closely as possible to theexperimental data. (C) Using the optimized parameter set from B, the green neurite is now fully governed by the model, whereas the red and blueneurites are forced to grow according to data recorded in the experiment. The errors in B and C are the square root of the summed squared deviationof the free growth cone from the experimentally measured location at each point in time.doi:10.1371/journal.pone.0086741.g004
Competition between Outgrowing Neurites
PLOS ONE | www.plosone.org 8 February 2014 | Volume 9 | Issue 2 | e86741

regulating growth rate, actin in the growth cone is also critically
involved in neurite guidance and steering [21]. After around
38 hours, the growth of the blue neurite is slower in the model
than in the experiment (Fig. 4B). The faster outgrowth in the
experiment could be due to other mechanisms of tubulin transport
besides diffusion and active transport of tubulin dimers, such as
microtubule polymer transport [15–17] and microtubule sliding
[18]. Sliding of microtubules against each other might also have a
direct role in competition between neurite branches, especially
during early neuronal development [18]. Microtubule sliding
provides mechanical forces for neurite protrusion over long
distances, and microtubules could slide between one neurite tip
and another.
Obviously, neurite outgrowth is more complex than imple-
mented in the model, and involves in addition to tubulin
dynamics, actin dynamics [19–21], transport of vesicles supplying
membrane for neurite extension [22], and transport of mitochon-
dria providing energy [23]. In the model, we deliberately
simplified the process of neurite outgrowth in order to investigate
what behavior could already emerge from basic tubulin dynamics
alone. Tubulin was assumed to be the rate-limiting resource for
neurite outgrowth. Although microtubule polymers are indeed a
main component of the neurite’s cytoskeleton, with tubulin
consequently being a necessary resource for neurites to grow
out, we would obtain very similar results if any other resource was
rate limiting for outgrowth, so long as this resource is produced in
the soma and transported by diffusion and active transport to the
growth cones and there consumed to elongate the neurite. Thus,
from our model results we cannot infer that tubulin is necessarily
involved in competition, only that a rate-limiting resource with the
same type of simple dynamics as implemented here for tubulin is
capable of producing competitive interactions between outgrowing
neurites.
Our model predictions—that competition between neurite
branches decreases with path distance between the growth cones,
increases with path distance to the cell body, and is mitigated by a
greater share of active transport in the total transport of tubulin—
are amenable to experimental testing. To test the dependence on
path distance to the cell body, the experiments in [1], in which the
growth of one branch was stimulated by local calcium uncaging
and the growth of the other branches monitored, can be repeated
by systematically selecting branches for stimulation that are at
various path distances from the soma. To test the dependence on
path distance between growth cones, the growth response of the
other branches can be plotted as a function of path distance to the
stimulated branch. The rate of active transport in neurites may
also be altered experimentally [43] in order to test whether a lower
rate leads to enhanced competition, as the model predicts.
The competitive interactions between neurite branches that we
observed in the model depend on tubulin being transported, at
least partially, by diffusion. If indeed tubulin is the rate-limiting
resource for neurite outgrowth, the model therefore predicts that
there should be a spatial gradient of tubulin from high levels in the
soma to lower levels in the growth cone. Furthermore, the gradient
in the fastest outgrowing neurite branch should initially be steeper,
as more tubulin is consumed in the growth cone of this branch
than in the growth cones of the other branches. Because of the
steeper gradient, there will be a larger diffusive influx into the
fastest growing branch as compared to the other branches. These
predictions can be tested experimentally by monitoring the
concentration gradient of free tubulin in outgrowing neurites.
To further test whether competition for a growth resource such
as tubulin is able to predict the growth of one branch on the basis
of the growth of the other branches, it would be desirable to
acquire more time-lapse movies of growing neurites, and perform
analyses similar to those in Fig. 4. Analysing more movies would
have made our conclusions stronger, but these movies are
currently not available. Our results highlight the importance of
such detailed movies for investigating the mechanisms underlying
the complex dynamics of neurite outgrowth.
Only a few biophysical models of neurite outgrowth exists [13].
Van Ooyen et al. [14], in a small pilot experiment, studied neurite
outgrowth based on tubulin dynamics in a highly simplified model
consisting of only three compartments, a soma compartment and
two growth cone compartments. They found that the fastest
growing neurite branch could prevent the outgrowth of the other
branch. However, they did not study retraction of neurites, or the
influence of diffusion constant, active transport rate and path
distance from the soma and between growth cones on the
competitive interactions between neurites. In a more extensive
compartmental model [9], neurite outgrowth was modulated by
microtubule-associated proteins (MAPs), with phosphorylated
MAP2 favoring branching and dephosphorylated MAP2 favoring
elongation. The authors showed that depending on the relative
rates of calcium-dependent phosphorylation and dephosphoryla-
tion, a variety of characteristic dendritic trees was produced, but
they did not investigate competitive interactions between neurite
branches. Another biophysical model of neurite outgrowth was
based on membrane expansion by exocytosis of vesicles trans-
ported inside the cell body and neurite [12], but this model was
also not concerned with competition. Likewise, models that focus
on the effects of external influences on neurite outgrowth, such as
adhesion between neurite and substrate [11] or repulsive
interactions between neurites [10], did not examine possible
competitive effects between neurites. Some form of competition
was studied in a model of axon-dendrite differentiation based on
shootin 1 [44]. It was shown that anterograde transport and
retrograde diffusion of shootin 1, together with shootin 1-
dependent neurite outgrowth, can cause one neurite to outgrow
its siblings and become the axon.
In contrast to biophysical models, phenomenological models of
neurite outgrowth do not directly implement the underlying
biological mechanisms responsible for neurite elongation and
branching. In the stochastic phenomenological model of Van Pelt
et al. [45–47], each growth cone in the growing tree has a certain
probability to branch and elongate. Interestingly, to be able to
accurately produce the morphology of a wide range of neuron
types, the model needs a competition factor describing how the
growth cone’s actions depend on the momentary total number of
growth cones in the tree. This factor may reflect competition
between growth cones for resources such as tubulin [31].
In conclusion, our results suggest that competition between
outgrowing neurites can already arise from basic dynamics of a
growth resource such as tubulin and that competition for such a
resource may partly underlie the experimentally observed
differential outgrowth and retraction of neurite branches of the
same neuron.
Acknowledgments
The authors would like to thank Martine Groen for providing the
reconstructed CA1 pyramidal neurons used in this study. We would also
like to thank Tim Kroon for making the illustration of the tubulin dynamics
in Fig. 1A.
Author Contributions
Conceived and designed the experiments: JJJH JvP HDM AvO. Performed
the experiments: JJJH. Analyzed the data: JJJH JvP AvO. Wrote the paper:
JJJH JvP AvO.
Competition between Outgrowing Neurites
PLOS ONE | www.plosone.org 9 February 2014 | Volume 9 | Issue 2 | e86741
References
1. Hutchins BI, Kalil K (2008) Differential outgrowth of axons and their branches
is regulated by localized calcium transients. J Neurosci 28: 143–153.2. Singh KK, Miller FD (2005) Activity regulates positive and negative
neurotrophin-derived signals to determine axon competition. Neuron 45: 837–845.
3. Da Fontoura Costa L, Manoel ETM, Fancereau F, Chelly J, Van Pelt J, et al.
(2002) A shape analysis framework for neuromorphometry. Network: Comput inNeural Syst 13: 283–310.
4. Dent EW, Barnes AM, Tang F, Kalil K (2004) Netrin-1 and semaphoring 3Apromote or inhibit cortical axon branching, respectively, by reorganization of
the cytoskeleton. J Neurosci 24: 3002–3012.
5. Luo L, O’Leary DD (2005) Axon retraction and degeneration in developmentand disease. Annu Rev Neurosci 28: 127–156.
6. Meyer MP, Smith JJ (2006) Evidence from in vivo imaging that synaptogenesisguides the growth and branching of axonal arbors by two distinct mechanisms.
J Neurosci 26: 3604–3614.7. Halloran MC, Kalil K (1994) Dynamic behaviors of growth cones extending in
the corpus callosum of living cortical brain slices observed with video
microscopy. J Neurosci 14: 2161–2177.8. Sanford SD, Gatlin JC, Hokfelt T, Pfenninger KH (2008) Growth cone
responses to growth and chemotropic factors. Eur J Neurosci 28: 268–278.9. Hely TA, Graham BP, Van Ooyen A (2001) A computational model of dendrite
elongation and branching based on MAP2 phosphorylation. J Theor Biol 210:
375–384.10. Sugimura K, Shimono K, Uemura T, Mochizuki A (2007) Self-organizing
mechanism for development of space-filling neuronal dendrites. PLoS ComputBiol 3(11): e212. doi:10.1371/journal.pcbi.0030212
11. O’Toole M, Lamoureux P, Miller K (2008) A physical model of axonalelongation: force, viscosity, and adhesions govern the mode of outgrowth.
Biophys J 94: 2610–2620.
12. Tsaneva-Atanasova K, Burgo A, Galli, Holcman D (2009) Quantifying neuritegrowth mediated by interactions among secretory vesicles, microtubules, and
actin networks. Biophysical Journal 96: 840–857.13. Van Ooyen A (2011) Using theoretical models to analyse neural development.
Nature Reviews Neuroscience 12: 311–326.
14. Van Ooyen A, Graham BP, Ramakers GJA (2001) Competition for tubulinbetween growing neurites during development. Neurocomputing 38: 73–78.
15. Reinsch SS, Mitchison TJ, Kirschner M (1991) Microtubule polymer assemblyand transport during axonal elongation. J Cell Biol 115:365–379.
16. Baas PW, Ahmad FJ (1993) The transport properties of axonal microtubulesestablish their polarity orientation. J Cell Biol 120:1427–1437.
17. Wang L, Brown A (2002) Rapid movement of microtubules in axons. Curr Biol
3; 1496–1501.18. Lu W, Fox P, Lakonishok M, Davidson MW, Gelfand VI (2013) Initial neurite
outgrowth in Drosophila neurons is driven by kinesin-powered microtubulesliding. Curr Biol 23:1018–1023.
19. Schaefer AW, Schoonderwoert VThG, Ji L, Mederios N, Danuser G, et al.
(2008) Coordination of actin filament and microtubule dynamics during neuriteoutgrowth. Developmental Cell 15: 146–162.
20. Flynn KC, Hellal F, Neukirchen D, Jacob S, Tahirovic S, et al. (2012) ADF/Cofilin-mediated actin retrograde flow directs neurite formation in the
developing brain. Neuron 76: 1091–1107.21. Dent EW, Gertler FB (2003) Cytoskeletal dynamics and transport in growth
cone motility and axon guidance. Neuron 40: 209–227.
22. Zakharenko S, Popov S (1998) Dynamics of axonal microtubules regulate thetopology of new membrane insertion into the growing neurites. J Cell Biol
143:1077–1086.23. Morris RL, Hollenbeck PJ (1995) Axonal transport of mitochondria along
microtubules and F-actin in living vertebrate neurons. J Cell Biol 131: 1315–
1326.
24. Keith CH (1990) Neurite elongation is blocked if microtubule polymerization is
inhibited in PC12 cells. Cell Motility and the Cytoskeleton 17: 95–105.25. Miller KE, Joshi HC (1996) Tubulin transport in neurons. J Cell Biol 133: 1355–
1366.26. Campenot RB, Eng H (2000) Protein synthesis in axons and its possible
functions. J Neurocytology 29: 793–798.
27. Morrison EE, Moncur PM, Askham JM (2002) EB1 identifies sites ofmicrotubule polymerisation during neurite development. Brain Res Mol Brain
Res 98:145–152.28. Graham BP, Van Ooyen A (2001) Compartmental models of growing neurites.
Neurocomputing 38–40: 31–36.
29. Laferriere NB, MacRae TH, Brown DL (1997) Tubulin synthesis and assemblyin differentiating neurons. Biochemistry and Cell Biology 75: 103–117.
30. Walker RA, O’Brien ET, Pryer NK, Soboeiro MF, Voter WA, et al. (1988)Dynamic instability of individual microtubules analyzed by video light
microscopy: rate constants and transition frequencies. J Cell Biol 107: 1437–1448.
31. Graham BP, Van Ooyen A (2004) Transport limited effects in a model of
dendritic branching. J Theor Biol 230: 421–432.32. Odde DJ (1997). Estimation of the diffusion-limited rate of microtubule
assembly. Biophysical J 73: 88–96.33. Mudrakola HV, Zhang K, Cui B (2009) Optically resolving individual
microtubules in live axons. Structure 17: 1433–1441.
34. Okabe S, Hirokawa N (1990) Turnover of fluorescently labelled tubulin andactin in the axon. Nature 343: 479–482.
35. Krouglova T, Vercammen J, Engelborghs Y (2004) Correct diffusion coefficientsof proteins in fluorescence correlation spectroscopy. Application to tubulin
oligomers induced by Mg 2+ and paclitaxel. Biophysical J 87: 2635–2646.36. Hille B (1984) Ionic channels of excitable membranes (Vol. 174). Sunderland,
MA: Sinauer Associates.
37. Galbraith JA, Reese TS, Schlief ML, Gallant PE (1999) Slow transport ofunpolymerized tubulin and polymerized neurofilament in the squid giant axon.
Proc Natl Acad Sci U S A 96:11589–11594.38. Miller KE, Samuels DC (1997) The axon as a metabolic compartment: protein
degradation, transport, and maximum length of an axon. J Theor Biology 186:
373–379.39. Forgue ST, Dahl JL (1978) The turnover rate of tubulin in rat brain.
J Neurochemistry 31: 1289–1297.40. Chang S, Svitkina TM, Borisy GG, Popov SV (1999) Speckle microscopic
evaluation of microtubule transport in growing nerve processes. Nature CellBiology 1: 399–403.
41. Janulevicius A, Van Pelt J, Van Ooyen A (2006) Compartment volume
influences microtubule dynamic instability: a model study. Biophysical J 90:788–798.
42. Gard DL, Kirschner MW (1987) Microtubule assembly in cytoplasmic extractsof Xenopus oocytes and eggs. J Cell Biol 105: 2191–2201.
43. Kapitein LC, Schlager MA, Kuijpers M, Wulf PS, Van Spronsen M, et al. (2010)
Mixed microtubules steer dynein-driven cargo transport into dendrites. CurrentBiology 20: 290–299.
44. Toriyama M, Sakumura Y, Shimada T, Ishii S, Inagaki N (2010) A diffusion-based neurite length-sensing mechanism involved in neuronal symmetry
breaking. Molecular Systems Biology 6:394. doi: 10.1038/msb.2010.51.45. Van Pelt J, Dityatev A, Uylings H (1997) Natural variability in the number of
dendritic segments: model-based inferences about branching during neurite
outgrowth. J Comp Neurol 387: 325–340.46. Van Pelt J, Uylings H (2002) Branching rates and growth functions in the
outgrowth of dendritic branching patterns. Network 13: 261–281.47. Koene RA, Tijms B, Van Hees P, Postma F, De Ridder A, et al. (2009).
NETMORPH: a framework for the stochastic generation of large scale neuronal
networks with realistic neuron morphologies. Neuroinformatics 7: 195–210.
Competition between Outgrowing Neurites
PLOS ONE | www.plosone.org 10 February 2014 | Volume 9 | Issue 2 | e86741
Related Documents