Competing for Securities Underwriting Mandates: Banking Relationships and Analyst Recommendations ALEXANDER LJUNGQVIST, FELICIA MARSTON, and WILLIAM J. WILHELM, JR. * ABSTRACT We investigate whether analyst behavior influenced banks likelihood of winning underwriting mandates for a sample of 16,625 U.S. debt and equity offerings in 1993 to 2002. We control for the strength of the issuers investment banking relationships with potential competitors for the mandate, prior lending relationships, and the endogeneity of analyst behavior and the banks decision to provide analyst coverage. Although analyst behavior was influenced by economic incentives, we find no evidence that aggressive analyst behavior increased their banks probability of winning an underwriting mandate. The main determinant of the lead-bank choice is the strength of prior underwriting and lending relationships. * Ljungqvist is from the New York University Stern School of Business and the Centre for Economic Policy Research, London; Marston is from the University of Virginia McIntire School of Commerce; and, Wilhelm is from the University of Virginia McIntire School of Commerce and the Oxford University Sad Business School. We are grateful to Bill Greene, Rob Stambaugh (the editor), and an anonymous referee for helpful suggestions, to Rajesh Aggarwal, Susan Chaplinsky, Randy Cohen, Francesca Cornelli (our NBER discussant), Josh Coval, David Denis, Greg Duffee, Darrell Duffie, Ken Eades, Joel Hasbrouck, Florian Heider, Harrison Hong, Ajay Khorana (our WFA discussant), Ross Levine, Robert Marquez, Stefan Nagel, Jay Ritter, Rick Ruback, Gideon Saar, Tony Saunders, Anna Scherbina, Peter Tufano, Daniel Wolfenzon, and Jeff Wurgler for useful thoughts, and to seminar audiences at Harvard Business School, Northwestern University, the University of Chicago, Carnegie Mellon University, the University of Minnesota, Tulane University, Oxford University, Vanderbilt Law School, the University of Virginia, the NYU Monday Seminar, the Norwegian School of Economics, the Federal Reserve Bank of New York, the 2003 NBER Summer Institute, the 2003 Oxford Summer Finance Symposium, and the 2003 Western Finance Association meetings for comments. We gratefully acknowledge the contribution of Thomson Financial for providing broker recommendations data, available through the Institutional Brokers Estimate System. These data have been provided as part of a broad academic program to encourage earnings expectations research. All errors are our own.

Welcome message from author
This document is posted to help you gain knowledge. Please leave a comment to let me know what you think about it! Share it to your friends and learn new things together.
Transcript
Competing for Securities Underwriting Mandates: Banking Relationships and Analyst Recommendations
ALEXANDER LJUNGQVIST, FELICIA MARSTON, and WILLIAM J. WILHELM, JR. *
ABSTRACT We investigate whether analyst behavior influenced banks� likelihood of winning underwriting mandates for a sample of 16,625 U.S. debt and equity offerings in 1993 to 2002. We control for the strength of the issuer�s investment banking relationships with potential competitors for the mandate, prior lending relationships, and the endogeneity of analyst behavior and the bank�s decision to provide analyst coverage. Although analyst behavior was influenced by economic incentives, we find no evidence that aggressive analyst behavior increased their bank�s probability of winning an underwriting mandate. The main determinant of the lead-bank choice is the strength of prior underwriting and lending relationships.
* Ljungqvist is from the New York University Stern School of Business and the Centre for Economic Policy Research, London; Marston is from the University of Virginia McIntire School of Commerce; and, Wilhelm is from the University of Virginia McIntire School of Commerce and the Oxford University Saïd Business School. We are grateful to Bill Greene, Rob Stambaugh (the editor), and an anonymous referee for helpful suggestions, to Rajesh Aggarwal, Susan Chaplinsky, Randy Cohen, Francesca Cornelli (our NBER discussant), Josh Coval, David Denis, Greg Duffee, Darrell Duffie, Ken Eades, Joel Hasbrouck, Florian Heider, Harrison Hong, Ajay Khorana (our WFA discussant), Ross Levine, Robert Marquez, Stefan Nagel, Jay Ritter, Rick Ruback, Gideon Saar, Tony Saunders, Anna Scherbina, Peter Tufano, Daniel Wolfenzon, and Jeff Wurgler for useful thoughts, and to seminar audiences at Harvard Business School, Northwestern University, the University of Chicago, Carnegie Mellon University, the University of Minnesota, Tulane University, Oxford University, Vanderbilt Law School, the University of Virginia, the NYU Monday Seminar, the Norwegian School of Economics, the Federal Reserve Bank of New York, the 2003 NBER Summer Institute, the 2003 Oxford Summer Finance Symposium, and the 2003 Western Finance Association meetings for comments. We gratefully acknowledge the contribution of Thomson Financial for providing broker recommendations data, available through the Institutional Brokers Estimate System. These data have been provided as part of a broad academic program to encourage earnings expectations research. All errors are our own.

1
The U.S. securities industry currently faces perhaps the strongest challenge to its integrity since the
Great Depression. Particularly troubling are the allegations that in the late 1990s, investment bank
research analysts systematically sacrificed objectivity, and thereby misled the investing public, to attract
securities underwriting mandates for their banks. Recent work by Lin and McNichols (1998), Michaely
and Womack (1999), and Bradley, Jordan, and Ritter (2003) lends weight to these allegations in the sense
that analysts are shown to be more optimistic towards their banks� underwriting clients.
And yet, there is no systematic evidence that analyst behavior influenced their bank�s likelihood of
attracting an underwriting mandate. Moreover, the 1990s witnessed profound changes in the competitive
landscape as commercial banks incrementally shed Glass-Steagall constraints on their ability to compete
for securities underwriting mandates. By most accounts, commercial banks exploited their larger capital
accounts to win underwriting mandates. Investment banks generally had smaller balance sheets but more
reputation capital derived from their long experience with capital market transactions.
Against this background, we investigate directly whether analyst behavior influenced the likelihood of
banks being awarded underwriting mandates for a sample of 16,625 U.S. debt and equity offerings sold
between December 1993 and June 2002. Although analyst recommendation behavior was influenced by
economic incentives, we find no evidence that such behavior favorably influenced whether banks won
either debt or equity mandates. Far more important appears to be the strength of the bank�s relationship
with the issuer as measured by the share of the issuer�s past securities offerings (both debt and equity)
underwritten by the bank, and to a somewhat lesser extent the strength of prior lending relationships.1
Our results do not conflict with well-documented examples of analysts sacrificing their objectivity
when under pressure from investment bankers. Rather, our modeling approach captures the analyst�s
tradeoff between career concerns (which we interpret as the cost of jeopardizing her reputation) and the
incentives bankers may have provided analysts to bias their recommendations. Our results confirm that
analysts were more aggressive when more potential fee income was at stake. More reputable analysts
(measured by Institutional Investor �all-star� rankings) and more prestigious banks (measured by
2
equity underwriting market share during the preceding year) were associated with less aggressive
analyst behavior. We interpret these findings as a reflection of the value to an analyst of maintaining her
reputation capital and the certification function of investment banks (Chemmanur and Fulghieri (1994)). It
is noteworthy, however, that during the dot-com bubble (1999-2000) when the stakes were particularly
high, even all-star analysts were more aggressive with their recommendations.
In sum, analyst behavior appears to be aggressive when the potential benefits are large and the
potential reputational cost is small. Under the assumption that analysts choose optimally (i.e.,
endogenously) whether to inflate their recommendations, some of our specifications suggest that
aggressive analyst recommendation behavior was counterproductive in the sense that it reduced their
banks� chances of winning the underwriting mandate. Interpreting aggressive analyst behavior as
liquidation of reputation capital, less reputable investment banks competed more aggressively on this
dimension but it was a losing proposition. It is possible that banks were foolish or irrational in their
behavior. Alternatively, we think it is plausible that bank and analyst decisions generally were calculated
but suffered from enormous uncertainty as the industry restructured during the sample period.
Commercial banks entered the securities underwriting business (and had their greatest competitive
impact) in the debt markets.2 Adverse selection theories of capital structure (e.g., Myers and Majluf
(1984) and Nachman and Noe (1994)) suggest �managers will prefer debt to equity financing when they
have a substantial amount of private information� (Grinblatt and Titman (1998), p. 652). Such
informational frictions create demand for investment bank certification and thus should pose a weaker
reputational barrier to entry in underwriting debt offerings. Other things equal, incentives to preserve
reputation capital should then be less constraining for banks that specialize in debt underwriting, implying
a greater willingness to test the limits of investor credulity. Consistent with this view, we find more
aggressive analyst behavior ahead of debt deals than ahead of equity deals, even among established
analysts. But investment banks competing aggressively on this dimension fought a losing battle:
Commercial banks gained considerable market share at their expense.
3
In broad terms we believe the evidence favors the interpretation that deregulation of commercial
banks coupled with enormous deal flow in the late 1990s upset an equilibrium in which market forces
(i.e., reputational concerns) moderated the longstanding conflict of interest between investment banking
and research.3 Interpreting aggressive behavior among analysts (and its subsequent fallout) as liquidation
of reputation capital, the evidence suggests that it did not serve banks� interests in the short run and we
contend it is therefore not likely to characterize long-run equilibrium in the industry.
Our analysis is complicated by several factors. First, a favorable research report, though surely of
value to a potential issuer, is not the only consideration in selecting an underwriter. At the transaction
level, such decisions are made within the context of complex banking relationships. Second, we show that
bank research coverage decisions are strategic and heavily influenced by past dealings with the issuer.
Thus, whether we observe a stock recommendation ahead of a given deal is not random and requires
explicit modeling. Third, a large literature documents systematic positive biases in earnings forecasts
(Brown, Foster, and Noreen (1985), Stickel (1990), Abarbanell (1991), Dreman and Barry (1995), Chopra
(1998), and others), which in part appear driven by career concerns (Hong and Kubik (2003) and Hong,
Kubik, and Solomon (2000)). Analyst research is an experience good and thus individual analysts have an
incentive to build and maintain a reputation for objectivity and forecast accuracy. The private incentive to
protect one�s reputation and the quasi rents it confers provide a countervailing force against incentives to
sacrifice objectivity (Graham (1999)). In short, there is ample reason to believe that analyst behavior
reflects at least in part a tradeoff and so cannot be treated as an exogenous determinant of a bank�s
chances of winning a mandate.
We address these problems by empirically modeling the bank�s coverage decision and analyst
behavior under the assumption that each is embedded in a banking relationship that evolves over time.
Their joint evolution, in turn, conditions the likelihood that an issuing firm grants an underwriting
mandate to a particular bank. We develop this structural econometric model in Section I. We use data
from six principal sources (SDC, I/B/E/S, Dealscan, 13f filings, Institutional Investor magazine, and

4
news reports) to estimate the model. Section II describes our data and coding choices in some detail.
Our empirical results are in Section III. Section IV concludes.
I. The Empirical Model
A. Economic Structure of the Model
In this section we outline the economic structure of the model and provide an overview of the key
variables. We defer precise specification of the variables to subsequent sections.
Our central focus is on the determinants of a bank j�s likelihood of receiving an issuing firm i�s
underwriting mandate at time t. The probability model takes the general form
Pr(bank j leads firm i�s deal at time t) = fL(analyst behavior, XL), (1)
where XL is a matrix of explanatory variables. By �analyst behavior� we mean either the level of bank j�s
analyst�s recommendation for firm i�s stock, or the change in that recommendation. In either case, we
normalize by the recommendation behavior of other banks. Thus, we test whether a bank is more likely to
win an underwriting mandate if its analyst provided a relatively bullish recommendation for the issuer�s
stock, or recently upgraded the issuer�s stock more aggressively, than did other banks. We control for the
reputation of the bank�s analyst, the bank�s broader reputation within the debt and equity markets, its
lending capacity, and the strength of the bank�s relationship with the issuer. Other things equal, we expect
a higher probability of success from a more reputable bank that maintains a strong relationship with the
issuer. Including proxies for lending relationships enables us to examine allegations that commercial
banks successfully tied lending facilities to opportunities for underwriting capital market transactions.4
Recent regulatory investigations allege that investment bankers pressured analysts to provide more
favorable recommendations for potential issuers. Such pressure could take the form of, among others,
promises of large year-end bonuses. However, research is an experience good so analysts have an
incentive to build and protect a reputation for meaningful recommendations. Thus, if analysts are self-
interested, they should weigh career concerns against any immediate expected payoffs from

5
cooperation with investment bankers. If so, inference is biased by treating analyst behavior as an
exogenous determinant of the bank�s probability of attracting an underwriting mandate. We address this
�simultaneity� problem by obtaining an instrumental variable or fitted value for analyst behavior from the
following model:
Analyst behavior at time t = fA(XA), (2)
where XA is a matrix of explanatory variables that control for both the expected cost to the analyst of
jeopardizing her reputation and the benefit she expects to receive (or equivalently, the amount of pressure
investment bankers put on her to bias her recommendation upward). Absent data on bonuses promised to
research analysts, we control for the latter with proxies for the bank�s expected underwriting profits. We
contend that profit opportunities are tied to the strength of the banking relationship with the issuing firm,
the issuer�s general capacity for generating fee income within this relationship, and the fee potential in the
deal at hand. We also control for time-variation in the size of the potential pool of �side payments�
bankers might use to gain analyst cooperation, based on changes in market-wide deal flows (such as the
�hot� market of the late 1990s).
A bank�s relationship with an issuer has potentially competing effects on analyst behavior. On the one
hand, a bank and its analyst might sacrifice reputation capital to protect a rent stream associated with a
strong relationship. Conversely, if an existing banking relationship presents a barrier to entry, there is less
incentive for a reputable bank maintaining a strong relationship with the issuer to offer an aggressive
recommendation. Competition via more aggressive analyst recommendations would then be the province
of less reputable banks seeking to build relationships with issuing firms; analysts employed by more
reputable banks and/or those with more �loyal� clients should face less pressure from investment bankers.
If every sample bank covered every sample issuer at the time of every sample transaction, we could
estimate (1) and (2) as a system of two simultaneous equations with the dichotomous dependent variable
in equation (1) being the only nonstandard feature (Maddala (1983), pp. 244-245). However,

6
universal coverage is not a feature of the marketplace, and so we observe analyst behavior � and its
effect on lead underwriter choice � only if bank j covers firm i�s stock at time t. Moreover, the selection
criterion leading to this sample truncation is likely nonrandom: Given resource scarcity, it is plausible,
and indeed likely, that bank research directors are strategic in their coverage decisions. We address this
�selectivity� problem by modeling the coverage decision explicitly as
Pr(bank j covers firm i at time t) = fC(XC), (3)
where XC is a matrix of explanatory variables that control for the strength of the bank�s relationship with
the issuer, the bank�s reputation, and various characteristics of the issuing firm that might attract
coverage. Commercial banks were relatively late entrants to the equity markets and generally provided
less equity research during the sample period. Thus, we allow their coverage decision criteria to differ
from those of investment banks.
B. Econometric Structure of the Model
If bank j�s analyst covers firm i, we observe both the probability model for winning the underwriting
mandate in equation (1) and the analyst behavior model in equation (2). Otherwise, we do not observe (2)
and instead observe only a modified form of (1) that relates the probability of winning the underwriting
mandate to the explanatory variables XL but not to analyst behavior. Suppressing subscripts for i, j, and t,
the econometric model is
Coverage case:
0 if ** >
++=+=
CLALLLL
AAAA yuyy
uyδβ
βXX
(4)
No-coverage case:
0 if
0 ** ≤
+==
CLNCLLNCL
A yuy
yXβ
, (5)
where stars indicate unobserved latent variables whose realizations are observed as binary outcomes.

7
Specifically, *Ly is a latent variable measuring the propensity of issuer i to hire bank j as lead
underwriter, observed as 1=Ly if 0* >Ly and 0=Ly if 0* ≤Ly , and *Cy is a latent variable measuring
bank j�s propensity to cover firm i�s stock at time t, which we observe with realizations
.00
01*
*
≤=>+==
CC
CCCCC
yifyuyify Xβ
(6)
The variable Ay is a continuous, observed variable measuring analyst behavior, and uk (k = L, A, C, LNC)
are error terms whose distributions are described shortly.
Although the XL matrix in the two lead-bank equations in (4) and (5) remains the same, we do not
constrain the two coefficient vectors LNCL ββ and to be equal. This enables us to test the hypothesis that
in the absence of coverage and thus of strategic analyst behavior, variables such as prior relationships
have a significantly stronger effect on a bank�s probability of winning underwriting mandates.
C. Estimation
Equations (4)-(6) form a simultaneous equations system with endogenous switching (Maddala (1983),
Ch. 8 and especially sections 8.3, 8.6, and Model 1 on p. 241). The switching criterion is given in (6),
which determines whether we observe system (4) or (5). To account for the simultaneity problem,
estimation is carried out through the following two-step procedure. Consider first the coverage case
( 1=Cy ). In step 1, we estimate the determinants of analyst behavior in reduced-form, including all
variables in XA and XL. The model is recursive ( *Ly depends on Ay , but not vice versa), so it is not strictly
necessary to include XL when estimating the first-step equation.5 Since analyst behavior is observed only
when there is coverage, we account for the resulting selectivity problem, under which ordinary least
squares (OLS) yields biased and inconsistent coefficient estimates, by estimating first-step coefficients
using the maximum likelihood (MLE) version of Heckman�s (1979) sample selection correction based on
equation (6).
Step 2 estimates the determinants of a given bank winning a given underwriting mandate,
8
replacing the analyst behavior variable Ay with the fitted value Ay� from step 1. Again, we account
for selectivity (truncation) by adjusting the probit likelihood function for truncation bias,
0)1|( ≠=CL yuE (see Van de Ven and Van Pragg (1981) for the derivation of the joint likelihood
function). If the estimates from step 1 are consistent and the equation system is identified, the second step
yields consistent estimates ( LL δβ �,� ). Identification will be discussed in Section III.B. Since step 2
involves a generated regressor, Ay� , which is estimated with sampling error, the second-step covariance
matrix is not consistent. Consistent standard errors are obtained using the procedure derived in Murphy
and Topel (1985, Section 5).
In the absence of coverage, 0=Ay , and so we simply estimate a single-equation probit model of
system (5), again corrected for selectivity (truncation) since 0)0|( ≠=CLNC yuE .
Finally, because our unit of observation is a securities transaction, the model for the probability of a
given bank winning an underwriting mandate conditions on information for both the winning bank (or, for
co-leads, banks) and the banks that unsuccessfully competed for the mandate. Thus, for each transaction,
we construct a data panel containing conditioning information for both winning and nonwinning banks.
Estimation is made feasible by restricting the set of nonwinning banks to those that were most �active�
over the period as defined in the next section.
II. Data
A. The Sample of Securities Offerings
Between January 1, 1988 and June 30, 2002, Thomson Financial�s Securities Data Corporation reports
36,173 debt and equity offerings, after excluding transactions by firms classified as SIC 6000-6999
(financial institutions, etc.) and SIC 9000-9999 (government agencies, etc.).6 The transactions or �deals�
range from IPOs to offerings by seasoned firms, and include both public and private offerings and firms.
We use the full sample period to generate a variety of variables, including prior relationships between
issuers and banks. The distribution of different types of offerings is reported in Table I. Public
9
common stock offerings, public nonconvertible debt, and private nonconvertible debt each account
for around one-third of the number of sample transactions but public debt dominates in dollar terms.7
INSERT TABLE I ABOUT HERE
Many issuers are related, so we form �corporate families� on the basis of SDC�s �ultimate parent
CUSIP� identifier and account for prior relationships between a given bank and any member of a
corporate family. For example, AT&T Corp is the parent of AT&T Wireless, Lucent Technologies,
Teligent, etc. Transactions involving any of these �subsidiaries� are grouped under AT&T. When Lucent
went public in 1996, we condition the probability of a bank receiving the mandate on the strength of its
relationship with the AT&T family in the prior T years. The 36,173 deals in 1988 through 2002 involve
15,306 unique firms reflecting 12,470 unique corporate families.
The estimation period for the econometric model is restricted to December 1, 1993 through June 30,
2002, because I/B/E/S tracks analyst recommendations only from Q4 1993. We further exclude a) any
family of issuers that never hired one of our sample banks (see below) as a lead manager between 1988
and June 2002, and b) purely foreign families of issuers. The first restriction eliminates small deals
managed by small banks. Presumably, our (mostly large) sample banks did not compete for these deals.
The second restriction keeps the data collection manageable. This leaves an estimation-period sample of
16,625 transactions, shown in the final two columns of Table I, involving 6,821 unique firms and 5,472
unique corporate families.
B. Sample Underwriters
Estimating a bank�s probability of winning the underwriting mandate for a particular offering requires
data for both the winning bank and its competitors. We focus on the 16 most active debt and equity lead
(or joint lead) underwriters, measured by the nominal proceeds from deals completed during the 2000 to
2002 period.8 We treat each bank as a potential competitor for each deal in the estimation period

10
(subject to regulatory constraints described below). Many of the sample banks are the product of
mergers (or demergers) and acquisitions during the sample period (see Figure 1). The predecessors of the
16 sample banks also are treated as potential competitors for a deal prior to joining forces with one of the
final 16. For example, from the perspective of 1988, there were up to 41 independent sample banks in
potential competition for each deal.
INSERT FIGURE 1 ABOUT HERE
Table II reports summary statistics for the 16 sample banks (and their predecessors). We compute
bank market shares from 1988 to 2002 by allocating to each bank the proceeds underwritten by its
predecessor banks. For example, the $323 billion in total capital underwritten assigned to JP Morgan
Chase includes the underwriting mandates granted to JP Morgan, Chase, Chemical Bank, Hambrecht &
Quist, and Manufacturers Hanover during the sample period. The top five underwriters (Credit Suisse
First Boston, Goldman Sachs, Merrill Lynch, Morgan Stanley, and Salomon Smith Barney) each held at
least an 11% market share in the debt and equity markets, accounting in aggregate for 63.5% of the dollar
amount of capital raised during the sample period.
INSERT TABLE II ABOUT HERE
Together, the 16 sample banks and their predecessors underwrote $1,181 billion in equity and $2,524
billion in debt (in nominal terms) over the sample period � more than 90% of underwriting activity in
either market. Their combined market share ranged from 80.7% in 1988 to 96.4% in 1990, falling below
90% only twice, in 1988 and 1989. Excluding other banks therefore results in little loss of data but
achieves significant economies in coding banking relationships and in the probability model estimation.
The sample includes commercial banks whose ability to compete for public offers historically was

11
restricted by the Glass-Steagall Act. We account for this by treating a commercial bank as capable
of competing for a public offering mandate prior to the repeal of the Glass-Steagall Act only if it had a so-
called Section 20 subsidiary with Tier II securities underwriting authority granted by the Federal Reserve
Board.9 Figure 1 documents the dates on which sample commercial banks received such approval. Tier II
authority was not required for private offers, so we treat every sample bank as being in competition for
every private deal. On average, 24.3 banks competed for a given deal.
Recall that we exclude from the sample issuers or families that never hired one of our sample banks as
lead manager between 1988 and June 2002. Among the remaining 16,625 mandates, nonsample banks
won 2,204 mandates. Thus, nonsample banks enter the sample when they won a deal, but they are not
treated as competitors for mandates that they did not win.
C. Prior Investment Banking Relationships
The lag between the 1988 beginning-of-the-sample period and the 1993 beginning-of-the-estimation
period provides at least five years of prior data for measuring investment banking relationships. Our main
proxy for the strength of an issuer�s relationship with a particular bank is the bank�s share of the client�s
previous mandates, coded as follows: For firm i at time t, we determine whether the issuer (or any
member of its corporate family) extended an underwriting mandate to bank j or any of j�s predecessors
(but not j�s successors); if so, we accumulate the proceeds from the deals that bank j managed for firm i in
the preceding T=1�5 years, and divide by the total raised by the firm to reduce the impact of differences
in scale across firms. This measure ranges from zero (no relationship) to one (when the issuer maintained
an exclusive banking relationship). It is computed separately for debt and equity deals, and for any sample
bank that was a potential competitor for the mandate at time t.
Implementation of the algorithm is complex in cases involving one or more acquisitions. Bank of
America (BoA), easily the most complicated in the sample, illustrates the point. In October 1997, BoA
acquired Robertson Stephens and, from our perspective, inherited Robertson Stephens� history of
relationships with a particular firm i. Their joint history then conditions the probability of BoA

12
winning any future mandate of firm i. In June 1998, Robertson Stephens was sold to BankBoston
(which was acquired by Fleet in 1999) in advance of BoA�s September 1998 merger with NationsBanc.
From this point forward, the mandate history of Robertson Stephens, including those received while
owned by BoA, belongs to BankBoston (and then Fleet). But we also assume that the probability of BoA
receiving a future mandate is conditional on the Robertson Stephens mandate history up to the time it was
sold to BankBoston. This element of �double-counting� reflects our inability to trace precisely the extent
to which relationships remain exclusive to Robertson Stephens.10
Table III provides summary statistics for our relationship proxy at the maximum five-year horizon
used in the econometric model. (The econometric results are somewhat stronger under shorter horizons,
indicating greater influence from more �recent� relationships. Our conclusions are qualitatively
insensitive to the horizon specification.) Results are reported separately for debt and equity transactions,
and are partitioned by whether or not the bank won the underwriting mandate and whether or not it
provided research coverage for the issuer at the time of the deal in question. Banks providing research
coverage that won equity mandates underwrote on average 46.1% of the issuer�s equity proceeds raised
during the prior five years. The strength of underwriting relationships appears less important among debt
offerings as evidenced by the 25.9% share of debt proceeds underwritten by the average winner of an
issuer�s debt mandate. In general, winners of a mandate in a particular market (debt or equity) had
stronger relationships with the issuer on both debt and equity dimensions.
INSERT TABLE III ABOUT HERE
D. “Paying to Play”
From the late 1980s the largest commercial banks bought or built first debt and then equity
underwriting capacity in Section 20 subsidiaries. Throughout the early- and mid-1990s, the securities
industry criticized commercial banks for using government-insured deposits to subsidize bids for

13
underwriting mandates with offers of low-margin lending facilities. By 2001, �paying to play�
became commonplace as issuers in both the public debt and equity markets demanded credit lines from
banks bidding for underwriting business.
We control for this change in the competitive landscape by constructing a measure of prior lending
relationships similar to the underwriting relationship measures outlined in the previous section. Loan data
are derived from the Loan Pricing Corporation�s (LPC�s) DealScan database, excluding non-U.S.
borrowers and firms in SIC codes 6000-6999 (financial institutions, etc.) and 9000-9999 (government
agencies, etc.). LPC lists 15,273 borrowers between 1988 and June 2002 taking out 49,459 loan facilities
totaling $8 trillion. We hand-match 6,701 LPC borrowers by name (LPC�s principal firm identifier) to our
sample of SDC issuers. These account for 30,068 of the 49,459 loan facilities, or 60.79% by number and
79.92% by loan amount.11 In the case of syndicated loans, each bank acting in a leading role (i.e.,
�arranger�) is credited with the corresponding fraction of the loan.12
As Table III shows, the average winning bank had relatively weak lending relationships with equity
issuers, in sharp contrast to the importance of prior equity underwriting relationships. Winning banks
providing coverage arranged only 2.4% of the average equity issuer�s loans in the prior five years. Among
debt issuers, lending relationships are somewhat more concentrated, peaking at 7.6% among winning
banks not providing coverage. Not coincidentally, Table III confirms the well-known fact that commercial
banks enjoyed considerable success in the debt markets. Of course, prior lending relationships need not
proxy solely for �tied� loans. Yasuda (2003) shows that bond issuers that hire their lenders as their
underwriter obtain keener prices, suggesting that lenders have greater certification capacity. Schenone
(2003) finds similar evidence for IPO firms.
Commercial banks� larger balance sheets almost certainly provided greater capacity for sweetening
bids for underwriting mandates by including a loan. We compute each bank�s share of the corporate loan
market in the calendar year before the deal in question, based on loans arranged, as a proxy for their
capacity to sweeten their bids or tie lending to capital market transactions. Descriptive statistics are

14
reported in Table III. Whether or not they provided coverage, large lenders more often failed in the
competition for equity deals while succeeding in competition for debt mandates.
E. Supplemental Relationship Measures
The sample period witnessed a high frequency of bank consolidation and associated disruptions to
bank-issuer relationships. We therefore supplement the transactions-based relationship variables with
measures of banks holding equity stakes in potential issuers (which might cement relationships), key
banker movements (who might take relationships with them as they move to a new bank), and bank
mergers (which might cause issuers to reevaluate their investment banking relationships).
Ljungqvist and Wilhelm (2003) document a sharp rise from 18.2% in 1996 to 44% in 2000 in the
frequency of banks having equity stakes in firms whose IPOs they underwrite. We measure whether this
means of cementing a banking relationship was part of a broader trend by merging our sample of issuers
with the Spectrum 13f data on equity stakes held by financial institutions. For each deal, we check
whether any sample bank active at that time reported an equity holding in the issuer or its corporate parent
as of the quarter-end prior to the deal.13 Table III indicates a generally high frequency of equity stakes
among banks winning underwriting mandates. The exception involves equity transactions prior to which
the bank did not provide research coverage. This segment of the sample is dominated by commercial
banks that for most of the period were prevented by regulation from holding equity stakes in their clients.
The high degree of mobility among investment bankers creates potential for relationship shocks not
captured by transaction-based measures of prior relationships. In general, both theory and casual evidence
suggest that client relationships are embodied, perhaps in large part, in individual bankers. 14 Thus, their
moves should influence the probability of receiving a mandate faced by both the firm they join and the
one from which they defected. We control for this effect by tracking the movement of key bankers or
teams of bankers during each quarter in the estimation period. We search electronically through the major
business periodicals covered by Lexis/Nexis and Proquest to identify individuals or teams who most likely
played key roles in developing and maintaining client relationships. The bulk of the sample comes

15
from Investment Dealers’ Digest, which provides weekly reports of the movements of high profile
bankers. In general, we focus on movements by bankers at the rank of managing director (or its
equivalent) and above, except in cases in which a less senior banker is part of a team or small group of
bankers switching firms. We classify key bankers as equity or debt specialists. The latter classification is
more precise in the sense that debt specialists are more typically identified clearly as such. In general,
M&A professionals are classified as equity specialists. We exclude cases involving prominent traders,
foreign exchange, mortgage-backed securities, and derivatives professionals as well as senior bankers
primarily involved in management functions. We also exclude professionals whose primary
responsibilities fell outside North America. This search yields a sample of 169 records.15
In many instances, reported defections probably understate the potential damage to client
relationships. Most bank acquisitions were followed by a substantial degree of movement, although not
necessarily at the most senior level, where completion of the deal may have depended on bankers signing
commitments preventing them from joining competitors for a fixed period. To avoid not detecting what
may be a substantial reordering of banking relationships, we code whether the bank was involved in a
merger during the quarter before the sample transaction took place.
F. Bank Reputation
We use prior-year debt and equity market shares to proxy for a bank�s reputation for success in
securities underwriting (Megginson and Weiss (1991)). Among the summary statistics reported in Table
III, two patterns stand out. First, banks that win underwriting mandates are more reputable as evidenced
by their higher market shares. Second, this is true whether or not the bank provides research coverage.
The differences are particularly large for debt transactions.
G. Analyst Behavior
We measure analyst behavior using data from the I/B/E/S �recommendations� database. I/B/E/S
tracks analyst recommendations from October 1993, covering roughly 10,000 firms, 8,000 analysts, and
500 banks. Sample firms are matched to I/B/E/S using the corporate parent�s CUSIP if possible and

16
the issuing firm�s CUSIP otherwise. Using this algorithm, 3,499 of the 6,821 sample companies and
2,586 of the 5,472 unique corporate families match firms covered in I/B/E/S. Some matches do not
correspond with analyst coverage provided by a sample bank. Among the 16,625 sample deals, 10,787
involve issuers covered by at least one sample bank prior to the deal. Issuers that do not appear in I/B/E/S
around their deal dates are treated as not receiving coverage from a sample bank.
Table IV provides descriptive statistics for the deals and issuing firms, according to whether or not
they received coverage. For both equity and debt deals, firms receiving research coverage from sample
banks are significantly larger (as measured by deal size), more frequent and substantial issuers of
securities (as evidenced by their deal histories), more mature (as measured by the time from their IPO),
and more frequently exchange-listed. Firms are also more likely to receive research coverage when the
bank�s analysts already provided broad coverage for the issuer�s industry (measured by the fraction of
firms in the issuer�s Fama-French (1997) industry grouping the bank covered over the three-year window
ending in the year of the deal in question).
INSERT TABLE IV ABOUT HERE
I/B/E/S codes recommendations from 1 (strong buy) to 5 (sell).16 We reverse the ordering so that larger
numbers indicate more positive recommendations. New, reiterated, or changed recommendations arrive
and are recorded by I/B/E/S irregularly and, compared to earnings forecasts, relatively infrequently. Thus,
the most recent recommendation for a given firm by a given bank will not necessarily correspond in time
with the most recent recommendation from a competing bank. We resolve the time-matching problem by
focusing on recommendations recorded in the 730 days prior to a transaction date. This balances concerns
that recommendations by competing banks are relatively close in time with concerns that a narrow
window potentially eliminates relevant recommendations. Our results are robust to using a one-year
window instead. The average (median) recommendation associated with a particular securities
17
offering was recorded 270 (229) days before the transaction date.
We construct two proxies for analyst behavior. The first measures bank j�s recommendation level
relative to consensus (measured as the median recommendation of all other banks covering firm i in the
730-day window before i�s deal).17 By construction, relative recommendations lie between �4 and + 4.
Positive values correspond to relatively optimistic recommendations.
Recent allegations center not on the level of recommendations but on aggressive upgrades prior to the
award of an underwriting mandate. We measure relative recommendation upgrades by calculating for
each bank the change between its two most recent recommendations. We require the latest
recommendation to be within 275 days (nine months) of the deal date and the penultimate
recommendation to be no older than two years.18 The relative upgrade is then defined as a bank�s
recommendation change for firm i less the median change for other banks. Relative upgrades lie between
�8 and +8, with positive values representing relatively aggressive upgrades.
The relative upgrade measure has two potential shortcomings. It is zero for the majority of firms, and
thus exhibits less variance than do relative recommendations. Moreover, a bank can provide a relative
upgrade but still be relatively less optimistic than another bank identified as providing no upgrade. For
example, Goldman�s analyst might have rated IBM as a �5� (strong buy) and not altered her opinion
before the deal date, while Bear Stearns� analyst might have upgraded IBM from �2� to �3.� Bear Stearns
would be considered to have upgraded the stock more aggressively than Goldman, even though
Goldman�s analyst held a higher recommendation level which could not be increased further. We account
for this in our relative upgrade models by including a dummy equaling one if the next-to-last
recommendation was already a �strong buy,� so that a further upgrade would have been impossible.19 In
summary, the relative upgrade measure emphasizes whether the analyst changed her opinion while the
relative recommendation measure focuses on the (relative) strength of the analyst�s opinion.
Table V shows that by either measure, analysts at winning banks were more aggressive in their
recommendations, especially prior to debt deals. These results extend the findings of Michaely and
18
Womack (1999) and Bradley, Jordan, and Ritter (2003) who show that after underwriting an IPO,
underwriter-affiliated analysts are relatively more optimistic. However, the differences between the
unconditional means are economically small, and there is no difference between the medians.
INSERT TABLE V ABOUT HERE
Table V also summarizes three controls for reputation-related career concerns. The first is based on
buy-side evaluations reflected in the annual Institutional Investor analyst rankings. We match these
rankings to I/B/E/S records by analyst name. For a deal at time t, we define a dummy to equal one if bank
j�s analyst covering the stock was an all-star (i.e., ranked as a top-three or runner-up analyst in her
industry) just prior to making the recommendation. Among equity (debt) deals, 32.7% (41.4%) of
winning banks have an all-star analyst covering the issuer versus only 26.3% (34.1%) for losing banks.
Second, assuming analyst reputation derives, at least in part, from forecasting ability, we measure forecast
accuracy as in Hong and Kubik (2003). Finally, we measure the analyst�s seniority as the number of years
since she first appeared in the I/B/E/S earnings database. Hong, Kubik, and Solomon (2000) find that
analysts are less bold early in their careers. For both equity and debt deals, analysts at winning banks in
our sample are significantly more senior on average, though only by a few months.
III. Estimation Results
We report the estimation results in three steps. Section III.A provides a brief summary of the results
from estimating the switching criterion given in the coverage equation (6), which determines whether we
observe system (4) or system (5). As outlined earlier, in the presence of coverage, we use a two-step
procedure to estimate system (4). Step 1 estimates the determinants of analyst behavior adjusted for
selectivity due to noncoverage. The identification strategy is outlined in Section III.B and the results for
step 1 are reported in Section III.C. Step 2 models the probability of winning the underwriting mandate as
a function of the fitted values of analyst behavior obtained in step 1, again adjusted for selectivity. In

19
the absence of coverage, analyst behavior is unobserved and we estimate system (5) as a single-
equation model with truncation. The results for these underwriting mandate probability models are
reported in Section III.D.
A. The Bank Coverage Model
Table VI reports results of �stand-alone� probit models of the likelihood that an analyst working for
bank j covers issuer i�s stock ahead of a deal at time t (equation (6)), estimated separately for equity and
debt transactions.20 We relate the coverage decision to the strength of the bank�s relationship with the
issuer, the bank�s market share, the breadth of the bank�s coverage of the issuer�s Fama-French industry,
and various characteristics of the issuer that might attract coverage. Each of these explanatory variables is
interacted with a dummy variable equal to one for commercial banks, to allow for differences in the
coverage decision criteria between commercial and investment banks.
INSERT TABLE VI ABOUT HERE
The explanatory power for both the equity and debt models is substantial as evidenced by the pseudo-
R2 exceeding 33% in each case. Consistent with the univariate results shown in Tables III and IV, we find
that a firm�s stock is more likely to be covered prior to a capital market transaction, the stronger the
relationships between bank and issuer, when the bank�s analyst already covers a large fraction of the
issuer�s sector, and for domestic and exchange-listed firms. For firms about to raise equity, coverage is
more likely the more mature they are (measured in log years since the initial public offering of equity),
the larger their fee-generating capacity (measured by the size of the fee on the deal relative to the bank�s
prior-year underwriting fee income and the log of the issuer�s equity proceeds raised during the previous
five years), and the larger the bank�s equity market share. In most cases, the magnitude of these effects is
smaller for commercial banks, which, all else equal, were less likely to provide coverage.
In sum, the research coverage models reveal that the coverage decision was heavily influenced by

20
variables associated with the strength of a bank�s relationship with the issuing firm and the issuing
firm�s capacity for sustaining such relationships via fee-generating transactions. Commercial banks were
latecomers to the provision of research by virtue of Glass-Steagall restrictions on their participation in
securities markets.
B. Identification and Instrument Strength
Before discussing the analyst behavior and lead-bank results, we outline our identification strategy.
Identification requires that the analyst behavior equation include one or more variables not included in the
lead bank equation. As is typical in structural estimation, we identify the system using a priori exclusion
restrictions on the parameter vector, designed to satisfy the rank and order conditions that are necessary
and sufficient for identification. Our selection of instruments is guided by economic considerations.
Specifically, we propose a set of instruments that likely affect analyst behavior but for which there is no
obvious a priori case that they should affect an issuer�s choice of lead manager.
As outlined in Section I.A, controlling for prior underwriting relationships, the analyst behavior
equation principally models two forces bearing on the recommendation decision, namely, the analyst�s
career concerns (which we interpret as the cost of jeopardizing the analyst�s reputation) and the amount of
pressure the bank puts on the analyst to bias her recommendation. Because the term �pressure� includes
economic incentives, we interpret these variables as the benefit potentially accruing to the analyst in
return for biasing her recommendation.
Our three proxies for career concerns � the analyst�s Institutional Investor ranking, seniority, and
relative forecast accuracy � might conceivably influence the issuer�s choice of underwriter. This would be
the case if issuers chose underwriters in part on the basis of the prestige, seniority, and accuracy of the
analyst. Therefore, our controls for career concerns are not good instruments a priori, and so are included
in both equations.
Our proxies for bank pressure, on the other hand, are not obviously related to underwriter choice a
priori. We use a set of five bank pressure proxies as instruments. The ideal instrument would be the

21
bonuses promised to research analysts in return for inflated recommendations, but such data are not
publicly available. Nonetheless, it stands to reason that the size of the bonus pool increases with the
bank�s expected underwriting profits. Our first instrument is hence the underwriting fee earned by the
winning bank on the deal in question relative to each bank�s total prior-year underwriting fee income.21,22
Presumably, banks put more pressure on their analysts when competing for deals that are large relative to
their normal underwriting revenue.
Our second instrument captures the idea that more active issuers have greater fee potential and thus
attract more competition. We proxy for future issuer activity using the issuer�s deal history, measured as
the cumulative proceeds over the prior five years. Note that unlike our first instrument, deal history varies
only across issuers and not across banks competing for a given deal. Thus, this variable is designed to
capture cross-sectional variation in how aggressive analysts as a group are ahead of a given deal.
Third, we argue that a �loyal� client base enables a bank to compete less fiercely and thus have less
need to pressure its analysts to win underwriting mandates. We follow Ellis, Michaely, and O�Hara
(2004) by constructing a loyalty index which for each bank measures how often it retains its clients in
consecutive deals, divided by the number of clients.23 The large commercial banks, for example, have
loyalty indices of around 0.7 in the debt markets, meaning that they retain around 70% of their clients
from deal to deal. The loyalty index varies across time and banks, but not across issuers.
Finally, we control for time-variation in the size of the potential pool of �side payments� bankers
might use to gain analyst cooperation. We proxy for this using the percentage difference in market-wide
proceeds raised during the current quarter and a five-year quarterly moving average, and interact it with
the bank�s lagged overall market share.24 This proxy captures �hot� markets such as the one in the late
1990s, during which the rewards for aggressive analyst behavior may have been especially large. Like the
loyalty index, these variables vary across time and banks, but not across issuers.
Economically, bank pressure should influence analyst behavior, but there is no obvious a priori reason
to expect issuers to choose underwriters on the basis of these five proxies. This is clearly true for an
22
issuer�s five-year deal history, as it does not vary across banks. Similarly, it is hard to see why an
issuer would base its choice of underwriter on how much its transaction will increase the bank�s fee pool,
or on the average loyalty of the bank�s client base. Indeed, Baker (1990) shows that issuers differ widely
in their preferences over loyalty.
Staiger and Stock (1997) show that having valid instruments is not sufficient to ensure unbiased two-
stage estimators in finite samples. The instruments also have to be �strong� in the sense that they correlate
strongly with the endogenous first-stage variable. Staiger and Stock recommend a critical value of 10 in
an F-test for the joint significance of the instruments in the first stage. The F-statistics, shown in Table
VII, suggest our instruments are strong in all models except the relative recommendation specification in
the equity sample. There, the bank pressure proxies are jointly significant in the first stage (p < 0.001) but
the F-statistic of 5.2 indicates that they are weak instruments. This has two consequences: The two-step
estimator in the equity sample may not improve on a one-step estimator that treats relative
recommendations as exogenous; and, the second-step standard errors for this specification may be
imprecise because the Murphy-Topel correction is partly based on the first-step covariance matrix.
INSERT TABLE VII ABOUT HERE
C. The Analyst Behavior Models
Table VII presents estimation results for the analyst behavior model (2) in structural form, for each of
the two proxies for analyst behavior. The models are estimated separately for debt and equity deals, and
conditioned on the coverage decision using joint MLE. The relative upgrade specifications include a
dummy variable equaling one if the penultimate recommendation was already a strong buy, ruling out a
further upgrade (the coefficients, which are significantly negative as expected, are not reported).25
Consistent with prior evidence regarding IPO underwriters, analysts are relatively more aggressive
when their bank has a strong relationship with the issuer. Specifically, relative recommendations are

23
more aggressive the greater the bank�s shares of the issuer�s past debt and equity proceeds or
commercial loans, and among banks with equity stakes in the issuing firm. The effects are present in both
equity and debt transactions and generally are highly statistically significant (see columns 1 and 3).26
The relative upgrade proxy reflects recent changes in analyst recommendations. As such, it more
nearly captures the idea that banks pressured analysts to position their recommendations to help the bank
compete for a specific deal. If banks less closely aligned with the issuer compete for deal flow with more
aggressive upgrades, we should observe an attenuation of the positive relation between analyst behavior
and the bank-issuer relationship proxies observed in the relative recommendation model. This appears to
be the case. For the debt deals shown in column 4, the coefficients associated with the bank�s debt
underwriting and lending relationships are significantly smaller than in the relative recommendations
specification. For the equity deals in column 2, the debt underwriting and lending relationship variables
cease to be significant at conventional levels, while the coefficient for equity underwriting relationships
turns significantly negative: Underwriters with strong equity ties upgrade their recommendations less
aggressively ahead of their clients� equity deals. This may anyway be unnecessary, as their
recommendations are already relatively more aggressive.
A strong reputation in the equity market provides a countervailing force to aggressive behavior: Banks
with large equity market shares are associated with significantly less aggressive relative recommendations
ahead of debt deals. In contrast, large debt market and loan market shares are associated with more
aggressive behavior, especially for the debt sample.
In reconciling these apparently conflicting effects, it is useful to recall that equity transactions likely
suffer more under the burden of informational frictions and so the intermediary�s reputation has a more
prominent role in certifying issuer quality. One should therefore expect that banks with strong reputations
in the equity markets would be less inclined to liquidate reputation capital via overly aggressive behavior
in either market. On the other hand, during the estimation period commercial banks gained substantial
market share in the debt markets (in part, entering via the corporate loan market), where an
24
intermediary�s reputation poses a weaker barrier to entry. Their gains came largely at the expense of
lower-ranked investment banks. Measuring reputation on the basis of a bank�s standing in the equity
market, less reputable banks (both commercial and investment) faced weaker countervailing forces to
their incentive to compete for debt mandates via more aggressive analyst behavior, other things equal.
Relative upgrades are less aggressive among all-star analysts suggesting that career concerns moderate
analysts� incentives to bend to investment bankers� demands. The moderating effect of all-star status is
reversed during the 1999 to 2000 period often associated with the �dot-com bubble� when the potential
rewards for sacrificing one�s reputation might have been greater. More accurate forecasting ability and
greater analyst seniority are associated with more aggressive behavior in each debt specification, with
much weaker evidence in the equity specifications. Thus, reputation concerns appear to have carried less
force for tempering aggressive behavior among analysts prior to debt offerings. This is consistent with the
debt markets being the point of entry for commercial banks and non-bulge-bracket investment banks (i.e.,
those with small equity market shares) responding to competitive pressure in this market segment by
liquidating reputation capital.
Our proxies for bank pressure behave as expected. Analysts are consistently more aggressive ahead of
deals carrying fees that are large relative to their bank�s prior-year fee income. Similarly, more active
issuers attract more aggressive recommendations and upgrades, consistent with analysts being pressured
more when more potential fee income is at stake. Analysts employed at banks whose clients are more
loyal issue less aggressive recommendations and upgrades, while an increase in market-wide issuance
activity relative to trend is associated with more aggressive behavior.
D. The Determinants of the Probability of Winning an Underwriting Mandate
Having estimated the bank coverage and analyst behavior equations, we now condition the probability
of a bank winning an underwriting mandate on its potentially strategic decision regarding whether to
cover the issuing firm, and if so, on its analyst�s behavior.
Equity Transactions
25
Table VIII summarizes the results from estimating the underwriting mandate model for equity
transactions. Conditional on a bank providing research coverage, there are two specifications in the table,
one for each measure of analyst behavior. These correspond to system (4) in Section I. In addition, we
estimate the likelihood of winning a deal in the absence of coverage (i.e., system (5)).
INSERT TABLE VIII ABOUT HERE
Strikingly, among equity deals, aggressive relative upgrades reduce a bank�s chances of winning an
underwriting mandate (p = 0.001). This finding runs counter to the spirit of previous research and the
arguments embodied in recent allegations.27 Interpreting aggressive upgrades as liquidation of reputation
capital, this strategy appears ineffective in the case of equity offerings in which reputation is viewed as
more central to successful placement: Banks pressed to compete on this dimension fought a losing battle.
The coefficient estimated for the relative recommendation measure, though not significant, also is not
positive. Recall, however, that our instruments for this specification are weak, which may bias the
Murphy-Topel standard errors upwards and possibly causes the two-step estimator to fail to improve on a
simple one-step estimator treating relative recommendations as exogenous. In other words, in the absence
of stronger instruments, it is unclear what effect aggressive recommendations have on a bank�s likelihood
of winning an equity mandate.
If aggressive analyst behavior does not attract equity mandates, what does? The strength of the bank-
issuer relationship (measured as the bank�s shares of the issuer�s prior equity or debt issuance and
borrowing) strongly increases the likelihood of the bank winning the issuer�s current underwriting
mandate. Judging from the magnitude of the coefficients,28 relationships derived from prior equity deals
influence the choice of equity underwriter more than those based on prior debt deals. The fact that lending
relationships help win equity mandates is consistent with allegations that commercial banks attempted to
tie lending capacity to securities underwriting.29
26
The coefficients for the bank�s market share in the prior year suggest that a strong reputation in
the equity market at large increases the likelihood of winning a mandate, regardless of whether the bank
provides coverage for the issuing firm. By contrast, a strong position in the debt markets has no bearing
on competition for equity deals. We interpret this as evidence of a degree of bank specialization in either
debt or equity. Large lenders � effectively, commercial banks � were less likely to win equity mandates.
Thus, while having a lending relationship helps, just being a large lender does not.
Mergers among banks and movements of key bankers have little effect on the likelihood of winning
an equity mandate, except in the absence of coverage, where merging with another bank or hiring bankers
from another bank increased, and losing bankers decreased, the chances of winning an equity mandate.
Finally, having an all-star or a more senior analyst provide research coverage for the issuing firm
significantly increases a bank�s likelihood of winning an equity mandate.
Debt Transactions
The results for debt transactions mirror those for equity deals. Table IX reveals that more aggressive
stock recommendation upgrades significantly decreased the likelihood of winning debt underwriting
mandates (p = 0.024), while aggressive recommendation levels also did not help a bank�s chances of
winning a debt mandate (p = 0.014).
INSERT TABLE IX ABOUT HERE
As with equity deals, prior relationships strongly influence an issuer�s choice of debt underwriter.
This is true for both debt and equity underwriting relationships, though relationships derived from having
underwritten an issuer�s prior debt offerings are most effective. This is consistent with specialization and
mirrors the results for the equity sample. Lending relationships also help win debt mandates.
In the absence of coverage, and in contrast to the equity results, owning an equity stake in the issuing
firm had a significantly negative effect on the likelihood of winning debt mandates. Commercial
27
banks and non-bulge-bracket investment banks account for the bulk of the cases in which no
research coverage was provided. Commercial banks were prohibited from holding equity stakes during
the first half of the estimation period. Moreover, commercial banks gained substantial debt market share
largely at the expense of non-bulge-bracket investment banks (at least through 1998). Thus, we favor the
interpretation that in the absence of coverage, lending relationships dominated any positive relationship
effects associated with equity ownership. As a consequence, we observe a negative relation between bank
equity stakes (mostly held by investment banks) and the likelihood of winning a debt mandate in the
absence of coverage. Regardless of this interpretation, commercial banks appear to have gained leverage
in the debt markets via their lending capacity.
The coefficients associated with a bank�s debt and equity market share during the calendar year
preceding a transaction provide further evidence of bank specialization. Banks with larger debt market
shares were more likely to win subsequent debt mandates, similar to the direct effect of equity market
share on the likelihood of winning subsequent equity mandates. By contrast, banks with larger equity
market shares were less likely to win debt underwriting mandates, other things equal. (Recall that debt
market share had no effect on the likelihood of winning an equity mandate.) We conjecture that the
negative effect of equity market share in the present context reflects, at least in part, competitive pressure
from commercial banks. Commercial banks generally had modest equity market share during the sample
period but were rapidly gaining debt market share.
We also find that a larger share of the corporate loan market increased a bank�s probability of winning
debt underwriting mandates. This result is consistent with the argument that competitive pressure from the
�pay-to-play� movement initiated by commercial banks had its greatest impact in the debt markets. Both
the analyst behavior coefficients and the large gains in debt market share among commercial banks even
in the early part of the 1990s suggest that liquidation of reputation capital was not an effective
competitive response, at least not across the entire estimation period. In the next section, we examine
whether the effectiveness of this competitive strategy changed over time.
28
Mergers have a positive effect on winning debt mandates, though this is significant only in the
upgrade specification. Movements of key bankers, on the other hand, which often coincided with mergers,
have a more consistent effect: A bank�s chances of winning a mandate were higher when it had recently
poached debt professionals from other banks. This suggests that relationships are embodied in key people.
Interestingly, having an all-star analyst covering the issuer�s stock had a negative effect on whether
the analyst�s bank was awarded the debt underwriting mandate. This is consistent with commercial banks
� which employ fewer all-stars � successfully competing for debt deals. All else equal, however, issuers
were more likely to choose banks employing more senior and, to some extent, more accurate analysts.
Differences Across Time
We now examine whether the effectiveness of competing for underwriting mandates by means of
inflated analyst recommendations changed over time. To this end, we split the estimation period into 1993
through 1997 and 1998 through June 2002. The end of the first subperiod corresponds roughly with the de
facto repeal of the Glass-Steagall Act revealed by the approval of Citicorp�s acquisition of Salomon Smith
Barney in 1998. The beginning of the second subperiod coincides with the dot-com bubble, with which
allegations of analyst misbehavior primarily are associated. We estimate the full model discussed
previously but to conserve space, Table X suppresses all but the analyst-behavior coefficients. The
remainder of the model is quite stable across the subperiods and so we simply highlight instances in
which partitioning the data leads to qualitative changes in our interpretation of the results.
INSERT TABLE X ABOUT HERE
For the equity sample, we find no evidence that analyst behavior positively influenced the likelihood
of winning equity underwriting mandates, even after 1997.30 The main changes over time concern the
increasing importance of highly rated analysts and the (relatively) decreasing importance of prior lending
relationships (which go from being three times more effective than debt relationships and nearly as
29
effective as equity relationships to being the least important source of a bank�s relationship
benefits).
The picture is similar for debt deals in that we find no evidence that analyst behavior positively
influenced the likelihood of winning debt underwriting mandates. The counterproductive effect of
aggressive analyst behavior is, in fact, concentrated in the post-1997 period, when commercial banks had
established a dominant presence in debt underwriting. The negative signs estimated for both relative
recommendations and relative upgrades for that period suggest that incumbent (investment) banks
reacted, unsuccessfully, to competition from commercial banks by liquidating reputation capital.
There are three additional significant differences across the two time periods. In contrast to the equity
model, the presence of an all-star analyst � typically employed at an investment bank � reduced the
likelihood of winning debt mandates during the post-1997 period. Second, large lenders were significantly
less likely to win debt mandates pre-1997 but more likely in the post-1997 period. Both of these results
are indicative of the successful inroads commercial banks made into the debt markets. Third, holding an
equity stake in the issuer helped the bank win the mandate only in the pre-1998 period. A natural
interpretation of this finding is that by 1998, the easing of restrictions on holding equity stakes helped
level the playing field between investment banks and commercial banks.
Controlling for the Exclusivity of Relationships
It is possible that over our sample period, the majority of issuers maintained relatively exclusive
relationships that were not seriously open to competition. We explore whether this possibility influences
our findings by interacting the analyst behavior proxies with two measures of the likelihood that a
mandate truly is up for grabs.31
The first measure is a dummy for firms maintaining relatively weak underwriting relationships. For
each of the 5,908 equity deals and 10,717 debt deals in the sample, the dummy variable equals one if
during the prior five years no bank competing for the deal underwrote 25% or more of the issuer�s prior
equity or debt offerings, respectively. In other words, the issuer maintained relationships with at least

30
five banks. This measure classifies 59.2% of equity issuers and 31.8% of debt issuers as not
maintaining exclusive relationships. The second measure attempts to capture a firm�s �switching
propensity� by estimating probits (separately in the equity and debt samples) for generating the predicted
likelihood that a firm will hire a different bank than the one it used in its previous deal. The probits are
conditioned on the firm�s maturity (log years since IPO), the dummy for firms maintaining relatively
weak relationships, the log size of the current deal, and (for debt deals) a dummy for high-yield bond
offers. Firms are more likely to switch the more mature they are and if they have weaker relationships.
Equity issuers are more likely to switch the larger the current deal, while the reverse is true for debt
issuers. Issuers of high-yield bonds are more likely to switch underwriters.
The results using these interactions for the strength of the underwriting relationship are reported in
Panels B and C of Table X, respectively. As in the subperiod analysis, we report only the coefficients of
interest. In Panel B, more aggressive analyst behavior generally is associated with a significantly lower
likelihood of the bank winning the mandate when the issuer maintains relatively weak relationships.
Relatively aggressive recommendations ahead of equity or debt deals and aggressive upgrades ahead of
debt deals have a significantly detrimental effect on a bank�s chances of winning a mandate when the
issuer maintains weak relationships. The only exception involves aggressive upgrades ahead of equity
deals, where the negative effect on a bank�s chances of winning the mandate is neutralized in the presence
of a weak relationship.
Similar results obtain when we interact the analyst behavior variables with our measure of switching
propensity. The more prone an issuer is to switching underwriters, the less the bank benefits from
aggressive analyst behavior. The exception again is aggressive upgrades ahead of equity deals, which
neutralize the otherwise harmful effect of such behavior.
These results suggest that competing for mandates that were more likely to be up for grabs by
aggressively liquidating reputation capital was counterproductive. Presumably it was the more desperate
banks that resorted to such tactics.
31
IV. Conclusion
We examine 16,625 U.S. debt and equity offerings completed between December 1993 and June 2002
for evidence that sell-side analyst behavior influenced the issuer�s choice of bank to underwrite its
offering. This is precisely the motivation suggested by recent allegations that analysts misrepresented
their beliefs about potential issuers under pressure from investment bankers competing for underwriting
mandates. Our findings provide little support for this argument but, perhaps more importantly, they draw
attention to the complexity of the situation and some unique features of the sample period.32
Issuing recommendations that were aggressive relative to consensus had no beneficial effect on a
bank�s chances of winning either debt or equity underwriting mandates. In general, the state of bank-
issuer relationships and the bank�s reputation had far more influence over the outcome of competition for
mandates. Furthermore, aggressively upgrading the issuing company�s stock recommendation had, if
anything, a detrimental effect on the bank�s chances of winning.
Our findings may strike some readers as surprising if not implausible in the light of recent regulatory
investigations leading to the so called �global settlement� restricting the role of analysts in pitching for
investment banking business. However, there is a straightforward economic argument consistent with the
negative relation between aggressive analyst behavior and the likelihood of winning equity mandates.
Equity transactions are subject to significant information frictions that are best resolved by a credible
intermediary. If overly aggressive recommendations undermine credibility, they will compromise a
bank�s capacity for resolving information frictions. Realizing this, issuing companies choose banks that
refrain from biasing their research. Of course, this does not explain why some banks nevertheless pursued
such a strategy. It is possible that banks knew they stood little chance of being selected as lead manager in
the absence of a prior relationship with the issuer, but nevertheless pressured their analysts into making
aggressive recommendations in the hope of being included in the underwriting syndicate.
Theory also suggests that the information frictions that make credibility so important for equity
underwriting are less severe in debt offerings. Consistent with this, we find evidence that reputation

32
concerns carried less force for tempering aggressive behavior among analysts prior to debt offerings.
Both banks and individual analysts have incentives to build and preserve reputations for accuracy and
honesty in their research. We find evidence of this moderating force at work in the data. This should not
be surprising given the industry�s heavy dependence on reputation for carrying out underwriting functions
and the longstanding nature of the conflict of interest between investment banking and sell-side research.
In view of calls for heavier regulation or even separation of research from investment banking, one might
ask whether the fundamentals of securities underwriting have changed. We contend that preservation
rather than aggressive liquidation of reputation capital will more likely characterize equilibrium behavior
in the industry for the foreseeable future. It does not follow that our findings absolve analysts and their
banks from any alleged misconduct.

33
REFERENCES Abarbanell, Jeffrey S., 1991, Do analysts� earnings forecasts incorporate information in prior stock price changes? Journal of Accounting and Economics 14, 147�165. Anand, Bharat, and Alexander Galetovic, 2000, Information, non-excludability and financial market structure, Journal of Business 73, 357�402. Anand, Bharat, and Alexander Galetovic, 2002, Does competition kill relationships? Inside investment banking, Working paper, Harvard Business School. Baker, Wayne, 1990, Market networks and corporate behavior, American Journal of Sociology 96, 589�625. Boot, Arnoud, and Anjan V. Thakor, 2000, Can relationship banking survive competition? Journal of Finance 55, 679�713. Bradley, Daniel J., Bradford D. Jordan, and Jay R. Ritter, 2003, The quiet period goes out with a bang, Journal of Finance 58, 1�36. Bradshaw, Mark T., Scott A. Richardson, and Richard G. Sloan, 2003, Pump and dump: An empirical analysis of the relation between corporate financing activities and sell-side analyst research, Working paper, Harvard Business School. Brown, Phillip, George Foster, and Eric Noreen, 1985, Security Analyst Multi-Year Earnings Forecasts and the Capital Market (American Accounting Association, Sarasota, Fl.). Chemmanur, Thomas, and Paolo Fulghieri, 1994, Investment bank reputation, information production, and financial intermediation, Journal of Finance 49, 57�80. Chopra, Vijay K., 1998, Why so much error in analysts� earnings forecasts? Financial Analysts Journal 54, 30�37. Cliff, Michael T., and David J. Denis, 2003, Do IPO firms purchase analyst coverage with underpricing? Journal of Finance, forthcoming. Diamond, Douglas, 1991, Monitoring and reputation: The choice between bank loans and privately placed debt, Journal of Political Economy 99, 689�721. Dreman, David, and Michael Berry, 1995, Analyst forecasting errors and their implications for security analysis, Financial Analysts Journal 51, 30�42. Drucker, Steven, and Manju Puri, 2004, On the benefits of concurrent lending and underwriting, Journal of Finance, forthcoming. Ellis, Katrina, Roni Michaely, and Maureen O�Hara, 2004, Competition in investment banking: Proactive, reactive, or retaliatory? Working paper, Cornell University. Fama, Eugene, and Kenneth French, 1997, Industry costs of equity, Journal of Financial Economics 43, 153�194.
34
Fernando, Chitru S., Vladimir A. Gatchev, and Paul A. Spindt, 2003, Wanna dance? How firms and underwriters choose each other, Journal of Finance, forthcoming. Gande, Amar, Manju Puri, and Anthony Saunders, 1999, Bank entry, competition and the market for corporate securities underwriting, Journal of Financial Economics 54, 165�195. Gande, Amar, Manju Puri, Anthony Saunders, and Ingo Walter, 1997, Bank underwriting of debt securities: Modern evidence, Review of Financial Studies 10, 1175�1202. Graham, John, 1999, Herding among investment newsletters: Theory and evidence, Journal of Finance 54, 237�268. Grinblatt, Mark, and Sheridan Titman, 1998, Financial Markets and Corporate Strategy (Irwin/McGraw-Hill, Boston). Heckman, James J., 1979, Sample selection bias as a specification error, Econometrica 47, 153�162. Hong, Harrison, and Jeffrey D. Kubik, 2003, Analyzing the analysts: Career concerns and biased earnings forecasts, Journal of Finance 58, 313�351. Hong, Harrison, Jeffrey D. Kubik, and Amit Solomon, 2000, Security analysts� career concerns and the herding of earnings forecasts, RAND Journal of Economics 31, 121�144. James, Christopher M., 1992, Relationship-specific assets and the pricing of underwriter services, Journal of Finance 47, 1865�1885. Kroszner, Randall S., and Raghuram G. Rajan, 1994, Is the Glass-Steagall Act justified? A study of the U.S. experience with universal banking before 1933, American Economic Review 84, 810�832. Lin, Hsiou-wei, and Maureen F. McNichols, 1998, Underwriting relationships, analysts� earnings forecasts and investment recommendations, Journal of Accounting and Economics 25, 101�127. Livingston Miles B., and Robert Miller, 2000, Investment banker reputation and the underwriting of non-convertible debt, Financial Management 29, 21�34. Ljungqvist, Alexander, and William J. Wilhelm, 2003, IPO pricing in the dot-com bubble, Journal of Finance 58, 723�752. Maddala, G.S., 1983, Limited-Dependent and Qualitative Variables in Econometrics (Cambridge, Cambridge University Press). Megginson, William L., and Kathleen A. Weiss, 1991, Venture capitalist certification in initial public offerings, Journal of Finance 46, 879�903. Michaely, Roni, and Kent L. Womack, 1999, Conflict of interest and the credibility of underwriter analyst recommendations, Review of Financial Studies 12, 653�686. Murphy, Kevin M., and Robert H. Topel, 1985, Estimation and inference in two-step econometric models, Journal of Business and Economic Statistics 13, 370�379.

35
Myers, Stewart C., and Nicholas S. Majluf, 1984, Corporate financing and investment decisions when firms have information that investors do not have, Journal of Financial Economics 15, 187�221. Nachman, David C., and Thomas H. Noe, 1994, Optimal design of securities under asymmetric information, Review of Financial Studies 7, 1�45. Petersen, Mitchell A., and Raghuram G. Rajan, 1994, The benefits of lending relationships: Evidence from small business data, Journal of Finance 49, 3�37. Petersen, Mitchell A., and Raghuram G. Rajan, 1995, The effect of credit market competition on lending relationships, Quarterly Journal of Economics 110, 407�443. Roten, Ivan C., and Donald J. Mullineaux, 2002, Debt underwriting by commercial bank-affiliated firms and investment banks: More evidence, Journal of Banking and Finance 26, 689�718. Schenone, Carola, 2003, The effect of banking relationships on the firm�s IPO underpricing, Journal of Finance, forthcoming. Smith, Richard J., and Richard W. Blundell, 1986, An exogeneity test for a simultaneous equation Tobit model with an application to labor supply, Econometrica 54, 679�686. Staiger, Douglas, and James H. Stock, 1997, Instrumental variables regression with weak instruments, Econometrica 65, 557�586. Stickel, Scott E., 1990, Predicting individual analyst earnings forecasts, Journal of Accounting Research 28, 409�417. Van de Ven, W.P.M.M., and B.M.S. Van Pragg, 1981, The demand for deductibles in private health insurance: A probit model with sample selection, Journal of Econometrics 17, 229�252. Yasuda, Ayako, 2003, Do bank relationships affect the firm�s underwriter choice in the corporate-bond underwriting market? Journal of Finance, forthcoming.
36
Endnotes 1 There is a substantial literature on commercial bank lending relationships (e.g., Boot and Thakor (2000),
Diamond (1991), Petersen and Rajan (1994, 1995)). There is much less theory to guide an empirical
analysis of investment banking relationships (however, see Anand and Galetovic (2002) and Fernando,
Gatchev, and Spindt (2003)).
2 Gande, Puri, and Saunders (1999) find that commercial bank entry is associated with a decline in debt
underwriting spreads but not in equity underwriting spreads. The effect is strongest among lower-rated
and smaller debt issues. Gande et al. (1997) provide evidence that commercial banks brought a larger
proportion of small debt offerings to market during the January 1993 to March 1995 period and that more
reputable banks (evidenced by market share) obtain lower yields for borrowers. Similarly, Livingston and
Miller (2000) report slightly lower gross spreads and lower yields obtained by more reputable banks.
After the first quarter of 1997, when the Federal Reserve Board relaxed constraints on cross-marketing
and information flows between commercial banks and their �Section 20� affiliates, Roten and Mullineaux
(2002) find little evidence that commercial banks and investment banks differed in their underwriting
performance.
3 In a similar spirit, Kroszner and Rajan (1994) challenge claims regarding the effects of conflicts of
interest offered as a rationale for the adoption of the Glass-Steagall Act.
4 Because we cannot observe the fees quoted by banks that subsequently fail to win an underwriting
mandate, we do not attempt to control for price competition. However, it is well known that cross-
sectional variation in percentage fees paid is minimal, at least for equity deals.
5 In principle, *Ly and yA could be jointly determined if the analyst�s expectation of her bank winning the
mandate influences her willingness to jeopardize her reputation by inflating the issuer�s stock
recommendation. Empirically, we find a negative relation between yA and )( *LyE , but this is not
statistically significant. We thus focus on the recursive model outlined here.

37
6 Our results are qualitatively unchanged if we also exclude regulated industries (SIC 4000-4999).
7 Our results are qualitatively unchanged if we restrict estimation to public nonconvertible debt and
common stock offerings.
8 We exclude Bank One (whose debt market share places it above some of our sample banks) for lack of
equity analysts.
9 In some instances debt and equity approval were granted at different times.
10 In June 1997, NationsBanc acquired Montgomery Securities. Thus, in addition to �inheriting�
relationships via its short-lived ownership of Robertson Stephens, BoA inherited relationships from
Montgomery and NationsBanc at the time of the merger. On September 21, 1998, in the wake of the
merger, Montgomery�s founder, Thomas Weisel, resigned from Montgomery, founded Thomas Weisel
Partners, and subsequently raided a large fraction of Montgomery�s banking professionals. Relationships
held by Montgomery prior to Weisel�s resignation are coded as being inherited by Weisel Partners, but
similar to the double-counting in the Robertson Stephens case, we also count them as being held by BoA.
11 Of the remaining 8,572 borrowers not matched to SDC, 1,678 can be matched to the CRSP master tape,
so we can definitively rule out that they are in SDC (since we can merge SDC and CRSP without a
problem). This leaves unmatched 6,894 borrowers taking out 14,344 loans for $1.3 trillion (16.25% of the
total). It is possible that some of these are in fact in SDC, but given the above numbers, we are confident
that we have captured the vast majority of lending activity.
12 Yasuda (2003) shows that lending relationships are strongest at the �arranger� level, though widening
the scope to include �lead managers� leaves her results unaffected.
13 The Spectrum 13f data of institutional holdings are filed with the SEC on a quarterly basis. We match
the names of filers to our sample banks using, as necessary, Nelson’s Directory of Investment Managers.
We thank Edie Hotchkiss for help in performing the match.
14 See Anand and Galetovic (2000) for a discussion of competition among investment banks when client

38
relationships are embodied in key employees and are therefore nonexcludable.
15 Some records involve a defection from one sample bank to another, so the number of independent
records is much smaller. As one might expect, banker defections cluster for two reasons, namely, an
acquisition or a high level of market activity in the banker�s area of specialization. When several key
bankers defect in close proximity to one another, existing relationships are more likely to suffer. When
bankers actually move as teams to a competitor, it is more likely that an existing relationship survived and
moved with them. When it was stated explicitly that bankers moved as a team, we code their movement
separately as a team movement. Our estimation results are robust to focusing only on team movements.
16 Strong buys account for 25% of recommendations; 36% are buy recommendations, 37% are hold
recommendations, 1.4% are underperform recommendations, and 0.6% are sell recommendations.
17 We subtract the consensus because Bradshaw, Richardson, and Sloan (2003) document that the analyst
consensus moves up ahead of issuance and down ahead of stock repurchases. Our results are robust to the
following alternative ways to measure the consensus: Subtracting the mean recommendation; defining the
peer group to include only sample banks (rather than all banks); or, taking as the consensus the
recommendations of brokers that do not underwrite securities (such as Sanford Bernstein).
18 If the analyst does not issue a new recommendation in the 275 days before the deal, we assume the
prior recommendation still stands, implying a zero upgrade. If the analyst�s first recommendation occurs
in the 275 days prior to the deal (i.e., initiation of coverage), we assume that the bank previously was
neutral toward the issuer (recommendation level 3) and measure the difference between the
recommendation at coverage initiation and the assumed neutral prior recommendation. Our results are
robust to excluding banks with fewer than two recommendations or, in cases in which coverage is being
initiated, using the median rating among competitors rather than a �hold� rating as the basis for relative
comparison.
39
19 This does not drive our results (see footnote 25 below). Alternatively, it is straightforward to show that
a composite measure that adds relative recommendations to relative upgrades serves to control for the
starting level of recommendations. In our example, this composite measure would identify Goldman�s
analyst as more aggressive than Bear Stearns�. Using this composite measure, we find qualitatively
identical results (available on request).
20 �Stand-alone� means that the coefficients are not those obtained from joint MLE of one of the systems
that includes the coverage equation. With two measures of analyst behavior and two selectivity-adjusted
equations (in step 1 and 2), we estimate four sets of coverage parameters for each of the debt and equity
samples. Instead of reporting all eight sets of coefficients, we report the stand-alone coefficients for the
coverage equation. There are slight differences among these parameter estimates and between these and
the stand-alone probit estimates. None of our conclusions are sensitive to this reporting convention.
21 In some cases, SDC does not report the underwriting fee. Missing fee information is filled in using a
regression of underwriting spreads on deal size in levels and logs (reflecting nonlinear scale economies),
as well as (for debt deals) credit ratings, shelf registration status, industry effects, prior issue experience,
and the maturity of the bond. The results are not sensitive to alternative approaches, such as assuming all
missing SEO fees equal 5% and all missing debt fees equal 1%.
22 For new entrants, prior-year fee revenue is often small or even zero. To avoid generating extreme
outliers, we measure the relative underwriting fee as �ln(1+lagged fee revenue/fee on deal). The minus
sign ensures that a larger value for this variable means a more attractive deal worth competing hard for.
23 Define Ic,i = 1 if bank j managed issuer i�s penultimate deal in the five years to the quarter before time t,
and zero otherwise. Define Ir,i = 1 if bank j managed issuer i�s most recent deal in the same window, and
zero otherwise. Then the loyalty index for bank j in month t equals Σ i Ic,i Ir,i / Σ i Ic,i, that is, the number of
retained clients over the total number of clients.

40
24 Our results are robust to using shorter windows and to defining the variable separately for equity and
debt deals.
25 As a robustness check, we repeat our analysis on a subsample that drops all cases in which the next-to-
last recommendation was a strong buy, so that the relative upgrade specification no longer requires
inclusion of the dummy. All results are qualitatively unaffected.
26 Banks generally are thought to act as intermediaries in securities offerings, balancing the competing
interests of issuers and institutional investors. One might expect banks to favor one side or the other
locally as they compete for new business opportunities, but not globally, in equilibrium. Thus, the
apparent tendency for banks to issue more aggressive recommendations for firms with which they already
have strong relationships begs further consideration. If institutional investors do not take such behavior
particularly seriously or any negative consequences can be offset by other means, then perhaps this is a
relatively low-cost form of nonprice competition of the sort envisioned by Anand and Galetovic (2002).
Alternatively, it might reflect banks colluding with issuers against investors during our estimation period.
Distinguishing between these and other potential explanations requires additional modeling to incorporate
the relationship between banks and institutional investors.
27 It also illustrates the importance of accounting for sample truncation and the endogeneity of analyst
behavior arising from their career concerns. Had we treated analyst behavior as exogenous, the sign on the
coefficient for relative upgrades would have flipped to become positive. However, a formal Smith-
Blundell (1986) test rejects the null hypothesis that analyst behavior is exogenous with respect to the lead
bank choice in our data (p < 0.0001).
28 This being a probit with sample selection correction, the error variance has been normalized to one, so
we cannot measure the economic magnitudes corresponding to the estimated coefficients. We can,
however, make statements about the relative size of the coefficients.

41
29 Drucker and Puri (2004) find that discounting loans increases the likelihood of winning SEO
underwriting mandates.
30 To gain further insight, we interact the analyst behavior instruments with a dummy equaling one for
deals completed during the bubble years (1999 and 2000), but find no evidence that analyst behavior had
a differential effect on issuers� choices during that period (not shown in the table).
31 We thank Francesca Cornelli and Raghu Rajan for suggesting this analysis.
32 Relative to existing research, our research design de-emphasizes the initial public offering by
examining all capital market transactions by an issuer during the sample period. From a theoretical
perspective, we contend that an issuer�s transactions with a bank should not be treated as independent
events. Our evidence is consistent with this argument. From a practical perspective, relatively few firms
attract analyst research coverage prior to their IPO and thus most IPOs are classified as no-coverage cases
in our sample. The exception is carve-outs by parents whose stocks are already covered. In this sub-
sample, we still find that aggressive analyst behavior failed to help banks win business. We note,
however, that anecdotal evidence suggests that banks and their analysts competed for IPO underwriting
mandates by making (nonbinding) commitments to provide favorable research coverage. The finding by
Cliff and Denis (2003) that firms are more likely to switch underwriters when they receive less coverage
than expected is consistent with punishment for violation of such implicit contracts.

Figure 1. Principal Bank Mergers, 1988-2002 The figure presents a time line of the principal merger and acquisition events involving sample banks over the period 1988 to June 2002. A vertical line indicates a merger of two banks. A dashed line indicates a sale or split-off of a bank. For estimation purposes, the sample includes all banks active as of June 2002 (see the right-hand side legend) as well as their predecessor banks. These are the banks considered in competition for a given deal at a given point in time, as long as they held Tier II authority to underwrite securities at that time. There is one exception. The two boutique investment banks acquired by Prudential Securities, Vector Securities and Volpe Brown Whelan, are not considered in competition for any deals due to their specialized nature and small size. Prudential withdrew from underwriting in Q4 2000. Following a merger, the new entity �inherits� the relationships of its predecessors. Following a sale or a split-off, the new entities inherit the relationships previously developed by the joint entity. We consider a bank merged on the first day of the month following the completion of the merger. From that day on, it competes in its merged form. Tier II authority involves separate approval for debt and equity underwriting. The approval dates (debt, equity) used for the sample commercial banks are as follows: BA Securities (10/11/94, 10/11/94), BT Securities (1/1/93, 1/15/91), BankBoston (11/1/96, 11/1/96), CIBC Wood Gundy Securities (6/30/90, 1/15/91), Chase Securities (7/26/89, 6/15/94), Chemical Securities (6/30/93, -), Deutsche Bank (12/1/92, 12/1/92), JP Morgan Securities (1/1/89, 1/1/90), NationsBank (7/26/93, 7/26/93), SBC (1/3/95, -), UBS Securities (debt underwriting grandfathered throughout sample period, equity: 1/1/95), and Citicorp (7/26/89, expected to receive equity approval as of 3/27/95 but not clear if received prior to merger with Traveler�s).
1988 1989 1990 1991 1992 1993 1994 1995 1996 1997 1998 1999 2000 2001 2002
Alex Brown & Sons IncBankers Trust (*)
Deutsche (*)
Fleet (*)Bank of Boston Corp (*) Fleet/Boston Robertson Stephens
Bank of America (*)Security Pacific (*)
Continental Bank (*)Robertson Stephens & Co
Montgomery SecuritiesNationsBank (*)
Thomas Weisel Partners LLC
Bear Stearns & Co Inc Bear Stearns & Co Inc
Manufacturers Hanover Bank (*)Chemical Bank (*)
Chase Manhattan (*)Hambrecht & Quist JP Morgan Chase
JP Morgan (*)
CIBC Wood Gundy Securities (*)Oppenheimer & Co Inc
Citicorp (*)Salomon BrothersSmith Barney Inc
Schroders
CowenSociete Generale (*)
Credit Suisse First BostonDonaldson Lufkin & Jenrette
Dean Witter Reynolds IncMorgan Stanley & Co
Union Bank of Switzerland (*)Swiss Bank Corp (*)
SG Warburg SecuritiesDillon, Read & Co Inc UBS Warburg
PaineWebberKidder Peabody & Co Inc
Goldman Sachs & Co Goldman Sachs & Co
Lehman Brothers Lehman Brothers
Merrill Lynch & Co Inc Merrill Lynch & Co Inc
Prudential Securities IncVector Securities
Volpe Brown Whelan
1988 1989 1990 1991 1992 1993 1994 1995 1996 1997 1998 1999 2000 2001 2002
(*) = commercial bank = Tier II Approval (approximate, see above)
SG Cowen Securities Corp
Deutsche Bank Securities
Prudential Volpe
Banc of America Securities LLC
CIBC World Markets Inc
Credit Suisse First Boston
Morgan Stanley Dean Witter
Salomon Smith Barney
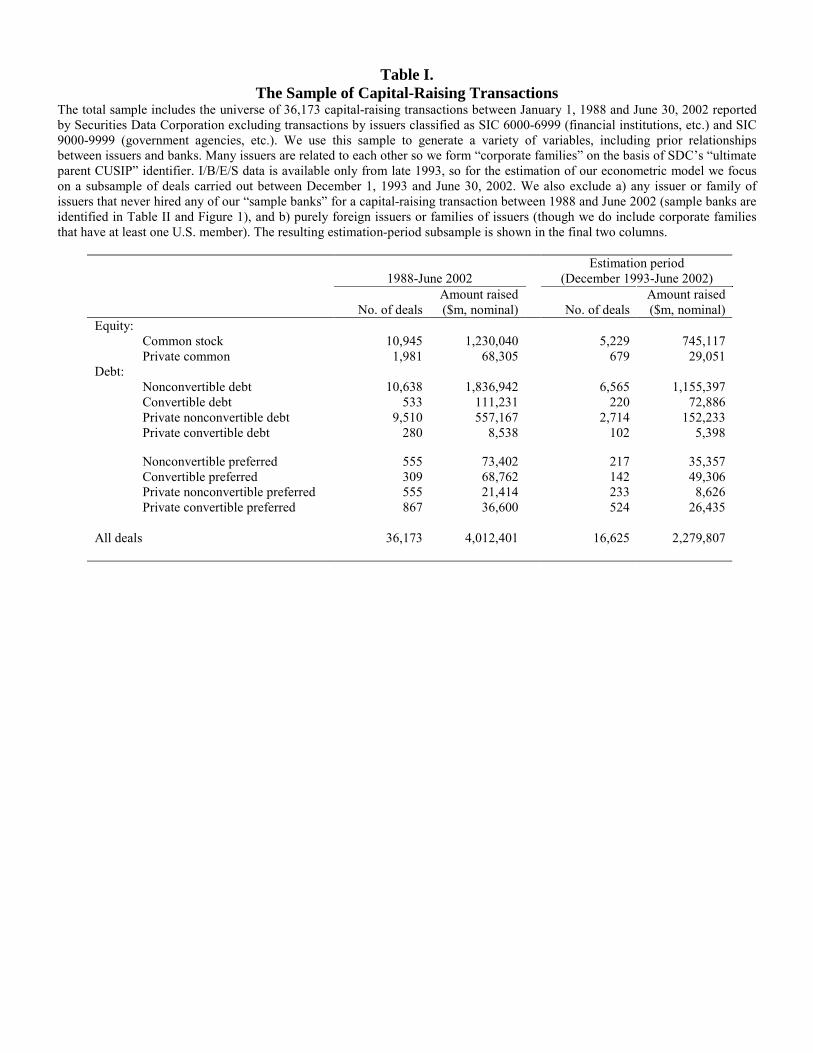
Table I. The Sample of Capital-Raising Transactions
The total sample includes the universe of 36,173 capital-raising transactions between January 1, 1988 and June 30, 2002 reported by Securities Data Corporation excluding transactions by issuers classified as SIC 6000-6999 (financial institutions, etc.) and SIC 9000-9999 (government agencies, etc.). We use this sample to generate a variety of variables, including prior relationships between issuers and banks. Many issuers are related to each other so we form �corporate families� on the basis of SDC�s �ultimate parent CUSIP� identifier. I/B/E/S data is available only from late 1993, so for the estimation of our econometric model we focus on a subsample of deals carried out between December 1, 1993 and June 30, 2002. We also exclude a) any issuer or family of issuers that never hired any of our �sample banks� for a capital-raising transaction between 1988 and June 2002 (sample banks are identified in Table II and Figure 1), and b) purely foreign issuers or families of issuers (though we do include corporate families that have at least one U.S. member). The resulting estimation-period subsample is shown in the final two columns.
1988-June 2002
Estimation period (December 1993-June 2002)
No. of deals
Amount raised ($m, nominal) No. of deals
Amount raised ($m, nominal)
Equity: Common stock 10,945 1,230,040 5,229 745,117 Private common 1,981 68,305 679 29,051 Debt: Nonconvertible debt 10,638 1,836,942 6,565 1,155,397 Convertible debt 533 111,231 220 72,886 Private nonconvertible debt 9,510 557,167 2,714 152,233 Private convertible debt 280 8,538 102 5,398
Nonconvertible preferred 555 73,402
217 35,357 Convertible preferred 309 68,762 142 49,306 Private nonconvertible preferred 555 21,414 233 8,626 Private convertible preferred 867 36,600 524 26,435 All deals 36,173 4,012,401 16,625 2,279,807
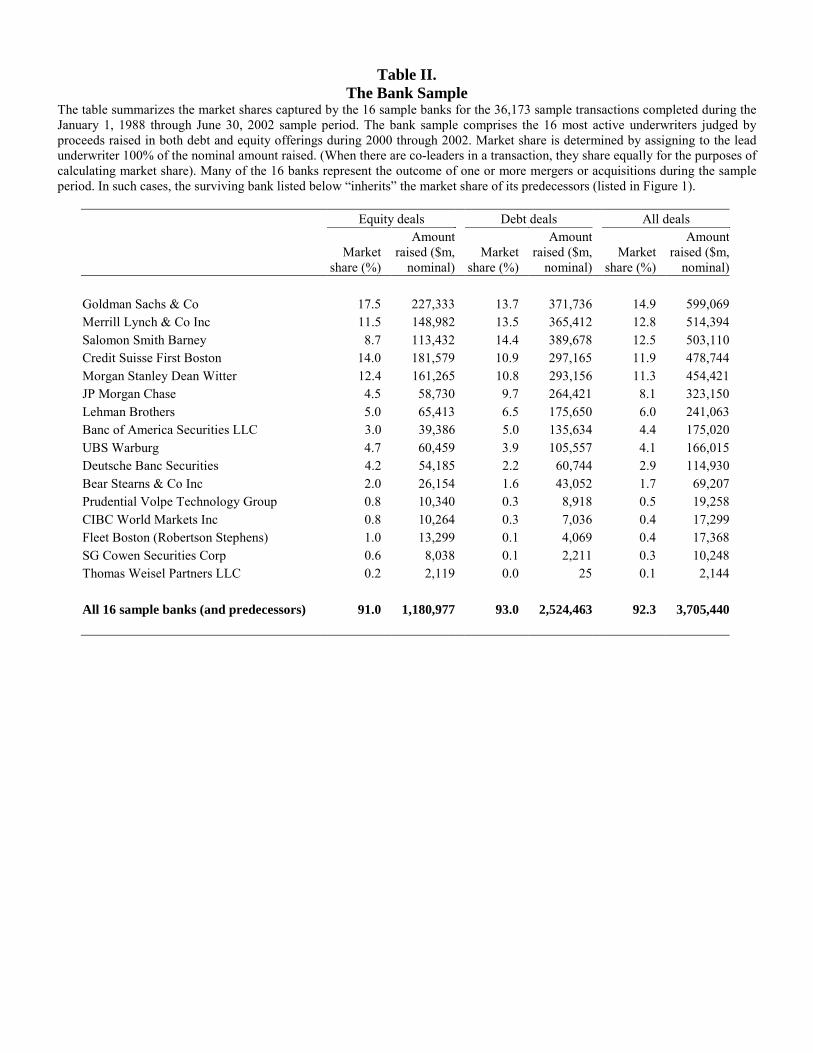
Table II. The Bank Sample
The table summarizes the market shares captured by the 16 sample banks for the 36,173 sample transactions completed during the January 1, 1988 through June 30, 2002 sample period. The bank sample comprises the 16 most active underwriters judged by proceeds raised in both debt and equity offerings during 2000 through 2002. Market share is determined by assigning to the lead underwriter 100% of the nominal amount raised. (When there are co-leaders in a transaction, they share equally for the purposes of calculating market share). Many of the 16 banks represent the outcome of one or more mergers or acquisitions during the sample period. In such cases, the surviving bank listed below �inherits� the market share of its predecessors (listed in Figure 1).
Equity deals Debt deals All deals
Market
share (%)
Amount raised ($m,
nominal)Market
share (%)
Amount raised ($m,
nominal)Market
share (%)
Amount raised ($m,
nominal)
Goldman Sachs & Co 17.5 227,333 13.7 371,736 14.9 599,069Merrill Lynch & Co Inc 11.5 148,982 13.5 365,412 12.8 514,394Salomon Smith Barney 8.7 113,432 14.4 389,678 12.5 503,110Credit Suisse First Boston 14.0 181,579 10.9 297,165 11.9 478,744Morgan Stanley Dean Witter 12.4 161,265 10.8 293,156 11.3 454,421JP Morgan Chase 4.5 58,730 9.7 264,421 8.1 323,150Lehman Brothers 5.0 65,413 6.5 175,650 6.0 241,063Banc of America Securities LLC 3.0 39,386 5.0 135,634 4.4 175,020UBS Warburg 4.7 60,459 3.9 105,557 4.1 166,015Deutsche Banc Securities 4.2 54,185 2.2 60,744 2.9 114,930Bear Stearns & Co Inc 2.0 26,154 1.6 43,052 1.7 69,207Prudential Volpe Technology Group 0.8 10,340 0.3 8,918 0.5 19,258CIBC World Markets Inc 0.8 10,264 0.3 7,036 0.4 17,299Fleet Boston (Robertson Stephens) 1.0 13,299 0.1 4,069 0.4 17,368SG Cowen Securities Corp 0.6 8,038 0.1 2,211 0.3 10,248Thomas Weisel Partners LLC 0.2 2,119 0.0 25 0.1 2,144 All 16 sample banks (and predecessors) 91.0 1,180,977 93.0 2,524,463 92.3 3,705,440
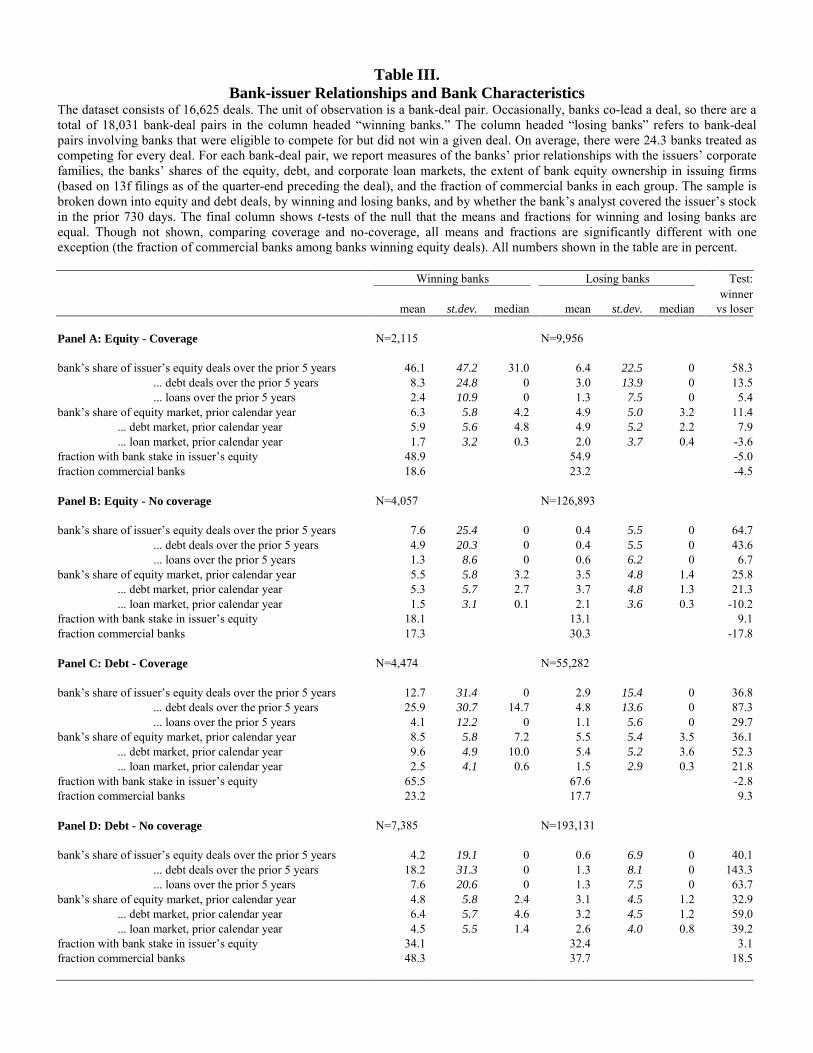
Table III. Bank-issuer Relationships and Bank Characteristics
The dataset consists of 16,625 deals. The unit of observation is a bank-deal pair. Occasionally, banks co-lead a deal, so there are a total of 18,031 bank-deal pairs in the column headed �winning banks.� The column headed �losing banks� refers to bank-deal pairs involving banks that were eligible to compete for but did not win a given deal. On average, there were 24.3 banks treated as competing for every deal. For each bank-deal pair, we report measures of the banks� prior relationships with the issuers� corporate families, the banks� shares of the equity, debt, and corporate loan markets, the extent of bank equity ownership in issuing firms (based on 13f filings as of the quarter-end preceding the deal), and the fraction of commercial banks in each group. The sample is broken down into equity and debt deals, by winning and losing banks, and by whether the bank�s analyst covered the issuer�s stock in the prior 730 days. The final column shows t-tests of the null that the means and fractions for winning and losing banks are equal. Though not shown, comparing coverage and no-coverage, all means and fractions are significantly different with one exception (the fraction of commercial banks among banks winning equity deals). All numbers shown in the table are in percent. Winning banks Losing banks Test: winner mean st.dev. median mean st.dev. median vs loser Panel A: Equity - Coverage N=2,115 N=9,956 bank�s share of issuer�s equity deals over the prior 5 years 46.1 47.2 31.0 6.4 22.5 0 58.3 ... debt deals over the prior 5 years 8.3 24.8 0 3.0 13.9 0 13.5 ... loans over the prior 5 years 2.4 10.9 0 1.3 7.5 0 5.4bank�s share of equity market, prior calendar year 6.3 5.8 4.2 4.9 5.0 3.2 11.4 ... debt market, prior calendar year 5.9 5.6 4.8 4.9 5.2 2.2 7.9 ... loan market, prior calendar year 1.7 3.2 0.3 2.0 3.7 0.4 -3.6fraction with bank stake in issuer�s equity 48.9 54.9 -5.0fraction commercial banks 18.6 23.2 -4.5 Panel B: Equity - No coverage N=4,057 N=126,893 bank�s share of issuer�s equity deals over the prior 5 years 7.6 25.4 0 0.4 5.5 0 64.7 ... debt deals over the prior 5 years 4.9 20.3 0 0.4 5.5 0 43.6 ... loans over the prior 5 years 1.3 8.6 0 0.6 6.2 0 6.7bank�s share of equity market, prior calendar year 5.5 5.8 3.2 3.5 4.8 1.4 25.8 ... debt market, prior calendar year 5.3 5.7 2.7 3.7 4.8 1.3 21.3 ... loan market, prior calendar year 1.5 3.1 0.1 2.1 3.6 0.3 -10.2fraction with bank stake in issuer�s equity 18.1 13.1 9.1fraction commercial banks 17.3 30.3 -17.8 Panel C: Debt - Coverage N=4,474 N=55,282 bank�s share of issuer�s equity deals over the prior 5 years 12.7 31.4 0 2.9 15.4 0 36.8 ... debt deals over the prior 5 years 25.9 30.7 14.7 4.8 13.6 0 87.3 ... loans over the prior 5 years 4.1 12.2 0 1.1 5.6 0 29.7bank�s share of equity market, prior calendar year 8.5 5.8 7.2 5.5 5.4 3.5 36.1 ... debt market, prior calendar year 9.6 4.9 10.0 5.4 5.2 3.6 52.3 ... loan market, prior calendar year 2.5 4.1 0.6 1.5 2.9 0.3 21.8fraction with bank stake in issuer�s equity 65.5 67.6 -2.8fraction commercial banks 23.2 17.7 9.3 Panel D: Debt - No coverage N=7,385 N=193,131 bank�s share of issuer�s equity deals over the prior 5 years 4.2 19.1 0 0.6 6.9 0 40.1 ... debt deals over the prior 5 years 18.2 31.3 0 1.3 8.1 0 143.3 ... loans over the prior 5 years 7.6 20.6 0 1.3 7.5 0 63.7bank�s share of equity market, prior calendar year 4.8 5.8 2.4 3.1 4.5 1.2 32.9 ... debt market, prior calendar year 6.4 5.7 4.6 3.2 4.5 1.2 59.0 ... loan market, prior calendar year 4.5 5.5 1.4 2.6 4.0 0.8 39.2fraction with bank stake in issuer�s equity 34.1 32.4 3.1fraction commercial banks 48.3 37.7 18.5
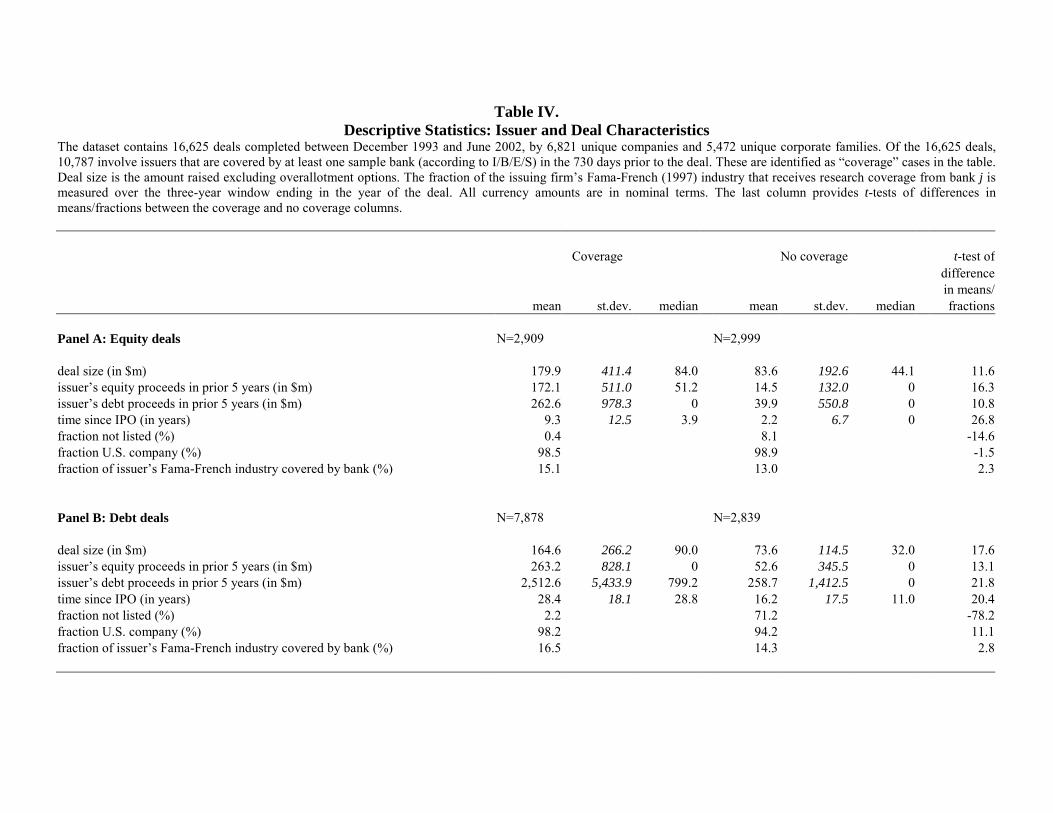
Table IV. Descriptive Statistics: Issuer and Deal Characteristics
The dataset contains 16,625 deals completed between December 1993 and June 2002, by 6,821 unique companies and 5,472 unique corporate families. Of the 16,625 deals, 10,787 involve issuers that are covered by at least one sample bank (according to I/B/E/S) in the 730 days prior to the deal. These are identified as �coverage� cases in the table. Deal size is the amount raised excluding overallotment options. The fraction of the issuing firm�s Fama-French (1997) industry that receives research coverage from bank j is measured over the three-year window ending in the year of the deal. All currency amounts are in nominal terms. The last column provides t-tests of differences in means/fractions between the coverage and no coverage columns. Coverage No coverage t-test of difference in means/ mean st.dev. median mean st.dev. median fractions Panel A: Equity deals N=2,909 N=2,999 deal size (in $m) 179.9 411.4 84.0 83.6 192.6 44.1 11.6 issuer�s equity proceeds in prior 5 years (in $m) 172.1 511.0 51.2 14.5 132.0 0 16.3 issuer�s debt proceeds in prior 5 years (in $m) 262.6 978.3 0 39.9 550.8 0 10.8 time since IPO (in years) 9.3 12.5 3.9 2.2 6.7 0 26.8 fraction not listed (%) 0.4 8.1 -14.6 fraction U.S. company (%) 98.5 98.9 -1.5 fraction of issuer�s Fama-French industry covered by bank (%) 15.1 13.0 2.3 Panel B: Debt deals N=7,878 N=2,839 deal size (in $m) 164.6 266.2 90.0 73.6 114.5 32.0 17.6 issuer�s equity proceeds in prior 5 years (in $m) 263.2 828.1 0 52.6 345.5 0 13.1 issuer�s debt proceeds in prior 5 years (in $m) 2,512.6 5,433.9 799.2 258.7 1,412.5 0 21.8 time since IPO (in years) 28.4 18.1 28.8 16.2 17.5 11.0 20.4 fraction not listed (%) 2.2 71.2 -78.2 fraction U.S. company (%) 98.2 94.2 11.1 fraction of issuer�s Fama-French industry covered by bank (%) 16.5 14.3 2.8
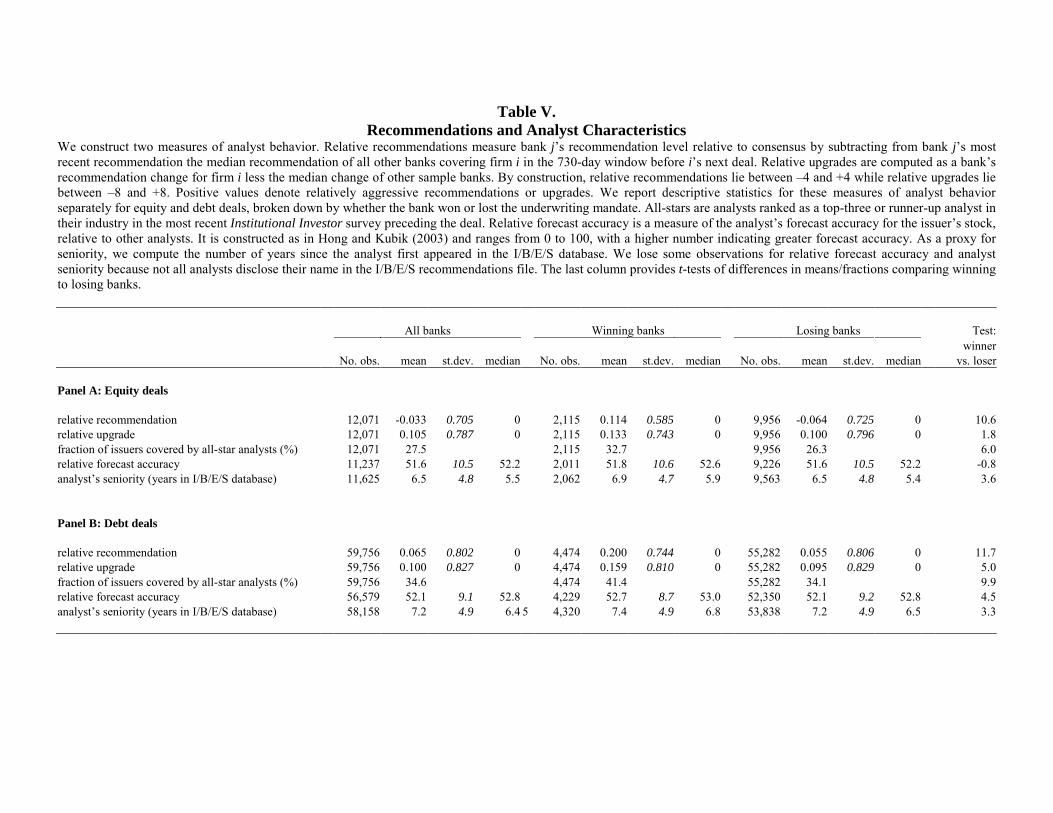
Table V. Recommendations and Analyst Characteristics
We construct two measures of analyst behavior. Relative recommendations measure bank j�s recommendation level relative to consensus by subtracting from bank j�s most recent recommendation the median recommendation of all other banks covering firm i in the 730-day window before i�s next deal. Relative upgrades are computed as a bank�s recommendation change for firm i less the median change of other sample banks. By construction, relative recommendations lie between �4 and +4 while relative upgrades lie between �8 and +8. Positive values denote relatively aggressive recommendations or upgrades. We report descriptive statistics for these measures of analyst behavior separately for equity and debt deals, broken down by whether the bank won or lost the underwriting mandate. All-stars are analysts ranked as a top-three or runner-up analyst in their industry in the most recent Institutional Investor survey preceding the deal. Relative forecast accuracy is a measure of the analyst�s forecast accuracy for the issuer�s stock, relative to other analysts. It is constructed as in Hong and Kubik (2003) and ranges from 0 to 100, with a higher number indicating greater forecast accuracy. As a proxy for seniority, we compute the number of years since the analyst first appeared in the I/B/E/S database. We lose some observations for relative forecast accuracy and analyst seniority because not all analysts disclose their name in the I/B/E/S recommendations file. The last column provides t-tests of differences in means/fractions comparing winning to losing banks. All banks Winning banks Losing banks Test: winner No. obs. mean st.dev. median No. obs. mean st.dev. median No. obs. mean st.dev. median vs. loser Panel A: Equity deals relative recommendation 12,071 -0.033 0.705 0 2,115 0.114 0.585 0 9,956 -0.064 0.725 0 10.6 relative upgrade 12,071 0.105 0.787 0 2,115 0.133 0.743 0 9,956 0.100 0.796 0 1.8 fraction of issuers covered by all-star analysts (%) 12,071 27.5 2,115 32.7 9,956 26.3 6.0 relative forecast accuracy 11,237 51.6 10.5 52.2 2,011 51.8 10.6 52.6 9,226 51.6 10.5 52.2 -0.8 analyst�s seniority (years in I/B/E/S database) 11,625 6.5 4.8 5.5 2,062 6.9 4.7 5.9 9,563 6.5 4.8 5.4 3.6 Panel B: Debt deals relative recommendation 59,756 0.065 0.802 0 4,474 0.200 0.744 0 55,282 0.055 0.806 0 11.7 relative upgrade 59,756 0.100 0.827 0 4,474 0.159 0.810 0 55,282 0.095 0.829 0 5.0 fraction of issuers covered by all-star analysts (%) 59,756 34.6 4,474 41.4 55,282 34.1 9.9 relative forecast accuracy 56,579 52.1 9.1 52.8 4,229 52.7 8.7 53.0 52,350 52.1 9.2 52.8 4.5 analyst�s seniority (years in I/B/E/S database) 58,158 7.2 4.9 6.4 5 4,320 7.4 4.9 6.8 53,838 7.2 4.9 6.5 3.3
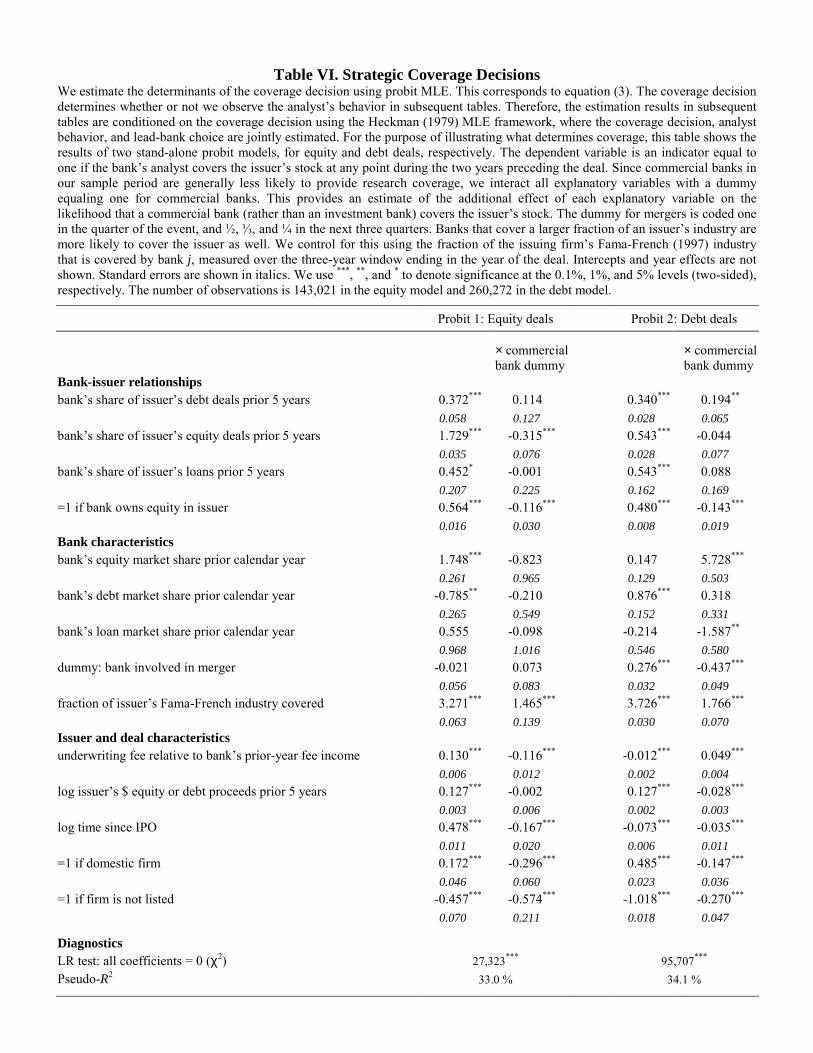
Table VI. Strategic Coverage Decisions We estimate the determinants of the coverage decision using probit MLE. This corresponds to equation (3). The coverage decision determines whether or not we observe the analyst�s behavior in subsequent tables. Therefore, the estimation results in subsequent tables are conditioned on the coverage decision using the Heckman (1979) MLE framework, where the coverage decision, analyst behavior, and lead-bank choice are jointly estimated. For the purpose of illustrating what determines coverage, this table shows the results of two stand-alone probit models, for equity and debt deals, respectively. The dependent variable is an indicator equal to one if the bank�s analyst covers the issuer�s stock at any point during the two years preceding the deal. Since commercial banks in our sample period are generally less likely to provide research coverage, we interact all explanatory variables with a dummy equaling one for commercial banks. This provides an estimate of the additional effect of each explanatory variable on the likelihood that a commercial bank (rather than an investment bank) covers the issuer�s stock. The dummy for mergers is coded one in the quarter of the event, and ½, ⅓, and ¼ in the next three quarters. Banks that cover a larger fraction of an issuer�s industry are more likely to cover the issuer as well. We control for this using the fraction of the issuing firm�s Fama-French (1997) industry that is covered by bank j, measured over the three-year window ending in the year of the deal. Intercepts and year effects are not shown. Standard errors are shown in italics. We use ***, **, and * to denote significance at the 0.1%, 1%, and 5% levels (two-sided), respectively. The number of observations is 143,021 in the equity model and 260,272 in the debt model.
Probit 1: Equity deals Probit 2: Debt deals
× commercial bank dummy
× commercial bank dummy
Bank-issuer relationships bank�s share of issuer�s debt deals prior 5 years 0.372*** 0.114 0.340*** 0.194** 0.058 0.127 0.028 0.065 bank�s share of issuer�s equity deals prior 5 years 1.729*** -0.315*** 0.543*** -0.044 0.035 0.076 0.028 0.077 bank�s share of issuer�s loans prior 5 years 0.452* -0.001 0.543*** 0.088 0.207 0.225 0.162 0.169 =1 if bank owns equity in issuer 0.564*** -0.116*** 0.480*** -0.143*** 0.016 0.030 0.008 0.019 Bank characteristics bank�s equity market share prior calendar year 1.748*** -0.823 0.147 5.728*** 0.261 0.965 0.129 0.503 bank�s debt market share prior calendar year -0.785** -0.210 0.876*** 0.318 0.265 0.549 0.152 0.331 bank�s loan market share prior calendar year 0.555 -0.098 -0.214 -1.587** 0.968 1.016 0.546 0.580 dummy: bank involved in merger -0.021 0.073 0.276*** -0.437*** 0.056 0.083 0.032 0.049 fraction of issuer�s Fama-French industry covered 3.271*** 1.465*** 3.726*** 1.766*** 0.063 0.139 0.030 0.070 Issuer and deal characteristics underwriting fee relative to bank�s prior-year fee income 0.130*** -0.116*** -0.012*** 0.049*** 0.006 0.012 0.002 0.004 log issuer�s $ equity or debt proceeds prior 5 years 0.127*** -0.002 0.127*** -0.028*** 0.003 0.006 0.002 0.003 log time since IPO 0.478*** -0.167*** -0.073*** -0.035*** 0.011 0.020 0.006 0.011 =1 if domestic firm 0.172*** -0.296*** 0.485*** -0.147*** 0.046 0.060 0.023 0.036 =1 if firm is not listed -0.457*** -0.574*** -1.018*** -0.270*** 0.070 0.211 0.018 0.047
Diagnostics LR test: all coefficients = 0 (χ2) 27,323*** 95,707*** Pseudo-R2 33.0 % 34.1 %
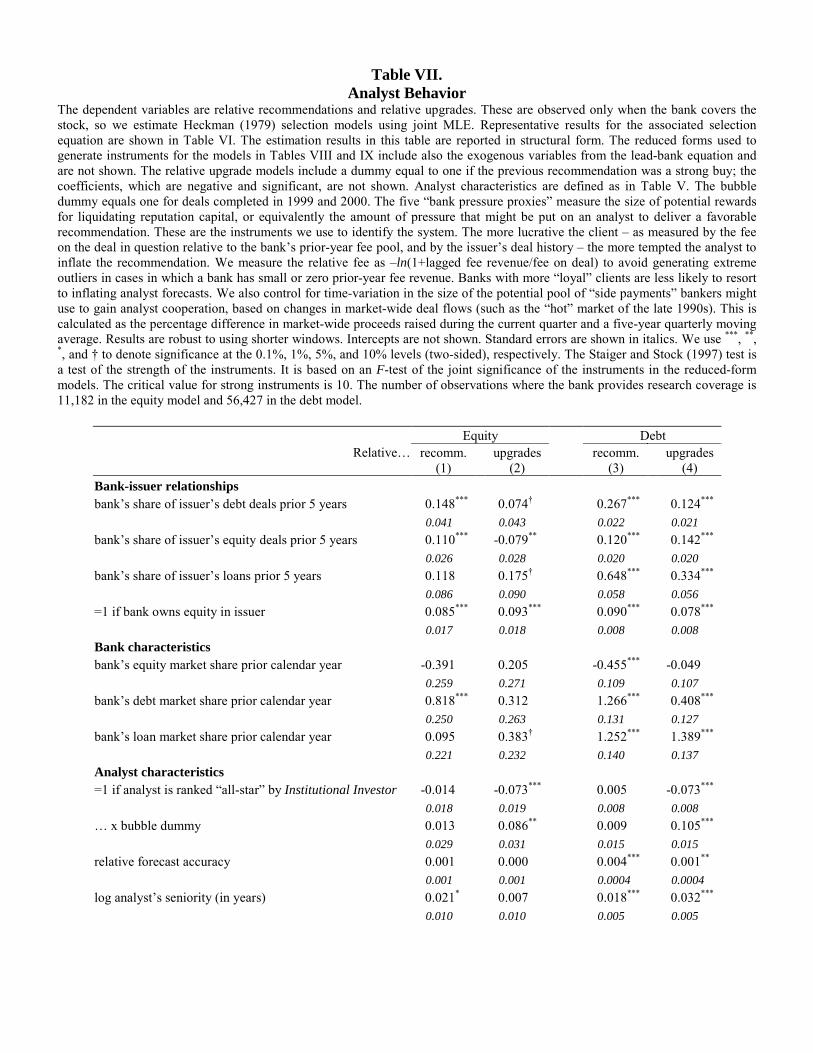
Table VII. Analyst Behavior
The dependent variables are relative recommendations and relative upgrades. These are observed only when the bank covers the stock, so we estimate Heckman (1979) selection models using joint MLE. Representative results for the associated selection equation are shown in Table VI. The estimation results in this table are reported in structural form. The reduced forms used to generate instruments for the models in Tables VIII and IX include also the exogenous variables from the lead-bank equation and are not shown. The relative upgrade models include a dummy equal to one if the previous recommendation was a strong buy; the coefficients, which are negative and significant, are not shown. Analyst characteristics are defined as in Table V. The bubble dummy equals one for deals completed in 1999 and 2000. The five �bank pressure proxies� measure the size of potential rewards for liquidating reputation capital, or equivalently the amount of pressure that might be put on an analyst to deliver a favorable recommendation. These are the instruments we use to identify the system. The more lucrative the client � as measured by the fee on the deal in question relative to the bank�s prior-year fee pool, and by the issuer�s deal history � the more tempted the analyst to inflate the recommendation. We measure the relative fee as �ln(1+lagged fee revenue/fee on deal) to avoid generating extreme outliers in cases in which a bank has small or zero prior-year fee revenue. Banks with more �loyal� clients are less likely to resort to inflating analyst forecasts. We also control for time-variation in the size of the potential pool of �side payments� bankers might use to gain analyst cooperation, based on changes in market-wide deal flows (such as the �hot� market of the late 1990s). This is calculated as the percentage difference in market-wide proceeds raised during the current quarter and a five-year quarterly moving average. Results are robust to using shorter windows. Intercepts are not shown. Standard errors are shown in italics. We use ***, **, *, and � to denote significance at the 0.1%, 1%, 5%, and 10% levels (two-sided), respectively. The Staiger and Stock (1997) test is a test of the strength of the instruments. It is based on an F-test of the joint significance of the instruments in the reduced-form models. The critical value for strong instruments is 10. The number of observations where the bank provides research coverage is 11,182 in the equity model and 56,427 in the debt model.
Equity Debt Relative� recomm.
(1) upgrades
(2) recomm.
(3) upgrades
(4) Bank-issuer relationships bank�s share of issuer�s debt deals prior 5 years 0.148*** 0.074� 0.267*** 0.124*** 0.041 0.043 0.022 0.021 bank�s share of issuer�s equity deals prior 5 years 0.110*** -0.079** 0.120*** 0.142*** 0.026 0.028 0.020 0.020 bank�s share of issuer�s loans prior 5 years 0.118 0.175� 0.648*** 0.334*** 0.086 0.090 0.058 0.056 =1 if bank owns equity in issuer 0.085*** 0.093*** 0.090*** 0.078*** 0.017 0.018 0.008 0.008 Bank characteristics bank�s equity market share prior calendar year -0.391 0.205 -0.455*** -0.049 0.259 0.271 0.109 0.107 bank�s debt market share prior calendar year 0.818*** 0.312 1.266*** 0.408*** 0.250 0.263 0.131 0.127 bank�s loan market share prior calendar year 0.095 0.383� 1.252*** 1.389*** 0.221 0.232 0.140 0.137 Analyst characteristics =1 if analyst is ranked �all-star� by Institutional Investor -0.014 -0.073*** 0.005 -0.073*** 0.018 0.019 0.008 0.008 � x bubble dummy 0.013 0.086** 0.009 0.105*** 0.029 0.031 0.015 0.015 relative forecast accuracy 0.001 0.000 0.004*** 0.001** 0.001 0.001 0.0004 0.0004 log analyst�s seniority (in years) 0.021* 0.007 0.018*** 0.032*** 0.010 0.010 0.005 0.005
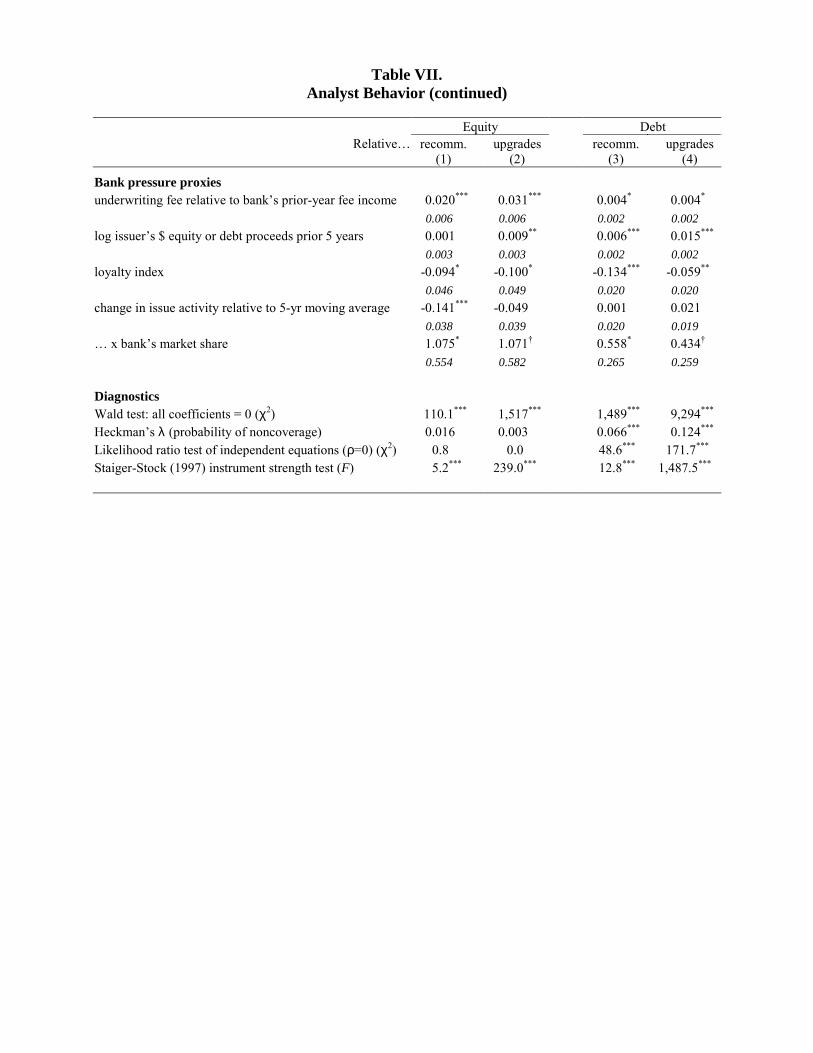
Table VII. Analyst Behavior (continued)
Equity Debt
Relative� recomm. (1)
upgrades (2)
recomm. (3)
upgrades (4)
Bank pressure proxies underwriting fee relative to bank�s prior-year fee income 0.020*** 0.031*** 0.004* 0.004* 0.006 0.006 0.002 0.002 log issuer�s $ equity or debt proceeds prior 5 years 0.001 0.009** 0.006*** 0.015*** 0.003 0.003 0.002 0.002 loyalty index -0.094* -0.100* -0.134*** -0.059** 0.046 0.049 0.020 0.020 change in issue activity relative to 5-yr moving average -0.141*** -0.049 0.001 0.021 0.038 0.039 0.020 0.019 � x bank�s market share 1.075* 1.071� 0.558* 0.434� 0.554 0.582 0.265 0.259 Diagnostics Wald test: all coefficients = 0 (χ2) 110.1*** 1,517*** 1,489*** 9,294*** Heckman�s λ (probability of noncoverage) 0.016 0.003 0.066*** 0.124*** Likelihood ratio test of independent equations (ρ=0) (χ2) 0.8 0.0 48.6*** 171.7*** Staiger-Stock (1997) instrument strength test (F) 5.2*** 239.0*** 12.8*** 1,487.5***
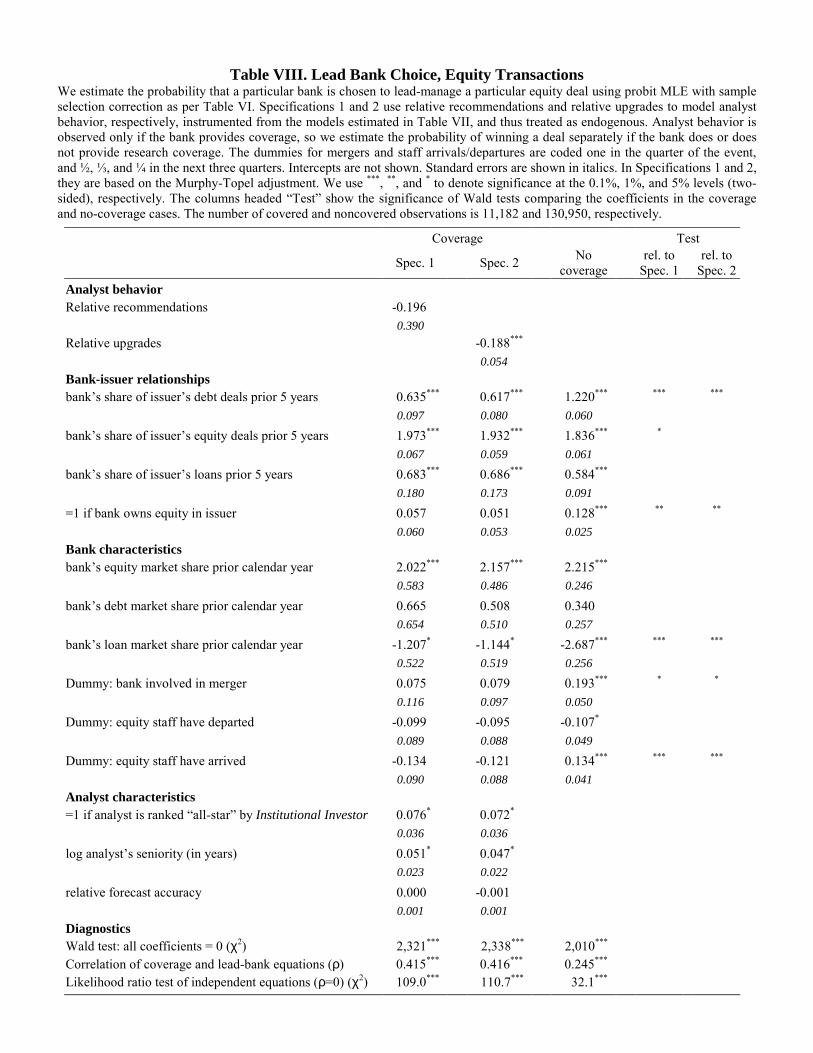
Table VIII. Lead Bank Choice, Equity Transactions We estimate the probability that a particular bank is chosen to lead-manage a particular equity deal using probit MLE with sample selection correction as per Table VI. Specifications 1 and 2 use relative recommendations and relative upgrades to model analyst behavior, respectively, instrumented from the models estimated in Table VII, and thus treated as endogenous. Analyst behavior is observed only if the bank provides coverage, so we estimate the probability of winning a deal separately if the bank does or does not provide research coverage. The dummies for mergers and staff arrivals/departures are coded one in the quarter of the event, and ½, ⅓, and ¼ in the next three quarters. Intercepts are not shown. Standard errors are shown in italics. In Specifications 1 and 2, they are based on the Murphy-Topel adjustment. We use ***, **, and * to denote significance at the 0.1%, 1%, and 5% levels (two-sided), respectively. The columns headed �Test� show the significance of Wald tests comparing the coefficients in the coverage and no-coverage cases. The number of covered and noncovered observations is 11,182 and 130,950, respectively.
Coverage Test
Spec. 1 Spec. 2 No
coverage rel. to
Spec. 1rel. to
Spec. 2Analyst behavior Relative recommendations -0.196 0.390 Relative upgrades -0.188*** 0.054 Bank-issuer relationships bank�s share of issuer�s debt deals prior 5 years 0.635*** 0.617*** 1.220*** *** *** 0.097 0.080 0.060
bank�s share of issuer�s equity deals prior 5 years 1.973*** 1.932*** 1.836*** * 0.067 0.059 0.061
bank�s share of issuer�s loans prior 5 years 0.683*** 0.686*** 0.584***
0.180 0.173 0.091
=1 if bank owns equity in issuer 0.057 0.051 0.128*** ** **
0.060 0.053 0.025 Bank characteristics bank�s equity market share prior calendar year 2.022*** 2.157*** 2.215***
0.583 0.486 0.246
bank�s debt market share prior calendar year 0.665 0.508 0.340 0.654 0.510 0.257
bank�s loan market share prior calendar year -1.207* -1.144* -2.687*** *** *** 0.522 0.519 0.256
Dummy: bank involved in merger 0.075 0.079 0.193*** * *
0.116 0.097 0.050
Dummy: equity staff have departed -0.099 -0.095 -0.107* 0.089 0.088 0.049
Dummy: equity staff have arrived -0.134 -0.121 0.134*** *** *** 0.090 0.088 0.041 Analyst characteristics =1 if analyst is ranked �all-star� by Institutional Investor 0.076* 0.072* 0.036 0.036 log analyst�s seniority (in years) 0.051* 0.047*
0.023 0.022
relative forecast accuracy 0.000 -0.001
0.001 0.001 Diagnostics Wald test: all coefficients = 0 (χ2) 2,321*** 2,338*** 2,010*** Correlation of coverage and lead-bank equations (ρ) 0.415*** 0.416*** 0.245*** Likelihood ratio test of independent equations (ρ=0) (χ2) 109.0*** 110.7*** 32.1***
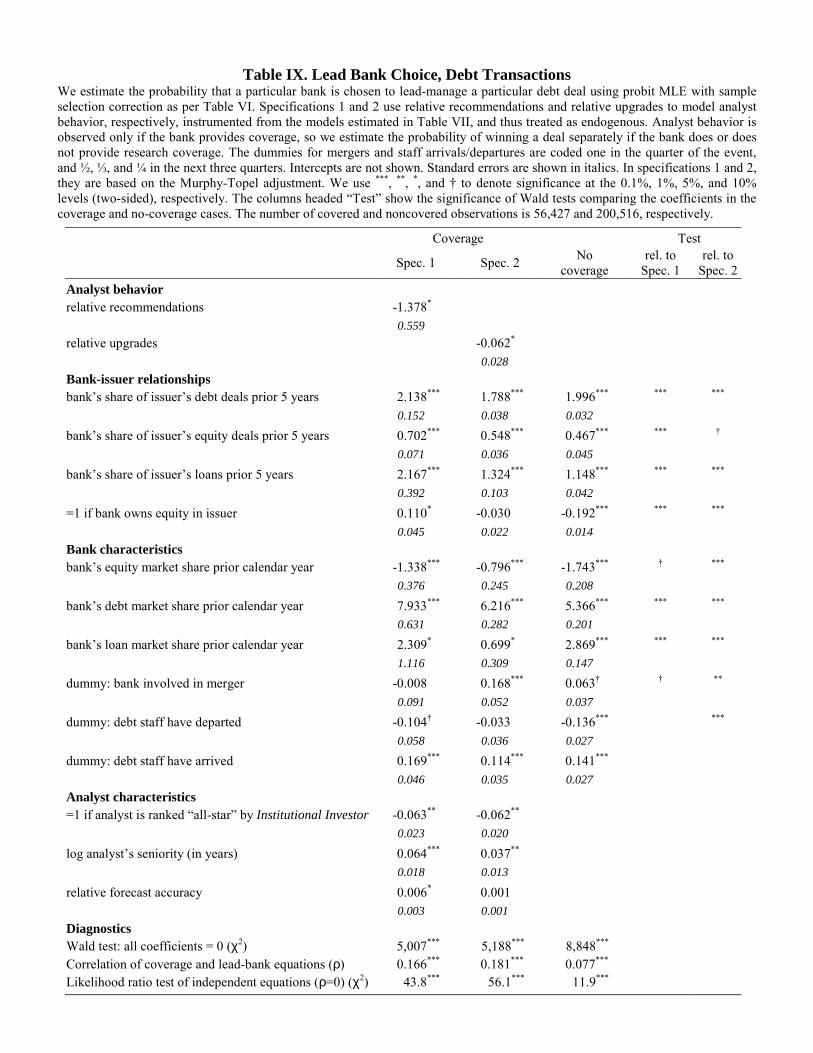
Table IX. Lead Bank Choice, Debt Transactions We estimate the probability that a particular bank is chosen to lead-manage a particular debt deal using probit MLE with sample selection correction as per Table VI. Specifications 1 and 2 use relative recommendations and relative upgrades to model analyst behavior, respectively, instrumented from the models estimated in Table VII, and thus treated as endogenous. Analyst behavior is observed only if the bank provides coverage, so we estimate the probability of winning a deal separately if the bank does or does not provide research coverage. The dummies for mergers and staff arrivals/departures are coded one in the quarter of the event, and ½, ⅓, and ¼ in the next three quarters. Intercepts are not shown. Standard errors are shown in italics. In specifications 1 and 2, they are based on the Murphy-Topel adjustment. We use ***, **, *, and � to denote significance at the 0.1%, 1%, 5%, and 10% levels (two-sided), respectively. The columns headed �Test� show the significance of Wald tests comparing the coefficients in the coverage and no-coverage cases. The number of covered and noncovered observations is 56,427 and 200,516, respectively.
Coverage Test
Spec. 1 Spec. 2 No
coverage rel. to
Spec. 1rel. to
Spec. 2Analyst behavior relative recommendations -1.378* 0.559 relative upgrades -0.062* 0.028 Bank-issuer relationships bank�s share of issuer�s debt deals prior 5 years 2.138*** 1.788*** 1.996*** *** ***
0.152 0.038 0.032
bank�s share of issuer�s equity deals prior 5 years 0.702*** 0.548*** 0.467*** *** �
0.071 0.036 0.045
bank�s share of issuer�s loans prior 5 years 2.167*** 1.324*** 1.148*** *** *** 0.392 0.103 0.042
=1 if bank owns equity in issuer 0.110* -0.030 -0.192*** *** ***
0.045 0.022 0.014 Bank characteristics bank�s equity market share prior calendar year -1.338*** -0.796*** -1.743*** � *** 0.376 0.245 0.208
bank�s debt market share prior calendar year 7.933*** 6.216*** 5.366*** *** *** 0.631 0.282 0.201
bank�s loan market share prior calendar year 2.309* 0.699* 2.869*** *** *** 1.116 0.309 0.147
dummy: bank involved in merger -0.008 0.168*** 0.063� � ** 0.091 0.052 0.037
dummy: debt staff have departed -0.104� -0.033 -0.136*** *** 0.058 0.036 0.027
dummy: debt staff have arrived 0.169*** 0.114*** 0.141*** 0.046 0.035 0.027 Analyst characteristics =1 if analyst is ranked �all-star� by Institutional Investor -0.063** -0.062** 0.023 0.020 log analyst�s seniority (in years) 0.064*** 0.037** 0.018 0.013 relative forecast accuracy 0.006* 0.001 0.003 0.001 Diagnostics Wald test: all coefficients = 0 (χ2) 5,007*** 5,188*** 8,848*** Correlation of coverage and lead-bank equations (ρ) 0.166*** 0.181*** 0.077*** Likelihood ratio test of independent equations (ρ=0) (χ2) 43.8*** 56.1*** 11.9***
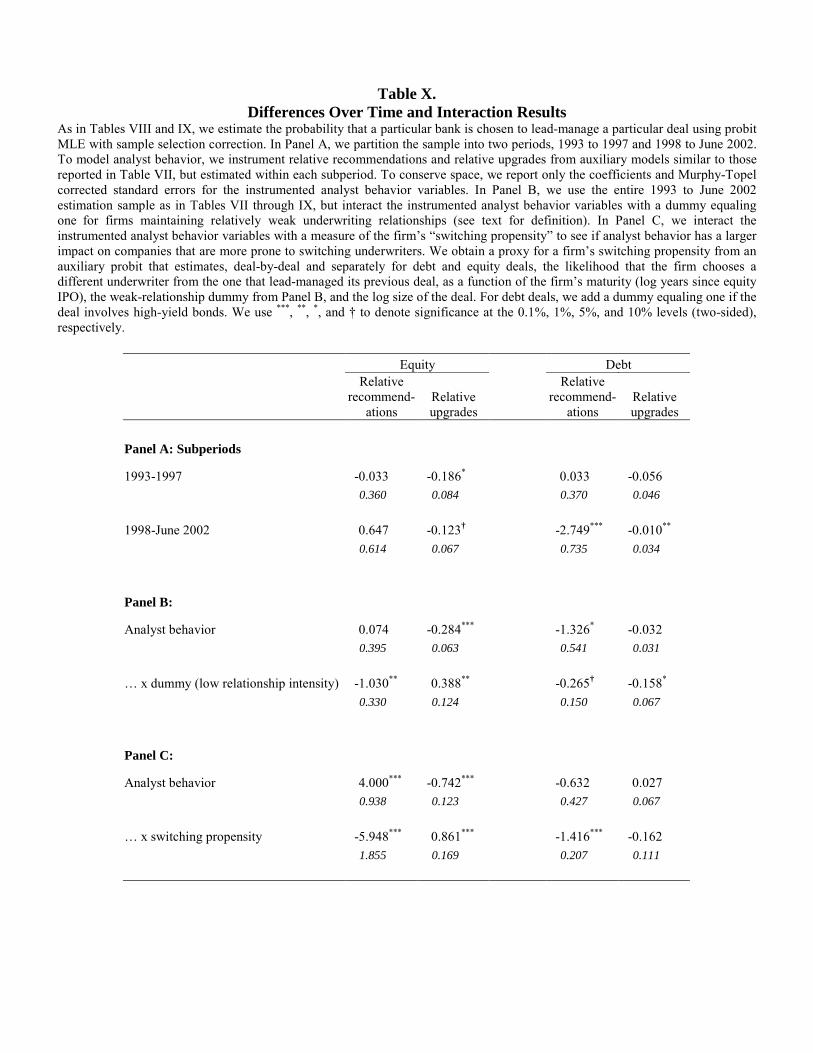
Table X. Differences Over Time and Interaction Results
As in Tables VIII and IX, we estimate the probability that a particular bank is chosen to lead-manage a particular deal using probit MLE with sample selection correction. In Panel A, we partition the sample into two periods, 1993 to 1997 and 1998 to June 2002. To model analyst behavior, we instrument relative recommendations and relative upgrades from auxiliary models similar to those reported in Table VII, but estimated within each subperiod. To conserve space, we report only the coefficients and Murphy-Topel corrected standard errors for the instrumented analyst behavior variables. In Panel B, we use the entire 1993 to June 2002 estimation sample as in Tables VII through IX, but interact the instrumented analyst behavior variables with a dummy equaling one for firms maintaining relatively weak underwriting relationships (see text for definition). In Panel C, we interact the instrumented analyst behavior variables with a measure of the firm�s �switching propensity� to see if analyst behavior has a larger impact on companies that are more prone to switching underwriters. We obtain a proxy for a firm�s switching propensity from an auxiliary probit that estimates, deal-by-deal and separately for debt and equity deals, the likelihood that the firm chooses a different underwriter from the one that lead-managed its previous deal, as a function of the firm�s maturity (log years since equity IPO), the weak-relationship dummy from Panel B, and the log size of the deal. For debt deals, we add a dummy equaling one if the deal involves high-yield bonds. We use ***, **, *, and � to denote significance at the 0.1%, 1%, 5%, and 10% levels (two-sided), respectively.
Equity Debt
Relative recommend-
ations Relative upgrades
Relative recommend-
ations Relative upgrades
Panel A: Subperiods
1993-1997 -0.033 -0.186* 0.033 -0.056 0.360 0.084 0.370 0.046 1998-June 2002 0.647 -0.123† -2.749*** -0.010** 0.614 0.067 0.735 0.034 Panel B:
Analyst behavior 0.074 -0.284*** -1.326* -0.032 0.395 0.063 0.541 0.031 � x dummy (low relationship intensity) -1.030** 0.388** -0.265† -0.158* 0.330 0.124 0.150 0.067 Panel C:
Analyst behavior 4.000*** -0.742*** -0.632 0.027 0.938 0.123 0.427 0.067 � x switching propensity -5.948*** 0.861*** -1.416*** -0.162 1.855 0.169 0.207 0.111
Related Documents