Article Compensation of Water Influence on Anionic Polymerization of ε-Caprolactam: 1. Chemistry and Experiments Michael Wilhelm 1 , Rainer Wendel 1, *, Martin Aust 2 , Philipp Rosenberg 1 and Frank Henning 1 1 Fraunhofer Institute for Chemical Technology (ICT), Department of Polymer Engineering, Joseph-von-Fraunhofer-Str. 7, 76327 Pfinztal, Germany; [email protected] (M.W.); [email protected] (P.R.); [email protected] (F.H.) 2 Deggendorf Institute of Technology (DIT), Faculty Mechanical Engineering and Mechatronics, 94491 Deggendorf, Germany; [email protected] * Correspondence: [email protected]; Tel.: +49-721-440-710 Received: 28 October 2019; Accepted: 26 December 2019; Published: 9 January 2020 Abstract: The activated anionic ring opening polymerization of ε-caprolactam to polyamide 6 is highly sensitive to external influences such as water. Based onan initial theory, preliminary reaction kinetic tests are carried out with the aim of compensating the influence of the water by increasing the activator and catalyst concentration. Different formulations of activator and catalyst were studied to understand the influence of water on the concentration of activator and catalyst. It was found that the compensation of added water with activator and catalyst restores the original reaction time. The test plates produced are examined with regard to their mechanical characteristics and the polymer properties. The results of the mechanical characterization show no significant impairment after compensation of the added water. The physical properties of the matrix show degradation with repeated compensation. However, the residual ε-caprolactam content remains below the critical value of 1% for three of the four investigated formulations. Keywords: thermoplastic resin; moisture; resin transfer molding; cure behavior; anionic polyamide-6 1. Introduction High damage tolerance, good fatigue behavior, the possibility of functionalization, weldability and the recyclability of the components are the particular advantages of thermoplastic fiber composites (TPCs) compared to their thermoset counterparts [1–4]. TPCs can be processed by either using reactive processing of monomer melts or using melt impregnation with polymer melts (organosheets). The latter has already been used successfully for 40 years in the automotive industry [5]. The reactive processing of ε-caprolactam (CL) into anionically polymerized PA6 (APA6) is only established in casting processes of neat material. For this reason, several institutes and companies worldwide are involved in process development and processing of composites out of this resin combined with fibers [6–11]. A B-pillar reinforcement and a roof reinforcement frame of the Roding Roadster have already been produced as technology demonstrators [12,13]. The low melt viscosity of about 5 mPa·s and the isothermal processability makes ε-caprolactam suitable for use in the Thermoplastic-Resin Transfer Molding process (T-RTM). A general challenge of anionic polymerization is the high sensitivity to proton donors like water. In order to achieve reproducible results in T-RTM manufacturing, it is therefore necessary to know the influencing factors and to be able to compensate them. Composite or sandwich structures are often produced using the T-RTM process. Therefore, used fibers, core materials and other materials like binders on the surface of fabrics take an amount of water into the process. The requirements for a reproducible T-RTM process J. Compos. Sci. 2020, 4, 7; doi:10.3390/jcs4010007 www.mdpi.com/journal/jcs

Welcome message from author
This document is posted to help you gain knowledge. Please leave a comment to let me know what you think about it! Share it to your friends and learn new things together.
Transcript
Article
Compensation of Water Influence on AnionicPolymerization of ε-Caprolactam: 1. Chemistryand Experiments
Michael Wilhelm 1 , Rainer Wendel 1,*, Martin Aust 2, Philipp Rosenberg 1 and Frank Henning 1
1 Fraunhofer Institute for Chemical Technology (ICT), Department of Polymer Engineering,Joseph-von-Fraunhofer-Str. 7, 76327 Pfinztal, Germany; [email protected] (M.W.);[email protected] (P.R.); [email protected] (F.H.)
2 Deggendorf Institute of Technology (DIT), Faculty Mechanical Engineering and Mechatronics,94491 Deggendorf, Germany; [email protected]
* Correspondence: [email protected]; Tel.: +49-721-440-710
Received: 28 October 2019; Accepted: 26 December 2019; Published: 9 January 2020�����������������
Abstract: The activated anionic ring opening polymerization of ε-caprolactam to polyamide 6 ishighly sensitive to external influences such as water. Based on an initial theory, preliminary reactionkinetic tests are carried out with the aim of compensating the influence of the water by increasing theactivator and catalyst concentration. Different formulations of activator and catalyst were studied tounderstand the influence of water on the concentration of activator and catalyst. It was found thatthe compensation of added water with activator and catalyst restores the original reaction time. Thetest plates produced are examined with regard to their mechanical characteristics and the polymerproperties. The results of the mechanical characterization show no significant impairment aftercompensation of the added water. The physical properties of the matrix show degradation withrepeated compensation. However, the residual ε-caprolactam content remains below the criticalvalue of 1% for three of the four investigated formulations.
Keywords: thermoplastic resin; moisture; resin transfer molding; cure behavior; anionic polyamide-6
1. Introduction
High damage tolerance, good fatigue behavior, the possibility of functionalization, weldabilityand the recyclability of the components are the particular advantages of thermoplastic fiber composites(TPCs) compared to their thermoset counterparts [1–4]. TPCs can be processed by either using reactiveprocessing of monomer melts or using melt impregnation with polymer melts (organosheets). The latterhas already been used successfully for 40 years in the automotive industry [5]. The reactive processingof ε-caprolactam (CL) into anionically polymerized PA6 (APA6) is only established in casting processesof neat material. For this reason, several institutes and companies worldwide are involved in processdevelopment and processing of composites out of this resin combined with fibers [6–11]. A B-pillarreinforcement and a roof reinforcement frame of the Roding Roadster have already been produced astechnology demonstrators [12,13].
The low melt viscosity of about 5 mPa·s and the isothermal processability makes ε-caprolactamsuitable for use in the Thermoplastic-Resin Transfer Molding process (T-RTM). A general challengeof anionic polymerization is the high sensitivity to proton donors like water. In order to achievereproducible results in T-RTM manufacturing, it is therefore necessary to know the influencing factorsand to be able to compensate them. Composite or sandwich structures are often produced using theT-RTM process. Therefore, used fibers, core materials and other materials like binders on the surface offabrics take an amount of water into the process. The requirements for a reproducible T-RTM process
J. Compos. Sci. 2020, 4, 7; doi:10.3390/jcs4010007 www.mdpi.com/journal/jcs
J. Compos. Sci. 2020, 4, 7 2 of 19
are to ensure that the total amount of water is low enough to achieve good polymerization. Initialresults show the influence of water on the processing and material properties [8]. The influence ofwater will therefore be examined in detail, along with methods for compensating the influence of waterin the T-RTM process.
It is well known that the anionic polymerization of ε-caprolactam is sensitive to water. To preventpolymerization problems, the water content during the processing of APA6 must be minimized bydrying all materials getting in contact with the resin and through inert gas atmosphere in the injectionmachine [14,15]. The first quantifiable investigations of the polymerization behavior at different watercontents of the reactive mixture were published by Ueda [15]. However, the activators and catalystsused today have different molecular shape so that the results cannot be transferred on the T-RTMprocess. Today, the mainly used materials are ε-caprolactam as monomer, sodium caprolactamate(NaCL) as catalyst and hexamethylen-1,6-diisocyanate (HDI) as activator, see Figure 1.
J. Compos. Sci. 2020, 4, x 2 of 19
using the T-RTM process. Therefore, used fibers, core materials and other materials like binders on the surface of fabrics take an amount of water into the process. The requirements for a reproducible T-RTM process are to ensure that the total amount of water is low enough to achieve good polymerization. Initial results show the influence of water on the processing and material properties [8]. The influence of water will therefore be examined in detail, along with methods for compensating the influence of water in the T-RTM process.
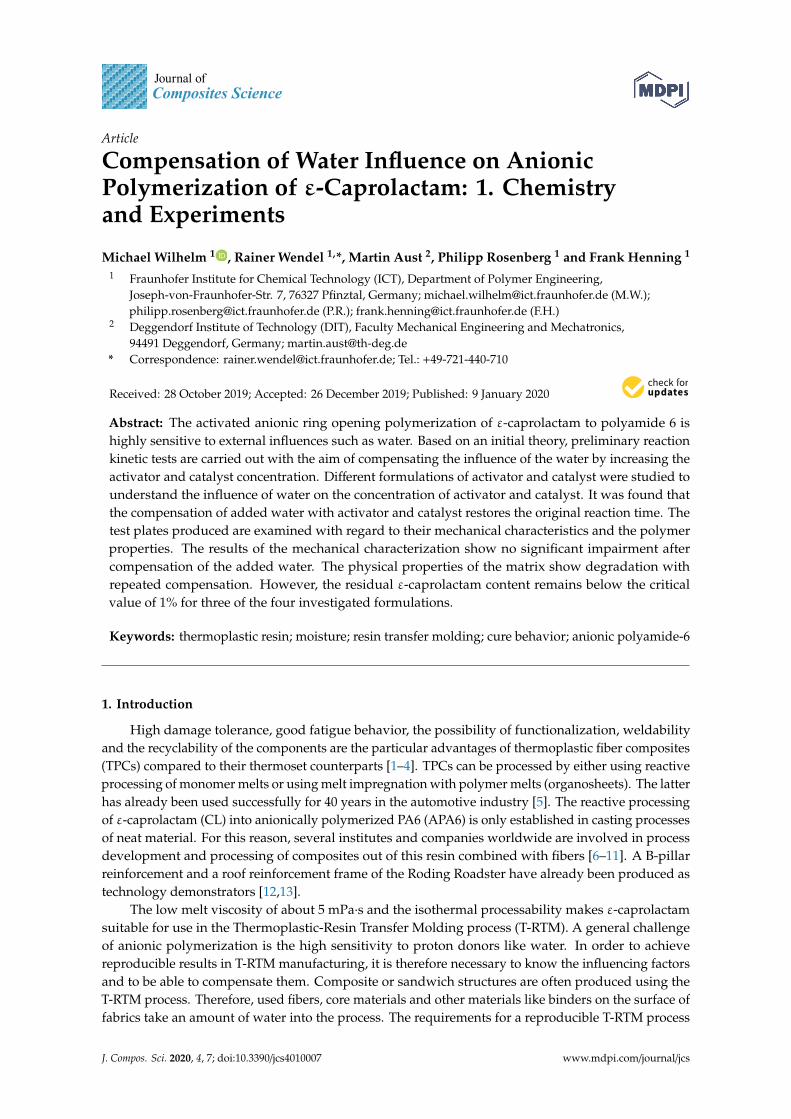
It is well known that the anionic polymerization of ɛ-caprolactam is sensitive to water. To prevent polymerization problems, the water content during the processing of APA6 must be minimized by drying all materials getting in contact with the resin and through inert gas atmosphere in the injection machine [14,15]. The first quantifiable investigations of the polymerization behavior at different water contents of the reactive mixture were published by Ueda [15]. However, the activators and catalysts used today have different molecular shape so that the results cannot be transferred on the T-RTM process. Today, the mainly used materials are ɛ-caprolactam as monomer, sodium caprolactamate (NaCL) as catalyst and hexamethylen-1,6-diisocyanate (HDI) as activator, see Figure 1.
Figure 1. Materials: (a) ɛ-caprolactam (CL), (b) sodium caprolactamate (NaCL), (c) hexamethylen-1,6-diisocyanate (HDI).
An understanding of the influence of moisture on the reaction kinetics and the conversion is essential for robust and reproducible processing of the material. Characterization of the reaction kinetics can be carried out in laboratory scale with beaker tests used by Wittmer and Teuwen in their experiments [16,17]. The polymerization behavior is determined by measuring the temperature rise of the reactive mixture caused by the exothermy of the polymerization during curing. This temperature rise can be described with the enthalpy of reaction in relation to the heat capacity of the material. In this case, cp is the resin heat capacity which is dependent on its conversion degree. With the simplification that the heat capacity of ɛ-caprolactam (cp,CL) corresponds to that of PA6 (cp,PA6) cp,CL
= cp,PA6 and is independent of temperature cp(T) = const., the temperature increase during the exothermic reaction can be calculated according to Equation (1). With the enthalpy of reaction ∆H = 15.6–16.3 kJ/mol and cp = 277–314 J/(K·mol) the theoretical temperature rise is ∆Tmax = 51–56 °C [16–19]. The experimental measurements of Wittmer and Teuwen agree well with this theoretical value which confirms that the energy loss can be neglected and that the experiments can be accepted as semi-adiabatic.
∆Tmax = ∆H/cp. (1)
It is assumed that the activator and catalyst react with water molecules. Therefore, a compensation of water in the monomer components could be realized by specific increase of the activator and catalyst amount. This allows the assumption that the reactivity of the APA6 can be precisely calculated and adjusted by the amount of activator and catalyst in the reactive mixture.
The reactive molecules of activator and catalyst start the ring-opening reaction by forming growing centers. The activator and catalyst can be deactivated by water molecules due to their molecular structure. Figure 2 shows the deblocking reaction (a) of the blocked activator and (b) possible reaction steps for the deactivation of the activator (C20P), a hexamethylene-1,6-diisocyanate (HDI).
Figure 1. Materials: (a) ε-caprolactam (CL), (b) sodium caprolactamate (NaCL), (c) hexamethylen-1,6-diisocyanate (HDI).
An understanding of the influence of moisture on the reaction kinetics and the conversion isessential for robust and reproducible processing of the material. Characterization of the reactionkinetics can be carried out in laboratory scale with beaker tests used by Wittmer and Teuwen in theirexperiments [16,17]. The polymerization behavior is determined by measuring the temperature rise ofthe reactive mixture caused by the exothermy of the polymerization during curing. This temperaturerise can be described with the enthalpy of reaction in relation to the heat capacity of the material. In thiscase, cp is the resin heat capacity which is dependent on its conversion degree. With the simplificationthat the heat capacity of ε-caprolactam (cp,CL) corresponds to that of PA6 (cp,PA6) cp,CL = cp,PA6 and isindependent of temperature cp(T) = const., the temperature increase during the exothermic reactioncan be calculated according to Equation (1). With the enthalpy of reaction ∆H = 15.6–16.3 kJ/mol andcp = 277–314 J/(K·mol) the theoretical temperature rise is ∆Tmax = 51–56 ◦C [16–19]. The experimentalmeasurements of Wittmer and Teuwen agree well with this theoretical value which confirms that theenergy loss can be neglected and that the experiments can be accepted as semi-adiabatic.
∆Tmax = ∆H/cp. (1)
It is assumed that the activator and catalyst react with water molecules. Therefore, a compensationof water in the monomer components could be realized by specific increase of the activator and catalystamount. This allows the assumption that the reactivity of the APA6 can be precisely calculated andadjusted by the amount of activator and catalyst in the reactive mixture.
The reactive molecules of activator and catalyst start the ring-opening reaction by forming growingcenters. The activator and catalyst can be deactivated by water molecules due to their molecularstructure. Figure 2 shows the deblocking reaction (a) of the blocked activator and (b) possible reactionsteps for the deactivation of the activator (C20P), a hexamethylene-1,6-diisocyanate (HDI).
J. Compos. Sci. 2020, 4, 7 3 of 19J. Compos. Sci. 2020, 4, x 3 of 19
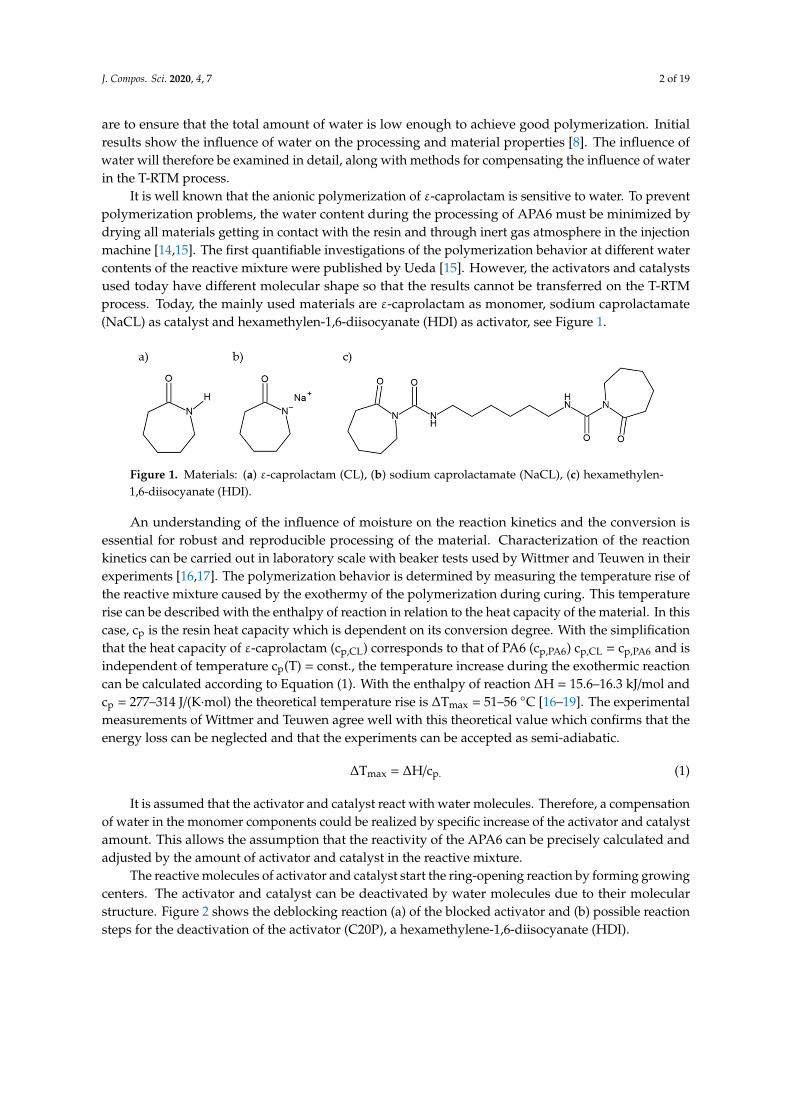
Figure 2. (a) Deblocking of the activator by exceeding the deblocking temperature and (b) possible reaction steps for the deactivation of the activator hexamethylene-1,6-diisocyanate (Brüggolen C20P) by water.
As a feedstock, HDI is blocked on both sides by a caprolactam molecule. In order to start the reaction, the activator must first be unblocked. This reaction is shown in Figure 2a and strongly depends on the temperature. The unblocking temperature (Tdeblocking) must be exceeded to separate the caprolactam molecule from the isocyanate group. Since this process follows an equilibrium reaction, the isocyanate groups will never be unblocked completely. The higher the temperature, the more free ends are available. Van Rijswijk stated Tdeblocking ≥ 160 °C [20]. As long as the deblocking temperature is not exceeded, the activator should be stable against a reaction with water.
Above Tdeblocking (see Figure 2b), the highly reactive isocyanate group (I) reacts with the water molecule to form an unstable carbamic acid (II), which decomposes into a primary diamine (III) and carbon dioxide. Furthermore, a second reaction step is possible. Another isocyanate group can react with the diamine to build a substituted urea (IV). The reaction shows a stoichiometric ratio of 1:2, i.e., one water molecule is able to deactivate two activator molecules.
If water is added to the catalyst (NaCL), different reactions can also take place. Figure 3 shows the respective reaction paths. In the first step, the caprolactam anion (I) is protonated by a proton of a water molecule. A caprolactam ring (II) is formed [16,21]. In the next step, the caprolactam ring is cleaved by the hydroxide and a secondary amine (III) with a carboxyl group is formed. Two subsequent reactions of the secondary amine are possible. First, the negatively charged nitrogen can easily be protonated by the proton of the less alkaline carboxyl group and form a primary amine (IV)
Figure 2. (a) Deblocking of the activator by exceeding the deblocking temperature and (b) possiblereaction steps for the deactivation of the activator hexamethylene-1,6-diisocyanate (Brüggolen C20P)by water.
As a feedstock, HDI is blocked on both sides by a caprolactam molecule. In order to start thereaction, the activator must first be unblocked. This reaction is shown in Figure 2a and stronglydepends on the temperature. The unblocking temperature (Tdeblocking) must be exceeded to separatethe caprolactam molecule from the isocyanate group. Since this process follows an equilibrium reaction,the isocyanate groups will never be unblocked completely. The higher the temperature, the more freeends are available. Van Rijswijk stated Tdeblocking ≥ 160 ◦C [20]. As long as the deblocking temperatureis not exceeded, the activator should be stable against a reaction with water.
Above Tdeblocking (see Figure 2b), the highly reactive isocyanate group (I) reacts with the watermolecule to form an unstable carbamic acid (II), which decomposes into a primary diamine (III) andcarbon dioxide. Furthermore, a second reaction step is possible. Another isocyanate group can reactwith the diamine to build a substituted urea (IV). The reaction shows a stoichiometric ratio of 1:2, i.e.,one water molecule is able to deactivate two activator molecules.
If water is added to the catalyst (NaCL), different reactions can also take place. Figure 3 shows therespective reaction paths. In the first step, the caprolactam anion (I) is protonated by a proton of a watermolecule. A caprolactam ring (II) is formed [16,21]. In the next step, the caprolactam ring is cleaved bythe hydroxide and a secondary amine (III) with a carboxyl group is formed. Two subsequent reactionsof the secondary amine are possible. First, the negatively charged nitrogen can easily be protonated by
J. Compos. Sci. 2020, 4, 7 4 of 19
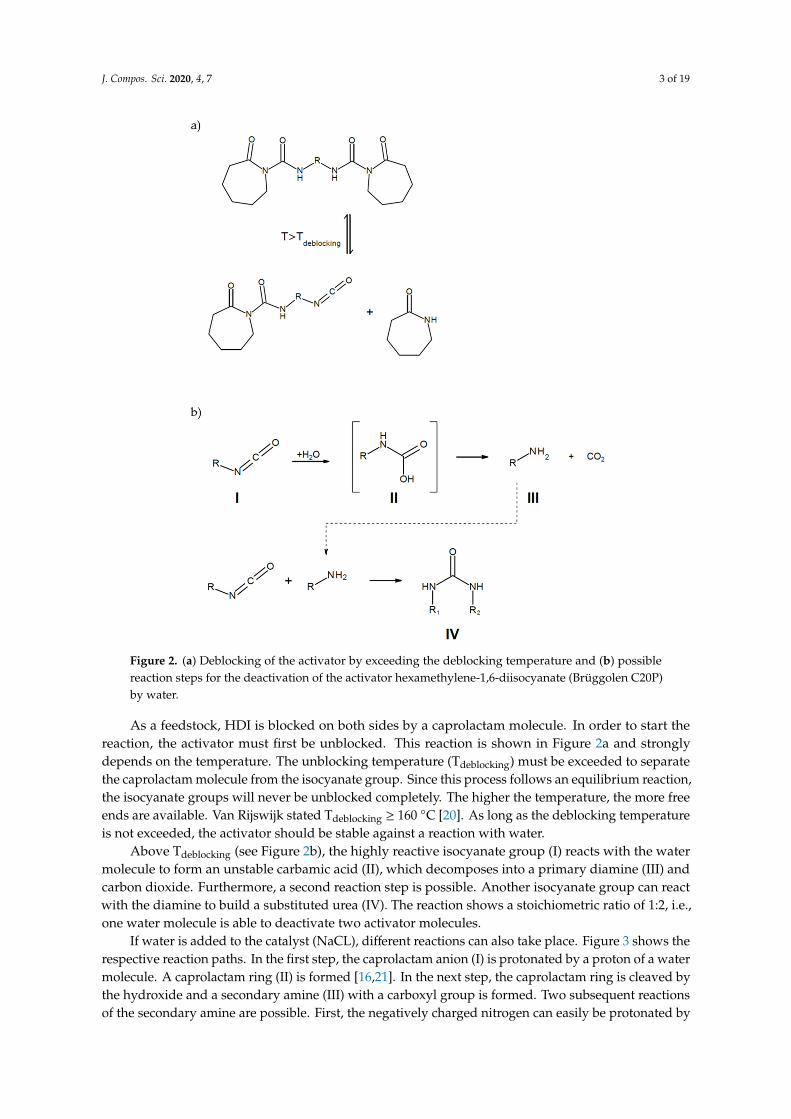
the proton of the less alkaline carboxyl group and form a primary amine (IV) with a carboxylate group(R-COO-). Second, the secondary amine (III) could take another proton of a water molecule and form aprimary amine (V) with a carboxyl group.
J. Compos. Sci. 2020, 4, x 4 of 19
with a carboxylate group (R-COO-). Second, the secondary amine (III) could take another proton of a water molecule and form a primary amine (V) with a carboxyl group.
A reaction of free hydroxide ions with another sodium caprolactamate (I) is not very likely due to the high basicity of the resulting double negatively charged nitrogen.
The possible reaction mechanisms give different ratios from deactivated catalyst molecules to water molecules. If the secondary amine is protonated by the carboxyl group (III → IV), a molar ratio of 1:1 results. If it is protonated by a second water molecule (III → V), the molar ratio results in 1:2 (one catalyst molecule is deactivated by two water molecules). The less likely reaction of a hydroxide ion with a catalyst molecule would lead to a ratio of 2:1. These different ratios lead to the need for experimental proof.
Figure 3. Possible reaction steps for the deactivation of the catalyst sodium caprolactamate (Brüggolen C10) with water.
The reaction of ɛ-caprolactam with water is also called hydrolytic polymerization. By adding a small amount of water (5–10%) [2,22], polyamide 6 is produced within 10–20 h at temperatures of 260–290 °C in an autoclave [23,24]. Since in the T-RTM process neither such high temperatures nor such long times are desired, the reaction of ɛ-caprolactam with water is not relevant for the later experiments.
In a previous study, the authors have investigated four different formulations with different concentrations of activator and catalyst in the monomer ɛ-caprolactam melt. The reaction rate can be calculated from the cavity pressure trend of the experimental results during T-RTM monitoring [8]. Theoretical values can be calculated using the chemical reactions in Figures 2 and 3. The remaining reactive molecules of activator and catalyst are essential for the speed of anionic polymerization. Figure 4 shows the calculated remaining reactive molecules (compact lines, right y-axis). The dotted lines (left y-axis) show the corresponding reaction speed during the experiment [8].
The values of the residual reactive molecules were calculated with the quantities of activator and catalyst molecules inside the activator C20 and catalyst C10 component (activator 85%, catalyst 18%). According to the technical data sheet, ɛ-caprolactam has a maximum water content of 100 ppm [25]. The values of the residual reactive molecules were corrected by 100 ppm, which explains the offset to 100% at 0.00% water.
Figure 3. Possible reaction steps for the deactivation of the catalyst sodium caprolactamate (BrüggolenC10) with water.
A reaction of free hydroxide ions with another sodium caprolactamate (I) is not very likely due tothe high basicity of the resulting double negatively charged nitrogen.
The possible reaction mechanisms give different ratios from deactivated catalyst molecules towater molecules. If the secondary amine is protonated by the carboxyl group (III→ IV), a molar ratioof 1:1 results. If it is protonated by a second water molecule (III→ V), the molar ratio results in 1:2(one catalyst molecule is deactivated by two water molecules). The less likely reaction of a hydroxideion with a catalyst molecule would lead to a ratio of 2:1. These different ratios lead to the need forexperimental proof.
The reaction of ε-caprolactam with water is also called hydrolytic polymerization. By addinga small amount of water (5–10%) [2,22], polyamide 6 is produced within 10–20 h at temperatures of260–290 ◦C in an autoclave [23,24]. Since in the T-RTM process neither such high temperatures nor suchlong times are desired, the reaction of ε-caprolactam with water is not relevant for the later experiments.
In a previous study, the authors have investigated four different formulations with differentconcentrations of activator and catalyst in the monomer ε-caprolactam melt. The reaction rate can becalculated from the cavity pressure trend of the experimental results during T-RTM monitoring [8].Theoretical values can be calculated using the chemical reactions in Figures 2 and 3. The remainingreactive molecules of activator and catalyst are essential for the speed of anionic polymerization.Figure 4 shows the calculated remaining reactive molecules (compact lines, right y-axis). The dottedlines (left y-axis) show the corresponding reaction speed during the experiment [8].
The values of the residual reactive molecules were calculated with the quantities of activator andcatalyst molecules inside the activator C20 and catalyst C10 component (activator 85%, catalyst 18%).According to the technical data sheet, ε-caprolactam has a maximum water content of 100 ppm [25].The values of the residual reactive molecules were corrected by 100 ppm, which explains the offset to100% at 0.00% water.
The two diagrams show that there is a direct, almost linear relationship between the number ofreactive molecules and the reaction time. This shows that the calculated values are basically confirmed.However, based solely on the experimental reaction time, it is not possible to determine the reactiontimes after compensation of the added water amounts. This was validated by the experiments carriedout in this study.
J. Compos. Sci. 2020, 4, 7 5 of 19
J. Compos. Sci. 2020, 4, x 5 of 19
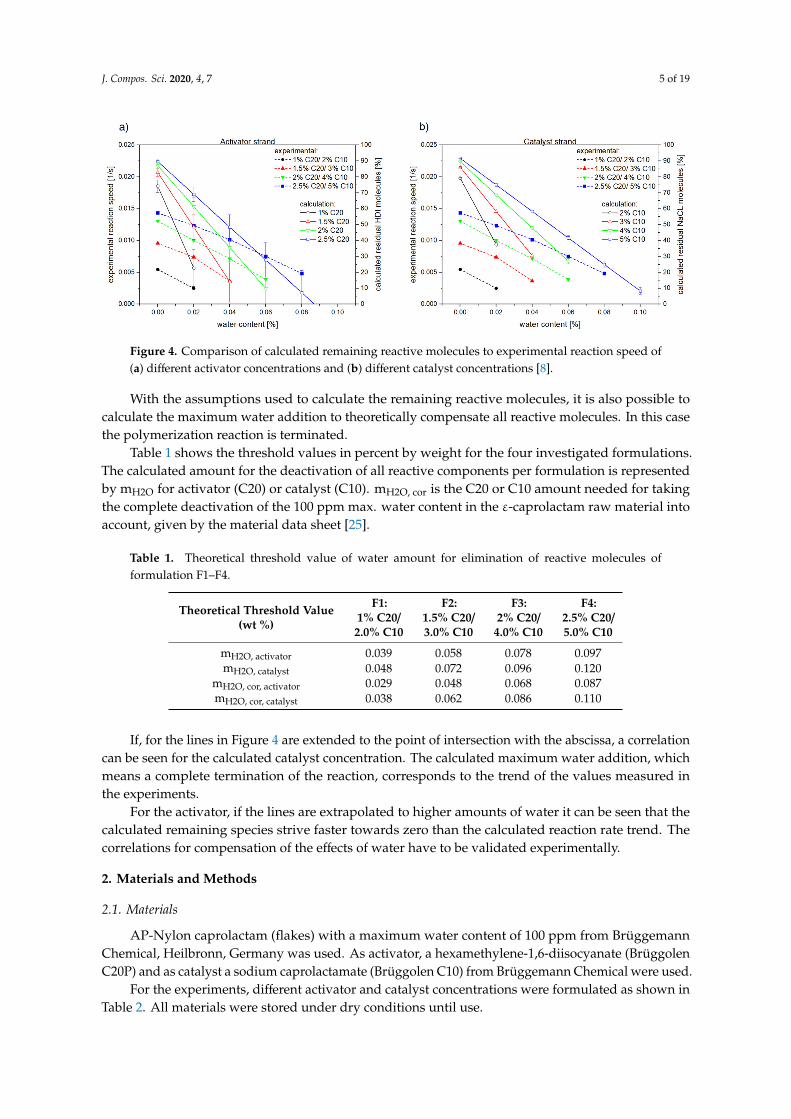
Figure 4. Comparison of calculated remaining reactive molecules to experimental reaction speed of (a) different activator concentrations and (b) different catalyst concentrations [8].
The two diagrams show that there is a direct, almost linear relationship between the number of reactive molecules and the reaction time. This shows that the calculated values are basically confirmed. However, based solely on the experimental reaction time, it is not possible to determine the reaction times after compensation of the added water amounts. This was validated by the experiments carried out in this study.
With the assumptions used to calculate the remaining reactive molecules, it is also possible to calculate the maximum water addition to theoretically compensate all reactive molecules. In this case the polymerization reaction is terminated.
Table 1 shows the threshold values in percent by weight for the four investigated formulations. The calculated amount for the deactivation of all reactive components per formulation is represented by mH2O for activator (C20) or catalyst (C10). mH2O, cor is the C20 or C10 amount needed for taking the complete deactivation of the 100 ppm max. water content in the ɛ-caprolactam raw material into account, given by the material data sheet [25].
Table 1. Theoretical threshold value of water amount for elimination of reactive molecules of formulation F1–F4.
Theoretical Threshold Value (wt %)
F1: 1% C20/ 2.0% C10
F2: 1.5% C20/ 3.0% C10
F3: 2% C20/ 4.0% C10
F4: 2.5% C20/ 5.0% C10
mH2O, activator 0.039 0.058 0.078 0.097
mH2O, catalyst 0.048 0.072 0.096 0.120
mH2O, cor, activator 0.029 0.048 0.068 0.087
mH2O, cor, catalyst 0.038 0.062 0.086 0.110
If, for the lines in Figure 4 are extended to the point of intersection with the abscissa, a correlation can be seen for the calculated catalyst concentration. The calculated maximum water addition, which means a complete termination of the reaction, corresponds to the trend of the values measured in the experiments.
For the activator, if the lines are extrapolated to higher amounts of water it can be seen that the calculated remaining species strive faster towards zero than the calculated reaction rate trend. The correlations for compensation of the effects of water have to be validated experimentally.
Figure 4. Comparison of calculated remaining reactive molecules to experimental reaction speed of(a) different activator concentrations and (b) different catalyst concentrations [8].
With the assumptions used to calculate the remaining reactive molecules, it is also possible tocalculate the maximum water addition to theoretically compensate all reactive molecules. In this casethe polymerization reaction is terminated.
Table 1 shows the threshold values in percent by weight for the four investigated formulations.The calculated amount for the deactivation of all reactive components per formulation is representedby mH2O for activator (C20) or catalyst (C10). mH2O, cor is the C20 or C10 amount needed for takingthe complete deactivation of the 100 ppm max. water content in the ε-caprolactam raw material intoaccount, given by the material data sheet [25].
Table 1. Theoretical threshold value of water amount for elimination of reactive molecules offormulation F1–F4.
Theoretical Threshold Value(wt %)
F1:1% C20/2.0% C10
F2:1.5% C20/3.0% C10
F3:2% C20/
4.0% C10
F4:2.5% C20/5.0% C10
mH2O, activator 0.039 0.058 0.078 0.097mH2O, catalyst 0.048 0.072 0.096 0.120
mH2O, cor, activator 0.029 0.048 0.068 0.087mH2O, cor, catalyst 0.038 0.062 0.086 0.110
If, for the lines in Figure 4 are extended to the point of intersection with the abscissa, a correlationcan be seen for the calculated catalyst concentration. The calculated maximum water addition, whichmeans a complete termination of the reaction, corresponds to the trend of the values measured inthe experiments.
For the activator, if the lines are extrapolated to higher amounts of water it can be seen that thecalculated remaining species strive faster towards zero than the calculated reaction rate trend. Thecorrelations for compensation of the effects of water have to be validated experimentally.
2. Materials and Methods
2.1. Materials
AP-Nylon caprolactam (flakes) with a maximum water content of 100 ppm from BrüggemannChemical, Heilbronn, Germany was used. As activator, a hexamethylene-1,6-diisocyanate (BrüggolenC20P) and as catalyst a sodium caprolactamate (Brüggolen C10) from Brüggemann Chemical were used.
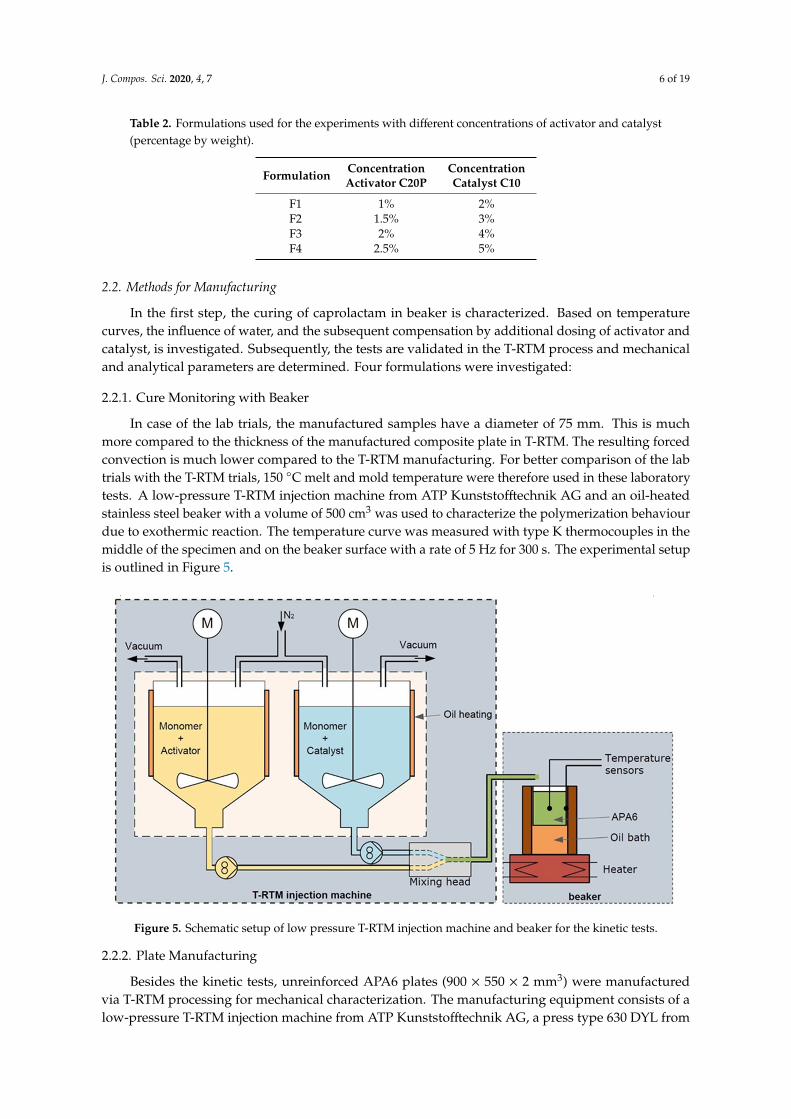
For the experiments, different activator and catalyst concentrations were formulated as shown inTable 2. All materials were stored under dry conditions until use.
J. Compos. Sci. 2020, 4, 7 6 of 19
Table 2. Formulations used for the experiments with different concentrations of activator and catalyst(percentage by weight).
Formulation ConcentrationActivator C20P
ConcentrationCatalyst C10
F1 1% 2%F2 1.5% 3%F3 2% 4%F4 2.5% 5%
2.2. Methods for Manufacturing
In the first step, the curing of caprolactam in beaker is characterized. Based on temperaturecurves, the influence of water, and the subsequent compensation by additional dosing of activator andcatalyst, is investigated. Subsequently, the tests are validated in the T-RTM process and mechanicaland analytical parameters are determined. Four formulations were investigated:
2.2.1. Cure Monitoring with Beaker
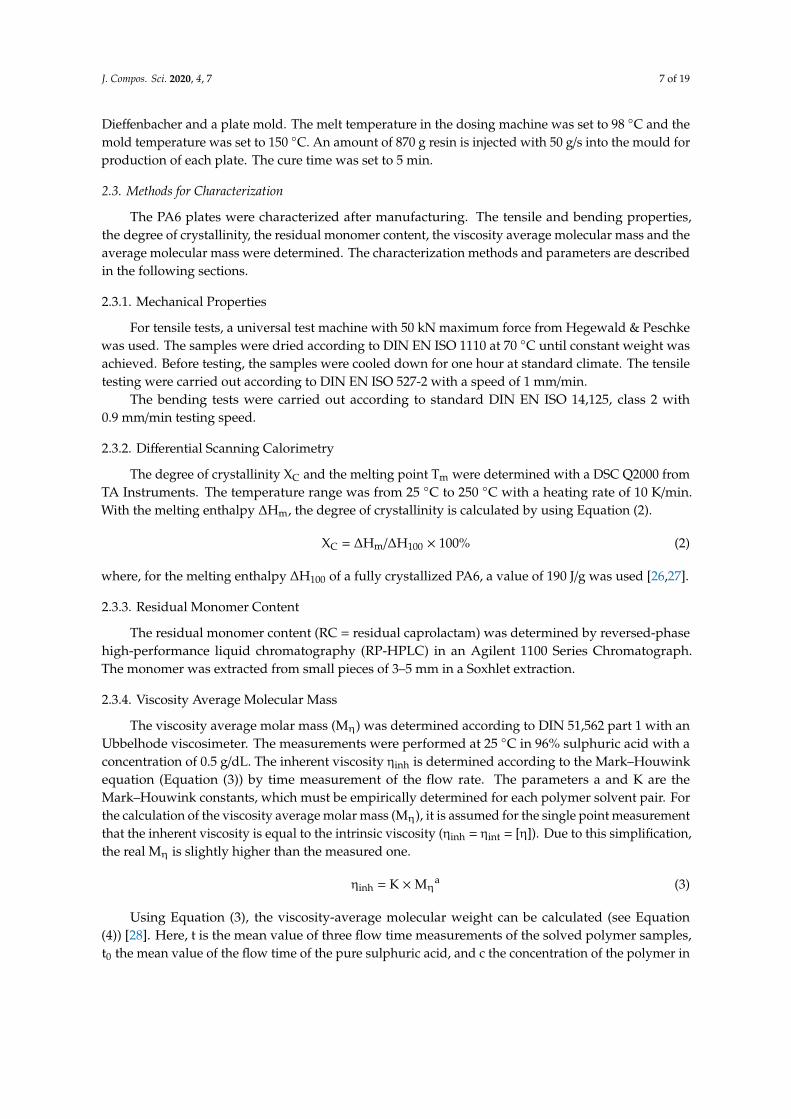
In case of the lab trials, the manufactured samples have a diameter of 75 mm. This is muchmore compared to the thickness of the manufactured composite plate in T-RTM. The resulting forcedconvection is much lower compared to the T-RTM manufacturing. For better comparison of the labtrials with the T-RTM trials, 150 ◦C melt and mold temperature were therefore used in these laboratorytests. A low-pressure T-RTM injection machine from ATP Kunststofftechnik AG and an oil-heatedstainless steel beaker with a volume of 500 cm3 was used to characterize the polymerization behaviourdue to exothermic reaction. The temperature curve was measured with type K thermocouples in themiddle of the specimen and on the beaker surface with a rate of 5 Hz for 300 s. The experimental setupis outlined in Figure 5.J. Compos. Sci. 2020, 4, x 7 of 19
Figure 5. Schematic setup of low pressure T-RTM injection machine and beaker for the kinetic tests.
2.3.1. Mechanical Properties
For tensile tests, a universal test machine with 50 kN maximum force from Hegewald & Peschke was used. The samples were dried according to DIN EN ISO 1110 at 70 °C until constant weight was achieved. Before testing, the samples were cooled down for one hour at standard climate. The tensile testing were carried out according to DIN EN ISO 527-2 with a speed of 1 mm/min.
The bending tests were carried out according to standard DIN EN ISO 14,125, class 2 with 0.9 mm/min testing speed.
2.3.2. Differential Scanning Calorimetry
The degree of crystallinity XC and the melting point Tm were determined with a DSC Q2000 from TA Instruments. The temperature range was from 25 °C to 250 °C with a heating rate of 10 K/min. With the melting enthalpy ∆Hm, the degree of crystallinity is calculated by using Equation (2).
XC = ∆Hm/∆H100 × 100% (2)
where, for the melting enthalpy ∆H100 of a fully crystallized PA6, a value of 190 J/g was used [26,27].
2.3.3. Residual Monomer Content
The residual monomer content (RC = residual caprolactam) was determined by reversed-phase high-performance liquid chromatography (RP-HPLC) in an Agilent 1100 Series Chromatograph. The monomer was extracted from small pieces of 3–5 mm in a Soxhlet extraction.
2.3.4. Viscosity Average Molecular Mass
The viscosity average molar mass (Mη) was determined according to DIN 51,562 part 1 with an Ubbelhode viscosimeter. The measurements were performed at 25 °C in 96% sulphuric acid with a concentration of 0.5 g/dL. The inherent viscosity ηinh is determined according to the Mark–Houwink equation (Equation (3)) by time measurement of the flow rate. The parameters a and K are the Mark–Houwink constants, which must be empirically determined for each polymer solvent pair. For the calculation of the viscosity average molar mass (Mη), it is assumed for the single point measurement that the inherent viscosity is equal to the intrinsic viscosity (ηinh = ηint = [η]). Due to this simplification, the real Mη is slightly higher than the measured one.
Figure 5. Schematic setup of low pressure T-RTM injection machine and beaker for the kinetic tests.
2.2.2. Plate Manufacturing
Besides the kinetic tests, unreinforced APA6 plates (900 × 550 × 2 mm3) were manufacturedvia T-RTM processing for mechanical characterization. The manufacturing equipment consists of alow-pressure T-RTM injection machine from ATP Kunststofftechnik AG, a press type 630 DYL from
J. Compos. Sci. 2020, 4, 7 7 of 19
Dieffenbacher and a plate mold. The melt temperature in the dosing machine was set to 98 ◦C and themold temperature was set to 150 ◦C. An amount of 870 g resin is injected with 50 g/s into the mould forproduction of each plate. The cure time was set to 5 min.
2.3. Methods for Characterization
The PA6 plates were characterized after manufacturing. The tensile and bending properties,the degree of crystallinity, the residual monomer content, the viscosity average molecular mass and theaverage molecular mass were determined. The characterization methods and parameters are describedin the following sections.
2.3.1. Mechanical Properties
For tensile tests, a universal test machine with 50 kN maximum force from Hegewald & Peschkewas used. The samples were dried according to DIN EN ISO 1110 at 70 ◦C until constant weight wasachieved. Before testing, the samples were cooled down for one hour at standard climate. The tensiletesting were carried out according to DIN EN ISO 527-2 with a speed of 1 mm/min.
The bending tests were carried out according to standard DIN EN ISO 14,125, class 2 with0.9 mm/min testing speed.
2.3.2. Differential Scanning Calorimetry
The degree of crystallinity XC and the melting point Tm were determined with a DSC Q2000 fromTA Instruments. The temperature range was from 25 ◦C to 250 ◦C with a heating rate of 10 K/min.With the melting enthalpy ∆Hm, the degree of crystallinity is calculated by using Equation (2).
XC = ∆Hm/∆H100 × 100% (2)
where, for the melting enthalpy ∆H100 of a fully crystallized PA6, a value of 190 J/g was used [26,27].
2.3.3. Residual Monomer Content
The residual monomer content (RC = residual caprolactam) was determined by reversed-phasehigh-performance liquid chromatography (RP-HPLC) in an Agilent 1100 Series Chromatograph.The monomer was extracted from small pieces of 3–5 mm in a Soxhlet extraction.
2.3.4. Viscosity Average Molecular Mass
The viscosity average molar mass (Mη) was determined according to DIN 51,562 part 1 with anUbbelhode viscosimeter. The measurements were performed at 25 ◦C in 96% sulphuric acid with aconcentration of 0.5 g/dL. The inherent viscosity ηinh is determined according to the Mark–Houwinkequation (Equation (3)) by time measurement of the flow rate. The parameters a and K are theMark–Houwink constants, which must be empirically determined for each polymer solvent pair. Forthe calculation of the viscosity average molar mass (Mη), it is assumed for the single point measurementthat the inherent viscosity is equal to the intrinsic viscosity (ηinh = ηint = [η]). Due to this simplification,the real Mη is slightly higher than the measured one.
ηinh = K ×Mηa (3)
Using Equation (3), the viscosity-average molecular weight can be calculated (see Equation(4)) [28]. Here, t is the mean value of three flow time measurements of the solved polymer samples,t0 the mean value of the flow time of the pure sulphuric acid, and c the concentration of the polymer in
J. Compos. Sci. 2020, 4, 7 8 of 19
the solution in (g/100 mL). K and a are the Mark–Houwink constants. In this study K = 7.44 × 10⁻⁴
dL/g and a = 0.745 were used [29].
Mη =
K ∗ c
ln(
tt0
) −
1a
(4)
2.3.5. Average Molecular Mass
The number average molecular weight (Mn) and weight average molecular weight (Mw) weremeasured by gel permeation chromatography (GPC). A LC1100 Agilent was used with HFIP andKTFAc as eluent at a temperature of 35 ◦C. The system was calibrated with PMMA in a range from 602g/mol to 542,000 g/mol.
3. Results and Discussion
Based on the reactions shown in Figures 2 and 3, different ratios of reactive and deactivatedactivator and catalyst molecules are possible. If only the first reaction step will appear, a ratio of 1:1will result. If further reactions take place, the ratio will be 1:2 (one water molecule deactivates tworeactive molecules), or even 2:1. Considering the given concentration range of NaCL in C10 and HDIin C20 from the TDS and MSDS, a second unknown constant arises. For the calculation of the amountof water, an average value of NaCL and HDI was taken. The average value for NaCL in C10 was set to18% (17–19% given in TDS [30]) and the average value for HDI in C20 was set to 85% (70–100% givenin the MSDS [31]).
3.1. Reaction Kinetics
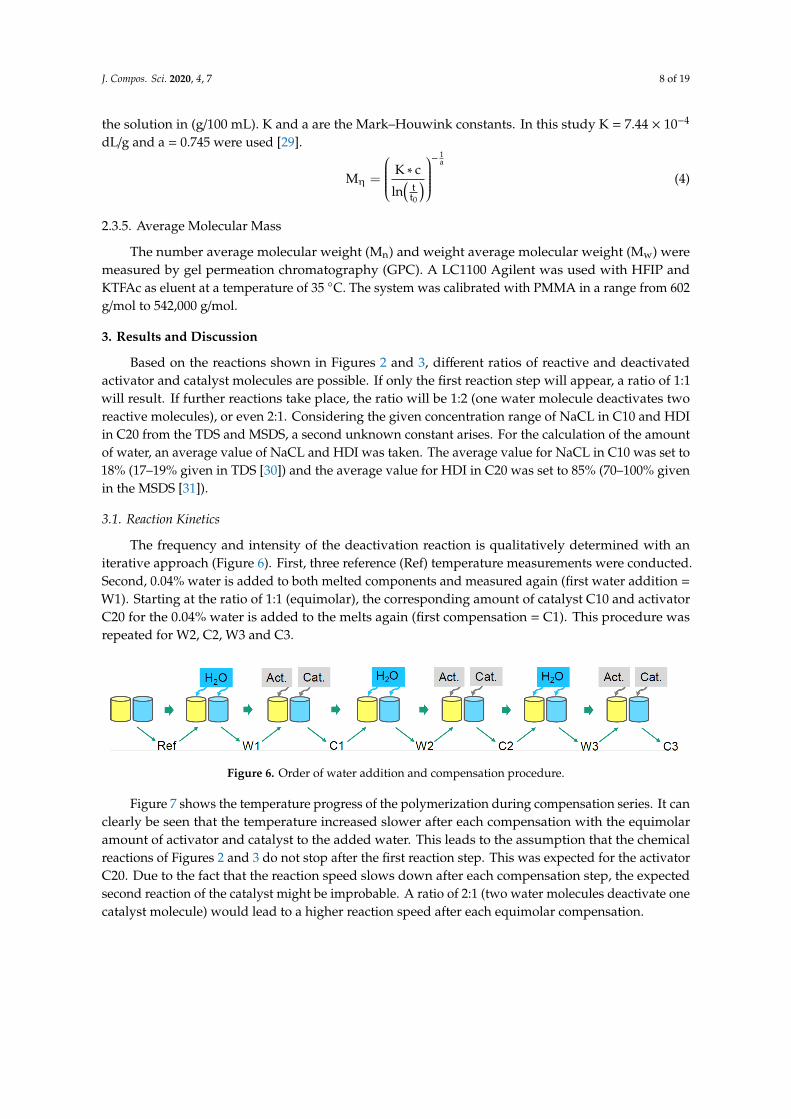
The frequency and intensity of the deactivation reaction is qualitatively determined with aniterative approach (Figure 6). First, three reference (Ref) temperature measurements were conducted.Second, 0.04% water is added to both melted components and measured again (first water addition =
W1). Starting at the ratio of 1:1 (equimolar), the corresponding amount of catalyst C10 and activatorC20 for the 0.04% water is added to the melts again (first compensation = C1). This procedure wasrepeated for W2, C2, W3 and C3.
J. Compos. Sci. 2020, 4, x 8 of 19
ηinh = K × Mηa (3)
Using Equation (3), the viscosity-average molecular weight can be calculated (see Equation (4)) [28]. Here, t is the mean value of three flow time measurements of the solved polymer samples, t0 the mean value of the flow time of the pure sulphuric acid, and c the concentration of the polymer in the solution in (g/100 mL). K and a are the Mark–Houwink constants. In this study K = 7.44 × 10⁻⁴ dL/g and a = 0.745 were used [29]. M = ∗ (4)
2.3.5. Average Molecular Mass
The number average molecular weight (Mn) and weight average molecular weight (Mw) were measured by gel permeation chromatography (GPC). A LC1100 Agilent was used with HFIP and KTFAc as eluent at a temperature of 35 °C. The system was calibrated with PMMA in a range from 602 g/mol to 542,000 g/mol.
3. Results and Discussion
Based on the reactions shown in Figures 2 and 3, different ratios of reactive and deactivated activator and catalyst molecules are possible. If only the first reaction step will appear, a ratio of 1:1 will result. If further reactions take place, the ratio will be 1:2 (one water molecule deactivates two reactive molecules), or even 2:1. Considering the given concentration range of NaCL in C10 and HDI in C20 from the TDS and MSDS, a second unknown constant arises. For the calculation of the amount of water, an average value of NaCL and HDI was taken. The average value for NaCL in C10 was set to 18% (17–19% given in TDS [30]) and the average value for HDI in C20 was set to 85% (70–100% given in the MSDS [31]).
3.1. Reaction Kinetics
The frequency and intensity of the deactivation reaction is qualitatively determined with an iterative approach (Figure 6). First, three reference (Ref) temperature measurements were conducted. Second, 0.04% water is added to both melted components and measured again (first water addition = W1). Starting at the ratio of 1:1 (equimolar), the corresponding amount of catalyst C10 and activator C20 for the 0.04% water is added to the melts again (first compensation = C1). This procedure was repeated for W2, C2, W3 and C3.
Figure 6. Order of water addition and compensation procedure.
Figure 7 shows the temperature progress of the polymerization during compensation series. It can clearly be seen that the temperature increased slower after each compensation with the equimolar amount of activator and catalyst to the added water. This leads to the assumption that the chemical reactions of Figures 2 and 3 do not stop after the first reaction step. This was expected for the activator C20. Due to the fact that the reaction speed slows down after each compensation step, the expected second reaction of the catalyst might be improbable. A ratio of 2:1 (two water molecules deactivate one catalyst molecule) would lead to a higher reaction speed after each equimolar compensation.
Figure 6. Order of water addition and compensation procedure.
Figure 7 shows the temperature progress of the polymerization during compensation series. It canclearly be seen that the temperature increased slower after each compensation with the equimolaramount of activator and catalyst to the added water. This leads to the assumption that the chemicalreactions of Figures 2 and 3 do not stop after the first reaction step. This was expected for the activatorC20. Due to the fact that the reaction speed slows down after each compensation step, the expectedsecond reaction of the catalyst might be improbable. A ratio of 2:1 (two water molecules deactivate onecatalyst molecule) would lead to a higher reaction speed after each equimolar compensation.
J. Compos. Sci. 2020, 4, 7 9 of 19J. Compos. Sci. 2020, 4, x 9 of 19
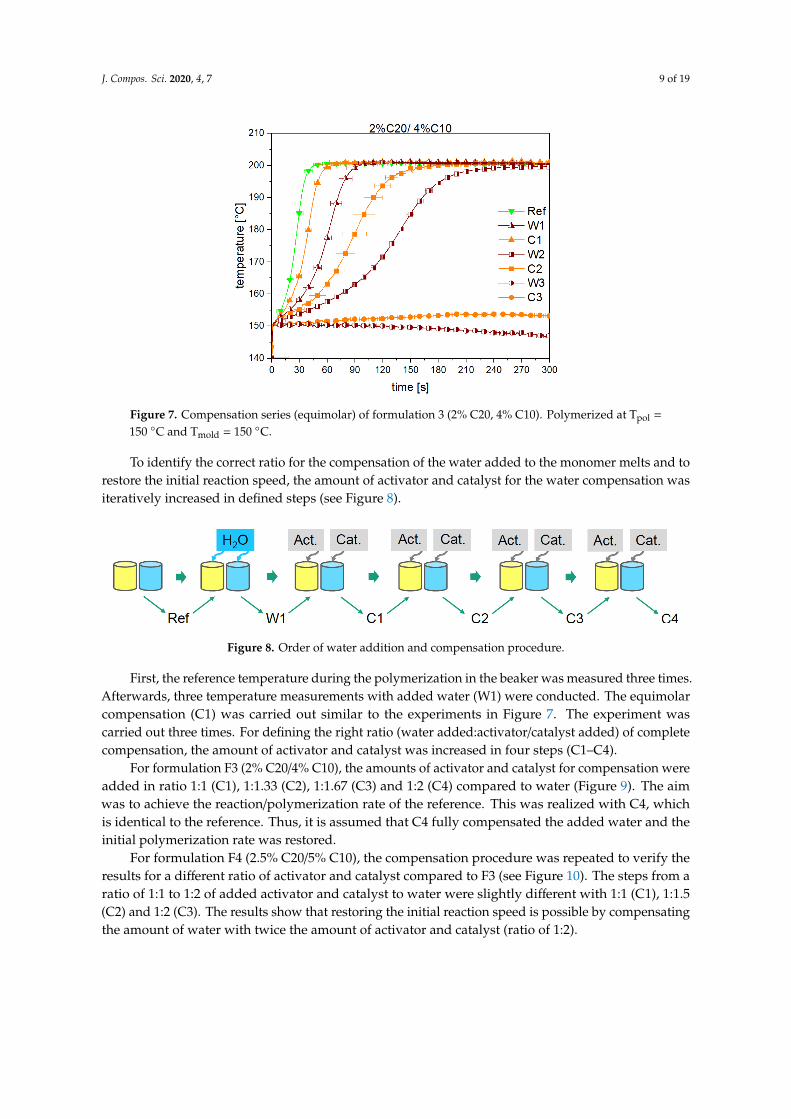
Figure 7. Compensation series (equimolar) of formulation 3 (2% C20, 4% C10). Polymerized at Tpol = 150 °C and Tmold = 150 °C.
To identify the correct ratio for the compensation of the water added to the monomer melts and to restore the initial reaction speed, the amount of activator and catalyst for the water compensation was iteratively increased in defined steps (see Figure 8).
First, the reference temperature during the polymerization in the beaker was measured three times. Afterwards, three temperature measurements with added water (W1) were conducted. The equimolar compensation (C1) was carried out similar to the experiments in Figure 7. The experiment was carried out three times. For defining the right ratio (water added:activator/catalyst added) of complete compensation, the amount of activator and catalyst was increased in four steps (C1–C4).
For formulation F3 (2% C20/4% C10), the amounts of activator and catalyst for compensation were added in ratio 1:1 (C1), 1:1.33 (C2), 1:1.67 (C3) and 1:2 (C4) compared to water (Figure 9). The aim was to achieve the reaction/polymerization rate of the reference. This was realized with C4, which is identical to the reference. Thus, it is assumed that C4 fully compensated the added water and the initial polymerization rate was restored.
Figure 8. Order of water addition and compensation procedure.
Figure 7. Compensation series (equimolar) of formulation 3 (2% C20, 4% C10). Polymerized at Tpol =
150 ◦C and Tmold = 150 ◦C.
To identify the correct ratio for the compensation of the water added to the monomer melts and torestore the initial reaction speed, the amount of activator and catalyst for the water compensation wasiteratively increased in defined steps (see Figure 8).
J. Compos. Sci. 2020, 4, x 9 of 19
Figure 7. Compensation series (equimolar) of formulation 3 (2% C20, 4% C10). Polymerized at Tpol = 150 °C and Tmold = 150 °C.
To identify the correct ratio for the compensation of the water added to the monomer melts and to restore the initial reaction speed, the amount of activator and catalyst for the water compensation was iteratively increased in defined steps (see Figure 8).
First, the reference temperature during the polymerization in the beaker was measured three times. Afterwards, three temperature measurements with added water (W1) were conducted. The equimolar compensation (C1) was carried out similar to the experiments in Figure 7. The experiment was carried out three times. For defining the right ratio (water added:activator/catalyst added) of complete compensation, the amount of activator and catalyst was increased in four steps (C1–C4).
For formulation F3 (2% C20/4% C10), the amounts of activator and catalyst for compensation were added in ratio 1:1 (C1), 1:1.33 (C2), 1:1.67 (C3) and 1:2 (C4) compared to water (Figure 9). The aim was to achieve the reaction/polymerization rate of the reference. This was realized with C4, which is identical to the reference. Thus, it is assumed that C4 fully compensated the added water and the initial polymerization rate was restored.
Figure 8. Order of water addition and compensation procedure. Figure 8. Order of water addition and compensation procedure.
First, the reference temperature during the polymerization in the beaker was measured three times.Afterwards, three temperature measurements with added water (W1) were conducted. The equimolarcompensation (C1) was carried out similar to the experiments in Figure 7. The experiment wascarried out three times. For defining the right ratio (water added:activator/catalyst added) of completecompensation, the amount of activator and catalyst was increased in four steps (C1–C4).
For formulation F3 (2% C20/4% C10), the amounts of activator and catalyst for compensation wereadded in ratio 1:1 (C1), 1:1.33 (C2), 1:1.67 (C3) and 1:2 (C4) compared to water (Figure 9). The aimwas to achieve the reaction/polymerization rate of the reference. This was realized with C4, whichis identical to the reference. Thus, it is assumed that C4 fully compensated the added water and theinitial polymerization rate was restored.
For formulation F4 (2.5% C20/5% C10), the compensation procedure was repeated to verify theresults for a different ratio of activator and catalyst compared to F3 (see Figure 10). The steps from aratio of 1:1 to 1:2 of added activator and catalyst to water were slightly different with 1:1 (C1), 1:1.5(C2) and 1:2 (C3). The results show that restoring the initial reaction speed is possible by compensatingthe amount of water with twice the amount of activator and catalyst (ratio of 1:2).
J. Compos. Sci. 2020, 4, 7 10 of 19
J. Compos. Sci. 2020, 4, x 10 of 19
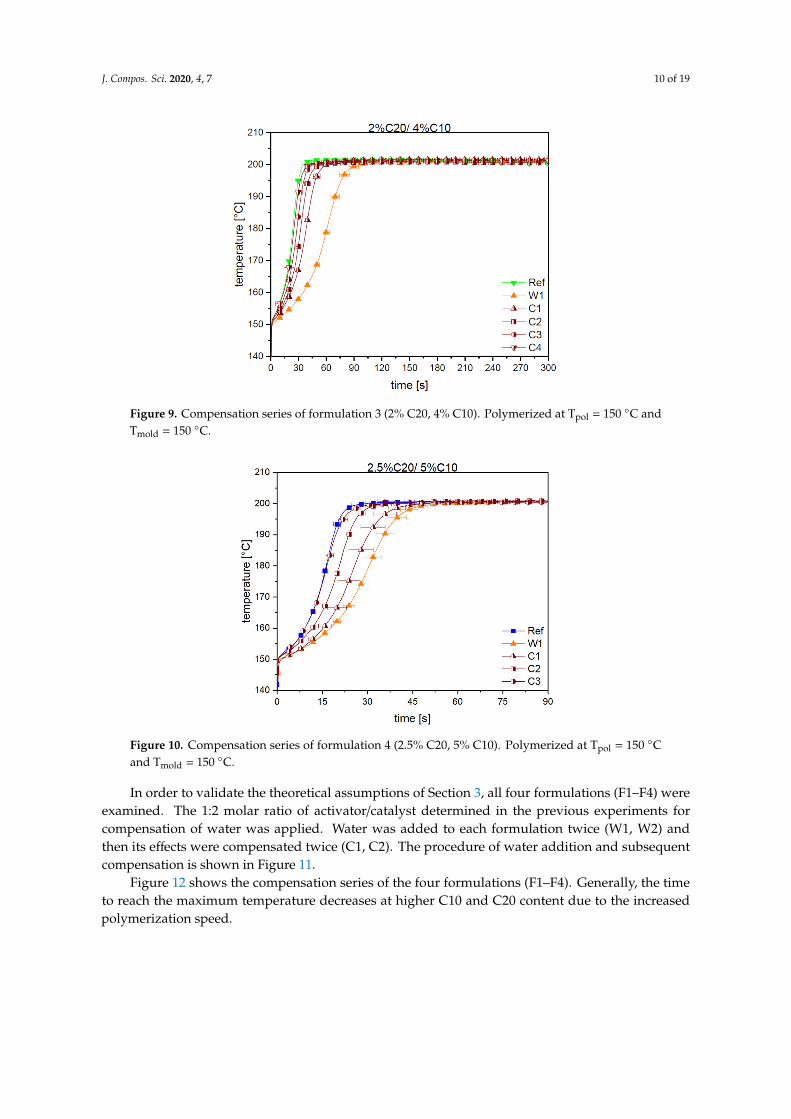
Figure 9. Compensation series of formulation 3 (2% C20, 4% C10). Polymerized at Tpol = 150 °C and Tmold = 150 °C.
For formulation F4 (2.5% C20/5% C10), the compensation procedure was repeated to verify the results for a different ratio of activator and catalyst compared to F3 (see Figure 10). The steps from a ratio of 1:1 to 1:2 of added activator and catalyst to water were slightly different with 1:1 (C1), 1:1.5 (C2) and 1:2 (C3). The results show that restoring the initial reaction speed is possible by compensating the amount of water with twice the amount of activator and catalyst (ratio of 1:2).
Figure 10. Compensation series of formulation 4 (2.5% C20, 5% C10). Polymerized at Tpol = 150 °C and Tmold = 150 °C.
In order to validate the theoretical assumptions of Section 3, all four formulations (F1–F4) were examined. The 1:2 molar ratio of activator/catalyst determined in the previous experiments for compensation of water was applied. Water was added to each formulation twice (W1, W2) and then its effects were compensated twice (C1, C2). The procedure of water addition and subsequent compensation is shown in Figure 11.
Figure 9. Compensation series of formulation 3 (2% C20, 4% C10). Polymerized at Tpol = 150 ◦C andTmold = 150 ◦C.
J. Compos. Sci. 2020, 4, x 10 of 19
Figure 9. Compensation series of formulation 3 (2% C20, 4% C10). Polymerized at Tpol = 150 °C and Tmold = 150 °C.
For formulation F4 (2.5% C20/5% C10), the compensation procedure was repeated to verify the results for a different ratio of activator and catalyst compared to F3 (see Figure 10). The steps from a ratio of 1:1 to 1:2 of added activator and catalyst to water were slightly different with 1:1 (C1), 1:1.5 (C2) and 1:2 (C3). The results show that restoring the initial reaction speed is possible by compensating the amount of water with twice the amount of activator and catalyst (ratio of 1:2).
Figure 10. Compensation series of formulation 4 (2.5% C20, 5% C10). Polymerized at Tpol = 150 °C and Tmold = 150 °C.
In order to validate the theoretical assumptions of Section 3, all four formulations (F1–F4) were examined. The 1:2 molar ratio of activator/catalyst determined in the previous experiments for compensation of water was applied. Water was added to each formulation twice (W1, W2) and then its effects were compensated twice (C1, C2). The procedure of water addition and subsequent compensation is shown in Figure 11.
Figure 10. Compensation series of formulation 4 (2.5% C20, 5% C10). Polymerized at Tpol = 150 ◦Cand Tmold = 150 ◦C.
In order to validate the theoretical assumptions of Section 3, all four formulations (F1–F4) wereexamined. The 1:2 molar ratio of activator/catalyst determined in the previous experiments forcompensation of water was applied. Water was added to each formulation twice (W1, W2) andthen its effects were compensated twice (C1, C2). The procedure of water addition and subsequentcompensation is shown in Figure 11.
Figure 12 shows the compensation series of the four formulations (F1–F4). Generally, the timeto reach the maximum temperature decreases at higher C10 and C20 content due to the increasedpolymerization speed.
J. Compos. Sci. 2020, 4, 7 11 of 19J. Compos. Sci. 2020, 4, x 11 of 19
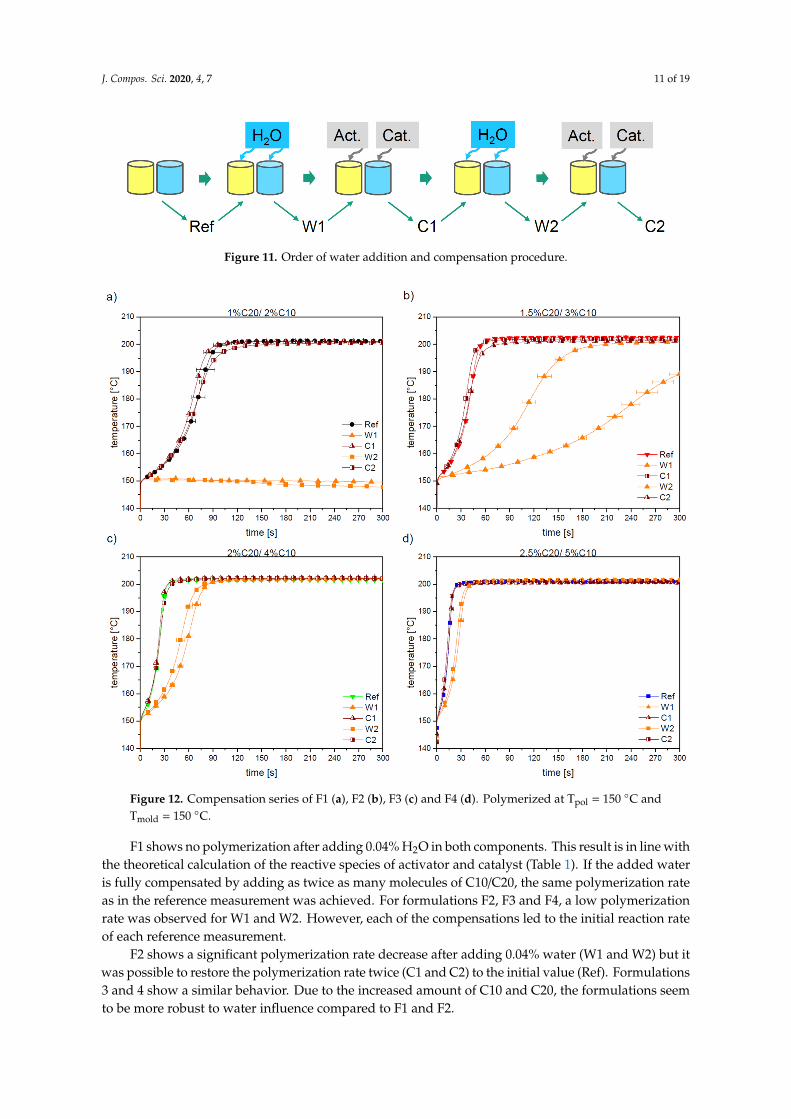
Figure 11. Order of water addition and compensation procedure.
Figure 12 shows the compensation series of the four formulations (F1–F4). Generally, the time to reach the maximum temperature decreases at higher C10 and C20 content due to the increased polymerization speed.
F1 shows no polymerization after adding 0.04% H2O in both components. This result is in line with the theoretical calculation of the reactive species of activator and catalyst (Table 1). If the added water is fully compensated by adding as twice as many molecules of C10/C20, the same polymerization rate as in the reference measurement was achieved. For formulations F2, F3 and F4, a low polymerization rate was observed for W1 and W2. However, each of the compensations led to the initial reaction rate of each reference measurement.
F2 shows a significant polymerization rate decrease after adding 0.04% water (W1 and W2) but it was possible to restore the polymerization rate twice (C1 and C2) to the initial value (Ref). Formulations 3 and 4 show a similar behavior. Due to the increased amount of C10 and C20, the formulations seem to be more robust to water influence compared to F1 and F2.
Figure 12. Compensation series of F1 (a), F2 (b), F3 (c) and F4 (d). Polymerized at Tpol = 150 °C and Tmold = 150 °C.
Figure 11. Order of water addition and compensation procedure.
J. Compos. Sci. 2020, 4, x 11 of 19
Figure 11. Order of water addition and compensation procedure.
Figure 12 shows the compensation series of the four formulations (F1–F4). Generally, the time to reach the maximum temperature decreases at higher C10 and C20 content due to the increased polymerization speed.
F1 shows no polymerization after adding 0.04% H2O in both components. This result is in line with the theoretical calculation of the reactive species of activator and catalyst (Table 1). If the added water is fully compensated by adding as twice as many molecules of C10/C20, the same polymerization rate as in the reference measurement was achieved. For formulations F2, F3 and F4, a low polymerization rate was observed for W1 and W2. However, each of the compensations led to the initial reaction rate of each reference measurement.
F2 shows a significant polymerization rate decrease after adding 0.04% water (W1 and W2) but it was possible to restore the polymerization rate twice (C1 and C2) to the initial value (Ref). Formulations 3 and 4 show a similar behavior. Due to the increased amount of C10 and C20, the formulations seem to be more robust to water influence compared to F1 and F2.
Figure 12. Compensation series of F1 (a), F2 (b), F3 (c) and F4 (d). Polymerized at Tpol = 150 °C and Tmold = 150 °C. Figure 12. Compensation series of F1 (a), F2 (b), F3 (c) and F4 (d). Polymerized at Tpol = 150 ◦C andTmold = 150 ◦C.
F1 shows no polymerization after adding 0.04% H2O in both components. This result is in line withthe theoretical calculation of the reactive species of activator and catalyst (Table 1). If the added wateris fully compensated by adding as twice as many molecules of C10/C20, the same polymerization rateas in the reference measurement was achieved. For formulations F2, F3 and F4, a low polymerizationrate was observed for W1 and W2. However, each of the compensations led to the initial reaction rateof each reference measurement.
F2 shows a significant polymerization rate decrease after adding 0.04% water (W1 and W2) but itwas possible to restore the polymerization rate twice (C1 and C2) to the initial value (Ref). Formulations3 and 4 show a similar behavior. Due to the increased amount of C10 and C20, the formulations seemto be more robust to water influence compared to F1 and F2.
J. Compos. Sci. 2020, 4, 7 12 of 19
Thus, with regard to the initial amount of reactive components in the formulations, the influenceof water on the reaction rate decreases with increasing concentration of activator and catalyst. Theevaluation of the curves alone cannot provide a justification for the same properties of referenceand compensated samples. Therefore, APA6 test plates were manufactured with water charged andcompensated monomer material to characterize and validate the mechanical and physical properties.
3.2. Material Properties of Compensated APA6 Samples
The influence of the compensation is evaluated on the basis of the physical andmechanical properties.
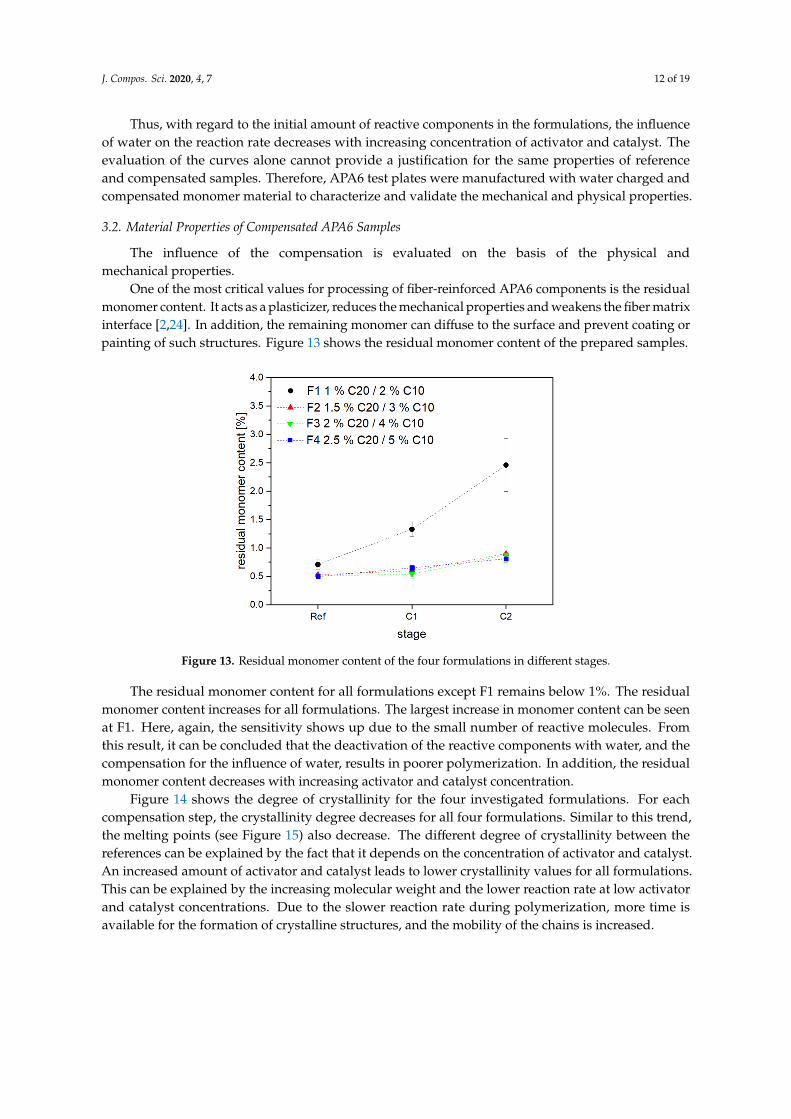
One of the most critical values for processing of fiber-reinforced APA6 components is the residualmonomer content. It acts as a plasticizer, reduces the mechanical properties and weakens the fiber matrixinterface [2,24]. In addition, the remaining monomer can diffuse to the surface and prevent coating orpainting of such structures. Figure 13 shows the residual monomer content of the prepared samples.
J. Compos. Sci. 2020, 4, x 12 of 19
Thus, with regard to the initial amount of reactive components in the formulations, the influence of water on the reaction rate decreases with increasing concentration of activator and catalyst. The evaluation of the curves alone cannot provide a justification for the same properties of reference and compensated samples. Therefore, APA6 test plates were manufactured with water charged and compensated monomer material to characterize and validate the mechanical and physical properties.
3.2. Material Properties of Compensated APA6 Samples
The influence of the compensation is evaluated on the basis of the physical and mechanical properties.
One of the most critical values for processing of fiber-reinforced APA6 components is the residual monomer content. It acts as a plasticizer, reduces the mechanical properties and weakens the fiber matrix interface [2,24]. In addition, the remaining monomer can diffuse to the surface and prevent coating or painting of such structures. Figure 13 shows the residual monomer content of the prepared samples.
The residual monomer content for all formulations except F1 remains below 1%. The residual monomer content increases for all formulations. The largest increase in monomer content can be seen at F1. Here, again, the sensitivity shows up due to the small number of reactive molecules. From this result, it can be concluded that the deactivation of the reactive components with water, and the compensation for the influence of water, results in poorer polymerization. In addition, the residual monomer content decreases with increasing activator and catalyst concentration.
Figure 13. Residual monomer content of the four formulations in different stages.
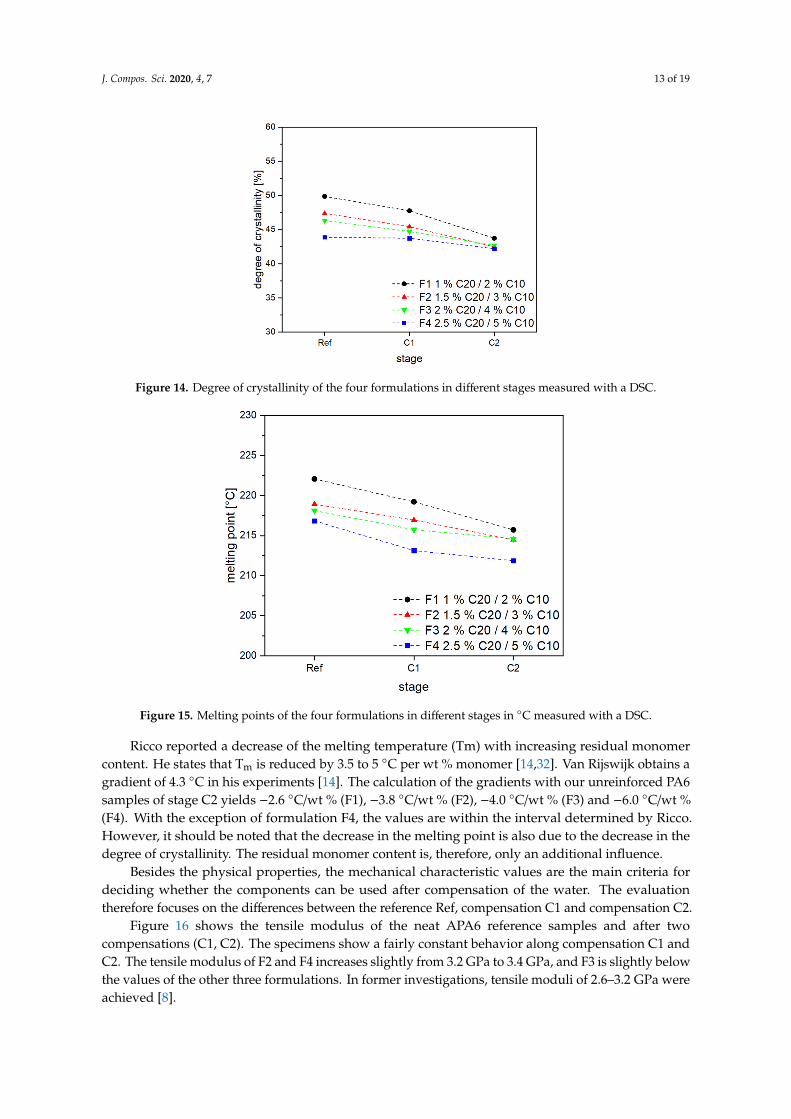
Figure 14 shows the degree of crystallinity for the four investigated formulations. For each compensation step, the crystallinity degree decreases for all four formulations. Similar to this trend, the melting points (see Figure 15) also decrease. The different degree of crystallinity between the references can be explained by the fact that it depends on the concentration of activator and catalyst. An increased amount of activator and catalyst leads to lower crystallinity values for all formulations. This can be explained by the increasing molecular weight and the lower reaction rate at low activator and catalyst concentrations. Due to the slower reaction rate during polymerization, more time is available for the formation of crystalline structures, and the mobility of the chains is increased.
Figure 13. Residual monomer content of the four formulations in different stages.
The residual monomer content for all formulations except F1 remains below 1%. The residualmonomer content increases for all formulations. The largest increase in monomer content can be seenat F1. Here, again, the sensitivity shows up due to the small number of reactive molecules. Fromthis result, it can be concluded that the deactivation of the reactive components with water, and thecompensation for the influence of water, results in poorer polymerization. In addition, the residualmonomer content decreases with increasing activator and catalyst concentration.
Figure 14 shows the degree of crystallinity for the four investigated formulations. For eachcompensation step, the crystallinity degree decreases for all four formulations. Similar to this trend,the melting points (see Figure 15) also decrease. The different degree of crystallinity between thereferences can be explained by the fact that it depends on the concentration of activator and catalyst.An increased amount of activator and catalyst leads to lower crystallinity values for all formulations.This can be explained by the increasing molecular weight and the lower reaction rate at low activatorand catalyst concentrations. Due to the slower reaction rate during polymerization, more time isavailable for the formation of crystalline structures, and the mobility of the chains is increased.
J. Compos. Sci. 2020, 4, 7 13 of 19
J. Compos. Sci. 2020, 4, x 13 of 19
Figure 14. Degree of crystallinity of the four formulations in different stages measured with a DSC.
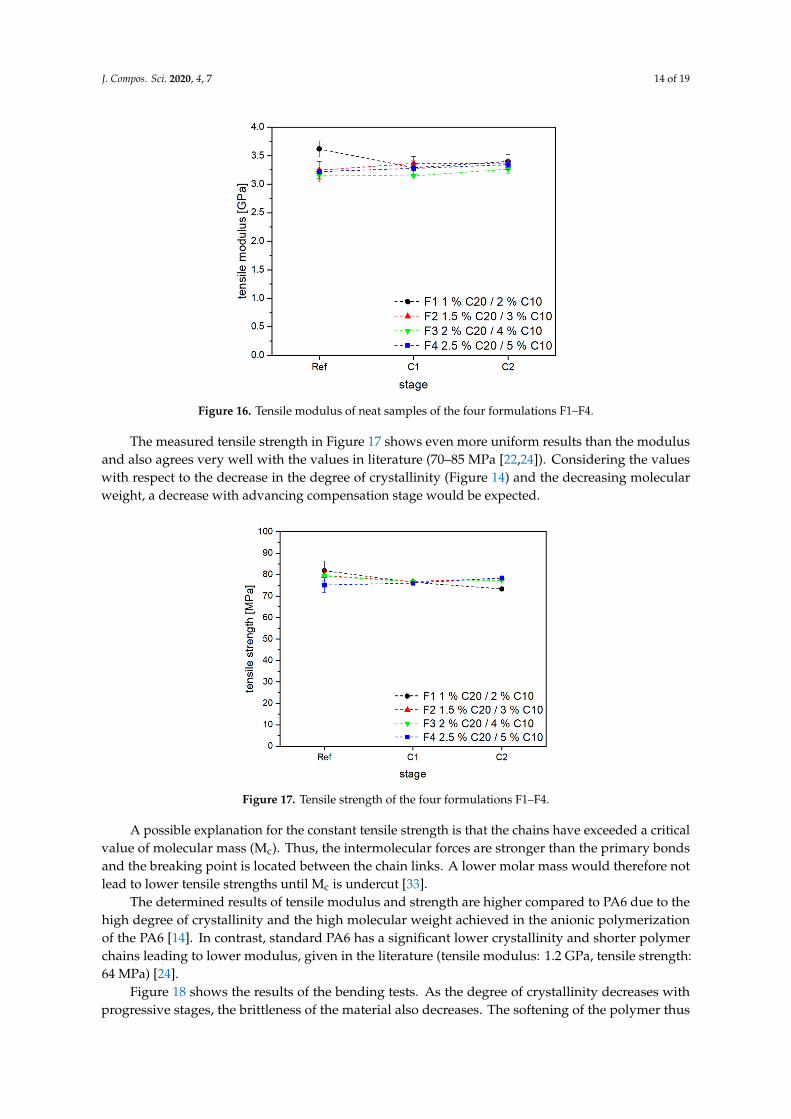
Ricco reported a decrease of the melting temperature (Tm) with increasing residual monomer content. He states that Tm is reduced by 3.5 to 5 °C per wt % monomer [14,32]. Van Rijswijk obtains a gradient of 4.3 °C in his experiments [14]. The calculation of the gradients with our unreinforced PA6 samples of stage C2 yields −2.6 °C/wt % (F1), −3.8 °C/wt % (F2), −4.0 °C/wt % (F3) and −6.0 °C/wt % (F4). With the exception of formulation F4, the values are within the interval determined by Ricco. However, it should be noted that the decrease in the melting point is also due to the decrease in the degree of crystallinity. The residual monomer content is, therefore, only an additional influence.
Figure 15. Melting points of the four formulations in different stages in °C measured with a DSC.
Besides the physical properties, the mechanical characteristic values are the main criteria for deciding whether the components can be used after compensation of the water. The evaluation therefore focuses on the differences between the reference Ref, compensation C1 and compensation C2.
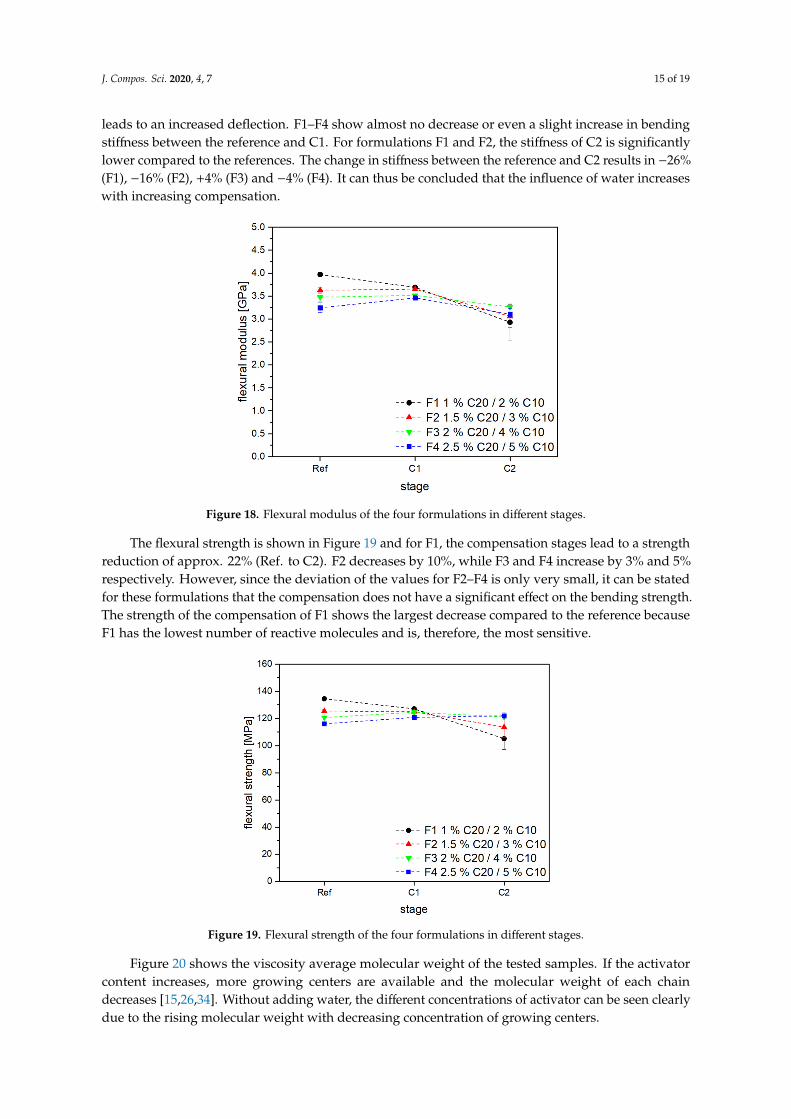
Figure 16 shows the tensile modulus of the neat APA6 reference samples and after two compensations (C1, C2). The specimens show a fairly constant behavior along compensation C1 and C2. The tensile modulus of F2 and F4 increases slightly from 3.2 GPa to 3.4 GPa, and F3 is slightly below the values of the other three formulations. In former investigations, tensile moduli of 2.6–3.2 GPa were achieved [8].
Figure 14. Degree of crystallinity of the four formulations in different stages measured with a DSC.
J. Compos. Sci. 2020, 4, x 13 of 19
Figure 14. Degree of crystallinity of the four formulations in different stages measured with a DSC.
Ricco reported a decrease of the melting temperature (Tm) with increasing residual monomer content. He states that Tm is reduced by 3.5 to 5 °C per wt % monomer [14,32]. Van Rijswijk obtains a gradient of 4.3 °C in his experiments [14]. The calculation of the gradients with our unreinforced PA6 samples of stage C2 yields −2.6 °C/wt % (F1), −3.8 °C/wt % (F2), −4.0 °C/wt % (F3) and −6.0 °C/wt % (F4). With the exception of formulation F4, the values are within the interval determined by Ricco. However, it should be noted that the decrease in the melting point is also due to the decrease in the degree of crystallinity. The residual monomer content is, therefore, only an additional influence.
Figure 15. Melting points of the four formulations in different stages in °C measured with a DSC.
Besides the physical properties, the mechanical characteristic values are the main criteria for deciding whether the components can be used after compensation of the water. The evaluation therefore focuses on the differences between the reference Ref, compensation C1 and compensation C2.
Figure 16 shows the tensile modulus of the neat APA6 reference samples and after two compensations (C1, C2). The specimens show a fairly constant behavior along compensation C1 and C2. The tensile modulus of F2 and F4 increases slightly from 3.2 GPa to 3.4 GPa, and F3 is slightly below the values of the other three formulations. In former investigations, tensile moduli of 2.6–3.2 GPa were achieved [8].
Figure 15. Melting points of the four formulations in different stages in ◦C measured with a DSC.
Ricco reported a decrease of the melting temperature (Tm) with increasing residual monomercontent. He states that Tm is reduced by 3.5 to 5 ◦C per wt % monomer [14,32]. Van Rijswijk obtains agradient of 4.3 ◦C in his experiments [14]. The calculation of the gradients with our unreinforced PA6samples of stage C2 yields −2.6 ◦C/wt % (F1), −3.8 ◦C/wt % (F2), −4.0 ◦C/wt % (F3) and −6.0 ◦C/wt %(F4). With the exception of formulation F4, the values are within the interval determined by Ricco.However, it should be noted that the decrease in the melting point is also due to the decrease in thedegree of crystallinity. The residual monomer content is, therefore, only an additional influence.
Besides the physical properties, the mechanical characteristic values are the main criteria fordeciding whether the components can be used after compensation of the water. The evaluationtherefore focuses on the differences between the reference Ref, compensation C1 and compensation C2.
Figure 16 shows the tensile modulus of the neat APA6 reference samples and after twocompensations (C1, C2). The specimens show a fairly constant behavior along compensation C1 andC2. The tensile modulus of F2 and F4 increases slightly from 3.2 GPa to 3.4 GPa, and F3 is slightly belowthe values of the other three formulations. In former investigations, tensile moduli of 2.6–3.2 GPa wereachieved [8].
J. Compos. Sci. 2020, 4, 7 14 of 19
J. Compos. Sci. 2020, 4, x 14 of 19
Figure 16. Tensile modulus of neat samples of the four formulations F1–F4.
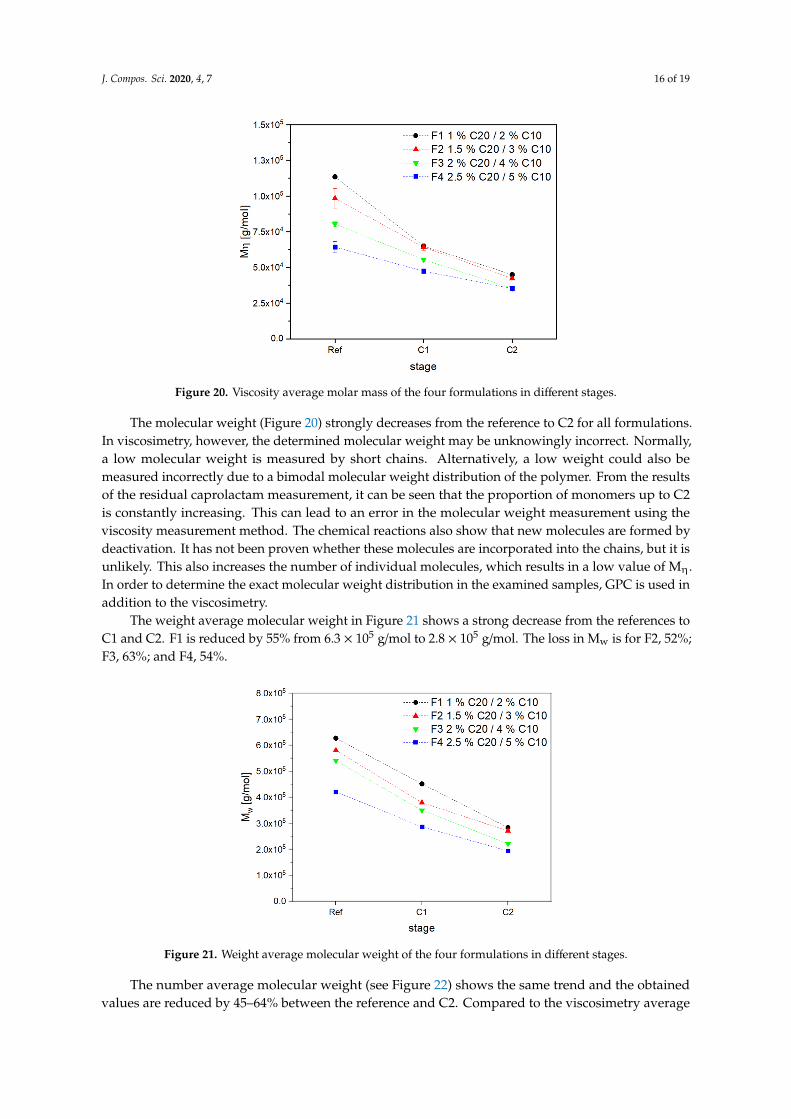
The measured tensile strength in Figure 17 shows even more uniform results than the modulus and also agrees very well with the values in literature (70–85 MPa [22,24]). Considering the values with respect to the decrease in the degree of crystallinity (Figure 14) and the decreasing molecular weight, a decrease with advancing compensation stage would be expected.
Figure 17. Tensile strength of the four formulations F1–F4.
A possible explanation for the constant tensile strength is that the chains have exceeded a critical value of molecular mass (Mc). Thus, the intermolecular forces are stronger than the primary bonds and the breaking point is located between the chain links. A lower molar mass would therefore not lead to lower tensile strengths until Mc is undercut [33].
The determined results of tensile modulus and strength are higher compared to PA6 due to the high degree of crystallinity and the high molecular weight achieved in the anionic polymerization of the PA6 [14]. In contrast, standard PA6 has a significant lower crystallinity and shorter polymer chains leading to lower modulus, given in the literature (tensile modulus: 1.2 GPa, tensile strength: 64 MPa) [24].
Figure 18 shows the results of the bending tests. As the degree of crystallinity decreases with progressive stages, the brittleness of the material also decreases. The softening of the polymer thus leads to an increased deflection. F1–F4 show almost no decrease or even a slight increase in bending stiffness between the reference and C1. For formulations F1 and F2, the stiffness of C2 is significantly
Figure 16. Tensile modulus of neat samples of the four formulations F1–F4.
The measured tensile strength in Figure 17 shows even more uniform results than the modulusand also agrees very well with the values in literature (70–85 MPa [22,24]). Considering the valueswith respect to the decrease in the degree of crystallinity (Figure 14) and the decreasing molecularweight, a decrease with advancing compensation stage would be expected.
J. Compos. Sci. 2020, 4, x 14 of 19
Figure 16. Tensile modulus of neat samples of the four formulations F1–F4.
The measured tensile strength in Figure 17 shows even more uniform results than the modulus and also agrees very well with the values in literature (70–85 MPa [22,24]). Considering the values with respect to the decrease in the degree of crystallinity (Figure 14) and the decreasing molecular weight, a decrease with advancing compensation stage would be expected.
Figure 17. Tensile strength of the four formulations F1–F4.
A possible explanation for the constant tensile strength is that the chains have exceeded a critical value of molecular mass (Mc). Thus, the intermolecular forces are stronger than the primary bonds and the breaking point is located between the chain links. A lower molar mass would therefore not lead to lower tensile strengths until Mc is undercut [33].
The determined results of tensile modulus and strength are higher compared to PA6 due to the high degree of crystallinity and the high molecular weight achieved in the anionic polymerization of the PA6 [14]. In contrast, standard PA6 has a significant lower crystallinity and shorter polymer chains leading to lower modulus, given in the literature (tensile modulus: 1.2 GPa, tensile strength: 64 MPa) [24].
Figure 18 shows the results of the bending tests. As the degree of crystallinity decreases with progressive stages, the brittleness of the material also decreases. The softening of the polymer thus leads to an increased deflection. F1–F4 show almost no decrease or even a slight increase in bending stiffness between the reference and C1. For formulations F1 and F2, the stiffness of C2 is significantly
Figure 17. Tensile strength of the four formulations F1–F4.
A possible explanation for the constant tensile strength is that the chains have exceeded a criticalvalue of molecular mass (Mc). Thus, the intermolecular forces are stronger than the primary bondsand the breaking point is located between the chain links. A lower molar mass would therefore notlead to lower tensile strengths until Mc is undercut [33].
The determined results of tensile modulus and strength are higher compared to PA6 due to thehigh degree of crystallinity and the high molecular weight achieved in the anionic polymerizationof the PA6 [14]. In contrast, standard PA6 has a significant lower crystallinity and shorter polymerchains leading to lower modulus, given in the literature (tensile modulus: 1.2 GPa, tensile strength:64 MPa) [24].
Figure 18 shows the results of the bending tests. As the degree of crystallinity decreases withprogressive stages, the brittleness of the material also decreases. The softening of the polymer thus
J. Compos. Sci. 2020, 4, 7 15 of 19
leads to an increased deflection. F1–F4 show almost no decrease or even a slight increase in bendingstiffness between the reference and C1. For formulations F1 and F2, the stiffness of C2 is significantlylower compared to the references. The change in stiffness between the reference and C2 results in −26%(F1), −16% (F2), +4% (F3) and −4% (F4). It can thus be concluded that the influence of water increaseswith increasing compensation.
J. Compos. Sci. 2020, 4, x 15 of 19
lower compared to the references. The change in stiffness between the reference and C2 results in −26% (F1), −16% (F2), +4% (F3) and −4% (F4). It can thus be concluded that the influence of water increases with increasing compensation.
Figure 18. Flexural modulus of the four formulations in different stages.
The flexural strength is shown in Figure 19 and for F1, the compensation stages lead to a strength reduction of approx. 22% (Ref. to C2). F2 decreases by 10%, while F3 and F4 increase by 3% and 5% respectively. However, since the deviation of the values for F2–F4 is only very small, it can be stated for these formulations that the compensation does not have a significant effect on the bending strength. The strength of the compensation of F1 shows the largest decrease compared to the reference because F1 has the lowest number of reactive molecules and is, therefore, the most sensitive.
Figure 19. Flexural strength of the four formulations in different stages.
Figure 20 shows the viscosity average molecular weight of the tested samples. If the activator content increases, more growing centers are available and the molecular weight of each chain decreases [15,26,34]. Without adding water, the different concentrations of activator can be seen clearly due to the rising molecular weight with decreasing concentration of growing centers.
Figure 18. Flexural modulus of the four formulations in different stages.
The flexural strength is shown in Figure 19 and for F1, the compensation stages lead to a strengthreduction of approx. 22% (Ref. to C2). F2 decreases by 10%, while F3 and F4 increase by 3% and 5%respectively. However, since the deviation of the values for F2–F4 is only very small, it can be statedfor these formulations that the compensation does not have a significant effect on the bending strength.The strength of the compensation of F1 shows the largest decrease compared to the reference becauseF1 has the lowest number of reactive molecules and is, therefore, the most sensitive.
J. Compos. Sci. 2020, 4, x 15 of 19
lower compared to the references. The change in stiffness between the reference and C2 results in −26% (F1), −16% (F2), +4% (F3) and −4% (F4). It can thus be concluded that the influence of water increases with increasing compensation.
Figure 18. Flexural modulus of the four formulations in different stages.
The flexural strength is shown in Figure 19 and for F1, the compensation stages lead to a strength reduction of approx. 22% (Ref. to C2). F2 decreases by 10%, while F3 and F4 increase by 3% and 5% respectively. However, since the deviation of the values for F2–F4 is only very small, it can be stated for these formulations that the compensation does not have a significant effect on the bending strength. The strength of the compensation of F1 shows the largest decrease compared to the reference because F1 has the lowest number of reactive molecules and is, therefore, the most sensitive.
Figure 19. Flexural strength of the four formulations in different stages.
Figure 20 shows the viscosity average molecular weight of the tested samples. If the activator content increases, more growing centers are available and the molecular weight of each chain decreases [15,26,34]. Without adding water, the different concentrations of activator can be seen clearly due to the rising molecular weight with decreasing concentration of growing centers.
Figure 19. Flexural strength of the four formulations in different stages.
Figure 20 shows the viscosity average molecular weight of the tested samples. If the activatorcontent increases, more growing centers are available and the molecular weight of each chaindecreases [15,26,34]. Without adding water, the different concentrations of activator can be seen clearlydue to the rising molecular weight with decreasing concentration of growing centers.
J. Compos. Sci. 2020, 4, 7 16 of 19J. Compos. Sci. 2020, 4, x 16 of 19
Figure 20. Viscosity average molar mass of the four formulations in different stages.
The molecular weight (Figure 20) strongly decreases from the reference to C2 for all formulations. In viscosimetry, however, the determined molecular weight may be unknowingly incorrect. Normally, a low molecular weight is measured by short chains. Alternatively, a low weight could also be measured incorrectly due to a bimodal molecular weight distribution of the polymer. From the results of the residual caprolactam measurement, it can be seen that the proportion of monomers up to C2 is constantly increasing. This can lead to an error in the molecular weight measurement using the viscosity measurement method. The chemical reactions also show that new molecules are formed by deactivation. It has not been proven whether these molecules are incorporated into the chains, but it is unlikely. This also increases the number of individual molecules, which results in a low value of Mη. In order to determine the exact molecular weight distribution in the examined samples, GPC is used in addition to the viscosimetry.
The weight average molecular weight in Figure 21 shows a strong decrease from the references to C1 and C2. F1 is reduced by 55% from 6.3 × 10⁵ g/mol to 2.8 × 10⁵ g/mol. The loss in Mw is for F2, 52%; F3, 63%; and F4, 54%.
Figure 21. Weight average molecular weight of the four formulations in different stages.
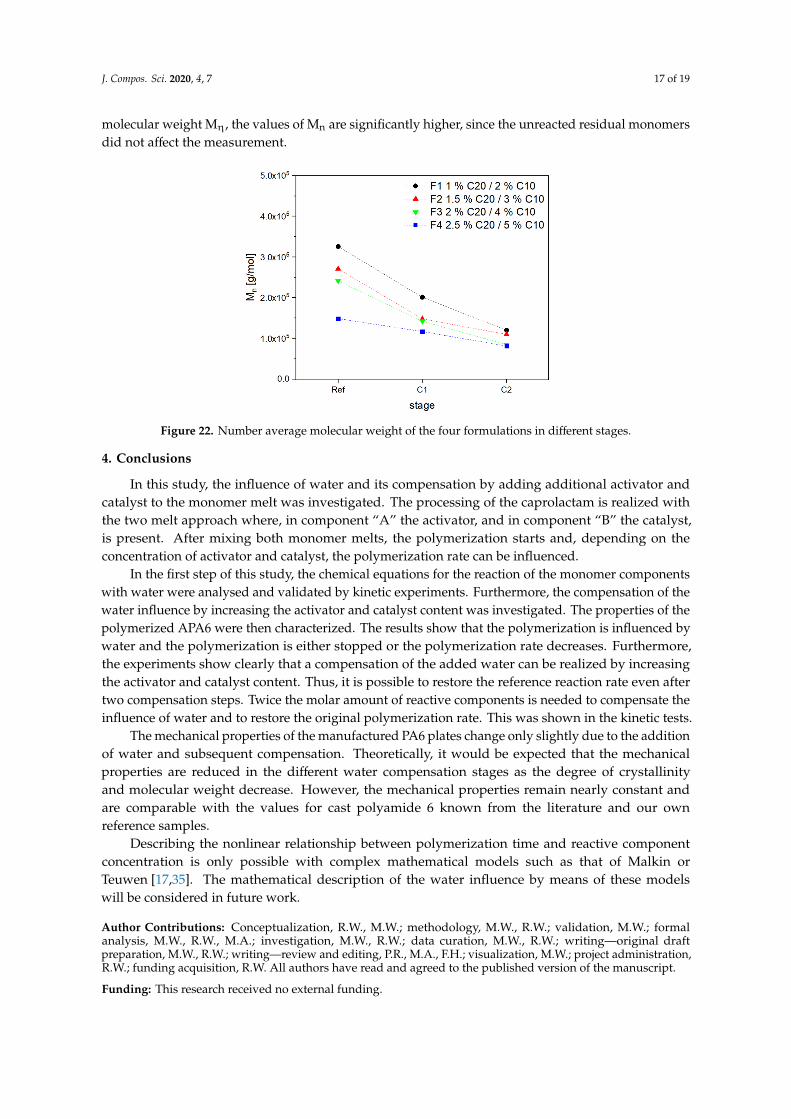
The number average molecular weight (see Figure 22) shows the same trend and the obtained values are reduced by 45–64% between the reference and C2. Compared to the viscosimetry average molecular weight Mη, the values of Mn are significantly higher, since the unreacted residual monomers did not affect the measurement.
Figure 20. Viscosity average molar mass of the four formulations in different stages.
The molecular weight (Figure 20) strongly decreases from the reference to C2 for all formulations.In viscosimetry, however, the determined molecular weight may be unknowingly incorrect. Normally,a low molecular weight is measured by short chains. Alternatively, a low weight could also bemeasured incorrectly due to a bimodal molecular weight distribution of the polymer. From the resultsof the residual caprolactam measurement, it can be seen that the proportion of monomers up to C2is constantly increasing. This can lead to an error in the molecular weight measurement using theviscosity measurement method. The chemical reactions also show that new molecules are formed bydeactivation. It has not been proven whether these molecules are incorporated into the chains, but it isunlikely. This also increases the number of individual molecules, which results in a low value of Mη.In order to determine the exact molecular weight distribution in the examined samples, GPC is used inaddition to the viscosimetry.
The weight average molecular weight in Figure 21 shows a strong decrease from the references toC1 and C2. F1 is reduced by 55% from 6.3 × 10⁵ g/mol to 2.8 × 10⁵ g/mol. The loss in Mw is for F2, 52%;F3, 63%; and F4, 54%.
J. Compos. Sci. 2020, 4, x 16 of 19
Figure 20. Viscosity average molar mass of the four formulations in different stages.
The molecular weight (Figure 20) strongly decreases from the reference to C2 for all formulations. In viscosimetry, however, the determined molecular weight may be unknowingly incorrect. Normally, a low molecular weight is measured by short chains. Alternatively, a low weight could also be measured incorrectly due to a bimodal molecular weight distribution of the polymer. From the results of the residual caprolactam measurement, it can be seen that the proportion of monomers up to C2 is constantly increasing. This can lead to an error in the molecular weight measurement using the viscosity measurement method. The chemical reactions also show that new molecules are formed by deactivation. It has not been proven whether these molecules are incorporated into the chains, but it is unlikely. This also increases the number of individual molecules, which results in a low value of Mη. In order to determine the exact molecular weight distribution in the examined samples, GPC is used in addition to the viscosimetry.
The weight average molecular weight in Figure 21 shows a strong decrease from the references to C1 and C2. F1 is reduced by 55% from 6.3 × 10⁵ g/mol to 2.8 × 10⁵ g/mol. The loss in Mw is for F2, 52%; F3, 63%; and F4, 54%.
Figure 21. Weight average molecular weight of the four formulations in different stages.
The number average molecular weight (see Figure 22) shows the same trend and the obtained values are reduced by 45–64% between the reference and C2. Compared to the viscosimetry average molecular weight Mη, the values of Mn are significantly higher, since the unreacted residual monomers did not affect the measurement.
Figure 21. Weight average molecular weight of the four formulations in different stages.
The number average molecular weight (see Figure 22) shows the same trend and the obtainedvalues are reduced by 45–64% between the reference and C2. Compared to the viscosimetry average
J. Compos. Sci. 2020, 4, 7 17 of 19
molecular weight Mη, the values of Mn are significantly higher, since the unreacted residual monomersdid not affect the measurement.J. Compos. Sci. 2020, 4, x 17 of 19
Figure 22. Number average molecular weight of the four formulations in different stages.
4. Conclusions
In this study, the influence of water and its compensation by adding additional activator and catalyst to the monomer melt was investigated. The processing of the caprolactam is realized with the two melt approach where, in component “A” the activator, and in component “B” the catalyst, is present. After mixing both monomer melts, the polymerization starts and, depending on the concentration of activator and catalyst, the polymerization rate can be influenced.
In the first step of this study, the chemical equations for the reaction of the monomer components with water were analysed and validated by kinetic experiments. Furthermore, the compensation of the water influence by increasing the activator and catalyst content was investigated. The properties of the polymerized APA6 were then characterized. The results show that the polymerization is influenced by water and the polymerization is either stopped or the polymerization rate decreases. Furthermore, the experiments show clearly that a compensation of the added water can be realized by increasing the activator and catalyst content. Thus, it is possible to restore the reference reaction rate even after two compensation steps. Twice the molar amount of reactive components is needed to compensate the influence of water and to restore the original polymerization rate. This was shown in the kinetic tests.
The mechanical properties of the manufactured PA6 plates change only slightly due to the addition of water and subsequent compensation. Theoretically, it would be expected that the mechanical properties are reduced in the different water compensation stages as the degree of crystallinity and molecular weight decrease. However, the mechanical properties remain nearly constant and are comparable with the values for cast polyamide 6 known from the literature and our own reference samples.
Describing the nonlinear relationship between polymerization time and reactive component concentration is only possible with complex mathematical models such as that of Malkin or Teuwen [17,35]. The mathematical description of the water influence by means of these models will be considered in future work.
Author Contributions: Conceptualization, R.W., M.W.; methodology, M.W., R.W.; validation, M.W.; formal analysis, M.W., R.W., M.A.; investigation, M.W., R.W.; data curation, M.W., R.W.; writing—original draft preparation, M.W., R.W.; writing—review and editing, P.R., M.A., F.H.; visualization, M.W.; project administration, R.W.; funding acquisition, R.W.
Funding: This research received no external funding.
Acknowledgments: The authors would like to thank their colleagues Cahit Arik, Marco Becker, Kevin Moritz, Uwe Podwojewski, Susanne Lüssenheide, Ronny Hanich, Beatrice Tübke, Yvonne Gallus, Heike Schuppler, Gabriela Wolf, Carolyn Fisher and Christoph Hübner for their support and feedback.
Conflicts of Interest: The authors declare no conflict of interest.
Figure 22. Number average molecular weight of the four formulations in different stages.
4. Conclusions
In this study, the influence of water and its compensation by adding additional activator andcatalyst to the monomer melt was investigated. The processing of the caprolactam is realized withthe two melt approach where, in component “A” the activator, and in component “B” the catalyst,is present. After mixing both monomer melts, the polymerization starts and, depending on theconcentration of activator and catalyst, the polymerization rate can be influenced.
In the first step of this study, the chemical equations for the reaction of the monomer componentswith water were analysed and validated by kinetic experiments. Furthermore, the compensation of thewater influence by increasing the activator and catalyst content was investigated. The properties of thepolymerized APA6 were then characterized. The results show that the polymerization is influenced bywater and the polymerization is either stopped or the polymerization rate decreases. Furthermore,the experiments show clearly that a compensation of the added water can be realized by increasingthe activator and catalyst content. Thus, it is possible to restore the reference reaction rate even aftertwo compensation steps. Twice the molar amount of reactive components is needed to compensate theinfluence of water and to restore the original polymerization rate. This was shown in the kinetic tests.
The mechanical properties of the manufactured PA6 plates change only slightly due to the additionof water and subsequent compensation. Theoretically, it would be expected that the mechanicalproperties are reduced in the different water compensation stages as the degree of crystallinityand molecular weight decrease. However, the mechanical properties remain nearly constant andare comparable with the values for cast polyamide 6 known from the literature and our ownreference samples.
Describing the nonlinear relationship between polymerization time and reactive componentconcentration is only possible with complex mathematical models such as that of Malkin orTeuwen [17,35]. The mathematical description of the water influence by means of these modelswill be considered in future work.
Author Contributions: Conceptualization, R.W., M.W.; methodology, M.W., R.W.; validation, M.W.; formalanalysis, M.W., R.W., M.A.; investigation, M.W., R.W.; data curation, M.W., R.W.; writing—original draftpreparation, M.W., R.W.; writing—review and editing, P.R., M.A., F.H.; visualization, M.W.; project administration,R.W.; funding acquisition, R.W. All authors have read and agreed to the published version of the manuscript.
Funding: This research received no external funding.
J. Compos. Sci. 2020, 4, 7 18 of 19
Acknowledgments: The authors would like to thank their colleagues Cahit Arik, Marco Becker, Kevin Moritz,Uwe Podwojewski, Susanne Lüssenheide, Ronny Hanich, Beatrice Tübke, Yvonne Gallus, Heike Schuppler,Gabriela Wolf, Carolyn Fisher and Christoph Hübner for their support and feedback.
Conflicts of Interest: The authors declare no conflict of interest.
References
1. Van Rijswijk, K.; Bersee, H.E.N. Reactive processing of textile fiber-reinforced thermoplastic composites—Anoverview. Compos. Part. Appl. Sci. Manuf. 2007, 38, 666–681. [CrossRef]
2. Cho, B.G.; McCarthy, S.P.; Fanucci, J.P.; Nolet, S.C. Fiber reinforced nylon-6 composites produced by thereaction injection pultrusion process. Polym. Compos. 1996, 17, 673–681. [CrossRef]
3. Garthaus, C.; Witschel, B.; Barfuss, D.; Rohkamm, A.; Gude, M. Funktionalisierte Faser-Thermoplast-Profilstrukturen. Lightweight Des. 2016, 9, 40–45. [CrossRef]
4. Epple, S.; Bonten, C. Stabile Leichtgewichte-Endlosfaserverstärkte Thermoplasthalbzeuge mit großemMaterialquerschnitt. Kunststoffe 2017, 3, 104–106.
5. Schürmann, H. Konstruieren mit Faser-Kunststoff-Verbunden; Springer: Berlin/Heidelberg, Germany, 2007.6. Gittel, D. Gesamtabschlussbericht Verbundprojekt “CastComp”—Neues T-RTM-Verfahren für
Hochleistungsverbundstrukturen. 2010. Available online: https://www.tib.eu/de/suchen/?tx_tibsearch_search%5Bdocid%5D=TIBKAT%3A654054894&tx_tibsearch_search%5Bcontroller%5D=Download&cHash=a6f15c07d00109ec4420ff13400163b5#download-mark (accessed on 30 October 2019).
7. Maazouz, A.; Lamnawar, K.; Dkier, M. Chemorheological study and in-situ monitoring of PA6 anionic-ringpolymerization for RTM processing control. Compos. Part Appl. Sci. Manuf. 2018, 107, 235–247. [CrossRef]
8. Wendel, R.; Thoma, B.; Henning, F. Influence of water during manufacturing of aPA6 in the thermoplasticRTM process. In Proceedings of the Conference 2017 of the Polymer Processing Society, Cancun, Mexico,10–14 December 2017; p. 33.
9. Ageyeva, T.; Sibikin, I.; Karger-Kocsis, J. Polymers and Related Composites via Anionic Ring-OpeningPolymerization of Lactams: Recent Developments and Future Trends. Polymers 2018, 10, 357. [CrossRef][PubMed]
10. KraussMaffei Technologies GmbH. Misch- und Schmelzvorrichtung zum Schmelzen von schmelzbaremKunststoffmaterial. DE 102015109770A1, 22 December 2016.
11. Garcia, A.S.; Palenzuela, G.L. Verfahren und Vorrichtung zur Polymerisation von Lactamen in Formen(US 9290622B2): Google Patents. Available online: https://www.google.com/patents/EP2338665B1?cl=de(accessed on 30 October 2019).
12. Bitterlich, M.; Ehleben, M.; Wollny, A.; Desbois, P.; Renkl, J.; Schmidhuber, S. Maßgeschneidert auf reaktivesPolyamid 6. Kunststoffe 2014, 104, 80–84.
13. Fries, E. Heisse Sache—T-RTM-Verfahren und -Demonstrator vereinen Faser, Kunststoff und Metall. CarbonCompos. Mag. 2016, 52, 52–53.
14. Van Rijswijk, K.; Bersee, H.E.N.; Beukers, A.; Picken, S.J.; Van Geenen, A.A. Optimisation of anionicpolyamide-6 for vacuum infusion of thermoplastic composites: Influence of polymerisation temperature onmatrix properties. Polym. Test. 2006, 25, 392–404. [CrossRef]
15. Ueda, K.; Yamada, K.; Nakai, M.; Matsuda, T.; Hosoda, M.; Tai, K. Synthesis of High Molecular Weight Nylon6 by Anionic Polymerization of ε-Caprolactam. Polym. J. 1996, 28, 446. [CrossRef]
16. Wittmer, P.; Gerrens, H. Über die anionische Schnellpolymerisation von Caprolactam. Die Makromol. Chem.1965, 89, 27–43. [CrossRef]
17. Teuwen, J.J.E.; Van Geenen, A.A.; Bersee, H.E.N. Novel Reaction Kinetic Model for Anionic Polyamide-6.Macromol. Mater. Eng. 2013, 298, 163–173. [CrossRef]
18. Kim, K.J.; Kim, Y.Y.; Yoon, B.S.; Yoon, K.J. Mechanism and kinetics of adiabatic anionic polymerization ofε-caprolactam in the presence of various activators. J. Appl. Polym. Sci. 1995, 57, 1347–1358. [CrossRef]
19. Iobst, S.A. Polymerization and crystallization behavior of anionic nylon 6. Polym. Eng. Sci. 1985, 25, 425–430.[CrossRef]
20. Van Rijswijk, K.; Van Geenen, A.A.; Bersee, H.E.N. Textile fiber-reinforced anionic polyamide-6 composites.Part II: Investigation on interfacial bond formation by short beam shear test. Compos. Part Appl. Sci. Manuf.2009, 40, 1033–1043. [CrossRef]
J. Compos. Sci. 2020, 4, 7 19 of 19
21. Michaeli, W.; Titzschkau, K. BMBF Abschlussbericht: Innovatives Herstellungsverfahren von Polyamid6-Nanocompounds auf Basis von Schichtsilikaten und ε-Caprolactam. 2009. Available online: https://www.brueggemann.com/de/ap-nylon-additive (accessed on 9 January 2020).
22. Elias, H.G. Makromoleküle: Band 3: Industrielle Polymere und Synthesen; Wiley: Hoboken, NJ, USA, 2001.23. Lechner, M.D.; Gehrke, K.; Nordmeier, E.H. Makromolekulare Chemie: Ein Lehrbuch für Chemiker, Physiker,
Materialwissenschaftler und Verfahrenstechniker; Springer: Berlin/Heidelberg, Germany, 2014.24. Domininghaus, H.; Elsner, P.; Eyerer, P.; Hirth, T. DOMININGHAUS—Kunststoffe: Eigenschaften und
Anwendungen; Springer: Berlin/Heidelberg, Germany, 2013.25. Brüggemann Chemical. TDS AP-NYLON Caprolactam flakes. Available online: https://www.brueggemann.
com/de/ap-nylon-additive (accessed on 9 January 2020).26. Udipi, K.; Dave, R.S.; Kruse, R.L.; Stebbins, L.R. Polyamides from lactams via anionic ring-opening
polymerization: 1. Chemistry and some recent findings. Polymer 1997, 38, 927–938. [CrossRef]27. Cartledge, H.C.Y.; Baillie, C.A. Studies of microstructural and mechanical properties of nylon/glass composite
Part I The effect of thermal processing on crystallinity, transcrystallinity and crystal phases. J Mater. Sci 1999,34, 5099–5111. [CrossRef]
28. Kulicke, W.M.; Clasen, C. Viscosimetry of Polymers and Polyelectrolytes; Springer: Berlin/Heidelberg,Germany, 2004.
29. Tänzer, W.; Schmidt, S.; Ludwig, I. Molmassebestimmung an Polyamiden und Reaktionsprodukten ausε-Caprolactam und Phenylglycidether. J. Prakt. Chem. 1996, 338, 311–319. [CrossRef]
30. Brüggemann Chemical. TDS BRUGGOLEN C10. Available online: https://www.brueggemann.com/de/ap-nylon-additive (accessed on 9 January 2020).
31. Brüggemann Chemical. MSDS BRUGGOLEN C20P 2016. Available online: https://www.brueggemann.com/
de/ap-nylon-additive (accessed on 9 January 2020).32. Ricco, L.; Russo, S.; Orefice, G.; Riva, F. Anionic Poly(ε-caprolactam): Relationships among Conditions
of Synthesis, Chain Regularity, Reticular Order, and Polymorphism. Macromolecules 1999, 32, 7726–7731.[CrossRef]
33. Weißbach, W.; Dahms, M. Werkstoffkunde: Strukturen, Eigenschaften, Prüfung; Vieweg+Teubner Verlag: Berlin,Germany, 2010.
34. Dave, R.S.; Kruse, R.L.; Stebbins, L.R.; Udipi, K. Polyamides from lactams via anionic ring-openingpolymerization: 2. Kinetics. Polymer 1997, 38, 939–947. [CrossRef]
35. Malkin, A.Y.L.; Ivanova, S.L.; Frolov, V.G.; Ivanova, A.N.; Andrianova, Z.S. Kinetics of anionic polymerizationof lactams. (Solution of non-isothermal kinetic problems by the inverse method). Polymer 1982, 23, 1791–1800.[CrossRef]
© 2020 by the authors. Licensee MDPI, Basel, Switzerland. This article is an open accessarticle distributed under the terms and conditions of the Creative Commons Attribution(CC BY) license (http://creativecommons.org/licenses/by/4.0/).
Related Documents


![ISTANBUL TECHNICAL UNIVERSITY INSTITUTE OF SCIENCE …yusuf/theses/gokhan_acik_MSc.pdf · polymerization with anionic insertion [14], activated monomer [14, 15], cationic [16- 20],](https://static.cupdf.com/doc/110x72/5cada45b88c993ab638b52cb/istanbul-technical-university-institute-of-science-yusufthesesgokhanacikmscpdf.jpg)