i COMPENSATION OF OUTAGE IN A CELLULAR RADIO NETWORK USING CELL ZOOMING TECHNIQUE SYMON NJERU MANEGENE MASTER OF SCIENCE (Telecommunication Engineering) JOMO KENYATTA UNIVERSITY OF AGRICULTURE AND TECHNOLOGY 2017

Welcome message from author
This document is posted to help you gain knowledge. Please leave a comment to let me know what you think about it! Share it to your friends and learn new things together.
Transcript
i
COMPENSATION OF OUTAGE IN A CELLULAR
RADIO NETWORK USING CELL ZOOMING
TECHNIQUE
SYMON NJERU MANEGENE
MASTER OF SCIENCE
(Telecommunication Engineering)
JOMO KENYATTA UNIVERSITY OF
AGRICULTURE AND TECHNOLOGY
2017
i
Compensation of Outage in a Cellular Radio Network Using Cell
Zooming Technique
Symon Njeru Manegene
A thesis submitted in partial fulfillment for the degree of Master of
Science in Telecommunication Engineering in the Jomo Kenyatta
University of Agriculture and Technology
2017
ii
DECLARATION
This thesis is my original work and has not been presented for a degree in any other
University
Signature………………………………… Date……………………. ……………..
Symon Njeru Manegene
This thesis has been submitted for examination with our approval as university
supervisors
Signature………………………………… Date……………………. ……………..
Prof. Stephen Musyoki, PhD
Technical University of Kenya
Signature…………………………………… Date…………………………………….
Dr. Kibet Langat, PhD
JKUAT, Kenya

iii
DEDICATION
To my Mom and Dad
iv
ACKNOWLEDGEMENTS
I wish to acknowledge the efforts of my supervisors in guiding and encouraging me
through this research. I have to accept it was tough and without them I would have given
up. Special mention goes to the staff of Safaricom Limited, who generously provided the
desired information, without which this thesis would not have made much of a difference.
My family has stood by me through thick and thin. Thank you all for your support.
v
TABLE OF CONTENTS
DECLARATION............................................................................................................... ii
DEDICATION.................................................................................................................. iii
ACKNOWLEDGEMENTS ............................................................................................ iv
TABLE OF CONTENTS ................................................................................................. v
LIST OF TABLES ......................................................................................................... viii
LIST OF FIGURES ......................................................................................................... ix
APPENDICES ................................................................................................................. xii
NOMENCLATURE ....................................................................................................... xiii
ABSTRACT .................................................................................................................... xvi
CHAPTER ONE ............................................................................................................... 1
1. INTRODUCTION........................................................................................................ 1
1.1 Background ......................................................................................................... 1
1.2 Problem Statement .............................................................................................. 2
1.3 Justification ......................................................................................................... 3
1.4 Objectives ........................................................................................................... 4
1.4.1 Main Objective................................................................................................ 4
1.4.2 Specific objectives .......................................................................................... 4
1.4.3 Scope ............................................................................................................... 4
CHAPTER TWO .............................................................................................................. 5
2. LITERATURE REVIEW ............................................................................................ 5
2.1 Background ......................................................................................................... 5
2.1.1 Self-configuration ........................................................................................... 6
2.1.2 Self-optimization............................................................................................. 6
2.1.3 Self-planning ................................................................................................... 6
2.1.4 Self-healing ..................................................................................................... 7

vi
2.2 Application of self-healing in radio network ...................................................... 7
2.3 Cell outage compensation ................................................................................... 8
2.4 Link Budget, Path Loss and Propagation Models ............................................. 11
2.4.1 Okumura-Hata Model ................................................................................... 13
2.4.2 COST-Hata Model ........................................................................................ 14
2.4.3 The standard propagation model ................................................................... 15
2.5 Outage Compensation Using Cell Zooming ..................................................... 16
2.5.1 Electrical Zooming........................................................................................ 17
2.5.2 Mechanical tilt .............................................................................................. 17
2.5.3 Electrical tilt .................................................................................................. 18
2.5.4 Height adjustment ......................................................................................... 19
2.6 Factors affecting compensation using cell zooming ......................................... 20
2.7 Methods of addressing capacity issue ............................................................... 20
2.8 Indicators of cell failure .................................................................................... 21
2.9 Related studies .................................................................................................. 22
2.10 Gap in the existing studies ................................................................................ 26
CHAPTER THREE ........................................................................................................ 27
3. METHODOLOGY ...................................................................................................... 27
3.1 Development of the algorithm .......................................................................... 27
3.1.1 Solving for coverage distance ....................................................................... 27
3.1.2 Solving for BS height and transmitter power ............................................... 29
3.1.3 Testing the algorithm .................................................................................... 29
3.2 Simulation ......................................................................................................... 30
3.2.1 Homogeneous single sector, 7 cells cluster network .................................... 30
3.2.2 Homogeneous 3 sectored, 7 cells cluster system .......................................... 31
3.2.3 Non-homogeneous network .......................................................................... 32
3.2.4 Simulation using actual network data ........................................................... 33
3.3 Traffic Trends Analysis .................................................................................... 33
CHAPTER FOUR ........................................................................................................... 35
4. SIMULATION RESULTS ANALYSIS AND DISCUSSION ................................. 35
4.1 Algorithm test ................................................................................................... 35
vii
4.2 Simulations ....................................................................................................... 40
4.2.1 Homogeneous single sectored 7 cells cluster................................................ 40
4.2.2 Homogeneous 3 sectored 7 cells cluster ....................................................... 44
4.2.3 Non homogeneous equally spaced 3 sectored 7 cells cluster ....................... 47
4.2.4 Simulation using actual network data ........................................................... 50
4.3 Traffic Trend ..................................................................................................... 56
4.3.1 Busy hour trend ............................................................................................. 56
4.3.2 Hourly traffic trend ....................................................................................... 57
CHAPTER 5 .................................................................................................................... 59
CONCLUSION AND RECOMMENDATION ............................................................ 59
5.1 Conclusion ........................................................................................................ 59
5.2 Recommendation .............................................................................................. 61
REFERENCES ................................................................................................................ 62
APPENDICES ................................................................................................................. 65
viii
LIST OF TABLES
Table 2.1: Example of tuned values for an Indian Metropolitan Region ......................... 16
Table 3.1: Simulation parameters .................................................................................... 30
Table 4.1: Table of Path Loss Parameter Values ............................................................. 35
Table 4.2: Calculated values of C for different environments ......................................... 36
Table 4.3: Values of a(hm) ............................................................................................... 36
Table 4.4: Calculated values of A .................................................................................... 37
Table 4.5: Radius of cell for GSM900 in different environment ..................................... 37
Table 4.6: Radius of cell for GSM1800 in different environment ................................... 37
Table 4.7: Compensation values for single sectored configuration ................................. 40
Table 4.8: Compensation values for 3 sectored Configuration ........................................ 44
Table 4.9: Compensation values used for non-homogeneous network ........................... 47
ix
LIST OF FIGURES
Figure 2.1: Cell Compensation Scenario ........................................................................... 9
Figure 2.2: Impact of self-healing.................................................................................... 10
Figure 2.3: Illustration of Mechanical tilt ........................................................................ 17
Figure 2.4: Illustration of Electrical Tilt .......................................................................... 18
Figure 2.5: Radiation patterns of mechanical and electrical tilts ..................................... 19
Figure 2.6: Compensation of a Homogeneous Network 1............................................... 25
Figure 2.7: Compensation of a Homogeneous Network 2............................................... 25
Figure 3.1: Algorithms Flow Chart.................................................................................. 28
Figure 3.2: Representation of a 3 sector signal ................................................................ 32
Figure 4.1: Relationship between path loss and Height of Transmitter as generated by the
algorithm ....................................................................................................... 39
Figure 4.2: Relationship between path loss and Height of Transmitter as generated in a
different study ................................................................................................ 39
Figure 4.3: Required EIRP and BS height for various coverage distances ..................... 40
Figure 4.4: Coverage by Signal Level in Healthy Conditions for a homogenous single
sectored cluster .............................................................................................. 41
Figure 4.5: Coverage by Signal Level for a homogenous single sectored cluster after Cell
D is switched off ............................................................................................ 41
Figure 4.6: Coverage by Signal Level for a homogenous single sectored cluster after Cell
D is switched off but with compensation using cell C and E ........................ 42
Figure 4.7: Compensation using 3 cells (B,C, G & A, E, F) ........................................... 43
Figure 4.8: Compensation using all cells ......................................................................... 43

x
Figure 4.9: Coverage by Signal Level for a homogenous 3 sectored cluster .................. 44
Figure 4.10: Coverage by Signal Level for a homogenous single sectored cluster after
Cell D is switched off ................................................................................. 45
Figure 4.11: Compensation using cell C sector 0, cell G sector 240 & B sector 120 ...... 45
Figure 4.12: Coverage by Signal Level for a homogenous 3 sectored cluster after Cell D
is switched off but with compensation using cells B, C & G ..................... 46
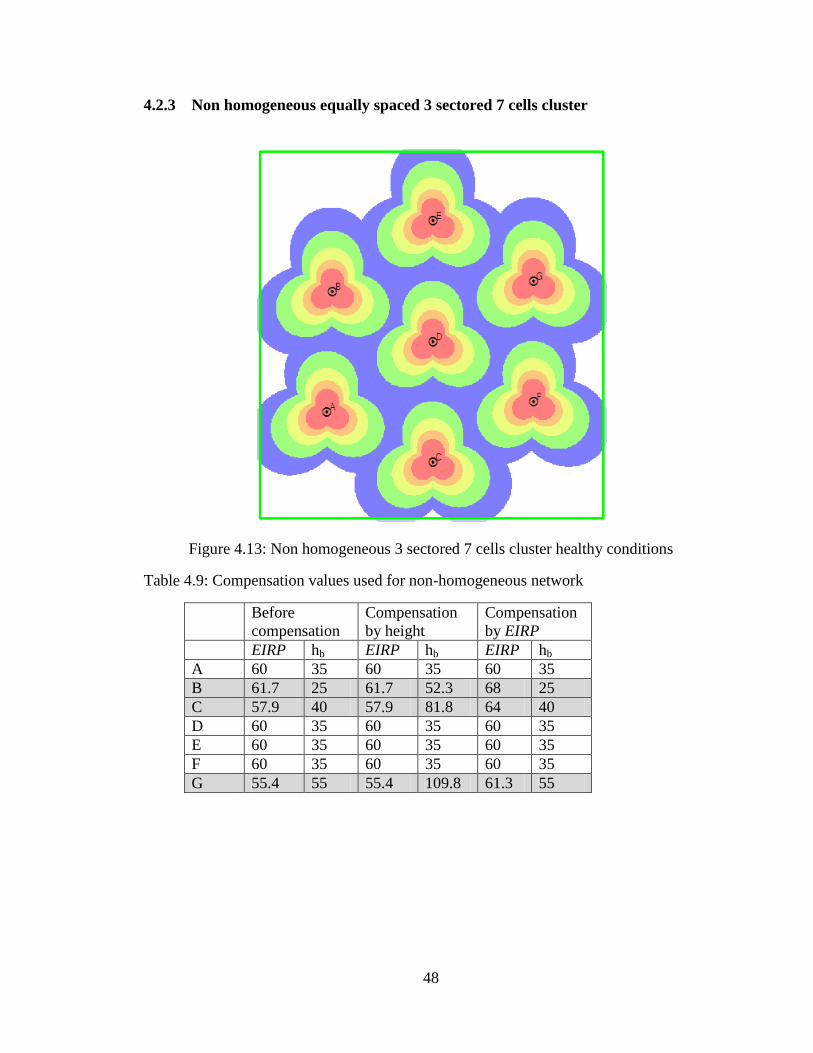
Figure 4.13: Non homogeneous 3 sectored 7 cells cluster healthy conditions ................ 47
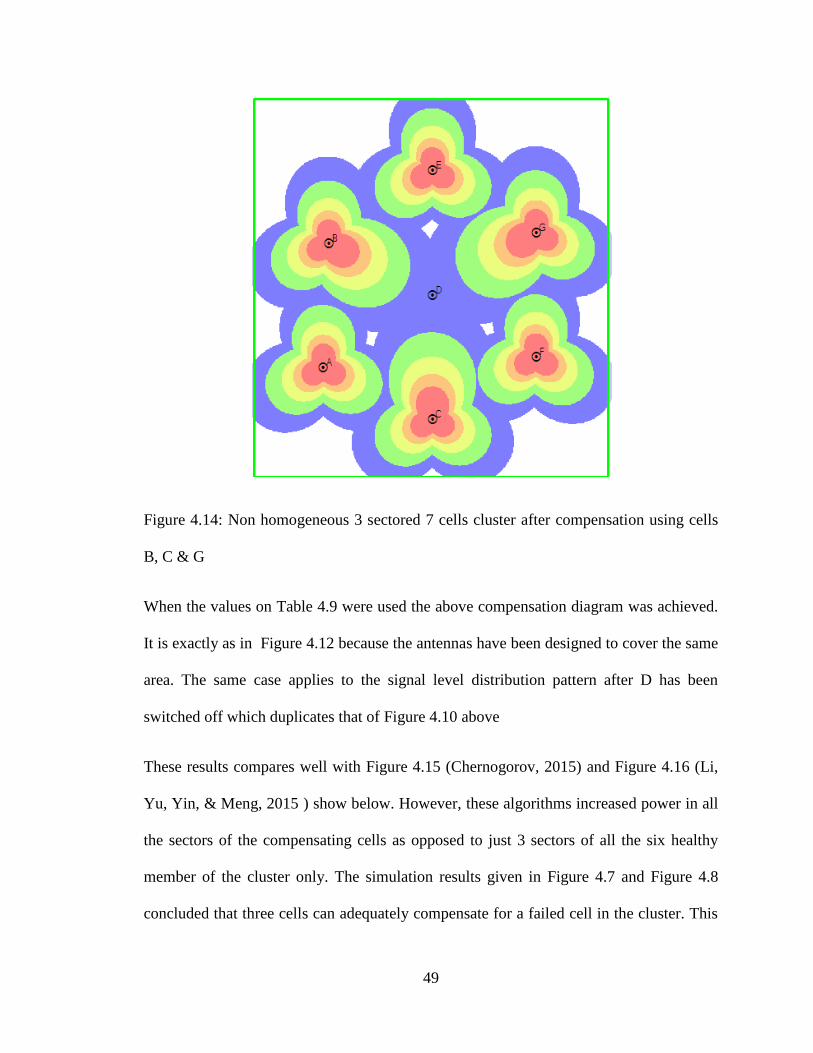
Figure 4.14: Non homogeneous 3 sectored 7 cells cluster after compensation using cells
B, C & G ..................................................................................................... 48
Figure 4.15: COC 1 .......................................................................................................... 49
Figure 4.16: COC 2 .......................................................................................................... 49
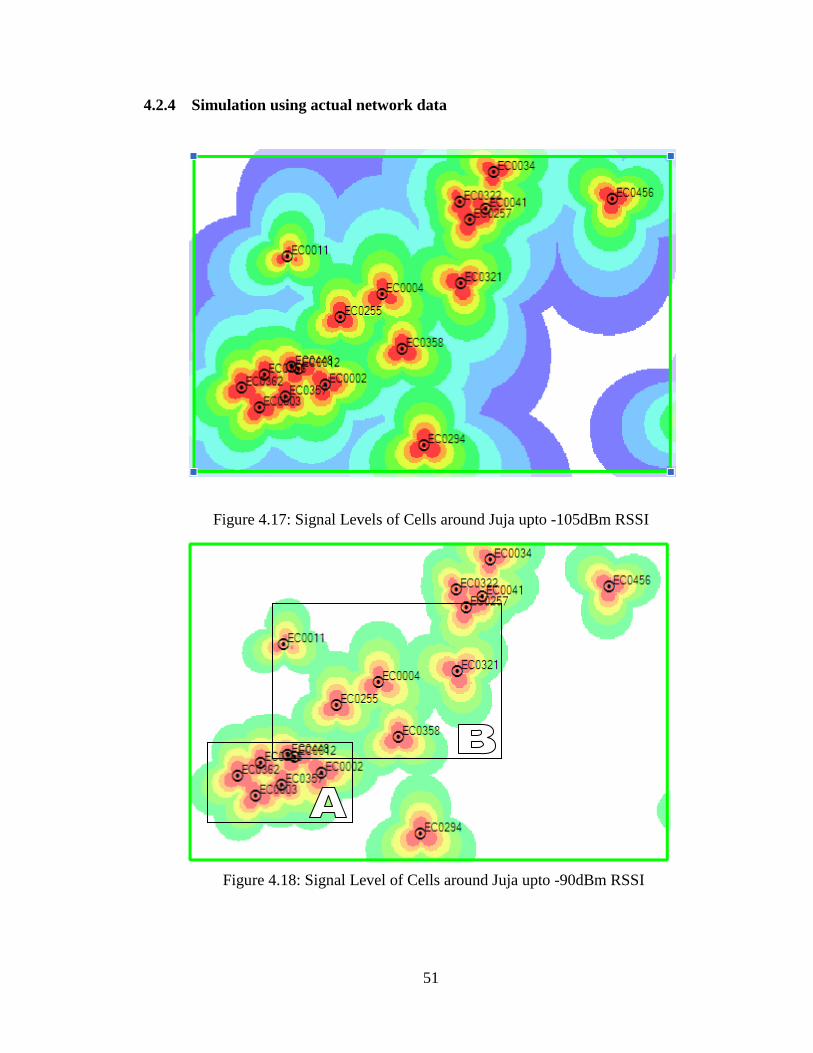
Figure 4.17: Signal Levels of Cells around Juja upto -105dBm RSSI ............................ 50
Figure 4.18: Signal Level of Cells around Juja upto -90dBm RSSI ................................ 50
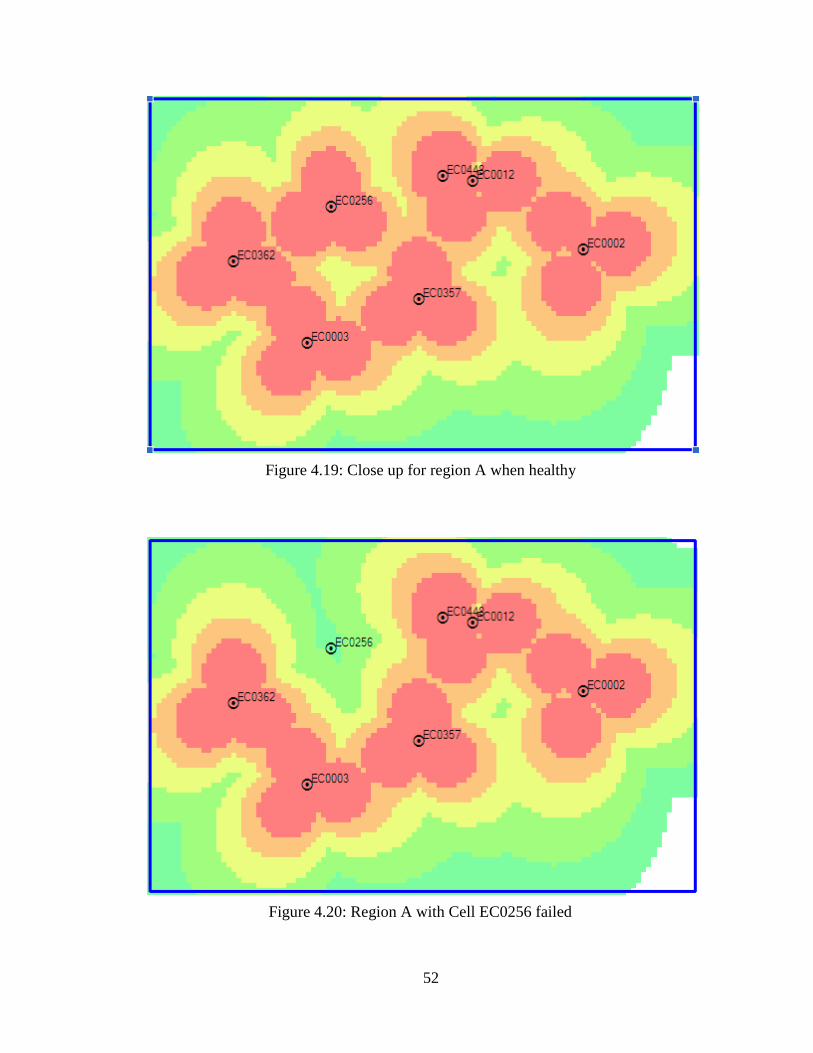
Figure 4.19: Close up for region A when healthy............................................................ 51
Figure 4.20: Region A with Cell EC0256 failed ............................................................. 51
Figure 4.21: close-up for healthy region B ...................................................................... 52
Figure 4.22: Close-up for region B with cell EC0004 Failed .......................................... 53
Figure 4.23: Compensation Using Cell EC0321 power adjustment ................................ 54
Figure 4.24: Additional compensation using azimuth ..................................................... 54
Figure 4.25: Additional compensation using cell EC0255 .............................................. 55
Figure 4.26: Graph of Busy Hour Traffic for Sites around JKUAT ................................ 56
Figure 4.27: Trend for sum of busy hour traffic .............................................................. 57
Figure 4.28: One week traffic plot ................................................................................... 57
xi
Figure 4.29: Busy day traffic plot .................................................................................... 58
xii
APPENDICES
APPENDIX 1: Algorithm ................................................................................................ 65
APPENDIX 2: Effect of Height of Transmitter on Path Loss ......................................... 71
APPENDIX 3: Busy Hour Traffic Data .......................................................................... 72
APPENDIX 4: Hourly Traffic Data ................................................................................. 76
APPENDIX 5: Busy Day Traffic Data ............................................................................ 77
APPENDIX 6: Radio Planning Data 1 ............................................................................ 78
APPENDIX 7: Radio Planning Data 2 ............................................................................ 79
APPENDIX 8: List of Publication & Conferences .......................................................... 82
xiii
NOMENCLATURE
2G Second Generation Mobile Network
3G 3rd
Generation Cellular Network
3GPP 3rd
Generation Partnership Project
AMR Adaptive Multi-Rate
AMR-HR Adaptive Multi-Rate Half Rate
BS Base Station
BTS Base Transceiver Station
CAPEX Capital Expenditure
CDMA Code Division Multiple Access
CSP Communication Service Provider
COC Cell Outage Compensation
COD Cell Outage Detection
COST European Cooperation in Science and Technology
COW Cell On Wheels (Cell on Wings)
CSSR Call Setup Success Rate
DL Down Link
EIRP Equivalent Isotropically Radiated Power
E-UTRA Evolved Universal Terrestrial Radio Access
E-UTRAN Evolved Universal Terrestrial Radio Access Network
FR Full Rate
GSM Global System for Mobile communication
HOSR Handover Success rate
xiv
HR Half Rate
ITU International Telecommunication Union
KPI Key Performance Indicator
LTE Long Term Evolution
MAPL Maximum Allowable Path Loss
MS Mobile Station
Multi-RAT Multiple Radio Access Technology
NGMN Next Generation Mobile Network
O&M Operation and Maintenance
OPEX Operation Expenditure
OSS Operation and Maintenance Sub System
PA Power Amplifier
PL Path Loss
QoS Quality of Service
RET Remote Electrical Tilt
RF Radio Frequency
RSSI Receiver Signal Level Indicator
SDCCH Standalone dedicated control Channel
SOCRATES Self-Optimisation and self-ConfiguRATion in wireless networkS
SON Self Organizing Networks
TCH Traffic channel
TRX Transceiver
UL Uplink

xv
UMTS Universal Mobile Telecommunication Service
xvi
ABSTRACT
In the Third Generation Partnership Project (3GPP) long term evolution release 8, it was
proposed to have networks that have intelligence to carry out most of the activities on
their own. Among these activities include configuration, optimization and self-healing.
These networks are called self-organizing networks (SON). This technology has so far
been realized mainly in a laboratory situation or on a trial basis. The main reason for the
slow development of the technology has been attributed to the complexity of the
available algorithms that makes the implementation costly.
This research was to identify corrective measures that could be taken to adapt existing
mobile network infrastructure so that it exhibits significant level of intelligence that
would lower overall downtime in mobile network and thus reap the benefits of SON.
The scope of the study was limited to the mobile radio network and it simulated how
radio units can be clustered together to share load incase a member of the cluster fails. To
demonstrate this, a visual basic algorithm that solved for the compensation parameters
was developed using Okumura-Hata propagation model. The Parameters from the
algorithm were fed to a simulator (Atoll Planning Software) and the effect analyzed. The
algorithm was validated by feeding it with the same parameters as had been used in a
previous study and the output matched perfectly. The result of the study identified two
region of compensation that can be categorized as densely populated and scarcely
populated. The scarcely populated region can primarily rely on the use of cell zooming
technique for outage compensation but the densely populated should consider other
means as well. Most important, the study revealed that the Azimuth of the antenna should
also be adjusted as part of cell zooming.

1
CHAPTER ONE
1 INTRODUCTION
1.1 Background
Cellular network hardware and software protection mechanisms have been implemented
in the core network to ensure the system does not experience total outage during
operation. Coverage area of one radio is much smaller and thus the stabilization of radio
cells has not been a priority, making faults occurrence frequent in the radio network.
When these faults occur on radio network, the attendant may be required to travel
physically to the site to attend to the faults. This is time consuming, costly and dangerous
to the person on duty as this might involve travelling to a security compromised zone. At
times, failed cell cannot be accessed for repair as it might be in a disaster situation. In
such cases coverage compensation becomes critical as this would also help in rescue
operations.
This research demonstrates a cellular system in which traffic from a failed cell can be
redistributed automatically to its neighbouring cells as stop gap measure, at least until the
fault is cleared at the appropriate time. The methods that have been used for the
compensation have been limited to cell zooming by power adjustment and by height
adjustment. This compensation is in line with the 3GPP proposal to design self-
organizing networks (SON) to minimize human intervention in fault clearance (NEC
corporation, 2009). Outage compensation falls in the category of self-healing.
During simulations a target cell is identified within a cluster. Configurations of its
neighbours is learned so as to redistribute traffic during fault situation. Normal
configuration is to resume when planning condition are reverted.
2
1.2 Problem Statement
Fault management and correction requires a lot of human interventions and should be
automated as much as possible; hence identification and self-healing of the faults is a
significant solution. Any loss of service within the base station will result in users
experiencing complete service outage or significantly degraded service. This can result in
loss of revenue for the operator and an increase in the level of subscribers moving to
competitors‟ networks. (Nokia Siemens Networks, 2010), (Ericssons, 2012), (Feng &
Seide, May 2008), (Ramiro & Hamied, 2011), (Pras, A., Schonwalder, J., Burgess, M.,
Festor, O., Perez, G. M., Stadler, R., & Stiller, B., 2007), (Marwangi, 2011)
These faults on the radio network are mostly random events and in most cases necessitate
intervention on site. It involves traveling long distances sometimes at night and in
insecurity prone areas. Even when a fault is anticipated, it may involve replacement of a
module which again has to be delivered and changed. More so, some events may hinder
effort to bring the site back into use. These include disasters and insecurities. Within this
time, there will be a network outage that definitely leads to loss of revenue and a lot of
inconvenience to users. Implementing a self optimizing network would place a stop gap
measure to ensure uninterrupted coverage while at the same time allowing for time to
clear the faults.
Sometimes it is not cell failure but some other events like political rallies, social
gathering and graduations are known to suddenly increase the offered traffic which
overwhelms a particular site. If this issue is not noted and addressed in time, degradation
of service may extend to adjacent cells. However, it is possible that when one cell is
3
overloaded, the neighbouring cells could be carrying way below average capacity and
thus these neighbouring cells are candidates for compensating for the outage.
1.3 Justification
The benefits of employing cell zooming in outage compensation are the same as those
that will be achieved by use of Self Organizing Networks (SON) in general and they
include
Saving in cost on overtime, hiring security escort, injuries from accidents
caused by fatigue as a result of working odd and long hours
Faster fault clearance
Better customer experience as the customer experience minimum outage
Better employee experience because they work within normal working
hours and have reduced exposure to insecurity
Employees can concentrate on better planning and schedule maintenance
without ad hoc need to attend to faults and overloads
In case of disasters like earthquake, floods, fire, lightning and insecurity,
this may be the only way to be able to provide the much needed service
Sometimes, a cell will be overloaded because of a temporary event and in
such a case you want to address the problem with a temporary solution.
4
1.4 Objectives
1.4.1 Main Objective
To develop a simulation model of a self-healing cellular radio network to mitigate the
effects of cell outages by introducing compensation through cell zooming
1.4.2 Specific objectives
To develop a model of a healthy network with optimal parameter settings in a
radio network cluster
Develop a test algorithm to be used to provide parameters for self-healing
To validate the developed algorithm against existing ones
To simulate faults at different points in the system by altering the parameters and
use the algorithm to generate optimal compensation parameters
1.4.3 Scope
This study is limited to only one cell failing within a cluster of cells. The failure of
multiple cells may mean that the other says may not be able to compensate for the loss
adequately. One cell with the immediate neighbors that have direct interaction with this
cell forms a cluster. However, both theoretical and actual values have been considered.
The algorithm is limited to only providing the necessary parameters to be fed to the
simulator.

5
CHAPTER TWO
2 LITERATURE REVIEW
2.1 Background
Radio planning and maintenance becomes difficult and complex as data usage increases
with growth. SON concept was introduced with various aims such as (Network E. U. T.
R. A, 2010), (3GPP , 2009), (Network E. U. T. R. A., 2009);
Reducing expenditure on design, planning, maintenance and optimization
Reduce human errors
Continuous, optimized and matched Uplink (UL) and Downlink (DL)
coverage
Optimized DL and UL capacity of the system
Balanced tradeoff between coverage and capacity
Interference reduction
Controlled cell edge performance
Minimized human intervention in network management and optimization
tasks
Energy savings
In order to achieve these objectives, 3GPP suggests an implementation of three key
functions (Network E. U. T. R. A, 2010), (3GPP , 2009), (Network E. U. T. R. A., 2009)
namely, detection of unintended holes in the coverage, perform coverage optimization,
including DL/UL channel coverage and ability to balance the trade-off between coverage
and capacity
6
The proposal provides for three classes of key functions as defined in the proposal and
specification
2.1.1 Self-configuration
This is what is popularized as „plug and play‟ or as guided installation in Microsoft. It
comprises all tasks necessary to automate the deployment and commissioning of
networks and the configuration of parameters. Network elements operate autonomously,
running setup routines, authenticating and connecting to the Operation and maintenance
Sub System (OSS), as well as linking up and swapping parameters with need-to-know
neighbors.
2.1.2 Self-optimization
This serves to improve or recover network quality by tuning network parameters
continuously. The system monitors the changes in the performance indicators and adjusts
various parameters to give optimal performance. Key tasks involve brokering handovers
and balancing loads among neighboring cells. SON offers advanced energy-saving
features that contribute to a greener network environment.
2.1.3 Self-planning
This combines configuration and optimization capabilities to dynamically re-compute
parts of the network, the aim being to improve parameters affecting service quality.
7
2.1.4 Self-healing
This encompasses a set of key functions designed to cope with major service outages,
including detection, root cause analysis, and outage mitigation mechanisms. Auto-restart
and other automatic alarm features afford the network operator even more quick-response
options. The main aim of a self-healing network is to promptly reduce the impact of the
failure as much as possible. These failures can be caused by a disruptive event such as
power failure, equipment failure and a traffic surge.
2.2 Application of self-healing in radio network
Within the current understanding of cellular self-healing networks there are a number of
main areas that are addressed:
Self-recovery of software - the ability to return to a previous software version
should issues arise. This is done by initiating a restart that rolls back to the
previous version and should happen without human intervention.
Self-healing of board faults - this often involves redundant circuits where a
spare can be switched in. Processing is also done by multiple processor with
just one generating output and when the primary one fails the standby will just
forward the output without the need to reprocess
Cell outage detection - it must be possible to remotely detect when there is an
issue with a particular cell. When the mechanism for communicating
information from a cell fails, detection of fault is not possible and the cell is
referred to as dead cell. Such a cell may be working but its status will not be
available immediately to the OSS.
8
Cell outage recovery - routines to assist with cell recovery, this may include
detection and diagnosis and along with an automatic recovery solution,
together with a report of the outcome of the action.
Cell outage compensation - methods of maintaining the best service to users
while repairs are effected.
Return from cell outage compensation - A rushed return to original
configuration may negate the gains made. Returning to the pre fault status
must be well calculated to ensure the return is easily achieved without
impacting on existing connections.
2.3 Cell outage compensation
An important element of the self-healing network is the compensation when a cell outage
occurs. The network should be able to respond quickly when as fault is detected, quantify
the impact quantified and immediately compensation is introduced. The speed at which
this should be implemented means that the compensation cannot be done manually and
hence the need for automation. The first step involves the effort to mitigate the problem
by means within the radio equipment itself but when there is a complete cell outage, this
is not possible and the compensation has to be done by the neighbouring cells
During compensation using neighbouring cells, a tradeoff between capacity and coverage
is made in order to alleviate the impact as much as possible. Optimization must also be
done in order to maintain the affected cells within the planning parameter range as much
as possible. (Nokia Siemens Networks, 2010) (Litjens, 2012) (Nokia Siemens Networks,
2009)
9
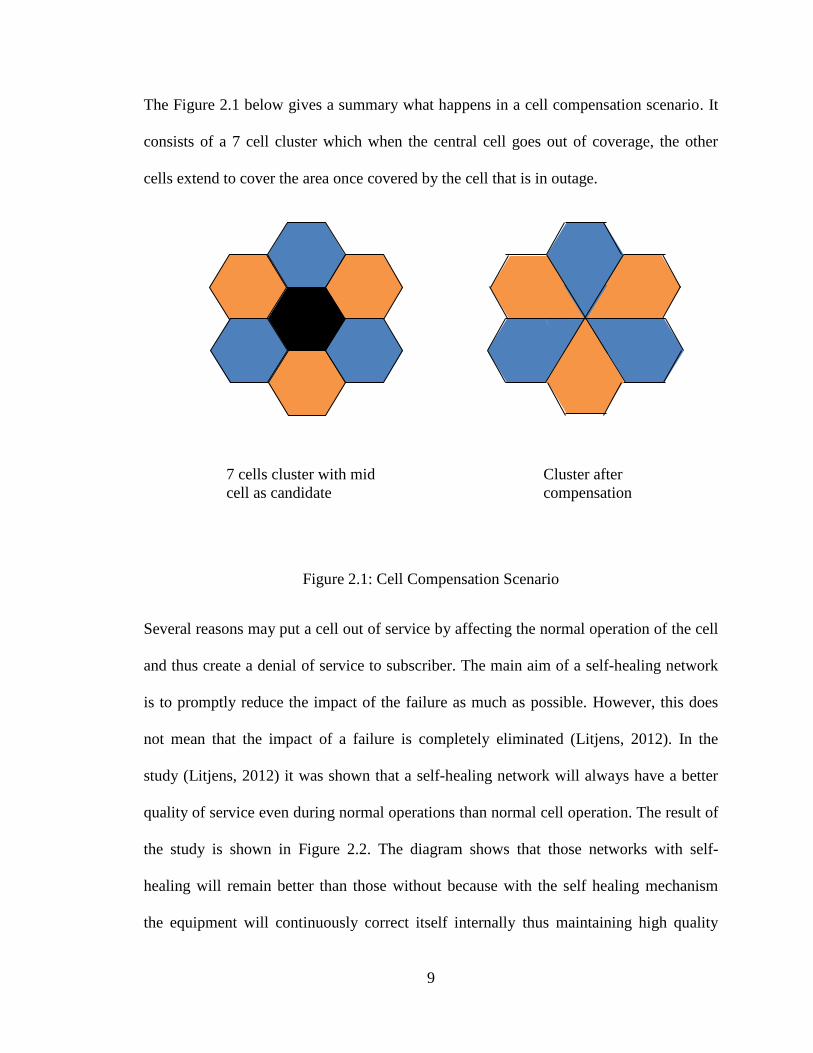
The Figure 2.1 below gives a summary what happens in a cell compensation scenario. It
consists of a 7 cell cluster which when the central cell goes out of coverage, the other
cells extend to cover the area once covered by the cell that is in outage.
Figure 2.1: Cell Compensation Scenario
Several reasons may put a cell out of service by affecting the normal operation of the cell
and thus create a denial of service to subscriber. The main aim of a self-healing network
is to promptly reduce the impact of the failure as much as possible. However, this does
not mean that the impact of a failure is completely eliminated (Litjens, 2012). In the
study (Litjens, 2012) it was shown that a self-healing network will always have a better
quality of service even during normal operations than normal cell operation. The result of
the study is shown in Figure 2.2. The diagram shows that those networks with self-
healing will remain better than those without because with the self healing mechanism
the equipment will continuously correct itself internally thus maintaining high quality
7 cells cluster with mid
cell as candidate
Cluster after
compensation

10
unlike the one without which will be degrading slowly. The curves in the diagram had the
same quality initially but the network without healing has been weakening over time and
thus the reason why these curves show a superior quality of service for self-healing
network prior to failure.
Figure 2.2: Impact of self-healing
The techniques used for cell zooming are discussed in details in the next section
Cellular self-healing network technology can be used to mitigate the effects of a complete
cell outage or other failure. However, there is likely to be an impact on performance and
therefore a fast response once the fault is diagnosed is required to ensure that the network
can return to its pre-fault condition. Compensation should not result in completely
With Self-Healing:
Quick Recovery to
Tolerable level
Without Self-Healing:
Dramatic Drop to
Intolerable Level
Site
Failure Time
Lo
cal
Ser
vic
e Q
ual
ity
11
abandoning the fault but repairs should be done at the earliest possible time and the
original configuration reverted.
2.4 Link Budget, Path Loss and Propagation Models
Communication link depends on the quality of the transmit power, transmitting antenna
gain, and receiving antenna gain. In between the transmitting and receiving antenna, the
signal gets attenuated and this attenuation is the path loss. Thus Path Loss is the
attenuation of the power density of an electromagnetic wave as it travels through space.
Link budgeting is used to account for the all the losses and gains in the link to ensure that
acceptable signal level is received for effective communication.
To determine path loss, transmitter output is first determined. Transmitter output is
boosted by system Antenna gain and reduced by transmission line and connector losses.
Effective Isotropic Radiated Power (EIRP) is given by:
EIRP (dBm) = Transmitter Output (dBm) + Antenna Gain (dBi) ‐ Cable
and Connector Losses (dB)
(2.1)
The losses within the antenna systems are also taken into account. When the power
transmitted by the antenna minus all the losses is greater than the minimum allowed
signal level of the receiving antenna, then communication is possible between the two
radios. However, it is prudent to add margin to the minimum allowed received levels for
a more reliable link.

12
In order to determine the received signal, link budget calculations are done to determine
the maximum allowable path loss (MAPL) in the system (SIEMENS AG, 2006).
(2.1)
where
is peak RF power of the MS
is the BTS sensitivity
is the losses of the system
is the margins coming from the propagation phenomena
is the system gains
When we know the MAPL, then it is possible to estimate the power that must be fed into
an antenna. This is because the minimum acceptable received levels are known and
specified as In-car = -100dBm, Indoor = -95dBm and Outdoor = -105dBm for downlink
and minimum power of -114dBm (SIEMENS AG, 2006). The end result of link
budgeting is the maximum cell radius since the other parameters are considered be fixed
from equation Error! Reference source not found.
(2.2)
Where RSSI is the received signal level indicator and Margin is an allowance given to
cater for interference.

13
A number of propagation models have been proposed that help in predicting path loss and
propagation pattern (Molisch, 2011) (Dalela, 2013) (Shabbir, Sadiq, Kashif, & Ullah,
2011). Three models used in this research follow:
2.4.1 Okumura-Hata Model
In this model, Path Loss is given by (Molisch, 2011) (Dalela, 2013) (Shabbir, Sadiq,
Kashif, & Ullah, 2011),
(2.3)
where A, B, and C are factors that depend on frequency and antenna height.
(2.4)
(2.5)
Where
is frequency in MHz
d is distance in km
hb is height of base station in meters
hm is height of mobile station in meters
The function and the factor C depend on the environment. This implies that the
perceived height of a mobile phone is dependent on the environment one is in and thus
the function :
Small and medium-size cities:
(2.6)
C = 0
Metropolitan areas
14
{
}
(2.7)
C = 0
Suburban environments
[ (
)]
(2.8)
Rural area
[ ] (2.9)
The function in suburban and rural areas is the same as for urban (small and
medium-sized cities) areas
2.4.2 COST-Hata Model
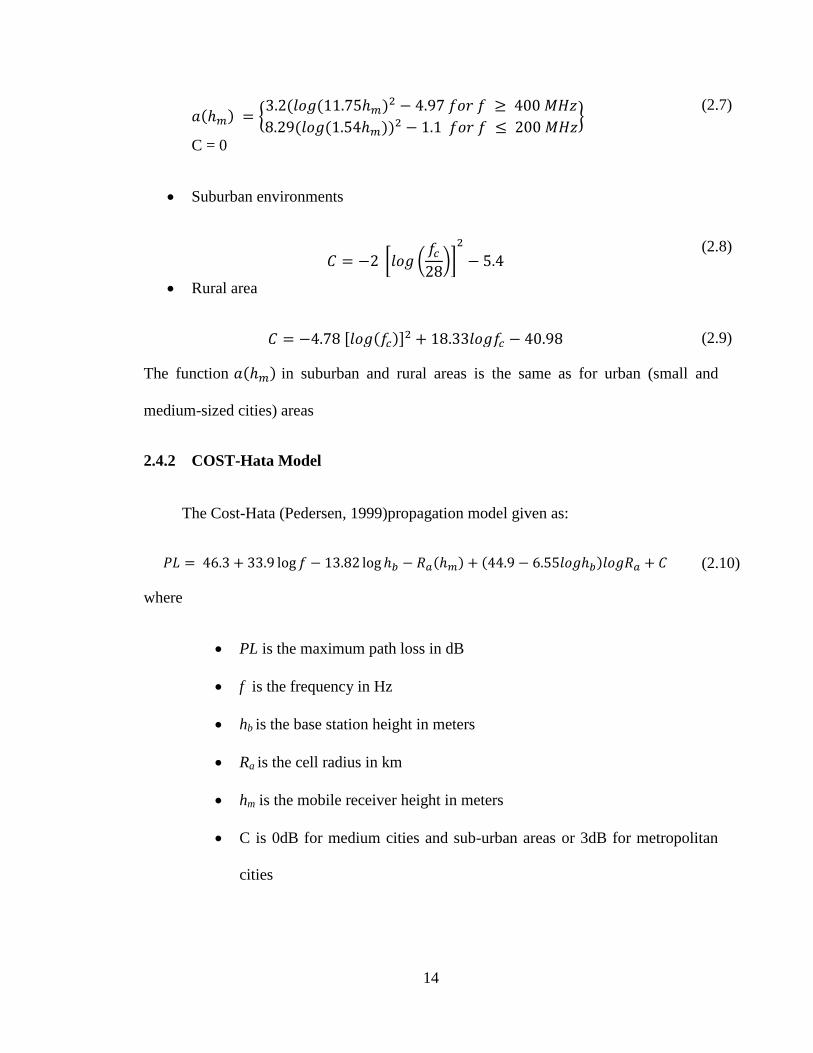
The Cost-Hata (Pedersen, 1999)propagation model given as:
(2.10)
where
PL is the maximum path loss in dB
f is the frequency in Hz
hb is the base station height in meters
Ra is the cell radius in km
hm is the mobile receiver height in meters
C is 0dB for medium cities and sub-urban areas or 3dB for metropolitan
cities
15
In a comparative study (Dalela, 2013) , COST-Hata propagation model was shown to be
the most consistent model for urban areas.
2.4.3 The standard propagation model
This model is a model derived from the Hata formula and is most suitable for predication
in the range of 150MHz~3500MHz for distances between 1km and 20km. This model
may be used for any technology; it is based on equation (2.11) (Cichon & Kürner, 1999),
(Rani, Behara, & K.Suresh, 2012): This model is very commonly used in Asset and Atoll
planning tools.
( )
( ) ( )
(2.11)
Where:
PLSPM is path loss for Standard Propagation Model
K1 Constant offset (dB)
K2 Multiplying factor for log(d)
d Distance between the receiver and the transmitter (m)
K3 Multiplying factor for log(HTxeff)
HTxeff Effective height of the transmitter antenna(m)
K4 Multiplying factor for diffraction calculation, K4 has to be a positive number
K5 Multiplying factor for log(d)log(HTxeff)

16
K6 Multiplying factor for HRxeff
HRxeff Mobile antenna height (m)
KClutter Multiplying factor for f(clutter)
f(clutter) Average of weighted losses due to clutter
In Asset and Atoll these values are set to default value but can be adjusted to tune the
propagation model according to actual propagation conditions. Table 2.1 below shows a
sample tuned values for and metropolitan town in India (Rani, Behara, & K.Suresh,
2012). These results are the only one of the kind that have been published.
Table 2.1: Example of tuned values for an Indian Metropolitan Region
K value Dense Urban Urban Sub Urban Rural Highways
K1 16.375 17.575 17.675 5.275 26.625
K2 48 45.9 44.9 48 40.1
K3 5.83 5.83 5.83 5.83 5.83
K4 0.8 0.8 0.8 0.8 0.8
K5 -6.55 -6.55 -6.55 -6.55 -6.55
K6 0 0 0 0 0
Kclutter 1 1 1 1 1
2.5 Outage Compensation Using Cell Zooming
Cell zooming involves the adjustment of the cell size by varying electrical power
dissipated by the antenna or by varying the tilt angle of the antenna either by mechanical
17
or electrical means (Pedrini, 2008), (Meyer, 2010) or by varying the height of the
antenna. Each of the approaches to cell zooming has its advantages and disadvantages but
the best approach would involve an optimal combination of the three.
2.5.1 Electrical Zooming
For a specific region, path loss is dependent on frequency and distance. Thus at fixed
frequency, path loss will be dependent only on distance. Consequently, increasing the
radiated power means there is a net margin to allow for a longer distance. Similarly,
reducing the power would lower the overall distance that the acceptable signal can cover.
This is the electrical zooming. It is achieved by varying the power fed to the transmitting
antenna to vary the coverage radius
2.5.2 Mechanical tilt
A mechanical tilt involves tilting the antenna usually through specific accessories on its
bracket consequently altering the direction of propagation of the signal. This tilt can be
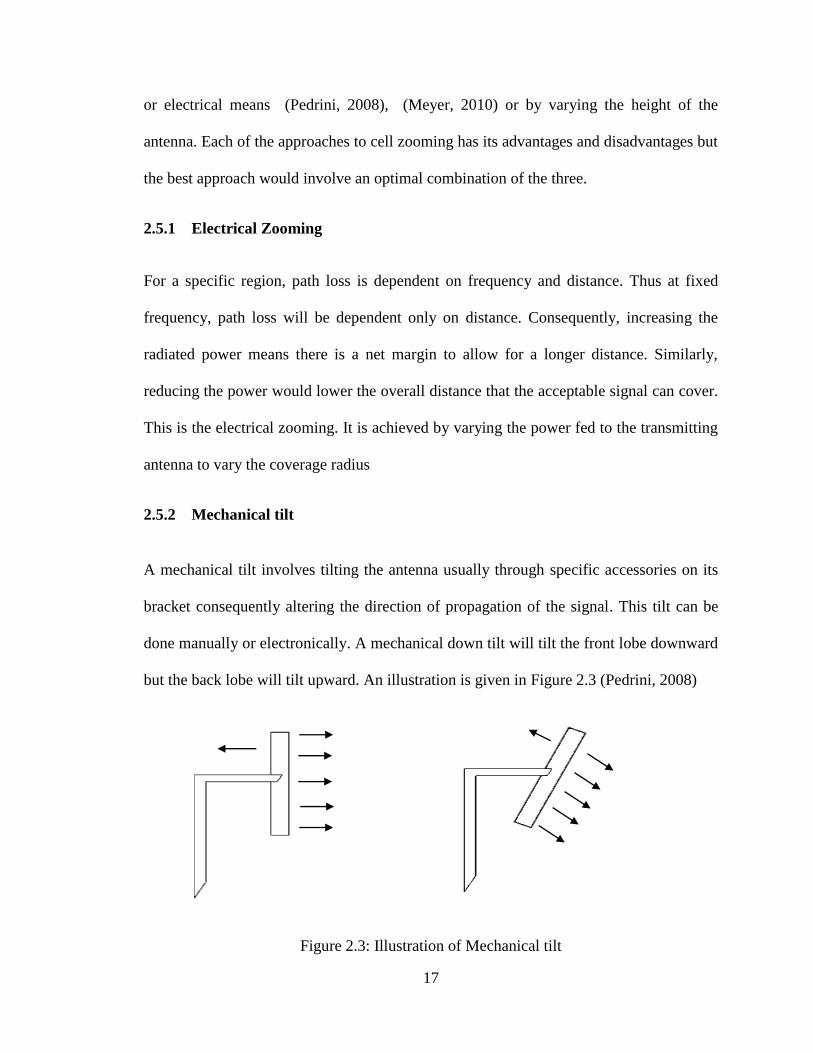
done manually or electronically. A mechanical down tilt will tilt the front lobe downward
but the back lobe will tilt upward. An illustration is given in Figure 2.3 (Pedrini, 2008)
Figure 2.3: Illustration of Mechanical tilt

18
When using mechanical down tilt, one is exposed to unexpected and often undesirable
pattern variances. This effect holds true beyond pattern blooming and can be seen in
other horizontal pattern characteristics such as front-to-back ratio, beam squint, sector
power ratio, and cross-polarization ratio (Meyer, 2010).
2.5.3 Electrical tilt
This is obtained by changing the characteristics of signal phases on each element of the
antenna, as seen in Figure 2.4 (Pedrini, 2008). A BTS antenna is constructed using
several antenna elements usually 2 to 8 and each element is fed with the same signal but
at different phases in order to achieve the tilt. The electrical tilt may have a single fixed
value or may be variable. If the variation is done electrically, this is referred to as Remote
Electrical Tilt (RET). An electrical down tilt, tilts both the front and the back lobe
downwards. Figure 2.4 below shows an illustration of 4 element antenna fed with signal
at different phases in order to achieve the tilt.
Antenna without tilt Antenna with electrical tilt
Figure 2.4: Illustration of Electrical Tilt

19
In addition to reducing horizontal pattern blooming, the increased beam forming
capabilities of the electrically tilted antennas have yielded significant improvement in
controlling other negative pattern characteristics. These include beam squint, front-to-
back ratio and cross polarization ratio. It is noted that, antennas using only electrical tilt
produce horizontal patterns that maximize sector coverage while minimizing potential
interference, and that their patterns demonstrate a high degree of consistency regardless
of the tilt angle (Meyer, 2010).
A comparison of the effect of electrical and mechanical tilt on the coverage is shown in
Figure 2.5 (Pedrini, 2008)
Figure 2.5: Radiation patterns of mechanical and electrical tilts
2.5.4 Height adjustment
As described above it is possible to achieve a cell zoom by adjusting the height of the
antenna on the tower and by using Okumura-Hata model, it is possible to determine the
correct height to achieve a particular cell size.

20
2.6 Factors affecting compensation using cell zooming
There are two main considerations that determine the requirement of a particular cell for
adequate coverage.
The minimum power required by the MS in order to sustain a communication
between the radio and the MS and a minimum power of -114dBm is required to
be received at the BTS antenna to sustain communication with a MS (SIEMENS
AG, 2006). Equations (2.4) to (2.10) given previously are used to calculate the
desired or the expected signal levels at various distances.
The size of available resources for carrying traffic. Usually, the limiting capacity
is that of traffic channels (TCH). The other channels on a radio hardly get
congested except in a case of extreme traffic or as a result of equipment fault.
The goal of every cellular network planning team is to strike a balance between coverage
and capacity. There are two aspects of coverage. One looks at the number of subscriber
covered while the second is the geographical region. The end product is the volume of
traffic generated in an area.
2.7 Methods of addressing capacity issue
As noted earlier, compensation cannot be achieved without enough capacity. This may
aggravate the situation leading to serious congestion or complete outage. Compensation
should thus not be a cause for further degradation of service. The following are some of
the measures that address capacity issue in the event that the planned capacity gets
overwhelmed.
Multi Radio Access Technology (Multi-RAT):

21
This is where one site is served by multiple radios of different radio technologies.
This is termed as a technology collocation (Network E. U. T. R. A, 2010) (3GPP ,
2009).
Adaptive Multi Rate-Half Rate (AMR-HR)
A standard voice encoding is at 16Kbps at the radio level. Any encoding method
reducing the bit-rate to 8kbps or less is the half rate. The AMR codec provides
operators with a means to optimize the balance between voice quality and spectral
efficiency by continuously selecting the optimal speech codec rate for the current
radio and traffic conditions (DITECH NETWORKS, 2012).
Dynamic channel allocation
Some channels in a radio can be configured as dual channels (capable of both
voice and data). Dynamic adjustment can be made either to increase the allocation
for voice or data, depending on which traffic type is high or has higher priority
(Zhang & Soong, 2004).
COW (Cell on Wheel/Wings)
This is a radio that is normally mounted on a movable container that is transported
on road or by air to a location which has no coverage or has gone out of coverage
to help offer services.
2.8 Indicators of cell failure
There are three sources that can provide information that would indicate a cell has failed.
Two of them are measurements relating to the cell while the others come from the user
equipment. The information from the user equipment may not be accessible to the
network provider and therefore has little contribution to the assessment that may help
22
identify a failed cell. The two sources relating to cell measurement are taken from the cell
itself or from the operation and maintenance data.
All cells generate data of their performance. This data is summarized in form of statistics
that is used to compare with defined standard termed quality of service while O&M
continuously monitor the KPIs. Any deviation from the normal will indicate a cell failure.
For example the following are indicators of potential cell outage
Increased load in some cells
High inter-cell interference
Increased number of handover failures
Sudden increase in radio link failures
High number of dropped calls
If outage is not detected and compensated for in time, it may lead to degradation of
services and in worst case it may lead to complete loss of service as a result of extreme
number of retries.
2.9 Related studies
The studies in the area of self-healing have been carried out in two categories. The area
with the most studies has been in the detection of cell outage commonly referred to as
cell outage detection (COD). This is of course because detection precedes compensation.
COD can be divided into stages (M. Amirijoo L. J., 2009), starting at the time of the
instant of the failure and ends when it is corrected.
23
The main reason for the concern with COD has been due to presence of sleeping cells
(M. Amirijoo L. J., 2009). These are cells that have lost communication to the OAM and
therefore no statistics about their operation is available. Such cases happen when the
OAM module in the cell required to sends alarms to the OAM center is the one that is
faulty (Ciocarlie, Lindqvist, Novaczki, & Sanneck, 2013). In the absence of alarms, the
operator may have the impression that the cell is healthy. Such detection requires the use
of data coming from the neighbouring cells such as handover statistics (de-la-Bandera,
Barco, Muñoz, & Serrano, 2015) from neighbouring cells for COD or by profiling normal
operation of cells from their statistics (Zoha, Saeed, Imranz, Imrany, & Abu-Dayya,
2015) it is possible to detect and localize a fault.
The second type of study is on Cell Outage Compensation (COC) where the initial
studies have analyzed the steps in compensation.
A number of organizations have engaged in research in the area: 3rd Generation
Partnership Project (3GPP), Next Generation Mobile Networks (NGMN) and Self-
Optimization and self-ConfiguRATion in wireless networkS (SOCRATES) project, have
conduct both research and projects in the area. 3GPP gives a detailed description of self-
healing (Network E. U. T. R. A, 2010) (3GPP , 2009) (Network E. U. T. R. A., 2009).
NGMN research report gives analysis on control parameters used for effective
compensation in case of cell outage (Li, Yu, Yin, & Meng, 2015 ) while SOCRATES
project (Kürner, 2010) also describes the procedure, scenarios and framework of self-
healing, and indicates that the coverage gap could be compensated by adjusting the
parameters, such as transmit power and the antenna down tilt (Meyer, 2010) of the
surrounding cells to achieve compensation (Li, Yu, Yin, & Meng, 2015 ) (Jie, Alsharoa,

24
Kamal, & Alnuem, 2015) (Bramah, 2016). These proposals give instructions on how to
carryout compensation but the specific mechanisms and algorithms are not provided.
Some specific compensation algorithms are put forward to achieve the compensation for
the outage area by adjusting the pilot power, the uplink target received power and other
parameters of surrounding cells (M. Amirijoo L. J., 2009) (M. Amirijoo L. J., 2011)
(Wenjing Li, 2012) (Chernogorov, 2015) (Li F. Q., 2011). Initially a centralized
compensation mechanism and a heuristic algorithm are proposed to adjust the power of
neighbouring antennas (Wenjing Li, 2012). The same authors of (Wenjing Li, 2012) in a
more recently (Li, Yu, Yin, & Meng, 2015 ) have suggested use of distributed mechanism
in compensation.
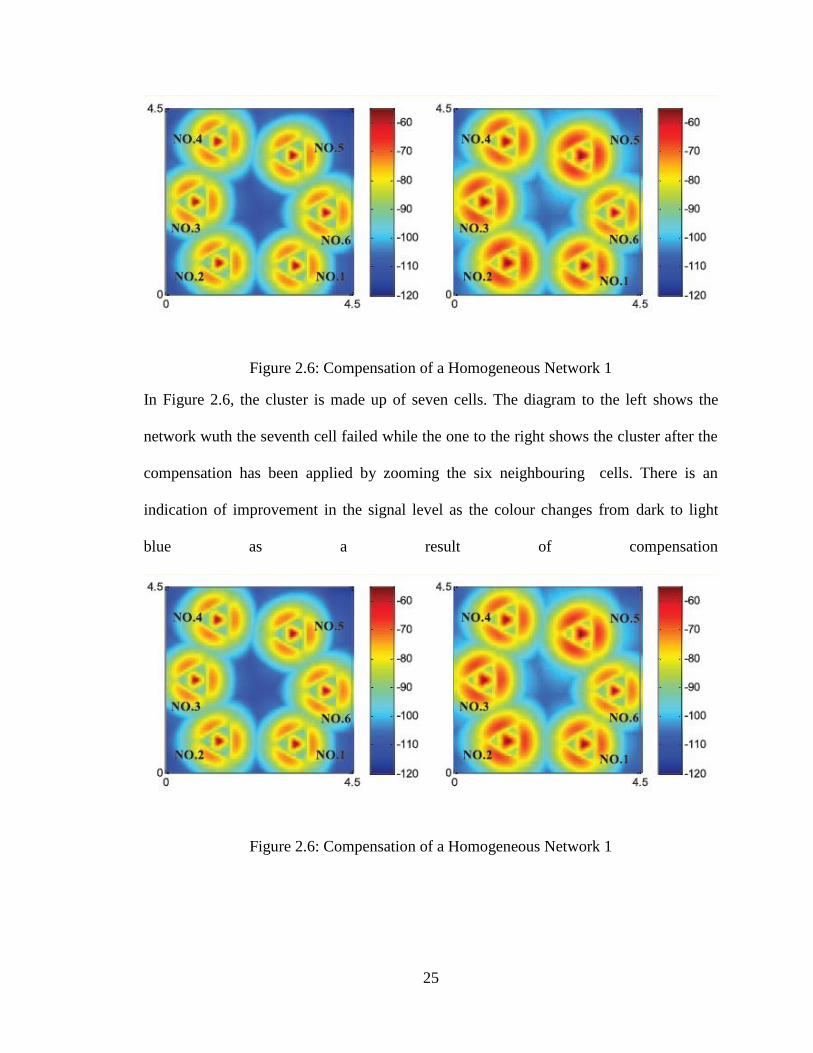
Some studies have generated and tested an algorithm for COC.
Figure 2.6: Compensation of a Homogeneous Network 1
and Figure 2.7 shows the simulation results done in studies (Li, Yu, Yin, & Meng, 2015 )
and (Chernogorov, 2015) respectively. As seen, the simulations use a seven cells cluster
to test the compensation with a significant improvement in signal level when the failed
cell is compensated by zooming the neighbouring cells. However, the algorithm zooms
all the sectors in the compensating cells which is an unnecessary waste of power.
25
Figure 2.6: Compensation of a Homogeneous Network 1
In Figure 2.6, the cluster is made up of seven cells. The diagram to the left shows the
network wuth the seventh cell failed while the one to the right shows the cluster after the
compensation has been applied by zooming the six neighbouring cells. There is an
indication of improvement in the signal level as the colour changes from dark to light
blue as a result of compensation
Figure 2.6: Compensation of a Homogeneous Network 1

26
Figure 2.7: Compensation of a Homogeneous Network 2
Figure 2.7 shows 20 cells with the inner 7 cells making a cluster. The central cell has
sectors 29, 30 and 31 but sector 29 has failed. The normal signal levels are indicated on
the left diagram. In the diagram on the right (Figure 2.7), compensation for the failed
sector has been done by zooming all the cells surrounding the cell with the failed sector
2.10 Gap in the existing studies
The main weaknesses of these studies are
The zooming is done in all the neighbouring cells and sectors. This is not optimal
as some of the sectors pointing in the opposite direction to the failed cell do not
contribute to improvement of the coverage. This leads wasted energy
These studies do not test the functionality of the algorithm using actual data and
thus they do not stand the test of time.
This research intended to improve on the flows of these studies by showing that
compensation can be implemented by zooming only three sectors out of the eighteen thus
contributing to saving in power. This study has also been carried out using theoretical and
actual data to improve on the weaknesses of the previous studies.
27
CHAPTER THREE
3 METHODOLOGY
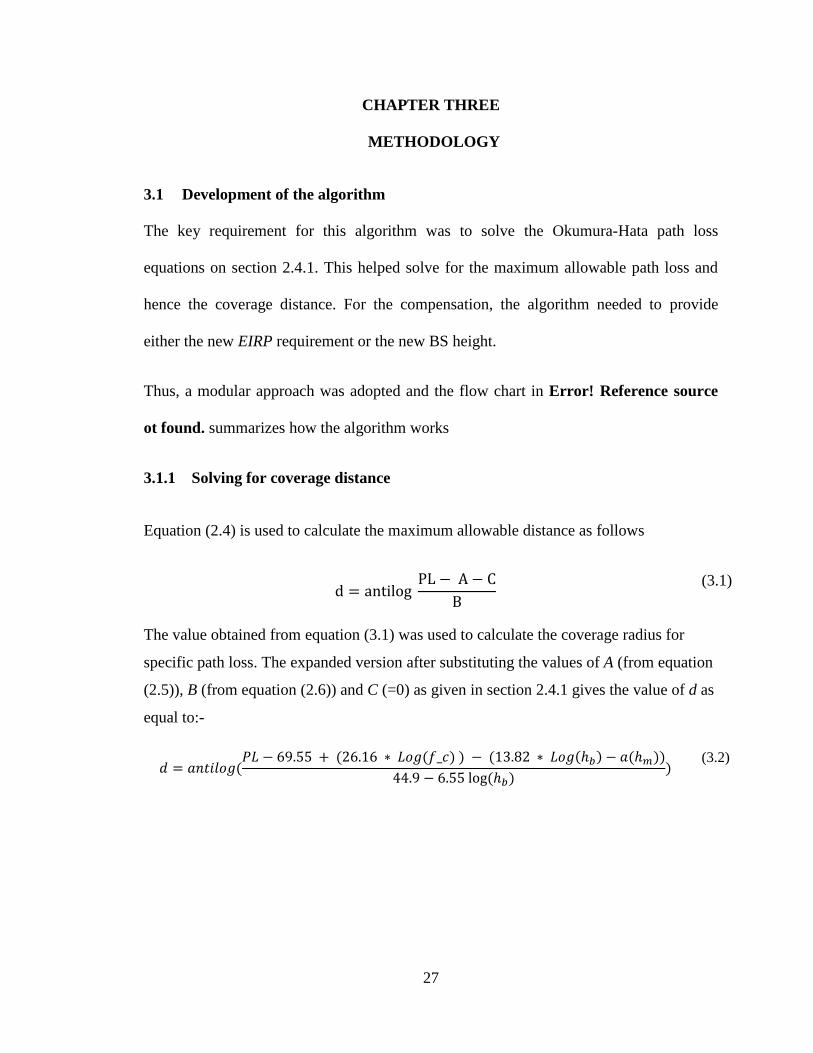
3.1 Development of the algorithm
The key requirement for this algorithm was to solve the Okumura-Hata path loss
equations on section 2.4.1. This helped solve for the maximum allowable path loss and
hence the coverage distance. For the compensation, the algorithm needed to provide
either the new EIRP requirement or the new BS height.
Thus, a modular approach was adopted and the flow chart in Error! Reference source
ot found. summarizes how the algorithm works
3.1.1 Solving for coverage distance
Equation (2.4) is used to calculate the maximum allowable distance as follows
(3.1)
The value obtained from equation (3.1) was used to calculate the coverage radius for
specific path loss. The expanded version after substituting the values of A (from equation
(2.5)), B (from equation (2.6)) and C (=0) as given in section 2.4.1 gives the value of d as
equal to:-
(3.2)

28
Figure 3.1: Algorithms Flow Chart
Initialize Conditions (Load
Database
Exit
Display
Output
Is there a
failed cell?
Determine
required Power
Determine
coverage distance
Start
Choose
Module
Obtain cell ID
Determine the cluster cell belongs to
Is the cell in a
cluster that can be
compensated?
Obtain current location of failed cell
Determine the compensating sectors
Cell Outage
Detection
module
NO
NO
YES
YES
29
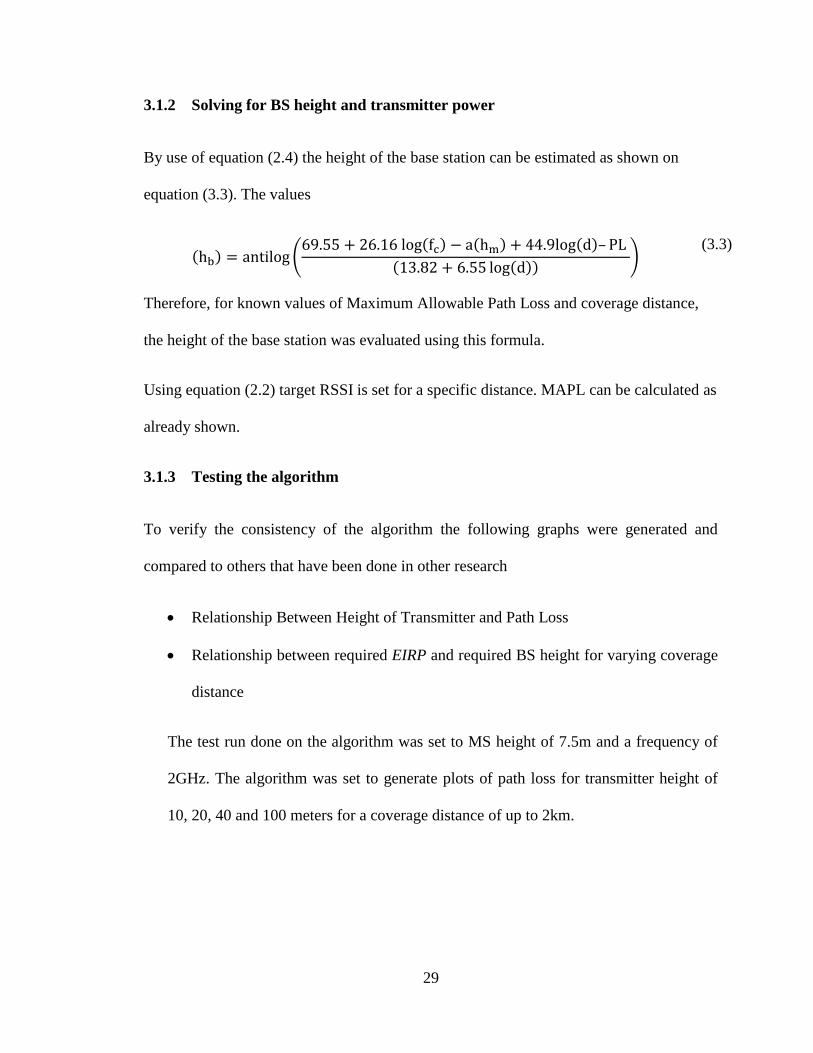
3.1.2 Solving for BS height and transmitter power
By use of equation (2.4) the height of the base station can be estimated as shown on
equation (3.3). The values
(
)
(3.3)
Therefore, for known values of Maximum Allowable Path Loss and coverage distance,
the height of the base station was evaluated using this formula.
Using equation (2.2) target RSSI is set for a specific distance. MAPL can be calculated as
already shown.
3.1.3 Testing the algorithm
To verify the consistency of the algorithm the following graphs were generated and
compared to others that have been done in other research
Relationship Between Height of Transmitter and Path Loss
Relationship between required EIRP and required BS height for varying coverage
distance
The test run done on the algorithm was set to MS height of 7.5m and a frequency of
2GHz. The algorithm was set to generate plots of path loss for transmitter height of
10, 20, 40 and 100 meters for a coverage distance of up to 2km.

30
3.2 Simulation
Four simulations were considered for this research and parameters used assumed a small
city region. Hence the algorithm and the simulator were tuned to specifications of the
small city conditions using Okumura-Hata propagation model. The algorithm provided
the required adjustment values that were fed on the simulator to view the simulation.
3.2.1 Homogeneous single sector, 7 cells cluster network
A homogeneous network is a network which all parameters are uniform. A homogenous
network is more of a theoretical network that assumes a cluster which has even
distribution of cells in the cluster, all antennas are at the same height, the traffic is evenly
distributed, the cells are of equal capacity and the terrain is ideal.
Two types of homogenous networks were considered: 3 sector cell and 1 sector cell. For
each of the networks the following process was carried out and the results recorded in the
result chapter.
Table 3.1: Simulation parameters
PARAMETER VALUE
Target RSSI -90dBm
EIRP 60dBm
MAPL 150dBm
Mobile station antenna height (hb) 1.8m
Base station height (hm) 35m
Frequency (fMHz) 900
Propagation Model Okumura-Hata (Medium & small city)
31
With these settings, the algorithm gave a separation distance of 5.3km which for
simulation purposes was approximated to 5km.
By use of iterative means the value of 1.8m the mobile station height was found to give
the best fit
Step 1: A healthy condition of the network was simulated using the parameters on
Table 3.1 and recorded
Step 2: A target cell was switched off to simulate fault in the model
Step 3: This fault was assumed to trigger the compensation process which obtain
the status of the healthy cells to determine the amount of compensation each cell
can contribute to the failed cell.
Step 4: Cell compensation was done by adjusting the power level or the height of
the neighbouring cells as per the calculated weights
Step 5: The effect of the compensation on the radio coverage was recorded.
Step 6: The fault cell was „repaired‟ and a reversal to normal condition is
gradually implemented to prevent interruption of service or „shocking‟ the
repaired cell. This is an assumption in consideration of what should be done in a
live environment
3.2.2 Homogeneous 3 sectored, 7 cells cluster system
Compensation of a 3 sectored cell is a bit different from that of an omnidirectional
antenna because of the signal distribution in such an antenna. While the pattern of an
omnidirectional antenna is circular, that of 3 sectored cells is best represented using an
equilateral triangle.

32
Referring to Figure 3.2, it can be shown mathematically that the ratio A: a is 2:1. Thus
during compensation, only a half extra distance is to be compensated for. In this case
compensation was achieved by multiplying the distance of the healthy cell by 1.5 to get
the compensation distance. Thereafter, steps 1 to 6 in page 31 above were followed in the
simulations
3.2.3 Non-homogeneous network
This network was set up such that the cells are evenly distributed in an ideal environment
but the antenna height and power were not equal. However, calculations were done to
ensure a healthy network conditions is achieved. A healthy condition in this case meant
all the antennas are able to cover the same distance which required balancing between
power and antenna height in relation to path loss. Therefore, despite the varying height
and power, each antenna was set to be able to have a coverage distance of 5km.
Nevertheless, cells A, E and F as appearing in Table 4.9 are not affected during
compensation and thus their parameters were left as default. Results of the compensation
B
A
C
A
B C
a
Figure 3.2: Representation of a 3 sector signal
33
for a three sectored cell cluster are shown in Results of the compensation for a three
sectored cell cluster are shown in Figure 4.11 and Figure 4.12
Table 4.8 has ideal settings that were calculated and used to simulate a healthy network.
Steps 2 to 6 were then followed for the other simulations. The distance was changed from
5 to 7.5 km during compensation. This adjustment was made to specific sectors of the
candidate cells.
3.2.4 Simulation using actual network data
Data for cells around Juja town were provided by Safaricom. The information included
all required parameters and is annexed as APPENDIX 6 and APPENDIX 7. This
information was used for simulations by following steps 2 to 6 above and recording the
results.
3.3 Traffic Trends Analysis
To show the environment under which compensation can be applied, the following
analyses were carried out.
The busy hour call attempts plot for sites around JKUAT from 1st October 2013 to
January 11th
2014 in APPENDIX 3: Busy Hour Traffic Data was provided but
only the truncated version of up to November 28th
2013 was considered because
the data includes traffic for 29th
November when there was graduation and the
traffic was way beyond capacity and it is seen even the Cell On Wheel (COW)
that was introduced did little to contain the extra load. The other traffic which is a
34
little out of pattern is that from 20th
December and January 4th
when the university
was closed and therefore a significant source of traffic was not present.
One Week Hourly Traffic trend was plotted using the data on APPENDIX 4
Busy Day Hourly Traffic trend was obtained by plotting the data on APPENDIX
5
35
CHAPTER FOUR
4 SIMULATION RESULTS ANALYSIS AND DISCUSSION
4.1 Algorithm test
From link budget calculation equation (2.2) the values of RSSI was set -105dBm and
margin of 10dBm was allowed for good call quality. This gave
MAPL = EIRP +95dBm
(4.1)
Two approaches were considered for solving equation (4.1). One is by fixing the EIRP to
60dBm and calculating the cell radius for the two frequencies bands of 900 and 1800
MHz and the second one was by fixing the radius and then calculating the EIRP.
From equation (4.1) and setting the EIRP to 60dBm
MAPL = 60dBm +95dBm =155dBm=PL
To solve for PL the parameters on Table 4.1 were considered as well application of equation
(2.3)
Table 4.1: Table of Path Loss Parameter Values
PARAMETER VALUE
Target Received Signal Levels -105dBm
Loss margin 10dBm
Antenna Gain 17dBi
Cable losses 10dBm
Mobile station antenna height (hm) 1.5m
Base station height (hb) 35m
Frequency (fMHz) 900/1800

36
Values of C were calculated and recorded on Table 4.2 below using equations on sections
2.4.1
Table 4.2: Calculated values of C for different environments
Values of a(hm) were calculated using section 2.4.1 and recorded in Table 4.3 below
Table 4.3: Values of a(hm)
AREA )for
900 MHz
) for 1800
MHz
Large city -9.19*10-4
-9.19*10-4
Rural
Suburban
Small city
Medium city
15.88*10-3
4.297*10-2
Using equation (2.4) and the values in Table 4.3, the values of A were tabulated in
AREA C calculation formula C for 900MHz C for 1800MHz
Open/Rural [ ]
-28.55 -31.96
Suburban [ (
)]
-9.94 -11.94
Small city
Large city
0 0 0

37
Table 4.4 below
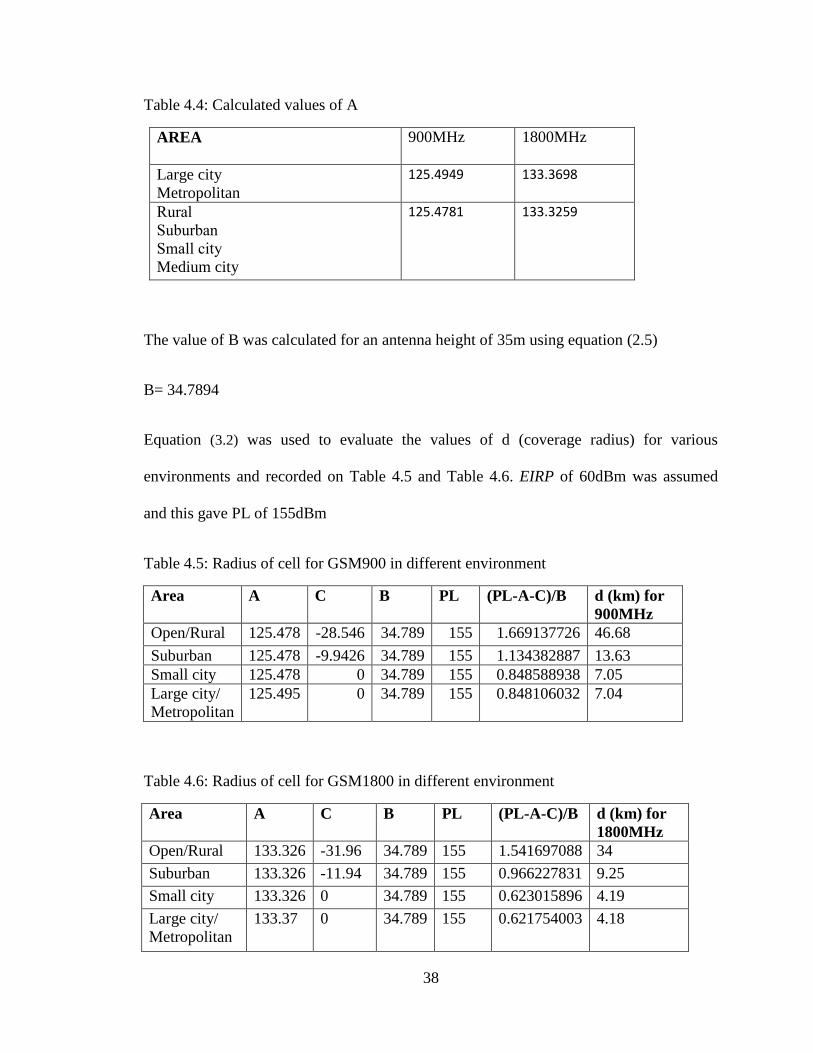
38
Table 4.4: Calculated values of A
AREA 900MHz 1800MHz
Large city
Metropolitan
125.4949
133.3698
Rural
Suburban
Small city
Medium city
125.4781 133.3259
The value of B was calculated for an antenna height of 35m using equation (2.5)
B= 34.7894
Equation (3.2) was used to evaluate the values of d (coverage radius) for various
environments and recorded on Table 4.5 and Table 4.6. EIRP of 60dBm was assumed
and this gave PL of 155dBm
Table 4.5: Radius of cell for GSM900 in different environment
Area A C B PL (PL-A-C)/B d (km) for
900MHz
Open/Rural 125.478 -28.546 34.789 155 1.669137726 46.68
Suburban 125.478 -9.9426 34.789 155 1.134382887 13.63
Small city 125.478 0 34.789 155 0.848588938 7.05
Large city/
Metropolitan
125.495 0 34.789 155 0.848106032 7.04
Table 4.6: Radius of cell for GSM1800 in different environment
Area A C B PL (PL-A-C)/B d (km) for
1800MHz
Open/Rural 133.326 -31.96 34.789 155 1.541697088 34
Suburban 133.326 -11.94 34.789 155 0.966227831 9.25
Small city 133.326 0 34.789 155 0.623015896 4.19
Large city/
Metropolitan
133.37 0 34.789 155 0.621754003 4.18

39
These calculations were used to tune the algorithm to provide the correct figures
Figure 4.1 was the resultant plot generated by the algorithm for path loss against distance
for various BS heights. This plot compared perfectly with Figure 4.2 from a study (Ephan
& Gabriel) done on Kathrein antenna.
All the subsequent results from this algorithm were thus considered authentic.
Figure 4.3 below shows the relationship between EIRP and BS height for different
coverage distance. For the same distance of coverage, increasing the BS height would
mean lowering the EIRP and vice versa. For example, to cover 1km radius with RSSI of -
90dBm the network can be set to EIRP of 30dBm and 80m high antenna or EIRP of
35dBm and 30m antenna. To double this coverage distance to 2km would mean adjusting
the power or the height to values that are on 2km plot.

40
Figure 4.1: Relationship between path loss and Height of Transmitter as generated by the
algorithm
Figure 4.2: Relationship between path loss and Height of Transmitter as generated in a
different study

41
Figure 4.3: Required EIRP and BS height for various coverage distances
4.2 Simulations
This section contains the results of the simulations. The specific data used is provided or
referred to in section 3.2. The simulations for the compensation using either BS height
adjustment or EIRP adjustment gave the same output and therefore only one simulation
representation was captured for both compensation cases.
4.2.1 Homogeneous single sectored 7 cells cluster
Table 4.7: Compensation values for single sectored configuration
Before
compensation
Compensation
by height
Compensation
by EIRP
Antenna height 35m 102m 35m
EIRP 60dBm 60 dBm 69.4dBm
Distance 5km 10km 10km
BS Height (m)

42
Figure 4.4: Coverage by Signal Level in Healthy Conditions for a homogenous single
sectored cluster
Figure 4.5: Coverage by Signal Level for a homogenous single sectored cluster after Cell
D is switched off
The white area has signal
strength below -90dBm
and is considered as
having no coverage
43
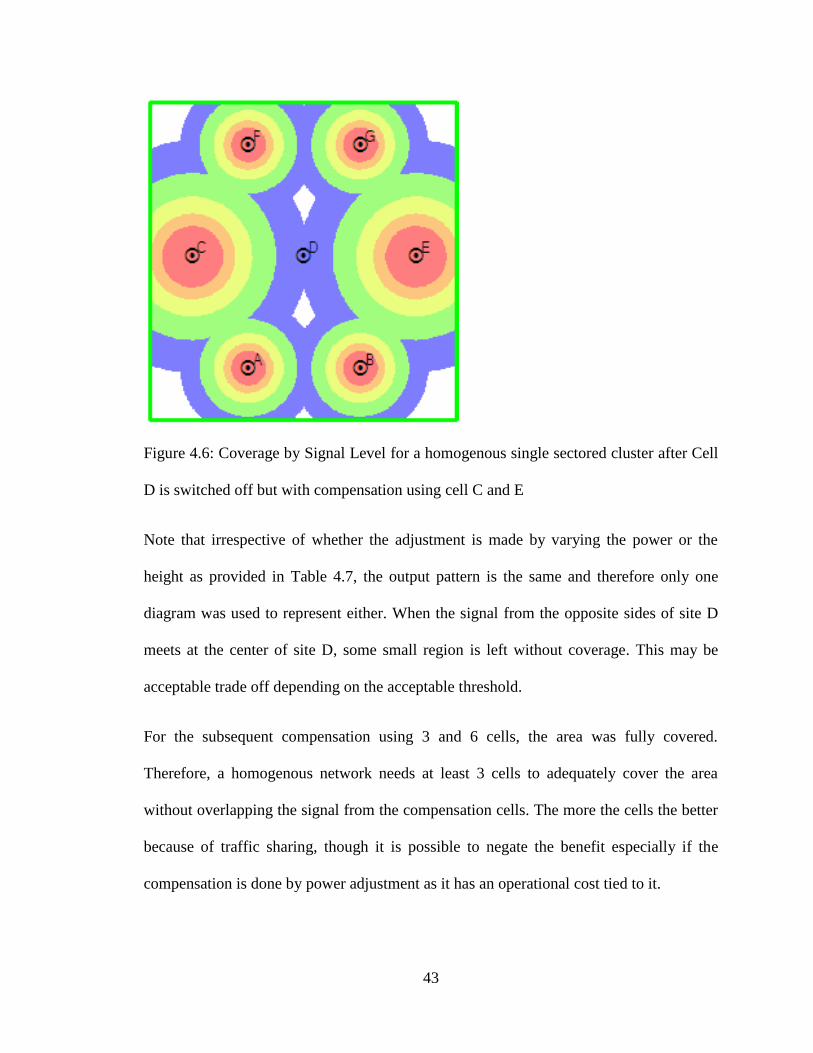
Figure 4.6: Coverage by Signal Level for a homogenous single sectored cluster after Cell
D is switched off but with compensation using cell C and E
Note that irrespective of whether the adjustment is made by varying the power or the
height as provided in Table 4.7, the output pattern is the same and therefore only one
diagram was used to represent either. When the signal from the opposite sides of site D
meets at the center of site D, some small region is left without coverage. This may be
acceptable trade off depending on the acceptable threshold.
For the subsequent compensation using 3 and 6 cells, the area was fully covered.
Therefore, a homogenous network needs at least 3 cells to adequately cover the area
without overlapping the signal from the compensation cells. The more the cells the better
because of traffic sharing, though it is possible to negate the benefit especially if the
compensation is done by power adjustment as it has an operational cost tied to it.
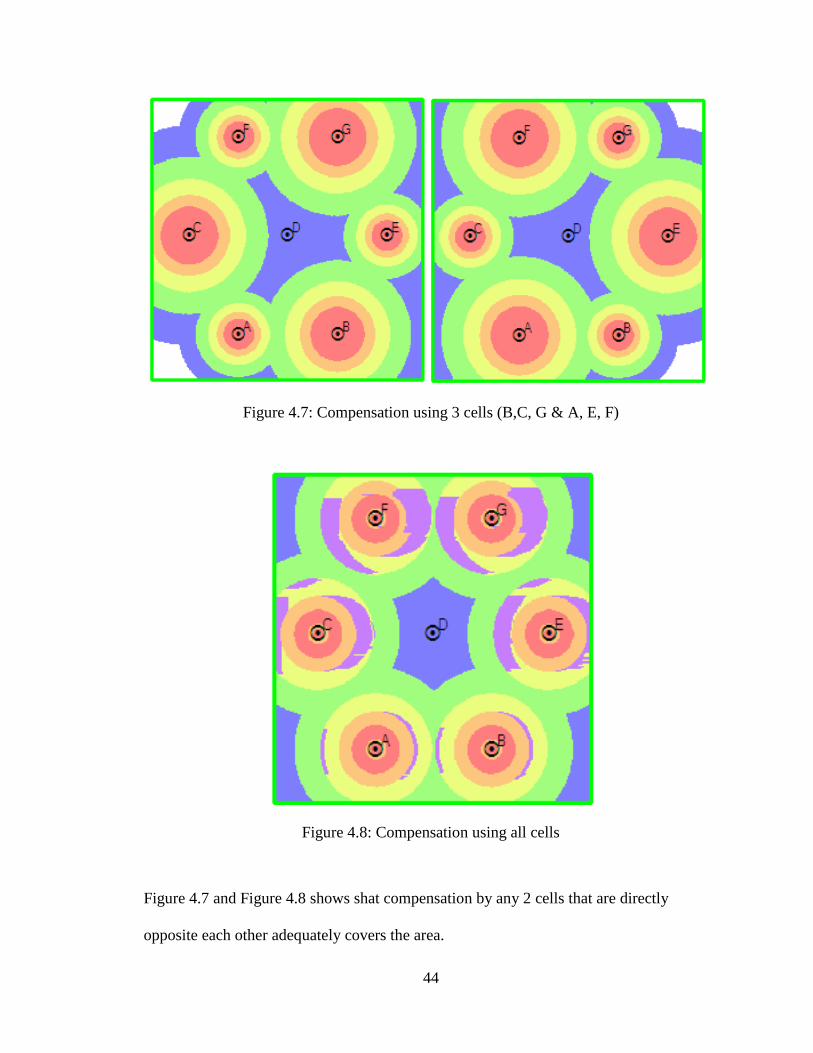
44
Figure 4.7: Compensation using 3 cells (B,C, G & A, E, F)
Figure 4.8: Compensation using all cells
Figure 4.7 and Figure 4.8 shows shat compensation by any 2 cells that are directly
opposite each other adequately covers the area.
45
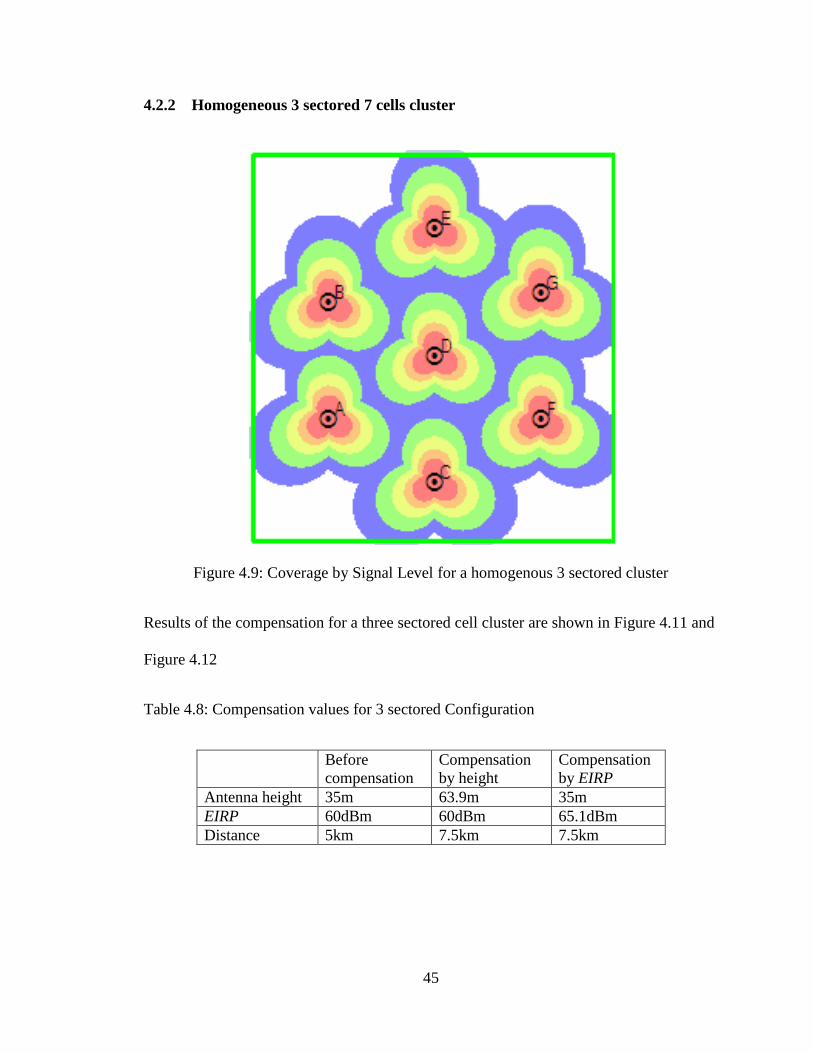
4.2.2 Homogeneous 3 sectored 7 cells cluster
Figure 4.9: Coverage by Signal Level for a homogenous 3 sectored cluster
Results of the compensation for a three sectored cell cluster are shown in Figure 4.11 and
Figure 4.12
Table 4.8: Compensation values for 3 sectored Configuration
Before
compensation
Compensation
by height
Compensation
by EIRP
Antenna height 35m 63.9m 35m
EIRP 60dBm 60dBm 65.1dBm
Distance 5km 7.5km 7.5km
46
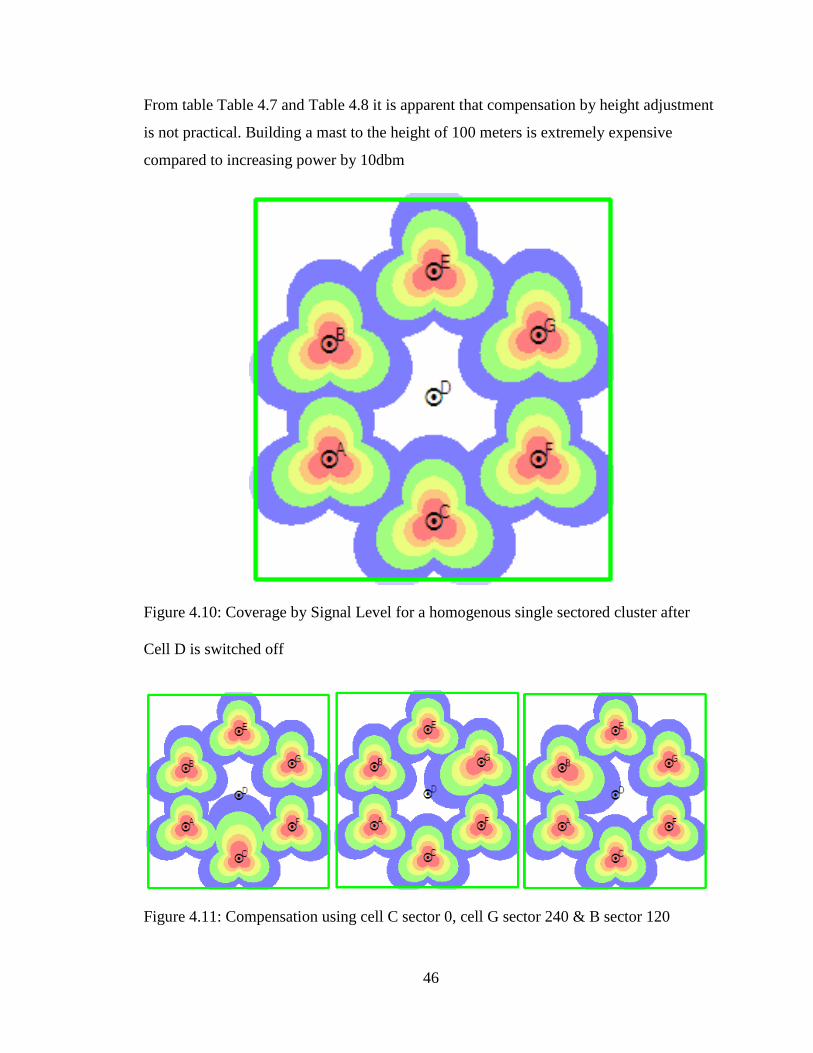
From table Table 4.7 and Table 4.8 it is apparent that compensation by height adjustment
is not practical. Building a mast to the height of 100 meters is extremely expensive
compared to increasing power by 10dbm
Figure 4.10: Coverage by Signal Level for a homogenous single sectored cluster after
Cell D is switched off
Figure 4.11: Compensation using cell C sector 0, cell G sector 240 & B sector 120
47
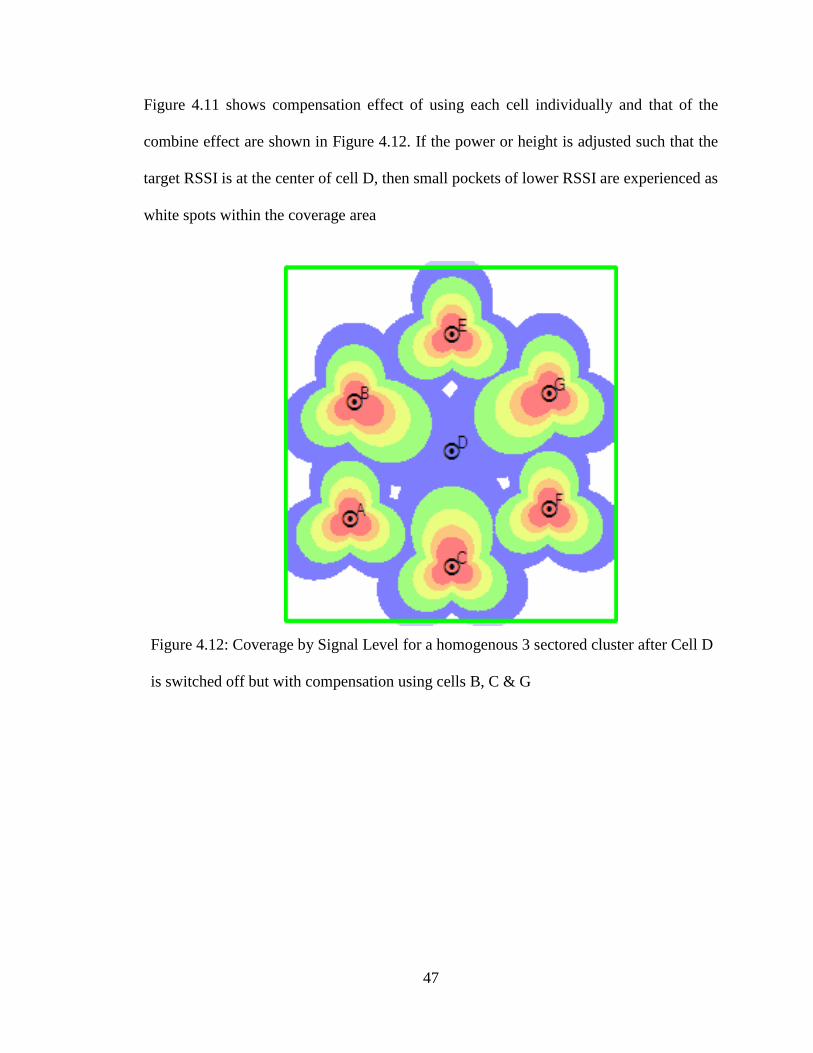
Figure 4.11 shows compensation effect of using each cell individually and that of the
combine effect are shown in Figure 4.12. If the power or height is adjusted such that the
target RSSI is at the center of cell D, then small pockets of lower RSSI are experienced as
white spots within the coverage area
Figure 4.12: Coverage by Signal Level for a homogenous 3 sectored cluster after Cell D
is switched off but with compensation using cells B, C & G
48
4.2.3 Non homogeneous equally spaced 3 sectored 7 cells cluster
Figure 4.13: Non homogeneous 3 sectored 7 cells cluster healthy conditions
Table 4.9: Compensation values used for non-homogeneous network
Before
compensation
Compensation
by height
Compensation
by EIRP
EIRP hb EIRP hb EIRP hb
A 60 35 60 35 60 35
B 61.7 25 61.7 52.3 68 25
C 57.9 40 57.9 81.8 64 40
D 60 35 60 35 60 35
E 60 35 60 35 60 35
F 60 35 60 35 60 35
G 55.4 55 55.4 109.8 61.3 55
49
Figure 4.14: Non homogeneous 3 sectored 7 cells cluster after compensation using cells
B, C & G
When the values on Table 4.9 were used the above compensation diagram was achieved.
It is exactly as in Figure 4.12 because the antennas have been designed to cover the same
area. The same case applies to the signal level distribution pattern after D has been
switched off which duplicates that of Figure 4.10 above
These results compares well with Figure 4.15 (Chernogorov, 2015) and Figure 4.16 (Li,
Yu, Yin, & Meng, 2015 ) show below. However, these algorithms increased power in all
the sectors of the compensating cells as opposed to just 3 sectors of all the six healthy
member of the cluster only. The simulation results given in Figure 4.7 and Figure 4.8
concluded that three cells can adequately compensate for a failed cell in the cluster. This

50
is further supported by the results on Figure 4.12. It is thus a weakness in these studies to
suggest increasing power in 18 sectors of the cluster for COC yet 3 cells can adequately
cover the failed cell. In theory, the proposal in this report would reduce the extra power
required by 6 time that suggested by other studies (Li, Yu, Yin, & Meng, 2015 ) ,
(Chernogorov, 2015).
Figure 4.15: COC 1
Figure 4.16: COC 2
51
4.2.4 Simulation using actual network data
Figure 4.17: Signal Levels of Cells around Juja upto -105dBm RSSI
Figure 4.18: Signal Level of Cells around Juja upto -90dBm RSSI
52
Figure 4.19: Close up for region A when healthy
Figure 4.20: Region A with Cell EC0256 failed

53
Region A is a densely populated area with closely spaced radios which even with the
failure of one cell, the received signal level is still high. Compensation for such a region
is achievable only by ensuring that the trunk capacity for the neighbouring cells is enough
to cover for the extra load.
This is an example of an area with a relatively low density of radios. When cell EC0004
fails as shown in Figure 4.22 a significant area which was under the cell coverage is left
with signal below the target RSSI necessitating compensation. Two cells were selected
for compensation. Cell EC0321 sector 3, which is at an azimuth of 290ᵒ and cell EC0255
sector 1 at 0 azimuths. The power was increased for the two sectors from 57.3dBm to
62dBm EIRP and the azimuths changed from 290ᵒ to 270
ᵒ and 0
ᵒ to 30
ᵒ respectively. This
gave an acceptable compensation for the received signal level. However, use of only two
sectors to compensate gives a huge load to the compensating cells. A huge reserve
Figure 4.21: close-up for healthy region B
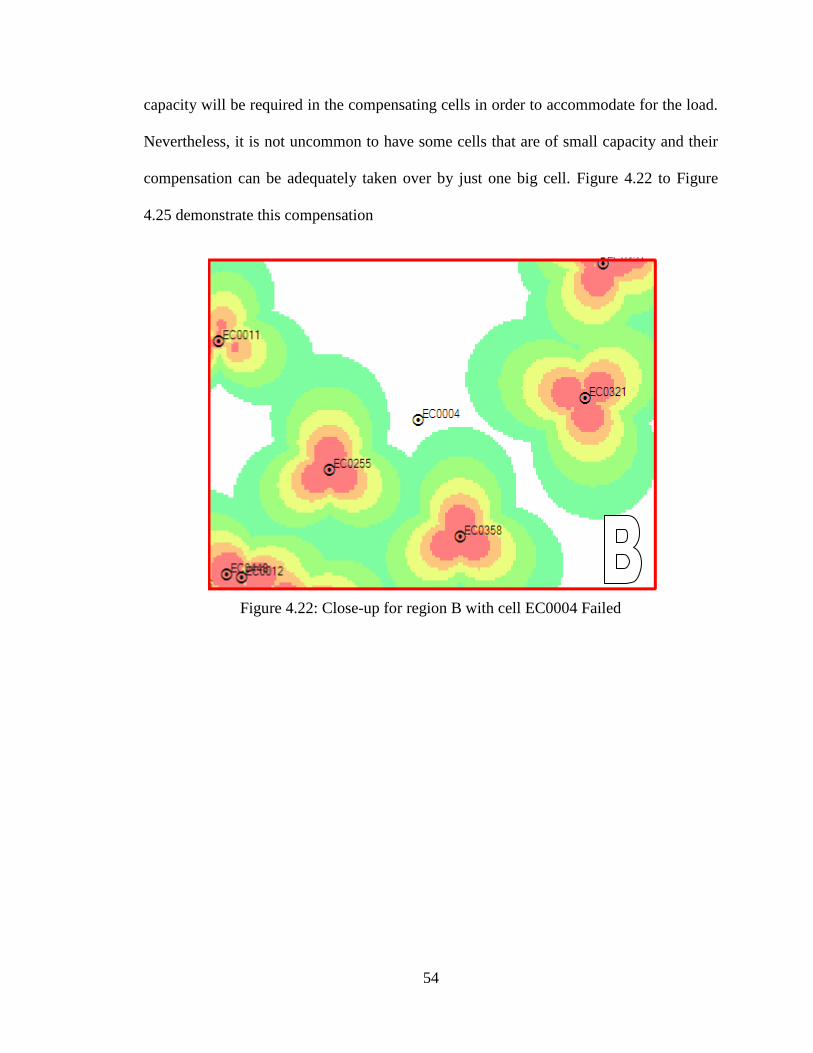
54
capacity will be required in the compensating cells in order to accommodate for the load.
Nevertheless, it is not uncommon to have some cells that are of small capacity and their
compensation can be adequately taken over by just one big cell. Figure 4.22 to Figure
4.25 demonstrate this compensation
Figure 4.22: Close-up for region B with cell EC0004 Failed

55
Figure 4.23: Compensation Using Cell EC0321 power adjustment
The EIRP Power on EC0321 changed from 57.3 to 62
Azimuth of cell EC0321 changed from 290ᵒ to 270
ᵒ
Figure 4.24: Additional compensation using azimuth

56
Figure 4.25: Additional compensation using cell EC0255
For cell EC0225 the power is changed from 57.3 to 62 and the azimuth from 0ᵒ to 30
ᵒ
57
4.3 Traffic Trend
4.3.1 Busy hour trend
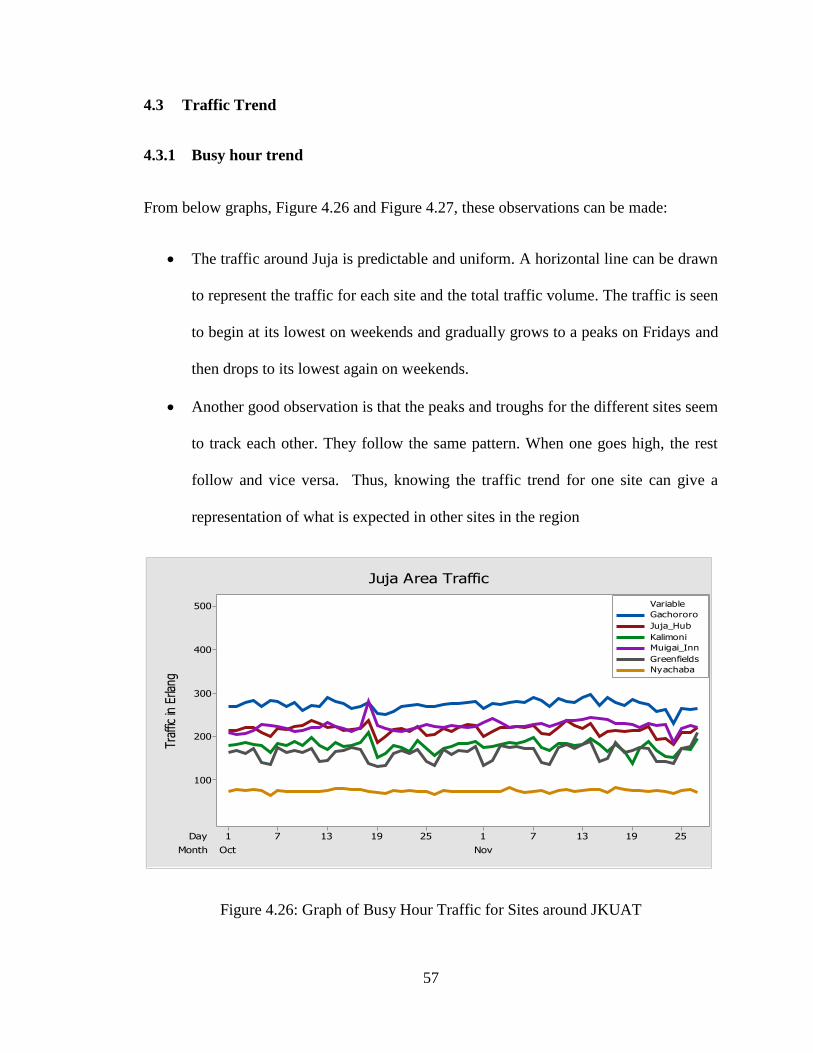
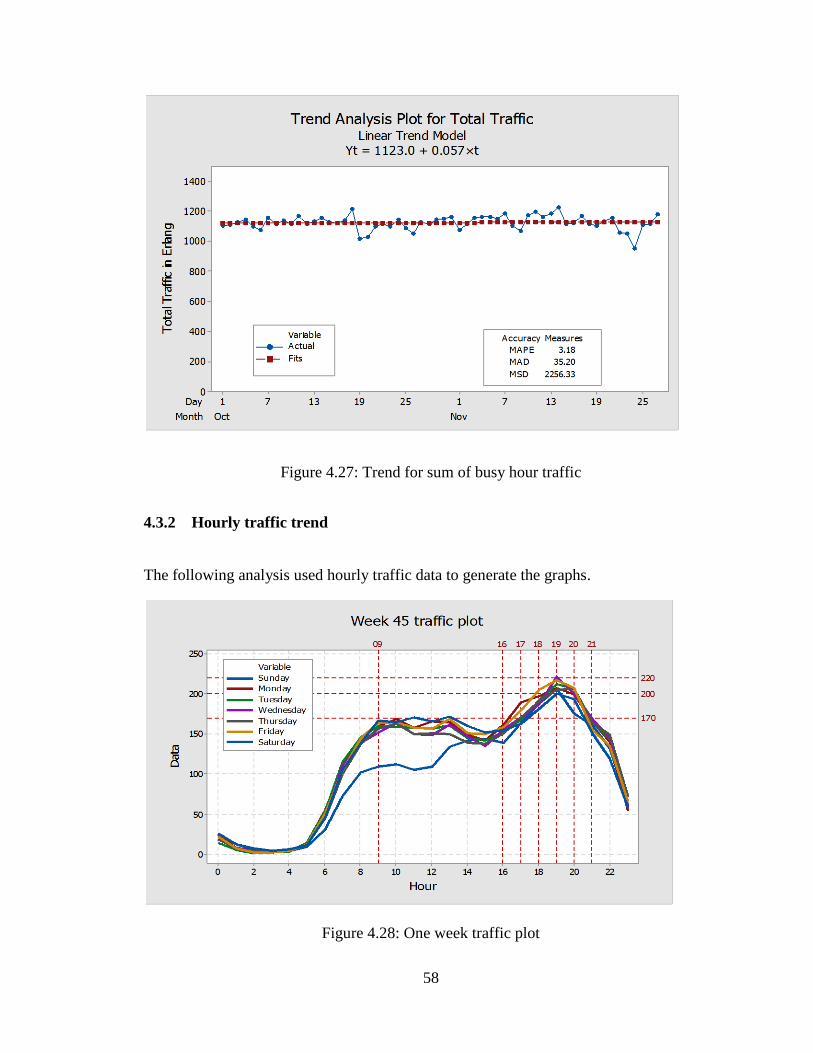
From below graphs, Figure 4.26 and Figure 4.27, these observations can be made:
The traffic around Juja is predictable and uniform. A horizontal line can be drawn
to represent the traffic for each site and the total traffic volume. The traffic is seen
to begin at its lowest on weekends and gradually grows to a peaks on Fridays and
then drops to its lowest again on weekends.
Another good observation is that the peaks and troughs for the different sites seem
to track each other. They follow the same pattern. When one goes high, the rest
follow and vice versa. Thus, knowing the traffic trend for one site can give a
representation of what is expected in other sites in the region
Figure 4.26: Graph of Busy Hour Traffic for Sites around JKUAT
Month
Day
NovOct
2519137125191371
500
400
300
200
100
Traf
fic in
Erla
ng
Gachororo
Juja_Hub
Kalimoni
Muigai_Inn
Greenfields
Nyachaba
Variable
Juja Area Traffic
58
Figure 4.27: Trend for sum of busy hour traffic
4.3.2 Hourly traffic trend
The following analysis used hourly traffic data to generate the graphs.
Figure 4.28: One week traffic plot
59
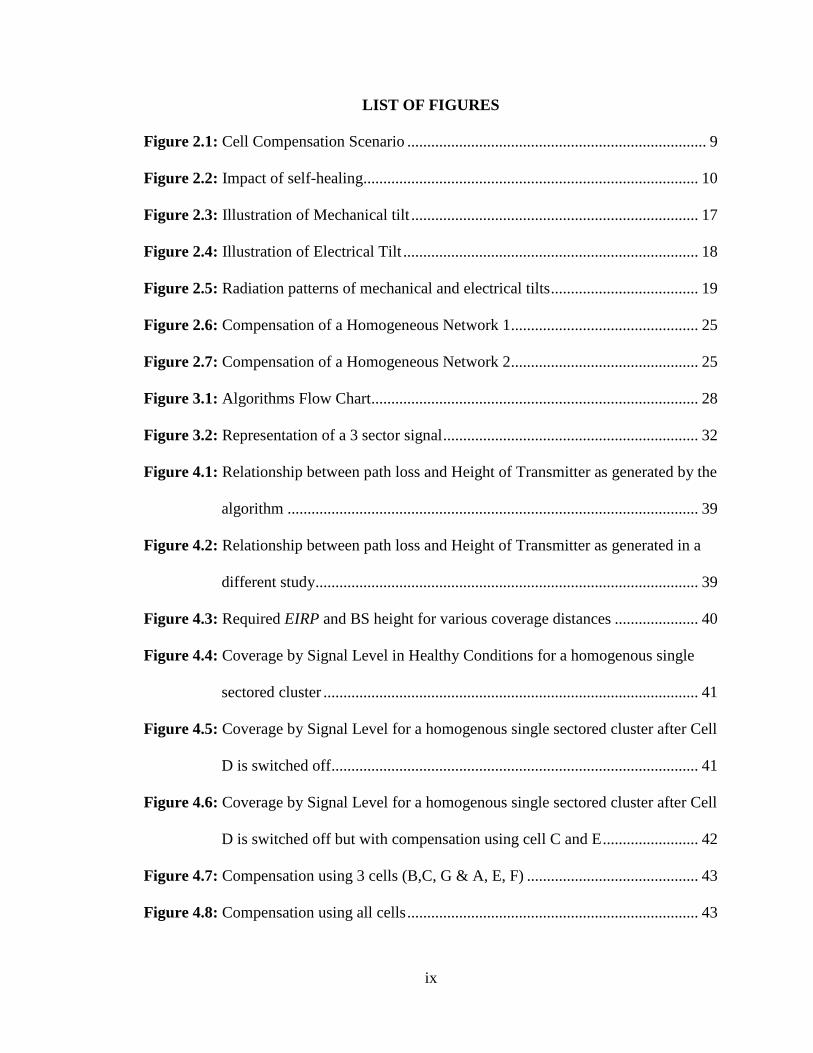
Figure 4.29: Busy day traffic plot
Figure 4.28 shows the traffic trend for different days in a week. Same trend was observed
for other weeks. The traffic is below 25% from midnight to 5am where it grows to its first
peak at 9 am. The next time traffic grows beyond the first peak is at 5 pm, reaches to
peak at 7 pm and deeps to below 25% at midnight
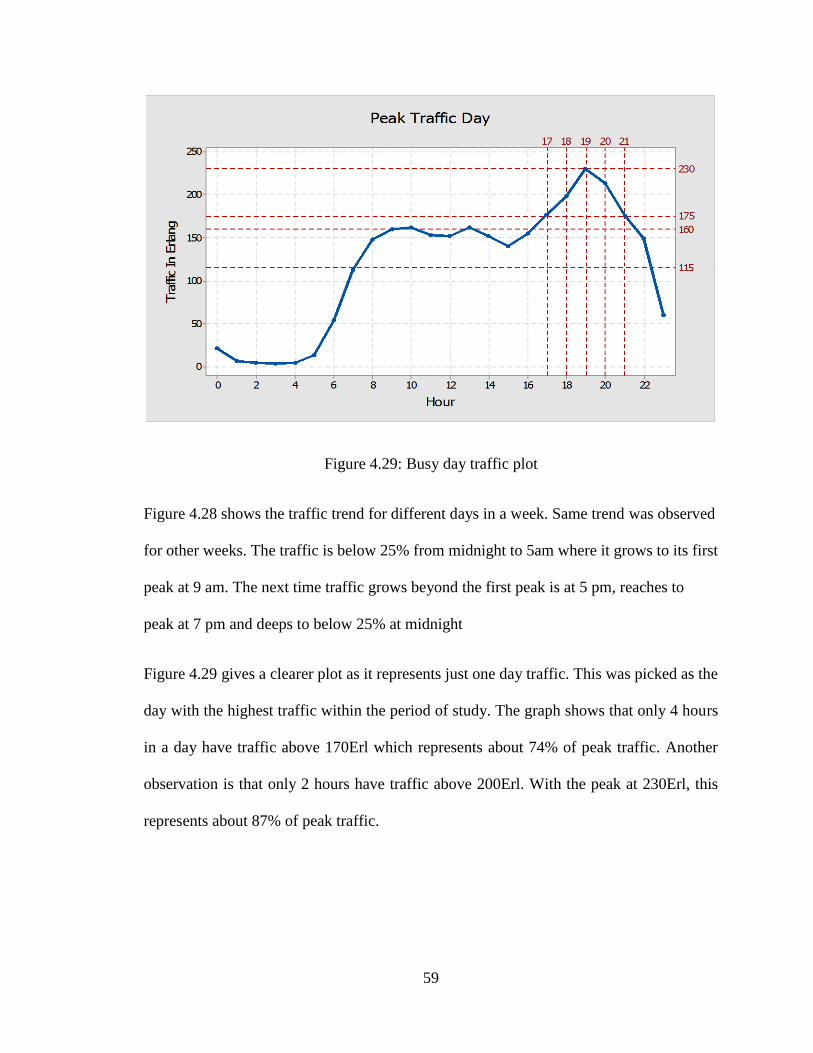
Figure 4.29 gives a clearer plot as it represents just one day traffic. This was picked as the
day with the highest traffic within the period of study. The graph shows that only 4 hours
in a day have traffic above 170Erl which represents about 74% of peak traffic. Another
observation is that only 2 hours have traffic above 200Erl. With the peak at 230Erl, this
represents about 87% of peak traffic.

60
CHAPTER 5
5 CONCLUSION AND RECOMMENDATION
5.1 Conclusion
In this work a self-healing radio network model has been developed and simulated. The
simulation at different complexities shows that it is possible to implement this kind of
network in practice. An actual network simulation was included by using actual data and
this also agreed with theory. Though the study has concentrated on Okumura-Hata
Propagation Model, it is worth noting that this model is one of the most complex in terms
of the number of parameters to be solved. Hence, having found solutions for this study
using Okumura-Hata model makes it easier for duplication of the study with other
models.
The study shows how self-healing can be implemented by introducing compensation
through cell zooming. Two methods of self-healing including height adjustment and
power adjustment were considered and these gave good results. The results for the
homogeneous networks tallied well with other studies in papers (Li, Yu, Yin, & Meng,
2015 ), (Chernogorov, 2015), (Ephan & Gabriel) .
The study included compensation scenarios for single sectored cell and a 3 sectored cell.
It proved easier to compensate for 3 sectored scenario than a single sector since a single
sectored cell required one and half as much power to compensate as compared to three
sectored cell.
Unlike (Li, Yu, Yin, & Meng, 2015 ) and (Chernogorov, 2015) this study has also been
carried out using data from an actual network and thus it‟s a true heterogeneous network
61
study. The study revealed that an actual network can be categorized into two regions
according to the density of antennas. The much cluttered regions have high received
signal levels and compensation should focus on additional capacity on the trunks. In a
scattered area, the compensation can be achieved through neighbouring cells adjustment.
However, consideration of power and height adjustment alone did not provide an optimal
relief. Azimuth of the antenna proved to be a major player both to the success of the
compensation as well as for maintaining the health of the unaffected cells.
The study also analyses traffic data which has demonstrated that there is actually no need
to attend to fault in the middle of the night when utilization of capacity is below 25%.
With at least 25% reserve capacity available in the network for 20 hours a day, it is
possible to implement cell zooming without needing additional capacity during this
period. However, during the 4 hours of high traffic, it can be proposed to use AMR-HR
scheme to improve the capacity. In areas with good RF, AMR-HR has been found to
double the radio capacity with a single TRX carrying upto 20Erl
Therefore, a compensation measure would adequately provide for capacity in any region
without requiring the compensating cells to have reserve capacity.
However, in order to handle the extra traffic that results from the failed cells during the
busy period, the study suggests provide some extra (reserve) capacity that should be
calculated on an individual cell basis proportional to the traffic in the cluster.
The study objectives were thus met since a self-healing radio network model was
developed and simulated. The algorithm developed also produced results that matched
with those of international studies.
62
It‟s worth noting that for cell zooming compensation method to maintain optimal
charac
63
REFERENCES
3GPP . (2009). Evolved Universal Terrestrial Radio Access (E-UTRA) and Evolved
Universal Terrestrial Radio Access Network (E-UTRAN), Overall Description,
Stage 2, Release 8. TS, 3GPP .
Bramah, E. H. (2016). Self healing in Long Term Evolution (LTE)(Development of a cell
outage compensation algorithm). Basic Sciences and Engineering Studies
(SGCAC), 2016 Conference of (pp. 75-79). IEEE.
Chernogorov, F. R. (2015). Cognitive Self-Healing System for Future Mobile Networks.
Wireless Communications and Mobile Computing Conference (IWCMC), 2015
International (pp. 628-633). IEEE.
Cichon, D. J., & Kürner, T. (1999). Propagation Prediction Models. COST 231 Final
Report. University of Karlsruhe, IHE, Germany.
Ciocarlie, G., Lindqvist, U., Novaczki, S., & Sanneck, a. H. (2013). Detecting anomalies
in cellular networks using an ensemble method. 9th International Conference in
Network and Service Management (CNSM) (pp. 171–174.). IEEE.
Dalela, C. (2013). Comparative Study of Radio Channel Propagation and Modeling for
4G Wireless Systems. International Journal of Engineering and Advanced
Technology (IJEAT), 2(5), 296-299.
de-la-Bandera, I., Barco, R., Muñoz, P., & Serrano, I. (2015, July). Cell Outage Detection
Based on Handover Statistics. IEEE Communications Letters, 19(7), 1189-1192.
DITECH NETWORKS. (2012). Voice Quality Solutions for Wireless Networks. San
Jose: DITECH NETWORKS.
Ephan, N., & Gabriel, R. (n.d.). Base-Station-Antennas for optimized Mobile
Communication Networks. Rosenheim, Germany: KATHREIN-Werke KG.
Ericssons. (2012, Feb). Heterogeneous networks. White Paper,.
Feng, S., & Seide, E. (May 2008). Self-Organizing Networks (SON) in 3GPP Long Term
Evolution. Nomor Research GmbH. Munich Germany: Nomor Research GmbH.
Jie, Y., Alsharoa, A., Kamal, A., & Alnuem, M. (2015). Self-Healing Solution to
Heterogeneous Networks Using CoMP. Global Communications Conference
(GLOBECOM) (pp. 1-6). San Diego, CA: IEEE.
64
Kürner, T. A. (2010). Final Report on Self-Organisation and its Implications in Wireless
Access Networks. SOCRATES. Self-optimisation and self-configuration in
wireless networks, Deliverable D, 5.
Li, F. Q. (2011). Achieving cell outage compensation in radio access network with
automatic network management. GLOBECOM Workshops (GC Wkshps), 673-
677.
Li, W., Yu, P., Yin, M., & Meng, L. (2015 , January). A Distributed Cell Outage
Compensation Mechanism Based on RS Power Adjustment in LTE Networks.
IEEE, 11(13), 40 - 47 .
Litjens, R. (2012). Self-Management in Cellular Networks. Eindhoven, The Netherlands.
M. Amirijoo, L. J. (2009). Cell Outage Management in LTE Networks. 6th International
Symposium on Wireless Communication Systems, (pp. 600-604).
M. Amirijoo, L. J. (2011). Effectiveness of cell outage compensation in LTE networks.
IEEE Consumer Communications and Networking Conference, CCNC'2011, 642-
647.
Marwangi, M. M. (2011). Challenges and Practical Implementation of Self Organizing
Networks in LTE/LTE-Advanced. Information Technology and Multimedia
(ICIM), 2011 International Conference on (pp. 1-5). Skudai. Malaysia: IEEE.
Meyer, L. J. (2010). Electrical and Mechanical Downtilt and their Effects on Horizontal
Pattern Performance. CommScope, Inc.: White Paper.
Molisch, A. F. (2011). Wireless Communications, 2nd Edition. USA: Wiley.
NEC corporation. (2009). Self Organising Networks, NEC proposal for next generation
radio network management. White Paper.
Network E. U. T. R. A. (2010). Self-configuring and self-optimizing network (SON) use
cases and solutions. Third Generation Partnership Project (3GPP) specification
TR, 36.
Network E. U. T. R. A. (2009). Self-configuring and self-optimizing network (SON) use
cases and solutions(release 9). Technical Specification. 3GPP.
Nokia Siemens Networks. (2009). Self-Organizing Network (SON). White Paper,.
Nokia Siemens Networks. (2010). Keeping the lid on OPEX with Self-Organizing
Networks. White Paper,.

65
Pedersen, G. F. (1999). COST 231-Digital mobile radio towards future generation
systems.
Pedrini, L. (2008). What is Antenna Electrical and Mechanical Tilt (and How to use it)?
(telecomHall) Retrieved June 03, 2013, from http://www.telecomhall.com/what-
is-antenna-electrical-and-mechanical-tilt-and-how-to-use-it.aspx
Pras, A., Schonwalder, J., Burgess, M., Festor, O., Perez, G. M., Stadler, R., & Stiller, B.
(2007). Key research challenges in network management. IEEE communications
magazine, 45(10), 104-110.
Ramiro, J., & Hamied, K. (2011). Self-Organizing Networks (2nd ed.). USA: Wiley.
Rani, M., Behara, S. V., & K.Suresh. (2012). Comparison of Standard Propagation Model
(SPM) and Stanford University Interim (SUI) Radio Propagation Models for Long
Term Evolution (LTE).
Shabbir, N., Sadiq, M. T., Kashif, H., & Ullah, R. (2011, September). Comparison Of
Radio Propagation Models For Long Term Evolution (LTE) Network.
International Journal of Next-Generation Networks (IJNGN), 3(3), 27-41.
SIEMENS AG. (2006). Planning Guideline: Air Interface Dimensioning. Handbook,,
SIEMENS AG, Munich.
Wenjing Li, P. Y. (2012). Centralized Management Mechanism for Cell Outage
Compensation in LTE Networks. International Journal of Distributed Sensor
Networks, 2012.
Zhang, Y., & Soong, B. (2004). Performance evaluation of GSM/GPRS networks with
channel re-allocation scheme. IEEE Communications Letters, 8(5), 280-282.
Zoha, A., Saeed, A., Imranz, A., Imrany, M. A., & Abu-Dayya, A. (2015). Data-Driven
Analytics for Automated Cell Outage Detection in Self-Organizing Networks.
2015 11th International Conference DRCN (pp. 203-210). IEEE.

66
APPENDICES
APPENDIX 1: Algorithm
Private Sub CommandButton1_Click()
'Draw graph for testing accuracy of software
h_m = 7.5
f_c = 2000
E = (1.1 * Log(f_c) / 2.303 - 0.7) * h_m - (1.56 * Log(f_c) / 2.303 - 0.8)
C = 0
'C = (-4.78 * ((Log(f_c) / 2.303)) ^ 2) + (18.33 * (Log(f_c) / 2.303)) - 40.98
'C = -2 * (Log(f_c / 28) / 2.303) ^ 2 - 5.4
Dim j As Integer
For j = 1 To 4
Select Case j
Case 1
h_b = 10
Case 2
h_b = 20
Case 3
h_b = 40
Case 4
h_b = 100
End Select
67
d = 0.1
B = 44.9 - (6.55 * Log(h_b) / 2.303)
A= 69.55 + (26.16 * Log(f_c) / 2.303) - (13.82 * Log(h_b) / 2.303) - E
Dim Counter As Integer
For Counter = 2 To 22
PL = a + B * Log(d) / 2.303 + C
Worksheets("Test2").Cells(1, j + 1).Value = h_b
Worksheets("Test2").Cells(Counter, 1).Value = d
Worksheets("Test2").Cells(Counter, j + 1).Value = PL
If j = 1 Then
Worksheets("Test2").Cells(1, 1).Value = "Distance"
Else
End If
d = d + 0.1
Next Counter
Next j
End Sub
Private Sub CommandButton4_Click()
'Calculate coverage distance
f_c = 900
Dim PL As Double
Dim h_b As Double
PL = 150
68
h_m = 1.8
h_b = 35
E = (1.1 * Log(f_c) / 2.303 - 0.7) * h_m - (1.56 * Log(f_c) / 2.303 - 0.8)
C = 0
A = 69.55 + (26.16 * Log(f_c) / 2.303) - (13.82 * Log(h_b) / 2.303) - e
B = 44.9 - (6.55 * Log(h_b) / 2.303)
d = 10 ^ ((PL - A - C) / B)
MsgBox d
End Sub
Private Sub CommandButton2_Click()
'Calculate height of transmitter
PL = 150
d = 9
f_c = 900
h_m = 1.8
E = (1.1 * Log(f_c) / 2.303 - 0.7) * h_m - (1.56 * Log(f_c) / 2.303 - 0.8)
Top = (69.55 + 26.16 * Log(f_c) / 2.303 - e + 44.9 * Log(d) / 2.303 - PL)
bottom = (13.82 + 6.55 * Log(d) / 2.303)
h_b = 10 ^ (Top / bottom)

69
MsgBox h_b
End Sub
Private Sub CommandButton5_Click()
h_m = 1.8
f_c = 900
e = (1.1 * Log(f_c) / 2.303 - 0.7) * h_m - (1.56 * Log(f_c) / 2.303 - 0.8)
C = 0
d = 9
h_b = 35
B = 44.9 - (6.55 * Log(h_b) / 2.303)
a = 69.55 + (26.16 * Log(f_c) / 2.303) - (13.82 * Log(h_b) / 2.303) - e
PL = A+ B * Log(d) / 2.303 + C
RSSI = -90
EIRP = PL + RSSI
MsgBox EIRP
End Sub
Private Sub CommandButton5_Click()
h_m = 1.8
f_c = 900
e = (1.1 * Log(f_c) / 2.303 - 0.7) * h_m - (1.56 * Log(f_c) / 2.303 - 0.8)
C = 0

70
Dim j As Integer
For j = 1 To 5
Select Case j
Case 1
d = 1
Case 2
d = 2
Case 3
d = 4
Case 4
d = 8
Case 5
d = 16
End Select
h_b = 5
RSSI = -105
Dim Counter As Integer
For Counter = 2 To 22
B = 44.9 - (6.55 * Log(h_b) / 2.303)
a = 69.55 + (26.16 * Log(f_c) / 2.303) - (13.82 * Log(h_b) / 2.303) - e
PL = a + B * Log(d) / 2.303 + C
EIRP = PL + RSSI
Worksheets("Test5").Cells(1, j + 1).Value = d
71
Worksheets("Test5").Cells(Counter, 1).Value = h_b
Worksheets("Test5").Cells(Counter, j + 1).Value = EIRP
If j = 1 Then
Worksheets("Test5").Cells(1, 1).Value = "BS Height"
Else
End If
h_b = h_b + 5
Next Counter
Next j
End Sub
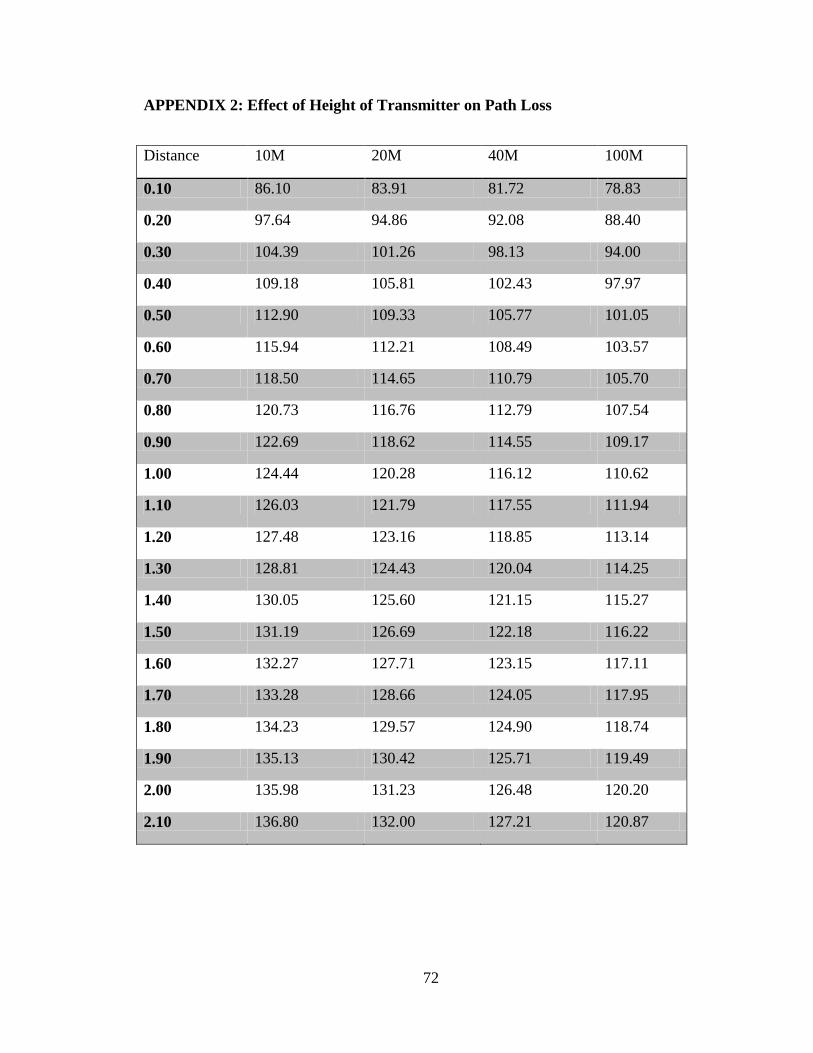
72
APPENDIX 2: Effect of Height of Transmitter on Path Loss
Distance 10M 20M 40M 100M
0.10 86.10 83.91 81.72 78.83
0.20 97.64 94.86 92.08 88.40
0.30 104.39 101.26 98.13 94.00
0.40 109.18 105.81 102.43 97.97
0.50 112.90 109.33 105.77 101.05
0.60 115.94 112.21 108.49 103.57
0.70 118.50 114.65 110.79 105.70
0.80 120.73 116.76 112.79 107.54
0.90 122.69 118.62 114.55 109.17
1.00 124.44 120.28 116.12 110.62
1.10 126.03 121.79 117.55 111.94
1.20 127.48 123.16 118.85 113.14
1.30 128.81 124.43 120.04 114.25
1.40 130.05 125.60 121.15 115.27
1.50 131.19 126.69 122.18 116.22
1.60 132.27 127.71 123.15 117.11
1.70 133.28 128.66 124.05 117.95
1.80 134.23 129.57 124.90 118.74
1.90 135.13 130.42 125.71 119.49
2.00 135.98 131.23 126.48 120.20
2.10 136.80 132.00 127.21 120.87

73
APPENDIX 3: Busy Hour Traffic Data
Date EC0034 EC0041 EC0257 EC0321 EC0322 EC0456 Total
2013-10-01 268.2 213.2 178.6 208.5 164.1 74.4 1107.0
2013-10-02 268.4 213.6 180.1 203.6 166.9 78.2 1110.8
2013-10-03 277.2 219.9 186.2 206.4 162.0 76.2 1127.8
2013-10-04 282.7 221.4 181.7 213.1 171.0 77.4 1147.3
2013-10-05 267.7 208.7 178.1 226.6 139.4 76.2 1096.7
2013-10-06 283.6 200.8 163.7 224.2 136.0 65.2 1073.5
2013-10-07 281.1 217.6 183.9 222.6 174.4 75.9 1155.6
2013-10-08 270.7 216.0 177.5 216.6 163.9 74.4 1119.1
2013-10-09 278.1 223.4 187.3 212.4 166.5 73.0 1140.7
2013-10-10 261.1 225.9 178.8 213.9 164.1 72.0 1115.8
2013-10-11 271.5 235.8 196.5 218.7 171.8 72.1 1166.3
2013-10-12 270.7 229.6 179.2 219.3 143.0 72.5 1114.3
2013-10-13 291.3 220.4 169.7 231.9 145.0 75.0 1133.2
2013-10-15 281.7 222.2 185.1 222.5 165.8 79.1 1156.6
2013-10-16 276.1 213.9 176.8 217.2 167.1 79.3 1130.5
2013-10-17 263.5 216.5 178.4 211.3 174.6 78.0 1122.3
2013-10-18 270.7 218.0 185.4 218.8 168.6 77.0 1138.5
2013-10-19 276.6 236.6 209.0 281.0 137.8 73.5 1214.4
2013-10-20 252.4 185.5 151.5 225.7 129.6 69.9 1014.6
2013-10-21 250.2 198.4 162.3 216.7 131.4 68.6 1027.6
2013-10-22 257.3 216.1 178.0 214.1 159.4 76.0 1101.0
2013-10-23 269.1 217.5 174.9 212.8 166.2 73.5 1114.0
2013-10-24 272.7 210.0 166.1 215.1 158.9 75.0 1097.8
2013-10-25 274.0 222.4 188.6 219.4 169.2 71.4 1144.9
2013-10-26 268.7 202.7 170.0 227.8 141.0 74.5 1084.7
2013-10-27 269.6 205.3 155.9 222.5 134.1 65.3 1052.7
2013-10-28 273.5 217.1 173.4 221.0 169.5 74.6 1129.1
2013-10-29 275.7 212.3 175.6 224.6 157.2 72.5 1117.8
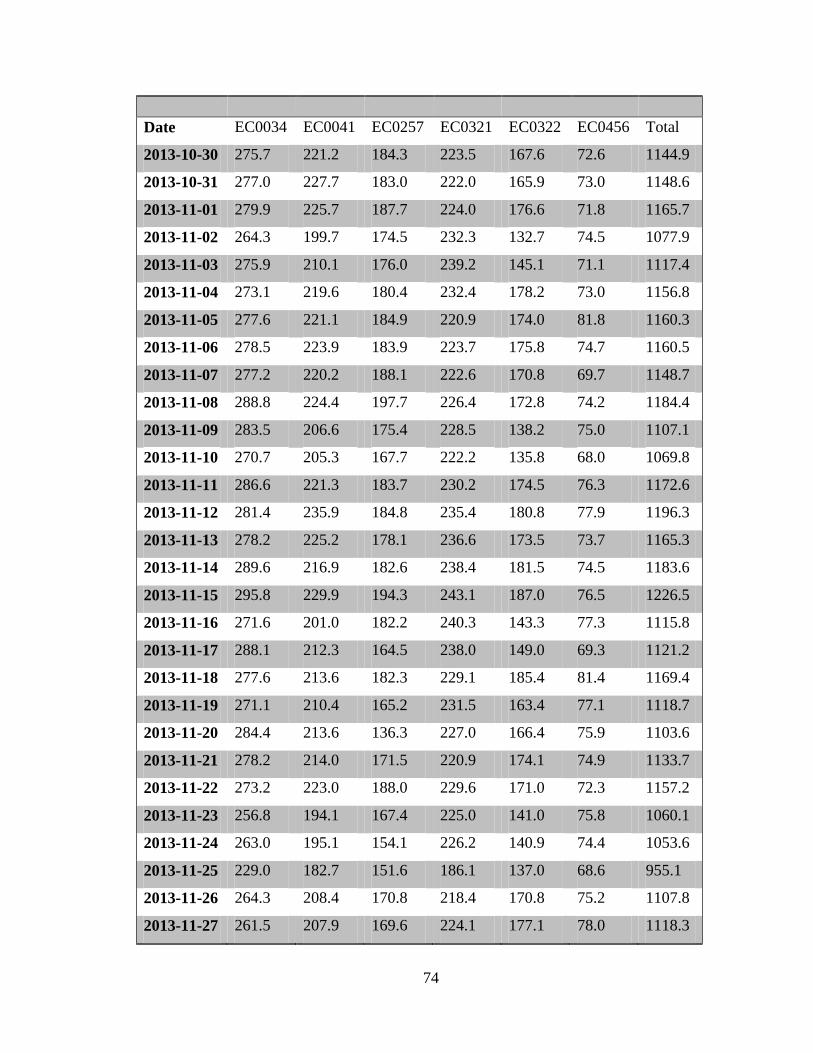
74
Date EC0034 EC0041 EC0257 EC0321 EC0322 EC0456 Total
2013-10-30 275.7 221.2 184.3 223.5 167.6 72.6 1144.9
2013-10-31 277.0 227.7 183.0 222.0 165.9 73.0 1148.6
2013-11-01 279.9 225.7 187.7 224.0 176.6 71.8 1165.7
2013-11-02 264.3 199.7 174.5 232.3 132.7 74.5 1077.9
2013-11-03 275.9 210.1 176.0 239.2 145.1 71.1 1117.4
2013-11-04 273.1 219.6 180.4 232.4 178.2 73.0 1156.8
2013-11-05 277.6 221.1 184.9 220.9 174.0 81.8 1160.3
2013-11-06 278.5 223.9 183.9 223.7 175.8 74.7 1160.5
2013-11-07 277.2 220.2 188.1 222.6 170.8 69.7 1148.7
2013-11-08 288.8 224.4 197.7 226.4 172.8 74.2 1184.4
2013-11-09 283.5 206.6 175.4 228.5 138.2 75.0 1107.1
2013-11-10 270.7 205.3 167.7 222.2 135.8 68.0 1069.8
2013-11-11 286.6 221.3 183.7 230.2 174.5 76.3 1172.6
2013-11-12 281.4 235.9 184.8 235.4 180.8 77.9 1196.3
2013-11-13 278.2 225.2 178.1 236.6 173.5 73.7 1165.3
2013-11-14 289.6 216.9 182.6 238.4 181.5 74.5 1183.6
2013-11-15 295.8 229.9 194.3 243.1 187.0 76.5 1226.5
2013-11-16 271.6 201.0 182.2 240.3 143.3 77.3 1115.8
2013-11-17 288.1 212.3 164.5 238.0 149.0 69.3 1121.2
2013-11-18 277.6 213.6 182.3 229.1 185.4 81.4 1169.4
2013-11-19 271.1 210.4 165.2 231.5 163.4 77.1 1118.7
2013-11-20 284.4 213.6 136.3 227.0 166.4 75.9 1103.6
2013-11-21 278.2 214.0 171.5 220.9 174.1 74.9 1133.7
2013-11-22 273.2 223.0 188.0 229.6 171.0 72.3 1157.2
2013-11-23 256.8 194.1 167.4 225.0 141.0 75.8 1060.1
2013-11-24 263.0 195.1 154.1 226.2 140.9 74.4 1053.6
2013-11-25 229.0 182.7 151.6 186.1 137.0 68.6 955.1
2013-11-26 264.3 208.4 170.8 218.4 170.8 75.2 1107.8
2013-11-27 261.5 207.9 169.6 224.1 177.1 78.0 1118.3
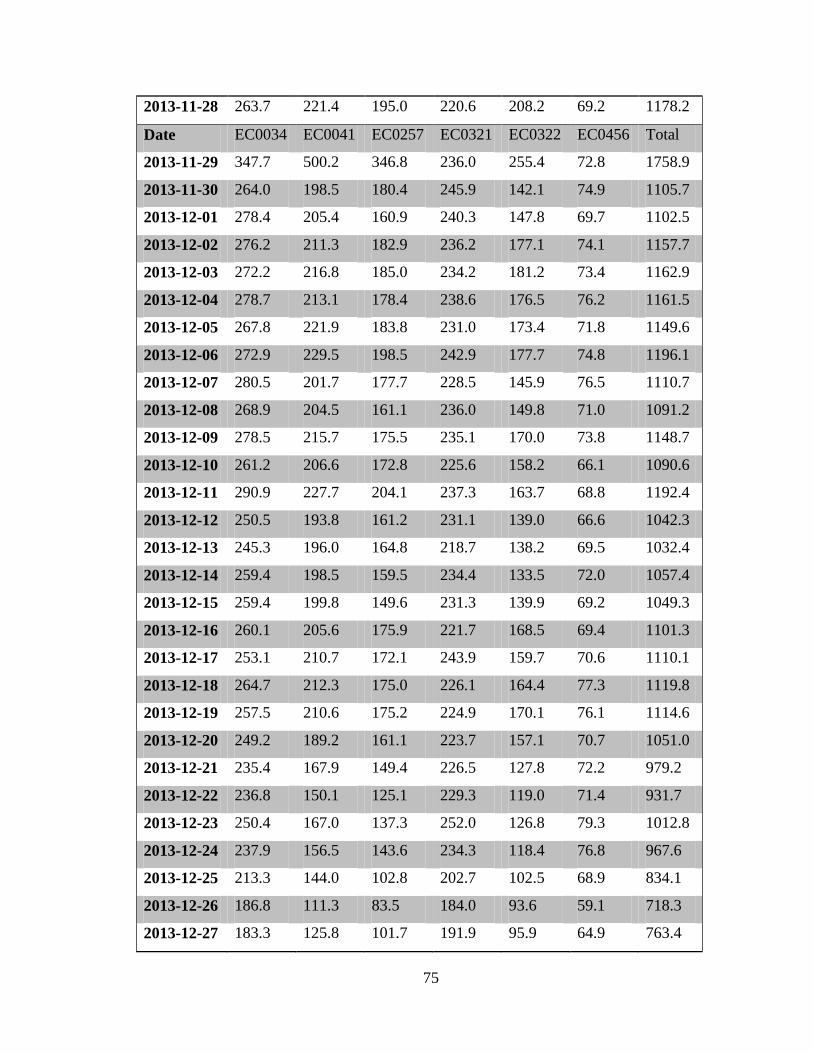
75
2013-11-28 263.7 221.4 195.0 220.6 208.2 69.2 1178.2
Date EC0034 EC0041 EC0257 EC0321 EC0322 EC0456 Total
2013-11-29 347.7 500.2 346.8 236.0 255.4 72.8 1758.9
2013-11-30 264.0 198.5 180.4 245.9 142.1 74.9 1105.7
2013-12-01 278.4 205.4 160.9 240.3 147.8 69.7 1102.5
2013-12-02 276.2 211.3 182.9 236.2 177.1 74.1 1157.7
2013-12-03 272.2 216.8 185.0 234.2 181.2 73.4 1162.9
2013-12-04 278.7 213.1 178.4 238.6 176.5 76.2 1161.5
2013-12-05 267.8 221.9 183.8 231.0 173.4 71.8 1149.6
2013-12-06 272.9 229.5 198.5 242.9 177.7 74.8 1196.1
2013-12-07 280.5 201.7 177.7 228.5 145.9 76.5 1110.7
2013-12-08 268.9 204.5 161.1 236.0 149.8 71.0 1091.2
2013-12-09 278.5 215.7 175.5 235.1 170.0 73.8 1148.7
2013-12-10 261.2 206.6 172.8 225.6 158.2 66.1 1090.6
2013-12-11 290.9 227.7 204.1 237.3 163.7 68.8 1192.4
2013-12-12 250.5 193.8 161.2 231.1 139.0 66.6 1042.3
2013-12-13 245.3 196.0 164.8 218.7 138.2 69.5 1032.4
2013-12-14 259.4 198.5 159.5 234.4 133.5 72.0 1057.4
2013-12-15 259.4 199.8 149.6 231.3 139.9 69.2 1049.3
2013-12-16 260.1 205.6 175.9 221.7 168.5 69.4 1101.3
2013-12-17 253.1 210.7 172.1 243.9 159.7 70.6 1110.1
2013-12-18 264.7 212.3 175.0 226.1 164.4 77.3 1119.8
2013-12-19 257.5 210.6 175.2 224.9 170.1 76.1 1114.6
2013-12-20 249.2 189.2 161.1 223.7 157.1 70.7 1051.0
2013-12-21 235.4 167.9 149.4 226.5 127.8 72.2 979.2
2013-12-22 236.8 150.1 125.1 229.3 119.0 71.4 931.7
2013-12-23 250.4 167.0 137.3 252.0 126.8 79.3 1012.8
2013-12-24 237.9 156.5 143.6 234.3 118.4 76.8 967.6
2013-12-25 213.3 144.0 102.8 202.7 102.5 68.9 834.1
2013-12-26 186.8 111.3 83.5 184.0 93.6 59.1 718.3
2013-12-27 183.3 125.8 101.7 191.9 95.9 64.9 763.4

76
2013-12-28 180.6 124.1 108.8 218.2 96.7 60.2 788.5
Date EC0034 EC0041 EC0257 EC0321 EC0322 EC0456 Total
2013-12-29 197.2 126.0 101.7 196.0 102.2 60.6 783.6
2013-12-30 204.0 140.6 117.8 223.5 105.1 70.4 861.4
2013-12-31 243.8 164.4 138.8 247.0 123.4 80.1 997.5
2014-01-01 205.7 133.3 101.9 221.1 106.8 72.3 841.1
2014-01-02 202.4 145.2 119.8 214.3 107.5 73.4 862.5
2014-01-03 216.1 149.5 125.5 223.2 112.4 73.5 900.3
2014-01-04 222.1 149.0 131.3 211.6 113.0 70.6 897.7
2014-01-05 232.0 158.2 128.3 236.4 121.4 67.4 943.7
2014-01-06 236.3 167.5 144.9 230.6 133.3 73.6 986.3
2014-01-07 225.4 163.5 141.1 229.1 131.7 75.3 966.0
2014-01-08 225.5 161.5 137.3 230.8 137.7 73.5 966.2
2014-01-09 297.7 157.0 137.6 219.6 131.6 74.6 1018.1
2014-01-10 227.9 160.8 139.3 224.1 134.0 76.2 962.3
2014-01-11 236.1 155.5 136.0 216.4 119.4 74.1 937.5
2014-01-12 232.7 152.6 132.1 224.3 122.5 65.0 929.2
2014-01-13 244.5 183.2 154.5 226.6 150.5 75.2 1034.4
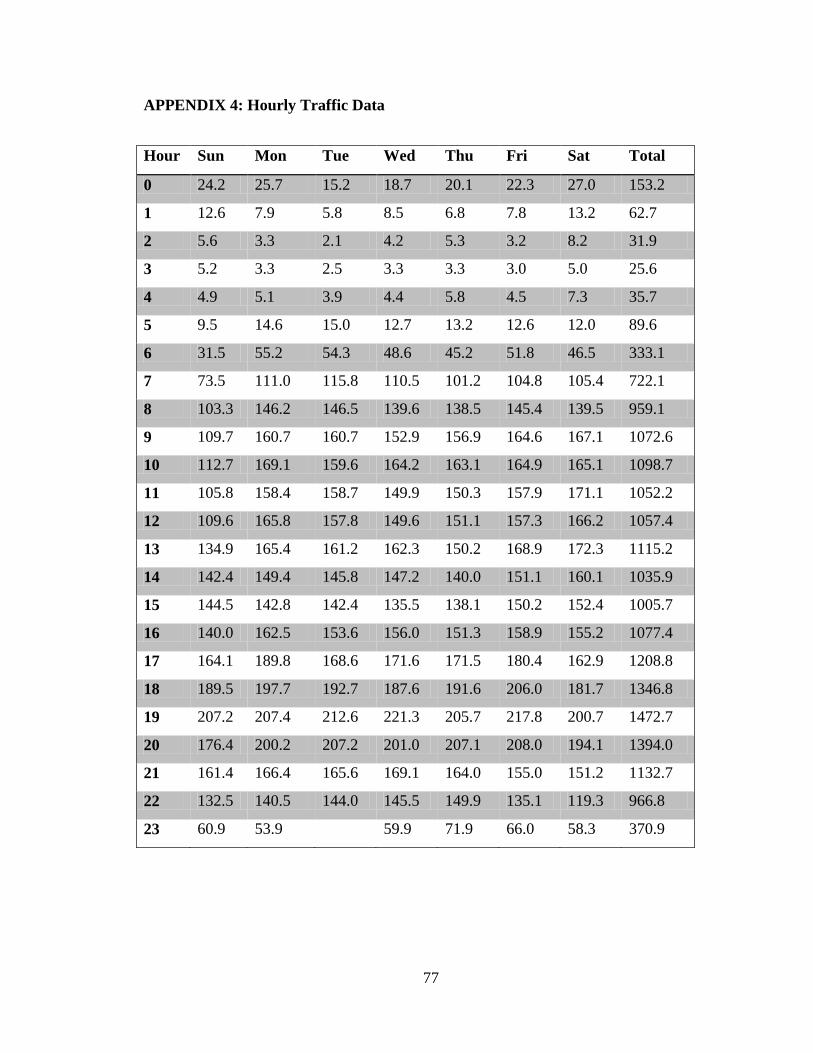
77
APPENDIX 4: Hourly Traffic Data
Hour Sun Mon Tue Wed Thu Fri Sat Total
0 24.2 25.7 15.2 18.7 20.1 22.3 27.0 153.2
1 12.6 7.9 5.8 8.5 6.8 7.8 13.2 62.7
2 5.6 3.3 2.1 4.2 5.3 3.2 8.2 31.9
3 5.2 3.3 2.5 3.3 3.3 3.0 5.0 25.6
4 4.9 5.1 3.9 4.4 5.8 4.5 7.3 35.7
5 9.5 14.6 15.0 12.7 13.2 12.6 12.0 89.6
6 31.5 55.2 54.3 48.6 45.2 51.8 46.5 333.1
7 73.5 111.0 115.8 110.5 101.2 104.8 105.4 722.1
8 103.3 146.2 146.5 139.6 138.5 145.4 139.5 959.1
9 109.7 160.7 160.7 152.9 156.9 164.6 167.1 1072.6
10 112.7 169.1 159.6 164.2 163.1 164.9 165.1 1098.7
11 105.8 158.4 158.7 149.9 150.3 157.9 171.1 1052.2
12 109.6 165.8 157.8 149.6 151.1 157.3 166.2 1057.4
13 134.9 165.4 161.2 162.3 150.2 168.9 172.3 1115.2
14 142.4 149.4 145.8 147.2 140.0 151.1 160.1 1035.9
15 144.5 142.8 142.4 135.5 138.1 150.2 152.4 1005.7
16 140.0 162.5 153.6 156.0 151.3 158.9 155.2 1077.4
17 164.1 189.8 168.6 171.6 171.5 180.4 162.9 1208.8
18 189.5 197.7 192.7 187.6 191.6 206.0 181.7 1346.8
19 207.2 207.4 212.6 221.3 205.7 217.8 200.7 1472.7
20 176.4 200.2 207.2 201.0 207.1 208.0 194.1 1394.0
21 161.4 166.4 165.6 169.1 164.0 155.0 151.2 1132.7
22 132.5 140.5 144.0 145.5 149.9 135.1 119.3 966.8
23 60.9 53.9 59.9 71.9 66.0 58.3 370.9
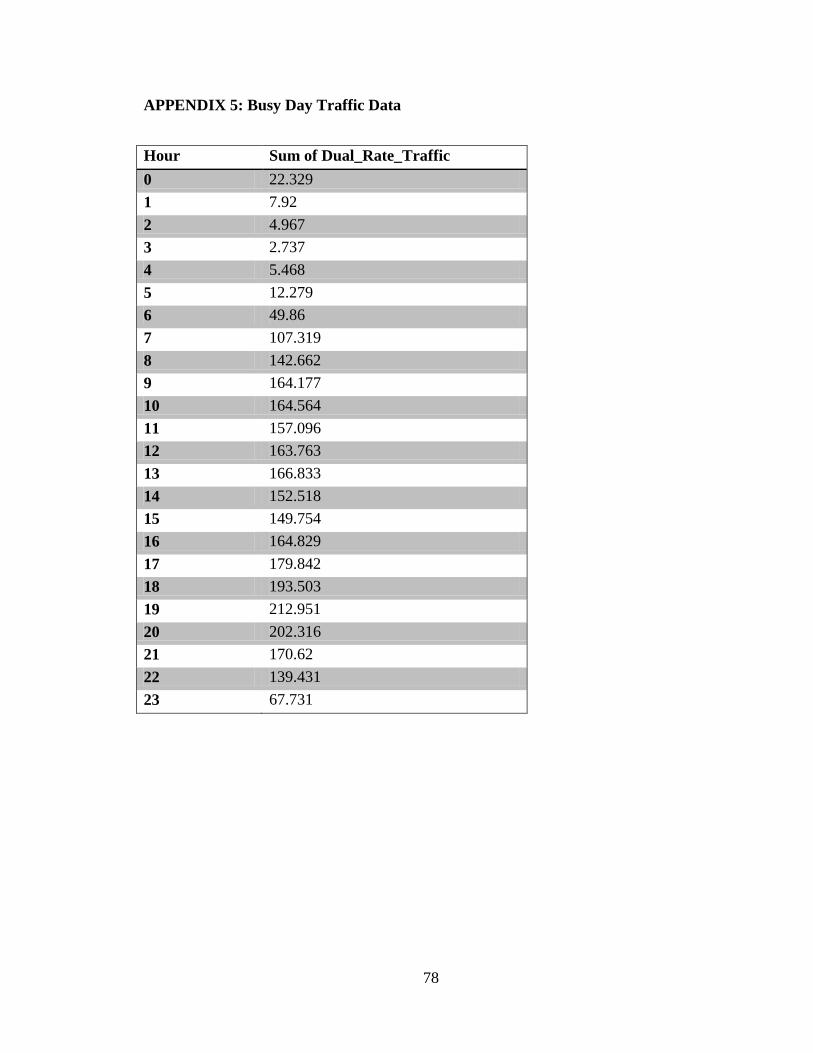
78
APPENDIX 5: Busy Day Traffic Data
Hour Sum of Dual_Rate_Traffic
0 22.329
1 7.92
2 4.967
3 2.737
4 5.468
5 12.279
6 49.86
7 107.319
8 142.662
9 164.177
10 164.564
11 157.096
12 163.763
13 166.833
14 152.518
15 149.754
16 164.829
17 179.842
18 193.503
19 212.951
20 202.316
21 170.62
22 139.431
23 67.731
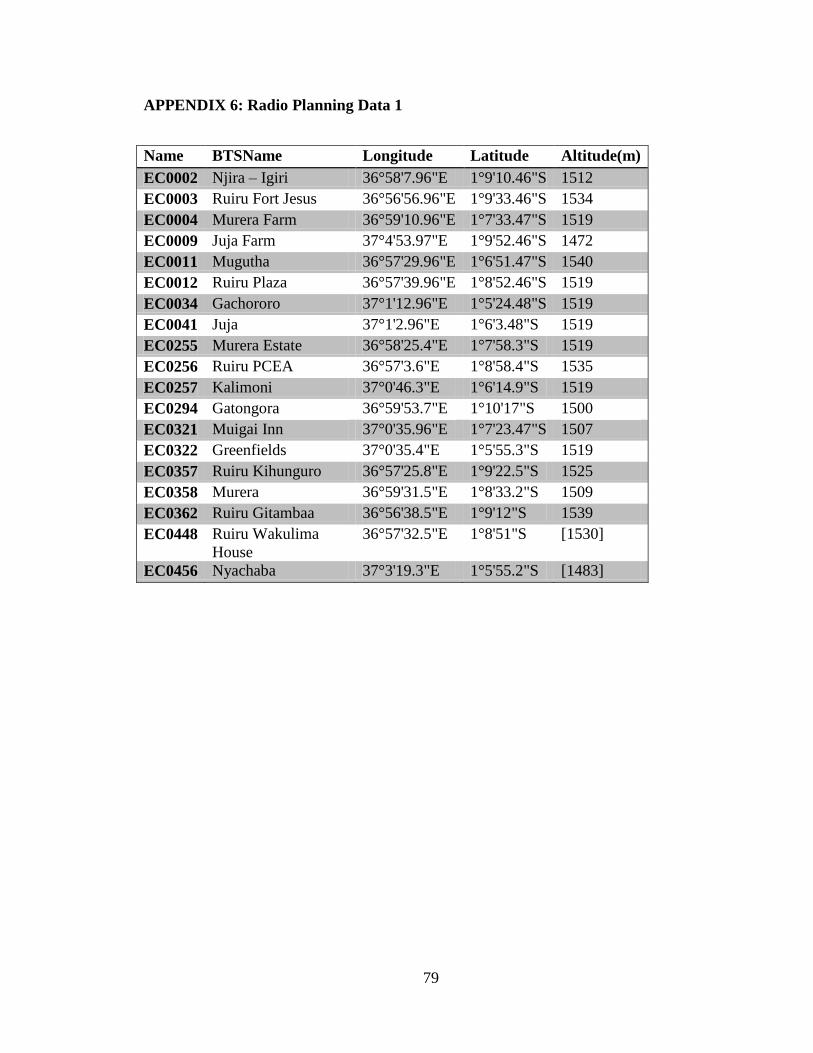
79
APPENDIX 6: Radio Planning Data 1
Name BTSName Longitude Latitude Altitude(m)
EC0002 Njira – Igiri 36°58'7.96"E 1°9'10.46"S 1512
EC0003 Ruiru Fort Jesus 36°56'56.96"E 1°9'33.46"S 1534
EC0004 Murera Farm 36°59'10.96"E 1°7'33.47"S 1519
EC0009 Juja Farm 37°4'53.97"E 1°9'52.46"S 1472
EC0011 Mugutha 36°57'29.96"E 1°6'51.47"S 1540
EC0012 Ruiru Plaza 36°57'39.96"E 1°8'52.46"S 1519
EC0034 Gachororo 37°1'12.96"E 1°5'24.48"S 1519
EC0041 Juja 37°1'2.96"E 1°6'3.48"S 1519
EC0255 Murera Estate 36°58'25.4"E 1°7'58.3"S 1519
EC0256 Ruiru PCEA 36°57'3.6"E 1°8'58.4"S 1535
EC0257 Kalimoni 37°0'46.3"E 1°6'14.9"S 1519
EC0294 Gatongora 36°59'53.7"E 1°10'17"S 1500
EC0321 Muigai Inn 37°0'35.96"E 1°7'23.47"S 1507
EC0322 Greenfields 37°0'35.4"E 1°5'55.3"S 1519
EC0357 Ruiru Kihunguro 36°57'25.8"E 1°9'22.5"S 1525
EC0358 Murera 36°59'31.5"E 1°8'33.2"S 1509
EC0362 Ruiru Gitambaa 36°56'38.5"E 1°9'12"S 1539
EC0448 Ruiru Wakulima
House
36°57'32.5"E 1°8'51"S [1530]
EC0456 Nyachaba 37°3'19.3"E 1°5'55.2"S [1483]
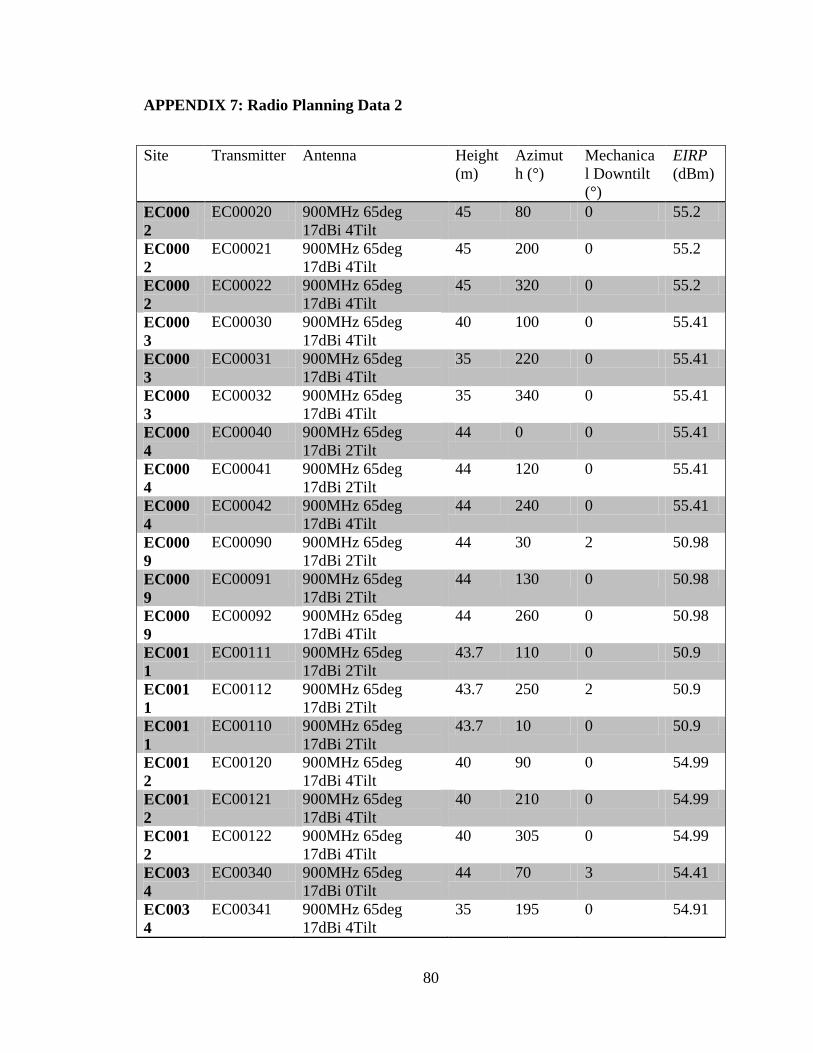
80
APPENDIX 7: Radio Planning Data 2
Site Transmitter Antenna Height
(m)
Azimut
h (°)
Mechanica
l Downtilt
(°)
EIRP
(dBm)
EC000
2
EC00020 900MHz 65deg
17dBi 4Tilt
45 80 0 55.2
EC000
2
EC00021 900MHz 65deg
17dBi 4Tilt
45 200 0 55.2
EC000
2
EC00022 900MHz 65deg
17dBi 4Tilt
45 320 0 55.2
EC000
3
EC00030 900MHz 65deg
17dBi 4Tilt
40 100 0 55.41
EC000
3
EC00031 900MHz 65deg
17dBi 4Tilt
35 220 0 55.41
EC000
3
EC00032 900MHz 65deg
17dBi 4Tilt
35 340 0 55.41
EC000
4
EC00040 900MHz 65deg
17dBi 2Tilt
44 0 0 55.41
EC000
4
EC00041 900MHz 65deg
17dBi 2Tilt
44 120 0 55.41
EC000
4
EC00042 900MHz 65deg
17dBi 4Tilt
44 240 0 55.41
EC000
9
EC00090 900MHz 65deg
17dBi 2Tilt
44 30 2 50.98
EC000
9
EC00091 900MHz 65deg
17dBi 2Tilt
44 130 0 50.98
EC000
9
EC00092 900MHz 65deg
17dBi 4Tilt
44 260 0 50.98
EC001
1
EC00111 900MHz 65deg
17dBi 2Tilt
43.7 110 0 50.9
EC001
1
EC00112 900MHz 65deg
17dBi 2Tilt
43.7 250 2 50.9
EC001
1
EC00110 900MHz 65deg
17dBi 2Tilt
43.7 10 0 50.9
EC001
2
EC00120 900MHz 65deg
17dBi 4Tilt
40 90 0 54.99
EC001
2
EC00121 900MHz 65deg
17dBi 4Tilt
40 210 0 54.99
EC001
2
EC00122 900MHz 65deg
17dBi 4Tilt
40 305 0 54.99
EC003
4
EC00340 900MHz 65deg
17dBi 0Tilt
44 70 3 54.41
EC003
4
EC00341 900MHz 65deg
17dBi 4Tilt
35 195 0 54.91

81
Site Transmitter Antenna Height
(m)
Azimut
h (°)
Mechanica
l Downtilt
(°)
EIRP
(dBm)
EC003
4
EC00342 900MHz 65deg
17dBi 0Tilt
44 310 3 54.41
EC004
1
EC00410 900MHz 65deg
17dBi 0Tilt
59 70 4 47.3
EC004
1
EC00411 900MHz 65deg
17dBi 4Tilt
38.5 185 0 47.3
EC004
1
EC00412 900MHz 65deg
17dBi 0Tilt
59 310 3 47.3
EC025
5
EC02551 900MHz 65deg
17dBi 4Tilt
30 120 0 54.78
EC025
5
EC02552 900MHz 65deg
17dBi 4Tilt
30 240 0 54.78
EC025
5
EC02550 900MHz 65deg
17dBi 4Tilt
38 0 0 54.78
EC025
6
EC02560 900MHz 65deg
17dBi 4Tilt
30 0 0 55.28
EC025
6
EC02561 900MHz 65deg
17dBi 4Tilt
30 120 0 55.28
EC025
6
EC02562 900MHz 65deg
17dBi 4Tilt
30 240 0 53.6
EC025
7
EC02570 900MHz 65deg
17dBi 4Tilt
33.1 80 0 55.07
EC025
7
EC02571 900MHz 65deg
17dBi 4Tilt
40 200 0 55.07
EC025
7
EC02572 900MHz 65deg
17dBi 4Tilt
40 320 0 55.07
EC029
4
EC02942 900MHz 65deg
17dBi 4Tilt
44 240 0 54.78
EC029
4
EC02940 900MHz 65deg
17dBi 4Tilt
44 0 0 54.78
EC029
4
EC02941 900MHz 65deg
17dBi 4Tilt
44 120 0 54.78
EC032
1
EC03210 900MHz 65deg
17dBi 4Tilt
44 50 0 55.37
EC032
1
EC03211 900MHz 65deg
17dBi 4Tilt
44 170 0 55.2
EC032
1
EC03212 900MHz 65deg
17dBi 4Tilt
44 290 0 55.2
EC032
2
EC03220 900MHz 65deg
17dBi 4Tilt
35 90 0 50.48
EC032
2
EC03221 900MHz 65deg
17dBi 4Tilt
35 210 0 50.48
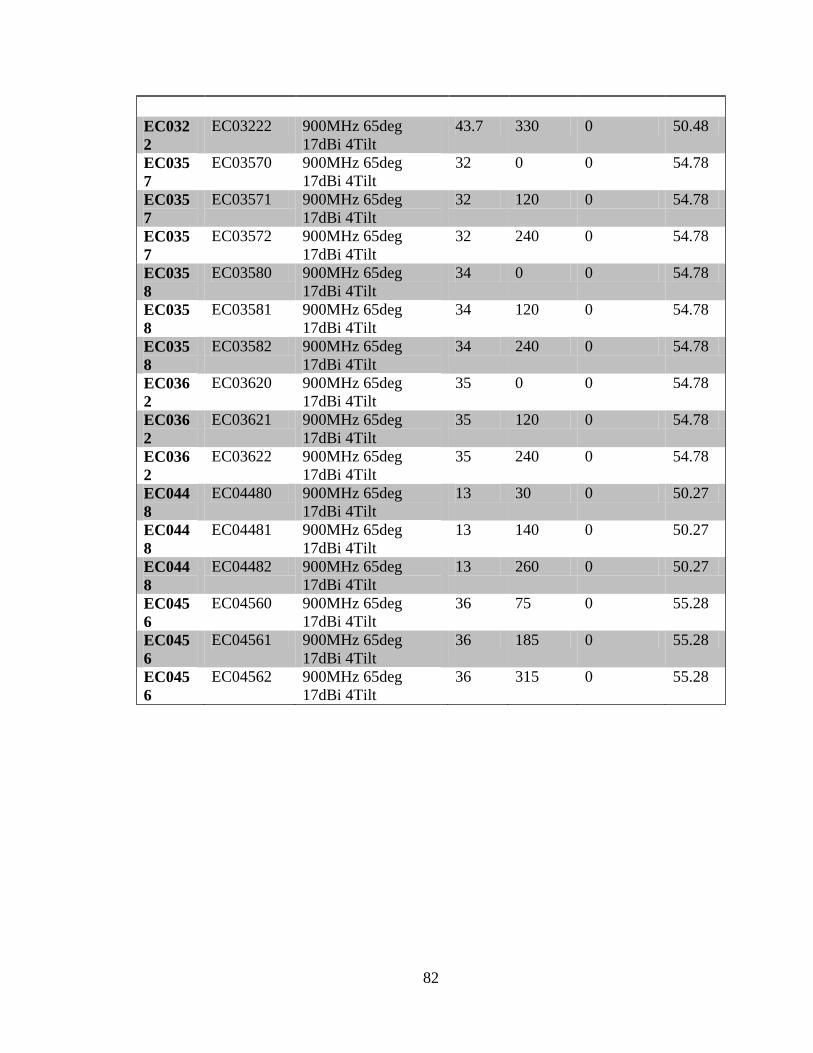
82
EC032
2
EC03222 900MHz 65deg
17dBi 4Tilt
43.7 330 0 50.48
EC035
7
EC03570 900MHz 65deg
17dBi 4Tilt
32 0 0 54.78
EC035
7
EC03571 900MHz 65deg
17dBi 4Tilt
32 120 0 54.78
EC035
7
EC03572 900MHz 65deg
17dBi 4Tilt
32 240 0 54.78
EC035
8
EC03580 900MHz 65deg
17dBi 4Tilt
34 0 0 54.78
EC035
8
EC03581 900MHz 65deg
17dBi 4Tilt
34 120 0 54.78
EC035
8
EC03582 900MHz 65deg
17dBi 4Tilt
34 240 0 54.78
EC036
2
EC03620 900MHz 65deg
17dBi 4Tilt
35 0 0 54.78
EC036
2
EC03621 900MHz 65deg
17dBi 4Tilt
35 120 0 54.78
EC036
2
EC03622 900MHz 65deg
17dBi 4Tilt
35 240 0 54.78
EC044
8
EC04480 900MHz 65deg
17dBi 4Tilt
13 30 0 50.27
EC044
8
EC04481 900MHz 65deg
17dBi 4Tilt
13 140 0 50.27
EC044
8
EC04482 900MHz 65deg
17dBi 4Tilt
13 260 0 50.27
EC045
6
EC04560 900MHz 65deg
17dBi 4Tilt
36 75 0 55.28
EC045
6
EC04561 900MHz 65deg
17dBi 4Tilt
36 185 0 55.28
EC045
6
EC04562 900MHz 65deg
17dBi 4Tilt
36 315 0 55.28

83
APPENDIX 8: List of Publication & Conferences
1. S. N. Manegene, S. Musyoki and P. L. Kibet: Application of Cell Zooming in
Outage Compensation, IOSR Journal of Electronics and Communication
Engineering (IOSR-JECE) e-ISSN: 2278-2834,p- ISSN: 2278-8735.Volume 10,
Issue 4, Ver. III (Jul - Aug .2015), PP 60-69 www.iosrjournals.org
2. S. N. Manegene, S. Musyoki and P. L. Kibet: The Use of Cell Zooming for
Outage Compensation in Cellular Radio Networks, International Conference
on Sustainable Research and Innovation, Volume 5, 7th-9th May 2014
3. S. N. Manegene, S. Musyoki and P. L. Kibet: Traffic Analysis in The Use of
Cell Zooming for Outage Compensation, Kabarak University 4th Annual
International Conference, Themed “Addressing The Challenges Facing Humanity
Through Research And Innovation”, 15th
to 18th
July 2014.
4. S. N. Manegene, S. Musyoki and P. L. Kibet: Analysis of Received Signal
Levels in The Use of Cell Zooming for Outage Compensation, Kabarak
University 4th Annual International Conference, Themed “Addressing The
Challenges Facing Humanity Through Research And Innovation”, 15th
to 18th
July 2014.
Related Documents