Compatibility and Market Structure for Network Goods by Nicholas Economides and Fredrick Flyer * November 1997 Abstract This paper analyzes the economics of industries where network externalities are significant. In such industries, firms have strong incentives to adhere to common technical compatibility standards, so that they reap the network externalities of the whole group. However, a firm also benefits from producing an incompatible product thereby increasing its horizontal product differentiation. We show how competition balances these opposing incentives. We find that market equilibria often exhibit extreme disparities in sales, output prices, and profits across firms, despite no inherent differences in the firms’ production technologies. This may explain the frequent domination of network industries by one or two firms. We also find that the presence of network externalities dramatically affects conventional welfare analysis, as total surplus in markets where these externalities are strong is highest under monopoly and declines with entry of additional firms. Key words: networks, network externalities, coalition structures, technical standards, compatibility JEL Classification: L1, D4 * Stern School of Business, New York University, New York 10012. Tel. (212) 998-0864, 998- 0877, FAX (212) 995-4218, e-mail: [email protected], [email protected], http://raven.stern.nyu.edu/networks. ** We thank Ken Arrow, Tim Brennan, Bob Hall, Charlie Himmelberg, Brian Kahin, Ed Lazear, Pino Lopomo, Roger Noll, Roy Radner, John Roberts, Sherwin Rosen, Myles Shaver, Phillip Strahan, John Sutton, Tim Van Zandt, Michael Waldman, Larry White, participants of the "Interoperability and the Economics of Information Infrastructure" conference, the 1997 Telecommunications Policy Research Conference, the Industrial Organization and the Information Systems seminars at the Stern School of Business, and seminars at the University of Chicago, Princeton, Stanford, and UC Irvine for their comments and suggestions.

Welcome message from author
This document is posted to help you gain knowledge. Please leave a comment to let me know what you think about it! Share it to your friends and learn new things together.
Transcript
Compatibility and Market Structure for Network Goods
by
Nicholas Economides and Fredrick Flyer*
November 1997
Abstract
This paper analyzes the economics of industries where network externalities are significant. Insuch industries, firms have strong incentives to adhere to common technical compatibilitystandards, so that they reap the network externalities of the whole group. However, a firm alsobenefits from producing an incompatible product thereby increasing its horizontal productdifferentiation. We show how competition balances these opposing incentives. We find thatmarket equilibria often exhibit extreme disparities in sales, output prices, and profits across firms,despite no inherent differences in the firms’ production technologies. This may explain thefrequent domination of network industries by one or two firms. We also find that the presenceof network externalities dramatically affects conventional welfare analysis, as total surplus inmarkets where these externalities are strong is highest under monopoly and declines with entryof additional firms.
Key words: networks, network externalities, coalition structures, technical standards,compatibility
JEL Classification: L1, D4
* Stern School of Business, New York University, New York 10012. Tel. (212) 998-0864, 998-0877, FAX (212) 995-4218, e-mail: [email protected], [email protected],http://raven.stern.nyu.edu/networks.
** We thank Ken Arrow, Tim Brennan, Bob Hall, Charlie Himmelberg, Brian Kahin, Ed Lazear,Pino Lopomo, Roger Noll, Roy Radner, John Roberts, Sherwin Rosen, Myles Shaver, PhillipStrahan, John Sutton, Tim Van Zandt, Michael Waldman, Larry White, participants of the"Interoperability and the Economics of Information Infrastructure" conference, the 1997Telecommunications Policy Research Conference, the Industrial Organization and the InformationSystems seminars at the Stern School of Business, and seminars at the University of Chicago,Princeton, Stanford, and UC Irvine for their comments and suggestions.

1
Compatibility and Market Structure for Network Goods
1. Introduction
The value of nearly every good is influenced by aggregate consumption levels in its
market and the markets for related goods. In many cases, high aggregate consumption in its own
market, and in markets for complementary goods affects positively the value of a good.
Traditionally such effects have been called network externalities, since they were first identified
in network industries.1 While such effects are salient in some markets, such as for telephones,
fax machines, and computer operating systems, for most goods these influences are more subtle,
and tend to be smaller.2
The impact that these consumption spillovers have on firms’ production decisions clearly
depend on the extent of the network externalities, and also on the control that firms have in
making their output compatible with competitors’ output and complimentary products. In markets
where these externalities are powerful and firms are freely able to choose among different
standards, the advantages of conforming to a popular platform must be weighed against the
advantages of horizontally differentiating output. Conforming to a common standard exploits the
1 For further discussion on network externalities see Katz and Shapiro (1985), Economides(1996).
2 For example, the value of a washing machine is affected by aggregate consumption ofwashing machines and the consumption level of the particular brand, since this determines theavailability of parts, repairman, detergents, fabric softeners and various other related goods andservices. The value of viewing a sporting event is influenced by the aggregate size of theaudience, as this enhances the excitement level, analysis, discussion and remembrance of theevent. Even a grapefruit is influenced by network externalities, since the variety of accessiblecomplements, such as peelers, slicers, juicers, recipes, nutritional information and specializedspoons, are affected by the aggregate consumption of the fruit.
2
added value associated with network externalities, but simultaneously increases the number of
close substitutes. Adopting a unique standard can increase monopoly pricing power, but fails to
exploit the positive externality from sales of other firms.
The economics of technical standards choice has gained enormous importance in recent
years, given the explosion in information technology and the dramatic network externalities that
affect those markets. In this paper, elements of a theory of coalition formation are developed and
applied to markets that experience strong network externalities. As a benchmark, we assume that
firms have identical cost structures and produce goods that are equivalent in all characteristics,
except that they can adhere to different compatibility standards. Firms choose which technical
standard to adhere to and their output level. In markets with no proprietary technical standards,
we apply the traditional concept of non-cooperative equilibrium. In contrast, in markets where
coalitions hold proprietary standards, we apply the concept ofconsensualequilibrium, where a
coalition has veto power over entry of a new member.
The quality aspects of the model are a variation of the Gabszewicz and Thisse (1979) or
Shaked and Sutton (1982) models of vertical differentiation, where firms choose quality in the
first stage and prices in the second. However, the model differs from these traditional vertical
differentiation models in two respects. First, in these vertical differentiation models, quality
differences reflect inherent differences in the features of products. In our framework, firms’
outputs are identical with respect to functional characteristics. Any variation in perceived quality
is attributable solely to the level of sales of the various coalitions (the group of firms that
produce compatible goods). Second, since relative quality is determined by the level of network
externalities, firms quantity and quality decisions are made simultaneously.
3
The central findings of this analysis are as follows: (1) The equilibria are often
asymmetric. Despite producing identical goods in terms of inherent characteristics and having
identical cost structures, firms’ prices, sales and profits vary dramatically. This asymmetry is
larger the more important are network externalities in the market. (2) When externalities are
strong, entry of new competitors has little impact on prices, sales, profits or surplus. In fact, total
surplus declines slightly with entry of additional firms. (3) Firms that are in leading coalitions
(those with greatest sales) have less incentive to make their technical standards available to others
when network externalities are large. (4) Full compatibility is a non-cooperative equilibrium in
markets where network externalities play smaller roles. (5) In contrast, for pure network goods,
where the externalities are the strongest, there existsno non-cooperative equilibrium. (6) When
the consent of existing members is required to join a technical standards coalition, total
incompatibility (where every firm adopts a different standard) is the unique equilibrium for goods
that derive most of their value from network externalities. Wewant to underline the result
that, in markets with strong network externalities, the equilibrium exhibits incompatibility and
acute differences in production levels and prices of firms that adhere to different technical
standards. This leads us to believe that in network industries, acute differences of size and
market power across firms are often a natural feature of equilibrium, rather than an historical
aberration or an event that should be explained either by out-of-the equilibrium considerations
or by non-economic considerations.3 This may explain the historical (pre-divestiture)
3 For example, Microsoft’s success is sometimes attributed to the historical circumstancessurrounding its first contract with IBM to provide the DOS operating system for the IBM PC.
4
domination of the telephone industry by AT&T and the current domination of the personal
computer software market by Microsoft.
The paper is organized as follows: The model and the corresponding equilibrium concepts
are developed in section 2. There are three basic types of coalition structures that can arise at
equilibrium. The general characteristics of these structures are described in section 3. In section
4, the equilibrium coalition structures are derived for markets of pure network goods (goods that
derive their entire value from network externalities). Equilibria coalition formations are also
derived for markets where two or three firms compete. We conclude in section 5.
2. The Model
2.1 Coalition Structures
Given a set of firmsS = {1, ..., S}, and i = 1, ... I technical standards, we identify a
subset Ci ⊆ S as a coalition, when the members ofCi adhere to the same technical standard
or "platform." The partition ofS into its subsets defines a coalition structureC = {C1, ..., CI}.
Let ci be the number of firms in coalitionCi. A coalition structure is represented as a vector
of the cardinalities of the coalitions, (c1, c2, ..., cI).4 In this application, the coalitions are ordered
in descending order according to total sales.
Product compatibility by all firms means that a single coalition includes all firms. For
example, the coalition structure (2, 0) represents full compatibility in two-firm competition. Total
incompatibility, where every firm adheres to its own unique standard, would mean that s = I
4 Specific assumptions on the demand and cost structure of our model imply that all firmsrealize equal profits within the same coalition at equilibrium.

5
and every coalition is of cardinality one. The coalition structure (1, 1, 1) represents total
incompatibility in a three-firm industry. Between these two extremes, there is a variety of partial
incompatibility coalition structures.
2.2 The Structure of the Game and the Equilibria
We analyze game structures that have two stages. In the first stage, firms choose
technical standards, and in the second they choose quantity levels. In the second stage, firms
play a non-cooperative Cournot game. In the first stage, we apply two alternative equilibrium
concepts that correspond to different regimes of intellectual property rights. In the first case, we
assume that all technical standards are non-proprietary, so that firms can coalesce on any standard
without restrictions. Thus, the decision of a firm to join a technical standard coalition is only
dependent on whether it achieves higher profits when it joins. We use the term "non-cooperative
equilibrium coalition structure" for the equilibrium of this game. In contrast, in the second case,
each firm has a technical standard that is proprietary to itself. Thus, if other firms want to join
its technical standard coalition, they have to get the consent of the proprietary standard owner.
We use the term "consensual equilibrium coalition structure" for the equilibrium of this game,
noting, however, that the consent of members of the coalition that a firm leaves is not required.
In the second stage of the game, firms simultaneously make production decisionsa-la-
Cournot considering the output of other firms as fixed. Firms make their choices known
simultaneously to each other and to consumers. As each firm j brings to market its output, total
output of each coalition can be calculated, and consumers can determine their demand for the
goods of each coalition. In anticipation of consumer demand determined through this process,

6
firms choose production levels non-cooperatively. Output is auctioneda-la-Cournot. To
determine the equilibria in the first stage of the game, it is useful to introduce the concept of an
"adjacent coalition structure". The definition of this structure is as follows:
Definition 1: A coalition structure that results when coalition structureC is changed by
the movement of only one firm (across coalitions) is called anadjacent coalition structureto
C. For example, coalition structures (3, 0, 0) and (2, 1, 0) are adjacent since the latter coalition
structure can be reached from the former by the defection of only one firm to a new
compatibility standard.
Definition 2: A coalition structureC is anon-cooperative equilibriumwhen no firm in
C has an incentive to change affiliations by joining a neighboring coalition to form an adjacent
coalition structure.
By the last definition, at a non-cooperative equilibrium coalition structure, no firm wants
to change its coalition affiliation. LetDCi be an adjacent coalition structure toC, formed by
the movement of firm i to another coalition. Then by definition 2,C is a non-cooperative
equilibrium coalition structure if and only if the profit conditionΠi(C) ≥ Πi(DCi) holds for each
firm i and every adjacent coalition structureDCi formed by a unilateral defection of firm i.
By definition, this equilibrium concept considers only moves in and out of coalitions by a single
firm, and thus does not consider movements of groups of firms.
The concept of the non-cooperative equilibrium coalition structure implicitly assumes that
other firms have no power to stop a firm from joining or leaving a standards coalition. This is
an important assumption that applies to many but not all environments. Most importantly, it
applies to areas where there are well-known but incompatible technical standards. However,

7
there is a class of cases where an existing coalition has the ability to prevent other firms from
joining. For example, if the technical standard is the intellectual property of a coalition, this
coalition can prevent others from "joining it" by not authorizing others to use this standard. For
such cases, we use the concept of aconsensual equilibrium.
Definition 3: A coalition structure C is a consensual equilibriumwhen either of the
following conditions hold: (a) no firm wants to move across coalitions unilaterally, or (b) no
coalition is willing to accept a firm that is willing to join it.5
Since condition (a) is necessary and sufficient for a non-cooperative equilibrium, this
implies thatany non-cooperative equilibrium is also a consensual equilibrium. Also note that
the consensual equilibrium disregards the interests of firms in the coalition from where a firm
may defect; it is assumed that firms in the original coalition are unable to stop a firm from
defecting.
2.3 Demand
Let coalition i have total production (market coverage) ni, normalized so that
0 ≤ ΣIi=1 ni ≤ 1. Let the willingness to pay for one unit of a good produced by a firm in coalition
i to person of typeω be u(ω, ni) = ωh(ni). Consumer typesω are uniformly distributed over
the interval [0, 1].6 The network externalities function, h(ni), captures the positive influence on
utility associated with network size. The network externalities function is specified to be linear:
5 We assume that a coalition of null size is willing to accept any firm.
6 This setup is similar to Economides and Himmelberg (1995), which focused primarily onperfect competition. Note that the multiplicative specification implies that consumer types varyin the value they attach to the network externality in a network of fixed size.

8
h(ni) = K + Ani. (1)
A good’s value embodies network and non-network benefits; K represents the non-network
benefits that a good provides, since it measures the willingness to pay for a unit of the good
when there are no other units sold. A benchmark case of the above function is when K = 0.
This describes a market for apure network good, since the good has no value in a network of
zero size (or in the absence of network externalities).7
2.4 Price Equilibrium For Any Coalition Structure
In the model, an industry has S firms, each producing a single good. All firms are
assumed to produce goods of equal inherent value (the parameters of the network externality
function, K and A, are constant across firms’ output), but goods can vary with respect to their
compatibility standard. When a collection of firms comply with a common technical standard,
thereby defining a "coalition," every firm in the coalition reaps the network externality associated
with the coalition’s total sales. Since goods are identical in other respects, they are differentiated
in quality only by the size of sales of the coalition to which their producer belongs.
Let coalition Ci, i = 1, ..., I, have ci firms, total output ni, with a typical firm in Ci
producing output nci so that ni = Σci nci.8 Without loss of generality, we assume that the index
i of a coalition is inversely related to the amounts of sales of that coalition; i.e., ni > ni+1, i = 1,
7 Examples of pure network goods are telephones and faxes.
8 For notational simplicity, we suppress an index for firms, although firms within the samecoalition may produce different outputs. We will show that at equilibrium, all firms within thesame coalition produce the same output.
9
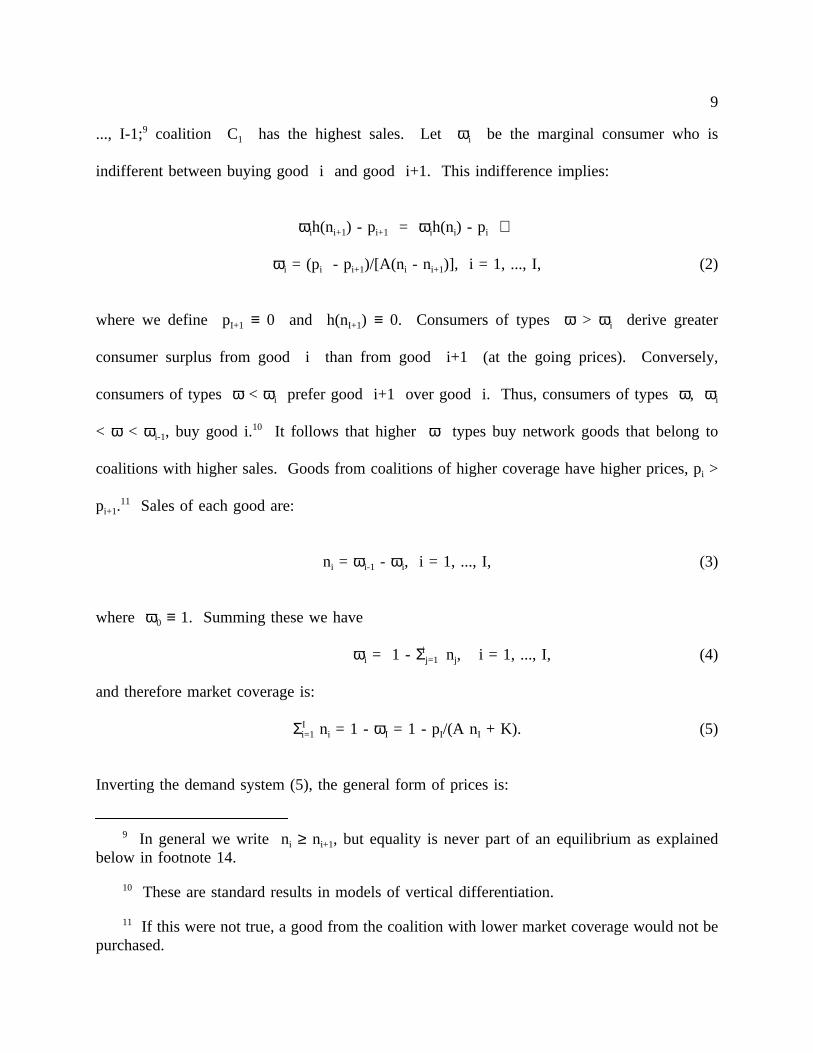
..., I-1;9 coalition C1 has the highest sales. Letωi be the marginal consumer who is
indifferent between buying good i and good i+1. This indifference implies:
ωih(ni+1) - pi+1 = ωih(ni) - pi ⇔
ωi = (pi - pi+1)/[A(ni - ni+1)], i = 1, ..., I, (2)
where we define pI+1 ≡ 0 and h(nI+1) ≡ 0. Consumers of typesω > ωi derive greater
consumer surplus from good i than from good i+1 (at the going prices). Conversely,
consumers of typesω < ωi prefer good i+1 over good i. Thus, consumers of typesω, ωi
< ω < ωi-1, buy good i.10 It follows that higher ω types buy network goods that belong to
coalitions with higher sales. Goods from coalitions of higher coverage have higher prices, pi >
pi+1.11 Sales of each good are:
ni = ωi-1 - ωi, i = 1, ..., I, (3)
where ω0 ≡ 1. Summing these we have
ωi = 1 - Σj=1i nj, i = 1, ..., I, (4)
and therefore market coverage is:
ΣIi=1 ni = 1 - ωI = 1 - pI/(A nI + K). (5)
Inverting the demand system (5), the general form of prices is:
9 In general we write ni ≥ ni+1, but equality is never part of an equilibrium as explainedbelow in footnote 14.
10 These are standard results in models of vertical differentiation.
11 If this were not true, a good from the coalition with lower market coverage would not bepurchased.
10
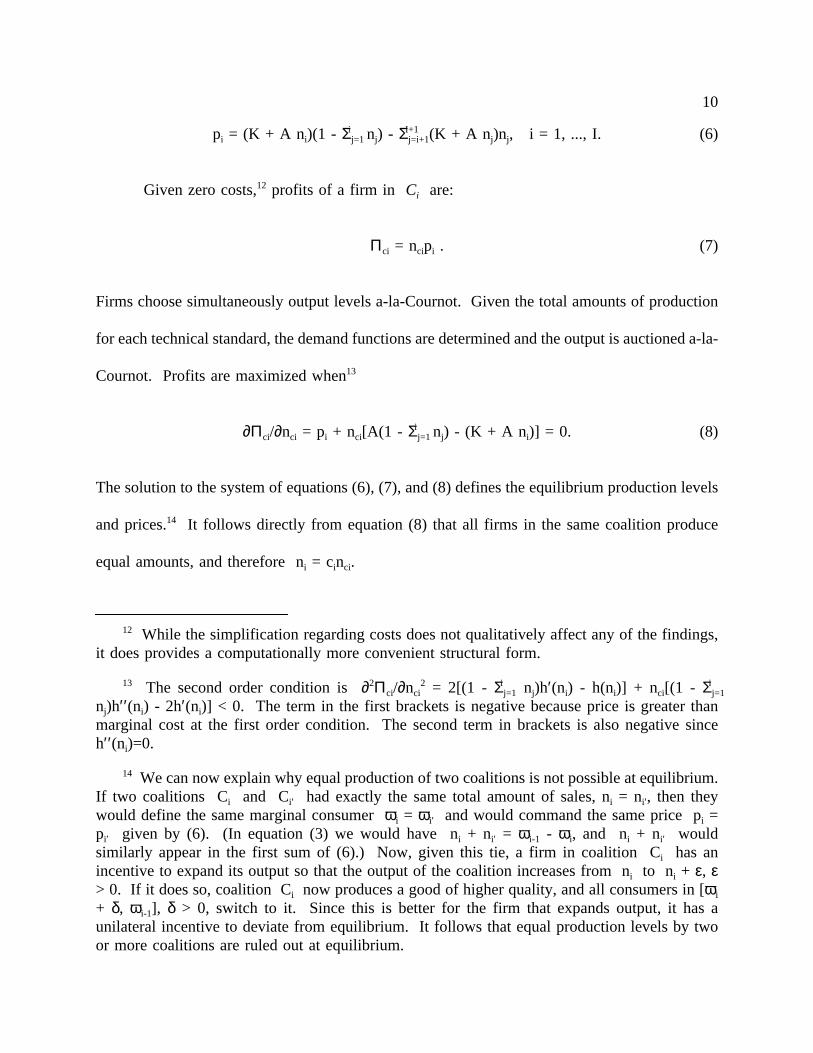
pi = (K + A ni)(1 - Σj=1i nj) - Σj=i+1
I+1 (K + A nj)nj, i = 1, ..., I. (6)
Given zero costs,12 profits of a firm in Ci are:
Πci = ncipi . (7)
Firms choose simultaneously output levels a-la-Cournot. Given the total amounts of production
for each technical standard, the demand functions are determined and the output is auctioned a-la-
Cournot. Profits are maximized when13
∂Πci/∂nci = pi + nci[A(1 - Σj=1i nj) - (K + A ni)] = 0. (8)
The solution to the system of equations (6), (7), and (8) defines the equilibrium production levels
and prices.14 It follows directly from equation (8) that all firms in the same coalition produce
equal amounts, and therefore ni = cinci.
12 While the simplification regarding costs does not qualitatively affect any of the findings,it does provides a computationally more convenient structural form.
13 The second order condition is∂2Πci/∂nci2 = 2[(1 - Σj=1
i nj)h′(ni) - h(ni)] + nci[(1 - Σj=1i
nj)h′′(ni) - 2h′(ni)] < 0. The term in the first brackets is negative because price is greater thanmarginal cost at the first order condition. The second term in brackets is also negative sinceh′′(ni)=0.
14 We can now explain why equal production of two coalitions is not possible at equilibrium.If two coalitions Ci and Ci′ had exactly the same total amount of sales, ni = ni′, then theywould define the same marginal consumerωi = ωi′ and would command the same price pi =pi′ given by (6). (In equation (3) we would have ni + ni′ = ωi-1 - ωi, and ni + ni′ wouldsimilarly appear in the first sum of (6).) Now, given this tie, a firm in coalition Ci has anincentive to expand its output so that the output of the coalition increases from ni to ni + ε, ε> 0. If it does so, coalition Ci now produces a good of higher quality, and all consumers in [ωi
+ δ, ωi-1], δ > 0, switch to it. Since this is better for the firm that expands output, it has aunilateral incentive to deviate from equilibrium. It follows that equal production levels by twoor more coalitions are ruled out at equilibrium.

11
The gains associated with network externalities are reflected in the consumers’ willingness
to pay. Consumers’ surplus at equilibrium is
CS = ΣIi=1 [∫
ωi
ωi-1
(ωni - pi)dω] = ΣIi=1 [(ωi-1
2 - ωi2)ni/2 - (ωi-1 - ωi)pi]. (9)
Since costs are zero, total profits of all members of coalition i are (ωi-1 - ωi)pi so that total
surplus is
TS = CS + PS =ΣIi=1 ∫
ωi
ωi-1
ωni dω = ΣIi=1 (ωi-1
2 - ωi2)ni/2. (10)
Because social welfare depends on the extent of network externalities, the model yields some
very interesting results in welfare comparisons across industry structures of varying degrees of
network externalities, as we will see below.
In the following sections, the model is used to analyze alternative market structures; this
provides a basis for determining the equilibrium coalition structures.
3. Potential Market Structures
3.1 Full Compatibility
Full compatibility refers to the case where all firms in the industry produce compatible
output. This coalition structure is denoted (S, 0), since all firms belong to the leading platform.
In this case, I = 1. The total size of the network isΣSs=1 ns, and the willingness to pay by
consumer of typeω is ω(K + A ΣSs=1 ns). At equilibrium, there is a unique price for all goods,
since goods from different firms are identical in every attribute. Given a common price, the
marginal consumerω who purchases the good is defined by
12
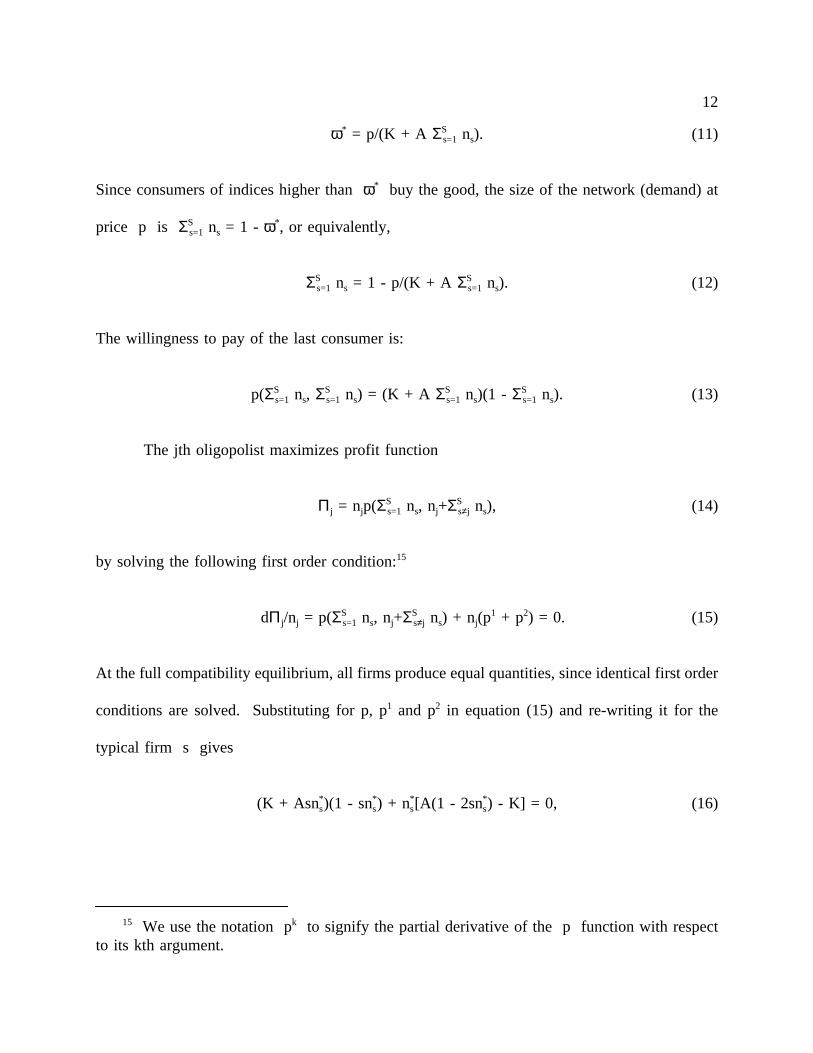
ω* = p/(K + A ΣSs=1 ns). (11)
Since consumers of indices higher thanω* buy the good, the size of the network (demand) at
price p is ΣSs=1 ns = 1 - ω*, or equivalently,
ΣSs=1 ns = 1 - p/(K + A ΣS
s=1 ns). (12)
The willingness to pay of the last consumer is:
p(ΣSs=1 ns, ΣS
s=1 ns) = (K + A ΣSs=1 ns)(1 - ΣS
s=1 ns). (13)
The jth oligopolist maximizes profit function
Πj = njp(ΣSs=1 ns, nj+ΣS
s≠j ns), (14)
by solving the following first order condition:15
dΠj/nj = p(ΣSs=1 ns, nj+ΣS
s≠j ns) + nj(p1 + p2) = 0. (15)
At the full compatibility equilibrium, all firms produce equal quantities, since identical first order
conditions are solved. Substituting for p, p1 and p2 in equation (15) and re-writing it for the
typical firm s gives
(K + Asns*)(1 - sns
*) + ns*[A(1 - 2sns
*) - K] = 0, (16)
15 We use the notation pk to signify the partial derivative of the p function with respectto its kth argument.
13
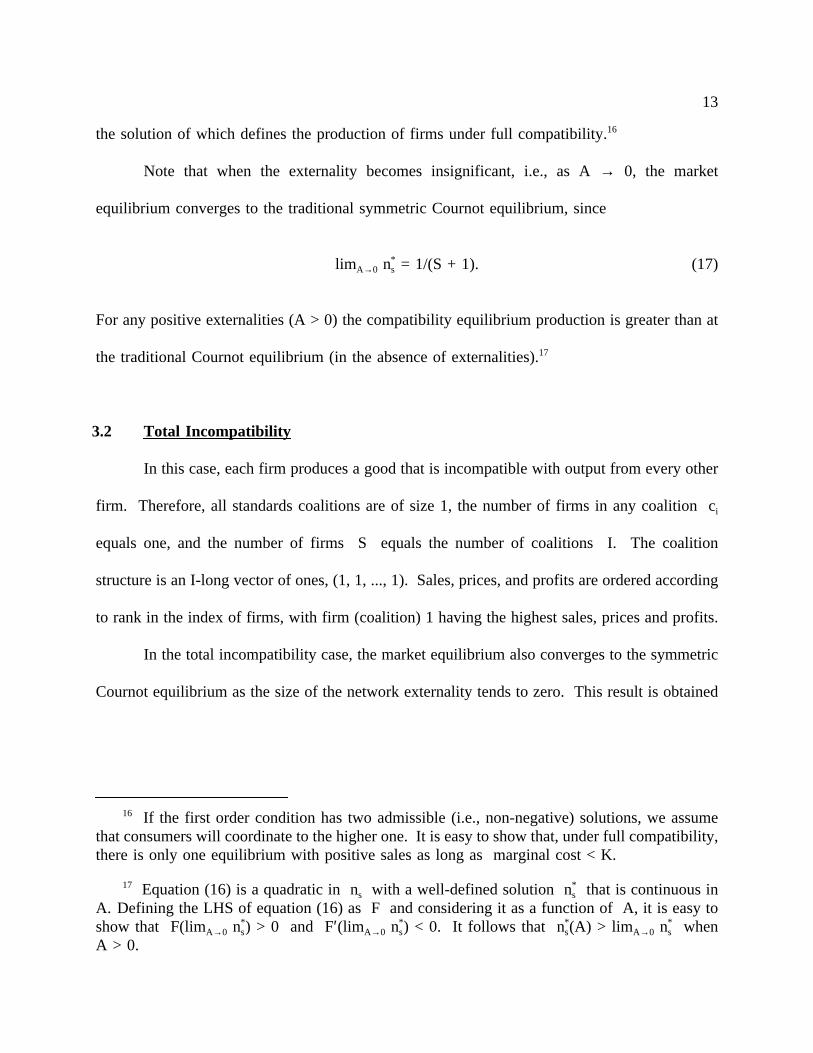
the solution of which defines the production of firms under full compatibility.16
Note that when the externality becomes insignificant, i.e., as A→ 0, the market
equilibrium converges to the traditional symmetric Cournot equilibrium, since
limA→0 ns* = 1/(S + 1). (17)
For any positive externalities (A > 0) the compatibility equilibrium production is greater than at
the traditional Cournot equilibrium (in the absence of externalities).17
3.2 Total Incompatibility
In this case, each firm produces a good that is incompatible with output from every other
firm. Therefore, all standards coalitions are of size 1, the number of firms in any coalition ci
equals one, and the number of firms S equals the number of coalitions I. The coalition
structure is an I-long vector of ones, (1, 1, ..., 1). Sales, prices, and profits are ordered according
to rank in the index of firms, with firm (coalition) 1 having the highest sales, prices and profits.
In the total incompatibility case, the market equilibrium also converges to the symmetric
Cournot equilibrium as the size of the network externality tends to zero. This result is obtained
16 If the first order condition has two admissible (i.e., non-negative) solutions, we assumethat consumers will coordinate to the higher one. It is easy to show that, under full compatibility,there is only one equilibrium with positive sales as long as marginal cost < K.
17 Equation (16) is a quadratic in ns with a well-defined solution ns* that is continuous in
A. Defining the LHS of equation (16) as F and considering it as a function of A, it is easy toshow that F(limA→0 ns
*) > 0 and F′(limA→0 ns*) < 0. It follows that ns
*(A) > limA→0 ns* when
A > 0.
14
by substituting equation (6) into equation (8), setting nci = ni, S = I, andtaking the limit as A
tends to zero:
limA→0 ni* = 1/(S + 1), (18)
which is the quantity per firm at the S-firm Cournot equilibrium without externalities. Thus, as
externalities tend to zero, output tends to the same limit under either compatibility or
incompatibility; therefore,when externalities are very small, whether firms are compatible or not
makes little difference to the equilibrium market structure.
Without loss of generality, the network externality function is normalized so that h(ni)
= k + ni, where k = K/A. In this specification, the index 1/k measures the intensity of the
marginal network externality. Thus, a good with small k provides benefits primarily through
its associated network externality, while goods with large k have relatively low network
externality effects. At the extremes, a pure network good is represented by setting k equal to
zero, and the standard Cournot case of no externalities is approached when k tends to infinity.
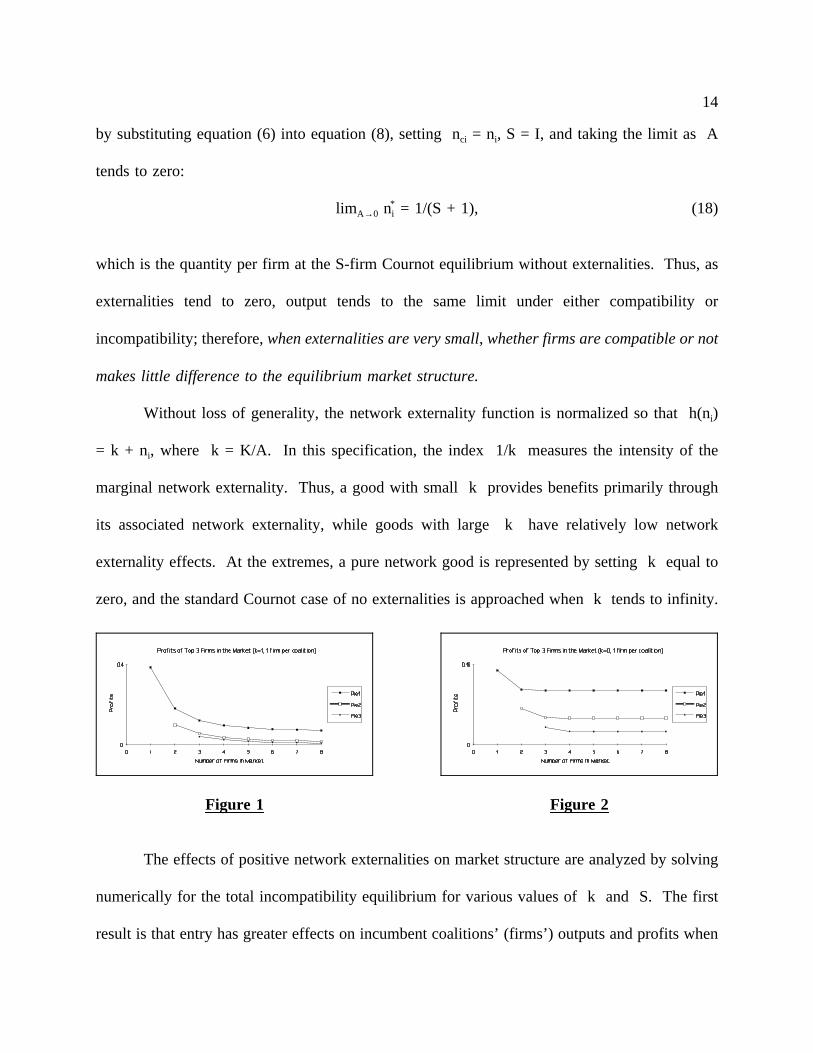
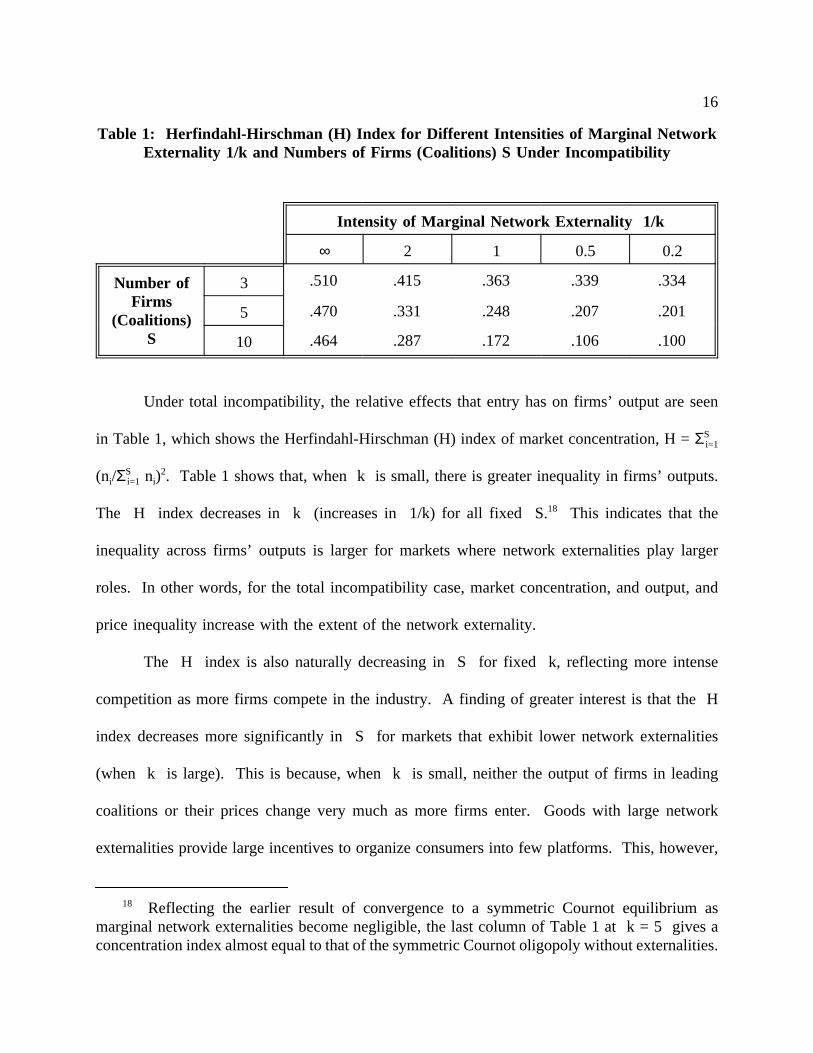
Figure 1 Figure 2
The effects of positive network externalities on market structure are analyzed by solving
numerically for the total incompatibility equilibrium for various values of k and S. The first
result is that entry has greater effects on incumbent coalitions’ (firms’) outputs and profits when

15
k is large. The relative effects on profits of entry is seen by comparing figures 1 and 2. These
figures depict profits of the leading 3 firms in the market given various numbers of firms in the
industry. In figure 1, k is set equal to 1. In figure 2, k equals 0. Notice that as the number
of firms increase, the profits for the leading firms in the industry where k is large (figure 1) are
more dramatically affected by entry. The intuition is straightforward: the greater non-network
benefits associated with high-k (low network externalities) industries make goods of different
compatibility standards closer substitutes. Therefore, the effect of increased competition on
profits is more pronounced for high-k (low network externalities) industries.
16
Table 1: Herfindahl-Hirschman (H) Index for Different Intensities of Marginal NetworkExternality 1/k and Numbers of Firms (Coalitions) S Under Incompatibility
Intensity of Marginal Network Externality 1/k
∞ 2 1 0.5 0.2
Number ofFirms
(Coalitions)S
3 .510 .415 .363 .339 .334
5 .470 .331 .248 .207 .201
10 .464 .287 .172 .106 .100
Under total incompatibility, the relative effects that entry has on firms’ output are seen
in Table 1, which shows the Herfindahl-Hirschman (H) index of market concentration, H =ΣSi=1
(ni/ΣSi=1 ni)
2. Table 1 shows that, when k is small, there is greater inequality in firms’ outputs.
The H index decreases in k (increases in 1/k) for all fixed S.18 This indicates that the
inequality across firms’ outputs is larger for markets where network externalities play larger
roles. In other words, for the total incompatibility case, market concentration, and output, and
price inequality increase with the extent of the network externality.
The H index is also naturally decreasing in S for fixed k, reflecting more intense
competition as more firms compete in the industry. A finding of greater interest is that the H
index decreases more significantly in S for markets that exhibit lower network externalities
(when k is large). This is because, when k is small, neither the output of firms in leading
coalitions or their prices change very much as more firms enter. Goods with large network
externalities provide large incentives to organize consumers into few platforms. This, however,
18 Reflecting the earlier result of convergence to a symmetric Cournot equilibrium asmarginal network externalities become negligible, the last column of Table 1 at k = 5 gives aconcentration index almost equal to that of the symmetric Cournot oligopoly without externalities.

17
provides high monopoly power to leading platforms, which are not significantly affected by entry
of firms offering incompatible output. On the other hand, when network externalities contribute
a relatively small portion to a good’s value (large k), incompatible outputs are closer substitutes
to leading platform goods, and consequently have a greater effect on leading firms’ output and
profits.
4. Application of Equilibrium Concepts
4.1 Pure Network Goods
We first consider the important class of pure network goods, i.e., goods that deriveall
their value from the existence of a network. In the specification of our model, pure network
goods are characterized by k = 0. For such goods, we establish that total incompatibility is a
consensual equilibrium coalition structure, and that a non-cooperative equilibrium coalition
structure in pure strategies does not exist. We also show that under total incompatibility, entry
of additional firms in the market has minimal effects on profits, quantities, prices, and total
surplus.
4.1.1 Pure Network Goods Under Incompatibility
We first fix the regime to incompatibility and analyze the market structure. For k = 0,
we show in the appendix that the ratio of consecutive production levels (or equivalently of
quality levels) is at leastφ2,
φ2 = 2.61803 = ns-1/ns < ns-2/ss-1 < ... < n1/n2 = 2.7322. (19)
18
where φ is the "golden mean" constant.19,20 Notice that the ratio between the sales of
consecutive firms depends only on their position and not on the number of firms in the industry.
That is, irrespective of the number of firms in the industry, the firm with the next to the lowest
quality always produces approximately 162% (φ2 - 1 = φ 1.62) more output than the lowest
quality firm. Similar relations hold for consecutive firms of higher quality indices. This signifies
an extreme inequality among producers. For example, as seen in Table 2a, with 10 firms in the
industry, the top firm sells 63.4% of industry output, the second firm 23.2%, and the third firm
8.5%, while the rest of the firms split the remaining 5.1% of the market. This is a small decrease
in output for the top firm from 66.7% when it was operating by itself. It is evident from Table
2a that market structure does not change significantly when the number of firms increases. We
show in the appendix that the Herfindahl index in an industry of an infinite number of firms21
is larger than H∞ = limS→∞ (ΣSi=1 φ4(i-1))/(ΣS
i=1 φ2(i-1))2 0.4472.22 This contrasts with an H∞ =
0 in an industry without externalities.
19 φ = (1 + √5)/2 1.61803 defines the "golden mean," and is the basis of the Fibonaccinumbers. The golden mean appears in the dimensions of the Parthenon, art, music, and nature.It also arises in population growth models. Its key mathematical properties areφ2 = φ + 1, 1/φ= φ - 1. φ is the limit of the ratio of consecutive terms in the sequence (0, 1, 1, 2, 3, 5, 8, ...)where the each last term is the sum of the two previous ones.
20 The formulas in equation (19) are for s > 4. For smaller s, equation (19) should be readfrom the left. For example, when s = 2, n1/n2 = 2.61803.
21 Clearly, the industry with an infinite number of firms is the most competitive of this type.
22 In fact, numerical methods show that the actual concentration ratio is higher, H∞ = 0.463.

19
Table 2a: Market Coverage and Prices under Incompatibility for Pure Network Goods
S=I n1 n2 n3 ΣSj=i nj p1 p2 p3 pS
1 0.6666 0.6666 0.222222 2.222e-1
2 0.6357 0.2428 0.8785 0.172604 0.0294 2.948e-2
3 0.6340 0.2326 0.0888 0.9555 0.170007 0.0231 0.0035 3.508e-3
4 0.6339 0.2320 0.0851 0.9837 0.169881 0.0227 0.0030 4.533e-4
5 0.6339 0.2320 0.0849 0.9940 0.169873 0.0227 0.0030 7.086e-5
10 0.6339 0.2320 0.0849 0.9999 0.169873 0.0227 0.0030 9.88e-11
∞ 0.6339 0.2320 0.0849 0.9999 0.169873 0.0227 0.0030 0
Table 2b: Profits and Total Surplus under Incompatibility for Pure Network Goods
S=I Π1 Π2 Π3 ΠS ΣSj=i Πj TS
1 0.1481 0.1481 0.1481 0.296296519
2 0.1097 7.159e-3 7.159e-3 0.1168 0.290018816
3 0.1077 5.377e-3 3.508e-4 3.508e-4 0.1135 0.288788913
4 0.1077 5.285e-3 3.096e-4 1.474e-5 0.1132 0.288683212
5 0.1077 5.281e-3 2.592e-4 8.44e-7 0.1132 0.288678179
10 0.1077 5.281e-3 2.589e-4 1.18e-14 0.1132 0.288677999
∞ 0.1077 5.281e-3 2.589e-4 0 0.1132 0.288677999
Similarly, we show in the appendix that the ratio of prices of consecutive firms is at least
φ2. Table 2a shows that the actual price ratios of consecutive firms are significantly higher,
ranging from 5.85 to 7.7. Since lower ranked firms (coalitions) have significantly lower sales
and sell at lower prices, profits of lower ranked firms are significantly lower. Formal
calculations in the appendix show that the ratio of profits of consecutive firms is at leastφ4 =
3φ + 2 6.86. Actual numbers in Table 2b show that the ratios of profits of consecutive firms
20
range from 15 to 20. Thus, the inequality in profits is even more extreme than the inequality of
output levels. This is a distinctive feature of pure network goods industries. In the traditional
Cournot model without externalities, the inequality in profits is the same as the inequality in
outputs. Here, because of the effect of output on quality (because of the network externalities),
the inequality in profits is much more pronounced than the inequality in quantities. If one were
to create a Herfindahl index of profits, that is an industry-wide sum of the squared profits shares,
HΠI = ΣIi=1 (Πi/ΣI
i=1 Πi)2, at the incompatibility market equilibrium with an infinite number of
firms it would be HΠ∞ = 0.9065 about double the value of the Herfindahl index in quantities.23
It is worth noting one more time that once the industry has reached three firms, entry of
additional firms make only tiny differences in quantities, prices, and profits. This holds despite
free entry and the existence of no fixed or sunk costs. It is also evident from Table 2b that entry
has little impact on total surplus. Interestingly, increases in the number of firms have a negative
effect on surplus, as platform fragmentation diminishes the gains from network externalities.
4.1.2 Total Incompatibility is a Consensual Equilibrium Coalition Structure for Pure
Network Goods
We now show that incompatibility is a consensual equilibrium coalition structure for pure
network goods. We consider a deviation from a coalition structure of total incompatibility,TIS
≡ (1, ..., 1), to a partial incompatibility coalition structure, where all coalitions have one member
except for coalition i which has two members,PIS = (1, ..., 1, 2, 1, ..., 1). Note that the number
of firms in both cases is S, and the number of coalitions (length of the vector) is S inTIS but
23 Of course, HΠ∞ = 0 in a world without network externalities.

21
S - 1 in PIS. A firm makes higher profits only if it joins a higher level (output) coalition;
therefore it is sufficient to consider only such moves. A firm in position i inTIS will accept
in its coalition the firm in position i - 1 ofTIS (thus resulting inPIS) if and only if the profits
it will realize in the two-firm coalition are higher than its original profits, i.e. ifΠi(TIS) > Πi(PIS).
We show in the appendix that this is never true, regardless of the position of i of the
firm or the size of the industry S. Therefore,total incompatibility is a consensual equilibrium
coalition structure. We also show in the appendix that a firm inTIS is always better off by
joining a higher coalition; therefore total incompatibility isnot a non-cooperative equilibrium
coalition structure.
In a traditional model without network externalities and zero fixed costs, an increase in
the number of firms increases consumers’ and total surplus. This is not necessarily true in a
world of positive externalities. In our model, increasing the number of firms in any coalition
increases consumers’ and total surplus as long as the number of coalitions (platforms) remains
the same. But, an increase in the number of firms that results in an increase in the number of
platforms may result in a decrease in consumers’ and total surplus. An increase in the number
of platforms may decrease production of some platforms. Consumers of these platforms may
receive lower surplus because of lower production and lower externalities within the platform,
despite the fact that they may also receive lower prices. The gains of consumers’ surplus by
consumers of other platforms will not compensate for losses of top platforms because the
platform-wide network externality is much smaller for lower platforms. For pure network goods,
under incompatibility, increases in the number of firms cause a decrease in consumers’ and total
22
surplus, as shown in Table 2b. Although, under incompatibility, monopoly results in the highest
total surplus, the realized surplus in this regime is significantly lower than total surplus under
compatibility.
4.1.3 Non-Existence of Non-cooperative Equilibrium Coalition Structures for Pure
Network Goods
From the arguments of the previous section we know that, for pure network goods, total
incompatibility isnot a non-cooperative equilibrium, since a firm in any platform except the very
top one would like to join the adjacent higher platform. We can similarly show that full
compatibility isnot a coalition structure equilibrium since any firm would like to deviate from
full compatibility and create, by itself, an incompatible top platform. More generally we can
show that no coalition structure is a non-cooperative equilibrium in pure strategies in a market
for pure network goods. To show this, we prove in the appendix that, given any coalition
structure in a pure network goods industry, there exists at least one firm that has an incentive to
change coalition affiliation. The intuitive reason for this result is that in a pure network goods
industry, there are very strong individual incentives to breaking away from a coalition and reap
the advantage of strong externalities and high production of a higher platform. Thus, firms
always want to join higher platforms (or create higher platforms by themselves), thereby
destroying any possibility of a non-cooperative equilibrium.
4.2 Special Case: Two Firms
23
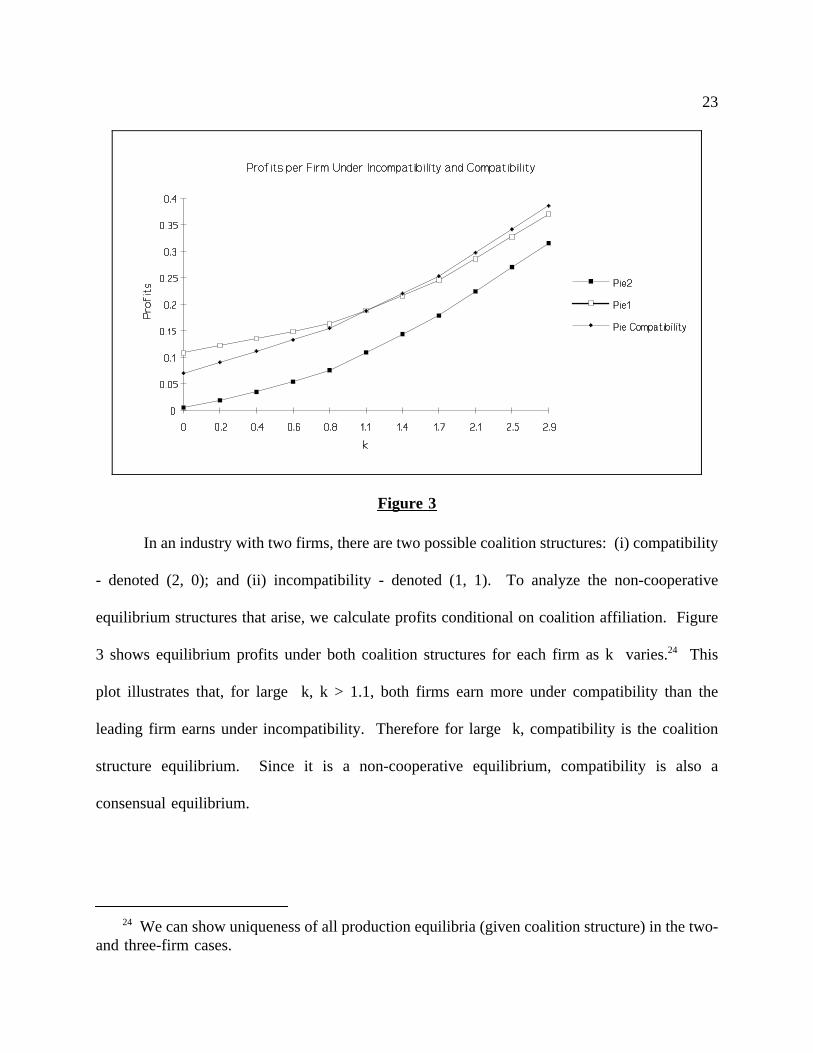
In an industry with two firms, there are two possible coalition structures: (i) compatibility
Figure 3
- denoted (2, 0); and (ii) incompatibility - denoted (1, 1). To analyze the non-cooperative
equilibrium structures that arise, we calculate profits conditional on coalition affiliation. Figure
3 shows equilibrium profits under both coalition structures for each firm as k varies.24 This
plot illustrates that, for large k, k > 1.1, both firms earn more under compatibility than the
leading firm earns under incompatibility. Therefore for large k, compatibility is the coalition
structure equilibrium. Since it is a non-cooperative equilibrium, compatibility is also a
consensual equilibrium.
24 We can show uniqueness of all production equilibria (given coalition structure) in the two-and three-firm cases.
24
For small k, when there are strong network externalities, compatibility profits lie between
the incompatibility profits of the first and the second firm. In this case, firm 2 wants
compatibility and firm 1 wants incompatibility. Therefore, for small k, there is no non-
cooperative equilibrium. Incompatibility is a consensual equilibrium, which arises when the
leading firm has the power to restrict the second firm from entering its coalition.
These results may seem paradoxical, since the incentive to break from compatibility is
higher in goods with strong network externalities, when one expects the highest benefits from
compatibility. The intuition behind this finding is as follows. The differences across firms in
the equilibrium outputs and prices under incompatibility increase as network externalities play
a larger role in the goods value (when k is small). With large externalities (i.e. when k is
close to zero), the top firm sells to the vast majority of consumers and receives a very high price.
Thus, the incentive to deviate from the equal quantities, prices, and profits compatibility
equilibrium and become the top firm under incompatibility is greater when network externalities
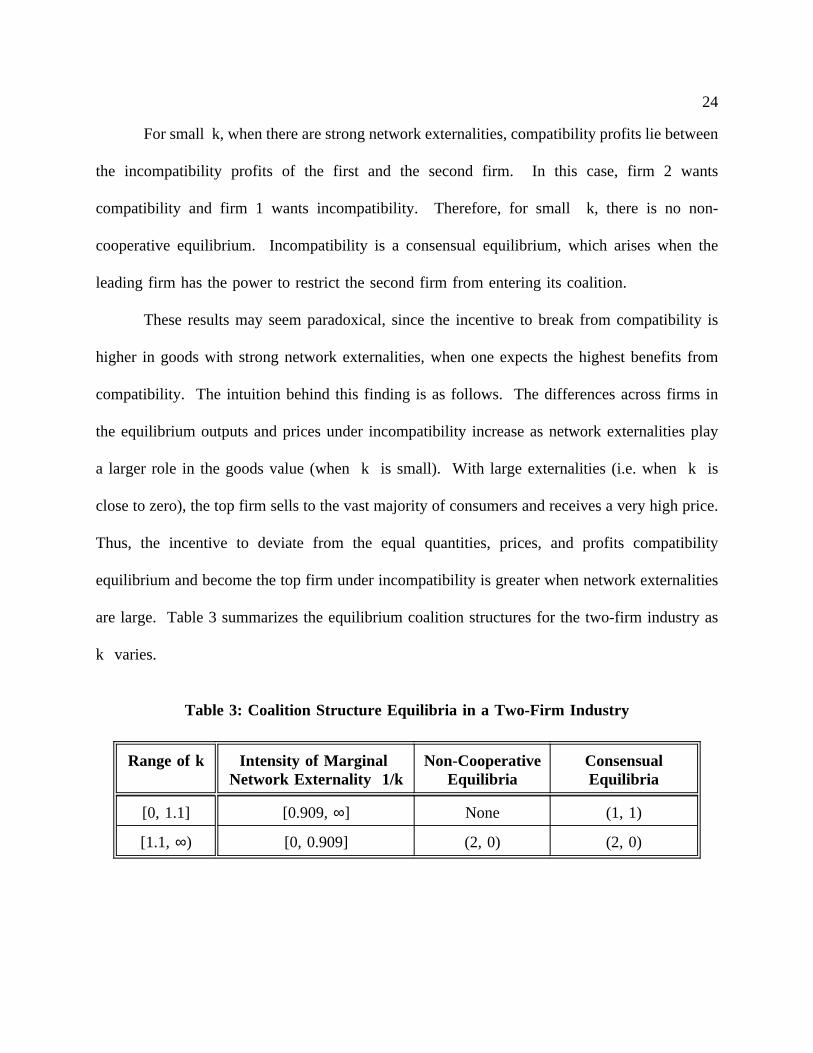
are large. Table 3 summarizes the equilibrium coalition structures for the two-firm industry as
k varies.
Table 3: Coalition Structure Equilibria in a Two-Firm Industry
Range of k Intensity of MarginalNetwork Externality 1/k
Non-CooperativeEquilibria
ConsensualEquilibria
[0, 1.1] [0.909,∞] None (1, 1)
[1.1, ∞) [0, 0.909] (2, 0) (2, 0)
25
4.3 Special Case: Three Firms
4.3.1 Non-cooperative Coalition Structure Equilibria
In an industry with three firms, the potential coalition structures are as follows: full
compatibility, (3, 0, 0); total incompatibility, (1, 1, 1); and partial incompatibility, (2, 1, 0) or (1,
2, 0). Equilibrium profits associated with the different coalition structures are presented in figure
4. This graph can be used to determine which coalition structures qualify as non-cooperative
equilibria. We first eliminate those coalition structures that do not qualify. Three coalition
structures can be immediately eliminated as candidates for non-cooperative equilibrium. In each
of these cases, a firm has an incentive to deviate and join another coalition, thus creating an
adjacent coalition structure.
1. (1, 1, 1) isnot a non-cooperative equilibrium because profits at (2, 1, 0) are higher for
a firm in the top layer than for the middle firm in (1, 1, 1); thus, there is an incentive for
the middle firm to join the top layer.
2. (2, 1, 0) isnot a non-cooperative equilibrium because profits at (2, 1, 0) are lower for a
firm in the middle layer than at full compatibility at (3, 0, 0), and therefore the middle
firm has an incentive to join the top coalition.
3. (1, 2, 0) isnot a non-cooperative equilibrium because profits for a firm at the top layer
at (2, 1, 0) are higher than for a firm in the lower layer of (1, 2, 0).
We now establish under what conditions the remaining coalition structure, (3, 0, 0) (i.e.,
full compatibility), is a non-cooperative equilibrium. For k > 0.5, the firm in the top layer in
coalition structure (1, 2, 0) is worse off than at (3, 0, 0). Thus, for k > 0.5, a defection from
(3, 0, 0) to (1, 2, 0) or to (2, 1, 0) is not desirable for the defecting firm. Therefore,for k > 0.5,

26
full compatibility is a non-cooperative equilibrium. For k < 0.5, the firm in the top layer at
Figure 4
(1, 2, 0) is better off than at (3, 0, 0), and therefore (3, 0, 0) isnot a noncooperative equilibrium.
Since all other coalition structures have been shown not to be non-cooperative equilibria,for k
< 0.5, there is no non-cooperative equilibrium in pure strategies.
In summary, we find that the only non-cooperative equilibrium is at full compatibility,
and that it is achieved only for goods that have some value on their own irrespective of sales to
other customers. As we have also proven earlier, for pure two-way network goods, where k =
0, there is no non-cooperative equilibrium coalition structure, since each firm has an incentive
to join a higher platform, or create one by itself.
27
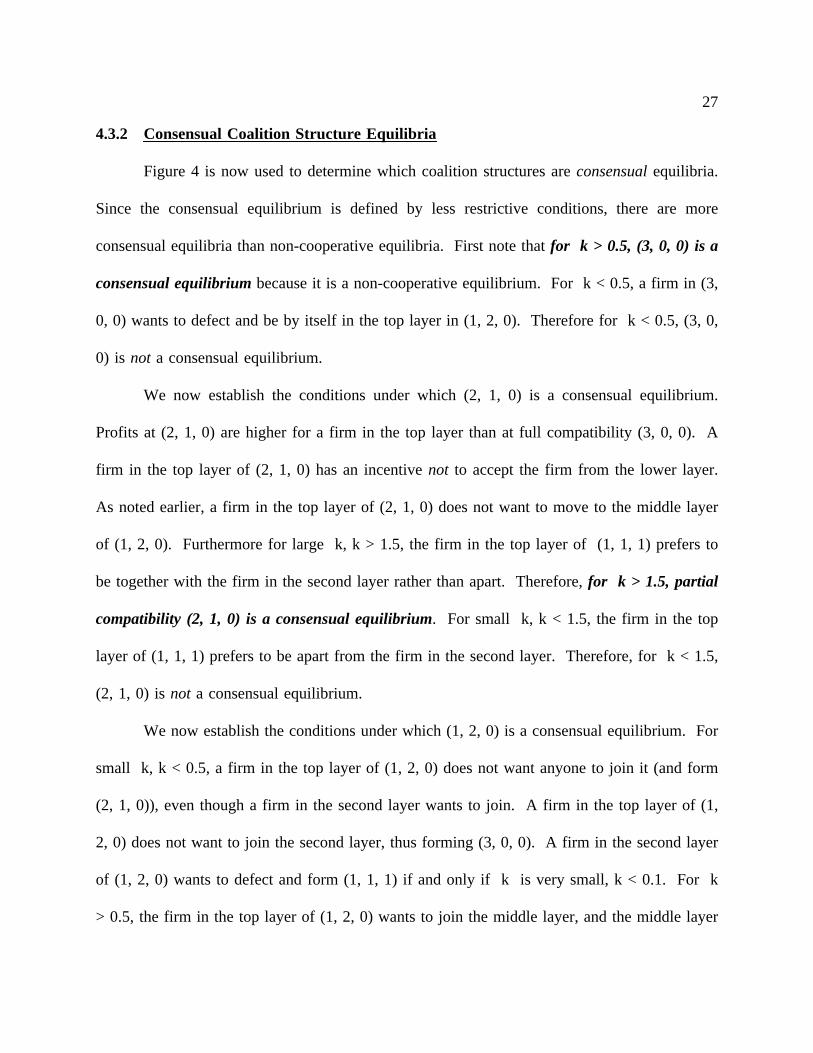
4.3.2 Consensual Coalition Structure Equilibria
Figure 4 is now used to determine which coalition structures areconsensualequilibria.
Since the consensual equilibrium is defined by less restrictive conditions, there are more
consensual equilibria than non-cooperative equilibria. First note thatfor k > 0.5, (3, 0, 0) is a
consensual equilibriumbecause it is a non-cooperative equilibrium. For k < 0.5, a firm in (3,
0, 0) wants to defect and be by itself in the top layer in (1, 2, 0). Therefore for k < 0.5, (3, 0,
0) is not a consensual equilibrium.
We now establish the conditions under which (2, 1, 0) is a consensual equilibrium.
Profits at (2, 1, 0) are higher for a firm in the top layer than at full compatibility (3, 0, 0). A
firm in the top layer of (2, 1, 0) has an incentivenot to accept the firm from the lower layer.
As noted earlier, a firm in the top layer of (2, 1, 0) does not want to move to the middle layer
of (1, 2, 0). Furthermore for large k, k > 1.5, the firm in the top layer of (1, 1, 1) prefers to
be together with the firm in the second layer rather than apart. Therefore,for k > 1.5, partial
compatibility (2, 1, 0) is a consensual equilibrium. For small k, k < 1.5, the firm in the top
layer of (1, 1, 1) prefers to be apart from the firm in the second layer. Therefore, for k < 1.5,
(2, 1, 0) isnot a consensual equilibrium.
We now establish the conditions under which (1, 2, 0) is a consensual equilibrium. For
small k, k < 0.5, a firm in the top layer of (1, 2, 0) does not want anyone to join it (and form
(2, 1, 0)), even though a firm in the second layer wants to join. A firm in the top layer of (1,
2, 0) does not want to join the second layer, thus forming (3, 0, 0). A firm in the second layer
of (1, 2, 0) wants to defect and form (1, 1, 1) if and only if k is very small, k < 0.1. For k
> 0.5, the firm in the top layer of (1, 2, 0) wants to join the middle layer, and the middle layer

28
wants to accept it, thus forming (3, 0, 0). Therefore (1, 2, 0) is a consensual equilibrium for 0.1
< k < 0.5.
We now establish the conditions under which (1, 1, 1) is a consensual equilibrium. For
extremely small k (very high externalities), k < 0.1, the middle firm does not want the bottom
firm to join it, and the top firm does not want the middle firm to join it, even though any lower
firm wants to join a higher layer. This establishes that fork < 0.1, (1, 1, 1) is a consensual
equilibrium. For k > 0.1, the middle firm will accept the lowest layer firm, and therefore (1,
1, 1) is not a consensual equilibrium.
Table 4: Coalition Structure Equilibria in a Three-Firm Industry
Range of k Intensity of MarginalNetwork Externality 1/k
Non-cooperativeEquilibria
ConsensualEquilibria
[0, 0.1] [10, ∞] None (1, 1, 1)
[0.1, 0.5] [2, 10] None (1, 2, 0)
[0.5, 1.5] [0.666, 2] (3, 0, 0) (3, 0, 0)
[1.5, ∞) [0, 0.666] (3, 0, 0) (3, 0, 0), (2, 1, 0)
In summary, we found that each coalition structure can be a consensual equilibrium for
some range of k. In particular, coalition structures of partial compatibility are consensual
equilibrium coalition structures for different values of k: for 0.1< k < 0.5 (1, 2, 0) is the
consensual equilibrium, and for k > 1.5, (2, 1, 0) is a consensual equilibrium. Full compatibility
(3, 0, 0) is a consensual equilibrium whenever it is a non-cooperative equilibrium, i.e., for k >
29
0.5. Finally, total incompatibility (1, 1, 1) is a consensual equilibrium for k < 0.1. These results
are summarized in Table 4.25
5. Conclusion
Firms that compete in markets where network externalities are present face unique
tradeoffs regarding the choice of a technical standard. Adhering to a leading compatibility
standard allows a firm’s product to capture the value added by a large network. However,
simultaneously the firm loses direct control over the market supply of the good and faces more
intra-platform competition. Alternatively, adhering to a unique standard allows the firm to face
less or no intra-platform competition, but it sacrifices the added value associated with a large
network. The tension between these economic forces shapes the coalition formation equilibrium
in these markets.
In this paper, we developed a model that can be used to solve establish the extent to
which firms adhere to common technical standards in markets for network goods, and the extent
to which firms are willing to sacrifice compatibility to reap the benefits of softening of
competition. The model is then applied to several markets that differ structurally in the extent
of the network externality and in the number of active firms. The resulting equilibrium coalition
structures define the number and extent of technical compatibility platforms, as well as the size
of firms, and price and profit levels.
25 Note that, for a region of the parameters, there is multiplicity of consensual equilibria.Given the nature of consensual equilibrium, this should not be surprising and does not create acontradiction even when the equilibria are adjacent coalition structures.

30
The principal findings of this analysis are: (1) Industry output is larger under the full
compatibility equilibrium than it is under the standard Cournot equilibrium when network
externalities are present. (2) The coalition formation equilibria that emerge are often very
asymmetric in firms’ profits and output, despite the fact that firms are producing identical goods
in terms of inherent qualities, and are using the same production technology. The acuteness of
these asymmetries increases as the portion of a good’s value that derives from the network
externality increases. (3) The conflicting benefits associated with joining a leading coalition
versus adhering to a unique standard also influence a firm’s decision on whether to make its
technical standard available to competitors. Firms in leading platforms earn higher profits by
allowing some additional firms to enter that platform when network externalities are weak. (4)
In markets for pure network goods, where externalities are very strong, there isno non-
cooperative equilibrium coalition structure. This is because there are strong incentives for a firm
to join a higher platform, which breaks any coalition structure. (5) However, total or partial
incompatibility is a consensual equilibrium coalition structure for goods with large network
externalities because, at a consensual equilibrium, a higher platform (single-firm) coalition can
refuse entry to other firms. The concept of a consensual equilibrium is applicable when a
coalition is able to exclude entrants because it holds proprietary standards. Our results show that
market dominance by one or few firms may be an inherent characteristic of market equilibrium
in network industries. (6) In pure network goods markets, under total incompatibility (the
consensual equilibrium coalition structure), total surplus is largest in monopoly because network
externalities are diminished under platform fragmentation. However, surplus is significantly
lower under compatibility, but compatibility is neither a non-cooperative nor a consensual

31
equilibrium coalition structure. (7) Full compatibility is a non-cooperative equilibrium coalition
structure in markets where externalities are weak.
In summary, in the presence of weak network externalities most market interactions turn
out as expected, and are close to the well-understood market equilibria in a world of no
externalities. However, in a market of very strong network externalities, the equilibrium market
structure differs radically from a market without externalities and has strange and unexpected
features. In the presence of strong externalities, there is extreme asymmetry of outputs, prices,
and profits which persists in the presence of free entry, despite the presence of no fixed costs.
Moreover, entry can diminish surplus at total incompatibility which is a consensual equilibrium
coalition structure, while compatibility, which achieves the highest surplus, is neither a
consensual nor a non-cooperative equilibrium. Thus, many traditional results on market structure
are reversed in a world of strong network externalities.

32
References
D’Aspremont, Claude, Alexis Jacquemin, Jean Jaskold-Gabszewicz, and John Weymark (1983),"On the Stability of Collusive Price Leadership,"Canadian Journal of Economics, vol.16, pp. 17-25.
Becker, Gary S., (1991), "A Note on Restaurant Pricing and Other Examples of Social Influenceson Price,"Journal of Political Economy, vol. 59, pp. 1109-1116.
Deneckere, Raymond, and Davidson, Carl, (1985), "Incentives to Form Coalitions with BertrandCompetition,"Rand Journal of Economics, vol 16, no. 4, pp. 473-486.
Donsimoni, Marie-Paule, Economides, Nicholas, and Polemarchakis, Heraclis, (1986), "StableCartels,"International Economic Review, vol. 22, no. 2, pp. 317-327.
Economides, Nicholas, (1984), "Equilibrium Coalition Structures," Discussion Paper No. 273,Columbia University, Department of Economics.
Economides, Nicholas, (1996), "The Economics of Networks,"International Journal of IndustrialOrganization, vol. 16, no. 4, pp. 675-699.
Economides, Nicholas and Charles Himmelberg, (1995), "Critical Mass and Network Size withApplication to the US Fax Market," Discussion Paper no. EC-95-10, Stern School ofBusiness, N.Y.U.
Economides, Nicholas and Lawrence J. White, (1994), "Networks and Compatibility: Implicationsfor Antitrust," European Economic Review, vol. 38, pp. 651-662.
Jaskold-Gabszewicz, Jean and Jacques-Francois Thisse, (1979), "Price Competition, Quality, andIncome Disparities,"Journal of Economic Theory, vol. 20, pp. 340-359.
Katz, Michael and Carl Shapiro, (1985), "Network Externalities, Competition and Compatibility,"American Economic Review, vol. 75 (3), pp. 424-440.
Mussa, Michael and Sherwin Rosen, (1978), "Monopoly and Product Quality,"Journal ofEconomic Theory, vol. 18, pp. 301-317.
Shaked, Avner and John Sutton, (1982), "Relaxing Price Competition Through ProductDifferentiation,"Review of Economic Studies, vol. 49, pp. 3-14.
Yi, Sang-Seung, and Hyukseung Shin (1992), "Endogenous Formation of Coalitions Part I:Theory," mimeo.
33
Appendix
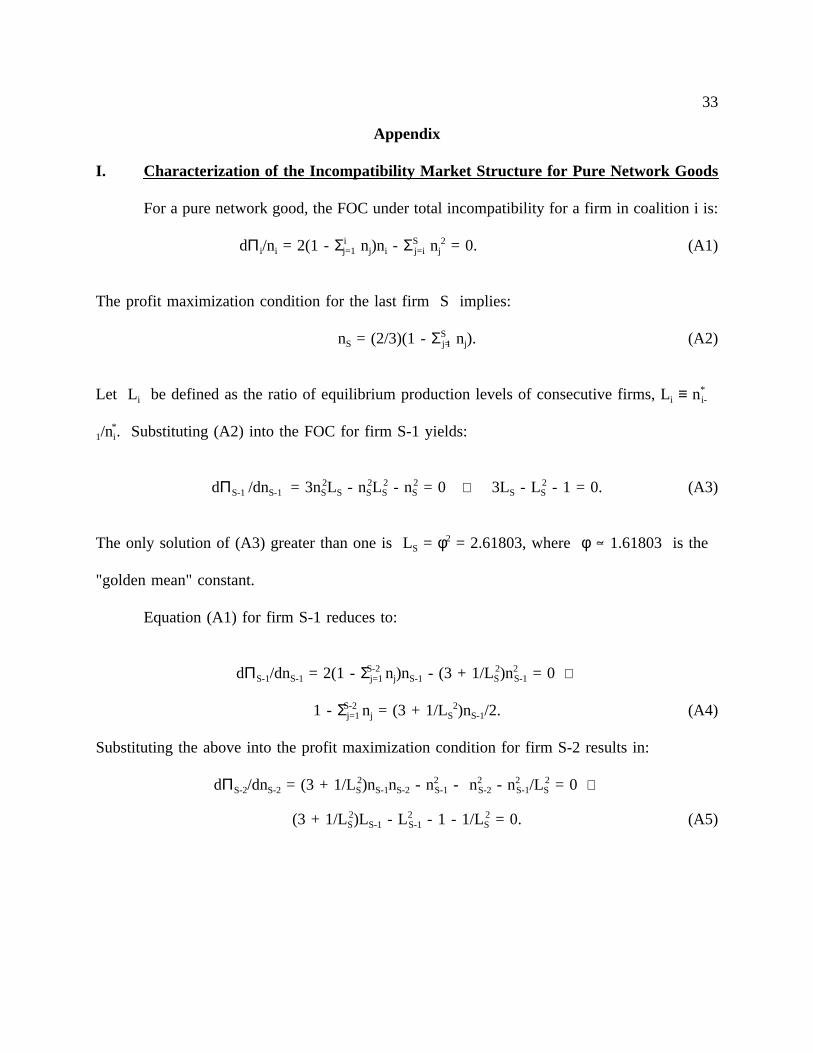
I. Characterization of the Incompatibility Market Structure for Pure Network Goods
For a pure network good, the FOC under total incompatibility for a firm in coalition i is:
dΠi/ni = 2(1 - Σij=1 nj)ni - ΣS
j=i nj2 = 0. (A1)
The profit maximization condition for the last firm S implies:
nS = (2/3)(1 - ΣSj=1 nj). (A2)
Let Li be defined as the ratio of equilibrium production levels of consecutive firms, Li ≡ n*i-
1/ni*. Substituting (A2) into the FOC for firm S-1 yields:
dΠS-1 /dnS-1 = 3nS2LS - nS
2LS2 - nS
2 = 0 ⇔ 3LS - LS2 - 1 = 0. (A3)
The only solution of (A3) greater than one is LS = φ2 = 2.61803, whereφ 1.61803 is the
"golden mean" constant.
Equation (A1) for firm S-1 reduces to:
dΠS-1/dnS-1 = 2(1 - Σj=1S-2 nj)nS-1 - (3 + 1/LS
2)n2S-1 = 0 ⇔
1 - Σj=1S-2 nj = (3 + 1/LS
2)nS-1/2. (A4)
Substituting the above into the profit maximization condition for firm S-2 results in:
dΠS-2/dnS-2 = (3 + 1/LS2)nS-1nS-2 - n2
S-1 - n2S-2 - n2
S-1/LS2 = 0 ⇔
(3 + 1/LS2)LS-1 - L2
S-1 - 1 - 1/LS2 = 0. (A5)

34
Given that LS = 2.61803, the above quadratic has a unique solution with LS-1 > 1,
specifically LS-1 = 2.72546. In general, Li is attained through recursion and solving the
following quadratic for the unique root greater than one,26
(3 + ΣSs=i+1
sj=i+1 Lj
-2 )Li - Li2 - 1 - ΣS
s=i+1sj=i+1 Lj
-2 = 0. (A6)
Note that given the value for LS above, the solution to (A6) approaches 2.7322 as i goes to
one. Regardless of the number of firms in the market, the ratio of sales of consecutive firms
(platforms) is always between 2.61803 and 2.7322 under total incompatibility for pure
network goods.
We now show that ratios ofpricesof consecutive platforms are at leastφ2 2.61803,pi/pi+1 > φ2. (A7)
For a pure network good, equilibrium prices under incompatibility are:
pi = ni(1 - Σij=1 nj) - Σj=i+1
S+1 nj2, i = 1, ..., S. (A8)
The ratio of prices for adjacent coalitions is:
pi/pi+1 = [ni(1 - Σij=1 nj) - Σj=i+1
S+1 nj2]/[ni+1(1 - Σi
j=1 nj) - Σj=i+2S+1 nj
2] (A9)
After few steps,
pi/pi+1 > ni/ni+1 ⇔
ni/ni+1 > (Σj=i+1S+1 nj
2)/(Σj=i+2S+1 nj
2). (A10)
26 denotes a product.

35
Since
1 > ni(1 - Σij=1 nj) > ni+1(1 - Σi
j=1 nj) > Σj=i+1S+1 nj
2 > 0, (A11)
the RHS of (A10) attains its highest value, 1 + 1/φ2 = φ2 + 2(1 - φ) < φ2, when i = 1. Since
the LHS of (A10) is larger than or equal toφ2, it follows that
pi/pi+1 > ni/ni+1 ≥ φ2, (A12)
and therefore (A7) is true.
II. Equilibrium Coalition Structures for Pure Network Goods
Now consider a deviation from total incompatibilityTIS to partial incompatibility PIS
= (1, ..., 1, 2, 1, ..., 1). Since the number of firms remains constant, equation (A6) still
describes the relative sales between neighboring coalitions when neither coalition has two
firms. However, the profit maximization condition for a firm in a coalition i of two firms
is:
dΠci/dnci = (3/2)(1 - Σj=1i-1 nj - (4/3)ni)ni - ΣS
j=i+1 ns2 = 0, (A13)
where n1i + n2i = ni and n1i = n2i. The above equation implies:
(1 - Σj=1i-1 nj) = (2/3)(2 +ΣS
s=i+1sj=i+1 Lj
-2)ni. (A14)
Substituting the right hand side of the above equation into the profit maximization condition
for the (i-1)th coalition (firm) and dividing by ni2 results in:

36
(4/3)(2 + ΣSs=i+1
sj=i+1 Lj
-2)Li - Li2 - 1 - ΣS
s=i+1sj=i+1 Lj
-2 = 0. (A15)
The above equation is analogous to equation (A6). Solving for the unique root that is greater
than one yields the ratio of output between coalition i-1 and i, namely Li, when coalition i
has two firms.
In the case where coalition i-1 has two firms, and all other coalitions have one firm, Li
is defined by:
(3/4)(3 + ΣSs=i+1
sj=i+1 Lj
-2)Li - 1/2Li2 - 1 - ΣS
s=i+1sj=i+1 Lj
-2 = 0. (A16)
Equation (A16) is derived in a similar manner to (A6) and (A15).
The profit maximization condition for a single firm coalition, equation (A1), implies:
(1 - Σj=1i-1 ni) = (3 + ΣS
s=i+1sj=i+1 Lj
-2)ni/2. (A17)
Substituting the right hand side of the above into the FOC condition for the two-firm
coalition, i-1, gives equation (A16). Note that when coalition i-1 has one firm, then the FOC
is defined by equation (A1) and substitution of the above right hand term into equation (A1)
yields equation (A6).
The solution for Li in equation (A16) is in the interval [4.00, 4.18], while the
solution for Li in equation (A15) is in the interval [2.22, 2.39]. It follows from the profit
maximization condition that for the total incompatibility case:
(3/2 + Σs=1S-1 S
j=s+1 Lj)nS = 1. (A18)

37
In the case where there are two firms in one of the coalitions, the analogous equation is:
(3/2 + Σs=1S-2 S-1
j=s+1 Lj) nS-1 = 1. (A19)
Note that the last equation assumes that the two firm coalition is not the bottom coalition. In
the case where the bottom coalition has two firms then (4/3) replaces (3/2) on the left hand
side of equation (A19).
It follows from equations (A13)-(A19) that total incompatibility is always a consensual
equilibrium for pure network goods, since the maximum ratio of total profits for a two firm
coalition i to total profits for coalition i and i+1 under total incompatibility is less than one.
A firm from a coalition with larger sales is always made worse off by accepting a firm from
a lower coalition. The above equations also indicate that sales of coalition i and i+1 under
total incompatibility are always greater than total sales for a two firm coalition i, holding the
number of firms at S.
III. Non-existence of Pure Strategy Non-cooperative Equilibrium Coalition Structures
This section shows that for pure network goods a non-cooperative equilibrium
coalition structure does not exist in pure strategies. To show this, it is sufficient to show that,
given any coalition structure, there exist some firm that has an incentive to change coalition
affiliation.
For a pure network good under any coalition structure, the FOC for a firm in coalition
i is:
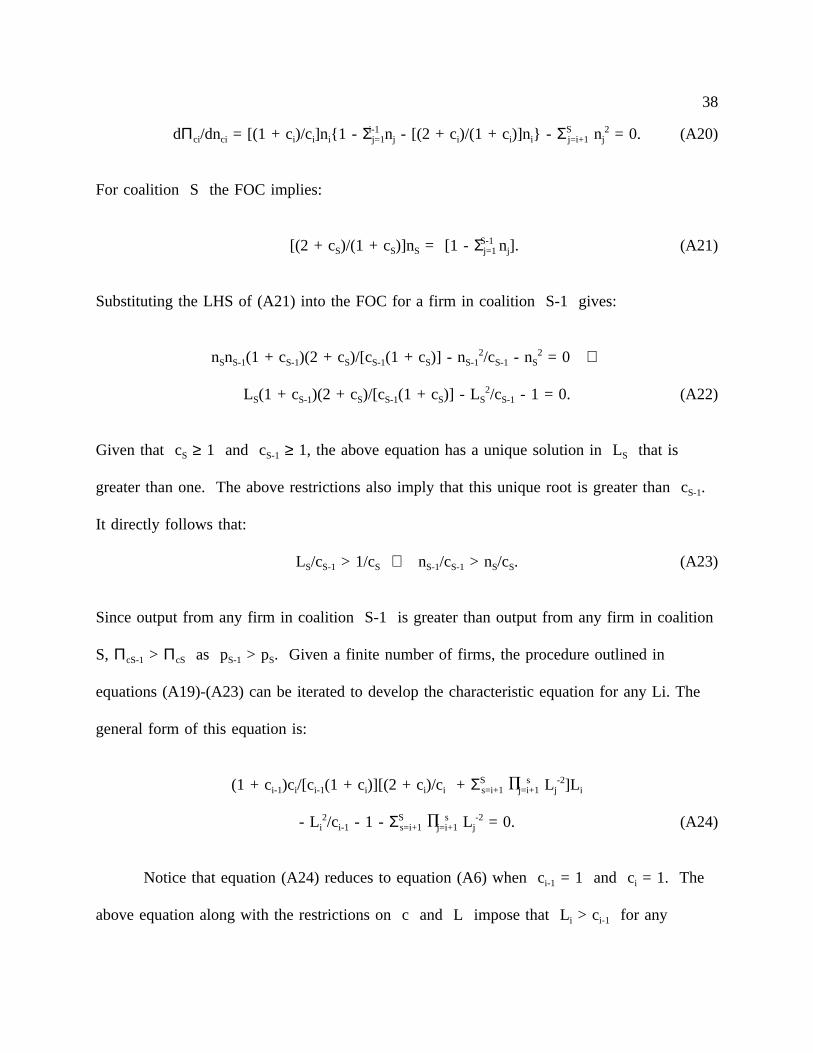
38
dΠci/dnci = [(1 + ci)/ci]ni{1 - Σj=1i-1 nj - [(2 + ci)/(1 + ci)]ni} - ΣS
j=i+1 nj2 = 0. (A20)
For coalition S the FOC implies:
[(2 + cS)/(1 + cS)]nS = [1 - Σj=1S-1 nj]. (A21)
Substituting the LHS of (A21) into the FOC for a firm in coalition S-1 gives:
nSnS-1(1 + cS-1)(2 + cS)/[cS-1(1 + cS)] - nS-12/cS-1 - nS
2 = 0 ⇔
LS(1 + cS-1)(2 + cS)/[cS-1(1 + cS)] - LS2/cS-1 - 1 = 0. (A22)
Given that cS ≥ 1 and cS-1 ≥ 1, the above equation has a unique solution in LS that is
greater than one. The above restrictions also imply that this unique root is greater than cS-1.
It directly follows that:
LS/cS-1 > 1/cS ⇔ nS-1/cS-1 > nS/cS. (A23)
Since output from any firm in coalition S-1 is greater than output from any firm in coalition
S, ΠcS-1 > ΠcS as pS-1 > pS. Given a finite number of firms, the procedure outlined in
equations (A19)-(A23) can be iterated to develop the characteristic equation for any Li. The
general form of this equation is:
(1 + ci-1)ci/[ci-1(1 + ci)][(2 + ci)/ci + ΣSs=i+1
sj=i+1 Lj
-2]L i
- Li2/ci-1 - 1 - ΣS
s=i+1s
j=i+1 Lj-2 = 0. (A24)
Notice that equation (A24) reduces to equation (A6) when ci-1 = 1 and ci = 1. The
above equation along with the restrictions on c and L impose that Li > ci-1 for any
39
coalition structure with finite number of firms. This implies that, regardless of coalition
structure, Πci-1 > Πci.
Given a coalition structure, let one firm from coalition i join coalition i-1. Denote
profits from a firm in coalition i-1 under this new structure asΠ*ci-1. It is straightforward to
show that output for coalition i-1 increases as does the price of its output with entry of new
firms. We now consider the two mutually exclusive possibilities regarding the relative
number of firms in each coalition; (1) ci-1 ≥ ci and (2) ci > ci-1. We show below that in
both casesΠ*ci-1 > Πci.
In the first case, the following inequality must hold: Li2ci-1/(ci-1 + 1) > 1.27 This
indicates thatΠ*ci-1 > Πci since
Π*ci-1 > Πci-1ci-1/(ci-1 + 1) > Li
2Πcici-1/(ci-1 + 1).28 (A25)
Therefore, any coalition structure where ci-1 ≥ ci can never be a non-cooperative equilibrium.
In the second case with ci > ci-1, it follows directly that Π*ci-1 > Πci, since
n*i-1 > ni-1 > ni and p*i-1 > pi-1 > pi, (A26)
where n*i-1 and p*i-1 are output and price for coalition i-1 given that a firm from coalition i
joins it. The above inequalities indicate that p*i-1n
*i-1/(ci-1 + 1) > pini/ci. Therefore, any
27 The inequality Li2ci-1/(ci-1 + 1) > 1 must hold for ci-1 ≥ 2, since Li > ci-1. It also holds
for the special case where ci-1 = ci=1, since then equation (A24) reduces to equation (A6)implying Li ≥ φ2 = 2.61803.
28 It is shown in the previous section that the ratio of profits between coalition i and i-1must be greater than Li
2.

40
coalition structure where ci > ci-1 can never be a non-cooperative equilibrium coalition
structure.
Related Documents


![STRUCTURE UNION - Jgyan - Programming tutorials [Compatibility Mode].pdf · structure data type. Ompal singh. Defining of Structure A structure has to defined, before it can used.](https://static.cupdf.com/doc/110x72/5b5e37827f8b9a310a8c033a/structure-union-jgyan-programming-compatibility-modepdf-structure-data.jpg)


![lecture 11 public goods new 2010.ppt€¦ · , X1,X 2,Y ˙ • ... Microsoft PowerPoint - lecture 11 public goods new 2010.ppt [Compatibility Mode] Author: david Created Date: 6/7/2010](https://static.cupdf.com/doc/110x72/5f2510eb2ee13f530a7a688e/lecture-11-public-goods-new-2010ppt-x1x-2y-a-microsoft-powerpoint.jpg)


