Compass Financial Stability and Savings Program Pilot Evaluation: Final Report March 2014 Prepared for Compass Working Capital Boston, MA Prepared by Delia Kimbrel, Research Associate Sandra Venner, Policy Director Institute on Assets and Social Policy The Heller School for Social Policy and Management Brandeis University, Waltham, MA

Welcome message from author
This document is posted to help you gain knowledge. Please leave a comment to let me know what you think about it! Share it to your friends and learn new things together.
Transcript
Compass Financial Stability and Savings Program
Pilot Evaluation: Final Report
March 2014
Prepared for
Compass Working Capital Boston, MA
Prepared by
Delia Kimbrel, Research Associate Sandra Venner, Policy Director
Institute on Assets and Social Policy The Heller School for Social Policy and Management
Brandeis University, Waltham, MA
Compass Working Capital (“Compass”) provides incentive-based financial coaching and savings programs that help low-income families access opportunities, build assets, and achieve their financial aspirations. More broadly, Compass seeks to catalyze and expand asset building opportunities for low-income families by sharing innovative, replicable ideas that help place families on the pathway to economic security.
89 South Street, Suite 203 || Boston, MA 02111 || 617.790.0810
100 Munroe Street || Lynn, MA 01902 || 781.584.4355 www.compassworkingcapital.org
Institute on Assets and Social Policy (IASP), Brandeis University (IASP) is a research institute at the Heller School for Social Policy and Management at Brandeis University, dedicated to promoting a better understanding of how assets and asset-building opportunities improve the well-being and financial stability of individuals and families left out of the economic mainstream. IASP pursues its mission through original research, policy analysis, program evaluation, technical assistance, community engagement, organizational capacity building, and leadership development.
Institute on Assets and Social Policy, Heller School for Social Policy and Management
Brandeis University, 415 South Street, Mailstop 035, Waltham, MA 02454 Phone (781) 736-8685 www.iasp.brandeis.edu
Compass Financial Stability and Savings Program
Pilot Evaluation: Final Report
March 2014
Prepared for
Compass Working Capital 89 South Street, Suite 203, Boston, MA 02111
Prepared by
Delia Kimbrel, Research Associate Sandra Venner, Policy Director
Institute on Assets and Social Policy The Heller School for Social Policy and Management
Brandeis University, 415 South Street, Waltham, MA 02454
Acknowledgement The authors would like to gratefully acknowledge Alicia Atkinson, Milagros Ramirez, Eduardo Undurraga, and Callie Watkins, IASP Graduate Research Assistants, who provided valuable assistance to this project over the years. We would also like to thank all of the families in the FSS program who participated in this project for their time, sincerity and openness about their experience in the program. We would like to extend our appreciation to the staff members at Compass Working Capital, Lynn Housing Authority & Neighborhood Development (LHAND) and Cambridge Housing Authority (CHA) for assisting this research through their time and valuable program information. We are also grateful to our colleagues at IASP, especially Thomas Shapiro, Director, for his critical advice throughout the project, Martha Cronin, Research Associate, for data analysis support, and Charity Adams, Department Coordinator, for her helpful insight and support for completion of the reports.
EXECUTIVE SUMMARY FOR COMPASS FSS MULTI-YEAR EVALUATION
Overview
Innovative financial security and asset-building programs are being implemented in federal rental assistance programs with the goal of providing families with a comprehensive set of supports for economic advancement. Compass Working Capital (Compass) and other similar programs aim to support families in their efforts to grow their income, manage finances, and build savings and assets ––all important components that assist in advancing upward mobility. With the particular goal of helping low-income families in subsidized housing save and build assets, the Compass Financial Stability and Savings Programs (Compass FSS and Compass FSS+) are leading asset-building demonstration programs for the U.S. Department of Housing and Urban Development (HUD) Family Self-Sufficiency program.
The HUD Family Self-Sufficiency (FSS) program was enacted by Congress in 1990 and is designed to help families living in public housing and those using Housing Choice Vouchers (HCV, formerly known as Section 8) progress toward self-sufficiency by reducing disincentives to working and assisting low-income families acquire valuable savings over a five year period. The FSS program combines (a) stable affordable housing with (b) case management services to help families access services needed to pursue employment and achieve other goals, and (c) an escrow account that grows as families’ earnings increase.
Through successful partnerships with two housing authorities in Massachusetts–first with Lynn Housing Authority and Neighborhood Development (LHAND) and more recently with the Cambridge Housing Authority (CHA)–Compass has designed a potentially higher impact model for the FSS program for families receiving Housing Choice Vouchers and living in public housing. The program Compass developed for FSS draws on its experience with Individual Development Accounts, as well as best practices in FSS programs across the country. The program is distinguished by an emphasis on effective outreach and recruitment, the provision of financial education, individualized financial coaching, strategic use of escrow funds, and focused asset-building strategies to deliver better long-term financial outcomes and assists families in subsidized housing achieve economic security.
Research Highlights for Compass FSS and FSS+ Programs
Extensive qualitative research and quantitative data collection made it possible to conduct a more comprehensive multi-year assessment of program results than standard FSS program reporting. The research evaluation of the Compass FSS programs conducted by the Institute on Assets and Social Policy at Brandeis University provided an opportunity to explore the value of an asset-building variation using existing self-sufficiency program in the context of subsidized housing over a three-year demonstration period.
Compass FSS Program in Lynn, MA
The evaluation for the first year studied the operations of Compass’ innovative model for the FSS program at LHAND in Lynn, MA since its beginning in September 2010. Key highlights from the
first year review of the Compass FSS program illustrated that critical to initiating the Compass model was the development of a trusting relationship with the local housing authority. That relationship is reliant on a philosophy of empowering participants, an agreement for accountability, and a shared commitment to the partnership. 1
The analysis documented Compass’ creative marketing and outreach strategy. Early results demonstrated promising lessons for recruitment and enrollment for a program that is traditionally hindered by poor promotion and limited take-up. Compass’ targeted and strategic outreach utilized creative imagery and inspirational messaging and allowed Compass to reach their enrollment target and increase the penetration rate to approximately 21% of the eligible population in Lynn in the first three years, a figure that significantly outpaces the national average.2
Demographic data for the 76 participants enrolled by the end of the first year show that families were predominantly female-headed with children, primarily self-identified as Hispanic, and three-quarters had at least a high school diploma. Financial data at baseline showed that 89% were at least partially employed, yet roughly a third had below poverty level-incomes, the majority suffered from credit and debt issues, and most experienced economic strain and worried about money. Interim results at six months, however, revealed very encouraging participant outcomes with growth in earned income, savings, and credit, as well as improved financial confidence and economic well-being.3
The promising findings from the first year also carried into the second year. The second year evaluation illustrated that Compass found LHAND to be an accommodating and flexible partner which allowed for effective coordination and successful implementation of the program possible. Likewise, LHAND continued to rely on Compass’ expertise and core competencies related to effective recruitment, financial education and coaching, and strong philosophical orientation toward asset-building to guide program development. 4
By September 2012, enrollment in Compass FSS had increased to 110 participants in Lynn, MA. Early reporting illustrated several marked financial improvements for the 52 participants with complete data at their one-year point.
• Participants at their 12-month point experienced increased earned income and decreased reliance on public benefits while raising their credit score and lowering their total debt.
• Results also revealed a significant increase in practices related to timely payment of bills, establishing financial goals and keeping track of income and spending.
• Participants also reported experiencing less economic strain, feeling increased optimism about the future, and engaging more frequently in credit repair and active savings behavior.5
Two more recent studies of the performance of Compass FSS in Lynn further suggest the added value of integrating asset-building components into the FSS model. This is evident from the continued income growth demonstrated by the Compass FSS population in contrast to comparable 1 Kimbrel, D., (2011). Compass Financial Stability and Savings Program Pilot Evaluation. Institute on Assets and Social Policy, Brandeis University. http://iasp.brandeis.edu/capacity/evaluation.html 2 ibid 3 ibid 4 Kimbrel, D., (2013). Compass Financial Stability and Savings Program Pilot Evaluation: Second Year Report. Institute on Assets and Social Policy, Brandeis University. http://iasp.brandeis.edu/capacity/evaluation.html 5 ibid
non-FSS HCV voucher holders noted in the third year final report and from the encouraging early results of the first two Compass FSS program graduates who have moved on to become homeowners. Also, the preliminary results for an analysis of the return on investment indicates that for a modest investment of program funds, the Compass FSS program is starting to generate promising returns for society through reduced public benefits expenditures.
Compass FSS+ Program in Cambridge, MA
The preliminary research findings illustrate that Compass is on track to expand the scope and impact of the FSS program with the launch of their first replication effort in partnership with Cambridge Housing Authority (CHA) in September 2012. The partnership with CHA allows Compass to demonstrate replication capacity and competency in a larger market with different parameters. As one of the 34 housing authorities nationally participating in the HUD Moving to Work (MTW) initiative, CHA enjoys programming flexibility that “traditional” housing authorities lack. As a result of CHA’s MTW status, Compass has been able to implement important program modifications, including simplifying key elements of the FSS program. Compass ability to adapt and transfer many of the resources, strategies, policies and documents developed with LHAND to the Cambridge model demonstrates Compass’ ability to effectively replicate the Compass FSS model to other locations.6
Recruitment activity during the first year in Cambridge resulted in 81 or 8% of those eligible enrolled in the Compass FSS+ program. Participants reported high ratings of satisfaction and excitement with the financial education and coaching offered through the program. Participants for whom data were available at the six-month point in the program demonstrated marked improvement in their financial status for very encouraging early program outcomes:
• Nearly $2,000 average increase in annual earned income • Over $3,000 average reduction in annual value of public benefits • Modest increase in average credit scores, while experiencing a slight increase in total debt7
Implications for FSS Program Development, Policy and Research The findings from the multi-year study suggest important implications for program development, policy, and research. The successes in outreach and recruitment suggests the need for a more pronounced effort in this area in standard FSS programs to ensure the FSS opportunity is made available to eligible families in subsidized housing. The positive reception and results of inclusion of financial education focused on budgeting, spending, credit, debt, and saving suggests the value of incorporating a financial education component in the standard FSS programs. In addition, the importance of ongoing, customized financial coaching to help participants reach core economic benchmarks and long-term financial goals suggests the need for expanding beyond the standard case management model to include important economic objectives tailored to participants’ financial needs.
6 ibid 7 ibid
Collectively, the promising outcomes present in the Compass FSS model speak to the potential benefits of aligning FSS with key asset development strategies that focus on improving financial skills, optimizing escrow funds, and strategic use of escrow disbursements toward longer term asset building. These features should be further evaluated and explored in a variety of self-sufficiency and housing demonstration programs. Additionally, study findings suggest the need for increased supports for work and career advancement, as Compass participant’ frustrations with the job market and challenges to achieve career mobility is consistent with FSS participants across the country. Future research and evaluation will benefit from more experimental, random assignment and comparative analysis conducted with non-FSS participants and/or participants in a standard FSS program to measure the impact of the added value of the Compass FSS program and other higher impact models on important economic indicators. The comparative analysis in this study is limited and not as robust as would be desired as historically, limited and incomplete data makes such comparisons challenging. An experimental study currently being conducted by MDRC is expected to add much to the field in this area. But research conducted in this area will be greatly strengthened with improved data collection efforts by HUD. As a recent GAO study noted, much of the research on HUD programs is limited by large gaps in participant data, errors in data entry, inconsistently-applied program metrics, and poorly managed data systems. 8
The research landscape of innovative approaches linked to subsidized housing will also benefit from systematic follow-up studies conducted with FSS graduates to provide insight into what were the important factors for successful completion of the program. Follow-up analysis of graduates can help add to the understanding of whether FSS programs can deliver long-term positive outcomes for families that are sustained after program graduation.
Lastly, Compass’ partnership with the Cambridge Housing Authority, with its Moving-to-Work status, encourages further examination of the program design within slightly different parameters. A thorough analysis of the implementation and program delivery of innovative FSS models at different locations and regions will add to the learning of what features and components work best under different conditions as well as what enhancements can be made to produce greater economic outcomes for families in subsidized housing.
8 Emple 2013; GAO: HUD Report. 2013
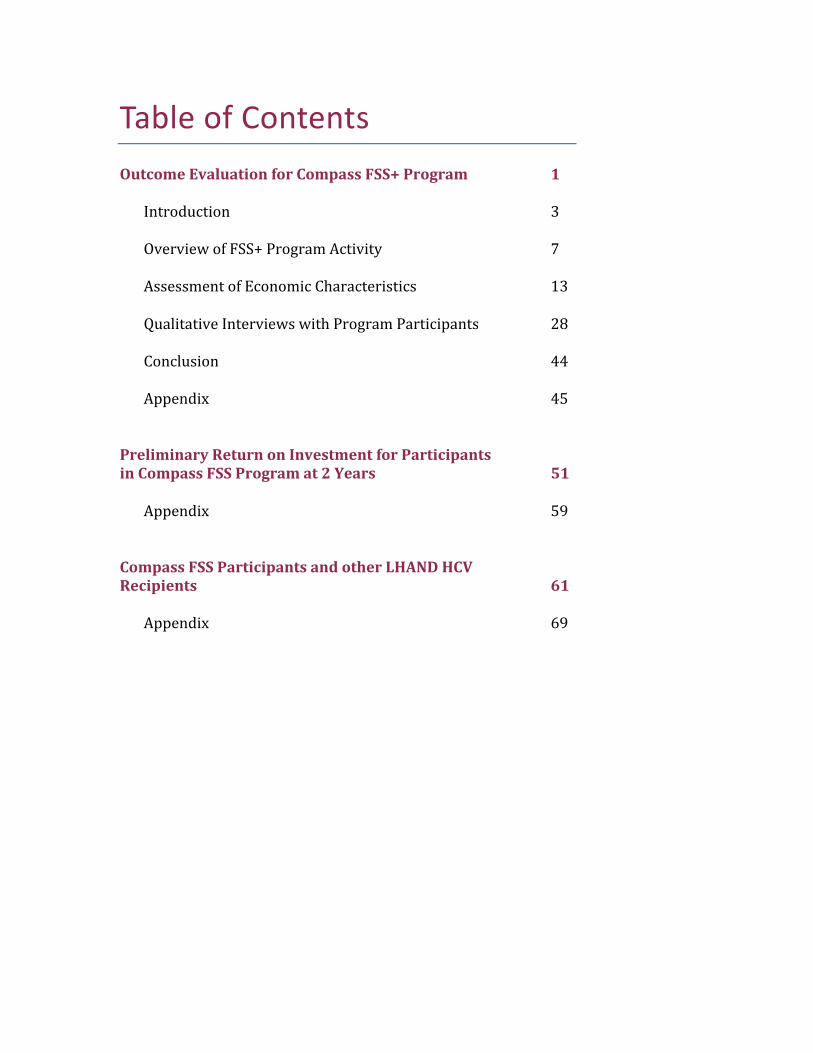
Table of Contents Outcome Evaluation for Compass FSS+ Program 1
Introduction 3 Overview of FSS+ Program Activity 7 Assessment of Economic Characteristics 13 Qualitative Interviews with Program Participants 28 Conclusion 44 Appendix 45
Preliminary Return on Investment for Participants in Compass FSS Program at 2 Years 51
Appendix 59 Compass FSS Participants and other LHAND HCV Recipients 61
Appendix 69

OUTCOME EVALUATION FOR COMPASS FSS+ PROGRAM
“Compass is dedicated to help people get out of
being stuck.”
“I am not a spender.
My husband is though. So I’ve been
showing him everything that I am learning and he has started to cut back.
Now we have a strict budget—that is the
most important.”
“The program is positive. It has a positive focus on
personal budgeting and building up
finances, and you know that somebody there cares…I get a
different feel at Compass than with my experience with
other programs.”
“In the second (coaching session), it
was really about seeing my progress, I was very pleased to
see how I was improving already”
Outcome Evaluation for Compass FSS+ Program 1

Outcome Evaluation for Compass FSS+ Program 2

OUTCOME EVALUATION FOR COMPASS FSS+ PROGRAM
Introduction The subsidized housing system often serves the most vulnerable segments of the U.S. population, providing rental assistance to more than five million households struggling to afford rising hosing costs with their limited incomes. While the primary objective of federal-rental assistance is to prevent homelessness and provide housing stability, in recent decades there have been calls to position housing as a platform for achieving broader socioeconomic goals. These goals have largely emphasized greater work, self-sufficiency and freedom from public assistance. Recognizing that families need a comprehensive set of supports in their pursuit for economic advancement, organizations are implementing innovative financial security and asset building strategies in an effort to help families achieve greater economic mobility. These programs are designed to help individuals and families grow their income, manage finances, and build a safety net through strategies such as financial education, coaching and matched-savings accounts to increase savings and asset holdings. The emphasis on economic security and asset building within these programs is consistent with the growing recognition that increasing financial capability along with savings and assets play a critical role in breaking the cycle of poverty and has the potential to promote financial well-being across the life span.1
I. Overview of the Research Study
Aimed at helping low-income families save and build assets, the Compass Financial Stability and Savings Program (Compass FSS) is an innovative variation of the U.S. Department of Housing and Urban Development (HUD) Family Self-Sufficiency (FSS) program. Created in 1990, the HUD FSS program is an employment and savings program for families who receive federal housing assistance with the intent of helping families progress toward self-sufficiency by reducing disincentives to working and assisting low-income families to build valuable savings. Through successful partnerships with two housing authorities in Massachusetts–first with Lynn Housing and Neighborhood Development (LHAND) and more recently with the Cambridge Housing Authority (CHA)–Compass designed a potentially higher impact model for the FSS program for families receiving Housing Choice Vouchers (HCV, formerly known as Section 8) and living in public housing. The Compass FSS program is distinguished by the provision of financial education, financial coaching, and asset building strategies to deliver better long-term financial outcomes and help families in subsidized housing achieve economic security.
The current study represents the final reports for the multi-year evaluation conducted by the Institute on Assets and Social Policy (IASP) at Brandeis University. The first report introduced Compass’ innovative, asset-building model for the FSS program first implemented at LHAND in Lynn, MA. It included a process analysis related to program implementation that detailed the extensive planning and design phase, satisfaction with and effectiveness of program delivery, and how the program evolved. The second report presented updated findings from economic and
1 Mckernan and Sherraden 2008; Shapiro and Wolff 2001; Sherraden 1991
Outcome Evaluation for Compass FSS+ Program 3
qualitative data related to program delivery, demographic and economic characteristics, preliminary outcomes at key stages of program participation, and examination of financial practices and well-being over the first two-years of the Compass FSS program pilot. Initial results of the implementation analysis as well as participant-level and survey data collected within the first two years of program launch showed that the program demonstrated impressive successes in recruitment, enrollment, and retention, as well as early participant gains in income, savings, credit, and financial confidence.
This final reporting phase examines more closely several aspects of the Compass FSS program to add to the learning from the quantitative and qualitative outcome analysis to-date. The final products of this evaluation study include:
• Analysis of non-FSS HCV participants in Lynn, MA compared to the demographic and economic characteristics of FSS participants at the end of the second year in the Compass FSS program to assess the added value of the Compass model on important economic measures.2
• Preliminary assessment of the return on investment of the Compass FSS program based on changes in participants’ utilization of public benefits after two years in the program in Lynn, MA.
• Summary of demographic and economic characteristics captured at baseline for participants in the Compass FSS+ program in Cambridge, MA, the first replication effort of the Compass FSS program. This analysis also examines early economic outcomes related to income, employment, credit and debt, and asset accumulation, as well as program effects on financial practices and perceptions of financial security and well-being for Compass FSS+ participants after six months in the program.
These reports conclude this research study of Compass FSS program activity since its launch in September 2010. The learning throughout the course of the evaluation primarily speak to three objectives: 1) to determine if there is a more effective way to implement the standard FSS program to deliver consistently strong outcomes and ensure families move towards economic security; 2) to demonstrate the importance of ongoing, customized financial coaching to help participants reach core economic benchmarks; and 3) to understand the potential benefits of aligning FSS with key asset development strategies focused on improving financial skills, optimizing escrow funds, and strategic use of escrow disbursements toward longer term asset building. The findings highlighted throughout the study suggest important implications for program, policy, and practice and the value of innovative approaches to self-sufficiency programs for residents in subsidized housing.
II. New Approach to Family Self-Sufficiency Program Overview of HUD’s Family Sel f -Suf f i c i ency Program The HUD Family Self-Sufficiency (FSS) program is designed to help families living in public housing and those using Housing Choice Vouchers progress toward self-sufficiency by reducing disincentives to increased work effort and assisting low-income families acquire valuable savings
2 Regrettably, this comparison is not as robust as desired due to limited and incomplete data which has also been true for past FSS research studies in this area.
Outcome Evaluation for Compass FSS+ Program 4
over a five-year period. The FSS program was enacted by Congress in 1990 and is administered by state and local public housing agencies (PHAs). FSS combines (a) stable affordable housing with (b) case management services to help families access services needed to pursue employment and achieve other goals, and (c) an escrow account that grows as families’ earnings grow. The escrow account functions as both an asset-building vehicle and a tangible financial incentive for families to increase their earnings. It creates a structure for residents to save the money that would otherwise go toward an increase in rent that occurs when earnings increase. Participants can withdraw the money in the escrow account upon successful completion of the program and there are no restrictions in its use. HUD reimburses PHAs for FSS escrow costs and through an annual application process, provides limited funding for FSS coordinator positions based on enrollment patterns at the PHA. Housing authorities are expected to cover other costs associated with recruitment, ongoing communications with FSS clients, and any additional programming. HUD runs two FSS programs: one within the Section 8 Housing Choice Voucher (HCV) program and the other within the public housing programs. Taken together the FSS program serves roughly 57,087 families nationally.3 FSS Program Development at Compass Working Capital Founded in 2005, Compass Working Capital is a non profit organization that provides incentive-based savings and financial coaching programs that empower working, low-income families to build assets, achieve their financial goals, and become financially secure. In seeking new ways to further its work with low-income families, Compass has designed a potentially higher impact model for the FSS program. It is predicated on the theory of change that providing incentives, access to opportunities, and quality financial coaching for motivated, low-income families will help them achieve economic security. Compass engaged in extensive research and concluded that FSS escrow accounts offer low-income families an enormous saving and asset-building opportunity. However, too many families are unaware of the great potential of the FSS program and often miss optimizing the savings structure for long-term gain. For Compass, the central questions are: What if the FSS program, which has demonstrated some success in helping low income families increase their income, was run by trained financial coaches who can assist clients in charting a path to economic stability with clear benchmarks and accountability? Could the program then help families optimize their escrow dollars toward asset building purposes? Could it empower participants to build their credit, strengthen their financial capabilities, and invest in their future? Compass FSS Program Model Compass sought to develop a replicable program model that could expand the scope and impact of FSS programs, locally and nationally. Compass rebranded its FSS program as the “Financial Stability and Savings Program” to reflect a fresh perspective on the opportunities it presents. The program Compass developed for FSS draws on its experience with Individual Development Accounts (IDAs), as well as best practices in FSS programs across the country. Figure 1, on the next page, presents the added value of a Compass FSS model compared to what the standard FSS program offers. While incorporating the basic elements of the FSS program, Compass seeks to also align FSS with key asset development strategies. Major additional program features include:
3 FY 14 FSS HUD Congressional Justification. Public and Indian Housing Family Self-Sufficiency Program 2014 Summary Statement and Initiatives. http://portal.hud.gov/hudportal/HUD?src=/program_offices/public_indian_housing/programs/hcv/fss.
Outcome Evaluation for Compass FSS+ Program 5
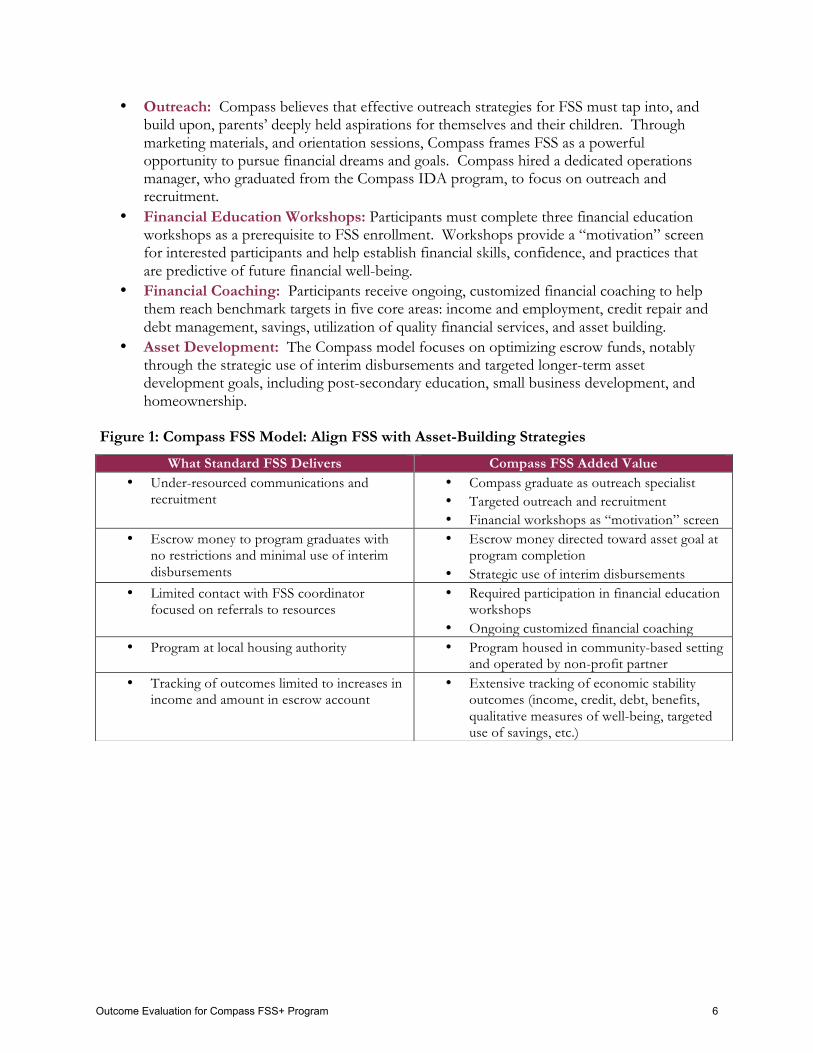
• Outreach: Compass believes that effective outreach strategies for FSS must tap into, and build upon, parents’ deeply held aspirations for themselves and their children. Through marketing materials, and orientation sessions, Compass frames FSS as a powerful opportunity to pursue financial dreams and goals. Compass hired a dedicated operations manager, who graduated from the Compass IDA program, to focus on outreach and recruitment.
• Financial Education Workshops: Participants must complete three financial education workshops as a prerequisite to FSS enrollment. Workshops provide a “motivation” screen for interested participants and help establish financial skills, confidence, and practices that are predictive of future financial well-being.
• Financial Coaching: Participants receive ongoing, customized financial coaching to help them reach benchmark targets in five core areas: income and employment, credit repair and debt management, savings, utilization of quality financial services, and asset building.
• Asset Development: The Compass model focuses on optimizing escrow funds, notably through the strategic use of interim disbursements and targeted longer-term asset development goals, including post-secondary education, small business development, and homeownership.
Figure 1: Compass FSS Model: Align FSS with Asset-Building Strategies
What Standard FSS Delivers Compass FSS Added Value • Under-resourced communications and
recruitment • Compass graduate as outreach specialist • Targeted outreach and recruitment • Financial workshops as “motivation” screen
• Escrow money to program graduates with no restrictions and minimal use of interim disbursements
• Escrow money directed toward asset goal at program completion
• Strategic use of interim disbursements • Limited contact with FSS coordinator
focused on referrals to resources
• Required participation in financial education workshops
• Ongoing customized financial coaching • Program at local housing authority • Program housed in community-based setting
and operated by non-profit partner • Tracking of outcomes limited to increases in
income and amount in escrow account • Extensive tracking of economic stability
outcomes (income, credit, debt, benefits, qualitative measures of well-being, targeted use of savings, etc.)
Outcome Evaluation for Compass FSS+ Program 6
OVERVIEW OF COMPASS FSS+ PROGRAM ACTIVITY
I. Compass FSS+ Program Development at Cambridge Housing Authority
Building on the early success of the Compass FSS program in Lynn, Compass launched a replication effort in partnership with the Cambridge Housing Authority (CHA), the fourth largest housing authority in Massachusetts. The partnership with CHA provides Compass with the opportunity to demonstrate proof of concept in a larger urban market and also positions Compass for broader policy influence at the federal level. After a six month planning phase, Compass launched the FSS+ program with CHA in September of 2012. Similar to LHAND, CHA sees their role beyond the provision of just affordable housing. They view housing as a platform for economic mobility that can have a transformational effect on a family’s economic advancement. Not having an existing FSS program, CHA entered the Compass FSS partnership seeking new ways to provide their voucher households with asset-building resources, and the financial education and coaching needed to achieve greater economic security. The arrangements that were developed and tested with LHAND guided the implementation of the Compass FSS+ program with CHA. The experience, skills and knowledge Compass acquired for effective coordination and flow of information were also applied to the launch of the FSS+ program. CHA brings to the partnership an infrastructure that can sustain and advance the FSS model and a strong information technology capacity to document results that can inform future policy development. As one of 34 housing authorities nationally participating in the HUD Moving to Work (MTW) initiative, CHA enjoys programming flexibility that “traditional” housing authorities lack. MTW status permits a housing authority to take a progressive approach in the development of locally based solutions to the issues surrounding low-income housing. This autonomy helps to fuel innovation, including CHA’s renewed focus on subsidized housing as a platform to promote family self-sufficiency. Specifically, CHA’s MTW status enabled Compass to implement three key modifications to the traditional “FSS” model and its own earlier variation on FSS including:
• Establish 50/50 “shared escrow” model, a concept developed by Jeffrey Lubell and Reid Cramer4, which is designed to promote program scale and long-term sustainability. (See section on Savings Goals and Escrow Accumulat ion for more detailed explanation.)
• Restrict escrow funds to be used toward asset building purposes for those who continue to receive HCV rental assistance after graduating from the program.
• Simplify the escrow calculation by removing the HUD Standard Income Limits to enable higher income families to build savings in the program.
Compass’ ability to adapt and transfer many of the resources, strategies, policies and documents developed with LHAND to the Cambridge model expedited program implementation and demonstrates the potential for replication of the Compass FSS model in other locations.
4 See Cramer, Reid & Jeff Lubell, (2011). “Taking Asset Building and Earnings Incentives to Scale in HUD-Assisted Rental Housing.” Washington, D.C. New America Foundation.
Outcome Evaluation for Compass FSS+ Program 7
II. Key Program Components Outreach and Recrui tment An important element of the Compass FSS+ program launch in Cambridge, MA was the creative marketing and outreach campaign. Drawing on the learning and recruitment successes in Lynn, Compass adapted and transferred their marketing materials to another community with a different demographic and racial make-up. Compass relied on targeted outreach and strategic marketing to recruit participants for the Compass FSS+ program. Building on marketing research from the Doorways to Dreams Fund,5 Compass used persistent and repeated mailings of postcards with inspirational messages, creative imaging, and quotes and stories from other participants to capture the attention of those longing to own a home, go to college, start a small business, or rebuild their credit. Outreach strategies also include word of mouth, referrals made via HCV case representatives and leasing agents, as well as promotional activities conducted at community events. Compass seeks to enroll 25% of eligible HCV participants at each partner site. Nationally, the FSS program serves just one percent of the roughly five million households participating in federal subsidized housing,6 even though about half are potential candidates for the program. To-date Compass has enrolled 8%7 of targeted households in Cambridge, exceeding both the state and national average for FSS program enrollment at this stage. Financial Educat ion Workshops Financial education is considered by many proponents of asset building to be the critical component when nested in an asset development program. Over the past five years, Compass experimented with how best to deliver meaningful, high impact financial education. Compass recently redesigned and streamlined its approach to financial education to focus on helping participants develop core financial competencies that are re-enforced and built on through financial coaching. The workshops for FSS are designed to help participants understand their own financial behaviors, develop and practice new financial skills, and build confidence––all of which contribute to greater financial stability. The first class covers goal setting and budgeting where participants identify and understand their own beliefs about money. The workshop aims to increase participants’ financial confidence and to equip participants with skills and knowledge to track income and spending and achieve their financial goals. In the second session, participants learn how to build and repair credit, pay off debt, and how to obtain and review a credit report. In the final workshop, participants learn the importance of building savings and assets. This workshop teaches participants about the value of building an emergency savings account and empowers participants to compare, select and maintain high quality savings products to help them reach their financial goals. Emotional buy-in is
5 Bourdeau, Maya & Nick Maynard. (2007).A Picture in Your Mind’s Eye: How LMI Individuals See Money and Savings. A Study by the D2D Fund. 6 Emple, Hannah. (2013). New America Foundation. Asset Building Program. Asset-Oriented Rental Assistance: Next Generation Reforms for HUD’s Family Self-Sufficiency Program. U.S. Government Accountability Office. 2013. Rental Housing Assistance: HUD Data on Self-Sufficiency Programs Should Be Improved. GAO-13-581. July 9, 2013. Washington, D.C.: GAO. 7 This calculation is based on 1,000 out of the 2,063 HCV holders served by CHA who are non-elderly and non-disabled.
Outcome Evaluation for Compass FSS+ Program 8
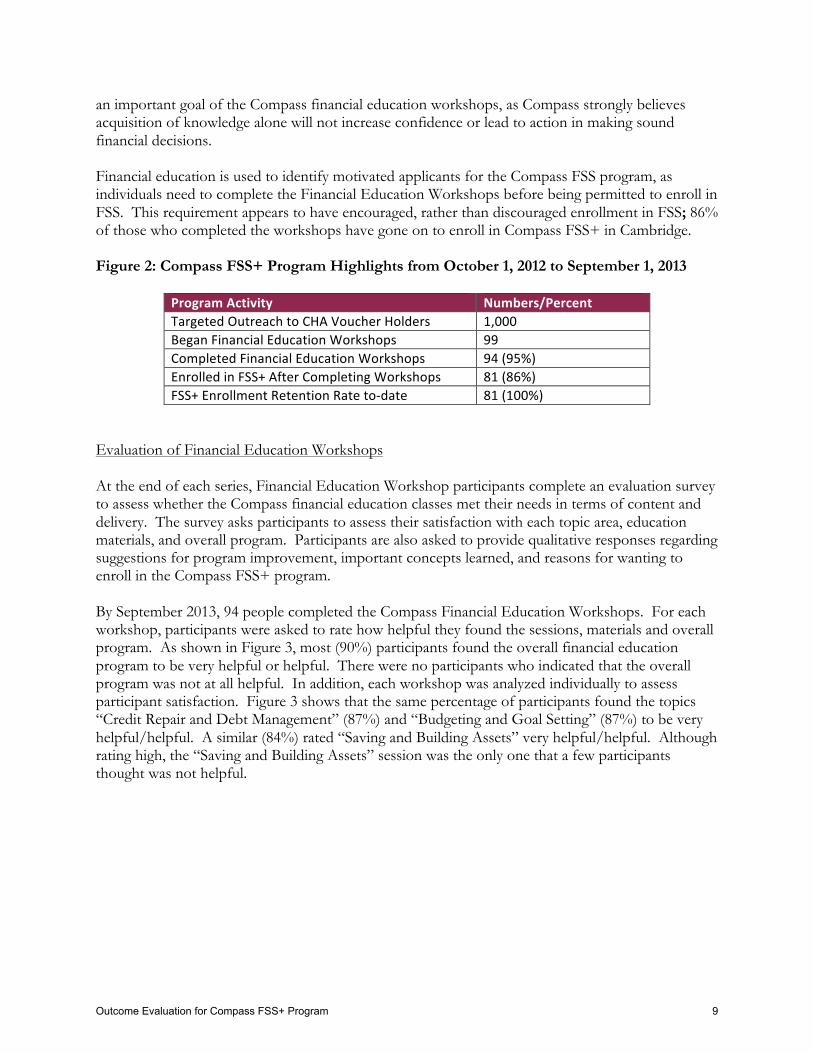
an important goal of the Compass financial education workshops, as Compass strongly believes acquisition of knowledge alone will not increase confidence or lead to action in making sound financial decisions. Financial education is used to identify motivated applicants for the Compass FSS program, as individuals need to complete the Financial Education Workshops before being permitted to enroll in FSS. This requirement appears to have encouraged, rather than discouraged enrollment in FSS; 86% of those who completed the workshops have gone on to enroll in Compass FSS+ in Cambridge. Figure 2: Compass FSS+ Program Highlights from October 1, 2012 to September 1, 2013
Program Activity Numbers/Percent Targeted Outreach to CHA Voucher Holders 1,000 Began Financial Education Workshops 99 Completed Financial Education Workshops 94 (95%) Enrolled in FSS+ After Completing Workshops 81 (86%) FSS+ Enrollment Retention Rate to-‐date 81 (100%)
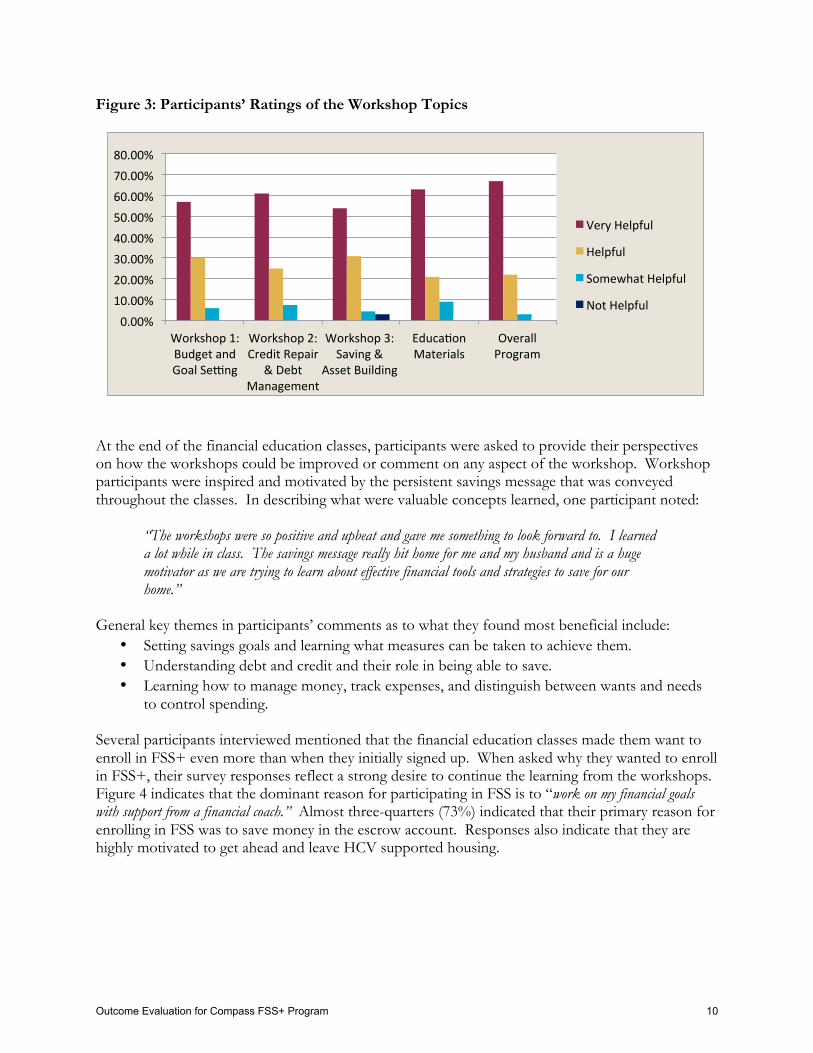
Evaluation of Financial Education Workshops At the end of each series, Financial Education Workshop participants complete an evaluation survey to assess whether the Compass financial education classes met their needs in terms of content and delivery. The survey asks participants to assess their satisfaction with each topic area, education materials, and overall program. Participants are also asked to provide qualitative responses regarding suggestions for program improvement, important concepts learned, and reasons for wanting to enroll in the Compass FSS+ program. By September 2013, 94 people completed the Compass Financial Education Workshops. For each workshop, participants were asked to rate how helpful they found the sessions, materials and overall program. As shown in Figure 3, most (90%) participants found the overall financial education program to be very helpful or helpful. There were no participants who indicated that the overall program was not at all helpful. In addition, each workshop was analyzed individually to assess participant satisfaction. Figure 3 shows that the same percentage of participants found the topics “Credit Repair and Debt Management” (87%) and “Budgeting and Goal Setting” (87%) to be very helpful/helpful. A similar (84%) rated “Saving and Building Assets” very helpful/helpful. Although rating high, the “Saving and Building Assets” session was the only one that a few participants thought was not helpful.
Outcome Evaluation for Compass FSS+ Program 9
0.00% 10.00% 20.00% 30.00% 40.00% 50.00% 60.00% 70.00% 80.00%
Workshop 1: Budget and Goal SeSng
Workshop 2: Credit Repair
& Debt Management
Workshop 3: Saving &
Asset Building
EducaYon Materials
Overall Program
Very Helpful
Helpful
Somewhat Helpful
Not Helpful
Figure 3: Participants’ Ratings of the Workshop Topics
At the end of the financial education classes, participants were asked to provide their perspectives on how the workshops could be improved or comment on any aspect of the workshop. Workshop participants were inspired and motivated by the persistent savings message that was conveyed throughout the classes. In describing what were valuable concepts learned, one participant noted:
“The workshops were so positive and upbeat and gave me something to look forward to. I learned a lot while in class. The savings message really hit home for me and my husband and is a huge motivator as we are trying to learn about effective financial tools and strategies to save for our home.”
General key themes in participants’ comments as to what they found most beneficial include:
• Setting savings goals and learning what measures can be taken to achieve them. • Understanding debt and credit and their role in being able to save. • Learning how to manage money, track expenses, and distinguish between wants and needs
to control spending. Several participants interviewed mentioned that the financial education classes made them want to enroll in FSS+ even more than when they initially signed up. When asked why they wanted to enroll in FSS+, their survey responses reflect a strong desire to continue the learning from the workshops. Figure 4 indicates that the dominant reason for participating in FSS is to “work on my financial goals with support from a financial coach.” Almost three-quarters (73%) indicated that their primary reason for enrolling in FSS was to save money in the escrow account. Responses also indicate that they are highly motivated to get ahead and leave HCV supported housing.
Outcome Evaluation for Compass FSS+ Program 10
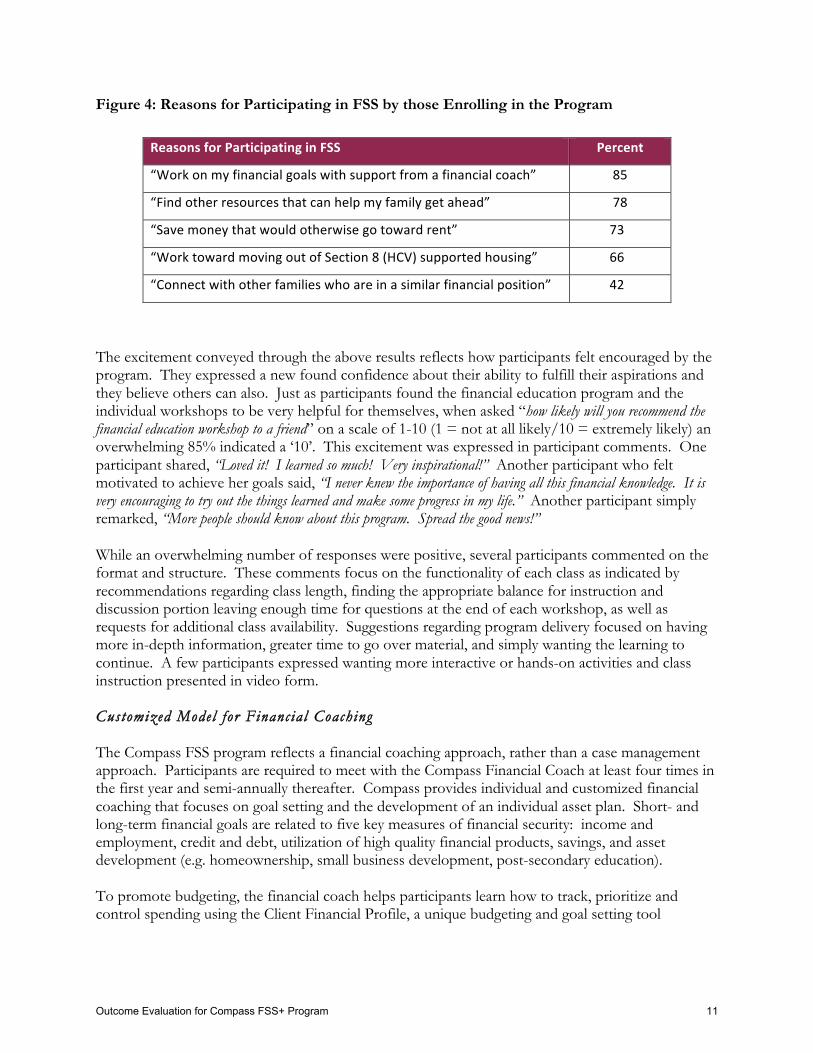
Figure 4: Reasons for Participating in FSS by those Enrolling in the Program The excitement conveyed through the above results reflects how participants felt encouraged by the program. They expressed a new found confidence about their ability to fulfill their aspirations and they believe others can also. Just as participants found the financial education program and the individual workshops to be very helpful for themselves, when asked “how likely will you recommend the financial education workshop to a friend” on a scale of 1-10 (1 = not at all likely/10 = extremely likely) an overwhelming 85% indicated a ‘10’. This excitement was expressed in participant comments. One participant shared, “Loved it! I learned so much! Very inspirational!” Another participant who felt motivated to achieve her goals said, “I never knew the importance of having all this financial knowledge. It is very encouraging to try out the things learned and make some progress in my life.” Another participant simply remarked, “More people should know about this program. Spread the good news!” While an overwhelming number of responses were positive, several participants commented on the format and structure. These comments focus on the functionality of each class as indicated by recommendations regarding class length, finding the appropriate balance for instruction and discussion portion leaving enough time for questions at the end of each workshop, as well as requests for additional class availability. Suggestions regarding program delivery focused on having more in-depth information, greater time to go over material, and simply wanting the learning to continue. A few participants expressed wanting more interactive or hands-on activities and class instruction presented in video form. Customized Model for Financial Coaching The Compass FSS program reflects a financial coaching approach, rather than a case management approach. Participants are required to meet with the Compass Financial Coach at least four times in the first year and semi-annually thereafter. Compass provides individual and customized financial coaching that focuses on goal setting and the development of an individual asset plan. Short- and long-term financial goals are related to five key measures of financial security: income and employment, credit and debt, utilization of high quality financial products, savings, and asset development (e.g. homeownership, small business development, post-secondary education). To promote budgeting, the financial coach helps participants learn how to track, prioritize and control spending using the Client Financial Profile, a unique budgeting and goal setting tool
Reasons for Participating in FSS Percent
“Work on my financial goals with support from a financial coach” 85
“Find other resources that can help my family get ahead” 78
“Save money that would otherwise go toward rent” 73
“Work toward moving out of Section 8 (HCV) supported housing” 66
“Connect with other families who are in a similar financial position” 42
Outcome Evaluation for Compass FSS+ Program 11
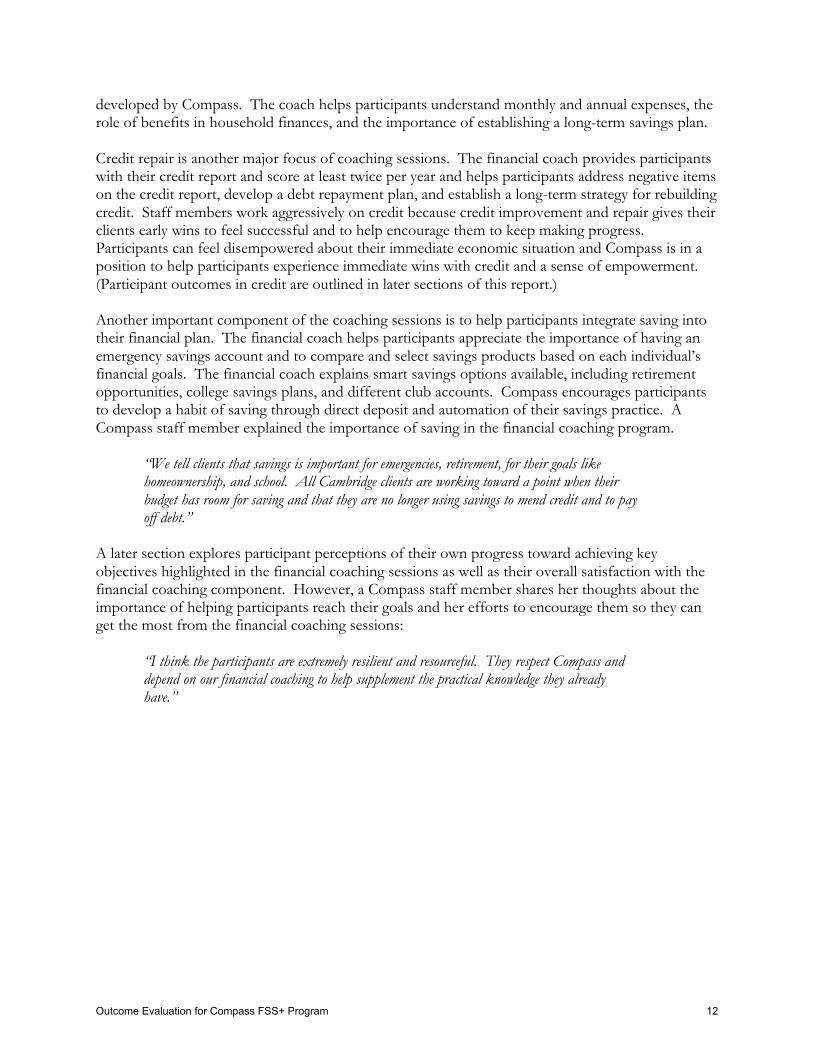
developed by Compass. The coach helps participants understand monthly and annual expenses, the role of benefits in household finances, and the importance of establishing a long-term savings plan. Credit repair is another major focus of coaching sessions. The financial coach provides participants with their credit report and score at least twice per year and helps participants address negative items on the credit report, develop a debt repayment plan, and establish a long-term strategy for rebuilding credit. Staff members work aggressively on credit because credit improvement and repair gives their clients early wins to feel successful and to help encourage them to keep making progress. Participants can feel disempowered about their immediate economic situation and Compass is in a position to help participants experience immediate wins with credit and a sense of empowerment. (Participant outcomes in credit are outlined in later sections of this report.) Another important component of the coaching sessions is to help participants integrate saving into their financial plan. The financial coach helps participants appreciate the importance of having an emergency savings account and to compare and select savings products based on each individual’s financial goals. The financial coach explains smart savings options available, including retirement opportunities, college savings plans, and different club accounts. Compass encourages participants to develop a habit of saving through direct deposit and automation of their savings practice. A Compass staff member explained the importance of saving in the financial coaching program.
“We tell clients that savings is important for emergencies, retirement, for their goals like homeownership, and school. All Cambridge clients are working toward a point when their budget has room for saving and that they are no longer using savings to mend credit and to pay off debt.”
A later section explores participant perceptions of their own progress toward achieving key objectives highlighted in the financial coaching sessions as well as their overall satisfaction with the financial coaching component. However, a Compass staff member shares her thoughts about the importance of helping participants reach their goals and her efforts to encourage them so they can get the most from the financial coaching sessions:
“I think the participants are extremely resilient and resourceful. They respect Compass and depend on our financial coaching to help supplement the practical knowledge they already have.”
Outcome Evaluation for Compass FSS+ Program 12
ASSESSMENT OF ECONOMIC CHARACTERISTICS
This section presents early findings and individual level outcomes of Compass FSS+ program participants who enrolled in the Compass FSS+ program with Cambridge Housing Authority between November 1, 2012 and September 1, 2013. These findings address the evaluation question: Is there a more e f f e c t ive way to implement the s tandard FSS program to de l iver consis tent ly s trong outcomes and ensure famil i es use this opportunity to move towards economic secur i ty? The study also establishes the baseline economic indicators to answer the second research questions: Does the Compass FSS program del iver long- term posi t ive outcomes for famil i es that are sustained af ter program graduat ion? The analysis examines key demographic and economic outcomes related to income, employment, asset accumulation, as well as early program effects on financial practices and perceptions of financial security and well-being. Economic indicators tracked since baseline provide the means by which to measure progress toward core Compass FSS program objectives:
• Increase in income
• Credit score of 680 or higher
• Debt-to income ratio less than 15%
• Sustained pattern of savings
• Utilization of quality financial services and products
• Increase in sense of financial well-being
• Investment in assets
I. Data Sources and Methods The data sources used in this analysis include participant-level administrative and program data, as well as survey data collected from the Financial Practices and Well-being Survey and from the Financial Education Post-Workshop Survey. Part i c ipant-Leve l Administrat ive Data To provide information about the characteristics of FSS+ participants, Compass collected baseline economic and demographic data at program enrollment. This was obtained from the pre-application forms, FSS enrollment materials, and other sources such as pay stubs, credit reports, and public benefit documents. Participant information was entered into the Compass tracking software, Outcome Tracker. Demographic variables include: gender, race, ethnicity, marital status, age, and household size. Economic Variables include: employment status, years employed, employment income in typical month, cash public benefits and non-cash benefits, years in Section 8 (HCV), and total annual household income, along with financial status information such as credit score and debt sources and amounts.
Outcome Evaluation for Compass FSS+ Program 13
Account-level escrow data obtained from Compass provided detailed information on individual escrow balances and timing of escrow deposits for enrolled participants. Specifically, this data documented the monthly account history from participants’ first month of enrollment through the end of the first year of program activity in Cambridge. All Compass program participants were asked to complete the Financial Practices and Well-being Survey administered at the first financial education workshop session. The survey is designed to assess participants’ financial confidence, skills, self-efficacy, past and present use of positive and negative financial services, and perceived financial security and well-being. The survey was constructed drawing from several previously validated survey instruments commonly used in savings and asset-building research. Survey items are self-reported and are primarily dichotomous yes/no questions or measured at the ordinal level (i.e. five-point scale from strongly agree to strongly disagree). The survey was developed by IASP and Compass staff and pre-tested with 15 Compass Individual Development Account program participants and later modified to further clarify questions. Participants were also asked to complete the Financial Education Post-Workshop Survey administered at the conclusion of financial education training. Questions in this survey include select financial confidence and practice items designed to measure changes after completion of the workshops. Those who completed the Financial Practice and Well-being Survey include participants currently enrolled in the Compass FSS+ program, those who completed the financial education workshops but chose not to enroll in the Compass FSS+ program, and those who dropped out of the financial education workshops. These baseline questions were administered by Compass program staff between October 1, 2012 and September 1, 2013. The survey was also administered annually to measure change over time in participant perceptions. The analysis presented in this report includes only data from participants who enrolled in the Compass FSS+ program in the first year at Cambridge Housing Authority (N=81). (The 13 individuals who completed the workshops, but opted not to enroll in FSS at this time constitute too small a cohort for which to conduct a separate statistical analysis.) II. Compass FSS+ Participant Demographic and Economic Status Character i s t i c s o f Compass FSS+ Part i c ipants Key characteristics of the 81 Compass FSS+ participants at program enrollment were as follows:
• Enrollees were predominantly female (91%). They ranged in age from 20-63 years, with a median age of 44.
• 55% identified as African-American/Black, 16% identified as Caucasian/White, 1% identified as Asian, 4.9% indicated multi-race and 20% indicated other as their racial identity.
• Average household size was 2.6 with the majority being single-headed families with children.
• Only 4% of Compass FSS+ participants had less than a high school diploma or GED.
• 28% of participants had attended some college education and 40% had an Associate’s degree or higher.
Outcome Evaluation for Compass FSS+ Program 14
• The average length of time Compass FSS+ participants had spent in the Housing Choice Voucher (HCV) program is 6.6 years.
• 74% were working at the time they entered the FSS program, with 63% of all working participants working full-time and the rest part-time.
It is important to provide context for how the Compass FSS+ participants compare to other FSS participants. Compared to a sample of 4,828 participants in 99 FSS programs and a tracking sample of 181 FSS participants highlighted in the 2011 HUD FSS evaluation, Compass FSS+ participants had higher annual incomes, higher employment rates, and higher educational attainment than the FSS enrollees cited in that report8. This is important to note as this particular study suggests that those who entered the FSS program with higher education, employment, and income were more likely to achieve their program goals. On the other hand, higher participant economic indicators in Massachusetts are tempered by the higher cost of living in this state. It is expected that some Compass FSS+ participants will face serious challenges in attaining good employment and work advancement as 19% are currently unemployed (five participants are either a student or employment status is unknown). (See Table 1 in Appendix.) Income and Publ i c Assis tance Over three-quarters (77%) of Compass FSS+ participants report receiving some income from formal employment and another 17% had income from self-employment in the past year. Among those employed at program entry, the average annual earned income was $29,353. However, nearly 40% of all Compass FSS+ participants reported monthly employment income less than $1,500. The earned income at baseline for Compass FSS+ participants placed them solidly among the ranks of low-income in Cambridge where median household income (2008-2012) is $72,225. In fact, 37% of families in the FSS+ program had incomes below $19,530, the poverty rate for a family of three. This is substantially more than the 13.9% of families with children that fell under the poverty line in the city of Cambridge in 2012.9 (See Table 2 in Appendix.) However, some participants had additional income supports available to their families. These include child support, unemployment insurance, retirement pension, or income from friends and family. Many receive other public benefits in addition to their housing subsidy. The average amount participants received annually in public benefits at enrollment was $18,968. The greatest contributor to this is their housing subsidy from CHA with an average monthly benefit of $975. More than half of the participants also receive assistance from the Supplemental Nutrition Assistance Program (SNAP, formerly known as food stamps). Some Compass participants also receive TANF, SSI, or assistance from other income support programs. The fact that only (1) person is receiving TANF assistance is noteworthy since a family must stop receiving TANF assistance for a period of 12 months to graduate from the FSS program. (See Table 3 in Appendix.) 8 United States. Dept. of Housing and Urban Development. Office of Policy Development and Research., Planmatics, and Abt Associates. Evaluation of the Family Self-Sufficiency Program: Prospective Study. [Washington, D.C.]: U.S Dept. of Housing and Urban Development, Office of Policy Development and Research, 2011. 9 Source U.S. Census Bureau: State and County QuickFacts. Data derived from Population Estimates, American Community Survey, Census of Population and Housing, County Business Patterns, Economic Census, Survey of Business Owners, Building Permits, Census of Governments.
Outcome Evaluation for Compass FSS+ Program 15
Credit and Debt In today’s economy, a good credit score is an important financial asset that allows families to access resources and plays a pivotal role in a household’s capacity to maintain financial security. Good credit helps families handle emergencies, get a mortgage to buy a home, or invest in a business or education. In addition, credit can also affect one’s access to affordable rental housing, employment opportunities, and access to low-cost financial products. Families with a good credit rating will pay approximately $250,000 less in interest throughout their working lives than those without savings that could go towards building assets.10 A critical component of the Compass FSS+ program is to help participants increase their credit score and reduce their debt burden. The Compass program communicates to participants that ‘prime’ credit is characterized by achieving a credit score of at least 680 and non-mortgage debt-to-income ratio less than 15%. Only a quarter (26%) met the credit score benchmark at baseline. The best-known and most widely used credit score model in the United States is the FICO score (named for Fair, Isaac and Company, the business that develops the credit scoring formulas). The classic FICO score is between 300 and 850 with 60% of people falling between 650 and 799. According to Debt.org, in early 2012, Massachusetts’s residents had an average FICO credit score of 680. An analysis of the credit status of Compass FSS+ program participants revealed that for the 76 participants who had credit scores recorded at baseline the mean score was 636. (See Table 4 in Appendix.) In addition, low-income families often struggle with high levels of consumer and household debt. In the Compass FSS+ program, the average total debt burden for participants at program enrollment was $20,587. Sixty percent of all Compass participants had debt greater than $5,000; more than a third (37%) of those owing more than $5,000 had employment income less than $1,500 a month. Credit card debt is the most common source of debt (77%) with an average credit debt burden of $4,392. In addition, (43%) of all participants had student loan debt, averaging $29,493, which is above the national student loan average. Nearly half (49%) had debt in collections. (See Table 4 in Appendix.)
Debt- to-Income Ratio Many low-income families across the country owe a significant amount of money relative to their income. Like credit score and debt information, the debt-to-income ratio is an important measure to use to track participants’ progress toward financial security. Debt-to-income ratio is a standard, personal finance measure that calculates how much current debt a participant owes relative to his/her income. Non-current debt (such as collection debt) is not included in this calculation. The Compass FSS+ program aims to help participants achieve and maintain a debt-to-income ratio under 15%. The average debt-to-income ratio for all participants at baseline is 16%, with 84% of participants having a debt-to-income ratio less than 15%. For half of all participants, the debt-to-income ratio calculation is zero, but this may be deceiving. Although the majority of participants met the Compass target debt-to-income benchmark at baseline, it was primarily a reflection of the fact that many of Compass participants (49%) had collection debt, which is not reflected in the debt-to-income ratio. The debt-to-income ratio must be interpreted alongside data cited above related to 10 (Richey 2011; Oklahoma Policy Institute).
Outcome Evaluation for Compass FSS+ Program 16
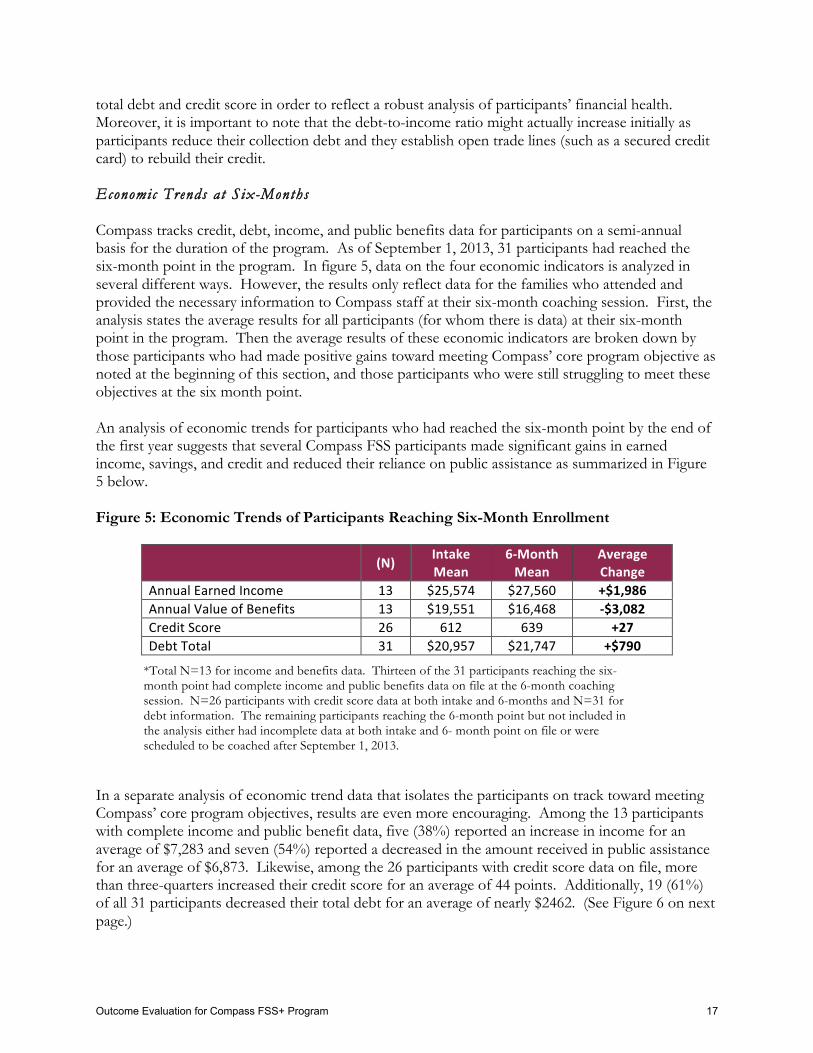
total debt and credit score in order to reflect a robust analysis of participants’ financial health. Moreover, it is important to note that the debt-to-income ratio might actually increase initially as participants reduce their collection debt and they establish open trade lines (such as a secured credit card) to rebuild their credit. Economic Trends at Six-Months Compass tracks credit, debt, income, and public benefits data for participants on a semi-annual basis for the duration of the program. As of September 1, 2013, 31 participants had reached the six-month point in the program. In figure 5, data on the four economic indicators is analyzed in several different ways. However, the results only reflect data for the families who attended and provided the necessary information to Compass staff at their six-month coaching session. First, the analysis states the average results for all participants (for whom there is data) at their six-month point in the program. Then the average results of these economic indicators are broken down by those participants who had made positive gains toward meeting Compass’ core program objective as noted at the beginning of this section, and those participants who were still struggling to meet these objectives at the six month point. An analysis of economic trends for participants who had reached the six-month point by the end of the first year suggests that several Compass FSS participants made significant gains in earned income, savings, and credit and reduced their reliance on public assistance as summarized in Figure 5 below. Figure 5: Economic Trends of Participants Reaching Six-Month Enrollment
(N) Intake Mean
6-‐Month Mean
Average Change
Annual Earned Income 13 $25,574 $27,560 +$1,986 Annual Value of Benefits 13 $19,551 $16,468 -‐$3,082 Credit Score 26 612 639 +27 Debt Total 31 $20,957 $21,747 +$790
*Total N=13 for income and benefits data. Thirteen of the 31 participants reaching the six-month point had complete income and public benefits data on file at the 6-month coaching session. N=26 participants with credit score data at both intake and 6-months and N=31 for debt information. The remaining participants reaching the 6-month point but not included in the analysis either had incomplete data at both intake and 6- month point on file or were scheduled to be coached after September 1, 2013.
In a separate analysis of economic trend data that isolates the participants on track toward meeting Compass’ core program objectives, results are even more encouraging. Among the 13 participants with complete income and public benefit data, five (38%) reported an increase in income for an average of $7,283 and seven (54%) reported a decreased in the amount received in public assistance for an average of $6,873. Likewise, among the 26 participants with credit score data on file, more than three-quarters increased their credit score for an average of 44 points. Additionally, 19 (61%) of all 31 participants decreased their total debt for an average of nearly $2462. (See Figure 6 on next page.)
Outcome Evaluation for Compass FSS+ Program 17

Figure 6: Economic Trends of Participants on Track to Meet Core Economic Objectives
*In cases where numbers in Figures 6 and 7 do not total (N), it is because some individuals experienced no change in these categories.
While the gains made by the participants already on track toward meeting economic benchmarks in the Compass program are substantial, the full picture shows that there was a subset of participants struggling to meet core program objectives. Figure 7 below illustrates that a small number of participants reaching the six-month point had a reduction in earned income and a few had an increase in public benefits. Regrettably, six households experienced a drop in credit score after six months in the Compass FSS program and 10 households experienced an increase in total debt with an average of over $7,000. These negative trends may reflect the difficulty some FSS participants had securing steady employment or advancing at work during a weak economy, or that they had experienced a financial emergency or other economic shock. In the next section, the qualitative interviews highlight some of the challenges participants had encountered. Figure 7: Economic Trends of Participants Not on Track to Meet Core Economic Objectives
% (N) Intake Mean
6-‐Month Mean
Average Change
Annual Earned Income 31% 4/13 $1,518.34 $1,297.67 -‐$221 Annual Value of Benefits 15% 2/13 $21,897.72 $25,918.74 +$4021 Credit Score 23% 6/26 617 589 -‐28 Debt Total 32% 10/31 $31,818 $38,944 +$7126
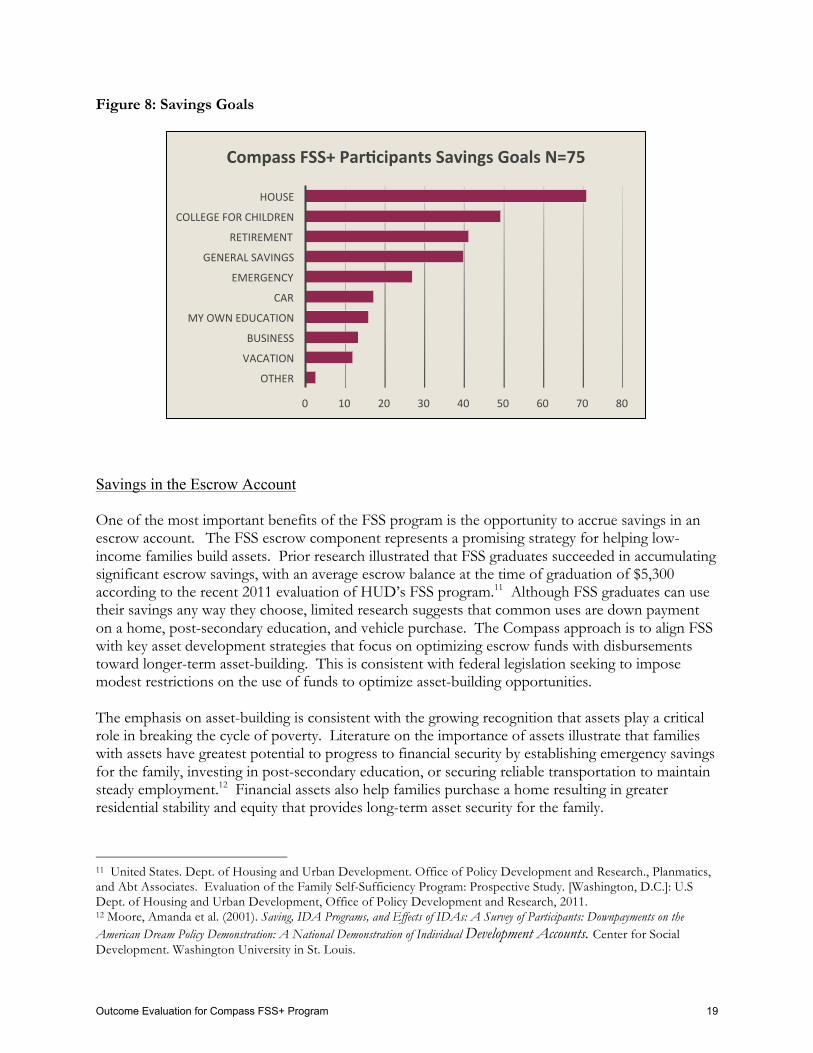
Savings Goals and Escrow Accumulat ion Savings Goals An important objective of the Compass FSS+ program is to promote savings and empower participants to utilize their FSS escrow account savings, as well as other personal savings, toward asset development purposes. When asked to indicate a savings goal, 75 participants identified a total of 225 savings goals. Saving for a house, followed by college for children, and saving for an emergency were the top three goals indicated as noted in Figure 8 below.
% (N)* Intake
Mean 6-‐Month Mean
Average Change
Annual Earned Income 38% 5/13 $28,767.6 $36,050 + $7,283 Annual Value of Benefits 54% 7/13 $21,445 $14,572 -‐$6,873 Credit Score 77% 20/26 610 654 +44 Debt Total 61% 19/31 $17,327 $14,865 -‐$2462
Outcome Evaluation for Compass FSS+ Program 18
0 10 20 30 40 50 60 70 80
OTHER
VACATION
BUSINESS
MY OWN EDUCATION
CAR
EMERGENCY
GENERAL SAVINGS
RETIREMENT
COLLEGE FOR CHILDREN
HOUSE
Compass FSS+ ParPcipants Savings Goals N=75
Figure 8: Savings Goals
Savings in the Escrow Account One of the most important benefits of the FSS program is the opportunity to accrue savings in an escrow account. The FSS escrow component represents a promising strategy for helping low-income families build assets. Prior research illustrated that FSS graduates succeeded in accumulating significant escrow savings, with an average escrow balance at the time of graduation of $5,300 according to the recent 2011 evaluation of HUD’s FSS program.11 Although FSS graduates can use their savings any way they choose, limited research suggests that common uses are down payment on a home, post-secondary education, and vehicle purchase. The Compass approach is to align FSS with key asset development strategies that focus on optimizing escrow funds with disbursements toward longer-term asset-building. This is consistent with federal legislation seeking to impose modest restrictions on the use of funds to optimize asset-building opportunities. The emphasis on asset-building is consistent with the growing recognition that assets play a critical role in breaking the cycle of poverty. Literature on the importance of assets illustrate that families with assets have greatest potential to progress to financial security by establishing emergency savings for the family, investing in post-secondary education, or securing reliable transportation to maintain steady employment.12 Financial assets also help families purchase a home resulting in greater residential stability and equity that provides long-term asset security for the family.
11 United States. Dept. of Housing and Urban Development. Office of Policy Development and Research., Planmatics, and Abt Associates. Evaluation of the Family Self-Sufficiency Program: Prospective Study. [Washington, D.C.]: U.S Dept. of Housing and Urban Development, Office of Policy Development and Research, 2011. 12 Moore, Amanda et al. (2001). Saving, IDA Programs, and Effects of IDAs: A Survey of Participants: Downpayments on the American Dream Policy Demonstration: A National Demonstration of Individual Development Accounts. Center for Social Development. Washington University in St. Louis.
Outcome Evaluation for Compass FSS+ Program 19
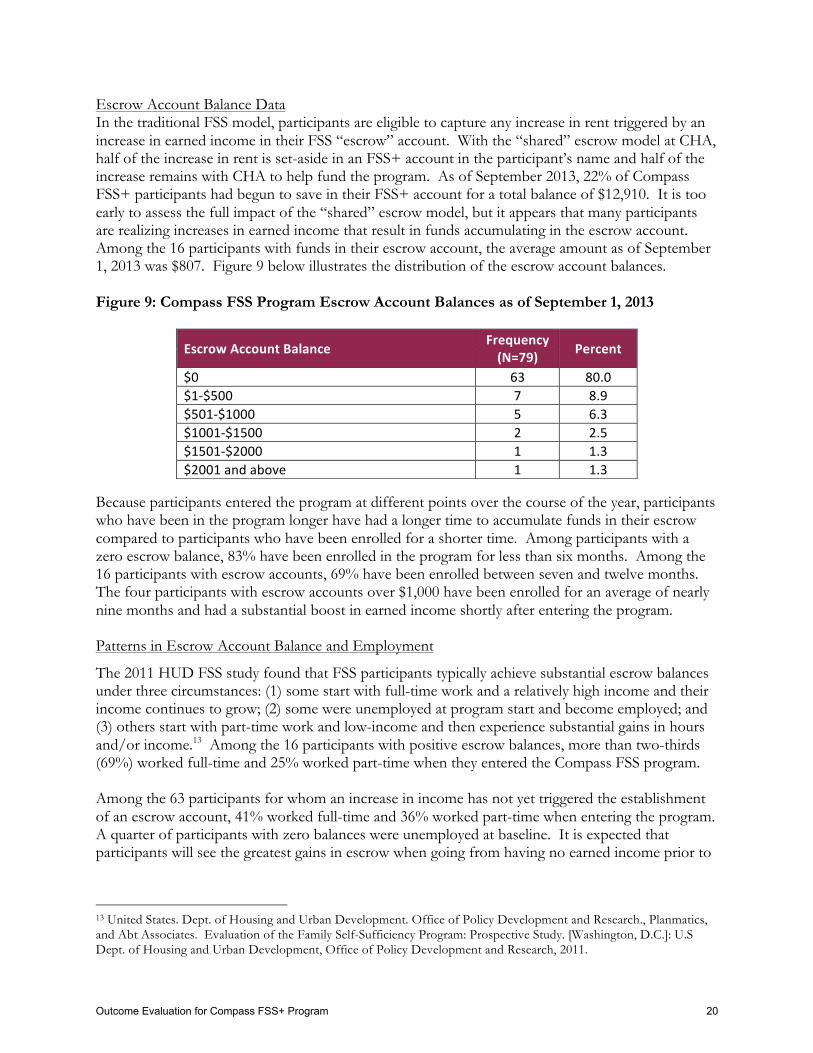
Escrow Account Balance Data In the traditional FSS model, participants are eligible to capture any increase in rent triggered by an increase in earned income in their FSS “escrow” account. With the “shared” escrow model at CHA, half of the increase in rent is set-aside in an FSS+ account in the participant’s name and half of the increase remains with CHA to help fund the program. As of September 2013, 22% of Compass FSS+ participants had begun to save in their FSS+ account for a total balance of $12,910. It is too early to assess the full impact of the “shared” escrow model, but it appears that many participants are realizing increases in earned income that result in funds accumulating in the escrow account. Among the 16 participants with funds in their escrow account, the average amount as of September 1, 2013 was $807. Figure 9 below illustrates the distribution of the escrow account balances. Figure 9: Compass FSS Program Escrow Account Balances as of September 1, 2013 Because participants entered the program at different points over the course of the year, participants who have been in the program longer have had a longer time to accumulate funds in their escrow compared to participants who have been enrolled for a shorter time. Among participants with a zero escrow balance, 83% have been enrolled in the program for less than six months. Among the 16 participants with escrow accounts, 69% have been enrolled between seven and twelve months. The four participants with escrow accounts over $1,000 have been enrolled for an average of nearly nine months and had a substantial boost in earned income shortly after entering the program. Patterns in Escrow Account Balance and Employment
The 2011 HUD FSS study found that FSS participants typically achieve substantial escrow balances under three circumstances: (1) some start with full-time work and a relatively high income and their income continues to grow; (2) some were unemployed at program start and become employed; and (3) others start with part-time work and low-income and then experience substantial gains in hours and/or income.13 Among the 16 participants with positive escrow balances, more than two-thirds (69%) worked full-time and 25% worked part-time when they entered the Compass FSS program. Among the 63 participants for whom an increase in income has not yet triggered the establishment of an escrow account, 41% worked full-time and 36% worked part-time when entering the program. A quarter of participants with zero balances were unemployed at baseline. It is expected that participants will see the greatest gains in escrow when going from having no earned income prior to
13 United States. Dept. of Housing and Urban Development. Office of Policy Development and Research., Planmatics, and Abt Associates. Evaluation of the Family Self-Sufficiency Program: Prospective Study. [Washington, D.C.]: U.S Dept. of Housing and Urban Development, Office of Policy Development and Research, 2011.
Escrow Account Balance Frequency (N=79) Percent
$0 63 80.0 $1-‐$500 7 8.9 $501-‐$1000 5 6.3 $1001-‐$1500 2 2.5 $1501-‐$2000 1 1.3 $2001 and above 1 1.3
Outcome Evaluation for Compass FSS+ Program 20
FSS participation to becoming employed and receiving earned income after enrolling in FSS. (See Table 5 in Appendix.) III. Compass FSS+ Participants’ Financial Practices, Confidence, and Well-Being Compass believes it is important to track participants’ use of financial products and services, along with their financial practices, confidence and well-being. Compass FSS+ participants complete a Financial Practices and Well-being Survey at intake, after the financial education workshops, and on an annual basis during their participation in the program. The survey was constructed drawing from several previously validated survey instruments commonly used in savings and asset building research. This section is a comparison of the responses from the 75 Cambridge participants who completed the survey both at baseline and post-workshop prior to September 1, 2013. These results document the impact of the Compass’ financial education workshops on participants’ financial practices, confidence and well-being. Financial Products and Servi ces at Program Entry Low-income households in the United States can face significant barriers to accessing mainstream banking services and pay high costs for conducting basic financial transactions through alternative financial service providers such as payday lenders, pawn shops, or check cashers. The Updated 2013 FDIC National Survey of Unbanked and Under-banked Households: Use of Alternative Financial Services revealed that one-quarter of all U.S. households have used at least one alternative financial service product in the past year, while 65% of unbanked or under-banked households have used such products in the past year.14 Inadequate access to bank accounts and use of high cost alternative financial services may undermine efforts to help families build assets and achieve financial security.15 Connecting families to optimal financial products and services is an important objective of the Compass FSS+ program. To better understand what financial products and services Compass FSS+ participants use, participants were asked several related questions about their past and present use of certain financial products and services in the baseline Financial Practices and Well-being Survey. Compass FSS+ participants appeared to be “banked” to a greater extent than the households reported in the FDIC survey. Most (92%) had a checking account, 65% had a savings account and 57% used direct deposit. Only 6.6% of Compass participants were “unbanked”. While 64% of Compass FSS+ participants had both a checking and savings account, 21% of participants’ still utilized alternative financial services such as payday loans, rent-to-own centers, check-cashers, tax Refund Anticipation Loans (RALs), or cash advances on credit cards. However, 42% of Compass FSS participants met the program’s benchmark goal for the utilization of quality financial products and services using two or more quality financial products (i.e. checking account, savings account, retirement account, etc.) and no negative financial products within the last year. (See Figure 10 below.)
14 Updated 2013 FDIC National Survey of Unbanked and Underbanked Households: Use of Alternative Financial Services , ,June 2013. 15 Barr, Michael (2004). Banking the Poor: Policies to Bring Low-Income Americans Into the Financial Mainstream. Washington, DC: The Brookings Institution.
Outcome Evaluation for Compass FSS+ Program 21
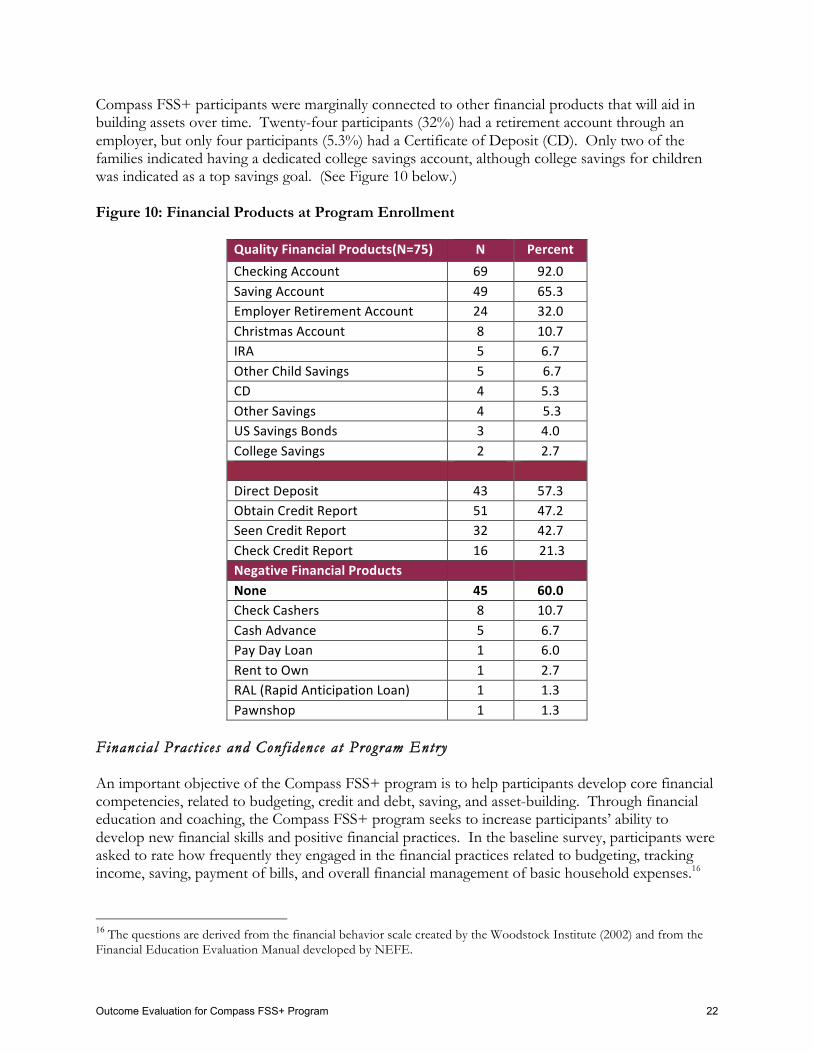
Compass FSS+ participants were marginally connected to other financial products that will aid in building assets over time. Twenty-four participants (32%) had a retirement account through an employer, but only four participants (5.3%) had a Certificate of Deposit (CD). Only two of the families indicated having a dedicated college savings account, although college savings for children was indicated as a top savings goal. (See Figure 10 below.) Figure 10: Financial Products at Program Enrollment
Quality Financial Products(N=75) N Percent Checking Account 69 92.0 Saving Account 49 65.3 Employer Retirement Account 24 32.0 Christmas Account 8 10.7 IRA 5 6.7 Other Child Savings 5 6.7 CD 4 5.3 Other Savings 4 5.3 US Savings Bonds 3 4.0 College Savings 2 2.7 Direct Deposit 43 57.3 Obtain Credit Report 51 47.2 Seen Credit Report 32 42.7 Check Credit Report 16 21.3 Negative Financial Products None 45 60.0 Check Cashers 8 10.7 Cash Advance 5 6.7 Pay Day Loan 1 6.0 Rent to Own 1 2.7 RAL (Rapid Anticipation Loan) 1 1.3 Pawnshop 1 1.3
Financial Pract i ces and Conf idence at Program Entry An important objective of the Compass FSS+ program is to help participants develop core financial competencies, related to budgeting, credit and debt, saving, and asset-building. Through financial education and coaching, the Compass FSS+ program seeks to increase participants’ ability to develop new financial skills and positive financial practices. In the baseline survey, participants were asked to rate how frequently they engaged in the financial practices related to budgeting, tracking income, saving, payment of bills, and overall financial management of basic household expenses.16
16 The questions are derived from the financial behavior scale created by the Woodstock Institute (2002) and from the Financial Education Evaluation Manual developed by NEFE.
Outcome Evaluation for Compass FSS+ Program 22
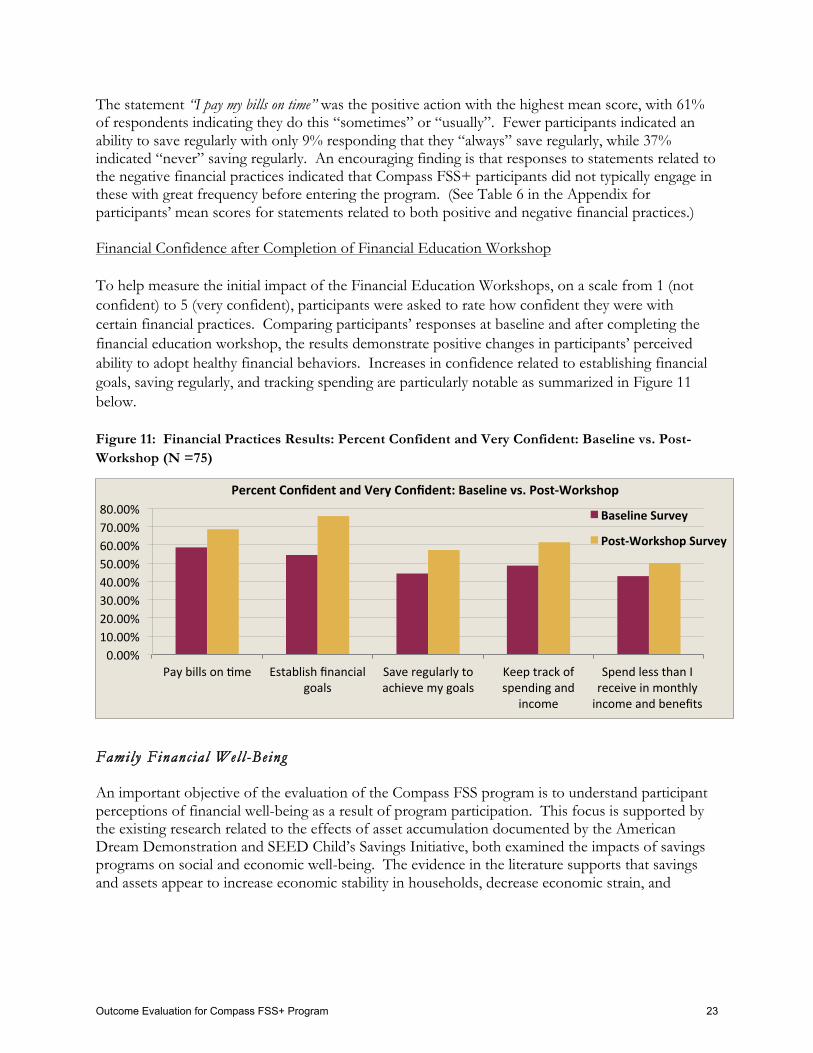
The statement “I pay my bills on time” was the positive action with the highest mean score, with 61% of respondents indicating they do this “sometimes” or “usually”. Fewer participants indicated an ability to save regularly with only 9% responding that they “always” save regularly, while 37% indicated “never” saving regularly. An encouraging finding is that responses to statements related to the negative financial practices indicated that Compass FSS+ participants did not typically engage in these with great frequency before entering the program. (See Table 6 in the Appendix for participants’ mean scores for statements related to both positive and negative financial practices.) Financial Confidence after Completion of Financial Education Workshop To help measure the initial impact of the Financial Education Workshops, on a scale from 1 (not confident) to 5 (very confident), participants were asked to rate how confident they were with certain financial practices. Comparing participants’ responses at baseline and after completing the financial education workshop, the results demonstrate positive changes in participants’ perceived ability to adopt healthy financial behaviors. Increases in confidence related to establishing financial goals, saving regularly, and tracking spending are particularly notable as summarized in Figure 11 below. Figure 11: Financial Practices Results: Percent Confident and Very Confident: Baseline vs. Post-Workshop (N =75) Family Financial Wel l -Being An important objective of the evaluation of the Compass FSS program is to understand participant perceptions of financial well-being as a result of program participation. This focus is supported by the existing research related to the effects of asset accumulation documented by the American Dream Demonstration and SEED Child’s Savings Initiative, both examined the impacts of savings programs on social and economic well-being. The evidence in the literature supports that savings and assets appear to increase economic stability in households, decrease economic strain, and
0.00% 10.00% 20.00% 30.00% 40.00% 50.00% 60.00% 70.00% 80.00%
Pay bills on Yme Establish financial goals
Save regularly to achieve my goals
Keep track of spending and
income
Spend less than I receive in monthly income and benefits
Percent Confident and Very Confident: Baseline vs. Post-‐Workshop
Baseline Survey
Post-‐Workshop Survey
Outcome Evaluation for Compass FSS+ Program 23
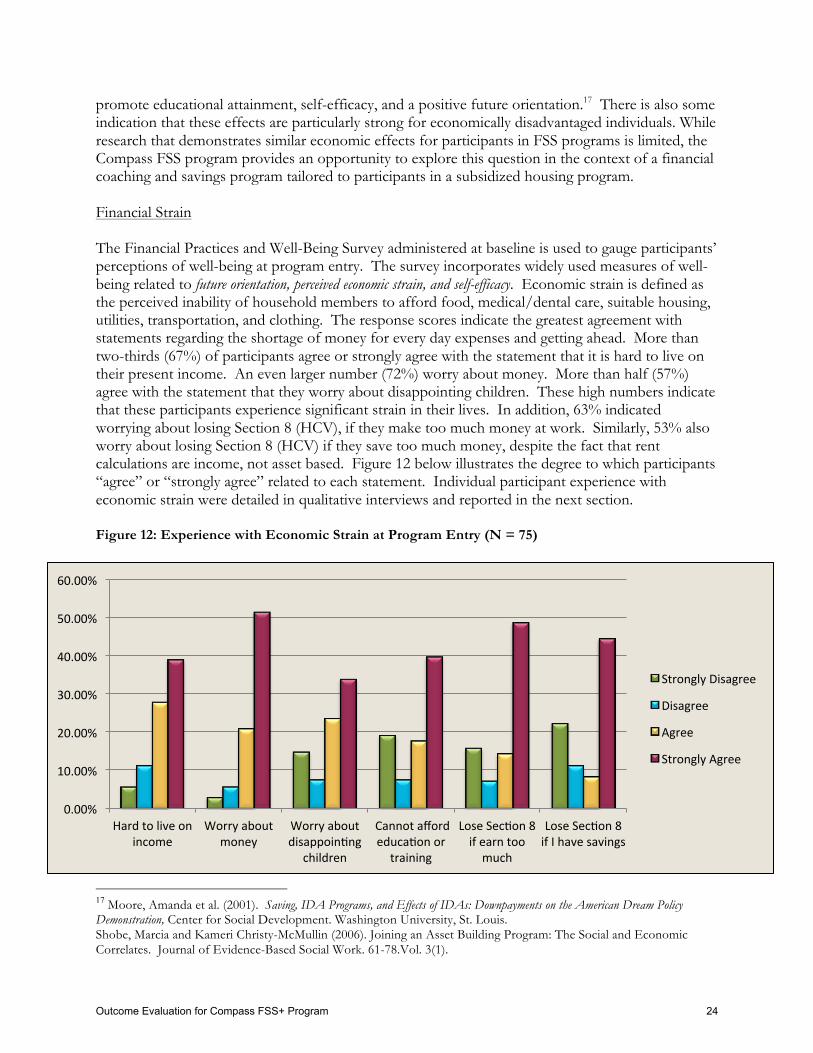
promote educational attainment, self-efficacy, and a positive future orientation.17 There is also some indication that these effects are particularly strong for economically disadvantaged individuals. While research that demonstrates similar economic effects for participants in FSS programs is limited, the Compass FSS program provides an opportunity to explore this question in the context of a financial coaching and savings program tailored to participants in a subsidized housing program. Financial Strain The Financial Practices and Well-Being Survey administered at baseline is used to gauge participants’ perceptions of well-being at program entry. The survey incorporates widely used measures of well-being related to future orientation, perceived economic strain, and self-efficacy. Economic strain is defined as the perceived inability of household members to afford food, medical/dental care, suitable housing, utilities, transportation, and clothing. The response scores indicate the greatest agreement with statements regarding the shortage of money for every day expenses and getting ahead. More than two-thirds (67%) of participants agree or strongly agree with the statement that it is hard to live on their present income. An even larger number (72%) worry about money. More than half (57%) agree with the statement that they worry about disappointing children. These high numbers indicate that these participants experience significant strain in their lives. In addition, 63% indicated worrying about losing Section 8 (HCV), if they make too much money at work. Similarly, 53% also worry about losing Section 8 (HCV) if they save too much money, despite the fact that rent calculations are income, not asset based. Figure 12 below illustrates the degree to which participants “agree” or “strongly agree” related to each statement. Individual participant experience with economic strain were detailed in qualitative interviews and reported in the next section. Figure 12: Experience with Economic Strain at Program Entry (N = 75)
17 Moore, Amanda et al. (2001). Saving, IDA Programs, and Effects of IDAs: Downpayments on the American Dream Policy Demonstration, Center for Social Development. Washington University, St. Louis. Shobe, Marcia and Kameri Christy-McMullin (2006). Joining an Asset Building Program: The Social and Economic Correlates. Journal of Evidence-Based Social Work. 61-78.Vol. 3(1).
0.00%
10.00%
20.00%
30.00%
40.00%
50.00%
60.00%
Hard to live on income
Worry about money
Worry about disappoinYng
children
Cannot afford educaYon or training
Lose SecYon 8 if earn too much
Lose SecYon 8 if I have savings
Strongly Disagree
Disagree
Agree
Strongly Agree
Outcome Evaluation for Compass FSS+ Program 24
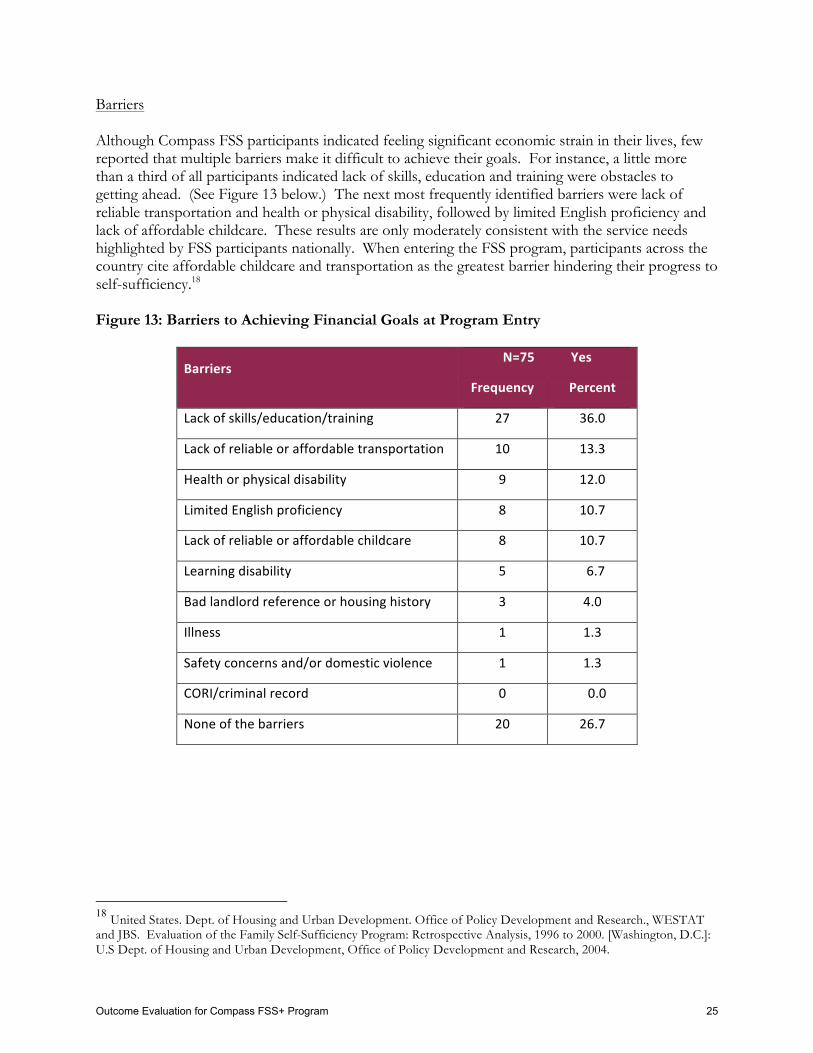
Barriers Although Compass FSS participants indicated feeling significant economic strain in their lives, few reported that multiple barriers make it difficult to achieve their goals. For instance, a little more than a third of all participants indicated lack of skills, education and training were obstacles to getting ahead. (See Figure 13 below.) The next most frequently identified barriers were lack of reliable transportation and health or physical disability, followed by limited English proficiency and lack of affordable childcare. These results are only moderately consistent with the service needs highlighted by FSS participants nationally. When entering the FSS program, participants across the country cite affordable childcare and transportation as the greatest barrier hindering their progress to self-sufficiency.18 Figure 13: Barriers to Achieving Financial Goals at Program Entry
Barriers N=75 Yes
Frequency Percent
Lack of skills/education/training 27 36.0
Lack of reliable or affordable transportation 10 13.3
Health or physical disability 9 12.0
Limited English proficiency 8 10.7
Lack of reliable or affordable childcare 8 10.7
Learning disability 5 6.7
Bad landlord reference or housing history 3 4.0
Illness 1 1.3
Safety concerns and/or domestic violence 1 1.3
CORI/criminal record 0 0.0
None of the barriers 20 26.7
18 United States. Dept. of Housing and Urban Development. Office of Policy Development and Research., WESTAT and JBS. Evaluation of the Family Self-Sufficiency Program: Retrospective Analysis, 1996 to 2000. [Washington, D.C.]: U.S Dept. of Housing and Urban Development, Office of Policy Development and Research, 2004.
Outcome Evaluation for Compass FSS+ Program 25
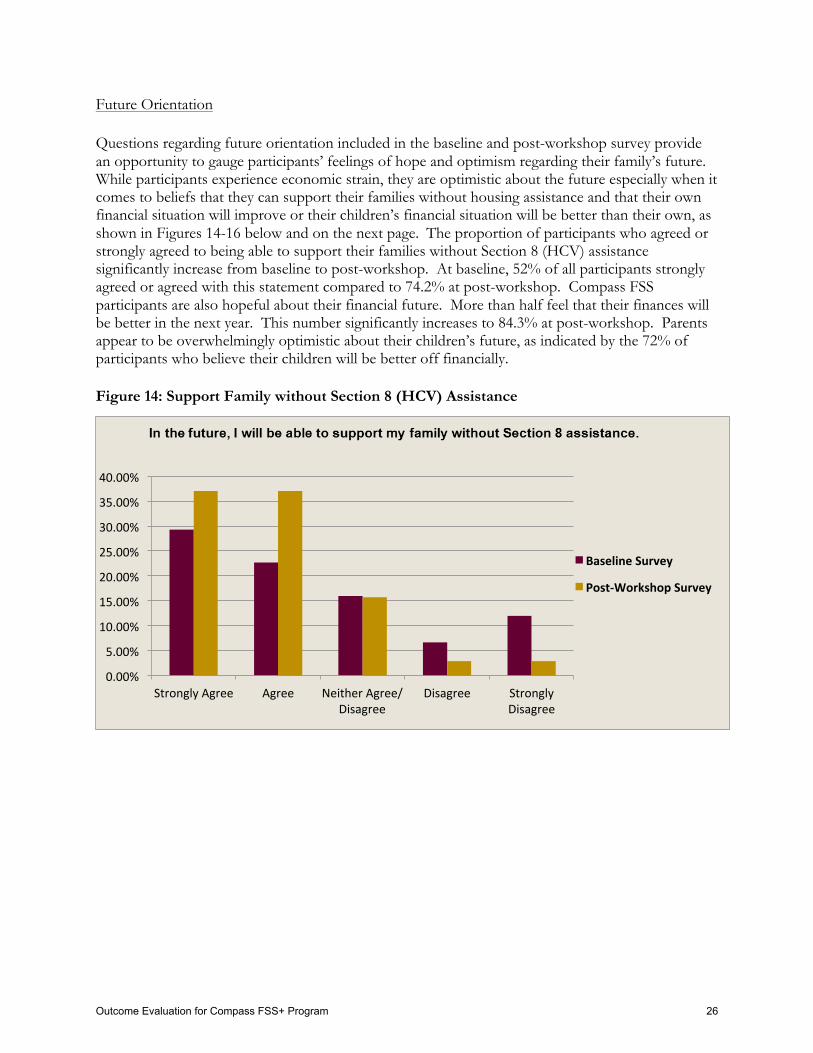
Future Orientation Questions regarding future orientation included in the baseline and post-workshop survey provide an opportunity to gauge participants’ feelings of hope and optimism regarding their family’s future. While participants experience economic strain, they are optimistic about the future especially when it comes to beliefs that they can support their families without housing assistance and that their own financial situation will improve or their children’s financial situation will be better than their own, as shown in Figures 14-16 below and on the next page. The proportion of participants who agreed or strongly agreed to being able to support their families without Section 8 (HCV) assistance significantly increase from baseline to post-workshop. At baseline, 52% of all participants strongly agreed or agreed with this statement compared to 74.2% at post-workshop. Compass FSS participants are also hopeful about their financial future. More than half feel that their finances will be better in the next year. This number significantly increases to 84.3% at post-workshop. Parents appear to be overwhelmingly optimistic about their children’s future, as indicated by the 72% of participants who believe their children will be better off financially. Figure 14: Support Family without Section 8 (HCV) Assistance
0.00%
5.00%
10.00%
15.00%
20.00%
25.00%
30.00%
35.00%
40.00%
Strongly Agree Agree Neither Agree/Disagree
Disagree Strongly Disagree
Baseline Survey
Post-‐Workshop Survey
Outcome Evaluation for Compass FSS+ Program 26
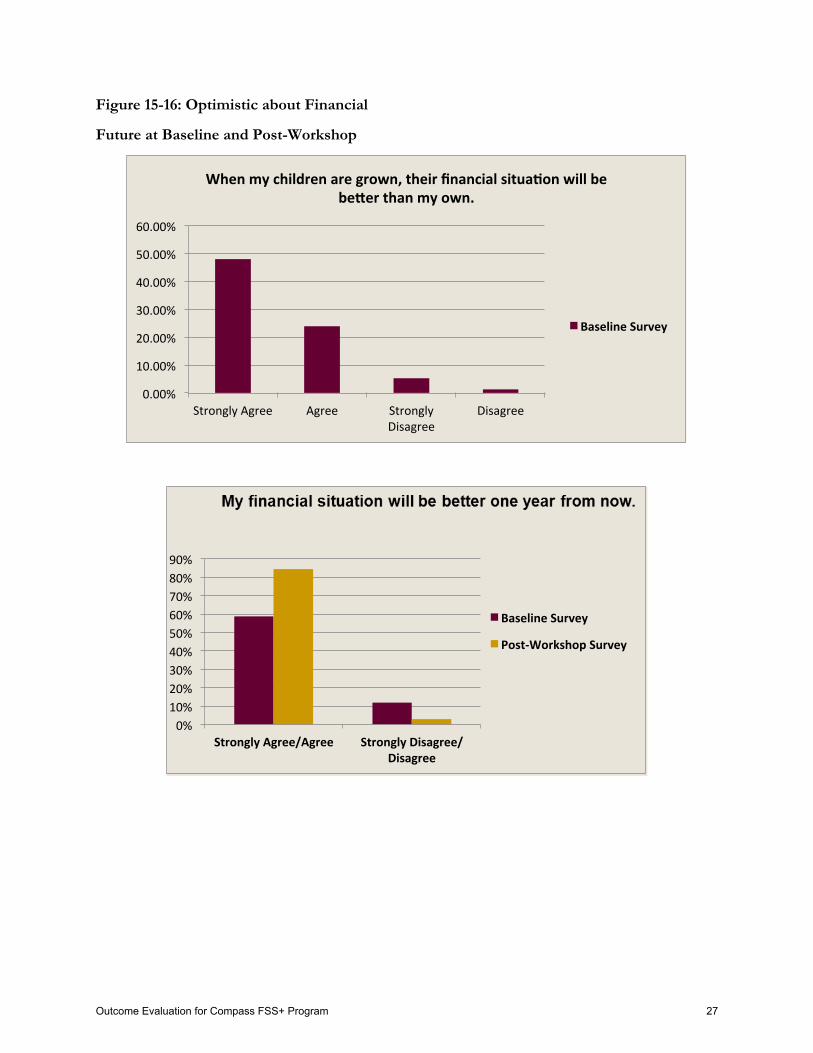
Figure 15-16: Optimistic about Financial
Future at Baseline and Post-Workshop
0.00%
10.00%
20.00%
30.00%
40.00%
50.00%
60.00%
Strongly Agree Agree Strongly Disagree
Disagree
When my children are grown, their financial situaPon will be beaer than my own.
Baseline Survey
0% 10% 20% 30% 40% 50% 60% 70% 80% 90%
Strongly Agree/Agree Strongly Disagree/Disagree
Baseline Survey
Post-‐Workshop Survey
Outcome Evaluation for Compass FSS+ Program 27
QUALITATIVE INTERVIEWS WITH PROGRAM PARTICIPANTS
The purpose of the qualitative assessment of the Compass FSS+ program is to assess the effectiveness and perceived benefits of key program components. In-depth interviews were conducted to provide a richer understanding of participant financial experiences, perceptions of financial well-being, goal attainment, and the effects of program participation on financial practices and saving behavior. In addition, qualitative interviews provide an opportunity to understand participant perceptions of their own progress toward achieving the key indicators related to Compass FSS core program objectives.
I. Background A purposive sampling technique was used to select 10 participants for in-depth interviews. This method was used to ensure that interview participants were of different racial and ethnic background, as well as marital and socioeconomic status. Due to the small number, this sample does not represent the full demographic make-up and range of experiences of all current Compass FSS+ participants. While it is not possible to develop definitive conclusions from these interviews, the responses from participants in the sample add depth and insight to the quantitative findings. Participants began enrolling in the Compass FSS+ program in November 2012. The interviews were conducted between June 2013 and September 2013 with participants who had been in the program for several months. The Institute on Assets and Social Policy (IASP) team developed and implemented the interview protocol and procedure. IASP worked with Compass FSS program staff for scheduling and coordinating participant availability. The interview only took place if the participant understood and signed a consent form. Participants were also asked if they consented to be audio-recorded. Interviews were 55 to 90 minutes each. All interviews were conducted at the Compass FSS program office in Boston, MA or by telephone. Data collected from the in-depth interviews were analyzed using line-by-line analysis and interview contents were categorized according to major thematic topics: goals and aspirations, activities during coaching sessions, escrow and savings behavior, income and work experience, credit/debt repair, financial practices, and perceptions of financial well-being. The demographic and economic characteristics of the 10 interview participants are presented below. The majority were female with a median age in the mid-40s and with half being single-parent households. A significant number appear to be African-American/Black in terms of their racial background. However, a large number of these participants have native African, Caribbean or West Indian ancestry. This racial-and ethnic mix is consistent with the overall program enrollees in the Compass FSS+ program in Cambridge. While two interviewees have only a high-school diploma, the majority have some post-secondary education, resulting in a relatively well educated group and somewhat more so than Compass FSS+ participants as a whole. The majority of interview participants were either employed part or full-time with a few experiencing recent bouts of unemployment. Interview data revealed that their occupations are primarily in the service sector. These jobs include home health care, Certified Nursing Assistant, administrative support, childcare provider, teaching assistant, food service, and retail. (See Figure 17 on the next page for details of demographics and economic characteristics.)
Outcome Evaluation for Compass FSS+ Program 28
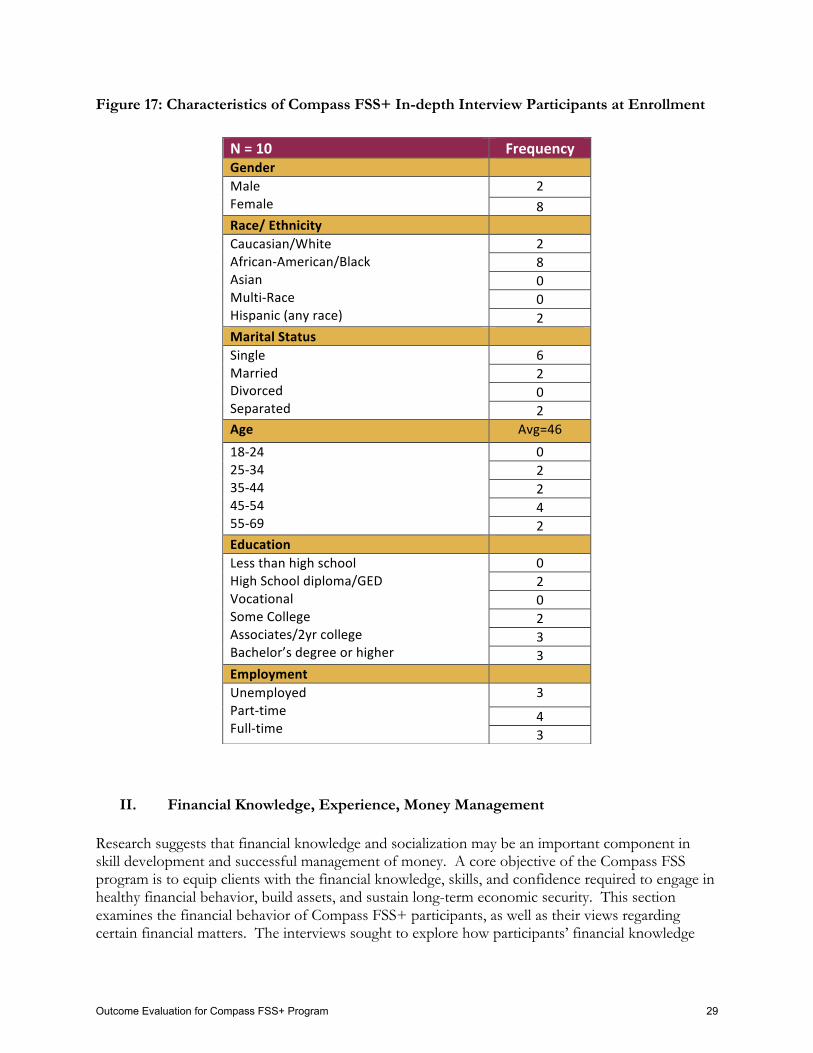
Figure 17: Characteristics of Compass FSS+ In-depth Interview Participants at Enrollment
II. Financial Knowledge, Experience, Money Management Research suggests that financial knowledge and socialization may be an important component in skill development and successful management of money. A core objective of the Compass FSS program is to equip clients with the financial knowledge, skills, and confidence required to engage in healthy financial behavior, build assets, and sustain long-term economic security. This section examines the financial behavior of Compass FSS+ participants, as well as their views regarding certain financial matters. The interviews sought to explore how participants’ financial knowledge
N = 10 Frequency Gender Male Female
2 8
Race/ Ethnicity Caucasian/White African-‐American/Black Asian Multi-‐Race Hispanic (any race)
2 8 0 0 2
Marital Status Single Married Divorced Separated
6 2 0 2
Age Avg=46 18-‐24 25-‐34 35-‐44 45-‐54 55-‐69
0 2 2 4 2
Education Less than high school High School diploma/GED Vocational Some College Associates/2yr college Bachelor’s degree or higher
0 2 0 2 3 3
Employment Unemployed Part-‐time Full-‐time
3
4 3
Outcome Evaluation for Compass FSS+ Program 29
and individual experience with certain financial matters shaped their financial practices. Participants described in detail their money management experience with meeting household expenses, paying bills, budgeting and spending, managing credit and debt, and accessing banking services and products prior to entering the Compass FSS+ program. This section highlights how the Compass FSS+ program’s delivery of customized financial coaching and training helped participants learn new strategies and modify existing practices, especially around budgeting, credit/debt, and saving. Previous Financial Knowledge , Experience and Pract i c es The interview responses suggest that most of these Compass FSS+ participants had a basic understanding of financial matters and were already making an attempt to practice healthy financial behaviors prior to enrolling in Compass. The majority of interview participants said that they already knew about spending, budgeting, and the impact of credit. No one attributed their financial setbacks to limited knowledge, unwise decision-making or poor financial behavior. Instead, many attributed their financial problems to their limited incomes, limited opportunities to advance in work, and the inability to save.
“I always felt that I had good financial practices and was knowledgeable. My issue is really just low income. I will be more confident if I can address that. But I do feel that I am learning some new things. It is a very positive program.” “For me it was tricky because I knew already what they helped with—I knew what my problem was—it was not making or sticking to a budget—for me my problem is just being unable to earn enough income. And being stuck in a very bad financial situation—which I should be able to get out of.”
“I already track the things I spend. Because my budget is so small I watch everything. I used to be able to go on vacation and earn enough to afford a car. But I am not in that bracket anymore.”
Meeting Household Expenses and Managing Spending For many families in this study, meeting household expenses, managing and paying bills, and budgeting and spending concerns are ongoing challenges. Their monthly household budgets are dominated by basic expenditures and household needs often max out their monthly income, leaving little left over for savings and household extras. Given their stretched and tight budgets, participants talked openly about strategies that they used to scale back or manage household finances on a low-income. Generally, interview participants knew to prioritize bills when finances were tight and eliminate spending on non-necessities, but they overwhelmingly expressed appreciation for the new information that they are receiving in the Compass FSS+ program and the new, specific financial strategies they are learning.
• Difficulty covering basic household expenses
“I barely meet my household expenses. I feel like a very low-income person. I feel lucky that I have the CHA voucher and I qualify for some food stamps but the bulk of my money goes to
Outcome Evaluation for Compass FSS+ Program 30
food and public transportation to get to work. My life is so small because my money is so small.” “Well let’s see I just had to make a payment plan to pay back money owed to the electric company. The only thing that I had going for me is that I got caught up on rent because my rent was so low. I have to admit it was good that I…wasn’t required to report my income (increase) because I wouldn’t been able to do this little bit if my rent was raised even a little bit. Now I’m getting caught up with car insurance and utilities.”
• Learning new strategies for budgeting and managing spending
“What I think a lot of people found helpful (from Compass FSS+ financial education workshops) was the group setting. I think people really felt that it is a personal challenge not to spend money. So it was good to have the group participate––we looked at everyone’s numbers, shared our experiences. It didn’t feel judgmental or reprimanding—it was very supportive and helpful.” “I appreciate the time spent with my coach discussing my budget and we went over budget tracking mechanisms and now I am set up with a Mint checker (spending tracker app)—which I use now to keep track of spending and finances. Although I meet my household expenses comfortably, especially since the new job, I do have goals to lower bills. And the Mint checker is just a breeze, it is so helpful and it is really easy at helping me focus on my bills.” “I would have never thought about negotiating my financial fees and terms with creditors. I definitely feel that I am at a better place because of what I’m learning. I feel I have a better feeling and attitude towards my financial goals and feeling more determined to earn more.” “The budgeting skills that I am learning are really helpful. I really needed to talk it out with someone. I wish I knew about this Compass program before because there’s really nothing out there providing the right information for people to see beyond where they are at.”
• Appling new money management strategies
“I am not a spender. My husband is though. So I’ve been showing him everything that I am learning and he has started to cut back. Now we have a strict budget—that is the most important. We don’t do things on a whim. We talk about what we can afford and what we can’t and what we need to buy. We took away cable and the sports package––that’s what my husband likes. But he knows the big picture is getting our house.” “The program really makes you think about how to spend less on everything. Before I would use whatever money I had I wasn’t able to track it or had any skills to track. Now, I am tracking my expenses, save receipts, I would always throw them out but
Outcome Evaluation for Compass FSS+ Program 31

now I save everything. I double-check receipts. And I just believe every day is learning and practicing these skills, doing these things every time.” “Being a single mom things can get rough, also eating out—I had to cut out eating out to two times a week. I also stopped getting my nails done. If I go, it’ll be a cheaper one or I’ll just do them myself. I got a nail kit. I already cut cell phone bills and cable. So yes I am really making the changes I need make.” “My goal is not to buy and overspend. I am getting off several subscriptions that I have because I don’t need and really can’t afford them and will use that money to pay my bills. They showed me how to pay my debt and not spend on anything. They just taught me how to do and be better.”
Building Credi t and Debt Management Skil l s A common theme consistent throughout the interviews was the issue of credit and the desire to have and maintain good credit. Even participants who felt they already had good credit prior to joining the FSS+ program spoke about the importance of “keeping it that way” and prioritizing credit over other financial goals. Several interviewees noted that they recognized early on the impact their credit score had on their financial lives and did their best to manage or took preventive measures from growing deeper into debt. As a result, some appear to have only minor debt problems and perceive their debt situation as manageable. Only a few interviewees mentioned that they had significant concerns about debt. Nearly all respondents mentioned that they appreciate Compass’ strong emphasis on the importance of credit repair and healthy debt management and recognize they are key attributes to a healthy financial profile.
• Awareness of importance of good credit
“I knew to focus my attention on bills and credit. I don’t have any savings. But I keep my credit report high. I always pay my bills on time. I never missed a payment on anything. I’ve had the same credit card for years and I just learned to pay stuff on time. Because credit is very serious.” “I always pay my credit card bills on time. But I have some stuff I didn’t pay in full so interest is getting to it now and adding up. For me having good credit is a necessity because I need good credit for emergencies. I don’t have anything else that I could rely on so I have to keep my credit good for an emergency.” “I guess in terms of…having good credit and saving…I wish I had both (chuckles). I’ll definitely take good credit because credit determines everything—it affects your life both positively and negatively. You cannot play around with credit––you can always build up your savings—but it’s harder to fix credit.”
Outcome Evaluation for Compass FSS+ Program 32
Only one participant admitted to not knowing or avoiding her credit profile before enrolling in the Compass FSS+ program. Fortunately for her she did not suffer negative consequences as a result.
“I have to admit that I avoided my credit profile for many years. I signed up for credit cards in college—quite a bit. I didn’t know. I guess we just don’t think about stuff until we have to or we want to buy something big. However, I do have good credit. Thankfully!”
• Acknowledging significant credit/debt problems
“I maxed out everything. So I can’t use anything anymore. I maxed out over $2k on Barclays. I’m in default and being taken to court on my Capital One. But for both I used for school stuff. I bought a computer and a desk and I also used them to live off of.” “I’ve had a lot of credit setbacks. Things are so bad I’ve been in default for a while I’ve been taken to court. And it’s all bad and it probably ain’t going to get better. I just don’t have nothing—so they can call and hound me all they want. But I can’t give them something I don’t have. I can’t stress and worry and cry about that. I can’t do nothing about it.” “I am also in a bad situation with student loans…I have a masters in library science and one of the local schools here got me all jacked up with a pretty nasty school loan that I now have to figure out how to pay. So I need more income to pay for everything or a chunk of money upfront. I just need something more to help make the transition out of the crises I am in.”
• Reinforcing efforts to improve credit and manage debt.
“I just want things to look a little better. I don’t really know who I owe. Some stuff I need to take care of now. I paid some stuff off but a few of the just don’t want to budge. Every time, I go and try to work with them and call them about working something out—they keep jacking the price up on me. I just want to pay what I owe. Not all that extra stuff. I just want things cleaned up so I can try to get a house. So I’ve been working with my coach on that.” “I knew how important credit is and I called those companies to clean things up. It really helped me to see my credit score and report when I entered the (Compass FSS+) program. But, I never had any real debt or credit problems. However, my husband needs to improve his credit a bit. But now we just try to pay everything in full and not rely on credit (cards) so much.” “In the second meeting, it was really about seeing my progress, I was very pleased to see how I was improving already. I improved on my credit because I was making some payments on my loans. I was so pleased with progress on credit and ability to pay off my loans and pay down balances. So yeah my credit is being maintained. It is not a big
Outcome Evaluation for Compass FSS+ Program 33
issue for me. My credit is good. But I have to keep it that way by paying a couple other things completely off.”
III. Savings Motives, Experience, and Behavior A core objective of the Compass FSS+ program is to help participants understand the benefits of having savings they may not have previously realized and encourage participants to establish an ongoing habit of saving. The following sections describe in more detail the ways that respondents discussed their saving desires and their individual efforts to save. This section gives particular attention to patterns of savings accumulation in the escrow account as well as participant experiences with other saving mechanisms outside of the Compass FSS+ program. Importance o f Saving Although most respondents reported not having focused on saving prior to signing up for the Compass FSS+ program, during interviews they noted the significance of having savings and the act of saving. Respondents reported a strong desire to save, primarily for emergencies, and indicated that savings is necessary for future advancement. However, all respondents reported that saving is very difficult because of underemployment and limited income and the need to place other financial priorities first.
• Achieving a sense of financial stability. “Saving is very important to me. I always know that I need to save for emergency and a house. I received messages at a young age. My grandmother had savings bond for me but it was for school only.”
“I mainly want to save for emergencies because I don’t have any other money coming in so if something happens I’ll have my emergency money. But I’m always in a position where I have to borrow from Peter to pay Paul, since I’ve had so many setbacks in employment.” “I am fearful of my future. I have big concerns about retirement. My income is so low that to try to make any real significant steps in my life I need a program like this. I am making 25% of what I was making before so I am facing a serious situation. I have a real fear about the future. So any little thing, a program, that can help me save or help me make more money, that is what I need at this point in my life.”
• Realizing important life goals.
“Saving is really important mainly because of the house for which we’re trying to save. We really need to get into our own house. We will be close and we have taken the steps. I am also a saver by nature. My husband is finally getting it. As I said, he is a spender. But I’ve been on him about our savings. We also have an IDA account. They match the first $2,000; we have about $13,000 (in that account). We have
Outcome Evaluation for Compass FSS+ Program 34
about $26,000 in total savings with all our accounts included. So, we’re going to buy a house.”
“It is important for my children to understand the value of saving. I don’t want my kids to struggle and learn the hard way. My children also know the importance of education. They are expose to college and schools and are expected to attend college…I do have college savings for both my children. I am concerned about getting my own master’s degree and how to find a balance with that and funding my daughter’s education. I need to figure out how to pay for both.” “In five years I want to buy a house hopefully somewhere else, maybe Puerto Rico. I know I’m not staying in Massachusetts. It is impossible to buy a house here. You’re crazy if you try to buy a house up here. I’m going to try elsewhere.”
Escrow Account Offers Unique Saving Opportunity One of the most important benefits of the FSS program is the opportunity to accrue savings using the FSS escrow account. The FSS escrow component represents an effective strategy for helping low-income families in the HCV program to increase their savings and build assets. An important objective of the Compass FSS+ program is to empower participants to use the FSS savings, as well as other personal savings, toward asset development purposes. Respondents’ experiences with accumulating funds in the escrow account varied. However, just about all indicated that the escrow account opportunity was a contributing factor for enrolling in the FSS+ program.
“I’m looking to this program to grow my income and accumulate savings. And I’ve joined because of that and this escrow opportunity which will allow my income to go toward saving. The escrow account is like icing on cake. I think it could really help me develop something significant, but it depends if my income is steady. But my thinking about the escrow was, ‘here is something that is designed to help me’. I understand that housing authority wants me to earn more and get me out of here. It is a big piece making the program attractive. That is what is going to get people in.” “I want to get money in the escrow savings. It is definitely a good thing, but my work situation is a problem, making it difficult. If I do get savings in there, I am not going to touch it because I want to buy house. If I’m still in Section 8 after five years I can use it for a deposit. We can definitely use this opportunity because if I wasn’t in this Compass program I would not get his privilege.”
Escrow Account and Work Strateg ies A few interview participants discussed what employment and income changes they would like to make in order to maximize the escrow opportunity for their benefit. Respondents discussed specific and immediate strategies that they have made or would like to make to increase income. Such strategies included: paying more attention to pay raises, adding a second job, stabilizing or increasing work hours, searching for a different job that pays more, or enrolling in an education or job training program to improve job prospects.
“I’m currently going to school. I’m trying to get in the One Family Scholar’s program. I am attending Springfield College. I need scholarship from One Family Scholar to help with costs. My
Outcome Evaluation for Compass FSS+ Program 35

degree is Human Services Concentration in Early Education. I’m doing this for a better job with more money.” “I am supposed to get a raise at both my jobs every year. But I don’t know if it has gone into escrow yet. It takes three months after recertification before the escrow gets triggered—for money to go into account.” “Well, I just got this job now which is good for escrow, but in order for me to get something out of the escrow I have to figure out how to keep my income and escrow deposits steady. I really want that to happen––to have money in my escrow and keep the deposits consistent and steady. But my job at (name omitted) will run out and I will need to find something else. So I do want things to be more stable with my income in terms of receiving rent increases even if it’s for the escrow.”
“I want to get money in the escrow savings. It is definitely a good thing but my work situation is a problem, making it difficult. If I do get savings in there. I am not going to touch it.”
Weighing Benef i t s o f Escrow Account vs . Rent Increase While participants recognize the escrow account as a valuable savings opportunity, they also realize they need to balance this with the rent increase resulting from reported higher income. For HCV holders, rent is calculated at 30% of a voucher holder’s income. When voucher holders obtain a job or receive an increase in pay, the housing authority in turn raises their rent payment to 30% of their higher income. For participants in the Compass FSS+ program, 50% of the increase in their rent payment is deposited into an escrow account each month. Under a new policy, CHA does not require, nor even encourage, HCV holders to report increased income until the time of their annual recertification. Some participants weighed reporting a pay increase prior to their next recertification because of paying more rent even though it will trigger savings in the escrow account. Compass has encouraged FSS+ participants with increased income to save on their own until the escrow account is established when they are recertified.
“I’m definitely looking forward to income reporting changes with my voucher. The housing authority has changed the reporting guidelines. I don’t have to report my income every time I have an increase in income. So now we only have a recertification every year. And I just had mine when I worked for Head Start. So I don’t need to do it again. I did the calculation and my rent will increase roughly $300 if I report. So now I am just saving that money on my own rather than have it go to escrow because they will still take half. I rather have more control over my own money myself.” “…I want the escrow to happen. But I don’t know if I want to rush and report my new income because my money and rent is so low. And this job is only temporary. Because the stall in the rent increases definitely helps with my economic security. It allows me to catch up on other bills. So, I am thinking that in six months I will report my income and get the escrow going. Because I need the money now to get my electricity caught up as I am in danger of getting shut off.”
Outcome Evaluation for Compass FSS+ Program 36
Maximizing the Motivat ional Value o f the Escrow Account As the administration of an FSS program was new to CHA, it took some time to get all the systems in place. Some interview participants did not know whether they had initiated an escrow deposit, nor how much was in the account. They expressed confusion and some frustration with the perceived lack of communication regarding their accounts. Unfortunately, the lack of clarity and communication may discourage some participants from striving to increase their earned income so as to establish and grow an escrow account. To address this, Compass is providing FSS+ participants with their escrow statements at each six-month coaching session and has created a client portal where participants can log in and check on their own.
“I am in this Compass program I should be saving this increase but the housing leasing person didn’t know what I was talking about. I don’t think it started yet because my recertification was recent––however, I would like some type of statement maybe a yearly statement.”
“I don’t really don’t know if it’s going to help me. My rent did increase before it was like $424 now it’s like $500 and something. But don’t know what’s going on with it or if it’ll be enough for it to really do anything for me. But I guess I hope so. But I have heard that the housing authority don’t give you the money so I don’t know.”
“I’m looking forward the rent and escrow. But no one ever told me if anything is in there. No one ever told me how much would be going in there. My rent went up an additional $200 because my income went up. But I have no idea what’s going on with it. It’s pretty much their word. It’s whatever they say. I have never got anything in writing. I learned hard in life. If you don’t get anything in writing it didn’t happen and whatever you need to happen it’s not going to. I’ve been paying $500 in rent since October 2012, now its July. So they could’ve just walked off with my money. They also told me I could add more money to it, but how would I go about doing that if I don’t know what’s going on with it.”
Savings Outside o f the Escrow Account While the escrow account is important for helping participants accumulate savings via income increases, it is not a mechanism whereby participants can actually practice the behavior of “saving”. Respondents noted that saving is an important theme within the program and a key aspect that they were introduced to during the financial education workshops. While a few participants discussed the incremental steps and changes they have made to save more, all respondents mentioned wanting to exert greater effort to increase personal savings. However, respondents reported having very little savings or none at all. All participants indicated that saving is very difficult because of limited income and the need to place other financial priorities first. The majority of respondents said that saving will become more of a priority once credit is good and debt is cleared and finances have become more manageable.
• Applying behavioral techniques to facilitate savings process.
“I have a saving and checking account; I have a savings at a credit union that is completely hands off I do not use whatsoever. For my savings account I have it split where $60 is going in one savings and then $80 going in the other savings I don’t touch. I definitely have a long way to go to reach my emergency savings goal.”
Outcome Evaluation for Compass FSS+ Program 37
“I had a checking account before Compass and a savings account at a credit union I don’t use my savings. I got direct deposit to my checking account where my paycheck goes right in then $50 dollars goes to savings.” “I had checking and saving account both before I joined the Compass program. I mainly use checking for my bills I try to save around $100 month in my savings. The savings account is at a credit union and I don’t use my savings. But I don’t have much savings.” “I had checking account before Compass. I got the saving after I enrolled. I got a little savings in there and I try to put some in there. Not much though. I also have it set up for the checking account where my paycheck goes right in. So I’m trying to leave it alone and take out what I have to.”
• Difficulty saving on a regular basis.
“Employment insecurity and job layoffs has made it difficult to save. Before, economically it just didn’t work with my budget—just not enough to save. Even working, it is still very difficult largely because of income limitations. It’s just not enough. When you pay bills, food, and transportation, there isn’t anything left.”
• Positive impact on families.19
“I am looking at this as my savings for my retirement—I’m looking at anything I get in escrow—as this is a five year program that is a good amount of time for it to grow into something—how much I don’t know, but any little thing will help. I just want to leave it alone and see. Because I am so afraid of the future. I am thinking about it constantly. I have to just leave my savings alone. And do what little bit I can for my retirement.” “I talk to my kids quite a bit––our motto is to buy a house—everything is centered around buying a house. As I said I’m making more money now. And paying things off. And just a better place. But my kids they get it. They have their own saving mechanism as well—they put their little money in a jar. (chuckles)” “I think about my daughter’s future. My daughter is brilliant. She is a great kid. She’ll be fine. I know she’s going to get scholarships. I just need to do what I can to get her off on her own and to get her a step forward. I need to do for her now so she doesn’t have to worry about anything, but going to college.”
Barriers to Greater Employment and Advancement Many interview participants discussed how their work situation could be improved when they talked about their savings experience, especially as it relates to savings in the FSS+ escrow account. They focused on challenges with finding jobs that pay enough to meet their expenses and a living wage. As Emple (2013) found in her assessment of FSS programs, the difficulty of finding living wage employment, a mismatch of skills to available jobs, and lack of career advancement are consistent 19 The effects mentioned by these participants are consistent with theories of the hypothesized effects of savings and assets commonly highlighted in the IDA and Child Saving Account (CSA) literature.
Outcome Evaluation for Compass FSS+ Program 38
barriers faced by FSS participants across the country. Some interview participants discussed challenges to obtaining employment; others discussed strategies to stabilize work hours and increase their wages. Several respondents reported working multiple part-time jobs because of challenges finding full-time work. Although employment status, work experience and satisfaction varied, an overwhelming theme was that respondents wanted greater career mobility and advancement and were frustrated with the current job market and growing job insecurity. While providing job placement assistance is not part of Compass’ core mission, the program provides guidance and referrals to other resources.
• Difficulty getting and maintaining good, secure jobs.
“It is incredibly difficult finding a good job in 2013. I was laid off from my job at my company after working almost 20 years. I tell you I never went without a job more than 3 weeks. In our economy it’s like you need to have had that same position prior or be someone right out of college and I am well past that. Right now, I just need more money! I am working but it isn’t enough and finding a job that I need to have is extremely difficult. I want a job where it’s secure and meet my needs.” “I live in Cambridge and you need like $60k to afford market rent. I guess I don’t see how to move up. The solution is to make enough and I don’t see how I can make $60k. My income is so low to try to make any real significant steps in my life. There are no jobs that pay that much. So I was needing a program like this—I am making only 25% of what I was making before.” “I work 40 hours but my job is not full time. I get no benefits. I don’t get anything. It is considered two part time jobs. I wanted a receptionist or work in a doctor’s office. But I couldn’t even get that. It is so hard to advance in work. There’s nothing really out there that can help you advance or move up in work. There’s not enough movement and not enough progress or opportunity to progress in something else. It took me nearly two years to get hired here.”
• Seeking help with job placement
“Compass did give me info for different services for stuff like interview clothes and the one-stop career centers. But those (state Career) Centers don’t do squat. They don’t do squat! All they tell you is to get on the computer and look. It is just so redundant. I need Compass to have more contacts and things that can help us in non-traditional professions or people with a certain specialization make contacts, because I am an artist and going to a lot of these centers will not help me. I am looking for an apprentice job or something like that to really learn the business side of things.” “I am hoping for a school program or a retraining program, but I am started to feel really doubtful about that because there just doesn’t seem to be any jobs anymore. Or maybe they can provide more direct job search help. They’ve made referrals to the Career Center and I went two times a week, but the attitude there was not right. They’re always saying that it is up to you to find a job and telling us about LinkedIn –for my skills it just was not helpful. We need access to real jobs. I thought you could
Outcome Evaluation for Compass FSS+ Program 39
go to a community college and do a re-training program- something like that? But I guess I don’t fit into the target population of these training programs because of my age.”
“Yes, they referred me to employment assistance programs. But I don’t think some of those programs are a good fit. Because these places were trying to get me to look into jobs not in my salary or education range. A lot of the resources just don’t seem like a good fit. I didn’t need to do mock interviews or work on my resume. I have multiple degrees. I just don’t need that.”
IV. Economic Security and Well-being
An important objective of the Compass FSS+ program is to help participants achieve financial security. Interview respondents were asked to comment on how they would define financial stability and whether they believed themselves to be economically secure. They described economic security in modest terms, such as having enough money to pay monthly bills, being able to meet basic needs with a little left over for emergency savings, and having the necessary resources to make plans for the future.
“No I do not feel economic secure. It means that you are able to survive that you live comfortably—you are not dreaming about what can be your future. You are not wondering and worrying about finances all the time––you can do things you want and need to do––like being able to go on vacation.” “It doesn’t mean having a lot necessarily. As long as I can have enough money to pay bills and save a little money, I will be able to be resilient and bounce back. Also economic security means living where you want to live not where I have to live. My life has been very small. I don’t have much and I wonder how’s it going to be when I’m 70 or 80. I want a job where it’s secure. I don’t have to worry about it downsizing or going under. I just want to meet my needs and go on a simple vacation and also have a car.”
While many spoke of having their own home as an indicator for economic security, a few respondents admitted they did not feel that homeownership was realistic given their financial situation and the high cost of living where they lived. These interviewees shared that having a stable housing voucher was an important piece of their short-term economic security.
“Right now to set a goal to buy house is just too much—that is not even realistic thinking right now. That is not my goal. I make so little I just think I am so lucky to have my apartment. I guess I don’t see how to move out. The solution is to make enough and I don’t see how I can make $60k which is the cost of living in Cambridge.”
“Ideally I would stay in housing for another six years because of my daughter. I don’t want to be on Section 8 but I need the stability for my child while she’s in my care. I don’t need to have anything for myself. When my daughter is off to college, I will move into a one bedroom or little studio and not think twice about my living. My goal is that she’s taken care of. To make sure she has what she needs to get to college. She comes first. I definitely do not want to be on
Outcome Evaluation for Compass FSS+ Program 40
housing. It is the most dehumanizing experience. I hate going to these offices. I hate going to the housing authority.”
V. Perspectives on Compass FSS+ Program
Compass FSS+ interview participants spoke favorably about their experience in the Compass FSS+ program and provided positive assessment of the program as it relates to equipping participants with the needed financial knowledge, skills, and information in their efforts for financial advancement. This section takes a closer look at respondents’ perspectives of core features of the Compass FSS+ program, providing a deeper examination of participant satisfaction with program implementation and delivery. Promoting Part i c ipat ion in the Compass FSS+ Program Most interview participants recalled receiving a flyer or postcard in the mail that invited them to participate in the Compass FSS+ program. They discussed how the inspirational messages and creative imaging piqued their interest and prompted them to attend orientation or reach out to the Compass outreach manager for more information.
“I received a postcard in mail. I almost threw it out. But I actually read it and decided to call somebody because it was convincing. I also felt that I bonded with (staff name). I am really happy to have her talk with me. And I met with one coach and I thought she was going to be my coach but then I met my coach and I liked her too. She is very encouraging. The staff really encouraged me to join the program. They make the program.”
“I heard about Compass FSS by receiving something in the mail. I heard about another program I was actually in the process of enrolling in at the housing authority. But, Compass seemed more convenient and more in line with what I was looking for. I was excited to learn about the workshops. Made me see what they had to offer before I joined. I really liked that.”
Perspec t ives on Financial Coaching Sess ions As outlined in a previous section of this report, Compass delivers a customized and client-focused coaching program designed to promote core financial competencies in the areas of income and employment, education advancement, credit/debt, use of quality financial services, and savings and asset development. With the development of the electronic Client Financial Profile tool, the Compass’ financial coaching program provides participants with a comprehensive and detailed list of steps to follow for successful completion of their goals in each core area. Interview respondents mentioned several times how they appreciated the opportunity to meet with a financial coach. Several participants noted that the individual meetings allowed them the opportunity to address specific challenges unique to their situation. Interviewees were very detailed in describing the activities and tasks initiated by the financial coach and their level of satisfaction with each session.
“My husband and I wanted to save for a house––we are really serious––we have attended 1st-time homebuyer classes. Now that I’m in this program, the saving message really hit home for us and is a huge motivator for me. We were already trying to do and learn everything on our own. But having somebody to present the right information is very beneficial. We were really
Outcome Evaluation for Compass FSS+ Program 41

trying to get the right information for everything we’re trying to do. Nowadays it is so important to find somebody who’s knowledgeable. We’ve been trying to stay away from people trying to sell you something. Seems like everybody is trying to sell you something. So now I am working on my credit and savings goals with my coach because we were not getting very far with what we are doing before I joined this program.”
Referral Assis tance/Connect ing to Other Agencies In addition to being satisfied with the content and delivery of the financial coaching sessions, a few interview participants touched on how they appreciated the resources and connections with other agencies Compass had to offer. These participants pointed to how Compass specifically connected them to specialized services unique to their situation. Referrals were made to the student loan clinic at Harvard University, Metro Credit Union (a credit union that provides low-cost banking products specific to Compass’ clients), One Family Scholars Program (a special program that provides tuition scholarships to low-income, single-parents to continue their college education), and AACA (for support services for veterans).
“They have a lot of resources, very valuable information, Compass has a lot of knowledge pertaining to credit and resources around credit. I know a lot of people finding these helpful. She connected us to finance service agencies and banks. In terms of connecting me to the school. I am enrolled in UMASS Boston. I am already in the system. But she connected me to a program about a scholarship.”
“Yes, she connected me to a really good association for veterans. They help with just about everything. Their mission is to education, empower, and employment. They offer free job training, English assistance, they provide a 27-week banking course for example. They do a lot of stuff.”
While some respondents appreciated the connections and referrals facilitated by the Compass FSS+ program, a few participants expressed the need for more advanced financial information, stronger employment supports, and more direct service contacts.
“I appreciated everything—they talk a lot about credit. The first three classes were really helpful. And I appreciated being connected to the Harvard loan education lawyer. Maybe something that can be optional is that they continue the classes and have a session on homeownership loans, student loans and capitalized interest.” “If they could expand into retraining program and emphasize job placement that would be really helpful, if they can provide resources to cut down costs on local services, like coupons or discounts to gyms that would help us a lot. As I said, I had to cut back a lot in my life that kept me healthy just because I could no longer afford it. But it would be nice if they had some inside into cost-cutting services that we could use that no longer can afford.” “I need Compass to have more contacts and that can help us in non-traditional professions or people with specializations. I am looking for Compass to help me make contacts that I don’t have. I just want to slide in the door—just a little and razzle and dazzle whomever. I need them to make contacts and provide resources for people with specializations.”
Outcome Evaluation for Compass FSS+ Program 42
Staf f Support and Encouragement Like the financial coaching portion of the program, most interview participants had positive things to say about the staff support and encouragement received in the Compass FSS+ program. They appreciated the individualized meetings, other informal contact, group events and activities, and looked forward to making impromptu calls to program staff to provide an update on their progress. Many respondents reported that the supporting attitudes and encouragement exhibited by Compass staff is what distinguishes Compass from other social service agencies and programs at local housing authorities.
“The program is positive. It has a positive focus on personal budgeting and building up finances, and you know that somebody there cares. These people are trying to make things better. I get a different feel at Compass than with my experience with other programs. At the job search programs and unemployment office I felt trampled down upon. It was a degrading experience. I leave away from these programs feeling like I’ve done something wrong. I didn’t like how these and the training programs treated me. It is something mean spirited about those programs and their staff. Compass is much more uplifting instead of saying you’ve done something wrong it was a refocusing toward your needs and where they can help.”
Most interview participants’ also expressed very high levels of satisfaction with the Compass FSS+ program overall. When pressed to make suggestions on how to improve the program, the response commonly was to make the program widely known, so more people could take advantage of the opportunity to participate. As the following quote reflects, interviewees were appreciative of what the program was offering them and found the program to be well implemented.
“Compass is dedicated to help people get out of being stuck. Some people out here is just sitting around and not doing nothing for themselves. They just laying up. But there are some people who wanna try to do something. They just need a little hope and inspiration and they’ll be alright. I think Compass is good for that. More people should be able to get in the program but it is not available for everybody. Compass needs to get at other housing authorities. Compass believes in what they do. Everything there is good for people out here trying to do something. The goal setting is beneficial, the focus on credit and budgeting and referrals they make. They are very resourceful!”
Outcome Evaluation for Compass FSS+ Program 43
CONCLUSION
The participant-level assessment in this study describes demographic and economic characteristics captured at baseline for participants in the Compass FSS+ program in Cambridge, MA. The analysis examines key economic outcomes related to income, employment, and asset accumulation as well as early program effects on financial practices and perceptions of financial security and wellbeing. Although the outcomes of the Compass FSS+ program will not be fully realized for several years, the results covering the first-year in Cambridge are encouraging. The majority of families in the program are single-parent households with children with some families experiencing below poverty incomes. Compass FSS+ participants, as a whole, have high employment rates and education attainment as compared to the typical FSS participant. 20 Moreover, some participants have already begun to experience increases in income, credit, and saving, as well as reductions in public assistance after being enrolled just six-months in the program. While Compass FSS+ participants have greater access to optimal banking products than the typical low-income household, they struggle with substantial debt and below average credit scores at program entry. Several participants noted that they recognized the significant impact of credit on their financial lives. Some noted over reliance on credit cards and having to use credit for school and living expenses to get by. However, the majority attributed their financial problems and setbacks to their limited incomes and limited opportunities to earn a living wage. Just about all mentioned that they appreciated Compass’ strong emphasis on the importance of budgeting, saving, credit repair, and healthy debt management and spoke about prioritizing healthy budgeting and credit over other financial goals. A large number of participants however, reported high levels of economic strain, face difficulty meeting household expenses, experience barriers to saving, and are frustrated with limited opportunities to advance at work. However, after completing the financial education component and attending regular coaching sessions, participants expressed and demonstrated a new found confidence and eagerness to apply new financial strategies toward fulfillment of their financial goals and optimism for their families’ future. This collective energy is seen in participants’ abilities to make financial improvements and progress early in the program.
20 United States. Dept. of Housing and Urban Development. Office of Policy Development and Research., WESTAT and JBS. Evaluation of the Family Self-Sufficiency Program: Retrospective Analysis, 1996 to 2000. [Washington, D.C.]: U.S Dept. of Housing and Urban Development, Office of Policy Development and Research, 2004.
Outcome Evaluation for Compass FSS+ Program 44
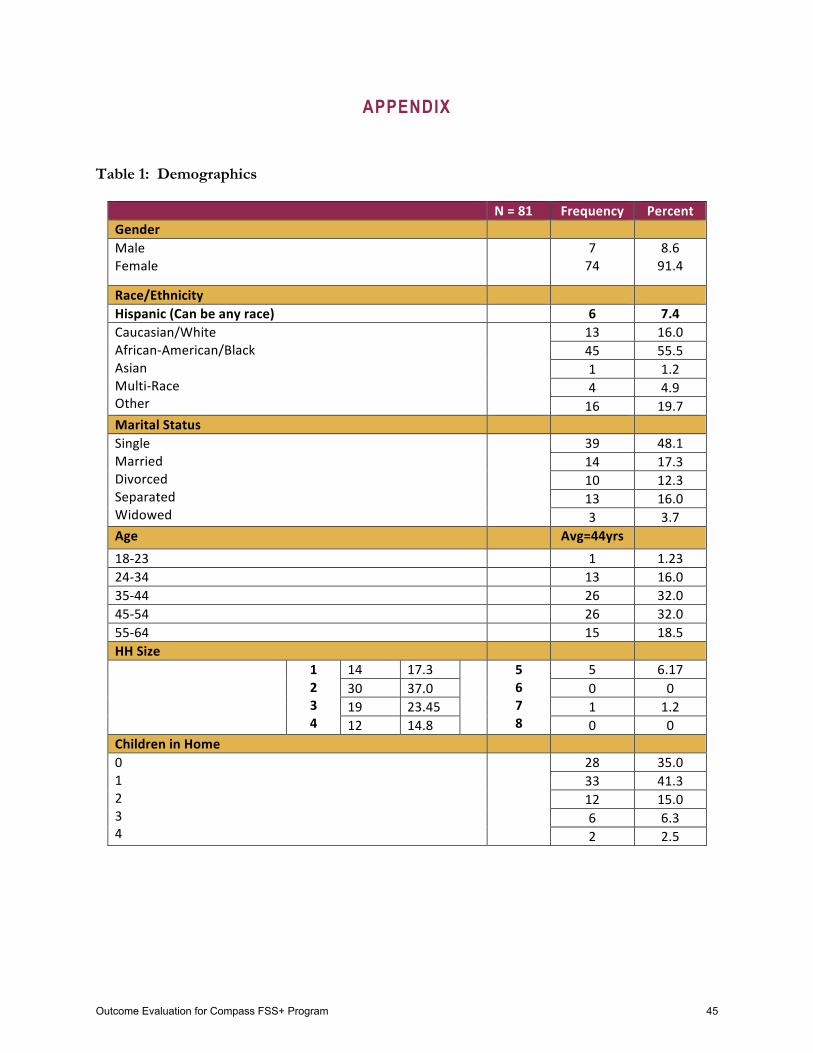
APPENDIX Table 1: Demographics
N = 81 Frequency Percent Gender Male Female
7 74
8.6 91.4
Race/Ethnicity Hispanic (Can be any race) 6 7.4 Caucasian/White African-‐American/Black Asian Multi-‐Race Other
13 16.0 45 55.5 1 1.2 4 4.9 16 19.7
Marital Status Single Married Divorced Separated Widowed
39 48.1 14 17.3 10 12.3 13 16.0 3 3.7
Age Avg=44yrs 18-‐23 1 1.23 24-‐34 13 16.0 35-‐44 26 32.0 45-‐54 26 32.0 55-‐64 15 18.5 HH Size
1 2 3 4
14 17.3 5 6 7 8
5 6.17 30 37.0 0 0 19 23.45 1 1.2 12 14.8 0 0
Children in Home 0 1 2 3 4
28 35.0 33 41.3 12 15.0 6 6.3 2 2.5
Outcome Evaluation for Compass FSS+ Program 45
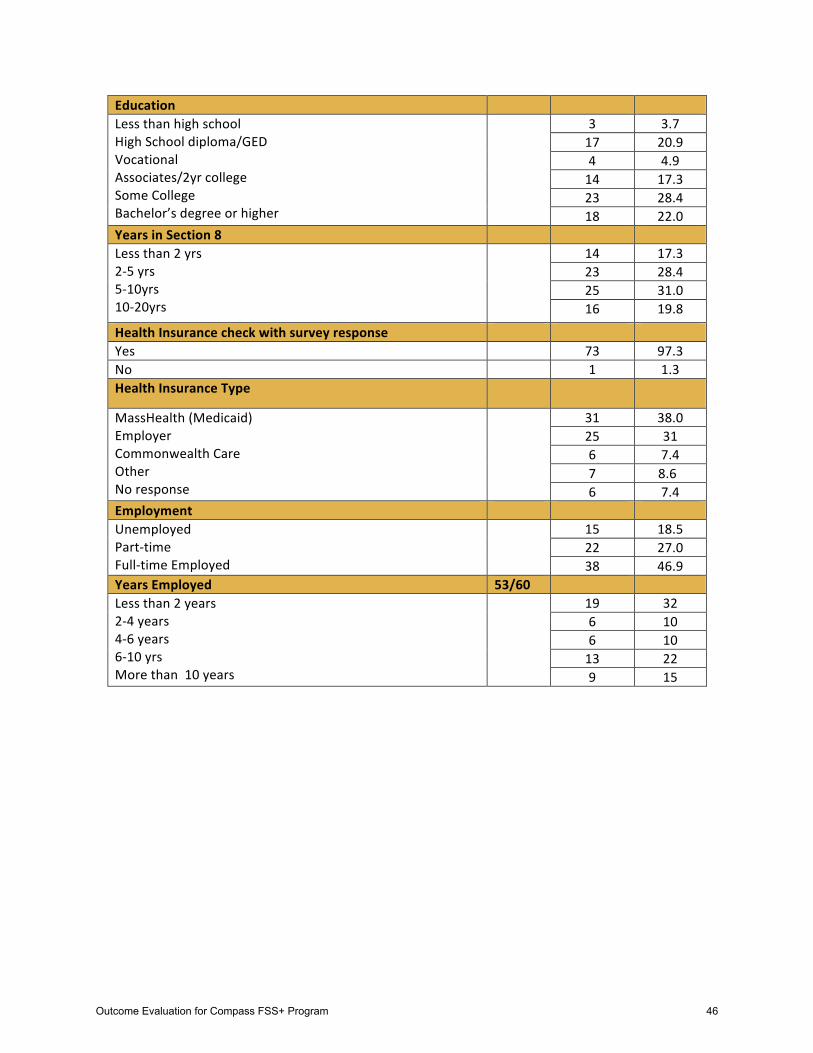
Education Less than high school High School diploma/GED Vocational Associates/2yr college Some College Bachelor’s degree or higher
3 3.7 17 20.9 4 4.9 14 17.3 23 28.4 18 22.0
Years in Section 8 Less than 2 yrs 2-‐5 yrs 5-‐10yrs 10-‐20yrs
14 17.3 23 28.4 25 31.0 16 19.8
Health Insurance check with survey response Yes 73 97.3 No 1 1.3 Health Insurance Type
MassHealth (Medicaid) Employer Commonwealth Care Other No response
31 38.0 25 31 6 7.4 7 8.6 6 7.4
Employment Unemployed Part-‐time Full-‐time Employed
15 18.5 22 27.0 38 46.9
Years Employed 53/60 Less than 2 years 2-‐4 years 4-‐6 years 6-‐10 yrs More than 10 years
19 32 6 10 6 10 13 22 9 15
Outcome Evaluation for Compass FSS+ Program 46
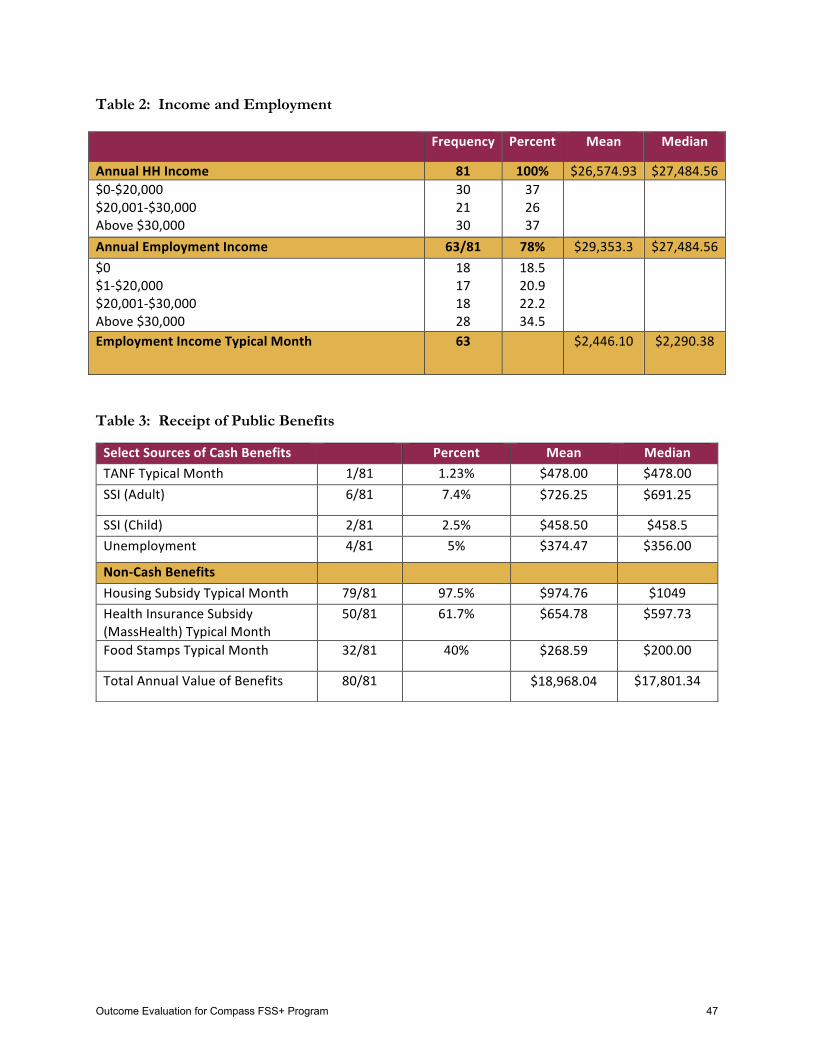
Table 2: Income and Employment
Table 3: Receipt of Public Benefits
Frequency Percent Mean Median
Annual HH Income 81 100% $26,574.93 $27,484.56 $0-‐$20,000 $20,001-‐$30,000 Above $30,000
30 21 30
37 26 37
Annual Employment Income 63/81 78% $29,353.3 $27,484.56 $0 $1-‐$20,000 $20,001-‐$30,000 Above $30,000
18 17 18 28
18.5 20.9 22.2 34.5
Employment Income Typical Month 63 $2,446.10 $2,290.38
Select Sources of Cash Benefits Percent Mean Median TANF Typical Month 1/81 1.23% $478.00 $478.00 SSI (Adult) 6/81 7.4% $726.25 $691.25
SSI (Child) 2/81 2.5% $458.50 $458.5 Unemployment 4/81 5% $374.47 $356.00
Non-‐Cash Benefits Housing Subsidy Typical Month 79/81 97.5% $974.76 $1049 Health Insurance Subsidy (MassHealth) Typical Month
50/81 61.7% $654.78 $597.73
Food Stamps Typical Month 32/81 40% $268.59 $200.00
Total Annual Value of Benefits 80/81 $18,968.04 $17,801.34
Outcome Evaluation for Compass FSS+ Program 47
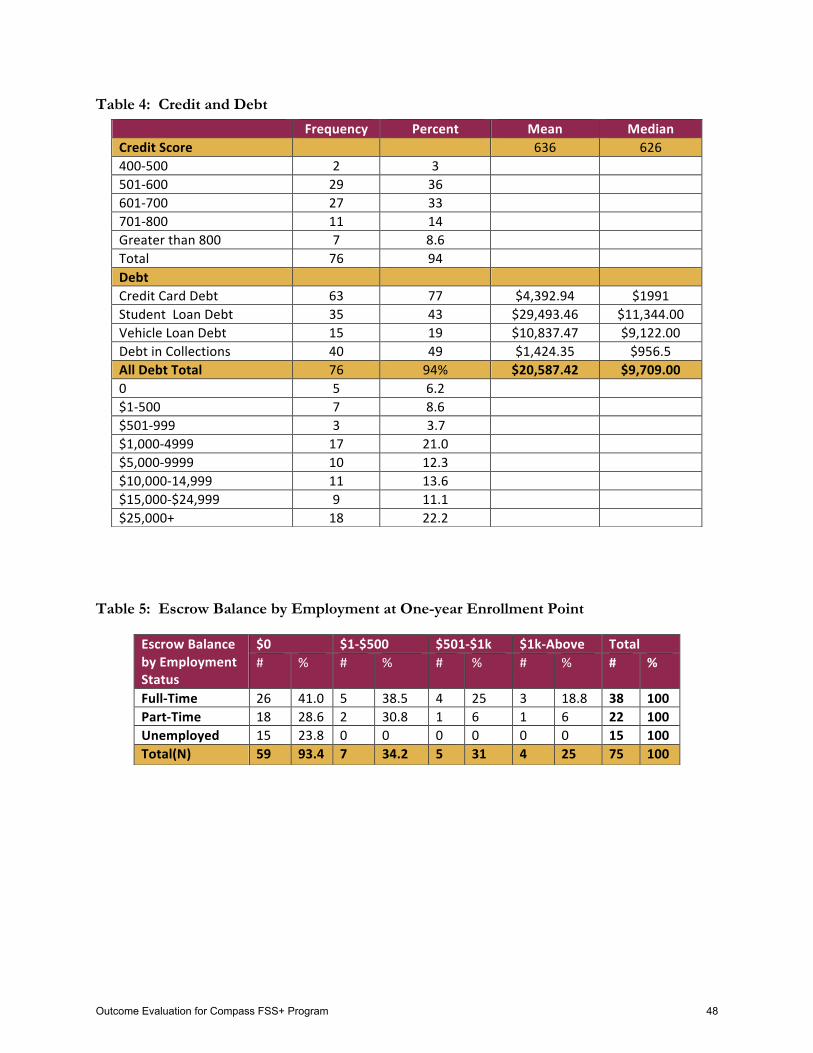
Table 4: Credit and Debt
Table 5: Escrow Balance by Employment at One-year Enrollment Point
Frequency Percent Mean Median Credit Score 636 626 400-‐500 2 3 501-‐600 29 36 601-‐700 27 33 701-‐800 11 14 Greater than 800 7 8.6 Total 76 94 Debt Credit Card Debt 63 77 $4,392.94 $1991 Student Loan Debt 35 43 $29,493.46 $11,344.00 Vehicle Loan Debt 15 19 $10,837.47 $9,122.00 Debt in Collections 40 49 $1,424.35 $956.5 All Debt Total 76 94% $20,587.42 $9,709.00 0 5 6.2 $1-‐500 7 8.6 $501-‐999 3 3.7 $1,000-‐4999 17 21.0 $5,000-‐9999 10 12.3 $10,000-‐14,999 11 13.6 $15,000-‐$24,999 9 11.1 $25,000+ 18 22.2
Escrow Balance by Employment Status
$0 $1-‐$500 $501-‐$1k $1k-‐Above Total # % # % # % # % # %
Full-‐Time 26 41.0 5 38.5 4 25 3 18.8 38 100 Part-‐Time 18 28.6 2 30.8 1 6 1 6 22 100 Unemployed 15 23.8 0 0 0 0 0 0 15 100 Total(N) 59 93.4 7 34.2 5 31 4 25 75 100
Outcome Evaluation for Compass FSS+ Program 48
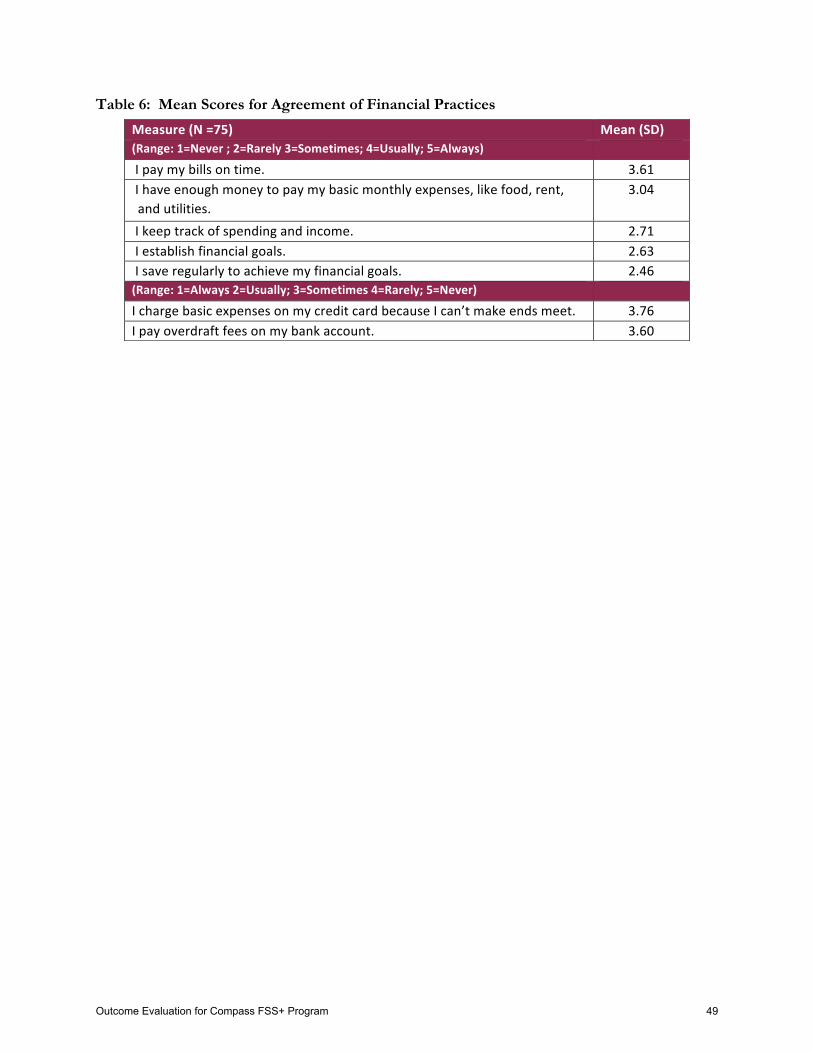
Table 6: Mean Scores for Agreement of Financial Practices
Measure (N =75) Mean (SD) (Range: 1=Never ; 2=Rarely 3=Sometimes; 4=Usually; 5=Always) I pay my bills on time. 3.61 I have enough money to pay my basic monthly expenses, like food, rent, and utilities.
3.04
I keep track of spending and income. 2.71 I establish financial goals. 2.63 I save regularly to achieve my financial goals. 2.46 (Range: 1=Always 2=Usually; 3=Sometimes 4=Rarely; 5=Never) I charge basic expenses on my credit card because I can’t make ends meet. 3.76 I pay overdraft fees on my bank account. 3.60
Outcome Evaluation for Compass FSS+ Program 49

Outcome Evaluation for Compass FSS+ Program 50
PRELIMINARY RETURN ON INVESTMENT
FOR PARTICIPANTS IN COMPASS FSS PROGRAM AT TWO YEARS
Preliminary Return on Investment for Participants in Compass FSS Program at Two Years 51
PRELIMINARY RETURN ON INVESTMENT FOR PARTICIPANTS IN COMPASS FSS PROGRAM AT TWO YEARS
Introduction to Compass FSS Program and this Assessment The Compass Financial Stability and Savings Program (Compass FSS) is an innovative variation on the U.S. Department of Housing and Urban Development (HUD) Family Self-Sufficiency (FSS) program. Created in 1990, the HUD FSS program is an employment and savings program for families who receive federal housing assistance with the intent of helping families progress toward self-sufficiency by reducing disincentives to working and assisting low-income families to build valuable savings. Through successful partnerships with two housing authorities in Massachusetts––first with Lynn Housing Authority and Neighborhood Development (LHAND) and more recently with Cambridge Housing Authority (CHA)––Compass has designed a potentially higher impact model for the FSS program for families receiving Housing Choice Vouchers (HCV, formerly known as Section 8) and living in public housing units. The Compass FSS program is distinguished by the provision of financial education, financial coaching, and asset building strategies to deliver better long-term financial outcomes and help families in subsidized housing achieve economic security. The success of this innovative model, with its incentives to increase work in order to increase savings and build assets, may have implications for FSS programs across the country. The Compass FSS program was launched in September 2010 with the first program participants enrolled in October 2010. From the beginning, the program has been part of a process and outcome evaluation conducted by the Institute on Assets and Social Policy at Brandeis University. The process evaluation assesses the effectiveness of the program design and participants’ perceptions of and satisfaction with key program components. The outcome evaluations of the first two years of the program in Lynn and the first year of the program in Cambridge report individual level outcomes. These analyses examine economic outcomes related to income, employment, credit and debt, and asset accumulation, as well as early program effects on financial practices and perceptions of financial well-being. The reports are available at www.iasp.brandeis.edu/capacity/evaluation.html. This report focuses on documenting a preliminary Return on Investment (ROI) in the Compass FSS program. The intent of the study is to begin to answer the research question, What is the return on investment of the Compass FSS model and given its impact, is it cost-effective? The goal of this analysis is to compare the program’s cost to changes in the amount of public funds received by families in the program in the form of housing subsidies and other public assistance benefits and tax credits. By using the comprehensive approach of including both public assistance benefits and tax credits, the study takes into account the major means by which the state and federal government supplement low earnings from employment to assist low-income households meet their basics needs. Program practices that encourage and support greater earned income can cause a decrease in these government supplements that may more than offset the per participant costs of the program. It is the intent of this ROI to determine to what degree the Compass FSS program has accomplished this to-date.
Preliminary Return on Investment for Participants in Compass FSS Program at Two Years 52
Although individuals can participate in the FSS program for up to five years with possible extensions, this report documents the changes experienced by families after their first 24 months in the program. The report uses data that has been verified or is based on calculations from state program data. It includes 43 families in Lynn, MA that entered the program after October 1, 2010 and reached the 24 month point prior to November 1, 2013 for whom there is complete income and public benefit data. The attached table provides the details for each data element at baseline and 24 months. 1 This report of the ROI focuses on societal financial gains realized after two years in the Compass FSS program, while other reports in this research study evaluated individual outcomes and financial benefits for program participants. Change in Earned Income A key objective of the HUD FSS program is to create incentives for greater work effort and to increase earned family income. This is also a primary goal of the Compass FSS program. The participants themselves report a strong desire to have fuller and more consistent employment.2 The average annual earned income for the 43 families when they entered the program was $22,777 with 39 households reporting income from employment. While participants’ first two years in the program transpired in relatively challenging economic times, the average earned income increased to $25,383 at the 24-month point with 37 households reporting earnings. Total annual earned income reported for the 43 households increased by 11.4% over this period. Change in Public Subsidies Housing Subsidies The HUD FSS program is only available to those who hold a HCV or who are residents of public housing, thus all 43 participants in the Compass FSS program in this study are recipients of housing subsidies. Rent for low-income families receiving housing subsidies is capped at approximately 30% of their income. If they hold a housing voucher, they can seek housing from participating landlords and the difference between what they are obligated to pay and the fair market rent for the apartment is covered by the voucher. If they live in public housing, the housing authority assumes the costs not covered through rent paid by residents. When the 43 Compass FSS program participants enrolled in the program, their average monthly housing subsidy was $784 for a total subsidy of $33,696 per month. At the 24 month point in the program, the average monthly subsidy was $730 for a total subsidy of $31,409 per month. The decrease in individual housing subsidies could possibly be the result of changes in rental units, but also likely reflects the increase in average earned income. The change in average total subsidy represents a 6.8% decrease.
1 While the majority of data designated as being at follow-up is from the 24 month point in the Compass FSS program, in a few cases the data was actually gathered some months prior or after this point. 2 See results of participant interviews in other reports from this study available at http://iasp.brandeis.edu/capacity/evaluation.html.
Preliminary Return on Investment for Participants in Compass FSS Program at Two Years 53
TAFDC and Other Cash Assis tance Subsidies There are several government programs that provide cash assistance to supplement earned income. TAFDC is the TANF program in Massachusetts providing basic assistance for families with dependent children. Adults who experience some type of disability that hinders full employment may be eligible to receive Supplemental Security Income or SSI. Those who are temporally unemployed may be eligible for Unemployment Insurance (UI). Few Compass FSS participants receive any of these benefits. At baseline only three households received cash assistance from any of these programs for a monthly total of $2,142 or an average of $714 per recipient. At the 24-month point, six households were receiving at least one of these benefits (3 TANF, 2 SSI, 3 UI) for a monthly total of $6,164 or an average of $1,027 per household. Few conclusions can be drawn about this significant increase of 287.8% in average monthly public expenditure due to the very small number of program recipients. Health Care Subsidies The most common health care coverage for Compass FSS families is MassHealth (Medicaid). Under Massachusetts health care reform3, MassHealth covers parents with incomes up to 138% of the federal poverty level (FPL) who do not have health insurance through employment or other means, and it covers children in households up to 300% of FPL who have no other health insurance. In some families, the wage earner may be covered by employer subsidized insurance but the children are covered under MassHealth. Adults who are not eligible for MassHealth and do not have insurance through employment can enroll in Commonwealth Care which is a subsidized policy for adults with income up to 300% of FPL. Commonwealth Care has three plan types based on income levels with about half of enrollees required to pay a premium. Families who receive either of these forms of health care coverage have no means of knowing the cost of their medical care beyond any payment obligation they may have. By accessing state records for expenditures for MassHealth and Commonwealth Care, it is possible to calculate average monthly per person cost.4 Based on what Compass FSS participants reported as family members receiving coverage under either of these programs at the time of enrollment, the average monthly cost for the 32 families with coverage was $865. At the 24 month point, 33 families reported receiving healthcare coverage with an average of $826 per recipient family. At entry into Compass FSS, the estimated total monthly state/federal cost for coverage by either MassHealth or Commonwealth Care was $27,680 and at the 24 month point it was $27,256. This represents a 1.5% decreased in average monthly public expenditures. Food Subsidy At program entry, 20 of the Compass FSS program participants in this study provided documentation of benefits from the Supplemental Nutrition Assistance Program (SNAP, formerly known as food stamps) with total monthly benefits of $7,505 or $375 per household receiving benefits. At the 24 month point, 19 households reported receiving this benefit for a total of $6,716 per month or $353 per recipient household and $156 for all households. This represents a 10.5% decrease in average monthly public expenditures. As the level of SNAP benefits decreases
3 The period covered in this Return on Investment analysis is prior to the start date for applicable provisions of the federal Affordable Care Act, but is during the time when all the provisions of Massachusetts’s own major health reform were in place. 4 For details regarding this calculation, contact Sandra Venner at [email protected]
Preliminary Return on Investment for Participants in Compass FSS Program at Two Years 54
proportionately to increases in income, the reduction in average monthly benefits was likely impacted by the increase in average earned income. Child Care Subsidies The state assists low-income families access child care while working or in educational programs through contracts with child care providers or individual vouchers to be used with participating providers. A formula based on income, number of children in care, and type and hours of care determines the portion of costs paid by the parent. Although families know their own out-of-pocket payments for child care, they do not have documentation of the amount of state subsidy paid to the provider. It is also not possible to calculate the state’s contribution for each individual placement due to the complexity of payment based not only on parents’ ability to pay, but also age of child, type of care, hours per week, etc. Based on reports from the state citing maximum daily provider reimbursement rates for each type of care and factoring in very conservative assumptions about parents ability to pay and hours of care, $430 is used to represent the typical monthly child care subsidy for children in families in the Compass FSS program.5 At baseline, program participants reported receiving child care vouchers for 10 children. Using the above formula, the average monthly public expenditure was $4,300. At the 24 month point, only six children were reported as having subsidized child care for an average monthly public expenditure of $2,580. This results in a 40% decrease in government expenditures based on the above formula. An examination of the employment status of those parents who had vouchers at baseline may explain the decline in numbers. Some individuals who were employed at baseline were no longer working at the 24 month point negating the need for child care. On the other hand, other individuals employed at baseline reported substantial increases in earned income at 24 months which may have made them ineligible for subsidized child care. It is also possible that a child aged out of care or other care arrangements were made. Total Annual Publ i c Benef i t s Total public benefits include those discussed above and other benefits documented for Compass FSS participants such as the WIC program that provides food supplements for pregnant women, infants and children, SSI for children, and the fuel assistance program. At program entry the total annual public benefits reported and calculated for the 43 Compass FSS enrollees included in this study was $884,949 or an average of $20,580 per family. Housing subsidies and health care insurance coverage represent the greatest cost in government expenditures. At the 24 month point, the total amount of reported and calculated annual public benefits was $881,702 or an average of $20,505 per family. This is a .4% reduction in the cost of total annual public benefits received. As discussed above, a decrease in public benefits can be attributed to many factors, but the greatest contributor is an increase in earned income that makes the recipient eligible for reduced levels of assistance or loss of eligibility all together. Income Tax Credits For several decades both the federal and state governments have initiated tax credits to lessen the tax burden for lower income families and for all families with minor children and to incentivize greater work effort. While these tax credits are minuscule in comparison to the tax relief of mortgage and retirement savings deductions that principally benefit the middle and upper classes, 5 For details regarding this calculation, contact Sandra Venner at [email protected].
Preliminary Return on Investment for Participants in Compass FSS Program at Two Years 55
they do impact the amount of income taxes paid by families of modest means. As earned income increases, these tax credits decrease resulting in greater payment of income taxes that help support government services. With the low earned income typical of participants in the Compass FSS program, their net tax obligation is very small. Until such time as their income warrants substantial tax obligation, what is more significant in calculating the ROI is the amount of tax credits that reduce the amount of their tax obligation and may provide them with a refund intended to help offset what has been paid in payroll taxes (e.g. Social Security). Income tax data are available for 16 Compass FSS participants both at baseline and the 24-month point. Earned Income Tax Credi t The most significant tax credit is the federal Earned Income Tax Credit (EITC). In the tax year at program entry, 16 Compass FSS participants reported an average federal EITC tax credit of $3,238 and total tax credit of $51,804. In the tax year at the 24 month point 14 of these households received EITC for an average tax credit was $2,877 and a total of $40,284. This represents a 22.2% reduction of tax credits granted to FSS tax filers. For the state EITC, the average credit at baseline was $520 for a total of $7,794. At the 24 month point it was $423 for a total of $5,921 or 24% less. Several factors could cause this reduction––change of family composition or marital status, or loss of taxable income, or increased earned income that triggered a decline in the amount of the EITC received. Other Tax Credi ts The reported tax information also shows a large reduction in the Child Tax Credit. The average credit reported for the tax year at baseline was $1,844 with a total credit of $23,968. At the 24 month point the average credit was $997 and the total was $14,950 resulting in a 37.6% reduction in the amount of tax credit allowed. As income has to become substantially higher (beyond the eligibility cut-off for subsidized housing) for this tax credit to begin to decline, it is more likely the cause for this change is related to the family composition of those who reported data for this variable at the 24 month point. Data was also collected for other tax credits such as Making-Work-Pay that was available during this time period. The total amount of other tax credits claimed at baseline was $6,400 by 16 households and at 24-month the total had decreased to $5,239 although only five households reported getting such tax credits, thus greatly increasing the average. The reasons for the significant amount of tax credits claimed by these five households are unknown. Total Tax Credi ts The average total tax credits for the tax year at program entry were $5,623 for the 16 reporting household units for a total of $89,966. This decreased to an average of $4,150 per household unit for a total of $66,394 at the 24 month point. This represents a 26.2% reduction in tax credits that decrease tax payers’ obligations. It is unknown if there has been a corresponding increase in the actual amount of federal and state income taxes paid by these families.
Preliminary Return on Investment for Participants in Compass FSS Program at Two Years 56
Program Costs In September 2010, Compass Working Capital began enrolling participants in their innovative model of the HUD FSS program in Lynn, MA through a contractual arrangement with the local housing authority (LHAND). When program costs are calculated based on participant months that factor in the fact that participants began to enter the program throughout the year and therefore partial year enrollments need to be converted to full-year equivalents, the annual cost per participant was $6,755 in the first year of the program. Absorbed in this figure are the typical start-up costs and the disbursement of program costs over only a few participants in the first months of the program. By August 31, 2011 (the end of the first program year), there were 76 participants enrolled in the Compass FSS program making the cost $239 per participant for that final month of the first program year. In the second year of the program (9/1/11-8/31/12), participants both entered and exited during the year although the large majority were in the program for the full twelve months. Factoring in the partial year enrollment of some participants, the annual cost per participant per full-year equivalent was $2,429. By the last month of the year (August 2012) program enrollment reached 110 and per participant cost for that month dropped to $177. At the start of the third program year (9/1/12), Compass launched the FSS+ program in Cambridge, MA through an arrangement with the Cambridge Housing Authority and with the support of additional funding from several sources. With the start up in a new area and additional previously enrolled participants exiting the program, the majority of participants were in the program only part of the year. This raised the annual cost per full-year participant equivalent to $2,567. By the end of the last month of the year (August 2013) program enrollment reached 204 which brought per participant cost down to $147 for that month. The significant reduction of per participant full year equivalent annual cost in the third year of the program to 38.0% of original annual cost is both a factor of spreading costs over greater numbers and increased program efficiency. Conclusion Although there is a need to be very cautious about any conclusions drawn from this data, it appears that for a modest investment, the Compass FSS program has begun to generate returns for society as well as for program participants. The key limitations on the data stem from the fact that it was necessary to calculate some variables based on state average expenditures with several built-in assumptions and that, with the exception of the housing subsidy, the program is reliant on participants reporting benefit receipt and/or bringing in documentation at the time of their annual financial coaching session. Therefore, it is not possible, nor realistic, to claim direct program causal effect excluding all other factors. Bearing in mind the data limitations, the study shows that the average increase in annual earned income after two years of participating in the Compass FSS program was $2,606, realizing a benefit for individual families and an economic benefits for society as a whole. Over this time period, the average annual decrease in receipt of public assistance benefits was $75 or $150 over two years, starting a trend toward savings for both state and federal tax payers. The average reduction in tax credits was $1,473 which may translates into a greater sharing of the tax burden by participants.
Preliminary Return on Investment for Participants in Compass FSS Program at Two Years 57
These numbers compare to a two-year per participant full-year equivalent Compass FSS program cost of $7,834.6 7 Impact o f FSS Program Escrow Account Typically, an increase in income results in those receiving housing subsidies being responsible for a greater portion of the rent. For participants in the FSS program, the housing authority sets aside this increased rent payment in an escrow account to be maintained and used under the parameters of the program. HUD assumes the cost of this lost rent should participants become eligible to withdraw funds from the escrow account at a future date.8 If participants successfully graduate from the FSS program, they receive the savings that has accumulated in the escrow account. This results in a public expenditure at that point, however, without the incentive of the FSS program the increased earned income that seeded this account may never have been realized. Thus some program proponents argue that the escrow payment is cost neutral. Receipt of the escrow funds can also represent a significant contribution to the local economy. Nationally, the average amount saved in escrow is $5,300 with some FSS participants receiving much more. For many participants, this presents an opportunity to move out of subsidized housing into homeownership using their escrow savings to put a down payment on a home. Other uses for the escrow include establishment of a small business, furthering education, or purchase of a vehicle. Future Promise Based on Early Program Resul ts It should be noted that this is only a preliminary report on the return on investment. FSS is designed for participants to remain in the program for up to five years with an option for an extension. There will likely be additional increases in earned income and reductions in receipt of public assistance benefits and tax credits over the remainder of participants’ time in the program. Evidence from the participants who graduated early from the Compass FSS program indicates a very positive net return on investment for these families. As of November 1, 2013, two participants have graduated from the Compass FSS program and purchased homes. They not only realized a substantial increase in earned income over their brief period in the program, but now as homeowners are paying property tax and in other ways contributing to their community. It can be anticipated that future program graduates will also make substantial contributions to the local economy
6 Calculated by the average full-year equivalent annual cost over the three year period the 60 participants in this study were enrolled in the Compass FSS program for their first 24 months and multiplying the result by two. 7 Not included in this calculation is administrative costs of the housing authority for the operation of a FSS program covered by HUD. 8 See other reports on the Compass FSS program for a more detailed explanation of savings in escrow http://iasp.brandeis.edu/capacity/evaluation.html.
Preliminary Return on Investment for Participants in Compass FSS Program at Two Years 58
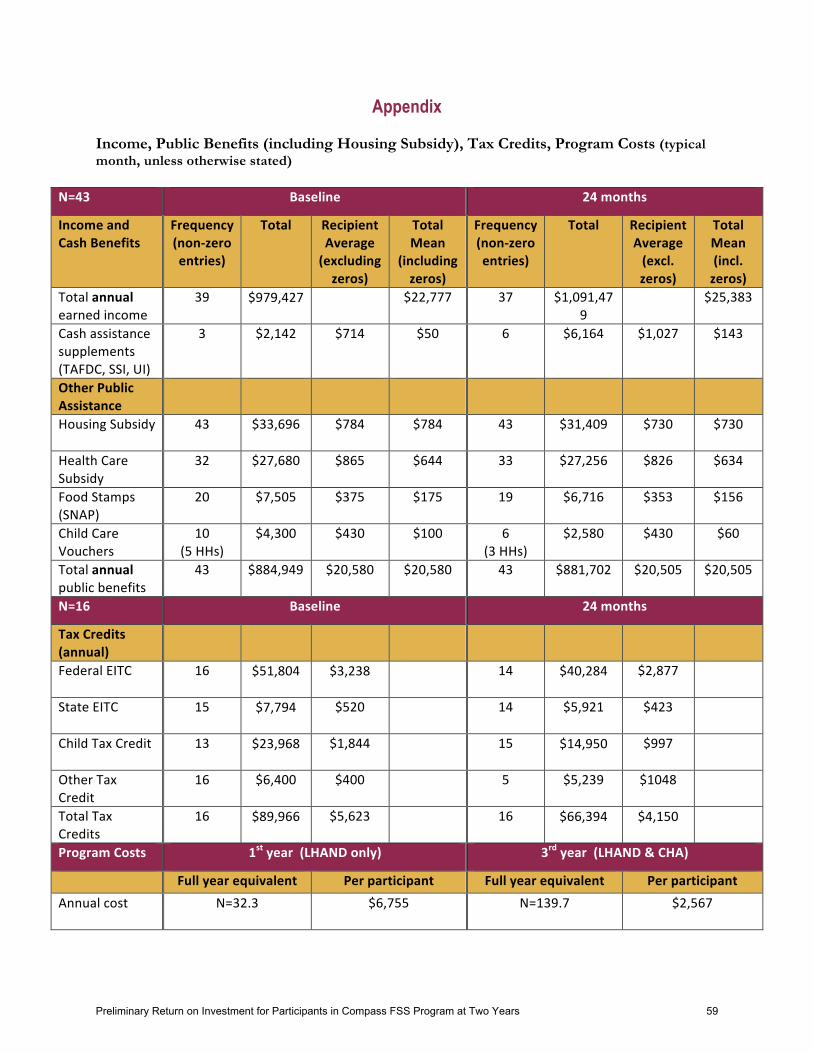
Appendix Income, Public Benefits (including Housing Subsidy), Tax Credits, Program Costs (typical month, unless otherwise stated)
N=43 Baseline 24 months
Income and Cash Benefits
Frequency (non-‐zero entries)
Total Recipient Average (excluding zeros)
Total Mean
(including zeros)
Frequency (non-‐zero entries)
Total Recipient Average (excl. zeros)
Total Mean (incl. zeros)
Total annual earned income
39 $979,427 $22,777 37 $1,091,479
$25,383
Cash assistance supplements (TAFDC, SSI, UI)
3 $2,142 $714 $50 6 $6,164 $1,027 $143
Other Public Assistance
Housing Subsidy 43 $33,696 $784 $784 43 $31,409 $730 $730
Health Care Subsidy
32 $27,680 $865 $644 33 $27,256 $826 $634
Food Stamps (SNAP)
20 $7,505 $375 $175 19 $6,716 $353 $156
Child Care Vouchers
10 (5 HHs)
$4,300 $430 $100 6 (3 HHs)
$2,580 $430 $60
Total annual public benefits
43 $884,949 $20,580 $20,580 43 $881,702 $20,505 $20,505
N=16 Baseline 24 months
Tax Credits (annual)
Federal EITC 16 $51,804 $3,238 14 $40,284 $2,877
State EITC 15 $7,794 $520 14 $5,921 $423
Child Tax Credit 13 $23,968 $1,844 15 $14,950 $997
Other Tax Credit
16 $6,400 $400 5 $5,239 $1048
Total Tax Credits
16 $89,966 $5,623 16 $66,394 $4,150
Program Costs 1st year (LHAND only) 3rd year (LHAND & CHA)
Full year equivalent Per participant Full year equivalent Per participant Annual cost N=32.3
$6,755 N=139.7
$2,567
Preliminary Return on Investment for Participants in Compass FSS Program at Two Years 59

Preliminary Return on Investment for Participants in Compass FSS Program at Two Years 60
COMPASS FSS PARTICIPANTS
AND OTHER LHAND HCV RECIPIENTS
Compass FSS Participants and Other LHAND HCV Recipients 61
COMPASS FSS PARTICIPANTS AND OTHER LHAND HCV RECIPIENTS
Objectives of the Study The first program participants enrolled in the Compass FSS (Financial Stability and Savings) program in September 2010 in Lynn, MA. Extensive data collection and tracking has made it possible to conduct a more comprehensive multi-year assessment of participant’s progress than standard FSS (Family Self-Sufficiency) program reporting. Financial indicators tracked at baseline since 2010 provide a comprehensive portrayal of key demographic and economic outcomes. Annual reporting has measured progress toward core Compass FSS program objectives related to income, employment, credit, debt, and asset accumulation, as well as early program effects on financial practices and perceptions of financial security and well-being.
The goal of this analysis is to compare Compass FSS participants who have been enrolled in the program at least two years to families with similar characteristics (non-elderly, non-disabled) not enrolled in the FSS program who are also receiving Housing Choice Vouchers (HCV, formerly known as Section 8) from LHAND for the past two years or longer. Data Sources and Analysis Approach
To provide information about the characteristics of its FSS participants, Compass collects baseline economic and demographic data at program enrollment. Compass tracks credit, debt, income, and public benefits data for participants on a semi-annual basis for the duration of the program. As of November 2013, 104 participants were enrolled in the Compass FSS program in Lynn. Sixty participants had reached their 24-month point in the program by that date. This analysis uses data documented for the 43 Compass FSS families who entered the program on or after October 1, 2010, reached the 24-month point prior to November 2013, and for whom there is complete income data. For the study of non-FSS participants enrolled in the LHAND HCV program for at least two years as of FY 2013, this analysis uses the most recent data from the Multifamily Tenant Characteristics System (MTCS). Data are derived from the Form 50058 submitted by LHAND to HUD that contains information on each family in the HCV and public housing programs, including demographics for family members and amounts of individual income. The sub-group (N=288) included in the study are non-elderly, non-disabled LHAND HCV families who are the prime target population for participation in the FSS program, but who have chosen not to enroll. Research, Data and Methodological Limitations An ideal evaluation of the FSS program would include experimental and random assignment studies conducted with matched non-FSS participants and participants in an FSS program to measure the impact of the added value of the FSS program on important economic indicators. The initial goal of the Compass FSS research project was to construct a quasi-comparative group analysis to measure the impact of the enhanced asset-building model of the Compass FSS program. The analysis originally called for a longitudinal tracking index between Compass FSS participants and the LHAND HCV (nonelderly & nondisabled) cohort to measure economic outcomes over a similar period of time. However, the comparative analysis in this study is much more limited than would be desired due to incomplete housing program data that has made such comparisons challenging. A
Compass FSS Participants and Other LHAND HCV Recipients 62
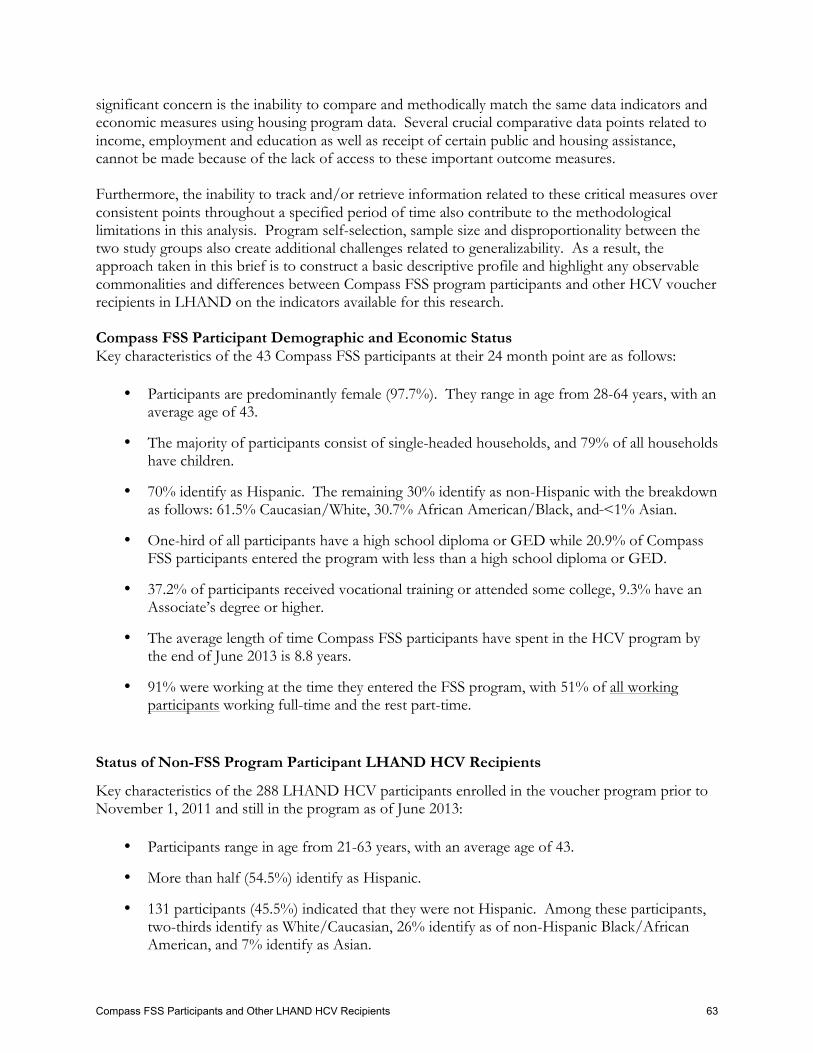
significant concern is the inability to compare and methodically match the same data indicators and economic measures using housing program data. Several crucial comparative data points related to income, employment and education as well as receipt of certain public and housing assistance, cannot be made because of the lack of access to these important outcome measures. Furthermore, the inability to track and/or retrieve information related to these critical measures over consistent points throughout a specified period of time also contribute to the methodological limitations in this analysis. Program self-selection, sample size and disproportionality between the two study groups also create additional challenges related to generalizability. As a result, the approach taken in this brief is to construct a basic descriptive profile and highlight any observable commonalities and differences between Compass FSS program participants and other HCV voucher recipients in LHAND on the indicators available for this research. Compass FSS Participant Demographic and Economic Status Key characteristics of the 43 Compass FSS participants at their 24 month point are as follows:
• Participants are predominantly female (97.7%). They range in age from 28-64 years, with an average age of 43.
• The majority of participants consist of single-headed households, and 79% of all households have children.
• 70% identify as Hispanic. The remaining 30% identify as non-Hispanic with the breakdown as follows: 61.5% Caucasian/White, 30.7% African American/Black, and <1% Asian.
• One-hird of all participants have a high school diploma or GED while 20.9% of Compass FSS participants entered the program with less than a high school diploma or GED.
• 37.2% of participants received vocational training or attended some college, 9.3% have an Associate’s degree or higher.
• The average length of time Compass FSS participants have spent in the HCV program by the end of June 2013 is 8.8 years.
• 91% were working at the time they entered the FSS program, with 51% of all working participants working full-time and the rest part-time.
Status of Non-FSS Program Participant LHAND HCV Recipients
Key characteristics of the 288 LHAND HCV participants enrolled in the voucher program prior to November 1, 2011 and still in the program as of June 2013:
• Participants range in age from 21-63 years, with an average age of 43.
• More than half (54.5%) identify as Hispanic.
• 131 participants (45.5%) indicated that they were not Hispanic. Among these participants, two-thirds identify as White/Caucasian, 26% identify as of non-Hispanic Black/African American, and 7% identify as Asian.
Compass FSS Participants and Other LHAND HCV Recipients 63
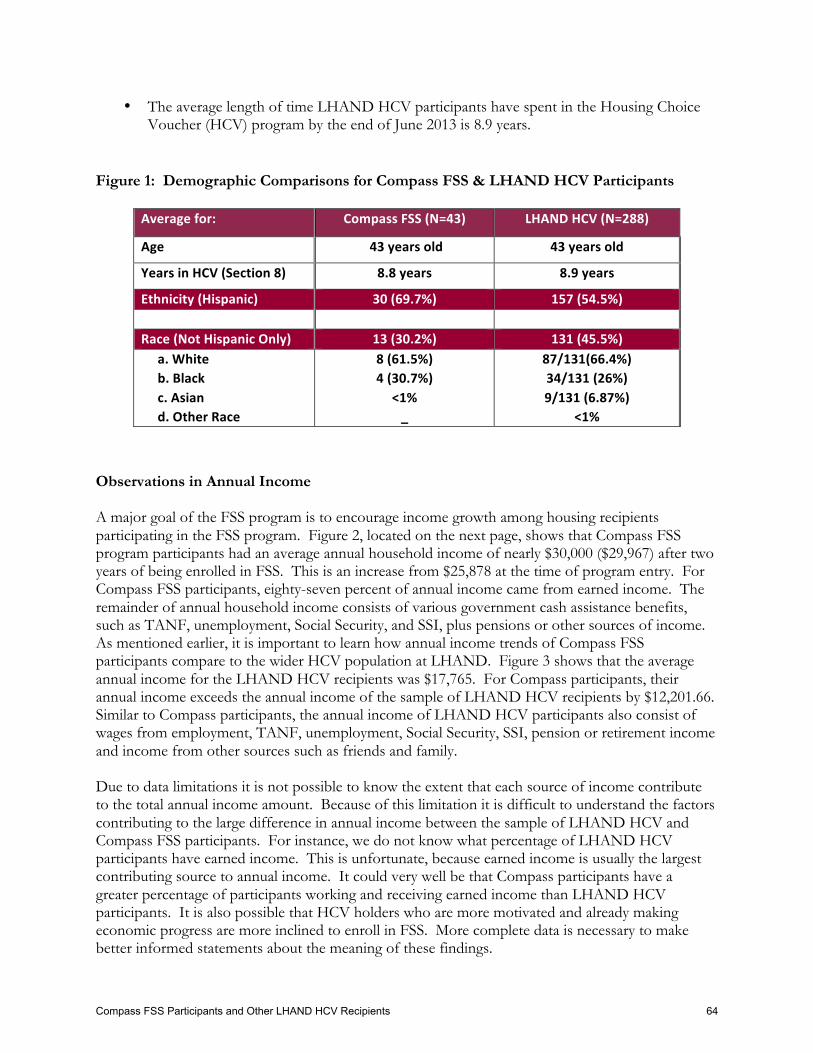
• The average length of time LHAND HCV participants have spent in the Housing Choice Voucher (HCV) program by the end of June 2013 is 8.9 years.
Figure 1: Demographic Comparisons for Compass FSS & LHAND HCV Participants
Observations in Annual Income A major goal of the FSS program is to encourage income growth among housing recipients participating in the FSS program. Figure 2, located on the next page, shows that Compass FSS program participants had an average annual household income of nearly $30,000 ($29,967) after two years of being enrolled in FSS. This is an increase from $25,878 at the time of program entry. For Compass FSS participants, eighty-seven percent of annual income came from earned income. The remainder of annual household income consists of various government cash assistance benefits, such as TANF, unemployment, Social Security, and SSI, plus pensions or other sources of income. As mentioned earlier, it is important to learn how annual income trends of Compass FSS participants compare to the wider HCV population at LHAND. Figure 3 shows that the average annual income for the LHAND HCV recipients was $17,765. For Compass participants, their annual income exceeds the annual income of the sample of LHAND HCV recipients by $12,201.66. Similar to Compass participants, the annual income of LHAND HCV participants also consist of wages from employment, TANF, unemployment, Social Security, SSI, pension or retirement income and income from other sources such as friends and family. Due to data limitations it is not possible to know the extent that each source of income contribute to the total annual income amount. Because of this limitation it is difficult to understand the factors contributing to the large difference in annual income between the sample of LHAND HCV and Compass FSS participants. For instance, we do not know what percentage of LHAND HCV participants have earned income. This is unfortunate, because earned income is usually the largest contributing source to annual income. It could very well be that Compass participants have a greater percentage of participants working and receiving earned income than LHAND HCV participants. It is also possible that HCV holders who are more motivated and already making economic progress are more inclined to enroll in FSS. More complete data is necessary to make better informed statements about the meaning of these findings.
Average for: Compass FSS (N=43) LHAND HCV (N=288)
Age 43 years old 43 years old
Years in HCV (Section 8) 8.8 years 8.9 years
Ethnicity (Hispanic) 30 (69.7%) 157 (54.5%) Race (Not Hispanic Only) 13 (30.2%) 131 (45.5%) a. White b. Black c. Asian d. Other Race
8 (61.5%) 4 (30.7%)
<1% _
87/131(66.4%) 34/131 (26%) 9/131 (6.87%)
<1%
Compass FSS Participants and Other LHAND HCV Recipients 64
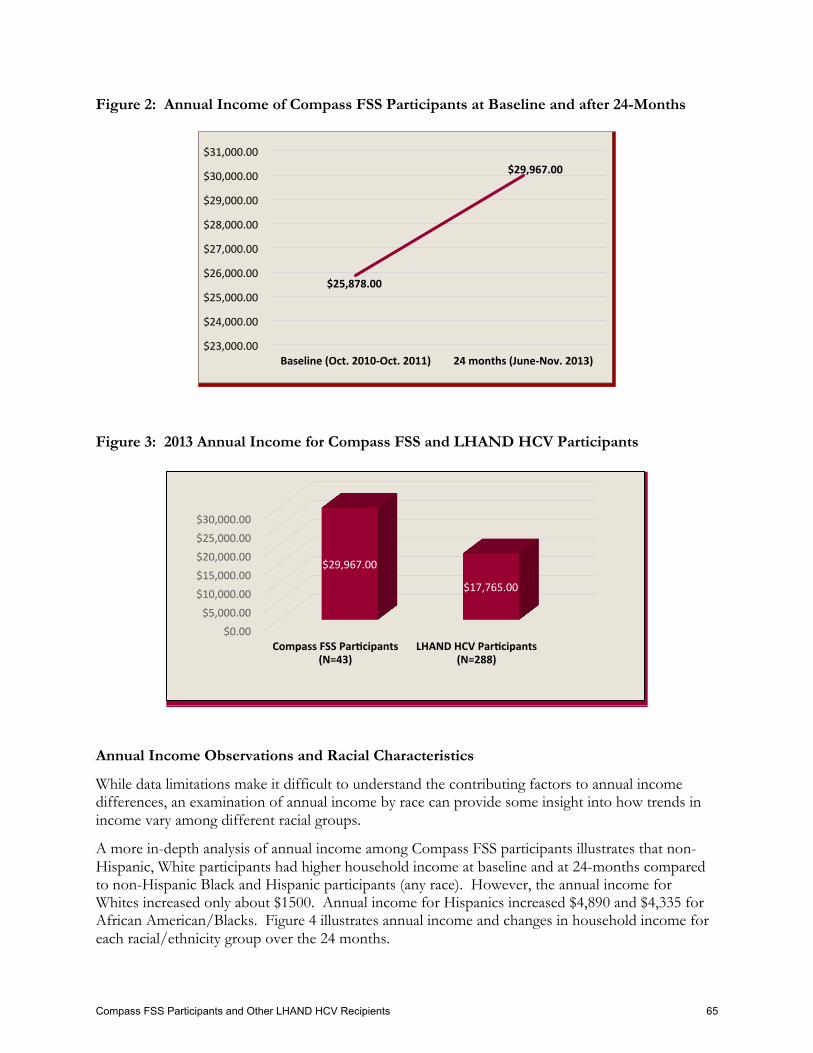
Figure 2: Annual Income of Compass FSS Participants at Baseline and after 24-Months
Figure 3: 2013 Annual Income for Compass FSS and LHAND HCV Participants
Annual Income Observations and Racial Characteristics
While data limitations make it difficult to understand the contributing factors to annual income differences, an examination of annual income by race can provide some insight into how trends in income vary among different racial groups.
A more in-depth analysis of annual income among Compass FSS participants illustrates that non-Hispanic, White participants had higher household income at baseline and at 24-months compared to non-Hispanic Black and Hispanic participants (any race). However, the annual income for Whites increased only about $1500. Annual income for Hispanics increased $4,890 and $4,335 for African American/Blacks. Figure 4 illustrates annual income and changes in household income for each racial/ethnicity group over the 24 months.
$25,878.00
$29,967.00
$23,000.00
$24,000.00
$25,000.00
$26,000.00
$27,000.00
$28,000.00
$29,000.00
$30,000.00
$31,000.00
Baseline (Oct. 2010-‐Oct. 2011) 24 months (June-‐Nov. 2013)
$0.00 $5,000.00
$10,000.00 $15,000.00 $20,000.00 $25,000.00 $30,000.00
Compass FSS Par^cipants (N=43)
LHAND HCV Par^cipants (N=288)
$29,967.00
$17,765.00
Compass FSS Participants and Other LHAND HCV Recipients 65
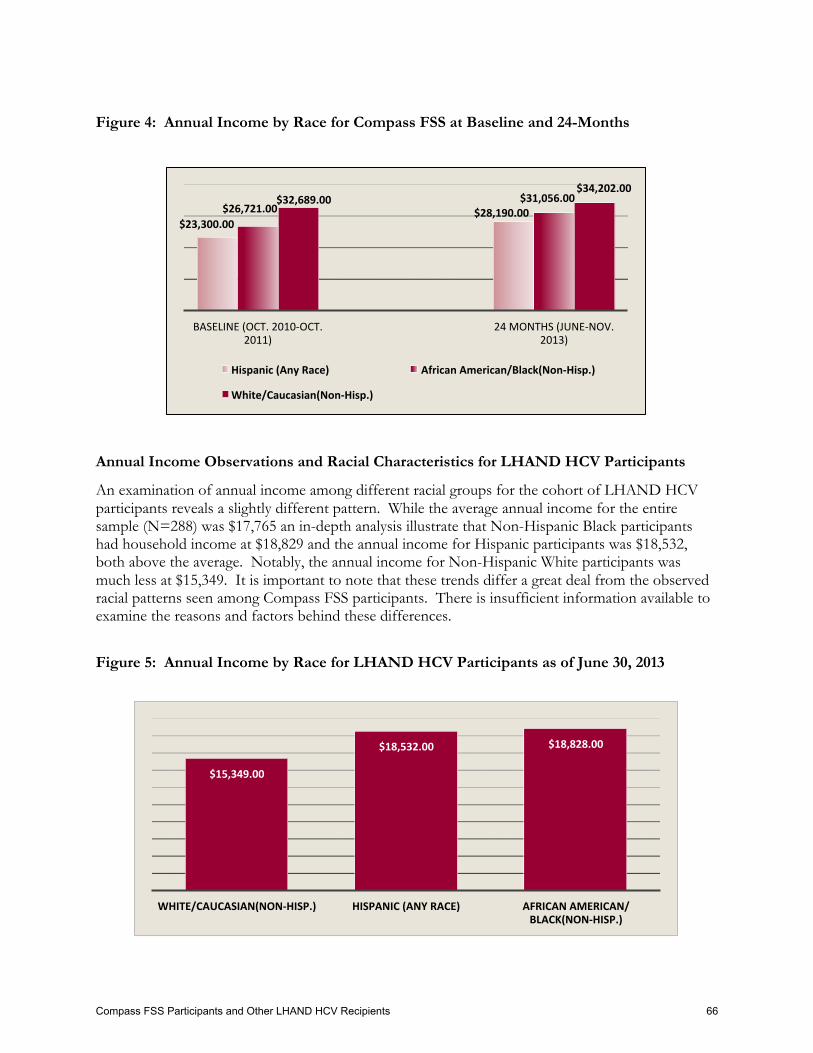
Figure 4: Annual Income by Race for Compass FSS at Baseline and 24-Months
Annual Income Observations and Racial Characteristics for LHAND HCV Participants
An examination of annual income among different racial groups for the cohort of LHAND HCV participants reveals a slightly different pattern. While the average annual income for the entire sample (N=288) was $17,765 an in-depth analysis illustrate that Non-Hispanic Black participants had household income at $18,829 and the annual income for Hispanic participants was $18,532, both above the average. Notably, the annual income for Non-Hispanic White participants was much less at $15,349. It is important to note that these trends differ a great deal from the observed racial patterns seen among Compass FSS participants. There is insufficient information available to examine the reasons and factors behind these differences.
Figure 5: Annual Income by Race for LHAND HCV Participants as of June 30, 2013
$15,349.00
$18,532.00 $18,828.00
WHITE/CAUCASIAN(NON-‐HISP.) HISPANIC (ANY RACE) AFRICAN AMERICAN/BLACK(NON-‐HISP.)
$23,300.00 $28,190.00 $26,721.00
$31,056.00 $32,689.00 $34,202.00
BASELINE (OCT. 2010-‐OCT. 2011)
24 MONTHS (JUNE-‐NOV. 2013)
Hispanic (Any Race) African American/Black(Non-‐Hisp.)
White/Caucasian(Non-‐Hisp.)
Compass FSS Participants and Other LHAND HCV Recipients 66
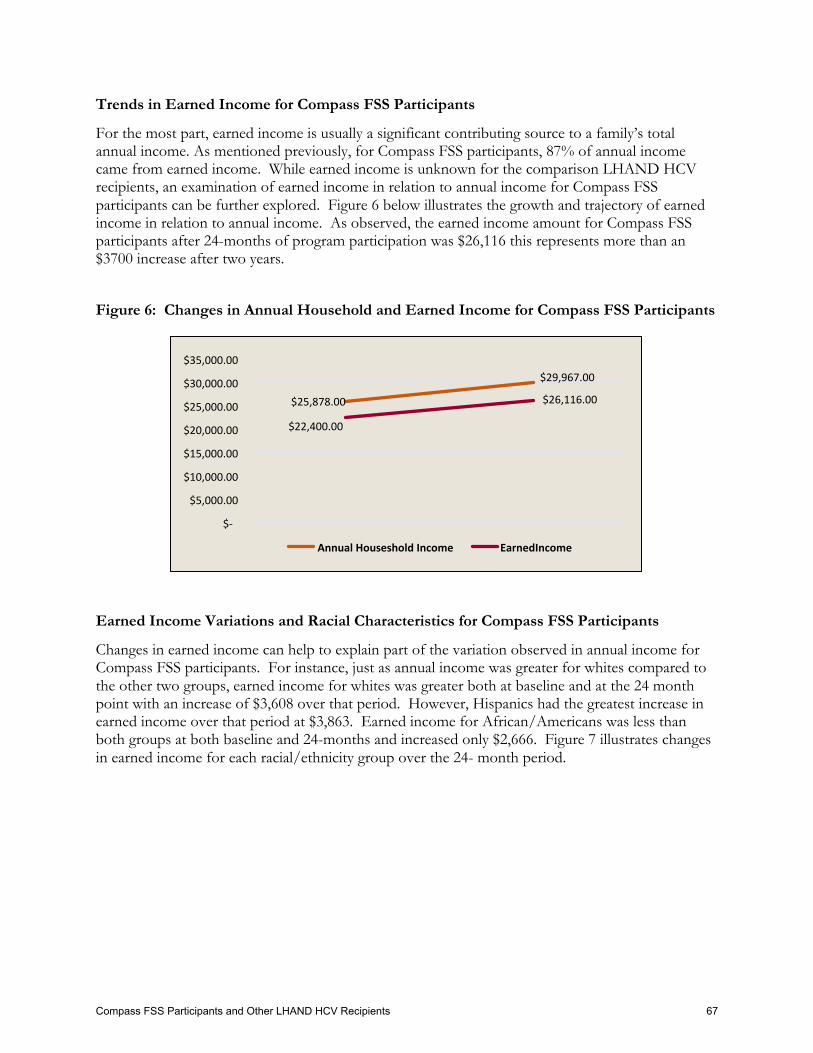
Trends in Earned Income for Compass FSS Participants
For the most part, earned income is usually a significant contributing source to a family’s total annual income. As mentioned previously, for Compass FSS participants, 87% of annual income came from earned income. While earned income is unknown for the comparison LHAND HCV recipients, an examination of earned income in relation to annual income for Compass FSS participants can be further explored. Figure 6 below illustrates the growth and trajectory of earned income in relation to annual income. As observed, the earned income amount for Compass FSS participants after 24-months of program participation was $26,116 this represents more than an $3700 increase after two years.
Figure 6: Changes in Annual Household and Earned Income for Compass FSS Participants
Earned Income Variations and Racial Characteristics for Compass FSS Participants
Changes in earned income can help to explain part of the variation observed in annual income for Compass FSS participants. For instance, just as annual income was greater for whites compared to the other two groups, earned income for whites was greater both at baseline and at the 24 month point with an increase of $3,608 over that period. However, Hispanics had the greatest increase in earned income over that period at $3,863. Earned income for African/Americans was less than both groups at both baseline and 24-months and increased only $2,666. Figure 7 illustrates changes in earned income for each racial/ethnicity group over the 24- month period.
$25,878.00
$29,967.00
$22,400.00
$26,116.00
$-‐
$5,000.00
$10,000.00
$15,000.00
$20,000.00
$25,000.00
$30,000.00
$35,000.00
Annual Houseshold Income EarnedIncome
Compass FSS Participants and Other LHAND HCV Recipients 67
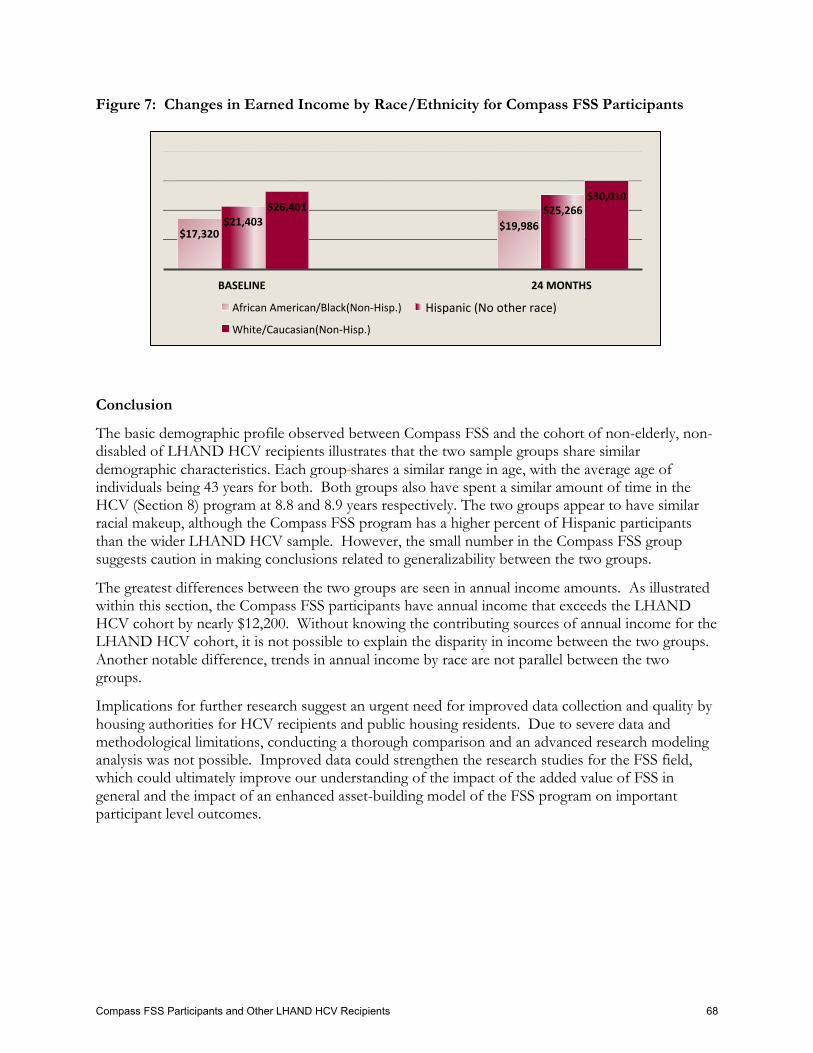
Figure 7: Changes in Earned Income by Race/Ethnicity for Compass FSS Participants
Conclusion
The basic demographic profile observed between Compass FSS and the cohort of non-elderly, non-disabled of LHAND HCV recipients illustrates that the two sample groups share similar demographic characteristics. Each group shares a similar range in age, with the average age of individuals being 43 years for both. Both groups also have spent a similar amount of time in the HCV (Section 8) program at 8.8 and 8.9 years respectively. The two groups appear to have similar racial makeup, although the Compass FSS program has a higher percent of Hispanic participants than the wider LHAND HCV sample. However, the small number in the Compass FSS group suggests caution in making conclusions related to generalizability between the two groups.
The greatest differences between the two groups are seen in annual income amounts. As illustrated within this section, the Compass FSS participants have annual income that exceeds the LHAND HCV cohort by nearly $12,200. Without knowing the contributing sources of annual income for the LHAND HCV cohort, it is not possible to explain the disparity in income between the two groups. Another notable difference, trends in annual income by race are not parallel between the two groups.
Implications for further research suggest an urgent need for improved data collection and quality by housing authorities for HCV recipients and public housing residents. Due to severe data and methodological limitations, conducting a thorough comparison and an advanced research modeling analysis was not possible. Improved data could strengthen the research studies for the FSS field, which could ultimately improve our understanding of the impact of the added value of FSS in general and the impact of an enhanced asset-building model of the FSS program on important participant level outcomes.
$17,320 $19,986 $21,403
$25,266 $26,401 $30,010
BASELINE 24 MONTHS
African American/Black(Non-‐Hisp.) Hispanic (No other race)
White/Caucasian(Non-‐Hisp.)
Compass FSS Participants and Other LHAND HCV Recipients 68
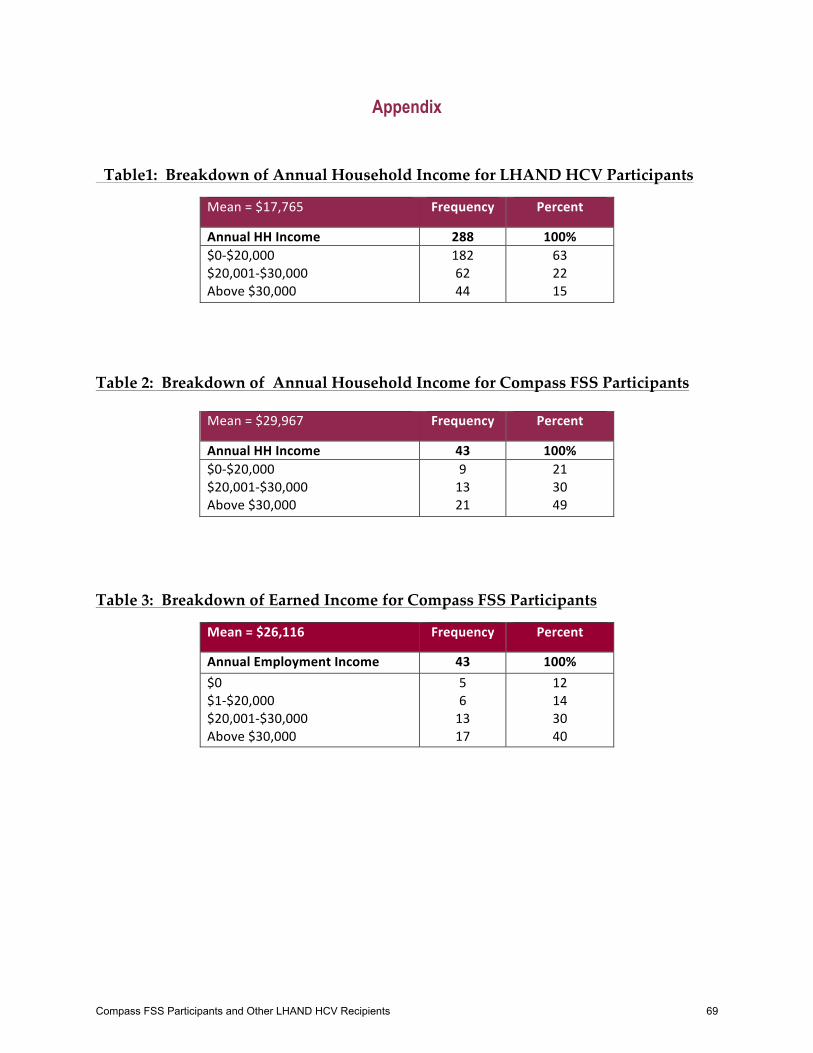
Appendix
Table1: Breakdown of Annual Household Income for LHAND HCV Participants
Mean = $17,765 Frequency Percent
Annual HH Income 288 100% $0-‐$20,000 $20,001-‐$30,000 Above $30,000
182 62 44
63 22 15
Table 2: Breakdown of Annual Household Income for Compass FSS Participants
Table 3: Breakdown of Earned Income for Compass FSS Participants
Mean = $26,116 Frequency Percent
Annual Employment Income 43 100% $0 $1-‐$20,000 $20,001-‐$30,000 Above $30,000
5 6 13 17
12 14 30 40
Mean = $29,967 Frequency Percent
Annual HH Income 43 100% $0-‐$20,000 $20,001-‐$30,000 Above $30,000
9 13 21
21 30 49
Compass FSS Participants and Other LHAND HCV Recipients 69
The Institute on Assets and Social Policy 415 South Street, MS 035
Waltham, MA 02454 (781) 736-8685
www.iasp.brandeis.edu
Related Documents