Compartment Proteomics Analysis of White Perch (Morone americana) Ovary Using Support Vector Machines Justin Schilling, † Angelito Nepomuceno, ‡ Jennifer E. Schaff, § David C. Muddiman, ‡ Harry V. Daniels, † and Benjamin J. Reading* ,† † Department of Applied Ecology, College of Agriculture and Life Sciences, ‡ W. M. Keck FT-ICR Mass Spectrometry Laboratory, Department of Chemistry, and § Genomic Sciences Laboratory, North Carolina State University, Raleigh 27695, North Carolina, United States * S Supporting Information ABSTRACT: Compartment proteomics enable broad charac- terization of target tissues. We employed a simple fractionation method and filter-aided sample preparation (FASP) to characterize the cytosolic and membrane fractions of white perch ovary tissues by semiquantitative tandem mass spectrom- etry using label-free quantitation based on normalized spectral counts. FASP depletes both low-molecular-weight and high- molecular-weight substances that could interfere with protein digestion and subsequent peptide separation and detection. Membrane proteins are notoriously difficult to characterize due to their amphipathic nature and association with lipids. The simple fractionation we employed effectively revealed an abundance of proteins from mitochondria and other membrane-bounded organelles. We further demonstrate that support vector machines (SVMs) offer categorical classification of proteomics data superior to that of parametric statistical methods such as analysis of variance (ANOVA). Specifically, SVMs were able to perfectly (100% correct) classify samples as either membrane or cytosolic fraction during cross-validation based on the expression of 242 proteins with the highest ANOVA p-values (i.e., those that were not significant for enrichment in either fraction). The white perch ovary cytosolic and membrane proteomes and transcriptome presented in this study can support future investigations into oogenesis and early embryogenesis of white perch and other members of the genus Morone. KEYWORDS: compartment proteomics, support vector machines, modulated modularity clustering, ovary, oocytes, vitellogenin, transcriptome, mitochondria, alternatively spliced variants ■ INTRODUCTION White perch (Morone americana) are native to lakes, rivers, and estuaries along the Mid-Atlantic and Northeastern seaboards of North America. Given their relatively broad niche distribution, white perch are a key indicator species for ecological monitoring. 1−3 White perch are temperate basses (genus Morone), a group of fishes that includes species of economic importance to commercial and recreational fisheries (striped bass, M. saxatilis) and aquaculture (hybrid striped bass, M. saxatilis X M. chrysops). Female reproductive dysfunction (i.e., production of inviable eggs, embryos, and larvae) remains a major obstacle to the expansion of finfish aquaculture and influences recruitment in fisheries and subsequent management practices. While transcriptomics and proteomics offer promise for greatly advancing the understanding of reproductive molecular biology, these methods rely on extant homologous databases, which remain incomplete for many non-model species including white perch and the other members of the genus Morone. Recent studies have provided the first ovary tran- scriptome sequences and proteomic analyses available for the striped bass. 4,5 The white perch is an important research model for oogenesis of fishes of genus Morone, 6−12 yet its ovary transcriptome and proteome are not described. Additionally, Acanthomorph teleosts, such as the temperate basses, express three distinct forms of vitellogenin (VtgAa, VtgAb, and VtgC). These egg yolk precursors are produced by the liver and released into the circulatory system where they are taken up specifically by growing oocytes. Understanding the disparate accumulation and processing of vitellogenins by the oocytes is relevant to egg quality, since these egg yolk components not only provide nutrition to embryos and larvae at specific developmental stages but also contribute to oocyte hydration and egg buoyancy as well. Therefore, the objectives of the present study were to generate an ovary transcriptome and cytosolic and membrane ovary proteomes for white perch to serve as resources for future investigations of reproduction and egg quality in temperate basses. We also measured the proportional abundance of the three vitellogenins in the white perch ovary at the late vitellogenic stage, just prior to ovulation. Received: October 25, 2013 Published: February 4, 2014 Article pubs.acs.org/jpr © 2014 American Chemical Society 1515 dx.doi.org/10.1021/pr401067g | J. Proteome Res. 2014, 13, 1515−1526

Welcome message from author
This document is posted to help you gain knowledge. Please leave a comment to let me know what you think about it! Share it to your friends and learn new things together.
Transcript
Compartment Proteomics Analysis of White Perch (Moroneamericana) Ovary Using Support Vector MachinesJustin Schilling,† Angelito Nepomuceno,‡ Jennifer E. Schaff,§ David C. Muddiman,‡ Harry V. Daniels,†
and Benjamin J. Reading*,†
†Department of Applied Ecology, College of Agriculture and Life Sciences, ‡W. M. Keck FT-ICR Mass Spectrometry Laboratory,Department of Chemistry, and §Genomic Sciences Laboratory, North Carolina State University, Raleigh 27695, North Carolina,United States
*S Supporting Information
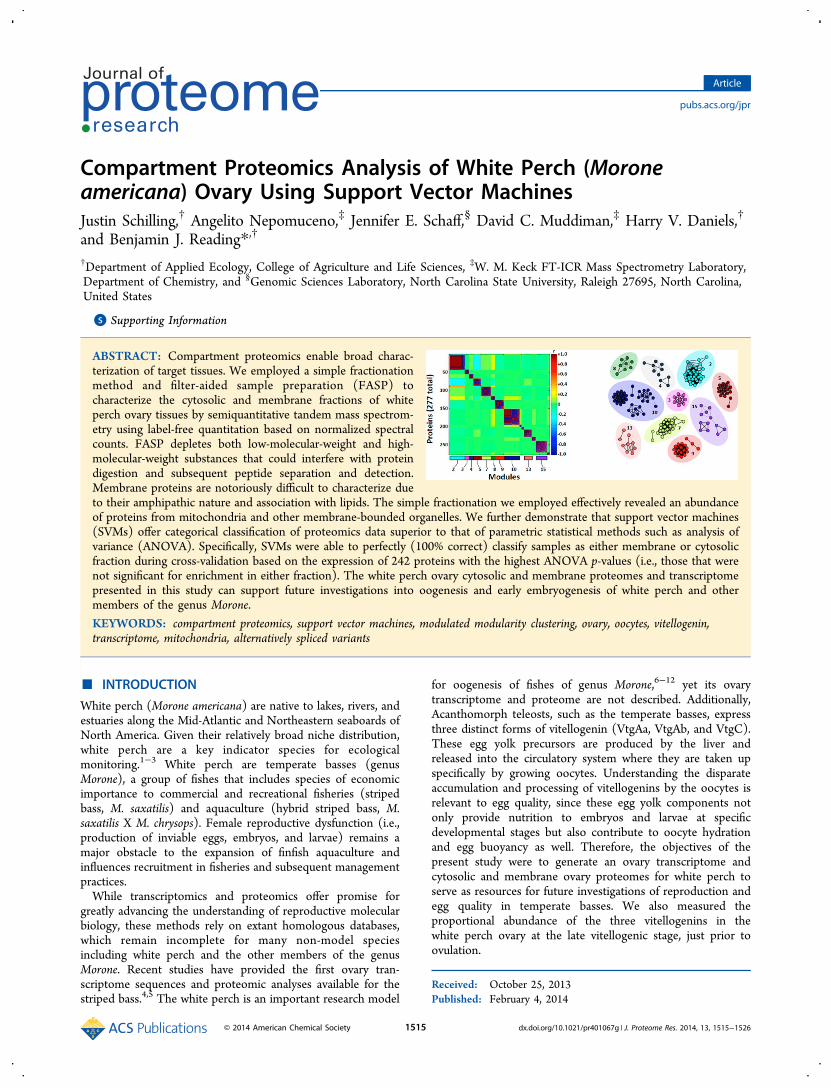
ABSTRACT: Compartment proteomics enable broad charac-terization of target tissues. We employed a simple fractionationmethod and filter-aided sample preparation (FASP) tocharacterize the cytosolic and membrane fractions of whiteperch ovary tissues by semiquantitative tandem mass spectrom-etry using label-free quantitation based on normalized spectralcounts. FASP depletes both low-molecular-weight and high-molecular-weight substances that could interfere with proteindigestion and subsequent peptide separation and detection.Membrane proteins are notoriously difficult to characterize dueto their amphipathic nature and association with lipids. The simple fractionation we employed effectively revealed an abundanceof proteins from mitochondria and other membrane-bounded organelles. We further demonstrate that support vector machines(SVMs) offer categorical classification of proteomics data superior to that of parametric statistical methods such as analysis ofvariance (ANOVA). Specifically, SVMs were able to perfectly (100% correct) classify samples as either membrane or cytosolicfraction during cross-validation based on the expression of 242 proteins with the highest ANOVA p-values (i.e., those that werenot significant for enrichment in either fraction). The white perch ovary cytosolic and membrane proteomes and transcriptomepresented in this study can support future investigations into oogenesis and early embryogenesis of white perch and othermembers of the genus Morone.
KEYWORDS: compartment proteomics, support vector machines, modulated modularity clustering, ovary, oocytes, vitellogenin,transcriptome, mitochondria, alternatively spliced variants
■ INTRODUCTION
White perch (Morone americana) are native to lakes, rivers, andestuaries along the Mid-Atlantic and Northeastern seaboards ofNorth America. Given their relatively broad niche distribution,white perch are a key indicator species for ecologicalmonitoring.1−3 White perch are temperate basses (genusMorone), a group of fishes that includes species of economicimportance to commercial and recreational fisheries (stripedbass, M. saxatilis) and aquaculture (hybrid striped bass, M.saxatilis X M. chrysops). Female reproductive dysfunction (i.e.,production of inviable eggs, embryos, and larvae) remains amajor obstacle to the expansion of finfish aquaculture andinfluences recruitment in fisheries and subsequent managementpractices.While transcriptomics and proteomics offer promise for
greatly advancing the understanding of reproductive molecularbiology, these methods rely on extant homologous databases,which remain incomplete for many non-model speciesincluding white perch and the other members of the genusMorone. Recent studies have provided the first ovary tran-scriptome sequences and proteomic analyses available for thestriped bass.4,5 The white perch is an important research model
for oogenesis of fishes of genus Morone,6−12 yet its ovarytranscriptome and proteome are not described. Additionally,Acanthomorph teleosts, such as the temperate basses, expressthree distinct forms of vitellogenin (VtgAa, VtgAb, and VtgC).These egg yolk precursors are produced by the liver andreleased into the circulatory system where they are taken upspecifically by growing oocytes. Understanding the disparateaccumulation and processing of vitellogenins by the oocytes isrelevant to egg quality, since these egg yolk components notonly provide nutrition to embryos and larvae at specificdevelopmental stages but also contribute to oocyte hydrationand egg buoyancy as well. Therefore, the objectives of thepresent study were to generate an ovary transcriptome andcytosolic and membrane ovary proteomes for white perch toserve as resources for future investigations of reproduction andegg quality in temperate basses. We also measured theproportional abundance of the three vitellogenins in thewhite perch ovary at the late vitellogenic stage, just prior toovulation.
Received: October 25, 2013Published: February 4, 2014
Article
pubs.acs.org/jpr
© 2014 American Chemical Society 1515 dx.doi.org/10.1021/pr401067g | J. Proteome Res. 2014, 13, 1515−1526
Cellular compartment fractionation can improve coverage inproteomics studies, enabling detection of moderate and lowabundance proteins.13,14 We employed a simple and cost-effective cellular compartment fractionation in order to broadlycharacterize the white perch ovary cytosolic and membraneproteomes representative of ovarian follicles on the cusp ofovulation. Furthermore, we employed support vector machines(SVMs) to analyze these data. The SVMs are supervisedmachine learning nonprobabilistic binary linear classifiers thatcan efficiently perform nonlinear classification as well using thekernel function15 and are superior to conventional parametricanalytical methods for categorical assignment of high-dimensionality data frequently encountered in ‘omics’ stud-ies.16,17 We used SVMs to classify samples as cytosolic ormembrane fractions based on protein expression data. Theseclassifiers performed perfectly even when data of those proteinswhose expression was not significantly enriched in eitherfraction by one-way analysis of variance (ANOVA) was used asinput.
■ EXPERIMENTAL SECTION
Sample Collection and Preparation
Adult female white perch were reared under controlledphotothermal conditions at the North Carolina State UniversityAquaculture Facility (Raleigh, NC).18,19 Females (N = 3) wereanesthetized with Finquel MS-222 (Argent Chemical Labo-ratories, Redmond, WA), and whole ovary tissues werecollected by dissection at a single time point in March 2013(body weight 114.95 ± 23.72 g; total length 195.67 ± 12.10mm; ovary weight 10.02 ± 1.91 g). The white perch is amultiple-clutch, group-synchronous spawner in which ovarianfollicles at several stages of development are present in theadult ovary.11,19 At this time in the annual reproductive cycle,the dominant clutch of follicles in the white perch ovary is latevitellogenic. A sample of each ovary was fixed in Bouin’ssolution for histology at the North Carolina State UniversityCollege of Veterinary Medicine Histology Laboratory (Raleigh,NC). Fractionation of the ovarian follicles was carried out usingmethods adapted from previous studies.9,10 Approximately 2 gof each ovary were pooled and homogenized by approximately10 strokes of Dounce homogenization in 24 mL (1 g/4 mL) ofTris-buffered saline (20 mM Tris-HCL pH 8.0, 150 mM NaCl,and 2 mM CaCl2) (all chemicals were purchased from SigmaAldrich, St. Louis, MO unless otherwise stated) and centrifugedat 13,000 × g for 15 min at 4 °C. The resulting supernatant wasretained as the ovary cytosolic fraction. The pellet comprisingthe ovary membrane fraction was resuspended in Tris-bufferedsaline and centrifuged at 13,000 × g for 15 min at 4 °C, and thesupernatant was discarded. This procedure was repeated fiveadditional times. The membrane pellet was then resuspended inice-cold Tris-buffered saline and homogenized using aBrinkmannPolytron PT10/35 tissue homogenizer on setting5 for two consecutive 30 s bursts on ice. The ovary membranefraction was then centrifuged a final time at 500 × g for 5 min at4 °C, after which the pellet was sequentially aspirated through18, 22, and finally 25 gauge needles until completelyresuspended in ice-cold Tris-buffered saline. Ovary cytosolicand membrane fractions were diluted with ice-cold Tris-buffered saline to final protein concentrations of 2 mg/mLdetermined by Bradford assay and frozen at −80 °C until use.
White Perch Ovary Transcriptome
Insert sequences from a UniZap II Lambda cDNA library ofvitellogenic white perch ovary11 were selectively amplified fromthe multiple cloning site by PCR using High Fidelity PlatinumPCR Supermix (Life Technologies, Grand Island, NY) and anSK forward primer (5′-CGC TCT AGA ACT AGT GGA TC-3′) and an oligo (dT)12−18 reverse primer. The PCRs wereperformed according to Reading et al.8 with the exception thatthe following thermal parameters were used: 94 °C for 2 minand then 35 cycles of 94 °C for 30 s, 56 °C for 30 s, and 68 °Cfor 5 min. Five micrograms of PCR products was submitted tothe NCSU Genomic Sciences Laboratory (Raleigh, NC) forstandard 454 pyrosequencing library preparation. The samplewas sequenced on one-half plate in the GS FLX 454 (Roche,Branford, CT). Vector sequence beginning with the SK primerand including the Xho cloning site was removed from the 5′end of all short read sequences, which were then assembledusing a version of CAP3.20 The parameters of the CAP3assembly were base quality cutoff for clipping = 12, overlaplength cutoff = 30, overlap percent identity cutoff = 75, overlapsimilarity score cutoff = 500, clipping range = 250, andminimum number of good reads at clipping position = 2. Thesesequences were subjected to BLAST (blastx)21 of the NCBIdatabase and annotated according to the Gene OntologyConsortium22 using Blast2GO 2048 M version 12.2.0.23−25
Parameters for blastx were Expect value 1 × 10⁻³ and HSPLength Cutoff 33. Parameters for the gene ontology (GO)annotations were E-value-hit-filter 1 × 10⁻⁶, Annotation Cutoff55, GO Weight 5, and HSP-Hit Coverage Cutoff 0. CombinedGO graphs for the annotated sequences (1,261 total) werecreated using percentages of second level GO terms forBiological Process, third level GO terms for MolecularFunction, and fourth level GO terms for Cellular Component.Represented GO classes were restricted to those with 50 ormore entities (sequence cutoff = 50.0); Sequence Filter = 50,Score alpha = 0.6, Node Score Filter = 10.
Filter-Aided Sample Preparation and Digestion
FASP was utilized with minor changes.26 The starting amountsfor the cytosolic and membrane fractions were 100 μg of totalprotein. Disulfide bonds were reduced by adding 3 μL of 50mM dithiothreitol (DTT) to 30 μL of sample followed byincubation at 56 °C for 30 min. Samples were then mixed with200 μL of 8 M urea in 0.1 M Tris-HCl pH 8.5. The solutionwas then transferred onto a Vivacon 500 30 kDa MW cutofffilter (Sartorius Stedim Biotech, Goettingen, Germany) andcentrifuged at 14,000 × g for 15 min at 21 °C. The urea washstep was repeated once more, and the flow through wasdiscarded. Iodoacetamide was prepared at a concentration of 50mM in 8 M urea, and 100 μL was added onto the filter. Thesamples were then incubated for 20 min in the dark at roomtemperature. Samples were then centrifuged at 14,000 × g for10 min at 21 °C. Wash steps then proceeded with 100 μL of 8M urea three times and 100 μL of 0.05 ammonium bicarbonatein H2O three times. After each series of urea and ammoniumbicarbonate washes, the flow though was discarded. Each washwas completed through centrifugation for 10 min at 14,000 × g.Trypsin was prepared with 50 mM ammonium bicarbonate andadded to samples at an enzyme to protein ratio of 1:100. Thefilter was then placed onto a new centrifuge tube. Solutionswere then incubated at 37 °C overnight. Trypic peptides werefiltered through by centrifugation at 14,000 × g for 10 min at 21°C.
Journal of Proteome Research Article
dx.doi.org/10.1021/pr401067g | J. Proteome Res. 2014, 13, 1515−15261516
nanoReversed Phase Chromatography and Tandem MassSpectrometry
Protein concentrations of the digests were obtained using aNanodrop at A280 (Thermo Scientific, Wilmington, DE).Samples were reconstituted to a protein concentration of 0.2μg/μL using mobile phase A (98/2/0.2% water/acetonitrile/formic acid), and a total of 5 μL was injected onto the trap fordesalting. Separation of peptides was performed using aThermo Scientific EASY nLC II (Thermo Scientific, San Jose,CA) in line with a cHiPLC nanoflex system (AB Sciex,Framingham, MA). A vented column configuration,27 aChromXP C18-CL 3 μm trap column, and a ChromXP C18-CL 75 μm × 15 cm analytical column were used for theseexperiments. The initial condition of 2% mobile phase B (2/98/0.2% water/acetonitrile/formic acid) was increased to 35%over 201 min, then steeply ramped to 95% mobile phase B over10 min and maintained at 95% mobile phase B for 10 min towash the column. The column was then equilibrated at 2%mobile phase B for 12 min. Each sample was analyzed intriplicate.The nanoLC configuration above was coupled to a
quadrupole orbitrap mass spectrometer28 (Q-Exactive, ThermoScientific, San Jose, CA). The Q-Exactive was operated usingoptimized global proteomics parameters described by Randallet al.29 Eluting peptides were ionized by applying 2.0 kV to aunion between the outlet of the LC system and the emitter tip.The MS inlet capillary was set to 275 °C. MS transients wereacquired with 70 kfwhm resolving power at m/z = 200. Theautomatic gain control (AGC) target for MS acquisitions wasset to 1 × 10⁶ with a maximum ion injection time of 30 ms. Thescan range was set to 400 to 1600 m/z. Data dependentacquisition was set for 12 MS/MS spectra, and the dynamicexclusion was set to 30 s. The MS/MS resolving power was setto 17.5 kfwhm at m/z = 200. The AGC was set to 2 × 10⁵ with amaximum ion injection time of 250 ms.
Mass Spectrometry Protein Identifications
Chromatogram files (.RAW) were processed into a peak listformat (.MGF) using Proteome Discoverer (Thermo Scientific,San Jose, CA). The resulting .MGF files were then searchedusing MASCOT30 (Matrix Science, Boston, MA) against thestriped bass ovary transcriptome (GenBank: SRX007394)4
translated in all six open reading frames with OrfPredictor31
and combined into one FASTA file that also contained theprotein sequences for the white perch VtgAa, VtgAb, and VtgC(GenBank Accession DQ020120.1, DQ020121.1, andDQ020122.1, respectively) and the white perch vitellogeninreceptor (LR8, GenBank Accession AY173045.1) for MAS-COT batch search. These four white perch sequences wereincluded, as the vtgAa, vtgAb, and vtgC are not expressed in theovary and the full-length vitellogenin receptor ortholog is notrepresented in the striped bass ovary transcriptome.4,5 Addi-tionally, the white perch ovary transcriptome was similarlytranslated and combined into one FASTA file for MASCOTbatch search. Sequences for human keratins and porcine trypsinsequences were added to both databases. The proteinsequences in both databases also were inverted for use inidentifying possible false positive peptides. The parameters forsearching the data in MASCOT were as follows: Carbamido-methyl (C) was set as a fixed modification and Carbamyl (K,N-term), Deamidation (NQ), Oxidation (M), Phospho (STY)were then set to variable modifications. The precursor ionssearch tolerance were 5 ppm, and the fragment ion tolerance
was set to ±0.02 Da. Statistical filtering using a 1% falsediscovery rate for identifying proteins was performed usingProteoIQ.32−34
Semiquantitative analysis was accomplished using spectralcounts. Spectral counts are confidently identified trypticpeptides of each protein. Normalized spectral counts (NSpC)were calculated using the total spectral counts within thereplicates of each sample and followed with the maximumspectral counts obtained from each ovary membrane andcytosolic replicate analysis. These normalized spectral counts(NSpC) for each of the three technical replicates per biologicalsample were exported from ProteoIQ and transformed toaccount for zero values [log10(y + 1), where y = NSpC].35
Striped bass ovary contigs corresponding to the white perchpeptides identified by MASCOT were further subjected toBLAST and annotated using Blast2GO as described above.Parameters for blastx were Expect value 1 × 10⁻³ and HSPLength Cutoff 33. Parameters for the GO annotations were E-value-hit-filter 1 × 10⁻⁶, Annotation Cutoff 55, GO Weight 5,and HSP-Hit Coverage Cutoff 0. Combined GO graphs for theannotated sequences (882 total) were created using percen-tages of second level GO terms for Biological Process, thirdlevel GO terms for Molecular Function, and sixth level GOterms for Cellular Component. Represented GO classes wererestricted to those with 50 or more entities (sequence cutoff =50.0); Sequence Filter = 50, Score alpha = 0.6, Node ScoreFilter = 10.
Data Analysis
Comparisons of the enrichment of proteins in the white perchovary cytosolic and membrane fractions were evaluated by one-way analysis of variance (ANOVA, α = 0.05) of log10(y + 1)transformed NSpC values using the GLM procedure in theSAS/STAT software, Version 9.3 of the SAS System forWindows (copyright 2012 SAS Institute Inc. SAS; all other SASInstitute Inc. product or service names are registeredtrademarks or trademarks of SAS Institute Inc., Cary, NC,USA). Following ANOVA, we employed two independentmethods of α correction: (1) standard Bonferroni and (2)Benjamini and Hochberg false discovery rate. Only peptideswith ≥0.5 average NSpC (NSpCavg) across all six technicalreplicates were confidently considered to be enriched in thecytosolic or membrane fraction.36
Residual values from the ANOVA for proteins significantlyenriched in the membrane or cytosolic fractions (p < 0.001)were input for modulated modularity clustering (MMC)performed using Pearson correlation coefficient.37 Thisstringent p-value cutoff was implemented to avoid inclusionof false positives in the clustering and also to provide areasonable catalog of proteins for further analysis by MMC.36
Similar p-value cutoffs are typically implemented in large-scalegene expression studies.38 Relevance association networks weregenerated from the MMC modules using Cytoscape version2.8.2 (www.cytoscape.org). Interactions between proteinswithin MMC modules were determined by correlationsexceeding |r| ≥ 0.99. The DAVID Functional ClassificationTool39 was used to group proteins based on functionalsimilarity within MMC modules. Default parameters forDAVID were used, and approved gene abbreviations for allwhite perch proteins were manually collected from the NCBIor GeneCards.40
We performed K-means clustering as an unsupervisedlearning tool to map protein expression [log10(y + 1)
Journal of Proteome Research Article
dx.doi.org/10.1021/pr401067g | J. Proteome Res. 2014, 13, 1515−15261517
transformed NSpC values] to either membrane or cytosoliccellular fractions using WEKA version 3.6.7 (http://www.cs.waikato.ac.nz/ml/weka/). The K-means algorithm clusters nobjects into k partitions based on attributes, in this case proteinexpression. We then evaluated the precision of clustering into 2clusters using WEKA sequential minimal optimization algo-rithm SVMs classifier.5,15,17 We employed two cross-validationstrategies to estimate classifier performance: (1) a percentagesplit whereby 66% of the data were randomly selected and usedto train the SVMs and the remaining 33% of the data wereinput as a cross-validation and (2) a 3-fold stratified hold-outwith n = 3 folds where one fold was used for cross-validationand n − 1 folds of the randomly reordered data set were usedfor training. The SVMs were used to classify samples as eithercytosolic or membrane using the complete protein expressiondata set as well as only those proteins that were not significantlyenriched in either fraction by ANOVA (p-values >0.05). Bothclasses (cytosolic and membrane fractions) were properlyrepresented in the SVMs training and cross-validation data sets.The performance of the SVMs was evaluated as a percent ofcorrect classification during the cross-validation. As a negativecontrol, the NSpC values for the whole data set were randomlyreordered and entered into SVMs as described above.
■ RESULTS
Ovary Histology
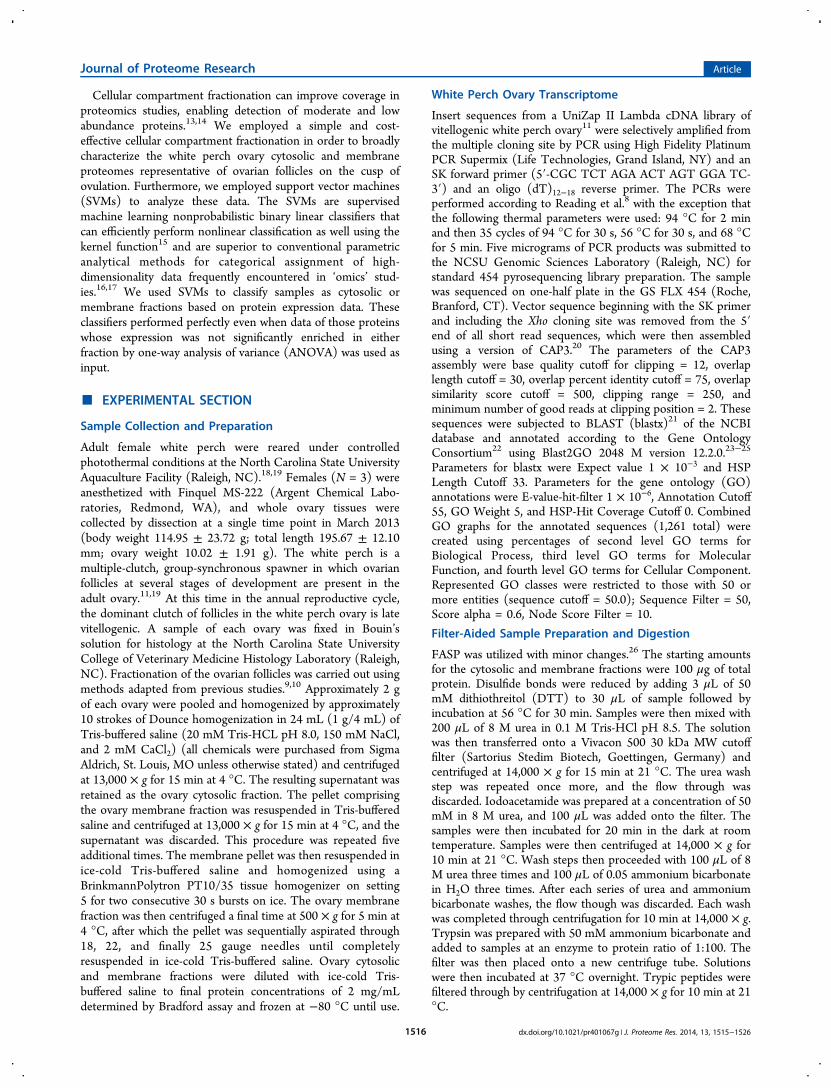
The most advanced clutch of follicles in each ovary was of thelate vitellogenic stage (oocyte diameter = 538 ± 24 μm)(Figure 1). The frequencies of follicles by stage in the whiteperch ovary were 44% primary growth (stage I), 7%perinucleolar (stage II), 8% lipidic (stage III), 8% corticalgranule (stage IV), 20% vitellogenic (stage V), 12% latevitellogenic (stage VI), and <1% atretic (stage VIII). This
distribution is typical of the late vitellogenic stage white perchovary.19
White Perch Ovary Transcriptome
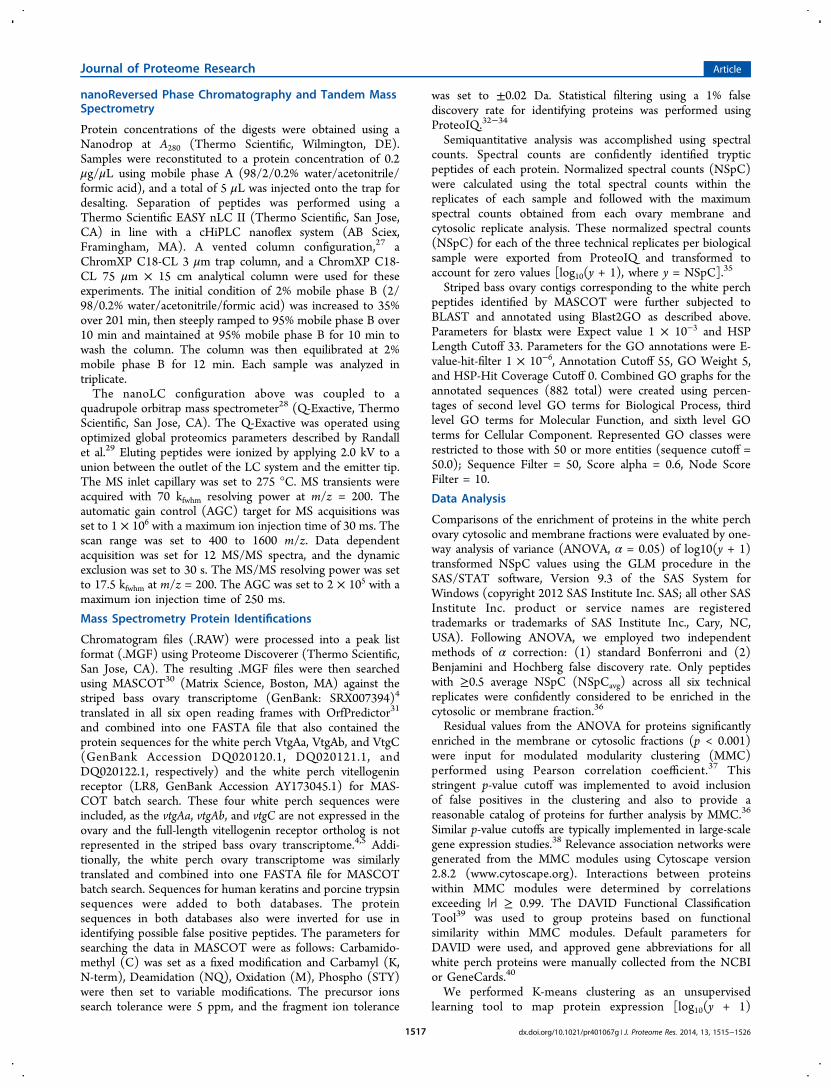
A total of 18,031 short reads were assembled into 362 contigswith 1,368 singletons remaining (GenBank: GAQS00000000).The contigs and singletons have average lengths of 339 bp and223 bp, respectively. The complete list of white perch ovarytranscript sequences, in FASTA format, is provided asSupplementary File S1 (Supporting Information). A total of1,261 sequences were annotated with GO terms (73% of thetotal 1,730 sequences), and the number of unknown uniquesequences was 30. The GO annotation breakdown of allannotated sequences is shown in Figure 2: Cellular Component(4th level), Molecular Function (3rd level), and BiologicalProcess (2nd level).
Tandem Mass Spectrometry
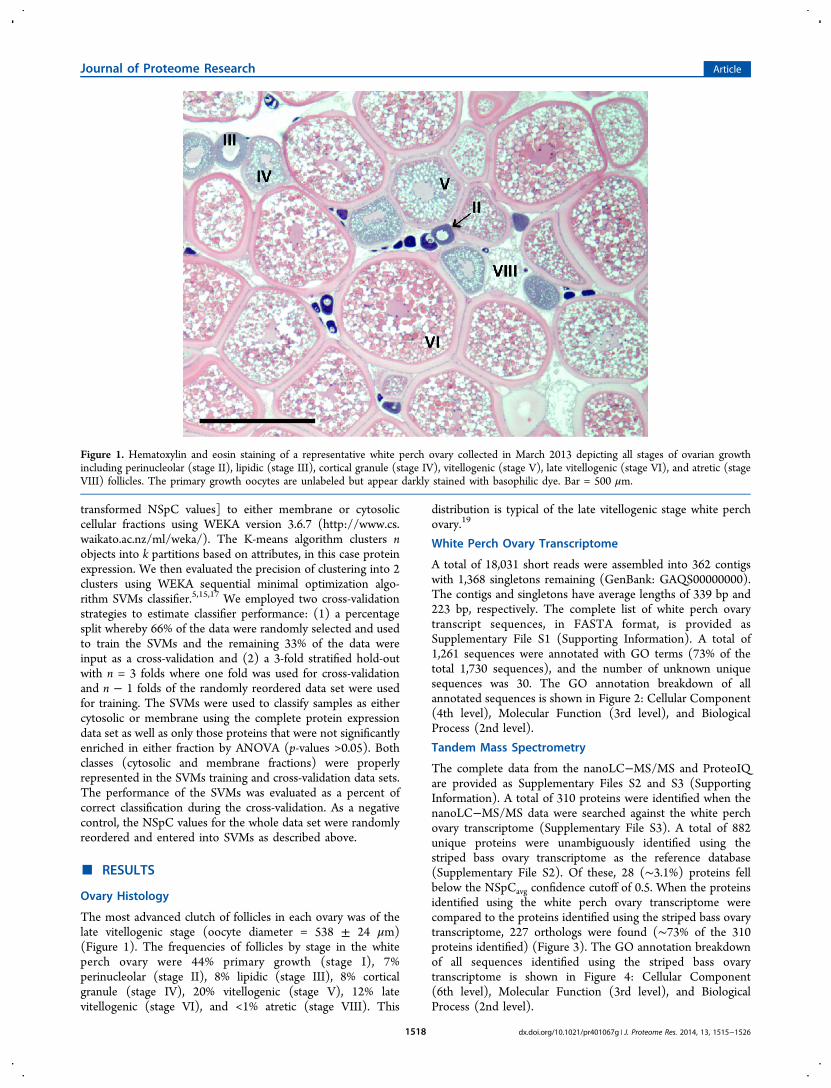
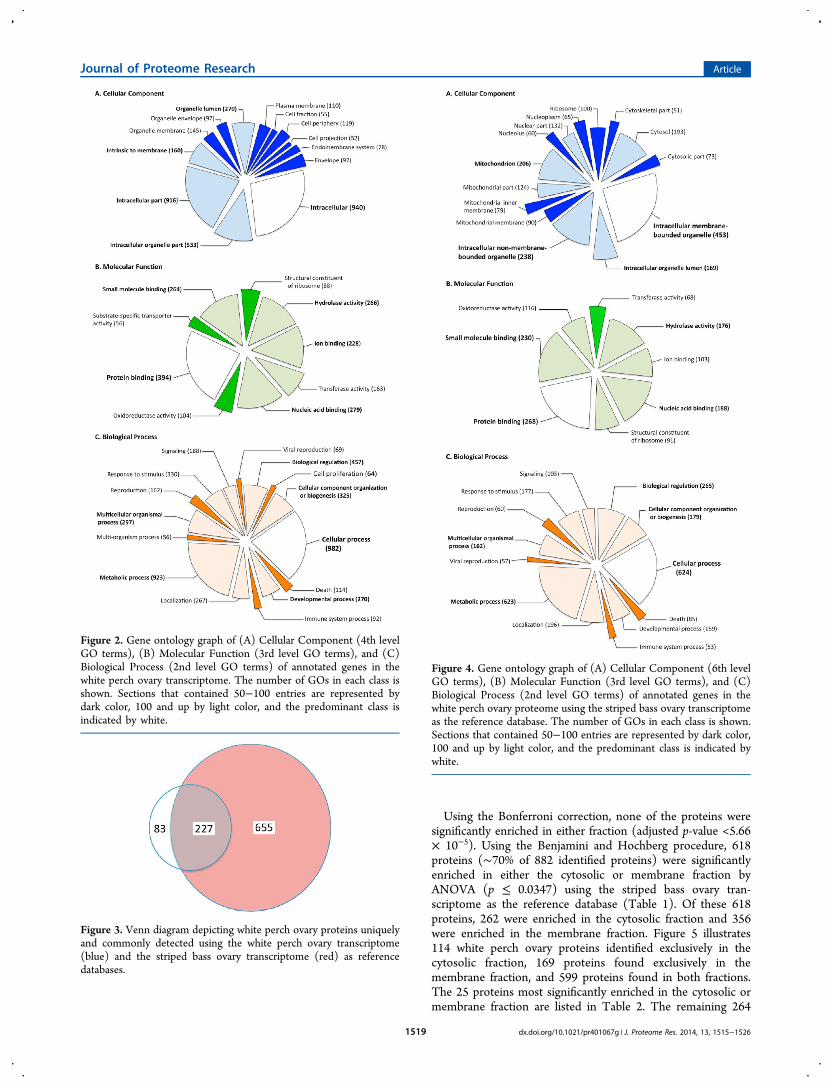
The complete data from the nanoLC−MS/MS and ProteoIQare provided as Supplementary Files S2 and S3 (SupportingInformation). A total of 310 proteins were identified when thenanoLC−MS/MS data were searched against the white perchovary transcriptome (Supplementary File S3). A total of 882unique proteins were unambiguously identified using thestriped bass ovary transcriptome as the reference database(Supplementary File S2). Of these, 28 (∼3.1%) proteins fellbelow the NSpCavg confidence cutoff of 0.5. When the proteinsidentified using the white perch ovary transcriptome werecompared to the proteins identified using the striped bass ovarytranscriptome, 227 orthologs were found (∼73% of the 310proteins identified) (Figure 3). The GO annotation breakdownof all sequences identified using the striped bass ovarytranscriptome is shown in Figure 4: Cellular Component(6th level), Molecular Function (3rd level), and BiologicalProcess (2nd level).
Figure 1. Hematoxylin and eosin staining of a representative white perch ovary collected in March 2013 depicting all stages of ovarian growthincluding perinucleolar (stage II), lipidic (stage III), cortical granule (stage IV), vitellogenic (stage V), late vitellogenic (stage VI), and atretic (stageVIII) follicles. The primary growth oocytes are unlabeled but appear darkly stained with basophilic dye. Bar = 500 μm.
Journal of Proteome Research Article
dx.doi.org/10.1021/pr401067g | J. Proteome Res. 2014, 13, 1515−15261518
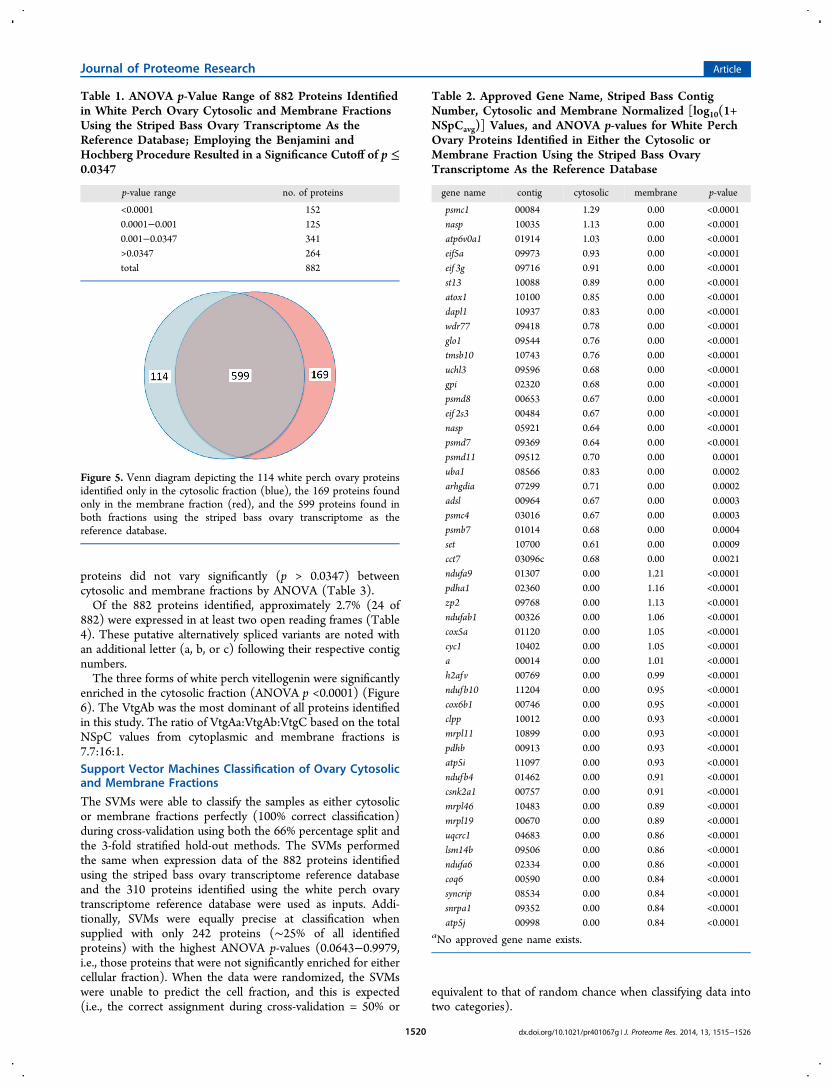
Using the Bonferroni correction, none of the proteins weresignificantly enriched in either fraction (adjusted p-value <5.66× 10⁻⁵). Using the Benjamini and Hochberg procedure, 618proteins (∼70% of 882 identified proteins) were significantlyenriched in either the cytosolic or membrane fraction byANOVA (p ≤ 0.0347) using the striped bass ovary tran-scriptome as the reference database (Table 1). Of these 618proteins, 262 were enriched in the cytosolic fraction and 356were enriched in the membrane fraction. Figure 5 illustrates114 white perch ovary proteins identified exclusively in thecytosolic fraction, 169 proteins found exclusively in themembrane fraction, and 599 proteins found in both fractions.The 25 proteins most significantly enriched in the cytosolic ormembrane fraction are listed in Table 2. The remaining 264
Figure 2. Gene ontology graph of (A) Cellular Component (4th levelGO terms), (B) Molecular Function (3rd level GO terms), and (C)Biological Process (2nd level GO terms) of annotated genes in thewhite perch ovary transcriptome. The number of GOs in each class isshown. Sections that contained 50−100 entries are represented bydark color, 100 and up by light color, and the predominant class isindicated by white.
Figure 3. Venn diagram depicting white perch ovary proteins uniquelyand commonly detected using the white perch ovary transcriptome(blue) and the striped bass ovary transcriptome (red) as referencedatabases.
Figure 4. Gene ontology graph of (A) Cellular Component (6th levelGO terms), (B) Molecular Function (3rd level GO terms), and (C)Biological Process (2nd level GO terms) of annotated genes in thewhite perch ovary proteome using the striped bass ovary transcriptomeas the reference database. The number of GOs in each class is shown.Sections that contained 50−100 entries are represented by dark color,100 and up by light color, and the predominant class is indicated bywhite.
Journal of Proteome Research Article
dx.doi.org/10.1021/pr401067g | J. Proteome Res. 2014, 13, 1515−15261519
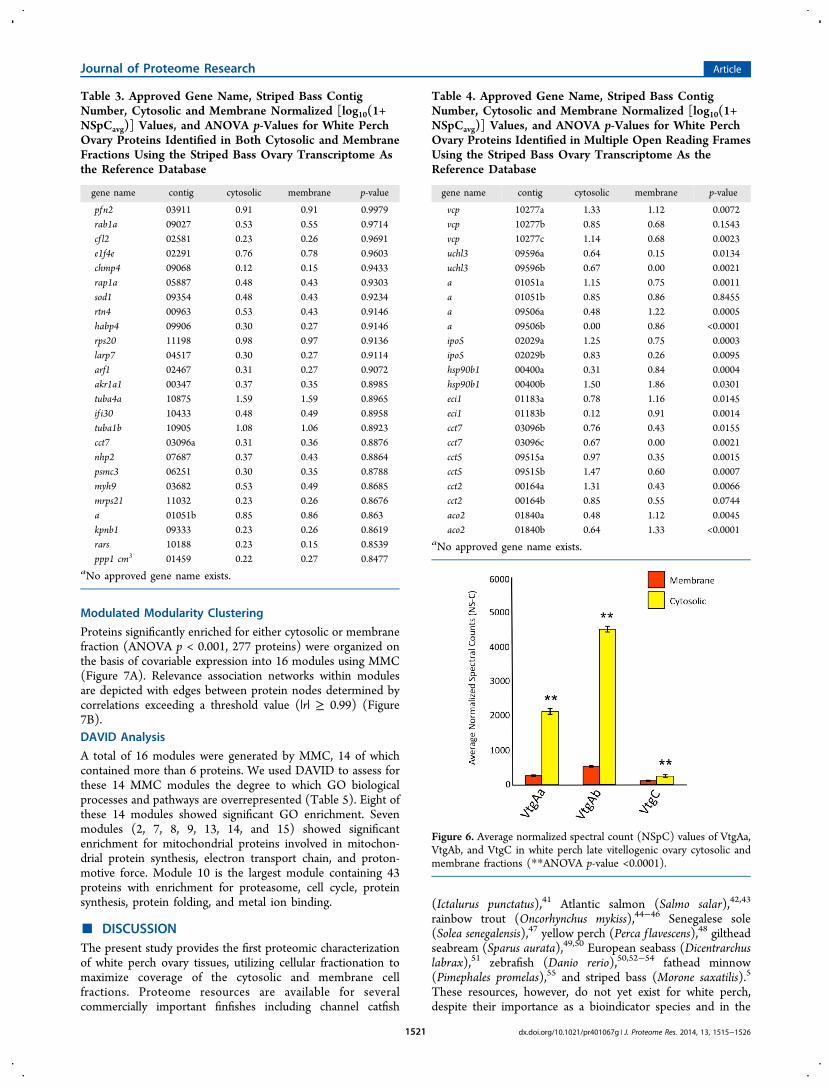
proteins did not vary significantly (p > 0.0347) betweencytosolic and membrane fractions by ANOVA (Table 3).Of the 882 proteins identified, approximately 2.7% (24 of
882) were expressed in at least two open reading frames (Table4). These putative alternatively spliced variants are noted withan additional letter (a, b, or c) following their respective contignumbers.The three forms of white perch vitellogenin were significantly
enriched in the cytosolic fraction (ANOVA p <0.0001) (Figure6). The VtgAb was the most dominant of all proteins identifiedin this study. The ratio of VtgAa:VtgAb:VtgC based on the totalNSpC values from cytoplasmic and membrane fractions is7.7:16:1.Support Vector Machines Classification of Ovary Cytosolicand Membrane Fractions
The SVMs were able to classify the samples as either cytosolicor membrane fractions perfectly (100% correct classification)during cross-validation using both the 66% percentage split andthe 3-fold stratified hold-out methods. The SVMs performedthe same when expression data of the 882 proteins identifiedusing the striped bass ovary transcriptome reference databaseand the 310 proteins identified using the white perch ovarytranscriptome reference database were used as inputs. Addi-tionally, SVMs were equally precise at classification whensupplied with only 242 proteins (∼25% of all identifiedproteins) with the highest ANOVA p-values (0.0643−0.9979,i.e., those proteins that were not significantly enriched for eithercellular fraction). When the data were randomized, the SVMswere unable to predict the cell fraction, and this is expected(i.e., the correct assignment during cross-validation = 50% or
equivalent to that of random chance when classifying data intotwo categories).
Table 1. ANOVA p-Value Range of 882 Proteins Identifiedin White Perch Ovary Cytosolic and Membrane FractionsUsing the Striped Bass Ovary Transcriptome As theReference Database; Employing the Benjamini andHochberg Procedure Resulted in a Significance Cutoff of p ≤0.0347
p-value range no. of proteins
<0.0001 1520.0001−0.001 1250.001−0.0347 341>0.0347 264total 882
Figure 5. Venn diagram depicting the 114 white perch ovary proteinsidentified only in the cytosolic fraction (blue), the 169 proteins foundonly in the membrane fraction (red), and the 599 proteins found inboth fractions using the striped bass ovary transcriptome as thereference database.
Table 2. Approved Gene Name, Striped Bass ContigNumber, Cytosolic and Membrane Normalized [log10(1+NSpCavg)] Values, and ANOVA p-values for White PerchOvary Proteins Identified in Either the Cytosolic orMembrane Fraction Using the Striped Bass OvaryTranscriptome As the Reference Database
gene name contig cytosolic membrane p-value
psmc1 00084 1.29 0.00 <0.0001nasp 10035 1.13 0.00 <0.0001atp6v0a1 01914 1.03 0.00 <0.0001eif5a 09973 0.93 0.00 <0.0001eif 3g 09716 0.91 0.00 <0.0001st13 10088 0.89 0.00 <0.0001atox1 10100 0.85 0.00 <0.0001dapl1 10937 0.83 0.00 <0.0001wdr77 09418 0.78 0.00 <0.0001glo1 09544 0.76 0.00 <0.0001tmsb10 10743 0.76 0.00 <0.0001uchl3 09596 0.68 0.00 <0.0001gpi 02320 0.68 0.00 <0.0001psmd8 00653 0.67 0.00 <0.0001eif 2s3 00484 0.67 0.00 <0.0001nasp 05921 0.64 0.00 <0.0001psmd7 09369 0.64 0.00 <0.0001psmd11 09512 0.70 0.00 0.0001uba1 08566 0.83 0.00 0.0002arhgdia 07299 0.71 0.00 0.0002adsl 00964 0.67 0.00 0.0003psmc4 03016 0.67 0.00 0.0003psmb7 01014 0.68 0.00 0.0004set 10700 0.61 0.00 0.0009cct7 03096c 0.68 0.00 0.0021ndufa9 01307 0.00 1.21 <0.0001pdha1 02360 0.00 1.16 <0.0001zp2 09768 0.00 1.13 <0.0001ndufab1 00326 0.00 1.06 <0.0001cox5a 01120 0.00 1.05 <0.0001cyc1 10402 0.00 1.05 <0.0001a 00014 0.00 1.01 <0.0001h2afv 00769 0.00 0.99 <0.0001ndufb10 11204 0.00 0.95 <0.0001cox6b1 00746 0.00 0.95 <0.0001clpp 10012 0.00 0.93 <0.0001mrpl11 10899 0.00 0.93 <0.0001pdhb 00913 0.00 0.93 <0.0001atp5i 11097 0.00 0.93 <0.0001ndufb4 01462 0.00 0.91 <0.0001csnk2a1 00757 0.00 0.91 <0.0001mrpl46 10483 0.00 0.89 <0.0001mrpl19 00670 0.00 0.89 <0.0001uqcrc1 04683 0.00 0.86 <0.0001lsm14b 09506 0.00 0.86 <0.0001ndufa6 02334 0.00 0.86 <0.0001coq6 00590 0.00 0.84 <0.0001syncrip 08534 0.00 0.84 <0.0001snrpa1 09352 0.00 0.84 <0.0001atp5j 00998 0.00 0.84 <0.0001
aNo approved gene name exists.
Journal of Proteome Research Article
dx.doi.org/10.1021/pr401067g | J. Proteome Res. 2014, 13, 1515−15261520
Modulated Modularity Clustering
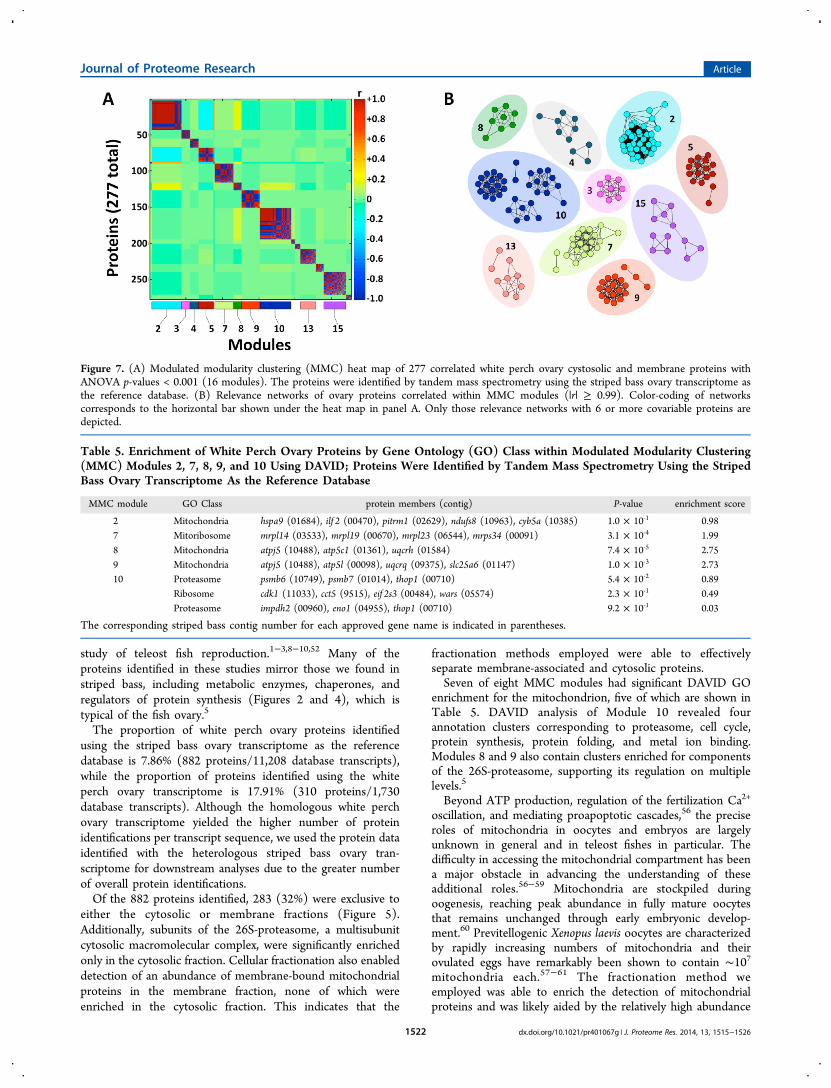
Proteins significantly enriched for either cytosolic or membranefraction (ANOVA p < 0.001, 277 proteins) were organized onthe basis of covariable expression into 16 modules using MMC(Figure 7A). Relevance association networks within modulesare depicted with edges between protein nodes determined bycorrelations exceeding a threshold value (|r| ≥ 0.99) (Figure7B).DAVID Analysis
A total of 16 modules were generated by MMC, 14 of whichcontained more than 6 proteins. We used DAVID to assess forthese 14 MMC modules the degree to which GO biologicalprocesses and pathways are overrepresented (Table 5). Eight ofthese 14 modules showed significant GO enrichment. Sevenmodules (2, 7, 8, 9, 13, 14, and 15) showed significantenrichment for mitochondrial proteins involved in mitochon-drial protein synthesis, electron transport chain, and proton-motive force. Module 10 is the largest module containing 43proteins with enrichment for proteasome, cell cycle, proteinsynthesis, protein folding, and metal ion binding.
■ DISCUSSIONThe present study provides the first proteomic characterizationof white perch ovary tissues, utilizing cellular fractionation tomaximize coverage of the cytosolic and membrane cellfractions. Proteome resources are available for severalcommercially important finfishes including channel catfish
(Ictalurus punctatus),41 Atlantic salmon (Salmo salar),42,43
rainbow trout (Oncorhynchus mykiss),44−46 Senegalese sole(Solea senegalensis),47 yellow perch (Perca f lavescens),48 giltheadseabream (Sparus aurata),49,50 European seabass (Dicentrarchuslabrax),51 zebrafish (Danio rerio),50,52−54 fathead minnow(Pimephales promelas),55 and striped bass (Morone saxatilis).5
These resources, however, do not yet exist for white perch,despite their importance as a bioindicator species and in the
Table 3. Approved Gene Name, Striped Bass ContigNumber, Cytosolic and Membrane Normalized [log10(1+NSpCavg)] Values, and ANOVA p-Values for White PerchOvary Proteins Identified in Both Cytosolic and MembraneFractions Using the Striped Bass Ovary Transcriptome Asthe Reference Database
gene name contig cytosolic membrane p-value
pfn2 03911 0.91 0.91 0.9979rab1a 09027 0.53 0.55 0.9714cf l2 02581 0.23 0.26 0.9691e1f4e 02291 0.76 0.78 0.9603chmp4 09068 0.12 0.15 0.9433rap1a 05887 0.48 0.43 0.9303sod1 09354 0.48 0.43 0.9234rtn4 00963 0.53 0.43 0.9146habp4 09906 0.30 0.27 0.9146rps20 11198 0.98 0.97 0.9136larp7 04517 0.30 0.27 0.9114arf1 02467 0.31 0.27 0.9072akr1a1 00347 0.37 0.35 0.8985tuba4a 10875 1.59 1.59 0.8965if i30 10433 0.48 0.49 0.8958tuba1b 10905 1.08 1.06 0.8923cct7 03096a 0.31 0.36 0.8876nhp2 07687 0.37 0.43 0.8864psmc3 06251 0.30 0.35 0.8788myh9 03682 0.53 0.49 0.8685mrps21 11032 0.23 0.26 0.8676a 01051b 0.85 0.86 0.863kpnb1 09333 0.23 0.26 0.8619rars 10188 0.23 0.15 0.8539ppp1 cm3 01459 0.22 0.27 0.8477
aNo approved gene name exists.
Table 4. Approved Gene Name, Striped Bass ContigNumber, Cytosolic and Membrane Normalized [log10(1+NSpCavg)] Values, and ANOVA p-Values for White PerchOvary Proteins Identified in Multiple Open Reading FramesUsing the Striped Bass Ovary Transcriptome As theReference Database
gene name contig cytosolic membrane p-value
vcp 10277a 1.33 1.12 0.0072vcp 10277b 0.85 0.68 0.1543vcp 10277c 1.14 0.68 0.0023uchl3 09596a 0.64 0.15 0.0134uchl3 09596b 0.67 0.00 0.0021a 01051a 1.15 0.75 0.0011a 01051b 0.85 0.86 0.8455a 09506a 0.48 1.22 0.0005a 09506b 0.00 0.86 <0.0001ipo5 02029a 1.25 0.75 0.0003ipo5 02029b 0.83 0.26 0.0095hsp90b1 00400a 0.31 0.84 0.0004hsp90b1 00400b 1.50 1.86 0.0301eci1 01183a 0.78 1.16 0.0145eci1 01183b 0.12 0.91 0.0014cct7 03096b 0.76 0.43 0.0155cct7 03096c 0.67 0.00 0.0021cct5 09515a 0.97 0.35 0.0015cct5 09515b 1.47 0.60 0.0007cct2 00164a 1.31 0.43 0.0066cct2 00164b 0.85 0.55 0.0744aco2 01840a 0.48 1.12 0.0045aco2 01840b 0.64 1.33 <0.0001
aNo approved gene name exists.
Figure 6. Average normalized spectral count (NSpC) values of VtgAa,VtgAb, and VtgC in white perch late vitellogenic ovary cytosolic andmembrane fractions (**ANOVA p-value <0.0001).
Journal of Proteome Research Article
dx.doi.org/10.1021/pr401067g | J. Proteome Res. 2014, 13, 1515−15261521
study of teleost fish reproduction.1−3,8−10,52 Many of theproteins identified in these studies mirror those we found instriped bass, including metabolic enzymes, chaperones, andregulators of protein synthesis (Figures 2 and 4), which istypical of the fish ovary.5
The proportion of white perch ovary proteins identifiedusing the striped bass ovary transcriptome as the referencedatabase is 7.86% (882 proteins/11,208 database transcripts),while the proportion of proteins identified using the whiteperch ovary transcriptome is 17.91% (310 proteins/1,730database transcripts). Although the homologous white perchovary transcriptome yielded the higher number of proteinidentifications per transcript sequence, we used the protein dataidentified with the heterologous striped bass ovary tran-scriptome for downstream analyses due to the greater numberof overall protein identifications.Of the 882 proteins identified, 283 (32%) were exclusive to
either the cytosolic or membrane fractions (Figure 5).Additionally, subunits of the 26S-proteasome, a multisubunitcytosolic macromolecular complex, were significantly enrichedonly in the cytosolic fraction. Cellular fractionation also enableddetection of an abundance of membrane-bound mitochondrialproteins in the membrane fraction, none of which wereenriched in the cytosolic fraction. This indicates that the
fractionation methods employed were able to effectivelyseparate membrane-associated and cytosolic proteins.Seven of eight MMC modules had significant DAVID GO
enrichment for the mitochondrion, five of which are shown inTable 5. DAVID analysis of Module 10 revealed fourannotation clusters corresponding to proteasome, cell cycle,protein synthesis, protein folding, and metal ion binding.Modules 8 and 9 also contain clusters enriched for componentsof the 26S-proteasome, supporting its regulation on multiplelevels.5
Beyond ATP production, regulation of the fertilization Ca2+
oscillation, and mediating proapoptotic cascades,56 the preciseroles of mitochondria in oocytes and embryos are largelyunknown in general and in teleost fishes in particular. Thedifficulty in accessing the mitochondrial compartment has beena major obstacle in advancing the understanding of theseadditional roles.56−59 Mitochondria are stockpiled duringoogenesis, reaching peak abundance in fully mature oocytesthat remains unchanged through early embryonic develop-ment.60 Previtellogenic Xenopus laevis oocytes are characterizedby rapidly increasing numbers of mitochondria and theirovulated eggs have remarkably been shown to contain ∼107mitochondria each.57−61 The fractionation method weemployed was able to enrich the detection of mitochondrialproteins and was likely aided by the relatively high abundance
Figure 7. (A) Modulated modularity clustering (MMC) heat map of 277 correlated white perch ovary cystosolic and membrane proteins withANOVA p-values < 0.001 (16 modules). The proteins were identified by tandem mass spectrometry using the striped bass ovary transcriptome asthe reference database. (B) Relevance networks of ovary proteins correlated within MMC modules (|r| ≥ 0.99). Color-coding of networkscorresponds to the horizontal bar shown under the heat map in panel A. Only those relevance networks with 6 or more covariable proteins aredepicted.
Table 5. Enrichment of White Perch Ovary Proteins by Gene Ontology (GO) Class within Modulated Modularity Clustering(MMC) Modules 2, 7, 8, 9, and 10 Using DAVID; Proteins Were Identified by Tandem Mass Spectrometry Using the StripedBass Ovary Transcriptome As the Reference Database
MMC module GO Class protein members (contig) P-value enrichment score
2 Mitochondria hspa9 (01684), ilf 2 (00470), pitrm1 (02629), ndufs8 (10963), cyb5a (10385) 1.0 × 10‑1 0.987 Mitoribosome mrpl14 (03533), mrpl19 (00670), mrpl23 (06544), mrps34 (00091) 3.1 × 10‑4 1.998 Mitochondria atpj5 (10488), atp5c1 (01361), uqcrh (01584) 7.4 × 10‑5 2.759 Mitochondria atpj5 (10488), atp5l (00098), uqcrq (09375), slc25a6 (01147) 1.0 × 10‑3 2.7310 Proteasome psmb6 (10749), psmb7 (01014), thop1 (00710) 5.4 × 10‑2 0.89
Ribosome cdk1 (11033), cct5 (9515), eif 2s3 (00484), wars (05574) 2.3 × 10‑1 0.49Proteasome impdh2 (00960), eno1 (04955), thop1 (00710) 9.2 × 10‑1 0.03
The corresponding striped bass contig number for each approved gene name is indicated in parentheses.
Journal of Proteome Research Article
dx.doi.org/10.1021/pr401067g | J. Proteome Res. 2014, 13, 1515−15261522
of mitochondria present in late vitellogenic white perchoocytes. Given their role in activation of the caspase pathwayand apoptosis,62 mitochondria are interesting candidates forfurther investigation into their role in egg quality of stripedbass, particularly in relation to the phenomena of ovarian atresiaand egg overripening.63
Alternative gene transcript splicing may underlie species-specific differences in phenotype.64 The putative spliced variantproteins listed in Table 4 encompass a diverse array ofbiological functions including mitochondrial beta-oxidation andtricarboxylic acid cycle (eci1 and aco2, respectively), deubiquiti-nation (uchl3), nucleocytoplasmic transport (ipo5), molecularchaperone (cct2, cct7, and hsp90b1), and cell cycle regulation(vcp). Alternatively spliced variants have previously beenreported for eci1, cct2, cct7, and uchl3. Of the 5 putative splicedvariants included in the MMC modules, 3 were also included inthe relevance networks (Figure 7B). Specifically, aco2(contig01840b) was included in network 9, and unnamedcontig09506a and cct5 (contig09515b) were included innetwork 10. Two of these putative spliced variants, aco2 andcct5, are located at or near the central network hubs and haveperfect connectivity to all nodes within their respectiverelevance networks. The remaining putative spliced variantsare members of highly intraconnected relevance networks thatcontain many edges. Proteins located at the center of relevanceassociation networks have many interaction partners and areoften associated with signaling, development, and disease andgenerally may be ascribed a regulatory function.65 Furtherinvestigation into alternatively spliced variants may uncoverdistinct regulatory functions for these proteins in fish oocytesand developing embryos.Support vector machines have been used to accurately
classify gene and protein expression patterns in response toendocrine disruption and during different ovarian growth stagesin fishes.5,66−68 The utility of SVMs for classification ofproteomics data that are not significant by linear statistics isevident in the present study. While we unambiguouslyidentified 618 proteins (∼70% of the total proteins) by massspectrometry that were significantly enriched in either thecytosolic or membrane fraction by one-way ANOVA (p ≤0.0347), the remaining 264 proteins did not significantly vary inabundance between cytosolic and membrane fractions (Table1). When the expression data of 242 proteins with ANOVA p-values = 0.0643−0.9979 were input, SVMs were able to classifythe samples as cytosolic or membrane fraction with perfect(100%) precision during cross-validation. Therefore, SVMs arean effective analytical method when it comes to classification ofproteomics data based upon cell fraction, even when expressiondata of proteins that were not significantly enriched for eitherfraction were used as the input.The three white perch vitellogenins were shown to comprise
31.2% VtgAa, 64.8% VtgAb, and 4.0% VtgC of the totalvitellogenin-derived egg yolk in late vitellogenic oocytes(Supplementary File S2; Figure 6). This ratio (7.7:16:1,respectively) more closely resembles that of barfin flounder(Verasper moseri) than that of the closely related striped bass(1.43:1.4:1, or 37.38% VtgAa, 36.55% VtgAb, and 26.07%VtgC).69,70 These findings further support the concept ofspecies-specific variation in egg yolk composition of fishes withmultiple vitellogenin systems.71 Such a stark difference in yolkcomposition between the white perch and the closely relatedstriped bass may relate to distinct patterns of oocyte hydrationthat could underlie differences in reproductive strategies.
Specifically, striped bass are anadromous, entering brackishand fresh water from the sea to spawn their neutrally buoyant,pelagic eggs. While marine populations do exist, white perch areprimarily a freshwater species that spawns adhesive, semipelagiceggs in estuaries, rivers, lakes, and marshes.72 The proportionalyolk composition in oocytes of various fishes to date indicatesthat VtgC is the most variable vitellogenin-derived egg yolkcomponent between species. For instance, in barfin flounder,gray mullet (Mugil cephalus), and white perch, VtgC derivedyolk proteins are minor and comprise ∼5% of yolk in latevitellogenic oocytes,69,73 whereas in mosquitofish (Gambusiaaf f inis)74 and striped bass69 they comprise a significantly largerproportion of the yolk (20−30%). Slight variation incomposition of VtgAa and VtgAb are observed betweenspecies; however, these are typically between 1:1 and 1:2(VtgAa:VtgAb) with the exception of the goldsinny wrasse(Ctenolabrus rupestris).75 This indicates that VtgC is likely animportant factor in egg yolk composition, and differences in itsaccumulation by oocytes of diverse fish species may relate tospecific early life histories and reproductive strategies. Furtherinvestigation is required to more fully understand thisphenomenon.
■ CONCLUSIONS
Membrane proteins perform crucial cellular functions and aredifficult to characterize due to their amphipathic nature andassociation with membrane lipids.76 Mature fish oocytes arecomplex cells with a highly yolked cytoplasm, makingcharacterization of their membrane proteins even morechallenging. The relatively simple and inexpensive compart-ment proteomics methods we employed helped to enrichdetection of membrane-associated proteins, particularly thoserelated to the mitochondrion and other membrane-boundedorganelles. Additionally, we show that SVMs are a superioranalytical method for classification of proteomics data basedupon cell fraction.
■ ASSOCIATED CONTENT
*S Supporting Information
Supplementary File S1: The white perch ovary transcriptome.Supplementary File S2: A table of 882 unique proteinsunambiguously identified in the late vitellogenic white perchovary when the nanoLC−MS/MS and ProteoIQ data weresearched against the striped bass ovary transcriptome as thereference database. Supplementary File S3: A table of 310unique proteins unambiguously identified in the late vitello-genic white perch ovary when the nanoLC−MS/MS andProteoIQ data were searched against the white perch ovarytranscriptome as the reference database. This material isavailable free of charge via the Internet at http://pubs.acs.org.
■ AUTHOR INFORMATION
Corresponding Author
*Tel: (919) 515-3380. Fax: (919) 515-5327. E-mail: [email protected].
Notes
The authors declare no competing financial interest.
Journal of Proteome Research Article
dx.doi.org/10.1021/pr401067g | J. Proteome Res. 2014, 13, 1515−15261523
■ ACKNOWLEDGMENTS
We thank Brad Ring and John Davis (North Carolina StateUniversity Aquaculture Facility) for care and maintenance ofthe white perch.
■ ABBREVIATIONS
ANOVA, analysis of variance; SVMs, support vector machines;MMC, modulated modularity clustering; FASP, filter aidedsample preparation; DTT, dithiothreitol; LC, liquid chroma-tography; MS, mass spectrometry; MS/MS, tandem massspectrometry; nanoLC, nanoscale liquid chromatography;nanoLC−MS/MS, nanoscale liquid chromatography coupledto tandem mass spectrometry; AGC, automatic gain control;GO, gene ontology; Vtg, vitellogenin
■ REFERENCES(1) Barnthouse, L. W.; Glaser, D.; DeSantis, L. Polychlorinatedbiphenyls and Hudson River white perch: Implications for population-level ecological risk assessment and risk management. Integr. Environ.Assess. Manag. 2009, 5, 435.(2) King, R. S.; Beaman, J. R.; Whigham, D. F.; Hines, A. H.; Baker,M. E.; Weller, D. E. Watershed land use is strongly linked to PCBs inwhite perch in Chesapeake Bay subestuaries. Environ. Sci. Technol.2013, 38, 6546−52.(3) Hiramatsu, N.; Matsubara, T.; Fujita, T.; Sullivan, C. V.; Hara, A.Multiple piscine vitellogenins: biomarkers of fish exposure toestrogenic endocrine disruptors in aquatic environments. MarineBiol. 2006, 149, 35−47.(4) Reading, B. J.; Chapman, R. W.; Schaff, J. E.; Scholl, E. H.;Opperman, C. H.; Sullivan, C. V. An ovary transcriptome for allmaturational stages of the striped bass (Morone saxatilis), a highlyadvanced perciform fish. BMC Res. Notes 2012, 5 (111), 1−12.(5) Reading, B. J.; Williams, V. N.; Chapman, R. W.; Williams, T. I.;Sullivan, C. V. Dynamics of the striped bass (Morone saxatilis) ovaryproteome reveal a complex network of the translasome. J. ProteomeRes. 2013, 12, 1691−99.(6) Tao, Y.; Berlinsky, D. L.; Sullivan, C. V. Characterization of avitellogenin receptor in white perch (Morone americana). Biol. Reprod.1996, 55, 646−56.(7) Hiramatsu, N.; Luo, W.; Reading, B. J.; Sullivan, C. V. Multipleovarian lipoprotein receptors in teleosts. Fish Physiol. Biochem. 2013,39, 29−32.(8) Reading, B. J.; Hiramatsu, N.; Sawaguchi, S.; Matsubara, T.; Hara,A.; Lively, M. O.; Sullivan, C. V. Conserved and variant molecular andfunctional features of multiple egg yolk precursor proteins(vitellogenins) in white perch (Morone americana) and other teleosts.Mar. Biotechnol. 2009, 11, 169−87.(9) Reading, B. J.; Hiramatsu, N.; Sullivan, C. V. Disparate binding ofthree types of vitellogenin to multiple forms of vitellogenin receptor inwhite perch. Biol. Reprod. 2011, 84, 392−99.(10) Hiramatsu, N.; Matsubara, T.; Hara, A.; Donato, D. M.;Hiramatsu, K.; Denslow, N. D.; Sullivan, C. V. Identification,purification and classification of multiple forms of vitellogenin fromwhite perch (Morone americana). Fish Physiol. Biochem. 2002, 26, 355−70.(11) Hiramatsu, N.; Chapman, R. W.; Lindzey, J. K.; Haynes, M. R.;Sullivan, C. V. Molecular characterization and expression ofvitellogenin receptor from white perch (Morone americana). Biol.Reprod. 2004, 70, 1720−30.(12) Hiramatsu, N.; Luo, W.; Reading, B. J.; Sullivan, C. V.; Mizuta,H.; Ryu, Y. W.; Nishimiya, O.; Todo, T.; Hara, A. Multiple ovarianlipoprotein receptors in teleosts. Fish Physiol. Biochem. 2012, 39, 29−32.(13) Nilsson, T.; Mann, M.; Aebersold, R.; Yates, J. R. Massspectrometry in high-throughput proteomics: ready for the big time.Nature 2010, 7, 681−85.
(14) Rockstroh, M.; Muller, S.; Jende, C.; Kerzhner, A.; Bergen; Von,M.; Tomm, J. M. Cell fractionation - an important tool forcompartment proteomics. JIOMICS 2011, 1, 135−43.(15) Witten, I. H.; Frank, E.; Hall, M. A. Data Mining: PracticalMachine Learning Tools and Techniques, 3rd ed.; Elsevier: Burlington,2011.(16) Chapman, R. W.; Mancia, A.; Beal, M.; Veloso, A.; Rathburn, C.;Blair, A.; Sanger, D.; Holland, A. F.; Warr, G. W.; Didonato, G. Atranscriptomic analysis of land-use impacts on the oyster, Crassostreavirginica, in the South Atlantic bight. Mol. Ecol. 2009, 18, 2415−25.(17) Johansson, P.; Ringner, M. Classification of Genomic andProteomic Data Using Support Vector Machines. Fundamentals ofData Mining in Genomics and Proteomics; Springer: Boston, 2007; pp187−202.(18) King, W. V.; Berlinsky, D. L.; Sullivan, C. V. Involvement ofgonadal steroids in final oocyte maturation of white perch (Moroneamericana) and white bass (M. chrysops): in vivo and in vitro studies.Fish Physiol. Biochem. 1995, 14, 489−500.(19) Jackson, L. F.; Sullivan, C. V. Reproduction of white perch: Theannual gametogenic cycle. Trans. Am. Fish. Soc. 2005, 124, 563−77.(20) Huang, X.; Madan, A. CAP3: A DNA sequence assemblyprogram. Genome Res. 1999, 9, 868−77.(21) Altschul, S. F.; Gish, W.; Miller, W.; Myers, E. W.; Lipman, D. J.Basic local alignment search tool. J. Mol. Biol. 1990, 215, 403−10.(22) Ashburner, M.; Ball, C. A.; Blake, J. A.; Botstein, D.; Butler, H.;Cherry, J. M.; Davis, A. P.; Dolinski, K.; Dwight, S. S.; Eppig, J. T.;Harris, M. A.; Hill, D. P.; Issel-Tarver, L.; Kasarskis, A.; Lewis, S.;Matese, J. C.; Richardson, J. E.; Ringwald, M.; Rubin, G. M.; Sherlock,G. Gene ontology: tool for the unification of biology. Nat. Genet. 2000,25, 25−29.(23) Gotz, S.; García-Gomez, J. M.; Terol, J.; Williams, T. D.;Nagaraj, S. H.; Nueda, M. J.; Robles, M.; Talon, M.; Dopazo, J.;Conesa, A. High-throughput functional annotation and data miningwith the Blast2GO suite. Nucleic Acids Res. 2008, 36, 3420−35.(24) Conesa, A.; Gotz, S. Blast2GO: A Comprehensive suite forfunctional analysis in plant genomics. Int. J. Plant Genomics 2008, 1−12.(25) Conesa, A.; Gotz, S.; García-Gomez, J. M.; Terol, J.; Talon, M.;Robles, M. Blast2GO: a universal tool for annotation, visualization andanalysis in functional genomics research. Bioinformatics 2005, 21,3674−6.(26) Wisniewski, J. R.; Zougman, A.; Nagaraj, N.; Mann, M.Universal sample preparation method for proteome analysis. Nat.Methods 2009, 6, 359−62.(27) Andrews, G. L.; Shuford, C. M.; Burnett, J. C.; Hawkridge, A.M.; Muddiman, D. C. Coupling of a vented column with splitlessnanoRPLC-ESI-MS for the improved separation and detection ofbrain natriuretic peptide-32 and its proteolytic peptides. J. Chromatogr.B 2009, 877, 948−54.(28) Michalski, A.; Damoc, E.; Hauschild, J. P.; Lange, O.; Wieghaus,A.; Makarov, A.; Nagaraj, N.; Cox, J.; Mann, M.; Horning, S. Massspectrometry-based proteomics using Q Exactive, a high-performancebenchtop quadrupole Orbitrap mass spectrometer. Mol. Cell Proteomics2011, 10, 1−11.(29) Randall, S. M.; Cardasis, H. L.; Muddiman, D. C. Factorialexperimental designs elucidate significant variables affecting dataacquisition on a quadrupole orbitrap mass spectrometer. J. Am. Soc.Mass Spectrom. 2013, 24, 1501−12.(30) Perkins, D. N.; Pappin, D. J.; Creasy, D. M.; Cottrell, J. S.Probability-based protein identification by searching sequence data-bases using mass spectrometry data. Electrophoresis 1999, 20, 3551−67.(31) Min, X. J.; Butler, G.; Storms, R.; Tsang, A. OrfPredictor:predicting protein-coding regions in EST-derived sequences. NucleicAcids Res. 2005, 33, W677−80.(32) Keller, A.; Nesvizhskii, A. I.; Kolker, E.; Aebersold, R. Empiricalstatistical model to estimate the accuracy of peptide identificationsmade by MS/MS and database search. Anal. Chem. 2002, 74, 5383−92.
Journal of Proteome Research Article
dx.doi.org/10.1021/pr401067g | J. Proteome Res. 2014, 13, 1515−15261524
(33) Nesvizhskii, A. I.; Keller, A.; Kolker, E.; Aebersold, R. Astatistical model for identifying proteins by tandem mass spectrometry.Anal. Chem. 2003, 75, 4646−58.(34) Weatherly, D. B.; Atwood, J. A.; Minning, T. A.; Cavola, C.;Tarleton, R. L.; Orlando, R. A heuristic method for assigning a false-discovery rate for protein identifications from mascot database searchresults. Mol. Cell. Proteomics 2005, 4, 762−72.(35) Wu, X.; Chau-Wen, T.; Edwards, N. HMMatch: Peptideidentification by spectral matching of tandem mass spectra usinghidden Markov models. J. Comput. Biol. 2007, 14 (8), 1025−43.(36) Gocke, E.; Shuford, C. M.; Franck, W. L.; Dean, R. A.;Muddiman, D. C. Evaluation of normalization methods on GeLC-MS/MS label-free spectral counting data to correct for variation duringproteomic workflows. J. Am. Soc. Mass Spectrom. 2011, 22, 2199−208.(37) Stone, E. A.; Ayroles, J. F. Modulated modularity clustering asan exploratory tool for functional genomic inference. PLoS Genet.2009, 5, e1000479.(38) Chan, Y. C.; Raengpradub, S.; Boor, K. J.; Wiedmann, M.Microarray-based characterization of the Listeria monocytogenes coldregulon in log- and stationary-phase cells. Appl. Environ. Microbiol.2007, 73 (20), 6484.(39) Dennis, G., Jr; Sherman, B. T.; Hosack, D. A.; Yang, J. DAVID:database for annotation, visualization, and integrated discovery.Genome Biol. 2003, 4 (9), R60.1−11.(40) Rebhan, M.; Chalifa-Caspi, V.; Prilusky, J.; Lancet, D.GeneCards: a novel functional genomics compendium with automateddata mining and query reformulation support. Bioinformatics 1998, 14,656−64.(41) Booth, N. J.; Bilodeau-Bourgeois, A. L. Proteomic analysis ofhead kidney tissue from high and low susceptibility families of channelcatfish following challenge with Edwardsiella ictaluri. Fish ShellfishImmun. 2009, 26, 193−6.(42) Provan, F.; Bjørnstad, A.; Pampanin, D. M.; Lyng, E.;Fontanillas, R.; Andersen, O. K.; Koppe, W.; Bamber, S. Massspectrometric profiling − a diagnostic tool in fish? Mar. Environ. Res.2006, 62 (Suppl), S105−8.(43) Liu, X.; Afonso, L.; Altman, E.; Johnson, S.; Brown, L.; Li, J. O-acetylation of sialic acids in N-glycans of Atlantic salmon (Salmo salar)serum is altered by handling stress. Proteomics 2008, 8, 2849−57.(44) Martin, S. A. M.; Vilhelmsson, O.; Medale, F.; Watt, P.; Kaushik,S.; Houlihan, D. F. Proteomic sensitivity to dietary manipulations inrainbow trout. Biochim. Biophys. Acta, Proteins Proteomics 2003, 1651,17−29.(45) Rime, H.; Guitton, N.; Pineau, C.; Bonnet, E.; Bobe, J.; Jalabert,B. Post-ovulatory ageing and egg quality: a proteomic analysis ofrainbow trout coelomic fluid. Reprod. Biol. Endocrinol. 2004, 2, 26.(46) Wulff, T.; Hoffmann, E. K.; Roepstorff, P.; Jessen, F.Comparison of two anoxia models in rainbow trout cells by a 2-DEand MS/MS-based proteome approach. Proteomics 2008, 8, 2035−44.(47) Forne, I.; Agulleiro, M. J.; Asensio, E.; Abian, J.; Cerda, J. 2-DDIGE analysis of Senegalese sole (Solea senegalensis) testis proteome inwild-caught and hormone-treated F1 fish. Proteomics 2009, 9, 2171−81.(48) Reddish, J. M.; St-Pierre, N.; Nichols, A.; Green-Church, K.;Wick, M. Proteomic analysis of proteins associated with body massand length in yellow perch, Perca f lavescens. Proteomics 2008, 8, 2333−43.(49) Zilli, L.; Schiavone, R.; Storelli, C.; Vilella, S. Molecularmechanisms determining sperm motility initiation in two sparids(Sparus aurata and Lithognathus mormyrus). Biol. Reprod. 2008, 79,356−66.(50) Ziv, T.; Gattegno, T.; Chapovetsky, V.; Wolf, H.; Barnea, E.;Lubzens, E.; Admon, A. Comparative proteomics of the developingfish (zebrafish and gilthead seabream) oocytes. Comp. Biochem.Physiol., Part D 2008, 3, 12−35.(51) Zilli, L.; Schiavone, R.; Zonno, V.; Rossano, R.; Storelli, C.;Vilella, S. Effect of cryopreservation on sea bass sperm proteins. Biol.Reprod. 2005, 72, 1262−67.
(52) Knoll-Gellida, A.; Andre, M.; Gattegno, T.; Forgue, J.; Admon,A.; Babin, P. J. Molecular phenotype of zebrafish ovarian follicle byserial analysis of gene expression and proteomic profiling, andcomparison with the transcriptomes of other animals. BMC Genomics2006, 7, 46.(53) Groh, K. J.; Nesatyy, V. J.; Segner, H.; Eggen, R. I. L.; Suter, M.J.-F. Global proteomics analysis of testis and ovary in adult zebrafish(Danio rerio). Fish Physiol. Biochem. 2011, 37, 619−47.(54) Groh, K. J.; Schonenberger, R.; Eggen, R. I. L.; Segner, H.;Suter, M. J.-F. Analysis of protein expression in zebrafish during gonaddifferentiation by targeted proteomics. Gen. Comp. Endocr. 2013, 193,210−20.(55) Martyniuk, C. J.; Alvarez, S. Proteome analysis of the fatheadminnow (Pimephales promelas) reproductive testes. J. Proteomics 2013,79, 28−42.(56) Elmore, S. Apoptosis: A review of programmed cell death.Toxicol. Pathol. 2007, 35, 495−516.(57) Dumollard, R.; Duchen, M.; Carroll, J. The role ofmitochondrial function in the oocyte and embryo. Curr. Top. Dev.Biol. 2007, 77, 21−49.(58) Wang, G.; Yan, S. Mitochondrial DNA content andmitochondrial gene transcriptional activities in the early developmentof loach and goldfish. Int. J. Dev. Biol. 1992, 36, 477−82.(59) Marinos, E.; Billett, F. S. Mitochondrial number, cytochromeoxidase and succinic dehydrogenase activity in Xenopus laevis oocytes.J. Embryol. Exp. Morph. 1981, 62, 395−409.(60) Marinos, E. The number of mitochondria in Xenopus laevisovulated oocytes. Cell Differ. 1985, 16, 139−43.(61) Billett, F. S.; Adam, E. The structure of the mitochondrial cloudof Xenopus laevis oocytes. J. Embryol. Exp. Morph. 1976, 33, 697−710.(62) Greenwood, J.; Gautier, J. From oogenesis through gastrulation:developmental regulation of apoptosis. Semin. Cell Dev. Biol. 2005, 16,215−24.(63) Kerby, J. H. Striped bass and striped bass hybrids. In Culture ofNonsalmonid Freshwater Fishes; Stickney, R. R., Ed; CRC Press: BocaRaton, 1986; pp 127−47.(64) Barbosa-Morais, N. L.; Irimia, M.; Pan, Q.; Xiong, H. Y.;Gueroussov, S.; Lee, L. J.; Slobodeniuc, V.; Kutter, C.; Watt, S.; Colak,R.; Kim, T.; Misquitta-Ali, C. M.; Wilson, M. D.; Kim, P. M.; Odom,D. T.; Frey, B. J.; Blencowe, B. J. The evolutionary landscape ofalternative splicing in vertebrate species. Science 2012, 338, 1587−93.(65) Buljan, M.; Chalancon, G.; Eustermann, S.; Wagner, G. P.;Fuxreiter, M.; Bateman, A.; Madan Babu, M. Tissue-specific splicing ofdisordered segments that embed binding motifs rewires proteininteraction networks. Mol. Cell 2012, 46, 871−83.(66) Wang, R. L.; Bencic, D.; Biales, A.; Lattier, D.; Kostich, M.;Villenueve, D.; Ankley, G. T.; Lazorchak, J.; Toth, G. DNAMicroarray-based ecotoxological biomarker discovery in a small fishmodel species. Environ. Toxicol. Chem. 2008, 27 (3), 664−75.(67) Wang, R. L.; Bencic, D.; Biales, A.; Flick, R.; Laz orchak, J.;Villeneuve, D.; Ankley, G. T. Discovery and validation of geneclassifiers for endocrine-disrupting chemicals in zebrafish (danio rerio).BMC Genomics 2012, 13, 358.(68) Ornostay, A.; Cowie, A M.; Hindle, M.; Baker, C. J. O.;Martyniuk, C. J. Classifying chemical mode of action using genenetworks and machine learning: A case study with the herbicidelinuron. Comp. Biochem. Physiol., Part D 2013, 8 (4), 263−74.(69) Sawaguchi, S.; Ohkubo, N.; Amano, H.; Hiramatsu, N.; Hara,A.; Sullivan, C. V.; Matsubara, T. Controlled accumulation of multiplevitellogenins into oocytes during vitellogenesis in the barfin flounderVerasper moseri. Cybium, Int. J. Ichthyol. 2008, 32 (2), 262.(70) Williams, V. N.; Reading, B. J.; Amano, H.; Hiramatsu, N.;Schilling, J.; Salger, S. A.; Islam Williams, T.; Gross, K.; Sullivan, C. V.Proportional accumulation of yolk proteins derived from multiplevitellogenins is precisely regulated during vitellogenesis in striped bass(Morone saxatilis). J. Exp. Zool. Part A 2013, submitted for publication.(71) Williams, V. N.; Reading, B. J.; Hiramatsu, N.; Amano, H.;Glassbrook, N.; Hara, A.; Sullivan, C. V. Multiple vitellogenins andproduct yolk proteins in striped bass, Morone saxatilis: molecular
Journal of Proteome Research Article
dx.doi.org/10.1021/pr401067g | J. Proteome Res. 2014, 13, 1515−15261525
characterization and processing during oocyte growth and maturation.Fish Physiol. Biochem. 2013, DOI: 10.1007/s10695-013-9852-0.(72) Hassler, T. J. Species profiles: Life histories and environmentalrequirements of coastal fishes and invertebrates (Pacific Southwest)striped bass. In U.S. Fish and Wildlife Service Biological Report. 82(11.82). U.S. Army Corps of Engineers, TR EL-82-4, 1988; pp 1−29.(73) Amano, H.; Fujita, T.; Hiramatsu, N.; Kagawa, H.; Matsubara,T.; Sullivan, C. V.; Hara, A. Multiple vitellogenin-derived yolk proteinsin gray mullet (Mugil cephalus): disparate proteolytic patternsassociated with ovarian follicle maturation. Mol. Reprod. Dev. 2008,75, 1307−17.(74) Sawaguchi, S.; Ohkubo, N.; Koya, Y.; Matsubara, T.Incorporation and utilization of multiple forms of vitellogenin andtheir derivative yolk proteins during vitellogenesis and embryonicdevelopment in the mosquitofish Gambusia af f inis. Zool. Sci. 2005, 22,701−10.(75) Kolarevic, J.; Nerland, A.; Nilsen, F.; Finn, R. N. Goldsinnywrasse (Ctenolabrus rupestris) is an extreme vtgAa-type pelagophilteleost. Mol. Reprod. Dev. 2008, 75, 1011−20.(76) Wu, C. C.; Yates, J. R. The application of mass spectrometry tomembrane proteomics. Nat. Biotechnol. 2003, 21, 262−67.
Journal of Proteome Research Article
dx.doi.org/10.1021/pr401067g | J. Proteome Res. 2014, 13, 1515−15261526
Related Documents