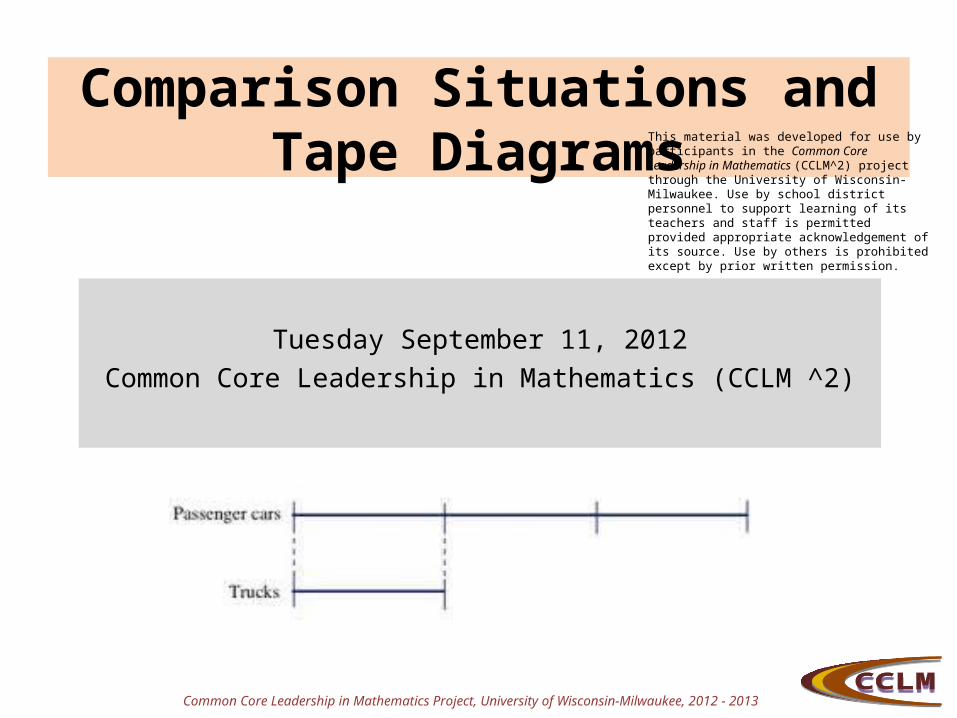
Common Core Leadership in Mathematics Project, University of Wisconsin-Milwaukee, 2012 - 2013 Comparison Situations and Tape Diagrams Tuesday September 11, 2012 Common Core Leadership in Mathematics (CCLM ^2) This material was developed for use by participants in the Common Core Leadership in Mathematics (CCLM^2) project through the University of Wisconsin- Milwaukee. Use by school district personnel to support learning of its teachers and staff is permitted provided appropriate acknowledgement of its source. Use by others is prohibited except by prior written permission.

Welcome message from author
This document is posted to help you gain knowledge. Please leave a comment to let me know what you think about it! Share it to your friends and learn new things together.
Transcript
Common Core Leadership in Mathematics Project, University of Wisconsin-Milwaukee, 2012 - 2013
Comparison Situations and Tape Diagrams
Tuesday September 11, 2012
Common Core Leadership in Mathematics (CCLM ^2)
This material was developed for use by participants in the Common Core Leadership in Mathematics (CCLM^2) project through the University of Wisconsin-Milwaukee. Use by school district personnel to support learning of its teachers and staff is permitted provided appropriate acknowledgement of its source. Use by others is prohibited except by prior written permission.

Common Core Leadership in Mathematics Project, University of Wisconsin-Milwaukee, 2012 - 2013
Learning Intentions & Success Criteria
• We are learning to…– Understand how to solve comparison problems
and use tape (strip) diagrams to illustrate the solutions.
• We will be successful when….– Clearly explain the difference between additive and
multiplicative comparison situations.– Understand CCSSM expectations for compare
situations in grades 1 & 2 and grades 3 &4.– .

Common Core Leadership in Mathematics Project, University of Wisconsin-Milwaukee, 2012 - 2013
Addition Comparison Problem Situations

Common Core Leadership in Mathematics Project, University of Wisconsin-Milwaukee, 2012 - 2013
1.OA.1 Use addition and subtraction within 20 to solve word problems involving situations of adding to, taking from, putting together, taking apart, and comparing, with unknowns in all positions, e.g., by using objects, drawings, and equations with a symbol for the unknown number to represent the problem.
Revisiting 1.OA.1

Common Core Leadership in Mathematics Project, University of Wisconsin-Milwaukee, 2012 - 2013
Four kindergarten problem subtypes
Skilled by the end of Grade 1
Experience at Grade 1 and skilled by the end of Grade 2

Common Core Leadership in Mathematics Project, University of Wisconsin-Milwaukee, 2012 - 2013
A Comparison Word Problem
Blakely has 9 plates and 5 cookies. If a whole cookie is put on each plate, how many more plates are there than cookies?
Model this problem with cubes. Then draw a tape diagram to illustrate the solution.

Common Core Leadership in Mathematics Project, University of Wisconsin-Milwaukee, 2012 - 2013
As children move to Level 2 strategies, “they no longer need representations that show each quantity as a group of objects.”
(OA Progressions, p. 16)

Common Core Leadership in Mathematics Project, University of Wisconsin-Milwaukee, 2012 - 2013
Blakely has 9 plates and 5 cookies. If a whole cookie is put on each plate, how many plates won’t get a cookie?
Concrete
Use concrete objects to form two groups to compare quantities.
Representational
5 cookies ?
9 plates
5 cookies ?
9 plates

Common Core Leadership in Mathematics Project, University of Wisconsin-Milwaukee, 2012 - 2013
The Packers played the Bears for the NFL Championship. The Packers scored 52 points. The Bears had 39 points. How many more points did the Packers score than the Bears?
Use tape diagrams to show the relationship among the quantities in this compare situation.

Common Core Leadership in Mathematics Project, University of Wisconsin-Milwaukee, 2012 - 2013
A General Comparison Model for Addition and Subtraction
larger quantity
smaller quantity difference

Common Core Leadership in Mathematics Project, University of Wisconsin-Milwaukee, 2012 - 2013
Multiplicative Comparison Problem Situations

Common Core Leadership in Mathematics Project, University of Wisconsin-Milwaukee, 2012 - 2013
Standard 4.OA.1
Interpret a multiplication equation as a comparison, e.g., interpret 35 equals 5 x 7 as a statement that 35 is 5 times as many as 7 and 7 times as many as 5. Represent verbal statements of multiplicative comparisons as multiplication equations.

Common Core Leadership in Mathematics Project, University of Wisconsin-Milwaukee, 2012 - 2013
Standard 4.OA.1
• Read standard 4.OA.1
• Divide your slate in half. On one side, rephrase this standard and on the other side, provide an example.
• Share with your partner.

Common Core Leadership in Mathematics Project, University of Wisconsin-Milwaukee, 2012 - 2013
Multiplicative Comparison ProblemsRead the handout aboutMultiplicative Comparison Problems.
•Highlight as you read, noting ideas that you understand and those that still confuse you.

Common Core Leadership in Mathematics Project, University of Wisconsin-Milwaukee, 2012 - 2013
Standard 4.OA.2
Cluster: Use the four operations with whole numbers to solve problem.
4.OA.2 Multiply or divide to solve word problems involving multiplicative comparison, e.g., by using drawings and equations with a symbol for the unknown number to represent the problem, distinguishing multiplicative comparison from additive comparison.

Common Core Leadership in Mathematics Project, University of Wisconsin-Milwaukee, 2012 - 2013
Standard 4.OA.2
• Read standard 4.OA.2
• Divide your slate in half. On one side, rephrase this standard and on the other side, provide an example.
• Share with your partner.

Common Core Leadership in Mathematics Project, University of Wisconsin-Milwaukee, 2012 - 2013
Sense Making….
Share with your shoulder partner a few ideas that struck you as critical to developing a sound understanding of multiplicative comparison problems.

Common Core Leadership in Mathematics Project, University of Wisconsin-Milwaukee, 2012 - 2013
Tape Diagram
A drawing that looks like a segment of tape, used to illustrate number relationships. Also known as strip diagrams, bar model, fraction strip or length model.
•CCSSM Glossary p. 87

Common Core Leadership in Mathematics Project, University of Wisconsin-Milwaukee, 2012 - 2013
Your Turn …
Connie ran 50 meters.Melissa ran 200 meters.
On your slate, write three problems using this information:
Larger quantity unknownSmaller quantity unknownCompare quantity unknown

Common Core Leadership in Mathematics Project, University of Wisconsin-Milwaukee, 2012 - 2013
A Parking Lot Problem
A fourth grade class counted the number of vehicles that went by the front entrance of the school between 9 o'clock and 10 o'clock. The total number of vehicles counted was156. There were 3 times as many passenger cars as trucks. How many passenger cars and how many trucks were counted?
Use a tape diagram to illustrate and solve this problem.

Common Core Leadership in Mathematics Project, University of Wisconsin-Milwaukee, 2012 - 2013
Farmer problem
• A farmer has 7 ducks. He has 5 times as many chickens as ducks. How many more chickens than ducks does he have?
• On your slate, draw a diagram to help you solve this problem. Record your thinking.

Common Core Leadership in Mathematics Project, University of Wisconsin-Milwaukee, 2012 - 2013
Let’s Look at Some Student Problems
Solve the problems (from Singapore Mathematics 3A) with your partner.
How did the tape diagram help you think multiplicatively?

Common Core Leadership in Mathematics Project, University of Wisconsin-Milwaukee, 2012 - 2013
The Power of Strip Diagrams
With the aid of simple strip diagrams, children can use straightforward reasoning to solve many challenging story problems conceptually.
Beckmann 2004

Common Core Leadership in Mathematics Project, University of Wisconsin-Milwaukee, 2012 - 2013
Reflecting on the Practices

Common Core Leadership in Mathematics Project, University of Wisconsin-Milwaukee, 2012 - 2013
Learning Intentions & Success Criteria
• We are learning to…– Understand how to solve comparison problems
and use tape (strip) diagrams to illustrate the solutions.
• We will be successful when….– Clearly explain the difference between additive and
multiplicative comparison situations.– Understand CCSSM expectations for compare
situations in grades 1 & 2 and grades 3 &4.– .
Related Documents