Page 1 Comparison of U.S. and International Prices for Top Medicare Part B Drugs by Total Expenditures October 25, 2018 Executive Summary The prices charged by drug manufacturers to wholesalers and distributors (commonly referred to as ex- manufacturers prices) in the United States are 1.8 times higher than in other countries for the top drugs by total expenditures separately paid under Medicare Part B. U.S. prices were higher for most of the drugs included in the analysis, and U.S. prices were more likely to be the highest prices paid among the countries in our study. 1. Introduction Recently there has been increased interest in how U.S. drug prices compare to those of other developed countries. Much of this interest focuses on pricing for pharmacy-dispensed drugs, which account for about 72 percent of total prescription drug spending. 1 This paper, instead, focuses on prices for non-retail drugs, which are generally physician-administered. In the fee-for-service Medicare program, outpatient prescription pharmaceuticals are covered under two separate voluntary benefits. Drugs dispensed by retail and specialty pharmacies to patients for self-administration are typically covered under the Medicare Part D program. Part D is operated by commercial insurance companies that negotiate formulary placement and prices with drug manufacturers and payment rates with pharmacies. This 1 U.S. Department of Health and Human Services, Office of the Assistant Secretary for Planning and Evaluation (ASPE). Observations on Trends in Prescription Drug Spending. March 2016. Available at https://aspe.hhs.gov/system/files/pdf/187586/Drugspendin g.pdf. approach is one reason why spending growth under Part D has remained below its initial spending projections. Drugs more typically administered to patients by healthcare practitioners, however, are covered and paid under Medicare Part B, which is part of the fee-for-service traditional Medicare benefit. 2 Under Part B, providers and suppliers “buy and bill” these types of drugs. Since 2005 for physicians, and 2006 for hospital outpatient departments, Medicare has paid suppliers and providers based upon the Average Sales Price (ASP) for each product, as reported by manufacturers to the Centers for Medicare & Medicaid Services (CMS). 3 Physician offices that buy and bill Part B drugs are paid 106% of the drug’s ASP. Depending on a hospital outpatient department’s participation in a safety 2 Medicare Part B covers some self-administered drugs that were added to the benefit by Congress prior to the creation of Part D. These self-administered drugs are not the subject of this paper. 3 Section 1847A of the Social Security Act governs payments to physicians for certain Part B drugs. Section 1833(t) governs payments to HOPDs, and allows the use of 1847A payment rates. By 2006, CMS cited this authority, and by 2014, was paying HOPDS based upon it.

Welcome message from author
This document is posted to help you gain knowledge. Please leave a comment to let me know what you think about it! Share it to your friends and learn new things together.
Transcript

Page 1
Comparison of U.S. and International Prices for Top Medicare Part B Drugs by Total Expenditures
October 25, 2018
Executive Summary
The prices charged by drug manufacturers to wholesalers and distributors (commonly referred to as ex-
manufacturers prices) in the United States are 1.8 times higher than in other countries for the top drugs
by total expenditures separately paid under Medicare Part B. U.S. prices were higher for most of the
drugs included in the analysis, and U.S. prices were more likely to be the highest prices paid among the
countries in our study.
1. Introduction
Recently there has been increased interest in
how U.S. drug prices compare to those of other
developed countries. Much of this interest
focuses on pricing for pharmacy-dispensed
drugs, which account for about 72 percent of
total prescription drug spending.1 This paper,
instead, focuses on prices for non-retail drugs,
which are generally physician-administered.
In the fee-for-service Medicare program,
outpatient prescription pharmaceuticals are
covered under two separate voluntary benefits.
Drugs dispensed by retail and specialty
pharmacies to patients for self-administration
are typically covered under the Medicare Part D
program. Part D is operated by commercial
insurance companies that negotiate formulary
placement and prices with drug manufacturers
and payment rates with pharmacies. This
1 U.S. Department of Health and Human Services, Office of the Assistant Secretary for Planning and Evaluation (ASPE). Observations on Trends in Prescription Drug Spending. March 2016. Available at https://aspe.hhs.gov/system/files/pdf/187586/Drugspending.pdf.
approach is one reason why spending growth
under Part D has remained below its initial
spending projections.
Drugs more typically administered to patients
by healthcare practitioners, however, are
covered and paid under Medicare Part B, which
is part of the fee-for-service traditional
Medicare benefit.2 Under Part B, providers and
suppliers “buy and bill” these types of drugs.
Since 2005 for physicians, and 2006 for hospital
outpatient departments, Medicare has paid
suppliers and providers based upon the Average
Sales Price (ASP) for each product, as reported
by manufacturers to the Centers for Medicare &
Medicaid Services (CMS).3 Physician offices
that buy and bill Part B drugs are paid 106% of
the drug’s ASP. Depending on a hospital
outpatient department’s participation in a safety
2 Medicare Part B covers some self-administered drugs that were added to the benefit by Congress prior to the creation of Part D. These self-administered drugs are not the subject of this paper. 3 Section 1847A of the Social Security Act governs payments to physicians for certain Part B drugs. Section 1833(t) governs payments to HOPDs, and allows the use of 1847A payment rates. By 2006, CMS cited this authority, and by 2014, was paying HOPDS based upon it.
Comparison of U.S. and International Prices for Top Spending Medicare Part B Drugs U.S. Department of Health and Human Services, Office of the Assistant Secretary for Planning and Evaluation
Page 2
net drug pricing program, hospitals are
reimbursed either 106 or 77.5 percent of ASP.4
ASP is reported by manufacturers to CMS as the
total sales to all purchasers minus the price
concessions granted to these purchasers and
eventual end users, i.e. physicians and hospitals,
with certain exceptions. For example,
manufacturers may offer a rebate to physician
specialists to prescribe and administer their
product over a competitor’s. The sale of the
product to a wholesaler and the price concession
granted to the physician are both accounted for
in the ASP. Purchases and price concessions or
rebates offered under federal discount programs
(such as the Veterans Health Administration, the
Medicaid Drug Rebate Program and State
Supplemental Rebate Agreements, and the 340B
Drug Discount Program) are excluded from the
ASP calculation.5
Unlike the situation with traditional, pharmacy-
dispensed drugs, payers are not typically
involved in the prescribing, purchasing, or
dispensing decision for physician-administered
drugs, and there is therefore more limited
private-payer negotiation for formulary
coverage. Specifically, the Medicare program
has not applied the types of formulary
management practices that are commonly used
to achieve better value for self-administered
drugs by commercial insurers, including those
sponsoring Medicare Advantage or Part D
plans, which were recently granted new
authority by CMS to use formulary management
practices such as step therapy for Part B drugs.6
However, this flexibility does not extend to the
fee-for-service Medicare Part B. Many have
4 HOPDs and off-campus locations that participate in the 340B Drug Discount Program are reimbursed a lower rate to account for significantly reduced acquisition costs. See 82 Fed. Reg. 52356. 5 See SSA 1847A(c)(2) for exclusions. 6 Source: CMS, “Prior Authorization and Step Therapy for Part B Drugs in Medicare Advantage,” available at: https://www.cms.gov/Medicare/Health-Plans/HealthPlansGenInfo/Downloads/MA_Step_Therapy_HPMS_Memo_8_7_2018.pdf.
also suggested that the 6 percent add-on
payment currently in place for physician offices
and some hospitals may incentivize the use of
the highest priced clinically beneficial product.
Differences in coverage for drugs under Part B
compared to Part D may have contributed to an
acceleration in spending for physician-
administered drugs, relative to spending growth
under the approach taken under Part D.
Specifically, spending for Part B drugs has
doubled since 2006, despite overall low FFS
enrollment growth.7 In Part D, although
enrollment continues to grow, annual and per-
beneficiary expenditure growth rates are lower
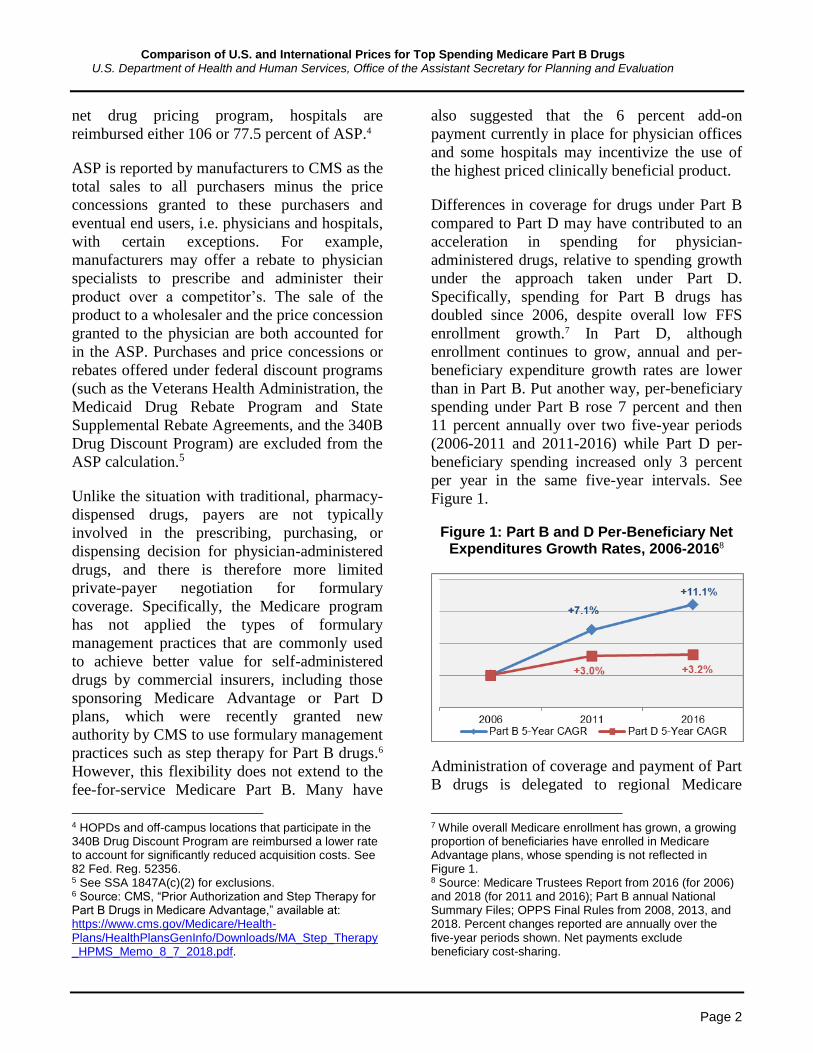
than in Part B. Put another way, per-beneficiary
spending under Part B rose 7 percent and then
11 percent annually over two five-year periods
(2006-2011 and 2011-2016) while Part D per-
beneficiary spending increased only 3 percent
per year in the same five-year intervals. See
Figure 1.
Figure 1: Part B and D Per-Beneficiary Net Expenditures Growth Rates, 2006-20168
Administration of coverage and payment of Part
B drugs is delegated to regional Medicare
7 While overall Medicare enrollment has grown, a growing proportion of beneficiaries have enrolled in Medicare Advantage plans, whose spending is not reflected in Figure 1. 8 Source: Medicare Trustees Report from 2016 (for 2006) and 2018 (for 2011 and 2016); Part B annual National Summary Files; OPPS Final Rules from 2008, 2013, and 2018. Percent changes reported are annually over the five-year periods shown. Net payments exclude beneficiary cost-sharing.
Comparison of U.S. and International Prices for Top Spending Medicare Part B Drugs U.S. Department of Health and Human Services, Office of the Assistant Secretary for Planning and Evaluation
Page 3
Administrative Contractors (MACs). Broad
rulemaking by CMS and ASP-based payment
limits are applicable at the national level, while
each MAC can determine for each patient if a
Part B drug claim is reasonable and necessary.
While the Medicare program and MACs do not
use formulary decision-making to restrict the
coverage and payment of Part B drugs, a
number of other economically comparable
countries do for these types of drugs. Though
these countries use their national health systems
to negotiate lower prices in exchange for market
access, drug manufacturers retain the choice
whether to offer price concessions beyond those
available to payers in the United States. To
better understand the effect of these negotiations
on prices paid for physician-administered drugs,
ASPE compares in this paper the prices paid for
physician-administered drugs in the U.S. to
other selected countries.
2. Background
The peer-reviewed literature assessing
international drug prices has significant
limitations, which we sought to address in our
analysis. Namely, few of these analyses use data
from after 2007, and there are no specific
analyses of the exact set of drugs that we are
interested in comparing.
Drug prices are generally higher in the U.S.
based on price comparisons in the literature. In
their recent systematic literature review,
Kesselheim and Avorn (2016) estimate that U.S.
prices were more than twice as high as those in
other, similar countries. However, they include
bilateral comparisons combined into a meta-
analysis, which may overstate price differences.
Instead, below and in Figures 2 and 3, we
compare seminal original research publications.
Comparing sample baskets of branded and
generic prescription drugs in the U.S., all
compared countries except Japan and Mexico
had prices that were at least 20 percent less than
those in the U.S. Prices in Japan were lower
than U.S. prices in the 2004 Department of
Commerce study but higher in Danzon and
Furukawa (2003, 2005, 2006). This is likely due
to methodological differences that result in
different products being included in the study.
For instance, package sizes in Japan differ
significantly from elsewhere particularly
because doses tend to be lower in Japan.
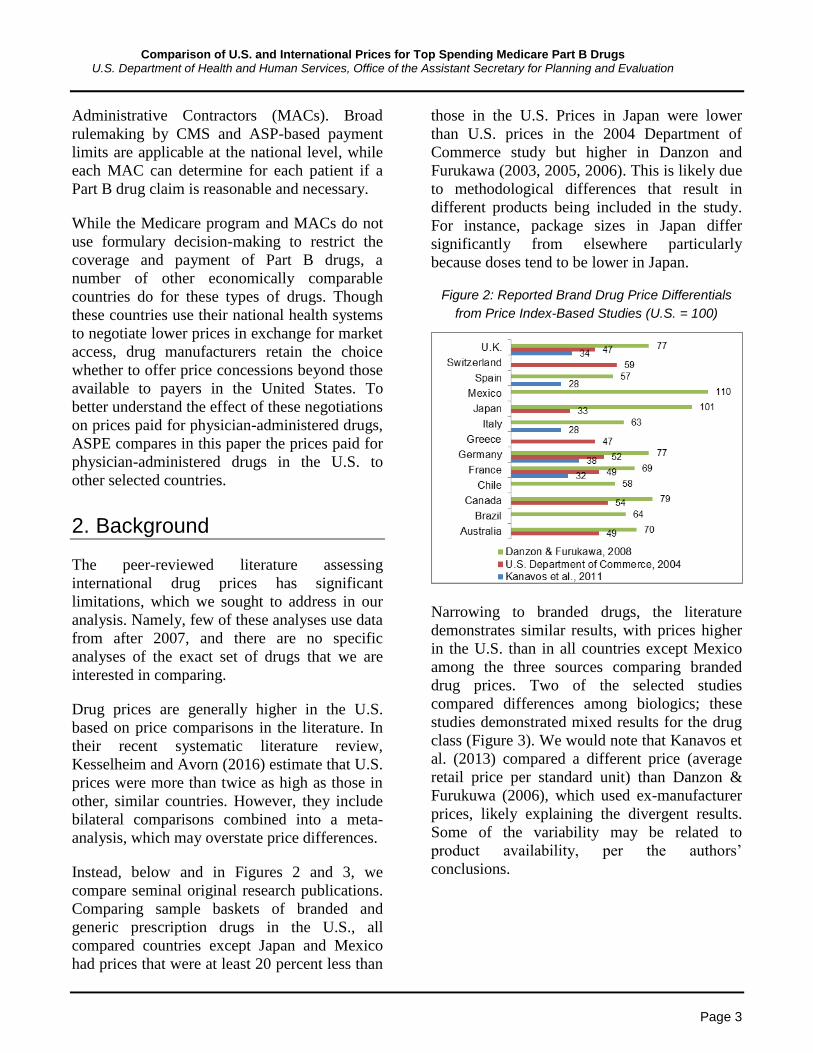
Figure 2: Reported Brand Drug Price Differentials
from Price Index-Based Studies (U.S. = 100)
Narrowing to branded drugs, the literature
demonstrates similar results, with prices higher
in the U.S. than in all countries except Mexico
among the three sources comparing branded
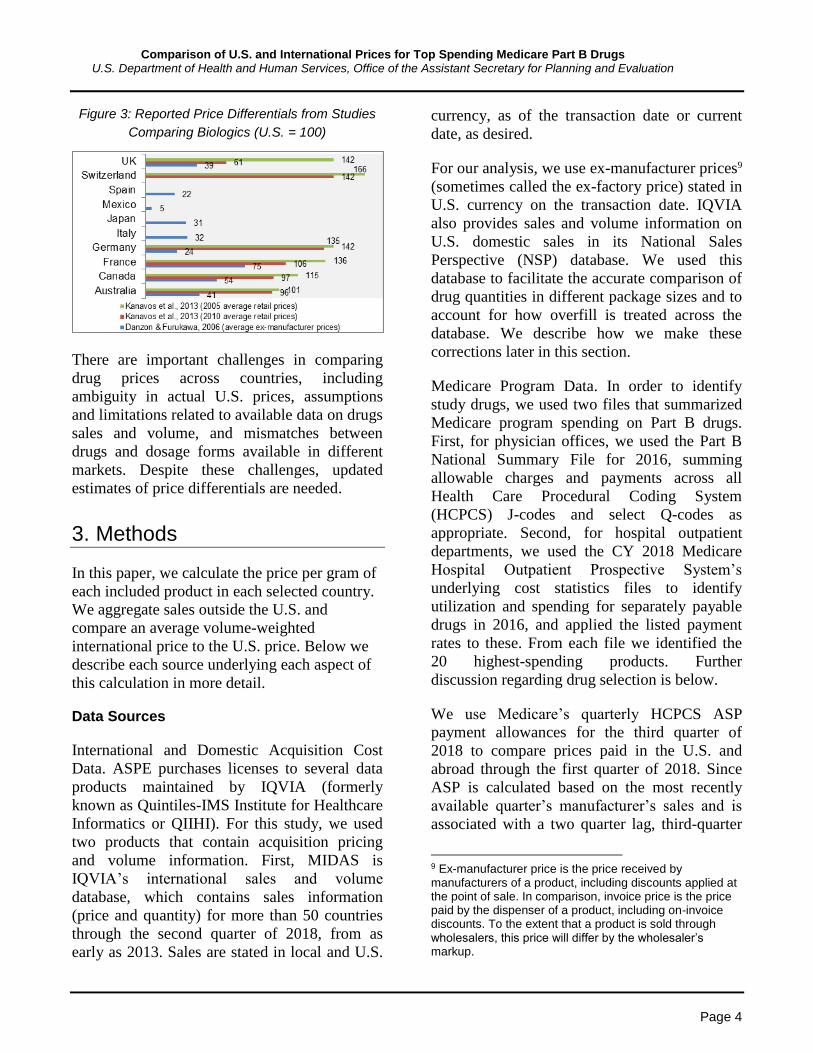
drug prices. Two of the selected studies
compared differences among biologics; these
studies demonstrated mixed results for the drug
class (Figure 3). We would note that Kanavos et
al. (2013) compared a different price (average
retail price per standard unit) than Danzon &
Furukuwa (2006), which used ex-manufacturer
prices, likely explaining the divergent results.
Some of the variability may be related to
product availability, per the authors’
conclusions.
Comparison of U.S. and International Prices for Top Spending Medicare Part B Drugs U.S. Department of Health and Human Services, Office of the Assistant Secretary for Planning and Evaluation
Page 4
Figure 3: Reported Price Differentials from Studies
Comparing Biologics (U.S. = 100)
There are important challenges in comparing
drug prices across countries, including
ambiguity in actual U.S. prices, assumptions
and limitations related to available data on drugs
sales and volume, and mismatches between
drugs and dosage forms available in different
markets. Despite these challenges, updated
estimates of price differentials are needed.
3. Methods
In this paper, we calculate the price per gram of
each included product in each selected country.
We aggregate sales outside the U.S. and
compare an average volume-weighted
international price to the U.S. price. Below we
describe each source underlying each aspect of
this calculation in more detail.
Data Sources
International and Domestic Acquisition Cost
Data. ASPE purchases licenses to several data
products maintained by IQVIA (formerly
known as Quintiles-IMS Institute for Healthcare
Informatics or QIIHI). For this study, we used
two products that contain acquisition pricing
and volume information. First, MIDAS is
IQVIA’s international sales and volume
database, which contains sales information
(price and quantity) for more than 50 countries
through the second quarter of 2018, from as
early as 2013. Sales are stated in local and U.S.
currency, as of the transaction date or current
date, as desired.
For our analysis, we use ex-manufacturer prices9
(sometimes called the ex-factory price) stated in
U.S. currency on the transaction date. IQVIA
also provides sales and volume information on
U.S. domestic sales in its National Sales
Perspective (NSP) database. We used this
database to facilitate the accurate comparison of
drug quantities in different package sizes and to
account for how overfill is treated across the
database. We describe how we make these
corrections later in this section.
Medicare Program Data. In order to identify
study drugs, we used two files that summarized
Medicare program spending on Part B drugs.
First, for physician offices, we used the Part B
National Summary File for 2016, summing
allowable charges and payments across all
Health Care Procedural Coding System
(HCPCS) J-codes and select Q-codes as
appropriate. Second, for hospital outpatient
departments, we used the CY 2018 Medicare
Hospital Outpatient Prospective System’s
underlying cost statistics files to identify
utilization and spending for separately payable
drugs in 2016, and applied the listed payment
rates to these. From each file we identified the
20 highest-spending products. Further
discussion regarding drug selection is below.
We use Medicare’s quarterly HCPCS ASP
payment allowances for the third quarter of
2018 to compare prices paid in the U.S. and
abroad through the first quarter of 2018. Since
ASP is calculated based on the most recently
available quarter’s manufacturer’s sales and is
associated with a two quarter lag, third-quarter
9 Ex-manufacturer price is the price received by manufacturers of a product, including discounts applied at the point of sale. In comparison, invoice price is the price paid by the dispenser of a product, including on-invoice discounts. To the extent that a product is sold through wholesalers, this price will differ by the wholesaler’s markup.
Comparison of U.S. and International Prices for Top Spending Medicare Part B Drugs U.S. Department of Health and Human Services, Office of the Assistant Secretary for Planning and Evaluation
Page 5
2018 ASP is the best temporal approximation to
the actual purchase prices paid in the first
quarter of 2018. We also use these quarterly
files to identify exactly which products are
included in each selected drug’s HCPCS code,
which we describe in the section to follow. In all
cases, the Medicare ASP payment files we use
are publicly available. No manufacturer
confidential information was collected for use in
these analyses.
Drug Selection
ASPE compiled data on the top 20 drugs based
on total Medicare reimbursement to either
physician offices, hospital outpatient
departments (HOPDs), or overall under
Medicare Part B in 2016, which is the most
recently available publicly accessible data (as
described above). Drugs are defined in this
study as each unique HCPCS code assigned by
CMS. We included only U.S. single source10
drugs11 (as of July 1, 2018), biologicals, and
biosimilars in our initial screening, and we
specifically excluded vaccines and blood
products, neither of which are paid under the
ASP system. We also excluded contrast agents.
We compiled our list based upon the top 20
drugs by total spending from each segment—
physicians and suppliers from the National
Summary File and HOPDs using Final Rule
data—because there are differences in patient
conditions and acuity that may affect treatment
patterns when aggregating total 2016 spending.
These steps ensured there were at least 20 drugs
10 In this paper, the single source status of a product was determined by the existence of a marketed product approved under an Abbreviated New Drug Application (ANDA). Some of the HCPCS codes included in this analysis contain multiple branded products marketed by different manufacturers. In addition, Velcade (bortezomib) is included in the analysis despite the recent approval of a generically named product that was approved under a New Drug Application (NDA) using the 505(b)2 pathway. 11 Elsewhere and throughout this paper the term “drug” includes biological products and biosimilar products. Here we separate “drug” from “biological” to ensure clarity with statutory definitions.
for the comparison after any exclusions, such as
those above. We also totaled spending across
the two settings to include additional drugs that
may not be in the top 20 in either segment, but
were in the top 20 overall. We cross-checked
this list against a 2017 publication from the U.S.
Department of Health and Human Services
Office of Inspector General (OIG) that
compared price-inflation rates for top Part B
drugs12 to ensure that drugs the department has
otherwise flagged with concerns about pricing
were also included. No drugs needed to be
added based upon the OIG report.
Appendix A lists all 32 products identified using
this protocol. Among the 32 drugs identified in
each payment system, we dropped Brovana
(arformoterol tartrate) and Pulmicort
(budesonide), because they are not physician-
administered products. We also excluded Botox
(onabotulinim toxin A) and Epogen (epoetin
alfa) from the main analysis because within the
IQVIA data they are not characterized as being
sold using such mass-based measures such as
milligrams or grams. However, we have
included Epogen and Botox in the table
examining prices per standard unit in Appendix
C, since they are physician-administered.
To select products for comparison in other
markets, we matched the HCPCS codes with
National Drug Codes (NDCs) using the July
2018 ASP NDC-HCPCS Crosswalk file.13 Using
the identified NDCs, we examined which
formulations of each product were included for
each HCPCS code using IQVIA’s NSP
(described earlier) to identify other formulations
of the same molecule. Based on this
examination, we included formulations
available in other countries that are not available
12 See HHS OIG, Calculation of Potential Inflation-Indexed
Rebates for Medicare Part B Drugs 2017, available at https://oig.hhs.gov/oei/reports/oei-12-17-00180.asp. 13 Crosswalk file available at: https://www.cms.gov/Medicare/Medicare-Fee-for-Service-Part-B-Drugs/McrPartBDrugAvgSalesPrice/2018ASPFiles.html.

Comparison of U.S. and International Prices for Top Spending Medicare Part B Drugs U.S. Department of Health and Human Services, Office of the Assistant Secretary for Planning and Evaluation
Page 6
in the United States if it appeared likely that
these formulations would appear on the same
HCPCS if available in the U.S. For example,
Cimzia (certolizumab pegol) is sold as both a
pre-filled syringe and a single-use vial
formulation in the U.S. Both formulations are
included in the HCPCS code and the calculated
ASP. In Europe, an auto-injector formulation is
available. We assume in this and other similar
cases that an auto-injector formulation would be
included in the same HCPCS code if approved
in the U.S. under the same New Drug
Application (NDA) or Biologics License
Application (BLA). The technical appendix that
accompanies this paper presents package size,
formulation, and manufacturer-level detail on
each included drug.
We reviewed our selection of drugs based on
2016 data, and identified one significant change
in the market, requiring a further exclusion. In
the U.S., Bendeka (bendamustine HCl) replaced
Treanda in late 2015. Bendeka and Treanda are
different formulations of the same active
ingredient. Bendeka was assigned a unique
HCPCS code by CMS as of January 1, 2017.
We considered including both products in our
analysis, but upon examining the dosage forms
and strengths of the foreign formulations in
MIDAS, we concluded that the foreign
formulations more closely match Treanda than
Bendeka. Bendeka is the fifth exclusion from
the original list of 32 drugs, yielding 27 drugs
for our main analysis, and 29 drugs for the
standard unit analysis presented in Appendix C.
Country Selection
Not every drug product is available in every
country, even among countries with similar
economic conditions as the U.S. To ensure a
broad representation of similar countries, we
selected all countries in the G714 and all
countries in Germany’s external reference
14 See https://g7.gc.ca/en/g7-presidency/g7-members/.
pricing market basket (15 countries).15 We then
excluded two countries (Denmark and the
Netherlands) from this resultant list for lack of
data in the IQVIA databases. This results in 17
countries including the U.S. to be included in
our study. See Table 1. There is significant
overlap among the G7 and Germany’s market
basket. While the absence of a drug in a given
country may be related to the prices it could be
sold for under that country’s coverage system,
this paper does not discuss access in these terms
in any further detail.
Table 1: Countries Included in Analysis16
United States* France*,** Portugal**
Austria** Germany* Slovakia**
Belgium** Greece** Spain**
Canada* Ireland** Sweden**
Czech Republic**
Italy*,** United Kingdom*,**
Finland** Japan*
Calculation of Price Ratios
Using IQVIA’s MIDAS dataset, ASPE
identified ex-manufacturer prices paid by
wholesalers and distributors for identified drugs
in the countries listed in Table 1. Based on
discussions with the CMS, ASPE determined
that ex-manufacturer price is preferable to gross
price for cross-country comparisons, even while
not directly comparable with ASP. Neither
measure includes wholesaler margin, but only
ASP includes price concessions to end users.
We separately compared U.S. and foreign ex-
manufacturer prices, and the ASP in the U.S. to
foreign ex-manufacturer prices.
15 See Remuzat, C. et al. Overview of External Reference Pricing Systems in Europe. Journal of Market Access & Health Policy. 2015; 3: 27675. 16 * indicates a member of the G7; ** indicates a member of Germany’s external reference pricing market basket. See footnotes 14 and 15.

Comparison of U.S. and International Prices for Top Spending Medicare Part B Drugs U.S. Department of Health and Human Services, Office of the Assistant Secretary for Planning and Evaluation
Page 7
ASP Billing Unit Conversions
For this analysis, we also compared third quarter
of the 2018 fiscal year ASP with the average ex-
manufacturer prices paid in the first calendar
quarter of 2018 derived from MIDAS (both
domestically and internationally) and the
invoice price paid in the U.S. derived for IQVIA
NSP. As described above, ASP is published for
the current quarter based on sales for the second
preceding quarter to accommodate manufacturer
reporting timelines. Therefore, the IQVIA price
date range of Q1-2018 matches the Q3-2018
reimbursement rate’s calculation date range in
the U.S. Also, note that CMS publishes ASP+6
percent reimbursement rates. We removed the 6
percent to approximate purchase prices.
Package and Vial Configurations
Using MIDAS, we constructed prices in terms
of price-per-equivalent quantity of drug or
biologic. This resulted in prices per gram of the
drug or biologic. For drugs not quantified by
measures of mass, we report price ratios only in
Appendix C by standard unit. For injectable
drugs, the standard unit is typically one vial. For
oral products, the standard unit is one pill.
Standard units do not account for differences in
strength. Using the price-per-gram, we
calculated the price per HCPCS code billing
unit, allowing us to compare the derived prices
in IQVIA to Medicare’s ASP reimbursement
rate. This gram measure reports the total amount
sold in each package of product and includes
overfill.
However, Medicare’s ASP does not include
overfill,17 so we adjusted by using the price per
kilogram in the MIDAS database to the price
per kilogram in a different IQVIA database –
NSP – which we described above. NSP accounts
for only the labeled amount of drug per
package, not the overfill. So, for example, if a
vial is labeled with 100 mg at $100 apiece, but
17 See 75 Fed. Reg. 73466.
has 10 mg overfill, the NSP price would be
$1,000 per gram while the MIDAS price would
be $909.10 per gram. ($100 divided by 110 mg
times 1,000 mg per gram equals $909.10.) This
ratio is calculated for each product where
applicable. We assume in our analysis that
overfill among identical package configurations
is standard regardless of country sold, but if
products are overfilled by different amounts
between countries, this may introduce a source
of variability in the ratio of prices.18
Federal Discount Programs
The MIDAS and NSP invoice prices include all
sales through all distribution channels to all
categories of end purchasers. In the U.S., this
means IQVIA estimates include sales to 340B
Drug Discount Program covered entities at that
program’s ceiling price (or a negotiated
subceiling price). Similarly, sales to federal
VHA facilities, at the program’s mandatorily
reduced prices, are included. This has the effect
of depressing average prices in the U.S. relative
to purchases made outside of these two
mandated discount programs. Undiscounted
sales to 340B covered entities were
approximately $16 billion in 2016,19 out of $450
billion in total pharmaceutical sales, but these
sales are concentrated among drugs typically
reimbursed under Part B rather than Part D.20
18 We make one exception to this methodology for Eylea based on the high ratio of overfill to labeled drug volume in the U.S. relative to overfill outside the U.S. (0.28 mL compared to 0.05 mL). While we are unable to verify each country’s labeled dosage, we assume 0.05 mL, rather than holding the ratio constant. Both the NSP and MIDAS prices account for this assumption. 19 HRSA, Fiscal Year 2019 Justification of Estimates for Appropriations Committees, p. 255. Available at https://www.hrsa.gov/sites/default/files/hrsa/about/budget/budget-justification-fy2019.pdf. 20 MedPAC’s reported that the share of payments for Part B drugs made to 340B covered entities was 48% in 2013 and increasing year over year. See Chapter 3 of the June 2015 Report to Congress, available at http://www.medpac.gov/docs/default-source/reports/chapter-3-part-b-drug-payment-policy-issues-june-2015-report-.pdf.

Comparison of U.S. and International Prices for Top Spending Medicare Part B Drugs U.S. Department of Health and Human Services, Office of the Assistant Secretary for Planning and Evaluation
Page 8
VHA spent approximately $7 billion in 2017,21
but not similarly concentrated among drugs
reimbursed under Part B. For these reasons, the
MIDAS and NSP estimated prices per gram will
typically be below the Part B ASP. We do not
adjust for these price differences in our analysis.
Biologics, Biosimilars, and Generics
Many of the products we include in the analysis
are biologics. While biologics do face
competition from biosimilars in the U.S., there
are far more biologics facing biosimilar
competition outside of the U.S. Because we
restate ex-U.S. pricing in terms of per-HCPCS-
billing code amounts, our analysis does not
include prices for biosimilars with the reference
biologics, in part because the Medicare Part B
reimbursement system treats biosimilars
distinctly under current law and regulation. In
our main analysis we include biologics that
outside the U.S. face biosimilar competition,
even if biosimilars are not available in the U.S.
For these products, we use only the prices for
the reference biologics, as we do for U.S. sales.
Which drugs are subject to generic competition
can differ between countries, as patents and
other exclusivities may expire earlier in one
country compared to another. In addition, a
generic company may successfully challenge a
patent in one country, but not succeed in
another, or a country may not have granted a
patent in the first place. Since this study is
assessing U.S. and ex-U.S. pricing for single
source drugs, we exclude all U.S. products with
generic competition as of July 1, 2018 from our
analysis. However, single source status may be
related to U.S.-only patent or other exclusivity
terms, so our main analysis combines the
generic sales with brand sales, outside the U.S.,
if generics are available in another country.
21 Mike McCaughan. Health Affairs Policy Brief: Prescription Drugs; Veterans Health Administration. Available at https://www.healthaffairs.org/do/10.1377/hpb20171008.000174/full/healthpolicybrief_174.pdf.
We are interested in understanding the effect of
the U.S.’s prices on Medicare Part B spending,
relative to prices paid elsewhere. To better
understand these differences, we calculate
additional spending under Medicare Part B
assuming that drugs are reimbursed at the
international average price rather than ASP+6
percent. This spending difference is calculated
as total Medicare allowed charges divided by
the average international price ratio. Effectively,
the new payment rate is ASP reduced to the
average international price plus 6 percent of
ASP, also reduced by the same ratio.
Considerations for Weighting for Aggregation
For our main analysis, we aggregated country
specific ratios into an international ratio. In
addition, we aggregated product ratios into an
overall ratio for the analysis. When aggregating
within a product across countries, we generated
an international average price that was weighted
by the amount of grams sold. When aggregating
into categories, we calculated an average ratio
by weighting by total U.S. sales dollars as
measured in MIDAS.
4. Results
We identified 32 Medicare Part B drugs among
the top 20 drugs in spending for each setting
(physician offices or HOPDs) or overall in the
U.S. in 2016.22 See Appendix A for a full list of
these drugs, ranking by setting of care, and
setting-specific and total spending by drug.
These 32 drugs accounted for $18 billion in
spending, out of a total of $27 billion on Part B
drugs across these settings (67 percent). The 27
drugs included in the main analysis account for
$17 billion (64 percent). The top product by
expenditures in physician offices was Eylea
(aflibercept), at $2.1 billion. This drug is the
22 We included Zaltrap (ziv-aflibercept) in the analysis to ensure it was separated from Eylea (aflibercept), because IQVIA codes these products as the same molecule.

Comparison of U.S. and International Prices for Top Spending Medicare Part B Drugs U.S. Department of Health and Human Services, Office of the Assistant Secretary for Planning and Evaluation
Page 9
22nd-ranked drug in HOPDs with $138 million
in spending in that setting. The top product in
HOPDs by expenditures was Rituxan
(rituximab), at $826 million, which was the
second-ranked drug in physician offices with
$840 million in expenditures.
In our main analysis we report on 27 Part B
drugs. As described above, we excluded two
drugs that are not physician-administered
(Brovana and Pulmicort). Further, we exclude
one drug (Bendeka) for lack of international
sales data for comparison. In addition, Epogen
(J0881) and Botox (J0585) are not sold in
measures of mass and are excluded from the
main analysis, but are included in the standard
unit analysis as presented in Appendix C. These
five drugs comprised only 5 percent of Part B
drug spending for our study’s drugs in 2016.
Only 11 of the 27 drugs in our main analysis
were sold in all 16 comparator countries in the
first quarter of 2018. Specific brands of
intravenous immunoglobulin drugs (IVIG), as
one example, are not uniformly available in
each country. Finally, sales data for one drug
indicated for a rare disease, Soliris
(eculizumab), was available in IQVIA in 10 of
the 16 countries. Prices for Soliris in these 10
countries were similar to U.S. prices. This
suggests that rather than getting price
concessions from the manufacturers, some
countries simply choose to not cover the
product. Sales data for the remaining products
were available for most of the 16 countries.
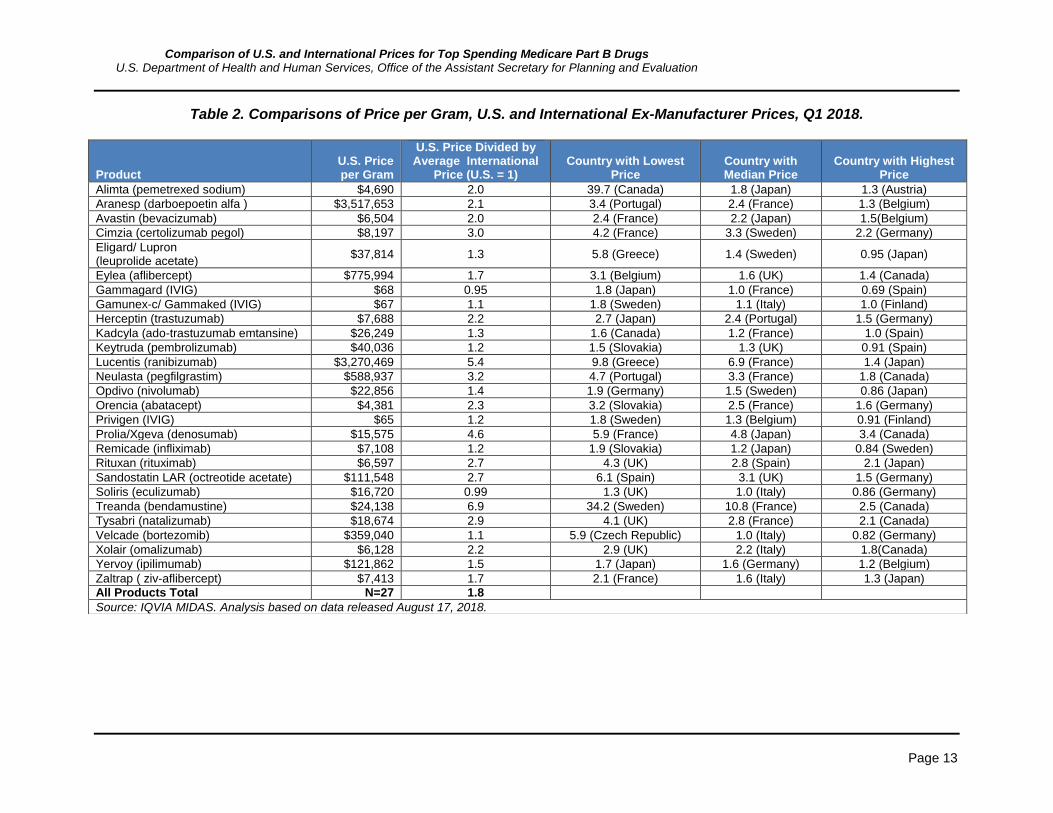
Across the 27 drugs in our study, U.S. ex-
manufacturer prices are 1.8 times that of the
average international ex-manufacturer price in
the first quarter of 2018. Table 2 (see page 13)
presents Q1-2018 price ratios for the U.S. and
the countries with the highest, median, and
lowest prices for the selected products and
groupings. We do not find that any one country
consistently has the highest or lowest prices
compared to the U.S. In this paper we do not
report individual country price index ratios
beyond the highest, median, and lowest prices
that we present in Table 2.
U.S. prices are lower: For two products
(Gammagard and Soliris), U.S. prices
were lower than the average international
price ratio
Prices are similar: For five products, while
the U.S. price is higher, it is within 20
percent of the international price
(Gamunex-c & Gammaked, Keytruda,
Privigen, Remicade, and Velcade).
U.S. prices are higher: For the remaining
20 products, U.S. prices exceed the
average international price by more than
20 percent. This includes three products
(Lucentis, Prolia & Xgeva, and Treanda)
with U.S. prices more than four times the
international average.
In addition to comparisons of the U.S. price to
the international average, we also evaluated
price ratios at the country-specific level.
U.S. prices are higher than any other
country: For 19 of the 27 products, the
highest price among comparison
countries is in the U.S. (In Table 2, the
column for highest price has a value
above 1.0, meaning the U.S. price is the
highest.)
U.S. prices are within range of other
countries’ prices: For the eight other
products, the average international price
may be lower than the U.S. price, but at
least one other country’s price exceeded
the price in the U.S. Spain, Germany,
and Japan had these highest prices
(exceeding the U.S. price) for two drugs
each. Finland and Sweden were the
highest (in excess of the U.S. price) for
one product each.
We also assessed which countries have
uniformly higher or lower prices.

Comparison of U.S. and International Prices for Top Spending Medicare Part B Drugs U.S. Department of Health and Human Services, Office of the Assistant Secretary for Planning and Evaluation
Page 10
Highest prices: Excluding the U.S.,
which has the highest price for 13 drugs
as noted above, among all 27 products
both Germany and Canada had the
highest prices for six drugs, and Japan
for five drugs. No other country had the
highest price for more than three drugs.
Lowest prices: For four products each,
France and the United Kingdom have the
lowest price measured outside the U.S.
Japan, Sweden, and Slovakia have the
lowest prices for three drugs each. No
other country has the lowest price on
more than two products.
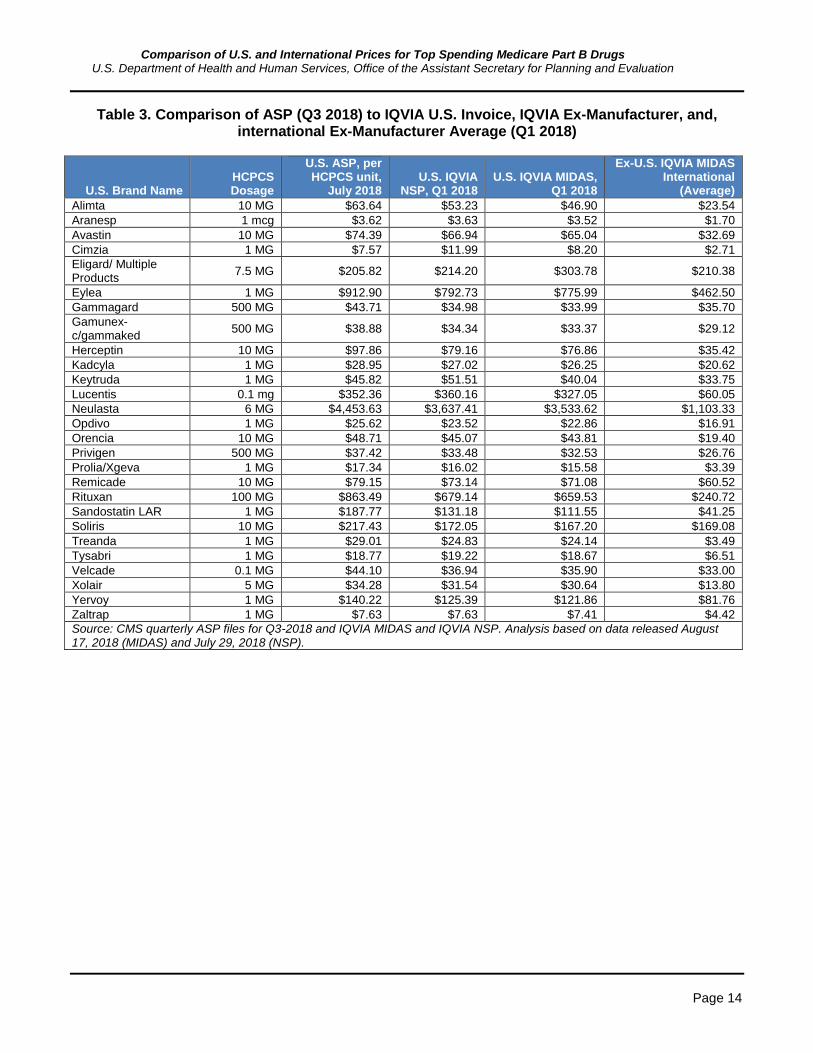
We also restated international and domestic
prices in terms of HCPS billing units to
facilitate comparisons of the IQVIA-derived
prices to ASP. We also restated two U.S. prices
derived from two IQVIA data sets to caveat the
direct comparisons between ASP and IQVIA
derived prices. Table 3 provides comparisons to
ASP overall.
Finally, we calculated that the Medicare
program and its beneficiaries spent an additional
$8.1 billion (or 47 percent more) on these 27
products than it would have, if payments based
upon ASP were scaled by the international price
ratios we calculated. Recognizing that the plus 6
percent add-on is an often-discussed topic, we
made this comparison solely to illustrate the
effects of the price differences we calculated.
See Table 4.
5. Discussion
Overall, prices and reimbursement rates for Part
B drugs are significantly higher for U.S.
providers than purchasers outside the U.S.
Except in a few outlier cases, this conclusion
holds for each drug, and regarding each
international comparator. Medicare could
achieve significant savings if prices in the U.S.
were similar to those of other large market-
based economies.
One of the products for which this is not the
case is an IVIG product. In addition, Soliris
prices are approximately the same in the U.S.
and our comparison countries. Soliris treats a
rare disease and has no competitors, which may
reduce the ability for any country to obtain price
concessions.
Limitations
There are several limitations to this data, which
may apply to some products more than others.
Namely, product presentations (dosage forms
and strengths) and manufacturing standards may
differ significantly. Further, the design choices
we made in our analysis may affect the point
estimates we calculate. We describe these
limitations below.
Meaningful Differences across Countries
The products available in other countries do not
perfectly align with products available in the
United States. The technical appendix that
accompanies this paper provides product
specific information that explores differences in
products by country.
We found that the responsible manufacturer
differs between the U.S. and other countries. For
example, no fewer than five manufacturers sell
branded Treanda across our comparison
countries. Remicade (infliximab) is sold by
Merck Sharp & Dohme in at least 11 countries
and by Johnson & Johnson in the U.S. and at
least four other countries. In this case (and in
others), Japan has a different manufacturer than
all other countries. Different manufacturers may
have different marketing strategies, which may
make it difficult to fully compare the pricing
between countries.
In addition, available formulations may differ
between countries. These differences in
formulations may alter the usage pattern of the
drug. For instance, as we discussed above, an
auto-injector version of Cimzia is available in
Europe. Auto-injectors help facilitate self-

Comparison of U.S. and International Prices for Top Spending Medicare Part B Drugs U.S. Department of Health and Human Services, Office of the Assistant Secretary for Planning and Evaluation
Page 11
administration of a product. While the pre-filled
syringe formulation of Cimzia sold in the U.S. is
also self-administered, Cimzia may have a
larger share of spending through self-
administration outside the U.S. Thus, it may be
inappropriate to compare the U.S. and European
versions.
Third, there may be broad differences in clinical
indications for these products, or different
regulatory approval standards. For instance,
Cimzia’s self-administered formulations were
approved much earlier in European markets than
they were in the U.S. As with overall approval,
indications for use may differ widely, as well as
may typical dosages even for the same indicated
uses. To the extent that pricing may differ based
on clinical indication or expected dosage, we
did not account for it.
Overfill
For injectable products, the manufacturer may
decide to include more product in a vial than is
administered to the patient. Some products have
more overfill than other products. Within
MIDAS, the price-per-gram data includes the
total amount of drug in the physical product. We
used IQVIA NSP to attempt to address this
concern by only including the amount of drug
typically dispensed. As a result, we included
NSP prices in Table 3. Given that we are mostly
concerned about the ratio of prices between the
U.S. and other countries, overfill would be only
an issue in cases in which vial sizes differ
between countries.
Data reporting
The data available in MIDAS is collected at
different levels in each country. For example, in
some countries data is collected at the hospital
level, while at others only at a higher level such
as the wholesale level. IQVIA then uses its own
proprietary methods to estimate whole-country
sales volumes and prices. IQVIA does not have
specific information on discounts for any given
unit including rebates, volume-based discounts,
or prompt-pay discounts.
Further, IQVIA data reporting may be subject to
limitations by manufacturers. If a manufacturer
restricts IQVIA’s ability to publish data, the
pricing numbers in IQVIA may be incorrect. For
instance, for some drugs in the U.S., IQVIA
only receives data from federal facilities. As a
result, the prices for drugs may not be
representative overall prices paid. For example,
IQVIA’s data products underestimate the sales
volume and price for Eylea due to data
restrictions from the manufacturer. Based on
examining distribution channel data in IQVIA
NSP, we estimate that the U.S. price should be
higher. IQVIA’s Eylea data reflects mostly sales
to federal facilities, which are able to purchase
the product at a lower price relative to the rest of
the market. We still included Eylea in this
analysis despite this issue, because the ratio
itself was not an outlier and it underestimates
the difference between U.S. and international
prices.
Ex-manufacturer Price versus Net Price
This analysis compared the U.S. and other
countries at the ex-manufacturer level. This
price may not accurately reflect the actual
amount paid in the U.S. or abroad.
In other countries, there may be additional
rebates and value-based agreements that are not
captured in the ex-manufacturer price.
Similarly, the U.S. ex-manufacturer prices do
not include potential rebates and after sale
discounts. To the extent that these impacts differ
by country, our results will be biased. While this
is an important limitation, as we explained
above, we considered this issue to be less
important for drugs administered by physicians
compared to drugs dispensed through retail
pharmacies. Some of the drugs included in this
study also have notable distribution through
pharmacies for self-administration, which may
result in greater bias in the results, if pricing
Comparison of U.S. and International Prices for Top Spending Medicare Part B Drugs U.S. Department of Health and Human Services, Office of the Assistant Secretary for Planning and Evaluation
Page 12
strategies differ based on whether consumers
face direct costs at the pharmacy point of sale
for example.
Generics and Biosimilars
This analysis included only single-source U.S.
drug products. Thus, if the product has generic
or biosimilar products available elsewhere, but
not in the United States, it is included. When
calculating international prices, we included
generic products outside the US as part of the
price of the product. While this choice reduced
prices paid outside the U.S., it reflected current
HCPCS policy had we included U.S. multiple
source drugs, and it allowed us to better
understand the role that longer patents or
exclusivities in the U.S. may play in price
differences. On the other hand, biosimilars are
not included in the same HCPCS code as their
reference biologic. As a result, this analysis did
not include biosimilars in the U.S. or outside the
U.S. in the analysis. Even though biosimilars are
not included in the analysis, it is possible that
the existence of biosimilars in other countries
reduces the price of the reference biologic in
those countries. Due to these pricing impacts
some may suggest that such products should be
removed from the analysis.
6. Conclusion
In this paper, we found that overall, the prices
paid for Medicare Part B drugs with the greatest
expenditures in the U.S. exceeded the prices
paid in countries with similar economic
conditions. The amount by which U.S. prices
exceeded those of international comparators
varied significantly by product, and there was
no clear pattern as to which countries were
consistently paying lower prices. We find these
higher U.S. prices mean that the Medicare
program pays nearly twice as much as it would
pay for the same or similar drugs in other
countries.
Comparison of U.S. and International Prices for Top Spending Medicare Part B Drugs U.S. Department of Health and Human Services, Office of the Assistant Secretary for Planning and Evaluation
Page 13
Table 2. Comparisons of Price per Gram, U.S. and International Ex-Manufacturer Prices, Q1 2018.
Product U.S. Price per Gram
U.S. Price Divided by Average International
Price (U.S. = 1) Country with Lowest
Price Country with Median Price
Country with Highest Price
Alimta (pemetrexed sodium) $4,690 2.0 39.7 (Canada) 1.8 (Japan) 1.3 (Austria)
Aranesp (darboepoetin alfa ) $3,517,653 2.1 3.4 (Portugal) 2.4 (France) 1.3 (Belgium)
Avastin (bevacizumab) $6,504 2.0 2.4 (France) 2.2 (Japan) 1.5(Belgium)
Cimzia (certolizumab pegol) $8,197 3.0 4.2 (France) 3.3 (Sweden) 2.2 (Germany)
Eligard/ Lupron (leuprolide acetate)
$37,814 1.3 5.8 (Greece) 1.4 (Sweden) 0.95 (Japan)
Eylea (aflibercept) $775,994 1.7 3.1 (Belgium) 1.6 (UK) 1.4 (Canada)
Gammagard (IVIG) $68 0.95 1.8 (Japan) 1.0 (France) 0.69 (Spain)
Gamunex-c/ Gammaked (IVIG) $67 1.1 1.8 (Sweden) 1.1 (Italy) 1.0 (Finland)
Herceptin (trastuzumab) $7,688 2.2 2.7 (Japan) 2.4 (Portugal) 1.5 (Germany)
Kadcyla (ado-trastuzumab emtansine) $26,249 1.3 1.6 (Canada) 1.2 (France) 1.0 (Spain)
Keytruda (pembrolizumab) $40,036 1.2 1.5 (Slovakia) 1.3 (UK) 0.91 (Spain)
Lucentis (ranibizumab) $3,270,469 5.4 9.8 (Greece) 6.9 (France) 1.4 (Japan)
Neulasta (pegfilgrastim) $588,937 3.2 4.7 (Portugal) 3.3 (France) 1.8 (Canada)
Opdivo (nivolumab) $22,856 1.4 1.9 (Germany) 1.5 (Sweden) 0.86 (Japan)
Orencia (abatacept) $4,381 2.3 3.2 (Slovakia) 2.5 (France) 1.6 (Germany)
Privigen (IVIG) $65 1.2 1.8 (Sweden) 1.3 (Belgium) 0.91 (Finland)
Prolia/Xgeva (denosumab) $15,575 4.6 5.9 (France) 4.8 (Japan) 3.4 (Canada)
Remicade (infliximab) $7,108 1.2 1.9 (Slovakia) 1.2 (Japan) 0.84 (Sweden)
Rituxan (rituximab) $6,597 2.7 4.3 (UK) 2.8 (Spain) 2.1 (Japan)
Sandostatin LAR (octreotide acetate) $111,548 2.7 6.1 (Spain) 3.1 (UK) 1.5 (Germany)
Soliris (eculizumab) $16,720 0.99 1.3 (UK) 1.0 (Italy) 0.86 (Germany)
Treanda (bendamustine) $24,138 6.9 34.2 (Sweden) 10.8 (France) 2.5 (Canada)
Tysabri (natalizumab) $18,674 2.9 4.1 (UK) 2.8 (France) 2.1 (Canada)
Velcade (bortezomib) $359,040 1.1 5.9 (Czech Republic) 1.0 (Italy) 0.82 (Germany)
Xolair (omalizumab) $6,128 2.2 2.9 (UK) 2.2 (Italy) 1.8(Canada)
Yervoy (ipilimumab) $121,862 1.5 1.7 (Japan) 1.6 (Germany) 1.2 (Belgium)
Zaltrap ( ziv-aflibercept) $7,413 1.7 2.1 (France) 1.6 (Italy) 1.3 (Japan)
All Products Total N=27 1.8
Source: IQVIA MIDAS. Analysis based on data released August 17, 2018.
Comparison of U.S. and International Prices for Top Spending Medicare Part B Drugs U.S. Department of Health and Human Services, Office of the Assistant Secretary for Planning and Evaluation
Page 14
Table 3. Comparison of ASP (Q3 2018) to IQVIA U.S. Invoice, IQVIA Ex-Manufacturer, and, international Ex-Manufacturer Average (Q1 2018)
U.S. Brand Name HCPCS Dosage
U.S. ASP, per HCPCS unit,
July 2018 U.S. IQVIA
NSP, Q1 2018 U.S. IQVIA MIDAS,
Q1 2018
Ex-U.S. IQVIA MIDAS International
(Average)
Alimta 10 MG $63.64 $53.23 $46.90 $23.54
Aranesp 1 mcg $3.62 $3.63 $3.52 $1.70
Avastin 10 MG $74.39 $66.94 $65.04 $32.69
Cimzia 1 MG $7.57 $11.99 $8.20 $2.71
Eligard/ Multiple Products
7.5 MG $205.82 $214.20 $303.78 $210.38
Eylea 1 MG $912.90 $792.73 $775.99 $462.50
Gammagard 500 MG $43.71 $34.98 $33.99 $35.70
Gamunex-c/gammaked
500 MG $38.88 $34.34 $33.37 $29.12
Herceptin 10 MG $97.86 $79.16 $76.86 $35.42
Kadcyla 1 MG $28.95 $27.02 $26.25 $20.62
Keytruda 1 MG $45.82 $51.51 $40.04 $33.75
Lucentis 0.1 mg $352.36 $360.16 $327.05 $60.05
Neulasta 6 MG $4,453.63 $3,637.41 $3,533.62 $1,103.33
Opdivo 1 MG $25.62 $23.52 $22.86 $16.91
Orencia 10 MG $48.71 $45.07 $43.81 $19.40
Privigen 500 MG $37.42 $33.48 $32.53 $26.76
Prolia/Xgeva 1 MG $17.34 $16.02 $15.58 $3.39
Remicade 10 MG $79.15 $73.14 $71.08 $60.52
Rituxan 100 MG $863.49 $679.14 $659.53 $240.72
Sandostatin LAR 1 MG $187.77 $131.18 $111.55 $41.25
Soliris 10 MG $217.43 $172.05 $167.20 $169.08
Treanda 1 MG $29.01 $24.83 $24.14 $3.49
Tysabri 1 MG $18.77 $19.22 $18.67 $6.51
Velcade 0.1 MG $44.10 $36.94 $35.90 $33.00
Xolair 5 MG $34.28 $31.54 $30.64 $13.80
Yervoy 1 MG $140.22 $125.39 $121.86 $81.76
Zaltrap 1 MG $7.63 $7.63 $7.41 $4.42
Source: CMS quarterly ASP files for Q3-2018 and IQVIA MIDAS and IQVIA NSP. Analysis based on data released August 17, 2018 (MIDAS) and July 29, 2018 (NSP).

Comparison of U.S. and International Prices for Top Spending Medicare Part B Drugs U.S. Department of Health and Human Services, Office of the Assistant Secretary for Planning and Evaluation
Page 15
Table 4. Changes in Medicare Part B Spending Based on International Comparator Price
HCPCS Code
U.S. Brand Name
2016 Total Medicare Part B Allowed
Charges
Medicare Part B Spending if Paid at the International Volume-Weighted Average Price23
Difference in Spending
J0178 Eylea $2,208,730,192 $1,152,867,398 ($892,314,629)
J9310 Rituxan $1,665,667,931 $639,603,352 ($1,057,851,434)
J2505 Neulasta $1,375,670,111 $424,641,010 ($946,133,518)
J1745 Remicade $1,338,726,195 $1,134,829,514 ($198,877,939)
J9299 Opdivo $1,220,839,260 $933,097,337 ($317,397,205)
J9035 Avastin $1,111,678,364 $567,128,402 ($552,964,027)
J0897 Xgeva/ Prolia $1,086,664,418 $234,454,406 ($849,982,901)
J2778 Lucentis $1,044,324,413 $187,779,622 ($852,588,112)
J9355 Herceptin $703,556,755 $339,667,923 ($379,373,082)
J9305 Alimta $511,822,437 $253,797,147 ($254,960,126)
J0129 Orencia $586,532,902 $255,021,785 ($326,803,388)
J9041 Velcade $490,438,068 $452,011,950 ($39,651,249)
J2353 Sandostatin LAR $411,511,792 $154,824,669 ($259,319,716)
J9217 Eligard $289,060,099 $215,839,009 ($74,636,177)
J1561 Gamunex $299,752,172 $261,524,159 ($38,228,013)
J0881 Aranesp $290,619,828 $141,366,296 ($150,572,598)
J9271 Keytruda $327,322,225 $285,984,921 ($51,358,260)
J1569 Gammagard $282,939,607 $297,155,879 $14,216,272
J1459 Privigen $237,597,939 $195,414,760 ($42,183,179)
J2357 Xolair $328,046,394 $146,959,018 ($180,282,725)
J2323 Tysabri $305,983,047 $103,995,559 ($199,303,326)
J9033 Treanda $263,809,341 $41,215,343 ($225,623,458)
J1300 Soliris $267,076,579 $269,976,437 $3,003,237
J9228 Yervoy $236,636,161 $168,272,373 ($77,863,939)
J0717 Cimzia $235,364,188 $77,115,101 ($157,589,093)
J9354 Kadcyla $113,231,486 $89,670,721 ($24,273,582)
J9400 Zaltrap $6,188,170 $3,686,556 ($2,501,614)
Grand Total, Top 20 PO or HOPD (N=27)
$17,239,790,075 $9,104,376,292 ($8,135,413,782)
Source: CMS and IQVIA MIDAS. Analysis based on data released August 17, 2018.Numbers may not add up due to rounding.
23 Deflation is based upon the ratios in Table 2. We take the total amount paid for these Part B drugs in 2016 as presented Appendix A and divided them by the ratios that were the results of our analysis in Table 2.
Comparison of U.S. and International Prices for Top Spending Medicare Part B Drugs U.S. Department of Health and Human Services, Office of the Assistant Secretary for Planning and Evaluation
Page 16
References
1. Danzon, P.M. and M.F. Furukawa, International prices and availability of pharmaceuticals in 2005.
Health Aff (Millwood), 2008. 27(1): p. 221-33.
2. Kanavos, P.G. and S. Vandoros, Determinants of branded prescription medicine prices in OECD
countries. Health Econ Policy Law, 2011. 6(3): p. 337-67.
3. U.S. Department of Commerce International Trade Administration, Pharmaceutical Price Controls in
OECD Countries: Implications for U.S. Consumers, Pricing, Research and Development and Innovation.
2004, U.S. Department of Commerce International Trade Administration, : Washington, DC.
4. Kanavos, P., et al., Higher U.S. branded drug prices and spending compared to other countries may stem
partly from quick uptake of new drugs. Health Aff (Millwood), 2013. 32(4): p. 753-61.
5. Danzon, P.M. and M.F. Furukawa, Prices and availability of biopharmaceuticals: an international
comparison. Health Aff (Millwood), 2006. 25(5): p. 1353-62.
6. Kesselheim, A.S., J. Avorn, and A. Sarpatwari, The High Cost of Prescription Drugs in the United States:
Origins and Prospects for Reform. JAMA, 2016. 316(8): p. 858-71.
7. Papanicolas, L.E., et al., Not Just Antibiotics: Is Cancer Chemotherapy Driving Antimicrobial
Resistance? Trends in Microbiology, 2018. 26(5): p. 393-400.
8. Savage, P., et al., Cancer Drugs: An International Comparison of Postlicensing Price Inflation. Journal
of Oncology Practice, 2017. 13(6): p. 384-+.
9. Suh, G.H., et al., International price comparisons of Alzheimer's drugs: a way to close the affordability
gap. International Psychogeriatrics, 2009. 21(6): p. 1116-1126.
10. Danzon, P.M. and M.F. Furukawa, Prices and availability of pharmaceuticals: evidence from nine
countries. Health Aff (Millwood), 2003. Suppl Web Exclusives: p. W3-521-36.
11. Miller, E. U.S. Drug Prices vs The World. 2018 [cited 2018; Available from:
https://www.drugwatch.com/featured/us-drug-prices-higher-vs-world/.

Comparison of U.S. and International Prices for Top Spending Medicare Part B Drugs U.S. Department of Health and Human Services, Office of the Assistant Secretary for Planning and Evaluation
Page 17
Appendix A: Top Part B Drugs in Physician Offices or Hospital Outpatient Departments, 2016
HCPCS Code U.S. Brand Name Molecule
Physician Office Allowed Charges, 2016
Physician Office Rank
HOPD Allowed Charges, 2016
HOPD Rank Total Spend
Total Rank
J0178 Eylea Aflibercept $2,071,052,178 1 $137,678,013 21 $2,208,730,192 1
J9310 Rituxan Rituximab $839,577,817 3 $826,090,112 1 $1,665,667,931 2
J2505 Neulasta Pegfilgrastim $681,665,008 6 $694,005,097 2 $1,375,670,111 3
J1745 Remicade Infliximab $832,050,751 4 $506,675,440 5 $1,338,726,195 4
J9299 Opdivo Nivolumab $580,636,482 7 $640,202,771 3 $1,220,839,260 5
J9035 Avastin Bevacizumab $561,491,122 8 $550,187,233 4 $1,111,678,364 6
J0897 Xgeva/Prolia Denosumab $683,404,048 5 $403,260,364 6 $1,086,664,418 7
J2778 Lucentis Ranibizumab $1,005,623,707 2 $38,700,704 56 $1,044,324,413 8
J9355 Herceptin Trastuzumab $334,464,920 10 $369,091,825 7 $703,556,755 9
J0129 Orencia Abatacept $406,895,619 9 $179,637,275 15 $586,532,902 10
J9305 Alimta Pemetrexed $235,992,292 12 $275,830,133 8 $511,822,437 11
J9041 Velcade Bortezomib $263,115,549 11 $227,322,508 10 $490,438,068 12
J2353 Sandostatin Octreotide acetate $179,163,663 22 $232,348,111 9 $411,511,796 13
J2357 Xolair Omalizumab $155,367,158 26 $172,679,213 17 $328,046,398 14
J9271 Keytruda Pembrolizumab $115,235,357 40 $212,086,833 12 $327,322,229 15
J2323 Tysabri Natalizumab $121,603,932 38 $184,379,082 14 $305,983,051 16
J1561 Gamunex IVIG $113,441,522 41 $186,310,613 13 $299,752,176 17
* J0585 Botox Onabotulinumtoxin A $203,050,245 16 $92,436,264 29 $295,486,525 18
* J0885 Epogen Epoetin alfa $208,040,284 15 $83,413,376 30 $291,453,675 19
J0881 Aranesp Darboepoetin alfa $166,314,575 24 $124,305,233 24 $290,619,832 20
J9217 Eligard Leuprolide acetate $224,381,941 13 $64,678,145 38 $289,060,099 21
J1569 Gammagard IVIG $124,326,865 36 $158,612,710 18 $282,939,611 22
J1300 Soliris Eculizumab $88,680,008 50 $178,396,526 16 $267,076,583 23
J9033 Treanda Bendamustine $125,105,469 35 $138,703,842 20 $263,809,345 24
* J9034 Bendeka Bendamustine #N/A #N/A
J1459 Privigen IVIG $24,580,466 95 $213,017,381 11 $237,597,943 25
J9228 Yervoy Ipilimumab $96,651,726 47 $139,984,392 19 $236,636,165 26
J0717 Cimzia Certolizumab Pegol $197,956,992 18 $37,407,181 57 $235,364,191 27
* J7605 Brovana Arformoterol tartrate $211,074,241 14 #N/A $211,074,255 28
* J7626 Pulmicort Budesonide $196,567,537 19 #N/A $196,567,556 29
J9354 Kadcyla
Ado-trastuzumab emtansine
$47,500,452 67 $65,730,971 37 $113,231,490 30
J9400 Zaltrap ziv-Aflibercept $4,326,085 170 $1,861,918 152 $6,188,174 234
Drugs Excluded from Main Analysis N=5 $610,692,023 $92,436,264 $703,128,287
Drugs Included in Main Analysis N=27 $10,488,645,988 $7,042,597,002 $17,531,242,990
* Indicates drug is excluded from main analysis. Source: CMS program data.

Comparison of U.S. and International Prices for Top Spending Medicare Part B Drugs U.S. Department of Health and Human Services, Office of the Assistant Secretary for Planning and Evaluation
Page 18
Appendix Table B: Selected Drugs and Generic or Biosimilarity Availability.
HCPCS Code
U.S. Brand Name Molecule
Total Part B Allowable Charges
Total Part B Rank
Physician Administered
Generic Available
(year)
Biosimilars Available in U.S.
(year)
Biosimilars Available ex-U.S.
(year)
J0178 Eylea Aflibercept $2,208,730,192 1 Yes N/A No No
J9310 Rituxan Rituximab $1,665,667,931 2 Yes N/A No Yes
J2505 Neulasta Pegfilgrastim $1,375,670,111 3 Yes N/A Yes (2018) No
J1745 Remicade Infliximab $1,338,726,195 4 Yes N/A Yes (2016) Yes
J9299 Opdivo Nivolumab $1,220,839,260 5 Yes N/A No No
J9035 Avastin Bevacizumab $1,111,678,364 6 Yes N/A No, but approved
in 2017 No, but approved in
2017
J0897 Xgeva/ Prolia Denosumab $1,086,664,418 7 Yes N/A No No
J2778 Lucentis Ranibizumab $1,044,324,413 8 Yes N/A No No
J9355 Herceptin Trastuzumab $703,556,755 9 Yes N/A No, but approved
in 2017 Yes, 2018
J0129 Orencia Abatacept $586,532,902 10 Yes N/A No No
J9305 Alimta Pemetrexed $511,822,437 11 Yes No N/A N/A
J9041 Velcade Bortezomib $490,438,068 12 Yes N/A N/A N/A
J2353 Sandostatin LAR Octreotide acetate $411,511,796 13 No No N/A N/A
J2357 Xolair Omalizumab $328,046,398 14 Yes N/A No No
J9271 Keytruda Pembrolizumab $327,322,229 15 Yes N/A No No
J2323 Tysabri Natalizumab $305,983,051 16 Yes N/A No No
J1561 Gamunex IVIG $299,752,176 17 No N/A No No
* J0585 Botox Onabotulinumtoxin A $295,486,525 18 Yes N/A No No
* J0885 Epogen Epoetin alfa $291,453,675 19 Yes N/A No, but approved
in 2018 Yes, 2007
J0881 Aranesp Darboepoetin alfa $290,619,832 20 Yes N/A No Yes, 2007
J9217 Eligard Leuprolide acetate $289,060,099 21 Yes Yes (2009) N/A N/A
J1569 Gammagard IVIG $282,939,611 22 No N/A No No
J1300 Soliris Eculizumab $267,076,583 23 Yes N/A No No
J9033 Treanda Bendamustine $263,809,345 24 Yes No N/A N/A
* J9034 Bendeka Bendamustine N/A N/A Yes Yes (2018) N/A N/A
J1459 Privigen IVIG $237,597,943 25 No N/A No No
J9228 Yervoy Ipilimumab $236,636,165 26 Yes N/A No No
J0717 Cimzia Certolizumab Pegol $235,364,191 27 Yes N/A No No
* J7605 Brovana Arformoterol $211,074,255 28 No No N/A N/A
* J7626 Pulmicort Budesonide $196,567,556 29 No Yes (2013) N/A N/A
J9354 Kadcyla Ado-trastuzumab emtansine
$113,231,490 30 Yes N/A No No
J9400 Zaltrap ziv-Aflibercept $6,188,174 234 Yes N/A No No

Comparison of U.S. and International Prices for Top Spending Medicare Part B Drugs U.S. Department of Health and Human Services, Office of the Assistant Secretary for Planning and Evaluation
Page 19
Appendix Table C: Comparisons of Price Per Standard Unit, U.S. and International Ex-Manufacturer Prices, Q1 2018
Product U.S. Price per Standard Unit
U.S. Price Divided by Average
International Price (U.S. = 1)
Alimta $1,494.65 1.8
Aranesp $205.66 2.5
Avastin $1,611.05 2.0
Botox $792.69 3.2
Cimzia $1,639.42 3.1
Eligard/ Other products $944.66 2.1
Epogen $253.08 3.4
Eylea $1,540.91 1.6
Gammagard $918. 83 2.1
Gamunex-c/gammaked $909.32 2.1
Herceptin $1,153.17 1.4
Kadcyla $3,070.00 1.3
Keytruda $4,003.59 1.6
Lucentis $1,635.17 1.8
Neulasta $3,533.62 3.6
Opdivo $2,206.09 1.7
Orencia $862.33 2.8
Privigen $1,019.83 1.4
Prolia/Xgeva $1,262.77 4.8
Remicade $710.84 1.2
Rituxan $1,756.93 1.5
Sandostatin LAR $3,308.19 2.5
Soliris $5,016.08 0.99
Treanda $1,691.81 6.4
Tysabri $5,602.42 2.9
Velcade $1,256.63 1.1
Xolair $919.29 2.3
Yervoy $12,610.53 1.5
Zaltrap $1,124.65 1.7
Source: IQVIA MIDAS. Analysis based on data released August 17, 2018.
Related Documents