COMPARISON OF SINGLE AND MULTI-SCALE METHOD FOR LEAF AND WOOD POINTS CLASSIFICATION FROM TERRESTRIAL LASER SCANNING DATA Hongqiang Wei 1 , Guiyun Zhou 1, *, Junjie Zhou 1 1 School of Resources and Environment, University of Electronic Science and Technology of China, Chengdu, Sichuan 611731, China - (hongqiang.wei, guiyun.zhou, junjie.zhou) [email protected] KEY WORDS: Scale, Leaf and wood classification, Terrestrial Laser Scanning, Tree point cloud, Machine Learning ABSTRACT: The classification of leaf and wood points is an essential preprocessing step for extracting inventory measurements and canopy characterization of trees from the terrestrial laser scanning (TLS) data. The geometry-based approach is one of the widely used classification method. In the geometry-based method, it is common practice to extract salient features at one single scale before the features are used for classification. It remains unclear how different scale(s) used affect the classification accuracy and efficiency. To assess the scale effect on the classification accuracy and efficiency, we extracted the single-scale and multi-scale salient features from the point clouds of two oak trees of different sizes and conducted the classification on leaf and wood. Our experimental results show that the balanced accuracy of the multi-scale method is higher than the average balanced accuracy of the single-scale method by about 10% for both trees. The average speed-up ratio of single scale classifiers over multi-scale classifier for each tree is higher than 30. 1. INTRODUCTION Terrestrial laser scanning (TLS) provides a revolutionary way of quantifying individual tree characteristics, with details and accuracy that satellite laser scanning (SLS) and airborne laser scanning (ALS) cannot match (Tao et al., 2015). Significant progress has been made using TLS data to calculate diameter at breast height (DBH), leaf area index (LAI), plant biomass, virtual projections, gap fraction, etc. (Dassot et al., 2011). The inventory measurements and canopy characterization of trees help ecologists and botanists build more accurate models for large amount of fine-scale research. 1 The retrieval of many parameters of tree from TLS data requires the classification of leaf and wood points to improve accuracy and reduce complexities. The classification of tree point clouds into leaf and wood points is a challenge. According to Wang et al. (2017), two types of methods have emerged for this problem. * Corresponding author The first-type method uses intensity information of returned laser pulse (Pfeifer et al., 2007; Pfennigbauer and Ullrich, 2010; Bé land et al., 2014). The assumption of this approach is that there are significant differences among the optical properties of different components of a tree at the operating wavelength of the laser system (Tao et al., 2015; Wang et al., 2017). Trees of different species may respond similarly to the laser wavelength , meaning that the intensity-based approach cannot be used for some tree species. In addition, the intensity values need an instrument specific radiometric calibration before it can be used for leaf and wood classification (Pfennigbauer and Ullrich, 2010; Calders et al., 2017). According to Hakala et al. (2012), multi- wavelength scanners have huge potential for improved accuracy and efficiency in comparison with traditional monochromatic laser scanners. However, this type of scanners are still in an early development stage and are not available from commercial manufacturers. The second-type method is referred to as the geometry-based method, which uses three dimensional ISPRS Annals of the Photogrammetry, Remote Sensing and Spatial Information Sciences, Volume IV-3, 2018 ISPRS TC III Mid-term Symposium “Developments, Technologies and Applications in Remote Sensing”, 7–10 May, Beijing, China This contribution has been peer-reviewed. The double-blind peer-review was conducted on the basis of the full paper. https://doi.org/10.5194/isprs-annals-IV-3-217-2018 | © Authors 2018. CC BY 4.0 License. 217

Welcome message from author
This document is posted to help you gain knowledge. Please leave a comment to let me know what you think about it! Share it to your friends and learn new things together.
Transcript

COMPARISON OF SINGLE AND MULTI-SCALE METHOD FOR LEAF AND WOOD
POINTS CLASSIFICATION FROM TERRESTRIAL LASER SCANNING DATA
Hongqiang Wei1, Guiyun Zhou1,*, Junjie Zhou1
1School of Resources and Environment, University of Electronic Science and Technology of China, Chengdu, Sichuan 611731, China
- (hongqiang.wei, guiyun.zhou, junjie.zhou) [email protected]
KEY WORDS: Scale, Leaf and wood classification, Terrestrial Laser Scanning, Tree point cloud, Machine Learning
ABSTRACT:
The classification of leaf and wood points is an essential preprocessing step for extracting inventory measurements and canopy
characterization of trees from the terrestrial laser scanning (TLS) data. The geometry-based approach is one of the widely used
classification method. In the geometry-based method, it is common practice to extract salient features at one single scale before the
features are used for classification. It remains unclear how different scale(s) used affect the classification accuracy and efficiency. To
assess the scale effect on the classification accuracy and efficiency, we extracted the single-scale and multi-scale salient features from
the point clouds of two oak trees of different sizes and conducted the classification on leaf and wood. Our experimental results show
that the balanced accuracy of the multi-scale method is higher than the average balanced accuracy of the single-scale method by about
10% for both trees. The average speed-up ratio of single scale classifiers over multi-scale classifier for each tree is higher than 30.
1. INTRODUCTION
Terrestrial laser scanning (TLS) provides a revolutionary way of
quantifying individual tree characteristics, with details and
accuracy that satellite laser scanning (SLS) and airborne laser
scanning (ALS) cannot match (Tao et al., 2015). Significant
progress has been made using TLS data to calculate diameter at
breast height (DBH), leaf area index (LAI), plant biomass,
virtual projections, gap fraction, etc. (Dassot et al., 2011). The
inventory measurements and canopy characterization of trees
help ecologists and botanists build more accurate models for
large amount of fine-scale research.1
The retrieval of many parameters of tree from TLS data requires
the classification of leaf and wood points to improve accuracy
and reduce complexities. The classification of tree point clouds
into leaf and wood points is a challenge. According to Wang et
al. (2017), two types of methods have emerged for this problem.
* Corresponding author
The first-type method uses intensity information of returned
laser pulse (Pfeifer et al., 2007; Pfennigbauer and Ullrich, 2010;
Béland et al., 2014). The assumption of this approach is that
there are significant differences among the optical properties of
different components of a tree at the operating wavelength of the
laser system (Tao et al., 2015; Wang et al., 2017). Trees of
different species may respond similarly to the laser wavelength ,
meaning that the intensity-based approach cannot be used for
some tree species. In addition, the intensity values need an
instrument specific radiometric calibration before it can be used
for leaf and wood classification (Pfennigbauer and Ullrich, 2010;
Calders et al., 2017). According to Hakala et al. (2012), multi-
wavelength scanners have huge potential for improved accuracy
and efficiency in comparison with traditional monochromatic
laser scanners. However, this type of scanners are still in an early
development stage and are not available from commercial
manufacturers. The second-type method is referred to as the
geometry-based method, which uses three dimensional
ISPRS Annals of the Photogrammetry, Remote Sensing and Spatial Information Sciences, Volume IV-3, 2018 ISPRS TC III Mid-term Symposium “Developments, Technologies and Applications in Remote Sensing”, 7–10 May, Beijing, China
This contribution has been peer-reviewed. The double-blind peer-review was conducted on the basis of the full paper. https://doi.org/10.5194/isprs-annals-IV-3-217-2018 | © Authors 2018. CC BY 4.0 License.
217

coordinates of objects captured by a laser scanner (Tao et al.,
2015; Wang et al., 2017). Tao et al. (2015) proposed a geometry-
based method that focuses on leaf and wood classification of
TLS data. Their method extracts the skeleton of trees and then
separates the leaf and wood points. Ma et al. (2016) developed a
method based on the Lalonde’s framework that used the spatial
distribution patterns of the manually selected training points of
each class to drive the Gaussian mixture model (GMM) for leaf
and wood classification (Lalonde et al., 2006). Yun et al. (2016)
presented another method based on Dey’s method, which
calculated the shape, normal vector distribution, structure tensor
of tree point clouds and used the semi-supervised support vector
machine (SVM) classifier to separate leaf and wood points (Dey
et al., 2012). Recently, Li et al. (2017) proposed the normal
difference method based on the differences in the structures of
leaf and non-leaf components of trees. To find better machine
learning classifiers and salient features, Wang et al. (2017)
examined four geometry-based machine learning classifiers and
many salient features that were widely adopted in other
classification tasks (Brodu et al., 2012; Weinmann et al., 2013,
2015, 2017) and found that machine learning classifiers and
several salient features could efficiently separate leaf and wood
points from TLS data with high accuracy.
In Wang’s experiments, he only uses single-scale salient features
to training classifiers. However, the surfaces of trees are
heterogeneous and their distinctive properties are seldom
defined at one specific scale. Therefore, using multi-scale salient
features in this problem holds huge potential for improved
accuracy (Brodu et al., 2012). The lack of comparative studies
on the abilities of single-scale and multi-scale salient features to
characterize the spatial patterns calls for further research on how
single-scale and multi-scale salient features affect the
classification accuracy and efficiency.
In this study, we examine the accuracy and efficiency of single-
and multi-scale leaf and wood classification methods to find
better classification strategy based on the Brodu’s framework.
2. MATERIALS
The study site is located at the Jigong Mountain National Nature
Reserve (114°02' E, 31°50' N), Henan Province, China. The TLS
data of two oak trees of different sizes were acquired from four
scan positions by Leica ScanStation P40 in April, 2016. The
Registration and Edit module of Leica Cyclone 9.1.4 software
are used to preprocess tree point cloud. The acquired point cloud
was further manually cleaned, as the point cloud of other trees
and ground should be removed. The cleaned point cloud for tree
1 and tree 2 contains 3,065,470 and 11,373,009 points,
respectively. The average distance between two adjacent points
is ~3mm. To assess the classification accuracy of single- and
multi-scale methods, we manually identified leaf and wood
points of the two trees. For tree 1, 1,948,299 and 1,117,171
points belong to leaf and wood, respectively. For tree 2,
6,799,597 points belong to leaf and 4,573,412 points to wood.
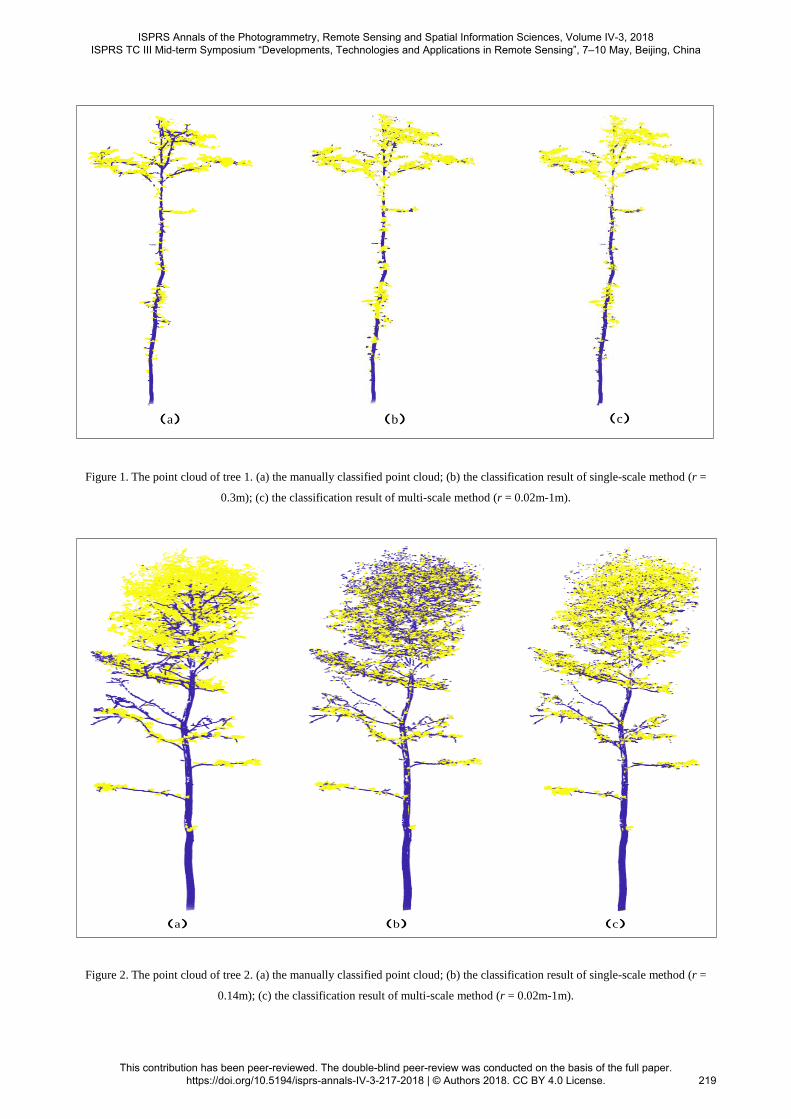
The original data of tree 1 and tree 2 are shown in Figure 1(a)
and Figure 2(a), respectively.
ISPRS Annals of the Photogrammetry, Remote Sensing and Spatial Information Sciences, Volume IV-3, 2018 ISPRS TC III Mid-term Symposium “Developments, Technologies and Applications in Remote Sensing”, 7–10 May, Beijing, China
This contribution has been peer-reviewed. The double-blind peer-review was conducted on the basis of the full paper. https://doi.org/10.5194/isprs-annals-IV-3-217-2018 | © Authors 2018. CC BY 4.0 License.
218
(a) (b) (c)
Figure 1. The point cloud of tree 1. (a) the manually classified point cloud; (b) the classification result of single-scale method (r =
0.3m); (c) the classification result of multi-scale method (r = 0.02m-1m).
(a) (b) (c)
Figure 2. The point cloud of tree 2. (a) the manually classified point cloud; (b) the classification result of single-scale method (r =
0.14m); (c) the classification result of multi-scale method (r = 0.02m-1m).
ISPRS Annals of the Photogrammetry, Remote Sensing and Spatial Information Sciences, Volume IV-3, 2018 ISPRS TC III Mid-term Symposium “Developments, Technologies and Applications in Remote Sensing”, 7–10 May, Beijing, China
This contribution has been peer-reviewed. The double-blind peer-review was conducted on the basis of the full paper. https://doi.org/10.5194/isprs-annals-IV-3-217-2018 | © Authors 2018. CC BY 4.0 License.
219

3. METHODS
3.1 Feature Calculation
Let q = (x, y, z)∈R3 be a point in the three dimensional space. Q
= {qi∈R3 | i=1,…,N} denotes the tree point cloud. The scale r in
our paper is defined as the radius of the ball centered on a point
of interest. For each point in Q, the neighborhood ball is
computed at one or more given scale(s). The Principal
Component Analysis (PCA) is applied to the points in that ball
(Shaw, 2013).
The ordered eigenvalues resulting from the PCA for point qi are
λ1 ≥ λ2 ≥ λ3, which is used to infer the local spatial distribution
pattern of this point. Let Pi = λi /(λ1+λ2+λ3). If P1 ≫ P2 ≈ P3, the
points in the ball are primarily distributed in one dimension, as
in the case of branches. If P1 ≈ P2 ≫ P3, the points in the ball are
primarily distributed in two dimension, as in the case of leaves.
Similarly, if P1 ≈ P2 ≈ P3, the points are distributed evenly in
three dimension. Then the salient feature (SF) of the given point
at the given scale can be defined as the simple combination of
P1, P2 and P3.
SF = (P1, P2 , P3)
3.2 Classifier
The famous machine learning classifier Support Vector Machine
(SVM) is used in our method (Vapnik et al.,1997). For a binary
classification problem, it tries to find a hyper-plane w·x + b = 0,
which maximizes the distance of the closest vector in both
classes. w is the normal vector to the hyper-plane, and b is the
distance of the closest point on the hyper-plane to the origin. For
a non-linear classification problem, it uses a kernel function
implicitly mapping the vector into a high-dimension space to
simplify the classification problem.
3.3 Evaluation
We use the balanced accuracy (ba) to assess the accuracy of
single- and multi-scale classifiers. With tl, tw, fl, fw denotes the
number of points truly(t) / false(f) classified into the leaf(l) /
wood(w) class, balanced accuracy is classically defined as ba =
(al + aw) / 2 with each class accuracy defined as al = tl / (tl +
fw) and aw = tw / (tw + fl) (Brodu et al., 2012). The total running
time of the processing includes the time consumed by feature
extracting, classifier training, and leaf and wood classification.
The speed-up ratio is used to assess the efficiency of single- and
multi-scale classifier. With ta and tb denoting the total running
time of classifier a and b, speed-up ratio of classifier a over b is
defined as ta / tb.
4. EXPERIMENTS AND RESULTS
Our experiments are conducted on a 64-bit windows 10 with an
Intel Core i7-7700k 4.2GHz processor and 16GB RAM. The
source code of our method is written in C++ programing
language. To reduce the computation load, we calculate the
salient features on a subset of the tree point cloud. The number
of points in the subset is about 10% of the tree point clouds
Firstly, about twenty percent of the aforementioned data is used
to train forty single-scale classifiers (r = 0.02m, 0.04m, 0.06m,…,
0.98m, 1m) and one multi-scale classifier (r = 0.02m-1m) for
each tree. The reason why we train so many single-scale
classifiers is that we want to obtain an optimal average
classification accuracy of the single-scale classifier. Then, these
classifiers are used to classify leaf and wood points for each tree.
The classified leaf and wood points of tree 1 and tree 2 are shown
in Figure 1 and Figure 2, respectively. Owing to the limitation of
space, we only plot one single-scale classifier classification
result for tree 1 and tree 2 in Figure 1(b) and Figure 2(b),as they
has the highest balanced accuracy. Similarly, the classification
result of the multi-scale classifier for tree 1 and tree 2 is
presented in Figure 1(c) and Figure 2(c), respectively.
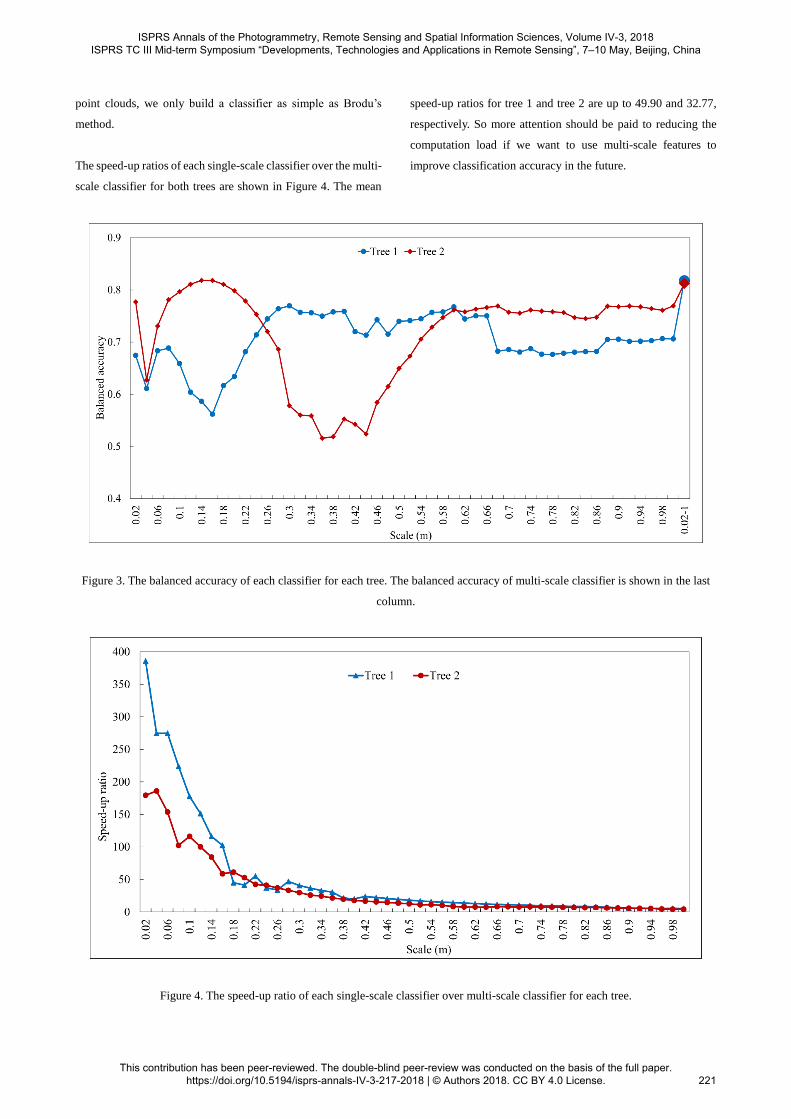
The classification accuracies are shown in Figure 3. The highest
balanced accuracy of the single-scale classifier (r = 0.3m) for
tree 1 is 0.78, which is lower than that of the multi-scale
classifier by about 4%. The highest balanced accuracy of the
single-scale classifier (r = 0.14m) for tree2 is 0.82, which is very
close to that of multi-scale classifier. However, the mean
balanced accuracy of the single-scale classifiers for each tree is
close to 0.7, which is lower than that of the multi-scale classifiers
by about 10%. It is worth noting that the balanced accuracies of
each classifier for tree 1 and tree 2 are lower than those reported
in Yun et al. (2016), Ma et al. (2016) and Wang et al. (2017) by
about 10%-15% because different tree point clouds, salient
features and classifiers are used. Because the purpose of our
study is to study the abilities of single-scale and multi-scale
features to characterize the local spatial patterns of points in
ISPRS Annals of the Photogrammetry, Remote Sensing and Spatial Information Sciences, Volume IV-3, 2018 ISPRS TC III Mid-term Symposium “Developments, Technologies and Applications in Remote Sensing”, 7–10 May, Beijing, China
This contribution has been peer-reviewed. The double-blind peer-review was conducted on the basis of the full paper. https://doi.org/10.5194/isprs-annals-IV-3-217-2018 | © Authors 2018. CC BY 4.0 License.
220
point clouds, we only build a classifier as simple as Brodu’s
method.
The speed-up ratios of each single-scale classifier over the multi-
scale classifier for both trees are shown in Figure 4. The mean
speed-up ratios for tree 1 and tree 2 are up to 49.90 and 32.77,
respectively. So more attention should be paid to reducing the
computation load if we want to use multi-scale features to
improve classification accuracy in the future.
Figure 3. The balanced accuracy of each classifier for each tree. The balanced accuracy of multi-scale classifier is shown in the last
column.
Figure 4. The speed-up ratio of each single-scale classifier over multi-scale classifier for each tree.
ISPRS Annals of the Photogrammetry, Remote Sensing and Spatial Information Sciences, Volume IV-3, 2018 ISPRS TC III Mid-term Symposium “Developments, Technologies and Applications in Remote Sensing”, 7–10 May, Beijing, China
This contribution has been peer-reviewed. The double-blind peer-review was conducted on the basis of the full paper. https://doi.org/10.5194/isprs-annals-IV-3-217-2018 | © Authors 2018. CC BY 4.0 License.
221

5. CONCLUSION
In this study, we assess how single-scale and multi-scale features
affect the classification accuracy and efficiency of leaf and wood.
Two oak trees of different sizes and complexities are used to
evaluate the accuracy and efficiency of the classifiers.
Experimental results show that multi-scale features can achieve
higher balanced accuracy. On average, the balanced accuracy of
the multi-scale method is higher than that of the single-scale
method by about 10%. However, the mean speed-up ratio of
single scale classifiers over multi-scale classifier is higher than
30. In the future, we will employ more optimization strategies to
reduce the processing time of the multi-scale method.
ACKNOWLEDGEMENTS
This work was supported by the National Natural Science
Foundation of China under Grant number 41671427; the
Fundamental Research Funds for the Central Universities under
Grant number ZYGX2016J148. We thank the referees for their
constructive criticism and comments.
REFERENCES
Béland, M., Baldocchi, D.D., Widlowski, J.L., Fournier,
R.A.,and Verstraete, M.M. 2014. On seeing the wood from the
leaves and the role of voxel size in determining leaf area
distribution of forests with terrestrial LiDAR. Agricultural &
Forest Meteorology, 184(2), pp. 82-97.
Brodu, N., and Lague, D. 2012. 3D terrestrial LiDAR data
classification of complex natural scenes using a multi-scale
dimensionality criterion: applications in geomorphology. Isprs
Journal of Photogrammetry & Remote Sensing, 68(1), pp.121-
134.
Calders, K., Disney, M.I., Armston, J., Burt, A., Brede, B., and
Origo, N. 2017. Evaluation of the range accuracy and the
radiometric calibration of multiple terrestrial LiDAR scanning
instruments for data interoperability. IEEE Transactions on
Geoscience & Remote Sensing, 55(5), pp.1-9.
Dassot, M., Constant, T., and Fournier, M. 2011. The use of
terrestrial LiDAR technology in forest science: application fields,
benefits and challenges. Annals of Forest Science, 68(5), pp.959-
974.
Dey, D., Mummert, L., and Sukthankar, R. 2012. Classification
of plant structures from uncalibrated image sequences. In
Proceedings of the 2012 IEEE Workshop on Applications of
Computer Vision (WACV), Breckenridge, CO, USA, pp.329-336.
Hakala, T., Suomalainen, J., Kaasalainen, S., and Chen, Y. 2012.
Full waveform hyperspectral LiDAR for terrestrial laser
scanning. Optics Express, 20(7), pp.7119.
Lalonde, J. F., Vandapel, N., Huber, D. F., and Hebert, M. 2006.
Natural terrain classification using three‐dimensional LiDAR
data for ground robot mobility. Journal of Field Robotics, 23(10),
pp.839-861.
Li, S., Dai, L., Wang, H., Wang, Y., He, Z., and Lin, S. 2017.
Estimating leaf area density of individual trees using the point
cloud segmentation of terrestrial LiDAR data and a voxel-based
model. Remote Sensing, 9(12), pp.1202.
Ma, L., Zheng, G., Eitel, J.U.H., Moskal, L.M., He,W., and
Huang, H. 2016. Improved salient feature-based approach for
automatically separating photosynthetic and nonphotosynthetic
components within terrestrial LiDAR point cloud data of forest
canopies. IEEE Transactions on Geoscience & Remote Sensing,
54(2), pp.679-696.
Pfeifer, N., Dorninger, P., Haring, A., and Fan, H. 2007.
Investigating terrestrial laser scanning intensity data: quality and
functional relations. 8th Conference on Optical 3-D
Measurement Techniques, Zürich, Switzerland, pp.328
Pfennigbauer, M., and Ullrich, A. 2010. Improving quality of
laser scanning data acquisition through calibrated amplitude and
pulse deviation measurement. Proc Spie, 7684(1), pp.143-153.
Shaw, P.J.A. 2003. Multivariate statistics for the environmental
sciences. London : Arnold.
Tao, S., Guo, Q., Su, Y., Xu, S., Li, Y., and Wu, F. 2015. A
geometric method for wood-leaf separation using terrestrial and
simulated LiDAR data. Photogrammetric Engineering &
Remote Sensing, 81(10), pp.767-776.
ISPRS Annals of the Photogrammetry, Remote Sensing and Spatial Information Sciences, Volume IV-3, 2018 ISPRS TC III Mid-term Symposium “Developments, Technologies and Applications in Remote Sensing”, 7–10 May, Beijing, China
This contribution has been peer-reviewed. The double-blind peer-review was conducted on the basis of the full paper. https://doi.org/10.5194/isprs-annals-IV-3-217-2018 | © Authors 2018. CC BY 4.0 License.
222

Vapnik, and Vladimir, N. 1997. The nature of statistical learning
theory. IEEE Transactions on Neural Networks, 38(4), pp.409-
409.
Wang, D., Hollaus, M., and Pfeifer, N. 2017. Feasibility of
machine learning methods for separating wood and leaf points
from terrestrial laser scanning data. Isprs Annals of the
Photogrammetry, IV-2/W4, pp.157-164.
Weinmann, M., Jutzi, B., and Mallet, C. 2013. Feature relevance
assessment for the semantic interpretation of 3D point cloud data.
Isprs Annals of Photogrammetry, II-5/W2, pp.313-318.
Weinmann, M., Jutzi, B., Hinz, S., and Mallet, C. 2015. Semantic
point cloud interpretation based on optimal neighborhoods,
relevant features and efficient classifiers. Isprs Journal of
Photogrammetry & Remote Sensing, 105, pp.286-304.
Weinmann, M., Weinmann, M., Mallet, C., and Brédif, M. 2017.
A classification-segmentation framework for the detection of
individual trees in dense mms point cloud data acquired in urban
areas. Remote Sensing, 9(3), pp.277.
Yun, T., An, F., Li, W., Sun, Y., Cao, L., and Xue, L. 2016. A
novel approach for retrieving tree leaf area from ground-based
LiDAR. Remote Sensing, 8(11), pp.942.
ISPRS Annals of the Photogrammetry, Remote Sensing and Spatial Information Sciences, Volume IV-3, 2018 ISPRS TC III Mid-term Symposium “Developments, Technologies and Applications in Remote Sensing”, 7–10 May, Beijing, China
This contribution has been peer-reviewed. The double-blind peer-review was conducted on the basis of the full paper. https://doi.org/10.5194/isprs-annals-IV-3-217-2018 | © Authors 2018. CC BY 4.0 License.
223
Related Documents