RESEARCH ARTICLE Open Access Comparison of similarity-based tests and pooling strategies for rare variants Sergii Zakharov 1,2* , Agus Salim 2 and Anbupalam Thalamuthu 1* Abstract Background: As several rare genomic variants have been shown to affect common phenotypes, rare variants association analysis has received considerable attention. Several efficient association tests using genotype and phenotype similarity measures have been proposed in the literature. The major advantages of similarity-based tests are their ability to accommodate multiple types of DNA variations within one association test, and to account for the possible interaction within a region. However, not much work has been done to compare the performance of similarity-based tests on rare variants association scenarios, especially when applied with different rare variants pooling strategies. Results: Based on the population genetics simulations and analysis of a publicly-available sequencing data set, we compared the performance of four similarity-based tests and two rare variants pooling strategies. We showed that weighting approach outperforms collapsing under the presence of strong effect from rare variants and under the presence of moderate effect from common variants, whereas collapsing of rare variants is preferable when common variants possess a strong effect. We also demonstrated that the difference in statistical power between the two pooling strategies may be substantial. The results also highlighted consistently high power of two similarity-based approaches when applied with an appropriate pooling strategy. Conclusions: Population genetics simulations and sequencing data set analysis showed high power of two similarity-based tests and a substantial difference in power between the two pooling strategies. Keywords: Genetics, Similarity, Power, Multi-locus, Association analysis, Rare variants, Collapsing, Weighting Background Although genome-wide association studies (GWAS) have identified many common single nucleotide polymorph- isms (SNPs) associated with common diseases (http:// www.genome.gov/gwastudies/), these common variants explain only a small fraction of the phenotypic variance attributable to genetic factors [1,2]. Recently, the scientific community has devoted a lot of attention to the analysis of rare variants, with the hope of finding the missing heri- tability. Indeed, there is growing evidence that rare variants are associated with some complex traits [3-6]. Therefore, research in the area of rare variants has a high potential to discover unknown associations of genomic regions with complex phenotypes. Numerous methodologies have been developed to test association of multiple rare variants within a region with a phenotype [7-11]. Measures of genotype similarity have been the basis of many proposed statistical tests. The idea of similarity- based tests is to consider the relationship between geno- typic and phenotypic similarities (similarity here roughly refers to a measure of closeness of two genotypes or phenotypes). Similarity-based tests are motivated by the fact that haplotypes carrying the same causal mutation are more related compared with those without causal mutations; so, case haplotypes are expected to share longer stretches of DNA identical by descent [12]. One of the major advantages of similarity-based tests is the ability to accommodate multiple types of DNA variations (SNPs, insertions and deletions, CNV) observed within a region, given flexibility in the choice of similarity mea- sures between two sequences [13]. Another issue that similarity-based tests address is the possible interaction * Correspondence: [email protected] [email protected] 1 Human Genetics, Genome Institute of Singapore, 60 Biopolis Street, Singapore 138672, Singapore 2 Saw Swee Hock School of Public Health, National University of Singapore, 16 Medical Drive, Singapore 117597, Singapore © 2013 Zakharov et al.; licensee BioMed Central Ltd. This is an Open Access article distributed under the terms of the Creative Commons Attribution License (http://creativecommons.org/licenses/by/2.0), which permits unrestricted use, distribution, and reproduction in any medium, provided the original work is properly cited. Zakharov et al. BMC Genomics 2013, 14:50 http://www.biomedcentral.com/1471-2164/14/50

Welcome message from author
This document is posted to help you gain knowledge. Please leave a comment to let me know what you think about it! Share it to your friends and learn new things together.
Transcript
Zakharov et al. BMC Genomics 2013, 14:50http://www.biomedcentral.com/1471-2164/14/50
RESEARCH ARTICLE Open Access
Comparison of similarity-based tests and poolingstrategies for rare variantsSergii Zakharov1,2*, Agus Salim2 and Anbupalam Thalamuthu1*
Abstract
Background: As several rare genomic variants have been shown to affect common phenotypes, rare variantsassociation analysis has received considerable attention. Several efficient association tests using genotype andphenotype similarity measures have been proposed in the literature. The major advantages of similarity-based testsare their ability to accommodate multiple types of DNA variations within one association test, and to account forthe possible interaction within a region. However, not much work has been done to compare the performance ofsimilarity-based tests on rare variants association scenarios, especially when applied with different rare variantspooling strategies.
Results: Based on the population genetics simulations and analysis of a publicly-available sequencing data set, wecompared the performance of four similarity-based tests and two rare variants pooling strategies. We showed thatweighting approach outperforms collapsing under the presence of strong effect from rare variants and under thepresence of moderate effect from common variants, whereas collapsing of rare variants is preferable whencommon variants possess a strong effect. We also demonstrated that the difference in statistical power betweenthe two pooling strategies may be substantial. The results also highlighted consistently high power of twosimilarity-based approaches when applied with an appropriate pooling strategy.
Conclusions: Population genetics simulations and sequencing data set analysis showed high power of twosimilarity-based tests and a substantial difference in power between the two pooling strategies.
Keywords: Genetics, Similarity, Power, Multi-locus, Association analysis, Rare variants, Collapsing, Weighting
BackgroundAlthough genome-wide association studies (GWAS) haveidentified many common single nucleotide polymorph-isms (SNPs) associated with common diseases (http://www.genome.gov/gwastudies/), these common variantsexplain only a small fraction of the phenotypic varianceattributable to genetic factors [1,2]. Recently, the scientificcommunity has devoted a lot of attention to the analysisof rare variants, with the hope of finding the missing heri-tability. Indeed, there is growing evidence that rare variantsare associated with some complex traits [3-6]. Therefore,research in the area of rare variants has a high potentialto discover unknown associations of genomic regions
* Correspondence: [email protected] [email protected] Genetics, Genome Institute of Singapore, 60 Biopolis Street,Singapore 138672, Singapore2Saw Swee Hock School of Public Health, National University of Singapore,16 Medical Drive, Singapore 117597, Singapore
© 2013 Zakharov et al.; licensee BioMed CentrCommons Attribution License (http://creativecreproduction in any medium, provided the or
with complex phenotypes. Numerous methodologies havebeen developed to test association of multiple rare variantswithin a region with a phenotype [7-11].Measures of genotype similarity have been the basis of
many proposed statistical tests. The idea of similarity-based tests is to consider the relationship between geno-typic and phenotypic similarities (similarity here roughlyrefers to a measure of closeness of two genotypes orphenotypes). Similarity-based tests are motivated by thefact that haplotypes carrying the same causal mutationare more related compared with those without causalmutations; so, case haplotypes are expected to sharelonger stretches of DNA identical by descent [12]. Oneof the major advantages of similarity-based tests is theability to accommodate multiple types of DNA variations(SNPs, insertions and deletions, CNV) observed within aregion, given flexibility in the choice of similarity mea-sures between two sequences [13]. Another issue thatsimilarity-based tests address is the possible interaction
al Ltd. This is an Open Access article distributed under the terms of the Creativeommons.org/licenses/by/2.0), which permits unrestricted use, distribution, andiginal work is properly cited.
Zakharov et al. BMC Genomics 2013, 14:50 Page 2 of 10http://www.biomedcentral.com/1471-2164/14/50
of different variants within a region, which is potentiallyaccounted for by considering multi-site similarity mea-sures [14]. For unrelated individuals, similarity measureshave been incorporated within a framework of singleSNP analysis of variance [15], multiple regression [16],U-statistic [17] and distance-based regression [14].Methods based on genotype similarity include the fol-lowing: sequence kernel association test (SKAT) [11];kernel-based association test (KBAT) [18], multivariatedistance matrix regression test (MDMR) [19]; and aggre-gate U-test [20]. However, so far, no attempts have beenmade to evaluate the performance of similarity-basedtests on rare variants association scenarios when com-mon variants are included into or excluded from theanalysis. Even though many non-causal common SNPsare removed by considering only rare variants, it is un-clear if consideration of fewer variants would be suffi-cient to compensate for the loss of association signalfrom common SNPs. Also, when both rare and commonvariants are included into the analysis, it is of interest toevaluate the change in the performance of the testswhen rare variants have lower effect sizes than commonSNPs. Additionally, statistical tests may utilize differentpooling strategies for rare variants, e.g. weighting or col-lapsing. Given the choice, it is unclear which pooling strat-egy is the best to be applied with similarity-based tests.In this article, we compared the performance of the
four similarity-based tests (SKAT, KBAT, MDMR and amodified U-test proposed by Schaid et al. [17]) appliedwith two popular rare variants pooling strategies (weight-ing and collapsing). The comparison was performed basedon population-genetics simulations under four differentdisease models and the GAW17 sequencing data set. Theresults highlighted that, under the presence of strong rarevariants association signal and moderate association ofcommon variants, weighting may be a much better strat-egy than collapsing, whereas collapsing tends to outper-form weighting when common variants possess a strongeffect. Moreover, we discovered that the magnitude of thedifference in power among similarity-based methods,when applied with weighting and collapsing strategies,may be very high, sometimes over 50%. Under the strongeffect size of rare variants when common variants wereexcluded from the analysis, we observed better perform-ance of collapsing strategy and lower power of weightingpooling strategy. Also, when the appropriate pooling strat-egy is applied, both SKAT and KBAT showed consistentlyhigh power among all the four similarity-based tests com-pared here.
ResultsPopulation genetic simulationsFor each test, 1000 permutations were performed to as-sess the significance of association. To make sure the
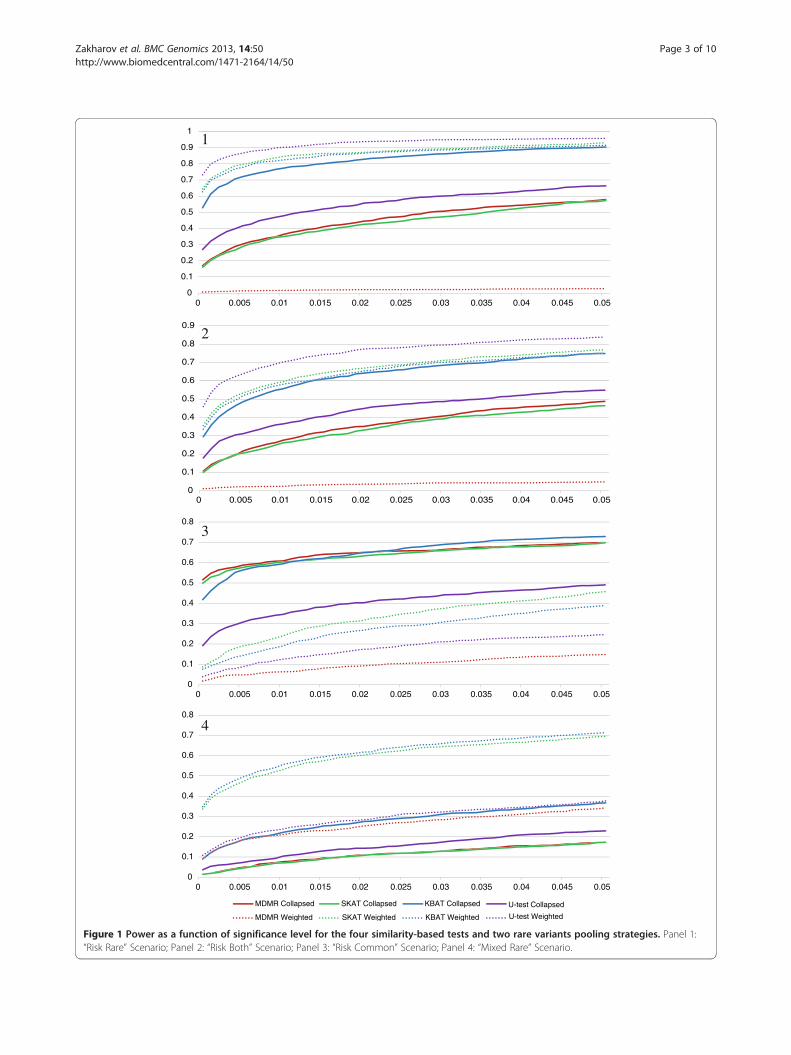
empirical type-1 error is controlled, we ran the analysisof simulated data under the null model. As can be seenfrom Additional file 1: Table S1, the type-1 error waswell controlled by using the permutation procedure toestimate the significance level. It is noticeable that for“Risk Rare” scenario when weighting pooling strategy isapplied and for “Risk Common” scenario the estimatesof type-1 error are below 0.05. This suggests that inthese cases the methods show slightly conservative be-havior. The double-sided 99% confidence interval for thetype-1 error estimate is approximately 0.033–0.67. Thiscan be derived from the normal approximation, giventhat the estimate of type-1 error rate is distributed as anobserved probability of success for a binomial randomvariable with a success probability of 0.05 under no infla-tion of type-1 error and the sample size of 1000, which isthe number of data replicates. As can be seen, the empir-ical type-1 error estimates for population genetics simula-tions were within the 99% confidence interval.Figure 1 shows the power of the four tests with col-
lapsing and weighting pooling strategies under differentassociation scenarios. As can be seen from Panel 1 (“RiskRare” scenario), the power of the tests was in the follow-ing order: for collapsing MDMR performed no worsethan SKAT but no better than U-test, which in turn hadlower power compared to KBAT; for weighting, MDMRperformed worse than KBAT, and KBAT was no morepowerful than SKAT, whereas U-test was the most power-ful among all the four tests considered. Also, weightingincreased the power of all the tests, except for MDMR.The same situation was observed when a weak associationsignal from common variants was introduced, togetherwith weaker signal from rare variants (“Risk Both” sce-nario in Panel 2 of Figure 1). The performance of the testswhen rare variants had lower effect compared with com-mon variants (“Risk Common” scenario) is presented inPanel 3 of Figure 1. As can be seen, the pattern is differentfrom those observed for the previous two scenarios. Forall the tests, the collapsing strategy performed better thanweighting. These results suggest that weighting outper-forms collapsing when strong rare variants association ispresent; however, when common variants explain a signifi-cant portion of phenotype variability, collapsing is moreadvantageous since the weighting scheme undermines thesignal from common variants.Finally, we investigated the performance of the tests in
the “Mixed Rare” scenario which incorporated both riskand protective variants within a region (Figure 1, Panel 4).As expected, collapsing underperformed weighting pool-ing strategy because collapsing risk and protective variantsannihilates the association signal. Overall, the simula-tion results highlighted the consistently high power ofKBAT and SKAT when the appropriate rare variants pool-ing strategy was applied (namely, collapsing for “Risk
0
0.1
0.2
0.3
0.4
0.5
0.6
0.7
0.8
0.9
1
0 0.005 0.01 0.015 0.02 0.025 0.03 0.035 0.04 0.045 0.05
1
0
0.1
0.2
0.3
0.4
0.5
0.6
0.7
0.8
0.9
0 0.005 0.01 0.015 0.02 0.025 0.03 0.035 0.04 0.045 0.05
2
0
0.1
0.2
0.3
0.4
0.5
0.6
0.7
0.8
0 0.005 0.01 0.015 0.02 0.025 0.03 0.035 0.04 0.045 0.05
3
0
0.1
0.2
0.3
0.4
0.5
0.6
0.7
0.8
0 0.005 0.01 0.015 0.02 0.025 0.03 0.035 0.04 0.045 0.05
MDMR Collapsed SKAT Collapsed KBAT Collapsed
4
MDMR Weighted SKAT Weighted KBAT Weighted
U-test Collapsed
U-test Weighted
Figure 1 Power as a function of significance level for the four similarity-based tests and two rare variants pooling strategies. Panel 1:“Risk Rare” Scenario; Panel 2: “Risk Both” Scenario; Panel 3: “Risk Common” Scenario; Panel 4: “Mixed Rare” Scenario.
Zakharov et al. BMC Genomics 2013, 14:50 Page 3 of 10http://www.biomedcentral.com/1471-2164/14/50
Zakharov et al. BMC Genomics 2013, 14:50 Page 4 of 10http://www.biomedcentral.com/1471-2164/14/50
Common” scenario, and weighting for other scenarios).Although these two tests had slightly lower power com-pared to the U-test for “Risk Rare” and “Risk Both” scenar-ios, they had much higher power for the other twoscenarios. Additionally, we calculated the maximum abso-lute power difference over the type-1 error rate for eachtest and phenotype scenario. As can be seen from Table 1,the maximum absolute power difference was substantial,and ranged from as low as 10% to as high as 55%. Theaverage maximum absolute power difference for theconsidered tests across the phenotype models were39.8%, 43.9%, 25.8% and 31.8% for MDMR, SKAT,KBAT and U-test respectively. This result shows theextreme importance of choosing the right rare variantspooling strategy for different disease models. As in oursimulations no adjustment for population stratificationwas made, we analyzed the data using another popularsimilarity measure: identity-by-state [14]. The resultswere similar to those obtained for exponential similarity(Additional file 2).We also analyzed the simulated data after excluding
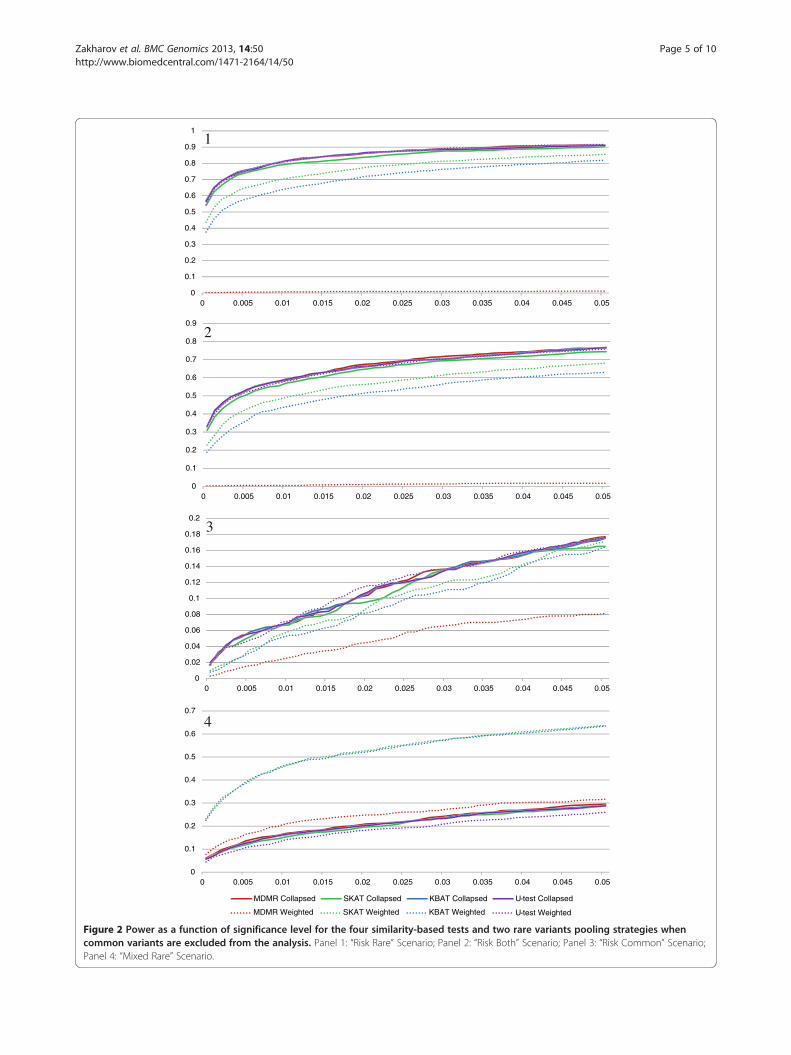
all common variants defined as those with MAF > 1%(Figure 2). Since all common variants were excluded,association tests under collapsing were performed onlyon a collapsed super-locus. In contrast to the previousresults, for “Risk Rare” and “Risk Both” scenarios, collaps-ing performed better and weighting performed worse. Forthe collapsing strategy, the reduction in the number ofSNPs was beneficial despite the loss of association signalfrom the excluded common SNPs. However, for theweighting pooling strategy, the loss of some of the causalvariants with MAF above 1% lowered the statistical powerof the tests. Hence, the results suggest that under strongrare variants effect size in one direction, one should prefercollapsing to weighting when common variants are ex-cluded from an association test. For the “Risk Common”scenario, the power of all the tests and all pooling strat-egies was lower, as the strong association signal from com-mon variants had been removed. For the “Mixed Rare”scenario, we observed that the results were similar tothose depicted in Figure 1. Also, it is notable that acrossthe four scenarios, the performances of the four tests were
Table 1 The maximum absolute difference in power (overthe type-1 error rate) between weighting and collapsingpooling strategies for different tests and phenotypescenarios in population genetics simulations
Scenario/Test MDMR SKAT KBAT U-Test
Risk Rare 0.466 0.472 0.157 0.511
Risk Both 0.395 0.29 0.094 0.379
Risk Common 0.551 0.479 0.388 0.235
Mixed Rare 0.18 0.516 0.393 0.148
very similar under the collapsing strategy. This suggeststhat for a single SNP analysis, the power of the four testsis very similar to one another.
GAW17 data setThe GAW17 data set is a large scale exome sequencingdata set with genotypes from the 1000 Genomes Project(http://www.1000genomes.org). The dataset consists of697 unrelated individuals from six populations (Centred'Etude du Polymorphisme Humain (CEPH) samples,Tuscan, Chinese, Japanese, Yoruba and Luhya). Thecomplex phenotype model incorporates environmentalcovariates (age, sex and smoking status) and both com-mon and rare causal SNPs from genes in particular path-ways. Totally 200 replicates of several quantitative traitsand case–control status were simulated under the pheno-type model. A more detailed description of the simula-tions can be found in Almasy et al. [21].We performed an association analysis of causal genes
that affect two quantitative traits, Q1 and Q2, and a di-chotomous trait, D. Adjustment for covariates was donein a similar way as in Jiang et al. [22]. Let G be the geno-type matrix, Qj, j = 1, 2 are vectors of two quantitativetraits, Ei i = 1, 2, 3, are vectors of covariates (age, sex andsmoking status, respectively), and R is the matrix of tenprincipal components of genotype matrix obtained usingthe software Eigenstat [23]. The corrected genotype,
phenotypes and covariates are⌣G ¼ G � RRTD , Qj ¼
Qj � RRTQj; j ¼ 1; 2, D ¼ D� RRTD and Ei = Ei-RRTEi,
i = 1,2,3. Next, covariates are regressed out of adjustedphenotypes using the regression models:
Q1 ¼ a0 þX3
i¼1ai E i þ ε1; Q2 ¼ b0
þX3
i¼1bi E i þ ε2; D ¼ C0 þ
X3
i¼1ci E þ ε3
ð1Þ
The residuals from the regression models (1) weredichotomized (upper 30% of the observed distributionwere declared cases, while the others were controls) andtested for association with adjusted genotype Ğ of thecausal genes. The type-1 error was set at 0.05, and 1000permutations were performed for each of the 200phenotype replicates to assess the power. To assess theempirical type-1 error rate for all the statistical tests, weran the analysis with randomly permuted adjusted phe-notypes obtained from the regressions (1). The resultingtype-1 error rates are presented in Additional files 3 and 4.The double-sided 99% confidence interval for the type-1error estimate is approximately 0.01–0.09. This can bederived from the normal approximation, given that theestimate of type-1 error rate is distributed as an observed
0
0.1
0.2
0.3
0.4
0.5
0.6
0.7
0.8
0.9
1
0 0.005 0.01 0.015 0.02 0.025 0.03 0.035 0.04 0.045 0.05
0
0.1
0.2
0.3
0.4
0.5
0.6
0.7
0.8
0.9
0 0.005 0.01 0.015 0.02 0.025 0.03 0.035 0.04 0.045 0.05
0
0.02
0.04
0.06
0.08
0.1
0.12
0.14
0.16
0.18
0.2
0 0.005 0.01 0.015 0.02 0.025 0.03 0.035 0.04 0.045 0.05
1
2
3
0
0.1
0.2
0.3
0.4
0.5
0.6
0.7
0 0.005 0.01 0.015 0.02 0.025 0.03 0.035 0.04 0.045 0.05
MDMR Collapsed SKAT Collapsed KBAT Collapsed U-test Collapsed
U-test Weighted
4
MDMR Weighted SKAT Weighted KBAT Weighted
Figure 2 Power as a function of significance level for the four similarity-based tests and two rare variants pooling strategies whencommon variants are excluded from the analysis. Panel 1: “Risk Rare” Scenario; Panel 2: “Risk Both” Scenario; Panel 3: “Risk Common” Scenario;Panel 4: “Mixed Rare” Scenario.
Zakharov et al. BMC Genomics 2013, 14:50 Page 5 of 10http://www.biomedcentral.com/1471-2164/14/50

Zakharov et al. BMC Genomics 2013, 14:50 Page 6 of 10http://www.biomedcentral.com/1471-2164/14/50
probability of success for a binomial random variable witha success probability of 0.05 under no inflation of type-1error and the sample size of 200, which is the number ofphenotype replicates. As can be seen, the empirical type-1error for GAW17 data was within the 99% confidenceinterval.Figure 3 depicts the results of the analysis of the causal
genes with the respective phenotypes (ARNT-VEGFCwith Q1, and BCHE-VWF with Q2). For the majority ofgenes with rare causal variants, the weighting strategy,on average, performed better than collapsing (except forMDMR). For example, the weighing strategy resulted insubstantial power improvement for the genes ARNT,SIRT1, VNN3 and VWF. All of these genes containedmultiple causal rare variants with a moderate or higheffect size. However, collapsing yielded a much higherpower for ELAVL4 and VNN1 genes. Closer examin-ation revealed that the two most common SNPs in theVNN1 gene were causal, whereas association with theELAVL4 gene could be explained by association of the onlytwo common SNPs that were non-causal. To show this, weanalyzed these two common SNPs with the four similarity-based tests and found that the power to identify an associ-ation with a phenotype was as follows: MDMR – 0.6,SKAT – 0.585, KBAT – 0.135, U-test – 0.095. The resultsof the dichotomous phenotype analysis are presented inthe Additional files 5 and 6. Among genes with maximumachieved power of greater than 40% for at least one of thetests, weighting was advantageous for the ARNT gene,whereas collapsing yielded higher power for FLT1 andPRKCA, which both contained common causal SNPs. So,the results of the GAW17 data set support the conclusionderived from population genetics simulations concerningpooling strategies. We also considered the maximumabsolute difference in power between weighting and col-lapsing for each statistical test and each GAW17 pheno-type (Q1, Q2 and dichotomous trait) over the respective
0
0.1
0.2
0.3
0.4
0.5
0.6
0.7
0.8
0.9
1
MDMR Collapsed SKAT Collapsed MDMR Weighted SKAT Weighted
Figure 3 Power to identify association with dichotomized adjusted quwith Q1, and BCHE-VWF with Q2).
causal genes. As can be seen from Table 2, the maximumabsolute power difference ranged from 14.5% (U-test) to84% (MDMR). The average maximum power differencesacross phenotypes were 73.8%, 45.6%, 35.6% and 40.5%for MDMR, SKAT, KBATand U-test, respectively. This ob-servation confirms the results obtained from our popula-tion genetics simulations and highlights the importance ofthe right choice of rare variants pooling strategy in sequen-cing association studies.
DiscussionIn this article, we compared the performance of the foursimilarity-based tests together with two rare variantspooling strategies using population genetics simulationsand the GAW17 real data set. The results suggest thatweighting may be a much better strategy than collapsingunder the assumption of strong effect from rare variants,and moderate or low effect from common variants. Col-lapsing, in turn, showed much better performance whencommon variants possessed a strong effect. The absolutepower difference of a statistical test when applied withcollapsing and weighting pooling strategies may be sub-stantial. From our study, it follows that if researchers areinclined to believe in the association of rare variantswithin a region, weighted pooling should be applied withsimilarity-based tests, whereas collapsing is more appro-priate if common variants are suspected to be associatedwith phenotype. Additionally, under strong rare variantseffect size in one direction when common variants wereexcluded from the analysis, collapsing performed equallygood or better than weighting. Finally, both SKAT andKBAT had consistently high power compared with otherconsidered similarity-based tests when applied with theappropriate pooling strategy.Recently, Basu and Pan [24] compared the perform-
ance of multiple statistical tests to identify an associationwith rare variants. The authors included SKAT with
KBAT Collapsed U-test Collapsed KBAT Weighted U-test Weighted
antitative trait in GAW17 data set for causal genes (ARNT-VEGFC
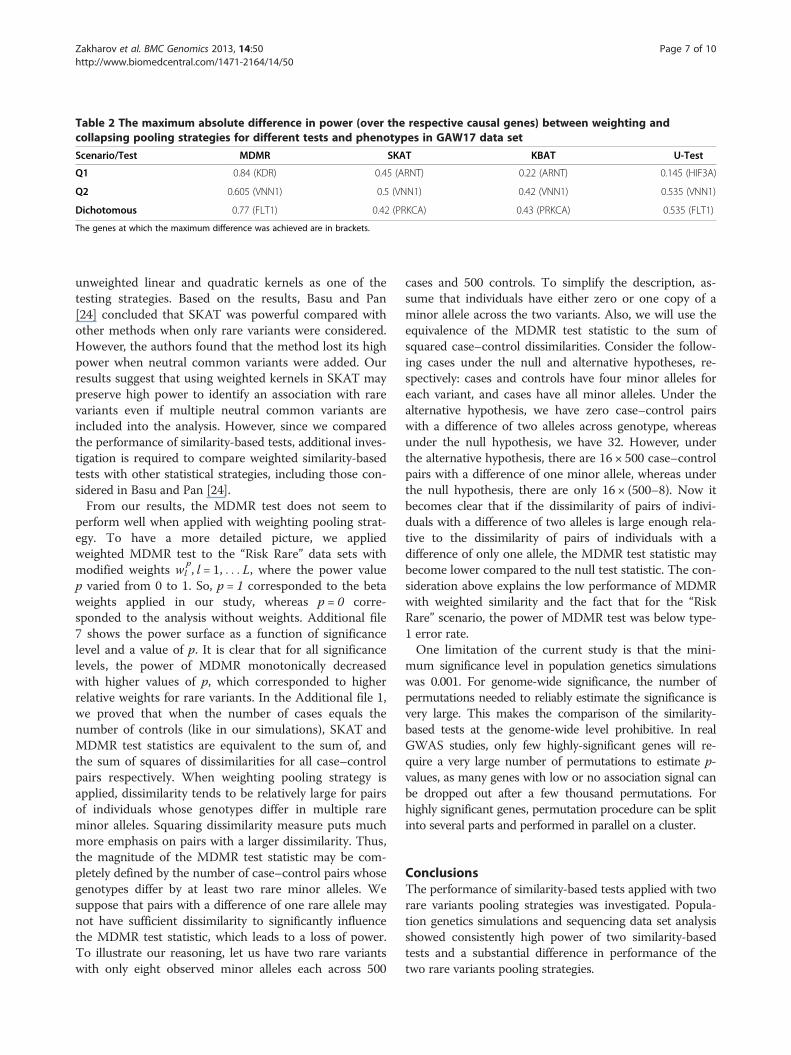
Table 2 The maximum absolute difference in power (over the respective causal genes) between weighting andcollapsing pooling strategies for different tests and phenotypes in GAW17 data set
Scenario/Test MDMR SKAT KBAT U-Test
Q1 0.84 (KDR) 0.45 (ARNT) 0.22 (ARNT) 0.145 (HIF3A)
Q2 0.605 (VNN1) 0.5 (VNN1) 0.42 (VNN1) 0.535 (VNN1)
Dichotomous 0.77 (FLT1) 0.42 (PRKCA) 0.43 (PRKCA) 0.535 (FLT1)
The genes at which the maximum difference was achieved are in brackets.
Zakharov et al. BMC Genomics 2013, 14:50 Page 7 of 10http://www.biomedcentral.com/1471-2164/14/50
unweighted linear and quadratic kernels as one of thetesting strategies. Based on the results, Basu and Pan[24] concluded that SKAT was powerful compared withother methods when only rare variants were considered.However, the authors found that the method lost its highpower when neutral common variants were added. Ourresults suggest that using weighted kernels in SKAT maypreserve high power to identify an association with rarevariants even if multiple neutral common variants areincluded into the analysis. However, since we comparedthe performance of similarity-based tests, additional inves-tigation is required to compare weighted similarity-basedtests with other statistical strategies, including those con-sidered in Basu and Pan [24].From our results, the MDMR test does not seem to
perform well when applied with weighting pooling strat-egy. To have a more detailed picture, we appliedweighted MDMR test to the “Risk Rare” data sets withmodified weights wl
p, l = 1, . . . L, where the power value
p varied from 0 to 1. So, p = 1 corresponded to the betaweights applied in our study, whereas p = 0 corre-sponded to the analysis without weights. Additional file7 shows the power surface as a function of significancelevel and a value of p. It is clear that for all significancelevels, the power of MDMR monotonically decreasedwith higher values of p, which corresponded to higherrelative weights for rare variants. In the Additional file 1,we proved that when the number of cases equals thenumber of controls (like in our simulations), SKAT andMDMR test statistics are equivalent to the sum of, andthe sum of squares of dissimilarities for all case–controlpairs respectively. When weighting pooling strategy isapplied, dissimilarity tends to be relatively large for pairsof individuals whose genotypes differ in multiple rareminor alleles. Squaring dissimilarity measure puts muchmore emphasis on pairs with a larger dissimilarity. Thus,the magnitude of the MDMR test statistic may be com-pletely defined by the number of case–control pairs whosegenotypes differ by at least two rare minor alleles. Wesuppose that pairs with a difference of one rare allele maynot have sufficient dissimilarity to significantly influencethe MDMR test statistic, which leads to a loss of power.To illustrate our reasoning, let us have two rare variantswith only eight observed minor alleles each across 500
cases and 500 controls. To simplify the description, as-sume that individuals have either zero or one copy of aminor allele across the two variants. Also, we will use theequivalence of the MDMR test statistic to the sum ofsquared case–control dissimilarities. Consider the follow-ing cases under the null and alternative hypotheses, re-spectively: cases and controls have four minor alleles foreach variant, and cases have all minor alleles. Under thealternative hypothesis, we have zero case–control pairswith a difference of two alleles across genotype, whereasunder the null hypothesis, we have 32. However, underthe alternative hypothesis, there are 16 × 500 case–controlpairs with a difference of one minor allele, whereas underthe null hypothesis, there are only 16 × (500–8). Now itbecomes clear that if the dissimilarity of pairs of indivi-duals with a difference of two alleles is large enough rela-tive to the dissimilarity of pairs of individuals with adifference of only one allele, the MDMR test statistic maybecome lower compared to the null test statistic. The con-sideration above explains the low performance of MDMRwith weighted similarity and the fact that for the “RiskRare” scenario, the power of MDMR test was below type-1 error rate.One limitation of the current study is that the mini-
mum significance level in population genetics simulationswas 0.001. For genome-wide significance, the number ofpermutations needed to reliably estimate the significance isvery large. This makes the comparison of the similarity-based tests at the genome-wide level prohibitive. In realGWAS studies, only few highly-significant genes will re-quire a very large number of permutations to estimate p-values, as many genes with low or no association signal canbe dropped out after a few thousand permutations. Forhighly significant genes, permutation procedure can be splitinto several parts and performed in parallel on a cluster.
ConclusionsThe performance of similarity-based tests applied with tworare variants pooling strategies was investigated. Popula-tion genetics simulations and sequencing data set analysisshowed consistently high power of two similarity-basedtests and a substantial difference in performance of thetwo rare variants pooling strategies.
Zakharov et al. BMC Genomics 2013, 14:50 Page 8 of 10http://www.biomedcentral.com/1471-2164/14/50
MethodsSimilarity-based testsAssume that an association study involves N individuals(NA cases and NU controls), and within a genomic re-gion L SNPs (both common and rare) were called. Letus denote the genotype matrix G = {gnl, n = 1,. . .,N l = 1,. . .,L} coded as minor allele counts, and the phenotypevector Y = {yn, n = 1,. . .,N} with the elements valued 1 forcases and −1 for controls (except when otherwise speci-fied). The N ×N similarity matrix is defined as K = {s(gn,gm)}n,m = 1
N, where gn is a multi-site vector of genotype{g1n,. . .,gLn} for nth individual, and s (x,y) is a similarityfunction. There is a variety of examples of similarityfunctions published in statistical genetics literature (forexamples, see Wu et al. [11], Wessel and Shork [14], andMukhopadhyay et al. [25]). However, it is desirable forthe similarity matrix K to be symmetric positive semi-definite as this is “the key to its use in many statisticalanalyses” [26]. Thus, we consider only those similaritymeasures that result in a positive definite similaritymatrix. Examples of such similarity measures are theweighted linear kernel s(gn, gm) =
Pl = 1
Lwlgnlgml forsome fixed weights wl,l = 1,. . .,L the weighted quadratickernel s(gn, gm) = (1 +
PlLwlgnlgml)
2, and the weighted IBSkernel s(gn, gm) =
Pl = 1
Lwl(2 − |gnl − gml|). For our analy-sis, a popular exponential similarity measure [27] was used:
s gn; gmð Þ ¼ exp �XL
l¼1gnl � gmlð Þ2
n oð2Þ
The choice of similarity was motivated by the need toanalyze quantitative genotype obtained as a result ofpopulation stratification adjustment (see Results section).As the exponential similarity is a function of the Euclideandistance between two multi-site genotypes, we consider thissimilarity to be more appropriate compared with, for ex-ample, another popular similarity measure, identity-by-state[17], which was designed to be applied to genotype codes.
Weighting and collapsingHere we consider the two major ways of rare variantspooling: weighting and collapsing. The SNP weights willbe denoted as w = {wl, l = 1,. . .,L}. In general, they maybe derived from observed minor allele frequency (MAF)or prior information. Here, we adopted the weights pro-posed by Wu et al. [11]: wl = Beta(mafl; 1, 25)
2, wheremafl is MAF of lth SNP, Beta (a; b, c) is the beta densitydistribution function with parameters b and c evaluatedat point a. The weight function monotonically increasesas MAF decreases, while, as noted by the authors, “put-ting decent nonzero weights for variants with MAF 1%–5%”. As noted by Wu et al. [11], setting 0 ≤ b ≤ 1 and c ≥1 allows for an increase in the weight of rare variantsand a decrease in the weight of common variants. Thus,any values of parameters and from the specified range
are acceptable. For the three tests (SKAT, MDMR andU-test), the weights are incorporated via the calculationof similarity matrix. Specifically, the weights incorporat-ing similarity function sw for the similarity matrix Kw isas follows:
sw gn; gmð Þ ¼ exp �XL
l¼1wl gnl � gmlð Þ2=
XL
l¼1wl
n o
ð3Þ
For the KBAT test statistic, the weights were incorpo-rated differently (for details, see the description below) asthe test does not use the multi-site genotype similarity.The collapsing of rare variants was performed as
described in Thalamuthu et al. [18], namely, by defininga super-locus gn(L+1),n = 1,. . .,N as follows:
gn Lþ1ð Þ ¼ min 2;X
l:mafl ≤0:01gnlð Þ
n oð4Þ
In general, this type of collapsing preserves more in-formation than an indicator of at least one rare variantbeing present, as suggested by Li and Leal [28]. Thecollapsed genotype is treated as a new SNP (super-locus)gn(L+1),n = 1,. . .,N, and a similarity matrix is constructedusing common variants and the super-locus.
Multivariate distance matrix regression (MDMR)Let us denote N x N identity matrix 1N and a vector of 1of size N as 1N. Following Wessel and Schork [14], thetest statistic is calculated according to the algorithm:
1. Phenotype projection matrix H = Y(YTY)-1YT, whereupper T denotes transposition.
2. Dissimilarity matrix D = {dij}i,j =1N = 1N1N
T− K, whereK is a similarity matrix defined above.
3. Gover’s centered matrix G = (1N − 1N1NT/N)
A(IN − 1N1NT/N), where A ¼ � d2ij
2
n oNi;j¼1
.
4. The test statistic MDMR = tr(HGH)/tr((IN −H)G(IN −H)), where tr is matrix trace.
Large values of the test statistic indicate a deviationfrom the null hypothesis of no association of a genotypewith a phenotype.
Sequence kernel association test (SKAT)For this test, the phenotype vector Y = {yn,n = 1,. . .,N}is coded as 1 for cases and 0 for controls. The mean phe-notype vector is defined as �Y ¼ NA1N=N . Following Wu
et al. [11], the test statistic is T ¼ Y � Y�ÞTKðY � �Y Þ=2�
.
The SKAT test statistic under the null hypothesis is asymp-totically distributed as the weighted sum of chi-squaredrandom variables with one degree of freedom. Thus, the
Zakharov et al. BMC Genomics 2013, 14:50 Page 9 of 10http://www.biomedcentral.com/1471-2164/14/50
significance level can be assessed theoretically. Permuta-tions can also be used to estimate the p-value empirically.
U-testThe average similarity score between pairs of cases U1
and controls U0 is defined as follows:
U1 ¼X
1≤n≤m≤Nn;m:Yn¼Ym¼1
2Knm=NA NA � 1� � ð5Þ
U0 ¼X
1≤n≤m≤Nn;m:Yn¼Ym¼�1
2Knm=NU NU � 1� � ð6Þ
where Knm, n, m = 1,. . .,N are the elements of the Ksimilarity matrix (K = {Knm}n,m = 1
N). The U-test statisticis defined as U = (U1 −U0)
2. Note that Shaid et al. [17]considered the weighted sum of the single SNP U-teststatistics, where weights were derived from the asymp-totic variance-covariance matrix of the U statistics vec-tor. However, for the purpose of comparison ofweighting and collapsing rare variants pooling methods,the statistic was modified as described above. The teststatistic U is similar to the single SNP U-test statistic pro-posed by Shaid et al. [17], but it incorporates the similarityinformation across multiple variants within a region. Per-mutations need to be applied to assess the p-value.
Kernel-based association test (KBAT)Let us denote Kl = {(Kl)nm}n,m = 1
N as a single SNPs simi-larity matrix for lth variant. Similar to the notations ofthe U-test subsection, Ul1 and Ul0 are the average simi-larity scores for pairs of cases and controls, respectively,calculated from Kl, and let Ul = (Ul1 +Ul0)/2. FollowingMukhopadhyay et al. [15], consider the within-groupand between-group sum of squares:
WSSl ¼X
1≤n≤m≤Nn;mYn¼Ym¼1
Klð Þnm � Ul1� �2
þX
1≤n≤m≤Nn;mYn¼Ym¼�1
Klð Þnm � Ul0� �2
ð7Þ
BSSl ¼NA NA � 1
� �Ul � Ul1ð Þ2
2
þNU NU � 1ð Þ Ul � Ul0ð Þ22
ð8Þ
where the two groups are case-case and control-controlpairs. The test statistic is KBAT =
Pl = 1
LBSSl/P
l = 1LWSSl.
Since the test does not utilize the multi-site similaritymatrix, but only single SNP matrices Kl, the weighted teststatistic KBATW =
Pl = 1
LwlBSSl/P
l = 1LwlWSSl is used
here. A large value of the KBAT statistic indicates a
deviation from the null hypothesis. Permutations are usedto assess the significance.
Population genetics simulationsPopulation genetics simulations were performed basedon the code provided by King et al. [29] with demo-graphic parameters from Boyko et al. [30]. A total of1000 data replicates were generated for each of the fourphenotype models: “Risk Rare”, “Risk Both”, “Risk Com-mon” and “Mixed Rare”. For a detailed description ofthe simulations, see Additional file 1.
Additional files
Additional file 1: Empirical type-1 error estimate for populationgenetics simulations (Table S1), detailed description of populationgenetics simulations, and considerations for possible reasons forMDMR power loss when applied with weighting pooling strategy.
Additional file 2: Power as a function of significance level for the foursimilarity-based tests with IBS kernels and two rare variants poolingstrategies. Panel 1: “Risk Rare” Scenario; Panel 2: “Risk Both” Scenario;Panel 3: “Risk Common” Scenario; Panel 4: “Mixed Rare” Scenario.
Additional file 3: Empirical type-1 error rates for dichotomizedadjusted quantitative phenotype in GAW17 data set at the theoreticallevel of 0.05 (ARNT-VEGFC with Q1, and BCHE-VWF with Q2).
Additional file 4: Empirical type-1 error rates for dichotomizedadjusted case–control status in GAW17 data set at the theoreticallevel of 0.05.
Additional file 5: Power to identify an association withdichotomized adjusted case–control status in GAW17 data set forsome of the causal genes.
Additional file 6: Power to identify an association withdichotomized adjusted case–control status in GAW17 data set forsome of the causal genes.
Additional file 7: Impact of power value on MDMR testperformance in a “Risk Rare” scenario.
Competing interestsThe authors declare that they have no competing interests.
Authors’ contributionsSZ, AS and AT conceived the study. SZ and AT designed the experiments. SZconducted the experiments and performed the analysis. SZ wrote themanuscript. SZ, AS and AT approved the manuscript.
AcknowledgementsWe would like to thank the workshop organizers of GAW17 for theirpermission to use their data in our research. The preparation of the GeneticAnalysis Workshop 17 Simulated Exome Data Set was supported by a GAWgrant, R01 GM031575, and in part by NIH R01 MH059490, and usedsequencing data from the 1000 Genomes Project (www.1000genomes.org).Funding: This work was supported by the Agency for Science, Technologyand Research (A*STAR; Singapore). The first author is a recipient of theSingapore International Graduate Award.
Received: 9 August 2012 Accepted: 17 January 2013Published: 24 January 2013
References1. Hirschhorn JN, Gajdos ZKZ: Genome-wide association studies: results from
the first Few years and potential implications for clinical medicine.Annu Rev Med 2011, 62(1):11–24.
2. Maher B: Personal genomes: the case of the missing heritability. Nature2008, 456:18–21.
Zakharov et al. BMC Genomics 2013, 14:50 Page 10 of 10http://www.biomedcentral.com/1471-2164/14/50
3. Green EK, Grozeva D, Sims R, Raybould R, Forty L, Gordon-Smith K, Russell E,St Clair D, Young AH, Ferrier IN, et al: DISC1 exon 11 rare variants foundmore commonly in schizoaffective spectrum cases than controls. Am JMed Genet B Neuropsychiatr Genet 2011, 156(4):490–492.
4. Norton N, Li D, Rieder Mark J, Siegfried Jill D, Rampersaud E, Züchner S,Mangos S, Gonzalez-Quintana J, Wang L, McGee S, et al: Genome-widestudies of copy number variation and exome sequencing identify rarevariants in BAG3 as a cause of dilated cardiomyopathy. Am J Hum Genet2011, 88(3):273–282.
5. Ramagopalan SV, Dyment DA, Cader MZ, Morrison KM, Disanto G, MorahanJM, Berlanga-Taylor AJ, Handel A, De Luca GC, Sadovnick AD, et al: Rarevariants in the CYP27B1 gene are associated with multiple sclerosis.Ann Neurol 2011, 70(6):881–886.
6. Xie P, Kranzler HR, Krauthammer M, Cosgrove KP, Oslin D, Anton RF, FarrerLA, Picciotto MR, Krystal JH, Zhao H, et al: Rare nonsynonymous variants inalpha-4 nicotinic acetylcholine receptor gene protect against nicotinedependence. Biol Psychiatry 2011, 70(6):528–536.
7. Bansal V, Libiger O, Torkamani A, Shork JN: Statistical analysis strategies forassociation studies involving rare variants. Nat Rev Genet 2011, 11:773–785.
8. Li Y, Byrnes AE, Li M: To identify associations with rare variants, justWHaIT: weighted haplotype and imputation-based tests. Am J Hum Genet2010, 87(5):728–735.
9. Madsen BE, Browning SR: A groupwise association test for rare mutationsusing a weighted Sum statistic. PLoS Genet 2009, 5(2):e1000384.
10. Neale BM, Rivas MA, Voight BF, Altshuler D, Devlin B, Orho-Melander M,Kathiresan S, Purcell SM, Roeder K, Daly MJ: Testing for an unusualdistribution of rare variants. PLoS Genet 2011, 7(3):e1001322.
11. Wu Michael C, Lee S, Cai T, Li Y, Boehnke M, Lin X: Rare-variant associationtesting for sequencing data with the sequence kernel association test.Am J Hum Genet 2011, 89(1):82–93.
12. Beckmann L, Thomas DC, Fischer C, Chang-Claude J: Haplotype sharinganalysis using mantel statistics. Hum Hered 2005, 59(2):67–78.
13. Schork NJ, Wessel J, Malo N: DNA Sequence-‐Based PhenotypicAssociation Analysis. In Advances in Genetics. Edited by Rao DC, Gu CC.Volume 60: Academic Press; 2008:195–217.
14. Wessel J, Schork NJ: Generalized genomic distance based regressionmethodology for multilocus association analysis. Am J Hum Genet 2006,79(5):792–806.
15. Mukhopadhyay I, Feingold E, Weeks DE, Thalamuthu A: Association testsusing kernel-based measures of multi-locus genotype similarity betweenindividuals. Genet Epidemiol 2010, 34(3):213–221.
16. Kwee LC, Liu D, Lin X, Ghosh D, Epstein MP: A powerful and flexiblemultilocus association test for quantitative traits. Am J Hum Genet 2008,82(2):386–397.
17. Schaid DJ, McDonnell SK, Hebbring SJ, Cunningham JM, Thibodeau SN:Nonparametric tests of association of multiple genes with humandisease. Am J Hum Genet 2005, 76(5):780–793.
18. Thalamuthu A, Zhao J, Keong G, Kondragunta V, Mukhopadhyay I:Association tests for rare and common variants based on genotypicand phenotypic measures of similarity between individuals. BMC Proc2011, 5(Suppl 9):S89.
19. Chung D, Zhang Q, Kraja A, Borecki I, Province M: Distance-basedphenotypic association analysis of DNA sequence data. BMC Proc2011, 5(Suppl 9):S54.
20. Li M, Fu W, Lu Q: An aggregating U-Test for a genetic association studyof quantitative traits. BMC Proc 2011, 5(Suppl 9):S23.
21. Almasy L, Dyer T, Peralta J, Kent J, Charlesworth J, Curran J, Blangero J:Genetic analysis workshop 17 mini-exome simulation. BMC Proc2011, 5(Suppl 9):S2.
22. Jiang R, Dong J: Detecting rare functional variants using a wavelet-basedtest on quantitative and qualitative traits. BMC Proc 2011, 5(Suppl 9):S70.
23. Price AL, Patterson NJ, Plenge RM, Weinblatt ME, Shadick NA, Reich D:Principal components analysis corrects for stratification in genome-wideassociation studies. Nat Genet 2006, 38(8):904–909.
24. Basu S, Pan W: Comparison of statistical tests for disease association withrare variants. Genet Epidemiol 2011, 35(7):606–619.
25. Mukhopadhyay I, Feingold E, Weeks DE, Thalamuthu A: Association testsusing kernel-based measures of multi-locus genotype similarity betweenindividuals. Genet Epidemiol 2009, 34(3):213–221.
26. Schaid DJ: Genomic similarity and kernel methods I: advancements bybuilding on mathematical and statistical foundations. Hum Hered2010, 70(2):109–131.
27. Wu MC, Kraft P, Epstein MP, Taylor DM, Chanock SJ, Hunter DJ, Lin X:Powerful SNP-Set analysis for case–control genome-wide associationstudies. Am J Hum Genet 2010, 86(6):929–942.
28. Li B, Leal SM: Methods for detecting associations with rare variants forcommon diseases: application to analysis of sequence data. Am J HumGenet 2008, 83(3):311–321.
29. King CR, Rathouz PJ, Nicolae DL: An evolutionary framework forassociation testing in resequencing studies. PLoS Genet 2010,6(11):e1001202.
30. Boyko AR, Williamson SH, Indap AR, Degenhardt JD, Hernandez RD,Lohmueller KE, Adams MD, Schmidt S, Sninsky JJ, Sunyaev SR, et al:Assessing the evolutionary impact of amino acid mutations in thehuman genome. PLoS Genet 2008, 4(5):e1000083.
doi:10.1186/1471-2164-14-50Cite this article as: Zakharov et al.: Comparison of similarity-based testsand pooling strategies for rare variants. BMC Genomics 2013 14:50.
Submit your next manuscript to BioMed Centraland take full advantage of:
• Convenient online submission
• Thorough peer review
• No space constraints or color figure charges
• Immediate publication on acceptance
• Inclusion in PubMed, CAS, Scopus and Google Scholar
• Research which is freely available for redistribution
Submit your manuscript at www.biomedcentral.com/submit
Related Documents