RESEARCH ARTICLE Comparison of Self-Reported Alcohol Consumption to Phosphatidylethanol Measurement among HIV-Infected Patients Initiating Antiretroviral Treatment in Southwestern Uganda Francis Bajunirwe 1 *, Jessica E. Haberer 2 , Yap Boum II 3 , Peter Hunt 4 , Rain Mocello 4 , Jeffrey N. Martin 4,5 , David R. Bangsberg 2 , Judith A. Hahn 4,5 1. Mbarara University of Science and Technology, Faculty of Medicine, Department of Community Health, P.O. Box 1410, Mbarara, Uganda, 2. Harvard Medical School, Boston, Massachusetts, United States of America, 3. Epicentre Uganda Research Center, Mbarara, Uganda, 4. Department of Epidemiology and Biostatistics, University of California San Francisco, San Francisco, California, United States of America, 5. Department of Medicine, University of California San Francisco, San Francisco, California, United States of America * [email protected] Abstract Background: Alcohol consumption among HIV-infected patients may accelerate HIV disease progression or reduce antiretroviral therapy adherence. Self-reported alcohol use is frequently under-reported due to social desirability and recall bias. The aim of this study was to compare self-reported alcohol consumption to phosphatidylethanol (PEth), a biomarker of alcohol consumption, and to estimate the correlation between multiple measures of self-reported alcohol consumption with PEth. Methods: The Uganda AIDS Rural Treatment Outcomes (UARTO) cohort is located in southwestern Uganda and follows patients on ART to measure treatment outcomes. Patients complete standardized questionnaires quarterly including questions on demographics, health status and alcohol consumption. Baseline dried blood spots (DBS) were collected and retrieved to measure PEth. Results: One hundred fifty samples were tested, and 56 (37.3%) were PEth positive (>8 ng/mL). Of those, 51.7% did not report alcohol use in the past month. Men were more likely to under-report compared to women, OR 2.9, 95% CI51.26, 6.65) and those in the higher economic asset categories were less likely to under- report compared to those in the lowest category (OR50.41 95% CI: 0.17, 0.94). Among self-reported drinkers (n531), PEth was highly correlated with the total number of drinking days in the last 30 (Spearman R50.73, p,0.001). OPEN ACCESS Citation: Bajunirwe F, Haberer JE, Boum Y II, Hunt P, Mocello R, et al. (2014) Comparison of Self-Reported Alcohol Consumption to Phosphatidylethanol Measurement among HIV- Infected Patients Initiating Antiretroviral Treatment in Southwestern Uganda. PLoS ONE 9(12): e113152. doi:10.1371/journal.pone.0113152 Editor: Anil Kumar, University of Missouri-Kansas City, United States of America Received: July 24, 2014 Accepted: October 20, 2014 Published: December 1, 2014 This is an open-access article, free of all copyright, and may be freely reproduced, distributed, transmitted, modified, built upon, or otherwise used by anyone for any lawful purpose. The work is made available under the Creative Commons CC0 public domain dedication. Data Availability: The authors confirm that all data underlying the findings are fully available without restriction. All relevant data are included in the Supporting Information files. Funding: This work was funded by National Institutes of Health R01 MH054907 (DRB), K24AA022586 (JAH), R01AA018631 (JAH), P30 AI027763, R01 MH054907, and U01 CA066529 (JM). FB is supported by the IAS-NIDA fellowship program and JEH is supported by the NIH (K23MH 087228). The funders had no role in study design, data collection and analysis, decision to publish, or preparation of the manuscript. Competing Interests: The authors have declared that no competing interests exist. PLOS ONE | DOI:10.1371/journal.pone.0113152 December 1, 2014 1 / 12

Welcome message from author
This document is posted to help you gain knowledge. Please leave a comment to let me know what you think about it! Share it to your friends and learn new things together.
Transcript
RESEARCH ARTICLE
Comparison of Self-Reported AlcoholConsumption to PhosphatidylethanolMeasurement among HIV-InfectedPatients Initiating AntiretroviralTreatment in Southwestern UgandaFrancis Bajunirwe1*, Jessica E. Haberer2, Yap Boum II3, Peter Hunt4, RainMocello4, Jeffrey N. Martin4,5, David R. Bangsberg2, Judith A. Hahn4,5
1.Mbarara University of Science and Technology, Faculty of Medicine, Department of Community Health, P.O.Box 1410, Mbarara, Uganda, 2. Harvard Medical School, Boston, Massachusetts, United States of America,3. Epicentre Uganda Research Center, Mbarara, Uganda, 4. Department of Epidemiology and Biostatistics,University of California San Francisco, San Francisco, California, United States of America, 5. Department ofMedicine, University of California San Francisco, San Francisco, California, United States of America
Abstract
Background: Alcohol consumption among HIV-infected patients may accelerate
HIV disease progression or reduce antiretroviral therapy adherence. Self-reported
alcohol use is frequently under-reported due to social desirability and recall bias.
The aim of this study was to compare self-reported alcohol consumption to
phosphatidylethanol (PEth), a biomarker of alcohol consumption, and to estimate
the correlation between multiple measures of self-reported alcohol consumption
with PEth.
Methods: The Uganda AIDS Rural Treatment Outcomes (UARTO) cohort is
located in southwestern Uganda and follows patients on ART to measure treatment
outcomes. Patients complete standardized questionnaires quarterly including
questions on demographics, health status and alcohol consumption. Baseline dried
blood spots (DBS) were collected and retrieved to measure PEth.
Results: One hundred fifty samples were tested, and 56 (37.3%) were PEth
positive (>8 ng/mL). Of those, 51.7% did not report alcohol use in the past month.
Men were more likely to under-report compared to women, OR 2.9, 95% CI51.26,
6.65) and those in the higher economic asset categories were less likely to under-
report compared to those in the lowest category (OR50.41 95% CI: 0.17, 0.94).
Among self-reported drinkers (n531), PEth was highly correlated with the total
number of drinking days in the last 30 (Spearman R50.73, p,0.001).
OPEN ACCESS
Citation: Bajunirwe F, Haberer JE, Boum Y II,Hunt P, Mocello R, et al. (2014) Comparison ofSelf-Reported Alcohol Consumption toPhosphatidylethanol Measurement among HIV-Infected Patients Initiating Antiretroviral Treatmentin Southwestern Uganda. PLoS ONE 9(12):e113152. doi:10.1371/journal.pone.0113152
Editor: Anil Kumar, University of Missouri-KansasCity, United States of America
Received: July 24, 2014
Accepted: October 20, 2014
Published: December 1, 2014
This is an open-access article, free of all copyright,and may be freely reproduced, distributed,transmitted, modified, built upon, or otherwise usedby anyone for any lawful purpose. The work ismade available under the Creative Commons CC0public domain dedication.
Data Availability: The authors confirm that all dataunderlying the findings are fully available withoutrestriction. All relevant data are included in theSupporting Information files.
Funding: This work was funded by NationalInstitutes of Health R01 MH054907 (DRB),K24AA022586 (JAH), R01AA018631 (JAH), P30AI027763, R01 MH054907, and U01 CA066529(JM). FB is supported by the IAS-NIDA fellowshipprogram and JEH is supported by the NIH (K23MH087228). The funders had no role in study design,data collection and analysis, decision to publish, orpreparation of the manuscript.
Competing Interests: The authors have declaredthat no competing interests exist.
PLOS ONE | DOI:10.1371/journal.pone.0113152 December 1, 2014 1 / 12
Conclusions: Approximately half of HIV infected patients initiating ART and
consuming alcohol under-report their use of alcohol. Given the high prevalence,
clinicians should assess all patients for alcohol use with more attention to males
and those in lower economic asset categories who deny alcohol use. Among those
reporting current drinking, self-reported drinking days is a useful quantitative
measure.
Introduction
Uganda faces a dual burden of HIV and unhealthy alcohol use. The country is
ranked among the top per capita consumers of alcohol in the world [1] and also
has a high prevalence of HIV of 7.3% among the adults [2]. This dual burden of
heavy alcohol use and HIV may present challenges because alcohol use among
HIV patients has been associated with increased progression of HIV disease [3],
potentially due to the effect of alcohol on the immune system [4]. Alcohol is
known to interact with certain antiretroviral treatments hence reducing treatment
efficacy [5], and alcohol consumption is associated with poor adherence to
antiretroviral medication [6–8] and with excess mortality [9–11]. Effective
treatments in the form of behavioral or pharmacological therapy [12] exist to
reduce the negative effects of alcohol among those with alcohol use disorders;
while screening and brief interventions may reduce alcohol consumption among
problem drinkers who are not alcohol dependent [13].
To identify patients who consume alcohol, counselors and clinicians often rely
on self-reported measures of alcohol consumption which may be biased toward
under-report by social desirability to report what the counselor or clinician wants
to hear, or out of fear of being denied ART [14] or simply recall bias. The
frequency of under-reporting has been explored in very few studies, however in a
nested case control from our cohort, the frequency of self-reported prior 3-month
alcohol use increased from 20% to 41% when alcohol biomarker and breathalyzer
testing was included as part of the study protocol and discussed during the
informed consent process [15]. There are also challenges in quantifying alcohol
consumption in resource limited settings such as Uganda, where drinks are often
served in non-standard containers such as gourds or consumed communally. In
order to accurately measure alcohol consumption, biomarkers of alcohol such as
phosphatidylethanol (PEth), a phospholipid which is formed by the action of a
phospholipase enzyme only in the presence of alcohol, may be useful. PEth has
been tested in Uganda and shown to be highly sensitive (88%) and specific (89%)
for any alcohol consumption in the prior 21 days [16]. Thus this biomarker
provides a tool to estimate under report.
The aim of this study was to determine the frequency of alcohol under-
reporting among patients receiving HIV treatment, the characteristics of the
patients who underreport, and examine the correlation of quantitative PEth
Self-Reported Alcohol Measures and HIV-1 Patients
PLOS ONE | DOI:10.1371/journal.pone.0113152 December 1, 2014 2 / 12
results with various self-reported measures of alcohol consumption in rural
Uganda.
Methods
Setting and study procedures
Participants in this study were part of the Uganda AIDS Rural Treatment
Outcomes (UARTO) cohort study located in Mbarara, which is in southwestern
Uganda. The UARTO cohort began in July 2005 and recruited treatment-naive
patients initiating ART at Mbarara Hospital’s HIV clinic. A study representative
approached individuals collecting new antiretroviral prescriptions from the
pharmacy, and determined their eligibility and interest in participation. Those
who were at least 18 years of age and lived within 50 kilometers of the clinic were
eligible for the study. The cohort is fully recruited now but follow-up is still
ongoing.
Ethics statement
All study procedures were approved by the Institutional review Boards of the
Mbarara University of Science and Technology, Partners HealthCare, the
University of California, San Francisco, and the Uganda National Council of
Science and Technology. All participants enrolled in the study provided written
informed consent. As part of the consent process, participants agreed to have their
blood samples stored, and were told that the blood may be tested to see if they had
consumed alcohol. Upon recruitment, UARTO participants underwent a baseline
interview and phlebotomy. Participants completed standardized interviewer-
administered surveys detailing demographics, household socioeconomic profile,
alcohol use, mental and physical health status and depression scores among other
variables, as well as CD4 cell count and HIV RNA quantification, on a quarterly
basis.
Measurement of alcohol consumption
We asked study participants when they last consumed alcohol, and how many
days in the prior 30 they consumed alcohol. We additionally asked the typical
number of drinks consumed per drinking day for those drinking alcohol in forms
other than gourds or non-standard drink containers. The number of drinks per
day was used to calculate the total number of drinks in the last 30 days. We asked
the total amount of money (in Ugandan shillings) that the participants spent on
their own alcohol in the prior 30 days. Lastly, we asked the number of days the
participants drank until they reached the following stages of intoxication (in
descending order of severity): drinking until feeling stuporous or becoming
unconscious; drinking until it was difficult to speak or see clearly or walk;
drinking until it was difficult to think clearly; and drinking until feeling
uninhibited or a false sense of confidence. We added the number of days the
Self-Reported Alcohol Measures and HIV-1 Patients
PLOS ONE | DOI:10.1371/journal.pone.0113152 December 1, 2014 3 / 12
participants reported these to create a variable representing the number of days of
drinking until intoxication.
Covariates
Depression was assessed using the 15-items of the Hopkins Symptoms checklist
depression scale (HSCL) that screen for depression [17]. The tool has been used
widely in the region and has been found to have high validity and reliability [18].
We used a cut-off of average value of greater than or equal to 1.75 to indicate a
positive screen for clinical depression. Literacy levels were assessed using simple
reading cards in the local language and English. Socio-economic status was
assessed using education, electricity in the home, asset category and land
ownership. Economic asset categories to indicate household wealth were
constructed using Principal components analysis [19]. Low represents the bottom
two quintiles and the rest were classified in a single category representing medium
to high assets.
Dried blood spot collection and phosphatidylethanol testing
Phospatidylethanol (PEth) is a metabolite of alcohol and is a highly sensitive and
specific biomarker for alcohol consumption and has been shown to have the
highest sensitivity for detecting alcohol intake over the last 21 days compared to
the other biomarkers such as carbohydrate deficient transferin (CDT), mean
corpuscular volume (MCV) and gamma-glutamyl transferase [20]. In a previous
study of persons with HIV attending the Mbarara Hospital HIV Clinic different
from those enrolled in the current study, we found that PEth was 88% sensitive
and 89% specific for any alcohol consumption in the prior 21 days. [16] In that
study any alcohol consumption was defined as either detectable alcohol use on
any daily breathalyzer test conducted at home or a pre-arranged drinking
establishment, or any and alcohol use self-reported on a daily survey.
In addition, the study found that PEth was highly correlated with several
quantitative measures of alcohol consumption, such as number of days drinking
(Spearman r50.74); others have shown similar results in HIV uninfected
populations. [21, 22]
We collected dried blood spots (DBS) at all study visits beginning July 2011,
and retrieved those for the baseline visits for the first 150 patients in August 2013,
therefore samples were stored for a maximum of two years. PEth testing was
conducted at the United States Drug Testing Laboratory, Des Plaines, IL, using a
previously published method. [23] PEth was detected in standard dried blood spot
punches (3.1 mm) using an Agilent 6460 liquid chromatography-tandem mass
spectrometry (LC-MS/MS) system following extraction into methanol. The most
prevalent PEth isomer, palmitoyl (PEth 16:0)/oleoyl (PEth 18:1), was detected.
Positive tests were confirmed with a repeat test, and the average of the two results
was used. The limit of detection was 2 ng/mL, the limit of quantitation was 8 ng/
mL, and the assay was linear up to 800 ng/mL.
Self-Reported Alcohol Measures and HIV-1 Patients
PLOS ONE | DOI:10.1371/journal.pone.0113152 December 1, 2014 4 / 12
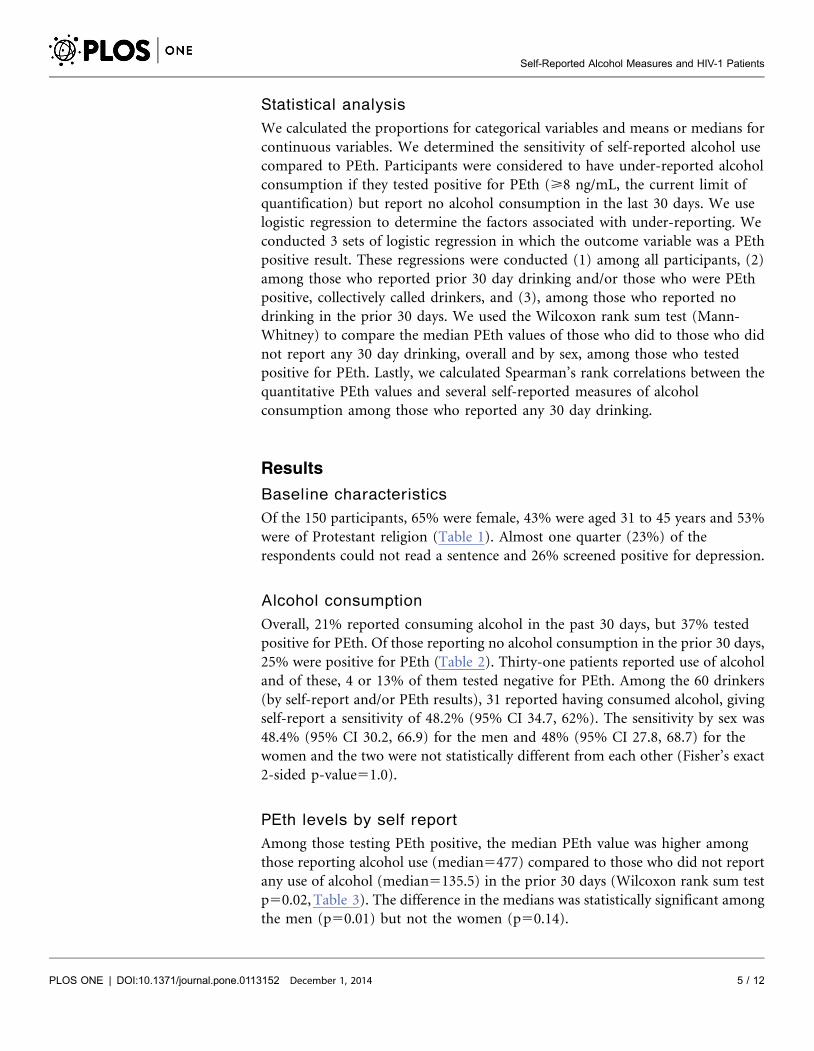
Statistical analysis
We calculated the proportions for categorical variables and means or medians for
continuous variables. We determined the sensitivity of self-reported alcohol use
compared to PEth. Participants were considered to have under-reported alcohol
consumption if they tested positive for PEth (>8 ng/mL, the current limit of
quantification) but report no alcohol consumption in the last 30 days. We use
logistic regression to determine the factors associated with under-reporting. We
conducted 3 sets of logistic regression in which the outcome variable was a PEth
positive result. These regressions were conducted (1) among all participants, (2)
among those who reported prior 30 day drinking and/or those who were PEth
positive, collectively called drinkers, and (3), among those who reported no
drinking in the prior 30 days. We used the Wilcoxon rank sum test (Mann-
Whitney) to compare the median PEth values of those who did to those who did
not report any 30 day drinking, overall and by sex, among those who tested
positive for PEth. Lastly, we calculated Spearman’s rank correlations between the
quantitative PEth values and several self-reported measures of alcohol
consumption among those who reported any 30 day drinking.
Results
Baseline characteristics
Of the 150 participants, 65% were female, 43% were aged 31 to 45 years and 53%
were of Protestant religion (Table 1). Almost one quarter (23%) of the
respondents could not read a sentence and 26% screened positive for depression.
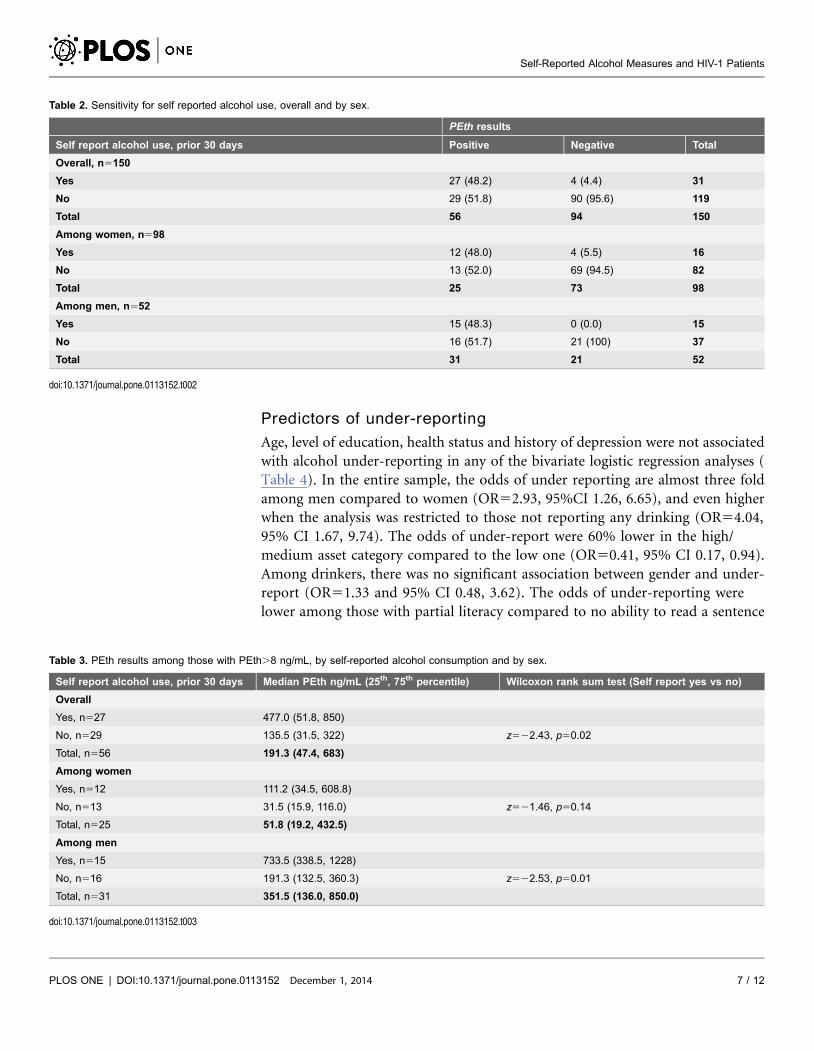
Alcohol consumption
Overall, 21% reported consuming alcohol in the past 30 days, but 37% tested
positive for PEth. Of those reporting no alcohol consumption in the prior 30 days,
25% were positive for PEth (Table 2). Thirty-one patients reported use of alcohol
and of these, 4 or 13% of them tested negative for PEth. Among the 60 drinkers
(by self-report and/or PEth results), 31 reported having consumed alcohol, giving
self-report a sensitivity of 48.2% (95% CI 34.7, 62%). The sensitivity by sex was
48.4% (95% CI 30.2, 66.9) for the men and 48% (95% CI 27.8, 68.7) for the
women and the two were not statistically different from each other (Fisher’s exact
2-sided p-value51.0).
PEth levels by self report
Among those testing PEth positive, the median PEth value was higher among
those reporting alcohol use (median5477) compared to those who did not report
any use of alcohol (median5135.5) in the prior 30 days (Wilcoxon rank sum test
p50.02, Table 3). The difference in the medians was statistically significant among
the men (p50.01) but not the women (p50.14).
Self-Reported Alcohol Measures and HIV-1 Patients
PLOS ONE | DOI:10.1371/journal.pone.0113152 December 1, 2014 5 / 12
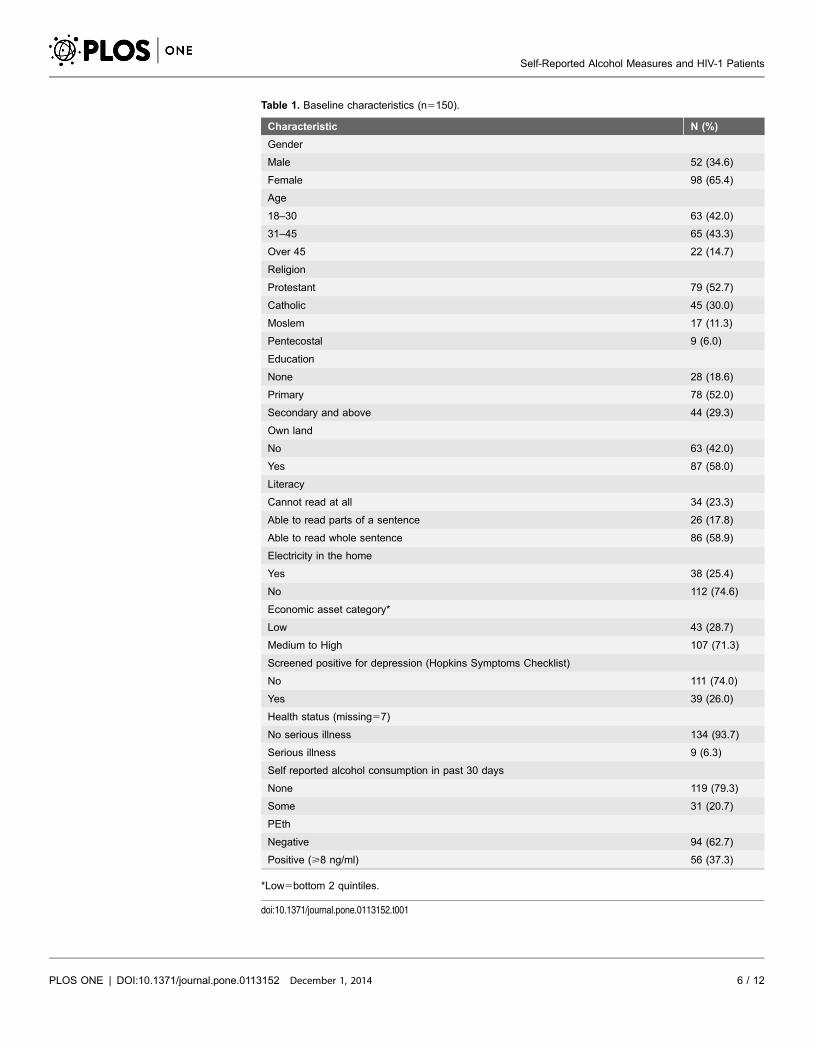
Table 1. Baseline characteristics (n5150).
Characteristic N (%)
Gender
Male 52 (34.6)
Female 98 (65.4)
Age
18–30 63 (42.0)
31–45 65 (43.3)
Over 45 22 (14.7)
Religion
Protestant 79 (52.7)
Catholic 45 (30.0)
Moslem 17 (11.3)
Pentecostal 9 (6.0)
Education
None 28 (18.6)
Primary 78 (52.0)
Secondary and above 44 (29.3)
Own land
No 63 (42.0)
Yes 87 (58.0)
Literacy
Cannot read at all 34 (23.3)
Able to read parts of a sentence 26 (17.8)
Able to read whole sentence 86 (58.9)
Electricity in the home
Yes 38 (25.4)
No 112 (74.6)
Economic asset category*
Low 43 (28.7)
Medium to High 107 (71.3)
Screened positive for depression (Hopkins Symptoms Checklist)
No 111 (74.0)
Yes 39 (26.0)
Health status (missing57)
No serious illness 134 (93.7)
Serious illness 9 (6.3)
Self reported alcohol consumption in past 30 days
None 119 (79.3)
Some 31 (20.7)
PEth
Negative 94 (62.7)
Positive (>8 ng/ml) 56 (37.3)
*Low5bottom 2 quintiles.
doi:10.1371/journal.pone.0113152.t001
Self-Reported Alcohol Measures and HIV-1 Patients
PLOS ONE | DOI:10.1371/journal.pone.0113152 December 1, 2014 6 / 12
Predictors of under-reporting
Age, level of education, health status and history of depression were not associated
with alcohol under-reporting in any of the bivariate logistic regression analyses (
Table 4). In the entire sample, the odds of under reporting are almost three fold
among men compared to women (OR52.93, 95%CI 1.26, 6.65), and even higher
when the analysis was restricted to those not reporting any drinking (OR54.04,
95% CI 1.67, 9.74). The odds of under-report were 60% lower in the high/
medium asset category compared to the low one (OR50.41, 95% CI 0.17, 0.94).
Among drinkers, there was no significant association between gender and under-
report (OR51.33 and 95% CI 0.48, 3.62). The odds of under-reporting were
lower among those with partial literacy compared to no ability to read a sentence
Table 2. Sensitivity for self reported alcohol use, overall and by sex.
PEth results
Self report alcohol use, prior 30 days Positive Negative Total
Overall, n5150
Yes 27 (48.2) 4 (4.4) 31
No 29 (51.8) 90 (95.6) 119
Total 56 94 150
Among women, n598
Yes 12 (48.0) 4 (5.5) 16
No 13 (52.0) 69 (94.5) 82
Total 25 73 98
Among men, n552
Yes 15 (48.3) 0 (0.0) 15
No 16 (51.7) 21 (100) 37
Total 31 21 52
doi:10.1371/journal.pone.0113152.t002
Table 3. PEth results among those with PEth.8 ng/mL, by self-reported alcohol consumption and by sex.
Self report alcohol use, prior 30 days Median PEth ng/mL (25th, 75th percentile) Wilcoxon rank sum test (Self report yes vs no)
Overall
Yes, n527 477.0 (51.8, 850)
No, n529 135.5 (31.5, 322) z522.43, p50.02
Total, n556 191.3 (47.4, 683)
Among women
Yes, n512 111.2 (34.5, 608.8)
No, n513 31.5 (15.9, 116.0) z521.46, p50.14
Total, n525 51.8 (19.2, 432.5)
Among men
Yes, n515 733.5 (338.5, 1228)
No, n516 191.3 (132.5, 360.3) z522.53, p50.01
Total, n531 351.5 (136.0, 850.0)
doi:10.1371/journal.pone.0113152.t003
Self-Reported Alcohol Measures and HIV-1 Patients
PLOS ONE | DOI:10.1371/journal.pone.0113152 December 1, 2014 7 / 12
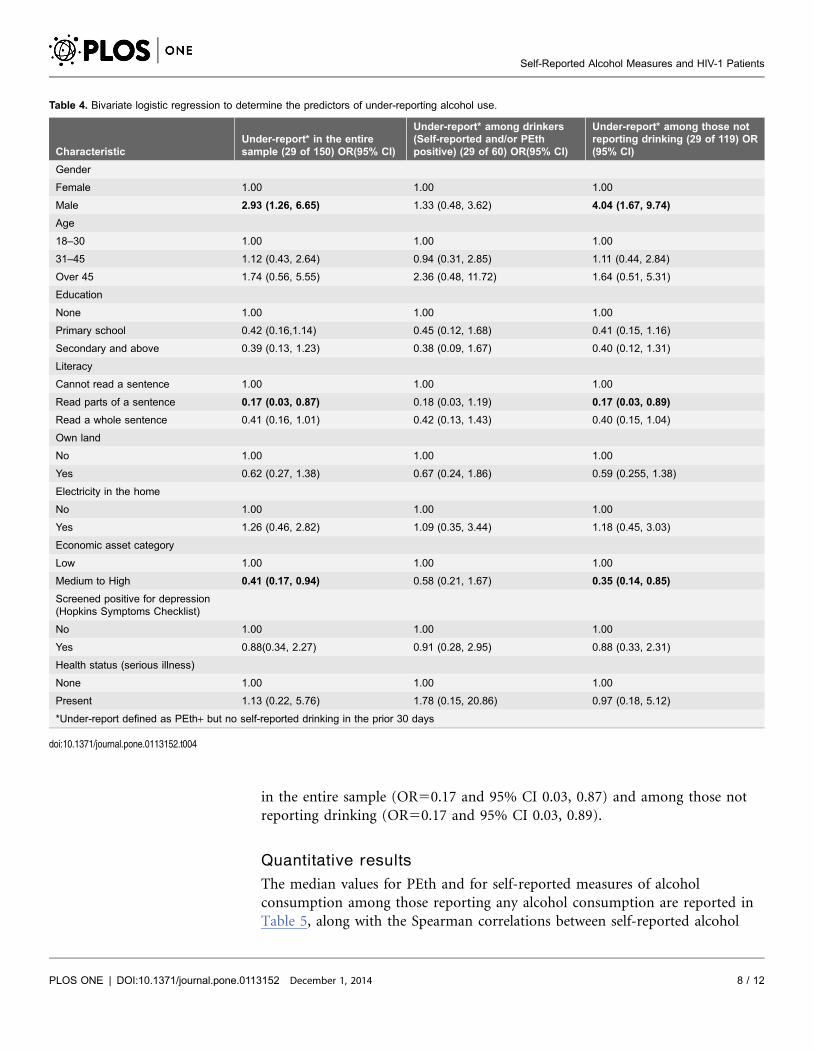
in the entire sample (OR50.17 and 95% CI 0.03, 0.87) and among those not
reporting drinking (OR50.17 and 95% CI 0.03, 0.89).
Quantitative results
The median values for PEth and for self-reported measures of alcohol
consumption among those reporting any alcohol consumption are reported in
Table 5, along with the Spearman correlations between self-reported alcohol
Table 4. Bivariate logistic regression to determine the predictors of under-reporting alcohol use.
CharacteristicUnder-report* in the entiresample (29 of 150) OR(95% CI)
Under-report* among drinkers(Self-reported and/or PEthpositive) (29 of 60) OR(95% CI)
Under-report* among those notreporting drinking (29 of 119) OR(95% CI)
Gender
Female 1.00 1.00 1.00
Male 2.93 (1.26, 6.65) 1.33 (0.48, 3.62) 4.04 (1.67, 9.74)
Age
18–30 1.00 1.00 1.00
31–45 1.12 (0.43, 2.64) 0.94 (0.31, 2.85) 1.11 (0.44, 2.84)
Over 45 1.74 (0.56, 5.55) 2.36 (0.48, 11.72) 1.64 (0.51, 5.31)
Education
None 1.00 1.00 1.00
Primary school 0.42 (0.16,1.14) 0.45 (0.12, 1.68) 0.41 (0.15, 1.16)
Secondary and above 0.39 (0.13, 1.23) 0.38 (0.09, 1.67) 0.40 (0.12, 1.31)
Literacy
Cannot read a sentence 1.00 1.00 1.00
Read parts of a sentence 0.17 (0.03, 0.87) 0.18 (0.03, 1.19) 0.17 (0.03, 0.89)
Read a whole sentence 0.41 (0.16, 1.01) 0.42 (0.13, 1.43) 0.40 (0.15, 1.04)
Own land
No 1.00 1.00 1.00
Yes 0.62 (0.27, 1.38) 0.67 (0.24, 1.86) 0.59 (0.255, 1.38)
Electricity in the home
No 1.00 1.00 1.00
Yes 1.26 (0.46, 2.82) 1.09 (0.35, 3.44) 1.18 (0.45, 3.03)
Economic asset category
Low 1.00 1.00 1.00
Medium to High 0.41 (0.17, 0.94) 0.58 (0.21, 1.67) 0.35 (0.14, 0.85)
Screened positive for depression(Hopkins Symptoms Checklist)
No 1.00 1.00 1.00
Yes 0.88(0.34, 2.27) 0.91 (0.28, 2.95) 0.88 (0.33, 2.31)
Health status (serious illness)
None 1.00 1.00 1.00
Present 1.13 (0.22, 5.76) 1.78 (0.15, 20.86) 0.97 (0.18, 5.12)
*Under-report defined as PEth+ but no self-reported drinking in the prior 30 days
doi:10.1371/journal.pone.0113152.t004
Self-Reported Alcohol Measures and HIV-1 Patients
PLOS ONE | DOI:10.1371/journal.pone.0113152 December 1, 2014 8 / 12
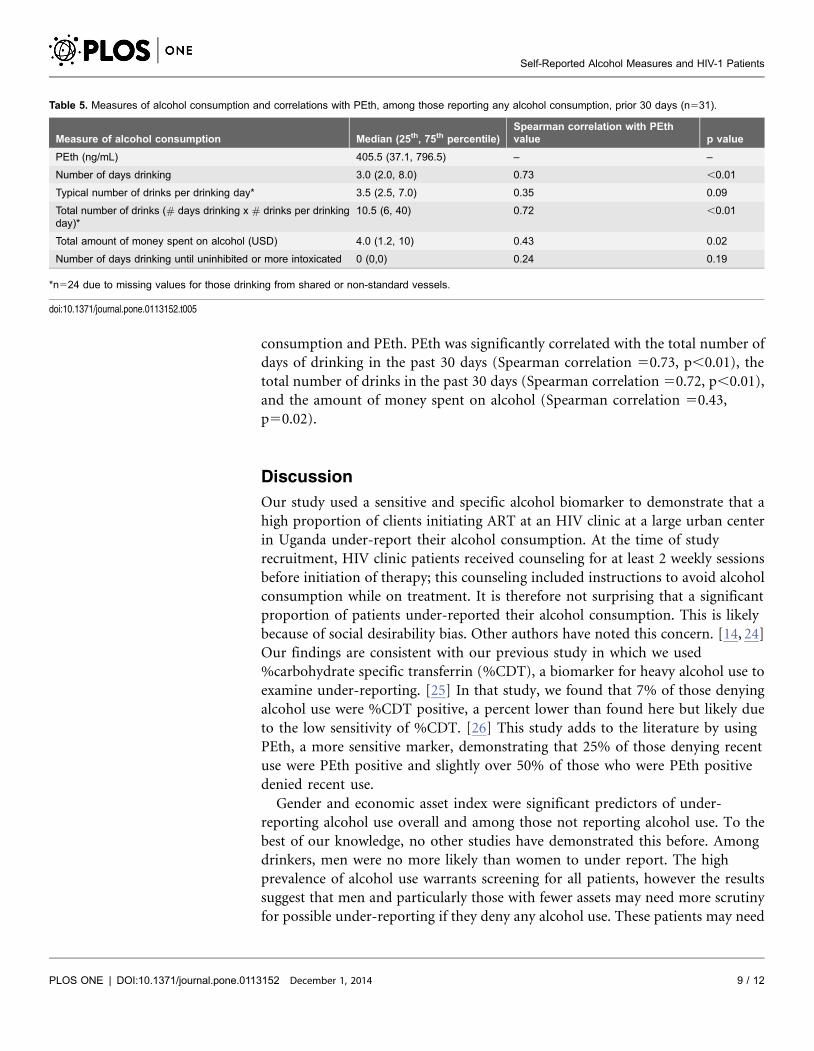
consumption and PEth. PEth was significantly correlated with the total number of
days of drinking in the past 30 days (Spearman correlation 50.73, p,0.01), the
total number of drinks in the past 30 days (Spearman correlation 50.72, p,0.01),
and the amount of money spent on alcohol (Spearman correlation 50.43,
p50.02).
Discussion
Our study used a sensitive and specific alcohol biomarker to demonstrate that a
high proportion of clients initiating ART at an HIV clinic at a large urban center
in Uganda under-report their alcohol consumption. At the time of study
recruitment, HIV clinic patients received counseling for at least 2 weekly sessions
before initiation of therapy; this counseling included instructions to avoid alcohol
consumption while on treatment. It is therefore not surprising that a significant
proportion of patients under-reported their alcohol consumption. This is likely
because of social desirability bias. Other authors have noted this concern. [14, 24]
Our findings are consistent with our previous study in which we used
%carbohydrate specific transferrin (%CDT), a biomarker for heavy alcohol use to
examine under-reporting. [25] In that study, we found that 7% of those denying
alcohol use were %CDT positive, a percent lower than found here but likely due
to the low sensitivity of %CDT. [26] This study adds to the literature by using
PEth, a more sensitive marker, demonstrating that 25% of those denying recent
use were PEth positive and slightly over 50% of those who were PEth positive
denied recent use.
Gender and economic asset index were significant predictors of under-
reporting alcohol use overall and among those not reporting alcohol use. To the
best of our knowledge, no other studies have demonstrated this before. Among
drinkers, men were no more likely than women to under report. The high
prevalence of alcohol use warrants screening for all patients, however the results
suggest that men and particularly those with fewer assets may need more scrutiny
for possible under-reporting if they deny any alcohol use. These patients may need
Table 5. Measures of alcohol consumption and correlations with PEth, among those reporting any alcohol consumption, prior 30 days (n531).
Measure of alcohol consumption Median (25th, 75th percentile)Spearman correlation with PEthvalue p value
PEth (ng/mL) 405.5 (37.1, 796.5) – –
Number of days drinking 3.0 (2.0, 8.0) 0.73 ,0.01
Typical number of drinks per drinking day* 3.5 (2.5, 7.0) 0.35 0.09
Total number of drinks (# days drinking x # drinks per drinkingday)*
10.5 (6, 40) 0.72 ,0.01
Total amount of money spent on alcohol (USD) 4.0 (1.2, 10) 0.43 0.02
Number of days drinking until uninhibited or more intoxicated 0 (0,0) 0.24 0.19
*n524 due to missing values for those drinking from shared or non-standard vessels.
doi:10.1371/journal.pone.0113152.t005
Self-Reported Alcohol Measures and HIV-1 Patients
PLOS ONE | DOI:10.1371/journal.pone.0113152 December 1, 2014 9 / 12
reassurance that disclosure of alcohol use will in no way jeopardize their chances
of initiating ART. Currently, clinics in Uganda do not have any strategies in place
to reduce under-reporting. No other characteristic was associated with under-
reporting alcohol use.
Our data also show a strong correlation between PEth and self-report measures
of alcohol consumption among those who did report any alcohol consumption.
The number of days of drinking in the past 30 days showed the strongest
correlation (Spearman50.73) with the quantitative PEth result. This suggests that
among those reporting any recent alcohol consumption, reporting of the
frequency of consuming alcohol is highly valid, and also suggests that PEth may be
a useful quantitative measure when self-report is unavailable or difficult to obtain.
It is also notable that even among self-reported drinkers, the level of alcohol
consumption was fairly low, with a median of 3 drinking days in the prior month.
This is consistent with our previous findings of a large number of drinkers
reporting reducing their alcohol consumption at the time of ART initiation in a
previous wave of this same cohort [27]. Our data shows low correlation between
number of days drinking until intoxicated and typical number of drinks per day
with PEth probably because of under-report. However, the low correlation does
not necessarily mean these measures are less useful.
PEth was detectable though results were significantly lower among those not
reporting any alcohol consumption. This may imply that under-reporters may be
lighter drinkers than those reporting drinking. In an analysis stratified by gender,
the difference remained statistically significant among men but not the women.
This may imply that women drinkers have similar levels of alcohol consumption
whether they under-report or correctly report their alcohol consumption.
However, this may be because of the small sample size. Also, because the women’s
PEth values are lower overall, even among those reporting alcohol use, their data
represents the end of the scale where the difference is small. Regardless, the level of
PEth was high among all those with detectable PEth, with a median of 191 ng/ml,
which is well above the recent cutoff of 80 ng/ml which indicated drinking.54
drinks daily in a recent study among a group of patients with liver disease [28].
Our study has some weaknesses. PEth may not be completely sensitive and
specific, therefore we may have under or over-estimated under-report. Secondly,
there were some who reported drinking but were PEth negative, although these
were very few. Our self-report measure spans 30 days while the biomarker spans
21 days; hence self-report may have reflected alcohol use beyond the window
detectable by PEth. Also, it is still unclear whether PEth when assessed using LC/
MS/MS is measuring any alcohol use or heavy alcohol use. [29] We took a
conservative approach and used positive PEth results to suggest any alcohol use;
however, it is possible that some PEth negatives may have consumed alcohol
although moderately. This is supported by a recent study where participants with
a negative PEth and reporting alcohol use were mainly light drinkers. [28]
Our study also warrants the necessity for clinicians to screen HIV infected
patients initiating ART for alcohol use, especially in countries such as Uganda
where alcohol consumption is high among drinkers. The high cost and limited
Self-Reported Alcohol Measures and HIV-1 Patients
PLOS ONE | DOI:10.1371/journal.pone.0113152 December 1, 2014 10 / 12
availability of biomarkers restricts their use to research and limits their application
in clinical settings.
In conclusion, our study has shown that many of HIV infected patients
receiving ART under-report their alcohol consumption. Clinicians should screen
the men more for possible under-reporting of alcohol consumption. Interventions
depend on the reporting of alcohol use, therefore future research should develop
ways to increase self-report.
Author Contributions
Conceived and designed the experiments: FB DRB JNM JAH. Performed the
experiments: FB JEH YB PH. Analyzed the data: FB JEH YB PH RM JNM DRB
JAH. Contributed reagents/materials/analysis tools: FB JEH YB PH RM JNM DRB
JAH. Wrote the paper: FB JEH YB PH RM JNM DRB JAH. Final approval of the
manuscript: FB JEH YB PH RM JNM DRB JAH.
References
1. WHO (2011) Global Status Report on Alcohol and Health. Geneva, Switzerland.
2. (2012) Uganda AIDS Indicator Survey 2011, Demographic and Health Surveys, ICF International.
3. Samet JH, Cheng DM, Libman H, Nunes DP, Alperen JK, et al. (2007) Alcohol consumption and HIVdisease progression. J Acquir Immune Defic Syndr 46: 194–199.
4. Hahn JA, Samet JH (2010) Alcohol and HIV disease progression: weighing the evidence. Curr HIV/AIDS Rep 7: 226–233.
5. Kumar S, Jin M, Ande A, Sinha N, Silverstein PS, et al. (2012) Alcohol consumption effect onantiretroviral therapy and HIV-1 pathogenesis: role of cytochrome P450 isozymes. Expert Opin DrugMetab Toxicol 8: 1363–1375.
6. Braithwaite RS, McGinnis KA, Conigliaro J, Maisto SA, Crystal S, et al. (2005) A temporal and dose-response association between alcohol consumption and medication adherence among veterans in care.Alcohol Clin Exp Res 29: 1190–1197.
7. Hendershot CS, Stoner SA, Pantalone DW, Simoni JM (2009) Alcohol use and antiretroviraladherence: review and meta-analysis. J Acquir Immune Defic Syndr 52: 180–202.
8. Samet JH, Horton NJ, Meli S, Freedberg KA, Palepu A (2004) Alcohol consumption and antiretroviraladherence among HIV-infected persons with alcohol problems. Alcohol Clin Exp Res 28: 572–577.
9. DeLorenze GN, Weisner C, Tsai AL, Satre DD, Quesenberry CP Jr (2011) Excess mortality amongHIV-infected patients diagnosed with substance use dependence or abuse receiving care in a fullyintegrated medical care program. Alcohol Clin Exp Res 35: 203–210.
10. Hessol NA, Kalinowski A, Benning L, Mullen J, Young M, et al. (2007) Mortality among participants inthe Multicenter AIDS Cohort Study and the Women’s Interagency HIV Study. Clin Infect Dis 44: 287–294.
11. Neblett RC, Hutton HE, Lau B, McCaul ME, Moore RD, et al. (2011) Alcohol consumption among HIV-infected women: impact on time to antiretroviral therapy and survival. J Womens Health (Larchmt) 20:279–286.
12. Anton RF, O’Malley SS, Ciraulo DA, Cisler RA, Couper D, et al. (2006) Combined pharmacotherapiesand behavioral interventions for alcohol dependence: the COMBINE study: a randomized controlled trial.JAMA 295: 2003–2017.
13. O’Donnell A, Anderson P, Newbury-Birch D, Schulte B, Schmidt C, et al. (2014) The impact of briefalcohol interventions in primary healthcare: a systematic review of reviews. Alcohol Alcohol 49: 66–78.
Self-Reported Alcohol Measures and HIV-1 Patients
PLOS ONE | DOI:10.1371/journal.pone.0113152 December 1, 2014 11 / 12
14. Papas RK, Gakinya BN, Baliddawa JB, Martino S, Bryant KJ, et al. (2012) Ethical issues in a stage 1cognitive-behavioral therapy feasibility study and trial to reduce alcohol use among HIV-infectedoutpatients in western Kenya. J Empir Res Hum Res Ethics 7: 29–37.
15. Hahn JA, Fatch R, Kabami J, Mayanja B, Emenyonu NI, et al. (2012) Self-Report of Alcohol UseIncreases When Specimens for Alcohol Biomarkers Are Collected in Persons With HIV in Uganda.J Acquir Immune Defic Syndr 61: e63–64.
16. Hahn JA, Dobkin LM, Mayanja B, Emenyonu NI, Kigozi IM, et al. (2012) Phosphatidylethanol (PEth)as a biomarker of alcohol consumption in HIV-positive patients in sub-Saharan Africa. Alcohol Clin ExpRes 36: 854–862.
17. Martinez P, Andia I, Emenyonu N, Hahn JA, Hauff E, et al. (2008) Alcohol use, depressive symptomsand the receipt of antiretroviral therapy in southwest Uganda. AIDS Behav 12: 605–612.
18. Epino HM, Rich ML, Kaigamba F, Hakizamungu M, Socci AR, et al. (2012) Reliability and constructvalidity of three health-related self-report scales in HIV-positive adults in rural Rwanda. AIDS Care 24:1576–1583.
19. Vyas S, Kumaranayake L (2006) Constructing socio-economic status indices: how to use principalcomponents analysis. Health Policy Plan 21: 459–468.
20. Hannuksela ML, Liisanantti MK, Nissinen AE, Savolainen MJ (2007) Biochemical markers ofalcoholism. Clin Chem Lab Med 45: 953–961.
21. Aradottir S, Asanovska G, Gjerss S, Hansson P, Alling C (2006) PHosphatidylethanol (PEth)concentrations in blood are correlated to reported alcohol intake in alcohol-dependent patients. AlcoholAlcohol 41: 431–437.
22. Hartmann S, Aradottir S, Graf M, Wiesbeck G, Lesch O, et al. (2007) Phosphatidylethanol as asensitive and specific biomarker: comparison with gamma-glutamyl transpeptidase, mean corpuscularvolume and carbohydrate-deficient transferrin. Addict Biol 12: 81–84.
23. Jones J, Jones M, Plate C, Lewis D (2011) The detection of 1-palmitoyl-2-oleoyl-sn-glycero-3-phosphoethanol in human dried blood spots. Analytical Methods 3: 1101–1106.
24. Morris CN, Levine B, Goodridge G, Luo N, Ashley J (2006) Three-country assessment of alcohol-HIVrelated policy and programmematic responses in Africa. African Journal of Drug and Alcohol Studies 5:170–184.
25. Hahn JA, Bwana MB, Javors MA, Martin JN, Emenyonu NI, et al. (2010) Biomarker testing toestimate under-reported heavy alcohol consumption by persons with HIV initiating ART in Uganda. AIDSBehav 14: 1265–1268.
26. Bergstrom JP, Helander A (2008) Clinical characteristics of carbohydrate-deficient transferrin(%disialotransferrin) measured by HPLC: sensitivity, specificity, gender effects, and relationship withother alcohol biomarkers. Alcohol Alcohol 43: 436–441.
27. Santos GM, Emenyonu NI, Bajunirwe F, Rain Mocello A, Martin JN, et al. (2014) Self-reportedalcohol abstinence associated with ART initiation among HIV-infected persons in rural Uganda. DrugAlcohol Depend 134: 151–157.
28. Stewart SH, Koch DG, Willner IR, Anton RF, Reuben A (2014) Validation of blood phosphatidylethanolas an alcohol consumption biomarker in patients with chronic liver disease. Alcohol Clin Exp Res 38:1706–1711.
29. Isaksson A, Walther L, Hansson T, Andersson A, Alling C (2011) Phosphatidylethanol in blood (B-PEth): a marker for alcohol use and abuse. Drug Test Anal 3: 195–200.
Self-Reported Alcohol Measures and HIV-1 Patients
PLOS ONE | DOI:10.1371/journal.pone.0113152 December 1, 2014 12 / 12
Related Documents