Comparison of Regeneration and Tree Species Diversity of Disturbed and Less Disturbed Zones of Sitakund Botanical Garden and Eco-Park, Chittagong, Bangladesh A Thesis submitted to University of Natural Resources and Applied Life Sciences In Partial Fulfillment of the Requirements for the Degree of Master of Science in Mountain Forestry By Rajasree Nandi Supervisor Ao. Prof. Dipl.-Ing. Dr. Harald Vacik Institute of Silviculture, Department of Forest and Soil Sciences Vienna, September 2009 Institute of Silviculture Department of Forest and Soil Sciences University of Natural Resources and Applied Life Sciences Vienna Mountain Forestry

Welcome message from author
This document is posted to help you gain knowledge. Please leave a comment to let me know what you think about it! Share it to your friends and learn new things together.
Transcript
Comparison of Regeneration and Tree Species Diversity of
Disturbed and Less Disturbed Zones of Sitakund Botanical
Garden and Eco-Park, Chittagong, Bangladesh
A Thesis submitted to
University of Natural Resources and Applied Life Sciences
In Partial Fulfillment of the Requirements for the Degree of
Master of Science in Mountain Forestry
By
Rajasree Nandi
Supervisor
Ao. Prof. Dipl.-Ing. Dr. Harald Vacik
Institute of Silviculture, Department of Forest and Soil Sciences
Vienna, September 2009
Institute of Silviculture
Department of Forest and Soil Sciences
University of Natural Resources and Applied Life Sciences
Vienna
Mountain Forestry

II
Dedicated to my parents
for their continuous support and encouragement
III
ACKNOWLEDGMENT
I would like to express my profound and indebted gratitude to my supervisor Professor Dr. Harald
Vacik, for his close supervision, encouragement, continuous help, professional guidance, valuable
suggestion and commenting on the draft thoroughly which has made possible to the preparation of
this thesis paper. Like this, my deeply thanks goes to Dr. Khairul Alam, Divisional Officer, Forest
Botany Division, Bangladesh Forest Research Institute (BFRI),Chittagong for his valuable
suggestion and comments during my field time. I would like to express my deepest gratitude to the
Professor Dr. Md. Amin Uddin Mridha, Vice Chancellor, Pabna University of Science and
Technology for providing me valuable suggestion. I would like to express my sincere gratitude to
Dr. Md. Danesh Mia, Associate Professor, Institute of Forestry and Environmental Sciences,
University of Chittagong for his valuable information during my data analysis. Also, I would like
to express my deep gratitude to Professor Hartmut Gossow for providing me valuable comment
and inspiration during my thesis work. My sincere thanks goes to ÖOG (Österreichische Orient-
Gesellschaft Hammer-Purgstall) for providing me the scholarship to pursue M.Sc.at the BOKU
University, Vienna. I would also like to thank Dr. Theresia Laubichler for her continuous help and
inspiration during my whole study period. Also I would like to thank Judith Weiss for her very
continuous help during my whole study period in Vienna. I would like to express my thanks to
Md. Zaid Hussain Bhuiyan, Project Director, Sitakund Botanical Garden and Eco-park, Sitakund,
Chittagong for his valuable support during my field work in Bangladesh. Also I would like to
express my gratitude to M.A. Khaleque Khan, Divisional Forest Officer, Coastal Forest Division,
Chittagong, Bangladesh for providing me valuable information and materials. I would like to
thank all the staff of Sitakund Botanical Garden and Eco-park who helped me continuously in the
field and provided me valuable information. Also thanks to all of the Mountain Forestry
Professors who provided more knowledge, shared their experience, idea and thought. For this, I
would like to thank Dr. H. Hasenauer, M. Lexer, G. Glatzel, G. Gratzer, M. Pregernig and H.
Hager. My thanks go to Monika Lex and all staff of silviculture institute for their cordial help
during my research time. My especial thanks go to my Bangladeshi colleague Md. Mizanur
Rahman for providing me help during my research work. I would like to acknowledge to my
entire Mountain Forestry colleague to whom I spent two years, enjoyed a lot, shared and
exchanged our idea and experience to each other. I would like to express my deepest gratitude to
my family members .Without their continuous support and inspiration I could not come up to this
stage. Also very special thanks to my friend Sepul who is always encouraging me, supporting me,
helping me. Once again, thanks to all who supported me directly and indirectly.
IV
ABSTRACT
This study presents the natural regeneration status and tree species diversity of the Sitakund
Botanical Garden and Eco-park, Chittagong, Bangladesh. The study area was classified as
disturbed and less disturbed zones based on the current anthropogenic disturbances. Stratified and
systematic random sampling was used to select the sample plots, 30 in less disturbed zone and 20
in disturbed zone. A total number of 109 plant species from 43 families were recorded in the
study, of which 93 were naturally originated species and rest were planted. Among the naturally
originated species 66 were tree species, 9 were shrub species and 18 were climbers. The average
densities (N/ha) of height range (0 - 0.5) m, (0.5 - 2) m, (> 2 m < 6 cm dbh) and trees (> 6 cm dbh)
were 72333, 11291, 2770 and 790 in the less disturbed zone and 122500, 12687, 1640 and 150 in
the disturbed zone respectively. The average basal areas (m2 / ha) in the disturbed and less
disturbed zone were 3.29 and 6.80 respectively. Holarrhena antidysenterica, Stereospermum
chelonioides, Dehasia kuruzi, Garuga pinnata, Albizzia procera, Kurulla were dominant tree
species in the disturbed zone and Holarrhena antidysenterica, Stereospermum chelonioides,
Dehasia kuruzi, Garuga pinnata, Syzygium fruticosum, Ficus hispida were dominant tree species
in the less disturbed zone.32 trees and 9 climbers were common in both zones. Herb coverage in
the disturbed and less disturbed zone was 67% and 40% respectively. Most of the shrub species
were common in both zones. Species richness, density (N / ha) for regeneration from (0 - 0.5) m
range and trees (> 6 cm dbh) and disturbance index showed significant differences between zones.
Species richness and basal area (m2/ha) showed a negative relationship with disturbance index.
Number of total individuals decreased as the diameter and height of trees increased. It is evident
from the results that plant species richness and tree species diversity were influenced by the level
of anthropogenic disturbances. Therefore, native forest eco-system could be restored if the
anthropogenic disturbances can be minimized.
Keywords: Human influence, Species diversity, Vegetation structure, Regeneration, Disturbance
index

V
KURZFASSUNG
In dieser Arbeit wird die Naturverjüngung und Baumartenvielfalt in durch den menschlichen
Einfluss unterschiedlich geprägten Gebieten des Sitakund Botanical Garden und Eco-park in
Chittagong in Bangladesh untersucht.
Das Untersuchungsgebiet mit einer Größe von 1570 ha wurde auf Basis der aktuellen
menschlichen Aktivitäten klassifiziert, wobei in der weniger beeinflussten Zone 30
Stichprobenpunkte und in der beeinflussten Zone 20 Stichprobenpunkte aufgenommen wurden.
Die stratifizierte Auswahl der Stichprobenpunkte erfolgte nach einem systematischen Raster
zufällig. Insgesamt konnten 109 Pflanzenarten aus 43 Familien identifiziert werden, wobei 93
einen natürlichen Ursprung aufweisen, der Rest war künstlich eingebracht. Von den
ursprünglichen Arten konnten 66 Baumarten, 9 Straucharten und 18 Kletterpflanzen unterschieden
werden. Die Baumartenvielfalt und Pflanzendichten waren zwischen den beiden Zonen
entsprechend den Höhenklassen (0 - 0.5) m , (0.5 - 2) m, (> 2 m < 6 cm BHD) und (> 6 cm BHD)
signifikant unterschiedlich. Die durchschnittliche Grundfläche war mit 3.29 m²/ha in der
beeinflussten Zone geringer als in der weniger beeinflussten Zone mit 6.80 m²/ha. Holarrhena
antidysenterica, Stereospermum chelonioides, Dehasia kuruzi, Garuga pinnata, Albizzia procera
und Kurulla waren die dominanten Baumarten in der beeinflussten Zone. Holarrhena
antidysenterica, Stereospermum chelonioides, Dehasia kuruzi, Garuga pinnata, Syzygium
fruticosum und Ficus hispida waren die dominanten Baumarten in der wenig beeinflussten Zone.
Neben den dominaten Baumarten Holarrhena antidysenterica, Stereospermum chelonioides,
Dehasia kuruzi und Garuga pinnata kamen auch noch zusätzlich 32 Baumarten, 9 Kletterpflanzen
und die meisten Straucharten in beiden Zonen gemeinsam vor. Die Bedeckung mit krautiger
Vegetation war mit 67% in der beeinflussten Zone höher als in der weniger beeinflussten Zone mit
40%. Die Baumartenvielfalt und die Grundfläche waren mit dem Grad des menschlichen
Einflusses signifikant negativ korreliert. Die Anzahl der Arten nahm mit steigendem Durchmesser
und Baumhöhe ab. Es konnte in der Arbeit die Bedeutung von menschlichen Aktivitäten auf die
Diversität der Waldökosysteme dargestellt werden. Hinweise für die Erhaltung einer möglichst
naturnahen Artenkombination werden gemacht.
Keywords: Menschliche beeinflussung, Artenvielfalt, Vegetationsstruktur, Verjüngung,
Störungsindex
VI
TABLE OF CONTENTS
ACKNOWLEDGMENT .............................................................................................................. III
ABSTRACT ................................................................................................................................ IV
KURZFASSUNG ......................................................................................................................... V
TABLE OF CONTENTS ............................................................................................................ VI
LIST OF TABLES ..................................................................................................................... VII
LIST OF FIGURES ................................................................................................................... VIII
LIST OF PHOTOGRAPHS.........................................................................................................IX
Chapter 1 INTRODUCTION ............................................................................................................. 1
1. 1 Background, Problem Statement and Justification ................................................................. 1
1. 2 Research Objectives ................................................................................................................ 3
Chapter 2 LITERATURE REVIEW .................................................................................................. 4
2. 1 The concept of Bio-diversity ................................................................................................... 4
2. 2 Status of Bio-diversity in Bangladesh ..................................................................................... 4
2. 3 Conservation of Species Diversity of Natural Forest .............................................................. 6
2.3. 1 In Situ Conservation ......................................................................................................... 7
2.3. 2 Ex-situ Conservation ........................................................................................................ 9
2. 4 Participation and Involvement of Bangladesh in the International Political Process ........... 11
2. 5 Government’s Policies, Legislations and Major Initiatives for Bio-diversity Conservation 11
Chapter 3 MATERIALS AND METHODS .................................................................................... 12
3. 1 Research Methodology .......................................................................................................... 12
3. 2 Data Collection ...................................................................................................................... 12
3. 3 Identification of Species ........................................................................................................ 13
3. 4 Instrument and Other Materials Used in the Study ............................................................... 13
3. 5 Field Data Collection Procedures .......................................................................................... 13
3. 6 Study Area ............................................................................................................................. 17
VII
3.6. 1 Location, Area and Boundary ......................................................................................... 17
3.6. 2 Climate and Site Information ......................................................................................... 20
3.6. 3 Vegetation ....................................................................................................................... 21
3.6. 4 Land Use Characteristics at Botanical Garden and Eco-park ......................................... 22
Chapter 4 RESULTS........................................................................................................................ 24
4. 1 Current Situation of Disturbances ......................................................................................... 24
4. 2 Composition and Tree Species Richness ............................................................................. 28
4. 3 Diversity Indices and Disturbances ....................................................................................... 32
4. 4 Community Structure ............................................................................................................ 34
4. 5 Dominant Tree Species ......................................................................................................... 41
Chapter 5 DISCUSSION ................................................................................................................. 46
Chapter 6 CONCLUSION AND RECOMMENDATION .............................................................. 50
6. 1 Conclusion ............................................................................................................................. 50
6. 2 Recommendation ................................................................................................................... 51
REFERENCES ............................................................................................................................. 52
ANNEXES ......................................................................................................................................i
LIST OF TABLES
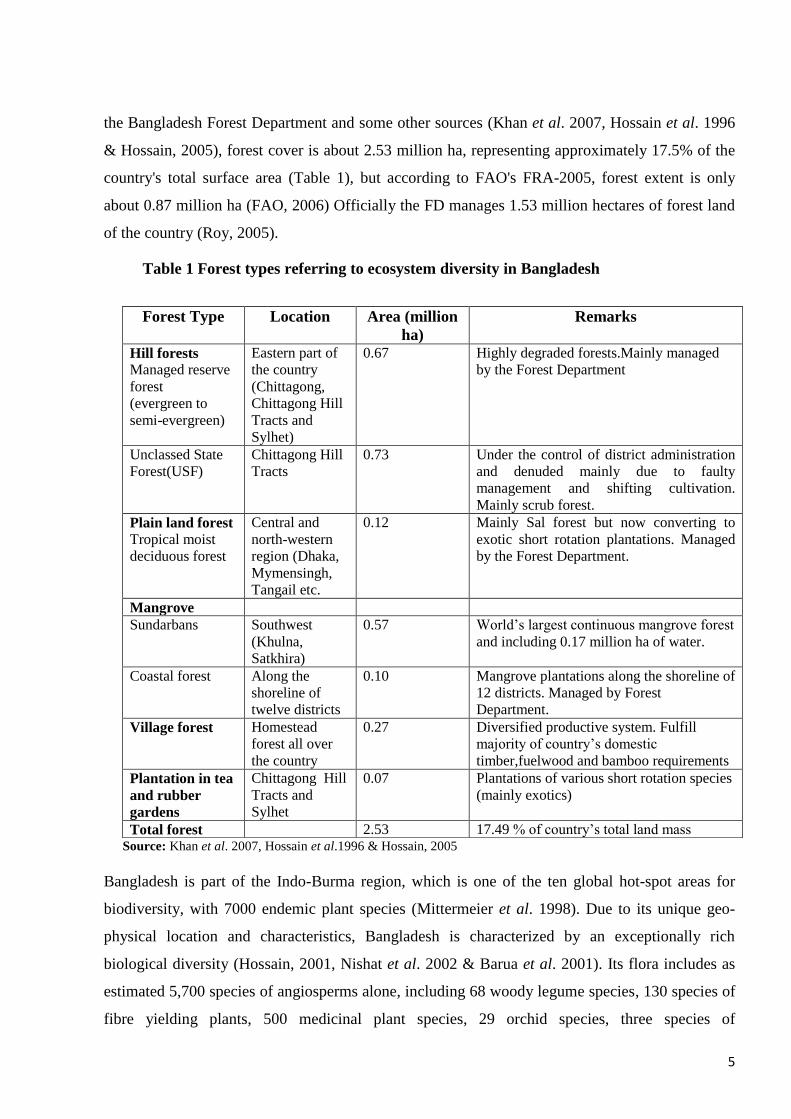
Table 1 Forest types referring to ecosystem diversity in Bangladesh ............................................... 5
Table 2 List of protected areas in Bangladesh ................................................................................... 8
Table 3 Framework for data collection in the field for disturbance elements ................................. 15
Table 4 Qualitative classes of disturbance elements ........................................................................ 16
Table 5 List of tree species composition and family recorded in the eco-park ............................... 28
Table 6 List of shrub species family, local and scientific name recorded in the eco-park .............. 30
Table 7 List of climber species family, local and scientific name recorded in the eco-park ........... 30
Table 8 Lists of tall grasses found in the disturbed zone ................................................................. 30
Table 9 Species richness and overlapping of plant species and percentage coverage of herb
between two zones ........................................................................................................................... 31
VIII
Table 10 ANOVA for the comparison of species richness between zones ..................................... 31
Table 11 Shanon -Weiner Index of Tree Diversity, Index of Dominance and Evenness Index in
two zones ......................................................................................................................................... 33
Table 12 Relationship between disturbance index with density (N/ ha) and basal area (m2 / ha) in
two zones ......................................................................................................................................... 33
Table 13 Density (N/ha) of shrubs (Mean ± SD) in two zones ..................................................... 34
Table 14 Density (N/ha) (Mean± SD), basal area (m2/ ha), (Mean ± SD) and Important Value
Index (IVI) of the enlisted trees >6 cm dbh in the two zones (*indicates planted species)............. 35
Table 15 ANOVA for to know the significant difference for the density (N/ha) of naturally
originated species and disturbance index between zones ................................................................ 37
Table 16 Composition (%) of dominating tree species (natural) at regeneration stage in the
disturbed zone .................................................................................................................................. 43
Table 17 Composition (%) of dominating tree species at their regeneration stage in the less
disturbed zone .................................................................................................................................. 43
Table 18 Mean Density (N /ha) of regeneration and composition (%) of tree species within the
height range from (0 - 0.5) m in both zones in order to know the condition of dominating tree
species compared with other species at their regeneration stage ..................................................... 43
LIST OF FIGURES
Fig. 1 Research design ..................................................................................................................... 12
Fig. 2 Plot design for data collection of regeneration and tree species diversity............................. 14
Fig. 3 Map of Bangladesh and Location of study area .................................................................... 18
Fig. 4 Map of Sitakund Botanical Garden and Eco-park, Chittagong, Bangladesh ........................ 19
Fig. 5 Share (%) of each disturbance category on the sample plots of the disturbed zone .............. 24
Fig. 6 Share (%) of each disturbance category on the sample plots of the less disturbed zone....... 24
Fig. 7 Species area curve for the disturbed and less disturbed zone ................................................ 32
Fig. 8 Density (N/ ha) of tree species from natural origin and plantation in the disturbed zone ..... 35
Fig. 9 Number of species with different diameter distribution in different plots for trees (> 6 cm
dbh) in the disturbed zone ................................................................................................................ 38
Fig. 10 Number of species with different diameter distribution in different plots for trees (> 6 cm
dbh) in the less disturbed zone ......................................................................................................... 38
IX
Fig. 11 Density (N/ ha) of trees (> 6 cm dbh) with different diameter (cm) distribution in both
zones ................................................................................................................................................ 39
Fig. 12 Number of species with different height distribution in different plots for trees (> 6 cm
dbh) in the disturbed zone ................................................................................................................ 40
Fig. 13 Number of species with different height distribution in different plots for trees (> 6 cm
dbh) in the less disturbed zone ......................................................................................................... 40
Fig. 14 Density (N /ha) of trees (> 6 cm dbh) with different height distribution in both zones ...... 41
Fig. 15 According to basal area (m2/ ha) percentage of dominating tree species in the disturbed
zone .................................................................................................................................................. 42
Fig. 16 According to basal area (m2/ ha) percentage of dominating tree species in the less
disturbed zone .................................................................................................................................. 42
LIST OF PHOTOGRAPHS
Photograph 1 Effect of fire in disturbed zone..................................................................................26
Photograph 2 Bark peeling for making medicine against mosquito from the disturbed zone.........26
Photograph 3 Local people are collecting tall grasses and saplings from the disturbed zone.........26
Photograph 4 Present condition of the less disturbed zone..............................................................27
Photograph 5 Water stream passing through the less disturbed zone..............................................27
ANNEXES
Annex 1 Species found in the study area with code........................................................................i
Annex 2 Relative Density, Relative Frequency, Relative Abundance and Relative Dominance of
tree (> 6cm dbh) in the disturbed zone............................................................................................ ii
Annex 3 Relative Density, Relative Frequency, Relative Abundance and Relative Dominance of
tree (> 6cm dbh) in the less disturbed zone.................................................................................... iii
Annex 4 Relative Density, Relative Frequency and Relative Abundance of plants from (0 - 0.5)
m range in the disturbed zone...................................................................................................................iv
Annex 5 Relative Density, Relative Frequency and Relative Abundance of plants from (0 - 0.5)
m range in the less disturbed zone................................................................................................... v
Annex 6 Relative Density, Relative Abundance and Relative Frequency of plants (0.5 - 2) m range
in the disturbed zone................................................................................................................................. vi
Annex 7 Relative Density, Relative Abundance and Relative Frequency of plants (0.5 - 2) m range
in the less disturbed zone........................................................................................................................ vii
X
Annex 8 Relative Density, Relative Abundance and Relative Frequency of plants for height range
(> 2 m < 6 cm dbh) in the disturbed zone..............................................................................................viii
Annex 9 Relative Density, Relative Abundance and Relative Frequency of plants for height range
(> 2 m < 6 cm dbh) in the less disturbed zone...................................................................................... ix
Annex 10 Some photos from field...........................................................................................................x
ABBREVIATIONS
FD = Forest Department
FMP = Forestry Master Plan
BFRI = Bangladesh Forest Research Institute
MOEF = Ministry of Environment and Forest
FAO = Food and Agriculture Organization
FRA = Forest Resources Assessment
IUCN = International Union for Conservation of Nature
WWF = World Wildlife Fund
UNFP = United Nations Environment Programme
CBD = Convention on Biological Diversity
CNPPA = Commission on National Parks and Protected Areas
NFSC = National Forest Seed Centre
RIMS = Resource Information Management System
NTFP = Non Timber Forest Product
ANOVA = Analysis of Variance
SPSS = Statistical Package for the Social Sciences
SD = Standard Deviation
1
Chapter 1 INTRODUCTION
1. 1 Background, Problem Statement and Justification
Bangladesh is a small country of about 144,000 sq km land area with a large population of
153,546,901 (2008 est.).It is one of the most densely populated countries in the world. Bangladesh
was well endowed with a very diverse compliment of terrestrial and aquatic biological
resources. The combined effect of habitat destructions and over exploitation of biological
resources, increased settlements, land use systems have been severely depleted the biodiversity.
Many species are now extinct in the country and many more species are listed as threatened and
endangered (Ahmed,1995) .The biological diversity of tropical forests constitutes a unique national
and international asset maintaining global ecological systems and achieving sustainability of
biological resources and now being widely recognized goals of world's nations (Trivedi, 2000).
An arbitrary felling of trees mainly from the hill forests have resulted in a stern running down of
tropical forest tree species causing a serious degradation of native ecosystems. Most of the hill
forests areas have been lying denuded of forest cover for decades. Even though Bangladesh Forest
Department has undertaken reforestation programmes in some of these degraded hill forests
through the World Bank and Asian Development Bank aided projects (Misbahuzzaman, 2004) ,no
satisfactory results have so far been achieved either in respect of a successful establishment of
plantation or in terms of the area brought under tree cover. The plantation programmes are not
successful due to the poor biophysical condition of the degraded hill soils and seasonal moisture
stress. Steep slopes and deep gorges may further affix to the difficulties of carrying out activities
for establishment of plantation. Nevertheless, the Government of Bangladesh has recognized the
importance of its native forest ecosystems mainly, because of its concerns for biodiversity
conservation and climate change issues. Concentrated efforts have recently been made in an
attempt to restore the unique condition of native forest ecosystems in some critical forest areas of
the country. One of such initiatives was to establish eco-parks for ecological restoration of native
hill forest ecosystems and development of eco-tourism on nature conservation in different parts of
the country (Misbahuzzaman & Alam, 2006).
An Eco-park is a natural recreational centre where people can enjoy the beauties of the nature in
its natural habitated, see the natural landscapes and biodiversity closely. Likewise, a botanical
garden plays a vital role for recreation. The National Botanical Garden was the only botanical

2
garden in the country which is situated in Mirpur, Dhaka. This garden is at present mostly used for
recreation purposes. A project was supposed to be implemented considering the needs of
recreation facilities of the people in Chittagong city and adjoining areas, ex-situ conservation of
biodiversity and genetic resources and display areas for plants, the practical demonstration plots
for developing a Botanical Garden in Chittagong Metropolitan area during 1994-95. It was
supposed to be implemented by five years, but could not run properly due to land administration
problems. Last of all Ministry of Environment and Forests, Government of Bangladesh decided in
August 1998 to establish a Botanical Garden at Chandranath Hill, Sitakund. In a meeting in
September 1999, the planning Commission, Government of Bangladesh decided to merge
‘Barabkunda Hot Spring and Baroiardhala Waterfall Project’ another proposed project of Forest
Department with the Botanical Garden project, as both the projects are located in the same area.
Finally a project titled ‘Establishment of Botanical Garden and Eco-park at Sitakund ’was
approved for five years from 1999 - 2000 to 2003 - 2004 (FD & MOEF, 2000) .This was the first
implementation phase of the project. Currently the second phase has been implemented at the
same place and this will run up to 2009 - 2010 fiscal years on ward.
The forests that once covered the hills in Chittagong have been largely destroyed. Though there
are no accurate data on how much forest has been lost from Chandranath reserve forest,
Chittagong, records of the Forest Department (FD) show that around 21,000 ha of forest has been
lost, due to encroachment, illegal felling and the ravages of the 1941-1945 and 1971 liberation war
periods (FMP, 1992) .The depletion of the forests has decreased soil fertility by accelerating soil
erosion, reducing water yield because of increased runoff and compaction of the topsoil (Alam,
2001). Now-a-days, because of the establishment of Sitakund Botanical Garden and Eco-park,
regeneration is improving. But local people have been evicted from their rights to use park
resources. As there is a lack of other alternative means to sustain livelihoods, they have been
involved in many illegal activities such as illegal logging, poaching and hunting of wild animals
which have weakened the conservation efforts undertaken by the authority. Local people
sometimes take the risk of grazing their cattle inside the reserve boundaries as they have no other
alternative. Therefore, it can be seen that the main goal of the park to restore the biodiversity of
the region is under threat because of the conflict rising between the Park Authority and local
people. Adjoining hills near to the border of the area especially on the east and south under Forest
Department are mostly degraded (Nath & Alauddin, 2005). For this reason, it was of great
importance and interesting to observe how anthropogenic disturbances are influencing the
regeneration of plant species and tree species diversity in different areas of Sitakund Botanical
3
Garden and Eco-park. However, there was no research on regeneration status and tree species
diversity based on the anthropogenic disturbances in that area. Therefore, the study was carried
out to observe the regeneration status and tree species diversity in some disturbed and less
disturbed zones of the Sitakund Botanical Garden & Eco-park, Chittagong, Bangladesh.
1. 2 Research Objectives
The general objective of the study was to compare the regeneration status and tree species
diversity in different zones of the Sitakund Botanical Garden and Eco-park, Chittagong,
Bangladesh. To that general objective the following research questions are related:
What are the differences between the study areas according to
- species richness (mature trees, regeneration, shrub, climber)?
- density (N/ha) of tree, regeneration, shrub?
- herb coverage percentage?
- the height and dbh (Diameter at Breast Height) distribution?
- basal area (m2 /ha)?
- anthropogenic disturbances?
What is the proportion of planted species in relation to naturally regenerated species in
disturbed zones?
What are the dominant naturally regenerating tree species in the different study sites and
how do their importance value indexes (IVI) differ? What is the composition of
dominating tree species at their regeneration stage?
What is the impact of anthropogenic disturbances on the biological diversity (in terms of
species richness, basal area (m2/ha) and density (N/ha)) in the study area?
4
Chapter 2 LITERATURE REVIEW
2. 1 The Concept of Bio-diversity
"Biological diversity" means the variability among living organisms from all sources including,
inter alia, terrestrial, marine and other aquatic ecosystems and the ecological complexes of which
they are part; this includes diversity within species, between species and of ecosystems.
(Convention of Biological diversity-Article 2) (CBD, 1992).Biological diversity has recently
become one of the most popular topics of discussion both in scientific and political forum at local,
national, regional and global level.
The term biodiversity includes three different but closely related aspects,
I) Genetic diversity: It refers to the variation of genes within species. This constitutes distinct
population of the same species or genetic variation within population or varieties within a
species.
II) Species diversity: It refers to the variety of species within a region. Such diversity could be
measured on the basis of number of species in a region.
III) Ecosystem diversity: In an ecosystem, there may exist different landforms, each of which
supports different and specific vegetation. Ecosystem diversity in contrast to genetic and
species diversity is difficult to measure since the boundaries of the communities which
constitute the various sub-ecosystems are elusive. Ecosystem diversity could best be
understood if one studies the communities in various ecological niches within the given
ecosystem; each community is associated with definite species complexes. These complexes
are related to composition and structure of the biodiversity.
2. 2 Status of Bio-diversity in Bangladesh
Bangladesh is the world largest deltaic region, lies in the northeastern part of South Asia (Hossain,
2001). The majority of country’s land is formed by alluvium from the Ganges and the
Brahmaputra Rivers and their tributaries and consists mostly of flood plains (80%), with some
hilly areas (12%) (Islam, 2003). Bangladesh has a sub-tropical monsoon climate; its natural forests
are classified into three major vegetation types occurring in three distinctly different land types:
hill forest (evergreen to semi-evergreen), plain land Sal (Shorea robusta) forests and mangrove
forests. There is contradictory information on the actual forest extent of Bangladesh. According to
5
the Bangladesh Forest Department and some other sources (Khan et al. 2007, Hossain et al. 1996
& Hossain, 2005), forest cover is about 2.53 million ha, representing approximately 17.5% of the
country's total surface area (Table 1), but according to FAO's FRA-2005, forest extent is only
about 0.87 million ha (FAO, 2006) Officially the FD manages 1.53 million hectares of forest land
of the country (Roy, 2005).
Table 1 Forest types referring to ecosystem diversity in Bangladesh
Source: Khan et al. 2007, Hossain et al.1996 & Hossain, 2005
Bangladesh is part of the Indo-Burma region, which is one of the ten global hot-spot areas for
biodiversity, with 7000 endemic plant species (Mittermeier et al. 1998). Due to its unique geo-
physical location and characteristics, Bangladesh is characterized by an exceptionally rich
biological diversity (Hossain, 2001, Nishat et al. 2002 & Barua et al. 2001). Its flora includes as
estimated 5,700 species of angiosperms alone, including 68 woody legume species, 130 species of
fibre yielding plants, 500 medicinal plant species, 29 orchid species, three species of
Forest Type Location Area (million
ha)
Remarks
Hill forests
Managed reserve
forest
(evergreen to
semi-evergreen)
Eastern part of
the country
(Chittagong,
Chittagong Hill
Tracts and
Sylhet)
0.67 Highly degraded forests.Mainly managed
by the Forest Department
Unclassed State
Forest(USF)
Chittagong Hill
Tracts
0.73 Under the control of district administration
and denuded mainly due to faulty
management and shifting cultivation.
Mainly scrub forest.
Plain land forest
Tropical moist
deciduous forest
Central and
north-western
region (Dhaka,
Mymensingh,
Tangail etc.
0.12 Mainly Sal forest but now converting to
exotic short rotation plantations. Managed
by the Forest Department.
Mangrove
Sundarbans Southwest
(Khulna,
Satkhira)
0.57 World’s largest continuous mangrove forest
and including 0.17 million ha of water.
Coastal forest Along the
shoreline of
twelve districts
0.10 Mangrove plantations along the shoreline of
12 districts. Managed by Forest
Department.
Village forest Homestead
forest all over
the country
0.27 Diversified productive system. Fulfill
majority of country’s domestic
timber,fuelwood and bamboo requirements
Plantation in tea
and rubber
gardens
Chittagong Hill
Tracts and
Sylhet
0.07 Plantations of various short rotation species
(mainly exotics)
Total forest 2.53 17.49 % of country’s total land mass

6
gymnosperms and 1,700 pteridophytes (Firoz et al. 2004 & Khan, 1977). Some 2,260 plant
species have been reported from the hilly region of Chittagong alone, which falls between two
major floristic regions of Asia (Annonymous, 1993). The homestead forests are usually composed
of multipurpose fast growing trees, fruits trees, bamboo, rattan, medicinal and some aquatic plants.
There are about 8000 varieties of rice and nearly 3000 varieties of other miscellaneous crops in
Bangladesh (Hassan, 1995).
Lately much attention has been given to the direct causes of biodiversity loss. However, there are
usually underlying factors, including policies and laws, which provide the conditions for
biodiversity loss (Ruskin, 1992). Population growth combined with intensive use of natural
resources, poverty and unequal share of resource use at all levels, land tenure problems, micro-
economic policies and trade practices are important causes.
2. 3 Conservation of Species Diversity of Natural Forest
The major goal of the world conservation strategy launched in 1980 by IUCN (International Union
for Conservation of Nature), WWF (World Wildlife Fund) and UNEP (United Nations Environment
Programme) is the integration of conservation and development to ensure the survival and well
being of the people. In achieving these goals every country should concentrate on the priority
requirements and on the main obstacles for which a strategy can be formulated. The natural forest
of Bangladesh possesses a well variety of plant and animal resources. But many of the wild
animals have become extinct and many others are not considered vulnerable due to habitat loss.
Removal of vegetation cover produces an open space which is unattractive to wildlife. A large area
of forest is being converted to agricultural land and habitation (Kumar & Asija, 2000).
Subsidies for agricultural development, livestock rearing and other intensive production system
have often resulted in unsustainable development program large scale but avoidable losses of
biodiversity worldwide. Low commitment to biodiversity management gives rise to a number of
problems. Centralized planning prevents local stakeholders from participating in decision-making
concerning land use and research.
Unless adequate conservation measures are taken the loss of tree species diversity will be
irreplaceable. Ex-situ and In-situ conservation programs had been started in Bangladesh as the
obligations of CBD in order to protect plants.

7
2.3. 1 In Situ Conservation
IUCN (1978) categorized the in situ conservation areas as strict nature reserves, national parks,
natural movements, nature conservation reserves or wild life sanctuaries, resource reserves, world
heritage sites. IUCN has recognized through its commission on national parks and protected areas
(CNPPA), 10 categories of conservation areas representing different levels of protection from
strict nature reserves to multiple use areas and varying degrees of local, regional and global
importance. Each category is designed to meet different objectives. However, it is considered that a
country may not need to develop all, as it has to reflect to its own objectives and constraints
(IUCN, 1984). Though there are some wilderness areas in Chittagong Hill Tracts, but there are no
records of conservation of these areas (Haque et al. 1997). However, there are 15 notified
protected areas in Bangladesh, size vary from 27 ha to 71, 502 ha. The total area of the notified
protected areas is 240,606 ha (Ghani, 1998). This is accomplished through maintenance of plants
and animals within their natural ecosystem. The noble way of doing is to declare a network of
protected areas that include the maximum number of threatened species and representative
areas of ecosystem types.
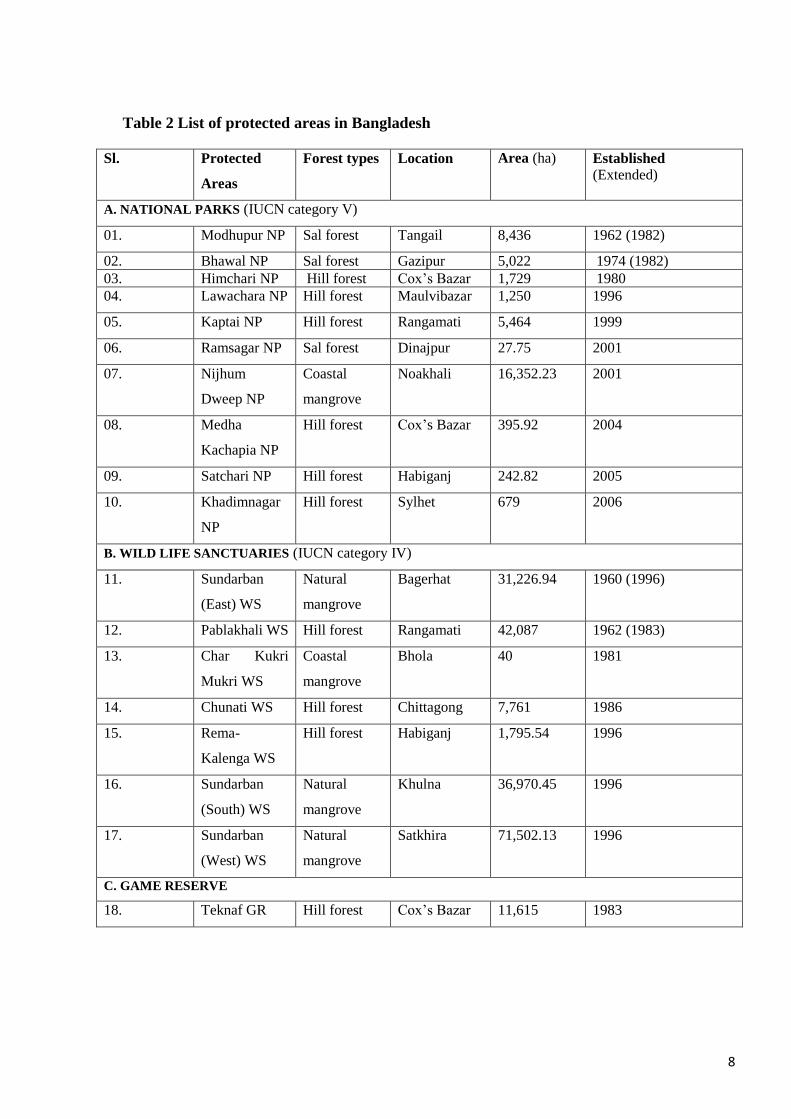
Three types of protected areas are defined in the Bangladesh Wildlife Preservation Act, 1974.
These are National park; Wildlife sanctuary and Game reserve (Table 2).
National park: A comparatively large area of outstanding scenic and natural beauty, in which the
protection of wildlife and preservation of the scenery, flora and fauna in their natural state is the
primary objective and to which the public may be allowed access for recreation, education and
research. Hunting, killing or capturing any wild animal within a national park or one mile (1.6 km)
of its boundaries, causing any disturbance (including firing of any gun) to any wild animal or its
breeding place, felling, tapping, burning or in any other way damaging any plant or tree,
cultivation, mining or breaking up any land, and polluting water flowing through a national park
are not allowed. Such prohibitions may be relaxed for scientific purposes, aesthetic enjoyment of
the scenery or any other exceptional reason. Construction of access roads, rest houses, hotels and
public amenities should be planned so as not to impair the primary objective of the establishment
of a national park.
8
Table 2 List of protected areas in Bangladesh
Sl. Protected
Areas
Forest types Location Area (ha) Established
(Extended)
A. NATIONAL PARKS (IUCN category V)
01. Modhupur NP Sal forest Tangail 8,436 1962 (1982)
02. Bhawal NP Sal forest Gazipur 5,022 1974 (1982) 03. Himchari NP Hill forest Cox’s Bazar 1,729 1980 04. Lawachara NP Hill forest Maulvibazar 1,250 1996
05. Kaptai NP Hill forest Rangamati 5,464 1999
06. Ramsagar NP Sal forest Dinajpur 27.75 2001
07. Nijhum
Dweep NP
Coastal
mangrove
Noakhali 16,352.23 2001
08. Medha
Kachapia NP
Hill forest Cox’s Bazar 395.92 2004
09. Satchari NP Hill forest Habiganj 242.82 2005
10. Khadimnagar
NP
Hill forest Sylhet 679 2006
B. WILD LIFE SANCTUARIES (IUCN category IV)
11. Sundarban
(East) WS
Natural
mangrove
Bagerhat 31,226.94 1960 (1996)
12. Pablakhali WS Hill forest Rangamati 42,087 1962 (1983)
13. Char Kukri
Mukri WS
Coastal
mangrove
Bhola 40 1981
14. Chunati WS Hill forest Chittagong 7,761 1986
15. Rema-
Kalenga WS
Hill forest Habiganj 1,795.54 1996
16. Sundarban
(South) WS
Natural
mangrove
Khulna 36,970.45 1996
17. Sundarban
(West) WS
Natural
mangrove
Satkhira 71,502.13 1996
C. GAME RESERVE
18. Teknaf GR Hill forest Cox’s Bazar 11,615 1983

9
Wildlife sanctuary: An area closed to hunting and maintained as an undisturbed breeding ground,
primarily for the protection of wildlife including all natural resources such as vegetation, soil and
water. Entry or residence, cultivation, damage to vegetation, killing or capturing wild animals
within one mile (1.6 km) of its boundary, introduction of exotic or domestic species of animals,
lighting of fires, and pollution of water are not allowed, but any of these prohibitions may be
relaxed for scientific reasons, or for the improvement or aesthetic enjoyment of the scenery.
Game reserves: An area in which the wildlife is protected to enable populations of important
species to increase. Capture of wild animals is prohibited. Hunting and shooting may be allowed
on a permit basis.
Presently, there are 18 notified protected areas (i.e., ten national parks, seven wildlife sanctuaries
and one game reserve) in Bangladesh (NSP, 2006). Compared to other regions of the world, this
figure is still very poor. The protected areas of Bangladesh cover nearly 1.7% of the total
landmass of the country. There are two Eco-parks in Bangladesh, one is Sitakund Botanical
Garden and Eco-park (1996 acres) and another one is Bangabandhu Eco-park (1500 acres).The
two eco-parks are belonged to the hill forests of the eastern part of the country.
2.3. 2 Ex-situ Conservation
There could be two approaches to this aspect; (I) Perpetuating sample species outside the natural
habitat i.e. in the botanical gardens, herbarium etc. (2) Genetic storage in germplasm bank. In
Bangladesh the responsibility of preservation of the germplasm belonging to the numerous crops
rest with the Agricultural and Forestry research organization (e.g. Bangladesh Forest Research
Institute, Bangladesh Tea Research Institute etc). Ex-situ conservation methods include any of
those practices that conserve genetic material outside the natural distribution of the parent
population and they may use reproductive material of individuals or stands located beyond the site
of the parent population. Ex-situ conservation is necessary because in-situ conservation may
sometimes fail due to intense pressure on land, weak legislation and implementation of
conservation regulation and a public opinion unaware of conservation needs. Various methods of
Ex-situ conservation (Rahman and Hossain, 2002) include the following:
Preservation plot: BFRI established one preservation plot of endangered tree species at
Hyankoo, Chittagong, which consist of seven species (Raktan, Bakul, Civit, Dakroom,
Kainjal, Pitraj and Boilam). Another conservation plot of ten endangered species (Pitraj,
Urium, Deshi gab, Baitta garjan, Agar, Guttguttya, Batna, Mahua, Dharmara and Narikeli) was
10
established at Chittagong Cantonment. One preservation plot of nine medicinal plant species
has been established at Chittagong.
Botanical gardens: In Mirpur Botanical garden, there are about 255 tree species, 310 shrubs,
385 herbs and in Baldah garden, there are about 18000 plants of tree, shrubs and herbs which
play a great role in conserving the biodiversity in Bangladesh. There are also some other
botanical gardens spreaded all over the country. Sitakund Botanical Garden and Eco-park is
one of them. There are about 156 tree species, 110 shrubs, 119 herbs and 27 climbers in this
botanical garden and eco-park area.
Arboretum: One bamboo arboretum has been established at BFRI Campus, which contains
collection of 27 bamboo species, including six exotic ones and another arboretum of medicinal
plants has been established which contains collection of 40 species including six exotic ones.
One cane arboretum of seven species has also been established at BFRI.
Seed storage: It refers to storage of intact seeds in a controlled environment. Under controlled
temperature and moist conditions, stored seeds of some species remain viable for decades.
There is a National Forest Seed Centre (NFSC) at BFRI. But this centre does not have any
facilities for long time storage of seeds. Non-calcitrant seeds can be stored here for few years.
Pollen storage/gene banks: With modern freeze-drying technique, pollen of some species can
be stored at a very low moisture condition. For regeneration purposes, this technique requires
complementary female structures to enable use of the pollen in seed production. There is no
facility in Bangladesh for storage of pollen grains of forest species.
Tissue culture: The technique involves micro propagation (meristems, embryo or other). It
requires large investment, but if cryogenic storage is developed, it provides a secure
conservation method. BFRI has so far developed tissue culture techniques for six tree species
(Kanthal, Zakrandra, Teak, Hybrid acacia, Neem, Eucalyptus) and six bamboo species
(Bambusa bambos, B. arundinacea, Dendrocalamus brandisii, Melocanna baccifera, B.
vulgaris, B. nutans).
Cryogenic storage: It is the preservation of biological material suspended above or in liquid
nitrogen at temperature from - 1500C to – 196
0C. It has become used for many years as a
means of keeping animal semen for breeding purposes. This technology is relatively new to
seed storage. There is no cryogenic storage facility in Bangladesh for forest tree species.
11
2. 4 Participation and Involvement of Bangladesh in the International Political
Process
Bangladesh is signatory to a number of international political processes. These are
Convention on wetlands of international importance, especial water flow habit, 1971
(Ramsar Convention).
Convention concerning the protection of world cultural and natural heritage, 1972.
The Convention on International Trade in Endangered Species of Wild Fauna and Flora
(CITES).
Convention on Biological Diversity (CBD), 1992.
Montreal Protocol for Protection of Ozone Layer.
2. 5 Government’s Policies, Legislations and Major Initiatives for Bio-diversity
Conservation
There are several legislative polices and initiatives that provide provisions for regulating the use
and protection of plants and animals in the country. These are:
Bangladesh Wildlife (Preservation) (Amendment) Act, 1974.
Bangladesh Forest Act, 1878 and subsequent amendments.
Forest Policy and Forestry Sector Master Plan.
Protection and conservation of fish-Fish Act, 1950 and Fish Rules, 1985.
Environment Policy, 1992.
Bangladesh Environmental Conservation Act 1995 and Environment Conservation Rules,
1997.
Declaration of Ecologically Critical Areas (ECA).
National Conservation Strategy (NCS).
National Environment Management Action Plan (NEMAP).
Sustainable Environment Management Programme (SEMP).
Coastal and Wetland Biodiversity Management Project in Cox’s Bazar and Hakaluki haor
in Greater Sylhet.
In addition to the above, the Government has taken up the following projects concerning
biodiversity management. These are:
Madhupur National Park Development Project.
Botanical Garden and Eco-park at Sitakund, Chittagong
Coastal Greenbelt Project.
Establishment of Madhutila Eco-park and
Development of Bhawal National Park, Baldha Garden and Botanical Garden.
12
Chapter 3 MATERIALS AND METHODS
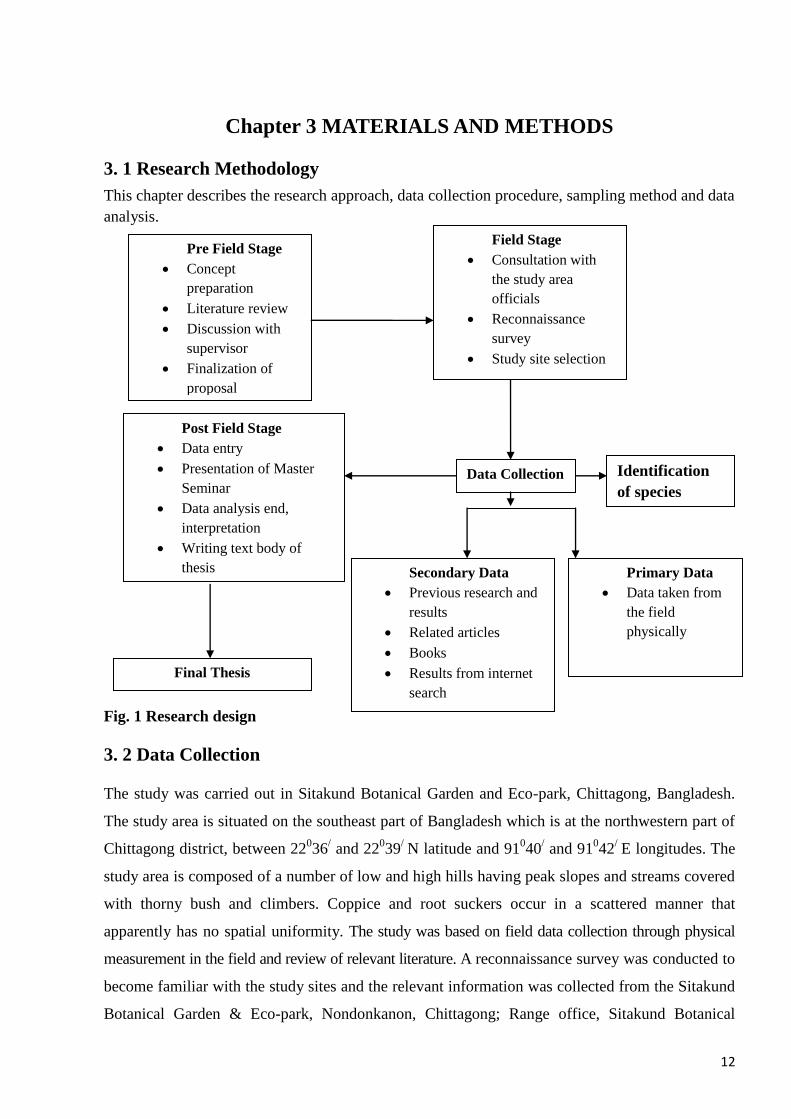
3. 1 Research Methodology
This chapter describes the research approach, data collection procedure, sampling method and data
analysis.
Fig. 1 Research design
3. 2 Data Collection
The study was carried out in Sitakund Botanical Garden and Eco-park, Chittagong, Bangladesh.
The study area is situated on the southeast part of Bangladesh which is at the northwestern part of
Chittagong district, between 22036
/ and 22
039
/ N latitude and 91
040
/ and 91
042
/ E longitudes. The
study area is composed of a number of low and high hills having peak slopes and streams covered
with thorny bush and climbers. Coppice and root suckers occur in a scattered manner that
apparently has no spatial uniformity. The study was based on field data collection through physical
measurement in the field and review of relevant literature. A reconnaissance survey was conducted to
become familiar with the study sites and the relevant information was collected from the Sitakund
Botanical Garden & Eco-park, Nondonkanon, Chittagong; Range office, Sitakund Botanical
Pre Field Stage
Concept
preparation
Literature review
Discussion with
supervisor
Finalization of
proposal
Field Stage
Consultation with
the study area
officials
Reconnaissance
survey
Study site selection
Data Collection
Post Field Stage
Data entry
Presentation of Master
Seminar
Data analysis end,
interpretation
Writing text body of
thesis Secondary Data
Previous research and
results
Related articles
Books
Results from internet
search
Primary Data
Data taken from
the field
physically
Final Thesis
Identification
of species
13
Garden & Eco-park; Bariordala Range office, Sitakund and Sitakund Beat Office. To have an idea
of species composition of the whole study area, a number of through field visit was conducted at the
onset of the field work (Fig. 1). The objective of the field visit was to get familiar with the vegetation
community and to get an idea about the various species in the study area.
3. 3 Identification of Species
The species were identified directly in the field. Local people working in the field and forest officials
also helped in identifying some species. Some species could not be referred to a given scientific name
and also family name that is why they had been identified by their local name.
3. 4 Instrument and Other Materials Used in the Study
To conduct the study, the following instruments were used for the collection of the necessary data.
Spiegel Relascope was used for height measurement with the help of forestry student of
the University of Chittagong.
Bamboo stick was used for height measurement in most of the cases.
Diameter tape was used for measurement of DBH.
Meter tape was used for distance measurement.
Wooden pegs were used for pointing out the plot area.
3. 5 Field Data Collection Procedures
In this study, the Sitakund Botanical Garden and Eco-park was classified in two zones on the basis
of human disturbances. (1) Disturbed zones (which are very close to the road), consisting with
exotic tree species and agricultural cultivation, mainly in the south eastern part of the area and (2)
Less disturbed zones (vally type which has inaccessibility and unavailability of tourist path)
consisting of naturally originated species, mainly in the north portion of the area. But there were
some plots taken from the areas very near to the stream considered as less disturbed zone. Tourists
visit this stream each year.
For the study, 20 circular plots of 314 m2 area have been established in the disturbed zone and 30
circular plots of same area in the less disturbed zone. All plots were taken along a transect, whereas
the start of the transect was chosen randomly. On each circular plot (10 m radius of each), square
plots (1 m *1 m , 2 m * 2 m and 4 m * 4 m) at 4 m distance from the center of the plot in both
sides were demarcated (Fig. 2). The distance between the centers of two circular plots was 100 m.
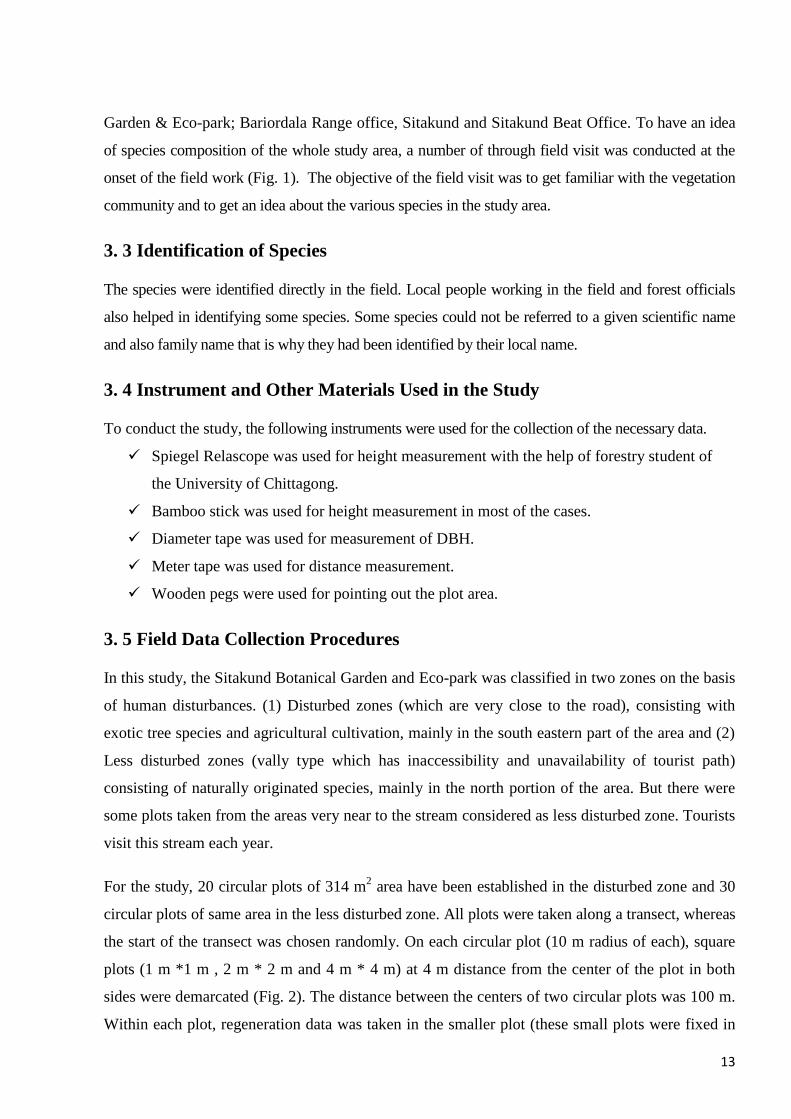
Within each plot, regeneration data was taken in the smaller plot (these small plots were fixed in
14
the field on the basis of abundance). In the small plot size 1 m * 1 m, regeneration of trees and
shrubs from height range (0 – 0.5) m was sampled. For plot size 2 m * 2 m, regeneration data was
sampled from height range (0.5 m - 2 m) and for plot size 4 m * 4 m, regeneration within height
range (> 2 m < 6 cm dbh) was recorded. Data for herb coverage percentage was taken from 4 m *
4 m in both sides of the plots. So total area for herb coverage percentage was 640 m2 and 960 m
2
in the disturbed and less disturbed zone respectively. On the whole plot (314 m2), trees (> 6 cm
dbh) were recorded including height and diameter measurement.
Fig. 2 Plot design for data collection of regeneration and tree species diversity
The intensity of disturbances was assessed according to the present impact. In the study area,
human disturbances were identified in different categories. There are different ways recorded for
developing disturbance indices are reported. Pandey and Shukla (2003) developed a disturbance
index on the ratio of the number of trees that have been cut and the total number of individuals
within a plot. Kumar and Ram (2005) considered mean canopy cover to estimate the human
disturbance level. In this study a disturbance index was calculated on the basis of the qualitative
assessment of the intensity of different disturbance elements observed in the field by following the
formula modified according to Rahman et al. (2009). Disturbances like logging, cutting of
regeneration, cutting of non wood products, bark peeling, litter collection, agro forestation, firing,
and tourism were assessed as present disturbances (Table 3).
1m*1m
2m*2m
4m*4m
Total Area:
314 m2
4m 4m
10m
15
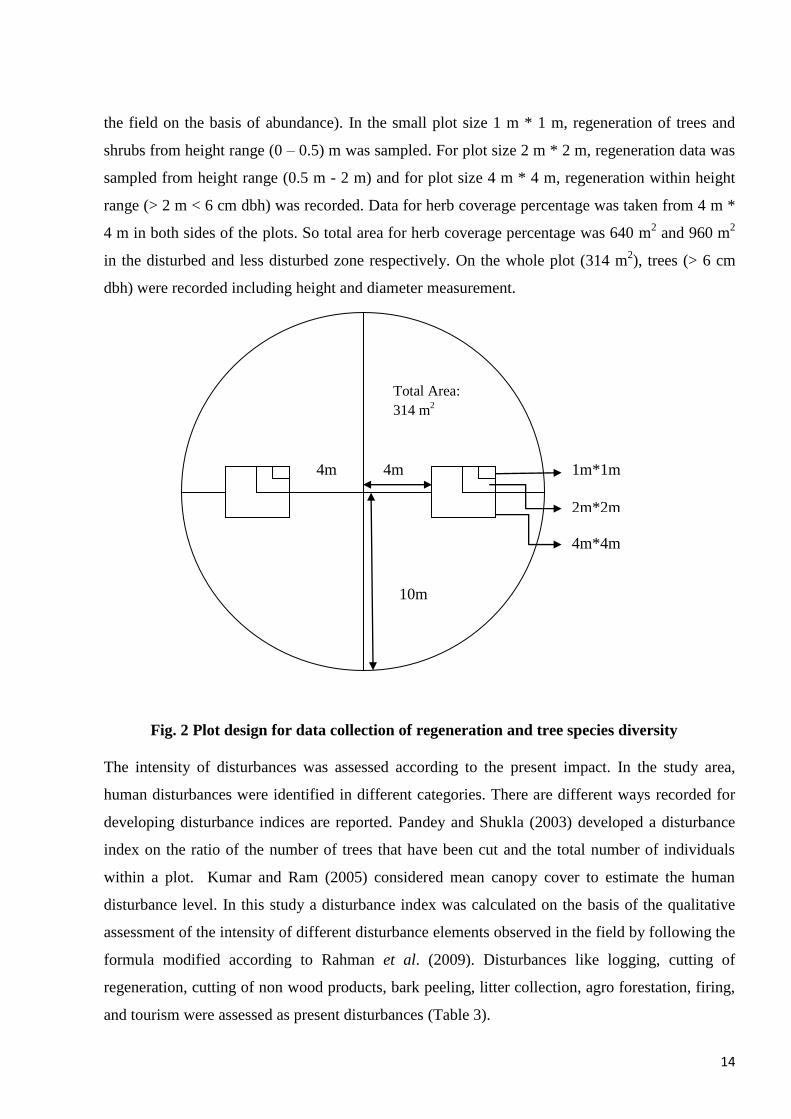
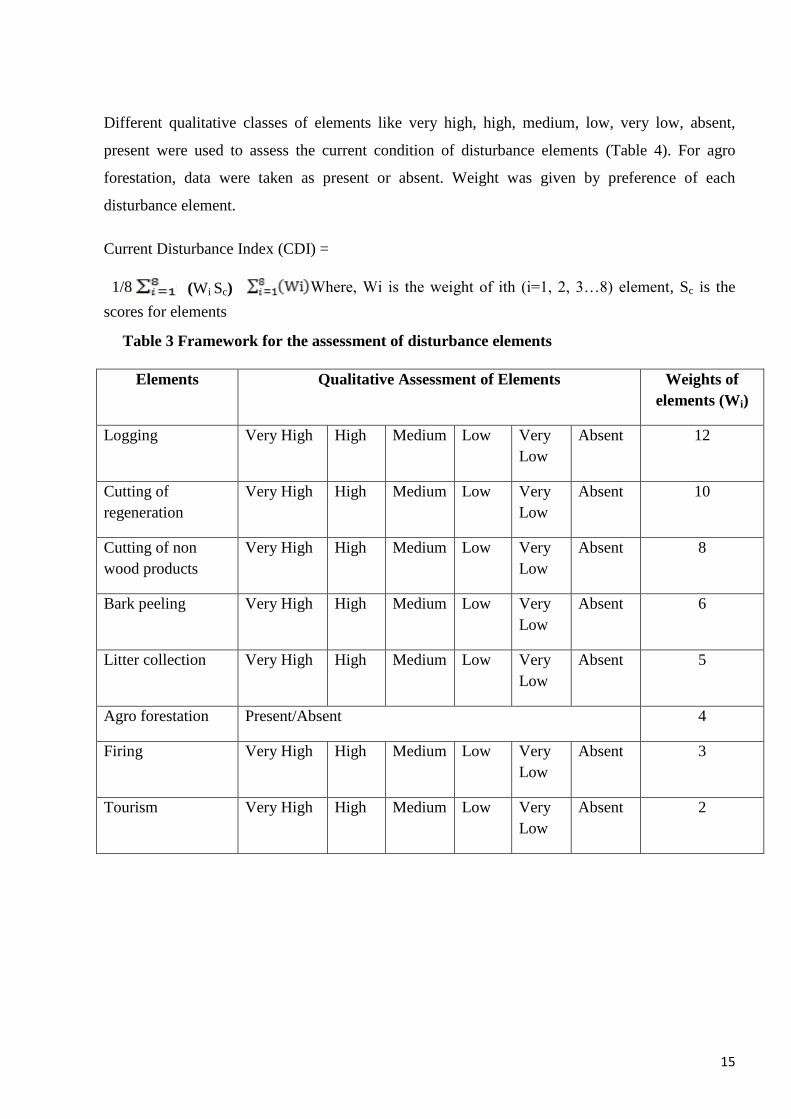
Different qualitative classes of elements like very high, high, medium, low, very low, absent,
present were used to assess the current condition of disturbance elements (Table 4). For agro
forestation, data were taken as present or absent. Weight was given by preference of each
disturbance element.
Current Disturbance Index (CDI) =
1/8
Where, Wi is the weight of ith (i=1, 2, 3…8) element, Sc is the
scores for elements
Table 3 Framework for the assessment of disturbance elements
Elements Qualitative Assessment of Elements Weights of
elements (Wi)
Logging Very High High Medium Low Very
Low
Absent 12
Cutting of
regeneration
Very High High Medium Low Very
Low
Absent 10
Cutting of non
wood products
Very High High Medium Low Very
Low
Absent 8
Bark peeling Very High High Medium Low Very
Low
Absent 6
Litter collection Very High High Medium Low Very
Low
Absent 5
Agro forestation Present/Absent 4
Firing Very High High Medium Low Very
Low
Absent 3
Tourism Very High High Medium Low Very
Low
Absent 2
(Wi Sc)
16
Table 4 Scores for the qualitative classes of disturbance elements
Classes of qualitative assessment (QC) Scores (Sc)
Absent 0
Present 10
Very low 20
Low 40
Medium 60
High 80
Very High 100
QC: Classes of qualitative assessment, Sc: Scores for elements
The relative values of frequency, density (N/ha) and basal area (m2/ha) for each single tree species
were used to calculate the Importance Value Index (IVI) according to Phillips (1959) and Curtis
(1959):
IVI= Relative Frequency + Relative Density + Relative Basal Area
The Shanon-Winner index for diversity (Michael, 1990):
H = - pipi ln
Where,
H = Index of species diversity
Pi = No. of individual of one species / Total no. of individuals of all species (ni/N)
Evenness was calculated by Pielou’s index from the formula given by (Magurran, 1988):
E = H / In S
Where,
E = Species evenness index
H = Shanon-Winner index of diversity
S = Total no.of species
Simpson’s index (Simpson, 1949) measured the concentration of dominance (CD):
17
CD =
s
i
ip1
)( 2
Where, CD = Index of dominance, pi = It is the same as for Shannon-Wiener Information function
.Value of CD ranges from 0 - 5. With this index, 0 represents high diversity and 1, low diversity.
That is, the bigger the value of CD, the lower the diversity.
Species area curve was drawn from the total number of plant species found at different plots. Data
were compiled and processed with the help of MS Excel Programme and then analyzed by one
way ANOVA to find out significant differences in case of species richness, density (N/ha) and
Disturbance Index (DI) between two zones. Spearman’s and Pearson’s correlation were used to
find out the relation between disturbance index with density (N/ha) and basal area (m2/ha) and
species richness. In case of basal area (m2/ha), Spearman’s correlation was performed as the data
were not normally distributed and in case of normally distributed data, Pearson’s correlation was
used. Data were summarized using tabled charts and graphs. All statistical analysis was done by
using the SPSS package (version 16.0, 2007).
3. 6 Study Area
3.6. 1 Location, Area and Boundary
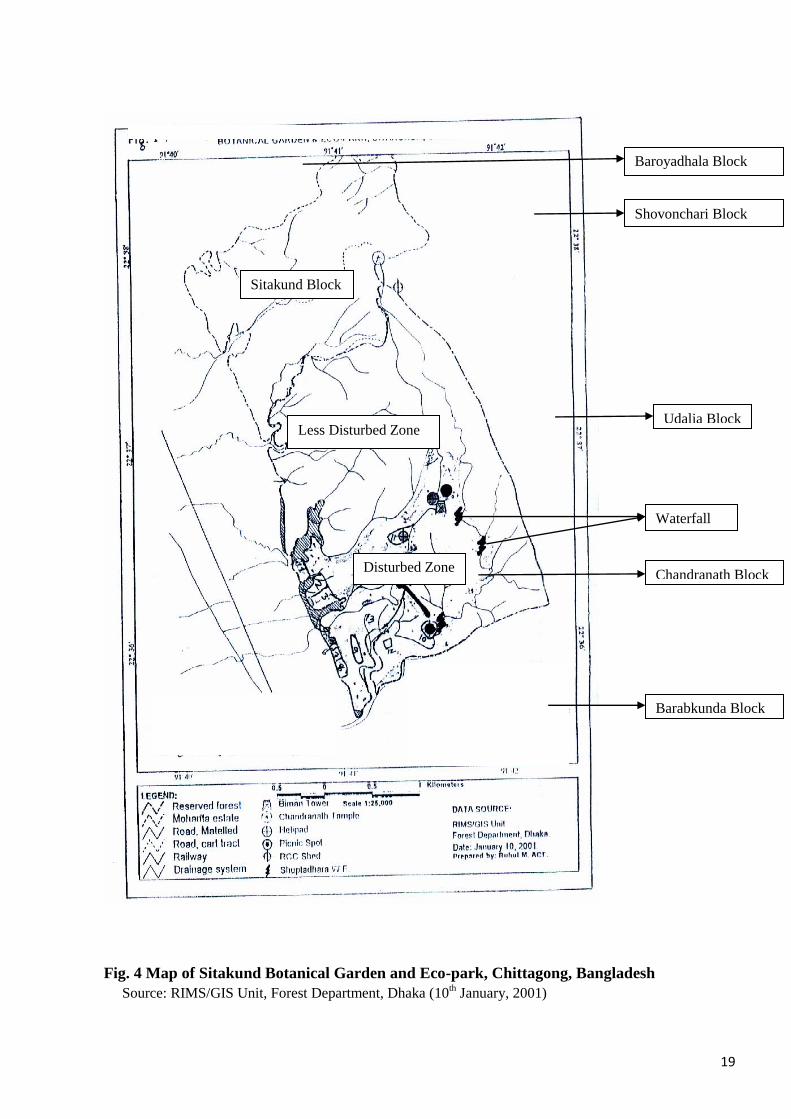
Fig.3 represents Sitakund Botanical Garden and Eco-park location. It is under Sitakund Upazila of
Chittagong District. It comprises Chandranath Reserve Forest under the jurisdiction of Chittagong
Forest Division. It lies between 22036
/ and 22
039
/ N latitude and 91
040
/ and 91
042
/ E longitude. It
is about 35 km north to Chittagong city, 3 km far away from Sitakund Upazila head quarter and
about one kilometer east to the Dhaka-Chittagong high way. Numbers of hills cover the area and
the hills are elevated gradually from the south to the north and from west to the east. Three
waterfalls at different elevations, almost perennial have enhanced beauties and touring values of
the areas. The Botanical Garden and Eco-park comprises an area of about 800 ha (1996 acres).
The Garden covers an area of 1000 acres (405 ha) and rest of the area (996 acres or 403.38 ha) is
under the Eco-park. As shown in the attached map (Fig. 4), the Botanical Garden and Eco-park is
generally surrounded by the different forest blocks like Barabkunda, Baroyadhala, Shovonchari
and Udalia forest blocks.

18
Location of Study Area
Fig. 3 Map of Bangladesh and Location of study area
Source: http://images.google.com/imgres & http://mychittagong.net (2nd
June, 2009)
19
Fig. 4 Map of Sitakund Botanical Garden and Eco-park, Chittagong, Bangladesh
Source: RIMS/GIS Unit, Forest Department, Dhaka (10th January, 2001)
Less Disturbed Zone
Disturbed Zone
Sitakund Block
Baroyadhala Block
Shovonchari Block
Udalia Block
Waterfall
Chandranath Block
Barabkunda Block

20
3.6. 2 Climate and Site Information
The area lies under the tropical climate zone. It is located in the east of the Bay of Bengal, 6-7 km
from the coast that helps to get heavy rain as the winds of the southwest monsoon blow in this
direction. The mean annual temperature in the area is 26.60
C. Average temperature in the area is
27.450
C. Maximum high temperature is during the month of May. Normal rainfall occurs during
the month of May to September for five months. Maximum rainfall is in the month of July and the
amount is 689.2 mm (average).
The soils of Sitakund hill are developed on Tertiary hill sediments of Tipam-Surma Series. These
are well structured, brown, acidic, loamy soils resting on hard rocks within 100 cm depth. Soils in
the high hills are loamy to clayey particularly towards the south and the west. Apparently these
soils do not show any mineral deficiency or toxicity that may limit tree growth. Soils of the high
hills are extremely drained. Because of the steepness of the slopes, they show some degrees of
erodibility.
The main limiting factor for tree growth of soils developed on consolidated Tertiary hill sediments
is surprisingly the soil moisture. Despite the favorable monsoon climate, moisture stress over a
period of 100 days or more in this steep denuded hill soils is evident.
The forests that once occurred on the hills have been largely destroyed. The depletion of forests
has decreased soil fertility by accelerated soil erosion, reducing water yield by increased run-off,
compaction of the top soil and presence of drought pan nearer the surface.
Peak elevation about 407 m is reached east to Sitakund Bazar near the temple. The hills are
elevated from the south and west towards the east and north. The landscape has a broken
topography comprising of very steep hills and V-shaped valleys. The degrees of slopes range from
40-90 degrees. The valleys serve as drainage channels. There are some broad valleys dissecting
the low hills.
Therefore land use planning in the high hills has to take into account (1) steep slope of the terrain
(> 30% slope), (2) shallow depths of soil, (3) serve seasonal doughtiness (January - May), (4)
large access of seasonal rainfall (July - October) and (5) difficult and poor accessibility of the
landscape.
21
3.6. 3 Vegetation
Flora
Sitakund was one of the richest areas of biodiversity in Chittagong in the past. Semi evergreen
forests comprising many evergreen and deciduous species covered once Sitakund hills. The hilly
forest of Sitakund is part of the flora of Chittagong which is floristically and geographically more
related to Indo-China than any other part of Indian sub continent (Khan, 1991a). More than two
century back Francis Buchanan (later on Buchanan-Hamilton) noted the abundance of timber trees
like Jarul (Lagerstroemia speciosa),Telsur (Hopea odorata), Surusbed (Cedrela toona),Arsol
(Vitex spp.),Kalibole (Cordia spp.),Chickrassy (Chickrassia tabularis) (Van Schendel,1992).
Hooker and Tomson had made a number of botanical collections from Sitakund during their visit
to Chittagong in 1851 and recorded many species in the Flora of British India (1872-1892) (Khan,
1991b).
In 2004 the plant species and also the ornamental species including rose garden at Botanical
garden & Eco-park, Sitakund, Chittagong were recorded. This survey was done by only one
Botanist named Md.Shamsul Haque in that particular period. He did extremely laborious job for
collecting the existing plant species including ornamental species at eco-park. According to the
survey 96 plant families were found, with a total of 291 genus and species 412 in total .Total tree
were found 156 including 110 shrubs, 119 herbs and 27 climbers. Addition to that he found and
collected a total list of roses in the garden which comprises 42 numbers in total (Haque, 2004).
Fauna
Once the evergreen forests of Sitakund comprised the typical representative fauna of Chittagong.
There is no documented report on the fauna of the Garden and Park area. Faizuddin (1981)
reported capped languor (Presbytis pileatus), barking deer (Munticus muntijak), Rhesus monkey
(Macaca mullata), Wild boar (Sus scrofa) from Karerhat which is a continuation of Sitakund hill
range. Once there occurred Tiger (Panthera tigris), Leopard (Panthera pardus), Asiatic elephant
(Elephus maximus), Sambar (Cervus unicolor), Gaur (Bos gaurus), Slow Loris (Nycticebus
coucang), Rhesus monkey (Macaca mullata), Capped monkey (Presbytis pileatus), Gibbon
(Hylobetes hooloock), Malayan Sun Bear (Helarectos malayana) and species of bird, Reptiles and
Amphibians. There has been a great depletion of population density and species composition of
wildlife mammals, birds, reptiles and amphibians. Some of the animals occurring currently in the
garden and park area are jungle cat, large civet, rhesus monkey, common mongoose, fox, jackal
and black rabbit, barking deer, common otter, lizard (Aranus bengalensis) wild boar and a number
22
of birds (FD, 2001a) . Same observation was done by Haque (2004) on animals and birds and he
reported animals in total 13 comprising Ban-biral, Baghdasha, Honuman, Banor and Beji.
Additionally he found very popular birds in the eco-park area like Tia, Chil, Bhutum Pay-cha and
Monyna.
3.6. 4 Land Use Characteristics at Botanical Garden and Eco-park
At present the study area is under the management of the Botanical Garden and Eco-park.
Previously it was under Sitakund Beat of Bariadhala Range under Chittagong Forest Division.
Still 1999 there were plantations of short rotation species, mainly Eucalyptus spp., and Acacia
auriculiformis. In early 1990s, Bangladesh Forest Research Institute had implemented
experimental plantations of Eucalyptus and Acacia auriculiformis. Now there exist few patches of
Acacia auriculiformis and coppices of Eucalyptus. Most of the plantations either failed because of
difficult site conditions or human interferences. Now scrub forests comprising of shrubs, grasses,
degenerating muli bamboo culms and herbs cover the area. Due to recent protection measures,
saplings of different indigenous species are coming from root suckers.
People living in the vicinity of Sitakund hill and surrounding areas exploit woody plants for fuel
wood, support sticks (gils) for country beans and betel leaves and other domestic purposes. Shrubs
are hardly 2 m tall that indicate heavy exploitation. There are patches of sun grass though out the
area. People collect sun grass during the months of November – March and burn the area after
harvest to enhance new growth. This practice however degrades the soil. This is the tradition of
the local people surrounding the eco-park. They have been practicing since long. As a result, only
the fire tolerant species are surviving without any kind of disturbances in these areas. Except fire
tolerant species, other species are declining day by day. These kind of practices of the local people
are the most important threats for biodiversity conservation in the eco-park.
Local people have also cultivated fruit trees like jackfruit, mango, guava, lemon, other fruit tree
orchards in moderately hill slopes. They grow different green vegetables particularly the cucurbits
along with fruits also. When there is scarcity of fodder in the plain fields, people collect fodder
from the hills. Local people collect other NTFPs from the hills also. The stream coming down
from the hills feed the plain agricultural fields at the down.
A paved road from Dhaka-Chittagong highway enters the area from the south-west. It passes to
the north across the area and leads to the temple. It roughly divides the area into two halves.

23
Another road enters the area at the southeast border and leads to further east along the south
border.
A helicopter pad and a radio transmission tower of Bangladesh Air Force are situated at about
middle of the area by the side of the road to the temple. A deep tube well with residences of staff
under Barabkunda Chemical Complex lies in the southern border of the area. At southwest corner
and hundred meters north from the main gate along the western border there are two shrines of
two saints namely Yasin Shah and Gafur Shah respectively. There are two sheds inside the area.
One green house also is being constructed inside the garden area.
Seepage water drains in the form of streams come towards the western side of the garden.
Drainage of seepage water at different levels from the north towards the south has made the
immense beauties of three waterfalls. At least two of them are almost perennial throughout the
year.
The old Hindu temple at the highest peak of Sitakund hills attracts large number of pilgrims once
a year of about three days in April; a few pilgrims visit the temple at other times of the year also.
Generally during the visit in April, the pilgrims climb the hill along the foot trails just adjacent to
the temple. Many of them get down along the paved road across the park and garden areas. Few
visitors visit the shrines of Yasin Shah and Gafur Shah throughout the year. These shrines have
connecting roads with the main highway. The paved road from the Dhaka-Chittagong Highway is
also used to attract a number of visitors for visiting the temple and for sightseeing. Recently with
the inauguration of the Botanical Garden and Eco-park, numbers of visitors per year have
increased. Every day people of different age groups are coming to the park for visits.
24
Chapter 4 RESULTS
4. 1 Current Situation of Disturbances
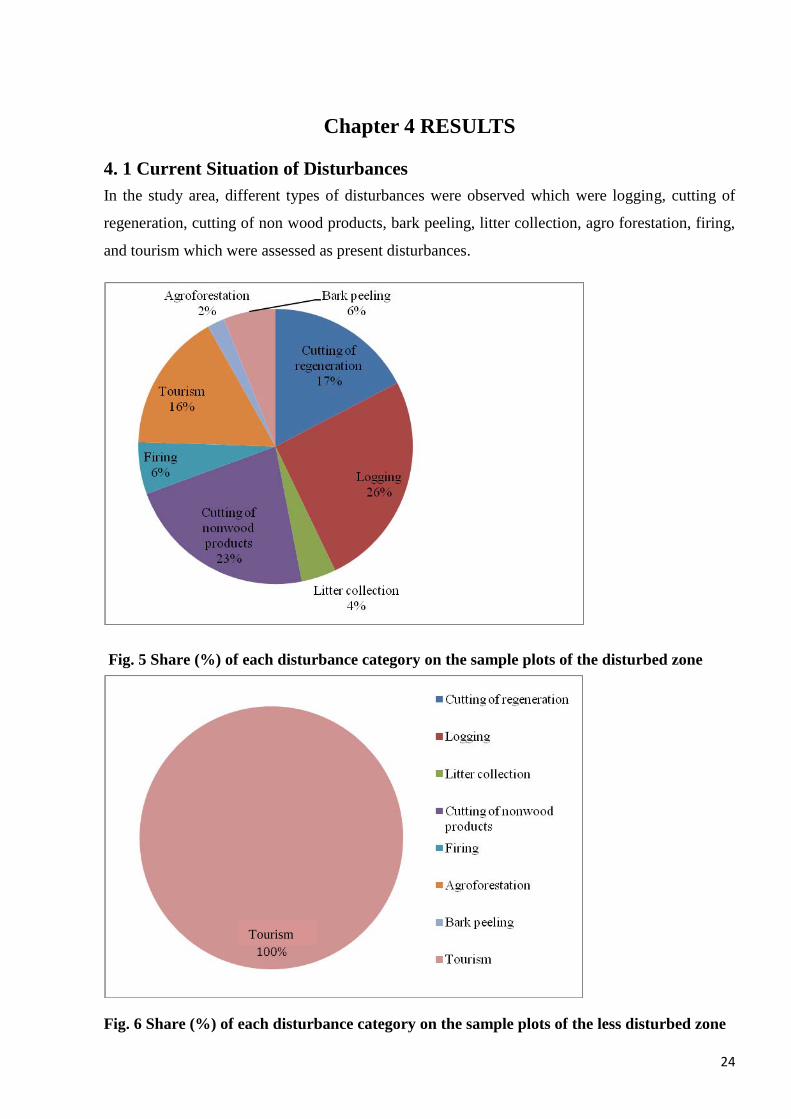
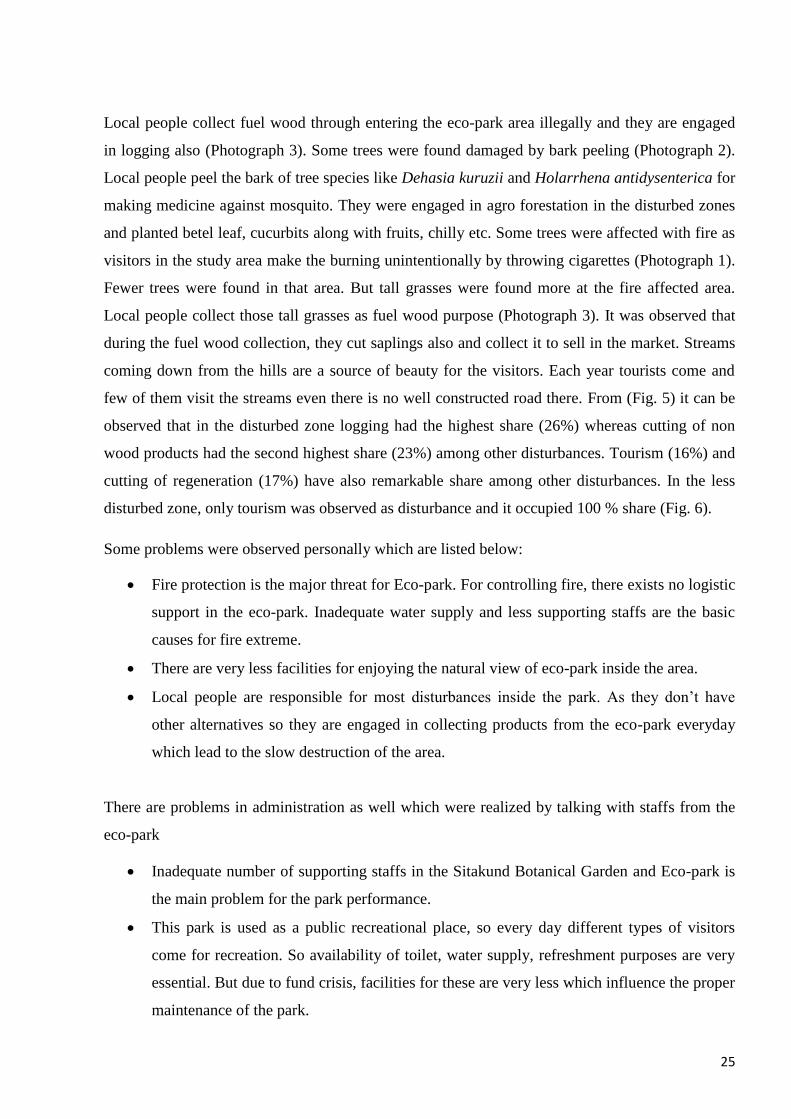
In the study area, different types of disturbances were observed which were logging, cutting of
regeneration, cutting of non wood products, bark peeling, litter collection, agro forestation, firing,
and tourism which were assessed as present disturbances.
Fig. 5 Share (%) of each disturbance category on the sample plots of the disturbed zone
Fig. 6 Share (%) of each disturbance category on the sample plots of the less disturbed zone
Tourism
25
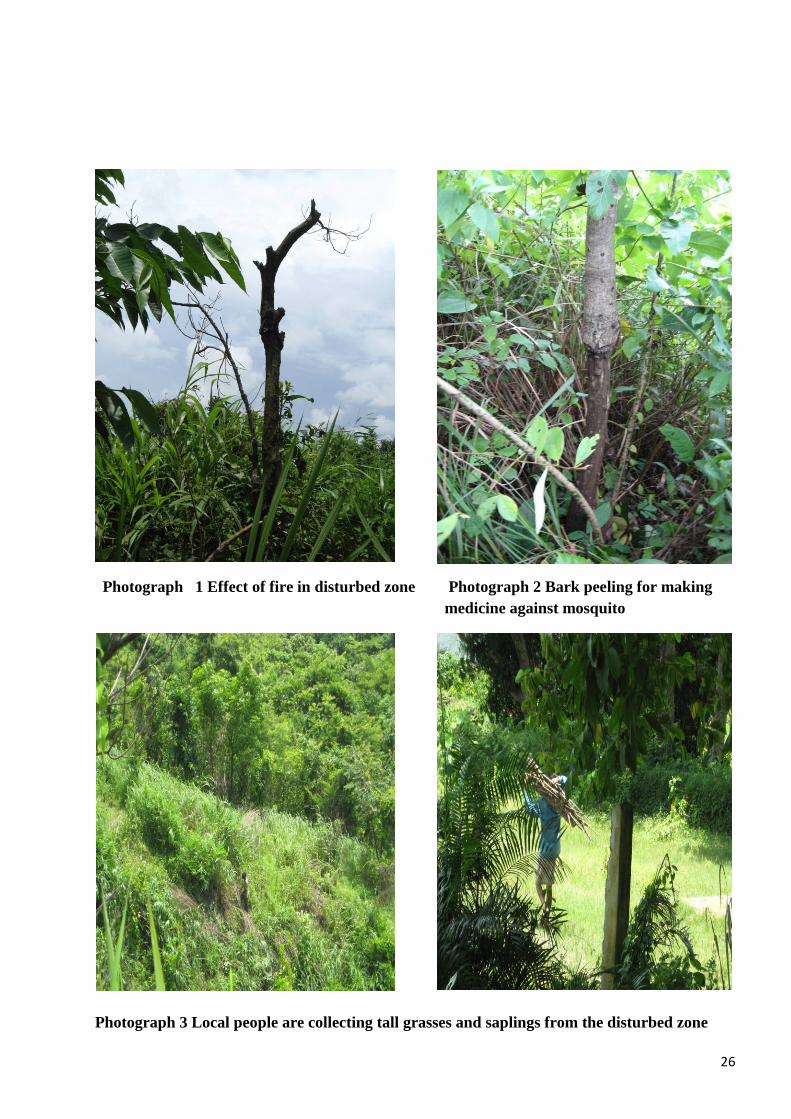
Local people collect fuel wood through entering the eco-park area illegally and they are engaged
in logging also (Photograph 3). Some trees were found damaged by bark peeling (Photograph 2).
Local people peel the bark of tree species like Dehasia kuruzii and Holarrhena antidysenterica for
making medicine against mosquito. They were engaged in agro forestation in the disturbed zones
and planted betel leaf, cucurbits along with fruits, chilly etc. Some trees were affected with fire as
visitors in the study area make the burning unintentionally by throwing cigarettes (Photograph 1).
Fewer trees were found in that area. But tall grasses were found more at the fire affected area.
Local people collect those tall grasses as fuel wood purpose (Photograph 3). It was observed that
during the fuel wood collection, they cut saplings also and collect it to sell in the market. Streams
coming down from the hills are a source of beauty for the visitors. Each year tourists come and
few of them visit the streams even there is no well constructed road there. From (Fig. 5) it can be
observed that in the disturbed zone logging had the highest share (26%) whereas cutting of non
wood products had the second highest share (23%) among other disturbances. Tourism (16%) and
cutting of regeneration (17%) have also remarkable share among other disturbances. In the less
disturbed zone, only tourism was observed as disturbance and it occupied 100 % share (Fig. 6).
Some problems were observed personally which are listed below:
Fire protection is the major threat for Eco-park. For controlling fire, there exists no logistic
support in the eco-park. Inadequate water supply and less supporting staffs are the basic
causes for fire extreme.
There are very less facilities for enjoying the natural view of eco-park inside the area.
Local people are responsible for most disturbances inside the park. As they don’t have
other alternatives so they are engaged in collecting products from the eco-park everyday
which lead to the slow destruction of the area.
There are problems in administration as well which were realized by talking with staffs from the
eco-park
Inadequate number of supporting staffs in the Sitakund Botanical Garden and Eco-park is
the main problem for the park performance.
This park is used as a public recreational place, so every day different types of visitors
come for recreation. So availability of toilet, water supply, refreshment purposes are very
essential. But due to fund crisis, facilities for these are very less which influence the proper
maintenance of the park.
26
Photograph 1 Effect of fire in disturbed zone
Photograph 3 Local people are collecting tall grasses and saplings from the disturbed zone
Photograph 2 Bark peeling for making
medicine against mosquito

27
Photograph 4 Present condition of the less disturbed zone
Photograph 5 Water stream passing through the less disturbed zone
28
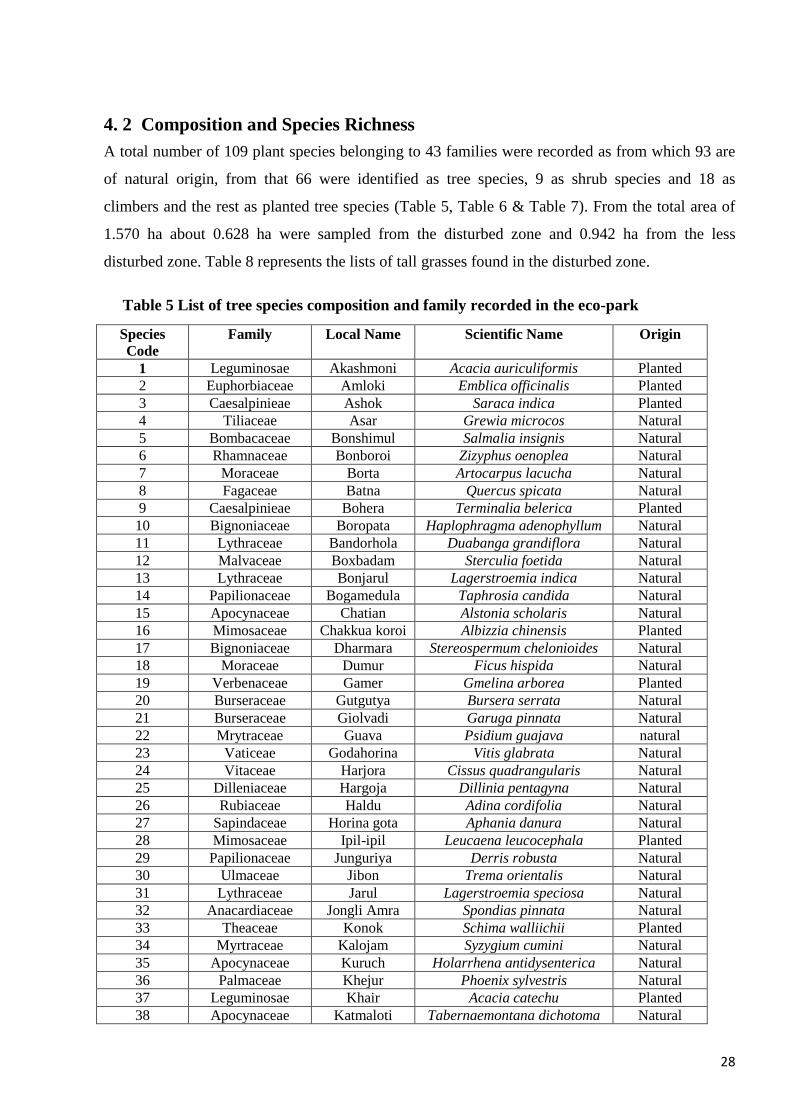
4. 2 Composition and Species Richness
A total number of 109 plant species belonging to 43 families were recorded as from which 93 are
of natural origin, from that 66 were identified as tree species, 9 as shrub species and 18 as
climbers and the rest as planted tree species (Table 5, Table 6 & Table 7). From the total area of
1.570 ha about 0.628 ha were sampled from the disturbed zone and 0.942 ha from the less
disturbed zone. Table 8 represents the lists of tall grasses found in the disturbed zone.
Table 5 List of tree species composition and family recorded in the eco-park
Species
Code
Family Local Name Scientific Name Origin
1 Leguminosae Akashmoni Acacia auriculiformis Planted
2 Euphorbiaceae Amloki Emblica officinalis Planted
3 Caesalpinieae Ashok Saraca indica Planted
4 Tiliaceae Asar Grewia microcos Natural
5 Bombacaceae Bonshimul Salmalia insignis Natural
6 Rhamnaceae Bonboroi Zizyphus oenoplea Natural
7 Moraceae Borta Artocarpus lacucha Natural
8 Fagaceae Batna Quercus spicata Natural
9 Caesalpinieae Bohera Terminalia belerica Planted
10 Bignoniaceae Boropata Haplophragma adenophyllum Natural
11 Lythraceae Bandorhola Duabanga grandiflora Natural
12 Malvaceae Boxbadam Sterculia foetida Natural
13 Lythraceae Bonjarul Lagerstroemia indica Natural
14 Papilionaceae Bogamedula Taphrosia candida Natural
15 Apocynaceae Chatian Alstonia scholaris Natural
16 Mimosaceae Chakkua koroi Albizzia chinensis Planted
17 Bignoniaceae Dharmara Stereospermum chelonioides Natural
18 Moraceae Dumur Ficus hispida Natural
19 Verbenaceae Gamer Gmelina arborea Planted
20 Burseraceae Gutgutya Bursera serrata Natural
21 Burseraceae Giolvadi Garuga pinnata Natural
22 Mrytraceae Guava Psidium guajava natural
23 Vaticeae Godahorina Vitis glabrata Natural
24 Vitaceae Harjora Cissus quadrangularis Natural
25 Dilleniaceae Hargoja Dillinia pentagyna Natural
26 Rubiaceae Haldu Adina cordifolia Natural
27 Sapindaceae Horina gota Aphania danura Natural
28 Mimosaceae Ipil-ipil Leucaena leucocephala Planted
29 Papilionaceae Junguriya Derris robusta Natural
30 Ulmaceae Jibon Trema orientalis Natural
31 Lythraceae Jarul Lagerstroemia speciosa Natural
32 Anacardiaceae Jongli Amra Spondias pinnata Natural
33 Theaceae Konok Schima walliichii Planted
34 Myrtraceae Kalojam Syzygium cumini Natural
35 Apocynaceae Kuruch Holarrhena antidysenterica Natural
36 Palmaceae Khejur Phoenix sylvestris Natural
37 Leguminosae Khair Acacia catechu Planted
38 Apocynaceae Katmaloti Tabernaemontana dichotoma Natural
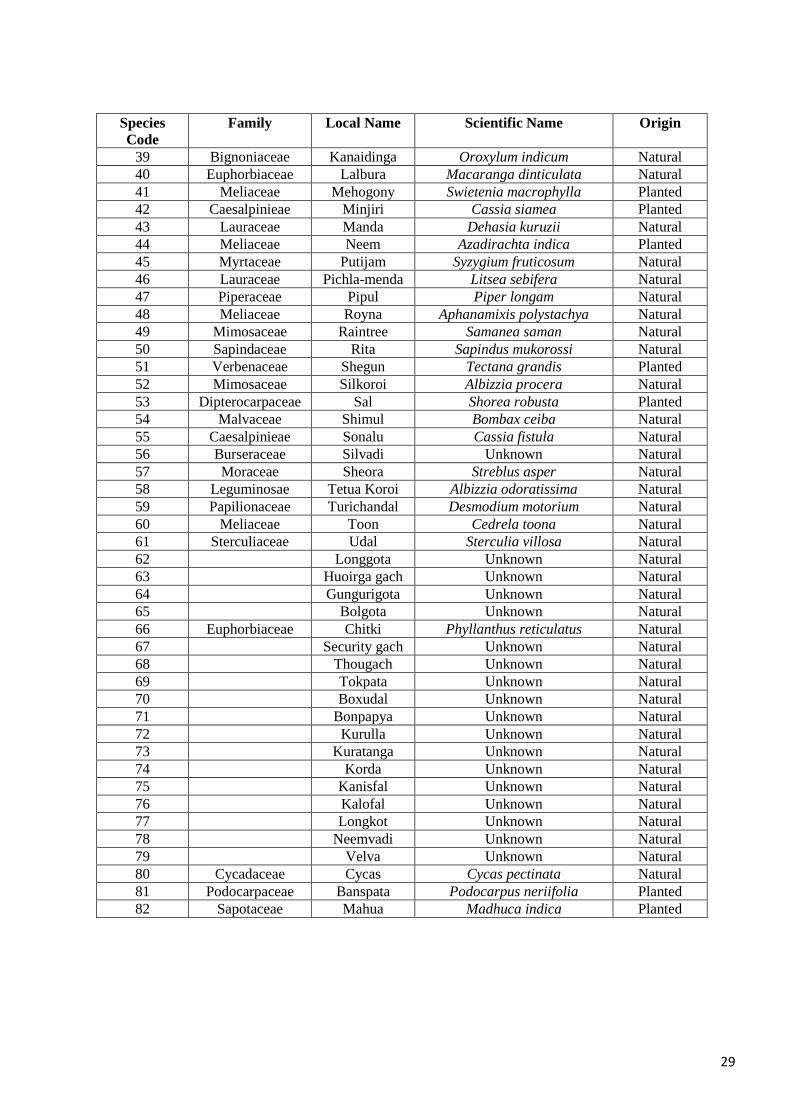
29
Species
Code
Family Local Name Scientific Name Origin
39 Bignoniaceae Kanaidinga Oroxylum indicum Natural
40 Euphorbiaceae Lalbura Macaranga dinticulata Natural
41 Meliaceae Mehogony Swietenia macrophylla Planted
42 Caesalpinieae Minjiri Cassia siamea Planted
43 Lauraceae Manda Dehasia kuruzii Natural
44 Meliaceae Neem Azadirachta indica Planted
45 Myrtaceae Putijam Syzygium fruticosum Natural
46 Lauraceae Pichla-menda Litsea sebifera Natural
47 Piperaceae Pipul Piper longam Natural
48 Meliaceae Royna Aphanamixis polystachya Natural
49 Mimosaceae Raintree Samanea saman Natural
50 Sapindaceae Rita Sapindus mukorossi Natural
51 Verbenaceae Shegun Tectana grandis Planted
52 Mimosaceae Silkoroi Albizzia procera Natural
53 Dipterocarpaceae Sal Shorea robusta Planted
54 Malvaceae Shimul Bombax ceiba Natural
55 Caesalpinieae Sonalu Cassia fistula Natural
56 Burseraceae Silvadi Unknown Natural
57 Moraceae Sheora Streblus asper Natural
58 Leguminosae Tetua Koroi Albizzia odoratissima Natural
59 Papilionaceae Turichandal Desmodium motorium Natural
60 Meliaceae Toon Cedrela toona Natural
61 Sterculiaceae Udal Sterculia villosa Natural
62 Longgota Unknown Natural
63 Huoirga gach Unknown Natural
64 Gungurigota Unknown Natural
65 Bolgota Unknown Natural
66 Euphorbiaceae Chitki Phyllanthus reticulatus Natural
67 Security gach Unknown Natural
68 Thougach Unknown Natural
69 Tokpata Unknown Natural
70 Boxudal Unknown Natural
71 Bonpapya Unknown Natural
72 Kurulla Unknown Natural
73 Kuratanga Unknown Natural
74 Korda Unknown Natural
75 Kanisfal Unknown Natural
76 Kalofal Unknown Natural
77 Longkot Unknown Natural
78 Neemvadi Unknown Natural
79 Velva Unknown Natural
80 Cycadaceae Cycas Cycas pectinata Natural
81 Podocarpaceae Banspata Podocarpus neriifolia Planted
82 Sapotaceae Mahua Madhuca indica Planted
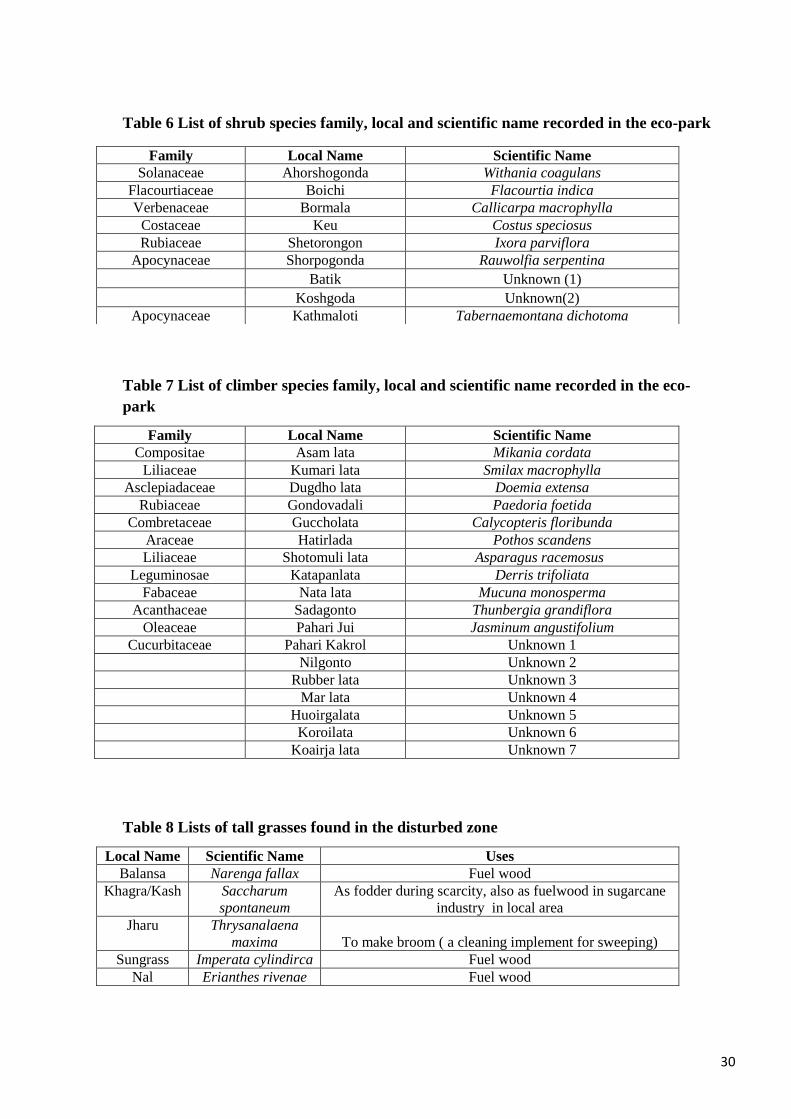
30
Table 6 List of shrub species family, local and scientific name recorded in the eco-park
Table 7 List of climber species family, local and scientific name recorded in the eco-
park
Family Local Name Scientific Name
Compositae Asam lata Mikania cordata Liliaceae Kumari lata Smilax macrophylla
Asclepiadaceae Dugdho lata Doemia extensa Rubiaceae Gondovadali Paedoria foetida
Combretaceae Guccholata Calycopteris floribunda Araceae Hatirlada Pothos scandens Liliaceae Shotomuli lata Asparagus racemosus
Leguminosae Katapanlata Derris trifoliata Fabaceae Nata lata Mucuna monosperma
Acanthaceae Sadagonto Thunbergia grandiflora Oleaceae Pahari Jui Jasminum angustifolium
Cucurbitaceae Pahari Kakrol Unknown 1
Nilgonto Unknown 2
Rubber lata Unknown 3
Mar lata Unknown 4
Huoirgalata Unknown 5
Koroilata Unknown 6
Koairja lata Unknown 7
Table 8 Lists of tall grasses found in the disturbed zone
Local Name Scientific Name Uses
Balansa Narenga fallax Fuel wood
Khagra/Kash Saccharum
spontaneum
As fodder during scarcity, also as fuelwood in sugarcane
industry in local area
Jharu Thrysanalaena
maxima To make broom ( a cleaning implement for sweeping)
Sungrass Imperata cylindirca Fuel wood
Nal Erianthes rivenae Fuel wood
Family Local Name Scientific Name
Solanaceae Ahorshogonda Withania coagulans Flacourtiaceae Boichi Flacourtia indica Verbenaceae Bormala Callicarpa macrophylla
Costaceae Keu Costus speciosus Rubiaceae Shetorongon Ixora parviflora
Apocynaceae Shorpogonda Rauwolfia serpentina
Batik Unknown (1)
Koshgoda Unknown(2) Apocynaceae Kathmaloti Tabernaemontana dichotoma

31
From the total number of tree and shrub species was 58 were in the height range (0 - 0.5) m, 50
in the height range (0.5 - 2 ) m, 42 in the range (> 2 m < 6 cm dbh) and 56 for trees (> 6 cm dbh)
in the less disturbed zone whereas in case of disturbed zone, it was 39 and 7 for the height range
(0 - 0.5) m, 39 and 6 for (0.5 - 2 ) m, 37 and 6 for (> 2 m < 6 cm dbh) and 47 for trees (> 6 cm
dbh) (Table 9). In case of disturbed zone, naturally regenerating plant species were less and there
were some planted tree species. Total number of climber species was 13 and 14 for the less
disturbed and disturbed zone respectively (Table 9). Within the height range (0 - 0.5 m), 33 tree
species and 7 shrub species were common to both zones whereas for the height range (0.5 - 2) m,
29 tree species and 6 shrub species were common. For height range (> 2 m < 6 cm dbh), 18 tree
species and 6 shrub species and for trees (> 6 cm dbh), 32 tree species were common to both zones
(Table 9). 9 climber species were common to both zones. Average herb coverage percentage was
40% in less disturbed zone and 67% in disturbed zone respectively.
Table 9 Species richness and overlapping of plant species and percentage coverage of
herb between two zones
Height Range of
Plants Species Richness Species Overlapping
Less Disturbed Disturbed Less Disturbed-
Disturbed
Tree Shrub Tree Shrub Tree Shrub
(0 - 0.5 ) m 50 8 39 7 33 7
(0.5 - 2 ) m 43 7 39 (35+4*) 6 29 6
(> 2 m < 6 cm dbh) 35 7 37 (24+13*) 6 18 6
Trees (> 6 cm dbh) 56 47 (32+15*) 32
Climbers 13 14 9
Herbs 40 67
* including exotic species
Table 10 ANOVA for the comparison of species richness between zones
Tree
Parameter
Height Range ANOVA
F P
Species
Richness
(0 - 0.5) m 8.25 0.006
(0.5 - 2) m 0.011 0.91
(>2 m < 6 cm dbh) 41.88 0.000
Trees (> 6 cm dbh) 55.90 0.000
From Table 10, it can be observed that both zones showed significant difference at p < 0.05 for
species richness at all ranges except (0.5 - 2) m. As the Levine’s test of homogeneity criteria
(equal variances assumed) for unequal sample sizes were fulfilled, it was possible to compare
species richness between zones with one way ANOVA.
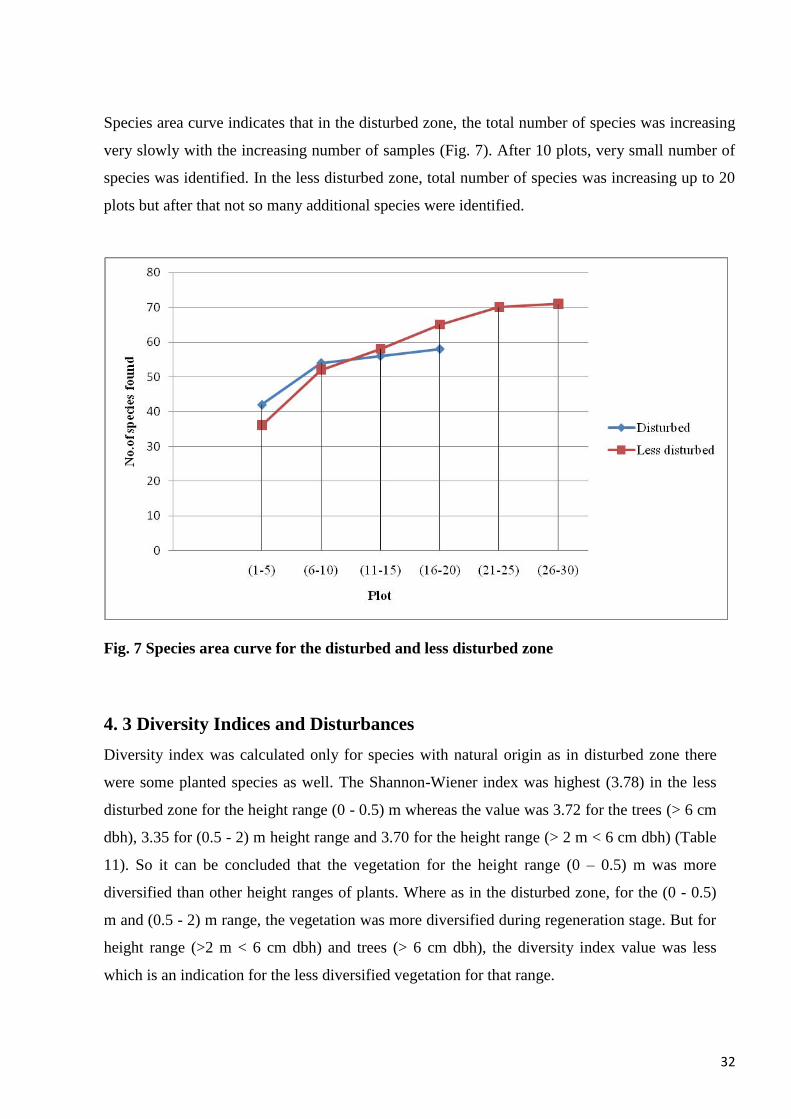
32
Species area curve indicates that in the disturbed zone, the total number of species was increasing
very slowly with the increasing number of samples (Fig. 7). After 10 plots, very small number of
species was identified. In the less disturbed zone, total number of species was increasing up to 20
plots but after that not so many additional species were identified.
Fig. 7 Species area curve for the disturbed and less disturbed zone
4. 3 Diversity Indices and Disturbances
Diversity index was calculated only for species with natural origin as in disturbed zone there
were some planted species as well. The Shannon-Wiener index was highest (3.78) in the less
disturbed zone for the height range (0 - 0.5) m whereas the value was 3.72 for the trees (> 6 cm
dbh), 3.35 for (0.5 - 2) m height range and 3.70 for the height range (> 2 m < 6 cm dbh) (Table
11). So it can be concluded that the vegetation for the height range (0 – 0.5) m was more
diversified than other height ranges of plants. Where as in the disturbed zone, for the (0 - 0.5)
m and (0.5 - 2) m range, the vegetation was more diversified during regeneration stage. But for
height range (>2 m < 6 cm dbh) and trees (> 6 cm dbh), the diversity index value was less
which is an indication for the less diversified vegetation for that range.
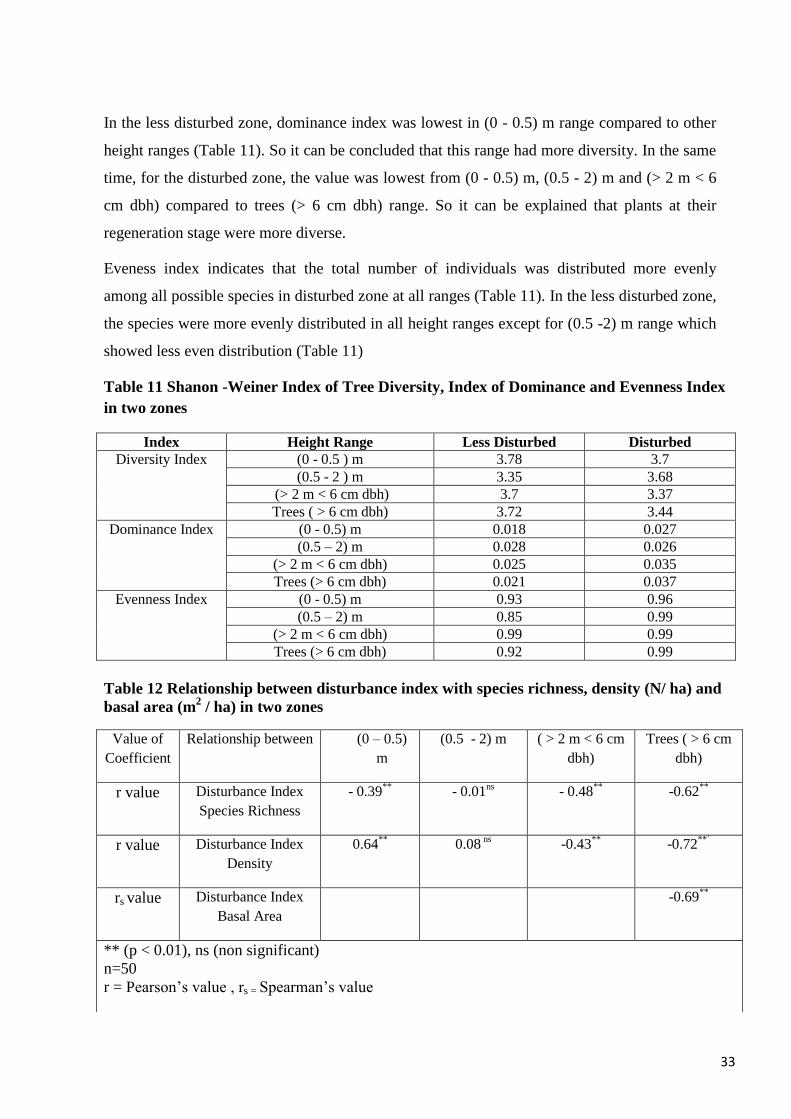
33
In the less disturbed zone, dominance index was lowest in (0 - 0.5) m range compared to other
height ranges (Table 11). So it can be concluded that this range had more diversity. In the same
time, for the disturbed zone, the value was lowest from (0 - 0.5) m, (0.5 - 2) m and (> 2 m < 6
cm dbh) compared to trees (> 6 cm dbh) range. So it can be explained that plants at their
regeneration stage were more diverse.
Eveness index indicates that the total number of individuals was distributed more evenly
among all possible species in disturbed zone at all ranges (Table 11). In the less disturbed zone,
the species were more evenly distributed in all height ranges except for (0.5 -2) m range which
showed less even distribution (Table 11)
Table 11 Shanon -Weiner Index of Tree Diversity, Index of Dominance and Evenness Index
in two zones
Index Height Range Less Disturbed Disturbed
Diversity Index (0 - 0.5 ) m 3.78 3.7
(0.5 - 2 ) m 3.35 3.68
(> 2 m < 6 cm dbh) 3.7 3.37
Trees ( > 6 cm dbh) 3.72 3.44
Dominance Index (0 - 0.5) m 0.018 0.027
(0.5 – 2) m 0.028 0.026
(> 2 m < 6 cm dbh) 0.025 0.035
Trees (> 6 cm dbh) 0.021 0.037
Evenness Index (0 - 0.5) m 0.93 0.96
(0.5 – 2) m 0.85 0.99
(> 2 m < 6 cm dbh) 0.99 0.99
Trees (> 6 cm dbh) 0.92 0.99
Table 12 Relationship between disturbance index with species richness, density (N/ ha) and
basal area (m2 / ha) in two zones
Value of
Coefficient
Relationship between (0 – 0.5)
m
(0.5 - 2) m ( > 2 m < 6 cm
dbh)
Trees ( > 6 cm
dbh)
r value Disturbance Index
Species Richness
- 0.39**
- 0.01ns
- 0.48**
-0.62**
r value Disturbance Index
Density
0.64**
0.08 ns
-0.43** -0.72
**´
rs value Disturbance Index
Basal Area
-0.69**
** (p < 0.01), ns (non significant)
n=50
r = Pearson’s value , rs = Spearman’s value
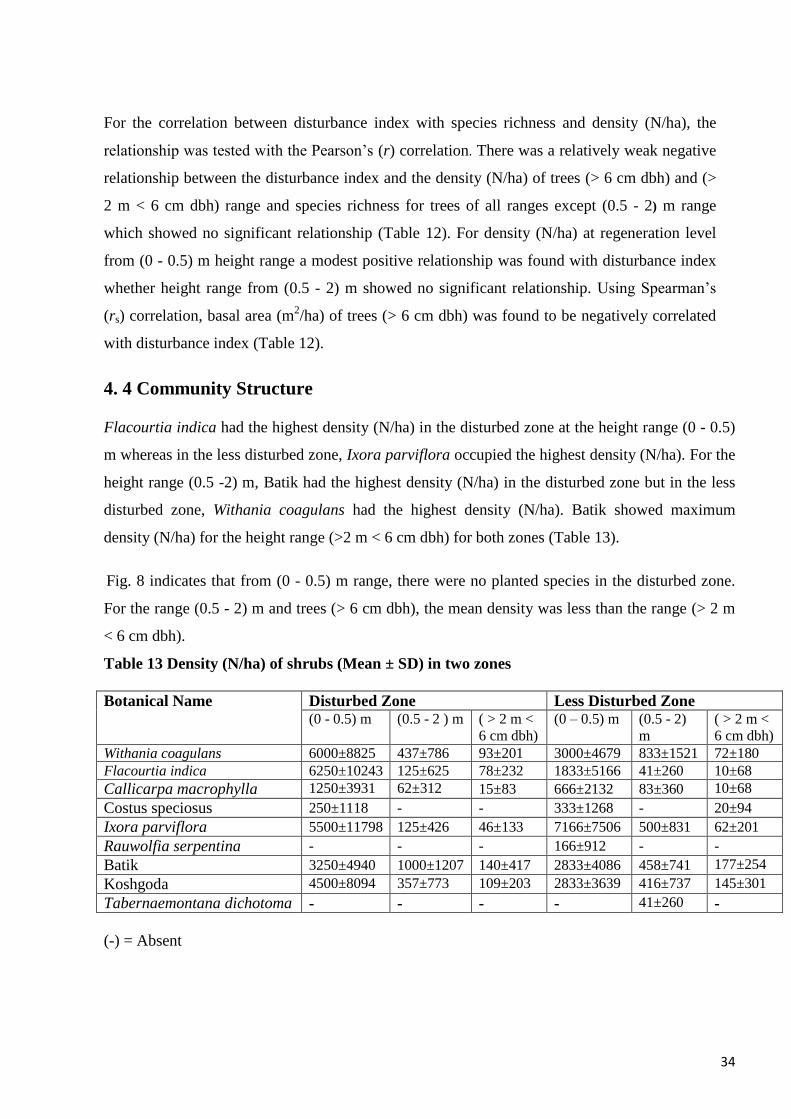
34
For the correlation between disturbance index with species richness and density (N/ha), the
relationship was tested with the Pearson’s (r) correlation. There was a relatively weak negative
relationship between the disturbance index and the density (N/ha) of trees (> 6 cm dbh) and (>
2 m < 6 cm dbh) range and species richness for trees of all ranges except (0.5 - 2) m range
which showed no significant relationship (Table 12). For density (N/ha) at regeneration level
from (0 - 0.5) m height range a modest positive relationship was found with disturbance index
whether height range from (0.5 - 2) m showed no significant relationship. Using Spearman’s
(rs) correlation, basal area (m2/ha) of trees (> 6 cm dbh) was found to be negatively correlated
with disturbance index (Table 12).
4. 4 Community Structure
Flacourtia indica had the highest density (N/ha) in the disturbed zone at the height range (0 - 0.5)
m whereas in the less disturbed zone, Ixora parviflora occupied the highest density (N/ha). For the
height range (0.5 -2) m, Batik had the highest density (N/ha) in the disturbed zone but in the less
disturbed zone, Withania coagulans had the highest density (N/ha). Batik showed maximum
density (N/ha) for the height range (>2 m < 6 cm dbh) for both zones (Table 13).
Fig. 8 indicates that from (0 - 0.5) m range, there were no planted species in the disturbed zone.
For the range (0.5 - 2) m and trees (> 6 cm dbh), the mean density was less than the range (> 2 m
< 6 cm dbh).
Table 13 Density (N/ha) of shrubs (Mean ± SD) in two zones
Botanical Name Disturbed Zone Less Disturbed Zone (0 - 0.5) m (0.5 - 2 ) m ( > 2 m <
6 cm dbh) (0 – 0.5) m (0.5 - 2)
m
( > 2 m <
6 cm dbh)
Withania coagulans 6000±8825 437±786 93±201 3000±4679 833±1521 72±180
Flacourtia indica 6250±10243 125±625 78±232 1833±5166 41±260 10±68
Callicarpa macrophylla 1250±3931 62±312 15±83 666±2132 83±360 10±68
Costus speciosus 250±1118 - - 333±1268 - 20±94
Ixora parviflora 5500±11798 125±426 46±133 7166±7506 500±831 62±201
Rauwolfia serpentina - - - 166±912 - -
Batik 3250±4940 1000±1207 140±417 2833±4086 458±741 177±254
Koshgoda 4500±8094 357±773 109±203 2833±3639 416±737 145±301
Tabernaemontana dichotoma - - - - 41±260 -
(-) = Absent
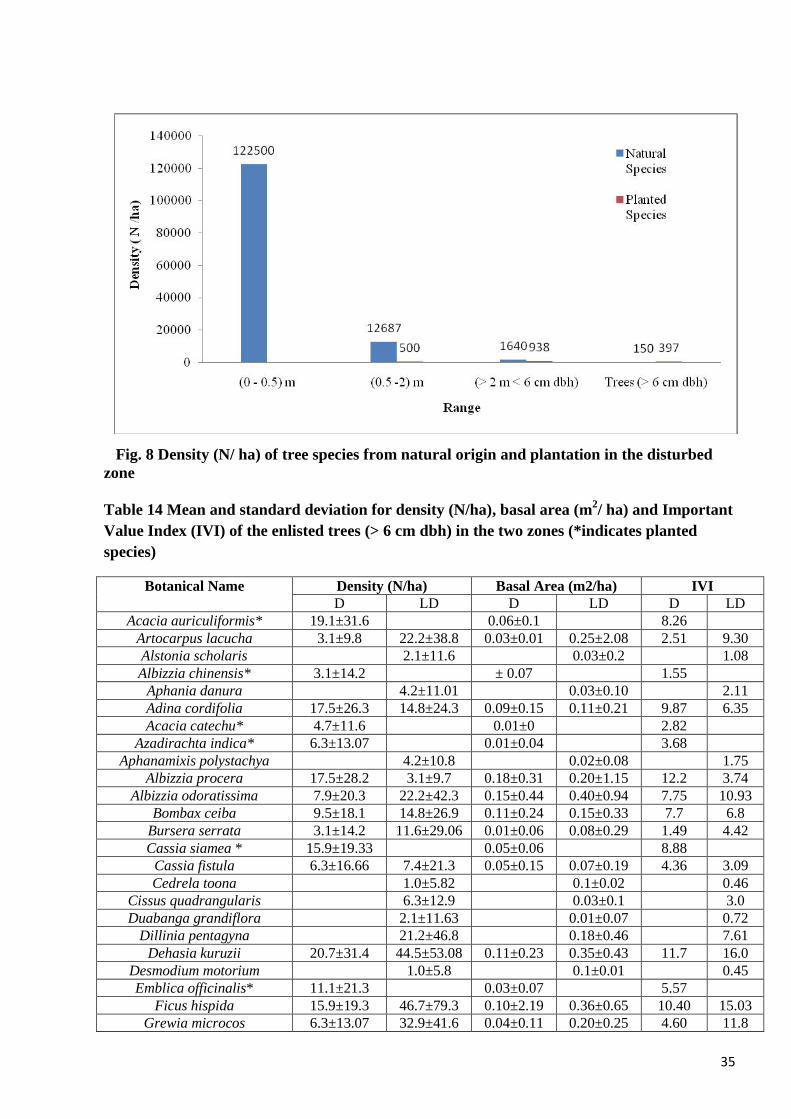
35
Fig. 8 Density (N/ ha) of tree species from natural origin and plantation in the disturbed
zone
Table 14 Mean and standard deviation for density (N/ha), basal area (m2/ ha) and Important
Value Index (IVI) of the enlisted trees (> 6 cm dbh) in the two zones (*indicates planted
species)
Botanical Name Density (N/ha) Basal Area (m2/ha) IVI
D LD D LD D LD
Acacia auriculiformis* 19.1±31.6 0.06±0.1 8.26
Artocarpus lacucha 3.1±9.8 22.2±38.8 0.03±0.01 0.25±2.08 2.51 9.30
Alstonia scholaris 2.1±11.6 0.03±0.2 1.08
Albizzia chinensis* 3.1±14.2 ± 0.07 1.55
Aphania danura 4.2±11.01 0.03±0.10 2.11
Adina cordifolia 17.5±26.3 14.8±24.3 0.09±0.15 0.11±0.21 9.87 6.35
Acacia catechu* 4.7±11.6 0.01±0 2.82
Azadirachta indica* 6.3±13.07 0.01±0.04 3.68
Aphanamixis polystachya 4.2±10.8 0.02±0.08 1.75
Albizzia procera 17.5±28.2 3.1±9.7 0.18±0.31 0.20±1.15 12.2 3.74
Albizzia odoratissima 7.9±20.3 22.2±42.3 0.15±0.44 0.40±0.94 7.75 10.93
Bombax ceiba 9.5±18.1 14.8±26.9 0.11±0.24 0.15±0.33 7.7 6.8
Bursera serrata 3.1±14.2 11.6±29.06 0.01±0.06 0.08±0.29 1.49 4.42
Cassia siamea * 15.9±19.33 0.05±0.06 8.88
Cassia fistula 6.3±16.66 7.4±21.3 0.05±0.15 0.07±0.19 4.36 3.09
Cedrela toona 1.0±5.82 0.1±0.02 0.46
Cissus quadrangularis 6.3±12.9 0.03±0.1 3.0
Duabanga grandiflora 2.1±11.63 0.01±0.07 0.72
Dillinia pentagyna 21.2±46.8 0.18±0.46 7.61
Dehasia kuruzii 20.7±31.4 44.5±53.08 0.11±0.23 0.35±0.43 11.7 16.0
Desmodium motorium 1.0±5.8 0.1±0.01 0.45
Emblica officinalis* 11.1±21.3 0.03±0.07 5.57
Ficus hispida 15.9±19.3 46.7±79.3 0.10±2.19 0.36±0.65 10.40 15.03
Grewia microcos 6.3±13.07 32.9±41.6 0.04±0.11 0.20±0.25 4.60 11.8
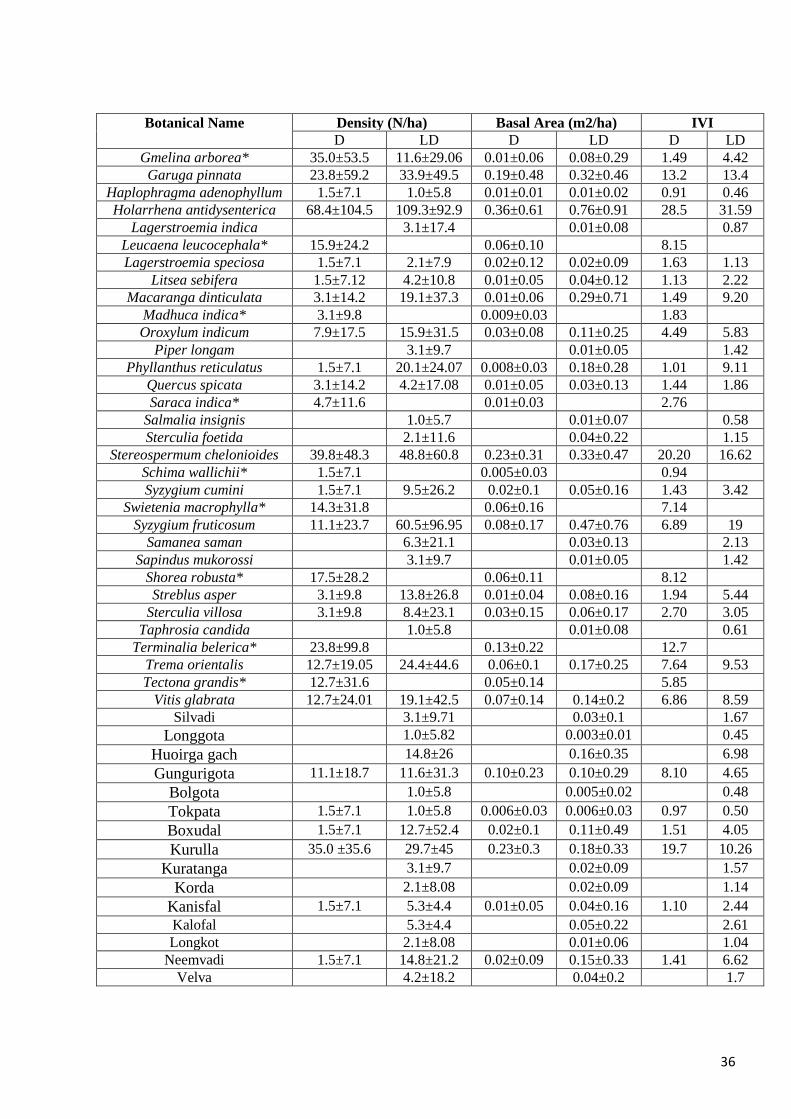
36
Botanical Name Density (N/ha) Basal Area (m2/ha) IVI
D LD D LD D LD
Gmelina arborea* 35.0±53.5 11.6±29.06 0.01±0.06 0.08±0.29 1.49 4.42
Garuga pinnata 23.8±59.2 33.9±49.5 0.19±0.48 0.32±0.46 13.2 13.4
Haplophragma adenophyllum 1.5±7.1 1.0±5.8 0.01±0.01 0.01±0.02 0.91 0.46
Holarrhena antidysenterica 68.4±104.5 109.3±92.9 0.36±0.61 0.76±0.91 28.5 31.59
Lagerstroemia indica 3.1±17.4 0.01±0.08 0.87
Leucaena leucocephala* 15.9±24.2 0.06±0.10 8.15
Lagerstroemia speciosa 1.5±7.1 2.1±7.9 0.02±0.12 0.02±0.09 1.63 1.13
Litsea sebifera 1.5±7.12 4.2±10.8 0.01±0.05 0.04±0.12 1.13 2.22
Macaranga dinticulata 3.1±14.2 19.1±37.3 0.01±0.06 0.29±0.71 1.49 9.20
Madhuca indica* 3.1±9.8 0.009±0.03 1.83
Oroxylum indicum 7.9±17.5 15.9±31.5 0.03±0.08 0.11±0.25 4.49 5.83
Piper longam 3.1±9.7 0.01±0.05 1.42
Phyllanthus reticulatus 1.5±7.1 20.1±24.07 0.008±0.03 0.18±0.28 1.01 9.11
Quercus spicata 3.1±14.2 4.2±17.08 0.01±0.05 0.03±0.13 1.44 1.86
Saraca indica* 4.7±11.6 0.01±0.03 2.76
Salmalia insignis 1.0±5.7 0.01±0.07 0.58
Sterculia foetida 2.1±11.6 0.04±0.22 1.15
Stereospermum chelonioides 39.8±48.3 48.8±60.8 0.23±0.31 0.33±0.47 20.20 16.62
Schima wallichii* 1.5±7.1 0.005±0.03 0.94
Syzygium cumini 1.5±7.1 9.5±26.2 0.02±0.1 0.05±0.16 1.43 3.42
Swietenia macrophylla* 14.3±31.8 0.06±0.16 7.14
Syzygium fruticosum 11.1±23.7 60.5±96.95 0.08±0.17 0.47±0.76 6.89 19
Samanea saman 6.3±21.1 0.03±0.13 2.13
Sapindus mukorossi 3.1±9.7 0.01±0.05 1.42
Shorea robusta* 17.5±28.2 0.06±0.11 8.12
Streblus asper 3.1±9.8 13.8±26.8 0.01±0.04 0.08±0.16 1.94 5.44
Sterculia villosa 3.1±9.8 8.4±23.1 0.03±0.15 0.06±0.17 2.70 3.05
Taphrosia candida 1.0±5.8 0.01±0.08 0.61
Terminalia belerica* 23.8±99.8 0.13±0.22 12.7
Trema orientalis 12.7±19.05 24.4±44.6 0.06±0.1 0.17±0.25 7.64 9.53
Tectona grandis* 12.7±31.6 0.05±0.14 5.85
Vitis glabrata 12.7±24.01 19.1±42.5 0.07±0.14 0.14±0.2 6.86 8.59
Silvadi 3.1±9.71 0.03±0.1 1.67
Longgota 1.0±5.82 0.003±0.01 0.45
Huoirga gach 14.8±26 0.16±0.35 6.98
Gungurigota 11.1±18.7 11.6±31.3 0.10±0.23 0.10±0.29 8.10 4.65
Bolgota 1.0±5.8 0.005±0.02 0.48
Tokpata 1.5±7.1 1.0±5.8 0.006±0.03 0.006±0.03 0.97 0.50
Boxudal 1.5±7.1 12.7±52.4 0.02±0.1 0.11±0.49 1.51 4.05
Kurulla 35.0 ±35.6 29.7±45 0.23±0.3 0.18±0.33 19.7 10.26
Kuratanga 3.1±9.7 0.02±0.09 1.57
Korda 2.1±8.08 0.02±0.09 1.14
Kanisfal 1.5±7.1 5.3±4.4 0.01±0.05 0.04±0.16 1.10 2.44
Kalofal 5.3±4.4 0.05±0.22 2.61
Longkot 2.1±8.08 0.01±0.06 1.04
Neemvadi 1.5±7.1 14.8±21.2 0.02±0.09 0.15±0.33 1.41 6.62
Velva 4.2±18.2 0.04±0.2 1.7
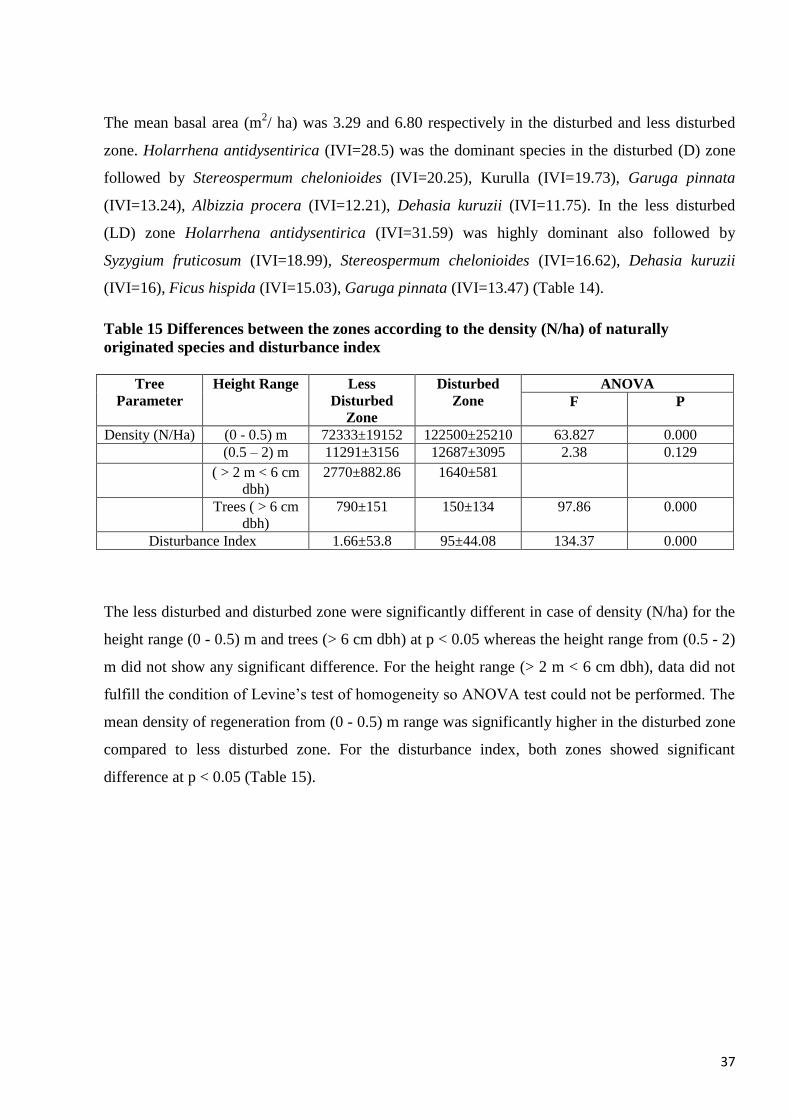
37
The mean basal area (m2/ ha) was 3.29 and 6.80 respectively in the disturbed and less disturbed
zone. Holarrhena antidysentirica (IVI=28.5) was the dominant species in the disturbed (D) zone
followed by Stereospermum chelonioides (IVI=20.25), Kurulla (IVI=19.73), Garuga pinnata
(IVI=13.24), Albizzia procera (IVI=12.21), Dehasia kuruzii (IVI=11.75). In the less disturbed
(LD) zone Holarrhena antidysentirica (IVI=31.59) was highly dominant also followed by
Syzygium fruticosum (IVI=18.99), Stereospermum chelonioides (IVI=16.62), Dehasia kuruzii
(IVI=16), Ficus hispida (IVI=15.03), Garuga pinnata (IVI=13.47) (Table 14).
Table 15 Differences between the zones according to the density (N/ha) of naturally
originated species and disturbance index
Tree
Parameter
Height Range Less
Disturbed
Zone
Disturbed
Zone
ANOVA
F P
Density (N/Ha) (0 - 0.5) m 72333±19152 122500±25210 63.827 0.000
(0.5 – 2) m 11291±3156 12687±3095 2.38 0.129
( > 2 m < 6 cm
dbh)
2770±882.86 1640±581
Trees ( > 6 cm
dbh)
790±151 150±134 97.86 0.000
Disturbance Index 1.66±53.8 95±44.08 134.37 0.000
The less disturbed and disturbed zone were significantly different in case of density (N/ha) for the
height range (0 - 0.5) m and trees (> 6 cm dbh) at p < 0.05 whereas the height range from (0.5 - 2)
m did not show any significant difference. For the height range (> 2 m < 6 cm dbh), data did not
fulfill the condition of Levine’s test of homogeneity so ANOVA test could not be performed. The
mean density of regeneration from (0 - 0.5) m range was significantly higher in the disturbed zone
compared to less disturbed zone. For the disturbance index, both zones showed significant
difference at p < 0.05 (Table 15).

38
Fig. 9 Number of species with different diameter distribution in different plots for trees (> 6
cm dbh) in the disturbed zone
Fig. 10 Number of species with different diameter distribution in different plots for trees (> 6
cm dbh) in the less disturbed zone
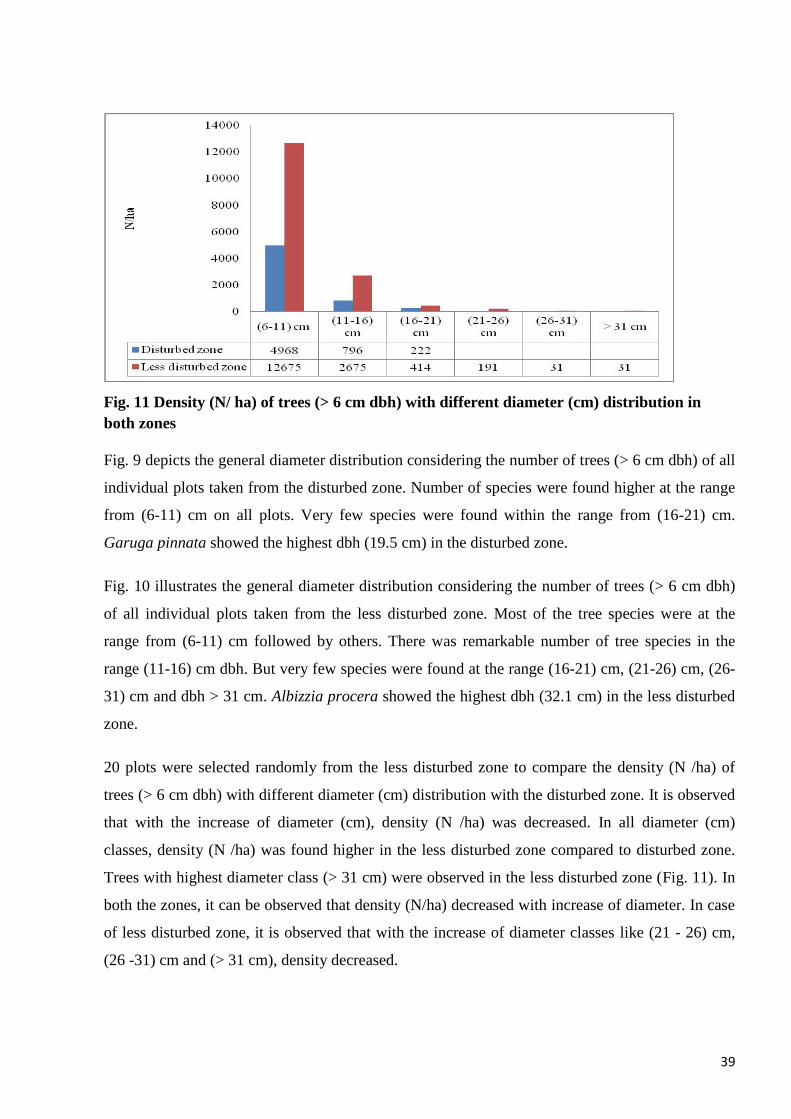
39
Fig. 11 Density (N/ ha) of trees (> 6 cm dbh) with different diameter (cm) distribution in
both zones
Fig. 9 depicts the general diameter distribution considering the number of trees (> 6 cm dbh) of all
individual plots taken from the disturbed zone. Number of species were found higher at the range
from (6-11) cm on all plots. Very few species were found within the range from (16-21) cm.
Garuga pinnata showed the highest dbh (19.5 cm) in the disturbed zone.
Fig. 10 illustrates the general diameter distribution considering the number of trees (> 6 cm dbh)
of all individual plots taken from the less disturbed zone. Most of the tree species were at the
range from (6-11) cm followed by others. There was remarkable number of tree species in the
range (11-16) cm dbh. But very few species were found at the range (16-21) cm, (21-26) cm, (26-
31) cm and dbh > 31 cm. Albizzia procera showed the highest dbh (32.1 cm) in the less disturbed
zone.
20 plots were selected randomly from the less disturbed zone to compare the density (N /ha) of
trees (> 6 cm dbh) with different diameter (cm) distribution with the disturbed zone. It is observed
that with the increase of diameter (cm), density (N /ha) was decreased. In all diameter (cm)
classes, density (N /ha) was found higher in the less disturbed zone compared to disturbed zone.
Trees with highest diameter class (> 31 cm) were observed in the less disturbed zone (Fig. 11). In
both the zones, it can be observed that density (N/ha) decreased with increase of diameter. In case
of less disturbed zone, it is observed that with the increase of diameter classes like (21 - 26) cm,
(26 -31) cm and (> 31 cm), density decreased.

40
Fig. 12 Number of species with different height distribution in different plots for trees (> 6
cm dbh) in the disturbed zone
Fig. 13 Number of species with different height distribution in different plots for trees (> 6
cm dbh) in the less disturbed zone
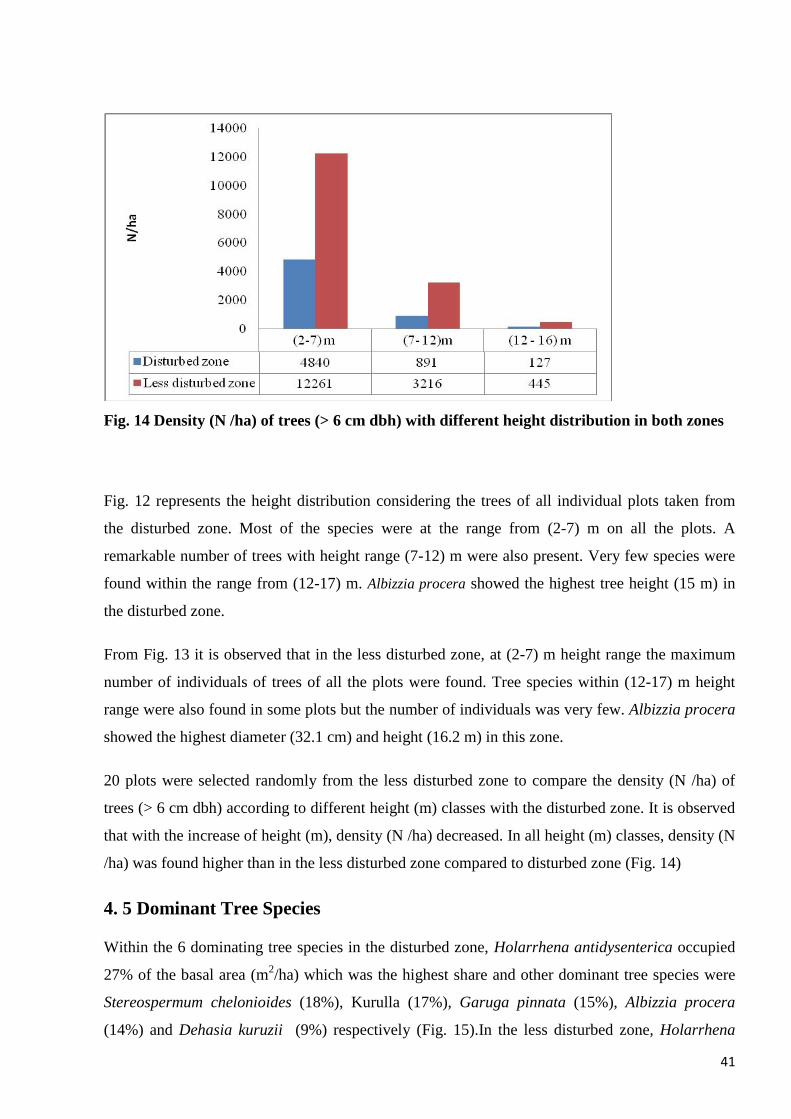
41
Fig. 14 Density (N /ha) of trees (> 6 cm dbh) with different height distribution in both zones
Fig. 12 represents the height distribution considering the trees of all individual plots taken from
the disturbed zone. Most of the species were at the range from (2-7) m on all the plots. A
remarkable number of trees with height range (7-12) m were also present. Very few species were
found within the range from (12-17) m. Albizzia procera showed the highest tree height (15 m) in
the disturbed zone.
From Fig. 13 it is observed that in the less disturbed zone, at (2-7) m height range the maximum
number of individuals of trees of all the plots were found. Tree species within (12-17) m height
range were also found in some plots but the number of individuals was very few. Albizzia procera
showed the highest diameter (32.1 cm) and height (16.2 m) in this zone.
20 plots were selected randomly from the less disturbed zone to compare the density (N /ha) of
trees (> 6 cm dbh) according to different height (m) classes with the disturbed zone. It is observed
that with the increase of height (m), density (N /ha) decreased. In all height (m) classes, density (N
/ha) was found higher than in the less disturbed zone compared to disturbed zone (Fig. 14)
4. 5 Dominant Tree Species
Within the 6 dominating tree species in the disturbed zone, Holarrhena antidysenterica occupied
27% of the basal area (m2/ha) which was the highest share and other dominant tree species were
Stereospermum chelonioides (18%), Kurulla (17%), Garuga pinnata (15%), Albizzia procera
(14%) and Dehasia kuruzii (9%) respectively (Fig. 15).In the less disturbed zone, Holarrhena

42
antidysenterica comprised 29% of the basal area (m2/ha) where as others were Syzygium
fruticosum (18%), Stereospermum chelonioides (13%), Dehasia kuruzii (13%), Ficus hispida
(14%), Garuga pinnata (13%) (Fig. 16).
Fig. 15 According to basal area (m2/ ha) percentage of dominating tree species in the
disturbed zone
Fig. 16 According to basal area (m2/ ha) percentage of dominating tree species in the less
disturbed zone
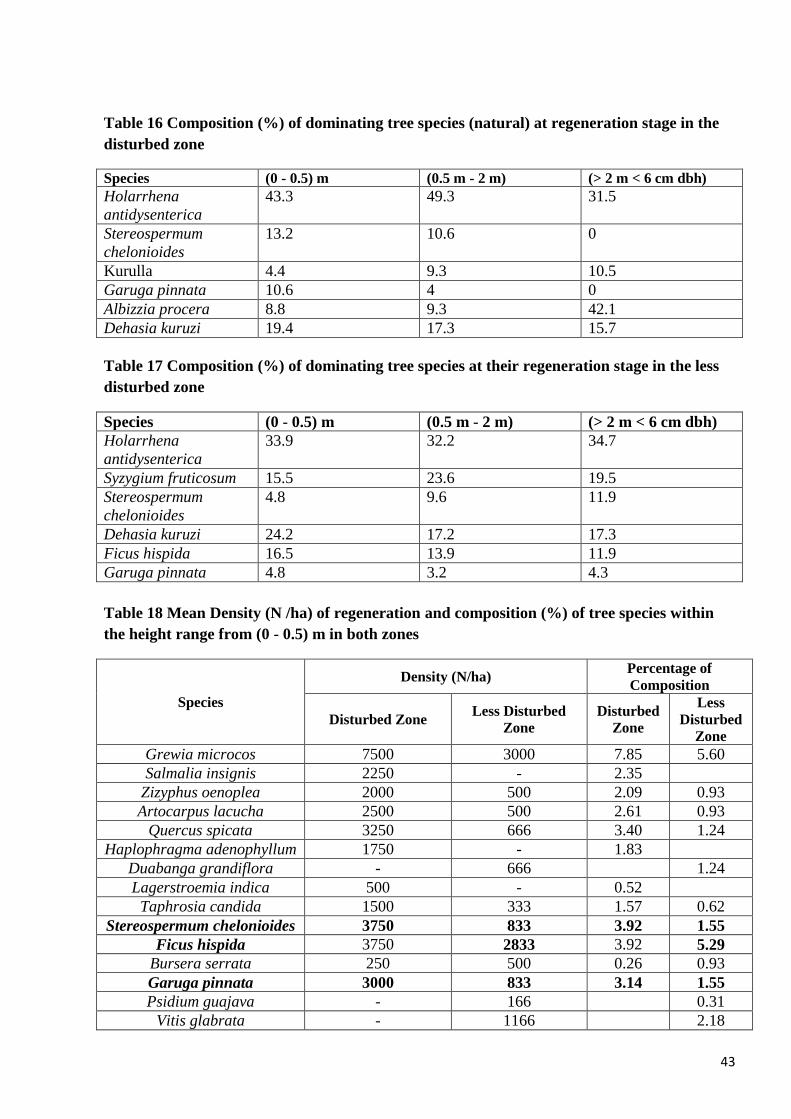
43
Table 16 Composition (%) of dominating tree species (natural) at regeneration stage in the
disturbed zone
Species (0 - 0.5) m (0.5 m - 2 m) (> 2 m < 6 cm dbh)
Holarrhena
antidysenterica
43.3 49.3 31.5
Stereospermum
chelonioides
13.2 10.6 0
Kurulla 4.4 9.3 10.5
Garuga pinnata 10.6 4 0
Albizzia procera 8.8 9.3 42.1
Dehasia kuruzi 19.4 17.3 15.7
Table 17 Composition (%) of dominating tree species at their regeneration stage in the less
disturbed zone
Species (0 - 0.5) m (0.5 m - 2 m) (> 2 m < 6 cm dbh)
Holarrhena
antidysenterica
33.9 32.2 34.7
Syzygium fruticosum 15.5 23.6 19.5
Stereospermum
chelonioides
4.8 9.6 11.9
Dehasia kuruzi 24.2 17.2 17.3
Ficus hispida 16.5 13.9 11.9
Garuga pinnata 4.8 3.2 4.3
Table 18 Mean Density (N /ha) of regeneration and composition (%) of tree species within
the height range from (0 - 0.5) m in both zones
Species
Density (N/ha) Percentage of
Composition
Disturbed Zone Less Disturbed
Zone
Disturbed
Zone
Less
Disturbed
Zone
Grewia microcos 7500 3000 7.85 5.60
Salmalia insignis 2250 - 2.35
Zizyphus oenoplea 2000 500 2.09 0.93
Artocarpus lacucha 2500 500 2.61 0.93
Quercus spicata 3250 666 3.40 1.24
Haplophragma adenophyllum 1750 - 1.83
Duabanga grandiflora - 666 1.24
Lagerstroemia indica 500 - 0.52
Taphrosia candida 1500 333 1.57 0.62
Stereospermum chelonioides 3750 833 3.92 1.55
Ficus hispida 3750 2833 3.92 5.29
Bursera serrata 250 500 0.26 0.93
Garuga pinnata 3000 833 3.14 1.55
Psidium guajava - 166 0.31
Vitis glabrata - 1166 2.18
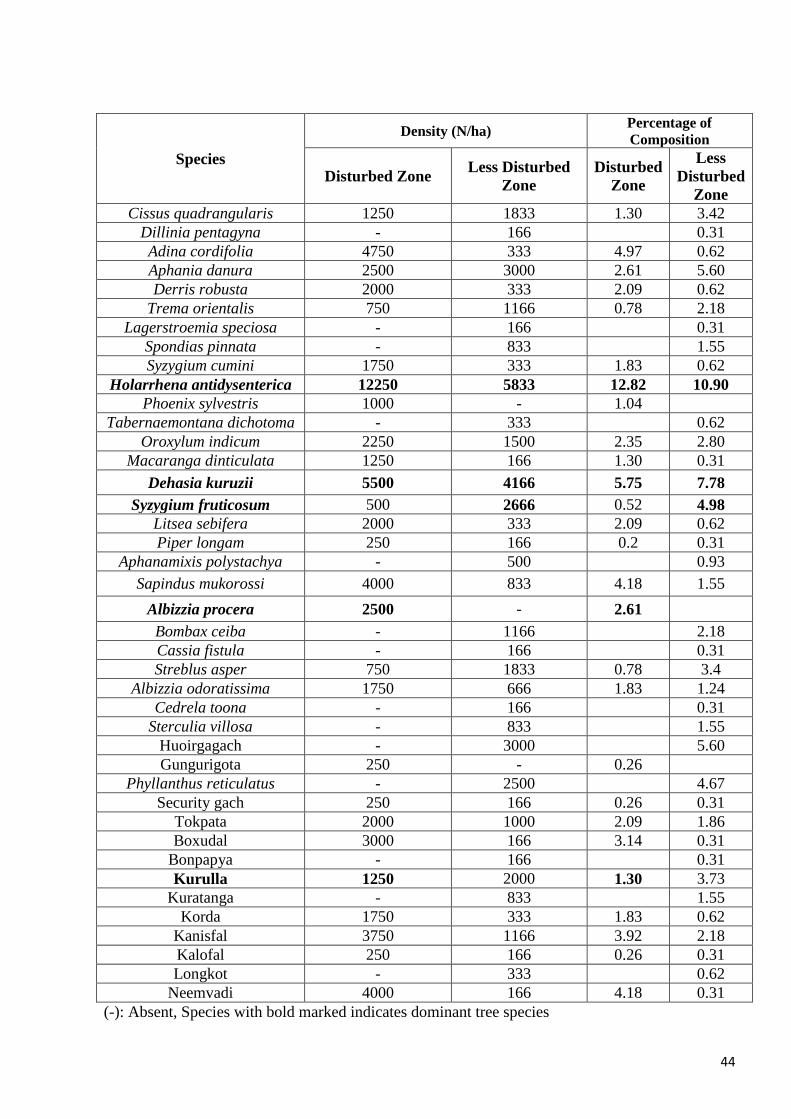
44
Species
Density (N/ha) Percentage of
Composition
Disturbed Zone Less Disturbed
Zone
Disturbed
Zone
Less
Disturbed
Zone
Cissus quadrangularis 1250 1833 1.30 3.42
Dillinia pentagyna - 166 0.31
Adina cordifolia 4750 333 4.97 0.62
Aphania danura 2500 3000 2.61 5.60
Derris robusta 2000 333 2.09 0.62
Trema orientalis 750 1166 0.78 2.18
Lagerstroemia speciosa - 166 0.31
Spondias pinnata - 833 1.55
Syzygium cumini 1750 333 1.83 0.62
Holarrhena antidysenterica 12250 5833 12.82 10.90
Phoenix sylvestris 1000 - 1.04
Tabernaemontana dichotoma - 333 0.62
Oroxylum indicum 2250 1500 2.35 2.80
Macaranga dinticulata 1250 166 1.30 0.31
Dehasia kuruzii 5500 4166 5.75 7.78
Syzygium fruticosum 500 2666 0.52 4.98
Litsea sebifera 2000 333 2.09 0.62
Piper longam 250 166 0.2 0.31
Aphanamixis polystachya - 500 0.93
Sapindus mukorossi 4000 833 4.18 1.55
Albizzia procera 2500 - 2.61
Bombax ceiba - 1166 2.18
Cassia fistula - 166 0.31
Streblus asper 750 1833 0.78 3.4
Albizzia odoratissima 1750 666 1.83 1.24
Cedrela toona - 166 0.31
Sterculia villosa - 833 1.55
Huoirgagach - 3000 5.60
Gungurigota 250 - 0.26
Phyllanthus reticulatus - 2500 4.67
Security gach 250 166 0.26 0.31
Tokpata 2000 1000 2.09 1.86
Boxudal 3000 166 3.14 0.31
Bonpapya - 166 0.31
Kurulla 1250 2000 1.30 3.73
Kuratanga - 833 1.55
Korda 1750 333 1.83 0.62
Kanisfal 3750 1166 3.92 2.18
Kalofal 250 166 0.26 0.31
Longkot - 333 0.62
Neemvadi 4000 166 4.18 0.31
(-): Absent, Species with bold marked indicates dominant tree species
45
It is observed from Table 16 that composition varies within dominating tree species at the
regeneration stage. Holarrhena antidysenterica occupied highest composition (43%) among other
five dominating tree species at the range (0 - 0.5) m whereas Dehasia kuruzi occupied the second
highest (19 %). From this table, it is observed that Kurulla had the lowest composition (4 %)
among other dominating tree species at the range of (0 - 0.5) m. At the range (0.5 -2) m,
Holarrhena antidysenterica and Dehasia kuruzi again occupied the highest (49%) and second
highest (17%) composition. But at the range (> 2 m < 6 cm dbh) Albizzia procera occupied the
highest composition (42%) whereas Holarrhena antidysenterica had the second highest (31.57%)
composition. Stereospermum chelonioides and Garuga pinnata were absent at this range.
In case of less disturbed zone, the most dominating tree species Holarrhena antidysenterica
showed approximately 34% composition among other dominating tree species at the range (0 –
0.5) m whereas Dehasia kuruzi occupied 24 % composition respectively. Holarrhena
antidysenterica occupied highest composition e.g. 32 % and 34.74 % at the range (0.5 – 2) m and
(> 2 m < 6 cm dbh) respectively. Garuga pinnata had lowest composition among other
dominating tree species in both ranges (Table 17)
Table 18 represents the density (N/ha) of all tree species among all naturally originated tree
species at the range (0 - 0.5) m in both zones. It was observed that the dominating mature tree
species were not dominant at the regeneration stage except Holarrhena antidysenterica. Some
other species have higher composition than the dominant species. Grewia microcos had second
highest composition in the disturbed zone at the range (0 - 0.5) m. Holarrhena antidysenterica and
Dehasia kuruzi had occupied the highest and second highest composition at this range in case of
the less disturbed zone. So it can be concluded that the dominating mature tree species did not
comprise the same importance compared with other tree species at the range (0-0.5) m.
46
Chapter 5 DISCUSSION
The species richness found on the study area of 50 sample plots in both zones of the Sitakund
Botanical Garden and Eco-park is 109 among which 66 were identified as tree species, these
findings are comparable to other studies accomplished in the same area in December 2003.
Misbahuzzaman and Alam (2006) reported 63 naturally regenerating tree species at the same
study area. Very few research was done on herb coverage percentage and also shrub species
richness in the study area. Species richness was more in the less disturbed zone in the study area
whereas in the disturbed zone, it was less. Hossain et al. (2004) found 64 regenerating tree species
from natural forest and 40 regenerating tree species from enrichment plantation in the Baraitali
Forest of Chittagong (South) Forest Division, Kadavul and Parthasarathy (1999) reported 50 tree
species on 1 ha area of less disturbed plots which had poor accessibility in the semi-evergreen
forest of Shervarayan hills of Eastern Ghats, India whereas in the disturbed plots, it was less than
that. Both natural and anthropogenic disturbances reduce observed species richness and diversity
(Brown and Gurevitch, 2004). From the study it was observed that species richness decreased with
the increasing disturbances. Rahman et al. (2009) also found negative relationship between
disturbance index and species richness, Parthasarathy (1999), stated more species richness in the
undisturbed site compared to selected felled site and frequently disturbed site in the Kalakad
National Park, Western Ghats, South India. But Kumar and Ram (2005) observed different
relationship in their study. They found anthropogenic disturbances like lopping, grazing, litter
removal or fire in the study area. It was found that tree and shrub species diversity was relatively
higher in the moderately and highly disturbed forests compared to low disturbed forests. They
mentioned disturbances decreased the dominance of single species and increased the plant
biodiversity by mixing species of different succession status.
Local people practice agro-forestry, collect litter, cut regeneration and non-woody plants from the
disturbed zone which might impact species richness. There is very less variation for the climber
and shrub species richness between zones. Most of the time, when local people collect fuel wood,
they cut climbers and use it to bind the fuel wood together. That’s why; it was observed that
climber density was less. But in the less disturbed zone, because of poor accessibility, absence of
management operation, it was observed that climbers were sticked with many trees which
hampered the growth of trees.
Both zones showed significant differences for the density (N/ha) of regeneration from (0 – 0.5) m
and for trees (> 6 cm). For mean density (N/ha) of trees (> 6 cm dbh) was higher in the less and
47
and for trees (> 6 cm dbh). The mean density (N/ha) of trees (> 6 cm dbh) was higher in the less
disturbed zone compared to disturbed zone which contributed to a significant difference between
zones. Due to poor accessibility in the less disturbed zone, resource extraction was minimal.
Whereas, the disturbed zones were located near to the main road of the study area where local
people can enter easily and engage in illegal logging. This result is comparable with Kadavul and
Parthasarathy (1999) where it was reported that due to poor accessibility and location of less
disturbed plots away from human habitation, density (N/ha) of woody species was higher than on
the disturbed plots. But density (N/ha) of regenerated plants from height range (0 - 0.5) m and (0.5
- 2) m, was higher in the disturbed zone. Maybe due to substantial amount of sunlight on the forest
floor that affects the regeneration rate, disturbed zone had a higher density (N/ha) of regeneration.
But due to human interference, less number of individuals reach the mature tree stage (tree > 6 cm
dbh).
Herb coverage percentage was low in the less disturbed zone which is supported by the results of
Kumar and Ram (2005) who stated that herb density (N/ha) was less in the least disturbed forest
than compared to highly and moderately disturbed forest. Nath et al. (2005) found that herbaceous
species were denser in highly disturbed stand compared to moderately disturbed and undisturbed
stand also. The low coverage of herbs in the less disturbed zone is due to the less solar radiation
on the forest floor caused by the closed canopy cover. The coverage is higher in the disturbed zone
due to the sunlight falling through the broken canopy on the forest floor (Bhatnagar, 1966).
From this study, it is observed that Holarrhena antidysentirica was the dominant tree species in
both zones (Disturbed: 28.5 & Less Disturbed: 31.59).There was one study accomplished during
2003 by a forestry student (Nath,2003) in the same study area and from the result, it was observed
that Holarrhena antidysentirica had the highest Importance Value Index (IVI) at the Southern
(IVI: 24.40) and Western (IVI: 23.77) aspect and also at the top hill (IVI: 20.20) and at the midhill
(IVI: 18.23), it had the second highest Importance Value Index (IVI). It was also found from the
study that in the natural forest, Holarrhena antidysentirica (IVI: 25.60), Sterlospermum
chelonioides (IVI: 20.40) occupied the second and third highest Importance Value Index (IVI)
whereas at the present study, both species had the first and third highest (IVI: 31.59 & 16.62)
Importance Value Index (IVI) respectively in the less disturbed zone. In the enrichment plantation
area (mixed with natural and planted species), Sterlospermum chelonioides (IVI: 19.23) and
Holarrhena antidysentirica (IVI: 16.10) followed the highest and second highest Importance
Value Index (IVI) whereas in the disturbed zone of the present study which had plantation also,
Holarrhena antidysentirica, Sterlospermum chelonioides showed the maximum Importance Value
48
Index (IVI).However these differences are mostly linked to the sampling design and the number of
plot observed. But the dominating mature tree species of this study showed different status at the
regeneration stage. Comparing with the composition of other tree species found in both zones at
regeneration stage (0 – 0.5) m, some of these dominant tree species had less share. Among
dominant tree species, Holarrhena antidysentirica and Dehasia kuruzi had a higher share than all
other tree species found in the disturbed and less disturbed zone at regeneration stage (0 – 0.5) m.
Grewia microcos had a higher share at this regeneration stage in both zones. It can be assumed
that the disturbed and less disturbed zone of the study area is better suited for regeneration and
growth of Holarrhena antidysentirica and Dehasia kuruzi compared to other dominant tree
species.
Holarrhena antidysenterica had the highest share at the range (0 - 0.5) m and (0.5 - 2) m in the
disturbed zone but at range (> 2m < 6 cm dbh) Albizzia procera had the highest share. So these
dominating tree species did not show a similar domination status at their regeneration stage. But in
the case of less disturbed zone Holarrhena antidysentirica had the highest share among other
dominant tree species at the regeneration stage. Syzygium fruticosum occupied the second highest
share at the regeneration stage (0.5 – 2) m and (> 2 m < 6 cm dbh) whereas Dehasia kuruzi at (0 –
0.5) m.
Among all other dominant tree species, Holarrhena antidysenterica had the highest share in both
zones. This species needs a slight amount of shade but it develops best in full light. It is sensitive
to frost, but has good powers of recovery from the base when killed down and may often be found
in abundance persisting on grassy areas subject to severe frost. As the area is recruited recently, so
there are less trees allowing dense canopy. As the tree develops best in full light, so this may be a
reason for its high dominancy. It is not readily browsed, even by goats. It shoots up readily after
severe damage by fire. It produces root-suckers in abundance (Troup, 1921).
It can be observed from this study that some of the dominant tree species had a lower proportion
than all other tree species found in both zones at their regeneration stage. It can be assumed that
due to stand development phase, in the early stage there was high number of individuals of
different species. It seems that the dominant tree species adopted better to the environment and
made them dominant among all other tree species. Although the hills at the Sitakund Botanical
Garden and Eco-park area mostly lack seed bearing trees, many of them have stumps from the
previously felled trees and a system of active root suckers is often covered with thorny bush and
climbers and other weeds (Misbahuzzaman and Alam, 2006). All the dominant tree species found

49
in the study area regenerate by root suckers and coppice, so this might be an additional reason for
the dominance as these tree species depend on less seed dispersal for their regeneration.
The diameter class distribution of trees (> 6 cm dbh) revealed that with an increase of diameter
classes, the total number of species decreased. Most of the species were found at the lowest
diameter class (6-11) cm on all plots in both zones. Garuga pinnata had the highest dbh which
was one of the dominant tree species also. In the less disturbed zone, Albizzia procera showed the
highest dbh but Importance Value Index (IVI) of the species was low because it had low
frequency and density (N /ha). It was found that the species recruitment has started recently with
an encouraging manner in both zones but due to disturbances, less species are available with high
diameter ranges in the disturbed zone. In the less disturbed zone, due to poor accessibility, there
are some species with high diameter classes. So adequate protection is necessary to maintain an
adequate number of species in each diameter class. Al-Amin et al. (2005) reported that most of the
species of a deforested area (Bamerchara and Danerchara is reserve forest of Jaldi beat under Jaldi
range Chittagong (South) Forest Division) of Bangladesh were in the lowest diameter range.
Number of total species was decreasing as diameter class was increasing.
For the height class distribution, the results were similar. The number of species decreased by
increasing height classes. In the present study, most of the species are at the height class from (2-
7) m in the disturbed zone. But in the less disturbed zone, even the total number of species was
more at the class from (2-7) m, but there were more species found at the (7-12) m and (12-17) m
classes than compared to the number of species found at that classes in the disturbed zone.
As the number of species decreased with the increase of diameter and height classes it could be
hypothesized that the area was degrading continuously in the past. Due to the establishment of
Eco-park and Botanical Garden, this process of recruitment with a diverse mixed species was
initiated. Rahman et al. (2009) found similar results in the Madhupur Sal forest of Bangladesh
where it is mentioned that trees with highest height were found in the low disturbed forest type
and herb coverage percentage was low in the low disturbed forest type of the Madhupur Sal forest.
Giant trees were found only in the low disturbed forest type. The density (N/ha) of regenerated
plants from the range of (0 - 0.5) m had a positive relationship with the disturbance index. This
result is supported by the research done by Mishra et al. (2003) where they found that an increased
level of disturbances favored regeneration both by seeds as well as by sprouting. Thus the
regeneration behavior of forest trees seems to be closely linked with the level of disturbances.
50
Chapter 6 CONCLUSION AND RECOMMENDATION
6. 1 Conclusion
Sitakund Eco-park is heterogeneous in terms of species richness and community structure. The
study revealed that anthropogenic disturbances influence the regeneration, species richness,
density (N/ha) and basal area (m2/ha). From the study, it is observed that the level of tree species
diversity in the less disturbed zone of Sitakund Eco-park is higher compared to the disturbed zone.
In the less disturbed zone, climbers were suppressing the growth of other trees even in the
disturbed zone. Local people are engaged in cutting of regeneration, cutting of non wood products,
logging, bark peeling for making medicine against mosquito, litter collection, agro forestry
practices which cause serious impacts on regeneration in the disturbed zone. They are dependent
on forest products for their daily livelihood. If in future this trend of extraction remains, it will
influence the regeneration on the less disturbed zone, also. Even many vary rare species will be
extinct. Gap filling with indigenous species in the disturbed zone could reduce the risk being
extinct. Forest management efforts should consider community-based forestry programmes
involving local people in forest management activities. Native forest eco-systems of eco-park
could be restored to a significant extent if there would be some regular cultural practices such as
removal of non woody vegetation like climbers or weeds. However, anthropogenic disturbances
should be reduced to facilitate regeneration. Local people participation during afforestation
programme can play an important role. For better participation, views of farmers (in species
selection, land uses etc.) should be considered in decision-making processes, which would create
co-operation between farmers and the Park Authority. Analysis of previous plantation history in
this area (FMP, 1992) and (Alam, 2001) indicates that failure of plantations was mostly due to
human interference. The local people were not involved in these plantation programmes and still
now they don’t have involvement .They should be involved in a participatory way for the
sustainability of the plantation programmes in future.
51
6. 2 Recommendation
Based on the personal observation at the study area, some major recommendations can be given:
As local people in the study area do not have other alternatives, they are engaged in logging,
cutting of regeneration, cutting of non wood products, bark peeling, agro forestation, firing and
litter collection. Visitors enter the area and cause disturbances. Fire caused by the visitors and
local people impacts regeneration. These disturbances are interrupting the ecological restoration of
the Sitakund Botanical Garden and Eco-park the reason it was established for. Local people do not
engage in conservation activities as they have no ownership for the area. So it can be
recommended that participation of local people in decision making, different plantation activities,
during selection of species could improve the condition of the status of regeneration and tree
species diversity of the study area. Community forestry might be a better idea for upgrading the
present condition of the status of regeneration and tree species diversity as well as the economic
condition of the local people. Through this approach local people would be more conscious about
protection of the area. Awareness raising and better understanding among local people and the
eco-park authority could help to minimize the disturbances in the study area.
Based on the information about some other problems in the study area given by the eco-park staff,
some recommendation can be given:
For preventing the spreading of forest fires, some logistic support like walky-talky for
communication facilities is needed. Water supply and an increased support from staff are other
basic recommendations.
Only 12% of the permanent positions are filled up by the local people. There should be some
provision to involve more local people at the management level of the Botanical Garden and Eco-
park.
52
REFERENCES
Ahmed, M. 1995. Biodiversity conservation-essential for overall protection of environment. World
Environment Day-an occasional paper published by the Department of Environment, Dhaka.21-22
pp.
Alam, MK. 2001. Development plan for Sitakund Botanical Garden and Eco-park. Consultancy
report on the establishment of Botanical Garden and Eco-park at Sitakund, Chittagong,
Bangladesh.
Al-Amin, M., Alamgir, M. and Bhuiyan, M.A.R. 2005. Structural Composition Based on Diameter
and Height Class Distribution of a Deforested Area of Chittagong, Bangladesh. Journal of Applied
Sciences, 5 (2): 227-231.
Annonymous. 1993. Forestry Master Plan- Main Plan, ADB (TA No.1355-BAN), UNDP/FAO BGD
88/025.162 pp.
Barua, S.P., Khan, M.M.H. and Reza, A.H.M.A. 2001. The Status of Alien invasive species in
Bangladesh and their Impact on the ecosystems. In: P. Balakrishna, (ed), Alien invasive Species-
report of workshop on Alien invasive species. IUCN Regional Biodiversity Programme of Asia,
Colombo, Sri Lanka.1-7 pp.
Bhatnagar, H.P. 1966. Phytosociological studies in some evergreen (Hollong-Nahor) forests of
Assam. Tropical Ecology, 7: 8-13.
Bhuiyan, Md. Zaid H. and Roy B. Ch. S. 2000. Conservation management plan of Botanical Garden
and Eco-park, Sitakund, Chittagong, Bangladesh.
Brown, K. A. and Gurevitch, J. 2004. Long term impacts of logging on forest diversity in
Madagaskar. Proceedings of the National Academy of Sciences of the United States of America,
101 (16): 6045-6049.
CBD, 1992. Convention of Biological Diversity-Article 2.
Curtis, J.T. 1959. The vegetation of Wisconsin: An ordination of plant communities. Madison,
Wisconsin: University Wisconsin Press.657 pp.
53
FD (Forest Department) & MOEF (Ministry of Environment and Forests). 2000. Project document on
establishment of Sitakund Botanical Garden and Eco-park, Chittagong, Government of the
Peoples’ Republic of Bangladesh.
FMP (Forestry Master Plan: Forest Production). 1992. Government of Bangladesh Ministry of
Environment and Forests. UNDP/FAO BGD 88/025, Dhaka, Bangladesh.
FD (Forest Department). 2001a. Souvenir published on the inaugural occasion of the Botanical
Garden and Eco-park, Sitakund, Chittagong (in Bangla). Forest Department. Ministry of
Environment and Forests. Government of the People’s Republic of Bangladesh.
FAO. 2006. Global Forest Resource Assessment 2005- Progress towards sustainable forest
management. FAO Forestry Paper 147, FAO, Rome, Italy.320 pp.
Firoz, R., Mobasher, S.M., Waliuzzaman, M. and Alam, M.K. (eds). 2004. Proceedings of the
Regional Workshops on National Biodiversity Strategy and Action Plan. IUCN Bangladesh
Country Office, Dhaka.167 pp.
Ghani, A. 1998. Medicinal plants of Bangladesh- Chemical Constituents and uses. Asiatic society of
Bangladesh, Dhaka. 460 pp.
Haque, A. Nandy, P. and Ahmed, F. U. 1997. Forest genetic resource composition and utilization in
Bangladesh. In: M. G. Hosain, R. K. Arora and P. N. Mathur, (eds.), Plant genetic resources-
Bangladesh Perspective. Proceeding of a national workshop on Plant genetic resources. BARC.
Dhaka. 104-132 pp.
Haque, Md. S. 2004. Unpublished, Report on existing flora and fauna at Botanical Garden & Eco-
park, Sitakund, Chittagong.
Hassan, M. M. 1995. Biodiversity conservation and management in Bangladesh: A State of the Art
Review paper submitted to ICIMOD, Katmundu, Nepal.
Hossain, M.K. 2001. Overview of the forest biodiversity in Bangladesh. In: Assessment,
Conservation and Sustainable Use of Forest Biodiversity (CBD Technical Series no.3).SCBD,
Montreal, Canada. 33-35 pp.
54
Hossain, M.K. 2005. Conversion of Dipterocarps dominant natural forests to short rotation
plantations-an unrecoverable threat to the native Dipterocarps in Bangladesh. Paper presented at
APAFRI Conference [URL: http://www.apafri.org/8thdip/Session%204/S4_Hossain.doc].
Hossain, M.K., Hossain, M. and Alam, M.K. 1996. Diversity and structural composition of trees in
Bamu reserved forest of Cox’s Bazar forest division, Bangladesh Journal of Forest Science.
Hossain, M. K., Rahman, M. L., Haque, A.T.M. R. and Alam, M. K. 2004. Comparative regeneration
status in a natural forest and enrichment plantations of Chittagong (South) Forest Division,
Bangladesh. Journal of Forestry Research, 15 (4): 255-260.
Islam, M.M., Amin, A.S.M.R. and Sarker, S.K. 2003. National report on alien invasive species of
Bangladesh. In: N. Pallewatta, J.K Reaser and A.T. Gutierrez (eds.), Invasive alien species in
South-Southeast Asia: National Reports & Directory of Resources. Global Invasive Species
Programme (GISP), Cape Town, South Africa. 7-24 pp.
IUCN. 1984. Threatened Plants News Letter. 13th August. 2 pp.
Kadavul, K. and Parthasarathy, N. 1999. Plant biodiversity and conservation of tropical semi-
evergreen forest in the Shervarayan Hills of Eastern Ghats, India. Biodiversity and Conservation,
8: 421-439.
Khan, M.A.S.A.U., M.B., Uddin, M.S., Chowdhury, M.S.H. and Mukul, S.A. 2007. Distribution and
status of forests in the tropic: Bangladesh Perspective. The Proceedings of the Pakistan Academy
of Sciences, 44: 145-153 pp.
Khan, M.S. 1977. Flora of Bangladesh, Report No: 4, Camelinanceae. Bangladesh National
Herbarium (BNH) and Bangladesh Agriculture Research Council (BARC), Farmgate, Dhaka.
Khan, M.S. 1991a. The vegetation of Bangladesh. In: S.I. Ali and A. Gaffar (eds.), Plants Life of
South Asia. 185-192 pp.
Khan, M.S. 1991b. Angiosperms. In: Islam, A.K.M.N. (ed.), Two Centuries of Botanical Studies in
Bangladesh and Neighboring Region. Asiatic Society of Bangladesh.175-194 pp.
Khan, M. S. 1991c. National conservation strategy of Bangladesh- towards Sustainable development:
Genetic resource in Bangladesh. Bangladesh Agricultural Research Council, International Union
55
for Conservation of nature and Natural Resources, The World Conservation union. Dhaka 1991.
162-172 pp.
Kumar, U. and Asija, M. J. 2000. Biodiversity principles & conservation. Agro bios, New Delhi, India.
242 pp.
Kumar, A and Ram, J. 2005. Anthropogenic disturbances and plant biodiversity in forests of
Uttaranchal, central Himalaya. Biodiversity and Conservation, 14: 309-331.
Magurran, A.F. 1988. Ecological Diversity and its measurement. Princeton University Press,
Princeton, New Jersey.145-146 pp.
Michael, P. 1990. Ecological Methods for Field and Laboratory Investigations. Tata McGraw-Hill
Publishing Company Limited, New Delhi. 404 pp.
Mishra, B.P., Tripathi, R.S., Tripathi, O.P. and Pandey, H.N. 2003. Effect of disturbance on the
vegetation of four dominant and economically important woody species in a broadleaved
subtropical humid forest of Meghalaya, northeast India. Current Science, 84 (11): 1449-1453.
Mittermeier, R.A., Myers, N., Thomsen, J.B., Da Fonseca, G.A. and Olivieri, S. 1998. Biodiversity
hotspots and major tropical wilderness areas: approaches to setting conservation priorities.
Conservation Biology, 12: 516-520.
Misbahuzzaman, K. 2004. A country report on potentiality and prospects of CDM forestry in
Bangladesh. In: Youn, Y. (ed.), Proceedings of the International Workshop on Climate Change
and Forest Factor: Clean Development Mechanism in Tropical Countries. Seoul, Republic of
Korea, 81-95 pp.
Misbahuzzaman, K. and Alam, M. J. 2006. Ecological restoration of rainforest through aided natural
regeneration in the denuded hills of Sitakund, Chittagong, Bangladesh. International Journal of
Agriculture and Biology, 8 (1): 778-782.
Nath, Tapan K. and Alauddin M. 2005. Sitakund Botanical Garden and Eco-park, Chittagong,
Bangladesh: Its impacts on a rural community. International Journal of Biodiversity Science and
Management, 1: 1-11.
56
Nath, S. 2003, Unpublished. Investigate the impacts of protected area management system on
biodiversity conservation in the Sitakund Botanical Garden and Eco-park, Chittagong,
Bangladesh.
Nath, P.C., Arunachalam, A., Khan, M.L., Arunachalam, K. and Barbhuiya, A.R. 2005. Vegetation
analysis and tree population structure of tropical wet evergreen forests in and around Namdapha
National Park, northeast India. Biodiversity and Conservation, 14: 2109-2136 pp.
Nishat, A., Huq, S.M.I., Barua, S.P., Reza, A.H.M.A. and Khan, A.S.M. 2002. Bio-ecological Zones
of Bangladesh. World Conservation Union, Dhaka, Bangladesh.141 pp.
NSP. 2006. Protected Areas of Bangladesh: A visitor’s guide.Nishorgo Support Project, Dhaka.41
pp.
Pandey, SK and Shukla, RP. 2003. Plant diversity in managed Sal (Shorea robusta Gaertn.) forests of
Gorakhpur, India: species composition, regeneration and conservation. Biodiversity and
Conservation, 12: 2295-2319.
Parthasarathy, N. 1999. Tree diversity and distribution in undisturbed and human- impacted sites of
tropical wet evergreen forest in Southern Western Ghats, South India. Biodiversity and
Conservation, 8: 1365-1381.
Phillips, E.A. 1959. Methods of vegetation study. Henry Holt and Co.Inc.107 pp.
Roy, M.K. 2005. Nishorgo Support Project: Designing a co-management model for the protected
areas of Bangladesh. In: Nishorgo-Protected Area Management Program of Bangladesh. Dhaka,
Bangladesh. 1-5 pp.
Ruskin, F.R. (ed.). 1992. Conserving Biodiversity: A research agenda for development agencies.
National Academy Press, Washington, DC. USA. 13-23 pp.
Rahman, M. L. and Hossain, M. K. 2002. Distribution pattern of different medicinal plants species In
Chunati Wild life Sanctuary of Chittagong. Journal of Tropical Medicinal plants. 3 (1): 65-72.
Rahman, MD. M, Nishat, A. and Vacik, H. 2009. Anthropogenic disturbances and biological
diversity of the Madhupur Sal forest (Shorea robusta) of Bangladesh. International Journal of
Biodiversity Science and Management (Accepted).
57
Siddiqui, N.A. and Faizuddin, M. 1981. Distribution and population status of some mammals in
Bangladesh. Bano Biggyan Patrika, 10 (1&2): 33-38.
Simpson, E.H. 1949. Measurement of diversity. Nature, 163: 688.
Trivedi, P.R. 2000. Global diversity. New Delhi, India.314 pp.
Troup, R.S.1921.The Silviculture of Indian Trees. Oxford Clarendon Press.
Van Schendel, W. (ed.) 1992. Francies Buchanan in Southeast Bengal (1798): His journey to
Chittagong, the Chittagong Hill Tracts, Noakhali and Comilla. The University Press Limited,
Dhaka, Bangladesh. 209 pp.
http://mychittagong.net (2nd
June, 2009)
http://images.google.com/imgres (2nd
June, 2009)
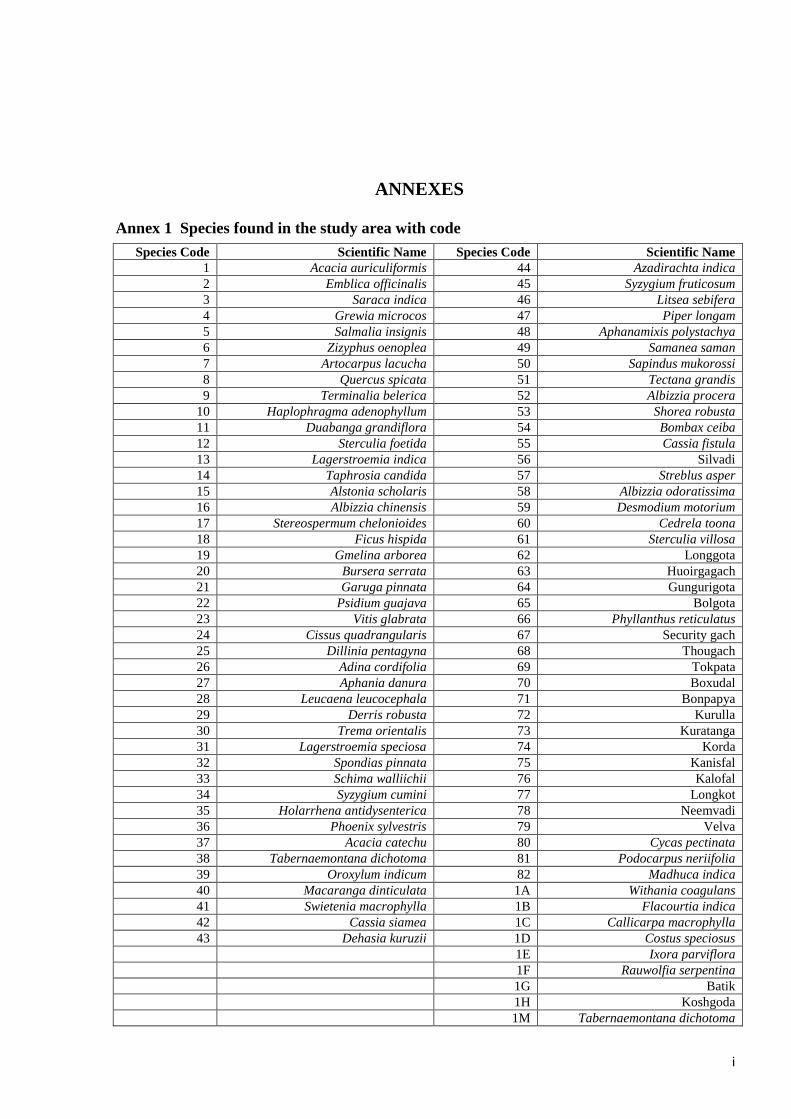
i
ANNEXES
Annex 1 Species found in the study area with code
Species Code Scientific Name Species Code Scientific Name
1 Acacia auriculiformis 44 Azadirachta indica
2 Emblica officinalis 45 Syzygium fruticosum
3 Saraca indica 46 Litsea sebifera
4 Grewia microcos 47 Piper longam
5 Salmalia insignis 48 Aphanamixis polystachya
6 Zizyphus oenoplea 49 Samanea saman
7 Artocarpus lacucha 50 Sapindus mukorossi
8 Quercus spicata 51 Tectana grandis
9 Terminalia belerica 52 Albizzia procera
10 Haplophragma adenophyllum 53 Shorea robusta
11 Duabanga grandiflora 54 Bombax ceiba
12 Sterculia foetida 55 Cassia fistula
13 Lagerstroemia indica 56 Silvadi
14 Taphrosia candida 57 Streblus asper
15 Alstonia scholaris 58 Albizzia odoratissima
16 Albizzia chinensis 59 Desmodium motorium
17 Stereospermum chelonioides 60 Cedrela toona
18 Ficus hispida 61 Sterculia villosa
19 Gmelina arborea 62 Longgota
20 Bursera serrata 63 Huoirgagach
21 Garuga pinnata 64 Gungurigota
22 Psidium guajava 65 Bolgota
23 Vitis glabrata 66 Phyllanthus reticulatus
24 Cissus quadrangularis 67 Security gach
25 Dillinia pentagyna 68 Thougach
26 Adina cordifolia 69 Tokpata
27 Aphania danura 70 Boxudal
28 Leucaena leucocephala 71 Bonpapya
29 Derris robusta 72 Kurulla
30 Trema orientalis 73 Kuratanga
31 Lagerstroemia speciosa 74 Korda
32 Spondias pinnata 75 Kanisfal
33 Schima walliichii 76 Kalofal
34 Syzygium cumini 77 Longkot
35 Holarrhena antidysenterica 78 Neemvadi
36 Phoenix sylvestris 79 Velva
37 Acacia catechu 80 Cycas pectinata
38 Tabernaemontana dichotoma 81 Podocarpus neriifolia
39 Oroxylum indicum 82 Madhuca indica
40 Macaranga dinticulata 1A Withania coagulans
41 Swietenia macrophylla 1B Flacourtia indica
42 Cassia siamea 1C Callicarpa macrophylla
43 Dehasia kuruzii 1D Costus speciosus
1E Ixora parviflora
1F Rauwolfia serpentina
1G Batik
1H Koshgoda
1M Tabernaemontana dichotoma
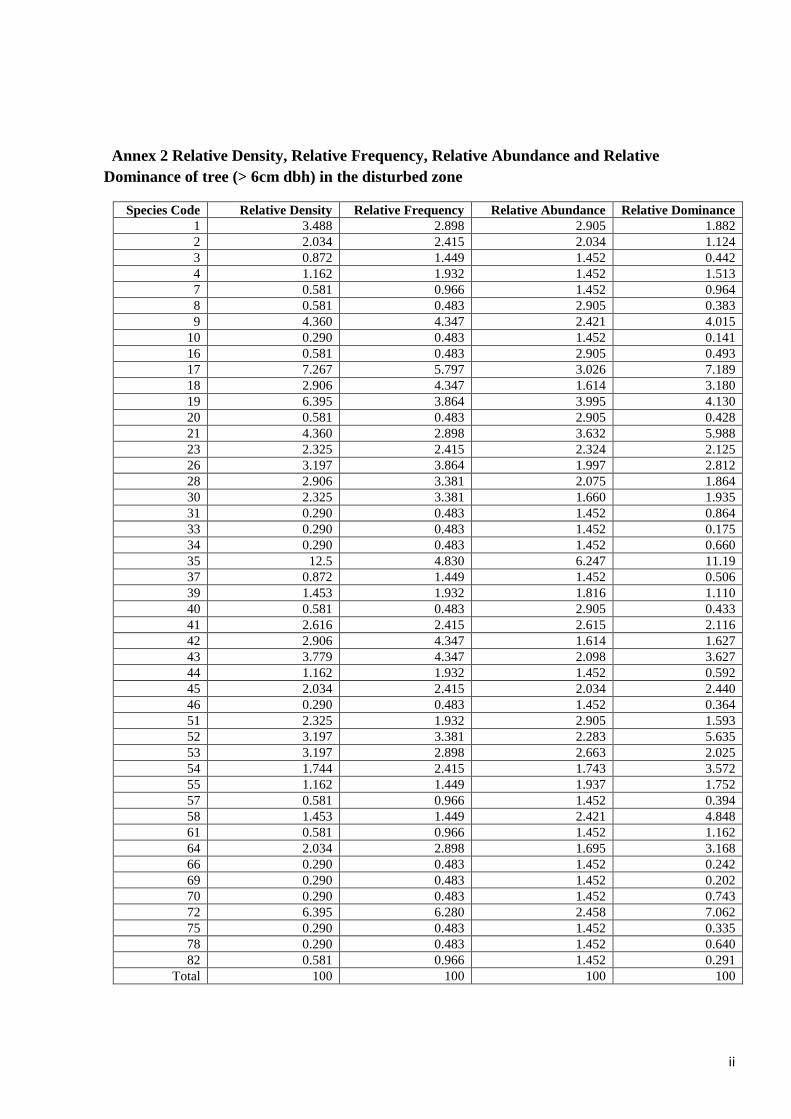
ii
Annex 2 Relative Density, Relative Frequency, Relative Abundance and Relative
Dominance of tree (> 6cm dbh) in the disturbed zone
Species Code Relative Density Relative Frequency Relative Abundance Relative Dominance
1 3.488 2.898 2.905 1.882
2 2.034 2.415 2.034 1.124
3 0.872 1.449 1.452 0.442
4 1.162 1.932 1.452 1.513
7 0.581 0.966 1.452 0.964
8 0.581 0.483 2.905 0.383
9 4.360 4.347 2.421 4.015
10 0.290 0.483 1.452 0.141
16 0.581 0.483 2.905 0.493
17 7.267 5.797 3.026 7.189
18 2.906 4.347 1.614 3.180
19 6.395 3.864 3.995 4.130
20 0.581 0.483 2.905 0.428
21 4.360 2.898 3.632 5.988
23 2.325 2.415 2.324 2.125
26 3.197 3.864 1.997 2.812
28 2.906 3.381 2.075 1.864
30 2.325 3.381 1.660 1.935
31 0.290 0.483 1.452 0.864
33 0.290 0.483 1.452 0.175
34 0.290 0.483 1.452 0.660
35 12.5 4.830 6.247 11.19
37 0.872 1.449 1.452 0.506
39 1.453 1.932 1.816 1.110
40 0.581 0.483 2.905 0.433
41 2.616 2.415 2.615 2.116
42 2.906 4.347 1.614 1.627
43 3.779 4.347 2.098 3.627
44 1.162 1.932 1.452 0.592
45 2.034 2.415 2.034 2.440
46 0.290 0.483 1.452 0.364
51 2.325 1.932 2.905 1.593
52 3.197 3.381 2.283 5.635
53 3.197 2.898 2.663 2.025
54 1.744 2.415 1.743 3.572
55 1.162 1.449 1.937 1.752
57 0.581 0.966 1.452 0.394
58 1.453 1.449 2.421 4.848
61 0.581 0.966 1.452 1.162
64 2.034 2.898 1.695 3.168
66 0.290 0.483 1.452 0.242
69 0.290 0.483 1.452 0.202
70 0.290 0.483 1.452 0.743
72 6.395 6.280 2.458 7.062
75 0.290 0.483 1.452 0.335
78 0.290 0.483 1.452 0.640
82 0.581 0.966 1.452 0.291
Total 100 100 100 100
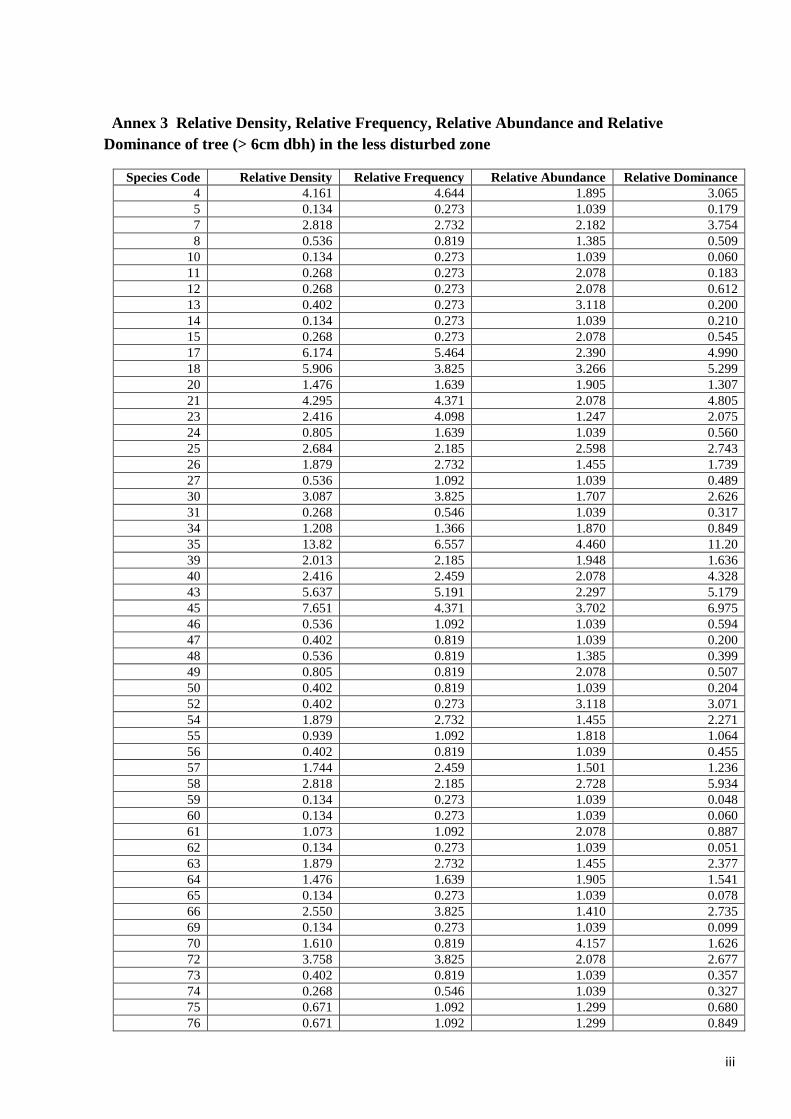
iii
Annex 3 Relative Density, Relative Frequency, Relative Abundance and Relative
Dominance of tree (> 6cm dbh) in the less disturbed zone
Species Code Relative Density Relative Frequency Relative Abundance Relative Dominance
4 4.161 4.644 1.895 3.065
5 0.134 0.273 1.039 0.179
7 2.818 2.732 2.182 3.754
8 0.536 0.819 1.385 0.509
10 0.134 0.273 1.039 0.060
11 0.268 0.273 2.078 0.183
12 0.268 0.273 2.078 0.612
13 0.402 0.273 3.118 0.200
14 0.134 0.273 1.039 0.210
15 0.268 0.273 2.078 0.545
17 6.174 5.464 2.390 4.990
18 5.906 3.825 3.266 5.299
20 1.476 1.639 1.905 1.307
21 4.295 4.371 2.078 4.805
23 2.416 4.098 1.247 2.075
24 0.805 1.639 1.039 0.560
25 2.684 2.185 2.598 2.743
26 1.879 2.732 1.455 1.739
27 0.536 1.092 1.039 0.489
30 3.087 3.825 1.707 2.626
31 0.268 0.546 1.039 0.317
34 1.208 1.366 1.870 0.849
35 13.82 6.557 4.460 11.20
39 2.013 2.185 1.948 1.636
40 2.416 2.459 2.078 4.328
43 5.637 5.191 2.297 5.179
45 7.651 4.371 3.702 6.975
46 0.536 1.092 1.039 0.594
47 0.402 0.819 1.039 0.200
48 0.536 0.819 1.385 0.399
49 0.805 0.819 2.078 0.507
50 0.402 0.819 1.039 0.204
52 0.402 0.273 3.118 3.071
54 1.879 2.732 1.455 2.271
55 0.939 1.092 1.818 1.064
56 0.402 0.819 1.039 0.455
57 1.744 2.459 1.501 1.236
58 2.818 2.185 2.728 5.934
59 0.134 0.273 1.039 0.048
60 0.134 0.273 1.039 0.060
61 1.073 1.092 2.078 0.887
62 0.134 0.273 1.039 0.051
63 1.879 2.732 1.455 2.377
64 1.476 1.639 1.905 1.541
65 0.134 0.273 1.039 0.078
66 2.550 3.825 1.410 2.735
69 0.134 0.273 1.039 0.099
70 1.610 0.819 4.157 1.626
72 3.758 3.825 2.078 2.677
73 0.402 0.819 1.039 0.357
74 0.268 0.546 1.039 0.327
75 0.671 1.092 1.299 0.680
76 0.671 1.092 1.299 0.849
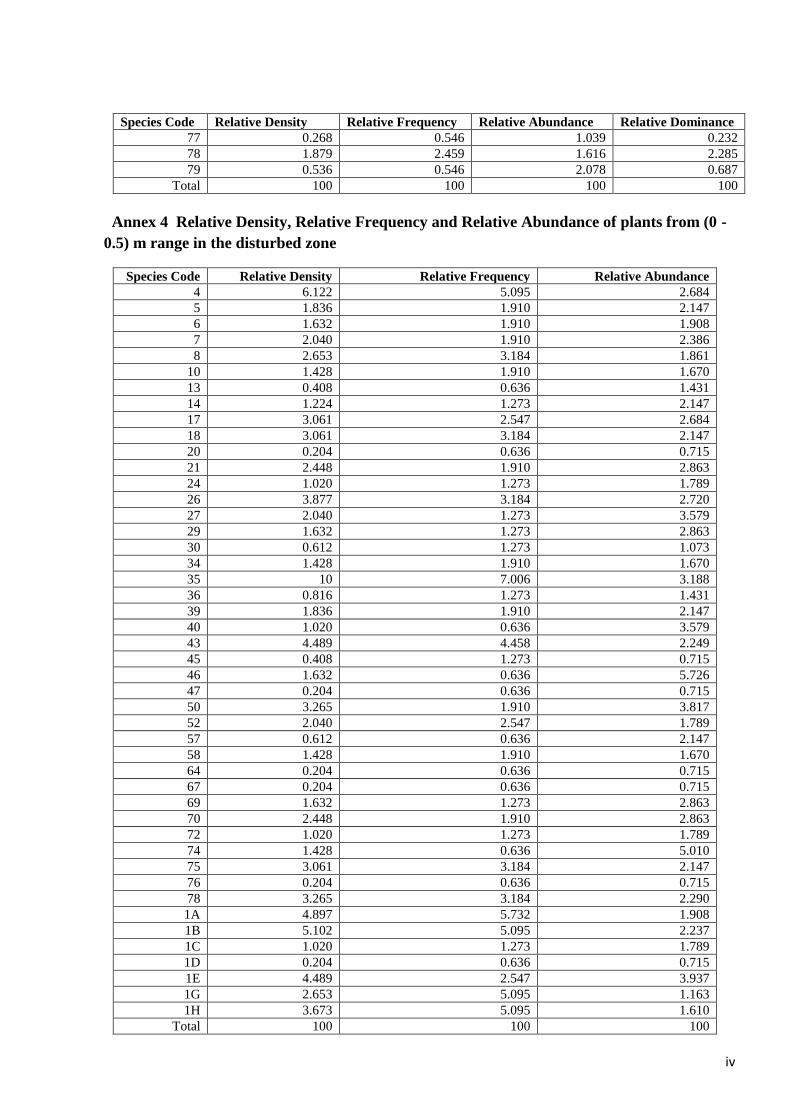
iv
Species Code Relative Density Relative Frequency Relative Abundance Relative Dominance
77 0.268 0.546 1.039 0.232
78 1.879 2.459 1.616 2.285
79 0.536 0.546 2.078 0.687
Total 100 100 100 100
Annex 4 Relative Density, Relative Frequency and Relative Abundance of plants from (0 -
0.5) m range in the disturbed zone
Species Code Relative Density Relative Frequency Relative Abundance
4 6.122 5.095 2.684
5 1.836 1.910 2.147
6 1.632 1.910 1.908
7 2.040 1.910 2.386
8 2.653 3.184 1.861
10 1.428 1.910 1.670
13 0.408 0.636 1.431
14 1.224 1.273 2.147
17 3.061 2.547 2.684
18 3.061 3.184 2.147
20 0.204 0.636 0.715
21 2.448 1.910 2.863
24 1.020 1.273 1.789
26 3.877 3.184 2.720
27 2.040 1.273 3.579
29 1.632 1.273 2.863
30 0.612 1.273 1.073
34 1.428 1.910 1.670
35 10 7.006 3.188
36 0.816 1.273 1.431
39 1.836 1.910 2.147
40 1.020 0.636 3.579
43 4.489 4.458 2.249
45 0.408 1.273 0.715
46 1.632 0.636 5.726
47 0.204 0.636 0.715
50 3.265 1.910 3.817
52 2.040 2.547 1.789
57 0.612 0.636 2.147
58 1.428 1.910 1.670
64 0.204 0.636 0.715
67 0.204 0.636 0.715
69 1.632 1.273 2.863
70 2.448 1.910 2.863
72 1.020 1.273 1.789
74 1.428 0.636 5.010
75 3.061 3.184 2.147
76 0.204 0.636 0.715
78 3.265 3.184 2.290
1A 4.897 5.732 1.908
1B 5.102 5.095 2.237
1C 1.020 1.273 1.789
1D 0.204 0.636 0.715
1E 4.489 2.547 3.937
1G 2.653 5.095 1.163
1H 3.673 5.095 1.610
Total 100 100 100
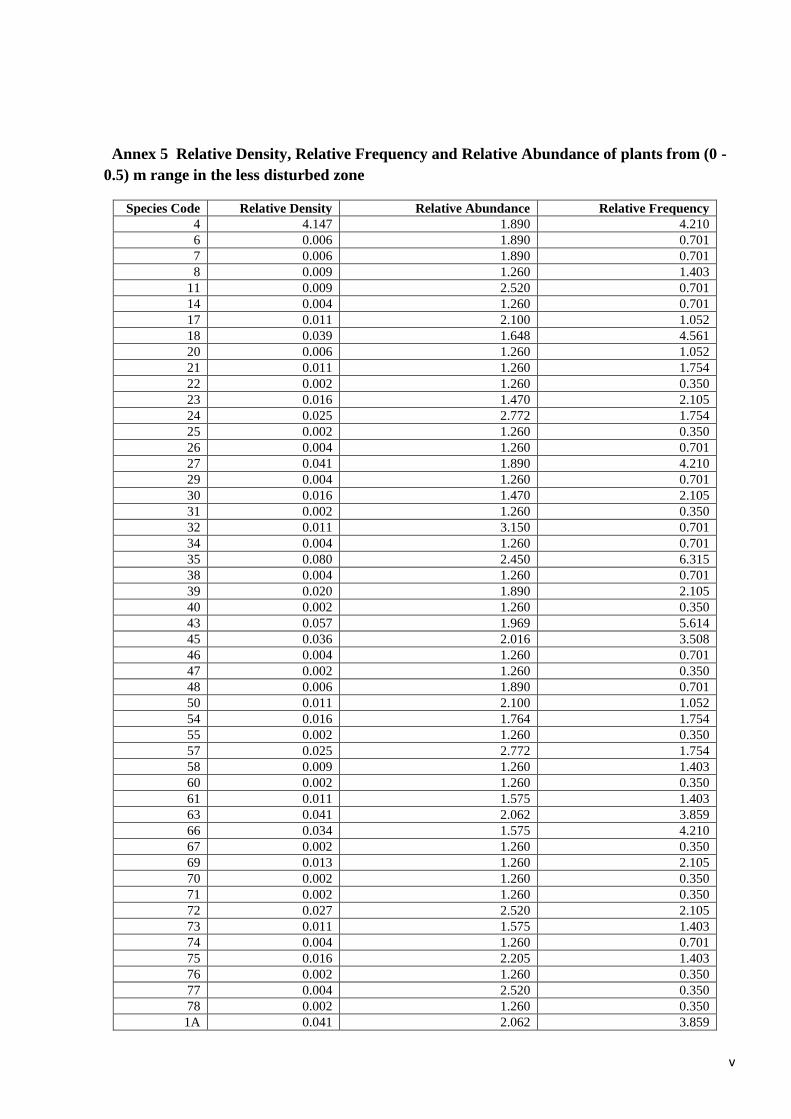
v
Annex 5 Relative Density, Relative Frequency and Relative Abundance of plants from (0 -
0.5) m range in the less disturbed zone
Species Code Relative Density Relative Abundance Relative Frequency
4 4.147 1.890 4.210
6 0.006 1.890 0.701
7 0.006 1.890 0.701
8 0.009 1.260 1.403
11 0.009 2.520 0.701
14 0.004 1.260 0.701
17 0.011 2.100 1.052
18 0.039 1.648 4.561
20 0.006 1.260 1.052
21 0.011 1.260 1.754
22 0.002 1.260 0.350
23 0.016 1.470 2.105
24 0.025 2.772 1.754
25 0.002 1.260 0.350
26 0.004 1.260 0.701
27 0.041 1.890 4.210
29 0.004 1.260 0.701
30 0.016 1.470 2.105
31 0.002 1.260 0.350
32 0.011 3.150 0.701
34 0.004 1.260 0.701
35 0.080 2.450 6.315
38 0.004 1.260 0.701
39 0.020 1.890 2.105
40 0.002 1.260 0.350
43 0.057 1.969 5.614
45 0.036 2.016 3.508
46 0.004 1.260 0.701
47 0.002 1.260 0.350
48 0.006 1.890 0.701
50 0.011 2.100 1.052
54 0.016 1.764 1.754
55 0.002 1.260 0.350
57 0.025 2.772 1.754
58 0.009 1.260 1.403
60 0.002 1.260 0.350
61 0.011 1.575 1.403
63 0.041 2.062 3.859
66 0.034 1.575 4.210
67 0.002 1.260 0.350
69 0.013 1.260 2.105
70 0.002 1.260 0.350
71 0.002 1.260 0.350
72 0.027 2.520 2.105
73 0.011 1.575 1.403
74 0.004 1.260 0.701
75 0.016 2.205 1.403
76 0.002 1.260 0.350
77 0.004 2.520 0.350
78 0.002 1.260 0.350
1A 0.041 2.062 3.859
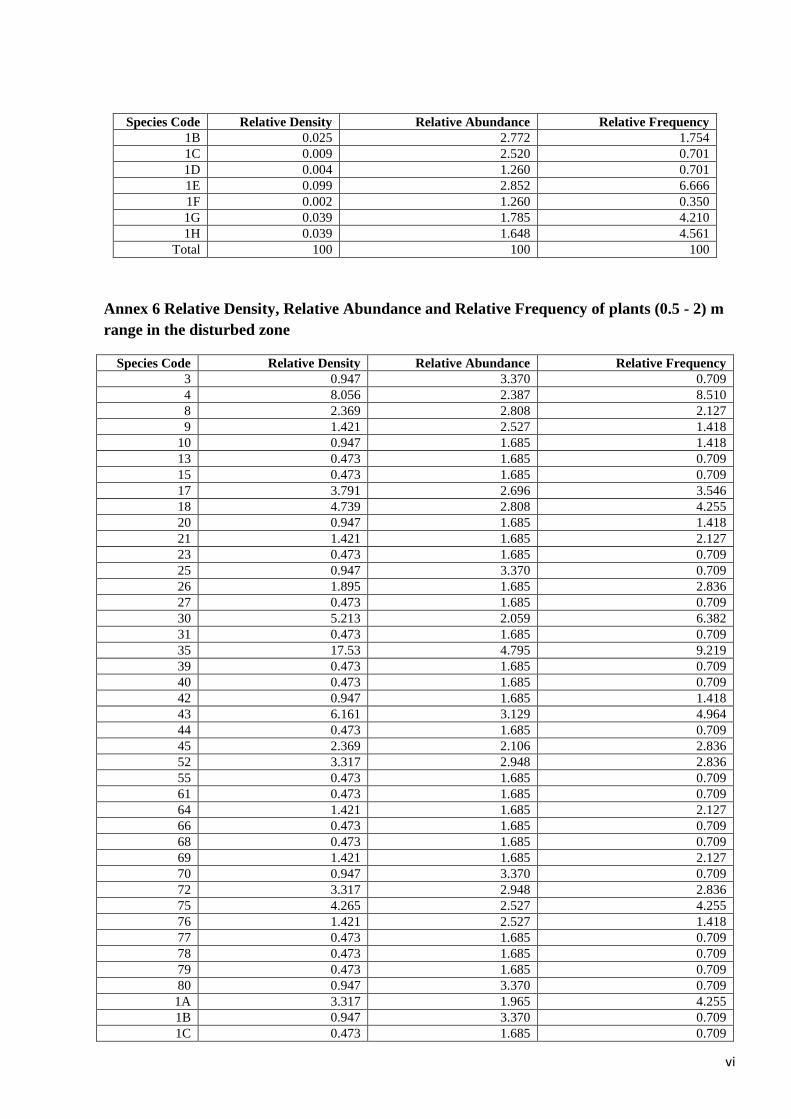
vi
Species Code Relative Density Relative Abundance Relative Frequency
1B 0.025 2.772 1.754
1C 0.009 2.520 0.701
1D 0.004 1.260 0.701
1E 0.099 2.852 6.666
1F 0.002 1.260 0.350
1G 0.039 1.785 4.210
1H 0.039 1.648 4.561
Total 100 100 100
Annex 6 Relative Density, Relative Abundance and Relative Frequency of plants (0.5 - 2) m
range in the disturbed zone
Species Code Relative Density Relative Abundance Relative Frequency
3 0.947 3.370 0.709
4 8.056 2.387 8.510
8 2.369 2.808 2.127
9 1.421 2.527 1.418
10 0.947 1.685 1.418
13 0.473 1.685 0.709
15 0.473 1.685 0.709
17 3.791 2.696 3.546
18 4.739 2.808 4.255
20 0.947 1.685 1.418
21 1.421 1.685 2.127
23 0.473 1.685 0.709
25 0.947 3.370 0.709
26 1.895 1.685 2.836
27 0.473 1.685 0.709
30 5.213 2.059 6.382
31 0.473 1.685 0.709
35 17.53 4.795 9.219
39 0.473 1.685 0.709
40 0.473 1.685 0.709
42 0.947 1.685 1.418
43 6.161 3.129 4.964
44 0.473 1.685 0.709
45 2.369 2.106 2.836
52 3.317 2.948 2.836
55 0.473 1.685 0.709
61 0.473 1.685 0.709
64 1.421 1.685 2.127
66 0.473 1.685 0.709
68 0.473 1.685 0.709
69 1.421 1.685 2.127
70 0.947 3.370 0.709
72 3.317 2.948 2.836
75 4.265 2.527 4.255
76 1.421 2.527 1.418
77 0.473 1.685 0.709
78 0.473 1.685 0.709
79 0.473 1.685 0.709
80 0.947 3.370 0.709
1A 3.317 1.965 4.255
1B 0.947 3.370 0.709
1C 0.473 1.685 0.709
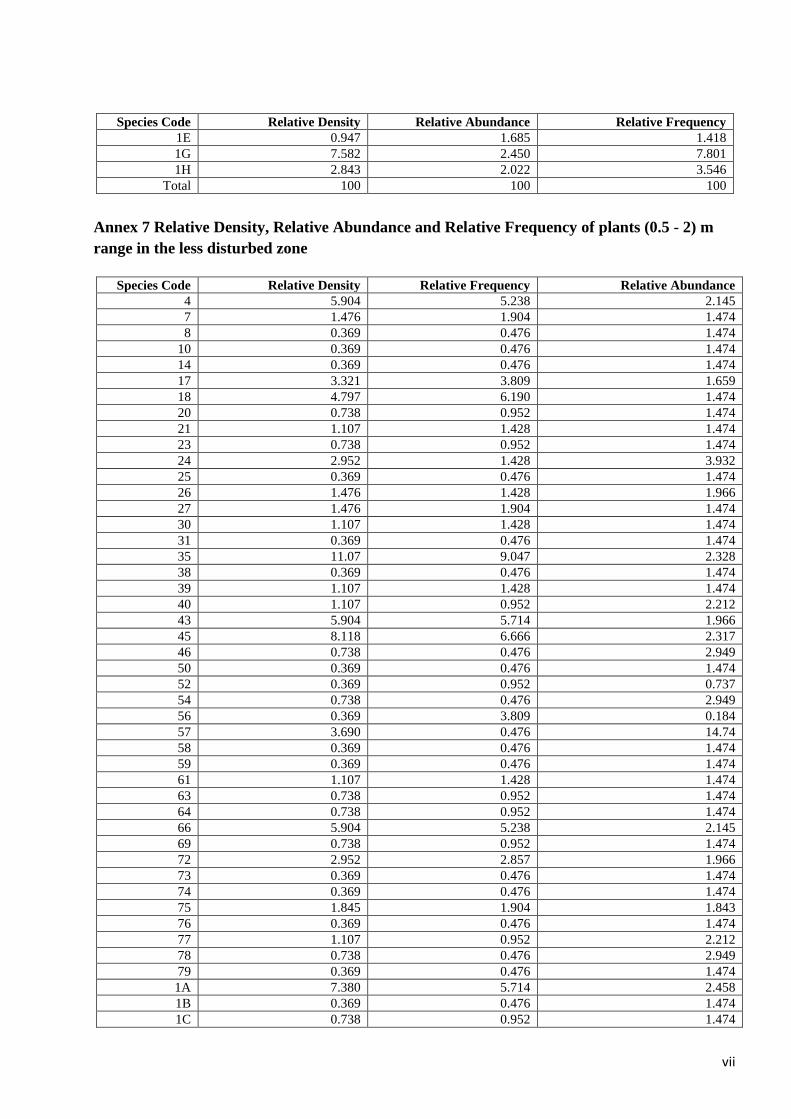
vii
Species Code Relative Density Relative Abundance Relative Frequency
1E 0.947 1.685 1.418
1G 7.582 2.450 7.801
1H 2.843 2.022 3.546
Total 100 100 100
Species Code Relative Density Relative Frequency Relative Abundance
4 5.904 5.238 2.145
7 1.476 1.904 1.474
8 0.369 0.476 1.474
10 0.369 0.476 1.474
14 0.369 0.476 1.474
17 3.321 3.809 1.659
18 4.797 6.190 1.474
20 0.738 0.952 1.474
21 1.107 1.428 1.474
23 0.738 0.952 1.474
24 2.952 1.428 3.932
25 0.369 0.476 1.474
26 1.476 1.428 1.966
27 1.476 1.904 1.474
30 1.107 1.428 1.474
31 0.369 0.476 1.474
35 11.07 9.047 2.328
38 0.369 0.476 1.474
39 1.107 1.428 1.474
40 1.107 0.952 2.212
43 5.904 5.714 1.966
45 8.118 6.666 2.317
46 0.738 0.476 2.949
50 0.369 0.476 1.474
52 0.369 0.952 0.737
54 0.738 0.476 2.949
56 0.369 3.809 0.184
57 3.690 0.476 14.74
58 0.369 0.476 1.474
59 0.369 0.476 1.474
61 1.107 1.428 1.474
63 0.738 0.952 1.474
64 0.738 0.952 1.474
66 5.904 5.238 2.145
69 0.738 0.952 1.474
72 2.952 2.857 1.966
73 0.369 0.476 1.474
74 0.369 0.476 1.474
75 1.845 1.904 1.843
76 0.369 0.476 1.474
77 1.107 0.952 2.212
78 0.738 0.476 2.949
79 0.369 0.476 1.474
1A 7.380 5.714 2.458
1B 0.369 0.476 1.474
1C 0.738 0.952 1.474
Annex 7 Relative Density, Relative Abundance and Relative Frequency of plants (0.5 - 2) m
range in the less disturbed zone
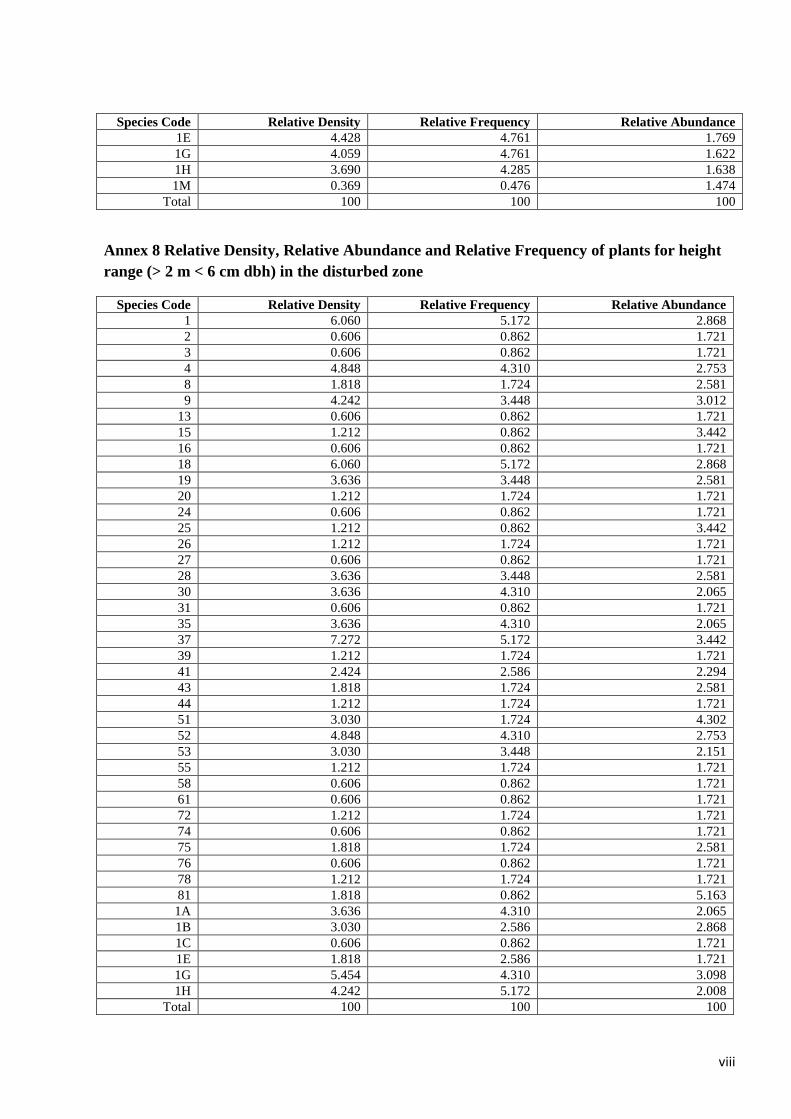
viii
Species Code Relative Density Relative Frequency Relative Abundance
1E 4.428 4.761 1.769
1G 4.059 4.761 1.622
1H 3.690 4.285 1.638
1M 0.369 0.476 1.474
Total 100 100 100
Annex 8 Relative Density, Relative Abundance and Relative Frequency of plants for height
range (> 2 m < 6 cm dbh) in the disturbed zone
Species Code Relative Density Relative Frequency Relative Abundance
1 6.060 5.172 2.868
2 0.606 0.862 1.721
3 0.606 0.862 1.721
4 4.848 4.310 2.753
8 1.818 1.724 2.581
9 4.242 3.448 3.012
13 0.606 0.862 1.721
15 1.212 0.862 3.442
16 0.606 0.862 1.721
18 6.060 5.172 2.868
19 3.636 3.448 2.581
20 1.212 1.724 1.721
24 0.606 0.862 1.721
25 1.212 0.862 3.442
26 1.212 1.724 1.721
27 0.606 0.862 1.721
28 3.636 3.448 2.581
30 3.636 4.310 2.065
31 0.606 0.862 1.721
35 3.636 4.310 2.065
37 7.272 5.172 3.442
39 1.212 1.724 1.721
41 2.424 2.586 2.294
43 1.818 1.724 2.581
44 1.212 1.724 1.721
51 3.030 1.724 4.302
52 4.848 4.310 2.753
53 3.030 3.448 2.151
55 1.212 1.724 1.721
58 0.606 0.862 1.721
61 0.606 0.862 1.721
72 1.212 1.724 1.721
74 0.606 0.862 1.721
75 1.818 1.724 2.581
76 0.606 0.862 1.721
78 1.212 1.724 1.721
81 1.818 0.862 5.163
1A 3.636 4.310 2.065
1B 3.030 2.586 2.868
1C 0.606 0.862 1.721
1E 1.818 2.586 1.721
1G 5.454 4.310 3.098
1H 4.242 5.172 2.008
Total 100 100 100
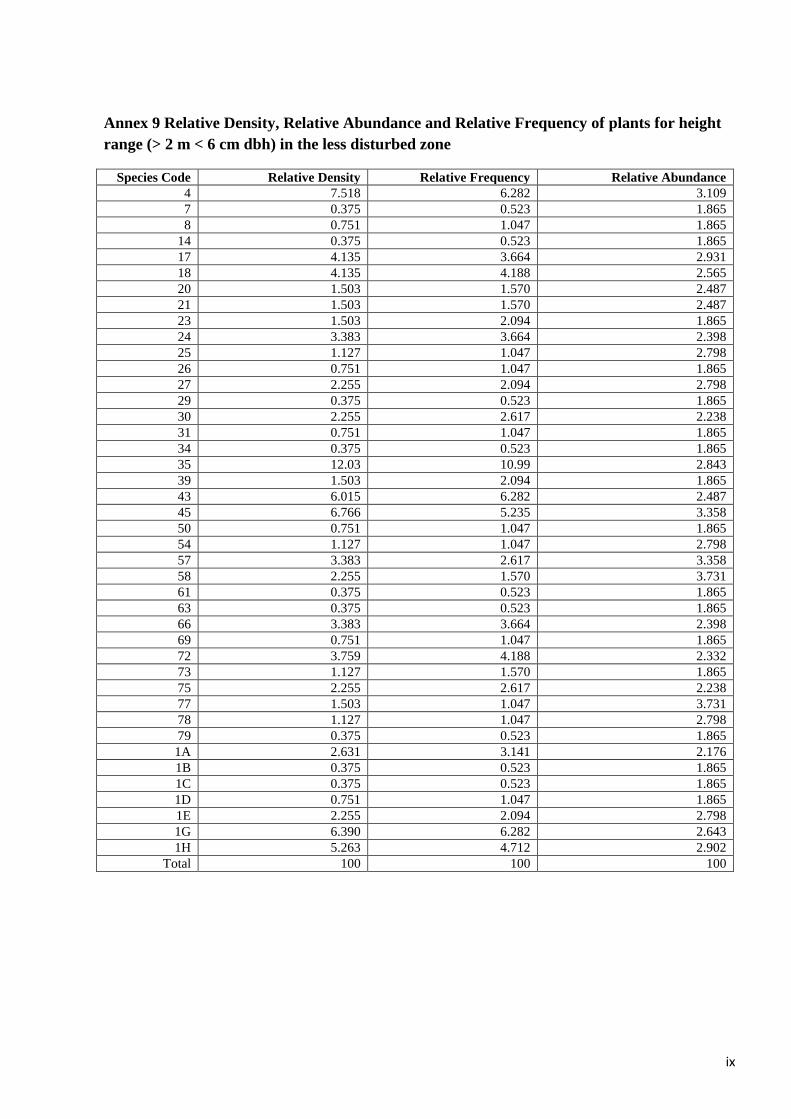
ix
Annex 9 Relative Density, Relative Abundance and Relative Frequency of plants for height
range (> 2 m < 6 cm dbh) in the less disturbed zone
Species Code Relative Density Relative Frequency Relative Abundance
4 7.518 6.282 3.109
7 0.375 0.523 1.865
8 0.751 1.047 1.865
14 0.375 0.523 1.865
17 4.135 3.664 2.931
18 4.135 4.188 2.565
20 1.503 1.570 2.487
21 1.503 1.570 2.487
23 1.503 2.094 1.865
24 3.383 3.664 2.398
25 1.127 1.047 2.798
26 0.751 1.047 1.865
27 2.255 2.094 2.798
29 0.375 0.523 1.865
30 2.255 2.617 2.238
31 0.751 1.047 1.865
34 0.375 0.523 1.865
35 12.03 10.99 2.843
39 1.503 2.094 1.865
43 6.015 6.282 2.487
45 6.766 5.235 3.358
50 0.751 1.047 1.865
54 1.127 1.047 2.798
57 3.383 2.617 3.358
58 2.255 1.570 3.731
61 0.375 0.523 1.865
63 0.375 0.523 1.865
66 3.383 3.664 2.398
69 0.751 1.047 1.865
72 3.759 4.188 2.332
73 1.127 1.570 1.865
75 2.255 2.617 2.238
77 1.503 1.047 3.731
78 1.127 1.047 2.798
79 0.375 0.523 1.865
1A 2.631 3.141 2.176
1B 0.375 0.523 1.865
1C 0.375 0.523 1.865
1D 0.751 1.047 1.865
1E 2.255 2.094 2.798
1G 6.390 6.282 2.643
1H 5.263 4.712 2.902
Total 100 100 100

x
Annex 10 Some photos from field
Bamboo plantation in the Sitakund Botanical
Garden and Eco-park
Cane plantation in the Sitakund Botanical
Garden and Eco-park
Cycas sp., one of the gymnospermic species of
Bangladesh was found in the study area
Podocarpus neriifolius, another gymnospermic
species of Baangladesh was found in the study area
Children of local people are going for collecting fuel
wood from the study area
Betel leaf cultivation inside the study area
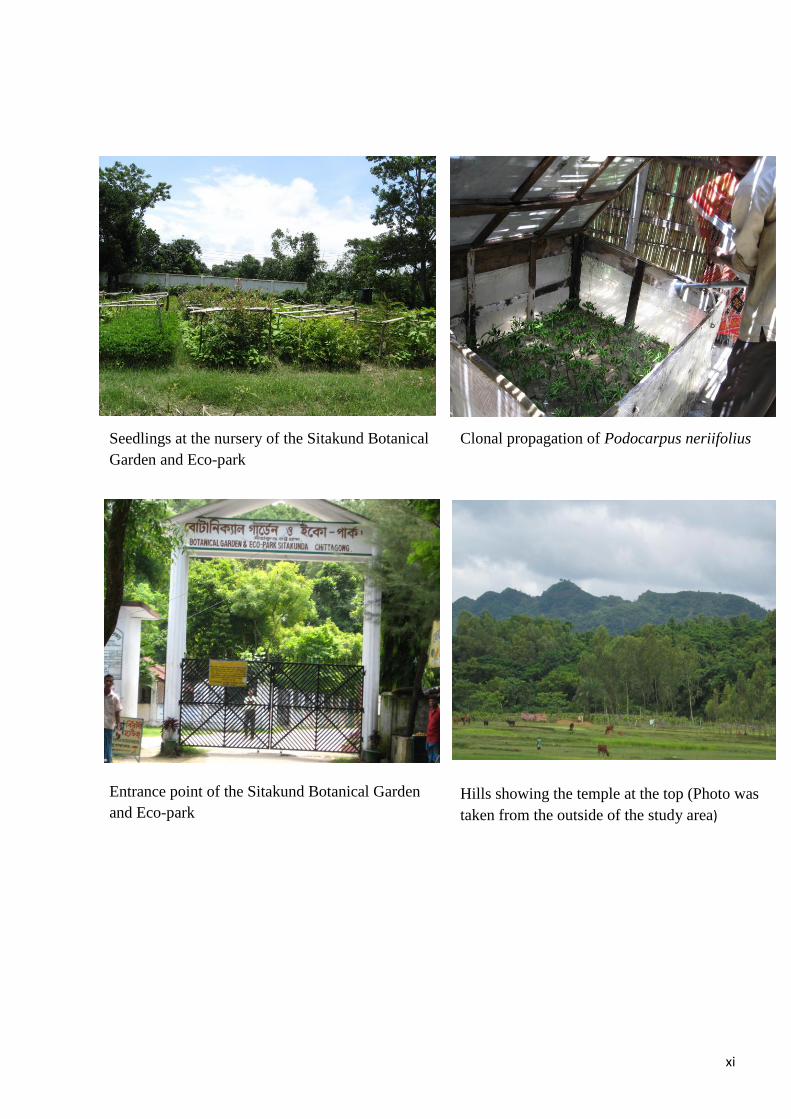
xi
Seedlings at the nursery of the Sitakund Botanical
Garden and Eco-park
Clonal propagation of Podocarpus neriifolius
Entrance point of the Sitakund Botanical Garden
and Eco-park
Hills showing the temple at the top (Photo was
taken from the outside of the study area)
Related Documents


