EmmaMae Hendrickson COMPARISON OF PRODUCT LAUNCH STRATEGIES FOR HOME GAMING CONSOLES Germany and Finland International Business 2018

Welcome message from author
This document is posted to help you gain knowledge. Please leave a comment to let me know what you think about it! Share it to your friends and learn new things together.
Transcript
EmmaMae Hendrickson
COMPARISON OF PRODUCT LAUNCH
STRATEGIES FOR HOME GAMING
CONSOLES Germany and Finland
International Business 2018
VAASAN AMMATTIKORKEAKOULU International Business
TIIVISTELMÄ
Tekijä EmmaMae Hendrickson Opinnäytetyön nimi Comparison of Product Launch Strategies for Home Gaming
Consoles: Germany and Finland Vuosi 2018 Kieli englanti Sivumäärä 42 + 1 liitettä Ohjaaja Ossi Koskinen Interaktiivinen viihdepeliteollisuus on jatkuvassa kasvussa ja kasvun ennustetaan jatkuvan edelleen. Merkittävä osa tätä alaa ovat pelikonsolit. Tämän opinnäytetyön tavoite on selvittää, miten uusia pelikonsoleita tulisi menestyksekkäästi julkaista Saksan ja Suomen markkinoilla.
Opinnäytetyön teoreettinen osuus käy läpi tuotejulkaisun perusteet ja tekijät, jotka on tärkeää huomioida. Teoriaosuudessa käsitellään myös Michael Porterin kilpai-lustrategiateoria sekä Yleisstrategiat, joiden pohjalta laatidaan toimiala-analyysi viihdepeli teollisuuden alasta.
Opinnäytetyön empiirisessä osassa analysoidaan opinnäytetyötä varten toteutetusta kyselytutkimuksesta. Kyselytutkimus toteutettiin yhdistäen sekä määrällistä, että laadullista menetelmää eli niin kutsutta monimeneltämätutkimusta. Tutkimusai-neisto kerättiin verkkokyselyn avulla. Kyselytutkimuksen avulla saatiin tietoa teki-jöistä, jotka vaikuttavat ja ohjaavat suomalaisten ja saksalaisten kuluttajien interak-tiivisten viihdepelien kulutusta.
Tutkimuksen viimeinen osa tiivistää tutkimuksen tulokset sekä esittää mahdolli-suuksia tutkia aihetta edelleen. Tutkimuksen perusteella Saksa olisi vahva vaihto-ehto uusien pelikonsoleiden julkaisumarkkinaksi. Suomalaiset vastaajat sen sijaan olivat enemmän PC käyttäjiä. Suomalaisten kuluttajien konsoleiden ostoaktiivisuus oli juuri uuden julkaisun aikaan tai huomattavan ajan kuluttua julkaisusta. Maiden välillä oli huomattavaa päällekkäisyyttä kun verrataan tekijöitä, jotka vaikuttavat eniten ja vähiten kuluttajien ostospäätökseen.
Avainsanat Interaktiivinen viihdepeliteollisuus, Porterin kilpailustrate-gia, Porterin Yleisstrategiat, monimenetelmätutkimus
VAASAN AMMATTIKORKEAKOULU UNIVERSITY OF APPLIED SCIENCES International Business ABSTRACT
Author EmmaMae Hendrickson Title Comparison of Product Launch Strategies for Home Gaming
Consoles: Germany and Finland Year 2018 Language English Pages 42 + 1 Appendices Name of Supervisor Ossi Koskinen The interactive entertainment industry is continuously growing and is expected to continue expanding. A significant portion of that industry is home gaming consoles. The aim of this thesis was to determine ideal launch behaviours for home gaming consoles in the German and Finnish markets.
The theoretical section of the thesis presented the fundamentals of launching a prod-uct and what factors need to be considered. Furthermore, Porter’s five forces and three generic strategies were also discussed and followed by an analysis on the in-teractive entertainment industry.
The empirical research section examined the study that was conducted. The re-search was completed using a concurrent mixed method research technique, to al-low for quantitative and qualitative data collection in one single phase. The data was collected through a questionnaire that was distributed online. The results of the research showed insight into German and Finnish consumers in the interactive en-tertainment industry, what influences consumer purchase behaviour, and what be-haviours consumers follow.
The final section includes a summary of the research results and suggestions for further research. The research shows that Germany would be a strong focus country for new product launches for home gaming consoles. Finland respondents stated that PC was their chosen hardware for playing games, and that the majority of their activity in console purchases was during the launch window and years after launch. Furthermore, there was overlap in the results in regard to the most and least im-portant influential factors and launch behaviours used in making a purchase deci-sion.
Keywords Interactive entertainment industry, launch behaviours, Por-ter’s five forces, Porter’s three generic strategies, concurrent mixed method
CONTENTS
TIIVISTELMÄ
ABSTRACT
1 INTRODUCTION......................................................................................... 8
1.1 Aim of the Thesis ................................................................................... 9
1.2 Structure of Thesis ................................................................................. 9
2 LAUNCH STRATEGIES FOR HOME GAMING CONSOLES ................. 11
2.1 Fundamentals of Product Launch Strategy ........................................... 11
2.2 Interactive Entertainment Industry Analysis ......................................... 15
2.3 Porter’s Five Forces and Three Generic Strategies ............................... 22
2.4 Analysis of Console Launches ............................................................. 27
2.5 Nintendo Switch .................................................................................. 28
2.6 Microsoft Xbox One ............................................................................ 29
2.7 Sony PlayStation 4 ............................................................................... 30
3 EMPIRICAL RESEARCH .......................................................................... 32
3.1 Quantitative Research Method ............................................................. 32
3.2 Qualitative Research Method ............................................................... 32
3.3 Reliability and Validity of the Research ............................................... 33
3.4 Questionnaire Construction .................................................................. 34
4 RESULTS OF THE RESEARCH ................................................................ 35
4.1 Demographics of Respondents ............................................................. 35
4.2 Launch Behaviour ................................................................................ 39
4.3 Qualitative Questions ........................................................................... 44
5 CONCLUSION ........................................................................................... 46
5.1 Summary of Research Findings ............................................................ 46
5.2 Limitations of the Study ....................................................................... 48
5.3 Reliability and Validity of the Study .................................................... 48
5.4 Suggestions for Future Research .......................................................... 49
REFERENCES .................................................................................................. 51
APPENDICES
5
LIST OF FIGURES AND TABLES
Figure 1. Development of marketing plans across stages of the product development
process. – Guiltinan (1999) p. 11
Figure 2. Two-Sided Networked Video Game Market. – Eisenmann et al (2006)
p. 18
Figure 3. Global Revenue by Region 2016. – Newzoo (2016) p. 19
Figure 4. Porter’s five forces framework. – Porter (1980) p. 21
Figure 5. Porter’s Three Generic Strategies. – Porter (1980) p. 26
Figure 6. Age of respondents from both countries. p. 34
Figure 7. Hours Finnish respondents spend playing video games per week. p. 35
Figure 8. Hours German respondents spend playing video games per week. p. 35
Figure 9. Preferred hardware among Finnish respondents. p. 36
Figure 10. Preferred hardware among German respondents. p. 36
Figure 11. Consoles currently owned by respondents. p. 37
Figure 12. How closely Finnish respondents follow console launch activities. p. 38
Figure 13. How closely German respondents follow console launch activities. p. 38
Figure 14. Consoles purchased within two weeks of launch. p. 39
Figure 15. Consoles purchased within three months of launch. p. 40
Figure 16. Influential factors among Finnish respondents. p. 41
Figure 17. Influential factors among German respondents. p. 41
Figure 18. Influential behaviours among respondents. p. 42

6
Table 1. Chronology of major console platforms. – Rabowsky (2010) Clements
(2013) Microsoft (2013) Layden (2016) Martin (2016) Nintendo (2017a) Nintendo
(2017b) p. 15
Table 2. Comparison of Finnish and German responses. p. 47

7
LIST OF APPENDICES
APPENDIX 1. Interactive entertainment industry questionnaire
8
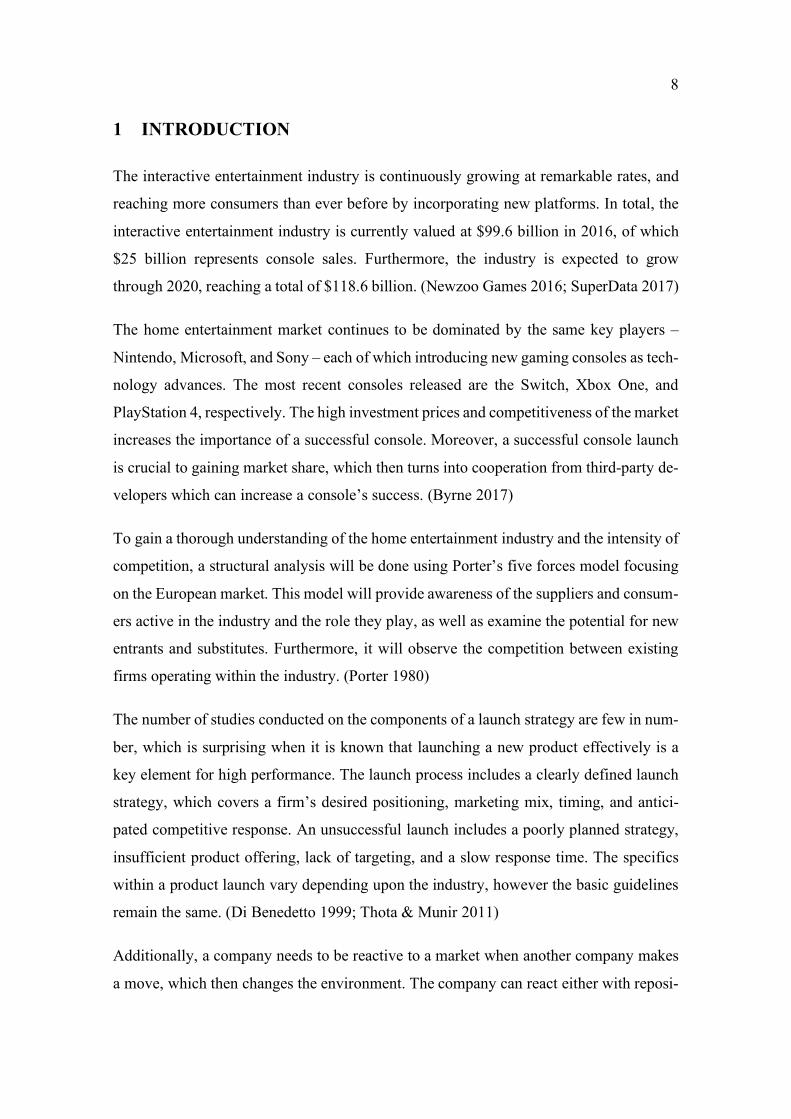
1 INTRODUCTION
The interactive entertainment industry is continuously growing at remarkable rates, and
reaching more consumers than ever before by incorporating new platforms. In total, the
interactive entertainment industry is currently valued at $99.6 billion in 2016, of which
$25 billion represents console sales. Furthermore, the industry is expected to grow
through 2020, reaching a total of $118.6 billion. (Newzoo Games 2016; SuperData 2017)
The home entertainment market continues to be dominated by the same key players –
Nintendo, Microsoft, and Sony – each of which introducing new gaming consoles as tech-
nology advances. The most recent consoles released are the Switch, Xbox One, and
PlayStation 4, respectively. The high investment prices and competitiveness of the market
increases the importance of a successful console. Moreover, a successful console launch
is crucial to gaining market share, which then turns into cooperation from third-party de-
velopers which can increase a console’s success. (Byrne 2017)
To gain a thorough understanding of the home entertainment industry and the intensity of
competition, a structural analysis will be done using Porter’s five forces model focusing
on the European market. This model will provide awareness of the suppliers and consum-
ers active in the industry and the role they play, as well as examine the potential for new
entrants and substitutes. Furthermore, it will observe the competition between existing
firms operating within the industry. (Porter 1980)
The number of studies conducted on the components of a launch strategy are few in num-
ber, which is surprising when it is known that launching a new product effectively is a
key element for high performance. The launch process includes a clearly defined launch
strategy, which covers a firm’s desired positioning, marketing mix, timing, and antici-
pated competitive response. An unsuccessful launch includes a poorly planned strategy,
insufficient product offering, lack of targeting, and a slow response time. The specifics
within a product launch vary depending upon the industry, however the basic guidelines
remain the same. (Di Benedetto 1999; Thota & Munir 2011)
Additionally, a company needs to be reactive to a market when another company makes
a move, which then changes the environment. The company can react either with reposi-
9
tioning themselves in the market or by introducing a new product. When faced with in-
creased competition, as is common in the interactive entertainment industry, a firm can
defend their position by enhancing their product offering. (Wang & Shaver 2016)
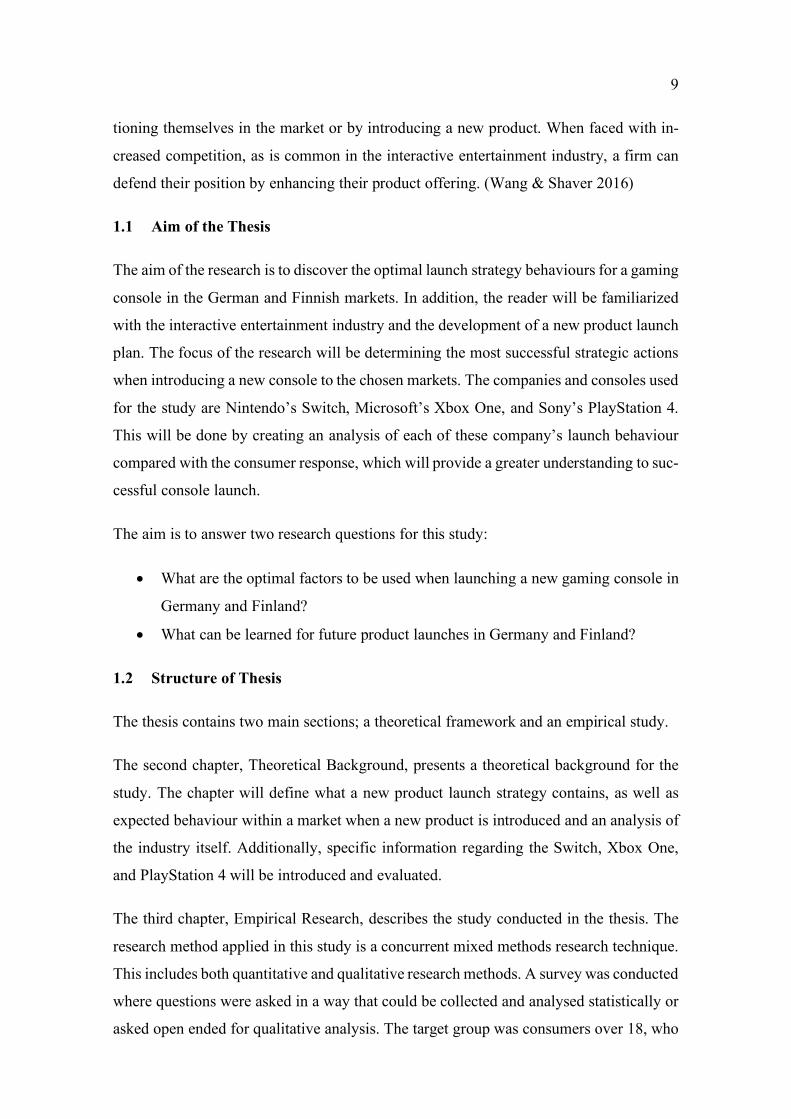
1.1 Aim of the Thesis
The aim of the research is to discover the optimal launch strategy behaviours for a gaming
console in the German and Finnish markets. In addition, the reader will be familiarized
with the interactive entertainment industry and the development of a new product launch
plan. The focus of the research will be determining the most successful strategic actions
when introducing a new console to the chosen markets. The companies and consoles used
for the study are Nintendo’s Switch, Microsoft’s Xbox One, and Sony’s PlayStation 4.
This will be done by creating an analysis of each of these company’s launch behaviour
compared with the consumer response, which will provide a greater understanding to suc-
cessful console launch.
The aim is to answer two research questions for this study:
• What are the optimal factors to be used when launching a new gaming console in
Germany and Finland?
• What can be learned for future product launches in Germany and Finland?
1.2 Structure of Thesis
The thesis contains two main sections; a theoretical framework and an empirical study.
The second chapter, Theoretical Background, presents a theoretical background for the
study. The chapter will define what a new product launch strategy contains, as well as
expected behaviour within a market when a new product is introduced and an analysis of
the industry itself. Additionally, specific information regarding the Switch, Xbox One,
and PlayStation 4 will be introduced and evaluated.
The third chapter, Empirical Research, describes the study conducted in the thesis. The
research method applied in this study is a concurrent mixed methods research technique.
This includes both quantitative and qualitative research methods. A survey was conducted
where questions were asked in a way that could be collected and analysed statistically or
asked open ended for qualitative analysis. The target group was consumers over 18, who

10
are interested and active within the interactive entertainment industry, and living in the
chosen countries. The survey was conducted online, to reach a maximum number of re-
spondents.
The fourth chapter is a conclusion and discussion of the thesis, which includes a summary
of information presented in the thesis. Furthermore, suggestions will be made for compa-
nies and for further research on the topic.
11
2 LAUNCH STRATEGIES FOR HOME GAMING CONSOLES
This section will provide an understanding of a new product launch strategy, discuss the
behaviour of a company in competition, and an analysis of the interactive entertainment
industry. Additionally, the launch behaviour of each named company will be examined.
2.1 Fundamentals of Product Launch Strategy
The new product launch, or commercialisation, is the process when a product is intro-
duced to the market and is often crucial in profitability and continued growth of a product.
According to Hultink et al (1997), a launch strategy is the “decisions and activities nec-
essary to present a product to its market and begin to generate revenue from sales of the
new product” (p. 245) (Hultink, Griffin, Hart, & Robben 1997; Guiltinan 1999; Thota &
Munir 2011).
The desired aim of a launch to is reach maximum profitability through market acceptance
and positioning. The planning phase of a launch is coordinated across different functions
and is designed to communicate the positioning and leverage of the new product to the
desired target market. (Guiltinan 1999; Thota & Munir 2011)
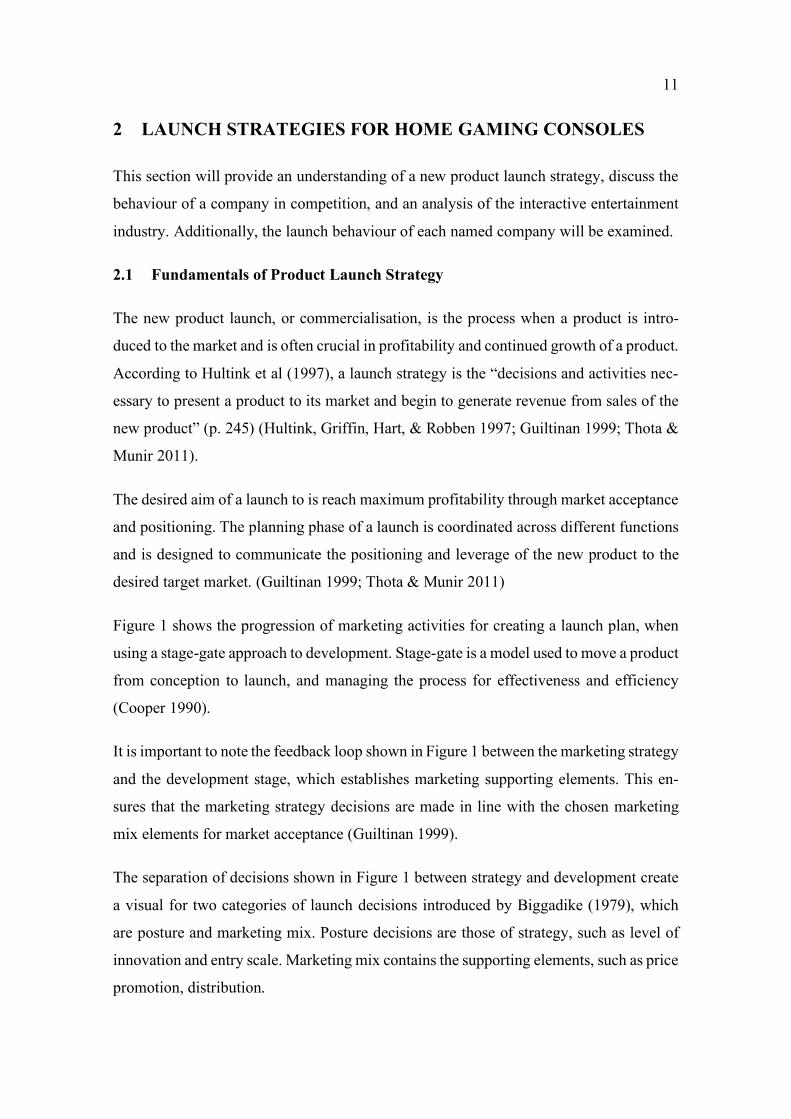
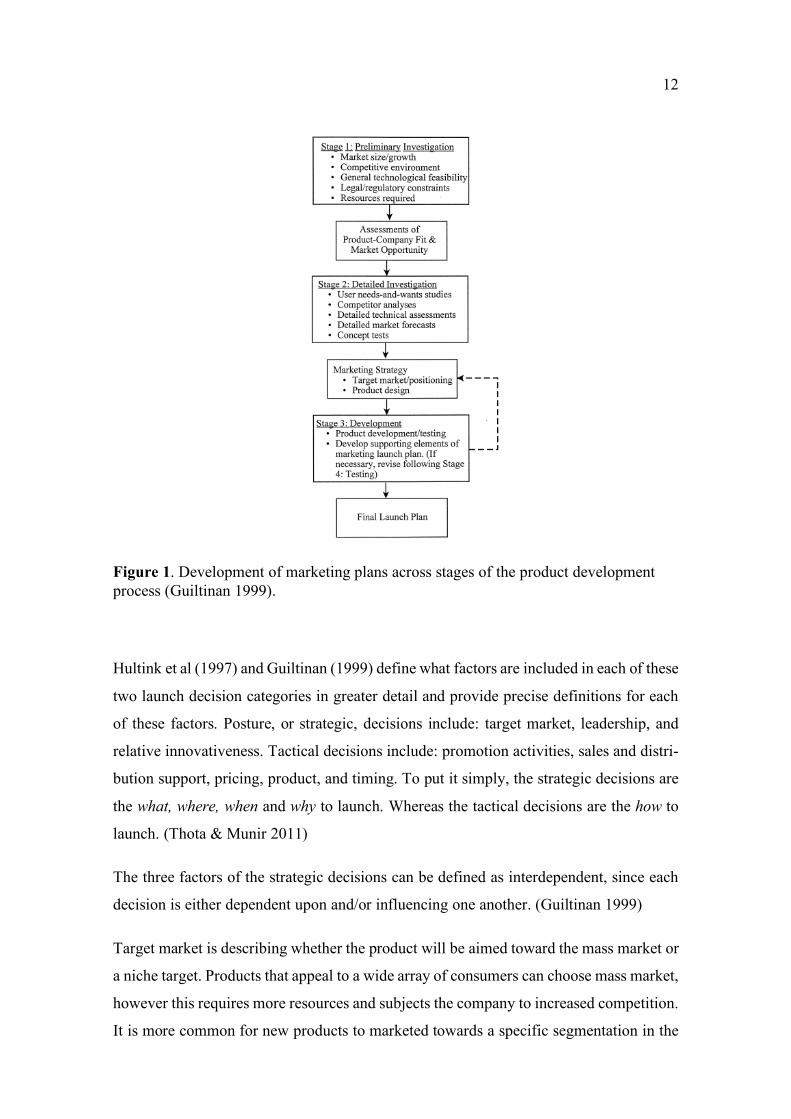
Figure 1 shows the progression of marketing activities for creating a launch plan, when
using a stage-gate approach to development. Stage-gate is a model used to move a product
from conception to launch, and managing the process for effectiveness and efficiency
(Cooper 1990).
It is important to note the feedback loop shown in Figure 1 between the marketing strategy
and the development stage, which establishes marketing supporting elements. This en-
sures that the marketing strategy decisions are made in line with the chosen marketing
mix elements for market acceptance (Guiltinan 1999).
The separation of decisions shown in Figure 1 between strategy and development create
a visual for two categories of launch decisions introduced by Biggadike (1979), which
are posture and marketing mix. Posture decisions are those of strategy, such as level of
innovation and entry scale. Marketing mix contains the supporting elements, such as price
promotion, distribution.
12
Figure 1. Development of marketing plans across stages of the product development process (Guiltinan 1999).
Hultink et al (1997) and Guiltinan (1999) define what factors are included in each of these
two launch decision categories in greater detail and provide precise definitions for each
of these factors. Posture, or strategic, decisions include: target market, leadership, and
relative innovativeness. Tactical decisions include: promotion activities, sales and distri-
bution support, pricing, product, and timing. To put it simply, the strategic decisions are
the what, where, when and why to launch. Whereas the tactical decisions are the how to
launch. (Thota & Munir 2011)
The three factors of the strategic decisions can be defined as interdependent, since each
decision is either dependent upon and/or influencing one another. (Guiltinan 1999)
Target market is describing whether the product will be aimed toward the mass market or
a niche target. Products that appeal to a wide array of consumers can choose mass market,
however this requires more resources and subjects the company to increased competition.
It is more common for new products to marketed towards a specific segmentation in the
13
market that is more likely to be interested in the benefits offered. (Hultink et al 1997;
Guiltinan 1999)
Leadership is determined by whether the company is a leader by introducing the new
product first or following another company. If a firm chooses to be a pioneer and intro-
duce a new product first, they are taking the financial responsibility of educating the pub-
lic on the product and the benefits it provides. However, this also allows the pioneer com-
pany the advantage of gaining early awareness, and the ability to target the largest market
segmentation. This leaves the follower company a smaller target segmentation. (Hultink
et al 1997; Guiltinan 1999)
When discussing leadership, the concept of thought leadership may also be mentioned.
Thought leadership may be viewed as a means of content marketing, in which a company
provides the answers to their chosen target market’s biggest questions. This may be done
with existing internal talent and expertise and by using communication channels best
suited for the target audience. By using the thought leadership technique, a company is
able to set themselves apart by demonstrating their in-depth knowledge, as well as engag-
ing with consumers’ questions and challenges. (Brenner 2017)
Relative innovativeness is both a perceptual and technical characteristic of a new product.
Depending on the target market and potential buyers’ perceptions of innovativeness, there
can be a large variance of these perceptions. Furthermore, relative innovativeness can
change quickly depending on the environment, which is in direct correlation with a com-
pany’s decision to be a leader or a follower, and vice versa. (Hultink et al 1997; Guiltinan
1999)
Tactical decisions are generally those of marketing mix elements, and commonly deci-
sions made towards the end of the process. This is due to the fact that these decisions are
more easily adjusted or inexpensively modified later in the project. Not every aspect of
the tactical decisions needs to be applied to every new product, but a combination to best
reach the target market and achieve the desired perceptions and buying behaviour.
(Hultink et al 1997; Guiltinan 1999; Thota & Munir 2011)
Promotional activity levels are determined to meet the desired objectives of market pen-
etration while maintaining profitability (Di Benedetto 1999). Aspects of promotional ac-
14
tivity include advertising, coupons, publicity, and sampling. Advertising is used to in-
crease awareness and knowledge of a product, which will stimulate interest in trying a
product. If a consumer doesn’t see the relative advantage of a product, meaning the ben-
efit of the new product in comparison to one already established in the market, a coupon
may be used to reinforce awareness of the new product. Sampling is an effective tactic
when usage and word-of-mouth is an important factor to learning product advantages.
(Hultink et al 1997; Guiltinan 1999)
Sales and distribution support decisions are determined by the established goals of desired
target market in combination with a product’s relative innovativeness. If a product has a
high level of innovation, then a new product could be used in a demonstration. This would
inform the consumer of the product’s relative advantage, especially in the case of uncer-
tainty from the consumer. Distribution structure consists of existing or new channels, de-
pending on if the target is familiar or new markets, respectively. The distribution channels
used will be discussed in more detail in the section regarding video game industry analy-
sis. (Hultink et al 1997; Guiltinan 1999)
Pricing is a factor which can primarily be established in two ways, either using a market
skimming tactic or introductory pricing for penetration. If a market has high compatibility
with the product and high perceptions of relative advantage, market skimming should be
used. This tactic introduces the product at a high price for early adopters, and then lowers
the price to attract a more price-conscious segment of the market. In markets where con-
sumers’ perception of relative advantage or compatibility isn’t very high, using a low
introductory price allows for market penetration to attract early adaptors. Additionally,
certain tactics such as rebates and guarantees can be implemented which will lower a
consumer’s economic risk. (Hultink et al 1997; Guiltinan 1999)
Product decisions include the assortment of a product line and branding. Branding, first
and foremost, acts as an identifier for consumers, which allows them to be able to pur-
chase from trusted brands that meet their needs. Secondly, the company behind the brand
is responsible for what that brand represents, which reflects on their reputation. This en-
sures that a company will strive to maintain the level of quality expected from them. A
strong brand builds a strong corporate image, which will attract loyal consumers, which
increases the potential for success when releasing a new product. Having a breadth of
15
assortment in a product allows for customization of consumer’s needs as well as helps
when introducing new products or categories. (Guiltinan 1999; Sandhusen, 2000)
Timing is one of the most crucial factors when launching a new product, in several dif-
ferent aspects. First, if a company spends too much time developing their product, they
are providing an opening for competitors to introduce a competing product first. Secondly
however, if a company chooses to rush a product to market to become the leader, they
face a multitude of risks, such as introducing a faulty and therefore unsuccessful product.
To determine launch timing, numerous factors need to be considered, which includes;
sales goals, competitors, distribution channels, promotions and any other activity neces-
sary before launch. Lastly, is the timing of announcements regarding the new product,
which is particularly key in the video game industry and will be discussed in detail in the
next section. Pre-announcing a product allows for excitement to grow for that product
and allows extra time for consumers to learn the new product or technology. (Di Bene-
detto 1999; Guiltinan 1999)
Rogers (1995) discusses five characteristics that can describe innovation, and uses con-
sumer’s perceptions of these characteristics to predict adoption rates. Adoption is de-
scribed as “a decision to use and implement a new idea” (Rogers 1995).
2.2 Interactive Entertainment Industry Analysis
The interactive entertainment, or video game, industry develops, publishes, manufactures,
distributes, and sells gaming hardware, software, services, accessories and merchandise.
Hardware refers to the product with which a game is played and software refers to the
games themselves. Services, accessories and merchandise are additional products or ser-
vices that can add value for the consumer. (Rabowsky 2010)
Hardware is divided into different platforms. Traditional platforms are a home console
which utilizes a television, or a personal computer (PC). The rise of additional platforms
has been observed, which includes handheld devices and more recently, mobile phones.
(Rabowsky 2010; Newzoo 2016)
16
Software is separated into several different genres. There is an overlap of genres from
television and film, such as action, drama, and horror. Moreover, there are genres created
specifically for interactive entertainment and combinations of genres. This includes Role-
Playing games (RPGs), Puzzle, Real-Time Strategy, First-Person Shooters, and many
others. Some software can be released exclusively for one platform or console, this con-
cept will be discussed in more detail later in this section. (Rabowsky 2010)
Services can include membership programs to receive certain benefits, support for elec-
tronic sports (eSports), and after sale support. Accessories are any other physical item
other than hardware and software but are to be used with the gaming system. This includes
controllers, headsets for online gaming, cameras, virtual reality headsets and more. Mer-
chandise involves all additional items relating to video games, that are not used to play a
game. For example, figurines, clothing, and posters.
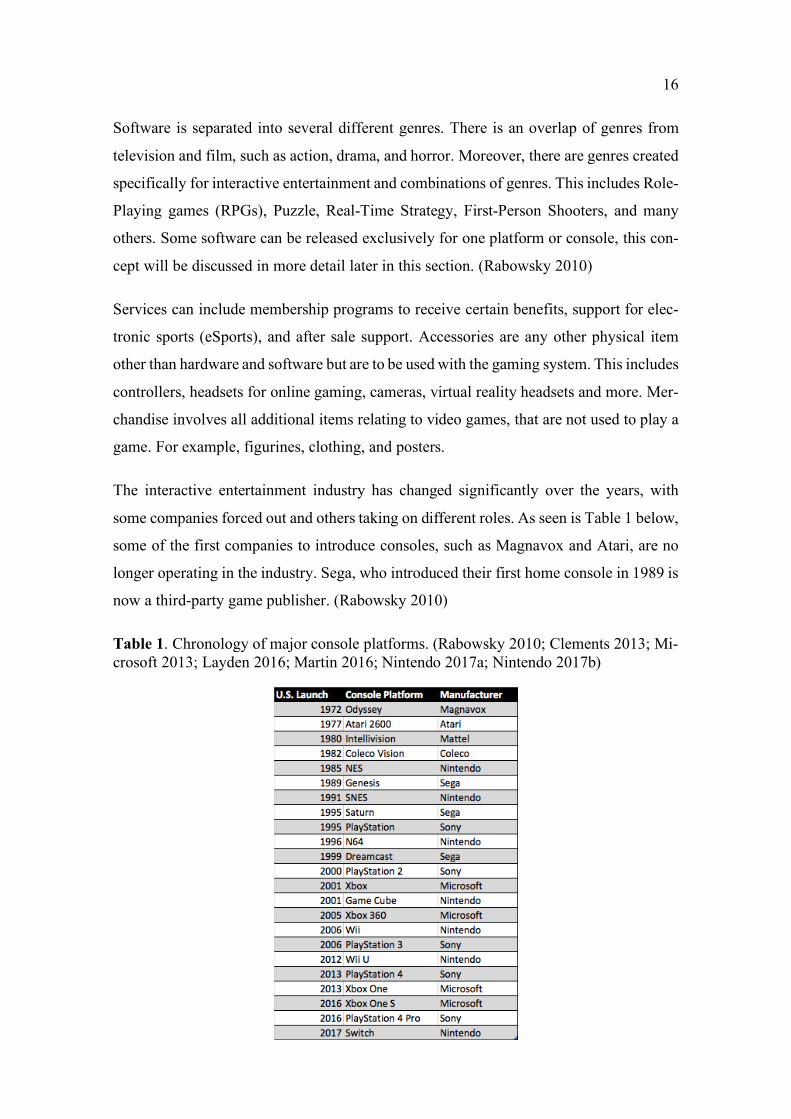
The interactive entertainment industry has changed significantly over the years, with
some companies forced out and others taking on different roles. As seen is Table 1 below,
some of the first companies to introduce consoles, such as Magnavox and Atari, are no
longer operating in the industry. Sega, who introduced their first home console in 1989 is
now a third-party game publisher. (Rabowsky 2010)
Table 1. Chronology of major console platforms. (Rabowsky 2010; Clements 2013; Mi-crosoft 2013; Layden 2016; Martin 2016; Nintendo 2017a; Nintendo 2017b)
17
Many companies were forced out of the industry due to a video game market crash in the
early 1980s. It is believed that due to companies creating poor quality games for their
consoles, consumers stopped purchasing them. This caused companies to go out of busi-
ness, which put their products at a very low price, which furthermore lowered the ex-
pected price point for new products. (Rabowsky 2010)
Nintendo introduced their NES (Nintendo Entertainment System) in 1985, and offered
fewer games of higher quality. This is when consumers were introduced to iconic fran-
chises and their characters such as the Super Mario Brothers and The Legend of Zelda.
Additionally, Nintendo created a licensing policy for any company publishing games for
Nintendo platforms. This required companies to pay royalties on each game manufac-
tured, and allowed Nintendo the ability to control the size, diversity, and quality of the
games for their system. This strategy was extremely successful, with Nintendo selling
over 60 million units of the NES. Several years later in 1989, Nintendo presented portable
gaming with their Game Boy handheld system. (Rabowsky 2010; Nintendo 2017a)
In the decades that followed Nintendo continued to release innovative technology, both
in handheld systems and home consoles. In 2006, Nintendo released the Wii, which was
well received by both consumers and critics, earning it several awards, and selling 101.63
million consoles worldwide. However, Nintendo faced struggles after releasing the Wii
U system in 2012, and only reaching 13.56 million units to date. (Nintendo 2016b; Nin-
tendo 2017a;)
In the late 1980s Sony was working with Nintendo to develop an audio chip and a drive
that could play both traditional game cartridges and CD-ROMs which would be used in
Nintendo’s next console. However, in June 1991 at the Consumer Electronics Show in
Chicago, Sony announced their plans to release the Play Station, which would play Nin-
tendo game cartridges as well as Sony Super Discs. The next day Nintendo announced
their plans to work with Philips instead, a long-time rival of Sony. Then, Sony made a
deal with Sega, one of Nintendo’s competitors, to produce software for their Sega Multi-
media Entertainment System. Finally, in 1992 negotiations were reached between Sony
and Nintendo regarding licensing and royalties. For unbeknownst reasons, the first Play
Station was never released. (IGN 1998)
18
In 1994, Sony released the redesigned PlayStation, and sold 102 million units until it was
discontinued in 2005. The PlayStation 2 was a remarkable success when it was launched
in 2000, and is the best-selling console of all time at 158 million units. The PlayStation 3
was released in 2006, and later Sony’s version of an online network, called PlayStation
Plus. (Griffith 2013; Dunn 2016).
In 2001, Microsoft enters the home console video game market by introducing their Xbox.
Bringing elements from PC gaming, such as Xbox Live, which allowed players to play
games together through their internet connection. Furthermore, Microsoft acquired the
game developer Bungie, to provide a launch title, Halo: Combat Evolved, which would
become a game title synonymous with Xbox. (Goss 2011; Microsoft 2016b)
It was well known that Microsoft sold their Xbox hardware at a loss. Due to this and other
factors, they chose to focus on developing a new console using more advanced technology
and in late 2005, the Xbox 360 was released. However, Microsoft faced significant hard-
ware issues early in the life cycle, known as the “Red Ring of Death”. This is named after
a red light that would appear around the console’s power button after a sudden system
crash, and would leave the console inoperable. Microsoft was aware of these system fail-
ures prior to launch, and chose to launch their faulty product to beat the competition to
the market. Due to replacing faulty consoles and extending their warranty period in an
effort to assure consumers, Microsoft faced losses around $1 billion USD. Furthermore,
Microsoft faced a class action lawsuit, that was instigated by an article that brought the
information about the defects to the public. In 2010, Microsoft introduced the Kinect, a
voice and motion sensor for the Xbox, which sold 8 million units in the first two months,
as well as a redesigned Xbox 360 console. (Rabowsky 2010; Goss 2011; Rubin 2013;
Microsoft 2016b)
As noted previously, the top three companies currently manufacturing consoles are Mi-
crosoft, Sony, and Nintendo with the Xbox One, PlayStation 4, and Switch respectively.
There is high competition in the industry, which is fuelled by the companies, their extreme
loyal fans, and partially by developers. Naturally, the companies are competing for the
highest market share by releasing new and innovative products with each generation of
consoles. This can be observed by the introduction of the Wii with motion controls, Mi-
crosoft with their Kinect, and a virtual reality headset from Sony. Furthermore, Microsoft
and Sony have each released upgraded versions of their current consoles. Microsoft with
19
the Xbox One S and recently announced Xbox One X, and Sony with PlayStation 4 Slim
and PlayStation 4 Pro. These new redesigned or upgraded consoles provide various addi-
tional value to consumers, such as compact size, adjusted ports, and higher video quality
up to 4K. (Rabowsky 2010; Kelly 2016a; Kelly 2016b)
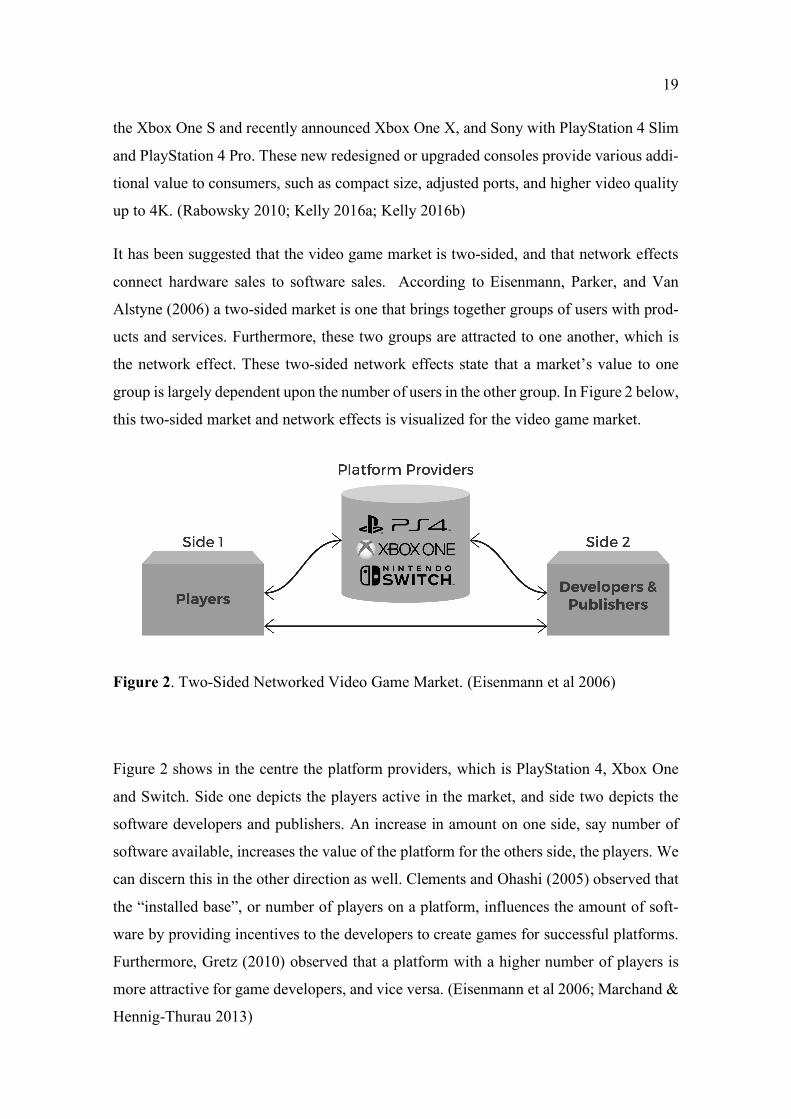
It has been suggested that the video game market is two-sided, and that network effects
connect hardware sales to software sales. According to Eisenmann, Parker, and Van
Alstyne (2006) a two-sided market is one that brings together groups of users with prod-
ucts and services. Furthermore, these two groups are attracted to one another, which is
the network effect. These two-sided network effects state that a market’s value to one
group is largely dependent upon the number of users in the other group. In Figure 2 below,
this two-sided market and network effects is visualized for the video game market.
Figure 2. Two-Sided Networked Video Game Market. (Eisenmann et al 2006)
Figure 2 shows in the centre the platform providers, which is PlayStation 4, Xbox One
and Switch. Side one depicts the players active in the market, and side two depicts the
software developers and publishers. An increase in amount on one side, say number of
software available, increases the value of the platform for the others side, the players. We
can discern this in the other direction as well. Clements and Ohashi (2005) observed that
the “installed base”, or number of players on a platform, influences the amount of soft-
ware by providing incentives to the developers to create games for successful platforms.
Furthermore, Gretz (2010) observed that a platform with a higher number of players is
more attractive for game developers, and vice versa. (Eisenmann et al 2006; Marchand &
Hennig-Thurau 2013)
20
Moreover, a networked market implies that platform providers benefit from exclusive
software content, by increasing the attractiveness of their platform to consumers. All three
companies discussed in this thesis develop or publish games exclusively for their own
console. This is known as “first-party” publishers. Game developers and publishers that
do not make consoles are referred to as “third-party” publishers. (Rabowsky 2010)
Platform companies make minimal, if any, profit from selling their console. Instead, the
focus is on making profit from selling their first-party software, and charging licensing
fees to third-party publishers and developers that create software for their platform. Fur-
thermore, if a particular console isn’t performing well among consumers, third-party pub-
lishers may choose to withdraw their support for that platform. This causes significant
issues in trying to increase an install base and market share, as discussed earlier.
(Rabowsky 2010)
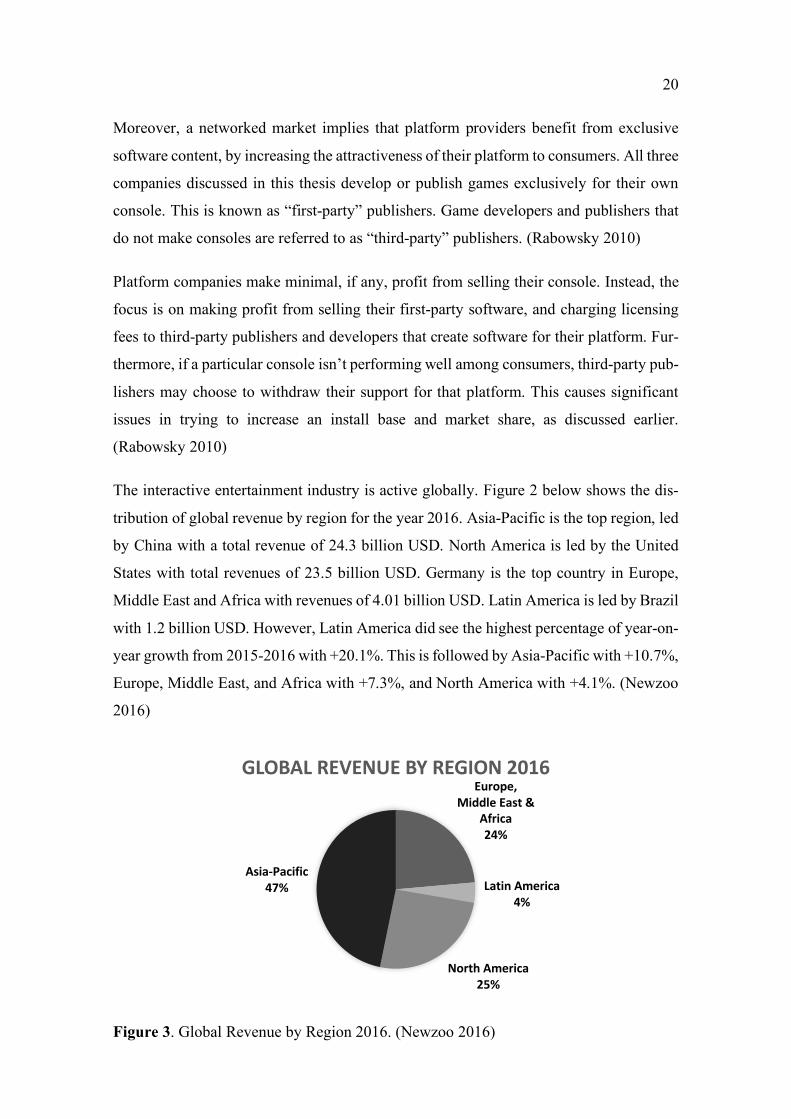
The interactive entertainment industry is active globally. Figure 2 below shows the dis-
tribution of global revenue by region for the year 2016. Asia-Pacific is the top region, led
by China with a total revenue of 24.3 billion USD. North America is led by the United
States with total revenues of 23.5 billion USD. Germany is the top country in Europe,
Middle East and Africa with revenues of 4.01 billion USD. Latin America is led by Brazil
with 1.2 billion USD. However, Latin America did see the highest percentage of year-on-
year growth from 2015-2016 with +20.1%. This is followed by Asia-Pacific with +10.7%,
Europe, Middle East, and Africa with +7.3%, and North America with +4.1%. (Newzoo
2016)
Figure 3. Global Revenue by Region 2016. (Newzoo 2016)
Europe, Middle East &
Africa24%
Latin America4%
North America25%
Asia-Pacific47%
GLOBAL REVENUE BY REGION 2016
21
Several trends have become prevalent in the interactive entertainment industry, such as
electronic sports (eSports) and mobile gaming. (Molina 2017)
According to Hamari and Sjöblom (2016) eSports can be defined as “competitive video
gaming that is often coordinated by different leagues, ladders and tournaments, where
players customarily belong to teams or other “sporting” organizations which are spon-
sored by various business organizations.” There are eSport tournaments based on differ-
ent video game genres, such as multiplayer online battle arena (League of Legends),
first-person shooters (Counter-Strike), traditional sports (FIFA), and arcade style
fighting games (Street Fighter). According to Newzoo (2017) eSports saw a 36.6%
global year-on-year audience growth in 2016 with 162 million enthusiasts and 161 mil-
lion occasional viewers. The global audience will grow with a compound annual growth
rate (2015-2020) of 20.1% with 286 million enthusiasts and 303 million occasional
viewers. (Hamari & Sjöblom 2016; Newzoo 2017)
Mobile gaming is a rapidly growing trend, generating 46.1 billion USD and taking 42%
of the global market in 2017. That is a 19.3% year-on-year growth compared to 2016.
Mobile gaming is classified as games played on either a tablet or smartphone. In July
2016, there was a surge of players due to the launch of Pokémon Go, an augmented re-
ality game in which small creatures could be found and captured in the real world. Fur-
thermore, there are several mobile gaming titles that are growing the eSports sector,
such as; Clash Royale, Hearthstone, and Vainglory. (Brunicki 2017; McDonald 2017)
When analysing challenges and the future of the interactive entertainment industry there
are several observations that can be made. First, that it is cyclical. This is related to the
second observation, that the industry is highly dependent upon technological advances,
both internal and external. As new technological capabilities are discovered, new hard-
ware is created that use these capabilities to provide new features and added value for the
consumer. (Rabowsky 2010)
For mobile and handheld platforms, they face unique challenges compared to consoles or
PC. The disappearance of handheld gaming is speculated due to the convergence of mul-
tiple functionalities into smartphones, which includes gaming. Furthermore, both devices
22
face issues with battery life, screen size, and high-resolution graphics limitations.
(Rabowsky 2010)
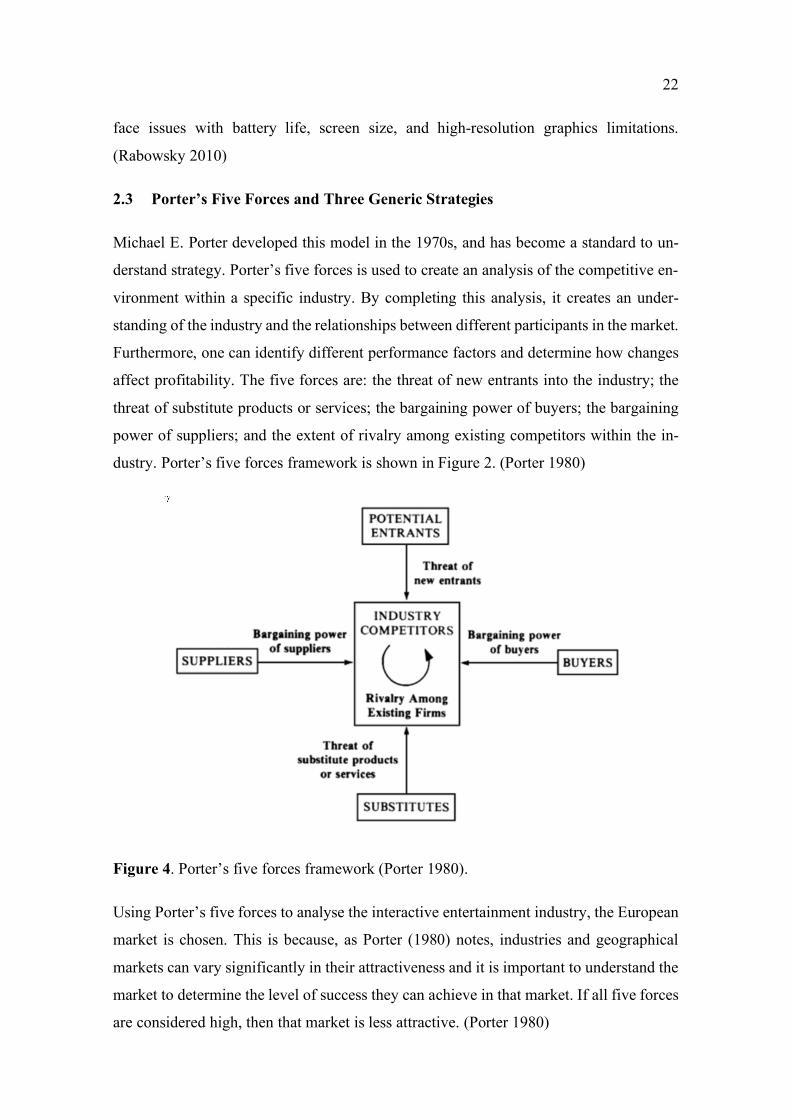
2.3 Porter’s Five Forces and Three Generic Strategies
Michael E. Porter developed this model in the 1970s, and has become a standard to un-
derstand strategy. Porter’s five forces is used to create an analysis of the competitive en-
vironment within a specific industry. By completing this analysis, it creates an under-
standing of the industry and the relationships between different participants in the market.
Furthermore, one can identify different performance factors and determine how changes
affect profitability. The five forces are: the threat of new entrants into the industry; the
threat of substitute products or services; the bargaining power of buyers; the bargaining
power of suppliers; and the extent of rivalry among existing competitors within the in-
dustry. Porter’s five forces framework is shown in Figure 2. (Porter 1980)
Figure 4. Porter’s five forces framework (Porter 1980).
Using Porter’s five forces to analyse the interactive entertainment industry, the European
market is chosen. This is because, as Porter (1980) notes, industries and geographical
markets can vary significantly in their attractiveness and it is important to understand the
market to determine the level of success they can achieve in that market. If all five forces
are considered high, then that market is less attractive. (Porter 1980)

23
Threat of new entrants is determined by the barriers to enter the industry and the antici-
pated reactions of the current competitors (Porter 1980). The barriers can be classified in
six different categories. First, economies of scale which describes the “declines in unit
costs of a product as the absolute volume per period increases” (Porter 1980). This means
that a new entrant into the industry would need to enter on a large scale and face reaction
from existing firms or on a small scale and be at a cost disadvantage. (Porter 1980;
Rabowsky 2010)
A second entry barrier is product differentiation, which focuses on brand identity and
consumer loyalty. This is a key barrier to entry because it would force entrants to the
industry to invest heavily to convince consumers to abandon their existing brand loyalty.
Furthermore, the existing brands in the interactive entertainment industry are well estab-
lished, which would require a new entrant an extended period of time to match. The sig-
nificant capital requirements needed to compete in the interactive entertainment industry
is another key barrier to entry. Moreover, even if a larger firm had the available capital to
enter the industry, they would face a high level of risk up front spending on research and
development, advertising, and production. (Porter 1980; Rabowsky 2010)
One of the more significant barriers of entry is the cost of switching that a buyer would
face by switching from one supplier’s product to another. Hardware and necessary acces-
sories in the interactive entertainment industry are a high initial investment for consum-
ers, which would lead them to be less likely to switch from one supplier to another. Ad-
ditionally, consumers would need to repurchase any games they had previously purchased
for the new console which only adds to the cost of switching. In regard to the access to
distribution channels barrier, a new entrant may face difficulties with retailers to give
their product space on the shelf or additional promotions. If a supplier faces difficulty
from retailers it will make entry into the market difficult. (Porter 1980; Rabowsky 2010)
Furthermore, existing firms in an industry may experience cost benefits that a new entrant
would not, regardless of scale. This is a separate barrier known as cost disadvantages
independent of scale, which has several factors included in it. Most notably for the inter-
active entertainment industry would be proprietary product technology, which refers to
existing firms having knowledge about the technology or design that would be unknown
to new entrants. Beyond the knowledge of creating the hardware itself, each of the exist-
ing firms offers their own intellectual property for their system, which are also known as
24
exclusives. Moreover, existing firms in the industry would have contracts with existing
suppliers which would cause difficulties for new entrants to gather the necessary raw
materials. Existing firms would also simply have an experience advantage by having a
greater understanding of the industry, more effective methods, and better performance.
The final barrier, government policy, doesn’t factor too heavily on the interactive enter-
tainment industry. Overall, the threat of new entrants is very low after examining all of
the barriers. (Porter 1980; Rabowsky 2010)
The rivalry among existing firms occurs when one or more competitors sees an oppor-
tunity for them to improve their position and increase their market share. If one firm
within an industry makes a move they may face retaliation from the other firms, and it
could improve the industry balance or all existing firms may be in a worse position than
before. For example, one firm adjusting their price lower is something that is easily rep-
licated by their competitors, which then puts all existing firms operating at lower revenues
unless they have high enough demand to raise the prices back. (Porter 1980; Rabowsky
2010)
In the interactive entertainment industry, the internal competition for home gaming con-
soles is very high due to the fact that there are only a few existing firms creating hardware.
Microsoft, Sony, and Nintendo are competing with one another for their share of the mar-
ket. Nintendo is the most differentiated in their strategy, by creating software and hard-
ware that is targeted for a more casual gamer of any age. However, this does create limi-
tations for their home gaming consoles because they do not have the same power or
graphics as their competitors. Nintendo is able to overcome this by offering additional
features with their consoles, such as motion control or being able to play games at home
or on the go. Microsoft and Sony both create a sort of home entertainment machine, not
simply a gaming console. With either you are able to download apps that allow you to
watch television or movies, listen to music, video chat or stream your games online. Mi-
crosoft and Sony both target a more serious gamer, as they offer more processing power
and better graphics. (Porter 1980; Rabowsky 2010)
Threat of substitutions is a scenario in which all existing firms in an industry are compet-
ing against any substitute products. Pertaining to home gaming consoles in the interactive
entertainment industry, the largest threat of substitution would be PC or mobile gaming.
25
According to Newzoo (2017) console gaming constituted 31% of the global gaming mar-
ket, where PC and mobile were 27% and 42%, respectively. Furthermore, the 2020 mar-
ket share predictions put consoles at 28%, PC at 22% and mobile at 50%. This demon-
strates that the industry is changing and adapting to consumers’ needs, and the threat for
substitution of traditional home gaming consoles is high. (Porter 1980; Rabowsky 2010;
Newzoo 2017)
Bargaining power of buyers, or consumers, affects the industry by forcing lower prices
or demanding higher quality. In the interactive entertainment industry, the consumer’s
bargaining leverage is low. Due to the limited nature of active firms in the industry, it
gives the consumer little choice of supplier. Furthermore, the differentiated offering of
each firm limits the buyer’s ability to play one company against another. Consumers do
have the ability to shop for favourable prices, but this would be done through a retailer,
not the firm itself. Retailers do gain some bargaining power as they may be able to influ-
ence a consumer’s decision, but not enough to gain true leverage over the firms. (Porter
1980; Rabowsky 2010)
Bargaining power of suppliers comes when suppliers are able to raise prices or lower
quality to adjust their own profits. In the interactive entertainment industry, suppliers
power would be considered low or medium. Due to the limited number of companies
operating in the industry, suppliers can influence the companies to match their desired
price and terms. However, also due to the limited number of companies and large number
of suppliers, it doesn’t allow the suppliers a lot power when negotiating if a second sup-
plier is willing to meet the company’s desired price. For some suppliers, they may provide
a product that is a crucial for the console or one that is popular demand and it gives that
supplier more power to choose their terms. (Porter 1980; Rabowsky 2010)
In regard to competitive strategy, Porter (1980) notes that while each company should
choose which methods best fit their circumstances, three consistent generic strategies can
be identified. These strategies are used to potentially outperform competitors in an indus-
try after managing the five forces previously mentioned. These three generic strategic
approaches are: overall cost leadership, differentiation, and focus. (Porter 1980)
26
First, the overall cost leadership strategy sets a goal for the company to become the overall
cost leader within their respective industry. This means a company will need to set poli-
cies and manage to cost control at every level to meet these goals. However, low cost
strategies must not affect quality, service, or other areas. By choosing to be in the low-
cost position a company can expect above average returns even in the presence of strong
competitors. Additionally, the lower costs allow the company to still see returns after
competitors have exhausted their returns trying to compete. Furthermore, the low-cost
position creates a defence against buyers and suppliers by giving them very little bargain-
ing power. This position also provides significant entry barriers to the industry in regard
to economies of scale and cost advantages. Lastly, there is little threat of substitution by
competitors due to the low-cost position. However, it is worth noting that using the overall
cost leadership strategy requires a high market share, ease of manufacturing, ideally econ-
omies of scope. Moreover, implementing this strategy may also require significant capital
investment and aggressive pricing which may see initial profit losses. (Porter 1980)
The second generic strategy is one of differentiation. This is achieved by creating a prod-
uct or service that is viewed as unique within the industry, by differentiating it from what
is offered by competitors. This differentiating can be accomplished many ways, such as;
design or brand image, technology, features, customer service, or other factors. In a per-
fect scenario, a company will achieve differentiation in multiple areas. However, while
cost control is not the main focus of this strategy it cannot be forgone entirely. In regard
to the five forces, differentiation generates brand loyalty from consumers, which in turn
protects from competitive rivalry and causes consumers to become less sensitive to price.
Furthermore, this consumer loyalty and the differentiation itself causes entry barriers in
the industry for potential competitors to overcome. (Porter 1980)
The average higher yields achieved from using the differentiation strategy allow for more
bargaining power with suppliers, and due to the uniqueness of the product, buyers lack a
substitute product and are again less sensitive to price. Initially when using the differen-
tiation strategy, a company may create a sense of exclusivity of their product, which trans-
lates to a smaller market share. This is done by conducting extensive research, using high
quality materials, strong product design and other tactics which require high initial in-
vestments. Therefore, the differentiation strategy isn’t applicable for all industries, such
as those with relatively comparable competitor prices and low costs. (Porter 1980)
27
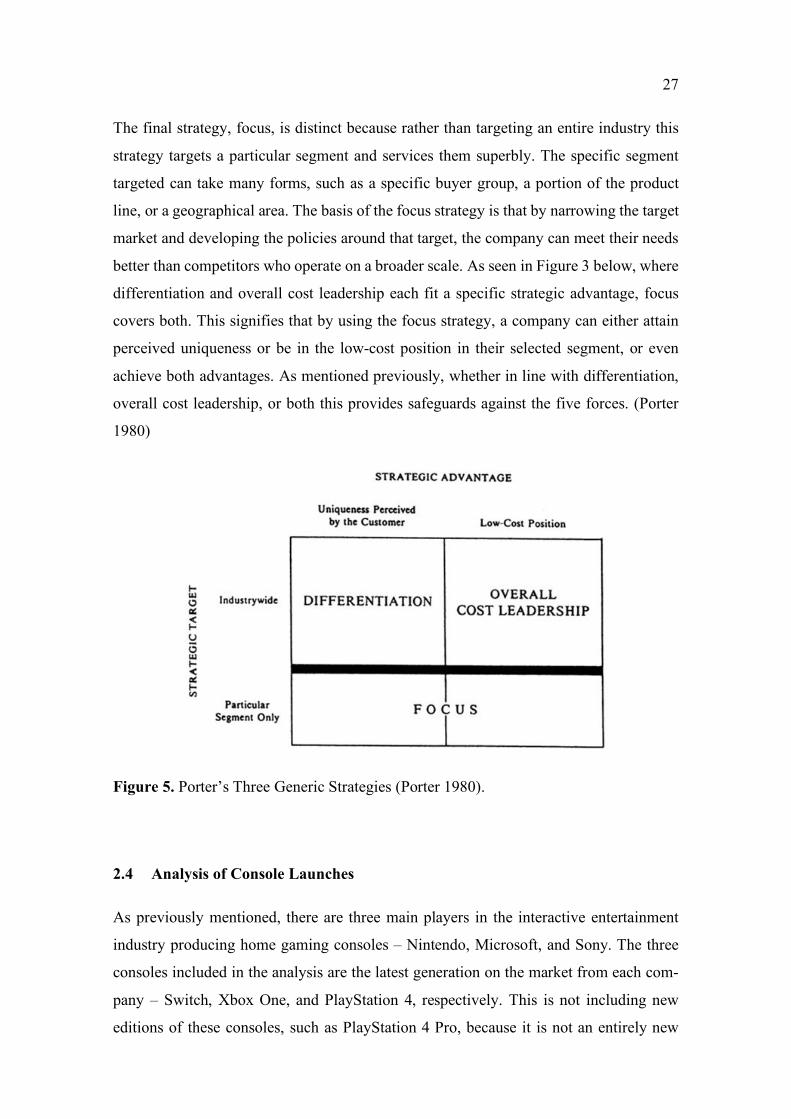
The final strategy, focus, is distinct because rather than targeting an entire industry this
strategy targets a particular segment and services them superbly. The specific segment
targeted can take many forms, such as a specific buyer group, a portion of the product
line, or a geographical area. The basis of the focus strategy is that by narrowing the target
market and developing the policies around that target, the company can meet their needs
better than competitors who operate on a broader scale. As seen in Figure 3 below, where
differentiation and overall cost leadership each fit a specific strategic advantage, focus
covers both. This signifies that by using the focus strategy, a company can either attain
perceived uniqueness or be in the low-cost position in their selected segment, or even
achieve both advantages. As mentioned previously, whether in line with differentiation,
overall cost leadership, or both this provides safeguards against the five forces. (Porter
1980)
Figure 5. Porter’s Three Generic Strategies (Porter 1980).
2.4 Analysis of Console Launches
As previously mentioned, there are three main players in the interactive entertainment
industry producing home gaming consoles – Nintendo, Microsoft, and Sony. The three
consoles included in the analysis are the latest generation on the market from each com-
pany – Switch, Xbox One, and PlayStation 4, respectively. This is not including new
editions of these consoles, such as PlayStation 4 Pro, because it is not an entirely new
28
console. First, a description of each company and console will be explained, followed by
a comparison of the consoles and their launch behaviour.
2.5 Nintendo Switch
Nintendo Co., Ltd. operates in the home entertainment field, developing, producing, and
selling products described as “dedicated video game platforms”, such as; software and
hardware for both handheld systems and home gaming consoles. Nintendo Co., Ltd., is
based in Japan, and consists of 27 subsidiaries and 5 associates globally. (Nintendo
2016a,3)
Nintendo first introduced its Nintendo Entertainment System (NES) in 1985, and it was
a historical moment for the video game industry, selling over 60 million units.
The Switch is the current console, which was released worldwide on March 3, 2017. The
Switch is a home gaming console, that consists of a tablet which is placed in a dock and
connected to a television. Alternatively, you can take the tablet from the dock and play
anywhere. The Joy-Con controllers can utilize traditional button responses or motion con-
trol, and are equipped with HD Rumble which can provide tactical feedback. The Joy-
Con can be used attached to the tablet during handheld mode, in the Joy-Con dock in
either handheld or docked mode like a traditional controller, or individually with the wrist
straps in either handheld or docked mode.
Initially, Satoru Iwata, Director and President of Nintendo Co., Ltd., and Isao Moriyasu,
President and CEO of DeNA Co., Ltd., used a joint announcement to inform the public
about the development of a brand-new concept with the codename “NX” on March 17,
2015 (Nintendo & DeNA 2015). The following year, in the 2016 Annual Report published
April 27th, 2016, Nintendo announces that the NX will be launched globally in March
2017 (Nintendo 2016a,9). On October 20, 2016, via a YouTube video, Nintendo unveiled
the Switch, giving their new console an official name and the public got their first look at
the device, which confirmed many speculated rumours (Kohler 2016).
On January 12, 2017, Nintendo held a press event in Tokyo, that was available via
livestream globally, to present more detailed information about the Switch, including;
global launch date of March 3, suggested retail price of $299.99 USD, and technical as-
29
pects of the hardware. In Europe, the price varied by retailer. Additionally, they an-
nounced that the system would include the main console, the Joy-Con controllers, the
Joy-Con grip, Joy-Con wrist straps, a docking unit to connect to a television, an HDMI
cable, and AC adapter. Furthermore, two versions of the system would be available, one
with grey Joy-Con, while the other was equipped with one neon blue and one neon red
Joy-Con. On March 3, 2017, the Switch was launched with the hopes of ushering in a
new era by allowing console gaming on the go. (Nintendo 2017b; Nintendo 2017c)
2.6 Microsoft Xbox One
Microsoft Corp. operates in several industries developing, licensing, and supporting soft-
ware products, services, and devices. Microsoft was founded in 1975, and currently op-
erates in over 190 countries worldwide, with headquarters in Redmond, Washington,
USA. Microsoft was given third place on Forbes’ World’s Most Valuable Brands list in
2016 and was the World’s Top Software Company in 2015 according to Investopedia.
(Seth 2015; Forbes 2016; Microsoft 2016a)
On April 24th, 2013, Lawrence “Larry” Hryb, the Director of Programming for Xbox
Live, announced that in May they would hold a special press event to share their vision
for Xbox and reveal what they were working on (Hryb 2013). During this special press
event, May 21st, 2013, Microsoft unveiled the Xbox One, giving the public a look at the
console itself, as well as it’s functionality, including details regarding the technical spec-
ifications and applications available (Covert 2013). Microsoft was out to develop an all-
in-one entertainment device, not just a gaming console. Naturally, due to Microsoft’s pur-
chase of Skype, an online video-chatting service, it would be included, which would em-
phasize the high-definition capabilities of the new Kinect. Moreover, with the voice-sen-
sor in the Kinect, consumers’ have the ability to control the entire console by using com-
mands, such as “Xbox on”. (Rubin 2013)
Several weeks later at the Electronic Entertainment Expo (E3) in Los Angeles, Microsoft
addressed the crucial point of what video games would be available for the Xbox One.
They announced several exclusive titles that would only be available for Xbox, such as;
Halo and Forza 5, but didn’t announce when these titles would be available. Furthermore,
much to consumers’ dismay, Microsoft announced the price of new console at €499. (The
Verge 2013)
30
On August 20, 2013, at gamescom in Cologne, Germany, Microsoft revealed all of the
game titles that would be available for the Xbox One at launch. It was a list of 23 titles,
with a significant portion being already established franchises, including: Assassin’s
Creed, Battlefield, and Call of Duty. (Goldfarb 2013)
On September 4, 2013, Yusuf Mehdi, corporate vice president of Marketing, Xbox Strat-
egy, and Business, announced that the Xbox will launch on November 22, 2013 in 13
markets. Furthermore, he discussed the availability of a limited-edition Day One console.
The Day One console was reserved via pre-order and in addition to the standard contents,
the consumer would also receive a specially branded “Day One 2013” controller, which
included a chrome Directional-pad, and a Day One digital achievement. Achievements
are virtual trophies, which players collect by accomplishing specific tasks in games. The
standard contents included the Xbox One console, a wireless controller and batteries, Ki-
nect, chat headset, HDMI cable, and the power supply. (Clarke 2013; Narcisse 2013)
The Xbox One launched on November 22, 2013 in the USA, Canada, Mexico, Brazil,
Australia, New Zealand, the UK, France, Germany, Spain, Italy, Ireland, and Austria. In
January 2014, Microsoft announced that over 3 million Xbox One consoles were sold
since launch, and at a record pace for Xbox. Currently it is estimated that Microsoft is at
around 26 million units for the Xbox One. (Microsoft 2013; Microsoft 2014; SuperData
2017)
2.7 Sony PlayStation 4
Sony Corporation is a multinational conglomerate company that operates in electronics,
entertainment, financial services, and gaming. Sony was originally known as Tokyo
Tsushin Kogyo K.K. (Tokyo Telecommunications Engineering Corporation) from its in-
ception in 1946 until 1958 when it changed to Sony Corporation. (Sony 2017)
From 1960 until 1990, Sony established locations in the United States, Hong Kong, and
across Europe, while also diversifying their portfolio. They manufactured electronics, like
radios and colour televisions, entered the music industry in a joint venture with CBS in
the US, offered life insurance alongside Prudential Insurance Co., and acquired Columbia
Pictures Entertainment to enter the movie industry. (Sony 2017)
31
During a press conference in February 2013, Sony announced their next console: the
PlayStation 4 (PS4). Sony expressed their vision for a console that would be high perfor-
mance and provide gamers with an immersive experience. A significant aspect of the PS4
was the social interaction it provided, allowing players to share images or videos captured
to friends on the PlayStation Network or to social media, such as Facebook. (Sony 2013a)
At E3 on June 10, 2013, Sony unveiled the PS4 hardware, as well as providing infor-
mation regarding the price and exclusive titles that could be expected. The console would
launch for the holiday season with a price of €399,99. Sony would provide exclusive first-
party content, which means they would develop game themselves and they would only
be available for PlayStation systems. Furthermore, they announced a list of games from
third-party developers from well-known franchises such as Final Fantasy and Assassin’s
Creed, as well as introducing new IP’s. (Sony 2013b)
In August 2013 at gamescom Sony announced the launch date as November 15th in North
America and November 29th in Europe and Latin America. Additionally, they revisited
game titles that would be available in the launch window, which is typically within 3
months of launch. (Koller 2013)
In November 2013, the PS4 was launched in 32 countries globally with 23 games availa-
ble immediately. As of January 1, 2017, PS4 has cumulatively sold 53.4 million units.
(Clements 2013; Sony 2017)
32
3 EMPIRICAL RESEARCH
The empirical research is based on theory presented in the theoretical background portion
of the thesis. Saunders, Lewis, & Thornhill (2016) define research as “the systematic col-
lection and interpretation of information with a clear purpose, to find things out”.
The aim of the research is to answer two questions laid out in the beginning of the thesis.
Therefore, data will be collected using a concurrent mixed methods research technique.
This allows for the use of quantitative and qualitative methods in a single phase of data
collection. By using this method, a more comprehensive understanding may be gained
from the variety of data. (Saunders, et al 2016)
3.1 Quantitative Research Method
The primary data is collected with the quantitative method, which will be used to gain an
in-depth comprehension of the specific phenomenon. According to Saunders et al (2016)
quantitative data is “numerical data or non-numerical data that has been quantified”.
Quantitative research analyses the given variables statistically and by using graphical
techniques. (Saunders et al 2016)
The quantitative data used in this study will be collected two ways. First, an analysis of
officially published data available from each company regarding sales figures. Secondly,
quantified non-numerical data gathered from a distributed questionnaire. This will allow
for a variety of information to be used to gather a conclusion.
3.2 Qualitative Research Method
The research conducted following the qualitative method allows for a richer and more
extensive insight into consumer’s purchase decision. Qualitative research, or non-numer-
ical data, can be described as interpretive, because the researchers must interpret the
meanings expressed about the specific phenomenon. Researchers study the respondent’s
experiences and the relationships between them to create a conceptual framework. (Saun-
ders et al 2016)
The qualitative research will be collected from open-ended questions included in the dis-
tributed questionnaire. Allowing respondents to answer freely provides the opportunity
33
to find different and interesting experiences that would not be given in the structured
nature of the quantitative portion.
3.3 Reliability and Validity of the Research
Reliability and validity are important for research findings as they are crucial in judging
the quality of the research conducted. Reliability refers to the consistency and replication
of the research. If the research was to be conducted again with the same findings, then the
research is considered reliable. Validity refers to the whether the proper method was used
and the accuracy of the data analysis. (Saunders et al 2016)
There are four main threats to reliability: participant error, participant bias, researcher
error, and researcher bias. Participant error is any factor that would alter the way a par-
ticipant operates. To prevent any misunderstandings and to ensure that all questions are
understood the same by each participant, the questions will be expressed very thoroughly
and carefully. Additionally, the questionnaire will be conducted online allowing partici-
pants to complete it at their own pace, when they have available time to contribute care-
fully and not feel hurried. Furthermore, by conducting the questionnaire anonymously
online helps to prevent participant bias, as the participants can feel more comfortable
giving honest answers. In terms of researcher error and bias, all steps will be taken to
ensure the credibility of the researcher and research findings. (Saunders et al 2016)
There are four descriptive types of validity that are used to assess the validity of the study.
Internal validity, or measurement validity, refers to the ability of the questionnaire’s find-
ings to represent what you intend to measure. This aspect makes an interesting conun-
drum, because if the researcher knew the findings there would be no need to conduct the
research. However, by using additional findings and other evidence to support the an-
swers researchers can avoid this issue.
Whether the questions within the questionnaire accurately reflect what they were intended
to measure is content validity. This can be overcome by assessing whether the questions
within the questionnaire are essential, unnecessary, or useful. Predictive validity refers to
the ability of the questions asked to make accurate predictions. This is assessed by com-
paring data that comes from the questions asked against that which is specified in the
criterion, often by using correlation.

34
Lastly, construct validity is the extent of which the set of questions measures the construct
that they were meant to measure. This is a complicated aspect of validity, therefore there
are two separate methods. Convergent validity is the correlation of data between different
measurement scales that are used to measure the same data. Discriminant validity is the
absence of correlation when different measurement scales are used on distinct constructs.
(Saunders et al 2016)
3.4 Questionnaire Construction
To reach a maximum number of respondents in both chosen countries, the questionnaire
was conducted online and in English. In total, there are 25 questions. The first three are
to understand the demographic of the respondent. The next 21 are structured around the
interactive entertainment industry and the respondents’ actions regarding the launch of
consoles. The final question is very general and open-ended to allow for the free flow of
respondents’ opinions and thoughts.
After the questionnaire was constructed it was pilot tested. This is a crucial step that al-
lows to correct any errors before implementation (Saunders et al 2016). The questionnaire
was shared online through universities in Finland and Germany, as well as through per-
sonal contacts. The questionnaire was available online for 25 days.
35
4 RESULTS OF THE RESEARCH
In the sections below the results of the survey will be presented. This will be done in
accordance with the research objectives laid out in the beginning of the thesis. The ques-
tionnaire that was used may be found in Appendix 1.
4.1 Demographics of Respondents
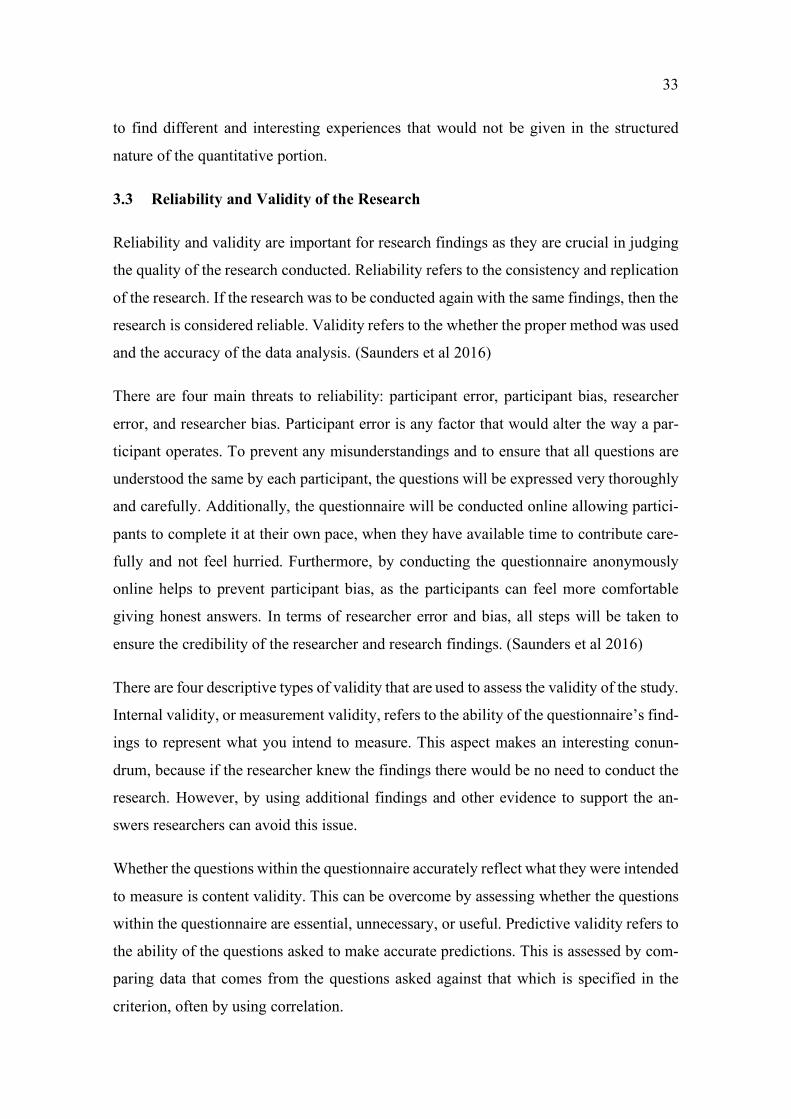
The questionnaire received a total of 154 responses. Of this total, 66 came from Finland
where 21.2% were female and 78.8% were male. The remaining 88 responses came from
Germany, where 48.9% were female and 51.1% were male. Figure 4 below shows the age
distribution of the respondents from both countries.
Figure 6. Age of respondents from both countries.
As can be seen in the graph, the highest number of respondents were in the 18 to 25-year-
old category, followed by the 26 to 30-year-old category. This was to be expected, as the
survey was primarily shared to other students.
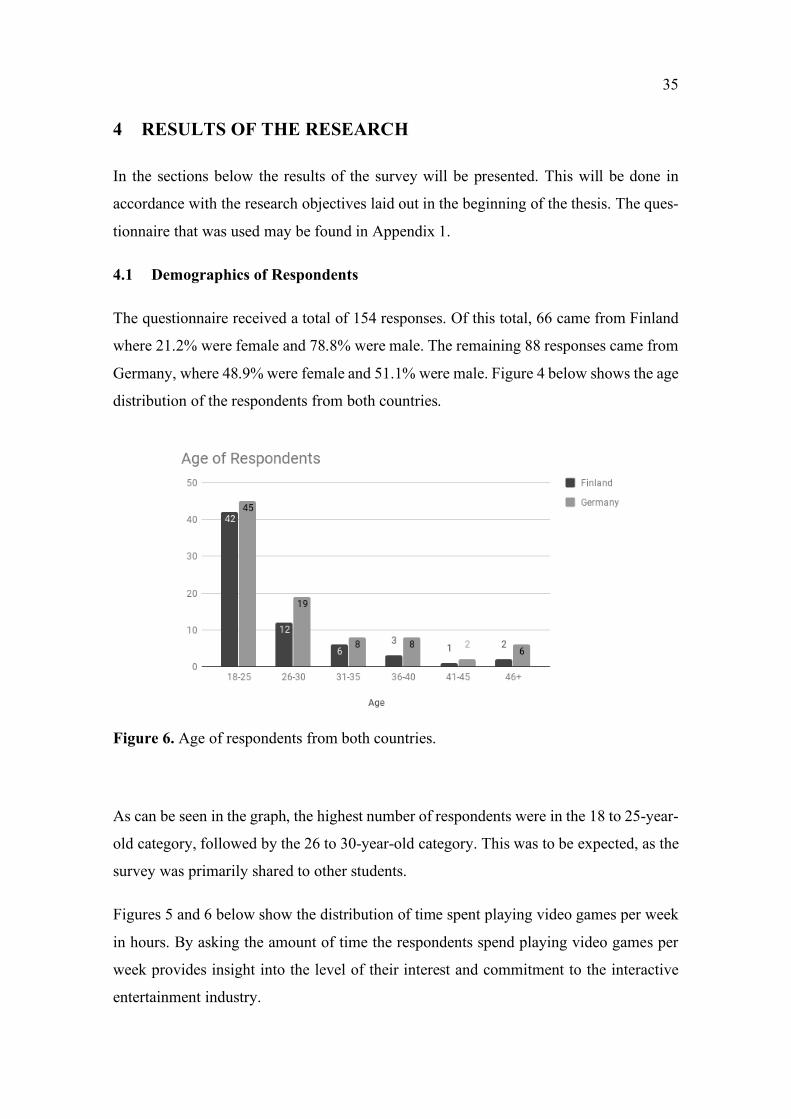
Figures 5 and 6 below show the distribution of time spent playing video games per week
in hours. By asking the amount of time the respondents spend playing video games per
week provides insight into the level of their interest and commitment to the interactive
entertainment industry.
36
Figure 7. Hours Finnish respondents spend playing video games per week.
Figure 8. Hours German respondents spend playing video games per week.
As can be seen in the above graph, Finland saw the highest number of responses with
under 3 hours, and the second highest with 4-6 hours. The third highest number of Finnish
respondents is with 7-10 hours, then over 20 hours, followed by 15-20 hours. Finland saw
the lowest number of respondents playing 10-15 hours per week.
Germany had the highest number of responses with under 3 hours and followed by 4-6
hours. However, Germany had the third highest number of responses with 10-15 hours,
followed by 15-20 hours. The lowest category for German respondents was tied with 7-
10 hours and over 20 hours per week.
37
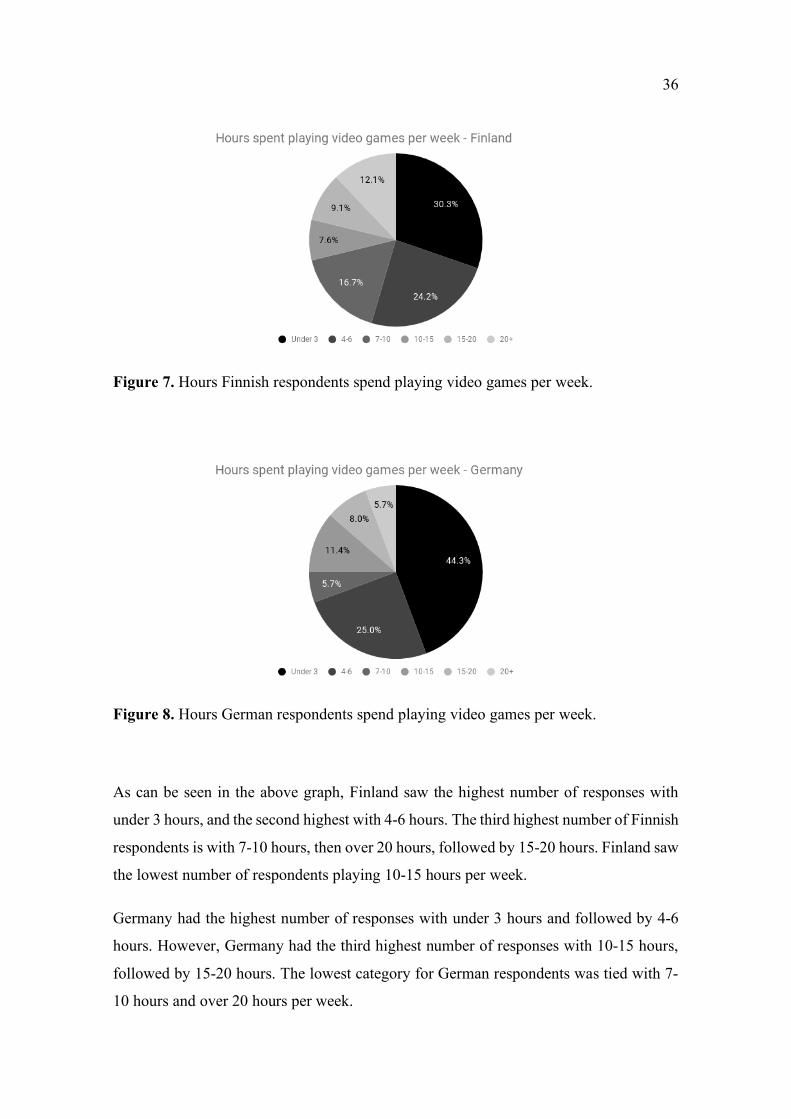
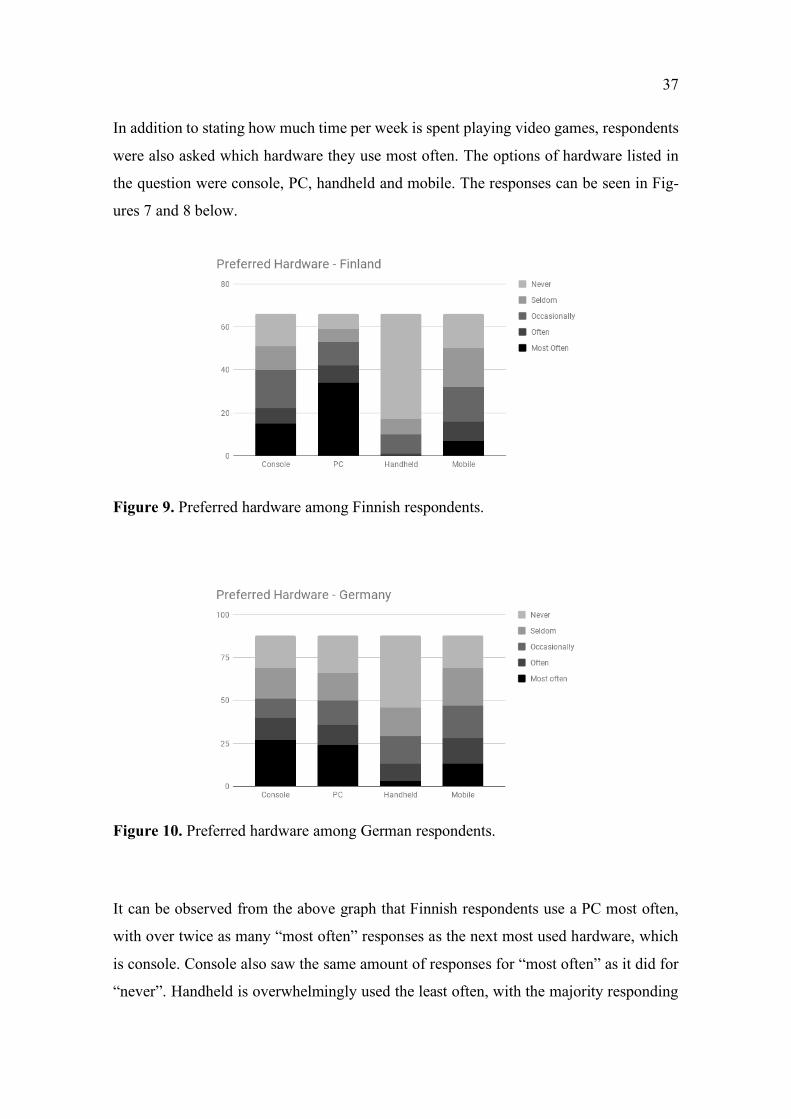
In addition to stating how much time per week is spent playing video games, respondents
were also asked which hardware they use most often. The options of hardware listed in
the question were console, PC, handheld and mobile. The responses can be seen in Fig-
ures 7 and 8 below.
Figure 9. Preferred hardware among Finnish respondents.
Figure 10. Preferred hardware among German respondents.
It can be observed from the above graph that Finnish respondents use a PC most often,
with over twice as many “most often” responses as the next most used hardware, which
is console. Console also saw the same amount of responses for “most often” as it did for
“never”. Handheld is overwhelmingly used the least often, with the majority responding
38
with “never” and zero responses for being used “most often”. Mobile has a fairly even
distribution from respondents for each usage option.
Among German respondents, console and PC are both played most often, with console
only slightly ahead. Both console and PC also have a fairly even distribution among the
other categories of use. Similar to Finnish respondents, handheld is used the least often
with the majority of respondents selecting “never”. Furthermore, mobile has a moderately
even distribution among German respondents as it did among those from Finland.
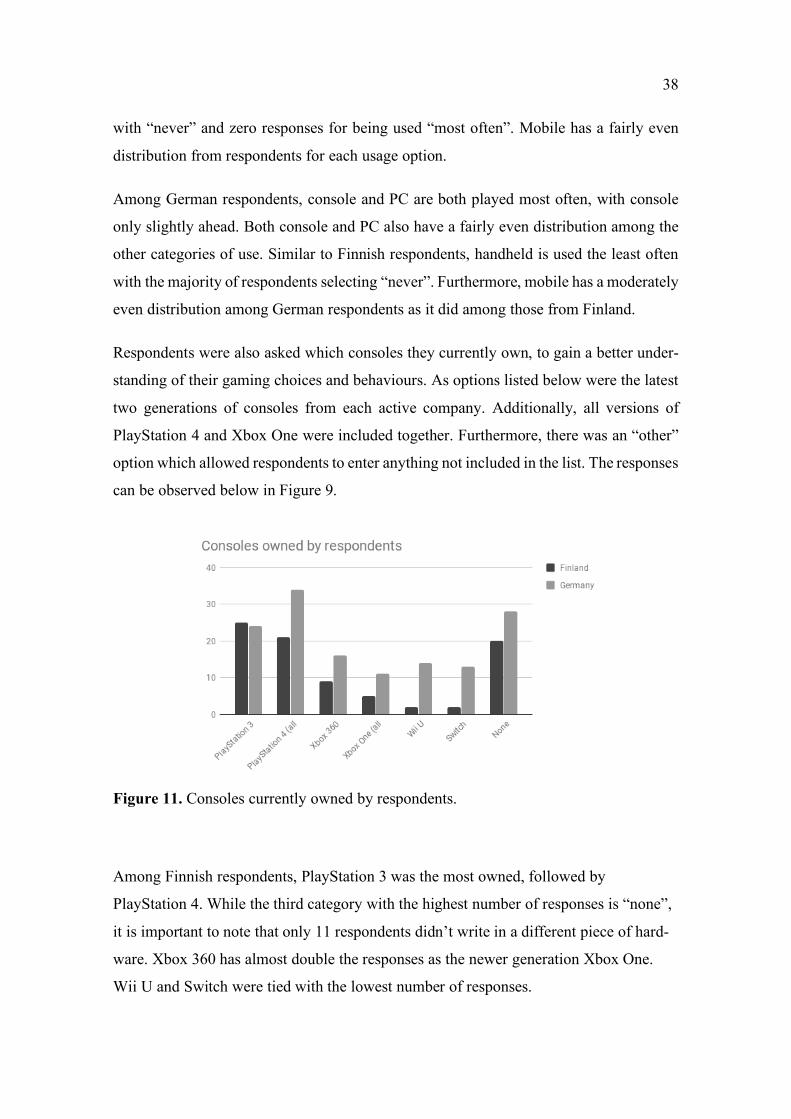
Respondents were also asked which consoles they currently own, to gain a better under-
standing of their gaming choices and behaviours. As options listed below were the latest
two generations of consoles from each active company. Additionally, all versions of
PlayStation 4 and Xbox One were included together. Furthermore, there was an “other”
option which allowed respondents to enter anything not included in the list. The responses
can be observed below in Figure 9.
Figure 11. Consoles currently owned by respondents.
Among Finnish respondents, PlayStation 3 was the most owned, followed by
PlayStation 4. While the third category with the highest number of responses is “none”,
it is important to note that only 11 respondents didn’t write in a different piece of hard-
ware. Xbox 360 has almost double the responses as the newer generation Xbox One.
Wii U and Switch were tied with the lowest number of responses.
39
Among German respondents, PlayStation 4 was the top owned console, followed by
PlayStation 3. The “none” option had the second highest number of responses, however
as with Finland, only 17 of those responses didn’t enter a different hardware. Wii U and
Switch came in fourth and fifth, respectively. Again, Xbox 360 saw more responses
than the Xbox One, which had the fewest number of responses.
4.2 Launch Behaviour
Several questions were asked in the questionnaire relating to console launches and how
each respondent behaved in those situations. Below the responses will be displayed and
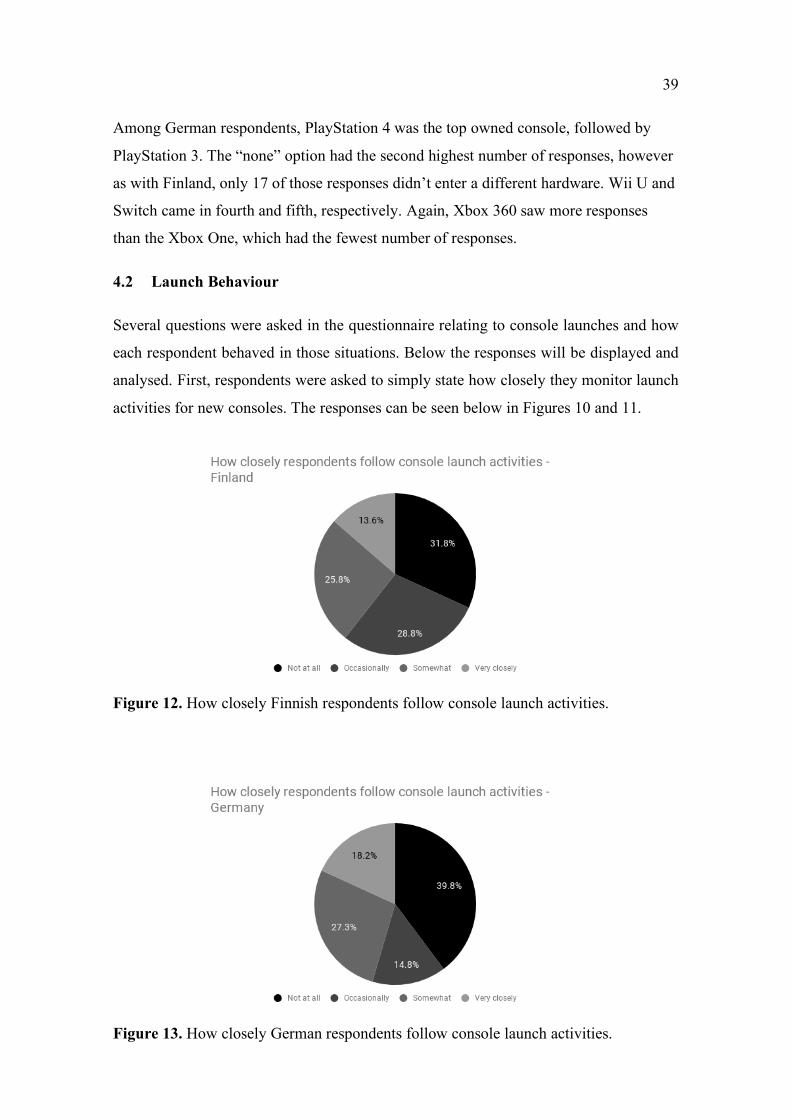
analysed. First, respondents were asked to simply state how closely they monitor launch
activities for new consoles. The responses can be seen below in Figures 10 and 11.
Figure 12. How closely Finnish respondents follow console launch activities.
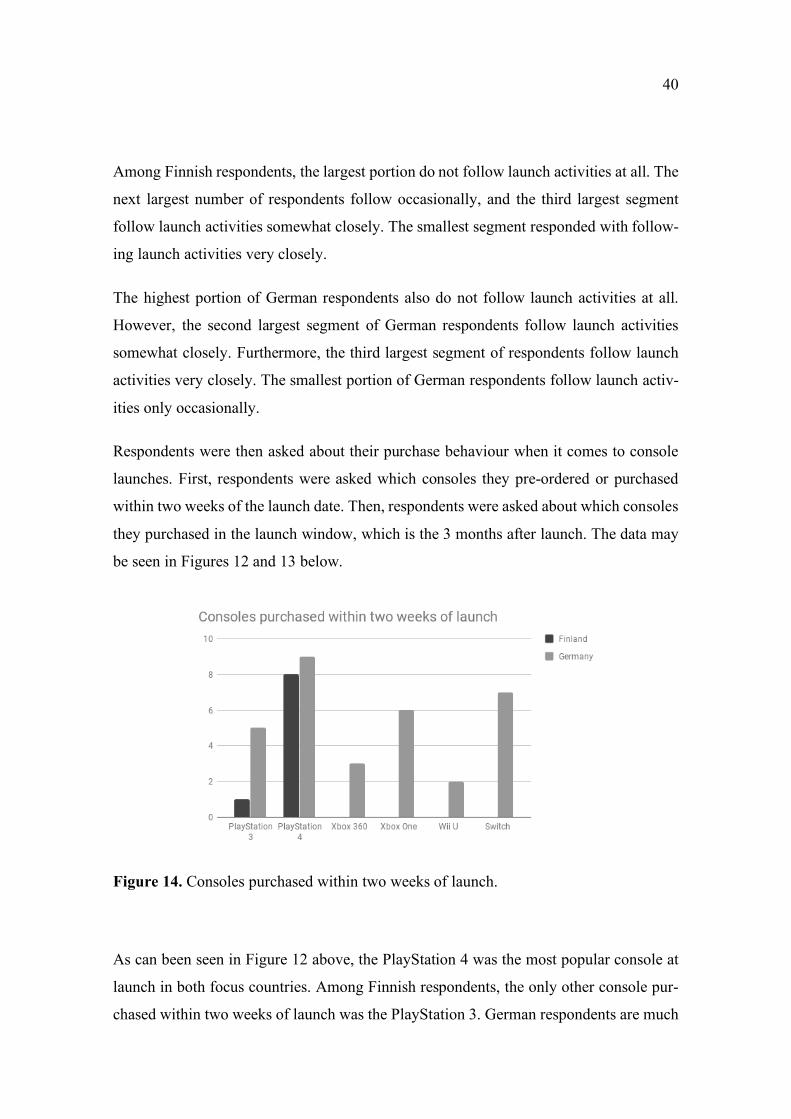
Figure 13. How closely German respondents follow console launch activities.
40
Among Finnish respondents, the largest portion do not follow launch activities at all. The
next largest number of respondents follow occasionally, and the third largest segment
follow launch activities somewhat closely. The smallest segment responded with follow-
ing launch activities very closely.
The highest portion of German respondents also do not follow launch activities at all.
However, the second largest segment of German respondents follow launch activities
somewhat closely. Furthermore, the third largest segment of respondents follow launch
activities very closely. The smallest portion of German respondents follow launch activ-
ities only occasionally.
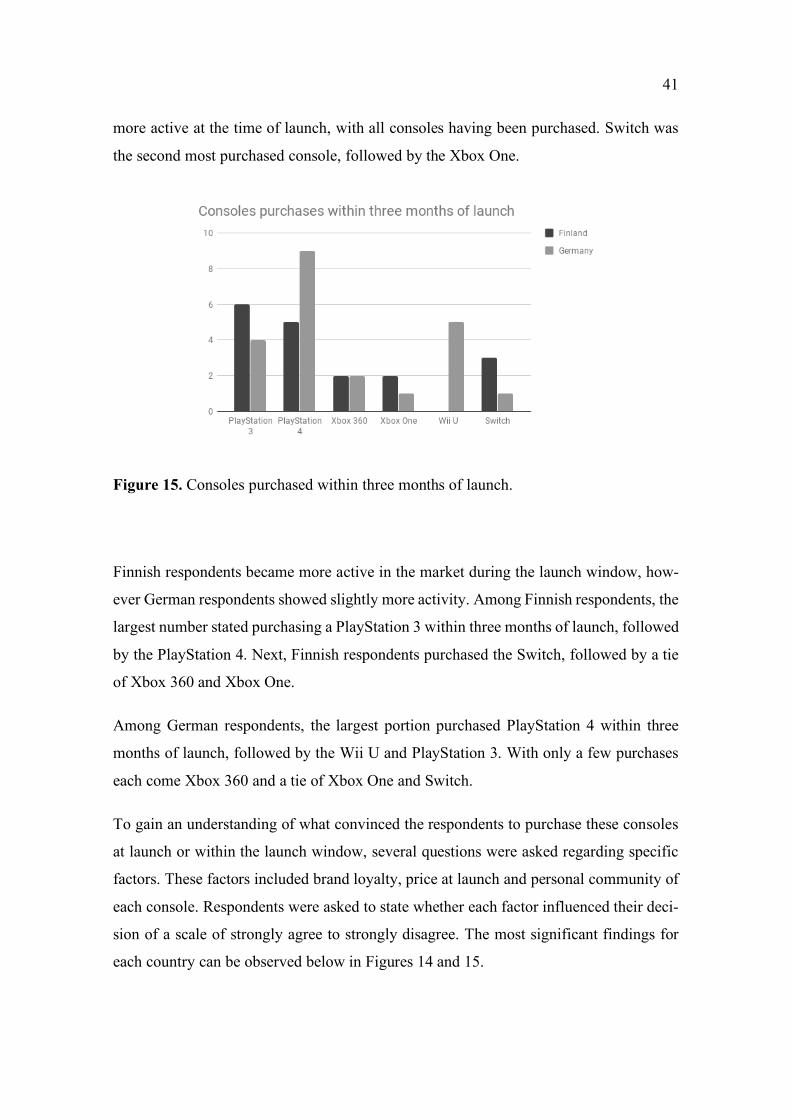
Respondents were then asked about their purchase behaviour when it comes to console
launches. First, respondents were asked which consoles they pre-ordered or purchased
within two weeks of the launch date. Then, respondents were asked about which consoles
they purchased in the launch window, which is the 3 months after launch. The data may
be seen in Figures 12 and 13 below.
Figure 14. Consoles purchased within two weeks of launch.
As can been seen in Figure 12 above, the PlayStation 4 was the most popular console at
launch in both focus countries. Among Finnish respondents, the only other console pur-
chased within two weeks of launch was the PlayStation 3. German respondents are much
41
more active at the time of launch, with all consoles having been purchased. Switch was
the second most purchased console, followed by the Xbox One.
Figure 15. Consoles purchased within three months of launch.
Finnish respondents became more active in the market during the launch window, how-
ever German respondents showed slightly more activity. Among Finnish respondents, the
largest number stated purchasing a PlayStation 3 within three months of launch, followed
by the PlayStation 4. Next, Finnish respondents purchased the Switch, followed by a tie
of Xbox 360 and Xbox One.
Among German respondents, the largest portion purchased PlayStation 4 within three
months of launch, followed by the Wii U and PlayStation 3. With only a few purchases
each come Xbox 360 and a tie of Xbox One and Switch.
To gain an understanding of what convinced the respondents to purchase these consoles
at launch or within the launch window, several questions were asked regarding specific
factors. These factors included brand loyalty, price at launch and personal community of
each console. Respondents were asked to state whether each factor influenced their deci-
sion of a scale of strongly agree to strongly disagree. The most significant findings for
each country can be observed below in Figures 14 and 15.
42
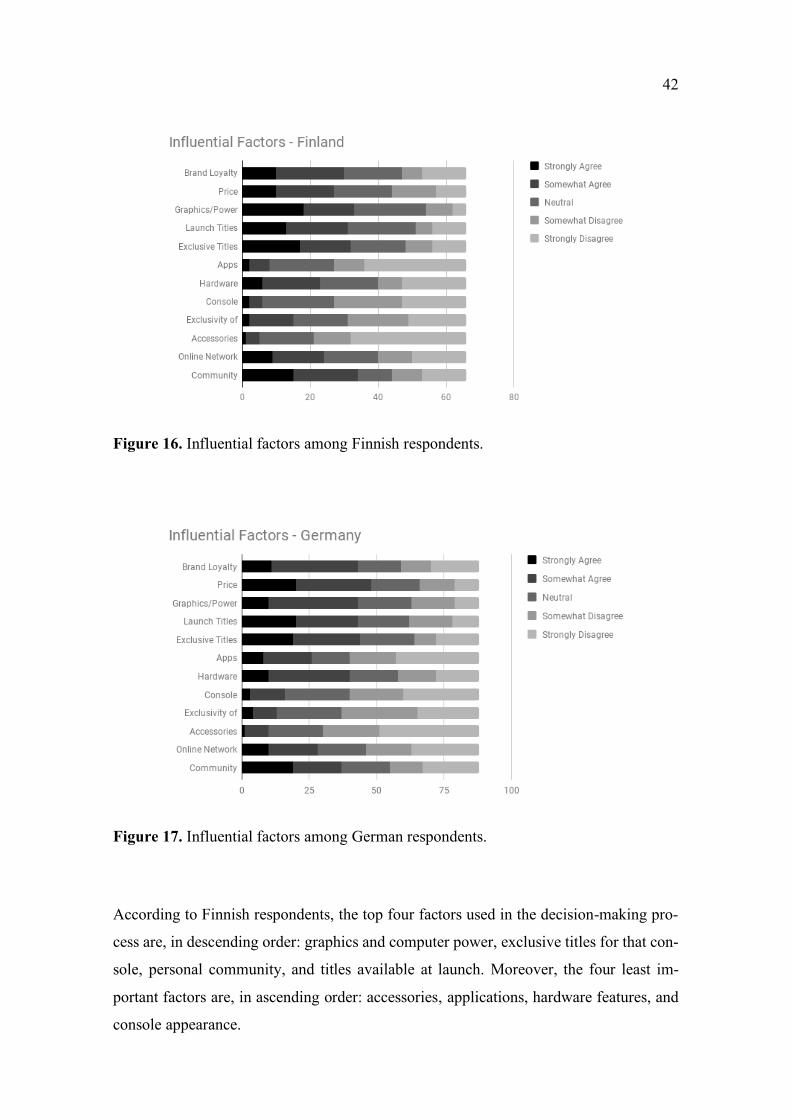
Figure 16. Influential factors among Finnish respondents.
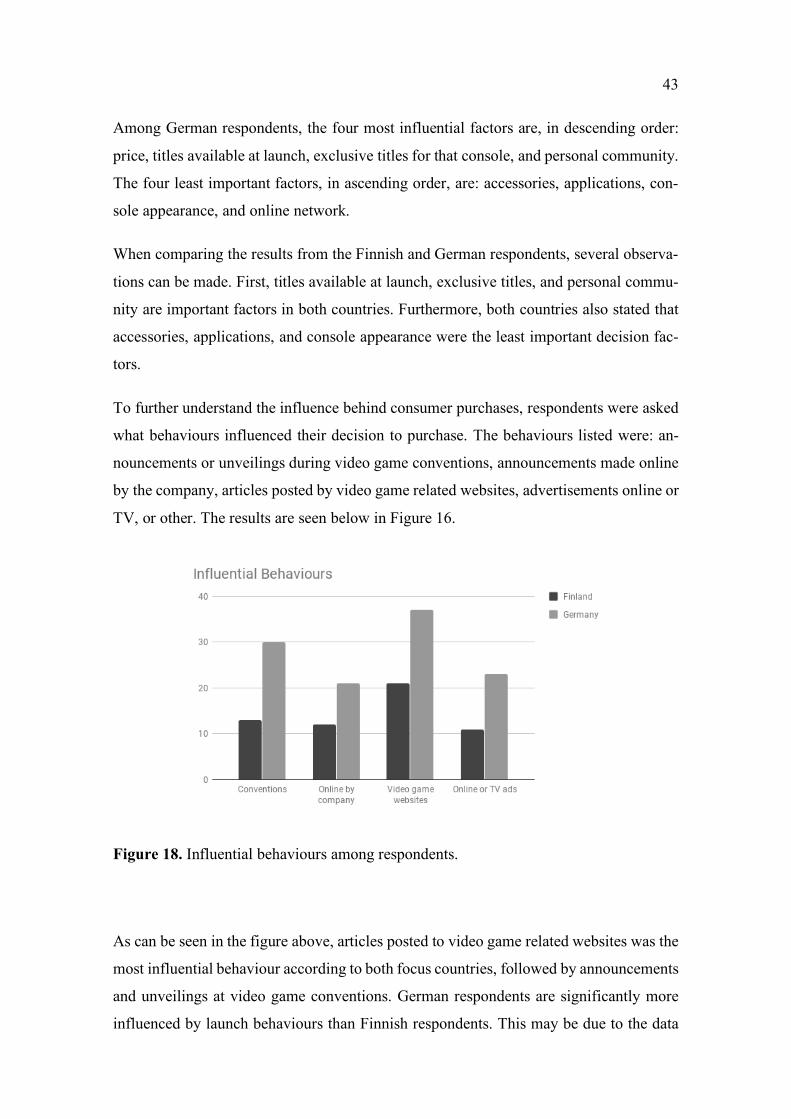
Figure 17. Influential factors among German respondents.
According to Finnish respondents, the top four factors used in the decision-making pro-
cess are, in descending order: graphics and computer power, exclusive titles for that con-
sole, personal community, and titles available at launch. Moreover, the four least im-
portant factors are, in ascending order: accessories, applications, hardware features, and
console appearance.
43
Among German respondents, the four most influential factors are, in descending order:
price, titles available at launch, exclusive titles for that console, and personal community.
The four least important factors, in ascending order, are: accessories, applications, con-
sole appearance, and online network.
When comparing the results from the Finnish and German respondents, several observa-
tions can be made. First, titles available at launch, exclusive titles, and personal commu-
nity are important factors in both countries. Furthermore, both countries also stated that
accessories, applications, and console appearance were the least important decision fac-
tors.
To further understand the influence behind consumer purchases, respondents were asked
what behaviours influenced their decision to purchase. The behaviours listed were: an-
nouncements or unveilings during video game conventions, announcements made online
by the company, articles posted by video game related websites, advertisements online or
TV, or other. The results are seen below in Figure 16.
Figure 18. Influential behaviours among respondents.
As can be seen in the figure above, articles posted to video game related websites was the
most influential behaviour according to both focus countries, followed by announcements
and unveilings at video game conventions. German respondents are significantly more
influenced by launch behaviours than Finnish respondents. This may be due to the data
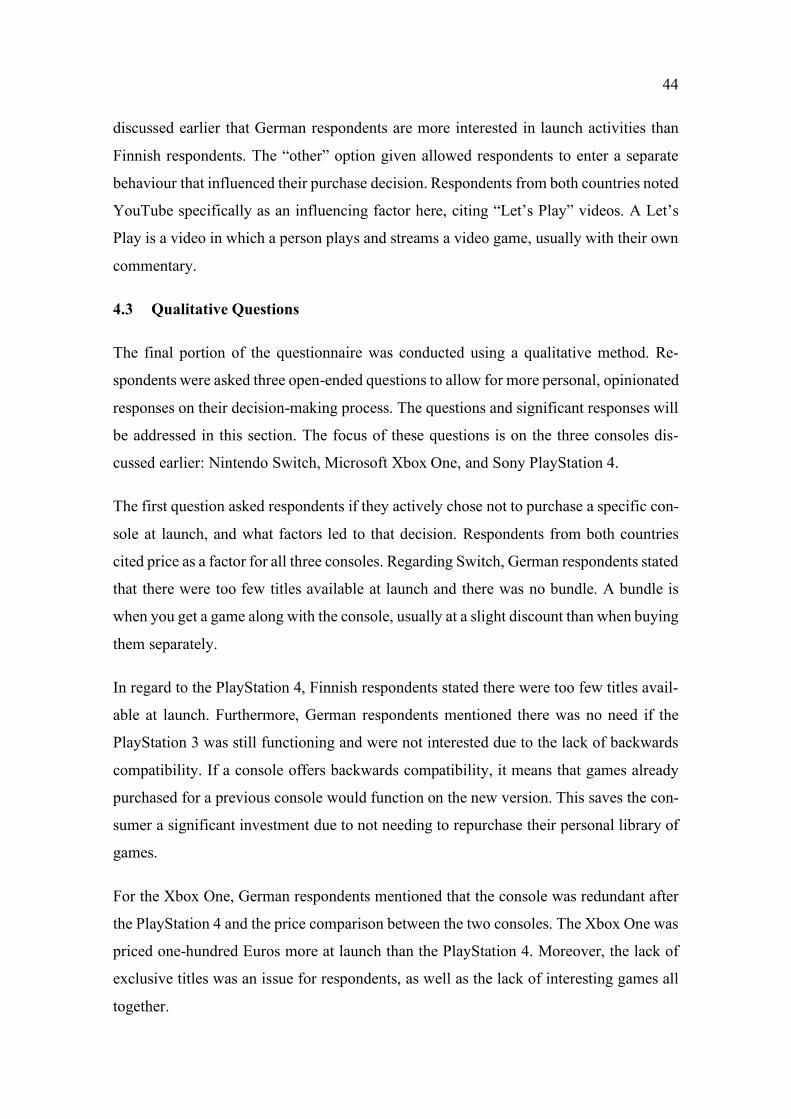
44
discussed earlier that German respondents are more interested in launch activities than
Finnish respondents. The “other” option given allowed respondents to enter a separate
behaviour that influenced their purchase decision. Respondents from both countries noted
YouTube specifically as an influencing factor here, citing “Let’s Play” videos. A Let’s
Play is a video in which a person plays and streams a video game, usually with their own
commentary.
4.3 Qualitative Questions
The final portion of the questionnaire was conducted using a qualitative method. Re-
spondents were asked three open-ended questions to allow for more personal, opinionated
responses on their decision-making process. The questions and significant responses will
be addressed in this section. The focus of these questions is on the three consoles dis-
cussed earlier: Nintendo Switch, Microsoft Xbox One, and Sony PlayStation 4.
The first question asked respondents if they actively chose not to purchase a specific con-
sole at launch, and what factors led to that decision. Respondents from both countries
cited price as a factor for all three consoles. Regarding Switch, German respondents stated
that there were too few titles available at launch and there was no bundle. A bundle is
when you get a game along with the console, usually at a slight discount than when buying
them separately.
In regard to the PlayStation 4, Finnish respondents stated there were too few titles avail-
able at launch. Furthermore, German respondents mentioned there was no need if the
PlayStation 3 was still functioning and were not interested due to the lack of backwards
compatibility. If a console offers backwards compatibility, it means that games already
purchased for a previous console would function on the new version. This saves the con-
sumer a significant investment due to not needing to repurchase their personal library of
games.
For the Xbox One, German respondents mentioned that the console was redundant after
the PlayStation 4 and the price comparison between the two consoles. The Xbox One was
priced one-hundred Euros more at launch than the PlayStation 4. Moreover, the lack of
exclusive titles was an issue for respondents, as well as the lack of interesting games all
together.
45
The second question given to respondents asked if there was anything more that could
have been done to persuade the consumer to purchase a console at launch. Respondents
from both countries cited price as a factor for all three consoles. Furthermore, Finnish
respondents mentioned backwards compatibility and introducing new exclusive titles.
Whereas German respondents mentioned seeing the consoles more on YouTube and tel-
evision. Moreover, the idea of adding additional benefits, such as: accessories with the
console at launch for a limited time, one-year subscription to the online network, or ex-
clusive merchandise.
For the Switch, several German respondents suggested having a wider array of titles avail-
able at launch. Furthermore, providing a bundle at launch would have been preferred.
In regard to PlayStation 4, a Finnish respondent proposed the idea of providing a discount
for current users of the previous console. However, this would be an option on the side
of the retailer rather than the manufacturers.
For the Xbox One, Finnish respondents not only suggested a lower price of the console
but also lower price for the games as well. Among German respondents, suggestions were
made for a stronger line-up of launch titles and more significant unique selling points.
The final question asked respondents to leave any additional thoughts or comments.
Among Finnish respondents the comments focused on PC, including “PC Master Race”.
This is a belief that those who play video games on PC are somehow superior to those
who play on consoles.
Among German respondents, some stated reasons for why they were unable to purchase
consoles at launch, such as: apprentice, student, or only buy from one company at launch.
Furthermore, two respondents mentioned games. One stated that they were a fan of the
Halo series, which was exclusive to Xbox, and would play whichever console it was
available on. Another stated that YouTube play-through streamers show certain games
which can inspire consumers to buy the console those games can be played on.
46
5 CONCLUSION
The aim of this thesis was to establish the ideal behaviours for launching a new gaming
console in the German and Finnish markets. Furthermore, to discover what could be
learned for future product launches in the respective markets.
The theoretical chapter discussed the fundamentals of launching a new product, an anal-
ysis of the interactive entertainment industry, as well as Porter’s five forces and generic
strategies to analyse competition. Moreover, the launch behaviour for each of the chosen
case consoles was outlined.
The empirical chapter describes the chosen research methods and the construction of the
questionnaire. A concurrent research method was used, which allows for the collection
of quantitative and qualitative data in a single phase. Additionally, the research findings
are analysed and visualised.
This final chapter will conclude the thesis with a summary of the research findings and
discuss the limitations, reliability, and validity of the study. Lastly, suggestions will be
made for further research.
5.1 Summary of Research Findings
In a comparison of the two countries, Germany is notably more active in terms of console
launches. Among German respondents, consoles are the preferred hardware, they own
more consoles, and follow launch activities more. Furthermore, they are significantly
more involved in terms of purchases at launch and during the launch window. Finnish
respondents were most interested in PC as their preferred hardware.
The two countries do overlap when determining which factors are most influential to the
purchase decision. Exclusive titles, titles available at launch, and their personal gaming
community are among the top factors for both countries. Moreover, accessories, applica-
tions, and console appearance were among the least important.
Furthermore, both countries stated that the preferred method of launch communications
was through articles posted on video game related websites. This may be due to the, gen-
erally speaking, impartial review of the product. It gives consumers an unbiased opinion
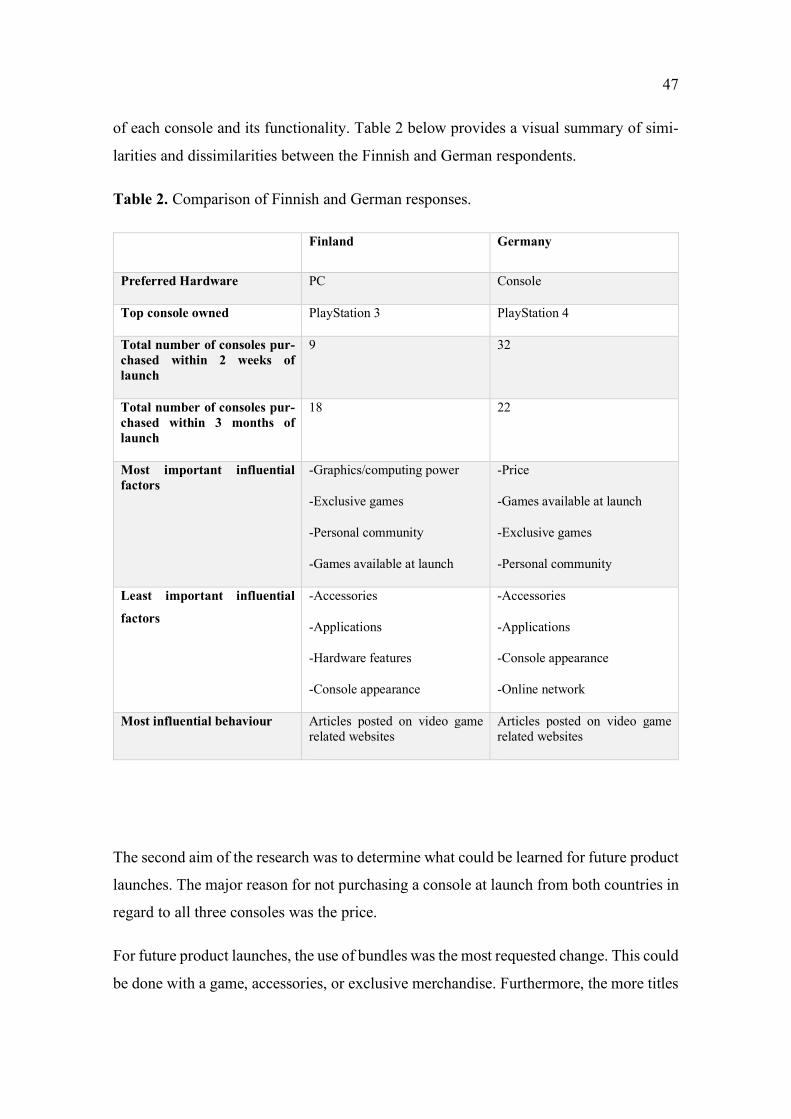
47
of each console and its functionality. Table 2 below provides a visual summary of simi-
larities and dissimilarities between the Finnish and German respondents.
Table 2. Comparison of Finnish and German responses.
Finland Germany
Preferred Hardware PC Console
Top console owned PlayStation 3 PlayStation 4
Total number of consoles pur-chased within 2 weeks of launch
9 32
Total number of consoles pur-chased within 3 months of launch
18 22
Most important influential factors
-Graphics/computing power
-Exclusive games
-Personal community
-Games available at launch
-Price
-Games available at launch
-Exclusive games
-Personal community
Least important influential
factors
-Accessories
-Applications
-Hardware features
-Console appearance
-Accessories
-Applications
-Console appearance
-Online network
Most influential behaviour Articles posted on video game related websites
Articles posted on video game related websites
The second aim of the research was to determine what could be learned for future product
launches. The major reason for not purchasing a console at launch from both countries in
regard to all three consoles was the price.
For future product launches, the use of bundles was the most requested change. This could
be done with a game, accessories, or exclusive merchandise. Furthermore, the more titles
48
available at launch and exclusive titles offered would increase the likelihood of purchases
from respondents in both countries.
5.2 Limitations of the Study
Certain limitations of the research should be noted in the thesis. First, the research was
only conducted from consumers’ perspective not from the company’s. The reasoning be-
hind this is two-fold. First, the amount of research would far exceed that of a bachelor’s
thesis. Secondly, further cooperation would be required from each of the companies as
their launch activities and sales information are not public knowledge.
The second limitation is the sample. First, the sample size could have been larger to gain
a more in-depth understanding. Secondly, the sample sizes were not even from the two
focus countries. If a larger and more even sample was used more accurate statistical anal-
ysis may have been conducted.
The third limitation is the lack of previous studies in this research area. There was limited
information to be found both on new product launch strategies and on the interactive
entertainment industry. The interactive entertainment industry is fairly new and has seen
significant growth in recent years, which may inspire more future research.
A fourth limitation is the limited comparability between the consoles. While Xbox One
and PlayStation 4 are quite comparable, Switch overlaps with some factors while ignoring
others. Furthermore, the Xbox One and PlayStation 4 were released in the same genera-
tion and have had reiterations of the same console released since. Nintendo has released
the Wii U and Switch in the same time frame, which limits the comparison of the con-
soles.
5.3 Reliability and Validity of the Study
The aim of the research is to be as reliable and valid as possible. Reliability and validity
are dependent upon question design, the structure of the questionnaire, and proper testing
of the questionnaire. (Saunders et al 2016)
As mentioned previously, reliability refers to the consistency and replication of the re-
search, that if it were to be recreated it would see the same findings. Validity focuses on
the research method and accuracy of the analysis.
49
The content of the questionnaire focuses on activities surrounding console launches and
how active the respondents are in the interactive entertainment industry. Furthermore, the
questions were designed and worded in a way that would be easy to understand for all
respondents. This was done by providing examples to provide a better understanding of
what was being described.
As mentioned under limitations, the sample size could have been larger and more even
between the two countries. However, due to time constraints this was unable to happen.
Furthermore, the respondents were primarily students and therefore focuses on a smaller
segment in each country.
Lastly, due to limited previous studies in this specific sector there was little research to
be used to back up the findings of this study. These particular findings challenge the reli-
ability and validity of the research.
5.4 Suggestions for Future Research
This study could be expanded and developed for future research in many different ways.
The overall topic of new product launches is vast and there are significant possibilities
for future research. Furthermore, the interactive entertainment industry has many more
aspects that could be studied.
First, a similar study could be carried out regarding launch activities on a broader scale.
For example, Europe as a whole or even globally. Moreover, a collaboration may be made
with one or more of the companies to provide a more in-depth view from the business
side rather than just the consumer.
Secondly, this study focused solely on the launch of gaming consoles. Further research
could be carried out for different kinds of hardware and other gaming platforms. As dis-
covered that Finland preferred gaming with PC, that is an aspect that could be explored.
Additionally, the rise of mobile gaming is one factor that could be researched and if its
increase in use is causing a decline in demand for consoles. From this the adaptation of
consoles could be studied, such as the multifunction of the Switch being a home and
handheld console.

50
Thirdly, a study may be done on the launch of games for the different platforms. As this
research suggests, more versions of a game would be sold for PC in Finland and for con-
soles in Germany. This is a topic that could be expanded internationally as well.
Lastly, a comparison may be done about new product launch strategies in different indus-
tries. One could study the reaction of the case countries’ responses to the launch of cell
phones or limited-edition sneakers.
51
REFERENCES
Biggadike, E. R. 1979. Corporate Diversification: Entry, Strategy, and Performance. Cambridge, MA. Harvard University.
Brenner, M. 2017. What is thought leadership? And when should you use it? Accessed 11.01.2018. https://marketinginsidergroup.com/content-marketing/what-is-thought-lead-ership-and-when-you-should-use-it/
Brunicki, A. 2017. 5 trends that matter in mobile gaming in 2017. Accessed 6.11.2017. https://venturebeat.com/2017/03/12/5-trends-that-matter-in-mobile-gaming-in-2017/
Byrne, K. 2017. HIS: World console market down in 2016 but PS4 claims 51% share over Xbox One’s 26%. Accessed 20.03.2017. http://www.mcvuk.com/news/read/ihs-world-console-market-down-in-2016-but-ps4-claims-51-share-over-xbox-one-s-26/0180196
Clarke, S. 2013. Xbox One to launch Nov. 22 in 13 markets; more Day One consoles now available for pre-order. Accessed 22.03.2017. https://blogs.microsoft.com/fire-hose/2013/09/04/xbox-one-to-launch-nov-22-in-13-markets-more-day-one-consoles-now-available-for-pre-order/#sm.0000412tgle7zf4txna2eoj1inrsb
Clements, M. Ohashi, H. 2005. Indirect Network Effects and the Product Cycle: Video Games in the U.S., 1994-2002. Journal of Industrial Economics. 53:515-542.
Clements, R. 2013. PS4 Launch Games: The Complete List. Accessed 24.03.2017. http://blog.us.playstation.com/2013/11/15/ps4-launch-games-the-complete-list/
Cooper, R. G. 1990. Stage-gate systems: A new tool for managing new products. Busi-ness Horizons, 33: 44-54.
Covert, A. 2013. Microsoft unveils new Xbox One game console. Accessed 22.03.2017. http://money.cnn.com/2013/05/21/technology/microsoft-xbox/
Di Benedetto, C. A. 1999. Identifying the Key Success Factors in New Product Launch. Journal of Product Innovation Management, 16: 530–544.
Dunn, J. 2016. Here’s how PlayStation 4 sales stack up to the best-selling game con-soles ever. Accessed 24.03.2017. http://www.businessinsider.de/sony-playstation-4-best-selling-video-game-consoles-chart-2016-12
Eisenmann, T. Parker, G. Van Alstyne, MW. Strategies for two-sided markets. Harvard Business Review. 84(10):92.
Forbes 2016. The World’s Most Valuable Brands. Accessed 22.03.2017. https://www.forbes.com/powerful-brands/list/
Goldfarb, A. 2013. Gamescom: Full Xbox One Launch Lineup Revealed. Accessed 23.03.2017. http://uk.ign.com/articles/2013/08/20/gamescom-full-xbox-one-launch-lineup-revealed
52
Goss, P. 2011. Ten Years of Xbox: a brief history. Accessed 22.03.2017. http://www.techradar.com/news/gaming/consoles/ten-years-of-xbox-a-brief-history-1040866
Gretz, R. 2010. Hardware Quality vs. Network Size in the Home Video Game Industry. Journal of Economic Behavior & Organization. 76:168-183.
Griffith, E. 2013. The Evolution of the Sony PlayStation. Accessed 24.03.2017. http://uk.pcmag.com/sony-playstation-4-ps4/6063/feature/the-evolution-of-the-sony-playstation
Guiltinan, J. P. 1999. Launch Strategy, Launch Tactics, and Demand Outcomes. Journal of Product Innovation Management. 16:509-529.
Hamari, J. Sjöblom, M. 2017. What is eSports and why do people watch it? Internet Re-search. 27:211-232.
Hryb, L. 2013. #Xbox Reveal. Accessed 21.03.2017. https://majornel-son.com/2013/04/24/xboxreveal/
Hultink, E. J., Griffin, A., Hart, S., Robben, H. S. J. 1997. Industrial New Product Launch Strategies and Product Development Performance. Journal of Product Innova-tion Management, 14:243-257.
IGN 1998. History of the PlayStation. Accessed 23.03.2017. http://www.ign.com/arti-cles/1998/08/28/history-of-the-playstation
Kelly, G. 2016a. PS4 Pro Vs PS4 Slim: What’s the Difference?. Accessed 17.06.2017. https://www.forbes.com/sites/gordonkelly/2016/11/09/ps4-pro-vs-ps4-slim-vs-ps4-whats-the-difference/#5367b3647a8a
Kelly, G. 2016b. Xbox One S Vs Xbox One: What’s the Difference?. Accessed 17.06.2017. https://www.forbes.com/sites/gordonkelly/2016/11/10/microsoft-xbox-one-vs-xbox-one-s-whats-the-difference/#3378317c458f
Kohler, C. 2016. Nintendo NX Game Machine Has a Real Name: ‘Nintendo Switch’. Accessed 21.03.2017. https://www.wired.com/2016/10/nintendo-nx-switch/
Koller, J. 2013. PS4 Launches in North America on November 15th, Gamescom Wrap-Up. Accessed 24.03.2017. http://blog.us.playstation.com/2013/08/20/ps4-launches-in-north-america-on-november-15th-gamescom-wrap-up/
Layden, Shawn. 2016. PlayStation 4 Pro Launches Today. Accessed 17.06.2017. https://blog.us.playstation.com/2016/11/10/playstation-4-pro-launches-today/
Marchand, A. Hennig-Thurau, T. 2013. Value Creation in the Video Game Industry: In-dustry Economics, Consumer Benefits, and Research Opportunities. Journal of Interac-tive Marketing. 27:141-157.
Martin, C. 2016. Xbox One S Release Date and Price. Accessed 17.06.2017. http://www.pcadvisor.co.uk/new-product/game/xbox-one-s-release-date-price-uk-new-xbox-one-s-specs-features-on-sale-stock-3640180/

53
McDonald, E. 2017. The global games market will reach $108.9 billion in 2017 with mobile gaming taking 42%. Accessed 6.11.2017. https://newzoo.com/insights/arti-cles/the-global-games-market-will-reach-108-9-billion-in-2017-with-mobile-taking-42/
Microsoft 2013. The Worldwide Launch of Xbox One Sparks A Global Celebration. Accessed 23.03.2017. http://news.xbox.com/2013/11/22/xbox-one-launch-blog/
Microsoft 2014. Thank You for an Epic 2013. Accessed 23.03.2017. http://news.xbox.com/2014/01/06/xbox-one-january-thank-you/
Microsoft 2016a. Annual Report 2016 for the Fiscal year Ended June 30, 2016. Ac-cessed 22.03.2017. https://www.microsoft.com/investor/reports/ar16/index.html
Microsoft 2016b. Important Dates. Accessed 22.03.2017. https://news.mi-crosoft.com/facts-about-microsoft/#ImportantDates
Molina, B. 2017. E3 2017: Five big video game trends to watch. Accessed 11.10.2017. https://www.usatoday.com/story/tech/talkingtech/2017/06/14/e-3-2017-five-big-video-game-trends-watch/395128001/#
Narcisse, E. 2013. Here’s Everything That Comes With The $500 ‘Day One’ Xbox One. Accessed 22.03.2017. http://kotaku.com/heres-everything-that-comes-with-the-500-day-one-xb-1065145279
Newzoo 2016. Free 2016 Global Games Market Report. Accessed 20.03.2017. https://cdn2.hubspot.net/hubfs/700740/Re-ports/Newzoo_Free_2016_Global_Games_Market_Report.pdf
Newzoo 2017. Free 2017 Global eSports Market Report. Accessed 11.10.2017. http://resources.newzoo.com/thank-you-esports-report-light-2017?submis-sionGuid=954e6b27-7992-4dac-9319-e451d9bb6f40
Nintendo 2016a. Annual Report 2016 for the Fiscal Year Ended March 31, 2016. Ac-cessed 21.03.2017. https://www.nintendo.co.jp/ir/pdf/2016/annual1603e.pdf
Nintendo 2016b. IR Information Hardware and Software Sales Units. Accessed 22.03.2017. https://www.nintendo.co.jp/ir/en/sales/hard_soft/
Nintendo 2017a. Corporate Company History. Accessed 22.03.2017. http://www.nin-tendo.com/corp/history.jsp
Nintendo 2017b. Nintendo Switch launches March 3rd at $299.99. Accessed 22.03.2017. http://www.nintendo.com/whatsnew/detail/nintendo-switch-launches-march-3-at-299-99
Nintendo 2017c. Nintendo Switch ushers in a new era of console gaming on the go. Ac-cessed 22.03.2017. http://www.nintendo.com/whatsnew/detail/nintendo-switch-ushers-in-a-new-era-of-console-gaming-on-the-go
Nintendo, DeNA 2015. Business and Capital Alliance Announcement. Accessed 21.03.2017. https://www.nintendo.co.jp/corporate/release/en/2015/150317/03.html
54
Porter, M. E. 1980. Competitive Strategy: Techniques for Analyzing Industries and Competitors. First Edition. New York. The Free Press.
Rabowsky, B. 2010. Interactive Entertainment: A Videogame Industry Guide. First Edi-tion. Oxnard, CA. RadiosityPress.
Rubin, P. 2013. Exclusive First Look at Xbox One. Accessed 21.03.2017. https://www.wired.com/2013/05/xbox-one/
Sandhusen, R. L. 2000. Marketing (Barron’s Business Review Series). Third Edition. Hauppauge, NY. Barron’s Educational Series.
Saunders, M. Lewis, P. Thornhill, A. 2016. Research Methods for Business Students. Seventh Edition. Essex. Pearson Higher Education.
Seth, S. 2015. World’s Top 10 Software Companies. Accessed 22.03.2017. http://www.investopedia.com/articles/personal-finance/121714/worlds-top-10-software-companies.asp
Song, X. M., Montoya-Weiss, M. M. 1998. Critical Development Activities for Really New versus Incremental Products. Journal of Product Innovation Management. 15:124-135.
Sony 2013a. Sony Computer Entertainment Inc. Introduces PlayStation 4 (PS4). Ac-cessed 24.03.2017. https://www.playstation.com/en-us/corporate/press-re-leases/2013/sony-computer-entertainment-inc-introduces-playstation-4-ps4/
Sony 2013b. Sony Computer Entertainment America Unveils PlayStation 4 System, Showcases Blockbuster Content for PlayStation Platforms at the 2013 E3 Media & Business Summit. Accessed 24.03.2017. https://www.playstation.com/en-us/corpo-rate/press-releases/2013/scea-unveils-ps4-system-showcases-blockbuster-content-for-2013-e3-media/
Sony 2017a. Corporate History. Accessed 23.03.2017. http://www.sony.net/SonyInfo/CorporateInfo/History/history.html
Sony 2017b. PlayStation4 (PS4) Sells Through 6.2 Million Units Worldwide During the 2016 Holiday Season. Accessed 24.03.2017. http://www.sie.com/en/corporate/re-lease/2017/170105.html
SuperData Research. 2017. Nintendo Switch: the SuperData Take. Accessed 23.03.2017. https://www.superdataresearch.com/nintendo-switch-the-superdata-take/
The Verge 2013. Xbox at E3 2013: Everything You Need to Know. Accessed 22.03.2017. http://www.theverge.com/2013/6/10/4414176/microsoft-xbox-one-at-e3-2013-everything-you-need-to-know
Thota, H., Munir, Z. 2011. Key Concepts in Innovation. First Edition. Hampshire, United Kingdom. Palgrave Macmillan.

55
Wang, R. D., Shaver, J. M. 2016. The Multifaceted Nature of Competitive Response: Repositioning and New Product Launch as Joint Response to Competition. Strategy Sci-ence 1(3):148-162.
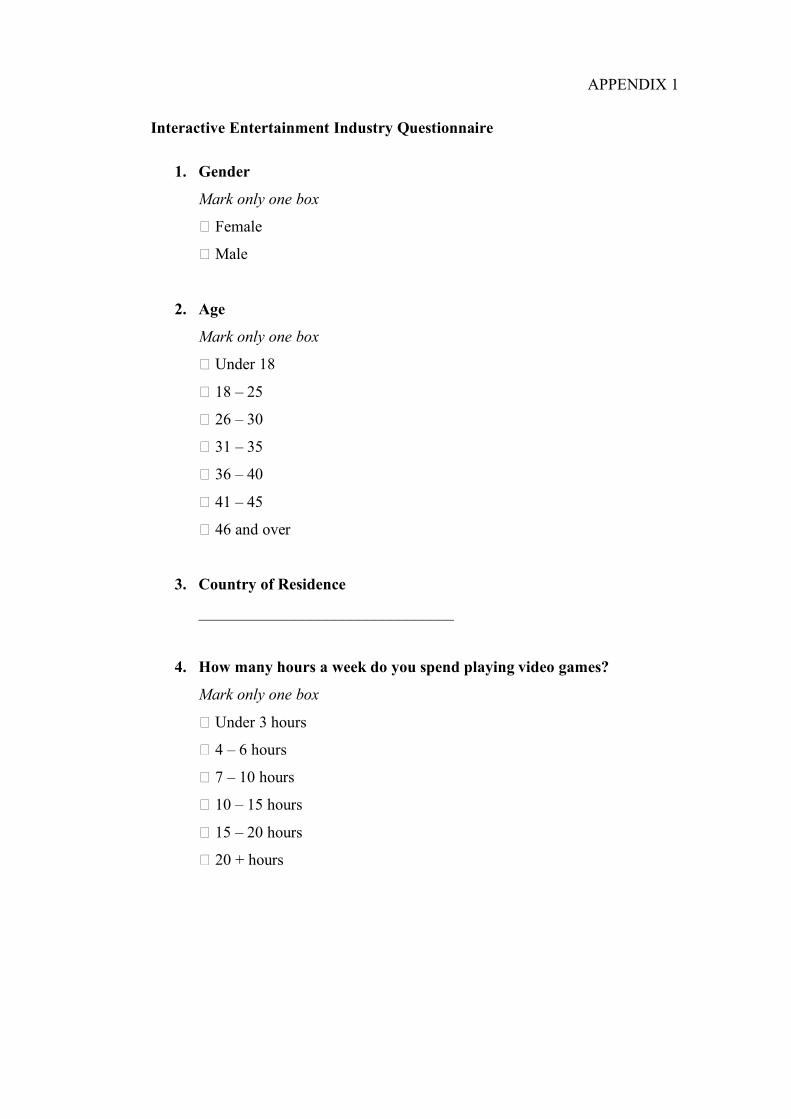
APPENDIX 1
Interactive Entertainment Industry Questionnaire
1. Gender
Mark only one box
� Female
� Male
2. Age
Mark only one box
� Under 18
� 18 – 25
� 26 – 30
� 31 – 35
� 36 – 40
� 41 – 45
� 46 and over
3. Country of Residence
________________________________
4. How many hours a week do you spend playing video games?
Mark only one box
� Under 3 hours
� 4 – 6 hours
� 7 – 10 hours
� 10 – 15 hours
� 15 – 20 hours
� 20 + hours
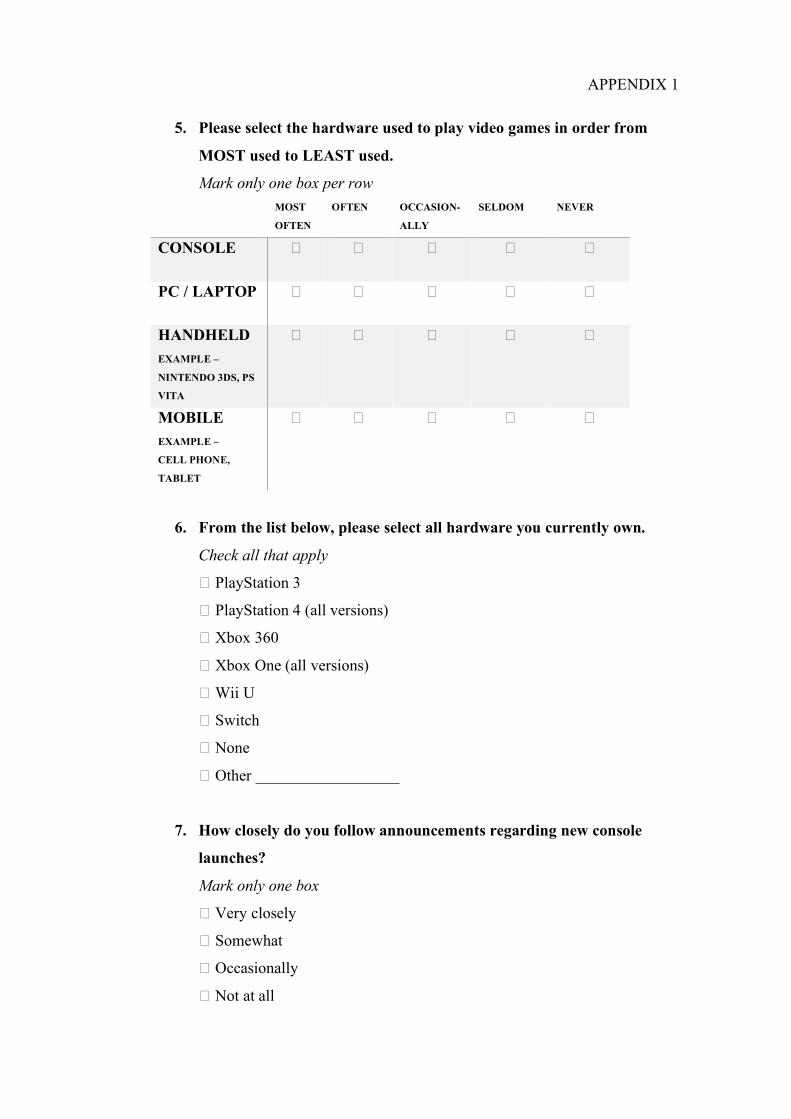
APPENDIX 1
5. Please select the hardware used to play video games in order from
MOST used to LEAST used.
Mark only one box per row
MOST
OFTEN OFTEN OCCASION-
ALLY SELDOM NEVER
CONSOLE � � � � �
PC / LAPTOP � � � � �
HANDHELD
EXAMPLE –
NINTENDO 3DS, PS
VITA
� � � � �
MOBILE EXAMPLE –
CELL PHONE,
TABLET
� � � � �
6. From the list below, please select all hardware you currently own.
Check all that apply
� PlayStation 3
� PlayStation 4 (all versions)
� Xbox 360
� Xbox One (all versions)
� Wii U
� Switch
� None
� Other __________________
7. How closely do you follow announcements regarding new console
launches?
Mark only one box
� Very closely
� Somewhat
� Occasionally
� Not at all
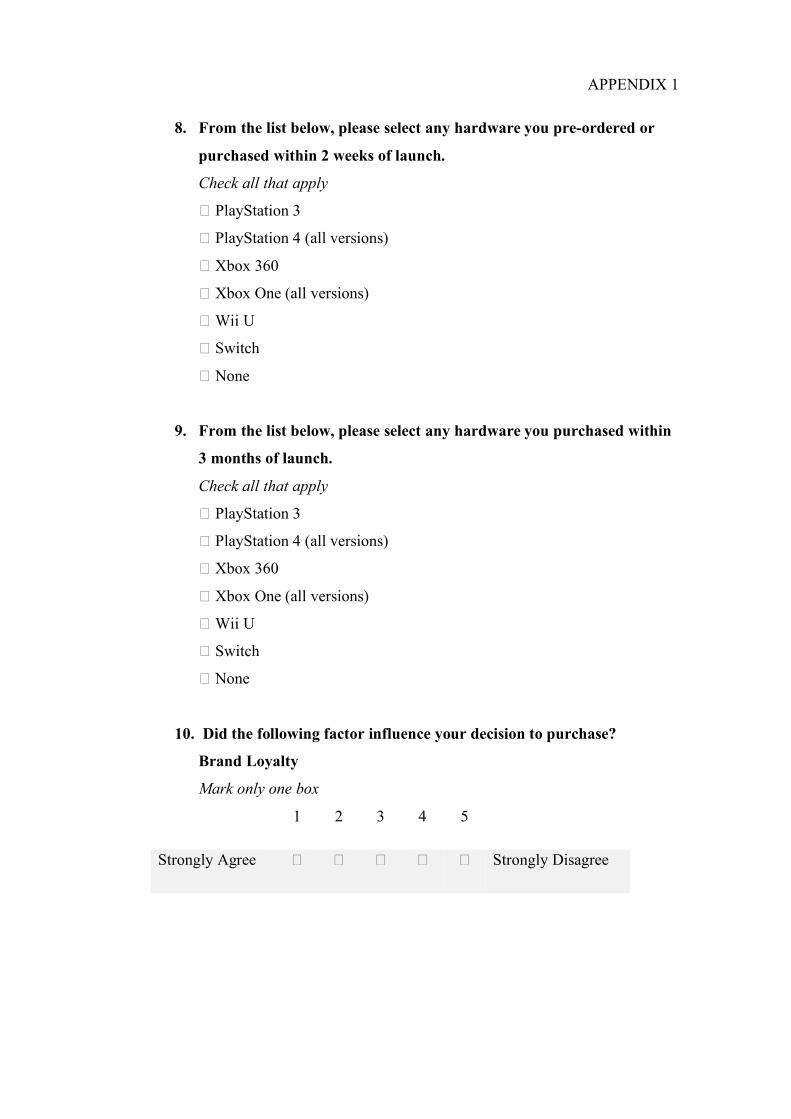
APPENDIX 1
8. From the list below, please select any hardware you pre-ordered or
purchased within 2 weeks of launch.
Check all that apply
� PlayStation 3
� PlayStation 4 (all versions)
� Xbox 360
� Xbox One (all versions)
� Wii U
� Switch
� None
9. From the list below, please select any hardware you purchased within
3 months of launch.
Check all that apply
� PlayStation 3
� PlayStation 4 (all versions)
� Xbox 360
� Xbox One (all versions)
� Wii U
� Switch
� None
10. Did the following factor influence your decision to purchase?
Brand Loyalty
Mark only one box
1 2 3 4 5
Strongly Agree � � � � � Strongly Disagree
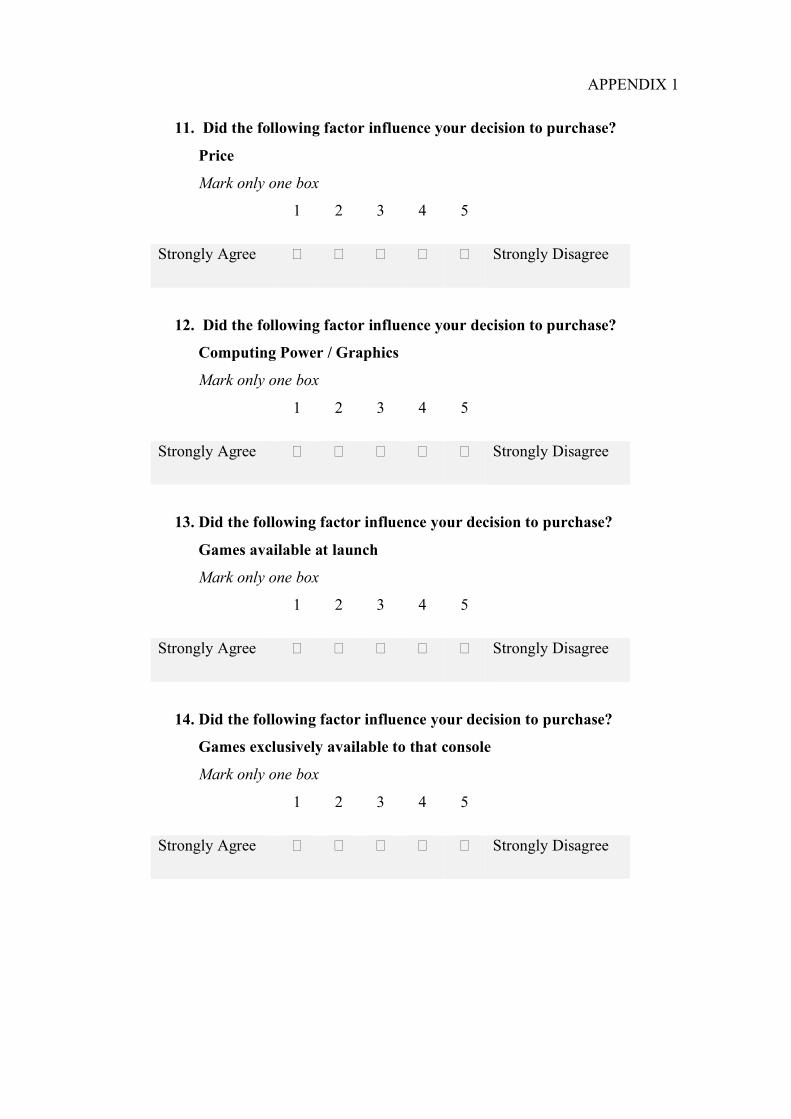
APPENDIX 1
11. Did the following factor influence your decision to purchase?
Price
Mark only one box
1 2 3 4 5
Strongly Agree � � � � � Strongly Disagree
12. Did the following factor influence your decision to purchase?
Computing Power / Graphics
Mark only one box
1 2 3 4 5
Strongly Agree � � � � � Strongly Disagree
13. Did the following factor influence your decision to purchase?
Games available at launch
Mark only one box
1 2 3 4 5
Strongly Agree � � � � � Strongly Disagree
14. Did the following factor influence your decision to purchase?
Games exclusively available to that console
Mark only one box
1 2 3 4 5
Strongly Agree � � � � � Strongly Disagree
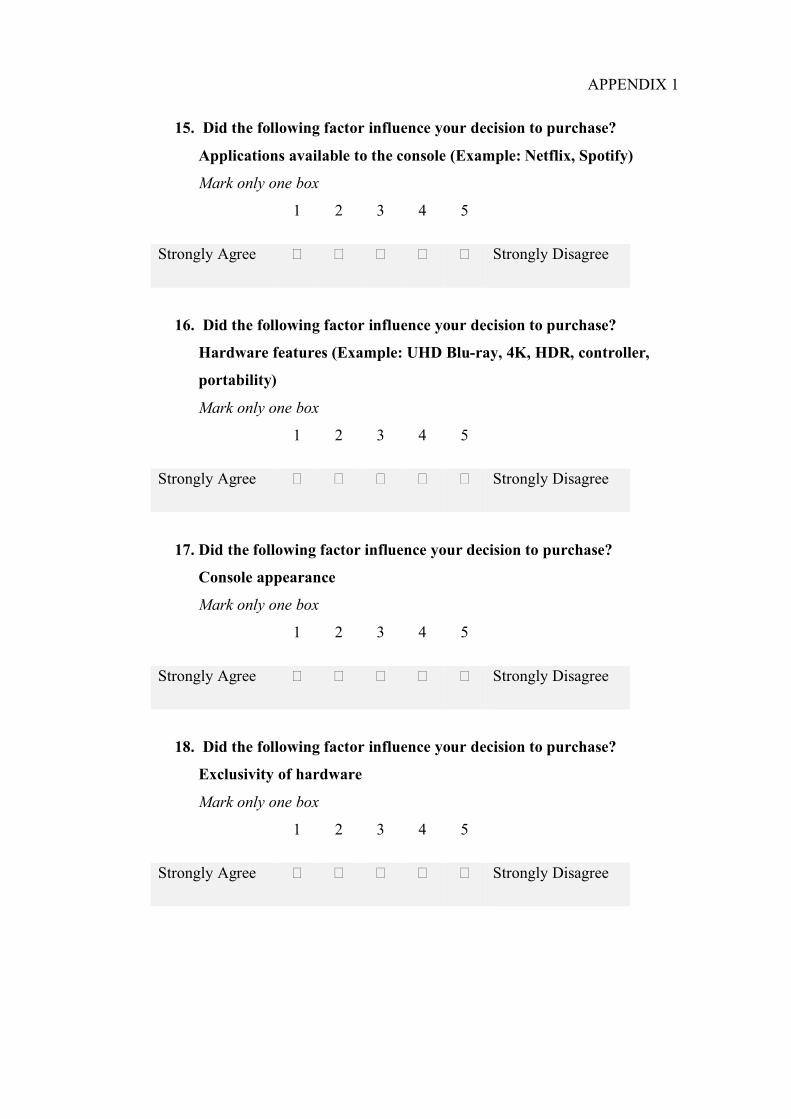
APPENDIX 1
15. Did the following factor influence your decision to purchase?
Applications available to the console (Example: Netflix, Spotify)
Mark only one box
1 2 3 4 5
Strongly Agree � � � � � Strongly Disagree
16. Did the following factor influence your decision to purchase?
Hardware features (Example: UHD Blu-ray, 4K, HDR, controller,
portability)
Mark only one box
1 2 3 4 5
Strongly Agree � � � � � Strongly Disagree
17. Did the following factor influence your decision to purchase?
Console appearance
Mark only one box
1 2 3 4 5
Strongly Agree � � � � � Strongly Disagree
18. Did the following factor influence your decision to purchase?
Exclusivity of hardware
Mark only one box
1 2 3 4 5
Strongly Agree � � � � � Strongly Disagree
APPENDIX 1
19. Did the following factor influence your decision to purchase?
Accessories (Example: PSVR, Kinect)
Mark only one box
1 2 3 4 5
Strongly Agree � � � � � Strongly Disagree
20. Did the following factor influence your decision to purchase?
Online gaming network (features and price)
Mark only one box
1 2 3 4 5
Strongly Agree � � � � � Strongly Disagree
21. Did the following factor influence your decision to purchase?
Community (which console friends use)
Mark only one box
1 2 3 4 5
Strongly Agree � � � � � Strongly Disagree
22. What, if any, behaviours influenced your decision to purchase?
Check all that apply
� Announcements/unveilings during video game conventions (Example:
E3, gamescom)
� Announcements made online from the company
� Articles posted by video game related websites
� Advertisements online or on TV
� None
� Other ______________________
APPENDIX 1
23. If you actively chose not to purchase a specific console at launch,
please state the reasons why. (Please make sure to specify which con-
sole – PlayStation 4, Xbox One, or Switch)
24. Is there anything more that could have been done to help persuade
you to purchase a console at launch? (Please make sure to specify
which console – PlayStation 4, Xbox One, or Switch)
25. Please use the space below to leave any additional thoughts or com-
ments.
Related Documents