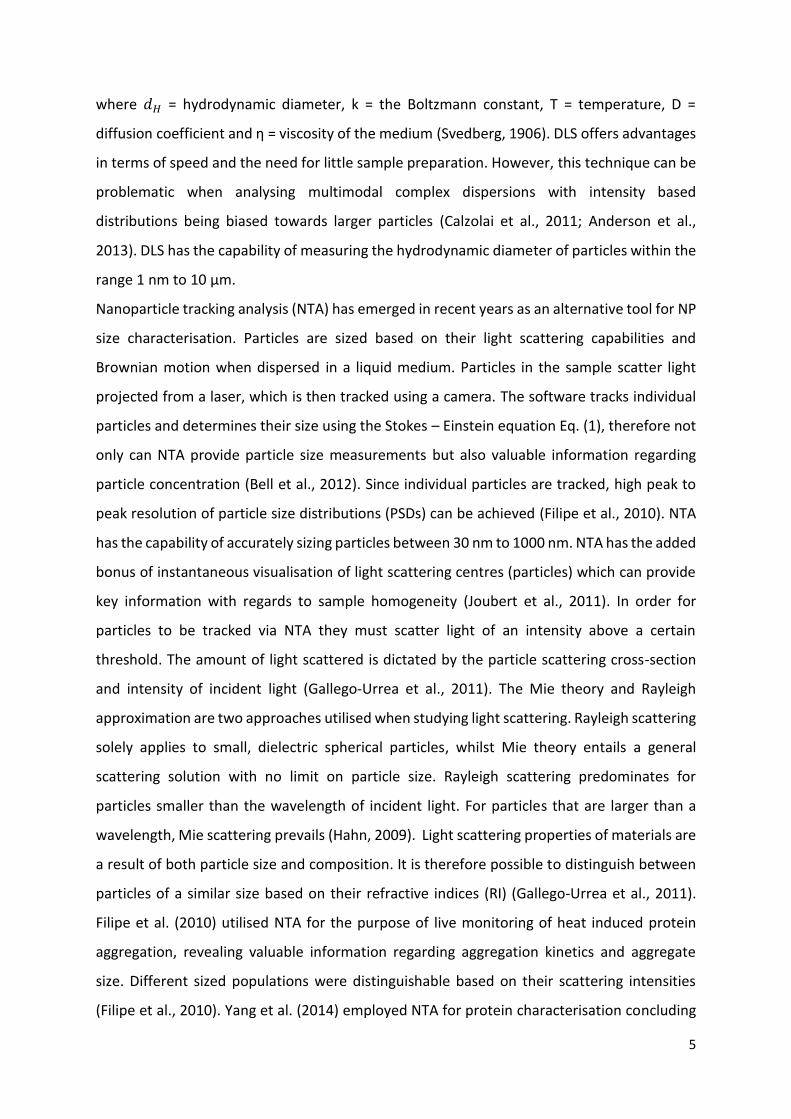
1 Comparison of particle size methodology and assessment of Nanoparticle Tracking Analysis (NTA) as a tool for live monitoring of crystallisation pathways Kate P. M. McComiskey and Lidia Tajber* Synthesis and Solid State Pharmaceutical Centre, School of Pharmacy and Pharmaceutical Sciences, Trinity College Dublin, Dublin 2, Ireland. *School of Pharmacy and Pharmaceutical Sciences, Trinity College Dublin, College Green, Dublin 2, Ireland. Tel: +35318962787. Fax: +35318962810. Email: [email protected]

Welcome message from author
This document is posted to help you gain knowledge. Please leave a comment to let me know what you think about it! Share it to your friends and learn new things together.
Transcript

1
Comparison of particle size methodology and assessment of Nanoparticle Tracking
Analysis (NTA) as a tool for live monitoring of crystallisation pathways
Kate P. M. McComiskey and Lidia Tajber*
Synthesis and Solid State Pharmaceutical Centre, School of Pharmacy and Pharmaceutical
Sciences, Trinity College Dublin, Dublin 2, Ireland.
*School of Pharmacy and Pharmaceutical Sciences, Trinity College Dublin, College Green,
Dublin 2, Ireland. Tel: +35318962787. Fax: +35318962810. Email: [email protected]

2
Abstract
Sample complexity and polydispersity presents challenges surrounding particle size
measurements for nanoparticles (NPs). To ensure the delivery of high quality products to the
marketplace it is imperative that this task is performed with the greatest accuracy and
certainty. For this reason, particle sizing via more than one technique is critical to the success
of the formulation process. Dynamic light scattering (DLS) and nanoparticle tracking analysis
(NTA) are techniques that size particles based on their Brownian motion in liquid medium.
However, each technique has advantages and disadvantages associated with its application.
This study was designed with the intent of comparing these techniques in a critical manner.
NPs were formed using three Biopharmaceutics Classification System class II compounds:
itraconazole, ketoconazole and posaconazole, using an anti-solvent addition, bottom up
method. The impact of polyethylene glycol, polyethylene glycol methyl ether and
polyethylene glycol dimethyl ether with a molecular weight 2000 Da, as stabilizers, was
assessed using these two particle sizing techniques. Mie light scattering theory was
successfully used to explain the relationship between material composition and particle
scattering power. A change in material refractive index, associated with an amorphous to
crystalline solid state transformation, was predominantly responsible for the observed
change in the light scattering power of posaconazole nano-dispersions. The innovative
application of NTA for the live tracking of these physical processes was explored for the first
time. This novel finding can serve to deepen our understanding of the dynamic crystallisation
pathway undertaken by a nanoparticle.
Keywords: Nanoparticle tracking analysis, dynamic light scattering, itraconazole,
ketoconazole, posaconazole, crystallisation, nanoparticle

3
List of Abbreviations
API = active pharmaceutical ingredient
a.u. = arbitrary unit
AUC = analytical ultracentrifugation
BCS = Biopharmaceutics Classification System
Da = Dalton
DLS = dynamic light scattering
DMPEG = polyethylene glycol dimethyl ether
ESD = equivalent spherical diameter
ITR = itraconazole
KETO = ketoconazole
MPEG = polyethylene glycol methyl ether
NTA = nanoparticle tracking analysis
NP = nanoparticle
OR = Ostwald ripening
PDI = polydispersity index
PEG = polyethylene glycol
POS = posaconazole
PSD = particle size distribution
PTFE = polytetrafluoroethylene
PXRD = powder X-ray diffraction
RI= refractive index
RSD = relative standard deviation
SD = standard deviation
SEM = scanning electron microscopy
SOP = standard operating procedure

4
1. Introduction
In order to fully utilise the potential of nanoparticles (NPs) as drug carriers, nanoparticle
characterisation must be accurate and reliable to ensure delivery of high quality products to
the marketplace. The accuracy of particle size distribution measurements is dependent upon
the technique employed for analysis. The inconsistency between measurements performed
via different techniques increases with sample complexity and polydispersity. For this reason,
it is recommended that size characterisation is performed using at least two methods that
employ different sizing techniques (Bell et al., 2012; Anderson et al., 2013).
There are a number of well established particle sizing techniques currently adopted within
industry, each having their own advantages and limitations. Methods should be quick to
perform, low in cost whilst providing a detailed analysis of the sample in question. Traditional
sizing methods include scanning electron microscopy (SEM) and dynamic light scattering
(DLS), as well as size exclusion chromatography and analytical ultracentrifugation (Bootz et
al., 2004; Brown and Schuck, 2006). SEM provides three-dimensional images of the particle
and can therefore reveal alternative information such as particle morphology. However when
employed as a sizing technique, in order to obtain statistically significant particle size
distributions (PSDs) it would be necessary to measure hundreds or thousands of individual
particles, unless automated analysis software were available (Bootz et al., 2004). SEM
requires drying and coating of particles with a conductive layer such as gold. Therefore
particle characteristics can be inherent of the preparation procedure which can have an
impact upon original particle properties (McKinlay et al., 2004).
DLS sizes particles dispersed in a liquid medium based on their translational diffusion
coefficient and Brownian motion. Intensity fluctuations of laser light scattered by the particles
is quantified via an autocorrelation function comparing the initial scattering intensity to the
intensity after specified time periods. A slow decay in the autocorrelation function is caused
by the presence of large particles moving slowly; whereas fast decay indicates the presence
of fast moving small particles. The diffusion coefficient can be obtained from the measured
decay rate, which is directly proportional to the inverse radius of the particles via the Stokes–
Einstein equation (Einstein, 1908). Hydrodynamic diameter is then calculated based upon the
Stoke – Einstein equation Eq. (1):
𝑑𝐻 = 𝑘 𝑇
3 𝐷 𝜋 ƞ Eq. (1)
5
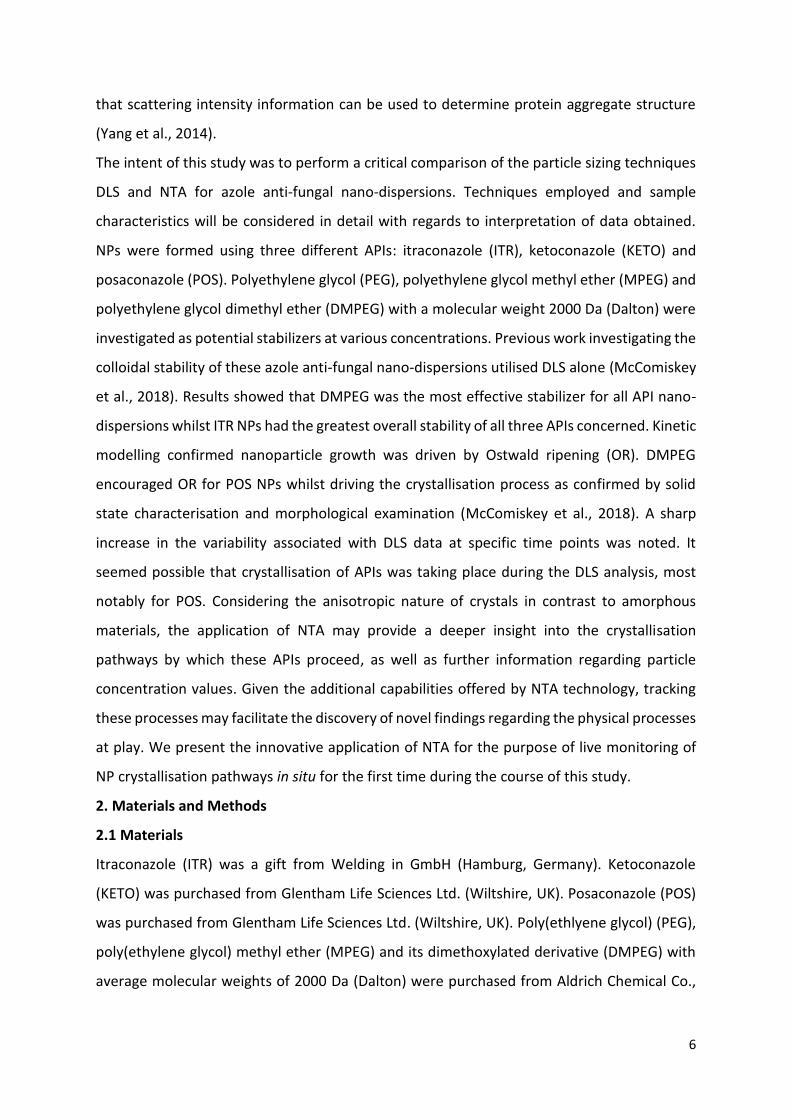
where 𝑑𝐻 = hydrodynamic diameter, k = the Boltzmann constant, T = temperature, D =
diffusion coefficient and ƞ = viscosity of the medium (Svedberg, 1906). DLS offers advantages
in terms of speed and the need for little sample preparation. However, this technique can be
problematic when analysing multimodal complex dispersions with intensity based
distributions being biased towards larger particles (Calzolai et al., 2011; Anderson et al.,
2013). DLS has the capability of measuring the hydrodynamic diameter of particles within the
range 1 nm to 10 µm.
Nanoparticle tracking analysis (NTA) has emerged in recent years as an alternative tool for NP
size characterisation. Particles are sized based on their light scattering capabilities and
Brownian motion when dispersed in a liquid medium. Particles in the sample scatter light
projected from a laser, which is then tracked using a camera. The software tracks individual
particles and determines their size using the Stokes – Einstein equation Eq. (1), therefore not
only can NTA provide particle size measurements but also valuable information regarding
particle concentration (Bell et al., 2012). Since individual particles are tracked, high peak to
peak resolution of particle size distributions (PSDs) can be achieved (Filipe et al., 2010). NTA
has the capability of accurately sizing particles between 30 nm to 1000 nm. NTA has the added
bonus of instantaneous visualisation of light scattering centres (particles) which can provide
key information with regards to sample homogeneity (Joubert et al., 2011). In order for
particles to be tracked via NTA they must scatter light of an intensity above a certain
threshold. The amount of light scattered is dictated by the particle scattering cross-section
and intensity of incident light (Gallego-Urrea et al., 2011). The Mie theory and Rayleigh
approximation are two approaches utilised when studying light scattering. Rayleigh scattering
solely applies to small, dielectric spherical particles, whilst Mie theory entails a general
scattering solution with no limit on particle size. Rayleigh scattering predominates for
particles smaller than the wavelength of incident light. For particles that are larger than a
wavelength, Mie scattering prevails (Hahn, 2009). Light scattering properties of materials are
a result of both particle size and composition. It is therefore possible to distinguish between
particles of a similar size based on their refractive indices (RI) (Gallego-Urrea et al., 2011).
Filipe et al. (2010) utilised NTA for the purpose of live monitoring of heat induced protein
aggregation, revealing valuable information regarding aggregation kinetics and aggregate
size. Different sized populations were distinguishable based on their scattering intensities
(Filipe et al., 2010). Yang et al. (2014) employed NTA for protein characterisation concluding
6
that scattering intensity information can be used to determine protein aggregate structure
(Yang et al., 2014).
The intent of this study was to perform a critical comparison of the particle sizing techniques
DLS and NTA for azole anti-fungal nano-dispersions. Techniques employed and sample
characteristics will be considered in detail with regards to interpretation of data obtained.
NPs were formed using three different APIs: itraconazole (ITR), ketoconazole (KETO) and
posaconazole (POS). Polyethylene glycol (PEG), polyethylene glycol methyl ether (MPEG) and
polyethylene glycol dimethyl ether (DMPEG) with a molecular weight 2000 Da (Dalton) were
investigated as potential stabilizers at various concentrations. Previous work investigating the
colloidal stability of these azole anti-fungal nano-dispersions utilised DLS alone (McComiskey
et al., 2018). Results showed that DMPEG was the most effective stabilizer for all API nano-
dispersions whilst ITR NPs had the greatest overall stability of all three APIs concerned. Kinetic
modelling confirmed nanoparticle growth was driven by Ostwald ripening (OR). DMPEG
encouraged OR for POS NPs whilst driving the crystallisation process as confirmed by solid
state characterisation and morphological examination (McComiskey et al., 2018). A sharp
increase in the variability associated with DLS data at specific time points was noted. It
seemed possible that crystallisation of APIs was taking place during the DLS analysis, most
notably for POS. Considering the anisotropic nature of crystals in contrast to amorphous
materials, the application of NTA may provide a deeper insight into the crystallisation
pathways by which these APIs proceed, as well as further information regarding particle
concentration values. Given the additional capabilities offered by NTA technology, tracking
these processes may facilitate the discovery of novel findings regarding the physical processes
at play. We present the innovative application of NTA for the purpose of live monitoring of
NP crystallisation pathways in situ for the first time during the course of this study.
2. Materials and Methods
2.1 Materials
Itraconazole (ITR) was a gift from Welding in GmbH (Hamburg, Germany). Ketoconazole
(KETO) was purchased from Glentham Life Sciences Ltd. (Wiltshire, UK). Posaconazole (POS)
was purchased from Glentham Life Sciences Ltd. (Wiltshire, UK). Poly(ethlyene glycol) (PEG),
poly(ethylene glycol) methyl ether (MPEG) and its dimethoxylated derivative (DMPEG) with
average molecular weights of 2000 Da (Dalton) were purchased from Aldrich Chemical Co.,

7
Ltd. (Dorset, UK). Acetone Chromasolv® HPLC grade was obtained from Sigma Aldrich (Dorset,
UK).
2.2 Methods
2.2.1 Anti-Solvent Precipitation of ITR, POS and KETO nanoparticles (NPs)
NPs were formed by rapid mixing of a solvent phase into an anti-solvent phase at 25 °C as
described by McComiskey et al. (2018). Briefly, ITR NPs were formed using a solvent phase
(2.01 mg/ml ITR in acetone) into an anti-solvent phase, using a 1:10 solvent to anti-solvent
(v/v) ratio. POS NPs were formed by rapid mixing of a solvent phase (14.8 mg/ml POS in
acetone) into an anti-solvent phase, using a 1:12.5 solvent to anti-solvent (v/v) ratio. KETO
NPs were formed by rapid mixing of a solvent phase (3.75 mg/ml KETO in acetone) into an
anti-solvent phase, using a 1:10 solvent to anti-solvent (v/v) ratio. Polymeric stabilizers (PEG,
MPEG and DMPEG) were included at the following concentrations: 0.5, (0.05 % w/v), 1 (0.1 %
w/v) and 1.5 mg/ml (0.15 % w/v).
2.2.2 Nanoparticle Tracking Analysis
Size characterisation determination was performed by NTA using a NanoSight NS300 device
(Malvern Instruments), equipped with a red laser 638 nm and SCMOS camera. Data collection
and analysis was performed using NTA 3.0 software. Anti-solvent (deionised water/stabilizer
solution) and solvent (API/acetone) phases were kept at 25 °C, solutions were filtered using
0.45 µm polytetrafluoroethylene (PTFE) filters (VWR, Ireland) prior to NP formation and
injected using sterile syringes into the sample chamber. Samples were diluted with the
appropriate anti-solvent phase using a 1:17 dilution (v/v) prior to analysis in order to achieve
the desired particle concentration, between 107 and 109 total particles/ml. Temperature was
controlled at 25 °C for the duration of the study. Particle size was recorded every minute for
30 minutes, therefore a standard operating procedure (SOP) was created using standard
measurement: 30 captures of 55 second duration, to account for ~ 5 second delay between
each capture. The sample was advanced every minute changing the particles in view to ensure
a truly representative sample of particles were measured. All measurements were performed
in triplicate. Samples were measured with manual shutter and gains adjustment. Particle size
was corrected for viscosity of the continuous phase. The sample chamber was manually
cleaned using MilliQ water and 10% ethanol in water solution (v/v). Upon completion, no
particles were visibly present in the sample chamber through the viewing window.
2.2.3 Dynamic Light Scattering (DLS)

8
The mean particle size of NPs were measured using the Zetasizer Nano ZS series (Malvern
Instruments, UK). The software used for analysing and capturing measurements was Malvern
Zetasizer software version 7.12. Mean particle size measurements were measured in situ
using a 12 o.d. mm 1ml PCS8501 glass cuvette. All measurements were carried out at 25 °C.
The analysis was performed in triplicate for each sample with mean particle diameter
recorded every minute for 30 minutes. Particle size was corrected for viscosity of the
continuous phase. Viscosity of the continuous phase was measured in triplicate at 25 °C using
a Vibro Viscometer SV-10 (A&D, Japan).
3. Results and Discussion
Previous work on particle size analysis of the azole drugs (ITR, KETO and POS) carried out using
DLS presented a number of key outcomes (McComiskey et al., 2018). ITR NPs had the best
stability all API nano-dispersions, in both the presence and absence of stabilizers. DMPEG was
the most effective stabilizer overall for all API nano-dispersions. For ITR NPs, DMPEG was the
most effective when employed at 0.5 mg/ml concentration. In contrast, for KETO NPs DMPEG
was most effective at the highest concentration 1.5 mg/ml. Increased variability around 15
minutes was observed in DLS data for KETO NPs stabilized with PEG and MPEG. This could
suggest possible crystallisation and indeed KETO NPs were confirmed as PXRD crystalline at
30 minutes (McComiskey et al., 2018). PXRD analysis also confirmed that POS NPs initially
formed an unstable amorphous phase, which was isolated within a few minutes of formation
and then replaced by a more stable ordered crystalline phases of form I POS within 30
minutes. POS NPs had the poorest stability, with the presence of stabilizers appearing to
promote crystallisation and destabilise nano-dispersions. POS NPs stabilised with MPEG were
the least stable with increased variability in data observed at the earliest time of 15 minutes.
This increased variability associated with the DLS pointed towards crystallisation but lacked
certainty. With NPs existing as high energy, mobile entities in solution, tracking their dynamic
crystallisation journey presents a challenging task. The use of NTA may facilitate efforts to
continuously monitor this process. Therefore all API nano-dispersions were analysed using
NTA in a manner similar to previous work carried out using DLS (McComiskey et al., 2018) to
allow for comparisons to be drawn between the two sets of data generated via these different
techniques.

9
3.1 Itraconazole
ITR particle size distributions (PSDs) shown in Fig. 1 highlight clear differences existing
between data obtained using DLS and NTA.

10
Fig. 1 ITR particle size distributions for NTA (number based) and DLS (number and intensity
based) for (a) stabilizer free ITR NPs at 1 minute (b) stabilizer free ITR NPs at 30 minutes (c)
ITR PEG 0.5 mg/ml NPs at 1 minute (d) ITR PEG 0.5 mg/ml NPs at 30 minutes (e) ITR MPEG 0.5
mg/ml NPs at 1 minute (f) ITR MPEG 0.5 mg/ml NPs at 30 minutes (g) ITR DMPEG 0.5 mg/ml
NPs at 1 minute (h) ITR DMPEG 0.5 mg/ml NPs at 30 minutes. (n = 3)
Previous work by McComiskey et al., (2018) measured increase in particle size (%) over 30
minutes using DLS for each ITR nano-dispersion, with values ranging between 100-250%. In
addition to DLS intensity based distributions, DLS number based distributions have been
included for completeness (Fig. 1 and 2). However, it should be noted that these number
based values have been derived from an intensity distribution. In a number based
distribution, all particles within the distribution are given equal weighting irrespective of their
size. In contrast, with an intensity based distribution, larger particles have the ability to skew
the distribution towards larger particle sizes (Demeester et al., 2005). Therefore as expected,
in all distributions number based values are lower than their intensity based equivalents
obtained using DLS. For ITR PSDs at 1 minute, the three distributions are in close agreement
(Fig. 1a, c, e, and g), NTA and DLS values correspond well. However at 30 minutes, the same
does not remain true with a greater difference existing between the DLS and NTA
distributions (Fig. 1b, d, f, and h). Interestingly, it is worth noting that the most stable ITR
DMPEG 0.5 mg/ml NPs have the lowest variability for both NTA and DLS as demonstrated by
the small error bars in Fig. 1g and h, indicating high measurement precision for this sample.
This was also the only sample to show a decrease in variability with both techniques between
minute 1 and 30 (Fig. 1g and h). Table 1 shows particle size data at 1 minute for ITR NTA versus
DLS.
Table. 1 Mean particle size and size distribution measurements obtained for ITR nano-
dispersions using DLS and NTA at 1 minute. (n = 3)
DLS (intensity based) NTA (number based)
Z-ave ± SD (nm) PDI ± SD Mean ± SD (nm) *Concentration (number particles/ml) ± RSD
Stabilizer free ITR NPs 184 ± 10 0.04 ± 0.03 161 ± 30 2.9·1010 ± 20.3

11
ITR PEG 0.5 mg/ml 232 ± 19 0.07 ± 0.06 171 ± 18 2.5·1010 ± 16.0
ITR PEG 1 mg/ml 235 ± 54 0.10 ± 0.07 174 ± 28 2.0·1010 ± 31.0
ITR PEG 1.5 mg/ml 179 ± 21 0.11 ± 0.09 206 ± 6 2.1·1010 ± 11.4
ITR MPEG 0.5 mg/ml 152 ± 13 0.05 ± 0.04 153 ± 7 4.0·1010 ± 5.3
ITR MPEG 1 mg/ml 180 ± 7 0.02 ± 0.02 183 ± 20 2.3·1010 ± 19.1
ITR MPEG 1.5 mg/ml 244 ± 13 0.04 ± 0.03 205 ± 33 1.6·1010 ± 32.5
ITR DMPEG 0.5 mg/ml 242 ± 56 0.08 ± 0.06 202 ± 24 1.8·1010 ± 10.6
ITR DMPEG 1 mg/ml 246 ± 77 0.13 ± 0.03 207 ± 23 1.9·1010 ± 25.8
ITR DMPEG 1.5 mg/ml 179 ± 13 0.03 ± 0.03 181 ± 16 2.3·1010 ± 14.3
*PDI = polydispersity index, SD = standard deviation, RSD = relative standard deviation
Both techniques confirm DMPEG is the most effective stabilizer for ITR NPs at the lowest
concentration of 0.5 mg/ml (Fig. 1g and h, Fig. SI. 1). Fig. 1 shows a marked decrease in NTA
particle concentration between 1 minute and 30 minutes for all ITR nano-dispersions (Fig. 1
and Fig. SI. 2). ITR NTA distributions at 30 minutes appear to be multimodal and polydisperse
in comparison to mono-modal distributions observed for all samples using both techniques
at 1 minute (Fig. 1). However, the complexity of ITR PSDs at 30 minutes visible with NTA was
not evident with DLS. This reiterates the ability of NTA to achieve greater peak resolution,
distinguishing particle population’s close in size, simply not possible with DLS (Filipe et al.,
2010).
3.2 Ketoconazole
12
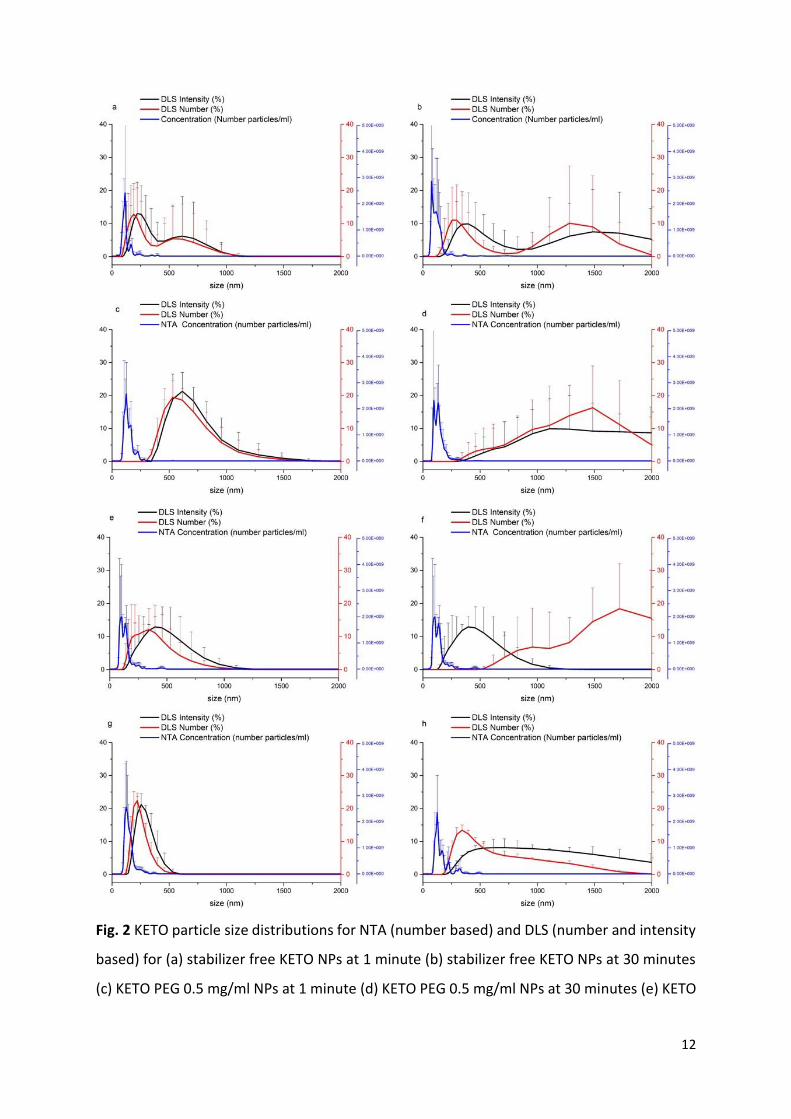
Fig. 2 KETO particle size distributions for NTA (number based) and DLS (number and intensity
based) for (a) stabilizer free KETO NPs at 1 minute (b) stabilizer free KETO NPs at 30 minutes
(c) KETO PEG 0.5 mg/ml NPs at 1 minute (d) KETO PEG 0.5 mg/ml NPs at 30 minutes (e) KETO

13
MPEG 0.5 mg/ml NPs at 1 minute (f) KETO MPEG 0.5 mg/ml NPs at 30 minutes (g) KETO
DMPEG 0.5 mg/ml NPs at 1 minute (h) KETO DMPEG 0.5 mg/ml NPs at 30 minutes.
KETO particle size distributions show a great variation between DLS and NTA, with NTA sizing
these samples much smaller than DLS throughout (Fig. 2). This feature has been noted
elsewhere in the literature (Filipe et al., 2010). Great differences are evident at 30 minutes
between the two techniques, with DLS having much broader PSDs. Large error bars are
associated with both techniques for KETO distributions, indicating low measurement
precision for these nano-dispersions. However, again the most stable KETO NPs containing
DMPEG, have the smallest DLS error bars and variability associated with those measurements
at both 1 and 30 minutes (Fig. 2g and h). There is little difference between the NTA
distributions between 1 and 30 minutes for all KETO nano-dispersions, in comparison with
the DLS peaks where a significant shift to a larger and broader distribution at 30 minutes was
observed (Fig. 2). All other KETO nano-dispersions behaved in the same manner, with the
exception being KETO DMPEG 1.5 mg/ml (Fig. SI. 3). Interestingly, this was the most the
effective stabilizer for KETO nano-dispersions as confirmed by DLS. This sample was
associated with the lowest variability and showed closest agreement between the two
techniques (Fig. SI. 3). Table 2 contains particle size data obtained via NTA and DLS at 1 minute
for KETO nano-dispersions.
Table. 2 Mean particle size and size distribution measurements obtained for KETO nano-
dispersions using DLS and NTA at 1 minute. (n = 3)
DLS (intensity based) NTA (number based)
Z-ave ± SD (nm) PDI ± SD Mean ± SD (nm) *Concentration (number particles/ml) ± RSD
Stabilizer free KETO NPs 204 ± 10 0.09 ± 0.07 117 ± 10 9.7·109 ± 66.0
KETO PEG 0.5 mg/ml 639 ± 83 0.05 ± 0.04 140 ± 7 1.6·1010 ± 41.3
KETO PEG 1 mg/ml 658 ± 152 0.10 ± 0.07 133 ± 18 1.9·1010 ± 8.4
KETO PEG 1.5 mg/ml 520 ± 102 0.15 ± 0.09 153 ± 21 1.3·1010 ± 33.8
KETO MPEG 0.5 mg/ml 406 ± 129 0.15 ± 0.05 146 ± 10 1.5·1010 ± 20.7
KETO MPEG 1 mg/ml 642 ± 84 0.10 ± 0.10 133 ± 5 1.9·1010 ± 21.1
KETO MPEG 1.5 mg/ml 345 ± 56 0.15 ± 0.05 133 ± 7 1.1·1010 ± 38.2
14
KETO DMPEG 0.5 mg/ml 258 ± 22 0.08 ± 0.06 149 ± 13 1.7·1010 ± 43.5
KETO DMPEG 1 mg/ml 269 ± 24 0.14 ± 0.04 169 ± 15 1.3·1010 ± 46.9
KETO DMPEG 1.5 mg/ml 248 ± 14 0.10 ± 0.05 166 ± 13 2.7·1010 ± 15.6
*PDI = polydispersity index, SD = standard deviation, RSD = relative standard deviation
KETO particle sizes upon initial formation are much larger when measured via DLS compared
with NTA equivalents (Table 2). Whilst ITR nano-dispersions show good agreement between
the two techniques with particle sizes ranging between 150-250 nm (Table 1). Polydispersity
index (PDI) measurements would suggest that KETO nano-dispersions are the most
polydisperse of all API nano- dispersions i.e. are multimodal. This fact is also supported by the
larger error bars associated with DLS data for KETO nano-dispersions compared with that of
NTA (Table 2). Decreased variability associated with NTA KETO samples suggests good
reproducibility for these datasets compared with DLS equivalents (Table 2). Stabilizer free
KETO NPs were highlighted as being particularly unstable via DLS (McComiskey et al., 2018).
This corresponds to the highest variability of all KETO nano-dispersions in particle
concentration measured via NTA which can be found in Table 2. Further information
regarding NTA particle concentration measurements is presented in Fig. SI. 4.
3.3 Posaconazole
Analysis of POS nano-dispersions proved to be challenging. The tendency of these samples to
visibly crystallise and precipitate crystals larger than 1 micron in size within the time scale of
the study, meant it was not possible to obtain size data via NTA for every time point. POS
crystals visibly precipitate within 30 minutes as shown by photographs (Fig. SI. 5) and SEM
images (McComiskey et al., 2018). Large crystals could be seen in the viewing field of the
software causing pixel blooming and therefore obscuring smaller particles present in the
sample (Fig. SI. 6a and b). In this instance, the NTA software views the large crystals as noise
and will not measure their size or will attempt to size them as many small particles, an issue
noted elsewhere in the literature (Gallego-Urrea et al., 2011). POS NTA particle concentration
measurements shown in Table SI. 1 also displayed high variability when compared with ITR
and KETO equivalents. This provides further evidence for exclusion of POS nano-dispersions
from size comparisons. Therefore, particle size comparison between DLS and NTA was limited
to the assessment of ITR and KETO nano-dispersions alone.

15
3.4 Monitoring of Crystallisation Pathways using NTA
Rayleigh approximation has been previously used by Luo et al. (2016) to explain the light
scattering behaviour of gold NPs (Joubert et al., 2011; Luo et al., 2016). Due to the larger size
of the ITR, KETO and POS NPs studied in this case, the same approach could not be
adopted(Joubert et al., 2011; Luo et al., 2016). Therefore it seemed logical to apply Mie theory
(Gallego-Urrea et al., 2011) to determine if NTA could be used to explain changes in NPs,
occurring primarily due to solid state transformations and not a change in particle size. Mie
scattering requires refractive index (RI) values for accurate size measurement. It is known that
cubic crystals and isotropic materials can have only one RI, whilst triclinic crystals have three
indices commonly denoted as α, ß and y (Carlton, 2011). The APIs in question are biaxial
triclinic crystal systems, therefore having three RI values (Peeters et al., 1979, 1996, and
2004). Unfortunately, exact values for the APIs studied are not know, however a number of
organic pharmaceutical materials exhibit RI values between 1.4 to above 1.7 (Watanabe and
Ohnuma, 2000). For instance, sulphanilamide polymorphic forms have RI values ranging from
1.548 to 1.8 (Lin et al., 1974). Therefore, it appears that crystallisation of a particle from an
isotropic phase (an amorphous form) to a triclinic crystal has the potential to be recorded by
NTA technology due to changes in RI value.
This hypothesis was tested further using the Mie theory in Scatlab 1.2 software with the
option “direct intensity graph” (Scatlab Project: http://www.scatlab.org) and scattering
power as a function of size was calculated for ITR, KETO and POS based on an average RI value
of 1.65 (Wong et al 2006; Palmberger et al., 2015; Touzet et al., 2018). Calculations were
based on 638 nm light, the same wavelength as that used by NTA. The dispersant RI was taken
as 1.33, with water being the liquid medium. The real part of the RI of the NP material was
set to 1.65 and the complex part was set to 0.001, both parameters being typical of organic
materials. Scattered light intensities were calculated for angles ranging 70-110°. All other
parameters were left at zero (Gallego-Urrea et al., 2011). Also, scattering intensity in a range
of RI values at 90° angle was calculated to reflect the triclinic nature of these APIs.

16
Fig. 3 Mie plot showing intensity of scattered light, calculated for the studied APIs using Mie
theory in Scatlab 1.2 at a range of angles 70-110°. (yellow box highlights lowest particle size
of NPs upon initial formation). RI= refractive index
This Mie plot shown in Fig. 3 demonstrates that the scattering intensity increases rapidly for
smaller sized particles in contrast with larger sized particles where a plateau in intensity is
reached from 200 nm and above. All API s form NPs above 150 nm (Table 1, 2 and SI. 1). A
range of RI values (1.5-2.0) where investigated, with Fig. 3 demonstrating the key impact of
this parameter upon particle scattering power. Therefore we can conclude that changes in
scattering intensity are predominantly dictated by material composition and not particle size.
Scattergrams presented below show particle size (nm) versus the intensity (a.u.) of light
scattered by NPs under analysis. It is possible to distinguish between particles of similar size
based on their differing refractive indices using these graphical representations of light
scattering. Particular attention should be paid to the scale of the Y-axis in the scattergrams
shown.
3.4.1 Itraconazole
17
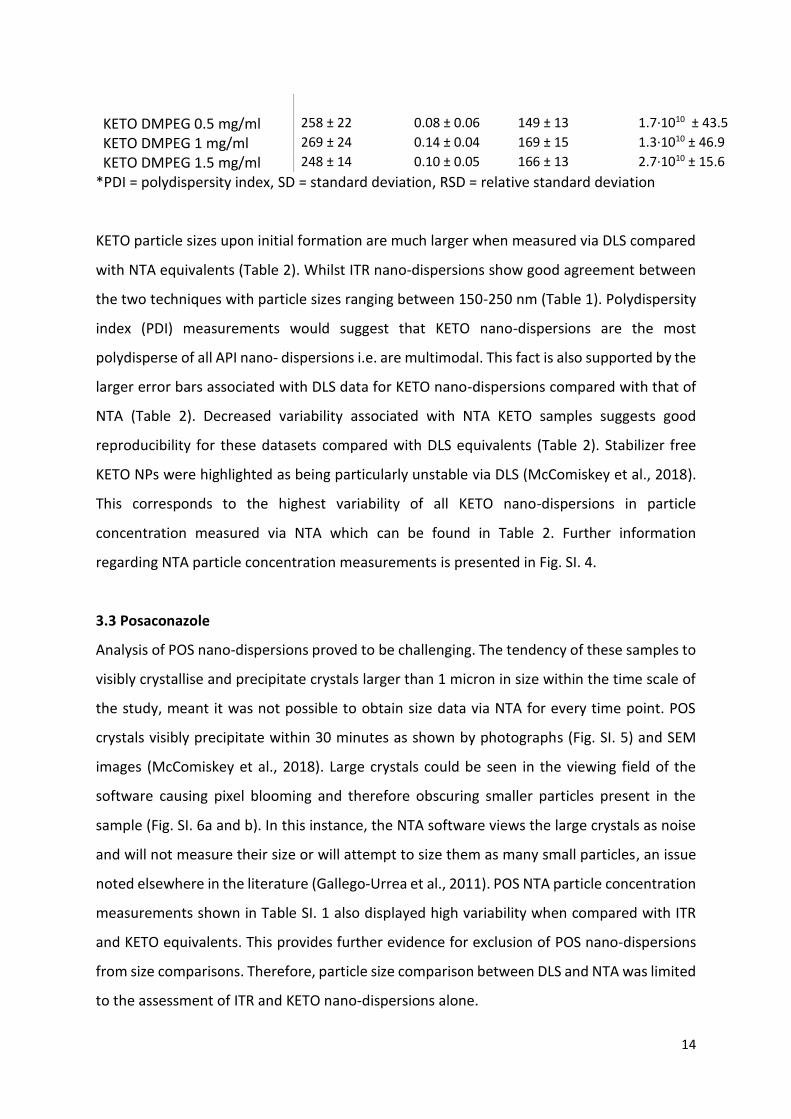
Fig. 4 NTA scattergram intensity (a.u.) vs. light with corresponding 3-D graph (size vs. intensity
vs. concentration) for stabilizer free ITR NPs at (a and b) 1 minute and (c and d) 30 minutes.
ITR nano-dispersions showed little difference between 1 and 30 minutes in their scattering
abilities (Fig. 4). ITR NPs scattered at the lowest level of intensity below 1.2 a.u.. ITR NPs
appear X-ray disordered upon initial formation. However, these NPs are in fact liquid crystal
in nature (Tarnacka et al., 2013; Mugheirbi and Tajber, 2015). An ability to flow like a liquid
with some degree of long range order could reduce their ability to refract light. The greater
stability of ITR nano-dispersions as confirmed by particle size measurements obtained via
both techniques is supported by the stable range of light scattered throughout the 30 minutes
(Fig. 4).
3.4.2 Ketoconazole
18
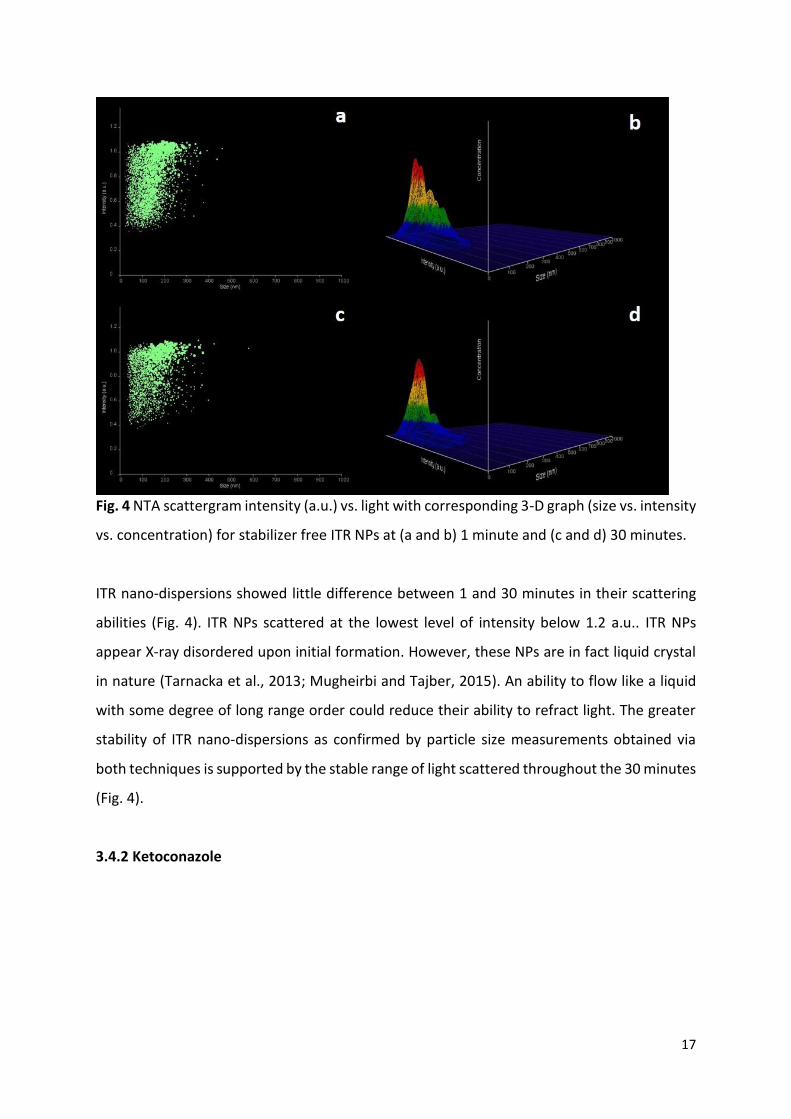
Fig. 5 NTA scattergram intensity (a.u.) vs. light with corresponding 3-D graph (size vs. intensity
vs. concentration) for stabilizer free KETO NPs at (a and b) 1 minute and (c and d) 30 minutes.
Equivalent scattergrams for KETO showed a decrease in the range of intensity of light
scattered by particles over the 30 minutes (Fig. 5). KETO NPs scattered light up to an intensity
5 a.u. at 1 minute, with a large sized cluster of particles scattering below 1.5 a.u. (Fig. 5a). This
may suggest the presence of both amorphous and crystalline KETO NPs in this sample, with
the majority being amorphous. PXRD analysis (McComiskey e al., 2018) confirms the
crystalline nature of the KETO NPs at 30 minutes. An increase in the size of the particle cluster
scattering at higher intensity can be seen at 30 minutes (Fig. 5c), however a significant number
of particles scattering below 1.5 a.u. remain. This may suggest the simultaneous presence of
both amorphous and crystalline KETO NPs at 30 minutes, with an increase in the number of
crystalline particles. It is also possible that the decrease in the intensity of scattered light
associated with KETO NPs can be explained by the dissolution of these particles. Wittbold and
Tatarkiewicz, (2017) previously tracked the process of crystallisation and dissolution by
observing varying intensity of scattered light of proteins using MANTA technology.
Crystallisation was characterised by an increased intensity, whilst dissolution was represented
by a decrease in the intensity of scattered light (Wittbold and Tatarkiewicz, 2017).
19
3.4.3 Posaconazole
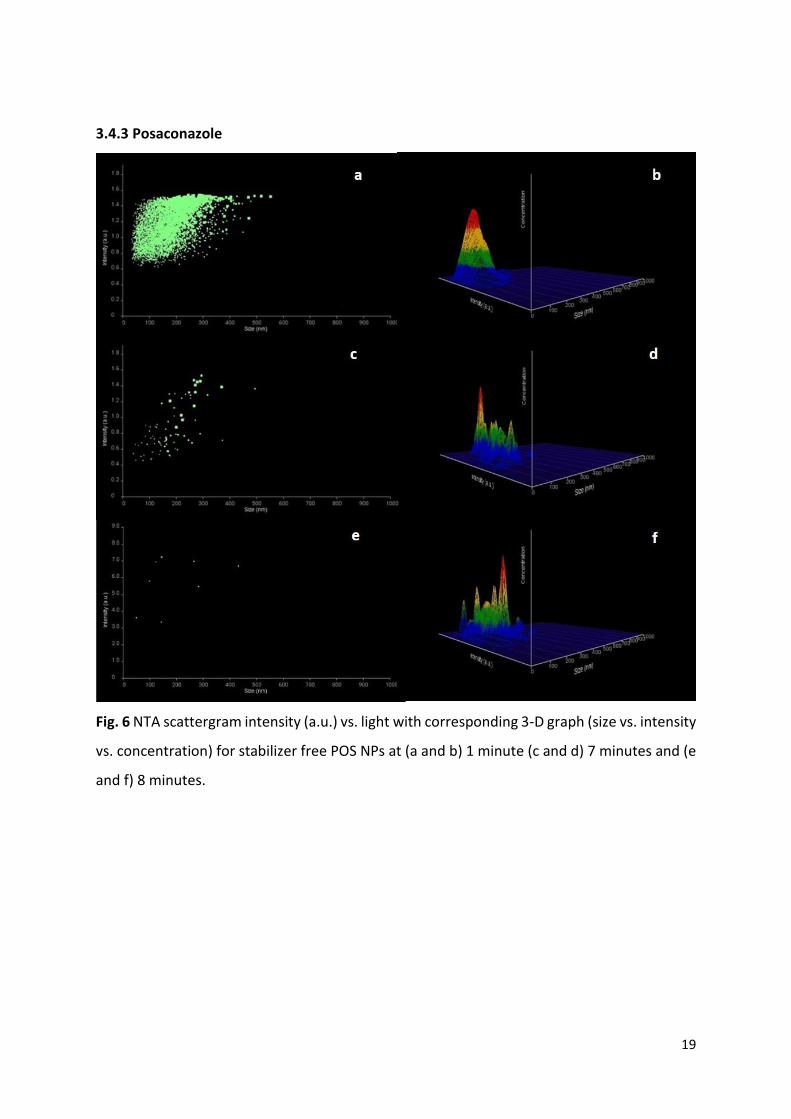
Fig. 6 NTA scattergram intensity (a.u.) vs. light with corresponding 3-D graph (size vs. intensity
vs. concentration) for stabilizer free POS NPs at (a and b) 1 minute (c and d) 7 minutes and (e
and f) 8 minutes.
20
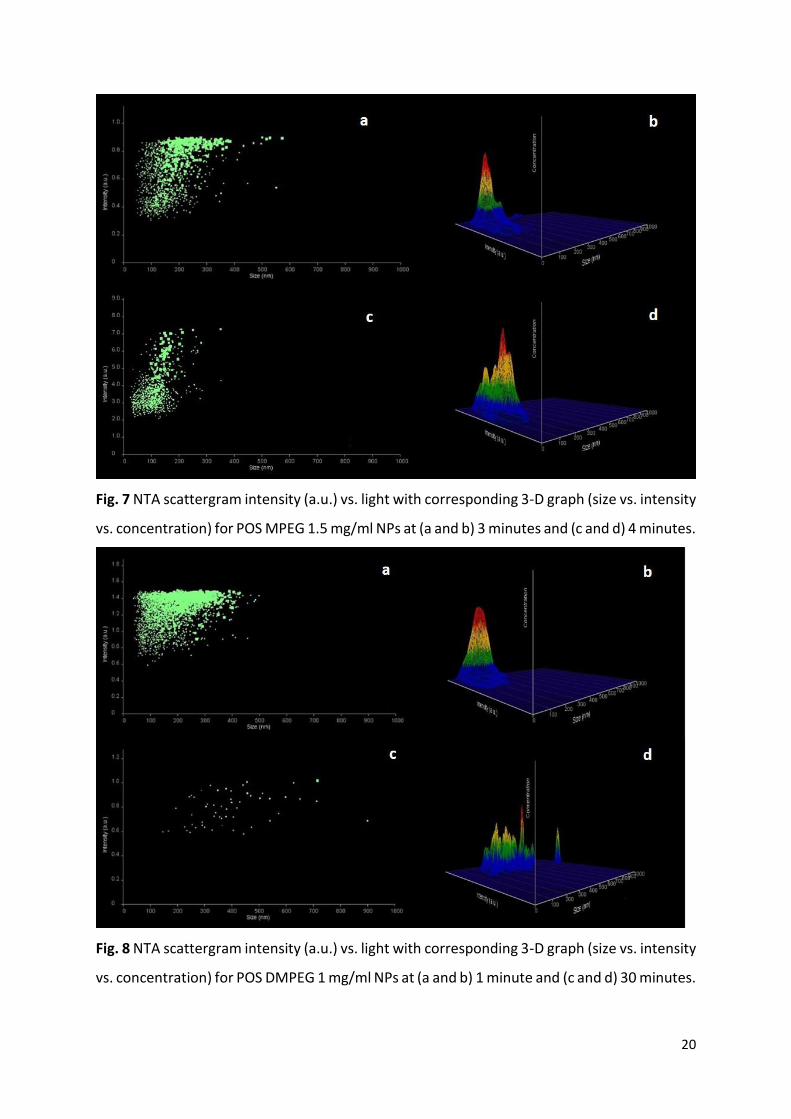
Fig. 7 NTA scattergram intensity (a.u.) vs. light with corresponding 3-D graph (size vs. intensity
vs. concentration) for POS MPEG 1.5 mg/ml NPs at (a and b) 3 minutes and (c and d) 4 minutes.
Fig. 8 NTA scattergram intensity (a.u.) vs. light with corresponding 3-D graph (size vs. intensity
vs. concentration) for POS DMPEG 1 mg/ml NPs at (a and b) 1 minute and (c and d) 30 minutes.
21
Presented are examples of stabilizer free POS nano-dispersion (Fig. 6), as well as POS MPEG
1.5 mg/ml which crystallised the fastest (Fig. 7) and POS DMPEG 1 mg/ml which showed no
signs of crystallisation over the 30 minutes (Fig. 8). Examples of scattergrams and 3-D graphs
for other polymer-stabilised nano-dispersions can be found in Figs. SI. 7-24. Notably, previous
work performed using DLS on these systems presented similar findings. POS MPEG 1.5 mg/ml
showed signs of possible crystallisation represented by remarkable increases in particle size
and variability as the experiment proceeded. In addition, POS DMPEG 1 mg/ml showed no
evidence of possible crystallisation, with a consistent increase in particle size observed
(McComiskey et al., 2018). A significant increase in the intensity of the light scattered by the
POS NPs (refer to Y-axis) was observed over the 30 minutes of the study (Fig. 6 and 7). For all
POS nano-dispersions (except POS DMPEG 1 mg/ml) prior to crystallisation particle light
scattering ranges fall between 0.1 – 1.5 a.u. (Fig. 6a to 8a) compared to the scattering range
1 - 7 a.u. post crystallisation (Fig. 6e and 7c). The 3D graphs included provide a graphical
representation of size versus intensity versus concentration, in this way providing information
regarding the concentration of particles scattering light at particular intensities (Fig. 6 to 8).
We can conclude that prior to crystallisation unstable disordered amorphous particles tend
to scatter light at a decreased intensity. In contrast, post crystallisation ordered stable
crystalline particles scatter light at an increased intensity. This is in agreement with the typical
characteristics of amorphous materials, they are isotropic having one refractive index of light,
whereas the crystalline form of POS is anisotropic having three RIs (Singh and Dunmur, 2002;
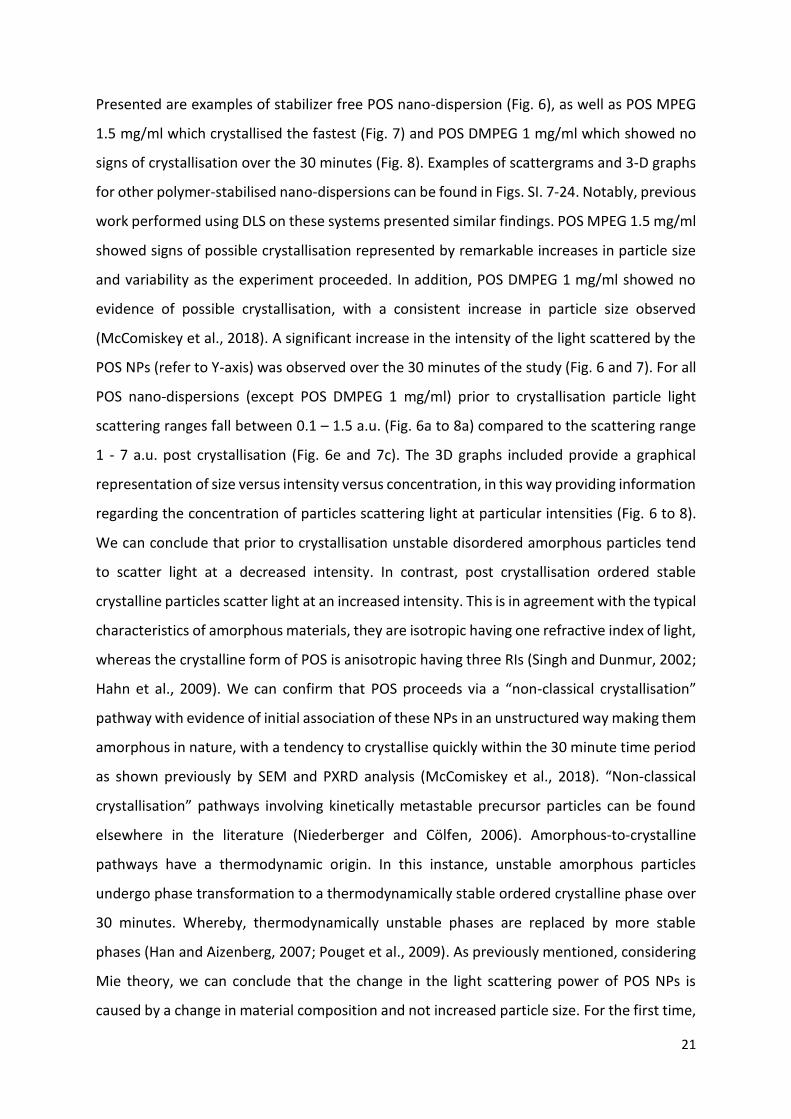
Hahn et al., 2009). We can confirm that POS proceeds via a “non-classical crystallisation”
pathway with evidence of initial association of these NPs in an unstructured way making them
amorphous in nature, with a tendency to crystallise quickly within the 30 minute time period
as shown previously by SEM and PXRD analysis (McComiskey et al., 2018). “Non-classical
crystallisation” pathways involving kinetically metastable precursor particles can be found
elsewhere in the literature (Niederberger and Cölfen, 2006). Amorphous-to-crystalline
pathways have a thermodynamic origin. In this instance, unstable amorphous particles
undergo phase transformation to a thermodynamically stable ordered crystalline phase over
30 minutes. Whereby, thermodynamically unstable phases are replaced by more stable
phases (Han and Aizenberg, 2007; Pouget et al., 2009). As previously mentioned, considering
Mie theory, we can conclude that the change in the light scattering power of POS NPs is
caused by a change in material composition and not increased particle size. For the first time,
22
NTA has been successfully utilised for the innovative application of monitoring crystallisation
in situ (Fig. 9).
Fig. 9 Schematic representation of “non-classical crystallisation” pathway followed by POS
NPs over 30 minutes of study.
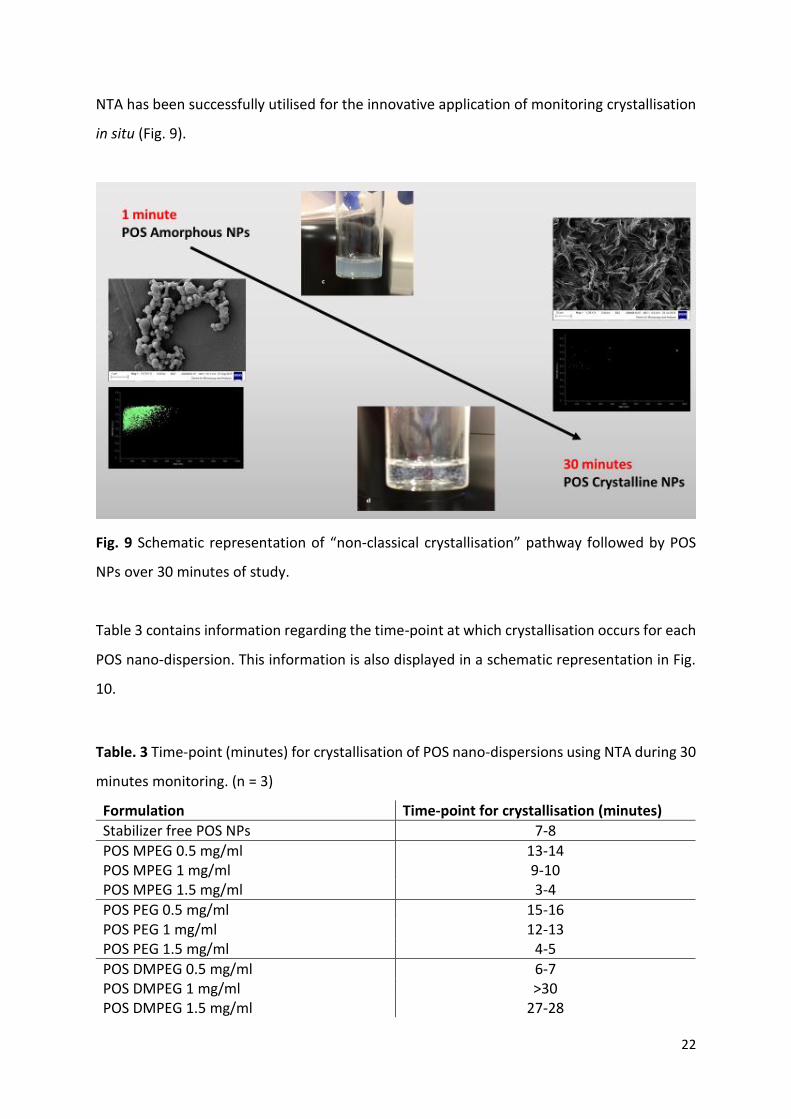
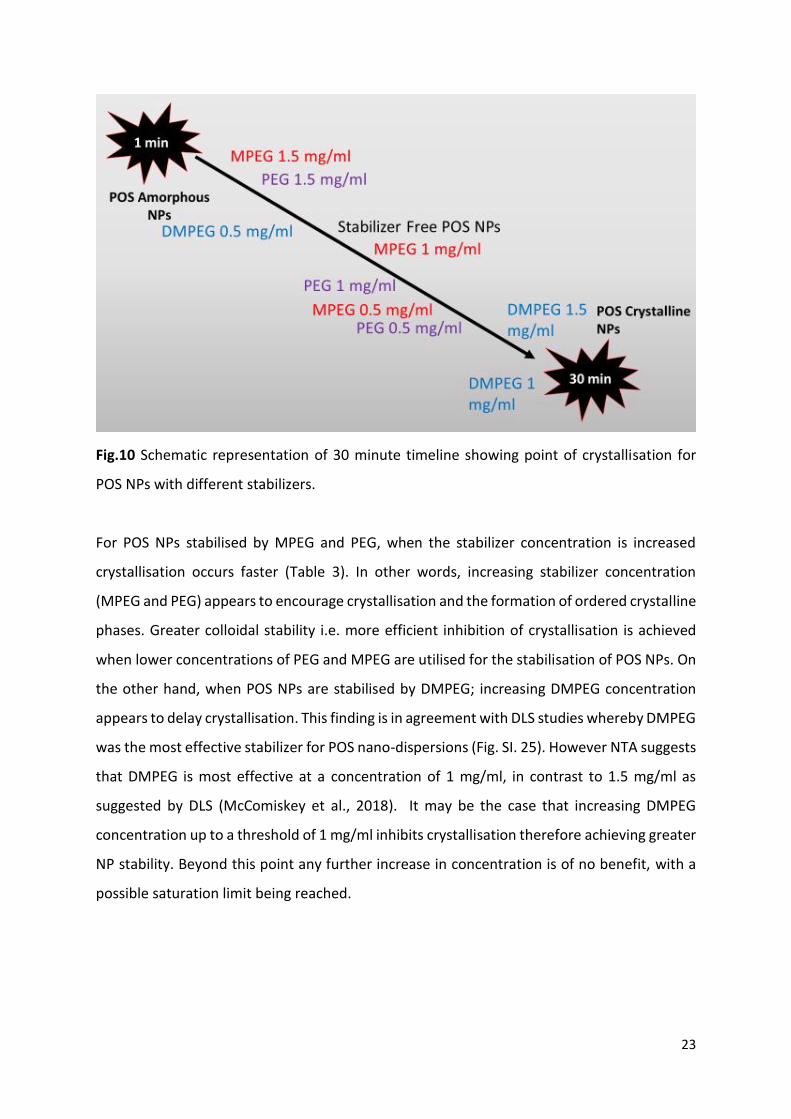
Table 3 contains information regarding the time-point at which crystallisation occurs for each
POS nano-dispersion. This information is also displayed in a schematic representation in Fig.
10.
Table. 3 Time-point (minutes) for crystallisation of POS nano-dispersions using NTA during 30
minutes monitoring. (n = 3)
Formulation Time-point for crystallisation (minutes)
Stabilizer free POS NPs 7-8
POS MPEG 0.5 mg/ml 13-14 POS MPEG 1 mg/ml 9-10 POS MPEG 1.5 mg/ml 3-4
POS PEG 0.5 mg/ml 15-16 POS PEG 1 mg/ml 12-13 POS PEG 1.5 mg/ml 4-5
POS DMPEG 0.5 mg/ml 6-7 POS DMPEG 1 mg/ml >30 POS DMPEG 1.5 mg/ml 27-28
23
Fig.10 Schematic representation of 30 minute timeline showing point of crystallisation for
POS NPs with different stabilizers.
For POS NPs stabilised by MPEG and PEG, when the stabilizer concentration is increased
crystallisation occurs faster (Table 3). In other words, increasing stabilizer concentration
(MPEG and PEG) appears to encourage crystallisation and the formation of ordered crystalline
phases. Greater colloidal stability i.e. more efficient inhibition of crystallisation is achieved
when lower concentrations of PEG and MPEG are utilised for the stabilisation of POS NPs. On
the other hand, when POS NPs are stabilised by DMPEG; increasing DMPEG concentration
appears to delay crystallisation. This finding is in agreement with DLS studies whereby DMPEG
was the most effective stabilizer for POS nano-dispersions (Fig. SI. 25). However NTA suggests
that DMPEG is most effective at a concentration of 1 mg/ml, in contrast to 1.5 mg/ml as
suggested by DLS (McComiskey et al., 2018). It may be the case that increasing DMPEG
concentration up to a threshold of 1 mg/ml inhibits crystallisation therefore achieving greater
NP stability. Beyond this point any further increase in concentration is of no benefit, with a
possible saturation limit being reached.
24
4. Critical Evaluation of Nanoparticle Tracking Analysis (NTA) versus Dynamic Light
Scattering (DLS)
Ultimately, both NTA and DLS confirmed ITR NPs have the greatest stability. DLS confirmed
DMPEG was the most effective stabilizer for ITR and KETO. This is reflected by small error bars
and therefore relatively low variability associated with the NTA PSDs of these samples (Fig.
1h, 2h and Fig. SI. 3L). In general, upon initial formation ITR nano-dispersions showed the
best agreement in particle size data obtained via the two techniques (Table 1). Greater
differences in particle size values were observed for KETO and POS nano-dispersions at the
same time point (Table 2 and SI. 1). It seems likely that the presence of larger sized particles
or aggregates within samples at 30 minutes are skewing DLS distributions towards larger
particle sizes (Demeester et al., 2005). This has been noted elsewhere in the literature, with
the presence of few large particles within the sample obstructing the accurate size
determination of the smaller dominant population (Berne and Pecora, 2000). It is also
possible that some degree of particle sedimentation is occurring at 30 minutes for samples
undergoing analysis, most notably for POS whereby micron sized crystals were present
(McComiskey et al., 2018). For accurate size determination via both DLS and NTA, it is critical
that the process of diffusion (Brownian motion) is much faster than the process of
sedimentation. It is possible that larger particles present at 30 minutes may be subject to
different rates of sedimentation as a consequence of their environment, which differs for DLS
and NTA. This could be responsible for inconsistencies in corresponding measurements
between the two techniques. It should be noted that intensity based DLS data is being
compared with number based equivalents derived using NTA. Therefore, it seems that a
number of large sized particles within the nano-dispersions are having profound impact on
the mean particle size measured using DLS.
Fig. 1 highlighted the increase in sample complexity shown by NTA between 1 minute and 30
minutes. This confirms the ability of NTA to achieve greater peak resolution for multimodal
size distributions (Dragovic et al., 2011). NTA can resolve particle populations with a 1.5 fold
difference in size compared with DLS which requires particle populations to have a two or
three fold difference in particle size (Filipe et al., 2010). Perhaps, NTA is more suitable for the
analysis of polydisperse samples, giving a truer picture of the sample.
25
In some cases, NTA mean size values were larger than their DLS counterparts by a small
margin. This may be explained by the lower size detection limit of DLS compared with NTA.
Therefore DLS has the ability to size smaller sized particles (<30 nm) in the distribution with
greater accuracy, resulting in smaller mean size values. In the case of KETO and POS, Table 2
and SI. 1 shows DLS particle sizes are greater than their NTA counterparts, a feature noted
elsewhere in the literature (Filipe et al., 2010). There a few possible explanations for this.
Firstly, PDI measurements would suggest that KETO nano- dispersions are the most
polydisperse of all studied API nano- dispersions i.e. multimodal and therefore may yield less
reliable size data via DLS. This fact is also supported by the larger error bars associated with
DLS data for KETO nano-dispersions compared with that of NTA (Fig. 2). Small error bars
associated with NTA KETO samples suggest good reproducibility for these datasets (Table 2).
The polydispersity of the KETO nano-dispersions (Table 2 and Fig. 2) may explain the
difference in particle size values obtained for the two techniques. DLS, being an intensity
based technique may not size polydisperse samples such as KETO accurately. Perhaps NTA
measurements give a more realistic representation of PSDs for KETO, making NTA the more
suitable technique for analysis of KETO nano-dispersions.
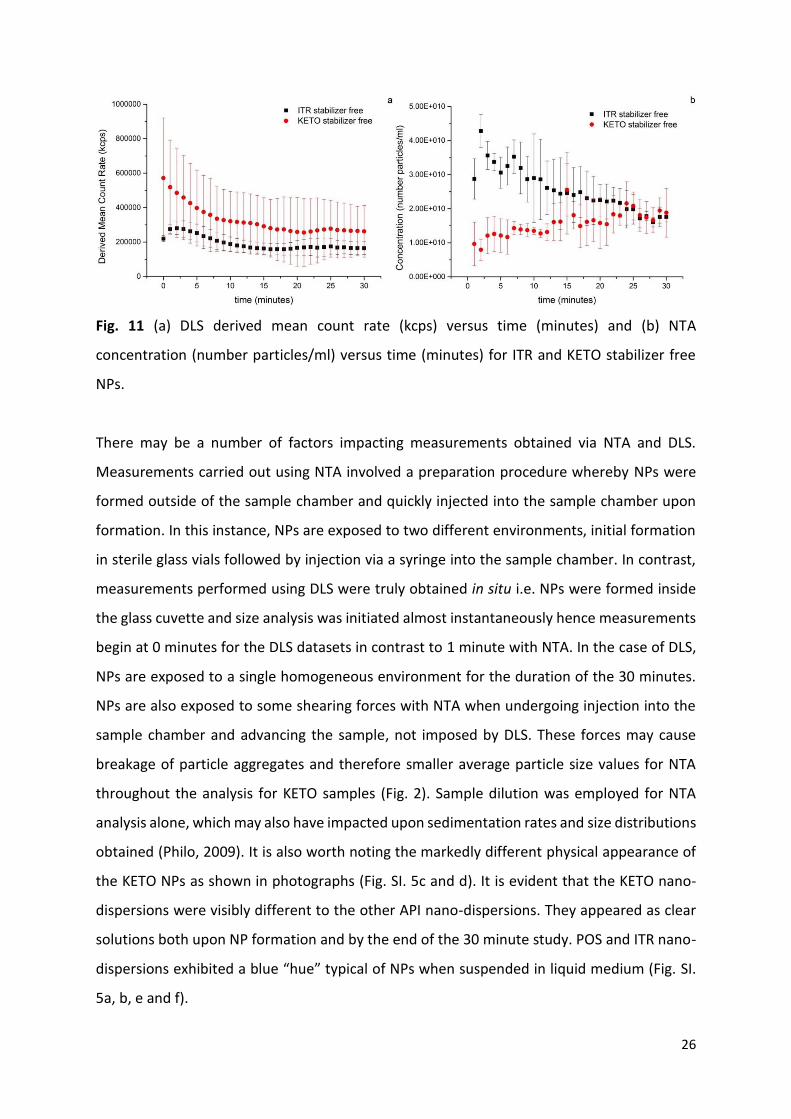
Both ITR and KETO DLS derived mean count rates follow a similar trend with count rates
decreasing over the 30 minute period (Fig. 11a). It has been shown previously that count rates
can act as a surrogate for NP concentration, however they are dependent upon both particle
size and concentration (Hassan et al., 2015). Fig. 11b provides evidence of decreasing ITR
particle concentration over 30 minutes according to NTA. Therefore DLS and NTA are in
agreement in this respect. Fig. 11b shows KETO NTA total particle concentration is lower than
ITR, however beyond 10 minutes no difference exists. It appears that DLS derived count rates
can indeed be used as a surrogate for particle concentration. On the other hand other studies
have concluded that NTA concentration measurements are possibly inaccurate, and perhaps
this data should be considered relative rather than absolute (Gallego-Urrea et al., 2011;
Krueger et al., 2016). Ultimately, the ability of NTA to provide particle concentration values
remains an advantage over DLS.
26
Fig. 11 (a) DLS derived mean count rate (kcps) versus time (minutes) and (b) NTA
concentration (number particles/ml) versus time (minutes) for ITR and KETO stabilizer free
NPs.
There may be a number of factors impacting measurements obtained via NTA and DLS.
Measurements carried out using NTA involved a preparation procedure whereby NPs were
formed outside of the sample chamber and quickly injected into the sample chamber upon
formation. In this instance, NPs are exposed to two different environments, initial formation
in sterile glass vials followed by injection via a syringe into the sample chamber. In contrast,
measurements performed using DLS were truly obtained in situ i.e. NPs were formed inside
the glass cuvette and size analysis was initiated almost instantaneously hence measurements
begin at 0 minutes for the DLS datasets in contrast to 1 minute with NTA. In the case of DLS,
NPs are exposed to a single homogeneous environment for the duration of the 30 minutes.
NPs are also exposed to some shearing forces with NTA when undergoing injection into the
sample chamber and advancing the sample, not imposed by DLS. These forces may cause
breakage of particle aggregates and therefore smaller average particle size values for NTA
throughout the analysis for KETO samples (Fig. 2). Sample dilution was employed for NTA
analysis alone, which may also have impacted upon sedimentation rates and size distributions
obtained (Philo, 2009). It is also worth noting the markedly different physical appearance of
the KETO NPs as shown in photographs (Fig. SI. 5c and d). It is evident that the KETO nano-
dispersions were visibly different to the other API nano-dispersions. They appeared as clear
solutions both upon NP formation and by the end of the 30 minute study. POS and ITR nano-
dispersions exhibited a blue “hue” typical of NPs when suspended in liquid medium (Fig. SI.
5a, b, e and f).
27
NTA measurements require the operator to select suitable analysis settings prior to sample
measurement, a form of visual validation which is subject to operator bias (Filipe et al., 2010).
The settings required for KETO NP analysis were profoundly different to that of ITR and POS
(screenshot of setting can be found within Figs. SI. 26 and 27). Much higher settings were
required in order to obtain a clear and suitable view of the KETO NPs for size measurements.
For example, for KETO NPs stabilized with MPEG 1 mg/ml a camera level of 12 was utilised,
while a camera level of 5 and 4 was used for ITR and POS equivalents. For this reason NTA
sizes KETO NPs with greater difficulty.
Both techniques confirmed POS NPs were the least stable. They also confirmed DMPEG to be
the best stabilizer as demonstrated by its ability to delay crystallisation for the longest period
of time (Fig. 10 and Table. SI. 1). DLS studies concluded that DMPEG 1.5 mg/ml to the most
effective concentration whilst NTA favours a 1 mg/ml concentration (McComiskey et al.,
2018). It may be the case that increasing DMPEG concentration up to a threshold of 1 mg/ml
inhibits crystallisation therefore achieving greater NP stability. Beyond this point any further
increase in concentration is of no benefit, perhaps a saturation limit is reached. The slight
difference in effective concentration suggested by the two techniques can be explained by
the analysis environment and the comparison of a number versus intensity based technique.
There are a number of other factors to be considered when interpreting data and assessing
the suitably of these sizing techniques. DLS requires little skill on the part of the operator,
whilst NTA requires the operator to select suitable detection and analysis settings, which are
dependent upon operator judgement and experience. In addition, NTA requires sample
particle concentration to be in the range of 107 to 109 particles per ml. Therefore, determining
the correct dilution factor can be time consuming for the user, with dilution possibly
impacting upon original particle properties and accurate analysis. On the other hand, DLS has
the ability to adjust the attenuator employed based on sample concentration automatically
removing operator bias. NTA also has the disadvantage of longer measurement time over DLS,
as multiple measurements are necessary in order to obtain statistically meaningful results.
Although NTA has greater peak resolution, this comes with reduced sensitivity to particles
smaller than 30 nm. Samples with average particle sizes below 30 nm may be more suitable
for DLS. The particle sizing technique selected should consider all prior information known
28
about the sample, as well as the critical sample characteristics to be determined, as these will
have a great impact upon end product performance.
An obvious advantage of NTA over DLS lies in its ability to visualise sample changes in situ.
The novel application of NTA for the purposes of monitoring the dynamic, complex journey
of crystallisation in situ has the potential to provide researchers with lucrative information
regarding the physical processes taking place during sample analysis.
5. Conclusion
Critical to the success of the NP formulation process is the utilisation of more than one particle
sizing technique. This study, revealed the detailed and diverse amount of information that
can be provided via particle size characterisation using both NTA and DLS for nano-
dispersions. Both techniques concluded ITR NPs were the most stable and POS NPs the least
stable. Both techniques confirmed DMPEG was the most effective stabilizer for POS nano-
dispersions. It seems that a number of large sized particles within the nano-dispersions have
a profound impact upon the mean particle size measured using DLS. Hence, DLS and NTA
sizing techniques should be used in a complimentary manner, making it possible to
characterise nano-dispersions in a quick and detailed way. Combining information derived via
both techniques provides the user with the opportunity to gain a complete holistic picture of
the sample under analysis. The suitability of the particle sizing technique utilised is dependent
upon the sample in question undergoing analysis as well as critical sample characteristics to
be determined. For the first time, NTA was successfully utilised for the innovative purpose of
in situ monitoring of crystal growth via “non-classical crystallisation” pathways. Mie theory
was successfully employed to explain the relationship between material composition and
particle light scattering power. This finding can provide an alternative means to conventional
methods for assessing the progress of the dynamic crystallisation process on the nano-scale
in real time. Such information can serve to deepen our understanding of these complex
physical processes.
6. Acknowledgements
29
Research leading to these results was supported by the Synthesis and Solid State
pharmaceutical Centre (SSPC), financed by a research grant from Science Foundation Ireland
(SFI) and co-funded under the European Regional Development Fund (Grant Number
12/RC/2275).The authors would like to thank Dr. Grzegorz Garbacz (Physiolution GmbH,
Germany) for kindly supplying itraconazole.
7. References Anderson, W., Kozak, D., Coleman, V.A., Jämting, Å.K., Trau, M., 2013. A comparative study
of submicron particle sizing platforms: Accuracy, precision and resolution analysis of polydisperse particle size distributions. J. Colloid Interface Sci. 405, 322–330. doi:10.1016/j.jcis.2013.02.030
Bell, N.C., Minelli, C., Tompkins, J., Stevens, M.M., Shard, A.G., 2012. Emerging techniques for submicrometer particle sizing applied to stober silica. Langmuir 28, 10860–10872. doi:10.1021/la301351k
Berne, B., Pecora, R., 2000. Dynamic light scattering with applications to chemistry, biology and physics. Mineola, Dover.
Bootz, A., Vogel, V., Schubert, D., Kreuter, J., 2004. Comparison of scanning electron microscopy, dynamic light scattering and analytical ultracentrifugation for the sizing of poly(butyl cyanoacrylate) nanoparticles. Eur. J. Pharm. Biopharm. 57, 369–375. doi:10.1016/S0939-6411(03)00193-0
Brown, P.H., Schuck, P., 2006. Macromolecular size-and-shape distributions by sedimentation velocity analytical ultracentrifugation. Biophys. J. 90, 4651–4661. doi:10.1529/biophysj.106.081372
Calzolai, L., Gilliland, D., Garcìa, C.P., Rossi, F., 2011. Separation and characterization of gold nanoparticle mixtures by flow-field-flow fractionation. J. Chromatogr. A 1218, 4234–4239. doi:10.1016/j.chroma.2011.01.017
Carlton, R.A., 2011. Pharmaceutical Microscopy. doi:10.1007/978-1-4419-8831-7 Demeester, J., Smedt, S., Sanders, N., Haustraete, J., 2005. Light Scattering, in: Jiskoot, W.,
Crommelin, D.J. (Ed.), Methods for Structural Analysis of Protein Pharmaceuticals. Arlington: AAPS.
Dragovic, R.A., Gardiner, C., Brooks, A.S., Tannetta, D.S., Ferguson, D.J.P., Hole, P., Carr, B., Redman, C.W.G., Harris, A.L., Dobson, P.J., Harrison, P., Sargent, I.L., 2011. Sizing and phenotyping of cellular vesicles using Nanoparticle Tracking Analysis. Nanomedicine Nanotechnology, Biol. Med. 7, 780–788. doi:10.1016/j.nano.2011.04.003
Einstein, A., 1908. Elementare theorie der brownschen bewegung. Zeitschrift fur Elektrochemie und Angew. Phys. Chemie 14, 235–239.
Filipe, V., Hawe, A., Jiskoot, W., 2010. Critical evaluation of nanoparticle tracking analysis (NTA) by NanoSight for the measurement of nanoparticles and protein aggregates. Pharm. Res. 27, 796–810. doi:10.1007/s11095-010-0073-2
Gallego-Urrea, J.A., Tuoriniemi, J., Hassellöv, M., 2011. Applications of particle-tracking analysis to the determination of size distributions and concentrations of nanoparticles in environmental, biological and food samples. TrAC - Trends Anal. Chem. 30, 473–483. doi:10.1016/j.trac.2011.01.005
Hahn, D.W., 2009. Light Scattering Theory. Aerosp. Eng. 27, 1–13. doi:[email protected]

30
Han, T.Y.-J., Aizenberg, J., 2007. Calcium Carbonate Storage in Amorphous Form and Its Template-Induced Crystallization. Chem. Mater. 20, 1064–1068. doi:dx.doi.org/10.1021/cm702032v
Hassan, P., Rana, S., Verma, G., 2015. Making sense of brownian motion: colloid characterization by dynamic light scattering. Langmuir 31, 3–12. doi:10.1021/la501789z
Joubert, M.K., Luo, Q., Nashed-Samuel, Y., Wypych, J., Narhi, L.O., 2011. Classification and characterization of therapeutic antibody aggregates. J. Biol. Chem. 286, 25118–25133. doi:10.1074/jbc.M110.160457
Krueger, A.B., Carnell, P., Carpenter, J.F., 2016. Characterization of Factors Affecting Nanoparticle Tracking Analysis Results With Synthetic and Protein Nanoparticles. J. Pharm. Sci. 105, 1434–1443. doi:10.1016/j.xphs.2016.02.005
Lin, H.O., Baenziger, N.C., Guillory, J.K., 1974. Physical properties of four polymorphic forms of sulfanilamide I: Densities, refractive indexes, and X‐ray diffraction measurements. J. Pharm. Sci. 63, 145–146. doi:10.1002/jps.2600630140
Luo, P., Roca, A., Tiede, K., Privett, K., Jiang, J., Pinkstone, J., Ma, G., Veinot, J., Boxall, A., 2016. Application of nanoparticle tracking analysis for characterising the fate of engineered nanoparticles in sediment-water systems. J. Environ. Sci. (China) 64, 62–71. doi:10.1016/j.jes.2016.07.019
McComiskey, K.P.M., Mugheirbi, N.A., Stapleton, J., Tajber, L., 2018. In Situ Monitoring of Nanoparticle Formation: Antisolvent Precipitation of Azole Anti-fungal Drugs. Int. J. Pharm. doi:https://doi.org/10.1016/j.ijpharm.2018.03.054
McKinlay, K.J., Allison, F.J., Scotchford, C.A., Grant, D.M., Oliver, J.M., King, J.R., Wood, J.V., Brown, P.D., 2004. Comparison of environmental scanning electron microscopy with high vacuum scanning elctron microscopy as applied to the assessment of cell morphology. J. Biomed Mater Res Part A 69, 359–366.
Mugheirbi, N.A., Tajber, L., 2015. Mesophase and size manipulation of itraconazole liquid crystalline nanoparticles produced via quasi nanoemulsion precipitation. Eur. J. Pharm. Biopharm. 96, 226–236. doi:10.1016/j.ejpb.2015.08.005
Niederberger, M., Cölfen, H., 2006. Oriented attachment and mesocrystals: non-classical crystallization mechanisms based on nanoparticle assembly. Phys. Chem. Chem. Phys. 8, 3271–3287. doi:10.1039/b604589h
Palmberger, S., Mohr, C., Stubauer, G., 2015. Patent Application Publication Pub. No.: US 2017/0139001 A1.
Peeters, O.M., Blaton, N.M., De Ranter, C.J., 1996. {\it cis}-2-{\it sec}-Butyl-4-{4-[4-(4-{[2-(2,4-dichlorophenyl)-2-(1{\it H}-1,2,4-triazol-1-ylmethyl)-1,3-dioxolan-4-yl]methoxy}phenyl)-1-piperazinyl]phenyl}-2,4-dihydro-3{\it H}-1,2,4-triazol-3-one (Itraconazole). Acta Crystallogr. Sect. C 52, 2225–2229. doi:10.1107/S0108270196004180
Peeters, O.M., Blaton, N.M., De Ranter, C.J., 1979. {\it cis}-1-Acetyl-4-(4-{[2-(2,4-dichlorophenyl)-2-(1{\it H}-1-imidazolylmethyl)-1,3-dioxolan-4-yl]methoxy}phenyl)piperazine: ketoconazole. A crystal structure with disorder. Acta Crystallogr. Sect. B 35, 2461–2464. doi:10.1107/S0567740879009651
Peeters, O.M., Blaton, N.M., Gerber, J.G., Gal, J., 2004. (+)-{\it cis}-1-Acetyl-4-(4-{[(2{\it R},4{\it S})-2-(2,4-di{\-}chloro{\-}phenyl)-2-(1{\it H}-imidazol-1-ylmeth{\-}yl)-1,3-dioxolan-4-yl]{\-}methoxy}phenyl){\-}piperazine [(2{\it R},4{\it S})-(+)-ketoconazole]. Acta Crystallogr. Sect. E 60, o367--o369. doi:10.1107/S1600536804003046
Philo, J.S., 2009. A critical review of methods for size characterization of non-particulate
31
protein aggregates. Curr Pharm Biotechnol. 10, 359–372. Pouget, E.M., Bomans, P.H.H., Goos, J.A.C.M., Frederik ,P.M., de With, G., Sommerdijk,
N.A.J.M., 2009. CaCO 3 Formation Revealed by Cryo-TEM. Science (80-. ). 323, 1455–1458. doi:doi: 10.1126/science.1169434
Radha, A.V., Forbes, T.Z., Killian, C.E., Gilbert, P.U.P.A., Navrotsky, A., 2010. Transformation and crystallization energetics of synthetic and biogenic amorphous calcium carbonate. Proc. Natl. Acad. Sci. U. S. A. 107, 16438–16443. doi:10.1073/pnas.1009959107
Singh, S., Dunmur, D.A., 2002. Liquid Crystal: Fundamentals, in: Liquid Crystals: Fundamentals. p. 62.
Svedberg, T., 1906. Uber die eigenbewegung der teilchen in kolloidalen losungen. Zeitschrift fur Elektrochemie und Angew. Phys. Chemie 12, 853–860.
Tarnacka, M., Adrjanowicz, K., Kaminska, E., Kaminski, K., Grzybowska, K., Kolodziejczyk, K., Wlodarczyk, P., Hawelek, L., Garbacz, G., Kocot, A., Paluch, M., 2013. Molecular dynamics of itraconazole at ambient and high pressure. Phys. Chem. Chem. Phys. 15, 20742–20752. doi:10.1039/C3CP52643G
Touzet, A., Pfefferlé, F., der Wel, P. van, Lamprecht, A., Pellequer, Y., 2018. Active freeze drying for production of nanocrystal-based powder: A pilot study. Int. J. Pharm. 536, 222–230. doi:10.1016/j.ijpharm.2017.11.050
Watanabe, A., Ohnuma, N., 2000. Crystallographic characteristics of crystal habits and their peculiarity to the substance (study of crystalline drugs by means of a polarizing microscope). J. Pharm. Soc. Japan 120, 290–297.
Wong, J., Papadopoulos, P., Werling, J., Rebbeck, C., Doty, M., Kipp, J., Konkel, J., Neuberger, D., 2006. Itraconazole suspension for intravenous injection: determination of the real component of complete refractive index for particle sizng by static light scattering. PDA J Pharm Sci Technol 60(5), 302–313.
Yang, D.T., Lu, X., Fan, Y., Murphy, R.M., 2014. Evaluation of Nanoparticle Tracking for Characterization of Fibrillar Protein Aggregates. AIChE J. 60, 1236–1244. doi:10.1002/aic.14349
Wittbold, W., Tatarkiewicz, K., 2017. Biological Characterization Using Protein Crystal Measurements. BioProcess International 15(3), 48-51.
Zölls, S., Tantipolphan, R., Wiggenhorn, M., Winter, G., Jiskoot, W., Friess, W., Hawe, A., 2012. Particles in therapeutic protein formulations, Part 1: Overview of analytical methods. J. Pharm. Sci. 101, 914–935. doi:10.1002/jps.23001
Related Documents