Comparison of Metabolomics Approaches for Evaluating the Variability of Complex Botanical Preparations: Green Tea (Camellia sinensis) as a Case Study Joshua J. Kellogg, † Tyler N. Graf, † Mary F. Paine, ‡ Jeannine S. McCune, § Olav M. Kvalheim, ⊥ Nicholas H. Oberlies, † and Nadja B. Cech* ,† † Department of Chemistry & Biochemistry, University of North Carolina at Greensboro, Greensboro, North Carolina 27412, United States ‡ College of Pharmacy, Washington State University, Spokane, Washington 99202, United States § Department of Pharmaceutics, University of Washington, Seattle, Washington 99202, United States ⊥ Department of Chemistry, University of Bergen, Bergen 5020, Norway * S Supporting Information ABSTRACT: A challenge that must be addressed when conducting studies with complex natural products is how to evaluate their complexity and variability. Traditional methods of quantifying a single or a small range of metabolites may not capture the full chemical complexity of multiple samples. Different metabolomics approaches were evaluated to discern how they facilitated comparison of the chemical composition of commercial green tea [Camellia sinensis (L.) Kuntze] products, with the goal of capturing the variability of commercially used products and selecting representative products for in vitro or clinical evaluation. Three metabolomic-related methodsuntar- geted ultraperformance liquid chromatography−mass spectrom- etry (UPLC-MS), targeted UPLC-MS, and untargeted, quantitative 1 HNMRwere employed to characterize 34 commercially available green tea samples. Of these methods, untargeted UPLC-MS was most effective at discriminating between green tea, green tea supplement, and non-green-tea products. A method using reproduced correlation coefficients calculated from principal component analysis models was developed to quantitatively compare differences among samples. The obtained results demonstrated the utility of metabolomics employing UPLC-MS data for evaluating similarities and differences between complex botanical products. I t is common practice in many research fields to conduct in vitro or clinical evaluation of complex botanical products. The selection of appropriate study material for such investigations is confounded by the complexity and variability of botanical source material. Botanical products contain diverse phytochemicals, of which the identities of many are often not known. In addition, substantive variability in phytochemical composition exists in these products depending on the method of preparation or source material used, and industrial processing of botanical supplements frequently renders them unable to be analyzed using genetic techniques, such as DNA barcoding. 1,2 Such variability in phytochemical composition can greatly impact the interpretation of both in vitro and clinical studies. There is currently a lack of definitive guidelines for ensuring the quality of the product to be tested. 3 The United States Food and Drug Administration (FDA) guidance for clinical trials involving botanical drug products 4 recommends that investigational new drug applications contain “a chemical identification for the active constituents or characteristic markers in the drug substance, if possible”. However, specific guidelines for comparing available products and selecting appropriate representative samples for investigation are currently lacking. The goal of this study was to compare the effectiveness of several metabolomics approaches for evaluating the variability in the phytochemical composition of a series of commercial botanical products. Green tea [leaves from Camellia sinensis (L.) Kuntze (Theaceae)] were employed as a test case. Green tea is one of the most commonly consumed beverages worldwide 5 and is also a popular dietary supplement, ranking fifth in sales in the United States in 2015. 6 Green tea products have been reported to possess numerous health-protective qualities, including cardioprotection, chemoprevention, and weight loss. 7−9 However, many green tea clinical samples are delivered as a complex mixture (tea or extract) as opposed to single-molecule interventions. 10−12 Received: December 16, 2016 Published: April 28, 2017 Article pubs.acs.org/jnp © 2017 American Chemical Society and American Society of Pharmacognosy 1457 DOI: 10.1021/acs.jnatprod.6b01156 J. Nat. Prod. 2017, 80, 1457−1466

Welcome message from author
This document is posted to help you gain knowledge. Please leave a comment to let me know what you think about it! Share it to your friends and learn new things together.
Transcript

Comparison of Metabolomics Approaches for Evaluating theVariability of Complex Botanical Preparations: Green Tea (Camelliasinensis) as a Case StudyJoshua J. Kellogg,† Tyler N. Graf,† Mary F. Paine,‡ Jeannine S. McCune,§ Olav M. Kvalheim,⊥
Nicholas H. Oberlies,† and Nadja B. Cech*,†
†Department of Chemistry & Biochemistry, University of North Carolina at Greensboro, Greensboro, North Carolina 27412, UnitedStates‡College of Pharmacy, Washington State University, Spokane, Washington 99202, United States§Department of Pharmaceutics, University of Washington, Seattle, Washington 99202, United States⊥Department of Chemistry, University of Bergen, Bergen 5020, Norway
*S Supporting Information
ABSTRACT: A challenge that must be addressed whenconducting studies with complex natural products is how toevaluate their complexity and variability. Traditional methods ofquantifying a single or a small range of metabolites may notcapture the full chemical complexity of multiple samples.Different metabolomics approaches were evaluated to discernhow they facilitated comparison of the chemical composition ofcommercial green tea [Camellia sinensis (L.) Kuntze] products,with the goal of capturing the variability of commercially usedproducts and selecting representative products for in vitro orclinical evaluation. Three metabolomic-related methodsuntar-geted ultraperformance liquid chromatography−mass spectrom-etry (UPLC-MS), targeted UPLC-MS, and untargeted, quantitative 1HNMRwere employed to characterize 34 commerciallyavailable green tea samples. Of these methods, untargeted UPLC-MS was most effective at discriminating between green tea,green tea supplement, and non-green-tea products. A method using reproduced correlation coefficients calculated from principalcomponent analysis models was developed to quantitatively compare differences among samples. The obtained resultsdemonstrated the utility of metabolomics employing UPLC-MS data for evaluating similarities and differences between complexbotanical products.
I t is common practice in many research fields to conduct invitro or clinical evaluation of complex botanical products.
The selection of appropriate study material for suchinvestigations is confounded by the complexity and variabilityof botanical source material. Botanical products contain diversephytochemicals, of which the identities of many are often notknown. In addition, substantive variability in phytochemicalcomposition exists in these products depending on the methodof preparation or source material used, and industrialprocessing of botanical supplements frequently renders themunable to be analyzed using genetic techniques, such as DNAbarcoding.1,2 Such variability in phytochemical composition cangreatly impact the interpretation of both in vitro and clinicalstudies. There is currently a lack of definitive guidelines forensuring the quality of the product to be tested.3 The UnitedStates Food and Drug Administration (FDA) guidance forclinical trials involving botanical drug products4 recommendsthat investigational new drug applications contain “a chemicalidentification for the active constituents or characteristicmarkers in the drug substance, if possible”. However, specific
guidelines for comparing available products and selectingappropriate representative samples for investigation arecurrently lacking.The goal of this study was to compare the effectiveness of
several metabolomics approaches for evaluating the variabilityin the phytochemical composition of a series of commercialbotanical products. Green tea [leaves from Camellia sinensis(L.) Kuntze (Theaceae)] were employed as a test case. Greentea is one of the most commonly consumed beveragesworldwide5 and is also a popular dietary supplement, rankingfifth in sales in the United States in 2015.6 Green tea productshave been reported to possess numerous health-protectivequalities, including cardioprotection, chemoprevention, andweight loss.7−9 However, many green tea clinical samples aredelivered as a complex mixture (tea or extract) as opposed tosingle-molecule interventions.10−12
Received: December 16, 2016Published: April 28, 2017
Article
pubs.acs.org/jnp
© 2017 American Chemical Society andAmerican Society of Pharmacognosy 1457 DOI: 10.1021/acs.jnatprod.6b01156
J. Nat. Prod. 2017, 80, 1457−1466
The phytochemical composition of green tea is similar tothat of fresh Camellia sinensis leaves except for a fewenzymatically catalyzed reactions that occur immediately afterharvest.5,13 Green tea contains over 200 previously identifiedconstituents, including polyphenols, xanthines, theanine,inorganic salts, and individual elements.14 Polyphenolsconstitute up to 30% of the dry leaf by mass and are themajor constituents in green tea.15 Catechins, specifically flavan-3-ols and flavan-3-gallates, represent the largest group ofpolyphenols in green tea leaves and are thought to be largelyresponsible for the diverse bioactivity demonstrated in greentea studies.16 The extraction efficiency of green tea polyphenolsdepends on the extraction method, contact time with thesolvent, solvent composition, and the form of tea (i.e., baggedor loose).17,18 This variability is increased with the incompleteor inconsistent application of analytical methods, makingdetermination of dose content challenging.19 Meta-analysisstudies of green tea products used in clinical studies reportedpolyphenol doses ranging from 200 to 1207 mg.10−12
Metabolomics-based approaches have emerged as importanttools in assessing large chemical and biological data sets,including those related to disease pathology,20 drug response,21
environmental toxicity,22 and natural products discovery.23,24
The primary goal of metabolomics is to correlate changes in thechemical profile of a sample with a corresponding shift inmacroscopic phenotype due to a perturbation.25 Metabolomicstudies coupled with statistical analysis (chemometric studies)have been employed to characterize the relationships betweenthe metabolome of green teas and corresponding genotype,origin, quality, or other biotic or abiotic attributes.26−28
Several different analytical techniques are used for metab-olomic profiling, including infrared and Raman spectroscopy,NMR spectroscopy, and mass spectrometry (MS).29,30 NMR-based metabolomic techniques, when acquired under quanti-tative conditions (qNMR), offer an unbiased assessment of acomplex sample composition, allow the simultaneous identi-fication and quantification of diverse metabolites, and are
nondestructive of the sample.24 Mass spectrometry-basedmetabolomic methods have the advantages of orders ofmagnitude greater sensitivity than NMR spectroscopy and theability to couple directly to separation techniques such as gaschromatography (GC) or liquid chromatography (LC).31 Adisadvantage of analysis via mass spectrometry is that ionizationis required to detect sample components, yet all chemicalcompounds are not universally ionized in a mass spectrom-eter.32 With these advantages and disadvantages in mind, thisstudy was undertaken to compare the effectiveness ofuntargeted and targeted mass spectrometry and NMR spec-troscopy as methods for chemically characterizing green teaproducts.One of the critical questions in selecting a botanical product
(in this case a sample of green tea) for further study is how itcompares to other available products. Chemometric analysis ofmetabolomics data sets can be used to make these comparisons.Ascribing similarity between metabolomic profiles is oftenachieved via multivariate statistical modeling procedures, suchas principal component analysis (PCA).26 PCA is a graphicalrepresentation of data that can be used to ascribe clusters ofsimilar samples, but is not equipped to quantify variability andsimilarity between samples, and generally employs only twoprincipal components at a time to classify the samples.33
Hierarchical cluster analysis (HCA) can be used to clustersamples based upon similarity, but provides only informationon similarity between adjacent samples and not for overarchingcomparisons between all samples in a data set.34,35 For thework described herein, an alternate approach for comparison ofsamples was employed, that of a reproduced correlationcoefficient matrix. The reproduced correlation coefficientmatrix is based on PCA scores and loadings, but is derivedfrom all principal components (i.e., not just a pair ofcomponents, as in traditional PCA plots). As demonstratedherein using the example of green tea, the correlation matrixdisplays a series of correlation coefficients that can be used toquantitatively compare multiple samples in a data set and
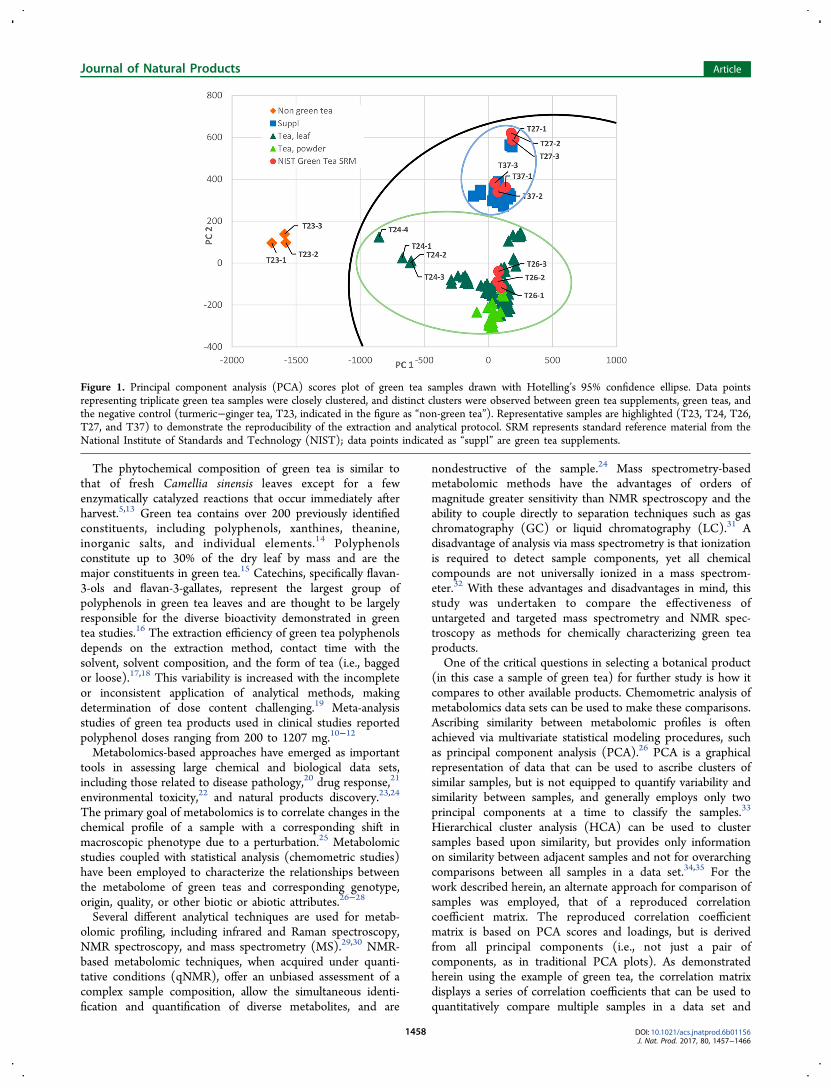
Figure 1. Principal component analysis (PCA) scores plot of green tea samples drawn with Hotelling’s 95% confidence ellipse. Data pointsrepresenting triplicate green tea samples were closely clustered, and distinct clusters were observed between green tea supplements, green teas, andthe negative control (turmeric−ginger tea, T23, indicated in the figure as “non-green tea”). Representative samples are highlighted (T23, T24, T26,T27, and T37) to demonstrate the reproducibility of the extraction and analytical protocol. SRM represents standard reference material from theNational Institute of Standards and Technology (NIST); data points indicated as “suppl” are green tea supplements.
Journal of Natural Products Article
DOI: 10.1021/acs.jnatprod.6b01156J. Nat. Prod. 2017, 80, 1457−1466
1458

determine which are most chemically similar. Such informationcan then be used to inform product selection for later in vitroor clinical evaluation.
■ RESULTS AND DISCUSSIONComparison of Extraction Techniques. An important
first step in comparing the chemistry of complex botanicalproducts is selecting the appropriate solvent extractiontechnique. Two extraction techniques were considered forthis study: hot water extraction and methanol extraction. Hotwater extraction replicates the traditional process of brewing tealeaves and should therefore yield results relevant to consumeruse. However, methanol extraction was appealing due to itsnonselective ability to extract a wide range of secondarymetabolites and the ease in removing methanol solvent forextract storage and processing.36 To aid in the decision betweenhot water and methanol extraction, triplicate extracts of aNational Institute of Standards and Technology (NIST) greentea standard were prepared in both hot water and methanol,and their chemical composition was compared.Overall, the two different extraction techniqueshot water
and methanolyielded similar quantities of the major
polyphenolic metabolites (Figure S1, Supporting Information).The metabolite profile as determined by mass spectrometricanalysis appeared similar between the two techniques. The hotwater extraction sample had a higher (−)-gallocatechin contentrelative to the methanol extraction sample, whereas themethanol extraction sample displayed higher levels of(−)-epicatechin gallate, (−)-epigallocatechin gallate, and gallicacid relative to the water extraction sample. Methanol wasselected as the extraction solvent for subsequent metabolomicsanalysis due to the overall similarities of the extracted quantitiesand the ease of preparing and handling methanolic extracts.
Differentiation of Green Tea Samples by UntargetedMass Spectrometry Metabolomics. Commercially availablegreen tea products (n = 34) were selected using consumer salesreports37 and product quality reports38,39 (Table S1, Support-ing Information). A turmeric−ginger tea served as a negativecontrol (T23), and NIST reference standards (T26, T27, andT37) served as positive controls. For the sake of furthercomparison, two of the selected green teas contained additionalbotanical additives (T24 and T38) (Table S1, SupportingInformation).
Figure 2. Loadings plots from untargeted MS-based PCA of green tea samples. Metabolites with more negative correlation values along the x-axis(PC1, green labels) were present in higher concentrations in the green tea samples versus the negative control (T23, turmeric−ginger tea) and wereresponsible for the separation observed along the horizontal axis of Figure 1. Labeled metabolites with greater positive correlation along the y-axis(PC2, brown labels) were more heavily represented in green tea supplement samples versus the loose leaf green tea samples and were the dominantmetabolites underlying the differentiation of the two sample groups in the vertical axis of Figure 1. Metabolites were identified by comparison againstanalytical standards. In cases where standards were not present, comparisons against the literature using m/z values from high-resolution massspectrometry are provided. Identifications based on mass without reference standards are tentative.
Journal of Natural Products Article
DOI: 10.1021/acs.jnatprod.6b01156J. Nat. Prod. 2017, 80, 1457−1466
1459

Untargeted metabolomic analysis of the green tea samplesusing UPLC-MS yielded 2270 marker ions (unique retentiontime−m/z ion pairings) for 114 objects (i.e., 38 green teasamples prepared by extraction in triplicate), which wereanalyzed using PCA (Figure 1A). The extraction replicates(e.g., T01-1, T01-2, and T01-3) of each green tea product wereoverlaid on the PCA plot (Figure 1A), indicating excellentrepeatability of the extraction technique and subsequent UPLC-MS analysis. PCA using untargeted metabolomics dataidentified one injection, T28-1, which originally appeared tobe an outlier, but had been mislabeled in the UPLC injectionqueue. The ability to identify and address this mislabeledinjection highlights the benefit and importance of havingreplicate samples (each analyzed separately) for metabolomicanalyses.Inspection of the data indicated that the sample clusters were
located at different points in the two-dimensional spaceprescribed by two vectors, principal component 1 (PC1 =38%) and principal component 2 (PC2 = 22%) (Figure 1A).Three distinct clusters were observed in the data, correspond-ing to the three different sample types (green tea, green teasupplement, and the non-green tea) studied. The negativecontrol (T23) was located beyond the boundary of theHotelling’s 95% confidence ellipse. The loose leaf andpowdered green teas were grouped together and were separatefrom the green tea supplements. The two green teas thatcontained additional botanical components (T24 and T38),although roughly grouped with the green tea samples, werevisibly drawn away from the main cluster of tea samples in thePCA. The positive controls (NIST samples T27 and T37) also
clustered with their commercial counterparts (loose leaf tea andgreen tea supplements, respectively) and were located centrallywithin each grouping. Thus, the NIST standards do, indeed,appear to be representative of green teas used commercially byU.S. consumers. Using the unsupervised PCA analysis, it wasnot possible to visually differentiate between the green tea leafand powdered samples, which suggests that the chemistry ofsuch samples is similar.Smaller groupings apparent within the loose leaf and
powdered tea clusters were noted (Figure 1). These clusteringscould have represented variations in tea cultivar, productsource, and/or processing methods.26−28,31,33,40,41 However,commercial suppliers do not traditionally offer records ofcultivars, geographic locations, or precise processing proceduresof their tea products. Therefore, it was not possible todetermine the underlying characteristics that produced thesesmaller clusters. This did not present a problem for theinvestigation being conducted here, as the goal was not tocompare green tea composition from different geographicallocations but evaluate the variability in samples used byconsumers and to determine which samples are mostrepresentative for further clinical and in vitro evaluation.Averaging the peak area from each marker ion across the
analyses of the triplicate extraction samples resulted in a datamatrix (2270 marker ions and 38 objects) that yielded a similarclustering pattern to that observed for the individual replicates(Figure 1). The averaged data set was used for comparisonagainst targeted chemometric analysis and NMR-basedmetabolomics.
Figure 3. Annotated mass spectral profile identifying green tea metabolites used in this study. (A) Positive electrospray ionization mode. (B)Negative electrospray ionization mode.
Journal of Natural Products Article
DOI: 10.1021/acs.jnatprod.6b01156J. Nat. Prod. 2017, 80, 1457−1466
1460

The separation observed in the PCA can be explainedthrough some of the identified metabolites highlighted in theloading plots for PC1 (Figure 2A) and PC2 (Figure 2B).Principal component loadings estimate the degree to whicheach independent variable contributes to the individualprincipal components of a PCA model; the greater themagnitude of a particular variable’s loading to a component,the more it contributes to that principal component. Plottingeach principal component’s loading demonstrates whichvariables (marker ions) are responsible for the clusterings andshifts observed in the PCA scores plot. The loadings plot forthe first principal component (Figure 2A) highlighted thecatechins (−)-epigallocatechin gallate, (−)-epigallocatechin,(−)-epicatechin gallate, (−)-epicatechin and a flavonol, rutin,as all contributing negatively to PC1. These ions were thedominant marker ions responsible for separating the green teasamples from the negative control (T23) (Figure 2A), as theywere present in the green tea samples in higher concentrationsthan the negative control. The components detected wereidentified by comparing retention times, accurate masses, andMS-MS fragmentation patterns against standards. Other ionsthat were dominant in the green tea samples included twodigallate dimers of epigallocatechin gallate, theasinensin A (m/z913.1639) and (−)-epigallocatechin-3-O-(3-O-methyl) gallate(m/z 472.1005), which were identified tentatively bycomparing their accurate masses to literature values.42,43 It isrecognized that definitive identification of these ions is notpossible without isolation and confirmation with NMRspectroscopy, but such experiments were beyond the scope ofthe current study, for which the primary goal was to comparemetabolomics data collection and analysis approaches.The second principal component discriminated between the
green tea supplements and the leaf/powdered teas. Thecorresponding loading plot revealed several metabolites thatwere present in higher concentrations in the green teasupplements than the leaf and powdered teas and, thus, weredominant peaks in the positive direction. Myricetin, kaempfer-ol, and quercetin aglycones, identified via comparison againstaccurate mass and fragmentation pattern of standards, were allpresent as leading discriminating ions (Figure 2B). In addition,based upon accurate mass measurements, the tentativelyidentified theaflavin 3-O-(3-O-methyl) gallate, which is formedvia oxidative coupling of epicatechin and epigallocatechin 3-O-(3-O-methyl) gallate,43 and the dimer epicatechin (4β→8)-epigallocatechin-3-O-gallate44 were observed in the positivedirection of the PC2 loading plot. The data suggest that thesecompounds are present at higher levels in green teasupplements compared to the loose teas. Again, follow-upstudies with NMR structure elucidation would be necessary toconfirm the chemical identity of the 3-O-(3-O-methyl) gallateand epicatechin-(4β→8)-epigallocatechin-3-O-gallate.Targeted Metabolomics Analysis of Green Tea
Samples. As a comparison with the untargeted metabolomicsapproach, targeted quantitative analysis was conducted of aseries of green tea components for which commercial standardswere available. These standards included catechins [(+)-cat-echin, (−)-epicatechin, (−)-epicatechin gallate, (−)-epigalloca-techin, (−)-epigallocatechin gallate, and (−)-gallocatechin],flavonols (kaempferol, myricetin, quercetin, and rutin),phenolic acids (caffeic acid, chlorogenic acid, coumaric acid,and gallic acid), an amino acid (theanine), and a purine alkaloid(caffeine). The calibration curves for each standard were linearover a range of 0.5−200 μg/mL, with a coefficient of
determination (R2) > 0.992 (Table S2, Supporting Informa-tion). The 16 standards were detected in all green tea samples(Figure 3), and the concentration of each constituent wasdetermined (Table S3, Supporting Information). Based on thecorresponding heat map of quantified standards (Figure 4),
concentrations of the main catechins and caffeine rangedbetween 7 and 107 μg/mL extract in all the green tea samplesanalyzed. The negative control (T23) yielded lower concen-trations of most metabolites than the green tea samples, and anumber of green tea metabolites were not detected (Figure 4).The NIST green tea leaf standard (T26) yielded similarconcentrations of (−)-epicatechin, (−)-epicatechin gallate,(−)-gallocatechin, and gallic acid compared to the publishedcertificate of analysis (Table S4, Supporting Information), whileNIST reported higher concentrations of (−)-epigallocatechinand (−)-epigallocatechin gallate. These differences are likely aresult of interlaboratory differences in extraction procedures.45
Metabolite concentrations in all green tea samples were withinthe same order of magnitude as those reported by Phenol-
Figure 4. Quantification of green tea standards in tea samples. Boxesrepresent average concentrations of triplicate samples in μg/mgextract. #Negative control (turmeric−ginger tea); ‡NIST standardreference materials; §green teas containing other botanical additives.ext, extract.
Journal of Natural Products Article
DOI: 10.1021/acs.jnatprod.6b01156J. Nat. Prod. 2017, 80, 1457−1466
1461
Explorer, a database dedicated to the aggregation of phenoliccontent data from dietary sources,46 and published by othersconducting quantitative analysis of green tea constituents.18,47
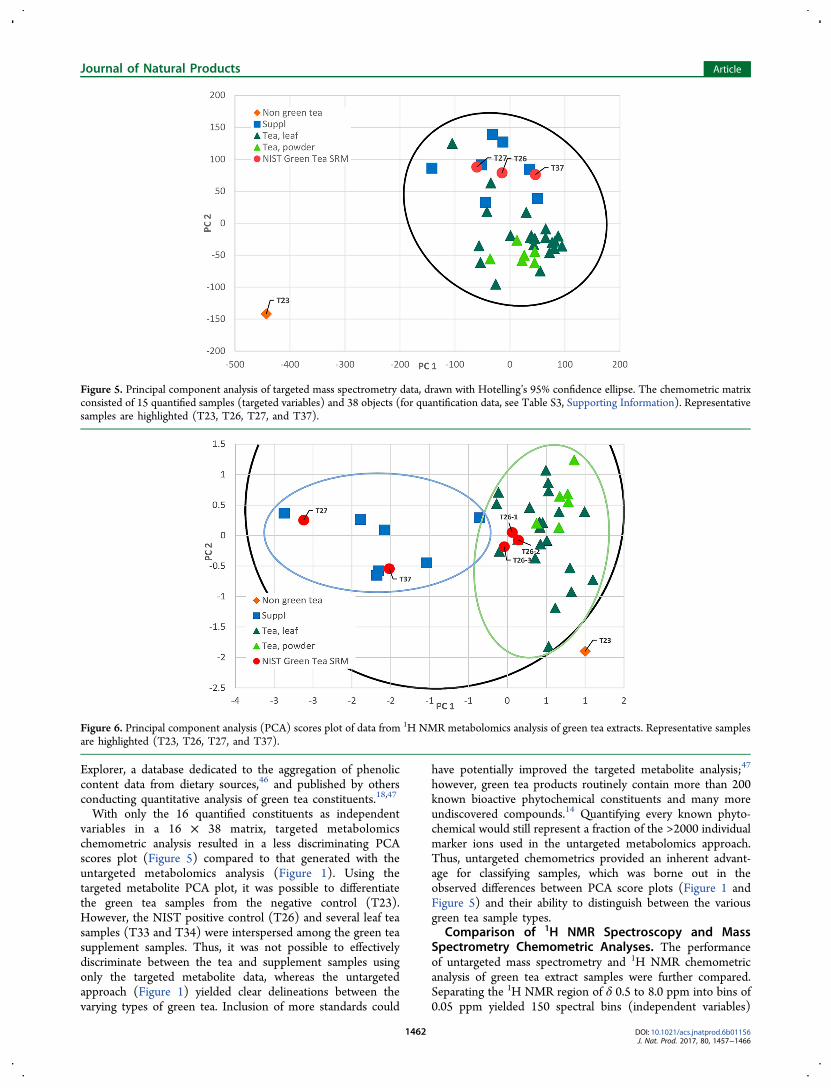
With only the 16 quantified constituents as independentvariables in a 16 × 38 matrix, targeted metabolomicschemometric analysis resulted in a less discriminating PCAscores plot (Figure 5) compared to that generated with theuntargeted metabolomics analysis (Figure 1). Using thetargeted metabolite PCA plot, it was possible to differentiatethe green tea samples from the negative control (T23).However, the NIST positive control (T26) and several leaf teasamples (T33 and T34) were interspersed among the green teasupplement samples. Thus, it was not possible to effectivelydiscriminate between the tea and supplement samples usingonly the targeted metabolite data, whereas the untargetedapproach (Figure 1) yielded clear delineations between thevarying types of green tea. Inclusion of more standards could
have potentially improved the targeted metabolite analysis;47
however, green tea products routinely contain more than 200known bioactive phytochemical constituents and many moreundiscovered compounds.14 Quantifying every known phyto-chemical would still represent a fraction of the >2000 individualmarker ions used in the untargeted metabolomics approach.Thus, untargeted chemometrics provided an inherent advant-age for classifying samples, which was borne out in theobserved differences between PCA score plots (Figure 1 andFigure 5) and their ability to distinguish between the variousgreen tea sample types.
Comparison of 1H NMR Spectroscopy and MassSpectrometry Chemometric Analyses. The performanceof untargeted mass spectrometry and 1H NMR chemometricanalysis of green tea extract samples were further compared.Separating the 1H NMR region of δ 0.5 to 8.0 ppm into bins of0.05 ppm yielded 150 spectral bins (independent variables)
Figure 5. Principal component analysis of targeted mass spectrometry data, drawn with Hotelling’s 95% confidence ellipse. The chemometric matrixconsisted of 15 quantified samples (targeted variables) and 38 objects (for quantification data, see Table S3, Supporting Information). Representativesamples are highlighted (T23, T26, T27, and T37).
Figure 6. Principal component analysis (PCA) scores plot of data from 1H NMR metabolomics analysis of green tea extracts. Representative samplesare highlighted (T23, T26, T27, and T37).
Journal of Natural Products Article
DOI: 10.1021/acs.jnatprod.6b01156J. Nat. Prod. 2017, 80, 1457−1466
1462

across all samples to describe the metabolite profile (Figure S2,Supporting Information).When compared to the PCA plot obtained from untargeted
mass spectrometry data (Figure 1), the NMR spectroscopicresults (Figure 6) displayed similar trends in clustering teasamples. In both score plots, separation was observed betweengreen tea samples and the negative control (T23), although inthe 1H NMR PCA plot, T23 was visually closer to the boundaryof Hotelling’s confidence ellipse. However, the NMRmetabolomics data displayed more overlap between green teasupplement samples and loose leaf tea and powdered teasamples (Figure 6) than was observed for the untargeted massspectrometry data (Figure 1). The overlap was due to thedispersal of variables along PC1; the variables were notclustered as cleanly as they were in the untargeted massspectrometry analysis (Figure 1). This suggests that the spectralbins containing overlapping information lowered discriminationbetween tea samples. However, a higher field instrument usinga cryoprobe has improved resolution. Using such an instrument(as was achieved by Yuk et al., 2013) could provide betterdiscrimination between green teas and improve the overallmetabolomics analysis.48
Comparison of Similarity Using a Reduced Correla-tion Matrix. One of the potential criticisms of usingunsupervised statistical methods, such as PCA, to evaluatesimilarity between samples is the reduction of the model toonly two dimensions (i.e., PC1 vs PC2), which inherently limitsthe analysis. For the green tea untargeted approach, PC1 andPC2 represented 60% of the total variation in the sample (38%and 22%, respectively). This has been observed in othermetabolomics studies, where the principal components used forvisual discrimination represented only a fraction of the totalvariation present in the samples.26,31,40
To address the limitations of using only two principalcomponents to describe the variability in the data set, a“reproduced correlation matrix” (Figure 7) was calculated,which is based on four principal components and is calculatedaccording to eq 4. Collectively, the four components used togenerate the data in Figure 7 encapsulate 84% of the variationin the metabolomics data. The reproduced correlation matrix isa simple and useful way to compare differences among samplesin a complex metabolomics data set. The values in the matrixrange from −1.0 to 1.0, and it is possible, by selecting therelevant correlation value in the matrix, to obtain a quantitativemeasure of the similarity between any two samples in the dataset (Table S5, Supporting Information). For example, the dataset could be used to select a commercial sample that is similarto the NIST loose leaf standard (T26). Samples T02, T13, T21,and T22, which demonstrate correlations with T26 of 0.974,0.983, 0.990, and 0.997, respectively, might be good choices.Conversely, the “superantioxidant” botanical-containing greentea T24, which shows a correlation of −0.029, is, based on themetabolomics data, less similar to the NIST standard.This study demonstrates the utility of untargeted mass
spectrometry-based metabolomics to effectively discriminatebetween multiple classes of green tea products. Chemometricanalysis using an untargeted metabolomics profiling was moreeffective in clustering loose leaf green teas from green teasupplements compared to targeted mass spectrometry analysisor 1H NMR metabolomics.Previous green tea studies highlight the benefits of using
NMR spectroscopy to study metabolomic differences, giventhat this method can detect all 1H-containing species in asample, including phytochemical compounds that could bedifficult to analyze via mass spectrometry.27,33,49 One widelyaccepted limitation of MS has been the nonuniversality ofnatural product ionization; the utilization of both positive and
Figure 7. Heat map correlation matrix for green tea samples. Correlation was based upon the averaged metabolomic profile for each sample andcalculated from the reproduced correlation coefficient matrix comprised of a four principal component model (Table S5, Supporting Information).Darker shades represent stronger correlation between samples. #Negative control; ‡NIST standard reference materials; §green teas with botanicaladditives.
Journal of Natural Products Article
DOI: 10.1021/acs.jnatprod.6b01156J. Nat. Prod. 2017, 80, 1457−1466
1463

negative modes in this study resulted in a wider range ofmetabolites detected and used in the overall metabolomicanalysis. For the samples evaluated, the UPLC-MS data weremore useful for distinguishing various sample types (i.e.,supplement versus tea) than NMR-based metabolomicsanalysis. The improved performance of mass spectrometry-based metabolomics as compared to NMR-based metabolomicscan be attributed to the ease with which mass spectrometry canbe coupled to separation methods (liquid or gas chromatog-raphy), which provide another dimension of separation in thedata. In addition, mass spectrometry is a far more sensitivetechnique than NMR spectroscopy, with limits of detection inthe pM to nM range.24,31,36 In contrast, NMR analysis is limitedto the more abundant metabolites, which may or may not bethe most relevant with respect to bioactivity.50 Other studieshave also demonstrated the improved ability of massspectrometry to differentiate complex supplement productsdue to higher sensitivity.51 Despite the somewhat superior dataobtained here with mass spectrometric analysis as compared toNMR spectroscopy, results from the current work suggest thateither NMR or MS could be effective methods to aid inselection of complex natural products or botanical products.Analyzing similarity and variation from a range of commercial
products remains a challenge when the study material is acomplex natural product or botanical sample.1 Green teaproducts, like other complex botanical preparations, contain awide variety of bioactive secondary metabolites, which varyconsiderably depending on the cultivar used, geography,processing, and formulation.52 The results illustrate theusefulness of untargeted metabolomics to obtain a snapshotof this variability. Information obtained by metabolomicsanalysis could be employed to make an informed opinion asto which products are most representative of those used byconsumers or to identify outliers in a data set. Comparison ofthe data in Figure 1 (PCA based on metabolite profile) andFigure 5 (PCA based solely on representative markercompounds) indicates the advantage of making such decisionsusing metabolomics information rather than data for selectedmarker compounds. The marker compounds represent only asubset of the chemical diversity of the samples; thus, one mightpresume (incorrectly) based on the marker compound data thatsamples are chemically similar, when in fact importantdifferences exist. Specific to the test case under investigationhere, based on the PCA of complex metabolomics data (Figure1), it is clear that the chemical makeup of green teasupplements is different from that of powdered or whole leaftea samples. If one conducted the comparison among samplesusing exclusively marker compound data (Figure 5), thesedifferences might have been overlooked. Such an oversightcould have important ramifications for future studies, given thatdifferences in the chemistry of tea versus supplement samplescould lead to different results in in vitro or clinical studies.The need to ascertain similarity and variability has numerous
applications in natural products research, whether it is tomonitor quality control of products for adulteration,53,54
authenticate botanical samples,55 or select samples for furtherin vitro or in vivo studies. The chemometric approachdescribed herein (untargeted mass spectrometric analysiscoupled with reproduced data matrix calculation) has thepotential to provide a wealth of data for comparisons ofmultiple, complex data sets. One of the challenges of usingmetabolite profiles to characterize similarities and differencesamong samples is handling the magnitude and complexity of
the data that are generated with such analyses. The bottleneckfor metabolomics experiments tends not to be in the datacollection, but in meaningful data interpretation. An importantcontribution of this study is the application of the reproducedcorrelation coefficient matrix as a simple metric for measuringthe similarity between multiple samples in a complex data setbased on the whole metabolite prof ile. The reproducedcorrelation coefficient is a single value that incorporatesmultiple PCA model components and provides a usefulalternative to visual inspection for comparing samples in aPCA plot.
■ EXPERIMENTAL SECTIONChemicals. Unless otherwise noted, all chemicals were of reagent
or spectroscopic grade and obtained from Fisher Scientific (Waltham,MA, USA).
Green Tea Product Selection. Green tea products were selectedusing readily available consumer sales reports37 and product qualityreports.38,39 The 34 products included 21 whole-leaf teas, six powders,and seven supplements (Table S1, Supporting Information) and wereeach coded with a T number. A single non-green tea (turmeric−gingertea) was included as a negative control (T23), and Camellia sinensisstandard reference materials from NIST for loose leaf tea (T26),supplement (T27), and oral dosage form (T37) (nos. 3254, 3255, and3256, respectively) served as positive controls (Table S1, SupportingInformation). Two green teas that contained other botanical additiveswere also selected for comparison (T24 and T38). A retention sampleof each product, containing several grams of material, was maintainedin the lab for future reference.
Green Tea Product Extraction and Isolation. Green teaproducts were extracted in triplicate via a hot water or methanolextraction procedure. For the hot water procedure, 200 mg of sampleand 20 mL of water were added to a 20 mL scintillation vial andheated to 90 °C. The mixture was stirred in a hot water bath for 5 min,after which the suspension was immediately filtered and cooled toroom temperature. Each sample was lyophilized and stored at −80 °Cuntil analysis. Sample extractions in methanol were performed in thesame 10:1 ratio as the hot water extracts. Thus, to each 200 mg teasample was added 20 mL of reagent-grade methanol, and the mixtureswere shaken overnight at room temperature, filtered, and dried underreduced pressure. NMR and MS analyses were conducted upon thesesamples in triplicate.
1H NMR Analysis. NMR spectra were acquired with a JEOL ECA-400 NMR spectrometer (400 MHz, JEOL Ltd., Tokyo, Japan)equipped with a high-sensitivity JEOL Royal probe and a 24-slotautosampler. NMR chemical shift values were referenced to residualsolvent signals for CD3OD (δH 3.31 ppm). To collect 1H NMR data,each sample was resuspended in CD3OD (Cambridge IsotopeLaboratories, Andover, MA, USA) to a concentration of 10 mg/mL.
Mass Spectrometry Analysis. Ultraperformance (UP) LC-MSdata were acquired using a Q Exactive Plus quadrupole-orbitrap massspectrometer (Thermo Scientific, Waltham, MA, USA) with anelectrospray ionization source coupled to an Acquity UPLC system(Waters, Milford, MA, USA). Before UPLC-MS analysis, each samplewas resuspended in methanol to yield a concentration of 1 mg/mL.Triplicate injections of 3 μL were then performed. Samples wereeluted from the column (Acquity UPLC BEH C18 1.7 μm, 2.1 × 50mm, Waters) at a flow rate of 0.3 mL/min using the following binarygradient, with solvent A consisting of H2O (0.1% formic acid added)and solvent B consisting of CH3CN (0.1% formic acid added): initialisocratic composition of 95:5 (A:B) for 1.0 min, increasing linearly to0:100 over 20 min, followed by an isocratic hold at 0:100 for 1 min,gradient returned to starting conditions of 95:5 for 2 min, and heldisocratic again for 1 min. The mass spectrometer was operated in thepositive/negative switching ionization mode over a full scan range ofm/z 150−2000 with the following settings: capillary voltage, 5 V;capillary temperature, 300 °C; tube lens offset, 35 V; spray voltage,
Journal of Natural Products Article
DOI: 10.1021/acs.jnatprod.6b01156J. Nat. Prod. 2017, 80, 1457−1466
1464

3.80 kV; sheath gas flow and auxiliary gas flow, 35 and 20 arbitraryunits, respectively.Metabolite Quantification. Quantification of the major catechin,
phenolic acid, and flavonoid components of the green tea productsused 15 calibration standards obtained from Chromadex (Irvine, CA,USA) (Table S2, Supporting Information). LC-MS analysis wasconducted as described above. Standards were prepared inspectrometric-grade MeOH and diluted in a 2-fold dilution seriesranging from 0.1 to 200 μg/mL before injection. A calibration curvewas constructed by plotting the area of the selected ion chromatogramfor each standard versus nominal concentration. Concentrations ofeach standard in the extracts were determined by 1/x2 weighted least-squares linear regression.Chemometric Analysis. Chemometric analysis was conducted
using a slightly modified version of a previously reported method.56
Both the untargeted and targeted UPLC-MS data sets for each samplewere individually analyzed, aligned, and filtered with MZmine 2.20software (http://mzmine.sourceforge.net/).57 Peak detection inMZmine was achieved using the following parameters for peakdetection: noise level (absolute value), 5 × 10⁵ counts; minimum peakduration, 0.05 min; tolerance for m/z variation, 0.05; and tolerance form/z intensity variation, 20%. Deisotoping, peak list filtering, andretention time alignment algorithm packages were used to refine peakdetection. Finally, the join algorithm integrated all metabolomicprofiles into a single data matrix using the following parameters: thebalance between m/z and retention time was set at 10.0 each, m/ztolerance was set at 0.001, and retention time tolerance size wasdefined as 0.5 min. The spectral data matrix was exported for analysis,both as a set of peak areas for individual ions detected in triplicateextractions and the average peak areas for the triplicate extractions.Throughout the MZmine data processing steps, samples that did notpossess a particular marker ion were coded with a peak area of 0, tomaintain the same number of variables for all data sets. Chemometricanalysis was performed on the data sets (both the individual triplicatedata and the average of the triplicates for each sample) using Siriusversion 9.0 (Pattern Recognition Systems AS, Bergen, Norway).58
Initially, transformation from heteroscedastic to homoscedastic noisewas carried out by a fourth root transform of the spectral variables.59
Principal component analysis was used to provide unsupervisedstatistical analysis of the green tea samples.Correlation coefficients (r) were calculated from principal
component models and used to indicate similarity between samples.A data matrix X can be decomposed into the sum of the mean valuesof the variables (X), the data estimated from principal componentsrepresenting the major variation in X (XPCA), and residual data (noiseand other sources of small variation, EPCA) (eq 1).
= + + EX X XPCA PCA (1)
The product of the estimated PCA matrix and its transpose (XPCAT )
divided by the norm of the two matrices yields a reproducedcorrelation coefficient matrix that can be used for comparison betweenvariables (eq 2) or objects (samples) (eq 3):
X X X X/PCAT
PCA PCAT
PCA (2)
X X X X/PCA PCAT
PCA PCAT
(3)
Thus, the reproduced correlation coefficient between each pair ofvariables (eq 2) or objects (eq 3) can be determined from the scalarproduct divided by the norm of the vectors (XPCA) (eq 4). Thus, forany two objects, R and S,
= · r x x x x/PCAT
PCA PCA PCAO S O S (4)
Equation 4 provides a correlation coefficient that describes theextent to which a given sample (in the present case, a green teaextract) correlates with any other sample in the data set after removingnoise and other sources of small variation from the data. Coefficientvalues closer to 1 demonstrate a stronger correlation (i.e., greatersimilarity) between the two samples. This calculation was performed
in Excel (Microsoft, Redmond, WA, USA), using the PCA loading andscore information obtained from the Sirius software output.
For NMR-based metabolomics, NMR spectra were processed usingMnova (Mestrelab Research, Santiago de Compostela, Spain) withexponential apodization (exponent 1); global phase correction;Bernstein-Polynomial baseline correction; Savitzky−Golay linesmoothing; and normalization using total spectral area as providedin Mnova. Spectral regions from 0.5 to 8 ppm were included in thenormalization and analysis. The NMR spectra of all the green teasamples were binned by 0.05 ppm. The narrow bin size allowed detailsto be revealed and provided much information on low-intensitypeaks.60 In this data set, each bin was considered to be one variable.Binned data were used to conduct PCA using the Sirius software.
■ ASSOCIATED CONTENT*S Supporting InformationThe Supporting Information is available free of charge on theACS Publications website at DOI: 10.1021/acs.jnat-prod.6b01156.
Additional information (PDF)
■ AUTHOR INFORMATIONCorresponding Author*Tel (N. B. Cech): 336-334-3017. Fax: 336-334-5402. E-mail:[email protected] J. Kellogg: 0000-0001-8685-0353Nicholas H. Oberlies: 0000-0002-0354-8464NotesThe authors declare no competing financial interest.
■ ACKNOWLEDGMENTSThis project was supported by the National Institutes of HealthNational Center for Complementary and Integrative Health,specifically the Center of Excellence for Natural Product DrugInteraction Research (NaPDI, U54 AT008909). We thank Dr.D. C. Hopp, NIH Program Officer, and Dr. D. D. Shen,Professor of Pharmaceutics at the University of Washington, forhelpful discussions. The high-resolution mass spectrometrydata were collected at the Triad Mass Spectrometry Facility atthe University of North Carolina at Greensboro.
■ REFERENCES(1) Klein, M. A.; Nahin, R. L.; Messina, M. J.; Rader, J. I.; Thompson,L. U.; Badger, T. M.; Dwyer, J. T.; Kim, Y. S.; Pontzer, C. H.; Starke-Reed, P. E.; Weaver, C. M. J. Nutr. 2010, 140, 1192S−1204S.(2) Coutinho Moraes, D. F.; Still, D. W.; Lum, M. R.; Hirsch, A. M.Planta Med. 2015, 81, 687−695.(3) Reddy, K. R.; Belle, S. H.; Fried, M. W.; Afdhal, N.; Navarro, V.J.; Hawke, R. L.; Wahed, A. S.; Doo, E.; Meyers, C. M. Clin. Trials2012, 9, 102−112.(4) Center for Drug Evaluation and Research. Botanical DrugDevelopment: Guidance for Industry; U.S. Department of Health andHuman Services, 2015.(5) Cabrera, C.; Artacho, R.; Gimenez, R. J. Am. Coll. Nutr. 2006, 25,79−99.(6) Smith, T.; Kawa, K.; Eckl, V.; Johnson, J. Herbalgram 2016, 111,67−73.(7) Bogdanski, P.; Suliburska, J.; Szulinska, M.; Stepien, M.; Pupek-Musialik, D.; Jablecka, A. Nutr. Res. (N. Y., NY, U. S.) 2012, 32, 421−427.(8) Hsieh, S.-R.; Hsu, C.-S.; Lu, C.-H.; Chen, W.-C.; Chiu, C.-H.;Liou, Y.-M. J. Biomed. Sci. 2013, 20, 86.(9) Patel, S. Food Sci. Technol. Res. 2013, 19, 923−932.
Journal of Natural Products Article
DOI: 10.1021/acs.jnatprod.6b01156J. Nat. Prod. 2017, 80, 1457−1466
1465

(10) Liu, K.; Zhou, R.; Wang, B.; Chen, K.; Shi, L. Y.; Zhu, J. D.; Mi,M. T. Am. J. Clin. Nutr. 2013, 98, 340−348.(11) Peng, X.; Zhou, R.; Wang, B.; Yu, X.; Yang, X.; Liu, K.; Mi, M.T. Sci. Rep. 2014, 4, 6251.(12) Zheng, X. X.; Xu, Y. L.; Li, S. H.; Hui, R.; Wu, Y. J.; Huang, X.H. Am. J. Clin. Nutr. 2013, 97, 750−762.(13) Graham, H. N. Prev. Med. 1992, 21, 334−350.(14) Dwyer, J. T.; Peterson, J. Am. J. Clin. Nutr. 2013, 98, 1611S−1618S.(15) Coxon, D. T.; Holmes, A.; Ollis, W. D.; Vora, V. C.; Grant, M.S.; Tee, J. L. Tetrahedron 1972, 28, 2819−2826.(16) Wang, D.; Lu, J.; Miao, A.; Xie, Z.; Yang, D. J. Food Compos.Anal. 2008, 21, 361−369.(17) Jun, X.; Deji, S.; Ye, L.; Rui, Z. Int. J. Pharm. 2011, 408, 97−101.(18) Rusak, G.; Komes, D.; Likic, S.; Horzic, D.; Kovac, M. FoodChem. 2008, 110, 852−858.(19) Balentine, D. A.; Dwyer, J. T.; Erdman, J. W., Jr.; Ferruzzi, M.G.; Gaine, C.; Harnly, J. M.; Kwik-Uribe, C. L. Am. J. Clin. Nutr. 2015,101, 1113−1125.(20) Sreekumar, A.; Poisson, L. M.; Rajendiran, T. M.; Khan, A. P.;Cao, Q.; Yu, J.; Laxman, B.; Mehra, R.; Lonigro, R. J.; Li, Y.; Nyati, M.K.; Ahsan, A.; Kalyana-Sundaram, S.; Han, B.; Cao, X.; Byun, J.;Omenn, G. S.; Ghosh, D.; Pennathur, S.; Alexander, D. C.; Berger, A.;Shuster, J. R.; Wei, J. T.; Varambally, S.; Beecher, C.; Chinnaiyan, A.M. Nature 2009, 457, 910−914.(21) Clayton, T. A.; Lindon, J. C.; Cloarec, O.; Antti, H.; Charuel, C.;Hanton, G.; Provost, J. P.; Le Net, J. L.; Baker, D.; Walley, R. J.;Everett, J. R.; Nicholson, J. K. Nature 2006, 440, 1073−1077.(22) Cotton, J.; Leroux, F.; Broudin, S.; Marie, M.; Corman, B.;Tabet, J.-C.; Ducruix, C.; Junot, C. J. Agric. Food Chem. 2014, 62,11335−11345.(23) Krug, D.; Muller, R. Nat. Prod. Rep. 2014, 31, 768−783.(24) Simmler, C.; Kulakowski, D.; Lankin, D. C.; McAlpine, J. B.;Chen, S. N.; Pauli, G. F. Adv. Nutr. 2016, 7, 179−189.(25) Oliver, S. G.; Winson, M. K.; Kell, D. B.; Baganz, F. TrendsBiotechnol. 1998, 16, 373−378.(26) Ku, K. M.; Choi, J. N.; Kim, J.; Kim, J. K.; Yoo, L. G.; Lee, S. J.;Hong, Y.-S.; Lee, C. H. J. Agric. Food Chem. 2010, 58, 418−426.(27) Lee, J.-E.; Lee, B.-J.; Chung, J.-O.; Hwang, J.-A.; Lee, S.-J.; Lee,C.-H.; Hong, Y.-S. J. Agric. Food Chem. 2010, 58, 10582−10589.(28) Lee, J.-E.; Lee, B.-J.; Chung, J.-O.; Kim, H. N.; Kim, E.-H.; Jung,S.; Lee, H.; Lee, S. J.; Hong, Y.-S. Food Chem. 2015, 174, 452−459.(29) Zhang, A.; Sun, H.; Wang, P.; Han, Y.; Wang, X. Analyst 2012,137, 293−300.(30) Scalbert, A.; Brennan, L.; Manach, C.; Andres-Lacueva, C.;Dragsted, L. O.; Draper, J.; Rappaport, S. M.; van der Hooft, J. J. J.;Wishart, D. S. Am. J. Clin. Nutr. 2014, 99, 1286−1308.(31) Fujimura, Y.; Kurihara, K.; Ida, M.; Kosaka, R.; Miura, D.;Wariishi, H.; Maeda-Yamamoto, M.; Nesumi, A.; Saito, T.; Kanda, T.;Yamada, K.; Tachibana, H. PLoS One 2011, 6, e23426.(32) Cech, N. B.; Yu, K. LCGC North America 2013, 31, 938−947.(33) Lee, J.-E.; Lee, B.-J.; Hwang, J.-A.; Ko, K.-S.; Chung, J.-O.; Kim,E.-H.; Lee, S.-J.; Hong, Y.-S. J. Agric. Food Chem. 2011, 59, 10579−10585.(34) Machado, F. L. S.; Duarte, H. M.; Gestinari, L. M. S.; Cassano,V.; Kaiser, C. R.; Soares, A. R. Chem. Biodiversity 2016, 13, 845−851.(35) Siheri, W.; Zhang, T.; Ebiloma, G. U.; Biddau, M.; Woods, N.;Hussain, M. Y.; Clements, C. J.; Fearnley, J.; Ebel, R. E.; Paget, T.;Muller, S.; Carter, K. C.; Ferro, V. A.; De Koning, H. P.; Watson, D. G.PLoS One 2016, 11, 1−16.(36) Mushtaq, M. Y.; Choi, Y. H.; Verpoorte, R.; Wilson, E. G.Phytochem. Anal. 2014, 25, 291−306.(37) Amazon.com Amazon Best Sellers. http://www.amazon.com/Best-Sellers-Grocery-Gourmet-Food-Green-Tea-Beverages/zgbs/grocery/16318471 (November 11, 2015),.(38) Anonymous. Consum. Rep. 2003, 68, 40−43.(39) Health, J. Green Tea Supplement Reviews. http://www.benefitsofgreentea.info/2007/green-tea-supplement-reviews.php (No-vember 11, 2015).
(40) Ku, K. M.; Kim, J.; Park, H. J.; Liu, K. H.; Lee, C. H. J. Agric.Food Chem. 2010, 58, 345−352.(41) Lee, L.-S.; Choi, J. H.; Son, N.; Kim, S.-H.; Park, J.-D.; Jang, D.-J.; Jeong, Y.; Kim, H.-J. J. Agric. Food Chem. 2013, 61, 332−338.(42) Sang, S.; Lee, M.-H.; Ho, C.-T.; Yang, C. S. J. Agric. Food Chem.2005, 53, 9478−9484.(43) Nishimura, M.; Ishiyama, K.; Watanabe, A.; Kawano, S.; Miyase,T.; Sano, M. J. Agric. Food Chem. 2007, 55, 7252−7257.(44) Yokozawa, T.; Nakagawa, T. Food Chem. Toxicol. 2004, 42,975−981.(45) National Institute of Standards and Technology, StandardReference Material 3254, Certificate of Analysis. In 2016.(46) Rothwell, J. A.; Perez-Jimenez, J.; Neveu, V.; Medina-Ramon, A.;M’Hiri, N.; Garcia Lobato, P.; Manach, C.; Knox, K.; Eisner, R.;Wishart, D.; Scalbert, A. Database 2013, 2013, bat070.(47) Zhao, Y.; Chen, P.; Lin, L.; Harnly, J. M.; Liangli, Y.; Li, Z. FoodChem. 2011, 126, 1269−1277.(48) Yuk, J.; McIntyre, K. L.; Fischer, C.; Hicks, J.; Colson, K. L.; Lui,E.; Brown, D.; Arnason, J. T. Anal. Bioanal. Chem. 2013, 405, 4499−4509.(49) Lee, J.-E.; Lee, B.-J.; Chung, J.-O.; Shin, H.-J.; Lee, S.-J.; Lee, C.-H.; Hong, Y.-S. Food Res. Int. 2011, 44, 597−604.(50) Farag, M. A.; Porzel, A.; Al-Hammady, M. A.; Hegazy, M.-E. F.;Meyer, A.; Mohamed, T. A.; Westphal, H.; Wessjohann, L. A. J.Proteome Res. 2016, 15, 1274−1287.(51) Farag, M. A.; Porzel, A.; Wessjohann, L. A. Phytochemistry 2012,76, 60−72.(52) Saldanha, L.; Dwyer, J. T.; Andrews, K.; Betz, J.; Harnly, J.;Pehrsson, P.; Rimmer, C.; Savarala, S. J. Food Sci. 2015, 80, H883−H888.(53) Bajpai, V.; Singh, A.; Arya, K. R.; Srivastava, M.; Kumar, B. FoodAddit. Contam., Part A 2015, 32, 799−807.(54) Rocha, T.; Amaral, J. S.; Oliveira, M. B. P. P. Compr. Rev. FoodSci. Food Saf. 2016, 15, 43−62.(55) Yuk, J.; Patel, D. N.; Isaac, G.; Smith, K.; Wrona, M.; Olivos, H.J.; Yu, K. J. Braz. Chem. Soc. 2016, 27, 1476−1483.(56) Kellogg, J. J.; Todd, D. A.; Egan, J. M.; Raja, H. A.; Oberlies, N.H.; Kvalheim, O. M.; Cech, N. B. J. Nat. Prod. 2016, 79, 376−386.(57) Pluskal, T.; Castillo, S.; Villar-Briones, A.; Oresic, M. BMCBioinf. 2010, 11, 395.(58) Kvalheim, O. M.; Chan, H. Y.; Benzie, I. F. F.; Szeto, Y. T.;Tzang, A. H.; Mok, D. K.; Chau, F. Chemom. Intell. Lab. Syst. 2011,107, 98−105.(59) Kvalheim, O. M.; Brakstad, F.; Liang, Y. Anal. Chem. 1994, 66,43−51.(60) Bingol, K.; Bruschweiler, R. Anal. Chem. 2014, 86, 47−57.
Journal of Natural Products Article
DOI: 10.1021/acs.jnatprod.6b01156J. Nat. Prod. 2017, 80, 1457−1466
1466

1
SUPPORTING INFORMATION
Comparison of Metabolomics Approaches for Evaluating the Variability of
Complex Botanical Preparations: Green Tea (Camellia sinensis) as a Case Study
Joshua J. Kellogg, † Tyler N. Graf, † Mary F. Paine, ‡ Jeannine S. McCune, § Olav M. Kvalheim,┴
Nicholas H. Oberlies, † and Nadja B. Cech†*
† Department of Chemistry & Biochemistry, University of North Carolina at Greensboro, Greensboro,
North Carolina 27412, United States
‡ College of Pharmacy, Washington State University, Spokane, Washington 99202, United States
§ Department of Pharmaceutics, University of Washington, Seattle, Washington 99202, United States
┴ Department of Chemistry, University of Bergen, Bergen 5020, Norway
2
CONTENTS
Table S1. Selection and coding of commercial green tea products under investigation
Table S2. Green tea standards used in the quantification of green tea samples.
Table S3. Quantification of green tea standards in green tea methanol extract samples.
Table S4. Quantified constituents from NIST green tea leaf reference material (no. 3254).
Table S5. Correlation matrix for green tea samples.
Figure S1. Comparison of quantities of selected green tea constituents extracted in hot water versus
methanol.
Figure S2. Comparison of 1H NMR spectroscopic profiles from green tea samples.

3
Table S1. Selection and coding of commercial green tea products under investigation.
code product form selection criteriaa
T01 leaf tea consumer sales36 T02 leaf tea quality report37 T03 leaf tea consumer sales36 T04 leaf tea quality report37 T05 leaf tea quality report37 T06 leaf tea quality report37 T07 leaf tea quality report37 T08 leaf tea quality report37 T09 leaf tea quality report37 T10 leaf tea quality report37 T11 powdered tea consumer sales36 T12 powdered tea quality report37 T13 leaf tea quality report37 T14 leaf tea quality report37 T15 tea supplement extract report38 T16 leaf tea quality report37 T17 leaf tea quality report37 T18 leaf tea quality report37 T19 tea supplement extract report38 T20 leaf tea quality report37 T21 leaf tea quality report37 T22 powdered tea quality report37
T23 b leaf tea non-green tea
T24 c leaf tea consumer sales36 T25 tea supplement extract report38
T26 d leaf tea NIST standard
T27 d tea supplement NIST standard
T28 tea supplement extract report38 T29 tea supplement extract report38 T30 powdered tea consumer sales36 T31 powdered tea consumer sales36 T32 powdered tea consumer sales36 T33 leaf tea quality report37 T34 leaf tea quality report37 T35 tea supplement extract report38 T36 tea supplement extract report38
T37 d tea supplement NIST standard
T38 c leaf tea consumer sales36 a Selection criteria represent the basis for which the product was included in the dataset (quality report37, green tea extract consumer report,38 consumer sales report,36). b Non-green tea negative control. c Green teas with botanical additives that served as partial negative controls. d NIST standard reference materials positive controls.

4
Table S1. Green tea standards used in the quantification of green tea samples described in Table 1.
standard compound
class formula [M+H]+ [M-H]- calibration equation R2
1 caffeic acid phenolic acid C9H8O4 181.0501 179.0344 y=2.36×10⁸x+4.5×10⁵ 0.9988 2 caffeine purine alkaloid C8H10N4O2 195.0883 193.0726 y=3.03×10⁸x+6.4×10⁵ 0.9973 3 (+)-catechin catechin C15H14O6 291.0869 289.0712 y=6.50×10⁷x+3.5×10⁵ 0.9925 4 chlorogenic acid phenolic acid C16H18O9 355.1029 353.0872 y=1.31×10⁸x+5.4×10⁵ 0.9999 5 coumaric acid phenolic acid C9H8O3 165.0552 163.0395 y=8.44×10⁷x+2.1×10⁵ 0.9969
6 (-)-epicatechin catechin C15H14O6 291.0869 289.0712 y=7.48×10⁷x+1.6×10⁵ 0.9971 7 (-)-epicatechin gallate catechin C22H18O10 443.0978 441.0821 y=5.75×10⁷x+1.6×10⁵ 0.9951 8 (-)-epigallocatechin catechin C15H14O7 307.0818 305.0661 y=6.55×10⁷x+1.9×10⁵ 0.9945
9 (-)-epigallocatechin
gallate catechin C22H18O11 459.0927 457.077 y=5.46×10⁷x+2.8×10⁵ 0.9998
10 gallic acid phenolic acid C7H6O5 171.0294 169.0137 y=1.64×10⁸x+4.2×10⁵ 0.9960 11 (-)-gallocatechin catechin C15H14O7 307.0818 305.0661 y=8.50×10⁷x+5.2×10⁵ 0.9977 12 kaempferol flavonol C15H14O7 287.0556 285.0399 y=1.59×10⁸x+4.3×10⁵ 0.9957 13 myricetin flavonol C22H18O11 319.0454 317.0297 y=2.78×10⁷x+8.8×10⁵ 0.9949 14 quercetin flavonol C15H10O6 303.0505 301.0348 y=4.43×10⁷x+1.5×10⁵ 0.9970 15 rutin flavonol C15H10O8 611.1612 609.1455 y=8.69×10⁶x+2.0×10⁵ 0.9966 16 theanine amino acid C15H10O7 175.1083 173.0926 y=3.05×10⁸x+1.0×10⁵ 0.9992
1 2 3
4 5 6
7 8 9

5
10 11 12
13 14
15 16

6
Table S2. Quantification of green tea standards in green tea methanol extract samples. Values given in µg/mL extract and represent the mean ± SD of triplicate extractions. ND, not detected; # non-green tea negative control; ‡ NIST, standard reference material positive controls; § green teas with botanical additives.
sample caffeic acid caffeine catechin chlorogenic acid coumaric acid epicatechin epicatechin
gallate epigallocatechin
T01 0.0358 ± 0.0069 50.5 ± 1.2 0.966 ± 0.013 1.171 ± 0.036 0.0126 ± 0.0011 18.74 ± 0.49 28.10 ± 0.73 81.8 ± 1.6 T02 0.0185 ± 0.0042 61.5 ± 1.0 0.641 ± 0.021 0.27 ± 0.12 0.0959 ± 0.0037 9.66 ± 0.13 26.92 ± 0.38 38.4 ± 1.0 T03 0.0144 ± 0.0032 78.6 ± 5.1 1.481 ± 0.074 37.9 ± 1.9 0.0398 ± 0.0022 11.10 ± 0.65 50.76 ± 2.16 57.1 ± 4.2 T04 0.04515 ± 0.00052 73.5 ± 1.1 0.745 ± 0.022 17.66 ± 0.26 0.0637 ± 0.0054 12.98 ± 0.31 41.39 ± 0.36 56.33 ± 0.77 T05 0.0568 ± 0.0024 73.00 ± 0.43 0.676 ± 0.018 31.19 ± 0.88 0.0421 ± 0.0060 10.65 ± 0.64 55.21 ± 0.44 55.6 ± 1.5 T06 0.0133 ± 0.0033 53.4 ± 1.8 1.228 ± 0.012 0.338 ± 0.012 0.1152 ± 0.0063 6.40 ± 0.21 19.44 ± 0.22 27.49 ± 0.88 T07 0.0298 ± 0.0039 17.70 ± 0.28 1.275 ± 0.023 0.11 ± 0.41 0.07642 ± 0.00094 13.547 ± 0.049 35.10 ± 0.35 45.3 ± 1.6 T08 0.01813 ± 0.00069 65.01 ± 0.56 1.42 ± 0.17 0.06 ± 0.16 0.08277 ± 0.00091 10.813 ± 0.054 35.44 ± 0.19 48.02 ± 0.43 T09 0.03006 ± 0.00099 58.6 ± 1.1 1.357 ± 0.079 0.024 ± 0.092 0.0079 ± 0.0015 17.06 ± 0.96 33.57 ± 0.76 72.0 ± 1.9 T10 0.0301 ± 0.0041 67.1 ± 1.7 1.198 ± 0.043 0.578 ± 0.059 0.0142 ± 0.0027 14.81 ± 0.74 32.32 ± 0.76 64.52 ± 0.42 T11 0.02323 ± 0.00084 53.622 ± 0.062 0.997 ± 0.052 0.446 ± 0.042 0.0228 ± 0.0022 13.485 ± 0.021 30.04 ± 0.16 56.91 ± 0.79 T12 0.02452 ± 0.00084 66.6 ± 2.1 1.109 ± 0.065 0.32 ± 0.13 0.0164 ± 0.0022 9.46 ± 0.17 31.97 ± 0.92 44.07 ± 0.77 T13 0.0641 ± 0.0052 91.39 ± 2.74 1.298 ± 0.031 1.19 ± 0.20 0.1386 ± 0.0081 7.47 ± 0.71 32.86 ± 1.90 39.2 ± 2.9 T14 0.0139 ± 0.0023 18.20 ± 0.64 1.025 ± 0.064 0.617 ± 0.086 0.0843 ± 0.0028 7.45 ± 0.22 20.43 ± 0.40 27.6 ± 1.0 T15 0.01378 ± 0.0022 7.364 ± 0.083 1.3548 ± 0.0054 1.368 ± 0.035 0.2851 ± 0.0041 10.46 ± 0.11 67.90 ± 0.48 53.22 ± 0.42 T16 0.01866 ± 0.00084 57.27 ± 0.61 1.0816 ± 0.0053 0.026 ± 0.088 0.0499 ± 0.0023 13.89 ± 0.29 31.73 ± 0.59 48.32 ± 0.62 T17 0.0373 ± 0.0053 74.3 ± 1.7 1.706 ± 0.096 1.71 ± 0.10 0.1228 ± 0.0039 13.603 ± 0.089 30.50 ± 0.50 61.82 ± 0.95 T18 0.0192 ± 0.0039 88.92 ± 0.82 1.3479 ± 0.0024 1.80 ± 0.054 0.0865 ± 0.0028 6.76 ± 0.18 45.03 ± 0.81 37.39 ± 0.59 T19 0.046 ± 0.011 75.4 ± 1.1 0.946 ± 0.016 0.744 ± 0.075 0.168 ± 0.020 16.32 ± 0.29 25.67 ± 0.51 75.0 ± 1.2 T20 0.0275 ± 0.0011 66.2 ± 1.4 0.747 ± 0.071 0.077 ± 0.082 0.0323 ± 0.0017 14.62 ± 0.26 36.63 ± 0.55 58.84 ± 0.54 T21 0.03393 ± 0.00051 72.6 ± 2.0 1.046 ± 0.011 1.62 ± 0.17 0.06052 ± 0.00072 12.30 ± 0.10 36.09 ± 1.38 55.18 ± 0.60 T22 0.0256 ± 0.0012 65.84 ± 0.70 1.632 ± 0.029 1.141 ± 0.015 0.02691 ± 0.00037 10.65 ± 0.13 33.79 ± 0.77 43.93 ± 1.92 T23 0.028 ± 0.011 0.037 ± 0.011 1.365 ± 0.041 4.62 ± 0.92 1.27 ± 0.19 1.4169 ± 0.0045 1.6334 ± 0.0073 1.4127 ± 0.0033 T24 0.0638 ± 0.0053 41.9 ± 1.9 1.065 ± 0.013 12.57 ± 0.85 0.446 ± 0.020 9.4 ± 1.0 27.1 ± 1.0 14.97 ± 0.97 T25 0.04754 ± 0.00037 93.8 ± 1.5 0.94 ± 0.10 2.929 ± 0.098 0.093 ± 0.011 11.45 ± 0.10 21.95 ± 0.55 66.19 ± 0.36 T26 0.02867 ± 0.00027 69.48 ± 0.52 1.145 ± 0.012 0.090 ± 0.051 0.0762 ± 0.0033 12.75 ± 0.20 35.56 ± 0.35 44.7 ± 1.1 T27 0.028 ± 0.014 39.67 ± 0.62 1.411 ± 0.021 1.5843 ± 0.0089 0.2674 ± 0.0020 14.11 ± 0.21 63.7 ± 1.9 41.6 ± 9.5 T28 0.0516 ± 0.0022 41.33 ± 15.88 0.989 ± 0.025 3.26 ± 0.18 0.338 ± 0.011 11.1 ± 4.8 25 ± 13 39 ± 15 T29 0.0386 ± 0.0081 51.5 ± 4.4 1.08 ± 0.11 4.7 ± 1.8 0.0551 ± 0.0093 14.2 ± 1.6 14.8 ± 2.8 54.1 ± 3.8 T30 0.0201 ± 0.0028 58.9 ± 2.9 1.50 ± 0.11 0.64 ± 0.38 0.0400 ± 0.0054 9.89 ± 0.25 23.08 ± 0.79 44.49 ± 0.21 T31 0.0226 ± 0.0034 58.1 ± 6.4 1.129 ± 0.021 0.88 ± 0.66 0.0460 ± 0.0107 9.73 ± 0.41 25.42 ± 0.93 39.65 ± 3.45 T32 0.0230 ± 0.0052 38.5 ± 2.8 0.881 ± 0.036 0.17 ± 1.1 0.0280 ± 0.0107 11.0 ± 1.1 27.6 ± 3.4 38.6 ± 9.9 T33 0.0313 ± 0.0029 31.6 ± 7.9 0.676 ± 0.018 1.67 ± 0.83 0.0469 ± 0.0075 13.57 ± 0.79 33.72 ± 0.65 60.1 ± 1.7 T34 0.046 ± 0.010 59 ± 14 1.632 ± 0.029 3.3 ± 1.2 0.044 ± 0.020 15.0 ± 1.1 34.85 ± 1.47 49.6 ± 9.2 T35 0.0636 ± 0.0053 90 ± 18 1.462 ± 0.026 10.7 ± 3.8 0.096 ± 0.012 11.98 ± 0.43 38.13 ± 1.37 26.5 ± 1.5 T36 0.028 ± 0.011 62 ± 14 1.11 ± 0.48 2.1 ± 1.3 0.1123 ± 0.0030 11.29 ± 0.21 38.32 ± 1.40 27.1 ± 5.3 T37 0.0376 ± 0.0021 77 ± 19 0.973 ± 0.041 16 ± 14 0.1013 ± 0.0076 9.97 ± 0.50 28.8 ± 5.0 30.9 ± 4.8 T38 0.0423 ± 0.0058 28.94 ± 0.95 1.0812 ± 0.0053 51.9 ± 1.4 0.0941 ± 0.0026 8.81 ± 0.36 17.2 ± 1.1 23.2 ± 2.8

7
Table S2 (con’t)
sample epigallocatechin
gallate gallic acid gallocatechin kaempferol myrecetin quercetin rutin theanine
T01 59.91 ± 0.26 0.1537 ± 0.0057 7.22 ± 0.38 0.00201 ± 0.00056 0.858 ± 0.034 0.434 ± 0.011 6.34 ± 0.19 12.11 ± 0.38 T02 52.48 ± 0.42 1.96 ± 0.33 3.42 ± 0.31 0.0597 ± 0.0047 0.109 ± 0.048 1.025 ± 0.063 4.98 ± 0.12 9.77 ± 0.31 T03 73.72 ± 3.38 0.87 ± 0.10 5.06 ± 0.45 0.0142 ± 0.0017 0.513 ± 0.232 0.86 ± 0.119 10.59 ± 0.76 9.27 ± 0.45 T04 67.02 ± 0.43 1.365 ± 0.041 4.99 ± 0.40 0.0459 ± 0.0034 0.506 ± 0.071 0.917 ± 0.018 14.131 ± 0.030 14.35 ± 0.40 T05 80.34 ± 1.13 0.54 ± 0.31 4.92 ± 0.10 0.0138 ± 0.0016 0.205 ± 0.058 0.883 ± 0.035 5.72 ± 0.61 9.66 ± 0.10 T06 43.56 ± 0.58 1.834 ± 0.034 2.47 ± 0.06 0.06730 ± 0.00049 0.18 ± 0.05 1.012 ± 0.013 3.26 ± 0.18 5.184 ± 0.056 T07 59.9 ± 2.4 1.416 ± 0.058 4.50 ± 0.47 0.03786 ± 0.00059 0.606 ± 0.066 0.629 ± 0.003 9.02 ± 0.12 12.84 ± 0.47 T08 66.32 ± 0.54 1.288 ± 0.039 4.26 ± 0.49 0.0258 ± 0.0010 0.654 ± 0.019 1.106 ± 0.009 4.85 ± 0.21 3.50 ± 0.49 T09 60.96 ± 0.92 0.221 ± 0.024 6.37 ± 0.11 0.00230 ± 0.00073 0.166 ± 0.057 0.602 ± 0.018 2.64 ± 0.19 4.42 ± 0.11 T10 60.76 ± 0.56 0.3905 ± 0.0024 5.713 ± 0.072 0.0419 ± 0.0062 0.19 ± 0.082 0.365 ± 0.012 4.253 ± 0.087 5.181 ± 0.072 T11 57.95 ± 0.24 0.2281 ± 0.0042 5.042 ± 0.099 0.00510 ± 0.00066 0.321 ± 0.167 0.385 ± 0.004 5.94 ± 0.11 10.040 ± 0.099 T12 58.7 ± 1.1 0.594 ± 0.029 3.92 ± 0.26 0.0119 ± 0.0013 0.097 ± 0.021 0.457 ± 0.018 2.80 ± 0.14 8.61 ± 0.26 T13 63.5 ± 1.2 3.05 ± 0.30 3.49 ± 0.69 0.0440 ± 0.0029 0.207 ± 0.048 1.228 ± 0.064 3.97 ± 0.30 8.11 ± 0.69 T14 42.47 ± 0.61 1.613 ± 0.027 2.48 ± 0.16 0.0391 ± 0.0015 0.184 ± 0.044 0.637 ± 0.009 6.78 ± 0.36 4.05 ± 0.16 T15 98.7 ± 1.4 5.541 ± 0.047 5.0959 ± 0.0089 0.438 ± 0.013 0.205 ± 0.01 5.206 ± 0.136 0.225 ± 0.025 0.0502 ± 0.0010 T16 54.22 ± 0.65 0.937 ± 0.017 4.291 ± 0.045 0.0204 ± 0.0015 0.211 ± 0.013 0.61 ± 0.11 12.27 ± 0.31 5.966 ± 0.045 T17 64.35 ± 0.76 0.818 ± 0.029 5.47 ± 0.33 0.0383 ± 0.0022 0.18 ± 0.068 0.983 ± 0.025 2.276 ± 0.088 13.07 ± 0.33 T18 76.44 ± 2.25 1.469 ± 0.076 3.3 ± 1.2 0.0569 ± 0.0022 0.104 ± 0.069 0.597 ± 0.013 3.55 ± 0.11 11.0 ± 1.2 T19 66.2 ± 1.4 1.38 ± 0.37 6.625 ± 0.091 0.0948 ± 0.0047 0.189 ± 0.114 2.30 ± 0.10 2.20 ± 0.10 2.828 ± 0.092 T20 63.45 ± 0.47 0.5472 ± 0.0054 5.21 ± 0.32 0.01642 ± 0.00065 0.452 ± 0.101 0.617 ± 0.016 6.22 ± 0.14 11.76 ± 0.32 T21 64.96 ± 0.85 0.946 ± 0.028 4.89 ± 0.18 0.0399 ± 0.0062 0.232 ± 0.092 0.49 ± 0.14 6.84 ± 0.13 8.38 ± 0.18 T22 61.1 ± 1.4 0.490 ± 0.022 4.56 ± 0.18 0.01320 ± 0.00084 0.723 ± 0.023 0.0069 ± 0.0021 3.68 ± 0.16 6.98 ± 0.18 T23 1.363 ± 0.016 0.00139 ± 0.0045 0.0610 ± 0.0013 ND ND ND ND 0.01568 ± 0.00096 T24 33.5 ± 1.5 3.55 ± 0.27 1.372 ± 0.16 0.0132 ± 0.0014 0.089 ± 0.02 0.1949 ± 0.0062 5.89 ± 0.55 1.39 ± 0.16 T25 68.36 ± 0.56 2.21 ± 0.49 5.8538 ± 0.0083 0.2518 ± 0.0040 0.904 ± 0.129 2.647 ± 0.041 9.87 ± 0.25 0.7459 ± 0.0082 T26 60.83 ± 0.62 2.609 ± 0.047 3.997 ± 0.010 0.0203 ± 0.0011 0.896 ± 0.056 0.5190 ± 0.0054 4.140 ± 0.084 0.242 ± 0.013 T27 107.8 ± 1.4 2.8064 ± 0.0023 5.1826 ± 0.0023 0.2929 ± 0.0014 0.473 ± 0.042 2.88 ± 0.57 0.440 ± 0.015 0.1453 ± 0.0019 T28 55 ± 24 3.83 ± 0.33 3.49 ± 0.33 2.21 ± 0.49 0.211 ± 0.013 1.79 ± 0.33 1.834 ± 0.034 1.357 ± 0.079 T29 49.47 ± 0.40 3.1 ± 1.1 4.8 ± 1.2 0.192 ± 0.065 0.049 ± 1.158 0.602 ± 0.018 2.8 ± 1.2 1.198 ± 0.043 T30 49.2 ± 1.2 1.086 ± 0.043 3.989 ± 0.090 0.0220 ± 0.0019 0.089 ± 0.09 0.365 ± 0.012 0.201 ± 0.090 6.3 ± 1.8 T31 49.2 ± 1.5 1.02 ± 0.32 4.03 ± 0.32 0.0142 ± 0.0033 0.084 ± 0.315 0.6368 ± 0.0091 0.73 ± 0.32 8.0 ± 1.3 T32 49.4 ± 6.9 0.59 ± 0.33 4.1 ± 0.33 0.0085 ± 0.0039 0.05 ± 0.325 0.983 ± 0.025 1.91 ± 0.33 1.091 ± 0.040 T33 61.4 ± 2.5 0.7 ± 1.2 5.3 ± 1.2 0.0155 ± 0.0039 0.029 ± 1.158 0.6371 ± 0.0091 0.40 ± 0.21 1.02 ± 0.18 T34 60.6 ± 5.2 0.964 ± 0.052 4.403 ± 0.092 0.019 ± 0.012 0.063 ± 0.09 1.025 ± 0.063 0.792 ± 0.090 0.14 ± 0.12 T35 75.1 ± 2.3 2.12 ± 0.32 2.5 ± 0.32 0.079 ± 0.027 0.044 ± 0.003 1.55 ± 0.32 0.41 ± 0.12 2.26 ± 0.26 T36 74.5 ± 4.3 5.8 ± 4.5 3.36 ± 0.50 0.165 ± 0.017 0.087 ± 0.036 2.95 ± 0.16 1.49 ± 0.34 1.35 ± 0.50 T37 53.1 ± 8.5 12.7 ± 4.4 3.49 ± 0.69 0.152 ± 0.053 0.093 ± 0.019 2.61 ± 0.56 2.84 ± 0.75 3.13 ± 0.69 T38 34.0 ± 2.4 1.220 ± 0.018 2.63 ± 0.12 0.01452 ± 0.00089 0.099 ± 0.005 1.105 ± 0.051 5.02 ± 0.18 5.03 ± 0.12

8
Table S3. Quantified constituents from NIST green tea leaf reference material (no. 3254)a
standard methanol extract NIST CoAb (mg/g dry tea) (mg/g dry tea)
(-)-epicatechin 6.25 ± 0.05 9.0 ± 1.6 (-)-epicatechin gallate 12.36 ± 0.13 12.7 ± 1.2
(-)-epigallocatechin 18.43 ± 0.82 25.2 ± 4.5 (-)-epigallocatechin gallate 24.69 ± 0.29 52.0 ± 2.2
(-)-gallocatechin 3.40 ± 0.12 2.4 ± 1.1 gallic acid 1.06 ± 0.02 1.12 ± 0.61
a values are calculated as average of triplicate runs ± standard deviation (SD) b values obtained from the provided NIST Certificate of Analysis38

9
Table S4. Correlation matrix for green tea samples. Correlation was based upon the averaged metabolomic profile for each sample, and calculated from the reproduced correlation coefficient matrix comprised of a four principal component model.
T01 T02 T03 T04 T05 T06 T07 T08 T09 T10 T11 T12 T13 T14 T15 T16 T17 T18 T19 T20 T21 T22 T23 T24 T25 T26 T27 T28 T29 T30 T31 T32 T33 T34 T35 T36 T37 T38
T01 1.000 0.465 -0.196 0.062 -0.236 0.086 0.513 0.891 0.987 0.944 0.991 0.934 0.615 0.244 -0.772 0.841 0.762 0.438 -0.642 0.978 0.591 0.723 -0.374 -0.283 -0.649 0.676 -0.860 -0.767 -0.450 0.533 0.609 0.793 0.581 0.683 -0.936 -0.608 -0.662 0.147
T02 0.465 1.000 0.595 0.739 0.569 0.901 0.919 0.815 0.372 0.707 0.583 0.730 0.948 0.896 -0.059 0.834 -0.208 0.571 -0.952 0.523 0.841 0.872 -0.007 0.461 -0.916 0.974 -0.426 -0.891 -1.000 -0.436 -0.355 -0.074 -0.440 -0.317 -0.736 -0.983 -0.954 0.544
T03 -0.196 0.595 1.000 0.966 0.999 0.608 0.725 0.192 -0.192 0.128 -0.090 -0.001 0.610 0.398 0.737 0.099 -0.567 0.714 -0.321 -0.016 0.675 0.527 -0.325 0.164 -0.223 0.585 0.451 -0.187 -0.615 -0.910 -0.877 -0.752 -0.817 -0.775 -0.023 -0.451 -0.333 -0.110
T04 0.062 0.739 0.966 1.000 0.955 0.657 0.875 0.435 0.060 0.380 0.170 0.250 0.787 0.487 0.543 0.331 -0.388 0.834 -0.508 0.238 0.842 0.728 -0.412 0.112 -0.411 0.774 0.225 -0.403 -0.755 -0.791 -0.736 -0.558 -0.687 -0.616 -0.275 -0.629 -0.524 -0.053
T05 -0.236 0.569 0.999 0.955 1.000 0.597 0.696 0.153 -0.231 0.088 -0.130 -0.041 0.578 0.382 0.763 0.061 -0.593 0.691 -0.290 -0.056 0.644 0.492 -0.308 0.172 -0.192 0.551 0.484 -0.152 -0.589 -0.924 -0.894 -0.778 -0.833 -0.795 0.017 -0.420 -0.301 -0.118
T06 0.086 0.901 0.608 0.657 0.597 1.000 0.709 0.511 -0.039 0.347 0.219 0.432 0.725 0.967 0.148 0.603 -0.580 0.269 -0.817 0.116 0.567 0.578 0.348 0.776 -0.798 0.590 -0.212 -0.700 -0.903 -0.632 -0.578 -0.343 -0.702 -0.608 -0.431 -0.837 -0.804 0.715
T07 0.513 0.919 0.725 0.875 0.696 0.709 1.000 0.816 0.480 0.767 0.613 0.687 0.986 0.652 0.070 0.737 -0.050 0.848 -0.817 0.635 0.983 0.963 -0.393 0.108 -0.747 0.977 -0.269 -0.775 -0.924 -0.452 -0.368 -0.110 -0.371 -0.255 -0.705 -0.892 -0.835 0.172
T08 0.891 0.815 0.192 0.435 0.153 0.511 0.816 1.000 0.839 0.982 0.945 0.980 0.893 0.607 -0.520 0.970 0.394 0.600 -0.901 0.911 0.830 0.927 -0.272 0.033 -0.884 0.899 -0.766 -0.951 -0.806 0.116 0.207 0.471 0.150 0.280 -0.985 -0.898 -0.915 0.352
T09 0.987 0.372 -0.192 0.060 -0.231 -0.039 0.480 0.839 1.000 0.919 0.963 0.873 0.566 0.103 -0.726 0.754 0.830 0.495 -0.535 0.983 0.584 0.698 -0.505 -0.434 -0.531 0.655 -0.780 -0.670 -0.359 0.557 0.629 0.786 0.634 0.726 -0.878 -0.513 -0.559 -0.015
T10 0.944 0.707 0.128 0.380 0.088 0.347 0.767 0.982 0.919 1.000 0.976 0.966 0.840 0.445 -0.556 0.918 0.543 0.644 -0.802 0.972 0.816 0.910 -0.416 -0.155 -0.781 0.879 -0.754 -0.878 -0.698 0.224 0.313 0.552 0.288 0.409 -0.974 -0.803 -0.823 0.192
T11 0.991 0.583 -0.090 0.170 -0.130 0.219 0.613 0.945 0.963 0.976 1.000 0.971 0.711 0.364 -0.720 0.903 0.667 0.488 -0.738 0.979 0.672 0.798 -0.342 -0.186 -0.739 0.755 -0.858 -0.844 -0.569 0.423 0.505 0.718 0.465 0.578 -0.974 -0.711 -0.756 0.222
T12 0.934 0.730 -0.001 0.250 -0.041 0.432 0.687 0.980 0.873 0.966 0.971 1.000 0.792 0.574 -0.676 0.979 0.484 0.446 -0.872 0.914 0.703 0.835 -0.171 0.046 -0.877 0.794 -0.878 -0.946 -0.716 0.284 0.370 0.618 0.292 0.417 -0.999 -0.841 -0.883 0.422
T13 0.615 0.948 0.610 0.787 0.578 0.725 0.986 0.893 0.566 0.840 0.711 0.792 1.000 0.710 -0.086 0.839 0.025 0.780 -0.894 0.708 0.965 0.981 -0.318 0.154 -0.838 0.983 -0.423 -0.868 -0.949 -0.336 -0.247 0.027 -0.277 -0.151 -0.805 -0.946 -0.909 0.283
T14 0.244 0.896 0.398 0.487 0.382 0.967 0.652 0.607 0.103 0.445 0.364 0.574 0.710 1.000 -0.103 0.729 -0.426 0.155 -0.892 0.229 0.513 0.577 0.438 0.797 -0.896 0.571 -0.439 -0.807 -0.891 -0.416 -0.357 -0.109 -0.514 -0.410 -0.566 -0.876 -0.875 0.843
T15 -0.772 -0.059 0.737 0.543 0.763 0.148 0.070 -0.520 -0.726 -0.556 -0.720 -0.676 -0.086 -0.103 1.000 -0.591 -0.737 0.231 0.358 -0.625 0.025 -0.174 -0.135 0.078 0.434 -0.104 0.928 0.504 0.035 -0.859 -0.892 -0.969 -0.793 -0.846 0.658 0.240 0.356 -0.377
T16 0.841 0.834 0.099 0.331 0.061 0.603 0.737 0.970 0.754 0.918 0.903 0.979 0.839 0.729 -0.591 1.000 0.297 0.411 -0.952 0.821 0.715 0.841 -0.033 0.238 -0.957 0.806 -0.843 -0.992 -0.821 0.133 0.220 0.489 0.115 0.246 -0.976 -0.921 -0.957 0.564
T17 0.762 -0.208 -0.567 -0.388 -0.593 -0.580 -0.050 0.394 0.830 0.543 0.667 0.484 0.025 -0.426 -0.737 0.297 1.000 0.170 0.006 0.721 0.105 0.209 -0.519 -0.728 -0.014 0.161 -0.573 -0.174 0.222 0.855 0.881 0.878 0.936 0.958 -0.485 0.049 -0.018 -0.334
T18 0.438 0.571 0.714 0.834 0.691 0.269 0.848 0.600 0.495 0.644 0.488 0.446 0.780 0.155 0.231 0.411 0.170 1.000 -0.421 0.615 0.916 0.834 -0.810 -0.393 -0.322 0.861 0.017 -0.413 -0.582 -0.361 -0.295 -0.138 -0.186 -0.111 -0.475 -0.536 -0.455 -0.375
T19 -0.642 -0.952 -0.321 -0.508 -0.290 -0.817 -0.817 -0.901 -0.535 -0.802 -0.738 -0.872 -0.894 -0.892 0.358 -0.952 0.006 -0.421 1.000 -0.644 -0.749 -0.841 -0.088 -0.455 0.994 -0.821 0.680 0.983 0.944 0.156 0.072 -0.213 0.191 0.061 0.871 0.989 0.999 -0.664
T20 0.978 0.523 -0.016 0.238 -0.056 0.116 0.635 0.911 0.983 0.972 0.979 0.914 0.708 0.229 -0.625 0.821 0.721 0.615 -0.644 1.000 0.722 0.818 -0.528 -0.359 -0.626 0.783 -0.745 -0.754 -0.512 0.396 0.477 0.670 0.480 0.586 -0.923 -0.641 -0.669 0.024
T21 0.591 0.841 0.675 0.842 0.644 0.567 0.983 0.830 0.584 0.816 0.672 0.703 0.965 0.513 0.025 0.715 0.105 0.916 -0.749 0.722 1.000 0.978 -0.547 -0.076 -0.673 0.990 -0.277 -0.733 -0.846 -0.348 -0.263 -0.022 -0.237 -0.124 -0.724 -0.829 -0.773 0.023
T22 0.723 0.872 0.527 0.728 0.492 0.578 0.963 0.927 0.698 0.910 0.798 0.835 0.981 0.577 -0.174 0.841 0.209 0.834 -0.841 0.818 0.978 1.000 -0.460 -0.029 -0.784 0.997 -0.470 -0.847 -0.871 -0.196 -0.105 0.155 -0.110 0.014 -0.850 -0.893 -0.862 0.154
T23 -0.374 -0.007 -0.325 -0.412 -0.308 0.348 -0.393 -0.272 -0.505 -0.416 -0.342 -0.171 -0.318 0.438 -0.135 -0.033 -0.519 -0.810 -0.088 -0.528 -0.547 -0.460 1.000 0.855 -0.173 -0.478 -0.146 -0.024 0.017 -0.034 -0.065 -0.075 -0.247 -0.263 0.200 0.012 -0.047 0.800
T24 -0.283 0.461 0.164 0.112 0.172 0.776 0.108 0.033 -0.434 -0.155 -0.186 0.046 0.154 0.797 0.078 0.238 -0.728 -0.393 -0.455 -0.359 -0.076 -0.029 0.855 1.000 -0.496 -0.029 -0.125 -0.336 -0.458 -0.433 -0.430 -0.321 -0.610 -0.577 -0.028 -0.408 -0.420 0.888
T25 -0.649 -0.916 -0.223 -0.411 -0.192 -0.798 -0.747 -0.884 -0.531 -0.781 -0.739 -0.877 -0.838 -0.896 0.434 -0.957 -0.014 -0.322 0.994 -0.626 -0.673 -0.784 -0.173 -0.496 1.000 -0.758 0.738 0.984 0.906 0.083 0.002 -0.276 0.138 0.010 0.872 0.966 0.989 -0.728
T26 0.676 0.974 0.585 0.774 0.551 0.590 0.977 0.899 0.655 0.879 0.755 0.794 0.983 0.571 -0.104 0.806 0.161 0.861 -0.821 0.783 0.990 0.997 -0.478 -0.029 -0.758 1.000 -0.407 -0.818 -0.875 -0.258 -0.168 0.089 -0.165 -0.044 -0.811 -0.883 -0.843 0.124
T27 -0.860 -0.426 0.451 0.225 0.484 -0.212 -0.269 -0.766 -0.780 -0.754 -0.858 -0.878 -0.423 -0.439 0.928 -0.843 -0.573 0.017 0.680 -0.745 -0.277 -0.470 -0.146 -0.125 0.738 -0.407 1.000 0.788 0.404 -0.611 -0.671 -0.845 -0.545 -0.638 0.863 0.583 0.678 -0.565
T28 -0.767 -0.891 -0.187 -0.403 -0.152 -0.700 -0.775 -0.951 -0.670 -0.878 -0.844 -0.946 -0.868 -0.807 0.504 -0.992 -0.174 -0.413 0.983 -0.754 -0.733 -0.847 -0.024 -0.336 0.984 -0.818 0.788 1.000 0.880 -0.017 -0.104 -0.382 0.010 -0.122 0.944 0.959 0.985 -0.617
T29 -0.450 -1.000 -0.615 -0.755 -0.589 -0.903 -0.924 -0.806 -0.359 -0.698 -0.569 -0.716 -0.949 -0.891 0.035 -0.821 0.222 -0.582 0.944 -0.512 -0.846 -0.871 0.017 -0.458 0.906 -0.875 0.404 0.880 1.000 0.456 0.376 0.096 0.458 0.335 0.723 0.978 0.946 -0.531
T30 0.533 -0.436 -0.910 -0.791 -0.924 -0.632 -0.452 0.116 0.557 0.224 0.423 0.284 -0.336 -0.416 -0.859 0.133 0.855 -0.361 0.156 0.396 -0.348 -0.196 -0.034 -0.433 0.083 -0.258 -0.611 -0.017 0.456 1.000 0.996 0.929 0.977 0.967 -0.269 0.262 0.152 -0.052
T31 0.609 -0.355 -0.877 -0.736 -0.894 -0.578 -0.368 0.207 0.629 0.313 0.505 0.370 -0.247 -0.357 -0.892 0.220 0.881 -0.295 0.072 0.477 -0.263 -0.105 -0.065 -0.430 0.002 -0.168 -0.671 -0.104 0.376 0.996 1.000 0.958 0.977 0.980 -0.356 0.176 0.067 -0.025
T32 0.793 -0.074 -0.752 -0.558 -0.778 -0.343 -0.110 0.471 0.786 0.552 0.718 0.618 0.027 -0.109 -0.969 0.489 0.878 -0.138 -0.213 0.670 -0.022 0.155 -0.075 -0.321 -0.276 0.089 -0.845 -0.382 0.096 0.929 0.958 1.000 0.909 0.949 -0.605 -0.112 -0.220 0.137
T33 0.581 -0.440 -0.817 -0.687 -0.833 -0.702 -0.371 0.150 0.634 0.288 0.465 0.292 -0.277 -0.514 -0.793 0.115 0.936 -0.186 0.191 0.480 -0.237 -0.110 -0.247 -0.610 0.138 -0.165 -0.545 0.010 0.458 0.977 0.977 0.909 1.000 0.991 -0.284 0.272 0.179 -0.234
T34 0.683 -0.317 -0.775 -0.616 -0.795 -0.608 -0.255 0.280 0.726 0.409 0.578 0.417 -0.151 -0.410 -0.846 0.246 0.958 -0.111 0.061 0.586 -0.124 0.014 -0.263 -0.577 0.010 -0.044 -0.638 -0.122 0.335 0.967 0.980 0.949 0.991 1.000 -0.409 0.142 0.047 -0.168
T35 -0.936 -0.736 -0.023 -0.275 0.017 -0.431 -0.705 -0.985 -0.878 -0.974 -0.974 -0.999 -0.805 -0.566 0.658 -0.976 -0.485 -0.475 0.871 -0.923 -0.724 -0.850 0.200 -0.028 0.872 -0.811 0.863 0.944 0.723 -0.269 -0.356 -0.605 -0.284 -0.409 1.000 0.844 0.883 -0.399
T36 -0.608 -0.983 -0.451 -0.629 -0.420 -0.837 -0.892 -0.898 -0.513 -0.803 -0.711 -0.841 -0.946 -0.876 0.240 -0.921 0.049 -0.536 0.989 -0.641 -0.829 -0.893 0.012 -0.408 0.966 -0.883 0.583 0.959 0.978 0.262 0.176 -0.112 0.272 0.142 0.844 1.000 0.992 -0.575
T37 -0.662 -0.954 -0.333 -0.524 -0.301 -0.804 -0.835 -0.915 -0.559 -0.823 -0.756 -0.883 -0.909 -0.875 0.356 -0.957 -0.018 -0.455 0.999 -0.669 -0.773 -0.862 -0.047 -0.420 0.989 -0.843 0.678 0.985 0.946 0.152 0.067 -0.220 0.179 0.047 0.883 0.992 1.000 -0.633
T38 0.147 0.544 -0.110 -0.053 -0.118 0.715 0.172 0.352 -0.015 0.192 0.222 0.422 0.283 0.843 -0.377 0.564 -0.334 -0.375 -0.664 0.024 0.023 0.154 0.800 0.888 -0.728 0.124 -0.565 -0.617 -0.531 -0.052 -0.025 0.137 -0.234 -0.168 -0.399 -0.575 -0.633 1.000

10
Figure S1. Comparison of quantities of selected green tea constituents extracted in hot water versus methanol. Triplicate extractions were conducted on a sample of green tea from the NIST (no. 3254). The mean concentration among triplicate extracts as determined by linear regression of the relevant calibration curve is reported. Error bars represent standard deviation(SD). * indicates significantly differing concentrations, as determined by the student’s t-test, with p < 0.05.

11
Figure S2. Untargeted 1H-NMR spectra for all 38 tea samples. Spectra were acquired in CD3OD at a concentration of 10
mg/mL.
Related Documents