1 Comparison of Hurricane Loss Projection Models presentation to the Florida House of Representatives Committee on Insurance January 24, 2008 Comparison of Hurricane Loss Projection Models presentation to the Florida House of Representatives Committee on Insurance January 24, 2008

Welcome message from author
This document is posted to help you gain knowledge. Please leave a comment to let me know what you think about it! Share it to your friends and learn new things together.
Transcript

1
Comparison of Hurricane LossProjection Models
presentation to the
Florida House of RepresentativesCommittee on Insurance
January 24, 2008
Comparison of Hurricane LossProjection Models
presentation to the
Florida House of RepresentativesCommittee on Insurance
January 24, 2008

2
BackgroundBackgroundBackground• In January 2007 the Florida House of Representatives
undertook an investigation of the hurricane loss models used in Florida
• Speaker Marco Rubio requested the Commission review and complete various comparisons of the Public Model and the four private models
• On April 16, 2007, the Commission’s Professional Team presented the results of its preliminary analysis to the House Committee on Insurance
• Upon conclusion of the 2007 model review process, the Commission provided a report of the final results to the House Speaker on November 5, 2007
• Today’s briefing provides an update regarding the review and final results of the models
3
Today’s BriefingToday’s Briefing• Overview of the Commission
• How do hurricane loss models work?
• Why are models different?
• What is the reasonable range of variation, and where do current models fit within that range?
• How have the models submitted to the Commission varied over time?
• Overview of 2007 model review process
• Primary findings of the Report to the Florida House of Representatives, Comparison of Hurricane Loss Projection Models, November 5, 2007
• Current and Future Areas of Investigation

4
Hurricane Modeling BackgroundHurricane Modeling Background
• Traditional methods of projecting hurricane loss cost were considered inadequate after Hurricane Andrew.
• Hurricane modeling provided a more scientific approach, but has been considered controversial due to the proprietary nature of the models.
• The Legislature recognized the need for expert evaluation of computer models to resolve conflictsamong actuarial professionals and created a Commission.
5
Creation of CommissionCreation of Commission
• In 1995, the Florida Legislature created the 11 member Florida Commission on Hurricane Loss Projection Methodology (see s. 627.0628, F.S.)
• Panel of Independent Experts formed to “provide the most actuarially sophisticated guidelines and standards for projection of hurricane losses possible.”
6
Composition of the CommissionComposition of the Commission
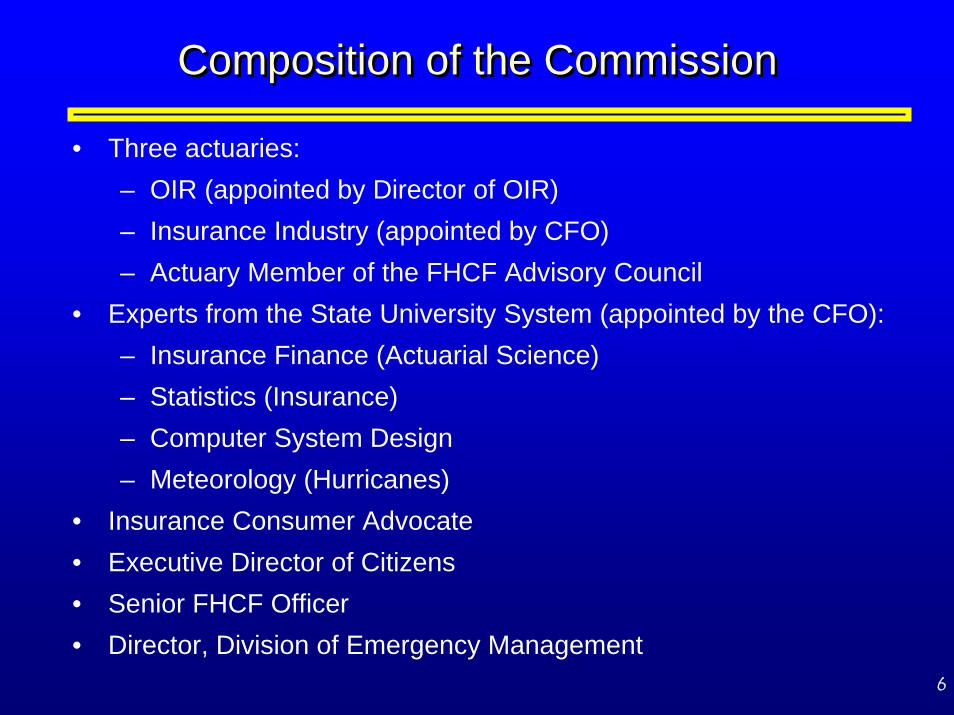
• Three actuaries:– OIR (appointed by Director of OIR)– Insurance Industry (appointed by CFO)– Actuary Member of the FHCF Advisory Council
• Experts from the State University System (appointed by the CFO):– Insurance Finance (Actuarial Science)– Statistics (Insurance)– Computer System Design– Meteorology (Hurricanes)
• Insurance Consumer Advocate• Executive Director of Citizens• Senior FHCF Officer• Director, Division of Emergency Management

7
Names of Commission Members & Professional Team Members Over the Last 12 Years
(current members bolded) – 55 Experts n lve
Names of Commission Members & Professional Team Names of Commission Members & Professional Team Members Over the Last 12 Years Members Over the Last 12 Years
(current members bolded) (current members bolded) –– 55 Experts Involved55 Experts Involved
Insurance Executive Director, Director, Consumer Advocate Senior FHCF Officer Citizens Emergency Management FHCF Actuary OIR Actuary Terry Butler Jack Nicholson, PhD Scott Wallace Craig Fugate Larry Johnson, FCAS Howard Eagelfeld, FCAS Bob Milligan Bob Ricker Joe Myers Alice Gannon, FCAS Sri Ramanujam, FCAS Steve Burgess Jay Newman Myron Dye, FCAS Kay Cleary, FCAS Lauri Goldman Ken Ritzenthaler, ACAS Elsie Crowell Insurance Computer System Industry Actuary Finance Expert Statistics Expert Design Expert Meteorology Expert Kristen Bessette, FCAS Randy Dumm, PhD Sneh Gulati, PhD Jai Navlakha, PhD Hugh Willoughby, PhD Steve Ludwig, FCAS David Nye, PhD Tim Lynch, PhD David Coursey, PhD Jim O'Brien, PhD Mark Homan, FCAS Carol Taylor West, PhD Shahid Hamid, PhD Kevin Kloesel, PhD Dan Powell, FCAS Naphtali David Rishe, PhD Peter Ray, PhD Charles Hughes, PhD Actuary Statistician Computer Scientist Meteorologist Engineer Marty Simons, ACAS Mark Johnson, PhD Paul Fishwick, PhD Jenni Evans, PhD Fred Stolaski, PE Chuck Watson Mark Brannon, FCAS (backup)
Ron Iman, PhD (backup)
Dick Nance, PhD (backup)
Tom Schroeder, PhD (backup)
Masoud Zadeh, PhD, PE (backup) Julie Serakos
David Cox, FCAS Ben Fitzpatrick, PhD Peter Ray, PhD Nur Yazdani, PhD, PE Steve Lyons, PhD Nariman Balsara, PE John Pepper, PE
5
13
2
3 4
4
2
3
5 4
3 32
45
2
Total Commission Members - 36
Total Professional Team Members - 19

8
Summary of Commission ActivitiesSummary of Commission ActivitiesSummary of Commission Activities
• 128 meetings over 12 year period
• Involvement of 55 different experts (36 Commission members & 19 Professional Team members)
• 52 on-site reviews/audits
• Annual Report of Activities published by November 1
• Rigorous public disclosure, on-site audits, and evaluation process (12 years of documentation)
• Reviewed eight (8) different models over 12 years
• Five (5) models acceptable under the current Standards
• Total Cost to Date: over $4 million

9
Hurricane Computer Models
MeteorologyEngineering
Actuarial
Expert Evaluation Requires:
StatisticianMeteorologistStructural EngineerActuaryComputer Scientist
52 On-Site Reviews to dateComputer Programming
Outputs
Statistics
The Professional TeamThe Professional TeamInputs

10
Jun Aug Sept Oct Nov Dec Jan Feb Mar Apr MayJul Jun
The Acceptability ProcessThe Acceptability Process
Re port of Ac tivitie s
Com
mission M
eet ing to Adopt S tandards
Com
mitt ee M
eet ings to Revise St andard s
Professi onal Team & St aff C
onference
Com
mission R
evi ews M
odels
On -Si te R
evi ews by Professi onal Team
Com
mission R
evi ews S ubm
i ssions
Modeler s Sub m
i ssi ons Due
Revising & Developing Standards Reviewing Models
Planning Workshops
November 1
February 28
Modelers have 4 months to revise models

11
l s Principles Principles (Examples*)(Examples*)
• All models or methods shall be theoretically sound.
• Models or methods shall not be biased to overstate or understate results.
• The output of models or methods shall be reasonable and the modeler shall demonstrate its reasonableness.
*See page 15 of the Report of Activities for the 20 Principles adopted by the Commission.

12
RequirementsRequirementsRequirements
General Meteorological Vulnerability Actuarial Statistical Computer
Standards
36(88 subparts)
5(8 subparts)
6(12 subparts)
2(9 subparts)
10(29 subparts)
6(7 subparts)
7(23 subparts)
Disclosures
144 28 33 11 38 27 7Forms
26 7 3 3 8 5 0On-Site Audit Requirements
14213 28 10 33 29 29

13
Overview of Hurricane Loss ModelsOverview of Hurricane Loss Models
• Input Data Bases
• Wind Models
• Surface Friction and Topography Adjustments
• Damage Functions
• Frequency of Occurrence of Events
• Supporting Decisions. For example:What constitutes an event?Spatial aggregation of numerical results
14
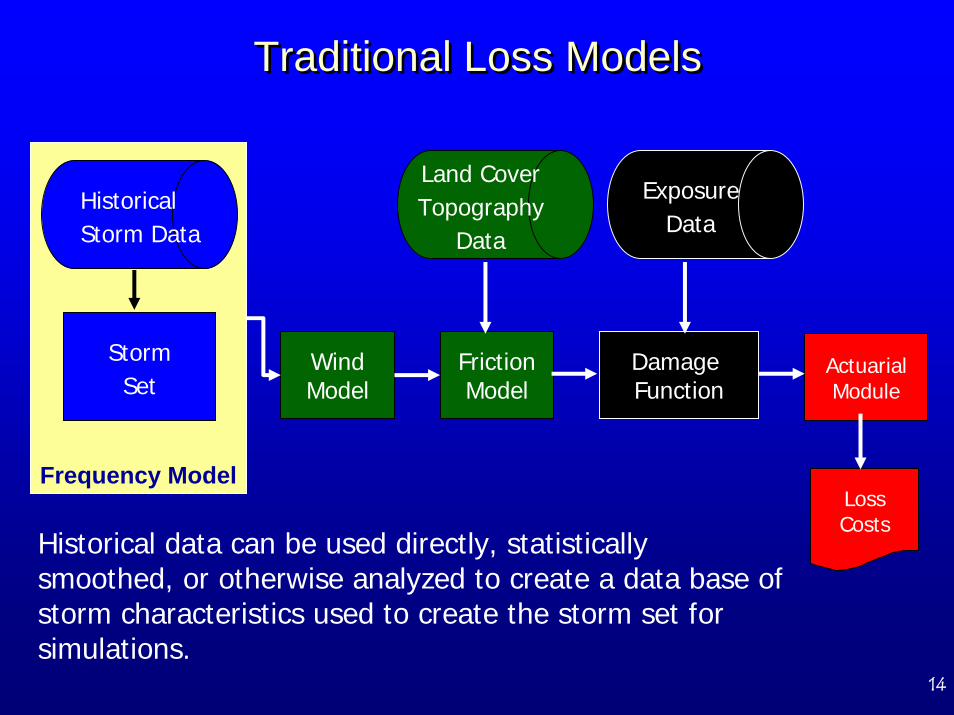
Frequency Model
Traditional Loss ModelsTraditional Loss Models
Damage Function
WindModel
FrictionModel
HistoricalStorm Data
StormSet
Historical data can be used directly, statistically smoothed, or otherwise analyzed to create a data base of storm characteristics used to create the storm set for simulations.
Land CoverTopography
Data
ExposureData
ActuarialModule
LossCosts
15
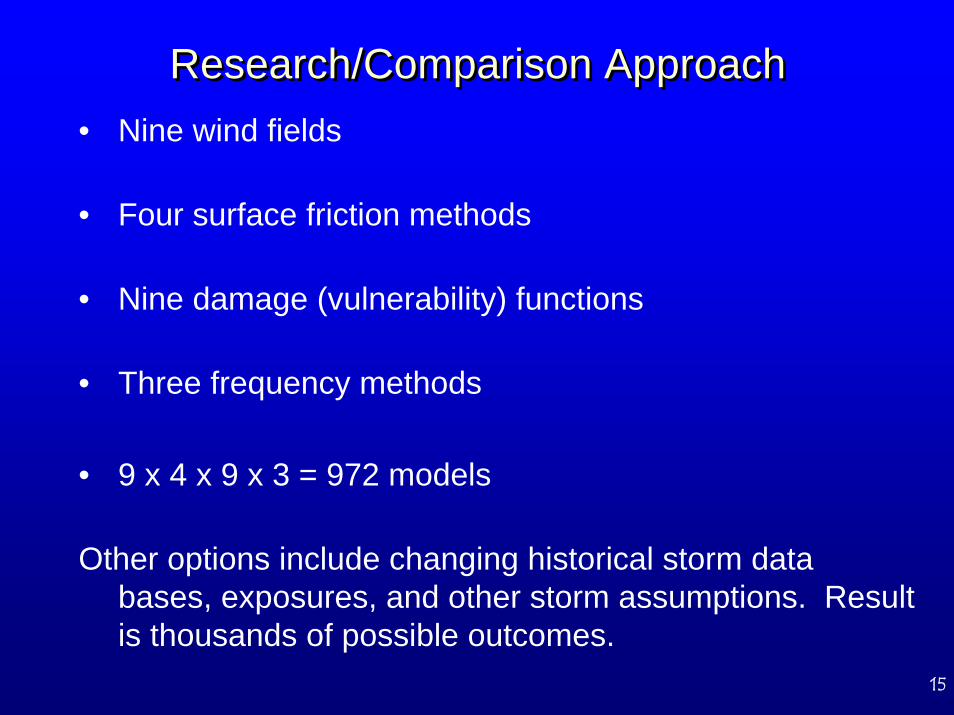
Research/Comparison ApproachResearch/Comparison Approach• Nine wind fields
• Four surface friction methods
• Nine damage (vulnerability) functions
• Three frequency methods
• 9 x 4 x 9 x 3 = 972 models
Other options include changing historical storm data bases, exposures, and other storm assumptions. Result is thousands of possible outcomes.

16
Input Data BasesInput Data Bases• Digital Elevation Model (topography)
Not all models use topographyRidge and valley effects important in upland areas
• Land Cover/Land Use Friction effects to adjust wind impacts on structures at surface
• Historical Storm Track and Intensity DataRequired to simulate individual storms for comparisonwith observed losses. Used as a basis for the determination of frequency of occurrence and other storm characteristics
• Exposure Data SetLocation, characteristics, and value of properties at risk

17
Range of Results from Public Domain ModelsRange of Results from Public Domain Models
0
2
4
6
8
10
12
14
16
SU
WA
NN
EE
HA
MILTO
NM
AD
ISO
NC
OLU
MB
IALA
FAY
ETTE
BR
AD
FOR
DG
ILCH
RIS
TJE
FFER
SO
NB
AK
ER
ALA
CH
UA
UN
ION
TAY
LOR
CLA
YD
IXIE
MA
RIO
NP
UTN
AM
VO
LUS
IALE
VY
DU
VA
LS
EM
INO
LELA
KE
WA
KU
LLALE
ON
JAC
KS
ON
NA
SS
AU
SU
MTE
RFLA
GLE
RG
AD
SD
EN
SA
INT JO
HN
SO
RA
NG
EP
OLK
HO
LME
SH
ILLSB
OR
OU
GH
HA
RD
EE
HIG
HLA
ND
SO
SC
EO
LAC
ITRU
SB
RE
VA
RD
HE
RN
AN
DO
WA
SH
ING
TON
PA
SC
OO
KE
EC
HO
BE
ED
ES
OTO
SA
NTA
RO
SA
LIBE
RTY
GLA
DE
SE
SC
AM
BIA
PIN
ELLA
SW
ALTO
NM
AN
ATE
EC
ALH
OU
NO
KA
LOO
SA
HEN
DR
YIN
DIA
N R
IVE
RS
AR
AS
OTA
FRA
NK
LINSAIN
T LUC
IEC
HA
RLO
TTEB
AY
BR
OW
AR
DM
AR
TING
ULF
PA
LM B
EA
CH
LEE
MIA
MI-D
AD
EC
OLLIE
RM
ON
RO
E
Median Min max
972 Models – Range of results: maximum, median, and minimum

18
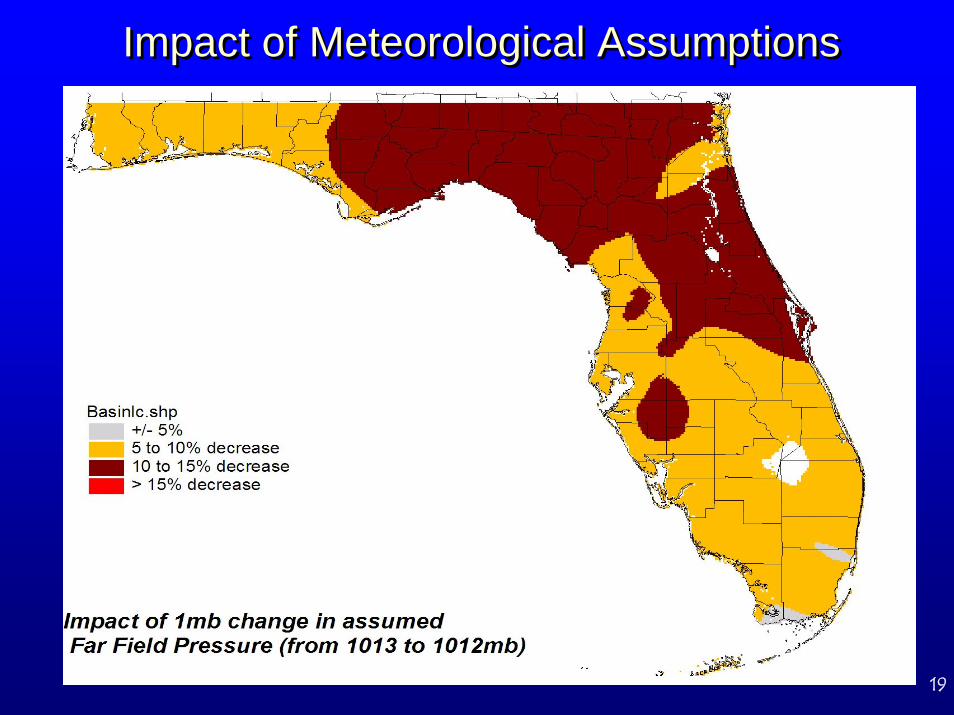
Why Are Models Different?Why Are Models Different?
• Meteorological input variables
• Historical data
• Land cover
• Exposure data bases and aggregation
Examined many additional aspects of why models differ besides the obvious one of different equations:
19
Impact of Meteorological AssumptionsImpact of Meteorological Assumptions

20
The Explosion in Hurricane DataThe Explosion in Hurricane DataData per day on landfalling Hurricane
1.00E+00
1.00E+01
1.00E+02
1.00E+03
1.00E+04
1.00E+05
1.00E+06
1.00E+07
1.00E+08
1.00E+09
1.00E+10
1.00E+11
1840 1860 1880 1900 1920 1940 1960 1980 2000 2020Year
Dat
a (b
ytes
)
Airports begin systematicweather reporting
Aircraft begin penetratinghurricanes to collect data
Coastal Radar Networksin place
Geosynchronoussatellites
Microwave Satellite Data(sounders) and improvedGEOS satellite sensors
Active low earth orbiting (POES)sensors and scatterometers,GPS dropsondes
GTS (telegraph), Lloyds ship reports
Note – Each vertical division represents 10 times the amount of data.

21
Short Term Trends in Hurricane WindsShort Term Trends in Hurricane Windsvmaxkts
0
20
40
60
80
100
1850 1870 1890 1910 1930 1950 1970 1990 2010
Peak
Hur
rican
e W
inds
vmaxkts
104.9 kts
4.8 kts
80.8 kts
73.3 kts
Probability of Hurricane Force Winds:Overall: 1 in 7.8El Nino Year: 1 in 6.9La Nina Year: 1 in 15.4
Data for DeFuniakSprings,Walton County

22
Frequencies and Data Base ComparisonFrequencies and Data Base Comparison
Does one or two years of additional history make a difference?
Can climate models be used instead of parametric models?

23
Variability Chart for Miami-DadeVariability Chart for Miami-Dade

24
Summary: Why Models VarySummary: Why Models Vary• Model component selections, especially wind field.
• Meteorological input variables –very sensitive to assumptions, more sensitive than our ability to measure, can drive wind model selections.
• Land cover and other support data basesout of date can make significant difference.
• Spatial aggregation and representationlevel of aggregation can bias results; ZIP Codes, especially in rural areas can introduce significant errors.

25
Where do we stand?Where do we stand?
• While we can’t expect individual models to agree, we can understand the variation we should expect from models.
• With the results of the above studies, especially the results of nearly one thousand public domain hurricane loss models, the Commission has a baseline against which to evaluate individual model submissions.

26
Analysis of Submitted ModelsAnalysis of Submitted Models
• AIR Worldwide Corporation (AIR) – Atlantic Tropical Cyclone Model V9.0
• Applied Research Associates, Inc. (ARA) – HurLoss4.0.c
• EQECAT, Inc. (EQE) –USWIND®/WORLDCATenterprise™ 3.9
• Florida Public Hurricane Loss Model (FPM) 2.6
• Risk Management Solutions, Inc. (RMS) – RiskLink 6.0a
Model versions reviewed and found acceptable under the 2006 Standards:

27
All 5 Models + Public Domain Loss CostsAll 5 Models + Public Domain Loss Costs
0
2
4
6
8
10
12
14
SUW
ANN
EEH
AMILTO
NM
ADISO
NC
OLU
MBIA
LAFAYETTEBR
ADFO
RD
GILC
HR
ISTJEFFER
SON
BAKERALAC
HU
AU
NIO
NTAYLO
RC
LAYD
IXIEM
ARIO
NPU
TNAM
VOLU
SIALEVYD
UVAL
SEMIN
OLE
LAKEW
AKULLA
LEON
JACKSO
NN
ASSAUSU
MTER
FLAGLER
GAD
SDEN
SAINT JO
HN
SO
RAN
GE
POLK
HO
LMES
HILLSBO
RO
UG
HH
ARD
EEH
IGH
LAND
SO
SCEO
LAC
ITRU
SBR
EVARD
HER
NAN
DO
WASH
ING
TON
PASCO
OKEEC
HO
BEED
ESOTO
SANTA R
OSA
LIBERTY
GLAD
ESESC
AMBIA
PINELLAS
WALTO
NM
ANATEE
CALH
OU
NO
KALOO
SAH
END
RY
IND
IAN R
IVERSAR
ASOTA
FRAN
KLINSAIN
T LUC
IEC
HAR
LOTTE
BAYBR
OW
ARD
MAR
TING
ULF
PALM BEAC
HLEEM
IAMI-D
ADE
CO
LLIERM
ON
RO
E
Median Min Max FPM06 AIR06 ARA06 EQE06 RMS06

28
AIR Loss CostAIR Loss Cost
0
2
4
6
8
10
12
14
SU
WAN
NEE
HAM
ILTON
MAD
ISO
NC
OLU
MBIA
LAFAY
ETTE
BR
AD
FOR
DG
ILCH
RIS
TJE
FFER
SO
NBAK
ER
ALAC
HU
AU
NIO
NTA
YLOR
CLA
YD
IXIE
MAR
ION
PU
TNAM
VO
LUSIA
LEVY
DU
VAL
SEM
INO
LELA
KEW
AKU
LLALE
ON
JAC
KSO
NN
ASSA
USU
MTE
RFLA
GLE
RG
AD
SD
ENSAIN
T JOH
NS
OR
ANG
EPO
LKH
OLM
ES
HILLS
BO
RO
UG
HH
AR
DEE
HIG
HLA
ND
SO
SC
EO
LAC
ITRU
SBR
EVA
RD
HER
NAN
DO
WAS
HIN
GTO
NPAS
CO
OKEEC
HO
BEE
DESO
TOSAN
TA RO
SA
LIBER
TYG
LAD
ES
ESC
AMBIA
PIN
ELLA
SW
ALTON
MAN
ATE
EC
ALH
OU
NO
KALO
OSA
HEN
DR
YIN
DIA
N R
IVER
SAR
ASO
TAFR
AN
KLIN
SAIN
T LUC
IEC
HAR
LOTTE
BAY
BR
OW
AR
DM
AR
TING
ULF
PALM
BEAC
HLE
EM
IAM
I-DAD
EC
OLLIE
RM
ON
RO
E
Median Min Max AIR 06

29
ARA Loss CostARA Loss Cost
0
2
4
6
8
10
12
14
SUW
ANN
EEH
AMILTO
NM
ADISO
NC
OLU
MBIA
LAFAYETTEBR
ADFO
RD
GILC
HR
ISTJEFFER
SON
BAKERALAC
HU
AU
NIO
NTAYLO
RC
LAYD
IXIEM
ARIO
NPU
TNAM
VOLU
SIALEVYD
UVAL
SEMIN
OLE
LAKEW
AKULLA
LEON
JACKSO
NN
ASSAUSU
MTER
FLAGLER
GAD
SDEN
SAINT JO
HN
SO
RAN
GE
POLK
HO
LMES
HILLSBO
RO
UG
HH
ARD
EEH
IGH
LAND
SO
SCEO
LAC
ITRU
SBR
EVARD
HER
NAN
DO
WASH
ING
TON
PASCO
OKEEC
HO
BEED
ESOTO
SANTA R
OSA
LIBERTY
GLAD
ESESC
AMBIA
PINELLAS
WALTO
NM
ANATEE
CALH
OU
NO
KALOO
SAH
END
RY
IND
IAN R
IVERSAR
ASOTA
FRAN
KLINSAIN
T LUC
IEC
HAR
LOTTE
BAYBR
OW
ARD
MAR
TING
ULF
PALM BEAC
HLEEM
IAMI-D
ADE
CO
LLIERM
ON
RO
E
Median Min Max ARA06

30
EQE Loss CostsEQE Loss Costs
0
2
4
6
8
10
12
14
SUW
ANN
EEH
AMILTO
NM
ADISO
NC
OLU
MBIA
LAFAYETTEBR
ADFO
RD
GILC
HR
ISTJEFFER
SON
BAKERALAC
HU
AU
NIO
NTAYLO
RC
LAYD
IXIEM
ARIO
NPU
TNAM
VOLU
SIALEVYD
UVAL
SEMIN
OLE
LAKEW
AKULLA
LEON
JACKSO
NN
ASSAUSU
MTER
FLAGLER
GAD
SDEN
SAINT JO
HN
SO
RAN
GE
POLK
HO
LMES
HILLSBO
RO
UG
HH
ARD
EEH
IGH
LAND
SO
SCEO
LAC
ITRU
SBR
EVARD
HER
NAN
DO
WASH
ING
TON
PASCO
OKEEC
HO
BEED
ESOTO
SANTA R
OSA
LIBERTY
GLAD
ESESC
AMBIA
PINELLAS
WALTO
NM
ANATEE
CALH
OU
NO
KALOO
SAH
END
RY
IND
IAN R
IVERSAR
ASOTA
FRAN
KLINSAIN
T LUC
IEC
HAR
LOTTE
BAYBR
OW
ARD
MAR
TING
ULF
PALM BEAC
HLEEM
IAMI-D
ADE
CO
LLIERM
ON
RO
E
Median Min max EQE06
31
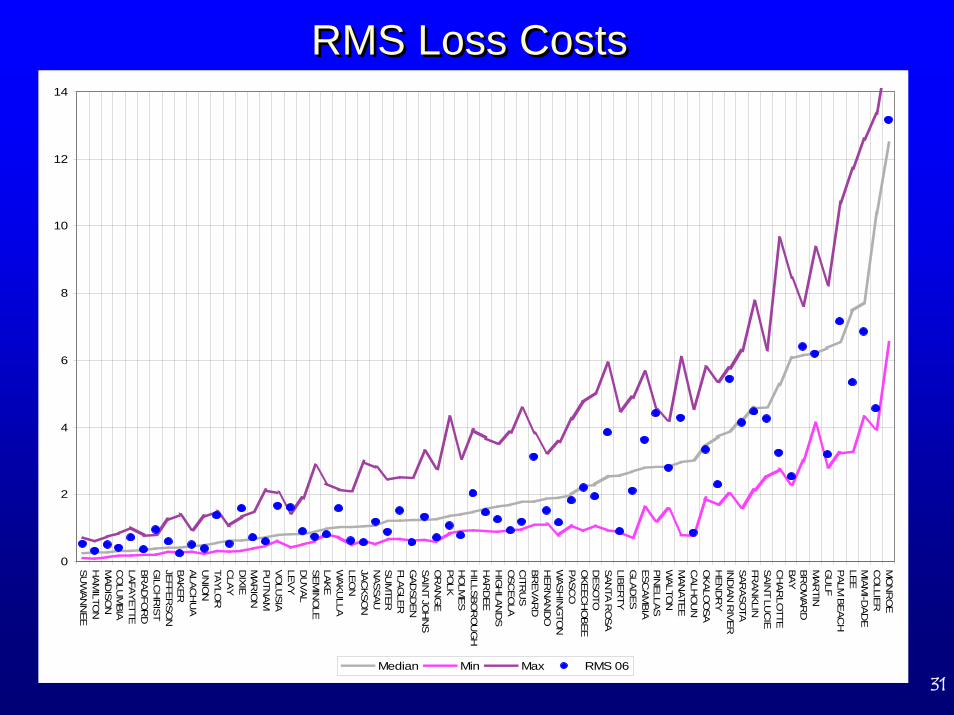
RMS Loss CostsRMS Loss Costs
0
2
4
6
8
10
12
14
SUW
AN
NEE
HAM
ILTON
MAD
ISO
NC
OLU
MB
IALAFAY
ETTEBR
AD
FOR
DG
ILCH
RIST
JEFFER
SO
NBAK
ERALA
CH
UA
UN
ION
TAYLO
RC
LAY
DIXIE
MAR
ION
PUTN
AM
VOLU
SIA
LEVY
DU
VAL
SEMIN
OLE
LAKE
WAK
ULLA
LEON
JACKS
ON
NAS
SAU
SUM
TERFLA
GLER
GAD
SDE
NSAIN
T JOH
NS
OR
AN
GE
POLK
HO
LMES
HILLSBO
RO
UG
HH
ARD
EEH
IGH
LAND
SO
SCEO
LAC
ITRU
SBR
EVA
RD
HER
NAN
DO
WAS
HIN
GTO
NPAS
CO
OKE
ECH
OB
EED
ESO
TOSAN
TA R
OSA
LIBER
TYG
LAD
ES
ESCAM
BIA
PINELLA
SW
ALTON
MAN
ATEE
CALH
OU
NO
KALO
OSA
HEN
DR
YIN
DIAN
RIV
ERSAR
ASO
TAFR
AN
KLIN
SAINT LU
CIE
CH
AR
LOTTE
BAYBR
OW
ARD
MAR
TING
ULF
PALM BE
ACH
LEEM
IAMI-D
ADE
CO
LLIERM
ON
RO
E
Median Min Max RMS 06

32
FPM Loss CostsFPM Loss Costs
0
2
4
6
8
10
12
14
SU
WAN
NEE
HAM
ILTON
MAD
ISO
NC
OLU
MBIA
LAFA
YETTE
BR
AD
FOR
DG
ILCH
RIS
TJE
FFER
SO
NBAKER
ALA
CH
UA
UN
ION
TAYLO
RC
LAY
DIX
IEM
AR
ION
PU
TNAM
VO
LUSIA
LEVY
DU
VAL
SEM
INO
LELA
KE
WAKU
LLALE
ON
JAC
KSO
NN
ASSAU
SU
MTE
RFLA
GLE
RG
AD
SD
EN
SAIN
T JOH
NS
OR
AN
GE
PO
LKH
OLM
ES
HILLS
BO
RO
UG
HH
AR
DEE
HIG
HLA
ND
SO
SC
EO
LAC
ITRU
SBR
EVAR
DH
ER
NAN
DO
WASH
ING
TON
PASC
OO
KEEC
HO
BEE
DESO
TOSAN
TA R
OSA
LIBER
TYG
LAD
ES
ESC
AM
BIA
PIN
ELLA
SW
ALTO
NM
AN
ATE
EC
ALH
OU
NO
KALO
OSA
HEN
DR
YIN
DIA
N R
IVER
SAR
ASO
TAFR
AN
KLIN
SAIN
T LUC
IEC
HAR
LOTTE
BAY
BR
OW
AR
DM
AR
TING
ULF
PALM
BEAC
HLE
EM
IAM
I-DAD
EC
OLLIE
RM
ON
RO
E
Median Min Max FPM06

33
Loss CostsLoss Costs
Loss Cost per $1000 of Exposure for Wood Frame
AIR AIR ARA EQE EQE
FPM FPM RMS RMS
34
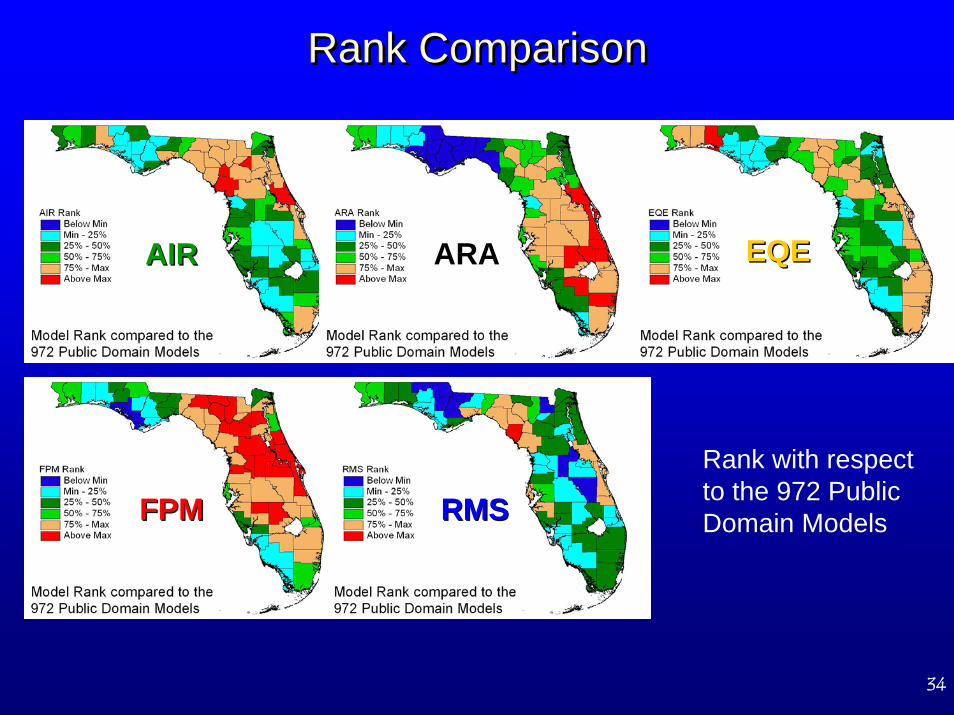
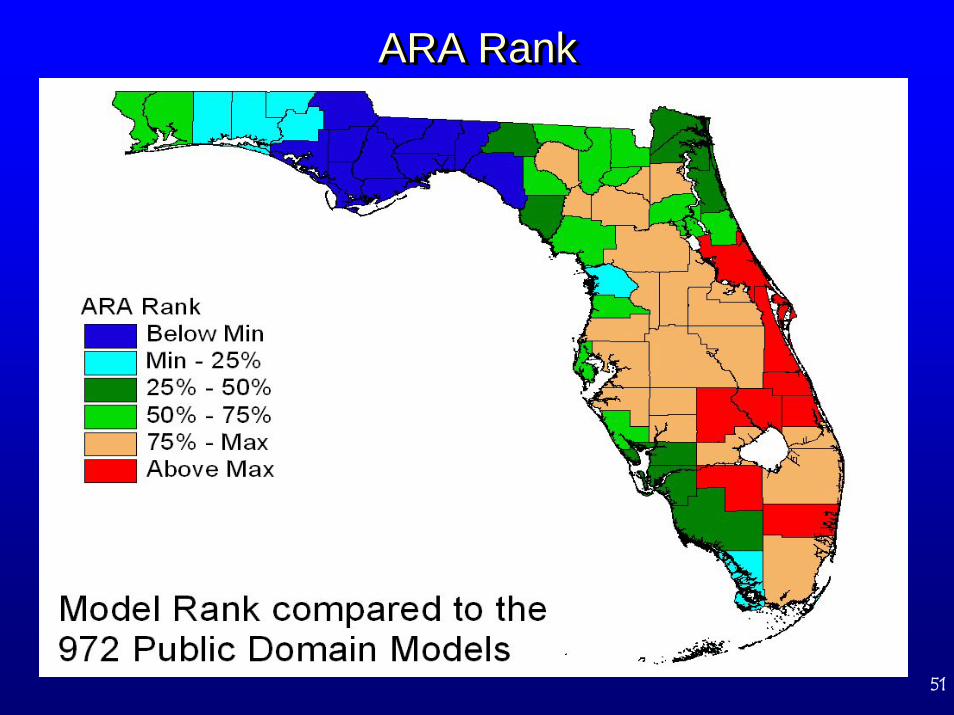
Rank ComparisonRank Comparison
Rank with respect to the 972 Public Domain Models
AIR AIR ARA EQE EQE
FPM FPM RMS RMS

35
Rank Comparison TableRank Comparison TableThis table shows the number of counties (out of 67) in each quartile of the 972 Public Domain model outputs, as well as those exceeding the maximum or falling below the minimum.
Model below min-25 25-50 50-75 75-max above
2005AIR 2 23 17 10 15 0ARA 0 5 4 6 40 12EQE 0 13 26 14 13 1RMS 12 19 18 8 10 0FPM 4 10 7 4 18 24
2006AIR 0 16 18 9 20 4ARA 11 6 8 13 21 8EQE 0 13 21 13 19 1RMS 8 18 23 5 12 1FPM 2 8 8 7 23 19
The Public Model version 1.5 is used to determine ranks in 2005.

36
Hypothetical Probable Maximum Loss ComparisonFHCF Hypothetical Exposure Data
Form S-2
Hypothetical Probable Maximum Loss ComparisonFHCF Hypothetical Exposure Data
Form SForm S--22
The probable maximum loss (PML) data is calculated on a hypothetical exposure data set and is not an indication of the actual PML for Florida. These results should be used for comparison purposes only.
ReturnProbability Time AIR ARA EQEEQE FPM RMS
0.4% 250 51.7 57.9 50.250.2 44.3 51.71% 100 36.3 41.4 36.736.7 35.6 34.32% 50 25.1 29.2 25.425.4 28.8 23.7
AAL 2.4 2.7 2.42.4 3.2 2.7
AAL: Average Annual LossReturn time in yearsAll numbers for the models in $ millions

37
Hypothetical PML ComparisonFHCF Hypothetical Exposure Data
Form S-2
Hypothetical PML ComparisonFHCF Hypothetical Exposure Data
Form SForm S--22
0
10
20
30
40
50
60
250 100 50
AIRARAEQEFPMRMS
Return Times
$ M
illio
ns
0
10
20
30
40
50
60
250 100 50
AIRARAEQEFPMRMS
Return Times
$ M
illio
ns

38
Hypothetical PML ComparisonFHCF Hypothetical Exposure DataForm S-2, Average Annual Loss
Hypothetical PML ComparisonFHCF Hypothetical Exposure DataForm SForm S--2, Average Annual Loss2, Average Annual Loss
0
0.5
1
1.5
2
2.5
3
3.5
AAL
AIRARAEQEFPMRMS
$ M
illio
ns
0
0.5
1
1.5
2
2.5
3
3.5
AAL
AIRARAEQEFPMRMS
$ M
illio
ns

39
Statewide Dynamic Range of Loss CostsStatewide Dynamic Range of Loss Costs
Ratio = (Sum Top 5 County Loss Costs)/(Sum Bottom 5 County Loss Costs)
Ratio of top 5 to bottom 5 loss costs
0
5
10
15
20
25
30
35
40
AIR ARA EQE FPM RMS
Rat
io
Maximum of 972
Median of 972
Minimum of 972

40
Changes in Models from Prior Year’s ModelChanges in Models from Prior Year’s Model
-100%
-80%
-60%
-40%
-20%
0%
20%
40%
60%
80%
100%
SUW
ANN
EEH
AMILTO
NM
ADISO
NC
OLU
MBIA
LAFAYETTEBR
ADFO
RD
GILC
HR
ISTJEFFER
SON
BAKERALAC
HU
AU
NIO
NTAYLO
RC
LAYD
IXIEM
ARIO
NPU
TNAM
VOLU
SIALEVYD
UVAL
SEMIN
OLE
LAKEW
AKULLA
LEON
JACKSO
NN
ASSAUSU
MTER
FLAGLER
GAD
SDEN
SAINT JO
HN
SO
RAN
GE
POLK
HO
LMES
HILLSBO
RO
UG
HH
ARD
EEH
IGH
LAND
SO
SCEO
LAC
ITRU
SBR
EVARD
HER
NAN
DO
WASH
ING
TON
PASCO
OKEEC
HO
BEED
ESOTO
SANTA R
OSA
LIBERTY
GLAD
ESESC
AMBIA
PINELLAS
WALTO
NM
ANATEE
CALH
OU
NO
KALOO
SAH
END
RY
IND
IAN R
IVERSAR
ASOTA
FRAN
KLINSAIN
T LUC
IEC
HAR
LOTTE
BAYBR
OW
ARD
MAR
TING
ULF
PALM BEAC
HLEEM
IAMI-D
ADE
CO
LLIERM
ON
RO
E
County
Perc
ent C
hang
e AIRARAEQEFPM1.5RMS

41
Change in Wood Frame Loss Costs: 2006 to 2007 (All Models)
Change in Wood Frame Loss Costs: 2006 to 2007 (All Models)
FPM FPM
AIR AIR ARA EQE EQE
RMS RMS
Percent Change from Version 1.5 to 2.6

42
Overall SummaryOverall Summary
• Fundamentally, models vary because their developers select different, on the surface equally valid, methods to solve the four basic components (frequency, wind, friction, and vulnerability) of loss modeling.
• Even if we could decide on a “perfect” solution for the four components, the uncertainty in meteorological parameters and other input data would cause significant uncertainty in loss costs.

43
AIRAIR

44
AIR Loss CostAIR Loss Cost

45
AIR Loss CostAIR Loss Cost
0
2
4
6
8
10
12
14
SU
WA
NN
EE
HA
MILTO
NM
AD
ISO
NC
OLU
MB
IALA
FAY
ETTEB
RAD
FOR
DG
ILCH
RIS
TJE
FFER
SO
NB
AKE
RA
LACH
UA
UN
ION
TAYLO
RC
LAYD
IXIE
MA
RIO
NP
UTN
AM
VO
LUS
IALE
VYD
UVA
LS
EM
INO
LELA
KEW
AKU
LLALE
ON
JAC
KS
ON
NA
SSA
US
UM
TER
FLAGLER
GA
DS
DEN
SA
INT JO
HN
SO
RAN
GE
PO
LKH
OLM
ES
HILLS
BO
RO
UG
HH
AR
DE
EH
IGH
LAND
SO
SC
EO
LAC
ITRU
SB
REV
AR
DH
ER
NA
ND
OW
ASH
ING
TON
PA
SCO
OK
EEC
HO
BEE
DE
SOTO
SA
NTA
RO
SALIB
ERTY
GLAD
ES
ES
CA
MBIA
PIN
ELLASW
ALTO
NM
AN
ATEE
CA
LHO
UN
OK
ALOO
SA
HE
ND
RY
IND
IAN
RIV
ERS
AR
AS
OTA
FRAN
KLIN
SA
INT LU
CIE
CH
ARLO
TTEB
AY
BR
OW
ARD
MA
RTIN
GU
LFP
ALM
BEA
CH
LEE
MIA
MI-D
AD
EC
OLLIE
RM
ON
RO
E
Median Min Max AIR 06

46
AIR RankAIR Rank

47
AIR Change Wood Frame 2005-2006AIR Change Wood Frame 2005-2006

48
ARAARA
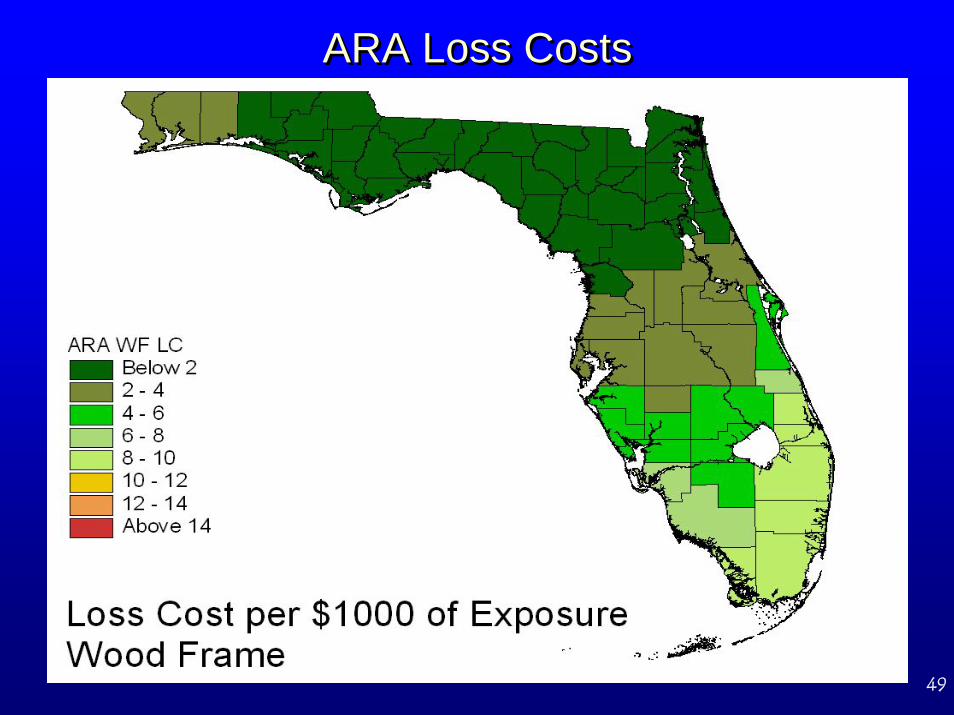
49
ARA Loss CostsARA Loss Costs

50
ARA Loss CostARA Loss Cost
0
2
4
6
8
10
12
14
SUW
ANN
EEH
AMILTO
NM
ADISO
NC
OLU
MBIA
LAFAYETTEBR
ADFO
RD
GILC
HR
ISTJEFFER
SON
BAKERALAC
HU
AU
NIO
NTAYLO
RC
LAYD
IXIEM
ARIO
NPU
TNAM
VOLU
SIALEVYD
UVAL
SEMIN
OLE
LAKEW
AKULLA
LEON
JACKSO
NN
ASSAUSU
MTER
FLAGLER
GAD
SDEN
SAINT JO
HN
SO
RAN
GE
POLK
HO
LMES
HILLSBO
RO
UG
HH
ARD
EEH
IGH
LAND
SO
SCEO
LAC
ITRU
SBR
EVARD
HER
NAN
DO
WASH
ING
TON
PASCO
OKEEC
HO
BEED
ESOTO
SANTA R
OSA
LIBERTY
GLAD
ESESC
AMBIA
PINELLAS
WALTO
NM
ANATEE
CALH
OU
NO
KALOO
SAH
END
RY
IND
IAN R
IVERSAR
ASOTA
FRAN
KLINSAIN
T LUC
IEC
HAR
LOTTE
BAYBR
OW
ARD
MAR
TING
ULF
PALM BEAC
HLEEM
IAMI-D
ADE
CO
LLIERM
ON
RO
E
Median Min Max ARA06
51
ARA RankARA RankARA Rank

52
ARA Change Wood Frame 2005-2006ARA Change Wood Frame 2005-2006

53
EQEEQE
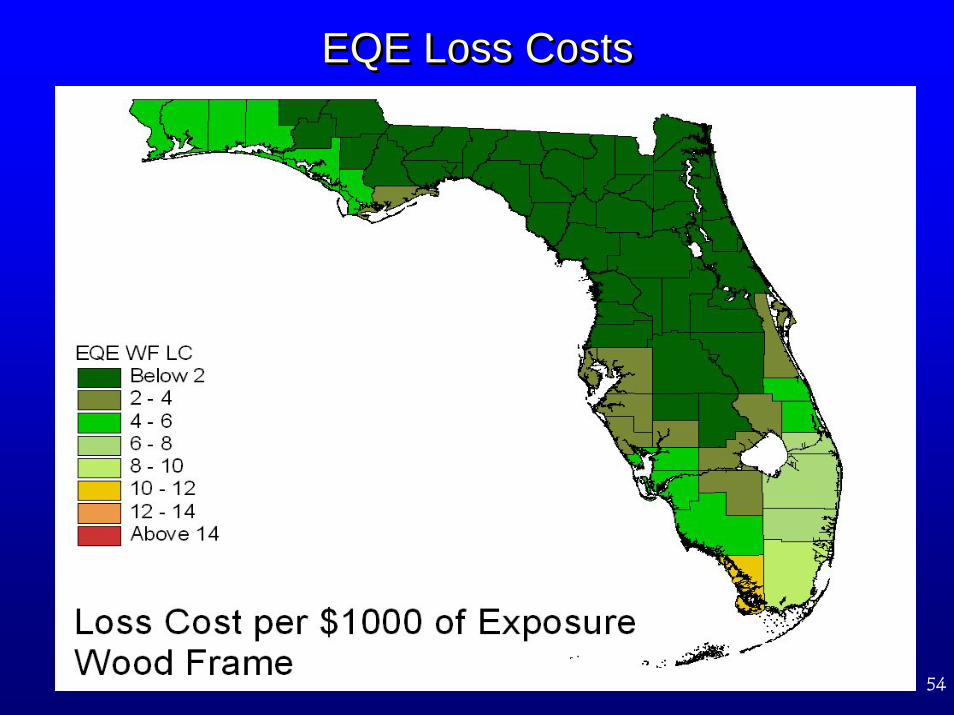
54
EQE Loss CostsEQE Loss Costs

55
EQE Loss CostsEQE Loss Costs
0
2
4
6
8
10
12
14
SUW
ANN
EEH
AMILTO
NM
ADISO
NC
OLU
MBIA
LAFAYETTEBR
ADFO
RD
GILC
HR
ISTJEFFER
SON
BAKERALAC
HU
AU
NIO
NTAYLO
RC
LAYD
IXIEM
ARIO
NPU
TNAM
VOLU
SIALEVYD
UVAL
SEMIN
OLE
LAKEW
AKULLA
LEON
JACKSO
NN
ASSAUSU
MTER
FLAGLER
GAD
SDEN
SAINT JO
HN
SO
RAN
GE
POLK
HO
LMES
HILLSBO
RO
UG
HH
ARD
EEH
IGH
LAND
SO
SCEO
LAC
ITRU
SBR
EVARD
HER
NAN
DO
WASH
ING
TON
PASCO
OKEEC
HO
BEED
ESOTO
SANTA R
OSA
LIBERTY
GLAD
ESESC
AMBIA
PINELLAS
WALTO
NM
ANATEE
CALH
OU
NO
KALOO
SAH
END
RY
IND
IAN R
IVERSAR
ASOTA
FRAN
KLINSAIN
T LUC
IEC
HAR
LOTTE
BAYBR
OW
ARD
MAR
TING
ULF
PALM BEAC
HLEEM
IAMI-D
ADE
CO
LLIERM
ON
RO
E
Median Min max EQE06

56
EQE RankEQE Rank
57
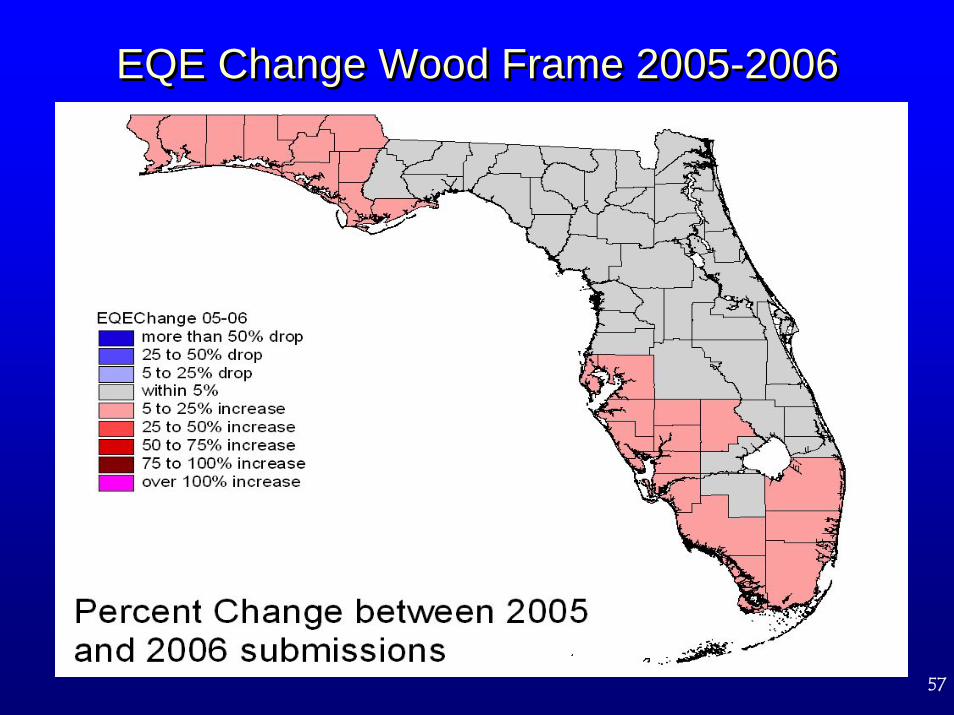
EQE Change Wood Frame 2005-2006EQE Change Wood Frame 2005-2006

58
FPMFPM

59
FPM Loss CostsFPM Loss Costs

60
FPM Loss CostsFPM Loss Costs
0
2
4
6
8
10
12
14
SU
WAN
NEE
HAM
ILTON
MAD
ISO
NC
OLU
MBIA
LAFAYETTE
BR
ADFO
RD
GILC
HR
IST
JEFFE
RSO
NBAKE
RALA
CH
UA
UN
ION
TAYLO
RC
LAYD
IXIEM
AR
ION
PU
TNAM
VO
LUSIA
LEVY
DU
VAL
SEM
INO
LELAK
EW
AKU
LLALEO
NJA
CKSO
NN
ASS
AU
SU
MTE
RFLA
GLE
RG
AD
SDEN
SAIN
T JOH
NS
OR
AN
GE
PO
LKH
OLM
ESH
ILLSBO
RO
UG
HH
AR
DEE
HIG
HLA
ND
SO
SC
EOLA
CITR
US
BR
EVAR
DH
ER
NAN
DO
WAS
HIN
GTO
NPASC
OO
KEE
CH
OBE
ED
ESO
TOSAN
TA R
OSA
LIBER
TYG
LADES
ESC
AM
BIA
PIN
ELLA
SW
ALTON
MAN
ATE
EC
ALH
OU
NO
KALO
OSA
HEN
DR
YIN
DIA
N R
IVER
SAR
ASO
TAFR
ANKLIN
SAIN
T LUC
IEC
HAR
LOTTE
BAY
BR
OW
AR
DM
AR
TING
ULF
PALM
BEAC
HLEEM
IAM
I-DAD
EC
OLLIER
MO
NR
OE
Median Min Max FPM06

61
FPM RankFPM Rank

62
FPM Change Wood Frame 2005-2006FPM Change Wood Frame 2005-2006

63
RMSRMS

64
RMS Loss CostsRMS Loss Costs

65
RMS Loss CostsRMS Loss Costs
0
2
4
6
8
10
12
14
SU
WAN
NEE
HAM
ILTON
MA
DISO
NC
OLU
MB
IALAFA
YETTE
BR
AD
FOR
DG
ILCH
RIS
TJEFFER
SO
NB
AKE
RA
LAC
HU
AU
NIO
NTAY
LOR
CLA
YD
IXIE
MA
RIO
NP
UTN
AMV
OLU
SIALEV
YD
UV
ALS
EMIN
OLE
LAKE
WA
KU
LLALEO
NJAC
KSO
NN
ASS
AUS
UM
TER
FLAG
LER
GAD
SDE
NS
AINT JO
HN
SO
RA
NG
EP
OLK
HO
LME
SH
ILLSBO
RO
UG
HH
ARD
EE
HIG
HLA
ND
SO
SCEO
LAC
ITRU
SB
RE
VAR
DH
ERN
AN
DO
WA
SH
ING
TON
PAS
CO
OKE
EC
HO
BE
ED
ESO
TOS
ANTA R
OS
ALIB
ER
TYG
LAD
ESE
SCA
MB
IAP
INE
LLAS
WA
LTON
MA
NATE
EC
ALHO
UN
OKA
LOO
SA
HEN
DR
YIN
DIA
N R
IVER
SAR
ASO
TAFR
AN
KLINS
AINT LU
CIE
CH
AR
LOTTE
BAY
BR
OW
AR
DM
AR
TING
ULF
PALM
BE
ACH
LEEM
IAM
I-DA
DE
CO
LLIER
MO
NR
OE
Median Min Max RMS 06

66
RMS RankRMS Rank
67
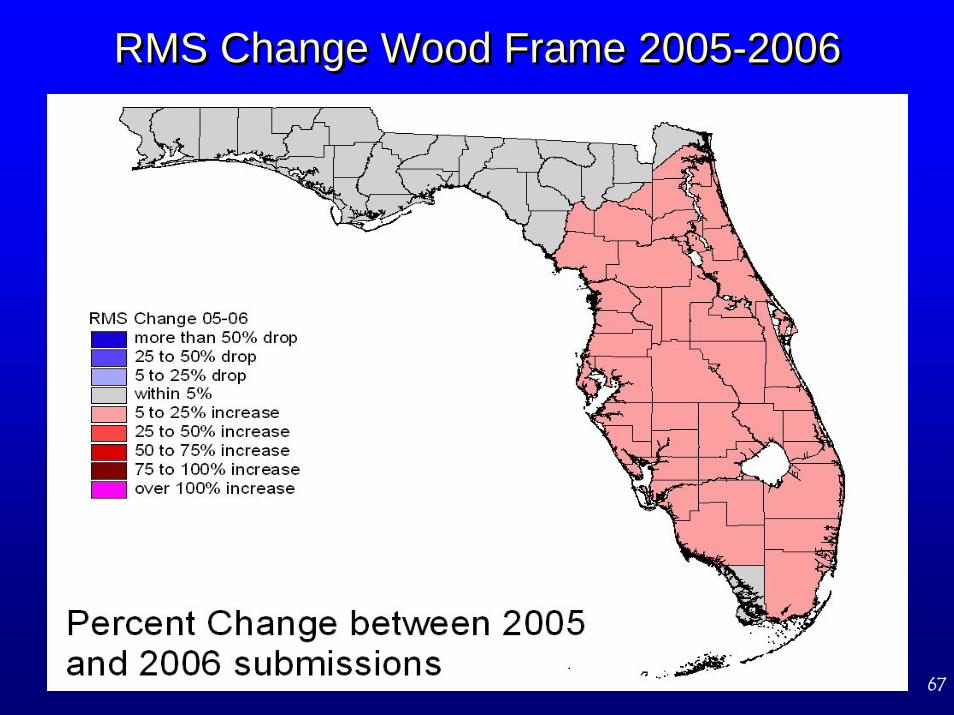
RMS Change Wood Frame 2005-2006RMS Change Wood Frame 2005-2006

68
Model Comparisons Contained in the ReportModel Comparisons Contained in the Report
• Commission reviews each model submitted independently against the Commission’s Standards
• Commission has not previously conducted a comparison of models
• Speaker Rubio requested the Commission complete various comparisons of the Public Model and the four private models

69
Comparison of Private Models versus Public Model Loss Costs by County
Comparison of Private Models versus Comparison of Private Models versus Public Model Loss Costs by CountyPublic Model Loss Costs by County
0
2
4
6
8
10
12
14
SUW
ANN
EEH
AMILTO
NM
ADISO
NC
OLU
MBIA
LAFAYETTEBR
ADFO
RD
GILC
HR
ISTJEFFER
SON
BAKERALAC
HU
AU
NIO
NTAYLO
RC
LAYD
IXIEM
ARIO
NPU
TNAM
VOLU
SIALEVYD
UVAL
SEMIN
OLE
LAKEW
AKULLA
LEON
JACKSO
NN
ASSAUSU
MTER
FLAGLER
GAD
SDEN
SAINT JO
HN
SO
RAN
GE
POLK
HO
LMES
HILLSBO
RO
UG
HH
ARD
EEH
IGH
LAND
SO
SCEO
LAC
ITRU
SBR
EVARD
HER
NAN
DO
WASH
ING
TON
PASCO
OKEEC
HO
BEED
ESOTO
SANTA R
OSA
LIBERTY
GLAD
ESESC
AMBIA
PINELLAS
WALTO
NM
ANATEE
CALH
OU
NO
KALOO
SAH
END
RY
IND
IAN R
IVERSAR
ASOTA
FRAN
KLINSAIN
T LUC
IEC
HAR
LOTTE
BAYBR
OW
ARD
MAR
TING
ULF
PALM BEAC
HLEEM
IAMI-D
ADE
CO
LLIERM
ON
RO
E
Median Min Max FPM06 AIR06 ARA06 EQE06 RMS06

70
AIR and Florida Public ModelAIR and Florida Public Model
0
2
4
6
8
10
12
14
SUW
ANN
EEH
AMILTO
NM
ADISO
NC
OLU
MBIA
LAFAYETTEBR
ADFO
RD
GILC
HR
ISTJEFFER
SON
BAKERALAC
HU
AU
NIO
NTAYLO
RC
LAYD
IXIEM
ARIO
NPU
TNAM
VOLU
SIALEVYD
UVAL
SEMIN
OLE
LAKEW
AKULLA
LEON
JACKSO
NN
ASSAUSU
MTER
FLAGLER
GAD
SDEN
SAINT JO
HN
SO
RAN
GE
POLK
HO
LMES
HILLSBO
RO
UG
HH
ARD
EEH
IGH
LAND
SO
SCEO
LAC
ITRU
SBR
EVARD
HER
NAN
DO
WASH
ING
TON
PASCO
OKEEC
HO
BEED
ESOTO
SANTA R
OSA
LIBERTY
GLAD
ESESC
AMBIA
PINELLAS
WALTO
NM
ANATEE
CALH
OU
NO
KALOO
SAH
END
RY
IND
IAN R
IVERSAR
ASOTA
FRAN
KLINSAIN
T LUC
IEC
HAR
LOTTE
BAYBR
OW
ARD
MAR
TING
ULF
PALM BEAC
HLEEM
IAMI-D
ADE
CO
LLIERM
ON
RO
E
Median Min Max FPM06 AIR06

71
ARA and Florida Public ModelARA and Florida Public Model
0
2
4
6
8
10
12
14
SUW
ANN
EEH
AMILTO
NM
ADISO
NC
OLU
MBIA
LAFAYETTEBR
ADFO
RD
GILC
HR
ISTJEFFER
SON
BAKERALAC
HU
AU
NIO
NTAYLO
RC
LAYD
IXIEM
ARIO
NPU
TNAM
VOLU
SIALEVYD
UVAL
SEMIN
OLE
LAKEW
AKULLA
LEON
JACKSO
NN
ASSAUSU
MTER
FLAGLER
GAD
SDEN
SAINT JO
HN
SO
RAN
GE
POLK
HO
LMES
HILLSBO
RO
UG
HH
ARD
EEH
IGH
LAND
SO
SCEO
LAC
ITRU
SBR
EVARD
HER
NAN
DO
WASH
ING
TON
PASCO
OKEEC
HO
BEED
ESOTO
SANTA R
OSA
LIBERTY
GLAD
ESESC
AMBIA
PINELLAS
WALTO
NM
ANATEE
CALH
OU
NO
KALOO
SAH
END
RY
IND
IAN R
IVERSAR
ASOTA
FRAN
KLINSAIN
T LUC
IEC
HAR
LOTTE
BAYBR
OW
ARD
MAR
TING
ULF
PALM BEAC
HLEEM
IAMI-D
ADE
CO
LLIERM
ON
RO
E
Median Min Max FPM06 ARA06

72
EQE and Florida Public ModelEQE and Florida Public Model
0
2
4
6
8
10
12
14
SUW
ANN
EEH
AMILTO
NM
ADISO
NC
OLU
MBIA
LAFAYETTEBR
ADFO
RD
GILC
HR
ISTJEFFER
SON
BAKERALAC
HU
AU
NIO
NTAYLO
RC
LAYD
IXIEM
ARIO
NPU
TNAM
VOLU
SIALEVYD
UVAL
SEMIN
OLE
LAKEW
AKULLA
LEON
JACKSO
NN
ASSAUSU
MTER
FLAGLER
GAD
SDEN
SAINT JO
HN
SO
RAN
GE
POLK
HO
LMES
HILLSBO
RO
UG
HH
ARD
EEH
IGH
LAND
SO
SCEO
LAC
ITRU
SBR
EVARD
HER
NAN
DO
WASH
ING
TON
PASCO
OKEEC
HO
BEED
ESOTO
SANTA R
OSA
LIBERTY
GLAD
ESESC
AMBIA
PINELLAS
WALTO
NM
ANATEE
CALH
OU
NO
KALOO
SAH
END
RY
IND
IAN R
IVERSAR
ASOTA
FRAN
KLINSAIN
T LUC
IEC
HAR
LOTTE
BAYBR
OW
ARD
MAR
TING
ULF
PALM BEAC
HLEEM
IAMI-D
ADE
CO
LLIERM
ON
RO
E
Median Min Max FPM06 EQE06

73
RMS and Florida Public ModelRMS and Florida Public Model
0
2
4
6
8
10
12
14
SUW
ANN
EEH
AMILTO
NM
ADISO
NC
OLU
MBIA
LAFAYETTEBR
ADFO
RD
GILC
HR
ISTJEFFER
SON
BAKERALAC
HU
AU
NIO
NTAYLO
RC
LAYD
IXIEM
ARIO
NPU
TNAM
VOLU
SIALEVYD
UVAL
SEMIN
OLE
LAKEW
AKULLA
LEON
JACKSO
NN
ASSAUSU
MTER
FLAGLER
GAD
SDEN
SAINT JO
HN
SO
RAN
GE
POLK
HO
LMES
HILLSBO
RO
UG
HH
ARD
EEH
IGH
LAND
SO
SCEO
LAC
ITRU
SBR
EVARD
HER
NAN
DO
WASH
ING
TON
PASCO
OKEEC
HO
BEED
ESOTO
SANTA R
OSA
LIBERTY
GLAD
ESESC
AMBIA
PINELLAS
WALTO
NM
ANATEE
CALH
OU
NO
KALOO
SAH
END
RY
IND
IAN R
IVERSAR
ASOTA
FRAN
KLINSAIN
T LUC
IEC
HAR
LOTTE
BAYBR
OW
ARD
MAR
TING
ULF
PALM BEAC
HLEEM
IAMI-D
ADE
CO
LLIERM
ON
RO
E
Median Min Max FPM06 RMS06

74
2007 Model Acceptability Review Process(February – April)
2007 Model Acceptability Review Process(February – April)
• February– Receipt of five (5) model submissions
• March– Commission met to review the submissions and to
authorize the on-site audits– Professional Team provided modelers with a pre-visit
letter outlining specific issues and identifying lines of inquiry that were followed during the on-site audits
– On-site audits begun
• April– On-site audits continued
75
2007 Model Acceptability Review Process(May – August)
2007 Model Acceptability Review Process(May – August)
• May– Additional audits of FPM and ARA– Commission met to determine acceptability of the
AIR, ARA, and EQE models
• June– Additional audits of FPM and RMS– Commission met to determine acceptability of the
RMS model
• August– Commission met to determine acceptability of the
FPM model

76
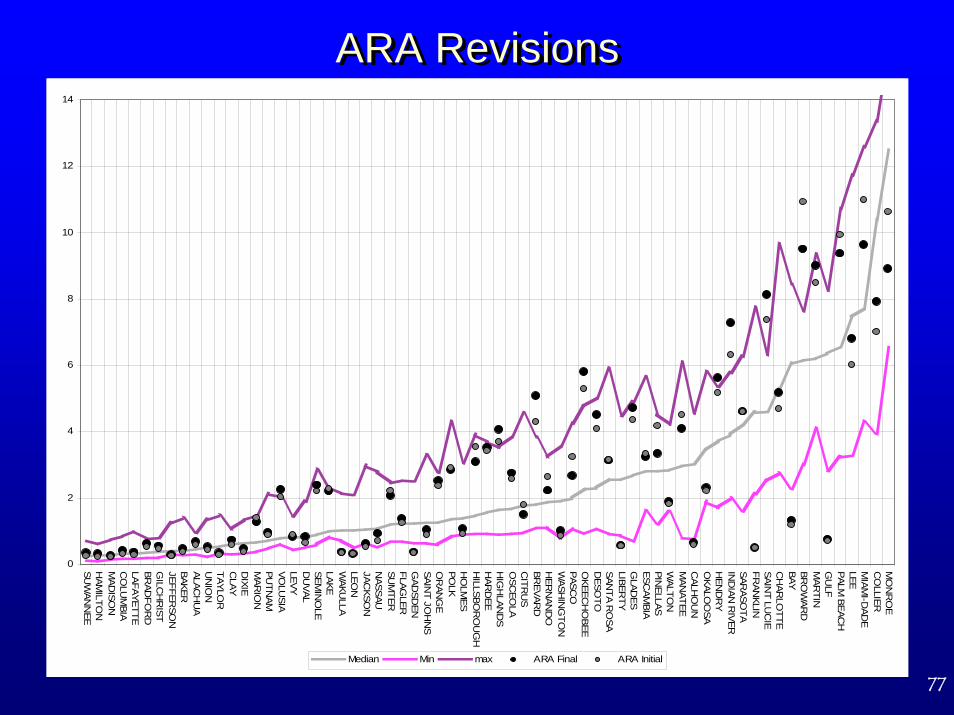
Analysis of ChangesOriginal Submission to Final Version*
Analysis of ChangesOriginal Submission to Final Version*
• Modelers are allowed to make revisions and corrections during the review process
• Impact of changes made during the 2007 review process are highlighted in the following slides
* AIR had no revisions or corrections to the loss costs during the 2007 review process
77
ARA RevisionsARA Revisions
0
2
4
6
8
10
12
14
SUW
ANN
EEH
AMILTO
NM
ADISO
NC
OLU
MBIA
LAFAYETTEBR
ADFO
RD
GILC
HR
ISTJEFFER
SON
BAKERALAC
HU
AU
NIO
NTAYLO
RC
LAYD
IXIEM
ARIO
NPU
TNAM
VOLU
SIALEVYD
UVAL
SEMIN
OLE
LAKEW
AKULLA
LEON
JACKSO
NN
ASSAUSU
MTER
FLAGLER
GAD
SDEN
SAINT JO
HN
SO
RAN
GE
POLK
HO
LMES
HILLSBO
RO
UG
HH
ARD
EEH
IGH
LAND
SO
SCEO
LAC
ITRU
SBR
EVARD
HER
NAN
DO
WASH
ING
TON
PASCO
OKEEC
HO
BEED
ESOTO
SANTA R
OSA
LIBERTY
GLAD
ESESC
AMBIA
PINELLAS
WALTO
NM
ANATEE
CALH
OU
NO
KALOO
SAH
END
RY
IND
IAN R
IVERSAR
ASOTA
FRAN
KLINSAIN
T LUC
IEC
HAR
LOTTE
BAYBR
OW
ARD
MAR
TING
ULF
PALM BEAC
HLEEM
IAMI-D
ADE
CO
LLIERM
ON
RO
E
Median Min max ARA Final ARA Initial

78
EQE RevisionsEQE Revisions
0
2
4
6
8
10
12
14
SUW
ANN
EEH
AMILTO
NM
ADISO
NC
OLU
MBIA
LAFAYETTEBR
ADFO
RD
GILC
HR
ISTJEFFER
SON
BAKERALAC
HU
AU
NIO
NTAYLO
RC
LAYD
IXIEM
ARIO
NPU
TNAM
VOLU
SIALEVYD
UVAL
SEMIN
OLE
LAKEW
AKULLA
LEON
JACKSO
NN
ASSAUSU
MTER
FLAGLER
GAD
SDEN
SAINT JO
HN
SO
RAN
GE
POLK
HO
LMES
HILLSBO
RO
UG
HH
ARD
EEH
IGH
LAND
SO
SCEO
LAC
ITRU
SBR
EVARD
HER
NAN
DO
WASH
ING
TON
PASCO
OKEEC
HO
BEED
ESOTO
SANTA R
OSA
LIBERTY
GLAD
ESESC
AMBIA
PINELLAS
WALTO
NM
ANATEE
CALH
OU
NO
KALOO
SAH
END
RY
IND
IAN R
IVERSAR
ASOTA
FRAN
KLINSAIN
T LUC
IEC
HAR
LOTTE
BAYBR
OW
ARD
MAR
TING
ULF
PALM BEAC
HLEEM
IAMI-D
ADE
CO
LLIERM
ON
RO
E
Median Min max EQE Final EQE Initial

79
FPM RevisionsFPM Revisions
0
2
4
6
8
10
12
14
SUW
ANN
EEH
AMILTO
NM
ADISO
NC
OLU
MBIA
LAFAYETTEBR
ADFO
RD
GILC
HR
ISTJEFFER
SON
BAKERALAC
HU
AU
NIO
NTAYLO
RC
LAYD
IXIEM
ARIO
NPU
TNAM
VOLU
SIALEVYD
UVAL
SEMIN
OLE
LAKEW
AKULLA
LEON
JACKSO
NN
ASSAUSU
MTER
FLAGLER
GAD
SDEN
SAINT JO
HN
SO
RAN
GE
POLK
HO
LMES
HILLSBO
RO
UG
HH
ARD
EEH
IGH
LAND
SO
SCEO
LAC
ITRU
SBR
EVARD
HER
NAN
DO
WASH
ING
TON
PASCO
OKEEC
HO
BEED
ESOTO
SANTA R
OSA
LIBERTY
GLAD
ESESC
AMBIA
PINELLAS
WALTO
NM
ANATEE
CALH
OU
NO
KALOO
SAH
END
RY
IND
IAN R
IVERSAR
ASOTA
FRAN
KLINSAIN
T LUC
IEC
HAR
LOTTE
BAYBR
OW
ARD
MAR
TING
ULF
PALM BEAC
HLEEM
IAMI-D
ADE
CO
LLIERM
ON
RO
E
Median Min max FPM Final (2.6) FPM Initial (2.0) FPM (2.5)

80
RMS RevisionsRMS Revisions
0
2
4
6
8
10
12
14
SUW
ANN
EEH
AMILTO
NM
ADISO
NC
OLU
MBIA
LAFAYETTEBR
ADFO
RD
GILC
HR
ISTJEFFER
SON
BAKERALAC
HU
AU
NIO
NTAYLO
RC
LAYD
IXIEM
ARIO
NPU
TNAM
VOLU
SIALEVYD
UVAL
SEMIN
OLE
LAKEW
AKULLA
LEON
JACKSO
NN
ASSAUSU
MTER
FLAGLER
GAD
SDEN
SAINT JO
HN
SO
RAN
GE
POLK
HO
LMES
HILLSBO
RO
UG
HH
ARD
EEH
IGH
LAND
SO
SCEO
LAC
ITRU
SBR
EVARD
HER
NAN
DO
WASH
ING
TON
PASCO
OKEEC
HO
BEED
ESOTO
SANTA R
OSA
LIBERTY
GLAD
ESESC
AMBIA
PINELLAS
WALTO
NM
ANATEE
CALH
OU
NO
KALOO
SAH
END
RY
IND
IAN R
IVERSAR
ASOTA
FRAN
KLINSAIN
T LUC
IEC
HAR
LOTTE
BAYBR
OW
ARD
MAR
TING
ULF
PALM BEAC
HLEEM
IAMI-D
ADE
CO
LLIERM
ON
RO
E
Median Min max RMS Final RMS Initial

81
Difference at County Level Between Original and Final Submissions
Difference at County Level Between Original and Final Submissions
0%
10%
20%
30%
40%
50%
60%
70%
80%
90%
1 11 21 31 41 51 61
Counties
Abs
. Pct
Cha
nge
FPM ARA RMS EQE

82
Primary Findings: GeneralPrimary Findings: General
• Aside from some anomalies, the output ranges of models submitted to the Commission under the 2006 Standards (found acceptable in 2007) fall within the range one would expect given the universe of possible scientifically valid approaches.
• Some year to year variation is expected from any model and particularly a young model.

83
Primary Findings: ComparisonsInvolving the Public Model
Primary Findings: ComparisonsInvolving the Public Model
• The Public Model has more observations below the minimum and above the maximum levels generated by the 972 models used as a benchmark for this study.
• The Public Model observations near or above the maximum loss costs generated by the 972 models tend to be in the lower and mid-level loss cost counties.
• The year to year (2006 to 2007) variability is less than that of ARA, but is generally greater than three of the long-standing private models (AIR, EQE, and RMS).

84
Moving the Modeling Process Forward:Areas of Current and Future InvestigationMoving the Modeling Process Forward:Moving the Modeling Process Forward:
Areas of Current and Future InvestigationAreas of Current and Future Investigation
• Demand Surge
• Commercial Residential
• Climate Models
• Risk Loadings
• Others Ways to Improve the Process
Related Documents


