Comparison of HRT-3 Glaucoma Probability Score and Subjective Stereophotograph Assessment for Prediction of Progression in Glaucoma Luciana M. Alencar 1,2 , Christopher Bowd 1 , Robert N. Weinreb 1 , Linda M. Zangwill 1 , Pamela A. Sample 1 , and Felipe A. Medeiros 1,2 1 Hamilton Glaucoma Center, Department of Ophthalmology, University of California San Diego, La Jolla, California 2 Department of Ophthalmology, University of São Paulo, São Paulo, Brazil Abstract Purpose—To assess whether baseline Glaucoma Probability Score (GPS; HRT-3; Heidelberg Engineering, Dossenheim, Germany) results are predictive of progression in patients with suspected glaucoma. The GPS is a new feature of the confocal scanning laser ophthalmoscope that generates an operator-independent, three-dimensional model of the optic nerve head and gives a score for the probability that this model is consistent with glaucomatous damage. Methods—The study included 223 patients with suspected glaucoma during an average follow-up of 63.3 months. Included subjects had a suspect optic disc appearance and/or elevated intraocular pressure, but normal visual fields. Conversion was defined as development of either repeatable abnormal visual fields or glaucomatous deterioration in the appearance of the optic disc during the study period. The association between baseline GPS and conversion was investigated by Cox regression models. Results—Fifty-four (24.2%) eyes converted. In multivariate models, both higher values of GPS global and subjective stereophotograph assessment (larger cup–disc ratio and glaucomatous grading) were predictive of conversion: adjusted hazard ratios (95% CI): 1.31 (1.15–1.50) per 0.1 higher global GPS, 1.34 (1.12–1.62) per 0.1 higher CDR, and 2.34 (1.22–4.47) for abnormal grading, respectively. No significant differences (P > 0.05 for all comparisons) were found between the c-index values (equivalent to area under ROC curve) for the multivariate models (0.732, 0.705, and 0.699, respectively). Conclusions—GPS values were predictive of conversion in our population of patients with suspected glaucoma. Further, they performed as well as subjective assessment of the optic disc. These results suggest that GPS could potentially replace stereophotograph as a tool for estimating the likelihood of conversion to glaucoma. Several studies have shown that the appearance of the optic nerve and retinal nerve fiber layer (RNFL) can precede visual field loss in glaucoma. 1,2 However, optic disc evaluation is subjective, and stereoscopic photographs are not readily obtained in clinical practice. In fact, Copyright © Association for Research in Vision and Ophthalmology Corresponding author: Felipe A. Medeiros, Hamilton Glaucoma Center, University of California, San Diego, 9500 Gilman Drive, La Jolla, CA 92093-0946; [email protected].. Disclosure: L.M. Alencar, None; C. Bowd, None; R.N. Weinreb, Heidelberg Engineering (F, R), Carl Zeiss Meditec (F, R); L.M. Zangwill, Heidelberg Engineering (F), Carl Zeiss Meditec (F); P.A. Sample, Carl Zeiss Meditec (F); F.A. Medeiros, Carl Zeiss Meditec (F, R), Heidelberg Engineering (R) NIH Public Access Author Manuscript Invest Ophthalmol Vis Sci. Author manuscript; available in PMC 2010 March 31. Published in final edited form as: Invest Ophthalmol Vis Sci. 2008 May ; 49(5): 1898–1906. doi:10.1167/iovs.07-0111. NIH-PA Author Manuscript NIH-PA Author Manuscript NIH-PA Author Manuscript

Welcome message from author
This document is posted to help you gain knowledge. Please leave a comment to let me know what you think about it! Share it to your friends and learn new things together.
Transcript
Comparison of HRT-3 Glaucoma Probability Score and SubjectiveStereophotograph Assessment for Prediction of Progression inGlaucoma
Luciana M. Alencar1,2, Christopher Bowd1, Robert N. Weinreb1, Linda M. Zangwill1, PamelaA. Sample1, and Felipe A. Medeiros1,21Hamilton Glaucoma Center, Department of Ophthalmology, University of California San Diego, LaJolla, California2Department of Ophthalmology, University of São Paulo, São Paulo, Brazil
AbstractPurpose—To assess whether baseline Glaucoma Probability Score (GPS; HRT-3; HeidelbergEngineering, Dossenheim, Germany) results are predictive of progression in patients with suspectedglaucoma. The GPS is a new feature of the confocal scanning laser ophthalmoscope that generatesan operator-independent, three-dimensional model of the optic nerve head and gives a score for theprobability that this model is consistent with glaucomatous damage.
Methods—The study included 223 patients with suspected glaucoma during an average follow-upof 63.3 months. Included subjects had a suspect optic disc appearance and/or elevated intraocularpressure, but normal visual fields. Conversion was defined as development of either repeatableabnormal visual fields or glaucomatous deterioration in the appearance of the optic disc during thestudy period. The association between baseline GPS and conversion was investigated by Coxregression models.
Results—Fifty-four (24.2%) eyes converted. In multivariate models, both higher values of GPSglobal and subjective stereophotograph assessment (larger cup–disc ratio and glaucomatous grading)were predictive of conversion: adjusted hazard ratios (95% CI): 1.31 (1.15–1.50) per 0.1 higher globalGPS, 1.34 (1.12–1.62) per 0.1 higher CDR, and 2.34 (1.22–4.47) for abnormal grading, respectively.No significant differences (P > 0.05 for all comparisons) were found between the c-index values(equivalent to area under ROC curve) for the multivariate models (0.732, 0.705, and 0.699,respectively).
Conclusions—GPS values were predictive of conversion in our population of patients withsuspected glaucoma. Further, they performed as well as subjective assessment of the optic disc. Theseresults suggest that GPS could potentially replace stereophotograph as a tool for estimating thelikelihood of conversion to glaucoma.
Several studies have shown that the appearance of the optic nerve and retinal nerve fiber layer(RNFL) can precede visual field loss in glaucoma.1,2 However, optic disc evaluation issubjective, and stereoscopic photographs are not readily obtained in clinical practice. In fact,
Copyright © Association for Research in Vision and OphthalmologyCorresponding author: Felipe A. Medeiros, Hamilton Glaucoma Center, University of California, San Diego, 9500 Gilman Drive, LaJolla, CA 92093-0946; [email protected]: L.M. Alencar, None; C. Bowd, None; R.N. Weinreb, Heidelberg Engineering (F, R), Carl Zeiss Meditec (F, R); L.M.Zangwill, Heidelberg Engineering (F), Carl Zeiss Meditec (F); P.A. Sample, Carl Zeiss Meditec (F); F.A. Medeiros, Carl Zeiss Meditec(F, R), Heidelberg Engineering (R)
NIH Public AccessAuthor ManuscriptInvest Ophthalmol Vis Sci. Author manuscript; available in PMC 2010 March 31.
Published in final edited form as:Invest Ophthalmol Vis Sci. 2008 May ; 49(5): 1898–1906. doi:10.1167/iovs.07-0111.
NIH
-PA Author Manuscript
NIH
-PA Author Manuscript
NIH
-PA Author Manuscript
several research groups have found a low rate of conformance with recommended optic discexamination and documentation practice patterns for glaucoma.3–5 In a retrospective reviewof 395 medical charts, Fremont et al.4 found that almost half of the patients with glaucoma didnot have a photograph or drawing of the optic nerve head made at the time of their initialevaluation.
Recently, several imaging technologies have become available for structural evaluation of theoptic disc and RNFL and to assist in the diagnosis of glaucoma. One of these technologies,confocal scanning laser ophthalmoscopy (CSLO) provides objective measurements of opticdisc topography that have been shown to predict progression in those with suspected glaucoma.6,7 As part of the ocular hypertension treatment study, Zangwill et al.6 showed that CSLOstereometric parameters and the Moorfields regression analysis (MRA) had a significantpredictive value in discriminating those ocular hypertensive patients who converted toglaucoma from those who did not.
Previous CSLO measures used for evaluation of optic disc topography have been limited bythe need for an examiner to approximate the optic disc margin with a contour line to calculatestereometric parameters and the MRA. This requirement added an undesirable subjectivity tothe examination and may have resulted in significant differences in the topographic parametervalues obtained by different examiners.8 Also, accurate tracing of the contour line optimallyrequires simultaneous visualization of optic disc photographs,8 which obviously decreases thevalue of CSLO as a replacement method for stereophotographs in the assessment anddocumentation of the optic disc. To overcome this limitation, a new version of CSLO (HRT-3;Heidelberg Engineering GmbH, Dossenheim, Germany) includes the Glaucoma ProbabilityScore (GPS), an index that is independent of the contour line traced by the examiner. The GPSis based on a three-dimensional model of the entire topographical image and has been shownto discriminate glaucomatous from normal subjects in cross-sectional studies.9,10
The purpose of the present study was to evaluate the ability of the contour-line–independentparameter GPS to predict the development of visual field loss or optic disc deterioration inpersons with suspected glaucoma. Further, the predictive ability of this parameter wascompared to that of subjective stereophotograph assessment.
MethodsThis was an observational cohort study. Patients in this study participated in a prospectivelongitudinal study designed to evaluate optic nerve structure and visual function in glaucoma(DIGS; Diagnostic Innovations in Glaucoma Study) conducted at the Hamilton GlaucomaCenter (University of California, San Diego; UCSD). All patients from the DIGS who met theinclusion criteria described below were enrolled in the present study. Informed consent wasobtained from all participants. The UCSD Human Subjects Committee approved all protocolsand the methods described adhered to the tenets of the Declaration of Helsinki.
Subjects were defined as having suspected glaucoma according to the clinical examination bytwo glaucoma specialists (FAM, RNW). Included were those with suspect optic discappearance (as determined by subjective assessment) and/or elevated intraocular pressure (>21mm Hg). All subjects had normal and reliable standard automated perimetry (SAP) visual fieldsat baseline, as defined later in the paper. Eligible subjects were required to have had a visualfield examination and optic disc stereophotograph taken close in time to a baseline HRT scanused for evaluation. Baseline was set at the first occurrence of this matching, and the HRT datewas used as the baseline date. The average time interval between examinations was 1.4 months(median: 0.6 months, first quartile: 0.2 months, third quartile: 1.7 months). Only subjects withopen angles on gonioscopy were included. Subjects were excluded if they presented best-
Alencar et al. Page 2
Invest Ophthalmol Vis Sci. Author manuscript; available in PMC 2010 March 31.
NIH
-PA Author Manuscript
NIH
-PA Author Manuscript
NIH
-PA Author Manuscript
corrected visual acuity less than 20/40, spherical refraction outside ± 5.0 D and/or cylindercorrection outside 3.0 D, or any other ocular or systemic disease that could affect the opticnerve or the visual field. One eye of each patient was randomly selected for analysis.
For each eye, central corneal thickness (CCT) was calculated as the average of threemeasurements obtained during the same visit using an ultrasound pachymeter (Pachette GDH500; DGH Technology, Inc, Philadelphia, PA).
Standard Automated PerimetryOnly patients with normal and reliable visual fields on the baseline were included. Standardautomated perimetry (SAP) visual fields were obtained using either 24-2 Full Threshold orSwedish Interactive Thresholding Algorithm (SITA) (Humphrey Field Analyzer; Carl ZeissMeditec, Dublin, CA) strategies. Only tests with reliable results (≤33% fixation losses, falsepositives, and false negatives) were included.
Glaucomatous conversion by visual field was defined as the development of three consecutiveabnormal examinations during follow-up, or two consecutive when these were the lastexamination results available during follow-up. An abnormal result followed by a normal onewas not considered conversion. An abnormal visual field was defined as a pattern standarddeviation (PSD) with P < 0.05 and/or a glaucoma hemifield test (GHT; Humphrey Perimeter;Carl Zeiss Meditec, Inc., Oberkochen, Germany) with results outside normal limits. Twoexperienced glaucoma specialists verified that the visual field defects were consistent withglaucoma.
Stereophotograph GradingSimultaneous stereoscopic optic disc photographs (TRC-SS; Topcon Instrument Corp ofAmerica, Paramus, NJ) were reviewed with a stereoscopic viewer (Pentax Stereo Viewer II;Asahi Optical Co., Tokyo, Japan). Baseline stereophotographs were evaluated by two masked,experienced graders and classified as glaucomatous or normal. Glaucomatous optic discappearance was defined based on the presence of neuroretinal rim thinning, excavation,notching, or characteristic retinal nerve fiber layer defects. Vertical cup-to-disc ratio (CDR)was assessed by visually estimating the CDR based on the contour of the cup. The averagevalue between examiners was calculated and used for analysis. For progression assessment,each patient's most recent stereophotograph was compared with the baseline one. Each graderwas masked to the temporal sequence of the photographs. Definition of change was based onfocal or diffuse thinning of the neuroretinal rim, increased excavation, and the appearance orenlargement of RNFL defects.
Discrepancies between the two graders were resolved either by consensus or by adjudicationof a third experienced grader. Only photographs with adequate quality were included. Froman initial group of 310 patients who fulfilled inclusion criteria, 5 (2%) subjects had poor-qualityphotographs at baseline, and 29 (9%) did not have follow-up stereophotographs to assessprogression and were excluded from further analysis.
Confocal Scanning Laser OphthalmoscopyCSLO images were acquired using either the HRT-I or –II (Heidelberg Engineering, GmbH)and analyzed on each respective machine, using HRT-3 software. Further details on theseinstruments have been described previously.11–13 Only 15° images were used. For each patient,three topographical images were obtained and then combined and automatically aligned tomake a single mean topography used for analysis. Magnification errors were corrected usingpatients' corneal curvature measurements. Good-quality images required a focused reflectanceimage with a standard deviation not greater than 50 μm and centered GPS analysis. From an
Alencar et al. Page 3
Invest Ophthalmol Vis Sci. Author manuscript; available in PMC 2010 March 31.
NIH
-PA Author Manuscript
NIH
-PA Author Manuscript
NIH
-PA Author Manuscript
initial group of 310 patients who fulfilled inclusion criteria, 15 (5%) were excluded becausethe 15° HRT baseline image could not be retrieved, 26 (8%) were excluded after quality controlof the HRT mean image, 4 (1%) were excluded because the HRT was not able to run the GPSanalysis, and 11 (4%) were excluded as a result of highly off centered analysis of the GPSalgorithm.
The GPS is obtained using a new automated analysis independent of either contour line tracingor a reference plane. The software analyzes the optic disc and parapapillary retina topographyand builds a three-dimensional (3-D) model using five shape-based measures: cup size, cupdepth, and rim steepness (referring to the optic disc) and vertical (superior to inferior) andhorizontal (nasal to temporal) parapapillary nerve fiber layer curvatures. The values of theparameters are then fed into a machine-learning classifier analysis, a relevance vector machine(RVM), which compares the patient's results to previously defined healthy and glaucomatousmodels. Glaucomatous eyes usually present with flatter RNFL curvature and increased cupsize, depth, and slope (rim steepness). The final GPS is the probability that the model hasstructural differences from the normal model that are compatible with glaucomatous damage.The higher the GPS, the more similar it is to the glaucoma model.
GPS results were obtained for the global region, as well as for six predefined sectors (with 0°as temporal): temporal superior (45°-90°), nasal superior (91°-135°), nasal (136°-225°), nasalinferior (226°-270°), temporal inferior (271°-315°), and temporal (316°-44°).
Follow-up and Definition of Study EndpointsConversion to glaucoma in this study was defined by either visual field test results or opticdisc stereophotograph evaluation, whichever came first. Eyes in which a confirmed visual fielddefect developed or optic disc deterioration on stereophotographs were referred to asconverters.
For converters, follow-up time was defined as the time between the HRT baseline visit and thedate of the first abnormal visual field result or the first optic disc stereophotograph showingdeterioration (the study endpoint). For nonconverters in both visual field and optic discevaluation, follow-up time was defined as the time between the HRT baseline visit and dateof last available visual field test result or stereophotograph on DIGS, whichever came first.During follow-up time, each patient was treated at the discretion of the attendingophthalmologist.
Statistical AnalysisThe primary purpose of the study was to determine whether the baseline GPS is predictive ofprogression. Other variables analyzed as potential risk factors were age, baseline IOP, CCT,and the baseline SAP visual field index PSD. Hazard ratios (HRs) for the association betweenGPS parameters and the development of a documented progression were obtained by Coxproportional hazards models. We report HRs from univariate models, which do not adjust forthe presence of other factors, as well as adjusted HRs from multivariate Cox proportionalhazards models. For the multivariate models, we report hazard ratios after adjustment for age,baseline IOP, CCT, and SAP PSD. These variables have been reported to be significantlyassociated with the risk of development of glaucomatous visual field loss or optic discdeterioration among patients with ocular hypertension or suspected glaucoma.14–16
We also evaluated the ability of subjective stereophotograph evaluation (grading and verticalcup/disc ratio) in predicting the development of progression. Univariate hazard ratios werereported for stereophotograph grading (glaucoma versus normal) as well as for vertical CDR.
Alencar et al. Page 4
Invest Ophthalmol Vis Sci. Author manuscript; available in PMC 2010 March 31.
NIH
-PA Author Manuscript
NIH
-PA Author Manuscript
NIH
-PA Author Manuscript
Adjusted HRs were also reported for these variables after adjustment for age, baseline IOP,CCT, and SAP PSD.
As the magnitude of a hazard ratio for a particular variable depends on its unit of measurement,a direct comparison of HRs would be an inappropriate way of comparing the predictive abilitiesof GPS and stereophotograph assessment. For this purpose, we used the c-index, as suggestedby Harrell.17 The c-index is similar to the area under the receiver operating characteristic (ROC)curve and is frequently used to evaluate the discriminating ability of predictive models insurvival data. It is calculated as the proportion of all usable subject pairs in which the predictionsand outcomes are concordant. If the predicted survival time is larger for the subject who actuallysurvived longer, the predictions of the pair are concordant with the outcomes. In predicting thetime to an event, c is calculated by including all possible pairs of subjects, at least one of whomhas experienced the event (viz., progression). Two subjects' survival times cannot be orderedif both subjects are censored or if one has failed and the follow-up time of the other is less thanthe failure time of the first.18 A c-index of 0.5 indicates random predictions, whereas 1.0indicates perfect prediction. The c-index was calculated for multivariate models, includingGPS, and adjusting for age, baseline IOP, CCT, and SAP PSD, as well as for multivariatemodels including stereophotograph parameters and adjusting for the same variables. Therefore,each multivariate model contained the combination of an optic disc parameter (objective versussubjective) plus other variables previously identified as significantly associated with the riskof the development of glaucoma. To test for the significance of the difference in discriminationbetween two models, we used the rcorrp.cens function from Harrell's Hmisc/Design library.17 This computes U statistics for testing whether the predictions of one model are moreconcordant with actual observations than those of another model.
To adjust for potentially confounding effects of treatment, these analyses were also performedincorporating treatment as a time-dependent covariate.
Statistical analyses were performed with commercial software packages (SPSS, ver. 15.0;SPSS, Chicago, IL; Stata, ver. 9.0; StataCorp, College Station, TX; and S-PLUS ver. 6.0;Insightful Corp., Seattle, WA). The α level (type I error) was set at 0.05.
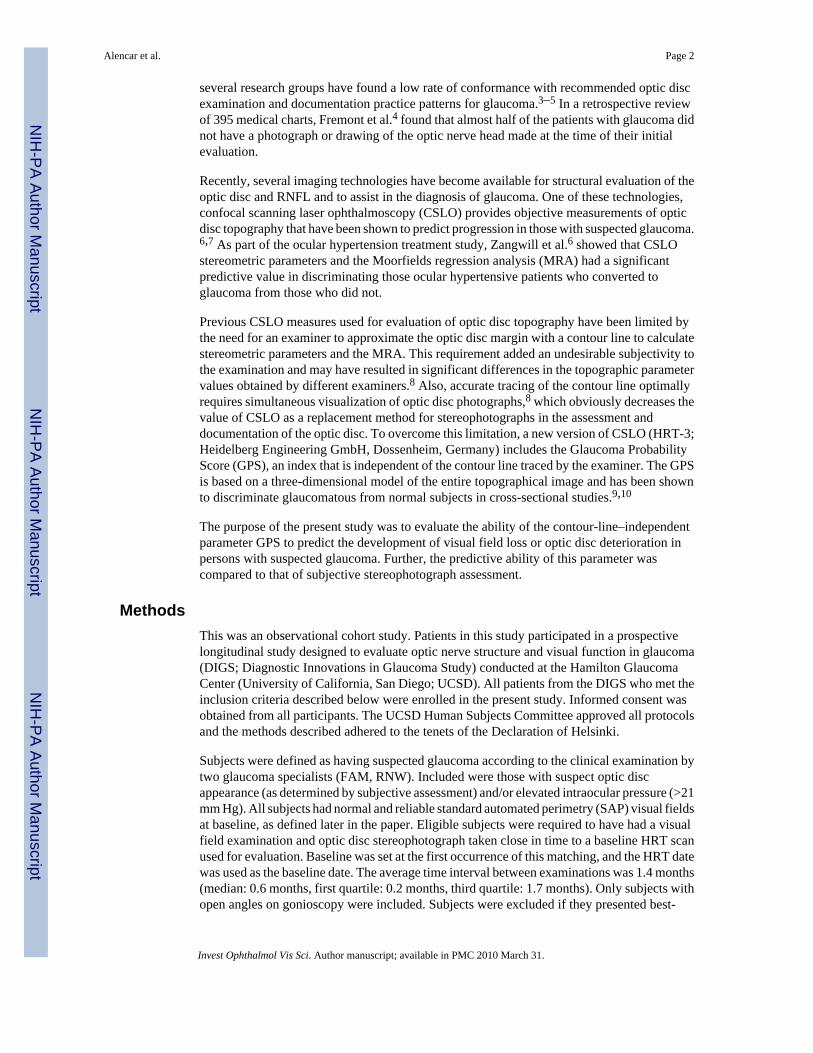
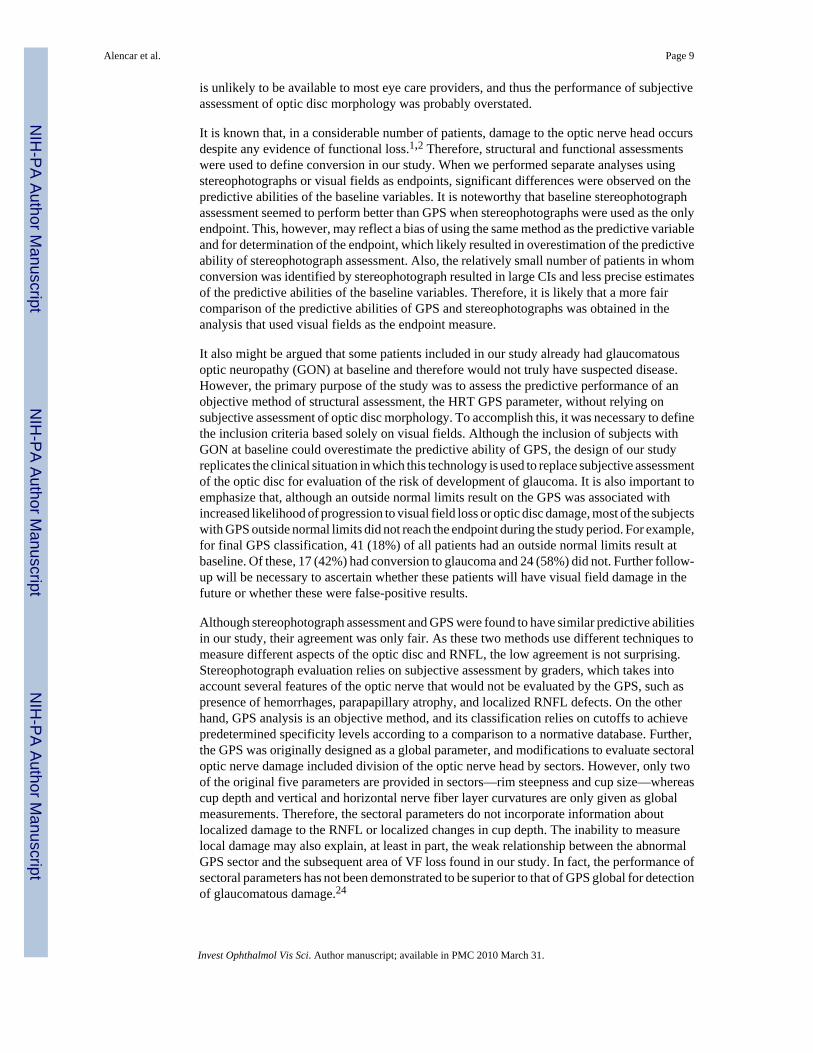
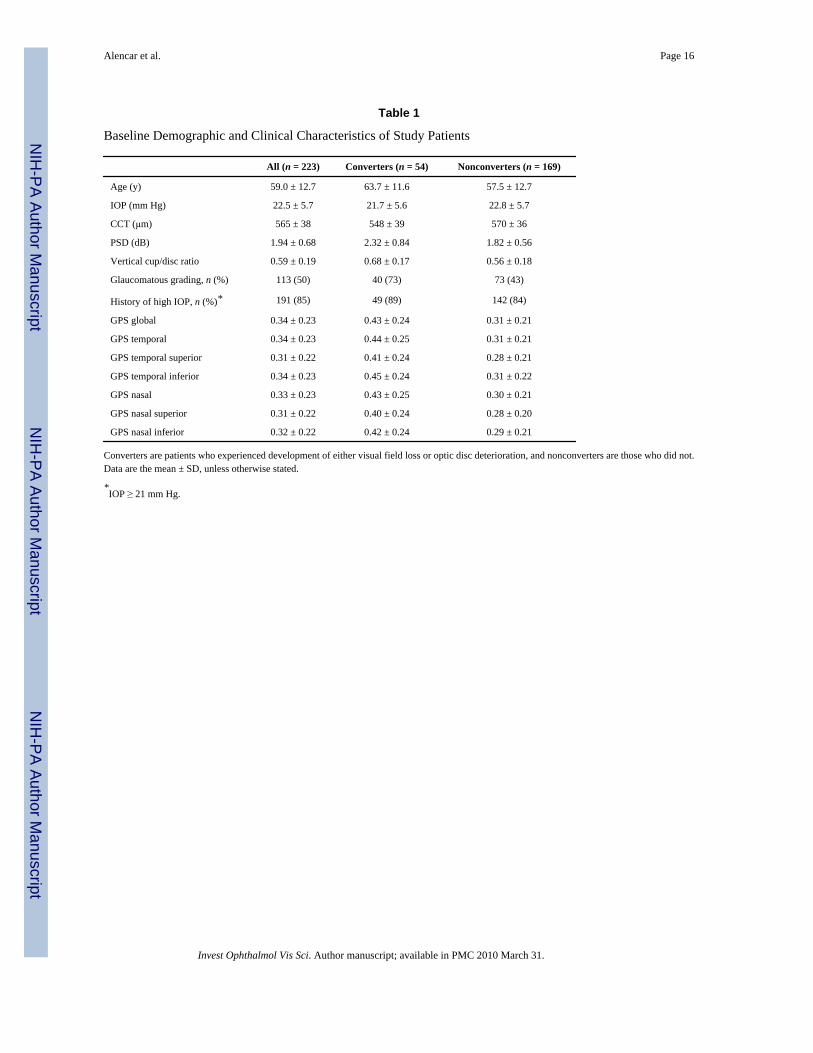
ResultsTwo-hundred and twenty-three eyes of 223 patients with suspected glaucoma were included.Table 1 shows baseline demographic and clinical characteristics of the patients included in thestudy. Fifty-four eyes (24.2%) showed conversion during the follow-up. Of these, 13 (24%)showed progression based first on development of optic disc changes, 32 (59.3%) based firston progressive visual field loss, and 9 (16.7%) based on both optic disc and visual field changesconcomitantly. For the 41 patients whose endpoint was determined by VF change, 33 had 3consecutive abnormal examination results, and 8 had only two repeatable abnormal visualfields, which were the last available examinations during follow-up. None of these eight casesshowed progression by stereophotographs during the study period. Exclusion of these eightconverters did not change the results of the study. Therefore, we report only analyses includingthe full group. Mean follow-up time until conversion was 53.1 ± 31.0 months (median 47.7months; range, 11.4–132.9 months). Mean follow-up time for nonconverters was 66.6 ± 38.7months (median 59.0 months; range, 6.5–156.1 months). Figure 1 illustrates the Kaplan-Meierestimated cumulative probability of development of visual field loss or optic disc changesduring the study. At 5 years of follow-up, the overall cumulative probability of conversion was21%.
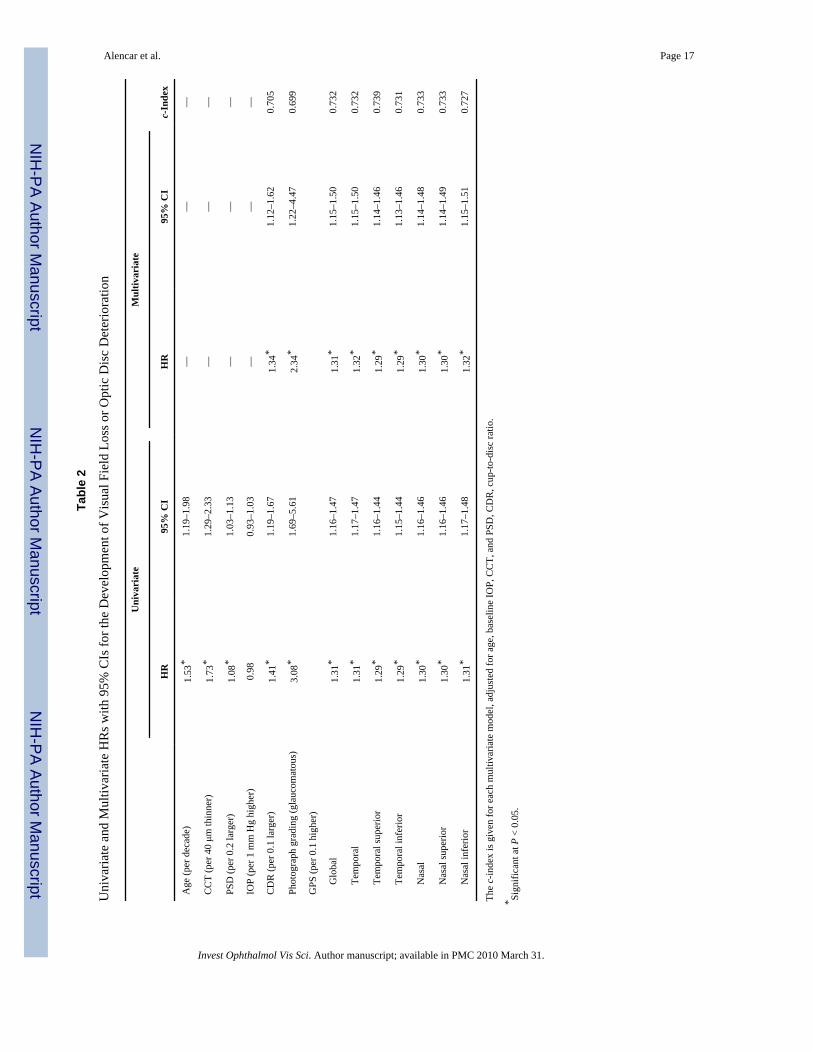
Table 2 shows univariate HRs with 95% CI for each putative predictive factor for conversion.In univariate analyses, both global and sectoral GPS results were significantly associated with
Alencar et al. Page 5
Invest Ophthalmol Vis Sci. Author manuscript; available in PMC 2010 March 31.
NIH
-PA Author Manuscript
NIH
-PA Author Manuscript
NIH
-PA Author Manuscript
progression, with HRs ranging from 1.29 (temporal superior and temporal inferior) to 1.31(global, temporal, and nasal inferior). A 0.1 larger global GPS was associated with a 31%increase in the risk of progression (HR: 1.31 per 0.1 higher; 95% CI: 1.16–1.47; P < 0.001).
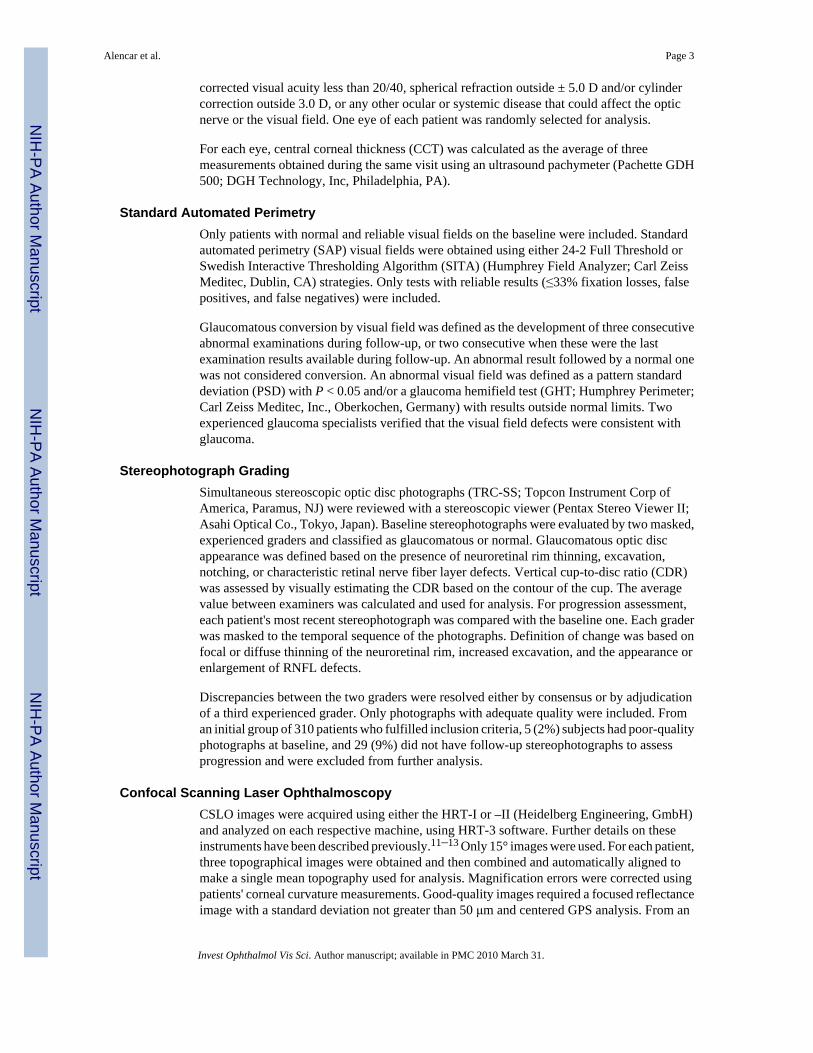
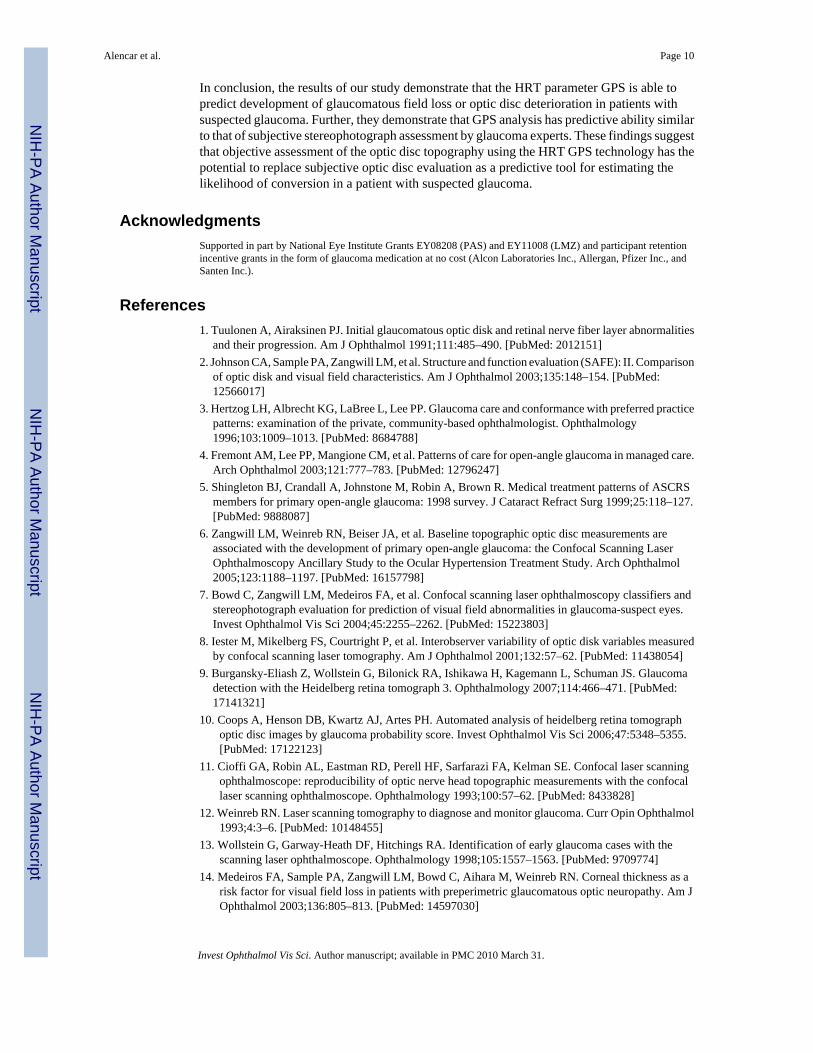
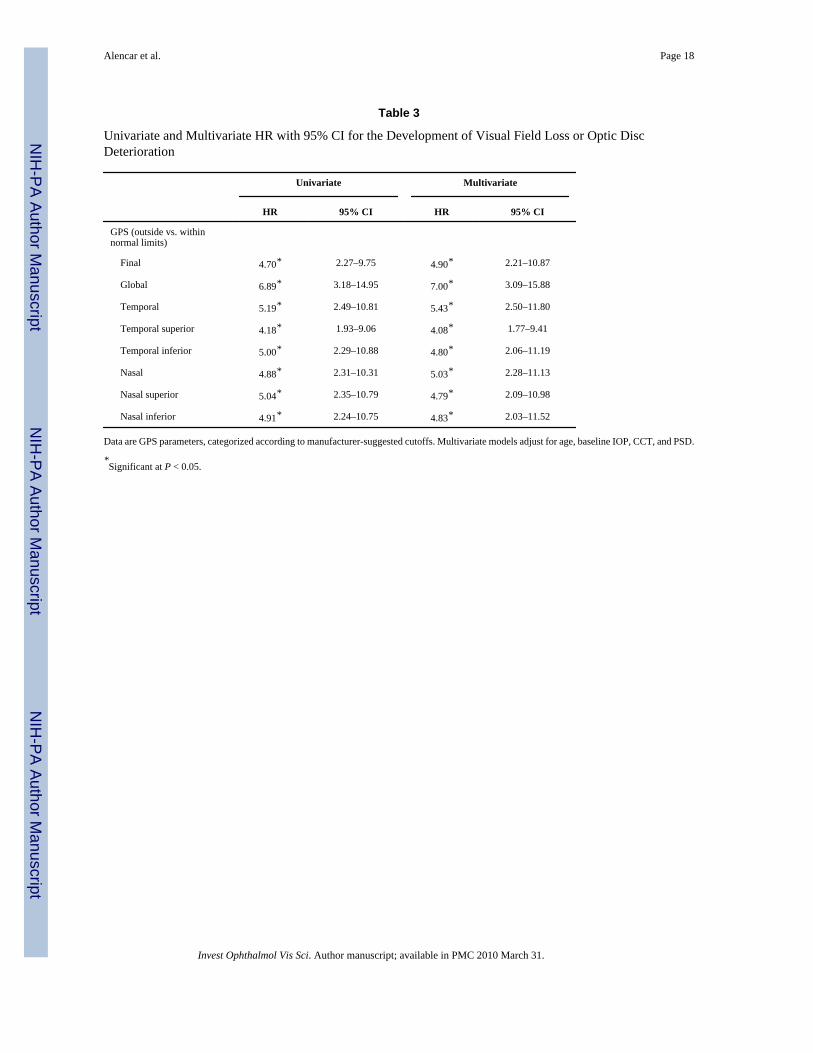
HRs were also assessed for GPS parameters classified according to the manufacturer'ssuggested cutoffs for global and sectoral analyses, and for the final classification provided onthe HRT 3.0 printout (Table 3). According to these cutoffs, GPS results between 0 and 0.27are classified as within normal limits, between 0.28 and 0.64 as borderline, and between 0.65and 1.0 as outside normal limits. The final classification provided is outside normal limits ifany sector or if the global assessment is flagged as outside normal limits. Using the withinnormal limits result as the reference category, an outside normal limits result on the GPS finalclassification had a univariate HR of 4.70 (95% CI: 2.27–9.75; P < 0.001), and a borderlineclassification had a univariate HR of 2.00 (95% CI: 1.02–3.94; P = 0.044). Figure 2 shows thecumulative probability (Kaplan-Meier survival curves) for development of visual field loss oroptic disc changes according to the categorization suggested by the manufacturer for the finalclassification (P < 0.001, log rank test).
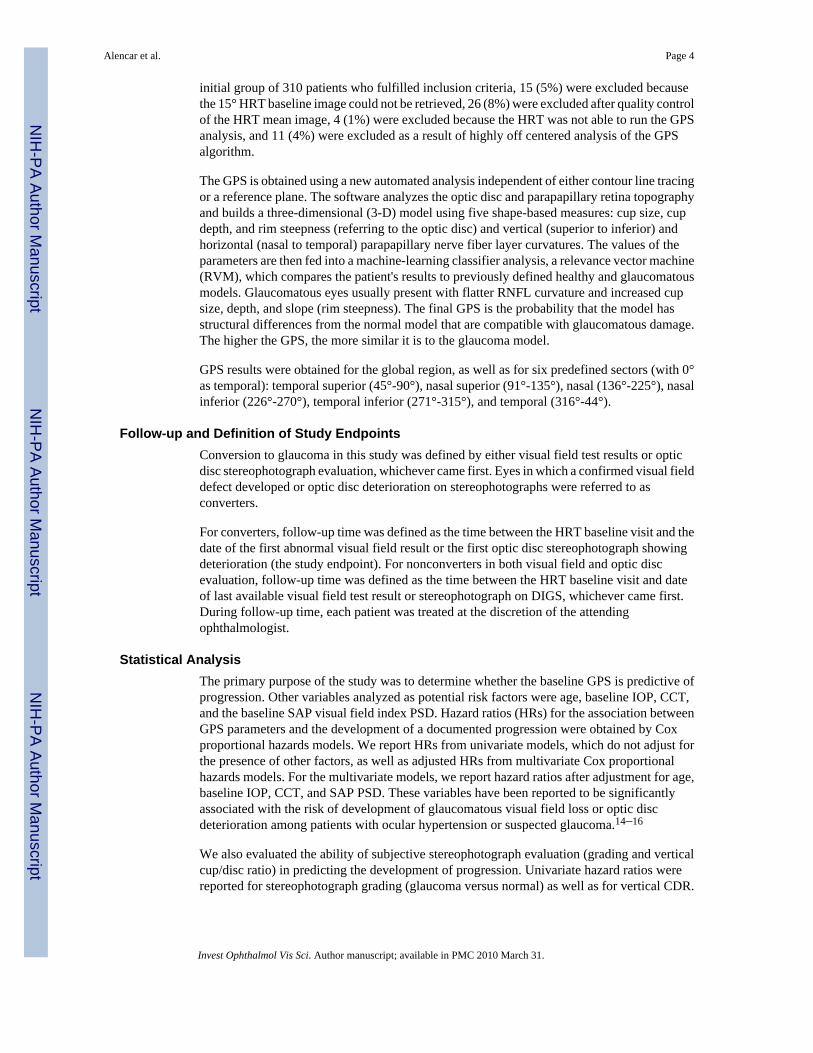
A glaucomatous grading on the baseline stereophotograph was also significantly associatedwith progression (HR: 3.08; 95% CI: 1.69–5.61; P < 0.001). Figure 3 shows the cumulativeprobability (Kaplan-Meier survival curves) for development of visual field loss or optic discchanges according to the categorization used for stereophotograph grading. For vertical cup/disc ratio, the univariate HR was 1.41 per 0.1 larger (95% CI: 1.19–1.67; P < 0.001).
When multivariate models were constructed adjusting for age, baseline IOP, CCT and SAPPSD, the GPS global, and sectoral values were still significantly associated with increased riskof progression to glaucoma, with adjusted HRs ranging from 1.29–1.32 for continuousvariables (Table 2). Each 0.1 larger value of Global GPS was associated with a 31% increasein the risk of converting to glaucoma (adjusted HR: 1.31; 95% CI: 1.15–1.50; P < 0.001). Theadjusted HRs for outside normal limits results (using manufacturer suggested cutoffs) arepresented in Table 3. An outside normal limits result on GPS final classification had an adjustedHR of 4.90 (95% CI: 2.21–10.87; P < 0.001). In multivariate models with adjustment for thesame variables, adjusted HRs for subjective stereophotograph assessment were 2.34 (95% CI:1.22–4.47; P = 0.010) for a grade indicating glaucoma and 1.34 (95% CI: 1.12–1.62; P = 0.002)for a 0.1 higher vertical cup–disc ratio.
The c-index was used to evaluate the predictive abilities of the multivariate models (Table 2).Models containing global or sectoral GPS results had very similar c-index values. The c-indexfor the multivariate model containing GPS global was 0.732. For the multivariate modelcontaining stereophotograph grading (glaucoma versus normal), the c-index was 0.699,whereas it was 0.705 for the multivariate model containing vertical cup–disc ratio. There wereno statistically significant differences in the predictive abilities of multivariate modelscontaining GPS global results, stereophotograph CDR, or stereophotograph grading (P > 0.05for all comparisons). Similar results were found when analyses were repeated using treatmentas a time-dependent covariate.
Spatial agreement between visual field loss and GPS abnormalities was evaluated for thosewho developed a repeatable abnormal visual field. Twenty-four subjects presented an inferiorvisual field defect at conversion. Of these, there were 6 with an outside normal limitsclassification for GPS global analysis and 6 for temporal, 5 for nasal, 10 for inferior (inferiortemporal and inferior nasal), and 10 for superior (superior temporal and superior nasal) visualfield defects. Thirty-two subjects presented a superior visual field defect at conversion (10 hadloss in both hemispheres). Of these, there were 8 with an outside normal limits classificationfor GPS global analysis and 9 for temporal, 9 for nasal, 14 for inferior (inferior temporal and
Alencar et al. Page 6
Invest Ophthalmol Vis Sci. Author manuscript; available in PMC 2010 March 31.
NIH
-PA Author Manuscript
NIH
-PA Author Manuscript
NIH
-PA Author Manuscript
inferior nasal), and 12 for superior (superior temporal and superior nasal) visual field defects.In several cases, there was more than one sector outside normal limits, and there was also anoverlap of subjects with superior and inferior visual field defects.
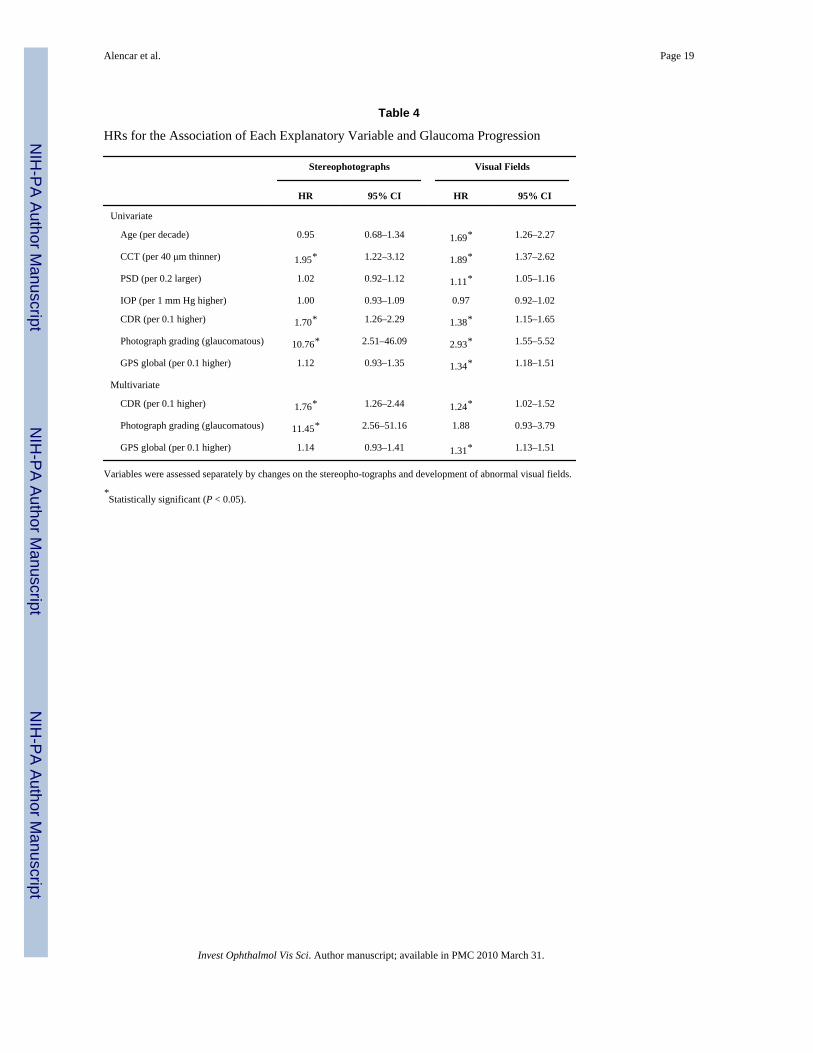
Table 4 shows the HRs for the association of each variable and progression as assessed bystereophotograph evaluation and by visual fields separately. When stereophotographs wereused as the only endpoint, only CCT and stereophotograph assessment at baseline weresignificantly associated with the risk of progression. It is important to note, however, that thelow number of patients who converted by stereophotograph during follow-up did not allowprecise estimation of HRs in this analysis, and the CIs were considerably larger than in thecomplete analysis. When only consecutive abnormal visual fields were considered as theendpoint, results were similar to those of the complete analysis.
Figure 4 shows Venn diagrams illustrating the agreement between categorical GPS finalclassification and stereophotograph grading in converters and nonconverters.
DiscussionIn this study, objective optic nerve head assessment with the HRT parameter GPS waspredictive of future progression in patients with suspected glaucoma. Subjects with higherscores at baseline had a greater risk of disease progression during the follow-up period. Inaddition, GPS results performed similarly to expert stereophotograph evaluation in predictingwhich patients would have glaucoma develop during the follow-up. These findings suggestthat objective optic disc analysis using the GPS could replace subjective stereophotographevaluation in risk assessment of patients with suspected glaucoma.
After adjustment for other potential risk factors, each 0.1 increase in the GPS global score wasassociated with a 31% higher risk of reaching the study endpoint. No significant improvementin predictive ability was noted when GPS results in the six predefined sectors were considered.When manufacturer's suggested cutoffs were used, an outside normal limits result on the GPSfinal classification was associated with an approximately fivefold higher risk of glaucoma,compared to a within normal limits result. For example, at 5 years of follow-up, the probabilityof conversion was 11% for those with within normal limits baseline GPS final classification,compared with 25% for those with borderline GPS and 45% for those with results outsidenormal limits.
Several investigators have previously evaluated the ability of HRT parameters to predictdevelopment of visual field defects or optic disc deterioration in patients with suspectedglaucoma. Bowd et al.7 demonstrated that HRT II MRA results and machine learning classifiersdeveloped using stereometric parameters were able to detect abnormalities in optic disctopography before the development of visual field loss. Zangwill et al.6 showed that severalbaseline HRT topographic measurements, alone or in combination with baseline clinical anddemographic factors, were significantly associated with the development of glaucoma amongparticipants with ocular hypertension in the Ocular Hypertension Study (OHTS), suggestingthat this instrument could be a useful predictive tool in this population. All HRT parametersincluded in these studies, however, required tracing of a contour line outlining the optic discmargin for their calculation. Although the HRT has been developed to provide objectivemeasurements of optic disc topography, the contour line requirement still imposes limitationson the objectivity and accuracy of this test. In fact, improper contour line drawing is recognizedas a frequent source of error and misinterpretation of HRT exams.8 With the development ofthe GPS analysis, these limitations have been largely overcome. GPS calculations areindependent of contour-line tracing and do not rely on a reference plane. Therefore, use of theGPS parameter removes the subjectivity that would be added by relying on contour line tracing
Alencar et al. Page 7
Invest Ophthalmol Vis Sci. Author manuscript; available in PMC 2010 March 31.
NIH
-PA Author Manuscript
NIH
-PA Author Manuscript
NIH
-PA Author Manuscript
performed by an examiner. To our knowledge, the present study is the first to demonstrate thatthe GPS parameters are also significantly predictive of conversion in patients with suspectedglaucoma.
We also compared the performance of the GPS to that of subjective expert stereophotographassessment for predicting which patients would have glaucoma develop during follow-up. Bothmethods had similar ability to discriminate converters from nonconverters, as assessed by thec-index. For the multivariate model containing GPS global, age, baseline IOP, CCT, and SAPPSD, the c-index was 0.732. A c-index of 0.73 indicates that, in approximately 73% of thecases, the model allocated a higher predicted probability for a subject who actually convertedthan for a subject who did not. For multivariate models containing stereophotograph gradingand vertical cup–disc ratio, corresponding values were 0.699 and 0.705. It is interesting to notethat the c-indexes for the multivariate models reported in our study are similar to those reportedin other studies conducted to evaluate predictive models to estimate risk of glaucoma. Medeiroset al.19 found c-indexes from 0.68 to 0.73 when predictive models derived from the OHTSwere applied to estimate risk of conversion to glaucoma in a group of 126 ocular hypertensivepatients followed for approximately 8 years. Similarly, a predictive model developed fromcombined results of the OHTS and the European Glaucoma Prevention Study (EGPS) had ac-index of 0.74 for discriminating ocular hypertensive subjects who converted to glaucomafrom those who did not.20
Several cross-sectional studies have previously compared the performances of objectivestructural assessment by imaging instruments and subjective stereophotograph evaluation.Girkin et al.21 and DeLeón-Ortega et al.22 showed that subjective stereophotograph assessmentoutperformed HRT parameters in discriminating patients with glaucomatous visual field lossfrom normal subjects. Both studies, however, are limited by their cross-sectional design andlack of a reference standard that was completely independent of the tests being evaluated.Although visual fields were reported to be the main test used to classify patients in both studies,it is very likely that clinical examination of the optic disc was used at some point to classifyparticipants, due to the cross-sectional design and glaucoma clinic-based samples in the studies.The appearance of the optic disc on clinical examination is more likely to be related to itsappearance on stereophotographs than to results of imaging instruments, and this tendencycould introduce a bias in favor of stereophotograph assessment. Also, although diagnosticaccuracy measures obtained from the studies just mentioned are useful in providing an initialevaluation of the ability of these tests to detect glaucomatous damage, it is clear that in clinicalpractice a clinician does not need an imaging test just to help differentiate a patient withrepeatable glaucomatous visual field loss from a healthy subject without suspect findings. Infact, clinicians are most interested in the ability of the test to diagnose or predict damage inpatients with suspected disease who do not show any clear abnormality such as repeatablevisual field loss.23 The longitudinal design used in our study largely overcomes theselimitations when imaging instruments and stereophotographs are compared.
Our study has limitations. Patients were not randomized for treatment or no treatment, and thedecision as to whether to initiate treatment might have been based on disc assessment resultsand other risk factors. It is possible that patients with more risk factors or a more suspectappearance of the optic disc were the ones who received treatment during follow-up. It mightbe argued that these patients would be less likely to progress—a situation that wouldunderestimate the true predictive value of baseline optic disc evaluation for conversion toglaucoma. However, this probably would affect the predictive ability of both methods of opticdisc assessment evaluated in our study. Further, when treatment was included as a time-dependent covariate, no significant differences were seen on the results. It must be emphasizedthat stereophotographs in our study were obtained by specialized personnel and evaluated byhighly trained individuals from a reading center, blinded to chronological order. Such expertise
Alencar et al. Page 8
Invest Ophthalmol Vis Sci. Author manuscript; available in PMC 2010 March 31.
NIH
-PA Author Manuscript
NIH
-PA Author Manuscript
NIH
-PA Author Manuscript
is unlikely to be available to most eye care providers, and thus the performance of subjectiveassessment of optic disc morphology was probably overstated.
It is known that, in a considerable number of patients, damage to the optic nerve head occursdespite any evidence of functional loss.1,2 Therefore, structural and functional assessmentswere used to define conversion in our study. When we performed separate analyses usingstereophotographs or visual fields as endpoints, significant differences were observed on thepredictive abilities of the baseline variables. It is noteworthy that baseline stereophotographassessment seemed to perform better than GPS when stereophotographs were used as the onlyendpoint. This, however, may reflect a bias of using the same method as the predictive variableand for determination of the endpoint, which likely resulted in overestimation of the predictiveability of stereophotograph assessment. Also, the relatively small number of patients in whomconversion was identified by stereophotograph resulted in large CIs and less precise estimatesof the predictive abilities of the baseline variables. Therefore, it is likely that a more faircomparison of the predictive abilities of GPS and stereophotographs was obtained in theanalysis that used visual fields as the endpoint measure.
It also might be argued that some patients included in our study already had glaucomatousoptic neuropathy (GON) at baseline and therefore would not truly have suspected disease.However, the primary purpose of the study was to assess the predictive performance of anobjective method of structural assessment, the HRT GPS parameter, without relying onsubjective assessment of optic disc morphology. To accomplish this, it was necessary to definethe inclusion criteria based solely on visual fields. Although the inclusion of subjects withGON at baseline could overestimate the predictive ability of GPS, the design of our studyreplicates the clinical situation in which this technology is used to replace subjective assessmentof the optic disc for evaluation of the risk of development of glaucoma. It is also important toemphasize that, although an outside normal limits result on the GPS was associated withincreased likelihood of progression to visual field loss or optic disc damage, most of the subjectswith GPS outside normal limits did not reach the endpoint during the study period. For example,for final GPS classification, 41 (18%) of all patients had an outside normal limits result atbaseline. Of these, 17 (42%) had conversion to glaucoma and 24 (58%) did not. Further follow-up will be necessary to ascertain whether these patients will have visual field damage in thefuture or whether these were false-positive results.
Although stereophotograph assessment and GPS were found to have similar predictive abilitiesin our study, their agreement was only fair. As these two methods use different techniques tomeasure different aspects of the optic disc and RNFL, the low agreement is not surprising.Stereophotograph evaluation relies on subjective assessment by graders, which takes intoaccount several features of the optic nerve that would not be evaluated by the GPS, such aspresence of hemorrhages, parapapillary atrophy, and localized RNFL defects. On the otherhand, GPS analysis is an objective method, and its classification relies on cutoffs to achievepredetermined specificity levels according to a comparison to a normative database. Further,the GPS was originally designed as a global parameter, and modifications to evaluate sectoraloptic nerve damage included division of the optic nerve head by sectors. However, only twoof the original five parameters are provided in sectors—rim steepness and cup size—whereascup depth and vertical and horizontal nerve fiber layer curvatures are only given as globalmeasurements. Therefore, the sectoral parameters do not incorporate information aboutlocalized damage to the RNFL or localized changes in cup depth. The inability to measurelocal damage may also explain, at least in part, the weak relationship between the abnormalGPS sector and the subsequent area of VF loss found in our study. In fact, the performance ofsectoral parameters has not been demonstrated to be superior to that of GPS global for detectionof glaucomatous damage.24
Alencar et al. Page 9
Invest Ophthalmol Vis Sci. Author manuscript; available in PMC 2010 March 31.
NIH
-PA Author Manuscript
NIH
-PA Author Manuscript
NIH
-PA Author Manuscript
In conclusion, the results of our study demonstrate that the HRT parameter GPS is able topredict development of glaucomatous field loss or optic disc deterioration in patients withsuspected glaucoma. Further, they demonstrate that GPS analysis has predictive ability similarto that of subjective stereophotograph assessment by glaucoma experts. These findings suggestthat objective assessment of the optic disc topography using the HRT GPS technology has thepotential to replace subjective optic disc evaluation as a predictive tool for estimating thelikelihood of conversion in a patient with suspected glaucoma.
AcknowledgmentsSupported in part by National Eye Institute Grants EY08208 (PAS) and EY11008 (LMZ) and participant retentionincentive grants in the form of glaucoma medication at no cost (Alcon Laboratories Inc., Allergan, Pfizer Inc., andSanten Inc.).
References1. Tuulonen A, Airaksinen PJ. Initial glaucomatous optic disk and retinal nerve fiber layer abnormalities
and their progression. Am J Ophthalmol 1991;111:485–490. [PubMed: 2012151]2. Johnson CA, Sample PA, Zangwill LM, et al. Structure and function evaluation (SAFE): II. Comparison
of optic disk and visual field characteristics. Am J Ophthalmol 2003;135:148–154. [PubMed:12566017]
3. Hertzog LH, Albrecht KG, LaBree L, Lee PP. Glaucoma care and conformance with preferred practicepatterns: examination of the private, community-based ophthalmologist. Ophthalmology1996;103:1009–1013. [PubMed: 8684788]
4. Fremont AM, Lee PP, Mangione CM, et al. Patterns of care for open-angle glaucoma in managed care.Arch Ophthalmol 2003;121:777–783. [PubMed: 12796247]
5. Shingleton BJ, Crandall A, Johnstone M, Robin A, Brown R. Medical treatment patterns of ASCRSmembers for primary open-angle glaucoma: 1998 survey. J Cataract Refract Surg 1999;25:118–127.[PubMed: 9888087]
6. Zangwill LM, Weinreb RN, Beiser JA, et al. Baseline topographic optic disc measurements areassociated with the development of primary open-angle glaucoma: the Confocal Scanning LaserOphthalmoscopy Ancillary Study to the Ocular Hypertension Treatment Study. Arch Ophthalmol2005;123:1188–1197. [PubMed: 16157798]
7. Bowd C, Zangwill LM, Medeiros FA, et al. Confocal scanning laser ophthalmoscopy classifiers andstereophotograph evaluation for prediction of visual field abnormalities in glaucoma-suspect eyes.Invest Ophthalmol Vis Sci 2004;45:2255–2262. [PubMed: 15223803]
8. Iester M, Mikelberg FS, Courtright P, et al. Interobserver variability of optic disk variables measuredby confocal scanning laser tomography. Am J Ophthalmol 2001;132:57–62. [PubMed: 11438054]
9. Burgansky-Eliash Z, Wollstein G, Bilonick RA, Ishikawa H, Kagemann L, Schuman JS. Glaucomadetection with the Heidelberg retina tomograph 3. Ophthalmology 2007;114:466–471. [PubMed:17141321]
10. Coops A, Henson DB, Kwartz AJ, Artes PH. Automated analysis of heidelberg retina tomographoptic disc images by glaucoma probability score. Invest Ophthalmol Vis Sci 2006;47:5348–5355.[PubMed: 17122123]
11. Cioffi GA, Robin AL, Eastman RD, Perell HF, Sarfarazi FA, Kelman SE. Confocal laser scanningophthalmoscope: reproducibility of optic nerve head topographic measurements with the confocallaser scanning ophthalmoscope. Ophthalmology 1993;100:57–62. [PubMed: 8433828]
12. Weinreb RN. Laser scanning tomography to diagnose and monitor glaucoma. Curr Opin Ophthalmol1993;4:3–6. [PubMed: 10148455]
13. Wollstein G, Garway-Heath DF, Hitchings RA. Identification of early glaucoma cases with thescanning laser ophthalmoscope. Ophthalmology 1998;105:1557–1563. [PubMed: 9709774]
14. Medeiros FA, Sample PA, Zangwill LM, Bowd C, Aihara M, Weinreb RN. Corneal thickness as arisk factor for visual field loss in patients with preperimetric glaucomatous optic neuropathy. Am JOphthalmol 2003;136:805–813. [PubMed: 14597030]
Alencar et al. Page 10
Invest Ophthalmol Vis Sci. Author manuscript; available in PMC 2010 March 31.
NIH
-PA Author Manuscript
NIH
-PA Author Manuscript
NIH
-PA Author Manuscript

15. Gordon MO, Beiser JA, Brandt JD, et al. The Ocular Hypertension Treatment Study: baseline factorsthat predict the onset of primary open-angle glaucoma. Arch Ophthalmol 2002;120:714–720.discussion 829–30. [PubMed: 12049575]
16. Miglior S, Pfeiffer N, Torri V, Zeyen T, Cunha-Vaz J, Adamsons I. Predictive factors for open-angleglaucoma among patients with ocular hypertension in the European Glaucoma Prevention Study.Ophthalmology 2007;114:3–9. [PubMed: 17070596]
17. Harrell, FE, Jr.. Regression Modelling Strategies with Applications to Linear Models, LogisticRegression and Survival Analysis. Springer; New York: 2001.
18. D'Agostino, RB.; Nam, BH. Evaluation of the performance of survival analysis models:discrimination and calibration measures. In: Balakrishnan, N.; Rao, CR., editors. Handbook ofStatistics. Vol. Vol. 23. Elsevier; Amsterdan: 2004.
19. Medeiros FA, Weinreb RN, Sample PA, et al. Validation of a predictive model to estimate the riskof conversion from ocular hypertension to glaucoma. Arch Ophthalmol 2005;123:1351–1360.[PubMed: 16219726]
20. Gordon MO, Torri V, Miglior S, et al. Validated prediction model for the development of primaryopen-angle glaucoma in individuals with ocular hypertension. Ophthalmology 2007;114:10–19.[PubMed: 17095090]
21. Girkin CA, DeLeón-Ortega JE, Xie A, McGwin G, Arthur SN, Monheit BE. Comparison of theMoorfields classification using confocal scanning laser ophthalmoscopy and subjective optic discclassification in detecting glaucoma in blacks and whites. Ophthalmology 2006;113:2144–2149.[PubMed: 16996609]
22. DeLeón-Ortega JE, Arthur SN, McGwin G Jr, Xie A, Monheit BE, Girkin CA. Discriminationbetween glaucomatous and nonglaucomatous eyes using quantitative imaging devices and subjectiveoptic nerve head assessment. Invest Ophthalmol Vis Sci 2006;47:3374–3380. [PubMed: 16877405]
23. Medeiros FA, Ng D, Zangwill LM, Sample PA, Bowd C, Weinreb RN. The effects of study designand spectrum bias on the evaluation of diagnostic accuracy of confocal scanning laserophthalmoscopy in glaucoma. Invest Ophthalmol Vis Sci 2007;48:214–222. [PubMed: 17197535]
24. Swindale NV, Stjepanovic G, Chin A, Mikelberg FS. Automated analysis of normal and glaucomatousoptic nerve head topography images. Invest Ophthalmol Vis Sci 2000;41:1730–1742. [PubMed:10845593]
Alencar et al. Page 11
Invest Ophthalmol Vis Sci. Author manuscript; available in PMC 2010 March 31.
NIH
-PA Author Manuscript
NIH
-PA Author Manuscript
NIH
-PA Author Manuscript
Figure 1.Cumulative probability (Kaplan-Meier survival curve) of development of visual field loss oroptic disc deterioration during the study.
Alencar et al. Page 12
Invest Ophthalmol Vis Sci. Author manuscript; available in PMC 2010 March 31.
NIH
-PA Author Manuscript
NIH
-PA Author Manuscript
NIH
-PA Author Manuscript
FIGURE 2.Cumulative probability (Kaplan-Meier survival curve) of development of visual field loss oroptic disc deterioration in patients with suspected glaucoma according to the baseline finalclassification of the GPS.
Alencar et al. Page 13
Invest Ophthalmol Vis Sci. Author manuscript; available in PMC 2010 March 31.
NIH
-PA Author Manuscript
NIH
-PA Author Manuscript
NIH
-PA Author Manuscript
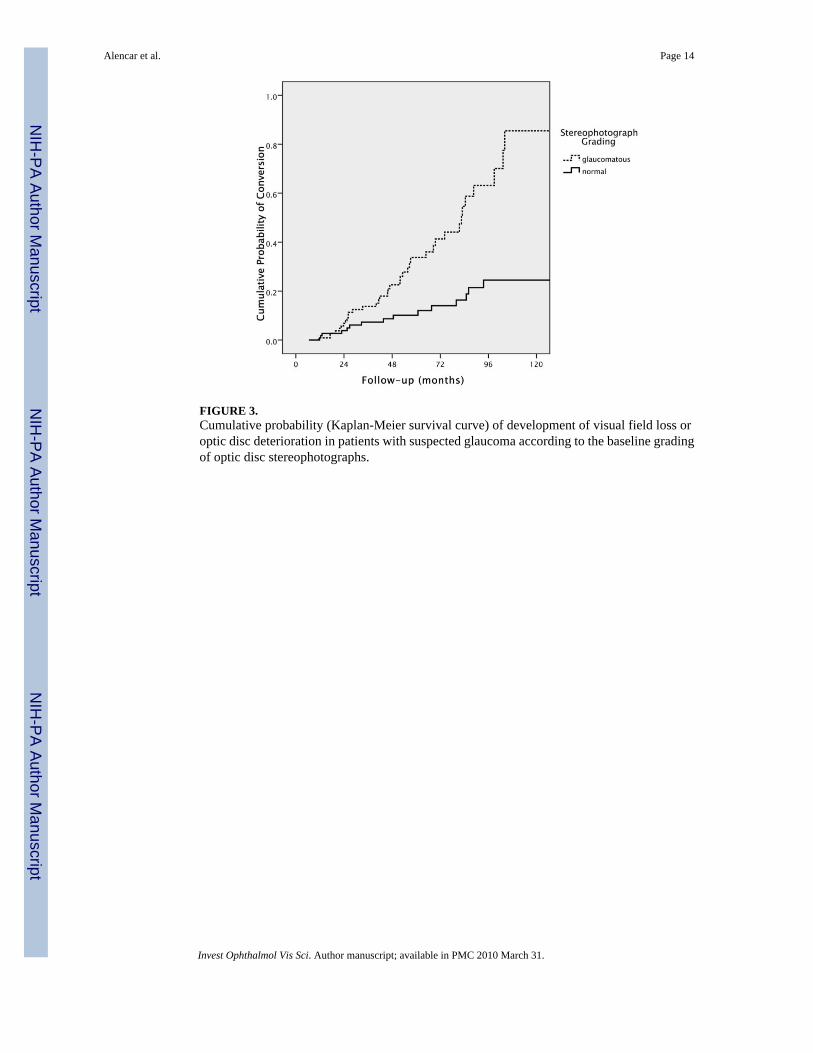
FIGURE 3.Cumulative probability (Kaplan-Meier survival curve) of development of visual field loss oroptic disc deterioration in patients with suspected glaucoma according to the baseline gradingof optic disc stereophotographs.
Alencar et al. Page 14
Invest Ophthalmol Vis Sci. Author manuscript; available in PMC 2010 March 31.
NIH
-PA Author Manuscript
NIH
-PA Author Manuscript
NIH
-PA Author Manuscript
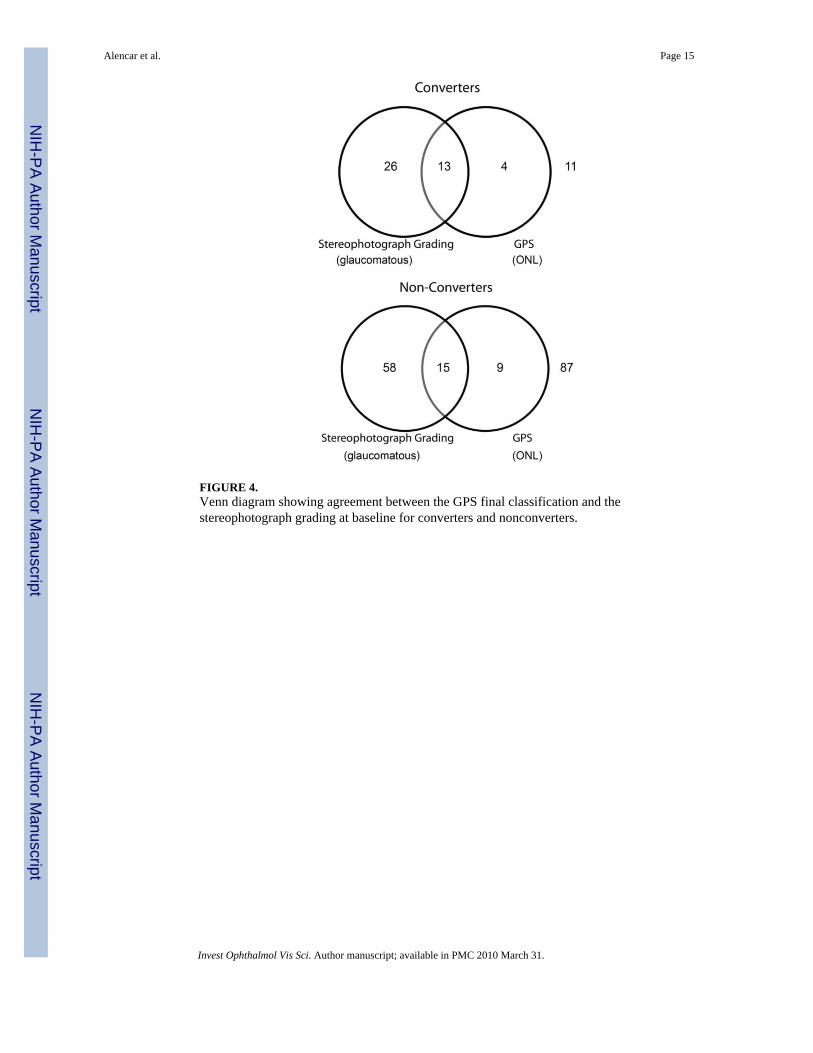
FIGURE 4.Venn diagram showing agreement between the GPS final classification and thestereophotograph grading at baseline for converters and nonconverters.
Alencar et al. Page 15
Invest Ophthalmol Vis Sci. Author manuscript; available in PMC 2010 March 31.
NIH
-PA Author Manuscript
NIH
-PA Author Manuscript
NIH
-PA Author Manuscript
NIH
-PA Author Manuscript
NIH
-PA Author Manuscript
NIH
-PA Author Manuscript
Alencar et al. Page 16
Table 1
Baseline Demographic and Clinical Characteristics of Study Patients
All (n = 223) Converters (n = 54) Nonconverters (n = 169)
Age (y) 59.0 ± 12.7 63.7 ± 11.6 57.5 ± 12.7
IOP (mm Hg) 22.5 ± 5.7 21.7 ± 5.6 22.8 ± 5.7
CCT (μm) 565 ± 38 548 ± 39 570 ± 36
PSD (dB) 1.94 ± 0.68 2.32 ± 0.84 1.82 ± 0.56
Vertical cup/disc ratio 0.59 ± 0.19 0.68 ± 0.17 0.56 ± 0.18
Glaucomatous grading, n (%) 113 (50) 40 (73) 73 (43)
History of high IOP, n (%)* 191 (85) 49 (89) 142 (84)
GPS global 0.34 ± 0.23 0.43 ± 0.24 0.31 ± 0.21
GPS temporal 0.34 ± 0.23 0.44 ± 0.25 0.31 ± 0.21
GPS temporal superior 0.31 ± 0.22 0.41 ± 0.24 0.28 ± 0.21
GPS temporal inferior 0.34 ± 0.23 0.45 ± 0.24 0.31 ± 0.22
GPS nasal 0.33 ± 0.23 0.43 ± 0.25 0.30 ± 0.21
GPS nasal superior 0.31 ± 0.22 0.40 ± 0.24 0.28 ± 0.20
GPS nasal inferior 0.32 ± 0.22 0.42 ± 0.24 0.29 ± 0.21
Converters are patients who experienced development of either visual field loss or optic disc deterioration, and nonconverters are those who did not.Data are the mean ± SD, unless otherwise stated.
*IOP ≥ 21 mm Hg.
Invest Ophthalmol Vis Sci. Author manuscript; available in PMC 2010 March 31.
NIH
-PA Author Manuscript
NIH
-PA Author Manuscript
NIH
-PA Author Manuscript
Alencar et al. Page 17
Tabl
e 2
Uni
varia
te a
nd M
ultiv
aria
te H
Rs w
ith 9
5% C
Is fo
r the
Dev
elop
men
t of V
isua
l Fie
ld L
oss o
r Opt
ic D
isc
Det
erio
ratio
n
Uni
vari
ate
Mul
tivar
iate
HR
95%
CI
HR
95%
CI
c-In
dex
Age
(per
dec
ade)
1.53
*1.
19–1
.98
——
—
CC
T (p
er 4
0 μm
thin
ner)
1.73
*1.
29–2
.33
——
—
PSD
(per
0.2
larg
er)
1.08
*1.
03–1
.13
——
—
IOP
(per
1 m
m H
g hi
gher
)0.
980.
93–1
.03
——
—
CD
R (p
er 0
.1 la
rger
)1.
41*
1.19
–1.6
71.
34*
1.12
–1.6
20.
705
Phot
ogra
ph g
radi
ng (g
lauc
omat
ous)
3.08
*1.
69–5
.61
2.34
*1.
22–4
.47
0.69
9
GPS
(per
0.1
hig
her)
G
loba
l1.
31*
1.16
–1.4
71.
31*
1.15
–1.5
00.
732
Te
mpo
ral
1.31
*1.
17–1
.47
1.32
*1.
15–1
.50
0.73
2
Te
mpo
ral s
uper
ior
1.29
*1.
16–1
.44
1.29
*1.
14–1
.46
0.73
9
Te
mpo
ral i
nfer
ior
1.29
*1.
15–1
.44
1.29
*1.
13–1
.46
0.73
1
N
asal
1.30
*1.
16–1
.46
1.30
*1.
14–1
.48
0.73
3
N
asal
supe
rior
1.30
*1.
16–1
.46
1.30
*1.
14–1
.49
0.73
3
N
asal
infe
rior
1.31
*1.
17–1
.48
1.32
*1.
15–1
.51
0.72
7
The
c-in
dex
is g
iven
for e
ach
mul
tivar
iate
mod
el, a
djus
ted
for a
ge, b
asel
ine
IOP,
CC
T, a
nd P
SD, C
DR
, cup
-to-d
isc
ratio
.
* Sign
ifica
nt a
t P <
0.0
5.
Invest Ophthalmol Vis Sci. Author manuscript; available in PMC 2010 March 31.
NIH
-PA Author Manuscript
NIH
-PA Author Manuscript
NIH
-PA Author Manuscript
Alencar et al. Page 18
Table 3
Univariate and Multivariate HR with 95% CI for the Development of Visual Field Loss or Optic DiscDeterioration
Univariate Multivariate
HR 95% CI HR 95% CI
GPS (outside vs. withinnormal limits)
Final 4.70* 2.27–9.75 4.90* 2.21–10.87
Global 6.89* 3.18–14.95 7.00* 3.09–15.88
Temporal 5.19* 2.49–10.81 5.43* 2.50–11.80
Temporal superior 4.18* 1.93–9.06 4.08* 1.77–9.41
Temporal inferior 5.00* 2.29–10.88 4.80* 2.06–11.19
Nasal 4.88* 2.31–10.31 5.03* 2.28–11.13
Nasal superior 5.04* 2.35–10.79 4.79* 2.09–10.98
Nasal inferior 4.91* 2.24–10.75 4.83* 2.03–11.52
Data are GPS parameters, categorized according to manufacturer-suggested cutoffs. Multivariate models adjust for age, baseline IOP, CCT, and PSD.
*Significant at P < 0.05.
Invest Ophthalmol Vis Sci. Author manuscript; available in PMC 2010 March 31.
NIH
-PA Author Manuscript
NIH
-PA Author Manuscript
NIH
-PA Author Manuscript
Alencar et al. Page 19
Table 4
HRs for the Association of Each Explanatory Variable and Glaucoma Progression
Stereophotographs Visual Fields
HR 95% CI HR 95% CI
Univariate
Age (per decade) 0.95 0.68–1.34 1.69* 1.26–2.27
CCT (per 40 μm thinner) 1.95* 1.22–3.12 1.89* 1.37–2.62
PSD (per 0.2 larger) 1.02 0.92–1.12 1.11* 1.05–1.16
IOP (per 1 mm Hg higher) 1.00 0.93–1.09 0.97 0.92–1.02
CDR (per 0.1 higher) 1.70* 1.26–2.29 1.38* 1.15–1.65
Photograph grading (glaucomatous) 10.76* 2.51–46.09 2.93* 1.55–5.52
GPS global (per 0.1 higher) 1.12 0.93–1.35 1.34* 1.18–1.51
Multivariate
CDR (per 0.1 higher) 1.76* 1.26–2.44 1.24* 1.02–1.52
Photograph grading (glaucomatous) 11.45* 2.56–51.16 1.88 0.93–3.79
GPS global (per 0.1 higher) 1.14 0.93–1.41 1.31* 1.13–1.51
Variables were assessed separately by changes on the stereopho-tographs and development of abnormal visual fields.
*Statistically significant (P < 0.05).
Invest Ophthalmol Vis Sci. Author manuscript; available in PMC 2010 March 31.
Related Documents


![OCT/OCTA: imaging del glaucoma in maculaoftalmologiadomani.it/download/articoli2020/I_quad/... · 2020-03-23 · me la Polarimetria (GDx) e la Tomografia a Scansione Laser (HRT) [5,6].](https://static.cupdf.com/doc/110x72/5fae665b0ba3d33a150d909d/octocta-imaging-del-glaucoma-in-macu-2020-03-23-me-la-polarimetria-gdx-e-la.jpg)
