Ecological Engineering 19 (2002) 13 – 28 www.elsevier.com/locate/ecoleng Comparison of horse and tractor traction using emergy analysis Torbjo ¨ rn Rydberg *, Jan Janse ´n Department of Ecology and Crop Production Science, Swedish Uniersity of Agricultural Sciences, Box 7043, SE-750 07 Uppsala, Sweden Received 18 July 2001; received in revised form 27 December 2001; accepted 26 January 2002 Abstract Horse traction in the context of Sweden 1927 and tractor traction in the context of Sweden 1996 were compared in terms of their resource requirements. Flows of energy, material and service from the environment and the economy were identified for the two traction-producing systems. The environmental work and human activity involved in generating necessary inputs for the systems were evaluated on a common basis, using emergy analysis. The main difference between the systems was found in their energy signature. Sixty percent of the horse inputs were renewable, compared with only 9% renewable inputs for the tractor. Ecological technology was replaced by mechanical technology. This represented a shift from a technology that was maintained and driven by mainly locally-generated qualities and driven on local flow-limited renewable sources to a technology controlled and supported by non-local processes and driven on non-renewable sources. A decrease in available fuels and minerals might cause a change in the choice of technology and ecological technology might then be reintroduced into our society as a whole and not only into the agricultural sector. Evaluating management strategies that consider direct and indirect requirements for natural resources from the economic system and ‘free’ natural resources from the environment currently requires a method able to integrate both. Emergy analysis provides that ability. © 2002 Elsevier Science B.V. All rights reserved. Keywords: Ecological technology; Emergy analysis; Animal power; Sustainability; Tractor traction 1. Introduction A major question of natural resource manage- ment is how to integrate economic use activities with supporting ecosystems in order to achieve sustainable performance of the combined system of the environment and mankind (Hall et al., 1986; Daly and Cobb, 1989; Odum, 1993). Eco- logical economic methods with the ability to eval- uate environmental services provided both by ecosystems and economic inputs are needed. In the quest for sustainability, agriculture plays a central role as one of the main converters of sunlight energy into commodities and services re- * Corresponding author. Address: Centre for Sustainable Agriculture, Swedish University of Agricultural Sciences, Box 7047, SE-750 07 Uppsala, Sweden. Tel.: +46-18-67-29-11; fax: +46-18-67-35-71. E-mail address: [email protected] (T. Rydberg). 0925-8574/02/$ - see front matter © 2002 Elsevier Science B.V. All rights reserved. PII:S0925-8574(02)00015-0

Welcome message from author
This document is posted to help you gain knowledge. Please leave a comment to let me know what you think about it! Share it to your friends and learn new things together.
Transcript
Ecological Engineering 19 (2002) 13–28 www.elsevier.com/locate/ecoleng
Comparison of horse and tractor traction using emergyanalysis
Torbjorn Rydberg *, Jan JansenDepartment of Ecology and Crop Production Science, Swedish Uni�ersity of Agricultural Sciences, Box 7043,
SE-750 07 Uppsala, Sweden
Received 18 July 2001; received in revised form 27 December 2001; accepted 26 January 2002
Abstract
Horse traction in the context of Sweden 1927 and tractor traction in the context of Sweden 1996 were comparedin terms of their resource requirements. Flows of energy, material and service from the environment and the economywere identified for the two traction-producing systems. The environmental work and human activity involved ingenerating necessary inputs for the systems were evaluated on a common basis, using emergy analysis. The maindifference between the systems was found in their energy signature. Sixty percent of the horse inputs were renewable,compared with only 9% renewable inputs for the tractor. Ecological technology was replaced by mechanicaltechnology. This represented a shift from a technology that was maintained and driven by mainly locally-generatedqualities and driven on local flow-limited renewable sources to a technology controlled and supported by non-localprocesses and driven on non-renewable sources. A decrease in available fuels and minerals might cause a change inthe choice of technology and ecological technology might then be reintroduced into our society as a whole and notonly into the agricultural sector. Evaluating management strategies that consider direct and indirect requirements fornatural resources from the economic system and ‘free’ natural resources from the environment currently requires amethod able to integrate both. Emergy analysis provides that ability. © 2002 Elsevier Science B.V. All rights reserved.
Keywords: Ecological technology; Emergy analysis; Animal power; Sustainability; Tractor traction
1. Introduction
A major question of natural resource manage-ment is how to integrate economic use activities
with supporting ecosystems in order to achievesustainable performance of the combined systemof the environment and mankind (Hall et al.,1986; Daly and Cobb, 1989; Odum, 1993). Eco-logical economic methods with the ability to eval-uate environmental services provided both byecosystems and economic inputs are needed.
In the quest for sustainability, agriculture playsa central role as one of the main converters ofsunlight energy into commodities and services re-
* Corresponding author. Address: Centre for SustainableAgriculture, Swedish University of Agricultural Sciences, Box7047, SE-750 07 Uppsala, Sweden. Tel.: +46-18-67-29-11; fax:+46-18-67-35-71.
E-mail address: [email protected] (T. Rydberg).
0925-8574/02/$ - see front matter © 2002 Elsevier Science B.V. All rights reserved.
PII: S0 925 -8574 (02 )00015 -0
T. Rydberg, J. Jansen / Ecological Engineering 19 (2002) 13–2814
quired by the human economy. A study of farm-ing systems practised at different times in Swedenin the 20th Century (Jansen, 2001) illustrates amassive change in dependency on externalsources. An example is increased use of fossil fuelfor food production during the conversion fromthe horse to motorised farming. In the past, farmproduction depended mainly on local resourcesand produced largely for subsistence and the localmarket. Currently, farming in Sweden is charac-terised by a more specialised division of produc-tion tasks and dependency on larger markets andenergy and materials from non-renewable stores.While this development came about in the era ofcheap and plentiful energy, it also led to a 13-foldincrease in the external energy input. Total agri-cultural production in 1981, however, was only2.4 times that in 1927 in the area studied (Jansen2001). A major part of the increased dependenceon external sources is due to the mounting depen-dence on combustion engines. Increased depen-dency on external inputs leaves the population atlocal and regional level vulnerable to shortages,market fluctuations and finite stocks, and means aloss of local control for people.
In response to increased concerns about thedependency on finite energy sources, numerousstudies aimed at clarifying direct and indirect useof energy in agriculture have been made (Pimentelet al., 1973; Leach, 1976; Fluck, 1992; Uhlin,1999). These studies mainly take into account thedirect and indirect uses of fossil fuel, and use theheat value of the fuel as a common denominatorfor quantification and comparisons. Althoughsome attempts have been made to deal with differ-ent kinds of fossil fuels (Cleveland, 1992), differ-ent energy forms are usually not recognised withinthe concept of energy analysis.
If only one form of energy is considered, theuse of the conventional definition of energy givesmeaningful results. For meaningful analyses ofprocesses dealing with energy of different kinds,however, other methods are required. This is inpart because energy of one kind is often notequivalent in its ability to do work to energy ofother kinds (Odum, 1984). Energy analysis there-fore has serious limitations for efforts to evaluateinteractions between human society and nature, as
this is much more than a question of fuel (Ulgiatiet al., 1994). Since all different kinds of energiesare capable of supporting very different types ofwork per unit of energy, evaluation cannot bebased on heat values of the resources and pro-cesses. Human labour, information and expensivetechnological devices are examples of energiesthat have relatively small energy flows comparedto environmental energies like sunlight, but veryhigh flows of environmental energies are neededfor their formation and maintenance. These typesof energies are of a higher quality because theyhave a greater ability to feed back and amplifyother flows (Odum, 1988). In energy and eco-nomic analyses, resources outside the moniedeconomy are usually considered to be externalitiesand free, and are not quantified. Renewable ener-gies like sun, wind, rain and tides are necessary inall economics and make up a significant portionin most products and processes (Brown et al.,1995). Emergy accounts for and measures thedifferent forms of energy on a common basis byrecognising that energy hierarchies develop as aresult of the organisational structure of systems,where energy transformation processes are or-ganised in ‘webs’ that converge and concentratethe energies into fewer and larger scale processes.Through the series of energy transformations, thefinal product carries less energy than the amountinvested to generate it due to energy transforma-tion losses. However, the high position in thehierarchy makes it more valuable due to the con-vergence of resources it took to support the pro-cess. Emergy analysis also measures botheconomic variables and ecological systems.Emergy is a quantitative measure of the resourcesrequired to develop a product, whether it is amineral resource, a biological resource or a com-mercial product and it expresses the resources inunits of one type of energy, usually, solar energy.
In this study we compared a mainly ecologicaltechnology with a mechanical technology. Theshift from animal-powered traction to tractortraction was investigated, as an example of a shiftfrom humans employing living systems to humansemploying mechanical systems.
The horse is a living system that gets its supportfor maintenance and reproduction mainly from
T. Rydberg, J. Jansen / Ecological Engineering 19 (2002) 13–28 15
renewable local energy in plants and water. Thetraction that the horse produces is one of itsfunctions, but, like other living systems, the horseis multifunctional. Using resources from the localenvironment it is self-recruiting, it produces ma-nure, meat and hide, and through grazing it con-tributes to the maintenance of a multifunctionallandscape. The additional needs for a horse todeliver useful traction, (e.g. tools, harness, andhuman care), are relatively limited.
The tractor is a mechanical device that is con-structed outside the local ecosystem. The energyrequired for its use, production and maintenanceis mostly of a non-renewable character. Differenttypes of pollutants and waste are generated whenthe tractor is used, and negative environmentaleffects are also linked to the entire chain of pro-duction from mining of metals to use and reuse ofmetals and degraded wastes.
For a comprehensive comparison of essentialsustainability parameters, a method that facili-tates quantification of both environmental ser-vices provided by ecosystems and economic inputswas used. The aim of this comparison was to:– Identify and quantify the amounts and quali-
ties of energy needed directly and indirectly toproduce traction, either by a typical horse inthe context of Sweden 1927 or by a typicaltractor in the context of Sweden 1996.
– Assess the ratio between the use of local renew-able resources and purchased resources, andrenewable resources embodied in purchases, inthe same cases.
– Discuss implications for long-term sustainabil-ity between the choice of different technologies.
2. Materials and methods
2.1. Method
Emergy analysis, a quantitative evaluation tech-nique that determines the value of nature’s inputto the human economy (Odum, 1988), was used.Emergy is a measure of direct and indirect sup-porting energy needed in different work processessupporting a product or a service, using a com-
mon unit. For a comprehensive description of themethodology we refer to Odum (1988, 1994,1996). Brown and Herendeen (1996) also clarifythe methodology through discussing differencesand similarities between embodied energy analysisand emergy analysis. The basic unit of measure-ment used is usually solar joules; the accumulatedamount of these used up in the chain behind agood or a service denotes its emergy value, and iscounted as Solar Emergy Joules, abbreviated sej.The solar transformity for an item is the solaremergy per unit available energy (sej/J) or weight(sej/g). The ultimate system boundary of the anal-ysis is the main energy sources behind all transfor-mations in the geobiosphere, that is the sun, thetides and the deep heat from inside the earth. Inemergy analysis, all processes are treated as nestedto environmental processes outside the analyticalwindow, so all definitions are therefore related tooverriding energy systems networks.
The amount of indirect emergy inputs throughservice and labour is assessed via their monetaryvalue, as money spent in the economy alwayspurchases human service. The amount of emergythat supports each unit of money in circulation ina specific year is calculated from the nationaleconomy, as an emergy to money ratio.
To assess the emergy in the service componentof purchased inputs and labour costs in our horsetraction system, operating in the Swedish econ-omy in 1927, we calculated the emergy to money(SEK) ratio for that year. From national statis-tics, we collected information about the environ-mental resources needed for the entire nation toproduce wealth and converted those flows intosolar emjoules for the year of interest. The emergyuse was divided by the money circulating for thatyear (gross domestic product, GDP). Theemergy–money ratio measures the average buyingpower of the money for that year and that coun-try. A study by Lagerberg et al. (1999) of theemergy to money ratio for the Swedish economyin 1996 provided the corresponding figures for thetractor alternative. Our data sources, selected eco-nomic and agricultural statistics, calculations andestimates are specified as Notes to the analysistables.
T. Rydberg, J. Jansen / Ecological Engineering 19 (2002) 13–2816
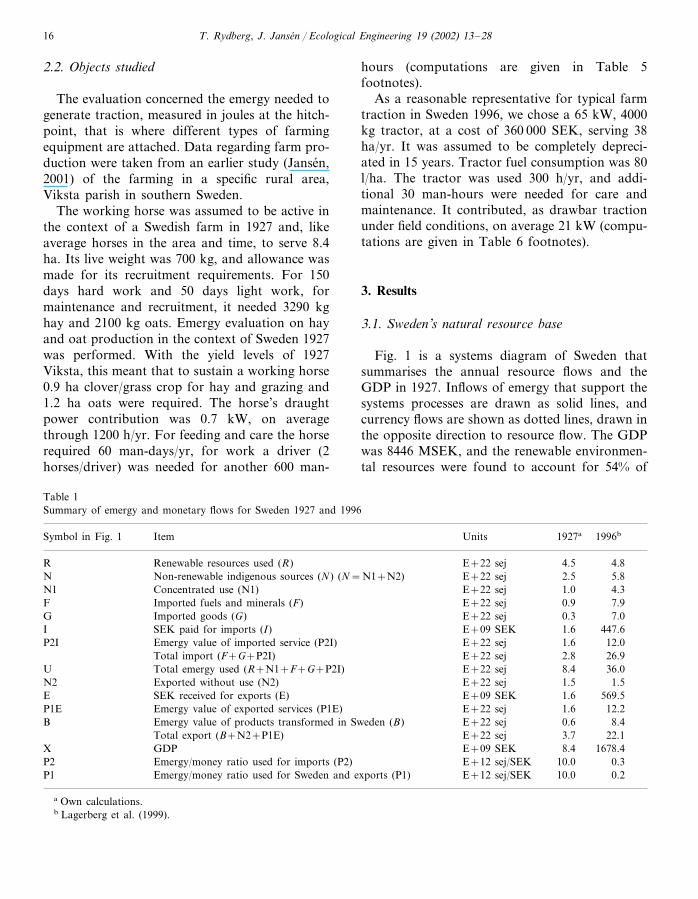
2.2. Objects studied
The evaluation concerned the emergy needed togenerate traction, measured in joules at the hitch-point, that is where different types of farmingequipment are attached. Data regarding farm pro-duction were taken from an earlier study (Jansen,2001) of the farming in a specific rural area,Viksta parish in southern Sweden.
The working horse was assumed to be active inthe context of a Swedish farm in 1927 and, likeaverage horses in the area and time, to serve 8.4ha. Its live weight was 700 kg, and allowance wasmade for its recruitment requirements. For 150days hard work and 50 days light work, formaintenance and recruitment, it needed 3290 kghay and 2100 kg oats. Emergy evaluation on hayand oat production in the context of Sweden 1927was performed. With the yield levels of 1927Viksta, this meant that to sustain a working horse0.9 ha clover/grass crop for hay and grazing and1.2 ha oats were required. The horse’s draughtpower contribution was 0.7 kW, on averagethrough 1200 h/yr. For feeding and care the horserequired 60 man-days/yr, for work a driver (2horses/driver) was needed for another 600 man-
hours (computations are given in Table 5footnotes).
As a reasonable representative for typical farmtraction in Sweden 1996, we chose a 65 kW, 4000kg tractor, at a cost of 360 000 SEK, serving 38ha/yr. It was assumed to be completely depreci-ated in 15 years. Tractor fuel consumption was 80l/ha. The tractor was used 300 h/yr, and addi-tional 30 man-hours were needed for care andmaintenance. It contributed, as drawbar tractionunder field conditions, on average 21 kW (compu-tations are given in Table 6 footnotes).
3. Results
3.1. Sweden’s natural resource base
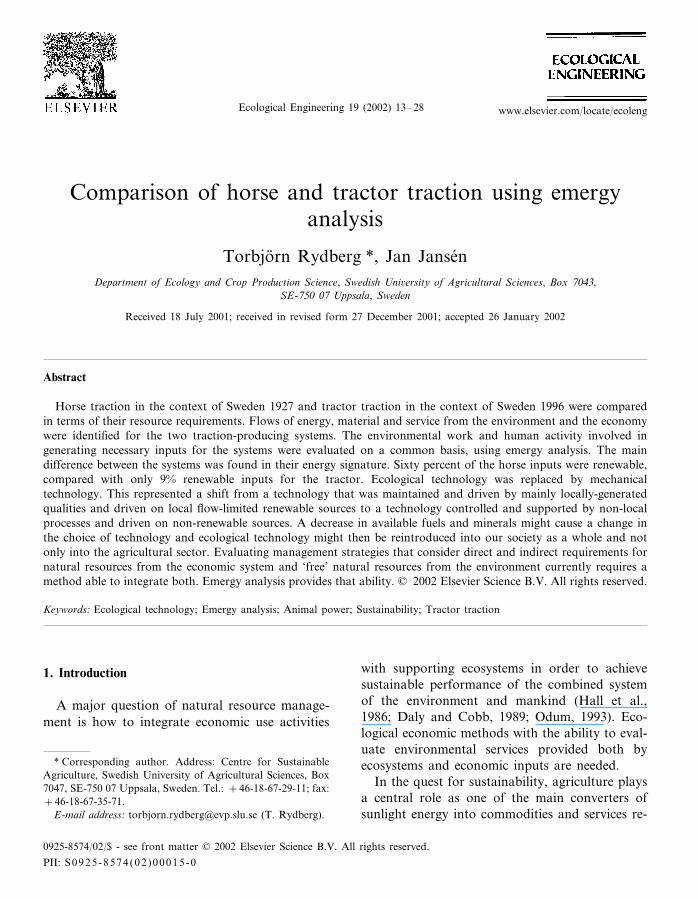
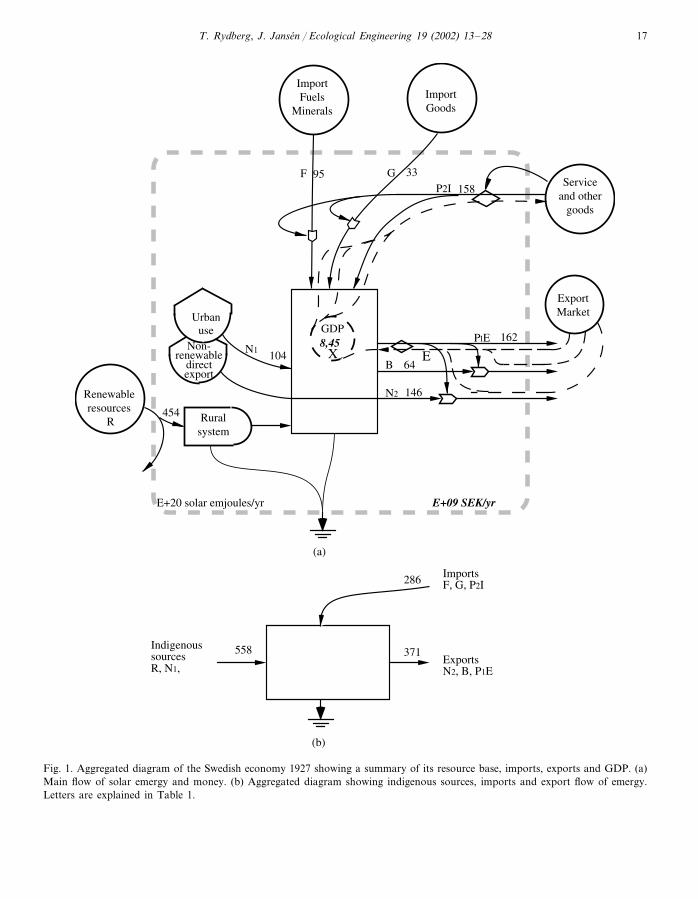
Fig. 1 is a systems diagram of Sweden thatsummarises the annual resource flows and theGDP in 1927. Inflows of emergy that support thesystems processes are drawn as solid lines, andcurrency flows are shown as dotted lines, drawn inthe opposite direction to resource flow. The GDPwas 8446 MSEK, and the renewable environmen-tal resources were found to account for 54% of
Table 1Summary of emergy and monetary flows for Sweden 1927 and 1996
1996b1927aUnitsSymbol in Fig. 1 Item
Renewable resources used (R)R E+22 sej 4.5 4.8Non-renewable indigenous sources (N) (N=N1+N2) E+22 sej 2.5 5.8N
N1 4.31.0E+22 sejConcentrated use (N1)0.9E+22 sej 7.9Imported fuels and minerals (F)F0.3E+22 sej 7.0Imported goods (G)G
E+09 SEKI 1.6SEK paid for imports (I) 447.6E+22 sejP2I 1.6Emergy value of imported service (P2I) 12.0
26.92.8E+22 sejTotal import (F+G+P2I)U Total emergy used (R+N1+F+G+P2I) E+22 sej 8.4 36.0N2 1.51.5E+22 sejExported without use (N2)
1.6E+09 SEK 569.5SEK received for exports (E)EE+22 sej 1.6P1E 12.2Emergy value of exported services (P1E)
Emergy value of products transformed in Sweden (B) E+22 sejB 0.6 8.4Total export (B+N2+P1E) E+22 sej 3.7 22.1
E+09 SEKX 1678.48.4GDPP2 E+12 sej/SEKEmergy/money ratio used for imports (P2) 10.0 0.3
Emergy/money ratio used for Sweden and exports (P1) E+12 sej/SEKP1 10.0 0.2
a Own calculations.b Lagerberg et al. (1999).
T. Rydberg, J. Jansen / Ecological Engineering 19 (2002) 13–28 17
Fig. 1. Aggregated diagram of the Swedish economy 1927 showing a summary of its resource base, imports, exports and GDP. (a)Main flow of solar emergy and money. (b) Aggregated diagram showing indigenous sources, imports and export flow of emergy.Letters are explained in Table 1.
T. Rydberg, J. Jansen / Ecological Engineering 19 (2002) 13–2818
Table 2Indices of resource use in Sweden, 1927 and 1996
Units 1927a 1996bExpressionName of index
Resource inputs:Indigenous renewable %R/U 54 13
% 12N1/U 12Indigenous non-renewable% 11Imported fuel and electricity 22F/U% 4G/U 19Imported goods
Imported services %P2I/U 19 33% 1 18electricity/UElectricity used
Trade:Imports E+22 sej/yrF+G+P2I 2.9 26.9
E+22 sej/yr 3.7N2+B+P1E 22.2Exports(F+G+P2I)/(N2+B+P1E)Ratio of imports to exports 0.8 1.2
E+22 sej/yr −0.9(F+G+P2I)–(N2+B+P1E) 4.7Imports–exports
Per capita:E+6 persons 6.1pop 8.8PopulationE+15 sej/capitaTotal resource use/person 13.9U/pop 40.7E+15 sej/capita 1.2(F-uranium-electricity)/pop 7.6Fuel use/person
(electricity)/popElectricity use/person E+15 sej/capita 0.2 7.2(R/U)(pop)Renewable carrying capacity E+6 people 3.3 1.2
E+6 people 5.1(R+N)/U)(pop) 2.6Carrying capacity using local resourcesGDP/person GDP/pop SEK 1387 198811
Resource-use indices:Imports to local resources (F+G+P2I)/(R+N) 0.5 3.0Environmental loading ratio (F+G+P2I+N)/R 1.2 6.9
a Own calculations.b Lagerberg et al. (1999).
the annual emergy budget, Table 1 and Table 2.Of the non-renewable resources, fuels and miner-als drawn from stocks within the country, some,N1, are processed and used in Sweden and some,N2, are exported without further processing. N1accounted for 12% of the annual emergy flows.The export of emergy from Sweden is the sum ofN2, processed products in Sweden (B) and theemergy embodied in service (P1E). Imports areaggregated into fuels (F), goods, (G) and services(P2I) and in 1927 contributed 11, 4 and 19% ofthe total, respectively.
A comparison of our results with those ofLagerberg et al. (1999) is given in Table 1 andTable 2. While the 1996 GDP, quantifying theannual production of goods and services in mone-tary terms, was almost 200 times that of 1927, theemergy budget of Sweden in 1996 was four timeslarger than in 1927. There was almost a 10-fold
increase of emergy in the import of fuels, goodsand service to the nation. The national use ofnon-renewable internal resources (N1) was 4 timeslarger in 1996 than in 1927, while the exports ofunprocessed non-renewable resources (N2) wasthe same size in both years. Due to the increasedimport of natural resources, the locally renewableshare dropped to 13% of the total emergy contri-bution in 1996, from 54% in 1927. The emergy tomoney ratio dropped from 9.99E+12 sej/SEK1927 to 0.2E+12 sej/SEK 1996, an inflation witheach unit of currency supported by less resourceuse.
A trade deficit in emergy terms of 0.85E+22sej in 1927 turned into a trade surplus of 4.7E+22 sej in 1996. The population increased by 44%from 6.1 million to 8.8 million, and the resourceuse per capita by almost 300%, from 13.7E+15to 40.7E+15 sej/person.
T. Rydberg, J. Jansen / Ecological Engineering 19 (2002) 13–28 19
Both the renewable carrying capacity, i.e. therenewable emergy (R) in proportion to the totalemergy (U) per capita, and the carrying capacityusing local resources, i.e. renewable plus non-re-newable emergy (R+N) in proportion to totalemergy (U) per capita, decreased considerablyfrom 1927 to 1996. Both the ratio of imports tolocal resources ((F+G+P2I)/(R+N) and theenvironmental loading ratio (the purchasedemergy plus non-renewable use (F+G+P2I+N)in proportion to renewable resources used (R)),increased about 6-fold from 1927 to 1996.
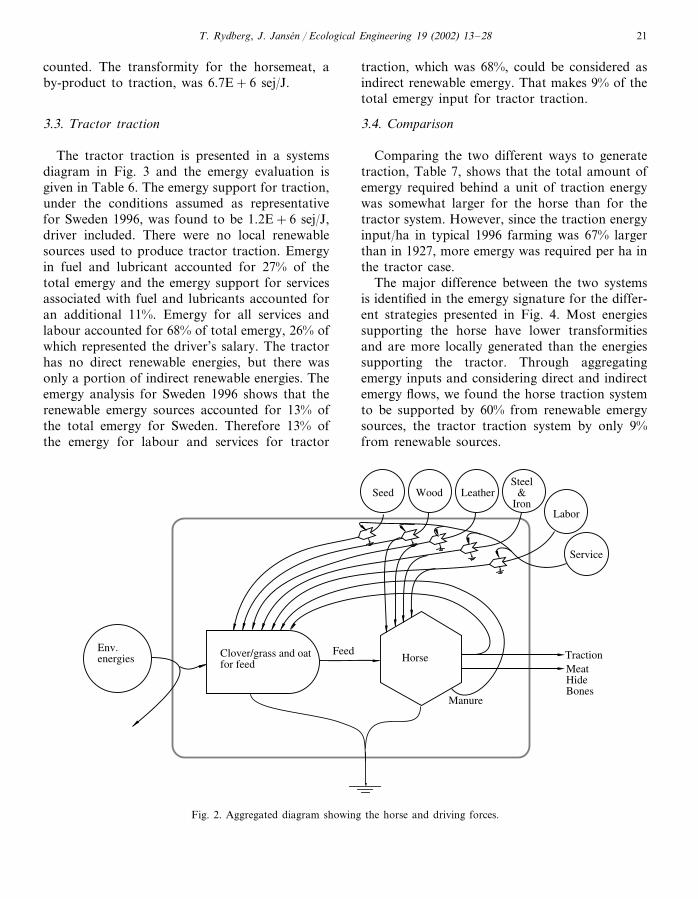
3.2. Horse traction
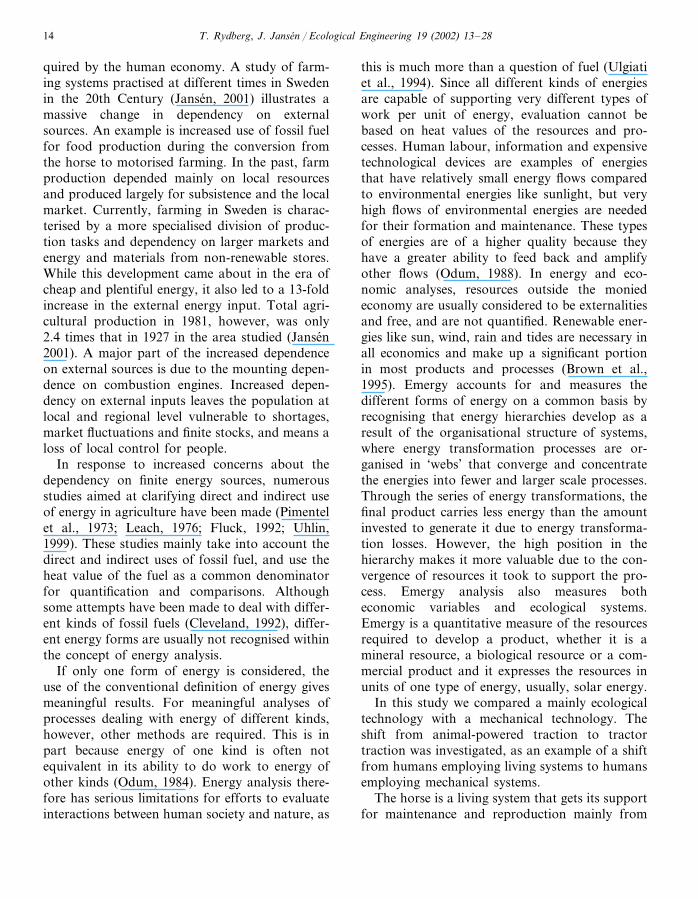
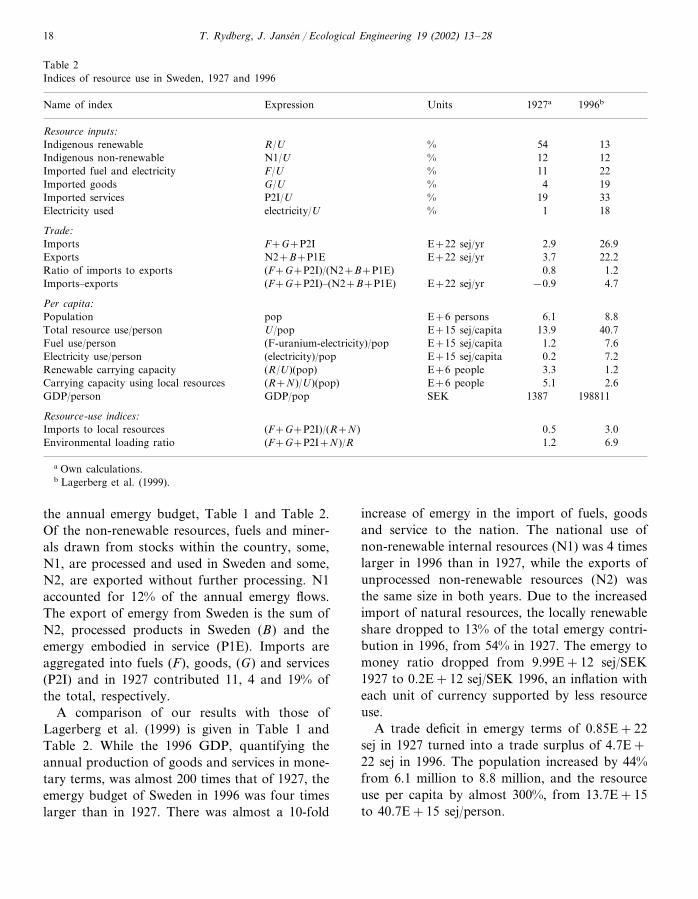
The emergy evaluations on hay and oat produc-tion are presented in Table 3 and Table 4 andform the basis for the emergy analysis for thehorse. The system producing horse traction ispresented diagrammatically in Fig. 2, and theemergy evaluation is given in Table 5. Theamount of emergy required for generation of trac-tion, driver included, was found to be 1.87E+6sej/J. Water, seed, wood and leather are consid-ered as local renewable and they accounted for
Table 3Emergy evaluation for 1 ha of oats in Viksta, Sweden 1927
Annual flow(raw units)Note, item, unit Transformity*(sej/unit) Solar emergy×E+12
Renewable energy sources2.72E+13(1) Sunlight, J 1.0E+0a 27.21.56E+10 18.2E+3a 283.9(2) Rain, chemical energy, J
Goods4.01E+09(3) Seed, J 12.7E+3c 51.0
26.13.0E+12f(4) Machinery, steel, kg 8.70E+00(5) Machinery, wood, J 3.8E+3b2.87E+07 0.1
1.49E+08(6) Buildings, wood, J 3.8E+3b 0.6(7) Harness, leather, J 4.5E+05c2.88E+07 12.9
Labour and ser�ice(8) Labour, SEK 5.09E+01 8.5E+12c 430.1
1.51E+01 8.5E+12c 127.6(9) Machinery, SEK2.10E−01(10) Buildings, SEK 8.5E+12c 1.83.49E+00 8.5E+12c 29.5(11) Harness, SEK4.20E+01 8.5E+12c 354.9(12) Seed, SEK
Output1318.544.7E+32.95E+10(13) Oats, J
(1) Sunlight, average insolation 1961–1990 at Ultuna 943 kWh/m2 (National Atlas of Sweden, 1995). Energy received onland/ha=10 000 m2/ha×943 kWh/m2×3.6E6 J/kWh×(1–20) (1-albedo)=2.72448E13 J, (2) Rain: Average annual precipitation1901–1930 at Uppsala 544 mm/yr. Evapotranspiration rate from spring sown crops, 58%. Energy in rain=area×evapotranspiredrain (m)×weight (kg/m3)×Gibbs free energy. 10 000 m2×0.316 m×1000 kg/m3×4940 J/kg=1.56E10 J/ha, (3) Seed, 200 kg/ha,4790 kcal/kg, 4.19 kJ/kcal=4.01E9 J, (4) Machinery, 8.7 kg steel/ha, (own calculations based on weight, hours in use/ha anddurability of the machines), (5) Wood in implement and machinery 1.5 kg, (own calculations based on weight, hours in use/ha anddurability of the machines), 19.1 MJ/kg=28.7 MJ, (6) Wood building for two horses, 4×4 m2 estimated to 7 m3 of wood/horse.525 kg dry matter/m3 gives 3675 kg DM wood/horse. Depreciated in 50 years and 1200 hours horse use/yr gives 0.06 kg wood/horseand hour. 130 horse-hours/ha, 19.1 MJ/kg/DM gives 149 MJ, (7) Harness: Assumed, 20 kg harness, depreciated in 10 years and 1200hours work/yr: 0.014 kg/hour. 130 horse-hours/ha gives 1.82 kg harness/ha. 15.8E6 J/kg gives 28.76E6 J. Transformity estimated tobe one magnitude higher than oats in this study, (8) Labour: 120 h/ha/yr, Nannesson (1936) at 4.24 SEK/10/man-hour, Statistiskarsbok (1928), gives 50.9 SEK, (9) Machinery, depreciation cost, 15.1 SEK/ha/yr, (own calculations based on price, hours in use/haand durability of the machines), (10) Building, depreciation cost, 7.8 kg, see Note 6. Price for lumber (Sveriges Officiella Statistik,1929) 27.4 SEK/ton=0.21 SEK, (11) Harness, depreciation cost, 1.82 kg/ha, see note 7. Leather price 1.92 SEK/kg (SverigesOfficiella Statistik, 1929)=3.49 SEK/ha, (12) Seed cost, assumed same price as wheat grain (Sveriges Officiella Statistik, 1927), 0.21SEK/kg×200 kg/ha=42 SEK/ha, (13) Yield of oats 1.73 ton/ha, at 85% DM and 4790 kcal/kg/DM, 4.19 kJ/kcal gives 29.5 GJ.
* Transformity from: aOdum (1996); bDoherty (1995); cthis study; fOdum et al. (1983).
T. Rydberg, J. Jansen / Ecological Engineering 19 (2002) 13–2820
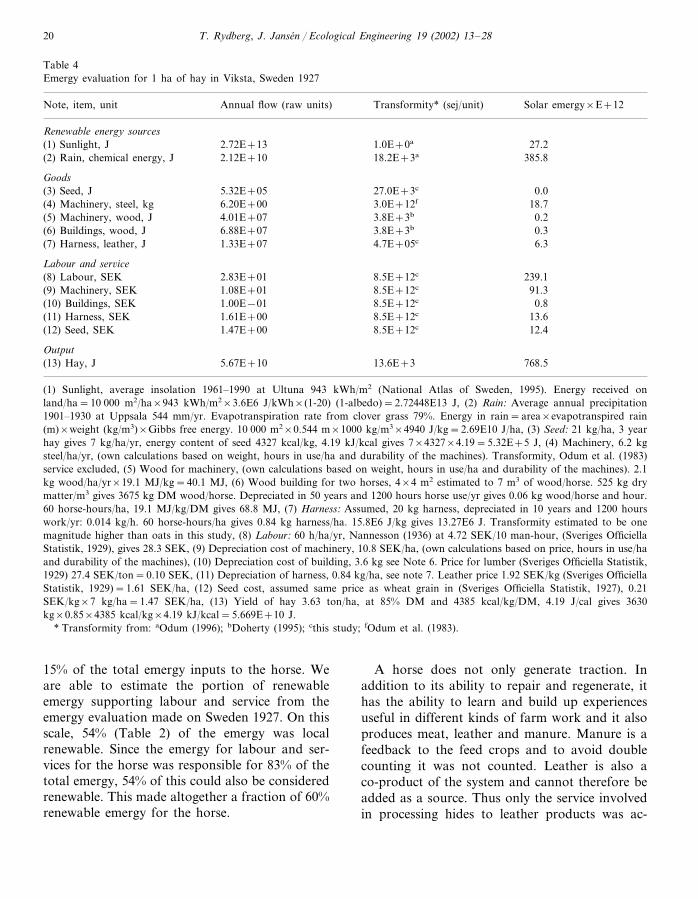
Table 4Emergy evaluation for 1 ha of hay in Viksta, Sweden 1927
Note, item, unit Transformity* (sej/unit)Annual flow (raw units) Solar emergy×E+12
Renewable energy sources(1) Sunlight, J 1.0E+0a2.72E+13 27.2
2.12E+10(2) Rain, chemical energy, J 18.2E+3a 385.8
Goods5.32E+05(3) Seed, J 27.0E+3c 0.0
3.0E+12f6.20E+00 18.7(4) Machinery, steel, kg3.8E+3b(5) Machinery, wood, J 0.24.01E+073.8E+3b6.88E+07 0.3(6) Buildings, wood, J
(7) Harness, leather, J 1.33E+07 4.7E+05c 6.3
Labour and ser�ice(8) Labour, SEK 8.5E+12c2.83E+01 239.1
8.5E+12c 91.3(9) Machinery, SEK 1.08E+018.5E+12c1.00E−01 0.8(10) Buildings, SEK
1.61E+00(11) Harness, SEK 8.5E+12c 13.6(12) Seed, SEK 1.47E+00 8.5E+12c 12.4
Output(13) Hay, J 5.67E+10 13.6E+3 768.5
(1) Sunlight, average insolation 1961–1990 at Ultuna 943 kWh/m2 (National Atlas of Sweden, 1995). Energy received onland/ha=10 000 m2/ha×943 kWh/m2×3.6E6 J/kWh×(1-20) (1-albedo)=2.72448E13 J, (2) Rain: Average annual precipitation1901–1930 at Uppsala 544 mm/yr. Evapotranspiration rate from clover grass 79%. Energy in rain=area×evapotranspired rain(m)×weight (kg/m3)×Gibbs free energy. 10 000 m2×0.544 m×1000 kg/m3×4940 J/kg=2.69E10 J/ha, (3) Seed: 21 kg/ha, 3 yearhay gives 7 kg/ha/yr, energy content of seed 4327 kcal/kg, 4.19 kJ/kcal gives 7×4327×4.19=5.32E+5 J, (4) Machinery, 6.2 kgsteel/ha/yr, (own calculations based on weight, hours in use/ha and durability of the machines). Transformity, Odum et al. (1983)service excluded, (5) Wood for machinery, (own calculations based on weight, hours in use/ha and durability of the machines). 2.1kg wood/ha/yr×19.1 MJ/kg=40.1 MJ, (6) Wood building for two horses, 4×4 m2 estimated to 7 m3 of wood/horse. 525 kg drymatter/m3 gives 3675 kg DM wood/horse. Depreciated in 50 years and 1200 hours horse use/yr gives 0.06 kg wood/horse and hour.60 horse-hours/ha, 19.1 MJ/kg/DM gives 68.8 MJ, (7) Harness: Assumed, 20 kg harness, depreciated in 10 years and 1200 hourswork/yr: 0.014 kg/h. 60 horse-hours/ha gives 0.84 kg harness/ha. 15.8E6 J/kg gives 13.27E6 J. Transformity estimated to be onemagnitude higher than oats in this study, (8) Labour: 60 h/ha/yr, Nannesson (1936) at 4.72 SEK/10 man-hour, (Sveriges OfficiellaStatistik, 1929), gives 28.3 SEK, (9) Depreciation cost of machinery, 10.8 SEK/ha, (own calculations based on price, hours in use/haand durability of the machines), (10) Depreciation cost of building, 3.6 kg see Note 6. Price for lumber (Sveriges Officiella Statistik,1929) 27.4 SEK/ton=0.10 SEK, (11) Depreciation of harness, 0.84 kg/ha, see note 7. Leather price 1.92 SEK/kg (Sveriges OfficiellaStatistik, 1929)=1.61 SEK/ha, (12) Seed cost, assumed same price as wheat grain in (Sveriges Officiella Statistik, 1927), 0.21SEK/kg×7 kg/ha=1.47 SEK/ha, (13) Yield of hay 3.63 ton/ha, at 85% DM and 4385 kcal/kg/DM, 4.19 J/cal gives 3630kg×0.85×4385 kcal/kg×4.19 kJ/kcal=5.669E+10 J.
* Transformity from: aOdum (1996); bDoherty (1995); cthis study; fOdum et al. (1983).
15% of the total emergy inputs to the horse. Weare able to estimate the portion of renewableemergy supporting labour and service from theemergy evaluation made on Sweden 1927. On thisscale, 54% (Table 2) of the emergy was localrenewable. Since the emergy for labour and ser-vices for the horse was responsible for 83% of thetotal emergy, 54% of this could also be consideredrenewable. This made altogether a fraction of 60%renewable emergy for the horse.
A horse does not only generate traction. Inaddition to its ability to repair and regenerate, ithas the ability to learn and build up experiencesuseful in different kinds of farm work and it alsoproduces meat, leather and manure. Manure is afeedback to the feed crops and to avoid doublecounting it was not counted. Leather is also aco-product of the system and cannot therefore beadded as a source. Thus only the service involvedin processing hides to leather products was ac-
T. Rydberg, J. Jansen / Ecological Engineering 19 (2002) 13–28 21
counted. The transformity for the horsemeat, aby-product to traction, was 6.7E+6 sej/J.
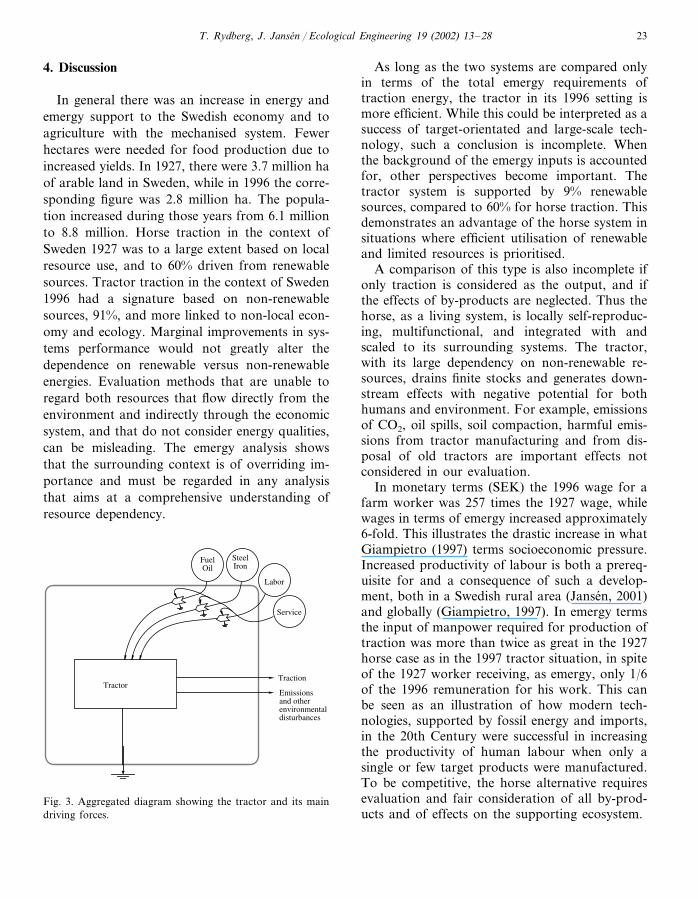
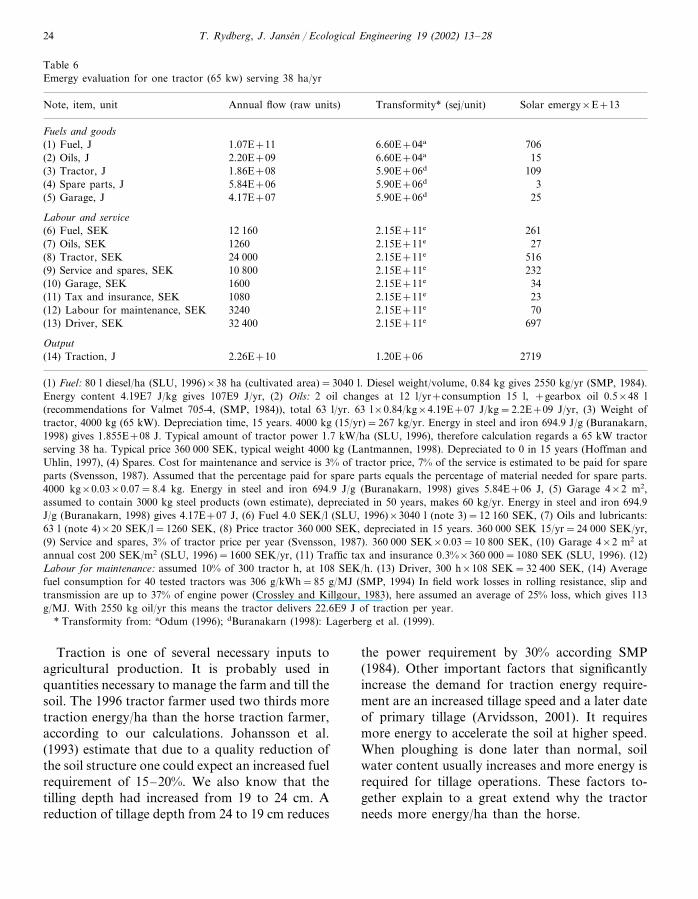
3.3. Tractor traction
The tractor traction is presented in a systemsdiagram in Fig. 3 and the emergy evaluation isgiven in Table 6. The emergy support for traction,under the conditions assumed as representativefor Sweden 1996, was found to be 1.2E+6 sej/J,driver included. There were no local renewablesources used to produce tractor traction. Emergyin fuel and lubricant accounted for 27% of thetotal emergy and the emergy support for servicesassociated with fuel and lubricants accounted foran additional 11%. Emergy for all services andlabour accounted for 68% of total emergy, 26% ofwhich represented the driver’s salary. The tractorhas no direct renewable energies, but there wasonly a portion of indirect renewable energies. Theemergy analysis for Sweden 1996 shows that therenewable emergy sources accounted for 13% ofthe total emergy for Sweden. Therefore 13% ofthe emergy for labour and services for tractor
traction, which was 68%, could be considered asindirect renewable emergy. That makes 9% of thetotal emergy input for tractor traction.
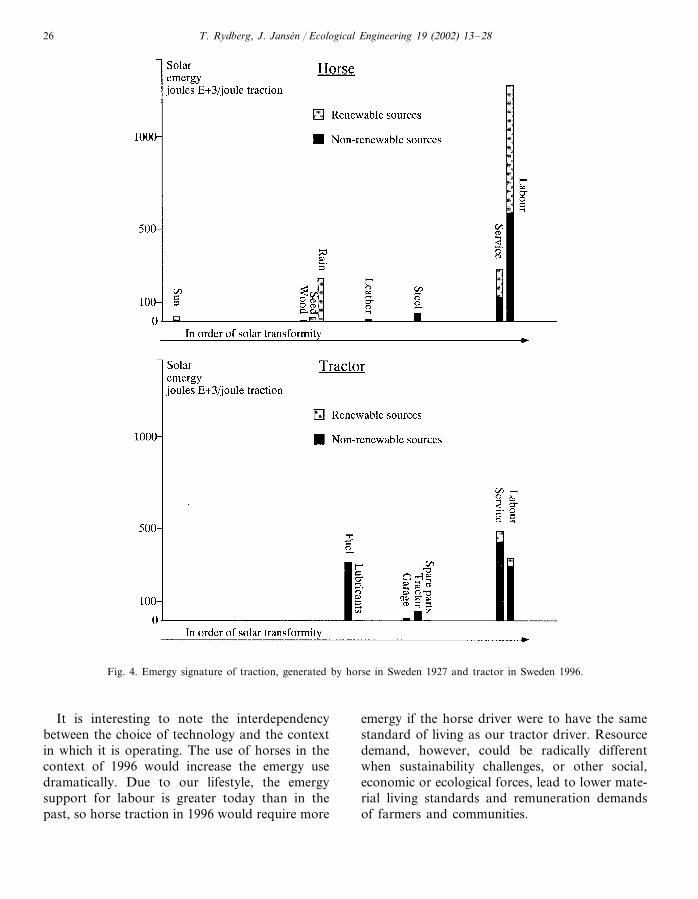
3.4. Comparison
Comparing the two different ways to generatetraction, Table 7, shows that the total amount ofemergy required behind a unit of traction energywas somewhat larger for the horse than for thetractor system. However, since the traction energyinput/ha in typical 1996 farming was 67% largerthan in 1927, more emergy was required per ha inthe tractor case.
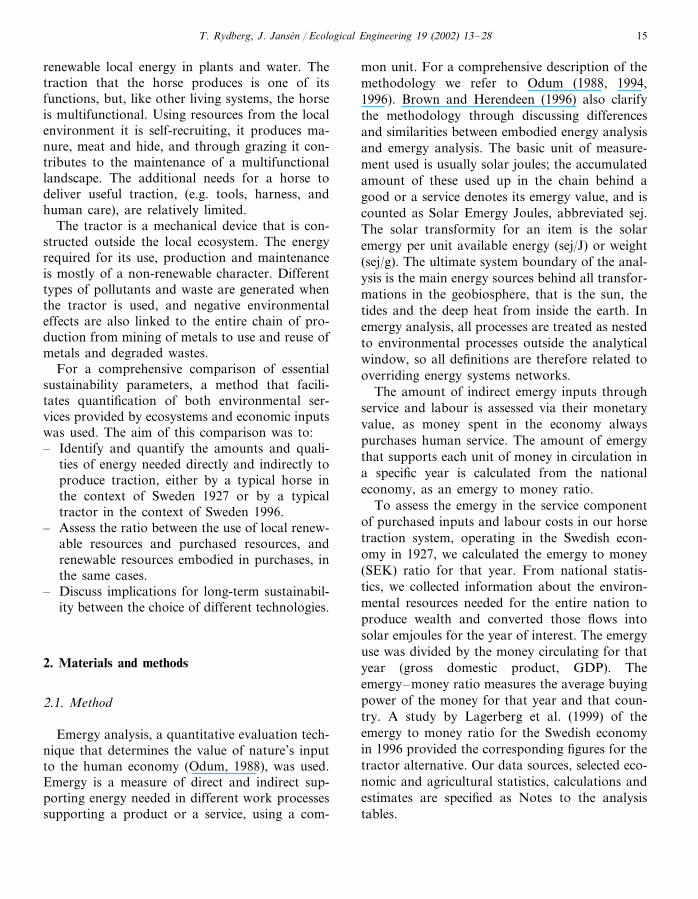
The major difference between the two systemsis identified in the emergy signature for the differ-ent strategies presented in Fig. 4. Most energiessupporting the horse have lower transformitiesand are more locally generated than the energiessupporting the tractor. Through aggregatingemergy inputs and considering direct and indirectemergy flows, we found the horse traction systemto be supported by 60% from renewable emergysources, the tractor traction system by only 9%from renewable sources.
Fig. 2. Aggregated diagram showing the horse and driving forces.
T. Rydberg, J. Jansen / Ecological Engineering 19 (2002) 13–2822
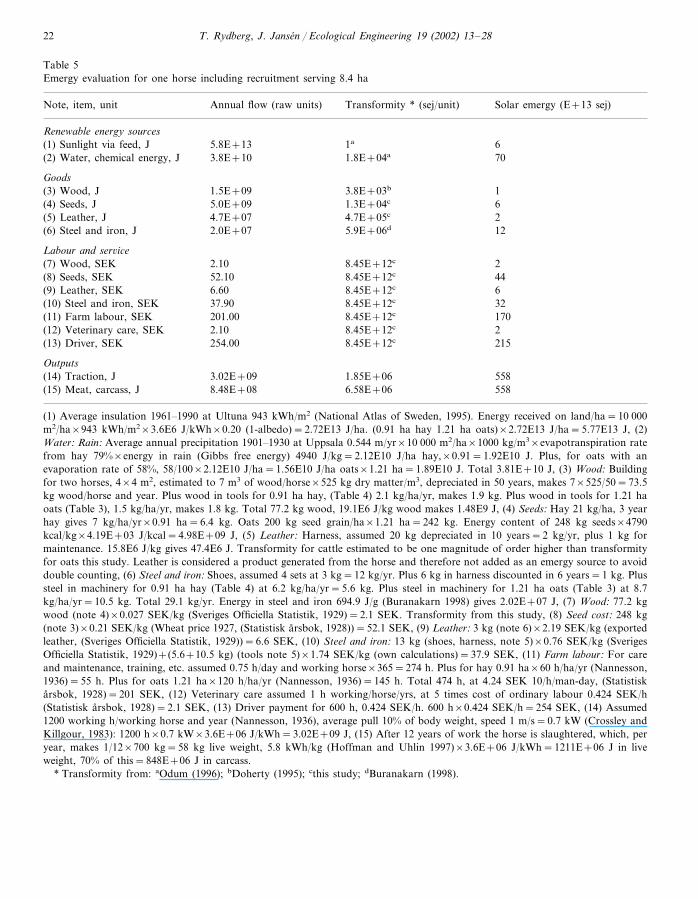
Table 5Emergy evaluation for one horse including recruitment serving 8.4 ha
Note, item, unit Transformity * (sej/unit)Annual flow (raw units) Solar emergy (E+13 sej)
Renewable energy sources(1) Sunlight via feed, J 1a5.8E+13 6
3.8E+10(2) Water, chemical energy, J 1.8E+04a 70
Goods3.8E+03b(3) Wood, J 11.5E+091.3E+04c5.0E+09 6(4) Seeds, J4.7E+05c 2(5) Leather, J 4.7E+075.9E+06d 122.0E+07(6) Steel and iron, J
Labour and ser�ice8.45E+12c2.10 2(7) Wood, SEK8.45E+12c(8) Seeds, SEK 4452.108.45E+12c6.60 6(9) Leather, SEK
(10) Steel and iron, SEK 37.90 8.45E+12c 328.45E+12c201.00 170(11) Farm labour, SEK8.45E+12c 2(12) Veterinary care, SEK 2.108.45E+12c 215254.00(13) Driver, SEK
Outputs1.85E+063.02E+09 558(14) Traction, J6.58E+06(15) Meat, carcass, J 5588.48E+08
(1) Average insulation 1961–1990 at Ultuna 943 kWh/m2 (National Atlas of Sweden, 1995). Energy received on land/ha=10 000m2/ha×943 kWh/m2×3.6E6 J/kWh×0.20 (1-albedo)=2.72E13 J/ha. (0.91 ha hay 1.21 ha oats)×2.72E13 J/ha=5.77E13 J, (2)Water: Rain: Average annual precipitation 1901–1930 at Uppsala 0.544 m/yr×10 000 m2/ha×1000 kg/m3×evapotranspiration ratefrom hay 79%×energy in rain (Gibbs free energy) 4940 J/kg=2.12E10 J/ha hay,×0.91=1.92E10 J. Plus, for oats with anevaporation rate of 58%, 58/100×2.12E10 J/ha=1.56E10 J/ha oats×1.21 ha=1.89E10 J. Total 3.81E+10 J, (3) Wood: Buildingfor two horses, 4×4 m2, estimated to 7 m3 of wood/horse×525 kg dry matter/m3, depreciated in 50 years, makes 7×525/50=73.5kg wood/horse and year. Plus wood in tools for 0.91 ha hay, (Table 4) 2.1 kg/ha/yr, makes 1.9 kg. Plus wood in tools for 1.21 haoats (Table 3), 1.5 kg/ha/yr, makes 1.8 kg. Total 77.2 kg wood, 19.1E6 J/kg wood makes 1.48E9 J, (4) Seeds: Hay 21 kg/ha, 3 yearhay gives 7 kg/ha/yr×0.91 ha=6.4 kg. Oats 200 kg seed grain/ha×1.21 ha=242 kg. Energy content of 248 kg seeds×4790kcal/kg×4.19E+03 J/kcal=4.98E+09 J, (5) Leather: Harness, assumed 20 kg depreciated in 10 years=2 kg/yr, plus 1 kg formaintenance. 15.8E6 J/kg gives 47.4E6 J. Transformity for cattle estimated to be one magnitude of order higher than transformityfor oats this study. Leather is considered a product generated from the horse and therefore not added as an emergy source to avoiddouble counting, (6) Steel and iron: Shoes, assumed 4 sets at 3 kg=12 kg/yr. Plus 6 kg in harness discounted in 6 years=1 kg. Plussteel in machinery for 0.91 ha hay (Table 4) at 6.2 kg/ha/yr=5.6 kg. Plus steel in machinery for 1.21 ha oats (Table 3) at 8.7kg/ha/yr=10.5 kg. Total 29.1 kg/yr. Energy in steel and iron 694.9 J/g (Buranakarn 1998) gives 2.02E+07 J, (7) Wood: 77.2 kgwood (note 4)×0.027 SEK/kg (Sveriges Officiella Statistik, 1929)=2.1 SEK. Transformity from this study, (8) Seed cost: 248 kg(note 3)×0.21 SEK/kg (Wheat price 1927, (Statistisk arsbok, 1928))=52.1 SEK, (9) Leather: 3 kg (note 6)×2.19 SEK/kg (exportedleather, (Sveriges Officiella Statistik, 1929))=6.6 SEK, (10) Steel and iron: 13 kg (shoes, harness, note 5)×0.76 SEK/kg (SverigesOfficiella Statistik, 1929)+(5.6+10.5 kg) (tools note 5)×1.74 SEK/kg (own calculations)=37.9 SEK, (11) Farm labour: For careand maintenance, training, etc. assumed 0.75 h/day and working horse×365=274 h. Plus for hay 0.91 ha×60 h/ha/yr (Nannesson,1936)=55 h. Plus for oats 1.21 ha×120 h/ha/yr (Nannesson, 1936)=145 h. Total 474 h, at 4.24 SEK 10/h/man-day, (Statistiskarsbok, 1928)=201 SEK, (12) Veterinary care assumed 1 h working/horse/yrs, at 5 times cost of ordinary labour 0.424 SEK/h(Statistisk arsbok, 1928)=2.1 SEK, (13) Driver payment for 600 h, 0.424 SEK/h. 600 h×0.424 SEK/h=254 SEK, (14) Assumed1200 working h/working horse and year (Nannesson, 1936), average pull 10% of body weight, speed 1 m/s=0.7 kW (Crossley andKillgour, 1983): 1200 h×0.7 kW×3.6E+06 J/kWh=3.02E+09 J, (15) After 12 years of work the horse is slaughtered, which, peryear, makes 1/12×700 kg=58 kg live weight, 5.8 kWh/kg (Hoffman and Uhlin 1997)×3.6E+06 J/kWh=1211E+06 J in liveweight, 70% of this=848E+06 J in carcass.
* Transformity from: aOdum (1996); bDoherty (1995); cthis study; dBuranakarn (1998).
T. Rydberg, J. Jansen / Ecological Engineering 19 (2002) 13–28 23
4. Discussion
In general there was an increase in energy andemergy support to the Swedish economy and toagriculture with the mechanised system. Fewerhectares were needed for food production due toincreased yields. In 1927, there were 3.7 million haof arable land in Sweden, while in 1996 the corre-sponding figure was 2.8 million ha. The popula-tion increased during those years from 6.1 millionto 8.8 million. Horse traction in the context ofSweden 1927 was to a large extent based on localresource use, and to 60% driven from renewablesources. Tractor traction in the context of Sweden1996 had a signature based on non-renewablesources, 91%, and more linked to non-local econ-omy and ecology. Marginal improvements in sys-tems performance would not greatly alter thedependence on renewable versus non-renewableenergies. Evaluation methods that are unable toregard both resources that flow directly from theenvironment and indirectly through the economicsystem, and that do not consider energy qualities,can be misleading. The emergy analysis showsthat the surrounding context is of overriding im-portance and must be regarded in any analysisthat aims at a comprehensive understanding ofresource dependency.
As long as the two systems are compared onlyin terms of the total emergy requirements oftraction energy, the tractor in its 1996 setting ismore efficient. While this could be interpreted as asuccess of target-orientated and large-scale tech-nology, such a conclusion is incomplete. Whenthe background of the emergy inputs is accountedfor, other perspectives become important. Thetractor system is supported by 9% renewablesources, compared to 60% for horse traction. Thisdemonstrates an advantage of the horse system insituations where efficient utilisation of renewableand limited resources is prioritised.
A comparison of this type is also incomplete ifonly traction is considered as the output, and ifthe effects of by-products are neglected. Thus thehorse, as a living system, is locally self-reproduc-ing, multifunctional, and integrated with andscaled to its surrounding systems. The tractor,with its large dependency on non-renewable re-sources, drains finite stocks and generates down-stream effects with negative potential for bothhumans and environment. For example, emissionsof CO2, oil spills, soil compaction, harmful emis-sions from tractor manufacturing and from dis-posal of old tractors are important effects notconsidered in our evaluation.
In monetary terms (SEK) the 1996 wage for afarm worker was 257 times the 1927 wage, whilewages in terms of emergy increased approximately6-fold. This illustrates the drastic increase in whatGiampietro (1997) terms socioeconomic pressure.Increased productivity of labour is both a prereq-uisite for and a consequence of such a develop-ment, both in a Swedish rural area (Jansen, 2001)and globally (Giampietro, 1997). In emergy termsthe input of manpower required for production oftraction was more than twice as great in the 1927horse case as in the 1997 tractor situation, in spiteof the 1927 worker receiving, as emergy, only 1/6of the 1996 remuneration for his work. This canbe seen as an illustration of how modern tech-nologies, supported by fossil energy and imports,in the 20th Century were successful in increasingthe productivity of human labour when only asingle or few target products were manufactured.To be competitive, the horse alternative requiresevaluation and fair consideration of all by-prod-ucts and of effects on the supporting ecosystem.
Fig. 3. Aggregated diagram showing the tractor and its maindriving forces.
T. Rydberg, J. Jansen / Ecological Engineering 19 (2002) 13–2824
Table 6Emergy evaluation for one tractor (65 kw) serving 38 ha/yr
Transformity* (sej/unit)Note, item, unit Solar emergy×E+13Annual flow (raw units)
Fuels and goods6.60E+04a1.07E+11 706(1) Fuel, J6.60E+04a(2) Oils, J 152.20E+095.90E+06d1.86E+08 109(3) Tractor, J
(4) Spare parts, J 5.84E+06 5.90E+06d 35.90E+06d 254.17E+07(5) Garage, J
Labour and ser�ice2.15E+11e12 160 261(6) Fuel, SEK
(7) Oils, SEK 2.15E+11e1260 272.15E+11e24 000 516(8) Tractor, SEK
10 800(9) Service and spares, SEK 2.15E+11e 2322.15E+11e 34(10) Garage, SEK 16002.15E+11e1080 23(11) Tax and insurance, SEK
3240(12) Labour for maintenance, SEK 2.15E+11e 70(13) Driver, SEK 32 400 2.15E+11e 697
Output2.26E+10(14) Traction, J 1.20E+06 2719
(1) Fuel: 80 l diesel/ha (SLU, 1996)×38 ha (cultivated area)=3040 l. Diesel weight/volume, 0.84 kg gives 2550 kg/yr (SMP, 1984).Energy content 4.19E7 J/kg gives 107E9 J/yr, (2) Oils: 2 oil changes at 12 l/yr+consumption 15 l, +gearbox oil 0.5×48 l(recommendations for Valmet 705-4, (SMP, 1984)), total 63 l/yr. 63 l×0.84/kg×4.19E+07 J/kg=2.2E+09 J/yr, (3) Weight oftractor, 4000 kg (65 kW). Depreciation time, 15 years. 4000 kg (15/yr)=267 kg/yr. Energy in steel and iron 694.9 J/g (Buranakarn,1998) gives 1.855E+08 J. Typical amount of tractor power 1.7 kW/ha (SLU, 1996), therefore calculation regards a 65 kW tractorserving 38 ha. Typical price 360 000 SEK, typical weight 4000 kg (Lantmannen, 1998). Depreciated to 0 in 15 years (Hoffman andUhlin, 1997), (4) Spares. Cost for maintenance and service is 3% of tractor price, 7% of the service is estimated to be paid for spareparts (Svensson, 1987). Assumed that the percentage paid for spare parts equals the percentage of material needed for spare parts.4000 kg×0.03×0.07=8.4 kg. Energy in steel and iron 694.9 J/g (Buranakarn, 1998) gives 5.84E+06 J, (5) Garage 4×2 m2,assumed to contain 3000 kg steel products (own estimate), depreciated in 50 years, makes 60 kg/yr. Energy in steel and iron 694.9J/g (Buranakarn, 1998) gives 4.17E+07 J, (6) Fuel 4.0 SEK/l (SLU, 1996)×3040 l (note 3)=12 160 SEK, (7) Oils and lubricants:63 l (note 4)×20 SEK/l=1260 SEK, (8) Price tractor 360 000 SEK, depreciated in 15 years. 360 000 SEK 15/yr=24 000 SEK/yr,(9) Service and spares, 3% of tractor price per year (Svensson, 1987). 360 000 SEK×0.03=10 800 SEK, (10) Garage 4×2 m2 atannual cost 200 SEK/m2 (SLU, 1996)=1600 SEK/yr, (11) Traffic tax and insurance 0.3%×360 000=1080 SEK (SLU, 1996). (12)Labour for maintenance: assumed 10% of 300 tractor h, at 108 SEK/h. (13) Driver, 300 h×108 SEK=32 400 SEK, (14) Averagefuel consumption for 40 tested tractors was 306 g/kWh=85 g/MJ (SMP, 1994) In field work losses in rolling resistance, slip andtransmission are up to 37% of engine power (Crossley and Killgour, 1983), here assumed an average of 25% loss, which gives 113g/MJ. With 2550 kg oil/yr this means the tractor delivers 22.6E9 J of traction per year.
* Transformity from: aOdum (1996); dBuranakarn (1998): Lagerberg et al. (1999).
Traction is one of several necessary inputs toagricultural production. It is probably used inquantities necessary to manage the farm and till thesoil. The 1996 tractor farmer used two thirds moretraction energy/ha than the horse traction farmer,according to our calculations. Johansson et al.(1993) estimate that due to a quality reduction ofthe soil structure one could expect an increased fuelrequirement of 15–20%. We also know that thetilling depth had increased from 19 to 24 cm. Areduction of tillage depth from 24 to 19 cm reduces
the power requirement by 30% according SMP(1984). Other important factors that significantlyincrease the demand for traction energy require-ment are an increased tillage speed and a later dateof primary tillage (Arvidsson, 2001). It requiresmore energy to accelerate the soil at higher speed.When ploughing is done later than normal, soilwater content usually increases and more energy isrequired for tillage operations. These factors to-gether explain to a great extend why the tractorneeds more energy/ha than the horse.

T. Rydberg, J. Jansen / Ecological Engineering 19 (2002) 13–28 25
Table 7Comparison of resource use for horse and tractor traction
Horse TractorIndex % of horseUnit
Flows357 595MJ/ha 167(1) Traction input
3.6 23.2(2) Emergy/man-hour 644E+12 sej/h1.87 1.20E+06 sej/J 64(3) Emergy use/generated J traction
(4) Emergy use/J traction exclusive driver E+06 sej/J 1.15 0.89 770.72 0.31E+06 sej/J 43(5) Emergy use for driver/J generated traction
E+14 sej/ha(6) Emergy use/ha 6.7 7.2 1074.2 5.3 126(7) Emergy use exclusive driver/ha E+14 sej/ha2.5 1.9E+14 sej/ha 76(8) Emergy use for driver/ha
Indices15 0%(9) Local renewable componenta
(10) Indirect renewable componentb % 45 960 9%(11) Total renewable component
a Items 2, 3, 4 and 5 in Table 3.b 54% of the emergy for service and labour to the horse is added as renewable emergy and 13% of the emergy for service and
labour to the tractor is added as renewable emergy, as found in respective national analyses.
It has been shown that there is a strong rela-tionship between economic growth in many sec-tors and the consumption of energy (Odum, 1971;Hall et al., 1986). The increased productivity inagriculture is also a result of an increased input offossil energy and other natural resources of anon-renewable character, e.g. metals and otherminerals. This was possible much due to the de-velopment of machines that allowed their use byextracting, refining, conversion and transporta-tion. With help of the machines, more energycould be converted to useful energy outside hu-man bodies. Machinery technology made humansmore powerful. Human activity was no longerrestricted by human power, nor by the restrictionthat comes from renewable energy sources. Eachfarmer could manage a larger agricultural area.More machines, fertilisers, pesticides and informa-tion were used to increase the output from agri-culture. There is no doubt that the increasedproductivity from agriculture was a result of anincreased input of non-renewable resources. Trac-tor traction quickly supplanted the horse withcheap energy in a concentrated and powerfulquality. This type of agricultural activity is possi-ble only in situations of access to concentratedstocks of natural resources. When such stocks areused up, or if environmental disturbances from
their use restricts the use of them, we will have toorganise our agriculture and other societal activi-ties to the flow of limited renewable resources.Animal traction is only one example of a renew-able biological technology more appropriate inlow energy situations. With the rising cost ofpurchased inputs, more of the work falls on theenvironment and less on purchased resources.This production will be flow limited since therenewable driving sources are flow limited. Thetotal activity in the society has to slow down andbe organised in a new way. The transition to afuture with less available net yielding energysources will require greater changes in those soci-eties that today are organised and strongly depen-dent on fossil fuels. In agriculture, nutrients willhave to be recycled on farm by integration ofcrops and animals. Nitrogen will have to be fixedby bacteria in symbiosis with clover and otherleguminous crops. Food and other crop productsthat leave the farm will to a great extent have tobe brought back to the fields after their use, torecycle the nutrients and the organic matter.Farmers and consumers will have to live closer toeach other to lower the cost of transportation,storage and retailing. Crops and crop rotationswill have to be chosen and organised in such away that they will generate a useful output, main-tain soil fertility and protect crops from pests.
T. Rydberg, J. Jansen / Ecological Engineering 19 (2002) 13–2826
Fig. 4. Emergy signature of traction, generated by horse in Sweden 1927 and tractor in Sweden 1996.
It is interesting to note the interdependencybetween the choice of technology and the contextin which it is operating. The use of horses in thecontext of 1996 would increase the emergy usedramatically. Due to our lifestyle, the emergysupport for labour is greater today than in thepast, so horse traction in 1996 would require more
emergy if the horse driver were to have the samestandard of living as our tractor driver. Resourcedemand, however, could be radically differentwhen sustainability challenges, or other social,economic or ecological forces, lead to lower mate-rial living standards and remuneration demandsof farmers and communities.
T. Rydberg, J. Jansen / Ecological Engineering 19 (2002) 13–28 27
It can be concluded that when ecological tech-nology, in this study represented by the horse, wasreplaced by mechanical technology, the tractor, itmeant a shift from a technology integrated inlocal environmentally processes to a system withless degree of integration. Several of the drivingforces for the horse are generated in the localenvironment e.g. grass, oats, water and wood forequipment and housing. The horse generates sev-eral useful outputs of importance for humans, notonly traction but also meat, leather, horsehair andfriendship. The waste products from the horse arenecessary feedback for maintenance of soil fertil-ity and growth of crops as well as the consumedand worn out products. The information neededfor maintenance, renewing and for reproducing isall embedded in the horse. The horse has theability to learn and develop its skills together withthe farmer. The farmer is in control of the infor-mation needed for the management of the horse.The tractor is nested to another type of environ-ment and without the abilities typical for a livingsystem. No direct driving forces can be found inthe local environment. Most driving forces for thetractor are generated in the industrial technologi-cal part of society. The driving forces for theindustry, infrastructure and knowledge necessaryfor the production and maintenance of the tractorare of a non-renewable character. Most of theinformation is outside the farm and the localenvironment. Emergy analysis has the ability todeal with all of these different resource qualitiesby valuing their different position in the energyhierarchy. Since the method treats the system ofinterest as an open system and uses a strategy ofaggregation of driving forces instead of exclusionof driving forces, it gives us a possibility to under-stand the dependence of the next large scale.
Acknowledgements
We acknowledge the Swedish Council forForestry and Agricultural Research and the Fac-ulty of Agriculture, Landscape Planning and Hor-ticulture for their financial support. We thankthree reviewers, Steven Doherty and members ofthe faculty research theme ‘Resource Efficient
Agricultural and Horticultural Systems’ for valu-able comments on the paper.
References
Arvidsson, J., 2001. Jordbearbetningens arsrapport 2000. Re-ports from the Division of Soil Management. Departmentof Soil Sciences, Uppsala (in Swedish).
Brown, M.T., Herendeen, R.A., 1996. Embodied energy analy-sis and EMERGY analysis: a comparative view. Ecol. Econ.19, 219–235.
Brown, M.T., Odum, H.T., Murphy, R.C., Christianson, R.A.,Doherty, S.J., McClanahan, T.R., Tennenbaum, S.E., 1995.Rediscovery of the world: developing an interface of ecologyand economics. In: Hall, C.A.S. (Ed.), Maximum Power.The Ideas and Applications of H.T. Odum. University Pressof Colorado, pp. 216–250.
Buranakarn, V., 1998. Evaluation of Recycling and Reuse ofBuilding Materials Using the Emergy Analysis Method. Ph.D. dissertation. University of Florida.
Cleveland, C.J., 1992. Energy quality and energy surplus in theextraction of fossil fuels in the US. Ecol. Econ. 6, 139–162.
Crossley, P., Killgour, J., 1983. Small Farm Mechanization forDeveloping Countries. Wiley, Chichester, 253 pp.
Daly, H.E., Cobb, J.B., 1989. For the Common Good. Redirect-ing the Economy Toward Community, the Environment,and a Sustainable Future. Beacon Press, Boston, 482 pp.
Doherty, S.J., 1995. Emergy Evaluation Of and Limits ToForest Production. Dissertation. University of Florida, 215pp.
Fluck, R.C., 1992. Energy in farm production. In: Stout, B.A.(Ed.), Energy in World Agriculture, vol. 6. Elsevier SciencePublishers BV, Amsterdam, 367 pp.
Giampietro, M., 1997. Socioeconomic pressure, demographicpressure, environmental loading and technological changesin agriculture. Agr. Ecosyst. Environ. 65, 201–229.
Hall, C.A.S., Cleveland, C.J., Kaufmann, R., 1986. Energy andResource Quality—The Ecology of the Economic Process.Wiley, New York, p. 577.
Hoffman, H., Uhlin, H.-E., 1997. Resursfloden i jordbruket ienergi-, fysiska och monetara termer. Smaskriftserien num-mer 111. Institutionen for ekonomi och statistik. SLU,Uppsala (in Swedish).
Jansen, J., 2001. Energy analysis of early, mid and late 20thcentury Swedish farming systems: a local case study. J.Sustain. Agric. 17 (4), 9–25.
Johansson, W., Mattsson, L., Thyselius, L., Wallgren, B., 1993.Energigrodor for biogas. Effekter pa odlingssystem. Jord-brukstekniska Institutionen, Uppsala. JTI-rapport 161 (inSwedish).
Lagerberg, C., Doherty, S.J., Nilsson, P.-O., 1999. Evaluationof the resource use efficiency and sustainability of theSwedish economy using emergy based indices. In: Lagerberg,C. (Ed.), Emergy Analysis of Resource Use in GreenhouseCrop Production and of the Resource Basis of the SwedishEconomy. Dissertation, Swedish University of AgriculturalSciences. Alnarp.

T. Rydberg, J. Jansen / Ecological Engineering 19 (2002) 13–2828
Lantmannen, 1998. Stora traktortabellen. Nummer 10: 23–29 (in Swedish).
Leach, G., 1976. Energy and Food Production. IPC Scienceand Technology Press, Guildford, Great Britain, 137 pp.
Nannesson, L., 1936. Jordbruksekonomi. Fritzes Bokforlag-forlag, Stockholm (in Swedish).
National Atlas of Sweden, 1995. Climate, Lakes and Rivers.SNA Publishing Stockholm.
Odum, E.P., 1993. Ecology and Our Endangered Life-sup-port Systems. Sinauer Associates, Inc, Publishers, Massa-chusetts, 301 pp.
Odum, H.T., 1971. Environment, Power and Society. Wiley,New York, 331 pp.
Odum, H.T., 1984. Energy analysis of the environmentalrole in agriculture. In: Stanhill, G. (Ed.), Energy andAgriculture. Springer, Berlin, Ch. 3 pp 24–51.
Odum, H.T., 1988. Self-organization, transformity and infor-mation. Science 242, 1132–1139.
Odum, H.T., 1994. Ecological and General Systems. An In-troduction to Systems Ecology. University Press of Colo-rado, Niwot, 644 pp.
Odum, H.T., 1996. Environmental Accounting: Emergy andEnvironmental Decision Making. Wiley, New York, 370pp.
Odum, H.T., Odum, E.C., Bosch, G., Braat, L.C., Dunn,W., Innes, G., Richardson, J.R., Scienceman, D.M.,Sendzimir, J.P., Smith, D.J., Thomas, M.V., 1983. En-ergy Analysis Overview of Nations. September 1983.WP-83-82. International Institute for Applied Systems
Analysis. A-2361. Laxenburg, Austria.Pimentel, D., Hurd, L.E., Bellotti, A.C., Forster, M.J., Oka,
I.N., Sholes, O.D., Whitman, R.J., 1973. Food produc-tion and energy crises. Science 182, 443–449.
SLU, 1996. Databok for driftsplanering 1996. Speciellaskrifter 62. SLU. Uppsala (in Swedish).
SMP, 1984. Maskinprovningarna. Meddelande 2907 (inSwedish).
SMP, 1994. Maskinprovningarna. Meddelande 3397 (inSwedish).
Statistisk arsbok, 1928. Statistisk arsbok for Sverige fem-tonde argangen 1928. Statistiska centralbyran. Stockholm(in Swedish with French summary).
Sveriges Officiella Statistik, 1927. Jordbruk och boskapsskot-sel. Statistiska centralbyran, Stockholm (in Swedish withFrench summary).
Sveriges Officiella Statistik, 1929. Handel. Berattelse for ar1927 av Kommerskollegium. Stockholm (in Swedish withFrench summary).
Svensson, J., 1987. Underhallskostnader for lantbrukets falt-maskiner. Rapport 114. Institutionen for lantbruksteknik.SLU (in Swedish, with English summary).
Uhlin, H.-E., 1999. Energy productivity of technologicalagriculture— lessons from the transition of Swedish agri-culture. Agr. Ecosyste. Environ. 73, 63–81.
Ulgiati, S., Odum, H.T., Bastianoni, S., 1994. Emergy use,environmental loading and sustainability. An emergyanalysis of Italy. Ecol. Model. 73, 215–268.
Related Documents