applied sciences Article Comparison of Fitness and Physical Activity Levels of Obese People with Hypertension Jana Krzysztoszek 1, * , Janusz Maciaszek 2 , Michal Bronikowski 1 , Monika Karasiewicz 3 and Ida Lauda ´ nska-Krzemi ´ nska 2 Citation: Krzysztoszek, J.; Maciaszek, J.; Bronikowski, M.; Karasiewicz, M.; Lauda ´ nska- Krzemi ´ nska, I. Comparison of Fitness and Physical Activity Levels of Obese People with Hypertension. Appl. Sci. 2021, 11, 10330. https://doi.org/ 10.3390/app112110330 Academic Editor: Vaclav Bunc Received: 22 September 2021 Accepted: 29 October 2021 Published: 3 November 2021 Publisher’s Note: MDPI stays neutral with regard to jurisdictional claims in published maps and institutional affil- iations. Copyright: © 2021 by the authors. Licensee MDPI, Basel, Switzerland. This article is an open access article distributed under the terms and conditions of the Creative Commons Attribution (CC BY) license (https:// creativecommons.org/licenses/by/ 4.0/). 1 Department of Didactics of Physical Activity, Poznan University of Physical Education, 61-871 Poznan, Poland; [email protected] 2 Department of Physical Activity Science and Health Promotion, Poznan University of Physical Education, 61-871 Poznan, Poland; [email protected] (J.M.); [email protected] (I.L.-K.) 3 Laboratory of International Health, Department of Preventive Medicine, Poznan University of Medical Sciences, 61-701 Poznan, Poland; [email protected] * Correspondence: [email protected]; Tel.: +48-61-835-52-78 Abstract: This study assessed the relationships between the current level of physical activity (PA) and PA in childhood and the level of physical fitness (PF) of obese people aged 40+ with co-existing hypertension (HT). The study included 82 obese patients with co-existing HT in their history. In order to assess the level of PA, we used the IPAQ. PF was assessed by observing the performance of patients in a fitness test (a 30-s chair stand, a handgrip strength test, a sit-and-reach test, a one leg stand test, a plank test, a wall squat test, and a 2-min step-in-place test). According to the IPAQ category, 24.4% were classified as having a high level of PA, 45.1% a sufficient level of PA, and 30.5% an insufficient level of PA. We noted that the higher the level of PA, the higher the PF—even in obese participants with HT. On the other hand, co-existing diabetes lowered almost all analysed parameters, both biochemical and fitness. The current PA level, a deficiency in which seems to be related to low PF and/or HT, does seem to be related to the degree of PF. Keywords: physical activity; physical fitness; obese people; hypertension; diabetes 1. Introduction The Survey of Health, Ageing, and Retirement in Europe (SHARE) has shown that 70.1% of the population aged 55–60 years suffers from one or more chronic diseases, while this percentage is higher than 80% for people aged 65+ [1]. The chronic diseases include conditions such as backache, osteoporosis, circulatory system diseases, obesity, type 2 diabetes, and stress, for the prevention and/or therapy of which physical activity is rec- ommended [2]. However, the awareness of risks related to insufficient physical activity (PA) is very low, which indicates that there is an urgent need for more effective health education and health promotion [3] and that this may be a worldwide problem. For example, in Canada a significant decrease in PA levels in the last several decades was associated with an increase in obesity and other related co-morbidities, such as hyper- tension (HT), heart failures, and diabetes [4]. As the problem concerns over 20% of the adult population in Canada, guidelines and recommendations for HT education have been immediately updated with new research evidence. In Europe, Bennie et al. [5], in their comparative study on PA and sedentary behaviours (using the IPAQ questionnaire) in adults from 32 European countries, report about a 300 min average sitting time a week for the average European adult. Although geographical and cultural factors differentiat- ing European nations prevented the generalisation of the scores, it is worth noting that high-sitting-time/low-activity individuals comprised 10% of the examined sample and these participants tended to self-report their general health state as “bad” or “very bad”. In Poland, according to the MultiSport Index 2019, almost half of all Poles spend more than 5 h a day in a sitting position and 16% sit for more than 9 h per day [6]. Appl. Sci. 2021, 11, 10330. https://doi.org/10.3390/app112110330 https://www.mdpi.com/journal/applsci

Welcome message from author
This document is posted to help you gain knowledge. Please leave a comment to let me know what you think about it! Share it to your friends and learn new things together.
Transcript

applied sciences
Article
Comparison of Fitness and Physical Activity Levels of ObesePeople with Hypertension
Jana Krzysztoszek 1,* , Janusz Maciaszek 2 , Michał Bronikowski 1 , Monika Karasiewicz 3
and Ida Laudanska-Krzeminska 2
�����������������
Citation: Krzysztoszek, J.;
Maciaszek, J.; Bronikowski, M.;
Karasiewicz, M.; Laudanska-
Krzeminska, I. Comparison of Fitness
and Physical Activity Levels of Obese
People with Hypertension. Appl. Sci.
2021, 11, 10330. https://doi.org/
10.3390/app112110330
Academic Editor: Vaclav Bunc
Received: 22 September 2021
Accepted: 29 October 2021
Published: 3 November 2021
Publisher’s Note: MDPI stays neutral
with regard to jurisdictional claims in
published maps and institutional affil-
iations.
Copyright: © 2021 by the authors.
Licensee MDPI, Basel, Switzerland.
This article is an open access article
distributed under the terms and
conditions of the Creative Commons
Attribution (CC BY) license (https://
creativecommons.org/licenses/by/
4.0/).
1 Department of Didactics of Physical Activity, Poznan University of Physical Education,61-871 Poznan, Poland; [email protected]
2 Department of Physical Activity Science and Health Promotion, Poznan University of Physical Education,61-871 Poznan, Poland; [email protected] (J.M.); [email protected] (I.L.-K.)
3 Laboratory of International Health, Department of Preventive Medicine, Poznan University of MedicalSciences, 61-701 Poznan, Poland; [email protected]
* Correspondence: [email protected]; Tel.: +48-61-835-52-78
Abstract: This study assessed the relationships between the current level of physical activity (PA)and PA in childhood and the level of physical fitness (PF) of obese people aged 40+ with co-existinghypertension (HT). The study included 82 obese patients with co-existing HT in their history. Inorder to assess the level of PA, we used the IPAQ. PF was assessed by observing the performanceof patients in a fitness test (a 30-s chair stand, a handgrip strength test, a sit-and-reach test, a oneleg stand test, a plank test, a wall squat test, and a 2-min step-in-place test). According to the IPAQcategory, 24.4% were classified as having a high level of PA, 45.1% a sufficient level of PA, and 30.5%an insufficient level of PA. We noted that the higher the level of PA, the higher the PF—even in obeseparticipants with HT. On the other hand, co-existing diabetes lowered almost all analysed parameters,both biochemical and fitness. The current PA level, a deficiency in which seems to be related to lowPF and/or HT, does seem to be related to the degree of PF.
Keywords: physical activity; physical fitness; obese people; hypertension; diabetes
1. Introduction
The Survey of Health, Ageing, and Retirement in Europe (SHARE) has shown that70.1% of the population aged 55–60 years suffers from one or more chronic diseases, whilethis percentage is higher than 80% for people aged 65+ [1]. The chronic diseases includeconditions such as backache, osteoporosis, circulatory system diseases, obesity, type 2diabetes, and stress, for the prevention and/or therapy of which physical activity is rec-ommended [2]. However, the awareness of risks related to insufficient physical activity(PA) is very low, which indicates that there is an urgent need for more effective healtheducation and health promotion [3] and that this may be a worldwide problem. Forexample, in Canada a significant decrease in PA levels in the last several decades wasassociated with an increase in obesity and other related co-morbidities, such as hyper-tension (HT), heart failures, and diabetes [4]. As the problem concerns over 20% of theadult population in Canada, guidelines and recommendations for HT education have beenimmediately updated with new research evidence. In Europe, Bennie et al. [5], in theircomparative study on PA and sedentary behaviours (using the IPAQ questionnaire) inadults from 32 European countries, report about a 300 min average sitting time a weekfor the average European adult. Although geographical and cultural factors differentiat-ing European nations prevented the generalisation of the scores, it is worth noting thathigh-sitting-time/low-activity individuals comprised 10% of the examined sample andthese participants tended to self-report their general health state as “bad” or “very bad”. InPoland, according to the MultiSport Index 2019, almost half of all Poles spend more than5 h a day in a sitting position and 16% sit for more than 9 h per day [6].
Appl. Sci. 2021, 11, 10330. https://doi.org/10.3390/app112110330 https://www.mdpi.com/journal/applsci

Appl. Sci. 2021, 11, 10330 2 of 14
The effects and benefits of PA on health have been widely described in the literature,both in the context of the prevention of non-communicable diseases (NCDs) and theirtherapy [7,8]. Physical activity at various stages of life plays a valuable role, from ensuringmobility, enabling recreation, and maintaining social interactions to the possibility ofmaintaining everyday activity and independence at an elderly age. Regular exercise andPA normalise glycaemia and positively affect the lipid profile [9], the body’s composition,the functions of blood vessels, lung function, the immune system, and cardiac output [10].On the contrary, I-Min Lee et al. [11] indicated that physical inactivity (which was definedas insufficient PA) causes 6–10% of several major non-communicable diseases, includingcoronary heart disease, type 2 diabetes, and breast and colon cancers. With the eliminationof physical inactivity, the life expectancy of the world’s population might be expected toincrease by 0.68 years [12]. Physical inactivity seems to have an effect similar to that ofobesity as a risk factor for poor health (0.5–0.7 years) [12].
It is known that PA habits are important predictors of weight history. Longer-termhabitual PA in adolescents, particularly at a higher intensity, has been shown to minimiseweight gain in adulthood, in both men and women, but particularly in women [13], andalso to lower the odds of incident hypertension, especially in women with moderate tohigh levels of cardiorespiratory fitness [14]. A study by Lee et al. [15] found that, whenconsidered simultaneously, fitness attenuated, but did not eliminate, the risk of impairedfasting glucose and type 2 diabetes when associated with obesity, and the highest risk wasfound in obese and unfit men. In the study by Chase et al. [16], individuals with previouslyknown diabetes (DM) had the lowest fitness in the fully adjusted model. It was observedthat the functional fitness decreased gradually with an increased impairment in glucoseregulation. Both patients with newly diagnosed DM and the ones with impaired glucosetolerance had a significantly poorer physical performance compared with those withnormal glycaemia. Michaliszyn et al. [17] indicated that greater fitness levels predictedbetter glycaemic control even among adolescents. Additionally, the strength of theserelations may grow with age.
It has been reported that regular PA, depending on its type, lowers arterial bloodpressure by 2–11 mm Hg [2]. According to Kniec et al. [18], it can lower systolic bloodpressure (SBP) by 8 mm Hg and diastolic (DBP) blood pressure by 2.5 mm Hg. Indirectly, italso contributes to a reduction in body mass [19], thus limiting dyslipidemia and insulinresistance [20]. It should be noted that a reduction in body mass results in the loweringof SBP by 4.4 mm Hg and DBP by 3.6 mm Hg [21]. This was also confirmed by the Trialsof Hypertension Prevention II carried out in people with high, but still within the normalrange of, blood pressure and increased values of body mass index (BMI), where a decreasein SBP by 3.7 and DBP by 2.7 mm Hg was seen with a loss of 4.5 kg of body mass [20].However, there are reports that only 18% of women and 50% of men in the 30–49 age groupand 31% of women and 36% of men in the 50–70 age group increase their PA after beingdiagnosed with HT [22], which is an issue.
Walther et al. [23] noted that even the diagnosis of HT did not produce a positivelifestyle change. Similarly, Rosenzweig et al. [24] indicated that unhealthy lifestyles weremore often observed in those with disease, as their presence increases the risk of developingHT and diabetes (DM). This should not be surprising, since compliance with the medicalrecommendations concerning PA is assessed negatively by as much as 48.5% of patientswith type 2 diabetes [25], despite the research evidence that shows that regular PA has astatistically and clinically significant effect on VO2 max (maximal oxygen consumption) intype 2 diabetic individuals [26]. Additionally, a 20-year longitudinal study by Carnethonet al. [27] showed that adult men and women who developed diabetes over 20 yearsexperienced significantly larger declines in relative fitness versus those who did not. Thestudy clearly indicated that poor fitness was significantly associated with diabetes incidenceand was explained largely by the relationship between fitness and BMI. Obesity and HT,the most severe NCDs, generate serious health damage, including a drop in the patient’sphysical fitness (PF). Addition of any new disease has consequences not only for individual

Appl. Sci. 2021, 11, 10330 3 of 14
health, but also for public health (for instance because of the costs of care for disabledindividuals).
The core interests and main subject of this study were obese patients with HT and theirlevels of physical fitness as well as associations with levels of physical activity (both in thepast and present). The research question was: how and to what extent does concomitantdisease, in combination with obesity and HT, differentiate levels of physical fitness andphysical activity in patients 40+? We wished to show the importance of PA and therelationship between PA and PF, and we conclude that more attention must be paid to theimportance of both PA and PF in the prevention and therapy of NCDs. It is importantespecially in the light of the trend in non-pharmacological therapy of NCDs seen amongboth patients and physicians that they are more willing to accept diet changes [28,29] thanto initiate and increase their PA.
The current study assessed the relationships between obesity and the presence ofDM with the levels of PA determining the level of PF in obese patients aged 40+ withco-existing HT. Moreover, the study looked for differences in the relationships by sex, age,and co-existing diabetes. Selected biochemical indicators were considered.
2. Materials and Methods2.1. Study Design and Participants
The study was conducted in 2017/2018 at the Clinic of Internal Medicine, MetabolicDisorders, and Hypertension in Poznan. The study included 82 patients aged 40 to 75 yearsof which 48 were women and 34 were men. The criteria to qualify for participation in thestudy were a clinical diagnosis of obesity with co-existing HT in the patient’s history, thepatient’s age being 40+ years, the patient being under constant specialist care, and accessto medical records with basic health parameters, including information on comorbidities.The diagnostic survey method was used along with a questionnaire. The questionnaires(the IPAQ with additional questions) were filled in individually in quiet surroundings ina separate room, and completing it took approximately 10 min. Body mass, height, andwaist data were collected by trained personnel with the use of anthropological instruments.Body height was measured to the nearest 0.5 cm using a portable stadiometer and bodymass was measured to the nearest 0.1 kg using mechanical personal scales (Seco, CE). Waistcircumference was measured to the nearest 0.5 cm using an anthropometric measuringtape (Baseline, CE). Body mass index, as a measure of body composition, was calculatedas body weight/height2 (kg/m2). The data concerning diagnosed diseases (such as DM,lipid metabolism disorders, and atrial fibrillation), values of systolic and diastolic bloodpressure, heart rate, and body weight at earlier visits, and the current results of laboratorytests (total cholesterol, HDL, LDL, triglycerides, glucose, sodium) were taken from themedical documentation of the patients.
2.2. Physical Activity
In order to assess the level of PA of the participating patients, we used the InternationalPhysical Activity Questionnaire (IPAQ)—Last 7 Days Physical Activity Recall—which hasbeen validated in multiple international settings and population groups [30]. The intensityof various types of physical activity associated with daily life, work, and leisure is evaluatedin the IPAQ using the metabolic equivalent of work—minutes per week (MET-min/week)coefficient. MET values were calculated using the methodological procedure [31] for the4 PA levels identified: total, vigorous, moderate, and walking. Based on these results, threePA levels were distinguished in accordance with the study methodology [31], namely: high,sufficient, and insufficient.
Additionally, in order to collect information on the PA of the patients in childhoodand adolescence, a short original survey was used that consisted of three parts. In the firstpart, similar to the screening question of Prochaska et al. [32] concerning the PA of childrenand adolescents, the participants were asked how many days a week they spent in the paston PA in three respective age categories: 6–14, 15–17, and 17–19 years. The second part

Appl. Sci. 2021, 11, 10330 4 of 14
concerned information on sport disciplines in which they engaged in the past, and in thethird part the respondents made a self-assessment of their attitude towards PA. Employingthe results of this survey together with the results of the IPAQ made it possible to comparethe levels of current and past PA.
2.3. Physical Fitness
Functional fitness was assessed using seven selected trials (the fitness test). Nostandardised tool for the measurement of functional fitness of persons with obesity wasfound in the literature. In order to ensure the health and safety of participants, the authorsof the test decided to perform two trials from the Senior Fitness Test (30-s chair stand testand 2-min step-in-place test) [33], two trials from the EUROFIT test battery (handgripstrength test and sit-and-reach test) [34], and three complementary trials (one leg standtest, wall squat test, plank test). The suggested battery of tests measures basic physicalparameters related to the ability to function and perform everyday activities. By performingtasks relating to walking, climbing the stairs, or getting up, it specifies the resources ofstrength, endurance, balance, and flexibility. The selection of the most suitable, reliable,and accurate tests was preceded by an analysis of various scientific research papers thatallowed us to examine what was considered the most important in assessing the fitness ofobese people considering their health constraints and restrictions. The selected ones werechosen as the most accurate and reliable for this specific group of subjects. Additionally,in all tests the safety of participants was our priority and all tests were conducted in thepresence of medical staff and assistants.
The fitness test:
1. 30-s chair stand test—tested lower body strength [33];2. handgrip strength test—measured the maximum isometric strength of the hand
and forearm muscles with a Lafayette Hand Dynamometer (Lafayette InstrumentCompany, Lafayette, Indiana) [34];
3. sit-and-reach test—measured the flexibility of the lower back and hamstring muscleswith a box. The starting position was sitting with the lower extremities straight andthe knee joints not bent. The task was to perform a maximum bend and reach as fartowards the feet as possible. The participant was to reach and maintain this positionfor 1–2 s while the distance was recorded [34];
4. one leg stand test—a balance test—the participant was standing with their legstogether, their toes forward, and their arms alongside, but not touching, the body.Then, the participant lifted one leg until the thigh and lower leg were at a 90-degreeangle. The participant tried to maintain this position for 30 s. This was followed by atest of the other lower extremity [35];
5. plank test (prone bridge test)—a test of core muscle strength and stability. The testinvolves maintaining a position on forearms and toes, with the whole body liftedabove the floor in one line. The result of the test was the number of seconds for whichthe correct position was maintained [36];
6. wall squat test—tested lower body muscular strength and endurance. The participantleaned on the wall with their feet placed at shoulder width, bent the knees at a90-degree angle, and attempted to maintain this position for 30 s. The results of thetest were the number of seconds for which the correct position was maintained [37];
7. 2-min step-in-place test (an alternative to the 6-min march test) [33]—an exercisetolerance assessment. The patient starts marching in place with their right leg, raisingtheir legs alternately to an individually set height (mid-thigh) as fast as possible. Tohelp keep balance, leaning against a wall, a chair, or a table is allowed. The final resultis the number of right leg raises completed in 2 min [38].
The fitness test was performed with each patient individually by trained personnel ina specially prepared room for physiotherapeutic care. For the test, a hand dynamometer(Lafayette Digital Hand Dynamometer) was used, and a sit-and-reach box was used tomeasure flexibility when sitting. Flexibility was measured to the nearest 0.5 cm.

Appl. Sci. 2021, 11, 10330 5 of 14
2.4. Ethics
The research protocol was approved by the Local Bioethics Committee of the KarolMarcinkowski University of Medical Sciences in Poznan (decision no. 537/17). The authorsdeclare that all methods have been applied in accordance with the relevant guidelines andregulations and that certified consent was obtained from all participants. Participationin the study was free, voluntary, and anonymous. Participants could withdraw from thestudy at any time without explanation.
2.5. Data Analysis
Basic and advanced statistical procedures of the STATISTICA 13.3 (Stat.Soft, Krakow,Poland) software package were used to conduct data analysis. Statistical significance wasset at p < 0.05. Because the distribution of quantitative variables was not normal, thefollowing non-parametric tests were used for statistical calculations: the Mann–Whitney Utest, the Kruskal–Wallis ANOVA test, the repeated measures ANOVA test, the two-wayANOVA test, and Spearman’s rank correlation significance test with bootstrap confidenceintervals.
3. Results
The mean age of the participants was 54.1 ± 13.0 years. The minimum BMI value, bothfor men and for women, was 30 kg/m2. The mean BMI value in women was 39.06 kg/m2
and was higher than in men (37.54 kg/m2), whereas for the whole studied group it was38.43 kg/m2. In addition, the waist circumference values were similar: 150 cm in womenand 157 cm in men. Taking into account the degree of obesity, the largest number ofpatients (39%) had third-degree obesity and the smallest number of patients in the studiedgroup (28%) had second-degree obesity. First-degree obesity characterised 33% of theparticipants. There were 49 patients (57% women) with diagnosed insulin-dependentdiabetes. Anthropometric data are presented in Table 1.
Table 1. Descriptive statistics of BMI, waist circumference, mean annual decrease/increase in body weight, blood pressureand HR values, and the results of laboratory blood tests and their differentiation by gender, age, and the presence of DM(with a Mann–Whitney U test).
ParameterMean (SD)
p(F/M)
p(Age < 60/>
59)
p(DM)
Femalen = 48
Malen = 34
Totaln = 82
BMI (kg/m2) 39.06 (6.78) 37.54 (6.73) 38.43 (6.76) 0.325 0.103 0.366
Waist circumference (cm) 116.90 (15.62) 121.79 (16.84) 118.93 (16.22) 0.190 0.559 0.049
Mean annual decrease/increasein body weight (kg/year) 0.01 (4.78) 0.64 (3.13) 0.27 (4.16) 0.728 0.475 0.296
Systolic blood pressure (mm Hg) 143.30 (12.88) 148.94 (17.74) 145.63 (15.25) 0.205 0.153 0.113
HR (L/min) 76.65 (7.19) 77.50 (6.78) 77.00 (6.99) 0.399 0.002 0.121
Total cholesterol (mmol/L) 5.80 (2.34) 5.33 (2.19) 5.63 (2.28) 0.318 0.151 0.347
HDL (mmol/L) 1.27 (0.30) 3.28 (10.12) 2.01 (6.16) 0.351 0.899 0.571
LDL (mmol/L) 3.42 (1.14) 3.22 (1.19) 3.35 (1.15) 0.540 0.102 0.162
Triglycerides (mmol/L) 2.09 (0.99) 1.91 (0.99) 2.03 (0.98) 0.339 0.757 0.880
Sodium (mmol/L) 140.77 (2.57) 141.26 (2.88) 140.95 (2.68) 0.723 0.004 ≤0.001
Glucose (mmol/L) 6.98 (2.67) 7.01 (2.21) 6.99 (2.49) 0.444 0.025 0.086
Note: BMI, body mass index; HR, heart rate; HDL, high density lipoprotein; LDL, low density lipoprotein; SD, standard deviation.Statistical significance was set at p < 0.05.

Appl. Sci. 2021, 11, 10330 6 of 14
In the above parameters, sex did not differentiate the participants; however, age didin terms of resting HR and levels of glucose and sodium (lower parameters for youngerparticipants, with the exception of the heart rate) and the presence of DM in terms ofwaist circumference and glucose level (all parameters were lower for participants withoutdiagnosed DM).
Additionally, the results of blood biochemical tests of 62 patients were analysed. Themean value of total cholesterol in the participants was 5.63 mmol/L (slightly higher inwomen than in men, 5.80 mmol/L and 5.33 mmol/L, respectively), and in almost half ofthe participants (45.1%) blood cholesterol levels exceeded the normal level. The levels ofLDL cholesterol, triglycerides, and glucose (3.34 mmol/L, 2.02 mmol/L, and 6.99 mmol/L,respectively) were also above normal in a large group of participants. Only the levels ofsodium were normal with a minimum value of 135.00 mmol/L. Normal values were alsonoted for HDL cholesterol in the vast majority of participants, with the mean value of2.01 mmol/L (see Figure 1).
Appl. Sci. 2021, 11, x FOR PEER REVIEW 6 of 14
In the above parameters, sex did not differentiate the participants; however, age did in terms of resting HR and levels of glucose and sodium (lower parameters for younger participants, with the exception of the heart rate) and the presence of DM in terms of waist circumference and glucose level (all parameters were lower for participants without diag-nosed DM).
Additionally, the results of blood biochemical tests of 62 patients were analysed. The mean value of total cholesterol in the participants was 5.63 mmol/L (slightly higher in women than in men, 5.80 mmol/L and 5.33 mmol/L, respectively), and in almost half of the participants (45.1%) blood cholesterol levels exceeded the normal level. The levels of LDL cholesterol, triglycerides, and glucose (3.34 mmol/L, 2.02 mmol/L, and 6.99 mmol/L, respectively) were also above normal in a large group of participants. Only the levels of sodium were normal with a minimum value of 135.00 mmol/L. Normal values were also noted for HDL cholesterol in the vast majority of participants, with the mean value of 2.01 mmol/L (see Figure 1).
Figure 1. Analysis of results of blood biochemical tests in reference to normal levels of the parameters. Note: HDL, high density lipoprotein; LDL, low density lipoprotein.
3.1. Physical Activity The results clearly show that few participants undertake intensive physical exercise
(28%), which allows for a more effective reduction in weight. Walking, defined as walking without a break for at least 10 min, has been shown to be a significant preventative factor but definitely less effective in the context of body weight reduction. However, it was pre-ferred by a large majority of participants (88%). Detailed data on the level of actual PA declared by the respondents are presented in Table 2. Men declared a significantly higher level of total activity and intensive activity. The current age of the participants and the presence of insulin-dependent DM did not differentiate the frequency of undertaking PA of various intensities.
35.5
4.8
29.0
64.5
25.8
35.5
95.2
100.0
71.0
74.2
64.5
0% 20% 40% 60% 80% 100%
total cholesterol (mmol/L)
HDL (mmol/L)
LDL (mmol/L)
triglycerides (mmol/L)
glucose (mmol/L)
sodium (mmol/L)
Percent (%)below standard normal increasedFigure 1. Analysis of results of blood biochemical tests in reference to normal levels of the parameters. Note: HDL, highdensity lipoprotein; LDL, low density lipoprotein.
3.1. Physical Activity
The results clearly show that few participants undertake intensive physical exercise(28%), which allows for a more effective reduction in weight. Walking, defined as walkingwithout a break for at least 10 min, has been shown to be a significant preventative factorbut definitely less effective in the context of body weight reduction. However, it waspreferred by a large majority of participants (88%). Detailed data on the level of actual PAdeclared by the respondents are presented in Table 2. Men declared a significantly higherlevel of total activity and intensive activity. The current age of the participants and thepresence of insulin-dependent DM did not differentiate the frequency of undertaking PAof various intensities.

Appl. Sci. 2021, 11, 10330 7 of 14
Table 2. Various levels of PA of the participants by gender, age, and diagnosed DM (with the Mann–Whitney U test).
Physical Activity MET-min/week
Femalen = 48
Malen = 34
Totaln = 82
p(F/M)
p(Age < 60/>
59)
p(DM)
TOTAL,MET-min/week
Mean (SD) 1961.25(2862.99)
3194.25(3403.80)
2472.49(3138.44) 0.048 0.781 0.677
Median 371.25 1749.0 1287.0
VIGOROUS,MET-min/week
Mean (SD) 611.67(2023.29)
1625.88(2676.57)
1032.19(2355.16) 0.006 0.172 0.254
Median 0.0001 0.0001 0.0001
MODERATE,MET-min/week
Mean (SD) 730.83(1116.67)
523.53(806.06)
644.88(999.40) 0.381 0.481 0.172
Median 400.00 0.0001 300.00
WALKING,MET-min/week
Mean (SD) 618.75(841.46)
1044.84(1311.87)
795.42(1075.45) 0.223 0.391 0.853
Median 371.25 511.50 371.25
Note: MET-min/week, metabolic equivalent of work—minutes for the week. One MET corresponds to the amount of oxygen consumed atrest and is equal to 3.5 mL of oxygen per kg of body weight per minute; SD, standard deviation. Statistical significance was set at p < 0.05.
Repeated measures ANOVA showed a significant differentiation in the amount ofMET-min/week obtained for particular activities (vigorous, moderate, and walking) bymen (with Greenhouse–Geisser correction, F = 3.645, df = 1.41/46.66, p = 0.048) with asignificantly greater amount of vigorous activity than moderate activity (Tukey’s HSDpost-hoc comparisons, p = 0.024). There were no such results among women.
The participants were also divided into three groups based on the levels of activitymeasured with the IPAQ (insufficient, sufficient, high level), and relationships with PAin the past, the level of current PA, the level of obesity, and biochemical parameters weredetermined. A high level of PA was noted for 24.4% of the participants (18.8% of womenand 32.4% of men), a sufficient level was noted for 45.1% of the participants (43.7% ofwomen and 47.0% of men), and an insufficient level was noted for 30.5% of the participants(37.5% of women and 20.6% of men).
Looking at PA undertaken in childhood and adolescence, it can be stated that menwere generally more active than women (in particular in childhood) and that the currentage of the participants does not differentiate them in this respect, similarly to the co-existence of DM or the current level of PA (see Table 3). However, a weak correlation wasfound between the level of activity in the past (for the youngest and the oldest age groups)and the current expenditure carried out in an intensive manner (for 6–14 yo: r = 0.220,p = 0.047, and 95%Cl = [0.002, 0.410]; for 15–17 yo: r = 0.193, p = 0.083, and 95%Cl = [−0.025,0.387]; and for 17–18 yo: r = 0.240, p = 0.030, and 95%CI = [0.023, 0.428]). This indicates alarger tendency to undertake intensive activity by persons who were active in childhood.However, the decline in daily activity with age is clear (Chiˆ2 Friedman’s ANOVA (N = 82,df = 2) = 57.922, p < 0.001). The recommended daily dose of 60 min of PA per week wasundertaken by only 12.2% of the participants at the age of 6–14 years (33% at least six timesa week) and in the later years of adolescence: at the age of 15–17 years—9.8% and 28.1%,respectively, and at the age of 17–19 years—8.5% and 18.3%, respectively.
In the other analysed parameters (BMI, obesity level, waist circumference, bloodpressure, HR values, and the results of laboratory blood tests) the current PA level did notdifferentiate the studied participants (for all, p > 0.05).
Appl. Sci. 2021, 11, 10330 8 of 14
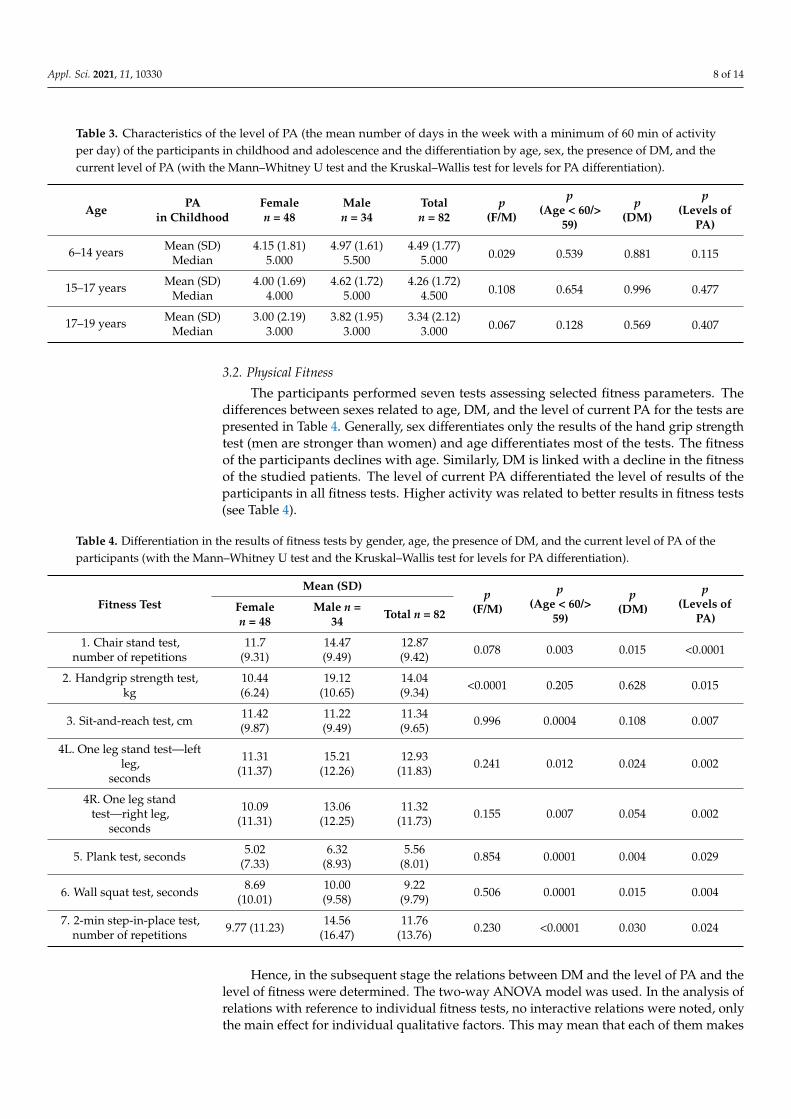
Table 3. Characteristics of the level of PA (the mean number of days in the week with a minimum of 60 min of activityper day) of the participants in childhood and adolescence and the differentiation by age, sex, the presence of DM, and thecurrent level of PA (with the Mann–Whitney U test and the Kruskal–Wallis test for levels for PA differentiation).
Age PAin Childhood
Femalen = 48
Malen = 34
Totaln = 82
p(F/M)
p(Age < 60/>
59)
p(DM)
p(Levels of
PA)
6–14 years Mean (SD) 4.15 (1.81) 4.97 (1.61) 4.49 (1.77)0.029 0.539 0.881 0.115Median 5.000 5.500 5.000
15–17 years Mean (SD) 4.00 (1.69) 4.62 (1.72) 4.26 (1.72)0.108 0.654 0.996 0.477Median 4.000 5.000 4.500
17–19 years Mean (SD) 3.00 (2.19) 3.82 (1.95) 3.34 (2.12)0.067 0.128 0.569 0.407Median 3.000 3.000 3.000
3.2. Physical Fitness
The participants performed seven tests assessing selected fitness parameters. Thedifferences between sexes related to age, DM, and the level of current PA for the tests arepresented in Table 4. Generally, sex differentiates only the results of the hand grip strengthtest (men are stronger than women) and age differentiates most of the tests. The fitnessof the participants declines with age. Similarly, DM is linked with a decline in the fitnessof the studied patients. The level of current PA differentiated the level of results of theparticipants in all fitness tests. Higher activity was related to better results in fitness tests(see Table 4).
Table 4. Differentiation in the results of fitness tests by gender, age, the presence of DM, and the current level of PA of theparticipants (with the Mann–Whitney U test and the Kruskal–Wallis test for levels for PA differentiation).
Fitness TestMean (SD)
p(F/M)
p(Age < 60/>
59)
p(DM)
p(Levels of
PA)Femalen = 48
Male n =34 Total n = 82
1. Chair stand test,number of repetitions
11.7(9.31)
14.47(9.49)
12.87(9.42) 0.078 0.003 0.015 <0.0001
2. Handgrip strength test,kg
10.44(6.24)
19.12(10.65)
14.04(9.34) <0.0001 0.205 0.628 0.015
3. Sit-and-reach test, cm 11.42(9.87)
11.22(9.49)
11.34(9.65) 0.996 0.0004 0.108 0.007
4L. One leg stand test—leftleg,
seconds
11.31(11.37)
15.21(12.26)
12.93(11.83) 0.241 0.012 0.024 0.002
4R. One leg standtest—right leg,
seconds
10.09(11.31)
13.06(12.25)
11.32(11.73) 0.155 0.007 0.054 0.002
5. Plank test, seconds 5.02(7.33)
6.32(8.93)
5.56(8.01) 0.854 0.0001 0.004 0.029
6. Wall squat test, seconds 8.69(10.01)
10.00(9.58)
9.22(9.79) 0.506 0.0001 0.015 0.004
7. 2-min step-in-place test,number of repetitions 9.77 (11.23) 14.56
(16.47)11.76
(13.76) 0.230 <0.0001 0.030 0.024
Hence, in the subsequent stage the relations between DM and the level of PA and thelevel of fitness were determined. The two-way ANOVA model was used. In the analysis ofrelations with reference to individual fitness tests, no interactive relations were noted, onlythe main effect for individual qualitative factors. This may mean that each of them makes

Appl. Sci. 2021, 11, 10330 9 of 14
an independent contribution to an improvement or a decline in the fitness of the studiedpatients (see Table 5).
Table 5. Main effects and interaction effect of DM and PA on fitness tests—results of two-way ANOVA.
Fitness Test Variables df F p ηp2
1. Chair stand test,number of repetitions
PA 2 15.82 <0.0001 0.294DM 1 6.34 0.014 0.077
PA × DM 2 0.37 0.689 0.010
2. Handgrip strength test, kgPA 2 2.75 0.070 0.068DM 1 0.03 0.867 <0.001
PA × DM 2 0.19 0.828 0.005
3. Sit-and-reach test, cmPA 2 4.17 0.019 0.099DM 1 1.09 0.300 0.014
PA × DM 2 0.31 0.736 0.008
4L. One leg stand test—left leg,seconds
PA 2 6.44 0.003 0.145DM 1 4.75 0.032 0.059
PA × DM 2 1.52 0.226 0.038
4R. One leg stand test—right leg,seconds
PA 2 7.35 0.001 0.162DM 1 3.12 0.081 0.039
PA × DM 2 2.24 0.113 0.056
5. Plank test, secondsPA 2 2.37 0.101 0.059DM 1 7.57 0.007 0.091
PA × DM 2 0.73 0.485 0.019
6. Wall squat test, secondsPA 2 6.36 0.003 0.145DM 1 7.38 0.008 0.090
PA × DM 2 0.29 0.751 0.008
7. 2-min step-in-place test,number of repetitions
PA 2 4.54 0.015 0.154DM 1 0.08732 0.769 0.002
PA × DM 2 0.85751 0.430 0.033
Note: DM, diabetes; PA, physical activity level; ηp2, partial eta squared.
4. Discussion
We believe that the current work is the first study to present differences in the level ofPF depending on the level of PA of obese people with co-existing HT. Our studies indicatethat PF is probably not related directly to the obesity of the participants or the coexistingHT. Rather, the current PA, a deficiency in which determines a low level of PF and/or HT,may be the critical factor. We noted that the higher the level of PA, the higher the PF—evenin obese participants with HT. On the other hand, the co-existence of DM lowers almost allof the analysed parameters, both biochemical and fitness.
It should be noted that slightly higher values than ours (33.4% vs. 28%) in terms ofvigorous physical effort were obtained by Biernat [39] in a study of 373 administrative,technical, and manual workers, only 10.5% of whom were obese. Almost half of the subjectshad a normal weight (46.4%), and 33.5% were overweight. This comparison shows that thefeature that characterises the population studied by us (diagnosed diseases in patients andobesity, HT, and DM in some of the participants) and often the accompanying decreasein the quality of life and health do not motivate patients to undertake intensive physicalexercise more often.
On the other hand, in the comparison of the total energy expenditure with the resultsobtained by Biernat [39], slight differences should be noted for high levels of PA (24.4% vs.20.3%) and moderate levels of PA (45.1% vs. 49%), respectively, whereas for lower levels ofPA the results are almost identical (30.5% vs. 30.8%). It could be suggested that the fixedmodel of lifestyle in terms of PA is a highly stable variable and a factor such as disease doesnot modify it. The results are also consistent with the findings of a comprehensive study of

Appl. Sci. 2021, 11, 10330 10 of 14
the health of the Polish population in 2009, conducted by the Central Statistical Office [40].We have to note, similarly to the authors of [40] and Biernat [39], that the level of PA ofPoles is low. For at least one-third of obese patients with HT, the level of PA is insufficientto maintain health at an unchanged level, and for the other half it is insufficient to satisfythe criterion for effective non-pharmacological therapy. Moreover, we noted that thoseparticipants who are currently physically inactive obese adults with HT were also childrenwith a low level of PA in the past. The recommended daily dose of PA was undertaken bya small percentage of children.
In terms of the PF of the studied obese patients with HT, the highest level of fitnessoccurred in persons in the group with a high level of PA. All participants in the studiedgroup were under constant medical supervision and their blood pressure level was main-tained pharmacologically; therefore, we could not identify any relationship between PAand fitness and the level of blood pressure of the respondents. We observed, however, thatin obese people treated for HT, appropriate PA co-existed with high PF. These are two basicfactors that offer a chance for therapeutic success in such patients. A recently publishedreview updated previous reports of an association between higher levels of PA and alower risk of incidental obesity, coronary heart disease, and diabetes and a reduced risk ofdeveloping new diseases [41]. At the same time, this review showed that we need moreresearch to draw a conclusion on the relationship between PA and hypertension [41]. Atpresent, the therapeutic mechanisms by which physical exercise decreases blood pressurein hypertensive patients are unclear. There are many important, different factors andmechanisms [42]. Diaz and Shimbo [43] list several probable mechanisms of the effect ofPA on blood pressure, but we can add that the concurring factor may be the fitness of thelocomotor apparatus (motor fitness).
This study showed that there is no single causative factor that directly characterisespatients with high blood pressure. We demonstrated, however that PF, the appropriate levelof which is a necessary pre-condition of successful HT therapy, is probably a consequenceof current PA. The activity undertaken in childhood is not directly associated with health(including the level of blood pressure) or with PF in adult life. However, an appropriatelifestyle in adulthood may be the effect of patterns of behaviour developed in childhoodand adolescence. However, studies on obese people with HT showed that the relationbetween PA in childhood and PA in adult life is not necessarily a rule.
In our study, we noted that the PF of obese patients with HT is significantly related tothe co-existence of DM. Of course, it is difficult to indicate a primary factor—DM or PF—within this study but it opens interesting avenues for further research. In addition, patientswith two or three chronic diseases (obesity, HT, and/or DM) have a greater illness/diseaseburden and are more disabled as they experience greater barriers to overcome in order tobe physically active compared with populations with one or two diagnosed conditions.Patients with multiple chronic diseases experience greater barriers to be overcome inorder to be physically active because they are more depressed and likely to have lessvitality, probably because of the burdens of multiple treatment regimens, concerns aboutcomplications, poorer perceptions of health, and the need to take more medication. Thus,they may perceive lower levels of autonomy and competence in dealing with it all [44]. Ourstudy shows that the level of PA of obese people with HT is low and particular deficienciesin this respect were noted in people with diagnosed DM. Patients with DM in the firstyears of their illness are often recommended to make lifestyle changes in the absence ofnoticeable diabetes-related symptoms or complaints. Van Puffelen et al. [45] observedthat many patients do not seem to perceive their condition to be serious and postponelifestyle changes until DM-related complications appear. The fitness levels of youth withDM seem to be in the low range, with youth with type 2 diabetes having poorer fitnesslevels than youth with type 1 diabetes [46]. Our findings indicate the need to develop andimplement better education programmes than those available at present for people withdiagnosed DM. Our patients already had obesity and HT; however, those who had anotherdiagnosed disease—DM—were still characterised by the lowest PF. Of course, it cannot be

Appl. Sci. 2021, 11, 10330 11 of 14
conclusively shown that low PF is a causative factor of DM, but we have demonstrated therelations between these two variables.
Moreover, we noted that the level of fitness of our patients was relatively low. Forexample, patients studied by us performed on average 12 repetitions in the chair standtest, whereas 64 older adults (≥60 years) studied by Shahtahmassebi et al. [47] performedapproximately 16 repetitions before undertaking exercise, and even 20 repetitions after18 weeks of training. Roongbenjawan and Siriphorn [48] indicated that a low numberof repetitions in this test may significantly increase the risk of falls, because people whoreported falls were able to perform only approximately nine repetitions. People in the agegroup studied by us should perform more than 13 repetitions on average [49].
The low fitness of our patients was also demonstrated in the co-ordination tests. In theone leg stand test, their time was only approximately 12 s, which shows a weak functioningof the body’s balance system. Da Silva et al. [50] noted that subjects aged over 60 years,living independently, with no falls in the past, can stand for 25 s (ranging from 6 to 74 s).The subjects also had very significant difficulties with the correct execution of the 2-minstep-in-place test.
Based on the previous studies [51,52], we expected that handgrip strength wouldcorrelate to PA or other health-related components. Akbar and Setiati [53] observed thathandgrip strength correlated to nutritional status. In our study, the level of handgripstrength was independent of the other tested variables. The low level of handgrip strengthin our patients can explain this rare and dangerous situation. Poor grip strength hasbeen found to be a common factor in the elderly who have suffered a fall [54]. Maximalhand grip strength is associated with self-efficacy as related to the fear of falling [55].Interestingly, Semba et al. [56] observed that grip strength correlates strongly to overallbody strength and the ability to perform functional tasks. For this reason, the low levelof hand grip strength in our patients could be worrying. On the other hand, the lackof statistically significant relationships with other components of functional efficiency isdifficult to explain. In addition, Awoitidebe et al. [57] observed that people with diabetesmellitus likewise demonstrated poor handgrip strength and that selected upper limbanthropometric characteristics significantly correlate to handgrip strength. Our subjectspresented a low level of handgrip strength, which correlated only to gender. This is worthfurther investigation with a more in-depth study.
The functional fitness factors studied by us are listed as some of those that contributeto successful ageing [58].
Among the limitations of the study, we can list a possible recall bias for the PA in thepast and a small sample size; however, considering the specificity of the analysed factors(DM, HT, and obesity), the sample size was still reasonable. Adding PF with group-specifictailoring of the tests, which is rare in this kind of research, should be considered a strength.
The analysis shows that a deeper understanding of the causes of the lower PF of obesepeople with HT and additionally DM is needed in order to recognise the motivation, orthe lack of motivation, to participate in the therapeutic process. Without the patient’scooperation, a doctor involved in the patient’s care may be ineffective. Obese patients,particularly those with concomitant HT and DM, should be provided with interdisci-plinary care by not only physicians and dieticians, but also by physical activity specialists:physiotherapists, occupational therapists, or personal coaches. The presence of severalconcomitant diseases depletes patients’ health resources and generates a greater anxietyagainst and an unwillingness to make changes in terms of PA with its underestimatedprotective role. PA, meanwhile, should be intensely included both in the prevention andnon-pharmacological treatment of NCDs. Mere recommendations to increase the dailyamount of PA may be insufficient. Muscle tissue volume, a prerequisite for adequate fitnessand, hence, self-dependency, and the lack of difficulties with self-care and the activities ofdaily living decrease with age. The consequences of the lack of adequate support in thisarea for the health care system and social services are vast, both in terms of financing (e.g.,costs of therapeutic and corrective actions) and social costs (e.g., the costs of caring for a

Appl. Sci. 2021, 11, 10330 12 of 14
disabled person). Educational messages addressed to people suffering from NCDs shouldalso be significantly modified to emphasise the importance of daily, well-designed PA toimprove PF. This is the purpose, among other things, of the health-related fitness concept.
5. Conclusions
Our study clearly shows that the presence of an additional concomitant disease,namely DM, in obesity with HT significantly reduces PF rates. Reliable PF tests dedicatedto obese patients should be developed, which should be included in the assessment ofpatients’ health resources.
Author Contributions: J.K. and I.L.-K. conceived the study design. J.K. and M.K. were involvedin data collection. I.L.-K. and J.M. performed the statistical analysis. J.K., M.B., I.L.-K., and J.M.interpreted data and prepared a draft of the manuscript. All authors edited, critically reviewed, andapproved the final version of the manuscript. All authors have read and agreed to the publishedversion of the manuscript.
Funding: This research received no external funding.
Institutional Review Board Statement: The research protocol was approved by the Local BioethicsCommittee of the Karol Marcinkowski University of Medical Sciences in Poznan (decision no. 537/17).The authors declare that all methods have been applied in accordance with the relevant guidelinesand regulations and that certified consent was obtained from all participants. Participation in thestudy was free, voluntary, and anonymous. Participants could withdraw from the study at any timewithout explanation.
Informed Consent Statement: Informed consent was obtained from all subjects involved in thestudy.
Data Availability Statement: Please contact the corresponding author for data requests.
Acknowledgments: We gratefully acknowledge to Paweł Kleka for his assistance in statisticalanalysis.
Conflicts of Interest: The authors declare no conflict of interest.
References1. Kalbarczyk, M.; Mackiewicz-Łyziak, J. Physical Activity and Healthcare Costs: Projections for Poland in the Context of an Ageing
Population. Appl. Health Econ. Health Policy 2019, 17, 523–532. [CrossRef]2. Krysinska, M.; Domosławska-Zylinska, K.; Fronk, M. (Eds.) Education and Prevention of Injuries among People over 60 Years of Age;
Narodowy Instytut Zdrowia Publicznego—Panstwowy Zakład Higieny: Warsaw, Poland, 2017. (In Polish)3. Wojtyniak, B.; Gorynski, P. Health Situation of the Polish Population and its Determinants—Synthesis; Narodowy Instytut Zdrowia
Publicznego—Panstwowy Zakład Higieny: Warsaw, Poland, 2018. (In Polish)4. Tremblay, M.S.; Shephard, R.J.; Brawley, L.R.; Cameron, C.; Craig, C.L.; Duggan, M.; Esliger, D.W.; Hearst, W.; Hicks, A.; Janssen,
I.; et al. Physical activity guidelines and guides for Canadians: Facts and future. Appl. Physiol. Nutr. Metab. 2007, 32 (Suppl. 2E),S218–S224. [CrossRef]
5. Bennie, J.A.; Chau, J.Y.; Ploeg, H.P.; Stamatakis, E.; Do, A.; Bauman, A. The prevalence and correlates of sitting in EuropeanAdults—A comparison of 32 Eurobarometer—Participating countries. Int. J. Behav. Nutr. Phys. Act. 2013, 10, 107. [CrossRef]
6. Raport MultiSport Index 2019, Actively for Health. Study of the Physical and Sports Activity of Poles. Available online:https://www.benefitsystems.pl (accessed on 29 October 2021). (In Polish).
7. West, S.L.; Caterini, J.; Banks, L.; Wells, G.D. Editorial the epidemic of obesity and poor physical activity participation: Will weever see a change? J. Funct. Morphol. Kinesiol. 2018, 3, 34. [CrossRef]
8. Strasser, B. Physical activity in obesity and metabolic syndrome. Ann. N. Y. Acad. Sci. 2013, 1281, 141–159. [CrossRef]9. Kwon, H.-J.; Lee, H.-J. Effect of vigorous physical activity on blood lipid and glucose. J. Exerc. Rehabil. 2017, 13, 653–658.
[CrossRef]10. Colberg, S.R.; Sigal, R.J.; Yardley, J.E.; Riddell, M.C.; Dunstan, D.W.; Dempsey, P.C.; Horton, E.S.; Castorino, K.; Tate, D.F. Physical
activity/exercise and diabetes: A position statement of the American Diabetes Association. Diabetes Care 2016, 39, 2065–2079.[CrossRef] [PubMed]
11. Lee, I.M.; Shiroma, E.J.; Lobelo, F.; Puska, P.; Blair, S.N.; Katzmarzyk, P.T.; Lancet Physical Activity Series Working Group. Effectof physical inactivity on major non-communicable diseases worldwide: An analysis of burden of disease and life expectancy.Lancet 2012, 380, 219–229. [CrossRef]

Appl. Sci. 2021, 11, 10330 13 of 14
12. Olshansky, S.J.; Passaro, D.J.; Hershow, R.C.; Layden, J.; Carnes, B.A.; Brody, J.; Hayflick, L.; Butler, R.N.; Allison, D.B.; Ludwig,D.S. A potential decline in life expectancy in the United States in the 21st century. N Engl. J. Med. 2005, 352, 1138–1145. [CrossRef]
13. Hankinson, A.L.; Daviglus, M.L.; Bouchard, C.; Carnethon, M.; Lewis, C.E.; Schreiner, P.J.; Liu, K.; Sidney, S. Maintaining a highphysical activity level over 20 years and weight gain. JAMA 2010, 304, 2603–2610. [CrossRef] [PubMed]
14. Barlow, C.E.; LaMonte, M.J.; FitzGerald, S.J.; Kampert, J.B.; Perrin, J.L.; Blair, S.N. Cardiorespiratory fitness is an independentpredictor of hypertension incidence among initially normotensive healthy women. Am. J. Epidemiol. 2006, 163, 142–150. [CrossRef]
15. Lee, D.-C.; Sui, X.; Church, T.S.; Lee, I.M.; Blair, S.N. Associations of cardiorespiratory fitness and obesity with risks of impairedfasting glucose and type 2 diabetes in men. Diabetes Care 2009, 32, 257–262. [CrossRef]
16. Chase, N.L.; Sui, X.; Lee, D.; Blair, S.N. The association of cardiorespiratory fitness and physical activity with incidence ofhypertension in men. Am. J. Hypertens. 2009, 22, 417–424. [CrossRef]
17. Michaliszyn, S.F.; Shaibi, G.Q.; Quinn, L.; Fritschi, C.; Faulkner, M.S. Physical fitness, dietary intake, and metabolic control inadolescents with type 1 diabetes. Pediatric Diabetes 2009, 10, 389–394. [CrossRef]
18. Kniec, M.; Kujawska-Łuczak, M. Lifestyle modification in hypertensive Patients—Part 2. Forum Zaburzen Metab. 2012, 3, 70–79.(In Polish)
19. Wanner, M.; Martin, B.W.; Autenrieth, C.S.; Schaffner, E.; Meier, F.; Brombach, C.; Stolz, D.; Bauman, A.; Rochat, T.; Schindler, C.Associations between domains of physical activity, sitting time, and different measures of overweight and obesity. Prev. Med. Rep.2016, 3, 177–184. [CrossRef] [PubMed]
20. Bogdanski, P.; Grabanska, K. The site of nonpharmacological management in prevention and treatment of arterial hypertension.Forum Zab Metab. 2010, 2, 115–122. (In Polish)
21. Tykarski, A.; Filipiak, K.J.; Januszewicz, J.; Litwin, M.; Narkiewicz, K.; Prejbisz, A.; Ostalska-Nowicka, D.; Widecka, K.; Kostka-Jeziorny, K. Rules of conduct in Hypertension—2019. Guidelines of the Polish Society of Hypertension. Nadcisnienie Tetnicze WPrakt. 2019, 5, 1–86. (In Polish)
22. Matschay, A.; Turostowska, R. Assessment of quality of cooperation between physicians and patients in treatment of arterialhypertension in a population of women and men. Now. Lek. 2013, 82, 294–302. (In Polish)
23. Walther, D.; Curjuric, J.; Dratva, J.; Schaffner, E.; Quinto, C.; Schmidt-Trucksass, A.; Eze, I.C.; Burdet, L.; Pons, M.; Gerbase, M.W.Hypertension, diabetes and lifestyle in the Long-Term—Results from a Swiss population-based cohort. Prev. Med. 2017, 97, 56–61.[CrossRef]
24. Rosenzweig, J.L.; Ferranninni, E.; Grundy, S.M.; Haffner, S.M.; Heine, R.J.; Horton, E.S.; Kawamori, R. Primary prevention ofcardiovascular disease and type 2 diabetes in patients at metabolic risk: An endocrine society clinical practice guideline. J. Clin.Endocrinol. Metab. 2018, 93, 3671–3689. [CrossRef]
25. Matej-Butrym, A.; Butrym, M.; Jaroszynski, A. Self-assessment of compliance with physician recommendations and glycaemiccontrol in patients with type 2 diabetes. Fam. Med. Prim. Care Rev. 2015, 17, 111–114. (In Polish)
26. Boulé, N.G.; Kenny, G.P.; Haddad, E.; Wells, G.A.; Sigal, R.J. Meta-analysis of the effect of structured exercise training oncardiorespiratory fitness in type 2 diabetes mellitus. Diabetologia 2003, 46, 1071–1081. [CrossRef]
27. Carnethon, M.R.; Sternfeld, B.; Schreiner, P.J.; Jacobs, D.R.; Lewis, C.E.; Liu, K.; Sidney, S. Association of 20-year changes incardiorespiratory fitness with incident type 2 diabetes. Diabetes Care 2009, 32, 1284–1288. [CrossRef]
28. Šedová, L.; Tóthová, V.; Olišarova, V.; Bártlová, S.; Chloubová, I.; Michálková, H.; Prokešová, R.; Treslova, M.; Adámkova, V.Opinions regarding the effectiveness of non-pharmacological measures in prevention of cardiovascular disease in the CzechRepublic. Neuroendocr. Lett. 2016, 37, 32–38.
29. Jarosz, M.; Wolanska, D.; Stolinska, H.; Respondek, W.; Kłosiewicz-Latoszek, L. Nutrition and lifestyle in patients pharmacologi-cally treated due to hypertension. Cardiol. J. 2016, 23, 491–496. [CrossRef] [PubMed]
30. Biernat, E.; Stupnicki, R.; Gajewski, A.K. International Physical Activity Questionnaire (IPAQ)—Polish version. Wych. Fiz. I Sport2007, 51, 47–54. (In Polish)
31. International Physical Activity Questionnaire. Available online: www.ipaq.ki.se (accessed on 31 March 2018).32. Prochaska, J.; Sallis, J.; Long, B. A physical activity screening measure for use with adolescents in primary care. Arch. Pediatr.
Adolesc Med. 2001, 155, 554–559. [CrossRef] [PubMed]33. Rikli, R.E.; Jones, C.J. Senior Fitness Test Manual, 2nd ed.; Human Kinetics: Champaign, IL, USA, 2013.34. Eurofit. Eurofit Tests of Physical Fitness, 2nd ed.; Eurofit: Strasbourg, France, 1993.35. Springer, B.A.; Marin, P.; Cyhan, T.; Roberts, H.; Gill, N.W. Normative Values for the Unipedal Stance Test with Eyes Open and
Closed. J. Geriatr. Phys. Ther. 2007, 30, 8–15. [CrossRef]36. Strand, S.L.; Hjelm, J.; Shoepe, T.C.; Fajardo, M.A. Norms for an isometric muscle endurance test. J. Hum. Kinet. 2014, 40, 93–102.
[CrossRef]37. Mackenzie, B. 101 Performance Evaluation Tests; PEAK Personal Training online Performance; Electric Word plc: London, UK, 2014.38. Bös, K.; Brehm, W.; Klemm, K.; Schreck, M. European Fitness Badge: Handbook for Instructors; Deutscher Turner-Bund e.V: Frankfurt
am Main, Germany, 2017.39. Biernat, E. Factors increasing the risk of inactivity among administrative, technical, and manual workers in Warszawa public
institutions. Int. J. Occup. Med. Environ. Health 2015, 28, 283–294. [CrossRef]

Appl. Sci. 2021, 11, 10330 14 of 14
40. Cleven, L.; Krell-Roesch, J.; Nigg, C.R.; Woll, A. The association between physical activity with incident obesity, coronary heartdisease, diabetes and hypertension in adults: A systematic review of longitudinal studies published after 2012. BMC Public Health2020, 20, 726. [CrossRef]
41. Health Status of Polish People in 2009; Central Statistical Office: Warsaw, Poland, 2011. (In Polish)42. American College of Sports Medicine. Position Stand. Physical activity, physical fitness, and hypertension. Med. Sci. Sorts Exert
1993, 25, 1–10.43. Diaz, K.M.; Shimbo, D. Physical activity and the prevention of hypertension. Curr. Hypertens. Rep. 2013, 15, 659–668. [CrossRef]44. Halvari, H.; Healey, J.; Olafsen, A.H.; Byrkjeland, R.; Deci, E.L.; Williams, G.C. Physical activity and motivational predictors of
changes in health behavior and health among DM2 and CAD patients. Scand. J. Med. Sci. Sports 2017, 27, 1454–1469. [CrossRef][PubMed]
45. van Puffelen, A.L.; Heijmans, M.J.; Rijken, M.; Rutten, G.E.; Nijpels, G.; Schellevis, F.G. Illness perceptions and self-care behavioursin the first years of living with type 2 diabetes; does the presence of complications matter? Psychol. Health 2015, 30, 1274–1287.[CrossRef]
46. Liese, A.D.; Ma, X.; Maahs, D.M.; Trilk, J.L. Physical activity, sedentary behaviors, physical fitness, and their relation to healthoutcomes in youth with type 1 and type 2 diabetes: A review of the epidemiologic literature. J. Sport Health Sci. 2013, 2, 21–38.[CrossRef]
47. Shahtahmassebi, B.; Hebert, J.J.; Hecimovich, M.; Fairchild, T.J. Trunk exercise training improves muscle size, strength, andfunction in older adults: A randomized controlled trial. Scand. J. Med. Sci. Sports 2019, 29, 980–991. [CrossRef] [PubMed]
48. Roongbenjawan, N.; Siriphorn, A. Accuracy of modified 30-s chair-stand test for predicting falls in older adults. Ann. Phys.Rehabil. Med. 2019, 63, 309–315. [CrossRef] [PubMed]
49. Jones, C.J.; Rikli, R.E.; Beam, W.C. A 30-s ChairStand Test as a measure of lower body strength in community-residing olderadults, research quarterly for exercise and sport. Res. Q Exerc. Sport 1999, 70, 113–119. [CrossRef] [PubMed]
50. Da Silva, R.A.; Bilodeau, M.; Parreira, R.B.; Teixeira, D.C.; Amorim, C.F. Age-related differences in time-limit performance andforce platform-based balance measures during one-leg stance. J. Electromyogr. Kinesiol. 2013, 23, 634–639. [CrossRef] [PubMed]
51. Kuchel, G.A. Aging and Homeostatic Regulation. In Hazzard’s Geriatric Medicine and Gerontology, 6th ed.; Hazzard, W.R., Halter,J.B., Eds.; McGraw-Hill Medical: New York, NY, USA, 2009; pp. 621–630.
52. Bohannon, R.W. Hand-Grip Dynamometry Predicts Future Outcomes in Aging Adults. J. Geriatr. Phys. 2008, 31, 3–10. [CrossRef][PubMed]
53. Akbar, F.; Setiati, S. Correlation between hand grip strength and nutritional status in elderly patients. IOP Conf. Series J. Phys.Conf. Ser. 2018, 1073, 042032. [CrossRef]
54. DeBeliso, M.; Boham, M.; Harris, C.; Carson, C.; Berning, J.M.; Sevene, T.; Adams, K.J.; Climstein, M. Grip Strength and FunctionalMeasures in the Mature Adult: Brief Report II. Int. J. Sci. Eng. Investig. 2015, 4, 1–4.
55. Belka, R.D.; De Beliso, M. Hand Grip Strength and Older Adults: Is Hand Grip Strength Associated with Self-Efficacy in OlderAdults? J. Phys. Act. Res. 2019, 4, 41–46. [CrossRef]
56. Semba, R.D.; Cappola, A.R.; Sun, K.; Bandinelli, S.; Dalal, M.; Crasto, C.; Guralnik, J.M.; Ferrucci, L. Relationship of low plasmaklotho with poor grip strength in older community-dwelling adults: The InCHIANTI study. Eur. J. Appl. Physiol. 2011, 112,1215–1220. [CrossRef] [PubMed]
57. Awotidebe, T.O.; Odetunde, M.O.; Okonji, M.A.; Odunlade, A.J.; Fasakin, O.M.; Olawoye, A.A.; Ayesoro, B.P.; Adedoyin, R.A.;Kolawole, B.A. Relationships between Hand Grip Strength, Upper Limb Anthropometric Characteristics and Hand Disability inMiddle-Aged and Older Adults with Type-2 Diabetes Mellitus. Int. J. Diabetes Clin. Res. 2021, 8, 135. [CrossRef]
58. Lin, P.S.; Hsieh, C.C.; Cheng, H.S.; Tseng, T.J.; Su, S.C. Association between physical fitness and successful aging in Taiwaneseolder adults. PLoS ONE 2016, 11, e0150389. [CrossRef]
Related Documents