Comparison of Different Cortical Connectivity Estimators for High-Resolution EEG Recordings Laura Astolfi, 1,2,3 Febo Cincotti, 3 Donatella Mattia, 3 M. Grazia Marciani, 3,4 Luiz A. Baccala, 5 Fabrizio de Vico Fallani, 3 Serenella Salinari, 1 Mauro Ursino, 6 Melissa Zavaglia, 6 Lei Ding, 7 J. Christopher Edgar, 8 Gregory A. Miller, 8 Bin He, 7 and Fabio Babiloni 2,3 1 Dipartimento Informatica e Sistemistica, Universita “La Sapienza,” Rome, Italy 2 Dipartimento Fisiologia Umana e Farmacologia, Universita “La Sapienza,” Rome, Italy 3 IRCCS Fondazione Santa Lucia, Rome, Italy 4 Dipartimento di Neuroscienze, Universita “Tor Vergata,” Rome, Italy 5 Department of Telecommunications and Control Engineering, Escola Polite ´cnica, University of Sa ˜o Paulo, Brazil 6 DEIS, University of Bologna “Alma Mater Studiorum,” Bologna, Italy 7 Department of Biomedical Engineering, University of Minnesota, Minneapolis, Minnesota, USA 8 Department of Psychology and Beckman Institute Biomedical Imaging Center, University of Illinois at Urbana-Champaign, Illinois, USA Abstract: The aim of this work is to characterize quantitatively the performance of a body of techniques in the frequency domain for the estimation of cortical connectivity from high-resolution EEG recordings in different operative conditions commonly encountered in practice. Connectivity pattern estimators investigated are the Directed Transfer Function (DTF), its modification known as direct DTF (dDTF) and the Partial Directed Coherence (PDC). Predefined patterns of cortical connectivity were simulated and then retrieved by the application of the DTF, dDTF, and PDC methods. Signal-to-noise ratio (SNR) and length (LENGTH) of EEG epochs were studied as factors affecting the reconstruction of the imposed connectivity patterns. Reconstruction quality and error rate in estimated connectivity patterns were evaluated by means of some indexes of quality for the reconstructed connectivity pattern. The error functions were statistically analyzed with analysis of variance (ANOVA). The whole methodol- ogy was then applied to high-resolution EEG data recorded during the well-known Stroop paradigm. Simulations indicated that all three methods correctly estimated the simulated connectivity patterns under reasonable condi- tions. However, performance of the methods differed somewhat as a function of SNR and LENGTH factors. The methods were generally equivalent when applied to the Stroop data. In general, the amount of available EEG affected the accuracy of connectivity pattern estimations. Analysis of 27 s of nonconsecutive recordings with an SNR of 3 or more ensured that the connectivity pattern could be accurately recovered with an error below 7% for the PDC and 5% for the DTF. In conclusion, functional connectivity patterns of cortical activity can be effectively estimated under general conditions met in most EEG recordings by combining high-resolution EEG techniques, linear inverse estimation of the cortical activity, and frequency domain multivariate methods such as PDC, DTF, and dDTF. Hum Brain Mapp 28:143–157, 2007. © 2006 Wiley-Liss, Inc. Key words: partial directed coherence; directed transfer function; dDTF; high-resolution EEG; Stroop Contract grant sponsor: National Science Foundation (NSF); Con- tract grant numbers: BES-0218736, BES-0411898; Contract grant sponsor: National Institutes of Health (NIH); Contract grant num- bers: EB00178, DA14111, MH19554, MH61358; Contract grant spon- sors: IRIB; University of Illinois Beckman Institute. *Correspondence to: Dr. Laura Astolfi, Department of Human Phys- iology and Pharmacology, University of Rome “La Sapienza,” P. le A. Moro 5, 00185, Rome, Italy. E-mail: laura.astolfi@uniroma1.it Received for publication 12 August 2005; Accepted 26 January 2006 DOI: 10.1002/hbm.20263 Published online 7 June 2006 in Wiley InterScience (www. interscience.wiley.com). Human Brain Mapping 28:143–157(2007) © 2006 Wiley-Liss, Inc.

Welcome message from author
This document is posted to help you gain knowledge. Please leave a comment to let me know what you think about it! Share it to your friends and learn new things together.
Transcript
Comparison of Different Cortical ConnectivityEstimators for High-Resolution EEG Recordings
Laura Astolfi,1,2,3 Febo Cincotti,3 Donatella Mattia,3 M. Grazia Marciani,3,4
Luiz A. Baccala,5 Fabrizio de Vico Fallani,3 Serenella Salinari,1
Mauro Ursino,6 Melissa Zavaglia,6 Lei Ding,7 J. Christopher Edgar,8
Gregory A. Miller,8 Bin He,7 and Fabio Babiloni2,3
1Dipartimento Informatica e Sistemistica, Universita “La Sapienza,” Rome, Italy2Dipartimento Fisiologia Umana e Farmacologia, Universita “La Sapienza,” Rome, Italy
3IRCCS Fondazione Santa Lucia, Rome, Italy4Dipartimento di Neuroscienze, Universita “Tor Vergata,” Rome, Italy
5Department of Telecommunications and Control Engineering, Escola Politecnica,University of Sao Paulo, Brazil
6DEIS, University of Bologna “Alma Mater Studiorum,” Bologna, Italy7Department of Biomedical Engineering, University of Minnesota, Minneapolis, Minnesota, USA
8Department of Psychology and Beckman Institute Biomedical Imaging Center,University of Illinois at Urbana-Champaign, Illinois, USA
� �
Abstract: The aim of this work is to characterize quantitatively the performance of a body of techniques in thefrequency domain for the estimation of cortical connectivity from high-resolution EEG recordings in differentoperative conditions commonly encountered in practice. Connectivity pattern estimators investigated are theDirected Transfer Function (DTF), its modification known as direct DTF (dDTF) and the Partial Directed Coherence(PDC). Predefined patterns of cortical connectivity were simulated and then retrieved by the application of the DTF,dDTF, and PDC methods. Signal-to-noise ratio (SNR) and length (LENGTH) of EEG epochs were studied as factorsaffecting the reconstruction of the imposed connectivity patterns. Reconstruction quality and error rate in estimatedconnectivity patterns were evaluated by means of some indexes of quality for the reconstructed connectivitypattern. The error functions were statistically analyzed with analysis of variance (ANOVA). The whole methodol-ogy was then applied to high-resolution EEG data recorded during the well-known Stroop paradigm. Simulationsindicated that all three methods correctly estimated the simulated connectivity patterns under reasonable condi-tions. However, performance of the methods differed somewhat as a function of SNR and LENGTH factors. Themethods were generally equivalent when applied to the Stroop data. In general, the amount of available EEGaffected the accuracy of connectivity pattern estimations. Analysis of 27 s of nonconsecutive recordings with an SNRof 3 or more ensured that the connectivity pattern could be accurately recovered with an error below 7% for the PDCand 5% for the DTF. In conclusion, functional connectivity patterns of cortical activity can be effectively estimatedunder general conditions met in most EEG recordings by combining high-resolution EEG techniques, linear inverseestimation of the cortical activity, and frequency domain multivariate methods such as PDC, DTF, and dDTF. HumBrain Mapp 28:143–157, 2007. © 2006 Wiley-Liss, Inc.
Key words: partial directed coherence; directed transfer function; dDTF; high-resolution EEG; Stroop
� �
Contract grant sponsor: National Science Foundation (NSF); Con-tract grant numbers: BES-0218736, BES-0411898; Contract grantsponsor: National Institutes of Health (NIH); Contract grant num-bers: EB00178, DA14111, MH19554, MH61358; Contract grant spon-sors: IRIB; University of Illinois Beckman Institute.*Correspondence to: Dr. Laura Astolfi, Department of Human Phys-iology and Pharmacology, University of Rome “La Sapienza,” P. leA. Moro 5, 00185, Rome, Italy. E-mail: [email protected]
Received for publication 12 August 2005; Accepted 26 January 2006DOI: 10.1002/hbm.20263
Published online 7 June 2006 in Wiley InterScience (www.interscience.wiley.com).
� Human Brain Mapping 28:143–157(2007) �
© 2006 Wiley-Liss, Inc.
INTRODUCTION
Neuroscience has recognized that the concept of brainconnectivity (i.e., how cortical regions communicate) is cen-tral to understanding the organized behavior of corticalregions, beyond the simple mapping of their activity [Brov-elli et al., 2004, 2005; Horwitz, 2003; Lee et al., 2003]. Corticalconnectivity estimation aims at describing these interactionsas connectivity patterns that represent the direction andstrength of the information flow between cortical areas. Toachieve this, several methods have been applied to bothhemodynamic and electromagnetic data [Brovelli et al.,2004; Buchel and Friston, 1997; Lee et al., 2003]. Although theterminology is as yet inconsistent, two main definitions ofbrain connectivity have been proposed: functional and ef-fective connectivity [Friston, 1994; Horwitz, 2003]. Func-tional connectivity is defined as the temporal correlationbetween spatially remote neurophysiologic events, whereaseffective connectivity is defined as the simplest brain circuitthat would produce the same temporal relationship as ob-served experimentally between cortical sites. Thus, effectiveconnectivity captures a putatively causal relationship. Forfunctional connectivity, computational methods proposed toestimate how different brain areas are working togethertypically involve the estimation of covariance propertiesbetween the time series measured from the different spatialsites during motor and cognitive tasks studied by EEG,MEG, or functional MRI (fMRI) techniques.
Structural Equation Modeling (SEM) has been used in thepast decade with hemodynamic and metabolic measure-ments to assess effective connectivity [Buchel and Friston,1997; McIntosh and Lima, 1994]. The basic idea of SEMdiffers from the usual statistical approach of modeling indi-vidual observations, since SEM considers the covariancestructure of the data. However, the estimation of corticaleffective connectivity obtained with the application of theSEM technique to fMRI data has a low temporal resolution(on the order of several seconds), which is far slower thanthe time scale on which many brain events normally unfold.Such temporal resolution can be improved by applying theSEM to high-resolution EEG data [Astolfi et al., 2005a].
One issue is that the SEM approach is model-dependent,although in general a connectivity model is not availablebefore the data analysis. Thus, data-driven functional con-nectivity methods that do not need an a priori connectivitymodel would have considerable appeal. Among the linearand nonlinear methods used to estimate functional brainconnectivity [Clifford Carter, 1987; Gevins et al., 1989; In-ouye et al., 1995; Nunez, 1995; Stam and van Dijk, 2002; Stamet al., 2003, Tononi et al., 1994; Urbano et al., 1998], frequen-cy-based methods are particularly attractive for the analysisof EEG or MEG data, since the activity of neural populationsis often best expressed in this domain [Gross et al., 2001,2003; Pfurtscheller and Lopes da Silva, 1999]. Many EEGand/or MEG frequency-based methods that have been pro-posed in recent years for assessment of the directional influ-ence of one signal on another are based mainly on theGranger [1969] theory of causality. Granger theory mathe-
matically defines what is a “causal” relation between twosignals. According to this theory, an observed time seriesx(n) is said to cause another series y(n) if the knowledge ofx(n)’s past significantly improves prediction of y(n); thisrelation between time series is not necessarily reciprocal, i.e.,x(n) may cause y(n) without y(n) causing x(n). This lack ofreciprocity allows the evaluation of the direction of informa-tion flow between structures. Kaminski and Blinowska[1991; Kaminski et al., 2001] proposed a multivariate spectralmeasure, called the Directed Transfer Function (DTF), whichcan be used to determine the directional influences betweenany given pair of channels in a multivariate dataset. DTF isan estimator that simultaneously characterizes the directionand spectral properties of the interaction between brainsignals and requires only one multivariate autoregressive(MVAR) model to be estimated simultaneously from all thetime series. The advantages of MVAR modeling of mul-tichannel EEG signals in order to compute efficient connec-tivity estimates have recently been stressed. Kus et al. [2004]demonstrated the superiority of MVAR multichannel mod-eling with respect to the pairwise autoregressive approach.
Another popular estimator, the Partial Directed Coher-ence (PDC), based on MVAR coefficients transformed intothe frequency domain was recently proposed [Baccala andSameshima, 2001], as a factorization of the Partial Coher-ence. The PDC is of particular interest because of its abilityto distinguish direct and indirect causality flows in the esti-mated connectivity pattern. As will be explained mathemat-ically in the following paragraph, if a “true” causality flowexists linking the signals recorded from region A to region B,and if another “true” flow exists from region B to region C,the PDC estimator does not add an “erroneous” causalityflow between the signal recorded from region A to region C.This property is particularly interesting in its application tobrain signals, where the interpretation of a direct connectionbetween two cortical regions is straightforward.
Over the last decade, a body of techniques known ashigh-resolution EEG has allowed precise estimation of cor-tical activity from noninvasive EEG measurements [Gevins,1989; Gevins et al., 1991, 1999; He and Lian, 2002; He et al.,2002; Nunez, 1995]. These methods involve the use of a largenumber of scalp electrodes or sensors, realistic models of thehead derived from structural magnetic resonance images(MRIs), and advanced processing techniques related to thesolution of the linear inverse problem, which enable theestimation of cortical current density from sensor measure-ments [Babiloni et al., 2000; Grave de Peralta and GonzalezAndino, 1999; Pascual-Marqui, 1995]. Previous simulationstudies analyzed the ability of the DTF to recover the scalpand cortical connectivity from EEG signals [Astolfi et al.,2005b; Korzeniewska et al., 2003]. It has been recentlypointed out that the DTF can recover cortical connectivitypatterns under a large range of signal-to-noise ratios (SNRs)and recording lengths [Astolfi et al., 2005b]. However, theformulation of DTF makes it possible in certain conditions toderive an incorrect estimation of the paths between corticalareas. To improve the capability of DTF to detect direct and
� Astolfi et al. �
� 144 �
indirect causality pathways, Korzeniewska et al. [2003] in-troduced the direct DTF (dDTF) in order to deal with suchpathways. It has been suggested that the use of PDC ordDTF techniques could overcome this drawback [Baccalaand Sameshima, 2001; Korzeniewska et al., 2003]. However,several questions related to the precision of the estimates ofthe connectivity patterns returned by DTF, PDC, and dDTFin conditions with different SNR and recording lengths re-main unaddressed.
The present study focused on the following open ques-tions:
1. How are the connectivity pattern estimators DTF, PDC,and dDTF influenced by different factors affecting theEEG recordings, like the SNR and the amount of dataavailable?
2. How do the estimators perform in the discrimination ofdirect or indirect causality patterns?
3. What is the most effective method for estimating aconnectivity model under the conditions usually en-countered in standard EEG recordings?
In the present study, these questions were addressed viasimulations, using predefined connectivity schemes linkingseveral cortical areas. Estimates of the cortical connectionsunder different conditions were then retrieved using DTF,PDC, and dDTF methods. The results obtained for the dif-ferent estimators were then statistically evaluated by analy-sis of variance (ANOVA). After characterizing the perfor-mance of the different connectivity estimators in thesimulation study, their potential for the evaluation of brainconnectivity is illustrated using high-resolution EEG re-corded during a standard Stroop task.
MATERIALS AND METHODS
Multivariate Methods for the Estimation ofConnectivity
Let Y be a set of cortical waveforms, obtained from severalcortical regions of interest (ROIs), as described in detail inthe following paragraph:
Y�[y1(t),y2(t),. . .,yN(t)]T (1)
where t refers to time and N is the number of cortical areasconsidered.
Supposing that the following MVAR process is an ade-quate description of the dataset Y:
�k�0
p
��k�Y�t � k� � E�t� with �(0)�I (2)
where Y(t) is the data vector in time, E(t)�[e1(t), …, eN]T isa vector of multivariate zero-mean uncorrelated white noiseprocesses, �(1), �(2), … �(p) are the N�N matrices of model
coefficients and p is the model order. In the present study, pwas chosen by means of the Akaike Information Criteria(AIC) for MVAR processes [Akaike, 1974] and was used forMVAR model fitting to simulations, as well as to experimen-tal signals. It has been noted that, although the sensitivity ofMVAR performance depends on the model order, smallmodel order changes do not influence results [Babiloni et al.,2005; Franaszczuk et al., 1985].
A modified procedure for the fitting of MVAR on multipletrials was adopted [Astolfi et al., 2005b; Babiloni et al., 2005;Ding et al., 2000]. When many realizations of the samestochastic process are available, as in the case of severaltrials of an event-related potential (ERP) recording, the in-formation from all the trials can be used to increase thereliability and statistical significance of the model parame-ters. In the present study, both in the simulation and in theapplication to real data, the data were in the form of severaltrials of the same length, as described in detail in the fol-lowing sections.
Once an MVAR model is adequately estimated, it becomesthe basis for subsequent spectral analysis. To investigate thespectral properties of the examined process, Eq. (2) is trans-formed to the frequency domain:
�(f)Y(f)�E(f) (3)
where:
��f� � �k�0
p
��k�e�j2�f�tk (4)
and �t is the temporal interval between two samples. Equa-tion (3) can be rewritten as:
Y(f)���1(f)E(f)�H(f)E(f). (5)
where H(f) is the transfer matrix of the system, whose ele-ment Hij represents the connection between the j-th inputand the i-th output of the system.
Directed Transfer Function
The DTF, representing the causal influence of the corticalwaveform estimated in the j-th ROI on that estimated in thei-th ROI as defined [Kaminski and Blinoswka, 1991] in termsof elements of the transfer matrix H, is:
ij2�f� � �Hij�f��2 (6)
In order to compare the results obtained for cortical wave-forms with different power spectra, a normalization can beperformed by dividing each estimated DTF by the squaredsums of all elements of the relevant row, thus obtaining theso-called normalized DTF [Kaminski and Blinoswka, 1991]:
� Estimators of Cortical Connectivity Patterns �
� 145 �
ij2�f� �
�Hij�f��2
�m�1
N
�Him�f��2
(7)
ij(f) expresses the ratio of influence of the cortical waveformestimated in the j-th ROI on the cortical waveform estimatedin the i-th ROI, with respect to the influence of all theestimated cortical waveforms. Normalized DTF values arein the interval [0, 1], and the normalization condition
�n�1
N
in2 �f� � 1 (8)
is applied.From the transfer matrix, we can calculate power spectra
S(f). If we denote by V the variance matrix of the noise E(f),the power spectrum is defined by:
S�f� � H�f�VH*�f� (9)
where the superscript * denotes transposition and complexconjugate.
From S(f), ordinary coherence can be computed as:
kij�f� ��Sij�f��2
Sii�f�Sjj�f�(10)
Coherence measures express the degree of synchrony (si-multaneous activation) between areas i and j.
Partial Directed Coherence
Partial coherence is another estimator of the relationshipbetween a pair of signals, describing the interaction betweenareas i and j when the influence due to all N-2 time series isdiscounted. It is defined by the formula:
��ij�f��2 ��Mij�f��2
Mii�f�Mjj�f�(11)
where Mij(f) is the minor obtained by removing i-th row andj-th column from the spectral matrix S.
In 2001, Baccala proposed the following factorization:
�ij�f� ��*i�f�V�1�j�f�
���*i�f�V�1�i�f����*j�f�V�1�j�f��(12)
where �n (f) is the n-th column of the matrix � (f). This ledto the definition of PDC [Baccala, 2001]:
�ij�f� ��ij�f�
��k�1
N
�ki�f��*kj�f�
(13)
The PDC from j to i, �ij(f), describes the directional flow ofinformation from the activity in the ROI sj(n) to the activityin si(n), whereupon common effects produced by other ROIssk(n) on the latter are subtracted, leaving only a descriptionthat is specifically from sj(n) to si(n).
PDC values are in the interval [0, 1], and the normaliza-tion condition:
�n�1
N
��ni�f��2 � 1 (14)
is verified. According to this condition, �ij(f) represents thefraction of the time evolution of ROI j directed to ROI i,compared to all of j’s interactions with other ROIs.
For both DTF and PDC, high values in a frequency bandrepresent the existence of an influence between any givenpair of areas in the dataset. However, an important differ-ence is that PDC does not involve the inversion of matrix �.This leads to several points. In fact, an analysis of the defi-nition of DTF reveals that, due to this matrix inversion, it isa linear combination of both the direct influence from onearea to the other and the influence mediated by other areasalong various cascade pathways [Kaminski et al., 2001]. Thisbecomes immediately clear from an example: given a three-region model, the nonnormalized DTF from area 1 to area 2is:
212 �f� � �H21�f��2 �
��21�f��33�f� � �31�f��23�f�����f��2 (15)
From this formula it can be noted that even if the directinfluence from area 1 to area 2, �21 (f), is zero, {9i}may stillbe different from zero, since there is an influence from 1 to3 (�31 (f)) and from 3 to 2 (�23 (f)). The link between 1 and2 will be indicated by DTF as a causal pathway if all thecausal influences along the way are nonzero.
PDC, due to the lack of the matrix inversion, behavesdifferently. It indicates only the existence of a direct causalinfluence from area 1 to area 2. If no direct influence exists,PDC21 is virtually zero.
Direct DTF
In order to distinguish between direct and cascade flowsin DTF, the direct DTF (dDTF) was introduced [Korze-niewska et al., 2003]. It is defined by multiplying the fullfrequency DTF (ffDTF), given by:
�ij2�f� �
�Hij�f��2
�f
�m�1
k
�Him�f��2
(16)
� Astolfi et al. �
� 146 �
by the partial coherence defined in Eq. 11. The dDTF fromarea j to area i is defined as:
ij�f� � �ij�f��ij�f� (17)
This function describes only the direct relations betweenchannels. The denominator of the ffDTF function (16) doesnot depend on frequency.
Simulation Study
The experimental design involved the following steps.
1) Generation of a set of test signals simulating corticalaverage activations. Several sets of simulated datawere generated in order to fit a predefined connectivitymodel and to respect imposed levels of the SNR (factorSNR) and the length of the data (factor LENGTH). Thedata were in the form of multiple trials, and the factorLENGTH indicates the total length of all trials.
2) Estimation of the cortical connectivity pattern obtainedunder different conditions. The estimators used wereDTF, PDC, and dDTF.
3) Computation of indices of connectivity estimation per-formance. These indices were error functions describ-ing the error in the connectivity estimation for thewhole pattern and for each single arc. A comparisonbetween the value estimated for the direct and indirectarcs was also performed.
4) Statistical analysis (ANOVA) of the results of the sim-ulations performed to study the effects of the factorsSNR and LENGTH on the recovery of the connectivitypattern resulting from the different methods.
Signal Generation
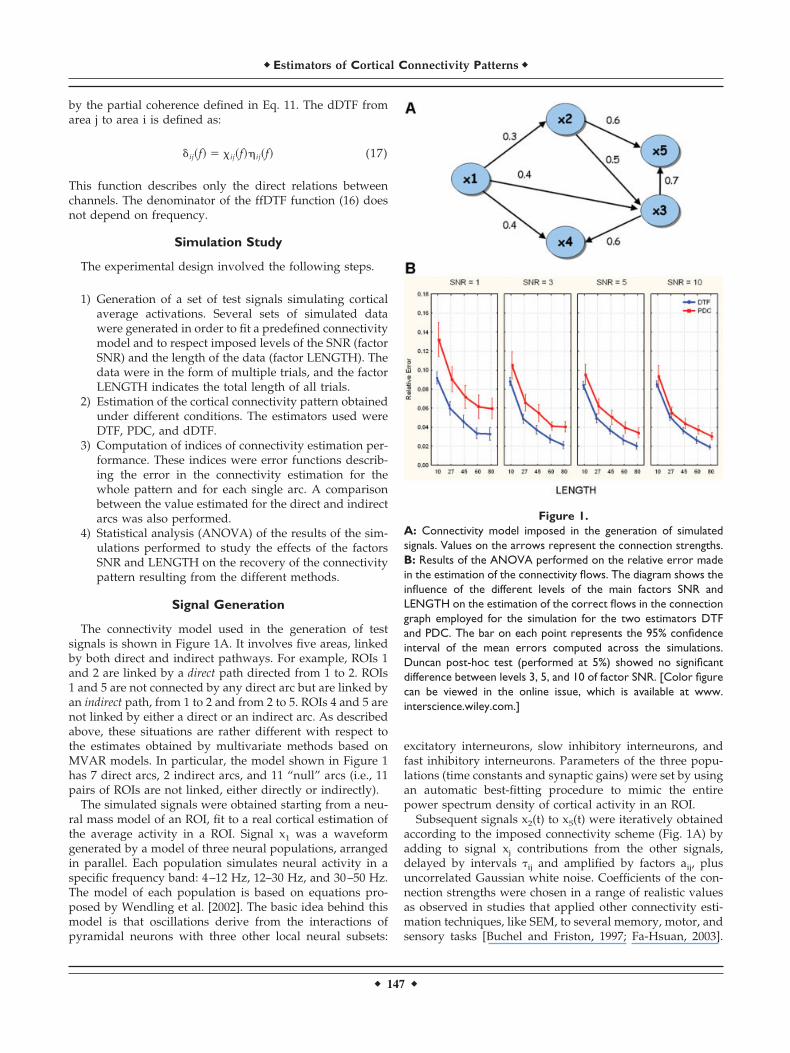
The connectivity model used in the generation of testsignals is shown in Figure 1A. It involves five areas, linkedby both direct and indirect pathways. For example, ROIs 1and 2 are linked by a direct path directed from 1 to 2. ROIs1 and 5 are not connected by any direct arc but are linked byan indirect path, from 1 to 2 and from 2 to 5. ROIs 4 and 5 arenot linked by either a direct or an indirect arc. As describedabove, these situations are rather different with respect tothe estimates obtained by multivariate methods based onMVAR models. In particular, the model shown in Figure 1has 7 direct arcs, 2 indirect arcs, and 11 “null” arcs (i.e., 11pairs of ROIs are not linked, either directly or indirectly).
The simulated signals were obtained starting from a neu-ral mass model of an ROI, fit to a real cortical estimation ofthe average activity in a ROI. Signal x1 was a waveformgenerated by a model of three neural populations, arrangedin parallel. Each population simulates neural activity in aspecific frequency band: 4–12 Hz, 12–30 Hz, and 30–50 Hz.The model of each population is based on equations pro-posed by Wendling et al. [2002]. The basic idea behind thismodel is that oscillations derive from the interactions ofpyramidal neurons with three other local neural subsets:
excitatory interneurons, slow inhibitory interneurons, andfast inhibitory interneurons. Parameters of the three popu-lations (time constants and synaptic gains) were set by usingan automatic best-fitting procedure to mimic the entirepower spectrum density of cortical activity in an ROI.
Subsequent signals x2(t) to x5(t) were iteratively obtainedaccording to the imposed connectivity scheme (Fig. 1A) byadding to signal xj contributions from the other signals,delayed by intervals �ij and amplified by factors aij, plusuncorrelated Gaussian white noise. Coefficients of the con-nection strengths were chosen in a range of realistic valuesas observed in studies that applied other connectivity esti-mation techniques, like SEM, to several memory, motor, andsensory tasks [Buchel and Friston, 1997; Fa-Hsuan, 2003].
Figure 1.A: Connectivity model imposed in the generation of simulatedsignals. Values on the arrows represent the connection strengths.B: Results of the ANOVA performed on the relative error madein the estimation of the connectivity flows. The diagram shows theinfluence of the different levels of the main factors SNR andLENGTH on the estimation of the correct flows in the connectiongraph employed for the simulation for the two estimators DTFand PDC. The bar on each point represents the 95% confidenceinterval of the mean errors computed across the simulations.Duncan post-hoc test (performed at 5%) showed no significantdifference between levels 3, 5, and 10 of factor SNR. [Color figurecan be viewed in the online issue, which is available at www.interscience.wiley.com.]
� Estimators of Cortical Connectivity Patterns �
� 147 �
The values used for the connection strengths are given in thelegend of Figure 1. The data were generated using differentdelay schemes on the connectivity pattern imposed. Thevalues used for the delay from the i-th ROI to the j-th (�ij)ranged from 1 sample up to p-2, where p was the order of theMVAR model used. These schemes were chosen in order tocover a variety of situations, to represent the effect of differ-ent delay conditions.
Generation of simulated data was repeated under thefollowing combinations of conditions: SNR factor levels� [1, 3, 5, 10]; LENGTH factor levels � [2,500, 6,750, 11,250,15,000, 20,000] data samples, corresponding to a signallength of [10, 27, 45, 60, 80] s, in the form of several trials ofthe same length, at a sampling rate of 250 Hz.
The levels chosen for both SNR and LENGTH factorscover a typical range for cortical activity estimated fromERPs with high-resolution EEG techniques.
The MVAR model was estimated by means of the Nuttall-Strand method, or multivariate Burg algorithm, which hasbeen demonstrated to provide the most accurate results[Kay, 1988; Marple, 1987; Schlogl, 2003].
Evaluation of Performance
A statistical evaluation of the performance of the differentestimators required a precise definition of an error function,describing the goodness of the pattern recognition. This wasachieved by focusing on the MVAR model structure de-scribed in Eq. 2 and comparing it to the signal generationscheme. The elements of matrices �(k) of MVAR modelcoefficients can be related to the coefficients used in thesignal generation and are different from zero only for k � �ij,where �ij is the delay chosen for each pair ij of ROIs and foreach direction among them. In particular, for the indepen-dent reference source waveform x1(t), an autoregressivemodel of the same order of the MVAR was estimated, withcoefficients a11(1), …, a11(p) corresponding to the elements�11(1), …, �11(p) of the MVAR coefficients matrix. Thus,with the estimation of the MVAR model parameters, weaimed to recover the original coefficients aij(k) used in signalgeneration. In this way, reference functions were computedfor each of the estimators on the basis of the signal genera-tion parameters. The error function was then computed asthe difference between these reference functions and theestimated ones (both averaged in the frequency band ofinterest).
To evaluate the performance in retrieving connectionsbetween areas, we used the Frobenius norm of the matrixreporting the differences between the values of the esti-mated and the imposed connections (Relative Error):
Erelative �
��i�1
m �j�1
m
��� ij�f1, f2� � �ij�f1,f2��2
��i�1
m �j�1
m
��� ij�f1,f2��2
(18)
where �ij� f1, f2� is the mean value of the estimator functionestimated in the frequency band (f1,f2), and �� ij� f1,f2� is themean value of the reference functions obtained from thegeneration model in the same frequency band. Here, �� ij canbe DTF or PDC.
Simulations were performed by repeating each genera-tion-estimation procedure 50 times in order to increase therobustness of the successive statistical analysis.
Statistical Analysis
The results obtained were subjected to separate ANOVA.The first analysis was a three-way ANOVA examining theeffect of SNR, LENGTH, and the different methods used toestimate the cortical connectivity (METHODS) on the errorfor the entire connectivity model estimated. The “within”main factors of the ANOVAs were SNR (with four levels: 1,3, 5, 10), LENGTH (with six levels: [2,500, 6,750, 11,250,15,000, 20,000] data samples, corresponding to a signalslength of [10, 27, 45, 60, 80] s, in three trials of the samelength, at a sampling rate of 250 Hz) and METHODS (withtwo levels: DTF and PDC). The dependent variable was theRelative Error defined in Eq. (18). The Greenhouse-Geissercorrection for the violation of the spherical hypothesis wasused. Duncan post-hoc analyses at P � 0.05 significancelevel were then performed.
As explained above, the presence of indirect paths in thenetwork (i.e., a path linking a node to another node on thenetwork not directly but through one or more intermediatenodes) is a critical situation for MVAR-based estimators ofcausality relations. For this reason, particular attention waspaid to the analysis of the estimation error in such indirectrelationships. Another ANOVA was performed where thevalues estimated on the indirect arcs by the three methods,DTF, PDC, and dDTF, were compared to the average valueof the parameters estimated on the arcs actually present inthe generation model. The dependent variable was the ab-solute level of the connectivity estimates, while the indepen-dent factors were METHODS, LENGTH, SNR, and PATHS.The first three main factors had the same levels used beforein the other ANOVAs, and the main factor PATHS had threelevels, describing the value of the dependent variable for the“indirect” links moving from the area x1to the area x5, thatfrom the area x2 to the area x4, and the average valueestimated on nonzero arcs in the model. The Greenhouse-Geisser correction was used also in this case.
Head and Cortical Models
In order to estimate cortical activity from actual EEG scalprecordings, realistic head models reconstructed from T1-weighted MRIs were employed. Scalp, skull, and dura matercompartments were segmented from MRIs and tesselatedwith �5,000 triangles for each surface. A source model wasbuilt using the following procedure: 1) the cortex compart-ment was segmented from MRIs and tesselated to obtain afine mesh with �100,000 triangles; 2) a coarser mesh wasobtained by resampling the fine mesh down to �5,000 tri-angles (this was done by preserving the general features of
� Astolfi et al. �
� 148 �
the neocortical envelope, especially in correspondence withpre- and postcentral gyri and frontal mesial area); and 3) anorthogonal unitary equivalent current dipole was placed ineach node of the tesselated surface, with the direction par-allel to the vector sum of the normals to the surroundingtriangles.
High-Resolution EEG Recordings
High-density EEG recordings were performed on a groupof five normal subjects. Here we present the connectivityresults related to one representative subject in order to illus-trate the potential of the methods investigated. Subjectswere seated in a comfortable chair in a quiet room connectedto the adjacent equipment room by intercom. They viewed ascreen where the name of a color (e.g., “red”) was printed inthe same color (e.g., in red ink, congruent condition) or adifferent color (e.g., in blue ink, incongruent condition).Blocks of congruent or incongruent words alternated withblocks of neutral words (not color names). There were 256trials in 16 blocks (four color congruent, eight neutral, fourcolor-incongruent) of 16 trials, with a variable intertrial in-terval averaging 2,000 ms between trial onsets. Within thecongruent blocks, half of the words were neutral, to preventthe development of word-reading strategies in the congru-ent blocks. A trial began with the presentation of a word for1,500 ms, followed by a fixation cross for an average of 500ms. Each trial consisted of one word presented in one of fourink colors (red, yellow, green, blue), with each color occur-ring equally often with each word type (congruent, neutral,incongruent). Subjects were asked to press one of four but-tons that corresponded to the color of the ink of the pre-sented word. Data from 0–450 ms poststimulus was ana-lyzed.
EEG was recorded using well-established methods (e.g.,following the recent guidelines of Picton et al. [2002]). Acustom-designed Falk Minow cap located 64 scalp locationsfor EEG and EOG recording, with the EEG electrodes spacedequidistantly, with left mastoid serving as the reference forall other sites. Electrode impedances were below 10 K ohms.Amplifier bandpass was 0.1–100 Hz with digitization at 250Hz, and the EEG data were successively digitally filtered at50 Hz. Electrode positions were digitized using a Zebris 3Dlocalization device with respect to anatomic landmarks (na-sion and two preauricular points). ERP data were visuallyinspected and trials containing artifacts were rejected. Asemiautomatic, supervised threshold criteria was used forthe rejection of trials contaminated by ocular and EMGartifacts, as described in detail elsewhere [Moretti et al.,2003]. After artifact rejection, ERP signals were baselineadjusted.
Regions of Interest (ROIs)
Cortical ROIs were drawn by a neuroradiologist on thecomputer-based cortical reconstruction of the individualhead model of each subject. ROIs representing the left andright primary motor areas (MI) included Brodmann area 4(BA 4). ROIs representing the supplementary motor area
(SMA) were obtained from cortical voxels belonging to themore general BA 6. In particular, the posterior SMAp wasdepicted bilaterally on the medial frontal wall by followingthe anatomical landmarks recommended by Picard andStrick [1996]: the anterior border of the SMAp correspondedto a plane perpendicular to the anterior–posterior commis-sure (AC-PC) line at the level of the AC (VAC), and aperpendicular plane at the level of the posterior commissure(VPC) represented the SMAp posterior border. ROIs fromthe right and left parietal areas including BA 7 and 5 wereselected. In the frontal regions BAs 8 and 9/46 were selected.The cingulate (CMA) area (left and right) was also selected
Estimation of Cortical Source Current Density
The solution of the following linear system:
Ax � b � n (19)
provides an estimation of the dipole source configuration xthat generates the measured EEG potential distribution b.The system also includes the measurement noise n, assumedto be normally distributed. A is the lead field matrix, whereeach j-th column describes the potential distribution gener-ated on the scalp electrodes by the j-th unitary dipole. Thecurrent density solution vector � of Eq. 10 was obtained as[Grave de Peralta and Gonzalez Andino, 1999]:
� � argminx
��Ax � b�M2 � �2�x�N
2 � (20)
where M, N are the matrices associated to the metrics of thedata and of the source space, respectively, � is the regular-ization parameter andP xPM represents the M norm of thevector x. The solution of Eq. (20) is given by the inverseoperator G:
��Gb, G�N�1A�(AN�1A���M�1)�1 (21)
An optimal regularization of this linear system was obtainedby the L-curve approach [Hansen, 1992a,b]. As a metric inthe data space we used the identity matrix, while as a normin the source space we use the following metric:
(N�1)ii��Ai��2) (22)
where (N-1)ii is the i-th element of the inverse of the diagonalmatrix N and all the other matrix elements Nij are set to 0.The L2 norm of the i-th column of the lead field matrix A isdenoted by PA.iP.
Cortical Estimated Waveforms
Using the relations described above, an estimate of thesigned magnitude of the dipolar moment for each one of the5,000 cortical dipoles was obtained for each timepoint. Asthe orientation of the dipole was defined to be perpendicularto the local cortical surface in the head model, the estimation
� Estimators of Cortical Connectivity Patterns �
� 149 �
process returned a scalar rather than a vector field. To obtainthe cortical current waveforms for all the timepoints, weused a unique “quasi-optimal” regularization � value for allthe analyzed EEG potential distributions. The quasi-optimalregularization value was computed as an average of theseveral � values obtained by solving the linear inverse prob-lem for a series of EEG potential distributions. These distri-butions are characterized by an average Global Field Power(GFP) with respect to the higher and lower GFP valuesobtained from all the recorded waveforms. The instanta-neous average of the signed magnitude of all the dipolesbelonging to a particular ROI was used to estimate theaverage cortical activity in that ROI during the entire inter-val of the experimental task. These waveforms were thensubjected to the MVAR estimation in order to estimate theconnectivity pattern between ROIs. For a given ROI pair, thesignificance of the estimated cortical connectivity patternwas determined by comparison of its value to a thresholdlevel. To estimate the thresholds for the functions valuesindicating lack of transmission, a surrogate data generationprocedure was performed [Astolfi et al., 2005b]. The timeseries data from each ROI were randomly shuffled in orderto remove interactions between signals. The connectivityestimators were then computed on these surrogate data. Theprocedure was repeated 1,000 times and an empirical distri-bution was generated. The significance threshold was set at0.01. Only values beyond this threshold were considered toindicate the existence of a connection between each pair ofROIs.
Connectivity Pattern Representation
The connectivity patterns are represented by arrowspointing from one cortical area (“the source”) toward an-other one (“the target”). The arrow’s color and size code thestrength of the functional connectivity estimated betweenthe source and the target. The bigger and the lighter thearrow, the stronger the connection. Only the cortical connec-tions statistically significant at P � 0.01 are represented,according to the thresholds obtained, as previously de-scribed.
The connectivity patterns in the different frequency bands(Theta, 4–8 Hz; Alpha, 8–12 Hz; Beta, 13–30 Hz; Gamma,30–40 Hz) between the different cortical regions were sum-marized by using indices representing the total flow fromand toward the selected cortical area. The total inflow in aparticular cortical region was defined as the sum of thestatistically significant connections from all the other corticalregions toward the selected area. The total inflow for eachROI is represented by a sphere centered on the corticalregion whose radius is linearly related to the magnitude ofall the incoming statistically significant links from the otherregions. Inflow information is also coded through a colorscale. This information depicts each ROI as the target offunctional connections from the other ROIs. The same con-ventions were used to represent the total outflow from acortical region, generated by the sum of all the statistically
significant links obtained by the application of the DTF tothe cortical waveforms.
RESULTS
Simulation Study
Several sets of signals were generated as described in theprevious section in order to fit a predefined connectivitypattern involving five cortical areas (shown in Fig. 1A). Thegraph depicts the flow of information from area x1 towardareas x2-x5. This connectivity model contains two indirectpaths, where the signal is transmitted to a destination byonly indirect relationships and with no direct link betweenthe source area and the target one (from area x2 to area x4
through x3, and from area x1 to area x5 through x2 and x3,with several different paths: x13x33x5 andx13x23x33x5).
A multivariate autoregressive model of order 10 was fittedto each set of simulated data, which were in the form ofabout 30 trials of the same length. The procedure of signalgeneration and connectivity estimation for the differentmethods was carried out 50 times for each level of the factorsSNR and LENGTH to increase the robustness of the subse-quent statistical analysis. The index of performance, i.e., theRelative Error, Eq. (12), and the estimated value on direct/indirect arcs were computed for each generation-estimationprocedure and then subjected to two ANOVAs.
In the first ANOVA the dependent variable was the Rel-ative Error, representing the average error for the entireconnectivity pattern estimated. Results revealed a stronginfluence of the main factors SNR (F � 205, P � 0.0001),METHODS (F � 1190, P � 0.0001), and LENGTH (F � 1644,P � 0.0001), as well as the SNR � METHOD interaction (F� 56, P � 0.0001) on the Relative Error. Figure 1B shows theinfluence of the levels of the main factors LENGTH and SNRon the Relative Error in the entire connectivity graph foreach estimator. The errors resulting from DTF, evaluatedwith respect to the theoretical values that represent the idealinformation obtainable by this indicator, were smaller thanthose resulting from PDC for every level of SNR andLENGTH. This indicates that DTF is more robust with re-spect to noise and amount of data available for its estima-tion. In particular, Figure 1B shows that for each increase inlength of the recordings, there is a constant decrease inestimation error. The influence of the factor SNR is weaker.Post-hoc tests revealed that there were no significant differ-ences between levels 3, 5, and 10 of the SNR factor. The baron each point represents the 95% confidence interval of themean errors computed across the simulations.
Particular attention was paid to the ability of the differentestimators to distinguish between direct and indirect causal-ity flows. The values estimated for the two indirect path-ways in the model were compared to the average valueobtained for the direct arcs present in the connectivity modelimposed. The values of the connections imposed betweencortical areas ranged from 0.3–0.7. The two indirect pathsanalyzed were arc 135 and arc 234, indicated by the large
� Astolfi et al. �
� 150 �
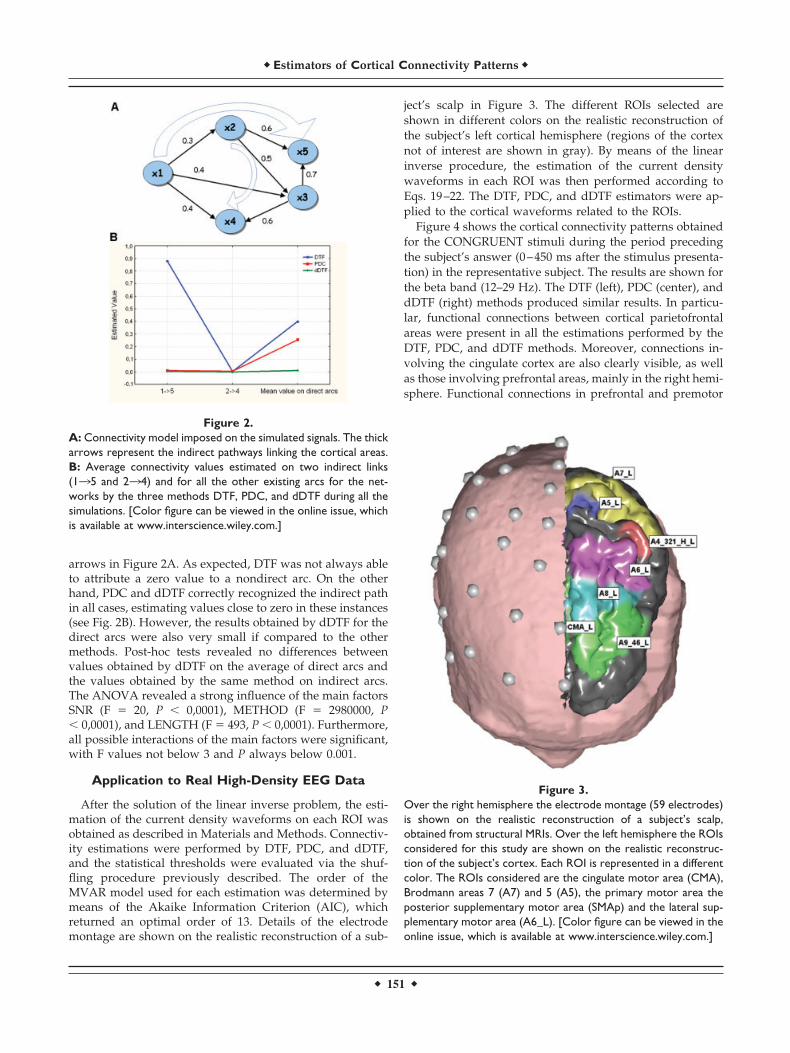
arrows in Figure 2A. As expected, DTF was not always ableto attribute a zero value to a nondirect arc. On the otherhand, PDC and dDTF correctly recognized the indirect pathin all cases, estimating values close to zero in these instances(see Fig. 2B). However, the results obtained by dDTF for thedirect arcs were also very small if compared to the othermethods. Post-hoc tests revealed no differences betweenvalues obtained by dDTF on the average of direct arcs andthe values obtained by the same method on indirect arcs.The ANOVA revealed a strong influence of the main factorsSNR (F � 20, P � 0,0001), METHOD (F � 2980000, P� 0,0001), and LENGTH (F � 493, P � 0,0001). Furthermore,all possible interactions of the main factors were significant,with F values not below 3 and P always below 0.001.
Application to Real High-Density EEG Data
After the solution of the linear inverse problem, the esti-mation of the current density waveforms on each ROI wasobtained as described in Materials and Methods. Connectiv-ity estimations were performed by DTF, PDC, and dDTF,and the statistical thresholds were evaluated via the shuf-fling procedure previously described. The order of theMVAR model used for each estimation was determined bymeans of the Akaike Information Criterion (AIC), whichreturned an optimal order of 13. Details of the electrodemontage are shown on the realistic reconstruction of a sub-
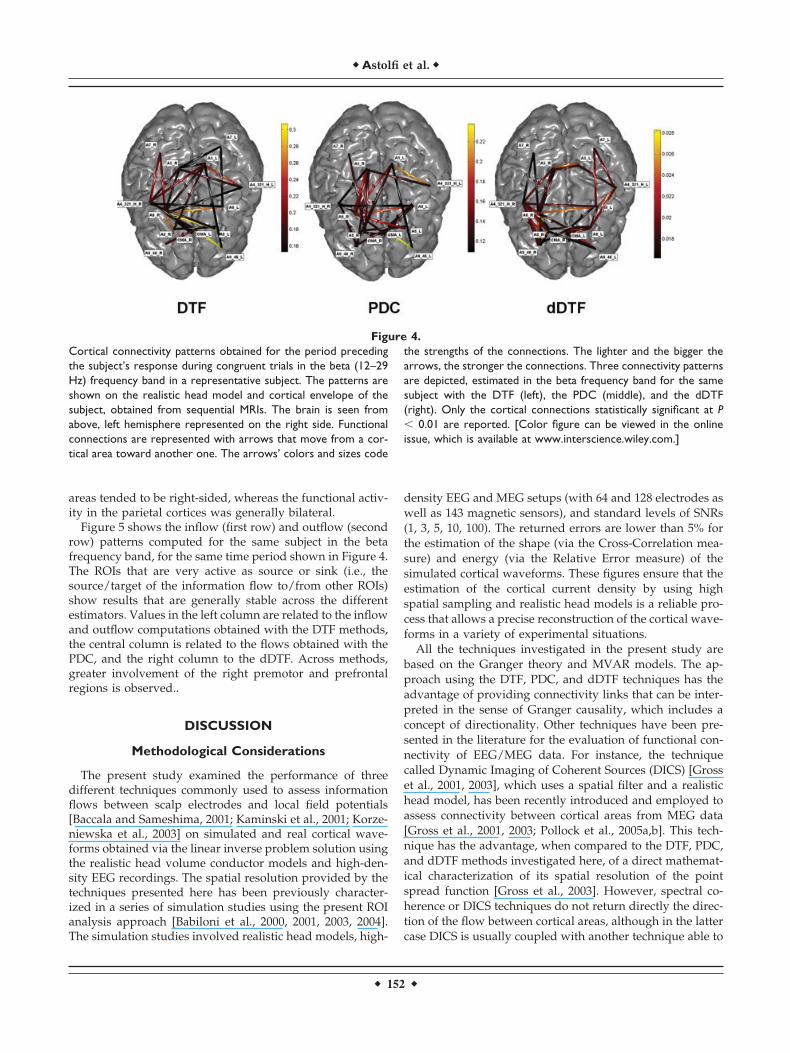
ject’s scalp in Figure 3. The different ROIs selected areshown in different colors on the realistic reconstruction ofthe subject’s left cortical hemisphere (regions of the cortexnot of interest are shown in gray). By means of the linearinverse procedure, the estimation of the current densitywaveforms in each ROI was then performed according toEqs. 19–22. The DTF, PDC, and dDTF estimators were ap-plied to the cortical waveforms related to the ROIs.
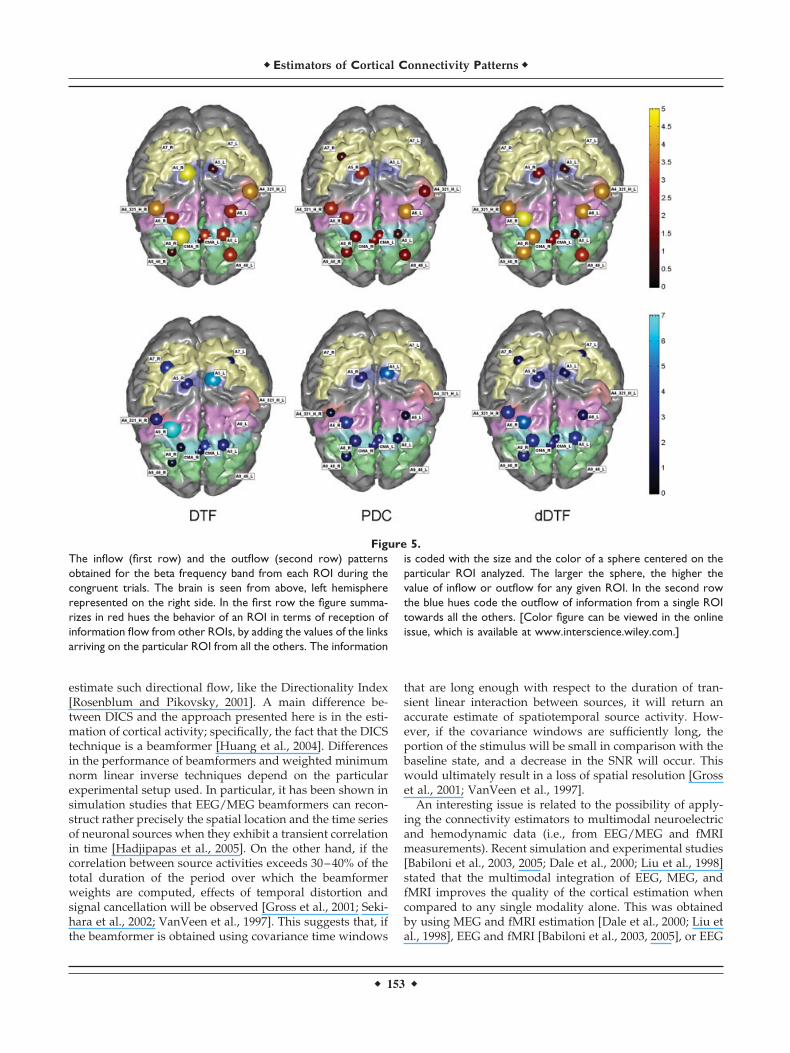
Figure 4 shows the cortical connectivity patterns obtainedfor the CONGRUENT stimuli during the period precedingthe subject’s answer (0–450 ms after the stimulus presenta-tion) in the representative subject. The results are shown forthe beta band (12–29 Hz). The DTF (left), PDC (center), anddDTF (right) methods produced similar results. In particu-lar, functional connections between cortical parietofrontalareas were present in all the estimations performed by theDTF, PDC, and dDTF methods. Moreover, connections in-volving the cingulate cortex are also clearly visible, as wellas those involving prefrontal areas, mainly in the right hemi-sphere. Functional connections in prefrontal and premotor
Figure 2.A: Connectivity model imposed on the simulated signals. The thickarrows represent the indirect pathways linking the cortical areas.B: Average connectivity values estimated on two indirect links(135 and 234) and for all the other existing arcs for the net-works by the three methods DTF, PDC, and dDTF during all thesimulations. [Color figure can be viewed in the online issue, whichis available at www.interscience.wiley.com.]
Figure 3.Over the right hemisphere the electrode montage (59 electrodes)is shown on the realistic reconstruction of a subject’s scalp,obtained from structural MRIs. Over the left hemisphere the ROIsconsidered for this study are shown on the realistic reconstruc-tion of the subject’s cortex. Each ROI is represented in a differentcolor. The ROIs considered are the cingulate motor area (CMA),Brodmann areas 7 (A7) and 5 (A5), the primary motor area theposterior supplementary motor area (SMAp) and the lateral sup-plementary motor area (A6_L). [Color figure can be viewed in theonline issue, which is available at www.interscience.wiley.com.]
� Estimators of Cortical Connectivity Patterns �
� 151 �
areas tended to be right-sided, whereas the functional activ-ity in the parietal cortices was generally bilateral.
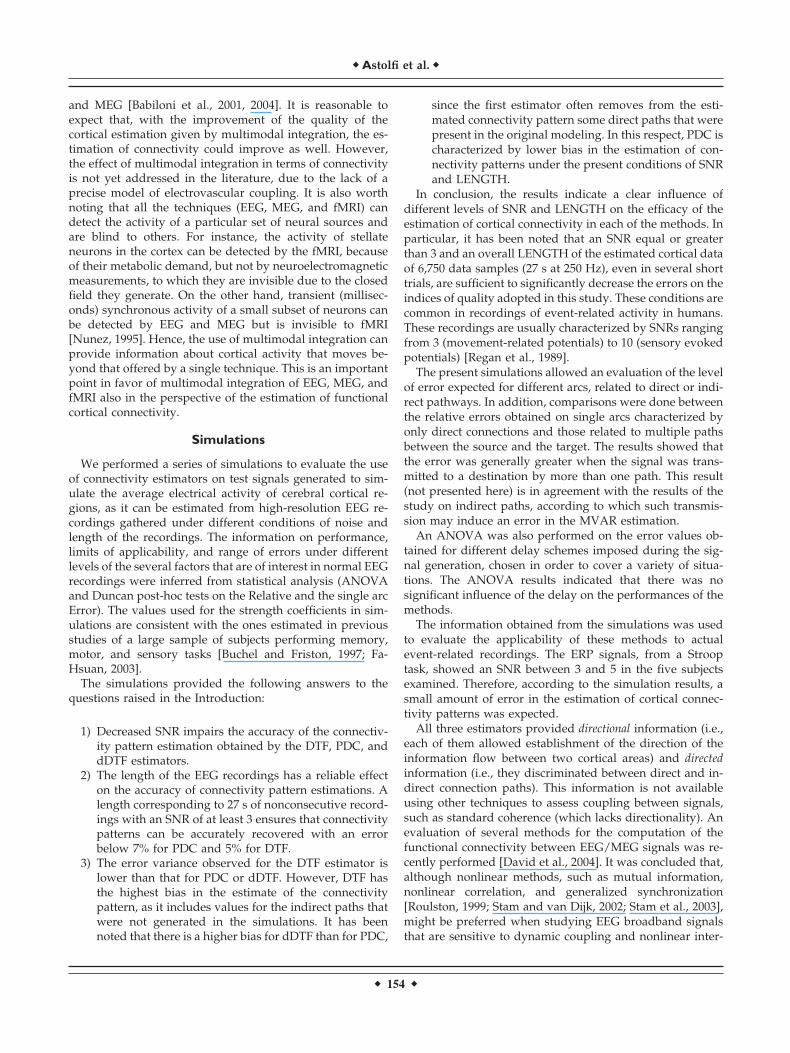
Figure 5 shows the inflow (first row) and outflow (secondrow) patterns computed for the same subject in the betafrequency band, for the same time period shown in Figure 4.The ROIs that are very active as source or sink (i.e., thesource/target of the information flow to/from other ROIs)show results that are generally stable across the differentestimators. Values in the left column are related to the inflowand outflow computations obtained with the DTF methods,the central column is related to the flows obtained with thePDC, and the right column to the dDTF. Across methods,greater involvement of the right premotor and prefrontalregions is observed..
DISCUSSION
Methodological Considerations
The present study examined the performance of threedifferent techniques commonly used to assess informationflows between scalp electrodes and local field potentials[Baccala and Sameshima, 2001; Kaminski et al., 2001; Korze-niewska et al., 2003] on simulated and real cortical wave-forms obtained via the linear inverse problem solution usingthe realistic head volume conductor models and high-den-sity EEG recordings. The spatial resolution provided by thetechniques presented here has been previously character-ized in a series of simulation studies using the present ROIanalysis approach [Babiloni et al., 2000, 2001, 2003, 2004].The simulation studies involved realistic head models, high-
density EEG and MEG setups (with 64 and 128 electrodes aswell as 143 magnetic sensors), and standard levels of SNRs(1, 3, 5, 10, 100). The returned errors are lower than 5% forthe estimation of the shape (via the Cross-Correlation mea-sure) and energy (via the Relative Error measure) of thesimulated cortical waveforms. These figures ensure that theestimation of the cortical current density by using highspatial sampling and realistic head models is a reliable pro-cess that allows a precise reconstruction of the cortical wave-forms in a variety of experimental situations.
All the techniques investigated in the present study arebased on the Granger theory and MVAR models. The ap-proach using the DTF, PDC, and dDTF techniques has theadvantage of providing connectivity links that can be inter-preted in the sense of Granger causality, which includes aconcept of directionality. Other techniques have been pre-sented in the literature for the evaluation of functional con-nectivity of EEG/MEG data. For instance, the techniquecalled Dynamic Imaging of Coherent Sources (DICS) [Grosset al., 2001, 2003], which uses a spatial filter and a realistichead model, has been recently introduced and employed toassess connectivity between cortical areas from MEG data[Gross et al., 2001, 2003; Pollock et al., 2005a,b]. This tech-nique has the advantage, when compared to the DTF, PDC,and dDTF methods investigated here, of a direct mathemat-ical characterization of its spatial resolution of the pointspread function [Gross et al., 2003]. However, spectral co-herence or DICS techniques do not return directly the direc-tion of the flow between cortical areas, although in the lattercase DICS is usually coupled with another technique able to
Figure 4.Cortical connectivity patterns obtained for the period precedingthe subject’s response during congruent trials in the beta (12–29Hz) frequency band in a representative subject. The patterns areshown on the realistic head model and cortical envelope of thesubject, obtained from sequential MRIs. The brain is seen fromabove, left hemisphere represented on the right side. Functionalconnections are represented with arrows that move from a cor-tical area toward another one. The arrows’ colors and sizes code
the strengths of the connections. The lighter and the bigger thearrows, the stronger the connections. Three connectivity patternsare depicted, estimated in the beta frequency band for the samesubject with the DTF (left), the PDC (middle), and the dDTF(right). Only the cortical connections statistically significant at P� 0.01 are reported. [Color figure can be viewed in the onlineissue, which is available at www.interscience.wiley.com.]
� Astolfi et al. �
� 152 �
estimate such directional flow, like the Directionality Index[Rosenblum and Pikovsky, 2001]. A main difference be-tween DICS and the approach presented here is in the esti-mation of cortical activity; specifically, the fact that the DICStechnique is a beamformer [Huang et al., 2004]. Differencesin the performance of beamformers and weighted minimumnorm linear inverse techniques depend on the particularexperimental setup used. In particular, it has been shown insimulation studies that EEG/MEG beamformers can recon-struct rather precisely the spatial location and the time seriesof neuronal sources when they exhibit a transient correlationin time [Hadjipapas et al., 2005]. On the other hand, if thecorrelation between source activities exceeds 30–40% of thetotal duration of the period over which the beamformerweights are computed, effects of temporal distortion andsignal cancellation will be observed [Gross et al., 2001; Seki-hara et al., 2002; VanVeen et al., 1997]. This suggests that, ifthe beamformer is obtained using covariance time windows
that are long enough with respect to the duration of tran-sient linear interaction between sources, it will return anaccurate estimate of spatiotemporal source activity. How-ever, if the covariance windows are sufficiently long, theportion of the stimulus will be small in comparison with thebaseline state, and a decrease in the SNR will occur. Thiswould ultimately result in a loss of spatial resolution [Grosset al., 2001; VanVeen et al., 1997].
An interesting issue is related to the possibility of apply-ing the connectivity estimators to multimodal neuroelectricand hemodynamic data (i.e., from EEG/MEG and fMRImeasurements). Recent simulation and experimental studies[Babiloni et al., 2003, 2005; Dale et al., 2000; Liu et al., 1998]stated that the multimodal integration of EEG, MEG, andfMRI improves the quality of the cortical estimation whencompared to any single modality alone. This was obtainedby using MEG and fMRI estimation [Dale et al., 2000; Liu etal., 1998], EEG and fMRI [Babiloni et al., 2003, 2005], or EEG
Figure 5.The inflow (first row) and the outflow (second row) patternsobtained for the beta frequency band from each ROI during thecongruent trials. The brain is seen from above, left hemisphererepresented on the right side. In the first row the figure summa-rizes in red hues the behavior of an ROI in terms of reception ofinformation flow from other ROIs, by adding the values of the linksarriving on the particular ROI from all the others. The information
is coded with the size and the color of a sphere centered on theparticular ROI analyzed. The larger the sphere, the higher thevalue of inflow or outflow for any given ROI. In the second rowthe blue hues code the outflow of information from a single ROItowards all the others. [Color figure can be viewed in the onlineissue, which is available at www.interscience.wiley.com.]
� Estimators of Cortical Connectivity Patterns �
� 153 �
and MEG [Babiloni et al., 2001, 2004]. It is reasonable toexpect that, with the improvement of the quality of thecortical estimation given by multimodal integration, the es-timation of connectivity could improve as well. However,the effect of multimodal integration in terms of connectivityis not yet addressed in the literature, due to the lack of aprecise model of electrovascular coupling. It is also worthnoting that all the techniques (EEG, MEG, and fMRI) candetect the activity of a particular set of neural sources andare blind to others. For instance, the activity of stellateneurons in the cortex can be detected by the fMRI, becauseof their metabolic demand, but not by neuroelectromagneticmeasurements, to which they are invisible due to the closedfield they generate. On the other hand, transient (millisec-onds) synchronous activity of a small subset of neurons canbe detected by EEG and MEG but is invisible to fMRI[Nunez, 1995]. Hence, the use of multimodal integration canprovide information about cortical activity that moves be-yond that offered by a single technique. This is an importantpoint in favor of multimodal integration of EEG, MEG, andfMRI also in the perspective of the estimation of functionalcortical connectivity.
Simulations
We performed a series of simulations to evaluate the useof connectivity estimators on test signals generated to sim-ulate the average electrical activity of cerebral cortical re-gions, as it can be estimated from high-resolution EEG re-cordings gathered under different conditions of noise andlength of the recordings. The information on performance,limits of applicability, and range of errors under differentlevels of the several factors that are of interest in normal EEGrecordings were inferred from statistical analysis (ANOVAand Duncan post-hoc tests on the Relative and the single arcError). The values used for the strength coefficients in sim-ulations are consistent with the ones estimated in previousstudies of a large sample of subjects performing memory,motor, and sensory tasks [Buchel and Friston, 1997; Fa-Hsuan, 2003].
The simulations provided the following answers to thequestions raised in the Introduction:
1) Decreased SNR impairs the accuracy of the connectiv-ity pattern estimation obtained by the DTF, PDC, anddDTF estimators.
2) The length of the EEG recordings has a reliable effecton the accuracy of connectivity pattern estimations. Alength corresponding to 27 s of nonconsecutive record-ings with an SNR of at least 3 ensures that connectivitypatterns can be accurately recovered with an errorbelow 7% for PDC and 5% for DTF.
3) The error variance observed for the DTF estimator islower than that for PDC or dDTF. However, DTF hasthe highest bias in the estimate of the connectivitypattern, as it includes values for the indirect paths thatwere not generated in the simulations. It has beennoted that there is a higher bias for dDTF than for PDC,
since the first estimator often removes from the esti-mated connectivity pattern some direct paths that werepresent in the original modeling. In this respect, PDC ischaracterized by lower bias in the estimation of con-nectivity patterns under the present conditions of SNRand LENGTH.
In conclusion, the results indicate a clear influence ofdifferent levels of SNR and LENGTH on the efficacy of theestimation of cortical connectivity in each of the methods. Inparticular, it has been noted that an SNR equal or greaterthan 3 and an overall LENGTH of the estimated cortical dataof 6,750 data samples (27 s at 250 Hz), even in several shorttrials, are sufficient to significantly decrease the errors on theindices of quality adopted in this study. These conditions arecommon in recordings of event-related activity in humans.These recordings are usually characterized by SNRs rangingfrom 3 (movement-related potentials) to 10 (sensory evokedpotentials) [Regan et al., 1989].
The present simulations allowed an evaluation of the levelof error expected for different arcs, related to direct or indi-rect pathways. In addition, comparisons were done betweenthe relative errors obtained on single arcs characterized byonly direct connections and those related to multiple pathsbetween the source and the target. The results showed thatthe error was generally greater when the signal was trans-mitted to a destination by more than one path. This result(not presented here) is in agreement with the results of thestudy on indirect paths, according to which such transmis-sion may induce an error in the MVAR estimation.
An ANOVA was also performed on the error values ob-tained for different delay schemes imposed during the sig-nal generation, chosen in order to cover a variety of situa-tions. The ANOVA results indicated that there was nosignificant influence of the delay on the performances of themethods.
The information obtained from the simulations was usedto evaluate the applicability of these methods to actualevent-related recordings. The ERP signals, from a Strooptask, showed an SNR between 3 and 5 in the five subjectsexamined. Therefore, according to the simulation results, asmall amount of error in the estimation of cortical connec-tivity patterns was expected.
All three estimators provided directional information (i.e.,each of them allowed establishment of the direction of theinformation flow between two cortical areas) and directedinformation (i.e., they discriminated between direct and in-direct connection paths). This information is not availableusing other techniques to assess coupling between signals,such as standard coherence (which lacks directionality). Anevaluation of several methods for the computation of thefunctional connectivity between EEG/MEG signals was re-cently performed [David et al., 2004]. It was concluded that,although nonlinear methods, such as mutual information,nonlinear correlation, and generalized synchronization[Roulston, 1999; Stam and van Dijk, 2002; Stam et al., 2003],might be preferred when studying EEG broadband signalsthat are sensitive to dynamic coupling and nonlinear inter-
� Astolfi et al. �
� 154 �
actions expressed over many frequencies, the linear mea-surements (like those presented here) afford a rapid andstraightforward characterization of functional connectivity.
Application to Real ERP Data
Although presented here only to demonstrate the capabil-ities of the estimation procedures with real data, the physi-ological results shown for a representative subject are con-sistent with those present in the Stroop literature. The Strooptask is often employed in studies of selective attention andhas been found to be sensitive to prefrontal damage. Forincongruent stimuli, PET and fMRI studies have shownactivation of a network of anterior brain regions. Most stud-ies report activation of the anterior cingulate cortex (ACC)and frontal polar cortex, and several authors have hinted atchanges in regional cerebral blood flow (rCFB) in posteriorcingulate and other posterior regions [Bench et al., 1993;Carter et al., 1995; Milham et al., 2003].
In the present study, ACC was approximately modeledby the CMA ROI and dorsolateral prefrontal areas by the9/46 ROI. Connectivity analysis indicated intense, bilat-eral ACC activity during the task. The number of directedinteractions was similar across several frequency bands,but there were differences in the connectivity structureacross the congruent–incongruent tasks (not shown here).These results were corroborated by the inflow– outflowanalysis that showed agreement between the methodolo-gies used for the derivation of the connectivity patterns.The predominance of outflow from right premotor andprefrontal cortical areas is of interest, and the increasedactivity in the prefrontal cortical regions is in agreementwith previous scalp observations. In an EEG Stroop study,West and Bell [1997] reported increased spectral power atmedial (F3, F4) and lateral (F7, F8) frontal sites, as well asover parietal regions (P3, P4). They suggested that activa-tion of the parietal cortex resulted from interaction be-tween prefrontal and parietal regions during the suppres-sion of the influence of the irrelevant word meaning.Interaction between parietal and frontal sites has beenadvocated as an explanation for the activation of posteriorareas [Carter et al., 1995; Milham et al., 2003; West andBell, 1997]. Possibly, the minimization of the influence ofirrelevant word information prompts directed interac-tions from parietal toward frontal sites.
In a previous coherence study [Schack et al., 1999], in-creased coherence between parietal and frontal sites wasobserved late in the trial. This behavior is not detectable atthe scalp level. With the application of advanced high-reso-lution EEG methodologies, including realistic cortical mod-eling, solution of the linear inverse problem, and the appli-cation to the computed cortical signals of connectivitypattern estimators, it became observable. These data suggestthat cognitive control is implemented by medial and lateralprefrontal cortices that bias processes in regions that havebeen implicated in high-level perceptual and motor pro-cesses [Egner and Hirsh, 2005]. It is also striking that in allthe frequency bands and for the five subjects analyzed the
differences between the estimated connectivity patternswith the connectivity estimation methods were negligible(results not shown here). This result suggests that in practi-cal conditions constant differences of only a few percentobserved in the simulation studies between DTF, PDC, anddDTF estimators are not as significant as other factors suchas SNR and recording LENGTH.
CONCLUSIONS
The results provided by the present simulation studysuggest that, under conditions frequently met in the ERPliterature (SNR of at least 3 and a total length over trials ofthe recorded ERP greater than 27 s), the estimation of func-tional connectivity by the DTF, PDC, and dDTF methods canbe performed with only moderate quantitative errors. Theuse of high-density ERP recordings and the estimation of thecortical waveforms in ROIs allows the evaluation of thefunctional cortical connectivity patterns during the Strooptask. These computational tools (high-density EEG, estima-tion of cortical activity via linear inverse problem, DTF,PDC, and dDTF) can be of considerable value for assessingfunctional connectivity patterns from noninvasive EEG re-cordings in humans.
ACKNOWLEDGMENTS
We thank M. Banich, A. Engels, J. Fisher, W. Heller, J. Her-rington, R. Levin, A. Mohanty, S. Sass, J. Stewart, B. Sutton,T. Wszalek, A. Webb, and E. Wenzel for assistance in col-lection of human data.
REFERENCES
Akaike H (1974): A new look at statistical model identification. IEEETrans Automat Control AC-19:716–723.
Astolfi L, Cincotti F, Babiloni C, Carducci F, Basilisco A, Rossini PM,Salinari S, Mattia D, Cerutti S, Ben Dayan D, Ding L, Ni Y, He B,Babiloni F (2005a): Estimation of the cortical connectivity byhigh-resolution EEG and structural equation modeling: simula-tions and application to finger tapping data. IEEE Trans BiomedEng 52:757–768.
Astolfi L, Cincotti F, Mattia D, Babiloni C, Carducci F, Basilisco A,Rossini PM, Salinari S, Ding L, Ni Y, He B, Babiloni F (2005b):Assessing cortical functional connectivity by linear inverse esti-mation and directed transfer function: simulations and applica-tion to real data. Clin Neurophysiol 116:920–932.
Babiloni F, Babiloni C, Locche L, Cincotti F, Rossini PM, Carducci F(2000): High-resolution electroencephalogram: source estimatesof Laplacian-transformed somatosensory-evoked potentials us-ing a realistic subject head model constructed from magneticresonance images. Med Biol Eng Comput 38:512–519.
Babiloni F, Carducci F, Cincotti F, Del Gratta C, Pizzella V, RomaniGL, Rossini PM, Tecchio F, Babiloni C (2001): Linear inversesource estimate of combined EEG and MEG data related tovoluntary movements. Hum Brain Mapp 14:197–209.
Babiloni F, Babiloni C, Carducci F, Romani GL, Rossini PM, Ange-lone LM, Cincotti F (2003): Multimodal integration of high-resolution EEG and functional magnetic resonance imagingdata: a simulation study. Neuroimage 19:1–15.
� Estimators of Cortical Connectivity Patterns �
� 155 �
Babiloni F, Babiloni C, Carducci F, Romani GL, Rossini PM, Ange-lone LM, Cincotti F (2004): Multimodal integration of EEG andMEG data: a simulation study with variable signal-to-noise ratioand number of sensors. Hum Brain Mapp 22:52–62.
Babiloni F, Cincotti F, Babiloni C, Carducci F, Basilisco A, RossiniPM, Mattia D, Astolfi L, Ding L, Ni Y, Cheng K, Christine K,Sweeney J, He B (2005): Estimation of the cortical functionalconnectivity with the multimodal integration of high-resolutionEEG and fMRI data by directed transfer function. Neuroimage24:118–131.
Baccala LA (2001): On the efficient computation of partial coherencefrom multivariate autoregressive model. In: Callaos N, RosarioD, Sanches B, editors. Proceed 5th World Conf Cybernetics Sys-temics Informatics SCI. Orlando, FL.
Baccala LA, Sameshima K (2001): Partial directed coherence: a newconcept in neural structure determination. Biol Cybern 84:463–474.
Bench CJ, Frith CD, Grasby PM, Friston KJ, Paulesu E, FrackowiakRSJ, Dolan RJ (1993): Investigations of the functional anatomy ofattention using the Stroop test. Neuropsychology 31:907–922.
Brovelli A, Ding M, Ledberg A, Chen Y, Nakamura R, Bressler SL(2004): Beta oscillations in a large-scale sensorimotor corticalnetwork: directional influences revealed by Granger causality.Proc Natl Acad Sci U S A 101:9849–9854.
Brovelli A, Lachaux JP, Kahane P, Boussaoud D (2005): High gammafrequency oscillatory activity dissociates attention from inten-tion in the human premotor cortex. Neuroimage 28:154–164.
Buchel C, Friston KJ (1997): Modulation of connectivity in visualpathways by attention: cortical interactions evaluated withstructural equation modeling and fMRI. Cereb Cortex 7:768–778.
Carter CS, Mintun M, Cohen JD (1995): Interference and facilitationeffects during selective attention: an H215O PET study of Strooptask performance. Neuroimage 2:264–272.
Clifford Carter G (1987): Coherence and time delay estimation. ProcIEEE 75:236–255.
David O, Cosmelli D, Friston KJ (2004): Evaluation of differentmeasures of functional connectivity using a neural mass model.Neuroimage 21:659–673.
Ding M, Bressler SL, Yang W, Liang H (2000): Short-window spec-tral analysis of cortical event related potentials by adaptivemultivariate autoregressive modeling: data preprocessing,model validation and variability assessment. Biol Cybern 83:35–45.
Egner T, Hirsh J (2005): The neural correlates and functional inte-gration of cognitive control in a Stroop task. Neuroimage 23:539–547.
Fa-Hsuan L (2003): Spatio temporal brain imaging and modeling.PhD thesis, Cambridge, MA: MIT Press.
Franaszczuk PJ, Blinowska KJ, Kowalczyk M (1985): The applicationof parametric multichannel spectral estimates in the study ofelectrical brain activity. Biol Cybern 51:239–247.
Friston KJ (1994): Functional and effective connectivity in neuroim-aging: a synthesis. Hum Brain Mapp 2:56–78.
Gevins AS, Cutillo BA, Bressler SL, Morgan NH, White RM, Illes J,Greer DS (1989): Event-related covariances during a bimanualvisuomotor task. II. Preparation and feedback. Electroencepha-logr Clin Neurophysiol 74:147–160.
Gevins A, Brickett P, Reutter B, Desmond J (1991): Seeing throughthe skull: advanced EEGs use MRIs to accurately measure cor-tical activity from the scalp. Brain Topogr 4:125–131.
Gevins A, Le J, Leong H, McEvoy LK, Smith ME (1999): Deblurring.J Clin Neurophysiol 16:204–213.
Granger CWJ (1969): Investigating causal relations by econometricmodels and cross-spectral methods. Econometrica 37:424–438.
Grave de Peralta Menendez R, Gonzalez Andino SL (1999): Distrib-uted source models: standard solutions and new developments.In: Uhl C, editor. Analysis of Neurophysiological Brain Func-tioning. Berlin: Springer. p 176–201.
Gross J, Kujala J, Hamalainen M, Timmermann L, Schnitzler A,Salmelin R (2001): Dynamic imaging of coherent sources: study-ing neural interactions in the human brain. Proc Natl Acad Sci US A 98:694–699.
Gross J, Timmermann L, Kujala J, Salmelin R, Schnitzler A (2003):Properties of MEG tomographic maps obtained with spatialfiltering. Neuroimage 19:1329–1336.
Hadjipapas A, Hillebrand A, Holliday IE, Singh KD, Barnes GR(2005): Assessing interactions of linear and nonlinear neuronalsources using MEG beamformers: a proof of concept. Clin Neu-rophysiol 116:1300–1313.
Hansen PC (1992a): Analysis of discrete ill-posed problems bymeans of the L-curve. SIAM Rev 34:561–580.
Hansen PC (1992b): Numerical tools for the analysis and solution ofFredholm integral equations of the first kind. Inverse Problems8:849–872.
He B, Lian J (2002): Spatio-temporal functional neuroimaging ofbrain electric activity. Crit Rev Biomed Eng 30:283–306.
He B, Zhang Z, Lian J, Sasaki H, Wu S, Towle VL (2002): Boundaryelement method based cortical potential imaging of somatosen-sory evoked potentials using subjects’ magnetic resonance im-ages. Neuroimage 16:564–576.
Horwitz B (2003): The elusive concept of brain connectivity. Neu-roimage 19:466–470.
Huang MX, Shih J, Lee RR, Harrington DL, Thoma RJ, Weisend MP,Hanlon FM, Paulson KM, Li T, Martin K, Miller GA, Canive JM(2004): Commonalities and differences among vectorized beam-formers in electromagnetic source imaging. Brain Topogr 16:139–158.
Inouye T, Iyama A, Shinosaki K, Toi S, Matsumoto Y (1995): Inter-site EEG relationships before widespread epileptiform dis-charges. Int J Neurosci 82:143–153.
Kaminski M, Blinowska K (1991): A new method of the descriptionof the information flow in the brain structures. Biol Cybern65:203–210.
Kaminski M, Ding M, Truccolo WA, Bressler S (2001): Evaluatingcausal relations in neural systems: Granger causality, directedtransfer function and statistical assessment of significance. BiolCybern 85:145–157.
Kay MS (1988): Modern Spectral Estimation. Englewood Cliffs, NJ:Prentice Hall.
Korzeniewska A, Manczak M, Kaminski M, Blinowska K, Kasicki S(2003): Determination of information flow direction betweenbrain structures by a modified directed transfer function method(dDTF). J Neurosci Methods 125:195–207.
Kus R, Kaminski M, Blinowska KJ (2004): Determination of EEGactivity propagation: pair-wise versus multichannel estimate.IEEE Trans Biomed Eng 51:1501–1510.
Lee L, Harrison LM, Mechelli A (2003): The functional brain con-nectivity workshop: report and commentary. Neuroimage 19:457–465.
Liu AK (2000): Spatiotemporal brain imaging. PhD dissertation,Cambridge, MA: MIT.
Liu AK, Belliveau JW, Dale AM (1998): Spatiotemporal imaging ofhuman brain activity using functional MRI constrained magne-toencephalography data: Monte Carlo simulations. Proc NatlAcad Sci U S A 95:8945–8950.
� Astolfi et al. �
� 156 �

Liu AK, Belliveau JW, Dale AM (2002): Monte Carlo simulationstudies of EEG and MEG localization accuracy. Hum BrainMapp 16:47–62.
Marple SL (1987): Digital Spectral Analysis With Applications.Englewood Cliffs, NJ: Prentice Hall.
McIntosh AR, Gonzalez-Lima F (1994): Structural equation model-ing and its application to network analysis in functional brainimaging. Hum Brain Mapp 2:2–22.
Milham MP, Banich MT, Barad V (2003): Competition for priority inprocessing increases prefrontal cortex’s involvement in top-down control: an event-related fMRI study of the Stroop Task.Cogn Brain Res 17:212–222.
Moretti DV, Babiloni F, Carducci F, Cincotti F, Remondini E, RossiniPM, Salinari S, Babiloni C (2003): Computerized processing ofEEG-EOG-EMG artifacts for multi-centric studies in EEG oscilla-tions and event-related potentials. Int J Psychophysiol 47:199–216.
Nunez PL (1995): Neocortical Dynamics and Human EEG Rhythms.New York: Oxford University Press.
Pascual-Marqui RD (1995): Reply to comments by Hamalainen,Ilmoniemi and Nunez. In: Skrandies W, ISBET Newslett 6:16–28.
Pfurtscheller G, Lopes da Silva FH (1999): Event-related EEG/MEGsynchronization and desynchronization: basic principles. ClinNeurophysiol 110:1842–1857.
Picard N, Strick PL (1996): Imaging the premotor areas. Curr OpinNeurobiol 11:663–672.
Pollock B, Gross J, Muller K, Aschersleben G, Schnitzler A (2005a):The cerebral oscillatory network associated with auditorilypaced finger movements. Neuroimage 24:646–655.
Pollock B, Gross J, Muller K, Aschersleben G, Schnitzler A (2005b):The oscillatory network of simple repetitive bimanual move-ments. Cogn Brain Res 25:300–311.
Regan D (1989): Human brain electrophysiology. Evoked potentialsand evoked magnetic fields in science and medicine. New York:Elsevier.
Rosenblum MG, Pikovsky AS (2001): Detecting direction of cou-pling in interacting oscillators. Phys Rev E Stat Nonlinear SoftMatter Phys 64:045202.
Roulston MS (1999): Estimating the errors on measured entropy andmutual information. Physica D 125:285–294.
Schack B, Chen ACN, Mescha S, Witte H (1999): Instantaneous EEGcoherence analysis during the Stroop task. Clin Neurophys 110:1410–1426.
Schlogl A (2003): Comparison of multivariate autoregressive esti-mators. Available online at: http://www.dpmi.tugraz.ac.at/�schloegl/publications/TR_MVARcomp201.pdf
Sekihara K, Nagarajan S, Poeppel D, Marantz A (2002): Performanceof an MEG adaptive-beamformer technique in the presence ofcorrelated neural activities: effects on signal intensity and time-course estimates. IEEE Trans Biomed Eng 49:1534–1546.
Stam CJ, van Dijk BW (2002): Synchronization likelihood: an unbi-ased measure of generalized synchronization in multivariatedata sets. Physica D 163:236–251.
Stam CJ, Breakspear M, van Cappellen van Walsum AM, van DijkBW (2003): Nonlinear synchronization in EEG and whole headMEG recordings of healthy subjects. Hum Brain Mapp 19:63–78.
Tononi G, Sporns O, Edelman GM (1994): A measure for braincomplexity: relating functional segregation and integration inthe nervous system. Proc Natl Acad Sci U S A 91:5033–5037.
Urbano A, Babiloni C, Onorati P, Babiloni F (1998): Dynamic func-tional coupling of high resolution EEG potentials related tounilateral internally triggered one-digit movements. Electroen-cephalogr Clin Neurophysiol 106:477–487.
VanVeen BD, vanDrongelen W, Yuchtman M, Suzuki A (1997):Localization of brain electrical activity via linearly constrainedminimum variance spatial filtering. IEEE Trans Biomed Eng44:867–880.
Wendling F, Bartolomei F, Bellanger JJ, Chauvel P (2002): Epilepsyfast activity can be explained by a model of impaired GABAergicdendritic inhibition. Eur J Neurosci 15:1499–1508.
West R, Bell MA (1997): Stroop-color word interference and electro-encephalogram activation: evidence for age-related decline ofthe anterior attention system. Neuropsychology 11:421–427.
� Estimators of Cortical Connectivity Patterns �
� 157 �
Related Documents