Hindawi Publishing Corporation International Journal of Antennas and Propagation Volume 2013, Article ID 410692, 6 pages http://dx.doi.org/10.1155/2013/410692 Research Article Comparison of Bioradiolocation and Respiratory Plethysmography Signals in Time and Frequency Domains on the Base of Cross-Correlation and Spectral Analysis Maksim Alekhin, 1 Lesya Anishchenko, 1 Alexander Tataraidze, 1,2 Sergey Ivashov, 1 Vladimir Parashin, 2 and Alexander Dyachenko 3,4 1 Remote Sensing Laboratory, Bauman Moscow State Technical University, 2nd Baumanskaya 5, Moscow 105005, Russia 2 Department of Biomedical Engineering, Bauman Moscow State Technical University, 2nd Baumanskaya 5, Moscow 105005, Russia 3 Department of Ecological and Medical Problems, Prokhorov General Physics Institute, Russian Academy of Sciences, Vavilova 38, Moscow 119991, Russia 4 Laboratory of Cardiorespiratory System Physiology and Biomechanics, Institute of Biomedical Problems, Russian Academy of Sciences, Khoroshevskoye Shosse 76A, Moscow 123007, Russia Correspondence should be addressed to Maksim Alekhin; [email protected] Received 8 March 2013; Accepted 13 April 2013 Academic Editor: Francesco Soldovieri Copyright © 2013 Maksim Alekhin et al. is is an open access article distributed under the Creative Commons Attribution License, which permits unrestricted use, distribution, and reproduction in any medium, provided the original work is properly cited. Comparison of bioradiolocation and standard respiratory plethysmography signals during simultaneous registration of different types of the human breathing movements is performed in both time and frequency domains. For all couples of synchronized signals corresponding to bioradiolocation and respiratory plethysmography methods, the cross-correlation and spectral functions are calculated, and estimates of their generalized characteristics are defined. e obtained results consider bioradiolocation to be a reliable remote sensing technique for noncontact monitoring of breathing pattern in medical applications. 1. Introduction Effective noncontact monitoring of breathing pattern is an important aspect of functional diagnostics and vital signs monitoring [1]. In analysis of respiratory movements char- acter, thoracic and abdominal components are usually taken into consideration. is approach is based on the representa- tion of chest wall as a system with two degrees of freedom [2]. Changes in the volume of its thoracic and abdominal components are almost linearly related to the changes of perimeters of correspondent thoracic and abdominal areas of chest wall. Usually, analysis of respiratory movements and associated changes in volume of chest wall abdominal and thoracic com- ponents is carried out applying respiratory plethysmography (RPG) methods [3]. In intensive care units, impedance RPG is widely used. In turn, inductive RPG methods are more popular in polysomnographic laboratories for analyzing res- piratory movements during sleep. Bioradiolocation (BRL) is a modern remote sensing tech- nique allowing to perform noncontact vital signs monitoring of living objects (even behind optically opaque obstacles), on the base of analysis of specific biometric modulation in reflected radiolocation signal [4]. During tidal breathing process, the modulation is mostly determined by recip- rocating displacements of skin surface in abdominal and thoracic areas of chest wall due to periodic contractions of respiratory muscles [5]. In medical practice, BRL technology application is known in somnology for noncontact screening of such types of sleep-disordered breathing as sleep apnea and sudden infant death syndromes [6]. Implementation of novel remote respiratory parameter registration techniques in clinical practice requires their mandatory verification with standard contact biomedical

Welcome message from author
This document is posted to help you gain knowledge. Please leave a comment to let me know what you think about it! Share it to your friends and learn new things together.
Transcript

Hindawi Publishing CorporationInternational Journal of Antennas and PropagationVolume 2013, Article ID 410692, 6 pageshttp://dx.doi.org/10.1155/2013/410692
Research ArticleComparison of Bioradiolocation and RespiratoryPlethysmography Signals in Time and Frequency Domains onthe Base of Cross-Correlation and Spectral Analysis
Maksim Alekhin,1 Lesya Anishchenko,1 Alexander Tataraidze,1,2 Sergey Ivashov,1
Vladimir Parashin,2 and Alexander Dyachenko3,4
1 Remote Sensing Laboratory, Bauman Moscow State Technical University, 2nd Baumanskaya 5, Moscow 105005, Russia2 Department of Biomedical Engineering, Bauman Moscow State Technical University, 2nd Baumanskaya 5, Moscow 105005, Russia3 Department of Ecological and Medical Problems, Prokhorov General Physics Institute, Russian Academy of Sciences, Vavilova 38,Moscow 119991, Russia
4 Laboratory of Cardiorespiratory SystemPhysiology and Biomechanics, Institute of Biomedical Problems, RussianAcademy of Sciences,Khoroshevskoye Shosse 76A, Moscow 123007, Russia
Correspondence should be addressed to Maksim Alekhin; [email protected]
Received 8 March 2013; Accepted 13 April 2013
Academic Editor: Francesco Soldovieri
Copyright © 2013 Maksim Alekhin et al. This is an open access article distributed under the Creative Commons AttributionLicense, which permits unrestricted use, distribution, and reproduction in any medium, provided the original work is properlycited.
Comparison of bioradiolocation and standard respiratory plethysmography signals during simultaneous registration of differenttypes of the human breathing movements is performed in both time and frequency domains. For all couples of synchronizedsignals corresponding to bioradiolocation and respiratory plethysmography methods, the cross-correlation and spectral functionsare calculated, and estimates of their generalized characteristics are defined. The obtained results consider bioradiolocation to be areliable remote sensing technique for noncontact monitoring of breathing pattern in medical applications.
1. Introduction
Effective noncontact monitoring of breathing pattern is animportant aspect of functional diagnostics and vital signsmonitoring [1]. In analysis of respiratory movements char-acter, thoracic and abdominal components are usually takeninto consideration.This approach is based on the representa-tion of chest wall as a system with two degrees of freedom[2]. Changes in the volume of its thoracic and abdominalcomponents are almost linearly related to the changes ofperimeters of correspondent thoracic and abdominal areas ofchest wall.
Usually, analysis of respiratorymovements and associatedchanges in volume of chest wall abdominal and thoracic com-ponents is carried out applying respiratory plethysmography(RPG) methods [3]. In intensive care units, impedance RPGis widely used. In turn, inductive RPG methods are more
popular in polysomnographic laboratories for analyzing res-piratory movements during sleep.
Bioradiolocation (BRL) is a modern remote sensing tech-nique allowing to perform noncontact vital signs monitoringof living objects (even behind optically opaque obstacles),on the base of analysis of specific biometric modulationin reflected radiolocation signal [4]. During tidal breathingprocess, the modulation is mostly determined by recip-rocating displacements of skin surface in abdominal andthoracic areas of chest wall due to periodic contractions ofrespiratory muscles [5]. In medical practice, BRL technologyapplication is known in somnology for noncontact screeningof such types of sleep-disordered breathing as sleep apnea andsudden infant death syndromes [6].
Implementation of novel remote respiratory parameterregistration techniques in clinical practice requires theirmandatory verification with standard contact biomedical

2 International Journal of Antennas and Propagation
research methods [3]. The aspect of matching breathing rate(FBR) values registered applying in parallel BRL and RPGmethods was previously [7] studied in details. However,analysis of functional relationships between BRL and RPGsignals in both time and frequency domains for registrationof various respiration types has not been performed yet. Themain aim of this study is the comparison of BRL and RPGsignals on the basis of cross-correlation and spectral (CCS)analysis of time series [8]. It is necessary for validation of BRLdata with standard contact biomedical research techniqueand to prove reliability and correctness of BRL methodapplication in noncontact remote monitoring of externalrespiration activity parameters.
2. Methods of Cross-Correlation andSpectral Analysis
Generally, for determining functional relationships betweenthe two processes in time and frequency domains, a rangeof methods is used, based on calculating CCS functions andestimates of their generalized characteristics. The CCS func-tions used in this study include normalized cross-correlationfunction (NCCF) and cross-power spectral density function(CPSDF). A couple of uniform time series with synchronizedreference points is usually taken as source data for calculatingCCS functions [8].
2.1. Normalized Cross-Correlation Function. NCCF describeslinear relationship between two signals reflecting similarityof their shape, as well as relative position in time domain. Fordigital signals 𝑋 and 𝑌, represented by uniform time serieswith zero mean values, NCCF is calculated as [8]
𝜌𝑥𝑦(𝜏) =
𝐾𝑥𝑦(𝜏)
𝜎𝑥⋅ 𝜎𝑦
=
𝐾𝑥𝑦(𝜏)
√𝐾𝑥𝑥(0) ⋅ √𝐾
𝑦𝑦(0)
, (1)
where𝜌𝑥𝑦(𝜏)—normalized cross-correlation function;𝐾
𝑥𝑦(𝜏)
—cross-correlation function; 𝐾𝑥𝑥(𝜏), 𝐾
𝑦𝑦(𝜏)—auto- correla-
tion functions; 𝜎𝑥, 𝜎𝑦—standard deviations estimates; 𝑓—
frequency; 𝜏—delay time.The similarity in shape of two signals in time domain
is determined by cross-correlation coefficient 𝜌𝐶, equaled to
NCCF at zero time delay [8]
𝜌𝐶= 𝜌𝑥𝑦(0) =
𝐾𝑥𝑦(0)
𝜎𝑥⋅ 𝜎𝑦
. (2)
2.2. Cross-Power Spectral Density Function. CPSDF for twosignals 𝑋 and 𝑌 is expressed through the NCCF as follows[8]
𝑃𝑥𝑦(𝑓) = 4 [
𝑇
∑
𝜏=0
𝜌𝑥𝑦(𝜏) ⋅ 𝑒
−𝑗2𝜋𝑓𝑡
] , (3)
where 𝑃𝑥𝑦(𝑓)—cross-spectral power density function; 𝜌
𝑥𝑦(𝜏)
—normalized cross-correlation function; 𝑓—frequency; 𝑇—the length of the analyzed time period; 𝜏—delay time; 𝑡—current time.
Knowing the maximum value of 𝑃max for corresponding𝑓𝑜, frequency band 𝐵
𝑒𝑓= 𝑓𝑜± Δ𝑓𝑒𝑓
can be determined, inwhich the main cross-power spectral density of the two pro-cesses is concentrated, where Δ𝑓
𝑒𝑓is effective width of cross-
spectrum in the neighborhood of the extreme frequency 𝑓𝑜
[8]:
Δ𝑓𝑒𝑓=
𝜌𝑥𝑦(0)
2𝜋 ⋅ 4 ⋅ 𝑃max=𝜌𝜅
8𝜋 ⋅ 𝑃𝑥𝑦(𝑓𝑜). (4)
3. Experiment
Three normal male subjects with no respiratory pathologies(age 22–24 years, height 170–176 cm, weight 64–82 kg) par-ticipated in the experiments for comparing BRL and RPGsignals.The studieswere carried out on the base of Laboratoryof Cardiorespiratory System Physiology and Biomechanicsof State Scientific Center of Russian Federation-Institute ofBiomedical Problems of Russian Academy of Sciences [9].
3.1. Equipment. BioRascan multifrequency BRL system witha continuous-wave signal and step frequency modulation,developed at Remote Sensing Laboratory of BaumanMoscowState Technical University, was used in the experiments. Theunit has 16 operating frequencies in the range from 3.6 to4.0GHz. The received signal is filtered by means of an activeanalog filter with a bandwidth 0.03–5.00Hz. The samplingrate is 52.1 Hz. Data are recorded in two quadratures.TheBRLsignal power flux density is 1.36𝜇W/cm2, which grants safetyfor both patients and medical staff during cardiovascularand respiratory monitoring with BioRascan BRL systemapplication [10].
When comparing BRL and RPG methods during simul-taneous data registration, “Respiration-1” instrumental com-plex (developed by “Biophyspribor” of Federal Medical-Biological Agency of Russian Federation) was applied forRPG recording. Specialized abdominal and thoracic beltmonitors with integrated rheostat-based perimetric sensorswere used for registering the respiratory movements ofthe subjects. Signal sampling rate in both cases is 250Hz.Previously, “Respiration-1” instrumental complexwas used inbiomedical research programon theRussianOrbital Segmentof the International Space Station [11].
3.2. Experimentation. During the set of experiments, a sub-ject was placed on a prepared couch, lying on his back,arms along his sides (Figure 1). Using a tripod, the BioRascanantenna unit was mounted at a distance of 1.0m from thesubject, directed towards his chest wall area. The thoracicRPG monitor was attached at the middle of the sternum,the abdominal one, at the hypochondrium, passing above thenavel. Each experimental recording startedwith a deep breathto subsequently perform peak-to-peak synchronization ofBRL and RPG signals during further stages of CCS analysis.
BRL data was recorded in single-frequency mode withBioRascan bioradar operating on 3.6GHz. During the set ofpreliminary experimentation, the visual analysis of BRL sig-nals, registered on each of the 16 frequencies from the range

International Journal of Antennas and Propagation 3
Figure 1: Simultaneous registration of BRL and RPG signals duringthe experiment.
3.6 to 4.0GHz, showed no considerable differences in shapeand quality of BRL data. So the selection of another operatingfrequency from this range has no significant influence onthe results of verification of BRL method with RPG in thetasks of noncontact remote monitoring of human breathingpattern. One BioRascan signal quadrature (in phase with thesignal of RPG abdominal sensor) on operating frequency of3.6GHz was selected for further analysis. This BRL signalgenerally satisfies the model and experiments described in[1] and is suitable for human breathing pattern monitoringwithout application of additional demodulation techniques.
An effect of RPG belt perimetric monitors on receiv-ing BRL signal was preliminary estimated. Test signalswere recorded: without RPG belt monitors, separately withabdominal and thoracic RPG belt monitors, and with bothmonitors. No significant changes in the quality of receivedBRL data were identified in each case according to the resultsof visual analysis of typical registered BRL signals.Thus, it canbe concluded that the presence of RPG belt monitors on thebody does not cause significant distortion of the received BRLsignal in simultaneous registration of BRL and RPG data.
During the experiment, each of the subjects performedthree types of respiratory movements:
(i) A: spontaneous breathing (6 to 15 breaths perminute);
(ii) B: rapid breathing (16 to 30 breaths per minute);
(iii) C: breath holding after a deep breath, followed bycontinued respiration (Figure 2).
It should be pointed out that correct and effective reg-istration of respiration arrests during sleep for longer than10 seconds is an important aspect of central sleep apneascreening and is essential in preventive diagnostics of suddeninfant death syndrome [12].
In horizontal position (lying on the back), abdominaltype of respiration is prevalent. Reciprocating displacementsof skin surface in abdominal area mostly contribute to BRLsignal during tidal breathing [13]. For this reason, in per-forming CCS analysis, source data from RPG belt abdominalmonitor and BRL signal quadrature on operating frequencyof 3.6GHz were compared.
10.5
0−0.5
−1
𝑆(𝑡)
(ru)
𝑡 (s)0 10 20 30 40 50 60 70 80 90 100 110 120
BRL
(a)
10.5
0−0.5
−1
𝑆(𝑡)
(ru)
𝑡 (s)0 10 20 30 40 50 60 70 80 90 100 110 120
RPG
(b)
Figure 2: Typical BRL and RPG signals for breath holding episode((a): BRL signal; (b): RPG signal).
4. Data Processing
In the structure of data processing algorithm for CCS analysisof BRL and RPG signals, the following stages can be pointedout:
(i) preprocessing (resampling; smoothing; Z-normal-ization; synchronization of reference points);
(ii) forming two-dimensional arrays of data for couples ofBRL and RPG signal realizations;
(iii) construction and analysis of FBR correlation fieldregistered with both BRL and RPG methods;
(iv) calculation and analysis of CCS functions (NCCF;CPSDF);
(v) calculation of estimates of generalized characteristicsfor CCS functions;
(vi) interpretation and analysis of results.MATLAB software was used for performing all the dataprocessing routines [14].
4.1. Preprocessing. For each couple of BRL and RPG signals,preprocessing procedure was performed (Figure 3), includ-ing the following stages:
(i) resampling of source data using linear interpolationmethod to set BRL and RPG signals to commonsampling rate of 10.0Hz;
(ii) smoothing the resulting uniform time series usingfive-point moving average filter to avoid possiblehigh-frequency fluctuations and random bursts ofdata;
(iii) Z-normalization;(iv) synchronization of reference points for couples of
BRL and RPG signals to form two-dimensional uni-form arrays of data for further CCS analysis.
4 International Journal of Antennas and Propagation𝑆(𝑡)
(ru)
𝑡 (s)
BRL
RPG0 10 20 30 40 50 60
1.51
0.50
−0.5−1
−1.5
(a)
𝑆(𝑡)
(ru)
𝑡 (s)
BRL
RPG
0 10 20 30 40 50 60
1.51
0.50
−0.5−1
−1.5
(b)
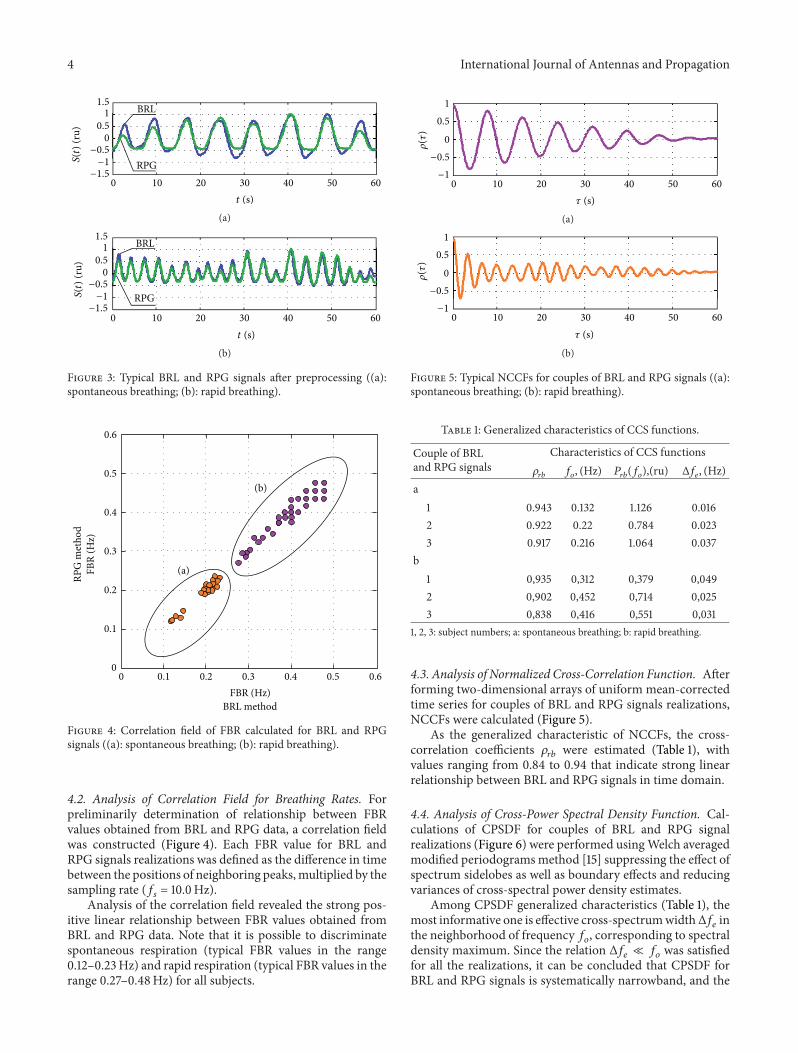
Figure 3: Typical BRL and RPG signals after preprocessing ((a):spontaneous breathing; (b): rapid breathing).
FBR (Hz)
FBR
(Hz)
RPG
met
hod
(a)
(b)
0.6
0.6
0.5
0.5
0.4
0.4
0.3
0.3
0.2
0.2
0.1
0.10
0
BRL method
Figure 4: Correlation field of FBR calculated for BRL and RPGsignals ((a): spontaneous breathing; (b): rapid breathing).
4.2. Analysis of Correlation Field for Breathing Rates. Forpreliminarily determination of relationship between FBRvalues obtained from BRL and RPG data, a correlation fieldwas constructed (Figure 4). Each FBR value for BRL andRPG signals realizations was defined as the difference in timebetween the positions of neighboring peaks,multiplied by thesampling rate (𝑓
𝑠= 10.0Hz).
Analysis of the correlation field revealed the strong pos-itive linear relationship between FBR values obtained fromBRL and RPG data. Note that it is possible to discriminatespontaneous respiration (typical FBR values in the range0.12–0.23Hz) and rapid respiration (typical FBR values in therange 0.27–0.48Hz) for all subjects.
10.5
0−0.5
−10 10 20 30 40 50 60
𝜌(𝜏)
𝜏 (s)
(a)
10.5
0−0.5
−10 10 20 30 40 50 60
𝜌(𝜏)
𝜏 (s)
(b)
Figure 5: Typical NCCFs for couples of BRL and RPG signals ((a):spontaneous breathing; (b): rapid breathing).
Table 1: Generalized characteristics of CCS functions.
Couple of BRLand RPG signals
Characteristics of CCS functions𝜌𝑟𝑏𝑓𝑜, (Hz) 𝑃
𝑟𝑏(𝑓𝑜),(ru) Δ𝑓
𝑒, (Hz)
a1 0.943 0.132 1.126 0.0162 0.922 0.22 0.784 0.0233 0.917 0.216 1.064 0.037
b1 0,935 0,312 0,379 0,0492 0,902 0,452 0,714 0,0253 0,838 0,416 0,551 0,031
1, 2, 3: subject numbers; a: spontaneous breathing; b: rapid breathing.
4.3. Analysis of Normalized Cross-Correlation Function. Afterforming two-dimensional arrays of uniform mean-correctedtime series for couples of BRL and RPG signals realizations,NCCFs were calculated (Figure 5).
As the generalized characteristic of NCCFs, the cross-correlation coefficients 𝜌
𝑟𝑏were estimated (Table 1), with
values ranging from 0.84 to 0.94 that indicate strong linearrelationship between BRL and RPG signals in time domain.
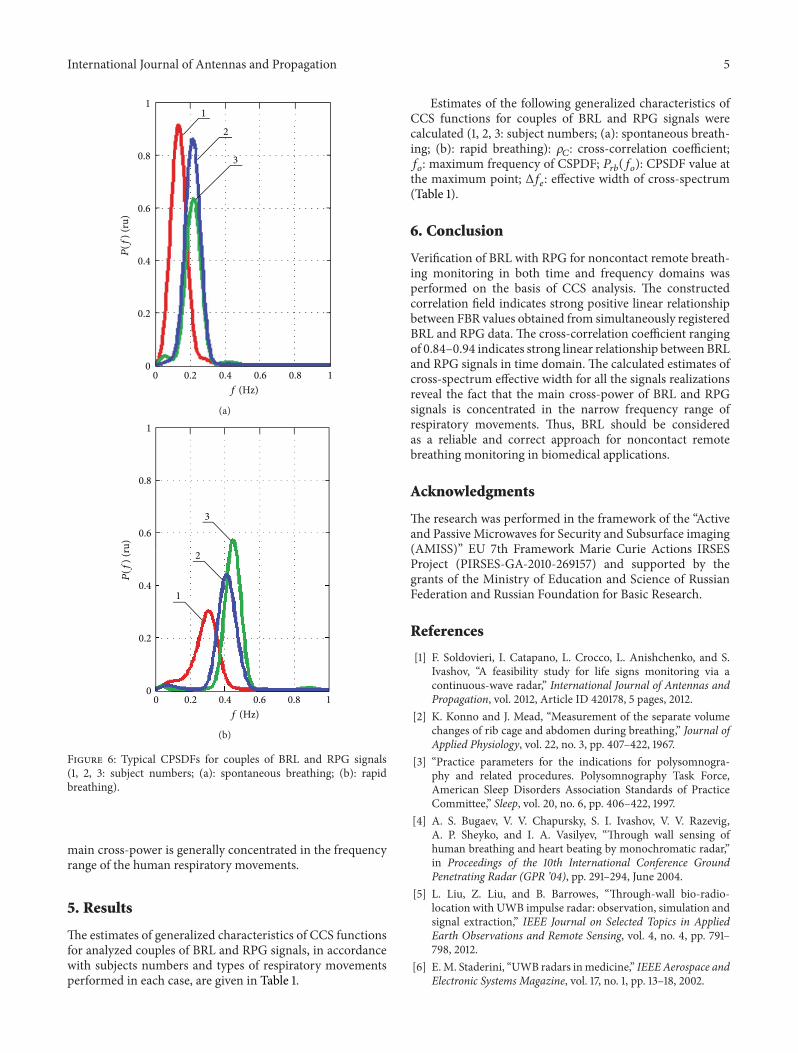
4.4. Analysis of Cross-Power Spectral Density Function. Cal-culations of CPSDF for couples of BRL and RPG signalrealizations (Figure 6) were performed usingWelch averagedmodified periodogramsmethod [15] suppressing the effect ofspectrum sidelobes as well as boundary effects and reducingvariances of cross-spectral power density estimates.
Among CPSDF generalized characteristics (Table 1), themost informative one is effective cross-spectrumwidthΔ𝑓
𝑒in
the neighborhood of frequency 𝑓𝑜, corresponding to spectral
density maximum. Since the relation Δ𝑓𝑒≪ 𝑓𝑜was satisfied
for all the realizations, it can be concluded that CPSDF forBRL and RPG signals is systematically narrowband, and the
International Journal of Antennas and Propagation 5
1
1
0.8
0.8
0.6
0.6
0.4
0.4
0.2
0.20
0
𝑃(𝑓
)(r
u)
𝑓 (Hz)
1
2
3
(a)1
0.8
0.6
0.4
0.2
0
𝑃(𝑓
)(r
u)
10.80.60.40.20𝑓 (Hz)
1
2
3
(b)
Figure 6: Typical CPSDFs for couples of BRL and RPG signals(1, 2, 3: subject numbers; (a): spontaneous breathing; (b): rapidbreathing).
main cross-power is generally concentrated in the frequencyrange of the human respiratory movements.
5. Results
The estimates of generalized characteristics of CCS functionsfor analyzed couples of BRL and RPG signals, in accordancewith subjects numbers and types of respiratory movementsperformed in each case, are given in Table 1.
Estimates of the following generalized characteristics ofCCS functions for couples of BRL and RPG signals werecalculated (1, 2, 3: subject numbers; (a): spontaneous breath-ing; (b): rapid breathing): 𝜌
𝐶: cross-correlation coefficient;
𝑓𝑜: maximum frequency of CSPDF; 𝑃
𝑟𝑏(𝑓𝑜): CPSDF value at
the maximum point; Δ𝑓𝑒: effective width of cross-spectrum
(Table 1).
6. Conclusion
Verification of BRL with RPG for noncontact remote breath-ing monitoring in both time and frequency domains wasperformed on the basis of CCS analysis. The constructedcorrelation field indicates strong positive linear relationshipbetween FBR values obtained from simultaneously registeredBRL and RPG data. The cross-correlation coefficient rangingof 0.84–0.94 indicates strong linear relationship between BRLand RPG signals in time domain. The calculated estimates ofcross-spectrum effective width for all the signals realizationsreveal the fact that the main cross-power of BRL and RPGsignals is concentrated in the narrow frequency range ofrespiratory movements. Thus, BRL should be consideredas a reliable and correct approach for noncontact remotebreathing monitoring in biomedical applications.
Acknowledgments
The research was performed in the framework of the “Activeand Passive Microwaves for Security and Subsurface imaging(AMISS)” EU 7th Framework Marie Curie Actions IRSESProject (PIRSES-GA-2010-269157) and supported by thegrants of the Ministry of Education and Science of RussianFederation and Russian Foundation for Basic Research.
References
[1] F. Soldovieri, I. Catapano, L. Crocco, L. Anishchenko, and S.Ivashov, “A feasibility study for life signs monitoring via acontinuous-wave radar,” International Journal of Antennas andPropagation, vol. 2012, Article ID 420178, 5 pages, 2012.
[2] K. Konno and J. Mead, “Measurement of the separate volumechanges of rib cage and abdomen during breathing,” Journal ofApplied Physiology, vol. 22, no. 3, pp. 407–422, 1967.
[3] “Practice parameters for the indications for polysomnogra-phy and related procedures. Polysomnography Task Force,American Sleep Disorders Association Standards of PracticeCommittee,” Sleep, vol. 20, no. 6, pp. 406–422, 1997.
[4] A. S. Bugaev, V. V. Chapursky, S. I. Ivashov, V. V. Razevig,A. P. Sheyko, and I. A. Vasilyev, “Through wall sensing ofhuman breathing and heart beating by monochromatic radar,”in Proceedings of the 10th International Conference GroundPenetrating Radar (GPR ’04), pp. 291–294, June 2004.
[5] L. Liu, Z. Liu, and B. Barrowes, “Through-wall bio-radio-location with UWB impulse radar: observation, simulation andsignal extraction,” IEEE Journal on Selected Topics in AppliedEarth Observations and Remote Sensing, vol. 4, no. 4, pp. 791–798, 2012.
[6] E.M. Staderini, “UWB radars inmedicine,” IEEE Aerospace andElectronic Systems Magazine, vol. 17, no. 1, pp. 13–18, 2002.

6 International Journal of Antennas and Propagation
[7] J. Muehlsteff, R. Pinter, and G. Morren, “Comparison of respi-ration rate monitoring with a low-cost Doppler-Radar sensorand inductive thorax-plethysmography,” in Proceedings of theWorld Congress on Medical Physics and Biomedical Engineering(IFMBE ’09), pp. 768–771, September 2009.
[8] D. Pollock,Handbook of Time Series Analysis, Signal Processing,and Dynamics, Academic Press, 1999.
[9] Y. Popova, A. Suvorov, A. Dyachenko, and V. Kolesnikov,“Biomechanics and regulation of the external respiration inthe conditions of 5-day dry immersion,” Aviakosmicheskaia iEkologicheskaia Meditsina, vol. 45, no. 6, pp. 26–31, 2011.
[10] L. Anishchenko, A. Bugaev, S. Ivashov, and I. Vasilyev, “Appli-cation of bio-radiolocation for estimation of the laboratoryanimals’movement activity,” PIERSOnline, vol. 5, no. 6, pp. 551–554, 2009.
[11] V. Baranov, A. Suvorov, A. Dyachenko, J. Popova, A. Minyaeva,andV. Kolesnikov, “Respiration and respiratory control in long-term spaceflight,” in Proceedings of the 17th IAA Humans inSpace Symposium, pp. 129–130, 2009.
[12] M. Alekhin, L. Anishchenko, A. Zhuravlev et al., “Estimatingdiagnostic informativeness of bio-radiolocation pneumographyin non-contact screening of sleep apnea syndrome,” BiomedicalEngineering, vol. 47, no. 2, 2013.
[13] D. A. Korchagina, M. D. Alekhin, and L. N. Anishchenko, “Bio-radiolocation method at chest wall motion analysis during tidalbreathing,” in Proceedings of the 7th European Radar Conference(EuRAD ’10), pp. 475–478, October 2010.
[14] D. Higham and N. Higham, MATLAB Guide, SIAM, Philadel-phia, Pa, USA, 2005.
[15] P. Welch, “The use of fast Fourier transform for the estimationof power spectra: a method based on time averaging overshort,modified periodograms,” IEEETransactions onAudio andElectroacoustics, vol. 15, no. 2, pp. 70–73, 1967.
Related Documents


