East Tennessee State University Digital Commons @ East Tennessee State University Electronic eses and Dissertations Student Works 8-2009 Comparison of Artificial Flavors in Commercial Products and Actual Natural Flavor via Gas Chromatography Mass Spectroscopy Data. Randi Jasmine Sluss East Tennessee State University Follow this and additional works at: hps://dc.etsu.edu/etd Part of the Food Chemistry Commons is esis - Open Access is brought to you for free and open access by the Student Works at Digital Commons @ East Tennessee State University. It has been accepted for inclusion in Electronic eses and Dissertations by an authorized administrator of Digital Commons @ East Tennessee State University. For more information, please contact [email protected]. Recommended Citation Sluss, Randi Jasmine, "Comparison of Artificial Flavors in Commercial Products and Actual Natural Flavor via Gas Chromatography Mass Spectroscopy Data." (2009). Electronic eses and Dissertations. Paper 1804. hps://dc.etsu.edu/etd/1804

Welcome message from author
This document is posted to help you gain knowledge. Please leave a comment to let me know what you think about it! Share it to your friends and learn new things together.
Transcript
East Tennessee State UniversityDigital Commons @ East
Tennessee State University
Electronic Theses and Dissertations Student Works
8-2009
Comparison of Artificial Flavors in CommercialProducts and Actual Natural Flavor via GasChromatography Mass Spectroscopy Data.Randi Jasmine SlussEast Tennessee State University
Follow this and additional works at: https://dc.etsu.edu/etd
Part of the Food Chemistry Commons
This Thesis - Open Access is brought to you for free and open access by the Student Works at Digital Commons @ East Tennessee State University. Ithas been accepted for inclusion in Electronic Theses and Dissertations by an authorized administrator of Digital Commons @ East Tennessee StateUniversity. For more information, please contact [email protected].
Recommended CitationSluss, Randi Jasmine, "Comparison of Artificial Flavors in Commercial Products and Actual Natural Flavor via Gas ChromatographyMass Spectroscopy Data." (2009). Electronic Theses and Dissertations. Paper 1804. https://dc.etsu.edu/etd/1804
Comparison of Artificial Flavors in Commercial Products and Actual Natural Flavor Via Gas Chromatography Mass Spectrometry Data
A thesis
presented to
the faculty of the Department of Chemistry
East Tennessee State University
In partial fulfillment
of the requirements for the degree
Master of Science in Chemistry
by
Randi Jasmine Sluss
August 2009
Dr. Chu-Ngi Ho, Chair
Dr. Peng Sun
Dr. Ningfeng Zhao
Keywords: Strawberry, Gas Chromatography Mass Spectroscopy, Natural Flavor,
Artificial Flavor
2
ABSTRACT
Comparison of Artificial Flavors in Commercial Products and Actual Natural Flavor Via Gas Chromatography Mass Spectroscopy Data
by
Randi Jasmine Sluss
In this research project, real natural strawberries bought from different local sources were
profiled by gas chromatography-mass spectroscopy (GCMS). These profiles were then used as a
reference to compare GCMS profiles of commercial artificial strawberry flavor products such as
strawberry flavored Cool SplashersTM, Gatorade®, and Aquacal® flavored water. The
chromatograms obtained were patterned using simple visual observations, scatter plot designs,
Mann-Whitney U Test, and correlation coefficients. The artificially flavored commercial
products tend to have simpler chromatograms. The Burger King® milkshake, Gatorade®, and Hi-
C® are the most similar to that of the natural strawberry flavor. Their correlation coefficients are
0.972, 0.870, and 0.984 respectively. The Mann-Whitney U Test results also support the
conclusions from correlation coefficients. However, the natural products tend to have more
constituents including the main flavoring compounds. Thus fresh produce have better flavor and
are more nutritious for a good reason.
3
DEDICATION
I would like to dedicate this thesis to everyone who believes in me and gives me the
strength to accomplish all my goals. I dedicate this thesis to a family who believes in me and
gives me the courage to push through struggles in my life. I dedicate this thesis to the entire
faculty of the Chemistry Department at ETSU who believes in me and pushes me to do better. I
dedicate this thesis to God who also gives me the strength and courage to accomplish all my
goals.

4
ACKNOWLEDGMENTS
I would like to acknowledge the entire ETSU faculty that aided me in the process of
completing all the requirements for graduation and my thesis. I would like to thank ETSU for
awarding me the graduate assistantship scholarship.

5
CONTENTS
Page
ABSTRACT…………………………………………………………………………………… 2
DEDICATION………………………………………………………………………………… 3
ACKNOWLEDGEMENTS…………………………………………………………………… 4
LIST OF TABLES……………………………………………………………………………. 7
LIST OF FIGURES…………………………………………………………………………… 8
Chapter
1. INTRODUCTION……………………………………………………………………. 9
Origins of Foods……………………………………………………………….. 9
Food Additives…………………………………………………....................... 11
Natural and Artificial Flavors…………………………………………………. 13
Strawberries…………………………………………………………………… 18
2. METHODS OF FLAVOR ANALYSIS……………………………………………… 21
GC/MS Methods………………………………………………………………. 21
Flavor Compounds Extraction Methods……………………………………… 23
Solvent Liquid/Liquid Extraction…………………………………….. 23
Static Headspace Sampling…………………………………………… 24
Dynamic Headspace Sampling……………………………………….. 25
Solid Phase Micro-Extraction(SPME)……………………………….. 25
Soxhlet Extraction……………………………………………………. 25
Supercritical Fluid Extraction……………………………………….. 26
Simultaneous Steam Distillation/Extraction…………………………... 26

6
Molecular Distillation…………………………………………………. 27
Flavor Analysis……………………………………………………………….. 28
Proposed Research……………………………………………………………. 34
3. EXPERIMENTAL PROCEDURES…………………………………………………. 36
Reagents………………………………………………………………………. 36
Samples Obtained…………………………………………………………….. 36
Preparation of Standard Solutions…………………………………………….. 37
Preparation of Natural Strawberry Samples…………………………………… 38
Preparation of Commercial Products Samples……………………………….... 38
Instrumentation……………………………………………………………….. 40
Data Analysis…………………………………………………………………. 43
4. RESULTS AND DISCUSSION……………………………………………………… 45
Visual Inspection of GCMS Chromatograms………………………………… 45
Scatter Plot Study……………………………………………………………. 54
Statistical Methods.…………………………………………………………… 57
5. CONCLUSION………………………………………………………………………. 62
REFERENCES………………………………………………………………………. 67
VITA…………………………………………………………………………………. 71
7
LIST OF TABLES
Table Page
1. Flavor Compounds and Contributed Flavors…….………………………………… 16
2. Important Compounds Found in Strawberries……………………………………… 20
3. HP 5890 GC Parameters……………………………………………………………. 4q
4. HP 5971 Mass Selective Detector Parameters……………………………………… 42
5. Correlation Coefficients of the Different Natural Strawberry Samples Obtained From
GCMS Data…………………………………………………………………............. 57
6. Correlations Coefficients Between the Natural Strawberry Samples and the Commercial
Samples……………………………………………………………………………… 58
7. Mann-Whitney U Test for Comparison of Natural Strawberry vs.
Commercial Products………………………………………………………………. 61

8
LIST OF FIGURES
Figure Page
1. GCMS a Simple Schematic of a Gas Chromatograph Mass Spectrometer..................... 22
2. GCMS Spectrum of Standards, Ethyl Acetate, Ethyl Butyrate, Furfural, and DMHF of
Concentrations of 1.02 x 10⁻⁴ , 7.57 x 10⁻⁵, 1.21 x 10⁻⁴, and 7.80 x 10⁻⁶
mol/L, Repectively…………………………………………………………...……… 45
3. GCMS Spectrum of California Strawberry Sample of Concentration of 0.1 g/mL….. 46
4. GCMS Spectrum of Driscoll’s Strawberry Sample of Concentration of 0.1 g/mL….. 47
5. GCMS Spectrum of Strawberry Fraises Sample of Concentration of 0.1 g/mL……... 48
6. GCMS Spectrum of Burger King® Milkshake Sample of Concentration 0.4 g/mL…. 49
7. GCMS Spectrum of Gatorade® Sample of Concentration 0.03 g/mL..………………. 49
8. GCMS Spectrum of Hi-C® Sample of Concentration 0.11 g/mL…………………….. 51
9. GCMS Spectrum of JELL-O® Sample of Concentration 0.03 g/mL…………………. 52
10. GCMS Spectrum of Aquacal® Sample of Concentration 0.05 g/mL…………………. 52
11. GCMS Spectrum of Cool SplashersTM Sample of Concentration 0.02 g/mL………… 53
12. Scatter Plot of Real Strawberry Averaged Retention Times Compared to Those of the
Commercial Products………………………………………………………………... 55
13. Scatter Plot of Real Strawberry Averaged Retention Times Compared to Those of the
Commercial Products………………………………………………………………… 56
9
CHAPTER 1
INTRODUCTION
Origins of Foods
Foods we consume are regulated by the Food and Drug Administration (FDA). Foods
can contain carbohydrates, fats, proteins, sugars, fiber, salts, vitamins, minerals, antioxidants,
phytonutrients, and food additives. Many of these components are used to develop the
commercial foods we eat today (1). The origins of foods are quite different. It is found that
most of our predecessors ate wild foods consisting of seeds, nuts, fruits, roots, insects, and
honey. By eating the same plants and fruits as the surrounding animals, humans could deduce
which foods were poisonous and which were safe to eat. Animals were also hunted and
consumed as a primary source of protein. Further, it has also been discovered that humans were
able to hunt larger animals as far back as nearly two million years ago. Although, the use of fire
to cook the meat was dated back to about 20,000 years ago, the first recorded use of fire was
30,000 years earlier. However, its purpose was not to cook food. Rather, fire was used for
warmth and often to scare animals away. This time was known as the Ice Age. As this era
ended, nearly 10,000 years later, humans used fire extensively as a light source to hunt animals.
The animals that were targeted were often overhunted; leading to a shortage in the food supply.
This situation initiated the origins of agriculture (2).
Nearly 10,000 years ago, these agricultural beginnings brought about the early stages of
food organization. The cultivating of seeds and other plants began as humans discovered the
most fertile times of the year in which to plant their crops. Some of these species of plants are
still grown today. Among the few crop sources of this time, wheat was cultured in Persia and

10
Afghanistan, along with other grains in Ethiopia. Migration brought wheat into Europe as oats,
barley, and rye grew more effectively in the northern lands. Further, there are recorded instances
of beer and liquor made from these grains as early as 5000 years ago. Yeast, recorded as an
early food additive, made this transition possible with the development of bread soon to follow.
Rice and maize were next in line to be grown extensively in both the Far East and Central
America. Turnips, radishes, almonds, peaches, apricots, beetroots, cabbages, onions, and garlic
are also recorded as having been firts cultivated nearly 4000 years ago. As time passed, humans
were able to gain control of their food sources as they developed better means of food production
and hunting.
Later, death from inadequate nutrition became quite common in many societies. Liquor,
wine, and beer were often instruments in dishonest trade, with herbs and spices used to cover the
foulness and off-flavor of foods. This began a new era of food additives, resulting from
organized thievery and dishonest merchants throughout the food trade. The trade of unfit foods
brought about the establishment of Trade Guilds in the Middle Ages. These guilds would set
standards of integrity, as they forced all merchants who sold foods to meet a certain level of
expectation. The 19th century brought with it the knowledge needed to maintain and develop the
nutritional quality of foods. By this period, it was discovered that proteins, fats, and
carbohydrates were essential to the daily food intake in humans. With this discovery, food began
to be classified by the level of carbohydrates, fats, and proteins of meats, vegetables, and grains.
Vitamins were the next to be discovered and proved to be useful against some types of diseases.
In the mid-1900s, amino acids and fatty acids were discovered and proved to be a necessity for
nutritional balance. This discovery introduced the knowledge of food’s nutritional value that is
in use today (2).

11
Food Additives
“A food additive may be defined as a substance added to food either directly and
intentionally for a functional purpose, or indirectly during some phase of production, processing,
storage or packaging without intending that it remain in, or serve a purpose in, the final product.
It does not include either the basic foodstuff itself or chance contaminants.” The two types of
food additives are intentional and incidental additives. Intentional additives are the compounds
that are added deliberately to improve nutritional value or flavor. Incidental additives are in
trace amounts and are by-products of production, storage, or packaging. Food additives are not
always lab created. Some foods may contain a food additive that is used in other processes such
as propionates in Swiss cheese to prevent mold (3). Many types of food additives are available.
Antioxidants, vitamins, minerals, preservatives, emulsifiers and stabilizers, food colors, flavors,
sequestrants, and anticaking agents are some of the more common additives to be discussed.
Others such as acids, buffers, bases, humectants, firming and crisping agents, sweeteners, and
enzymes are also used (2).
Antioxidants protect fats as well as vitamins and are commonly used to protect
unsaturated food compounds. They protect the targeted food constituent by preventing oxidation
and formation of free radicals. The antioxidant soaks up the free radicals to prevent the second
step of oxidation, propagation, from taking place. Propyl gallate, octyl gallate, and ascorbic acid
(vitamin C) are a few of the commonly employed antioxidants (2).
Preservatives are similar to antioxidants as they both protect food from spoilage.
Preservatives reduce microbial spoilage. Early methods of preservation include pickling, drying,
or smoking; some still in use today. In the earlier days, rock salt was used to preserve meat.

12
Methods such as canning, which preserve the natural look of food, are in use today. Some of the
basic preservatives in use today are sorbic acid, benzoic acid, and sodium nitrate. Sulphur
dioxide, another preservative, is the most common and help fights bacteria. Development of
preservatives is very delicate. Nitrites that are often used as preservatives can give rise to the
formation of nitrosoamine which is a carcinogen (2, 3).
Emulsifiers and stabilizers are another type of food additive. Many foods contain water
and are immiscible when placed in a lipid medium such as oil. An emulsifier aids in the process
of mixing two immiscible liquids together. A stabilizer helps two immiscible liquids stay in
emulsion. Many natural foods have their own emulsifiers and stabilizers. They can be extracted
from natural foods or synthesized in a laboratory. Sorbitol is an example of an emulsifier (2).
Food color plays a very simple role as a food additive; it adds to the desirable look of
food. Some food will lose color during processing. Food coloring can bring back the color lost
during processing so the food does not look distasteful. Food colorings are compounds with a
system of conjugated multiple bonds. Food colorings also contain nitrogen that can intensify the
color. Color additives are often placed on and taken off the market because of demands or health
concerns. The U.S. list of food colors is somewhat different than that of the U.K.. Some food
colors allowed to be used in the U.S. include amaranth, green, indigo carmine, and red. There
are many coloring agents that are present in nature that bring about the synthesis of carotenoids.
These carotenoids can be found in fruits, berries, and leaves. Anthocyanins are another large
class of compounds also found in fruits and seeds such as paprika and beetroot. Their colors can
differ from bright blue all the way to red. The colors manifested are controlled by the pH of the
compound (2).

13
Sequestrants are similar to antioxidants in preventing the oxidation process. Certain
metals in compounds can act as a catalyst for oxidation; sequestrants simply block this from
occurring. They form complexes with the metals. A good example of a sequestrants is ethylene
diamine tetracetic acid (EDTA) (2, 3).
Anhydrous compounds are anticaking agents. They absorb the moisture in foods
preventing them from clumping. Calcium phosphates, magnesium oxide, and salts of silicic acid
are examples of anticaking agents. Humectants are the opposite of anticaking agents. They are
used to maintain the moisture in a food. Both anticaking agents and humectants pick up the
water. However, while the anticaking agents are used to absorb the water away from foods,
humectants are used to keep water throughout the food (2, 3).
Acids, buffers, and bases can be grouped together as they control the pH in a system.
Buffers are used to stabilize foods at a certain pH level. Acids and bases are used to lower or
raise the pH depending are the targeted sample pH. Vegetables need to be protected against their
natural delicateness. Firming and crisping agents maintains the water pressure that is built up
inside of the food to hold the texture of the vegetable skin. Sweeteners, natural or artificial, are a
very common food additive. Vitamins and minerals are also added into food to add nutritional
value (2, 3).
Natural and Artificial Flavors
A flavor is a sensory result of a substance and is determined from taste and smell (3).
According to the FDA (4), “the term natural flavor or natural flavoring means the essential oil,
oleoresin, essence or extractive, protein hydrolysate, distillate, or any product of roasting,
heating or enzymolysis, which contains the flavoring constituents derived from a spice, fruit or
14
fruit juice, vegetable or vegetable juice, edible yeast, herb, bark, bud, root, leaf or similar plant
material, meat, seafood, poultry, eggs, dairy products, or fermentation products thereof, whose
significant function in food is flavoring rather than nutritional. Natural flavors include the
natural essence or extractives obtained from plants” (4).
Artificial flavors are very different. They are made of many compounds that complement
each other to form the targeted flavor. Artificial flavor is mainly composed of two parts: the
flavor portion and the diluents portion (5). Those components are then divided into further
portions. The flavor portion is composed of the character item, the contributory item, and the
differential item. A character item is the compound and/or compounds that when tasted is
reminiscent of the named flavor. It is the compound that provides the most organoleptic effect.
The character item is essential for the specific flavor. The contributory item is a compound
and/or compounds that when tasted enhance or help to create the named flavor. These
compounds are not reminiscent of the named flavor, but when added to the character item they
bring the character item closer to the named flavor. They are not characteristic but are necessary
to the final flavor. The differential item is the combination of compounds that when added has
no reminiscent factor to the named flavor. Differential items give the flavor its individuality.
They are neither characteristic nor essential to the named flavor. The function of the flavor
portion is to simulate the named flavor, maintain the character, and enhance the flavor (5).
The functions of the diluents portion are to provide a carrier for the coloring, to keep the
flavor principles in the solution, and to act as a strength regulator. It gives the flavor a physical
fixation. It can act as preservatives and prevents chemical reactions from occurring. It is the
vehicle for the presentation of the flavor and it determines the form of the flavor. In the past,
15
natural flavors were hard to duplicate, but as technology became more advanced, the differences
between natural and artificial flavors narrowed a great deal (5).
Flavor analysis and identification of flavors are difficult tasks. Targeted flavor
compounds are often present in parts per million levels, making them very difficult to extract or
detect. There are three complications for flavor chemists: 1) the flavor compounds can consist of
many classes of organic compounds; 2) in each class, there is an array of organic compounds; 3)
the compounds have a very wide range of boiling points (6). Gas chromatography is the best
method available for flavor research because of the low boiling points of the flavor compounds.
Ketones, aldehydes, alcohols, and sulfur compounds are some of the volatiles in the flavor
compounds. However, their concentration will differ in different types of food. Sample
preparations are a very important part to flavor analysis. One must specify the targeted
compounds of interest and then specify a sample preparation method that best suits the
compounds (6).
Only 1500 flavor compounds were known in the 1970s. Today there are over 7000 flavor
compounds that have been identified (7). The use of gas chromatography-olfactometry is an
alternative method for the distinction of flavor compounds. Olfactometry focuses on the aroma
of flavor compounds and uses the human smell as a detector. To sense the flavor compound by
smell, it must be broken apart from the food matrix. Not all volatiles can be sensed by smell (7).
The following are compounds that are detected from various references 7-9. Table 1 is a
compilation of various flavor compounds and their associated flavors/aromas.

Table 1. Flavor
Compound(Reference)
Hydroxymethylfuran (9)
Furanones (7,9)
DMHF (7)
Aldehydes (9)
Ethyl butyrate (7)
Polysulfides (9)
Sotolone (7)
Linalool (7)
Dodecanal (7)
16
Flavor compounds and contributed flavors
Formula Flavor
Sweet
Sweet caramel
Sweet, caramel, fruity
Fruity, green
Juicy, pinapple
Onion
Cotton candy, spice, maple
Floral
Citric,
Flavor
rum-like
Sweet caramel
Sweet, caramel, fruity
Fruity, green
uicy, pinapple-like
Onion
Cotton candy, spice, maple
Floral, citric
Citric, green
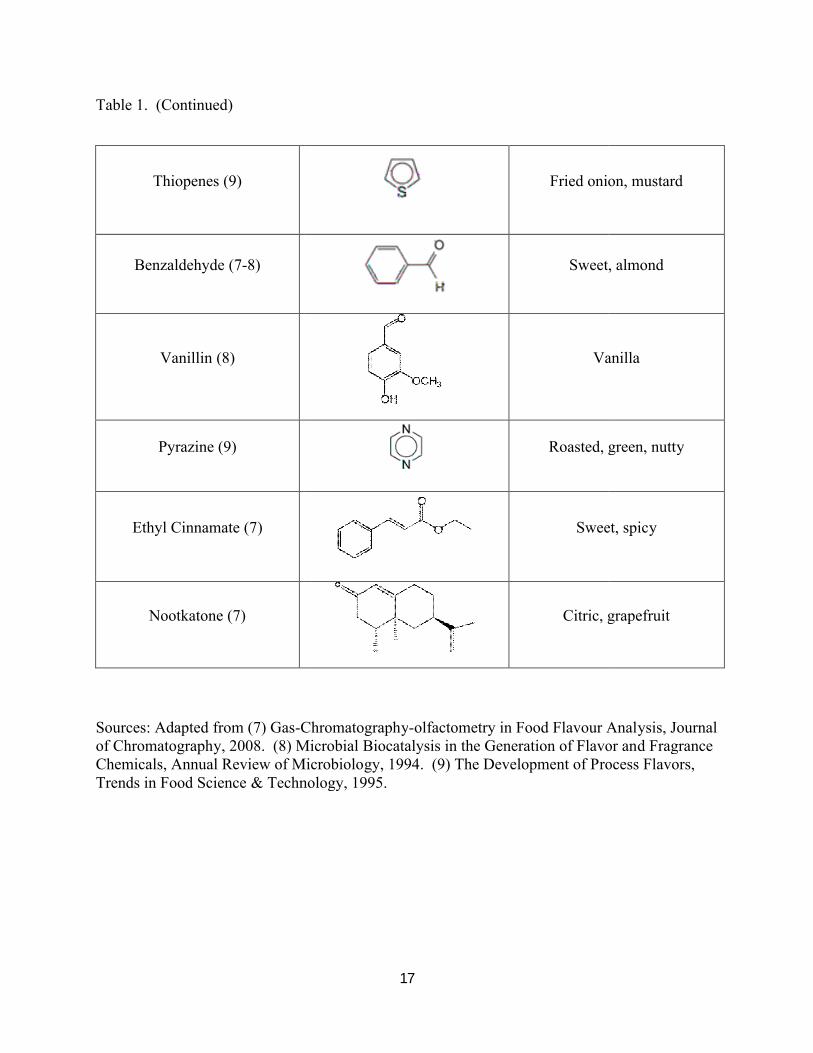
Table 1. (Continued)
Thiopenes (9)
Benzaldehyde (7-8)
Vanillin (8)
Pyrazine (9)
Ethyl Cinnamate (7)
Nootkatone (7)
Sources: Adapted from (7) Gas-Chromatographyof Chromatography, 2008. (8) Microbial Chemicals, Annual Review of Microbiology, 1994Trends in Food Science & Technology, 1995
17
Fried onion, mustard
Sweet, almond
Vanilla
Roasted, green, nutty
Sweet, spicy
Citric, grapefruit
Chromatography-olfactometry in Food Flavour Analysis, Journal ) Microbial Biocatalysis in the Generation of Flavor and Fragrance
Chemicals, Annual Review of Microbiology, 1994. (9) The Development of Process Flavors, ds in Food Science & Technology, 1995.
Fried onion, mustard
Sweet, almond
Vanilla
Roasted, green, nutty
Sweet, spicy
Citric, grapefruit
olfactometry in Food Flavour Analysis, Journal Biocatalysis in the Generation of Flavor and Fragrance
) The Development of Process Flavors,

18
Strawberries
Strawberries can grow wild or domestically. Strawberry is from the family Rosaceae and
from the genus Fragaria. Cultivated strawberries have an increased number of sets of
chromosomes than wild strawberries that provide for larger fruit and higher yield. However,
with increased number of chromosomes, the cultivated strawberries have fewer characteristic
flavor compounds (10). Technically, strawberries are not a fruit but instead are the enlarged
ends of the plant’s stamen, the large receptacles of the flowers of the plant. Strawberries vary
remarkably in size, color, flavor, shape, degree of fertility, and season of ripening. Some may
even vary in their sexual organs. Usually, the flowers appear hermaphroditic in structure and can
function as either male or female (11).
In all parts of the world, strawberries are considered as an elegantly flavored and tasty
fruit. The strawberry name is believed to have been derived from the name strewn berry.
Berries that are strewn among the flowers of the plants were known as strewn berries in earlier
times. The people began to pronounce them as strawberries as straw was used as mulch by
farmers. Strawberries have a history of over 2000 years. Wild strawberries were found in Italy
as long ago as 200 BC. Strawberries cultivated in Europe are also found in Russia, Chile, and
United States. Europeans first found some wild strawberries on the shores of Virginia in 1588.
Indians started cultivating strawberries as early as 1643 in Massachusetts. Strawberries
cultivated in California began in the 1900s, and California grew to be the largest supplier in the
United States. Strawberries were cultivated all over the country beginning in the 1860s. They
were also sometimes used for their medicinal purposes. The roots, fruits, and leaves were used
to make medicine for skin diseases and digestive problems. The berry was used internally to
cure diarrhea. In the 13th century, strawberries were considered an aphrodisiac (11).
19
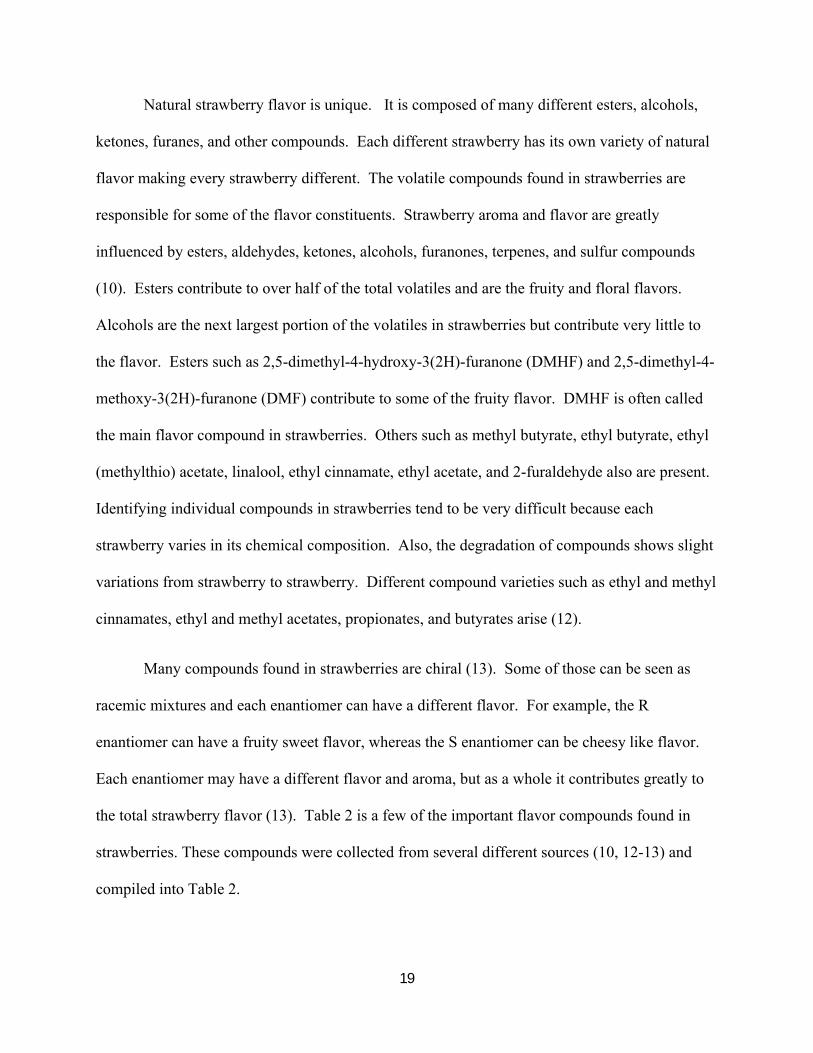
Natural strawberry flavor is unique. It is composed of many different esters, alcohols,
ketones, furanes, and other compounds. Each different strawberry has its own variety of natural
flavor making every strawberry different. The volatile compounds found in strawberries are
responsible for some of the flavor constituents. Strawberry aroma and flavor are greatly
influenced by esters, aldehydes, ketones, alcohols, furanones, terpenes, and sulfur compounds
(10). Esters contribute to over half of the total volatiles and are the fruity and floral flavors.
Alcohols are the next largest portion of the volatiles in strawberries but contribute very little to
the flavor. Esters such as 2,5-dimethyl-4-hydroxy-3(2H)-furanone (DMHF) and 2,5-dimethyl-4-
methoxy-3(2H)-furanone (DMF) contribute to some of the fruity flavor. DMHF is often called
the main flavor compound in strawberries. Others such as methyl butyrate, ethyl butyrate, ethyl
(methylthio) acetate, linalool, ethyl cinnamate, ethyl acetate, and 2-furaldehyde also are present.
Identifying individual compounds in strawberries tend to be very difficult because each
strawberry varies in its chemical composition. Also, the degradation of compounds shows slight
variations from strawberry to strawberry. Different compound varieties such as ethyl and methyl
cinnamates, ethyl and methyl acetates, propionates, and butyrates arise (12).
Many compounds found in strawberries are chiral (13). Some of those can be seen as
racemic mixtures and each enantiomer can have a different flavor. For example, the R
enantiomer can have a fruity sweet flavor, whereas the S enantiomer can be cheesy like flavor.
Each enantiomer may have a different flavor and aroma, but as a whole it contributes greatly to
the total strawberry flavor (13). Table 2 is a few of the important flavor compounds found in
strawberries. These compounds were collected from several different sources (10, 12-13) and
compiled into Table 2.
20
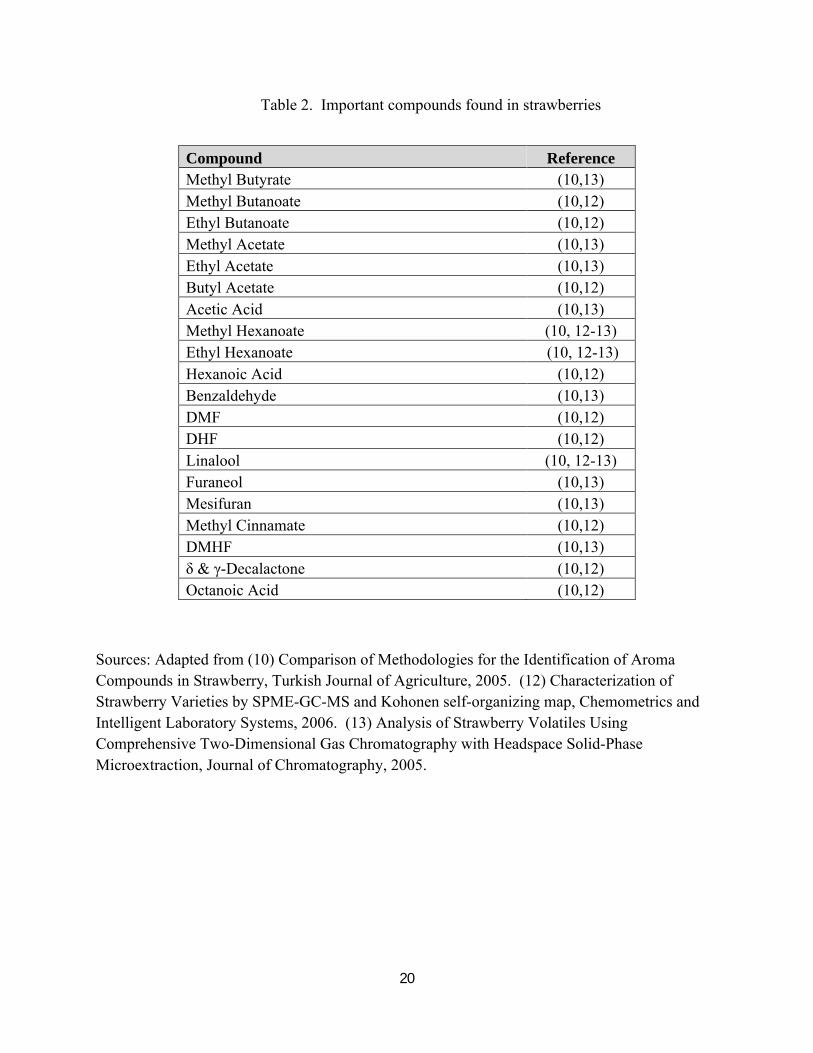
Table 2. Important compounds found in strawberries
Compound ReferenceMethyl Butyrate (10,13)Methyl Butanoate (10,12)Ethyl Butanoate (10,12)Methyl Acetate (10,13)Ethyl Acetate (10,13)Butyl Acetate (10,12)Acetic Acid (10,13)Methyl Hexanoate (10, 12-13)Ethyl Hexanoate (10, 12-13)Hexanoic Acid (10,12)Benzaldehyde (10,13)DMF (10,12)DHF (10,12)Linalool (10, 12-13)Furaneol (10,13)Mesifuran (10,13)Methyl Cinnamate (10,12)DMHF (10,13)δ & γ-Decalactone (10,12)Octanoic Acid (10,12)
Sources: Adapted from (10) Comparison of Methodologies for the Identification of Aroma Compounds in Strawberry, Turkish Journal of Agriculture, 2005. (12) Characterization of Strawberry Varieties by SPME-GC-MS and Kohonen self-organizing map, Chemometrics and Intelligent Laboratory Systems, 2006. (13) Analysis of Strawberry Volatiles Using Comprehensive Two-Dimensional Gas Chromatography with Headspace Solid-Phase Microextraction, Journal of Chromatography, 2005.
21
CHAPTER 2
METHODS OF FLAVOR ANALYSIS
GC/MS Methods
Gas chromatography (GC) is a very useful method for analyzing volatile components of
foods. When combined with mass spectroscopy (MS), it is excellent for the identification of
separated compounds. Combining these two techniques proves to be very useful for chemical
analysis. It also allows a mixture to be analyzed qualitatively and quantitatively. In the
beginning, gas chromatography mass spectroscopy (GCMS) instruments were very bulky and
fragile. As computers advanced and the interface between GC and MS improved, GCMS
became smaller and more practical. The simplification of the instrument and the amount of time
to analyze a sample also improved. Present GCMSs have a library reference already on the
computer to compare and identify compounds in one’s sample. Today GCMS is used in
pharmacological, medical, environmental, forensics, and law enforcement fields (14).
GCMS is composed of two major components: the gas chromatograph and the mass
spectrometer. The GC separates the components while the MS characterizes each of the
compounds individually. The GC employs a capillary column that varies in length, diameter,
film thickness, and stationary phase properties. The mobile phase in GC is some type of gas
such as helium, nitrogen, or hydrogen. The mobile phase carries the sample through the
stationary phase. The stationary phase is a material that can interact with compounds to be
separated selectively. It is placed in a tube called a column. The eluent or mobile phase flows
through the tube over the stationary phase. The stationary and the mobile phase must be
immiscible. The compounds of the sample in the mobile phase interact with the stationary phase

22
and each compound interacts at a different rate. The compounds that interact fast with the
stationary phase elute or exit the column earliest. Usually, the compounds with lower molecular
weights exit first and heavier ones last. Different stationary phases interact with the compounds
differently according to such factors as polarity, chirality, and others. Also, changing the
physical properties (i.e. temperature or pressure) affects how the compounds interact with the
stationary phase. Temperature can affect how fast compounds elute the column. GCMS
instruments house the column in an oven in which you can gradually increase the temperature
(14). Figure 1 is a simplified schematic diagram of a GCMS.
Figure 1. GCMS a simple schematic of a gas chromatograph mass spectrometer. Helium gas is the mobile phase. The injection is a manual injection.
23
Flavor Compounds Extraction Methods
There are many extraction methods available to extract flavors from fruits. Fruits have
trace amounts of flavor constituents. The flavor components are found among the proteins,
water, salts, and carbohydrates. For these reasons, a specific extraction technique is needed for
the particular type of fruit being analyzed. There are many different methods available for flavor
extraction. Liquid/liquid solvent extraction, static headspace sampling, dynamic headspace
sampling, solid-phase microextraction, Soxhlet extraction, supercritical fluid distillation,
simultaneous steam distillation, and molecular distillation are some of the methods to be
discussed. The complexity of different foods makes it difficult to use just one method of
extraction for all. All the methods listed have their own advantages and disadvantages. Sample
preparation is also a planned task. The volatility, solubility, oxidation, and other properties must
be considered when choosing the sample preparation and extraction method of the flavor
constituent. The food matrix of the sample tends to be nonvolatile and polar, whereas the flavor
portion tends to be very volatile and nonpolar. The food matrix is composed of the salts,
proteins, water, and carbohydrates. The flavor constituents that tend to be more volatile contain
terpene hydrocarbons, sulfur compounds, and lipid-derived aldehydes. One must choose the
most suitable extraction and preparation method for the targeted flavor depending on where and
what type of flavor constituent it is (15).
Solvent Liquid/Liquid Extraction
Solvent liquid/liquid extraction is a fairly common and easy way to extract flavors from
samples. The extraction must be carried out using two immiscible liquids, often an organic
solvent and water. A separatory funnel, extraction vessels, or other means are employed to
24
separate the liquids. For instance, water can be used to dissolve the sample and the soluble
compounds will separate from the insoluble compounds. Then some type of organic solvent
such as methylene chloride, methyl tertiary-butyl ether, or pentane/diethyl ether mixtures is
mixed with the water/sample mixture. The two liquids are separated in the container where the
organic solvent now contains the targeted compounds in the sample. The organic phase then can
be used for analysis. Some problems do arise when using this method. The foaming and
emulsification of the sample need to be resolved by using salts or even centrifuging the sample.
Water in the sample can also cause problems in the extraction. It can lead to underrepresentation
in the final analysis along with extraction problems of the sample. For this method, the samples
must be concentrated to prevent the loss of the volatiles (15).
Static Headspace Sampling
Static headspace sampling is another method that is common to volatile compounds
extraction. It is employed by sampling the headspace, the upper gas phase that has collected
above the sample in a sealed vial. The sample can be a liquid, semi-solid, or solid. The sample
is dissolved in a solvent and is kept at constant temperature, pressure, agitation, and other
extraction parameters. As the sample and the headspace reach equilibrium over a period of time,
a gas-tight syringe is used to remove the vapor in the headspace. The gaseous vapor is then
injected into a gas chromatograph for analysis. The static headspace technique allows only the
injection of the volatiles or semi-volatiles, not the nonvolatile compounds. This provides better
analytical representation of the sample than solvent/solvent extraction because the loss of
volatiles is minimized (15, 16).
25
Dynamic Headspace Sampling
Another method for extraction of volatiles is dynamic headspace sampling, also known as
purge and trap sampling. The previous method, static headspace sampling, is simple to perform.
However, dynamic headspace sampling is a more sensitive technique that affords lower detection
limits. The extraction is conducted by passing a gas over the sample. The gas can be helium or
nitrogen. A column of adsorptive material extracts the volatiles as the stream of gas passes
through it. The column is then washed with a solvent to be injected in the GC. Unlike static
headspace sampling, in dynamic headspace sampling the equilibrium between the headspace
vapor and the sample is not reached because the volatiles are purged from the sample. Dynamic
headspace sampling is an effective tool to concentrate and analyze small amounts of volatiles in
a sample (15).
Solid Phase Micro-Extraction (SPME)
Solid phase micro-extraction employs a short length fused silica fiber. This fiber is
coated with an adsorptive material and placed at the end of a syringe. This method also employs
the use of headspace vapor. The fiber adsorbs the volatile compounds in the headspace vapor.
The volatile compounds can be eluted by using HPLC or GCMS. The advantages of using
SPME method are low concentrations, rapid analysis, and solventless extraction. Another
advantage of using SPME method is it can be selective (12).
Soxhlet Extraction
Another method that can be used to extract flavor components of samples is Soxhlet
extraction. It is designed to extract compounds from a solid sample. Originally, Soxhlet
extraction was designed to extract lipids, but it can be used to extract many compounds other
26
than lipids. A sample desired to be extracted is placed into a porous substance similar to a
thimble. This is placed into the main compartment of the Soxhlet extractor. The thimble with
the sample is placed in a refluxing solvent and condenser. As the solvent condenses, it passes
through the porous material and back down to the solvent reservoir. The reservoir is where the
extracted compounds collect. A downside to this extraction method is that the extraction time
can take up to 10 hours. The sample must also be very concentrated to have good results on the
GCMS (15).
Supercritical Fluid Extraction
Supercritical fluid extraction also is a method used to extract compounds from plants.
This method resembles the Soxhlet extraction except that the solvent is in the supercritical state.
One of the solvents that can be used for this extraction method is supercritical carbon dioxide.
The major advantage of the method is that it does not need an organic solvent. The selectivity
can be controlled by varying the density of the carbon dioxide. The compounds in this extraction
have high diffusion coefficients that increase the rate of extraction and lessen degradation of the
solute. Another advantage is the low cost of carbon dioxide. It is also nonflammable and devoid
of oxygen which prevents the sample from any degradation caused by oxidation. A disadvantage
of supercritical fluid extraction is the problem with the fat content of the sample. A sample
cannot have high fat content because the fat can be extracted along with the desired compounds
by this method (15).
Simultaneous Steam Distillation/Extraction
Simultaneous steam distillation/extraction is yet another method for extraction of flavor
compounds. To carry out this procedure, the sample and solvent are placed into a type of

27
glassware used for refluxing. The sample/solvent mixture is usually placed in a type of round
bottom flask. The solvents can be an organic solvent such as methanol or di-ethyl ether. The
sample mixture is then heated up by a sand bath and the vapors escape through a water cooled
tube. The extracted compounds are collected in a flask connected to the water cooled glass tube.
Simultaneous steam distillation/extraction is one of the most common methods used in flavor
extraction. Some disadvantages of steam distillation are that the glassware tends to be very
expensive and delicate. The method itself, when carried out, can also be time consuming. A
highly water soluble sample such as a strawberry will have volatile compounds that are very
difficult to extract with this method. Target compounds that can easily be oxidized and
degraded are also difficult to extract. Even though simultaneous steam distillation/extraction is a
fairly simple procedure to carry out, the disadvantages far outweigh the advantages (15).
Molecular Distillation
Lastly, another method for extraction of flavor compounds is molecular distillation. It is
carried out in a short path distillation apparatus called a Kugel-Rohr apparatus. The method
seems to distill a little faster than steam distillation because of the short path the distillate has to
travel. Also, this reduces the losses of the compound being extracted. This method is used to
extract volatiles of low to medium volatility. It only uses a small amount of sample under high
pressure. Medium to high volatiles are, however, difficult to extract with this method (15).
Flavor Analysis
Research on volatiles has been accomplished extensively. Many studies reported have
used headspace extraction and solid phase micro-extraction. However, there are other methods
of extraction and analysis available. Zellner et al. (7) focused on gas chromatography-
olfactometry analysis in different food flavors. Olfactory analysis uses the human sense of smell
28
as a method of analysis. It uses peaks of interest targeted by the GC and analyzes the volatiles
by human smell. Compounds such as DMHF, acetic acid, hexanal, nonanal, ethyl butyrate, and
methional are found in dairy products. Flavor analysis of coffee found compounds such as
DMHF, vanillian, furanones, and many other complex esters. Zellner et al. (7) focused on
identifying compounds found in many different food products.
In the study conducted by Kafkas et al. (10), HS-SPME and solvent extraction methods
were employed. For the SPME method, strawberries were ground in a food processor and
diluted with NaCl solution. The headspace vapor was immediately adsorbed on a
polydimethysiloxane/divinylbenzene fiber. After 30 min at 65 oC, the fiber coated syringe was
introduced into the GCMS. The solvent extraction method was involved grinding the
strawberries in a food processor with Celite and NaCl. The flavor compounds were then
extracted using tert-butyl methyl ether and shaking for 30 min. This solution was dried with
anhydrous Na2SO4 and evaporated under nitrogen.
For the Kafkas et al. study (10), the GCMS parameters were set as follows. The injector
temperature was set to 250 oC and splitless injection was used. Initial oven temperature was set
at 50 oC for 1 min with a ramp of 4 oC per min up to 200 oC. The detector temperature was set to
280 oC. They reported 10 esters were detected using solvent extraction and up to 32 esters were
found using the SPME method. Esters such as methyl hexanoate, butyl butanoate, isopropyl
butanoate, methyl hexanoate, butyl butanoate, and ethyl heaxanoate were found in all varieties of
strawberries tested. The amount of furanones increased with maturity of the fruit. Amounts of
aldehydes, alcohols, and aromatic compounds varied during the maturity stages.
De Boishebert et al. (12) reported their work using similar GCMS parameters as those
used by Kafkas and coworkers. The samples used were both fresh and frozen strawberries. The
29
SPME method was used in their research along with similar procedures in the Kafkas et al. study
(10). Unlike the prevoius study, this research contains data analysis done by Kohenen self-
organizing map. This map was used to explore different multidimensional sets of data. It
consists of the Kohonen self-organizing map algorithm with two variables, m and n. One
variable, m, is the real strawberry vector while the other variable, n, is the output layer, which is
the Kohonen map, and they form a two-dimensional arrary of neurons. Each neuron stores a
virtual strawberry with chemical components. The end product is a honeycomb structure of the
real strawberry varieties compared against the compounds found in strawberries. This structure
shows all the compounds found in the different strawberry varieties. De Boishebert et al. found
92 different volatiles in several different strawberry varieties.
Williams et al. (13) also used SPME method for the extraction of flavoring compounds in
their study. For the analysis of the strawberries, this study used multi-dimensional gas
chromatography (GC x GC). This type of analysis produces a two-dimensional contour plot.
The method employed the use of four columns. The first dimension couples two columns
together. These columns are enantioselective columns. The third column was the second
dimension. There was also a fourth column between the first and second dimension to focus
more of the volatile compounds for analysis. The data obtained were transferred to a software
program called Transform Software (Fortner Research, Virginia, USA). This produced the two-
dimensional chromatograms. The volatile profiles were used to compare the peak areas for each
variety of strawberry. They also used co-variances matrixes to compare each variety of
strawberry.
Liquid chromatography-mass spectroscopy (LCMS) spectrometric analysis can also be
used to analyze food products. Harrabi et al. (17) used LCMS to find lipids in corn oil.
30
Glycerophospholipid was found in corn oil by this study. Inductively coupled plasma mass
spectroscopy (ICP-MS) can also be used in analyzing food products. Giannenas et al. (18) used
ICP-MS to identify elemental components in different types of eggs. This study identified many
micro minerals such as cobalt, nickel, cadmium, and copper in different types of eggs. High
performance liquid chromatography (HPLC) coupled with a diode array dector (DAD) and
HPLC coupled with MS are other analysis techniques used by Simirgotis et al. (19). This study
focused on the identification of phenolic compounds in papaya fruit. Flavonols and carotenoids
were found in different varieties of papaya fruit.
GCMS analysis tends to be the method of choice when analyzing volatile flavoring
compounds in fruit. Ong et al. (20) used SMPE method and gas chromatography-time-of-flight
mass spectroscopy (GC-TOFMS) to identify volatile compounds in jackfruit. Butyl acetate, 3-
methylbutanoal, isolbutyl isovalerate, acetone, ethanol, and other esters were found in jackfruit.
Several compounds were found at high concentrations in jackfruit. These compounds were ethyl
isovalerate, 3-methylbutyl acetate, 1-butanol, propyl isovalerate, isobutyl isovalerate, 2-methyl-
1-butanol, and butyl isocalerate. Analysis of variance (ANOVA) statistical calculation and
cross-validation were used to confirm the results.
GCMS was used by Kaskoniene et al. (21) to study the volatile compounds in different
varieties of honey. SPME was used to collect the volatiles. Honey has a very complex
composition of volatile compounds. They found that about 100 different compounds could be
detected from the different varieties of honey. Alcohols, ketones, aldehydes, acids, terpenes,
hydrocardons, benzene, and furan compounds were all found in honey. However, only
benzaldehyde and benzenacetaldehyde were found in all 15 varieties. ANOVA statistical
calculation and standard deviations were also applied to compare similarity of the results.
31
SPME and GCMS were used by Riu-Aumatell et al. (22) to analyze volatile compounds
in different fruit juices. A flame ionization dectector (FID) was also used to complete
semiquantitative measurements. Three different types of fruit juices analyzed are apricot, pear,
and peach juice. Apricot juice contained compounds such as ethyl, acetate, and hexyl esters.
Terpeniods, alcohols, and aldehydes were also founds in apricot juices. Hexyl isovalerate,
cinnamaldehyde, α-terpinolene, and α-farnesene were detected in all of the apricot juice samples.
Peach juices contained esters, lactones, terpenoids, and norisoprenoids. However, γ-decalactone
was found in all peach juice samples. Pear juices also contained methyl, ethyl, and acetate
esters, along with alcohols and aldehydes. Hexyl acetate and ethyl 2, 4 (E,Z)-decadienoate were
found in all pear juice samples.
Yang et al. (23) analyzed grape berries by SPME method and GCMS. The grape berries
also had volatile compounds similar to strawberries such as ethyl acetate, ethyl butanoate,
linalool, ethyl benzoate, and other esters. The preparation methods, sample extraction, and
GCMS parameters are also similar to the studies presented by Kafkas et al. and De Boishebert et
al. Yang et al. used different statistical methods from the research by De Boishebert et al. and
Williams et al. They used a one-way ANOVA analysis to compare the volatile concentrations in
different varieties of grapes. Principal component analysis (PCA) was also completed to
compare the clustering in formations of different grape genotypes. Covariance matrixes were
also used to compare differences in the grape varieties. About 60 different volatiles were found
in the grape germplasm including esters, alcohols, aldehydes, carbonyl compounds, and
terpenoids. The main flavor compounds varied from varieties of grape berries.
GC analysis of simultaneous micro steam distillation/solvent extraction for flavor
compounds of cinnamon was studied by Jayatilaka et al. (24). Some of the main component
32
compounds found in cinnamon were linalool, cinnamaldehyde, 3-phenylpropanal, cinnamyl
alcohol, eugenol, benzyl benzoate, α-humulene, calamenene, and coumarin. This study focused
mainly on identifying the compounds present in cinnamon.
Zabetakis et al. (25) studied the biosynthesis of strawberry flavor. They stated that sugar
is the main soluble compound found in strawberries. Sugars are precursors for flavor
compounds and an energy source for the growth of the strawberry. Different types of sugars
such as sucrose, glucose, and fructose are 99 % of the total sugar found in strawberries.
Zabetakis et al. discovered as a strawberry ripens the levels of sugars increase. This increase in
sugars help develops more furanones and other metabolites. Acids can affect the formation of
strawberry flavor. Acids affect the formation of off-flavors that provide some individuality to
strawberry flavor.
Bood et al. (26) also focused on the biosynthesis of strawberry flavor and literature
reviews of present research in their study. This study mentions sugars, esters, and furanones.
Sugars help to balance the amount of acids during the ripening stages. They also tend to increase
as ripening occurs, which can account for the sweet pleasant taste. Esters are one of the main
groups of flavor compounds in strawberries. Bood and co-workers state some of the main esters
identified by GCMS are methyl and ethyl butanoates, ethyl hexanoate, hexyl acetate, and trans-2-
hexenyl acetate. DMHF is a furanone found in strawberry flavor. It is only in trace amounts but
has a large impact on the flavor. It can be found in four different forms such as DMHF-glucose,
mesifuran, DMHF-malonyl-glucoside, and aglycone DMHF.
Modise (27) studied the effect of freezing and thawing on the flavor of strawberries.
Various strawberries were frozen and allowed to thaw for an allotted amount of time. These
samples were analyzed using headspace microextraction. The results show flavor compounds
33
alter significantly after freezing and thawing. Levels of volatile compounds such as
acetaldehyde, hexanal, ethyl acetate, methyl acetate, methyl hexanoate, and hexyl acetate are
increased.
Pfannkoch et al. (28) used a technique that is not commonly employed. They used stir
bar sorptive extraction (SBSE) to extract flavor and fragrance compounds. They aim to
eliminate problems from matrix effects. A Gerstel Twister was used to extract volatile
compounds. This method was a very economical and fast technique. In whiskey analysis, they
eliminated interference from ethanol, surfactants, and emulsifiers. This method proved to be
very useful in extracting volatile compounds.
Hamilton-Kemp et al. (29) focused their studies on identifying compounds found in
strawberry flowers. Strawberry flowers are the leaves attached to the top of the strawberry. This
study employed GCMS to extract the volatile compounds. They employed headspace extraction
to identify volatile compounds. Volatile compounds identified include, but are not limited to,
limonene, benzaldehyde, methyl salicylate, and hexyl acetate.
Wilkes et al. (30) provides different sample preparation techniques for the analysis of
foods. This study provides many sample preparation methods for different analysis techniques
such as direct injection GC, HPLC, headspace GC, distillation GC, and SPME GC analysis. This
study provides many different methods and the most suitable analysis methods for analyzing
different foods.
In conclusion, there are many methods available to extract flavor compounds. Past
research has shown many different extraction and analysis methods. This research focuses on
comparison of flavor compounds between real natural flavor and artificially flavored commercial
products. This proposed research will also focus on scatter plot comparison, correlation
34
coefficients, and Mann-Whitney U Test statistics. One needs to be knowledgeable as to what
type of compound to be extracted, whether it has low or high volatility. Once all the variables
are determined, one can choose the method most suitable for the flavor sample to be extracted.
While solvent extraction and simultaneous steam distillation/extraction are the most commonly
used methods, molecular distillation, dynamic headspace sampling, and static headspace
sampling are good for extracting volatiles. Strawberries have many volatiles; the best method
available is dynamic headspace sampling, static headspace sampling, or solid phase micro-
extraction.
Proposed Research
In Chapter 1, the origins and facts about food and food additives were discussed. Food
additives, mainly flavors, have advanced throughout history. Scientists began to create flavors in
labs and discovered just how each compound contributes to the flavor. Strawberries have over
100 compounds that contribute to their flavor. Commercial products can also include natural or
artificial strawberry flavor. The literature mentions several different methods of extraction
techniques. A simpler flavor extraction method is needed. The cost and availability of the
materials should be within one’s resources. Currently, environmental concerns are also to be
considered. The “greenness” of the analytical procedures and material also become paramount.
Accuracy, precision, relevance to the desired analyte, and the reproducibility of analysis are the
analytical merits one used to assess the usefulness of the method. This research project seeks to
accomplish the following objectives:
1. To establish an economical extraction method.
2. Propose GCMS parameters that best suit the detection of volatile constituents in
strawberries.
35
3. Compare artificial flavored commercial products to real natural strawberry flavor.
4. Apply statistical methodologies for the comparative studies of the natural
strawberry flavor and artificial flavored commercial products.
5. Conclude how similar or dissimilar the natural strawberry flavor and artificial
flavored commercial products are and their value in purchase.
36
CHAPTER 3
EXPERIMENTAL PROCEDURES
Chapter 3 presents all the reagents, samples, standard solutions, instrumentation, and data
analysis used in this project. The preparation of the samples is explained in detail along with the
experimental procedure carried out to analyze them. The parameters of the GCMS along with
the statistical methodologies are explained.
Reagents:
The following reagents are all ACS certified and obtained from Fisher Scientific in
Fairlawn, NJ.
1. Methanol
2. DMHF
3. Ethyl butyrate
4. Ethyl acetate
5. Furfural
Samples Obtained:
1. Fresh California Strawberries distributed by Andrew and Williamson Fresh Produce
in San Diego, CA and bought at Kroger in Johnson City, TN.
2. Driscoll’s Strawberries distributed by Driscoll Strawberry Associates in Dover, FL
and bought at Earth Fare Grocery in Johnson City, TN.
3. Strawberry Fraises distributed by Classy Berry Farms in Plant City, FL and bought at
Food City in Johnson City, TN.
4. Strawberry Gatorade® purchased from Kroger in Johnson City, TN.
37
5. Strawberry Milkshake purchased from Burger King® in Johnson City, TN.
6. Strawberry flavored Aquacal® purchased from Food City in Johnson City, TN.
7. JELL-O® Gelatin Dessert purchased from Kroger in Johnson City, TN.
8. Cool SpashersTM Strawberry Drink Mix purchased from Kroger in Johnson City, TN.
9. Hi-C® Strawberry Drink Box purchased from Food City in Johnson City, TN.
Preparations of Standard Solutions
The following standard solutions were made:
1. DMHF standard solution: 1.0 grams of DMHF was diluted in a 10-mL volumetric flask
with methanol. Then 50 μL of this solution was diluted further in 10-mL volumetric
flask with methanol.
2. Ethyl Butyrate standard solution: 50 μL of ethyl butyrate was diluted using a 10-mL
volumetric flask with methanol.
3. Ethyl Acetate standard solution: 50 μL of ethyl acetate was diluted using 10-mL
volumetric flask with methanol.
4. Furfural standard solution: 50 μL of furfural was diluted using a 10-mL volumetric flask
with methanol.
5. A mixture of the standards was prepared by adding 20 μL of each sample and diluted in a
10-mL volumetric flask with methanol.
6. Each of the standard solutions was prepared and run in the GCMS individually before
running them as a mixture of four standards.

38
Preparation of Natural Strawberry Samples
The available solvents for extraction were hexane, methanol, and acetone. Acetone and
hexane are non-polar and strawberries do not readily dissolve in either. The volatile compounds
found in strawberries are often polar, which dissolve better in methanol. The extraction of
strawberry flavor was carried out as follows:
A few strawberries from each sample (California, Discroll’s, and Fraises) were cleaned of
all contaminants.
Any ruined or damaged sections of the strawberry were cut off.
The strawberries were then strained by a fine mesh strainer and put into separate
containers according to the sample.
About 1.0 g of each strained strawberry sample was weighed out accurately and put into
separate sample beakers.
10 mL of methanol was added to each beaker and stirred on a magnetic stirrer for 30 min.
This mixture was then gravity filtered three times to insure the absence of particles in the
solution.
Preparation of Commercial Product Samples
The preparation of the artificial strawberry flavored commercial products needs to be
similar to that of the natural strawberry samples. This is done to allow valid comparative study.
The commercial products are not of the same composition; therefore, some modification of the
procedure is needed.

39
The Burger King® milkshake was prepared by weighing out 1.116 g of the milkshake
accurately on a balance. This was added to 10 mL of methanol. The mixture was stirred on a
magnetic stirrer for 15 min then gravity filtered three times to ensure the solution was completely
homogeneous and did not contain any small particles that can cause a problem to the GCMS.
The solution was then diluted to 20 mL of methanol and ran on the GCMS two more times.
The Gatorade® sample was prepared by adding 0.52 grams of Gatorade® to 20 mL of
methanol. This mixture was stirred on a magnetic for 15 min and then gravity filtered three
times.
For the JELLO® sample 0.52 g of gelatin powder was added to 20 mL of methanol and
stirred for 15 min on a magnetic stirrer. This solution was gravity filtered three times to ensure
no particulates were in the solution.
Aquacal® sample was prepared by adding 1.06 g of flavored water to 20 mL of methanol
and stirred for 15 min on a magnetic stirrer. This solution was gravity filtered three times to
ensure no particulates were in the solution.
The Cool SplashersTM drink mix was prepared by adding 20 mL of methanol to 0.48 g of
the drink mix. This mixture was stirred on a magnetic for 15 min and then gravity filtered three
times.
The Hi-C® sample was prepared by adding 2.21 g of Hi-C® to 20 mL of methanol. This
mixture was stirred on a magnetic for 15 min and then gravity filtered three times. All samples
had a final volume of 20 mL.

40
Instrumentation
The analyses of commercial products and volatiles of strawberries were conducted on a
Hewlett Packard A model 5890 Series II Gas Chromatograph equipped with a Series 5971 Mass
Selective Detector. The column was a HP5MS with the dimensions of 30.0 m x 0.25 mm, and
0.25 μm film thickness with the temperature tolerance of up to 350 oC. The polar stationary
phase is made up of 5 % phenyl and 95 % dimethyl polysiloxane. The exact parameters were an
important function to the analysis of strawberry flavor. The majority of the compounds of
interest are volatile. Volatile compounds have low boiling points. If the initial temperature is
too high and the temperature ramp is too high/fast, the volatile compounds will be lost in the
spectrum. The MS chromatographs would be very cluttered with adjacent unresolved
compounds. The molecular weight peaks were hard to distinguish with so many different
compounds. The retention times and the standard solutions chromatographs were the main
source of identifying the eluted compounds. Table 3 states the parameters of the GC. Table 4
provides the parameters for the MS.
Each of the standards was chromatographed on the GCMS individually before
analyzed as a mixture of the four standards. The chromatograph with the four standards was
used to identify some compound peaks in the samples. All of the natural strawberry samples and
the artificially flavored commercial products samples to be analyzed were injected in the GCMS
individually. The amount of sample that was injected in the GCMS was 1 μL. All the samples
were run in triplicates.

41
Table 3. HP 5890 GC parameters
Oven
Initial Temperature: 40 oC hold 10 min
Ramp 1: 9 oC/min to 100 oC
Ramp 2: 12oC/min to 180 oC
Run Time: 25.33 min
INLET
Mode: split
Inlet Temperature: 250 oC
Pressure: 21 kPa
Sample Size: 0.1 μL
CAPILLARY COLUMN
Column Length: 30.0 m
Column Diameter: 0.25 mm
Column Film Thickness: 0.25 μm
Presure: 21 kPa
Carrier Gass: Helium
Flow Rate: 1.0 mL/min
Stationary Phase: 5 % phenyl and
95% dimethyl polysiloxane

42
Table 4. HP 5971 Mass Selective Detector parameters
INTERFACE
Type: Capillary Direct Interface
Temperature: 250 oC
TUNE: Atune.u
DATA ACQUISTION
Mode: TIC scan mode
Mass range: Low Mass: 50 amu
High Mass: 550 amu
SOLVENT DELAY: 2 min
MS ZONES
MS Quadrupole Temp: 150 oC, max 200 oC
MS Source: 250 oC, max 325 oC
43
Data Analysis
All the samples including both the natural strawberry flavor samples and the artificially
flavored commercial products were analyzed on the GCMS. Each sample was injected in
triplicate. The retention times collected from the chromatographs of each sample were then
edited using Microsoft® Office Excel 2007 Software. The retention times were input in Excel in
individual columns per sample. The standard deviation and relative standard deviation of the
correlations were calculated in Excel for each sample column. The retention times of all
compounds of each sample were compared against each other for calculating the correlation
coefficients. The test was performed by highlighting the retentions times of the targeted samples
then clicking MORE FUNCTIONS, STATISTICAL, and then STDEV.
The data input into Excel was copied and pasted into the SPSS Statistical Software.
Scatter plots of the samples were plotted using SPSS Statistical Software. The selected retention
times of the compounds found in all the real strawberry samples were averaged and compared to
those of the commercial products. Each of the averaged retention times of the compounds in the
samples was compared against those of the strawberry standard and plotted. The scatter plots
were plotted by clicking GRAPHS, SCATTER, OVERLAY, and DESIGN. Next, define the X-
Y variable pairs and click OK.
The Pearson’s correlations coefficients of the commercial samples with the real
strawberry samples were calculated also using the SPSS Statistical Software. The correlations
were calculated by clicking ANALYSE, CORRELATE, and then BIVARIATE. In the
correlation window, the next process is to click the Pearson correlation and select the variables to
correlate.

44
The Mann-Whitney U Test was performed in SPSS Statistical Software by using the
same data as the Pearson’s correlation coefficients. This non-parametric test is to examine if two
independent samples do come from the same distribution. Two samples have to be independent
and the observations must be continuous measurements. It is to test if the null hypothesis that
the commercial products are indeed similar to the natural strawberry flavor can be confirmed or
rejected. If α < 0.05 then the null hypothesis can be rejected; i.e. the commercial product is not
similar to the natural strawberry sample. The Mann-Whitney U is calculated by
. For large samples, the U value is approximately normally
distributed. The approximated value is where mU and σU are the mean and standard deviation of U.
The mU and σU are given by , where and
. The retention times of the selected major compounds in the natural
strawberry samples were averaged and used as the referenced retention times of the natural
strawberry sample used for the Mann-Whitney U Test. The significance for the Mann-Whitney
U Test is calculated by clicking ANALYZE, NON-PARAMETRIC TEST, and 2
INDEPENTDENT SAMPLES. In the Mann-Whitney U window, select the variables then click
OK.
45
CHAPTER 4
RESULTS AND DISCUSSION
Visual Inspection of GCMS Chromatograms
The samples extracted were injected into the GCMS to obtain the chromatographic data.
The data of peak areas versus retention times were subjected to different statistical analysis to
obtain results from which conclusions can be drawn to evaluate the attainment of research goals.
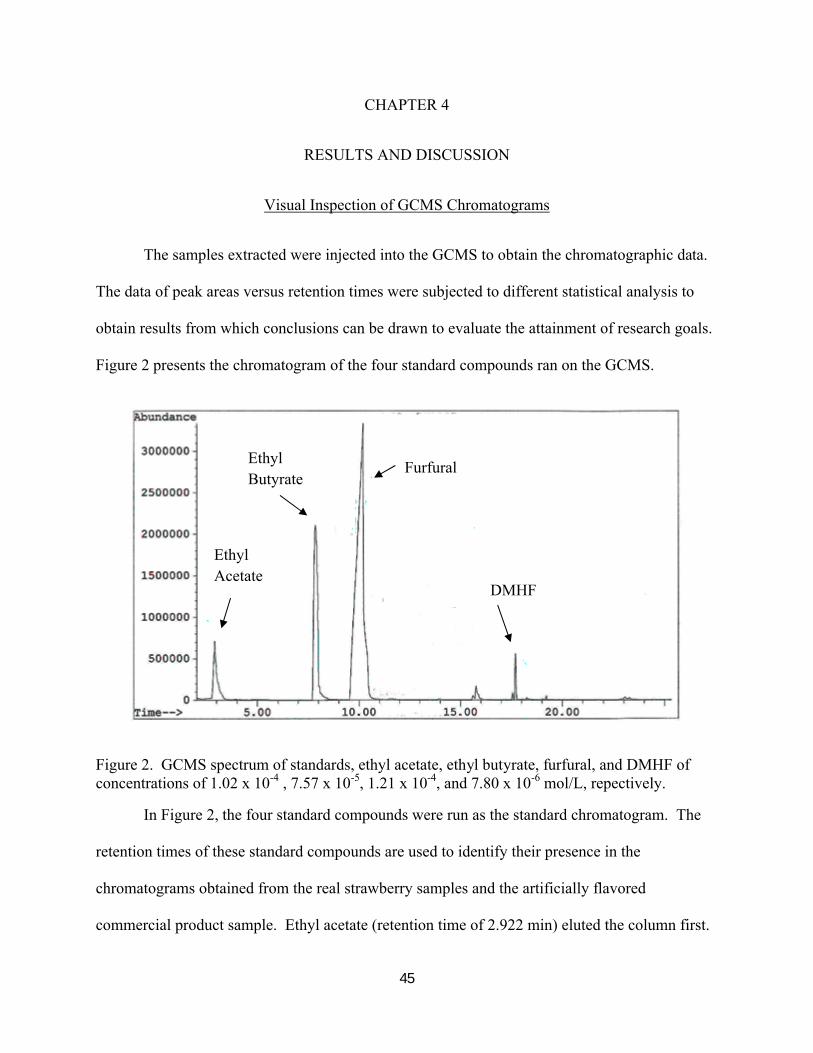
Figure 2 presents the chromatogram of the four standard compounds ran on the GCMS.
Figure 2. GCMS spectrum of standards, ethyl acetate, ethyl butyrate, furfural, and DMHF of concentrations of 1.02 x 10⁻⁴ , 7.57 x 10⁻⁵, 1.21 x 10⁻⁴, and 7.80 x 10⁻⁶ mol/L, repectively.
In Figure 2, the four standard compounds were run as the standard chromatogram. The
retention times of these standard compounds are used to identify their presence in the
chromatograms obtained from the real strawberry samples and the artificially flavored
commercial product sample. Ethyl acetate (retention time of 2.922 min) eluted the column first.
Ethyl Acetate
Ethyl Butyrate
Furfural
DMHF

46
Ethyl butyrate, furfural, and DMHF eluted the column next with retention times of 7.855 min,
10.180 min, and 17.713 min, respectively. They eluted almost in the order of molar mass and
polarity. This chromatogram was used as a visual comparison to the peaks in other samples.
Figure 3, 4, and 5 are the GCMS chromatograms of the three real strawberry samples
used in this study.
Figure 3. GCMS spectrum of California strawberry sample of concentration of 0.1 g/mL. The only standard compound found, based on retention time, was ethyl butyrate.
In Figure 3, one can see that in natural strawberry, there are many compounds present.
Some of those compounds are responsible for the unique flavor of the California strawberry.
Some are other compounds which may be vitamins, antioxidants, and so on. Based on the
retention times of the standards, one can only find the probable presence of ethyl butyrate
(retention time of 7.855 min) in this sample. The other peaks are not identifiable. The
deficiency in the standard compounds available, and the shortcoming of the MS library file does
Ethyl Butyrate

47
Figure 4. GCMS spectrum of Driscoll’s strawberry sample of concentration of 0.1 g/mL. No standards were found in the sample.
Figure 5. GCMS spectrum of strawberry Fraises sample of concentration of 0.1 g/mL. Three standard compounds that were found in this sample are ethyl acetate, furfural, and DMHF, based on the retention times.
Ethyl Acetate
Furfural DMHF

48
not allow one to identify any of the peaks unless they have the same retention times as those of
the four standards available.
Figure 4 is the chromatogram of the Driscoll’s Strawberry sample. The Driscoll’s
Strawberry sample has many compounds. However, none of the standard compounds are
positively identified in this sample. Identification of the compounds in the Figure 4
chromatogram, based on the retention times of the standards, proved to be difficult. The
identification of the compounds in the Driscoll’s Strawberry sample may have been possible if
one has an extensive MS library file for the instrument.
In Figure 5, one can see again that the natural strawberry sample chromatogram is
complex and made up of many compounds. In the Strawberry Fraises sample chromatogram,
three of the four standard compounds are found. These are ethyl acetate, furfural, and DMHF.
The retention times of these standards are 2.922 min, 10.180 min, and 17.713 min, respectively.
The peaks identified are prominent single peaks and matched the retention times of the standard
compounds. As one can see, natural flavors are very complex and have many compounds that
make up a flavor.
Figures 6 and 7 are chromatograms of the Burger King® Milkshake sample and the
Gatorade® sample. Artificially flavored commercial products have many compounds present
other than flavoring compounds. Identifying the standard flavoring compounds that are available
proved to be a difficult task.
49
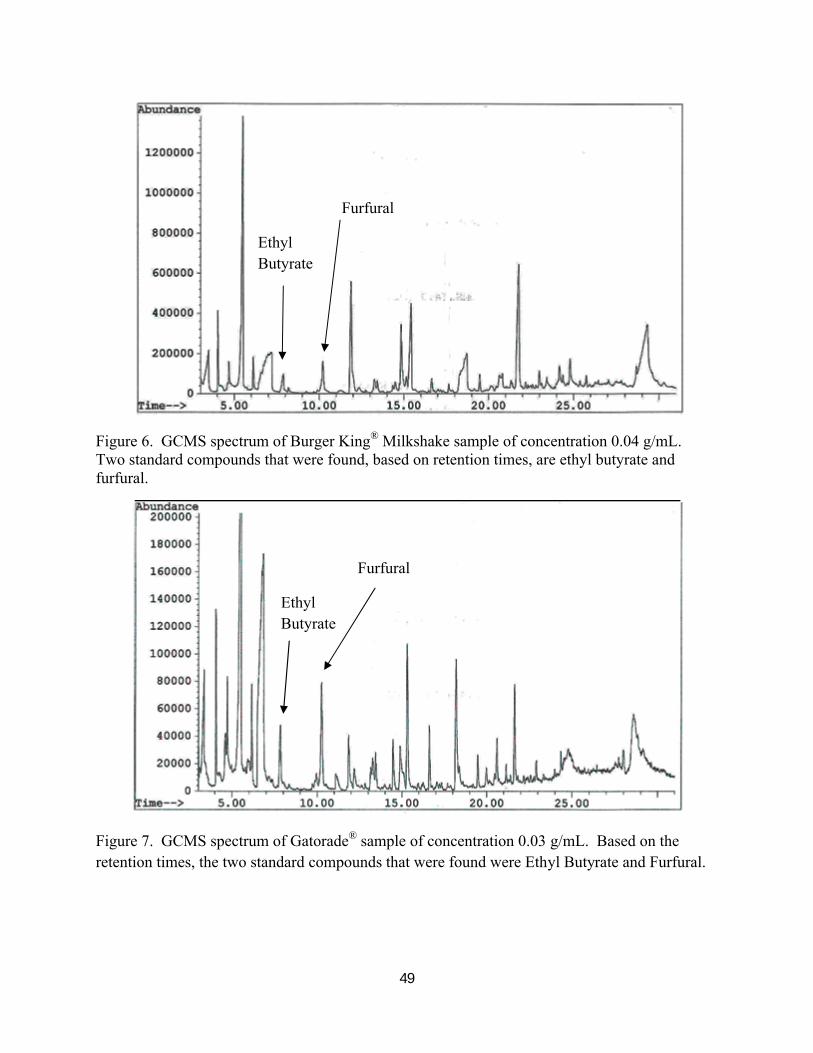
Figure 6. GCMS spectrum of Burger King® Milkshake sample of concentration 0.04 g/mL.Two standard compounds that were found, based on retention times, are ethyl butyrate and furfural.
Figure 7. GCMS spectrum of Gatorade® sample of concentration 0.03 g/mL. Based on the retention times, the two standard compounds that were found were Ethyl Butyrate and Furfural.
Ethyl Butyrate
Furfural
Ethyl Butyrate
Furfural
50
The Burger King® Milkshake sample chromatogram shown in Figure 6 contains many
peaks. A visual comparison proved that this sample in many ways is similar to the real
strawberry. One can see that the Burger King® Milkshake sample and natural strawberry sample
chromatograms have similar numbers of peaks. Based on the retention times, ethyl butyrate
(retention time of 7.855 min) and furfural (retention time of 10.180 min) are found in this
sample. These standards are identified by using the retention times of peaks from the sample and
comparing them against the retention times of the standard compounds. This visual comparison
of the chromatograms obtained shows that the Burger King® Milkshake sample is the closest in
similarity to that of a natural strawberry chromatogram. The result thus indicated that the Burger
King® Milkshake most likely contains the real natural strawberry of some form. Also the taste of
the products by actually eating them seems to collaborate the findings from GCMS. It might
also be due to the nature of the product. It is far easier to mix in the real strawberry or some
version of the real strawberry into the product than to extract flavor compounds.
The chromatogram of Gatorade® sample shown in Figure 7 shows that it is also quite
similar to that of the natural strawberry. Two standards that may be present in this sample, as
indicated by the retention times, are ethyl butyrate (7.855 min) and furfural (10.180 min). With
the availability of compounds spectral library software, the identification of more compounds
may have been possible.
The chromatogram of the Hi-C® sample shown in Figure 8 is found to be also very
similar to the chromatograms of the natural strawberry samples. This commercial product most
likely has the most prominent flavor compounds of the natural strawberries present. The taste
also resembled that of the natural strawberry. In addition, ethyl butyrate (7.855 min), furfural
(10.180 min), and DMHF (17.713 min) seem to be present in the sample.

51
Figure 8. GCMS spectrum of Hi-C® sample of concentration 0.11 g/mL. Ethyl Butyrate, Furfural, and DMHF were found in this sample based on the retention times.
Thus visual inspection of the chromatograms of the natural strawberries, Burger King®
Milkshake, Gatorade®, and Hi-C® leads one to believe that these three products do indeed have
similar features to that of the natural strawberry.
Figures 9, 10, and 11 are commercial products of JELL-O®, Aquacal®, and Cool
SplashersTM that seem to be the least similar to real strawberry flavor. As one can see from these
figures, the chromatograms of these samples are much simpler than those of the natural
strawberries and also those of Burger King® Milkshake, Gatorade®, and Hi-C®. This observation
shows that these products contain only one or at most only a few of the prominent “strawberry”
flavor compounds. The strawberry flavor of these products is definitely not from the natural
source or extract of the natural source. Some of the peaks of these samples may have come from
other additives such as dyes or vitamins. None of these commercial products seem to have the
four standard compounds that were included in this project.
Ethyl Butyrate Furfural
DMHF
52
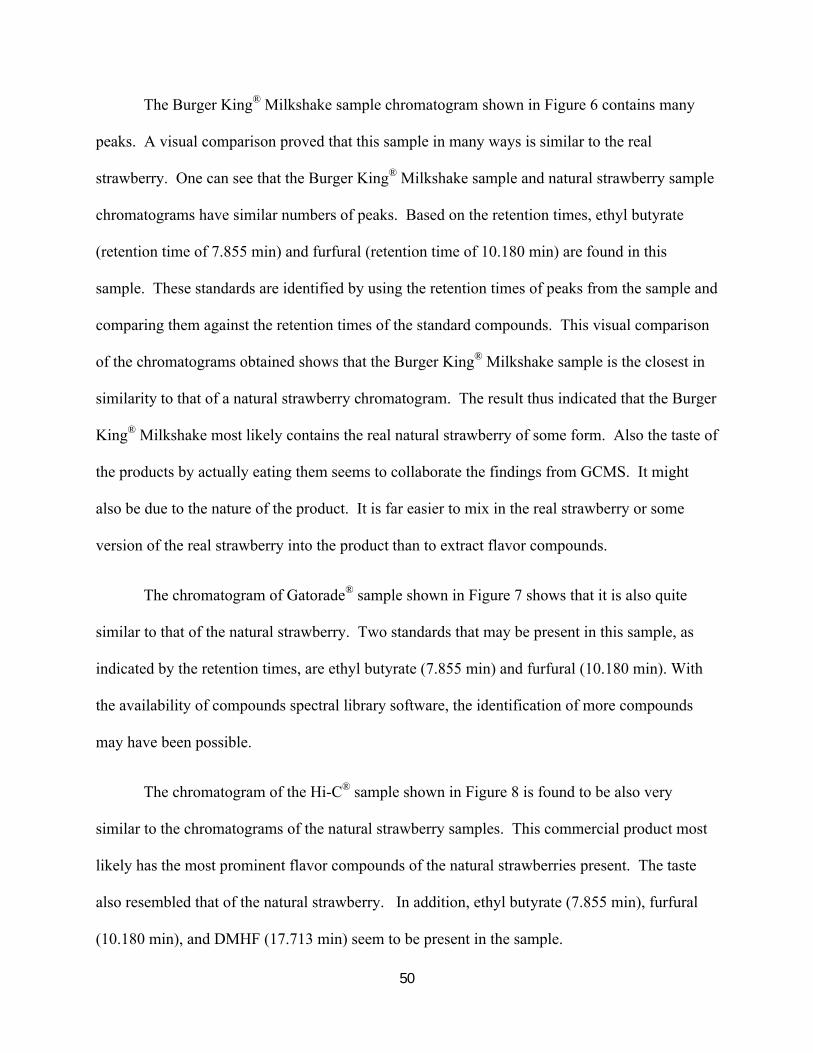
Figure 9. GCMS spectrum of JELL-O® sample of concentration 0.03 g/mL. No standard compounds were found in this sample.
Figure 10. GCMS spectrum of Aquacal® sample of concentration 0.05 g/mL. No standard compounds were found in this sample.

53
Figure 11. GCMS spectrum of Cool SplashersTM sample of concentration 0.02 g/mL. No standard compounds were found in this sample.
Figure 9 is the chromatogram of the artificially flavored JELL-O® sample. Taste testing
also confirmed it is not characteristic of the natural strawberry flavor but only minimally
resembles it. Flavoring compounds may not be the main components of the sample. Figure 10
represents the chromatogram of the Aquacal® sample. The Aquacal® sample has the fewest
number of compounds as indicated by the very few peaks in the chromatogram. It is the most
remote from the natural strawberry. It only has a couple of peaks showing that its flavor most
likely comes from trace amounts of only one or two of the synthetic form of the main flavor
compound of strawberries. The flavoring components in the Aquacal® sample were not the main
component in this commercial product. The chromatogram of the Cool SplashersTM sample is
represented in Figure 11. One can see, as a visual comparison, the Cool SplashersTM sample
chromatogram is hardly similar to the natural strawberry sample chromatogram. The taste of the
product also supports the findings that the Cool SplashersTM is not the same as that of the natural

54
strawberry. The taste of the sample resembles more of a fruity taste. The compounds in this
sample include other components along with flavoring compounds. The flavoring compounds
may only be present in trace amounts.
Scatter Plot Study
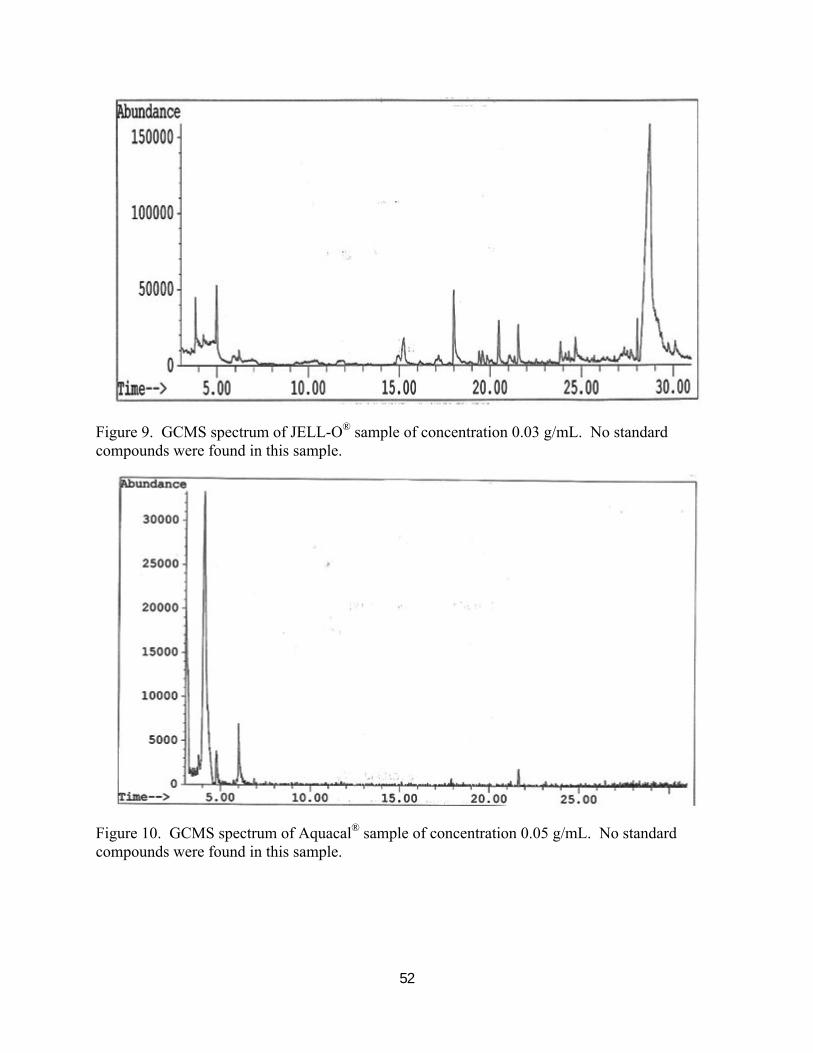
A scatter plot is a good visual aid to compare how similar the samples are to each other.
Figures 12 and 13 are the scatter plots of the averaged retention times of the compounds found in
the artificially flavored commercial products against those of the natural strawberry flavor
samples. Figure 12 is the combined scatter plot showing the Burger King® Milkshake,
Gatorade®, and JELL-O® samples against that of the natural strawberry sample. Figure 12
shows that the Burger King® Milkshake sample pattern is virtually superimposable on top of the
strawberry sample. This means that the milkshake sample is very similar to that of the natural
strawberry. Such also is the case with the Gatorade® sample. It follows very closely along the
natural strawberry pattern. However, the chromatogram of the Gatorade® sample is not as close
as the chromatogram of the Burger King® milkshake sample to that of the natural strawberry
sample as can be discerned from the scatter plot of Figure 12. There are more deviations of its
chromatogram from that of the natural strawberry at the longer averaged retention times.
However, the chromatogram of the JELL-O® sample does not track that of the natural strawberry
well at all. Except for the first few peaks, the rest of the chromatograms deviate greatly from
that of the natural strawberry. The averaged retention times fall to the far right of the scatter
plot. From this scatter plot, one can conclude that the synthetic flavor compounds used in the
JELL-O® are only a very small subset of that of the natural strawberry. Another observation is
that the flavor compounds in strawberries are those with earlier retention times. This is
reasonable as most flavor compounds are quite volatile or of lower boiling points.

55
Figure 12. Scatter plot of real strawberry averaged retention times compared to those of the commercial products. Each of the averaged retention times of the samples was compared againstthose of the strawberry standard and plotted.
Figure 13 shows that the averaged retention times of the compounds in the Hi-C® sample
track that of the compounds in natural strawberry sample somewhat closely, albeit not right on
top of each other as in the case of the Burger King® milkshake sample. As for the Cool
SplashersTM, only two peaks seem to be somewhat similar to those of the natural strawberry
sample. The rest of the chromatogram is very different from that of the natural strawberry
indicating that, again, just as is the case of the JELL-O® sample, the product contains only a
minor subset of the natural strawberry flavor compounds. As for the Aquacal®, there were only a
Strawberry
Burger King®
MilkshakeGatorade®
JELL-O®
56
few peaks in its chromatogram, so few in fact, that it is not possible to include its chromatogram
in the scatter plot. This means that Aquacal® does not have much, if any, of the flavor
compounds of the natural strawberry.
Figure 13. Scatter plot of real strawberry averaged retention times compared to those of the commercial products. Each of the averaged retention times of the samples was compared against those of the strawberry standard and plotted.
Strawberry
Hi-C®
Cool SplashersTM

57
Statistical Methods
Tables 5 and 6 are the correlation coefficients of the retention times of compounds in the
strawberry samples and those of the commercial products. The coefficients that are closer to
1.00 represent the largest similarity to each other.
Table 5. Correlation coefficients of the different natural strawberry samples obtained from GCMS data
A1 A2 A3 B1 B2 B3 C1 C2 C3A1 r2 1 0.88 0.97 0.99 0.94 0.93 0.97 0.44 0.94
RSD 0 5.3 5.3 4.2 4.2 4.2 36.2 36.2 36.2A2 r2 0.88 1 0.96 0.85 0.97 0.98 0.95 0.62 0.91
RSD 5.3 0 5.3 4.2 4.2 4.2 36.2 36.2 36.2A3 r2 0.97 0.96 1 0.97 0.99 0.99 0.99 0.65 0.99
RSD 5.3 5.3 0 4.2 4.2 4.2 36.2 36.2 36.2B1 r2 0.99 0.85 0.97 1 0.95 0.94 0.96 0.34 0.95
RSD 4.2 4.2 4.2 0 3.4 3.4 37.2 37.2 37.2B2 r2 0.94 0.97 0.99 0.95 1 1.00 0.99 0.64 0.98
RSD 4.2 4.2 4.2 3.4 0 3.4 37.2 37.2 37.2B3 r2 0.93 0.98 0.99 0.94 1.00 1 0.99 0.64 0.98
RSD 4.2 4.2 4.2 3.4 3.4 0 37.2 37.2 37.2C1 r2 0.97 0.95 0.99 0.96 0.99 0.99 1 0.57 0.98
RSD 36.2 36.2 36.2 37.2 37.2 37.2 0 15.3 15.3C2 r2 0.44 0.62 0.65 0.34 0.64 0.64 0.57 1 0.44
RSD 36.2 36.2 36.2 37.2 37.2 37.2 15.3 0 15.3C3 r2 0.94 0.91 0.99 0.95 0.98 0.98 0.98 0.44 1
RSD 36.2 36.2 36.2 37.2 37.2 37.2 15.3 15.3 0A = California Strawberry SampleB = Driscoll’s Strawberry SampleC = Strawberry Fraises SampleNumber behind these letters are the trial number
Table 5 is the correlation coefficients and relative standard deviations of the retention
times of the different natural strawberry samples compared with each other. As shown in Table
5, the correlation coefficients between Driscoll’s Strawberry and California Strawberry samples
are close to 1.00. The correlation coefficients are 0.85 and higher between all trials of

58
California, Driscoll’s, and Fraises Strawberry samples. However, trial 2 of the Strawberry
Fraises sample has lower correlation coefficients that do not follow the other results. Other than
that one exception of trial 2 in the Strawberry Fraises sample, all trials are in relatively close
agreement.
Table 6 lists the correlation coefficients and relative standard deviations of the
commercial products’ retention times compared against the natural strawberry sample retention
times.
Table 6. Correlations coefficients between the natural strawberry samples and the commercial samples
A B C D E F GA r2 1 0.97 0.87 0.81 0 0.83 0.98
RSD 0 0.0 40.4 14.6 0 8.0 9.4B r2 0.97 1 0.95 0.89 0 0.87 0.99
RSD 0.0 0 106.0 16.2 0 8.8 10.7C r2 0.87 0.95 1 0.72 0 0.72 0.98
RSD 40.4 106.0 0 15.8 0 8.4 10.3D r2 0.81 0.89 0.72 1 0 0.86 0.86
RSD 14.6 16.2 15.8 0 0 14.8 14.7E r2 0 0 0 0 1 0 0
RSD 0 0 0 0 0 0 0F r2 0.83 0.87 0.72 0.86 0 1 0.86
RSD 8.0 8.8 8.4 14.8 0 0 10.5G r2 0.98 0.99 0.98 0.86 0 0.86 1
RSD 9.4 10.7 10.3 14.7 0 10.5 0A = Strawberry SampleB = Burger King® SampleC = Gatorade® SampleD = JELL-O® SampleE = Aquacal® SampleF = Cool SplashersTM SampleG = Hi-C® Sample
The Hi-C® sample had the highest correlation coefficient of 0.98 with the natural
strawberry sample. Based on the correlation coefficients, the Hi-C® sample is the most similar to

59
the natural strawberry sample. The correlation coefficients of the Burger King® Milkshake
sample and the Gatorade® sample with the natural strawberry sample are also very high. Those
coefficients are 0.97 and 0.87 respectively. One can see from Table 6, the Burger King®
milkshake, Gatorade®, and Hi-C® samples have the highest correlation coefficients and their
chromatograms have the greatest number of peaks in common to those of the natural strawberry
sample. These commercial products may contain actual flavoring compounds found in natural
strawberries.
Using visual and statistical comparisons, Cool SplashersTM and JELL-O® samples were
not very similar to the natural strawberry samples. However, the correlation coefficients of these
two samples with the strawberry sample are relatively high. Cool SplashersTM sample has a
correlation coefficient of 0.83. While the JELL-O® sample has the lowest correlation coefficient
of 0.81, it has few numbers of comparable peaks to the natural strawberry flavor. This result was
surprising because other comparative studies done in this project showed that these samples
should have lower correlation coefficients. The Aquacal® sample has very few peaks in the
chromatogram. As mentioned earlier, the Aquacal® sample does not have many flavoring
compounds if any at all. Its correlation coefficient could not be calculated because its
chromatogram has so few peaks. As seen by the correlation coefficients, Cool SplashersTM,
JELL-O®, and Aquacal® samples are not that similar to the natural strawberry flavor. These
samples contain only few flavoring compounds reminiscent of the natural strawberry.
Mann-Whitney U Test determines whether two independent samples come from the same
distribution. A null hypothesis is determined and the Mann-Whitney U Test analyzes whether to
confirm or reject the null hypothesis. For this research project, the null hypothesis is: that the
artificially flavored commercial products are similar to the natural strawberry flavored samples.

60
If the significance value or α is less than 0.05 the null hypothesis is rejected. If it is greater than
0.05 then the null hypothesis is confirmed and the samples are similar in some way. Table 7 is
the Mann-Whitney U Test results. The significance in the order of most similar to the natural
strawberry flavor are in agreement with the correlation coefficient findings with the exception of
the Cool SplashersTM and Hi-C® samples. The significance for the Cool SplashersTM sample is
0.268 and the null hypothesis is confirmed that is the chromatogram of the sample is similar to
that of the natural strawberry. Burger King® Milkshake has the next highest significance of
0.209. The higher significance values mean the samples are more similar to the natural
strawberry sample. The significance values for the Gatorade® and Hi-C® samples are 0.080 and
0.070 respectively. These value indicate that the Cool SplashersTM, Burger King® Milkshake,
Gatorade®, and Hi-C® samples may be similar to the natural strawberry flavor because the null
hypothesis is confirmed. For the JELL-O® sample data, the significance value of 0.019 was
obtained while the Aquacal® has a significance value of 0.038. For both of these samples, the
null hypothesis is rejected which concludes these samples are not similar to the natural
strawberry sample. Mann-Whitney U Test is an excellent statistical method to test if two
independent samples are indeed similar or dissimilar. However, the Mann-Whitney U Test may
not be useful in determining the magnitude of similarity based on the findings in this study.
Other than the result of the Cool SplashersTM, the overall results of the Mann-Whitney U Tests
track those of the pattern plots and correlation coefficient values very well indeed. This leads me
to have a greater confidence in the conclusions to be made for the project.
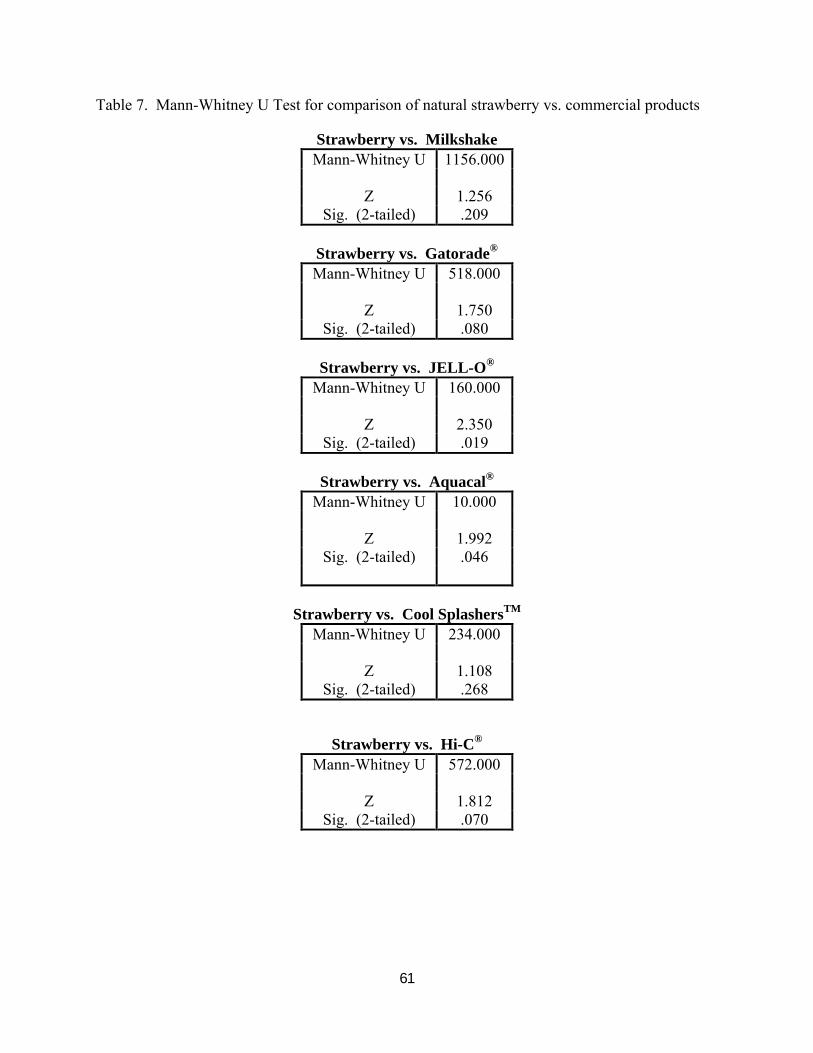
61
Table 7. Mann-Whitney U Test for comparison of natural strawberry vs. commercial products
Strawberry vs. Milkshake
Strawberry vs. Gatorade®
Mann-Whitney U 518.000
Z 1.750Sig. (2-tailed) .080
Strawberry vs. JELL-O®
Mann-Whitney U 160.000
Z 2.350Sig. (2-tailed) .019
Strawberry vs. Aquacal®
Mann-Whitney U 10.000
Z 1.992Sig. (2-tailed) .046
Strawberry vs. Cool SplashersTM
Mann-Whitney U 234.000
Z 1.108Sig. (2-tailed) .268
Strawberry vs. Hi-C®
Mann-Whitney U 572.000
Z 1.812Sig. (2-tailed) .070
Mann-Whitney U 1156.000
Z 1.256Sig. (2-tailed) .209
62
CHAPTER 5
CONCLUSIONS
Flavors and their contents in useful herbs and plants have long been studied and
researched. This chapter provides a summary of the research project conducted in extracting
flavor compounds of strawberry and those present in commercial products and the procedure to
separate these compounds on GCMS. This chapter also summarizes the results obtained by the
different methodologies used for comparing the components found in the studied samples.
Food production processes have come a long way as they have undergone changes
throughout history. Fruits, seeds, and cereal foods were a main source of food about 30,000
years ago. Today the content and make-up of food is a very important aspect of food production.
Food additives are also new and important components of food. They are added during the
production or processing of a food to serve a purpose in the final product. They can be
intentionally and incidentally added to the food and can also be natural or lab synthesized.
Antioxidants, preservatives, emulsifiers and stabilizers, food colors, flavors, sequestrants, and
anticaking agents are some food additives. Along with others such as acids, buffers, and bases,
humectants, firming and crisping agents, sweeteners, enzymes, nutritive additives, and flour and
bread additives are also food additives. Each of these additives serves a purpose in the final food
product.
Natural and Artificial flavors are common food additives used. A flavor is a sensory
result of a substance and is determined from taste and smell. Flavor can be extracted from a
natural substance or created in a lab with a distinct purpose. Artificial flavors are made from
many different compounds that work together to form the targeted flavor. Many flavor
63
compounds consist of esters, ketones, and aldehydes. Flavors whether artificial or natural tend to
be very volatile and have low boiling points. The flavor constituents in foods have very low
concentrations in parts per billion. To extract such compounds, the method for extraction should
be carefully chosen.
This research is focused on the flavor constituents of strawberries compared to the
compounds found in selected commercial products. Strawberries are often cultivated but are also
found in the wild. Strawberry is from the family Rosaceae and from the genus Fragaria.
Strawberries vary remarkably in size, color, flavor, shape, degree of fertility, and season of
ripening. They are often considered a delicacy and tasty fruit. The flavor of a strawberry is quite
remarkable. It is composed of many compounds with the majority of those being volatile.
Strawberry flavor consists of many esters, aldehydes, ketones, alcohols, furanones, terpenes, and
sulfur compounds. The majority of the compounds are esters. 2,5-dimethyl-4-hydroxy-3(2H)-
furanone (DMHF) and 2,5-dimethyl-4-methoxy-3(2H)-furanone (DMF) are esters that contribute
to some of the fruity flavor. DMHF is often called the main flavor compound in strawberries.
Others such as methyl butyrate, ethyl butyrate, ethyl (methylthio) acetate, linalool, ethyl
cinnamate, ethyl acetate, and 2-furaldehyde also are present.
Extracting flavor compounds is very difficult. An extraction method should be chosen
based upon the type of compound to be extracted. For strawberry flavor, the flavor constituents
tend to be volatile. Gas chromatography mass spectroscopy is usually the method of choice for
studying strawberry flavor. Static headspace sampling and dynamic headspace sampling
methods are common extraction procedures reported in many literature articles referenced.
These methods allow only the semi-volatiles and volatiles to be injected into the GCMS.
Simultaneous steam distillation/extraction is also a common method for flavor extraction.
64
However, volatile compounds are often hard to extract with this procedure. The goal of this
research is to evaluate an extraction procedure that is simple, economical, and practical. The
procedure would allow analysis of strawberry flavor with limited resources. In this research
strawberry samples were strained using a fine metal strainer and dissolved in methanol. This
mixture was gravity filtered multiple times then injected into the GCMS. A similar procedure
was used to extract flavor compounds from the commercial products. The proposed procedure is
proven acceptable and satisfactory from the data obtained.
Results showed that the GCMS chromatograms of some of the commercial products are
very similar to those of the natural strawberry flavor. Burger King® milkshake, Gatorade®, and
Hi-C® are the products most similar to the natural strawberry flavor. This conclusion is obtained
from various ways of analyzing the data from the experiments performed. These methods
include scatter plots, correlation coefficients, and the Mann-Whitney U test.
The correlation coefficients for those three samples are 0.97, 0.87, and 0.98 respectively.
These correlation coefficients of the commercial products samples are the highest of all samples
tested. From these calculated correlation coefficients, the Hi-C® product has the greatest
similarity to that of the natural strawberry. Cool SplashersTM has a correlation coefficient of
0.83. This value shows that it only has a few peaks in common to those of the natural strawberry
flavor. Aquacal® and JELL-O® show the least similarity to the natural strawberry flavor. The
correlation coefficients for those samples are 0.00 and 0.81 respectively. Cool SplashersTM,
JELL-O®, and Aquacal® products may only have one or at most a couple of compounds that
contribute to the artificial strawberry flavor.
65
The scatter plot study is a visual aid to compare the artificially flavored commercial
products to the natural strawberry samples. The scatter plots are of the averaged retention times
of the compounds found in the artificially flavored commercial products against those of the
natural strawberry flavor samples. These pattern plots show the Burger King® milkshake,
Gatorade®, and Hi-C® patterns are adjacent, if not totally superimposable, to the pattern of the
natural strawberry sample. These results also show that these samples are very similar to the
natural strawberry. The JELL-O® and Cool SplashersTM samples’ patterns track to the far right
of the scatter plot which shows these samples are not similar to that of the natural strawberry
sample. The Aquacal® had so few peaks; it was not comparable to the natural strawberry on the
scatter plot.
The Mann-Whitney U Test results also support the conclusion from that obtained from
the values of the correlation coefficients. The significance values for the Burger King®
milkshake, Gatorade®, and Hi-C® are 0.209, 0.080, and 0.070 respectively. The null hypothesis
of the artificially flavored commercial products are similar to the natural strawberry flavored
samples were confirmed for these three samples. This confirmation of the null hypothesis
concludes that these three samples are indeed the most common to that of the natural strawberry
flavor. Cool SplashersTM sample was also similar to that of the natural strawberry flavor.
However, it was not as similar as the Burger King® milkshake, Gatorade®, and Hi-C®. The
Mann-Whitney U test significance is 0.268 for the Cool SplashersTM sample. The significance
values for the Aquacal® and JELL-O® are 0.038 and 0.019 respectively. Other than the result of
the Cool SplashersTM, the overall results of the Mann-Whitney U Tests track those of the pattern
plots and correlation coefficient values very well indeed. These results lead me to have a greater
confidence in the conclusions made for this project.

66
From all the different methods of evaluating the GCMS data of the different products,
natural and commercial, this project shows that one can quite satisfactorily compare the different
samples and compare their similarity to each other. Thus using appropriate statistical procedure
and other suitable means, one can combine the findings to corroborate conclusions obtained from
different angles. This should prove useful for many other future similar projects one may be
interested in.
67
REFERENCES
1. “What’s In Food: Nutrition”
http://www.nutrition.gov/nal_display/index.php?info_center=11&tax_level=1&tax_subject
=388. Accessed on 2-16-2009.
2. Taylor. “Food Additives” John Wiley and Sons Ltd., 1980, pp.1-73.
3. “Food Additives-what they are, where they come from” Manufacturing Chemists’
Association, Inc., 1971, pp. 15-20.
4. “Electronic Code of Federal Regulations” http://www.ecfr.gpoaccess.gov/cgi/text/text-
idx?c=ecfr&sid=37c16f32511a18ed0d0f22743dd35d85&rgn=div8&view=text&node=21:2
.0.1.1.2.2.1.1&idno=21. Accessed on 1-28-2009.
5. “The Science in Artifical Flavor Creation”
http://www.fks.com/flavors/tech/Science%20of%20Flavor%20Creation.asp. Accessed on
1-28-2009.
6. Hornstein. “Flavor Chemistry” Series 56.; American Chemical Society, 1966, pp. 70-72.
7. d’ Acampora Zellner, B.; Dugo, P.; Dugo, G.; Mondello, L. “Gas chromatography-
olfactometry in food flavor analysis” Journal of Chromatography A. 2008, 1186, 123-143.
8. Hagedorn, S.; Kaphammer, B. “Microbial Biocatalysis in the Generation of Flavor and
Fragrance Chemicals” Annu. Rev. Microbiol. 1994, 48, 773-800.
9. Manley, C.H.; Ahmedi, S. “The development of process flavors” Trends in Food Science &
Technology. 1995, 6, 46-51.
10. Kafkas, E.; Kafkas, S.; Koch-Dean, M.; Schwab, W.; Larkov, O.; Lavid, N.; Bar, E.; Ravid,
U.; Lewinsohn, E. “Comparison of Methodologies for the Identification of Aroma
Compounds in Strawberry” Turk. J. Agric For. 2005, 29, 383-390.

68
11. “Resources for Home Gardening Growing Strawberry” http://www.growing-
strawberry.com/the-history-of-strawberries/. Accessed on 1-28-2009.
12. De Boishebert, V.; Giraudel, J.L.; Montury, M. “Characterization of strawberry varieties by
SPME-GC-MS and Kohonen self-organizing map” Chemometrics and Intelligent
Laboratory Systems. 2006, 80, 13-23.
13. Williams, A.; Ryan, D.; Guasca, A.O.; Marriott, P.; Pang, E. “Analysis of strawberry
volatiles using comprehensive two-dimensional gas chromatography with headspace solid-
phase microextraction” Journal of Chromatography B. 2005. 817, 97-107.
14. “Gas Chromatography-Mass Spectroscopy Background”
http://www.gmu.edu/departments/SRIF/tutorial/gcd/gc-ms2.htm. Accessed on 7-13-2008.
15. Peppard, T.L. “How Chemical Analysis Supports Flavor Creation” Food Technology.
1999, 53, 46-51.
16. Sitaramaraju, Y.; van Hul, A.; Wolfs, K.; Schepdael, A.V.; Hoogmartens, J.; Adams, E.
“Static headspace gas chromatography of (semi-)volatile drugs in pharmaceuticals for
topical use” Journal of Pharmaceutical and Biomedical Analysis. 2008, 47, 834-840.
17. Harrabi, S.; Herchi, W.; Kallel, H.; Mayer, P.M.; Boukhchina, S. “Liquid chromatographic-
mass spectrometric analysis of glycerophospholipids in corn oil” Food Chemistry. 2009,
114, 712-716.
18. Giannenas, I.; Nisianakis, P.; Gavriil, A.; Kontopidis, G.; Kyriazakis, L. “Trace mineral
content of conventional, organic and courtyard eggs analyzed by inductively coupled
plasma mass spectroscopy (ICP-MS)” Food Chemistry. 2009, 114, 706-711.
19. Simirgiotis, M.J.; Caligari, P.D.S.; Schmeda-Hirschman, G. “Identification of phenolic
compounds from the fruits of the mountain papaya Vasconcella pubescens A. DC. Grown
69
in Chile by liquid chromatography-UV detection-mass spectrometry” Food Chemistry.
2009, 115, 775-784.
20. Ong, B.T.; Nazimah, S.A.H.; Tan, C.P.; Mirhosseni, H.; Osman, A.; Hashim, D.M.; Rusul,
G. “Analysis of volatile compounds in five jackfruit (Artocarpus heterophyllus L.) cultivars
using solid-phase microextraction (SMPE) and gas chromatography-time-of-flight mass
spectrometry (GC-TOFMS)” Journal of Food Composition and Analysis. 2008, 21, 412-
422.
21. Kaskoniene, V.; Venskutonis, P.R.; Ceksteryte, V. “Composition of volatile compounds of
honey of various floral origin and beebread collected in Lithuania” Food Chemistry. 2008,
111, 988-997.
22. Riu-Aumatell, M.; Castellari, M.; Lopez-Tamames, E.; Galassi, S.; Buxaderas, S.
“Characterisation of volatile compounds of fruit juices and nectars by HS/SPME and
GC/MS” Food Chemistry. 2004, 87, 627-637.
23. Yang, C.; Wang, Y.; Liang, Z.; Fan, P.; Wu, B.; Yang, L.; Wang, Y.; Li, S. “Volatiles of
grape berries evaluated at the germplasm level by headspace-SPME with GC-MS” Food
Chemistry. 2009, 114, 1106-1114.
24. Jayatilaka, A.; Poole, S.K.; Poole, C.F.; Chichila, T.M.P. “Simultaneous micro steam
distillation/solvent extraction for the isolation of semivolatile flavor compounds from
cinnamon and their separation by series coupled-column gas chromatography” Analytica
Chimica Acta. 1995, 302, 147-162.
25. Zabetakis, I.; Holden, M.A, “Strawberry Flavour: Analysis and Biosynthesis” J. Sci. Food.
Agric. 1997, 74, 421-434.
70
26. Bood, K.G.; Zabetakis, I. “The Biosynthesis of Strawberry Flavor (II): Biosynthetic and
Molecular Biology Studies” Journal of Food Science. 2002, 67, Nr. 1, 2-8.
27. Modise, D.M. “Does freezing and thawing affect the volatile profile of strawberry fruit
(Fragaria x ananassa Duch.)?” Postharvest Biology and Technology. 2008, 50, 25-30.
28. Pfannkoch, E.; Whitecavage, J. “Determination of flavor and fragrance components by
Twister[TM] stir bar sorptive extraction and GC/MS: elimination of polar matrix
components. (Food and Beverage: Advertising Supplement)” LC-GC North America. 2003,
21.2, S37(2).
29. Hamilton-Kemp, T.R.; Loughrin, J.H.; Andersen, R.A. “Indentification of Some Volatile
Compounds From Strawberry Flowers” Phytochemistry. 1990, 29(9), 2847-2848.
30. Wilkes, J.G.; Conte, E.D.; Kim, Y.; Holcomb, M.; Sutherland, J.B.; Miller, D.W. “Sample
preparation for the analysis of flavors and off-flavors in foods” Journal of
Chromatography. A. 2000, 880, 3-33.
71
VITA
RANDI JASMINE SLUSS
Personal Data: Date of Birth: March 19, 1985
Place of Birth: Kingsport, TN
Marital Status: Single
Education: Twin Springs High School, Nickelsville, VA
B.A. Chemistry, East Tennessee State University, Johnson City, TN, 2007
M.S. Analytical Chemistry, East Tennessee State University, Johnson City, TN, 2009
Professional Experience: Summer Intern, Eastman Chemical Company; Kingsport, TN,Summer 2007, Summer 2008
Graduate Assistant, East Tennessee State University, College of Arts and Sciences, 2007 – 2009
Poster Presentation: SERMACS in Nashville, TN, November 2008.
Related Documents


