COMPUTING PRACTICES Edgar H. Sibley Panel Editor A comparison of systems analysis techniques, the Data Flow Diagram (DFD) and part of the Integrated Definition Method (IDEFo), is done using a new developmental framework. COIUPARISON OF AUALYSIS TECHNIQUES FOR lUFORlUATllOhl REQUIREMEIUT DETERIUINA~ION SURYA B. YADAV, RALPH R. BRAVOCO, AKEMI T. CHATFIELD, AND T. M. RAJKUMAR It is widely recognized that determining a complete and the requirement determination level: Structured Analy- correct set of requirements of an organization is vital to sis and Design Technique (SADT) [12], Data Flow Dia- the design of an effective information system. To do gram (DFD) [9], Business Information Analysis Tech- this, however, one must first understand the organiza- nique (BIAIT), Integrated Definition Method (IDEF) [2], tion [IS, 171. Organizations are generally complex sys- [5], Interpretive Structured Modeling Software (ISMS) tems, and this makes the task of determining require- [lo]. Some of these techniques compete with each ments very difficult. In addition, Davis [8] suggests other. It is not clear to educators and practicing profes- three other reasons for the difficulty in obtaining a sionals which techniques are better suited for require- complete and correct set of requirements: ment analysis. (1) The limitations of humans as information proces- sors and problem solvers. (2) The variety and complexity of information require- ments. (3) The complex patterns of interaction among users and analysts in determining requirements. Some of these constraints, however, can be overcome by the use of a systematic method. Specifically, a struc- tured modelling technique can help analysts manage the complexity of an organization by studying each part of the organization separately while not losing the over- all context. Several structured techniques have been developed to help an analyst model an organization at Research to compare these techniques is scarce, although there are some articles [6, 11, 131 that report efforts to do so. Colter [6] has proposed a comparative framework for comparing systems analysis techniques. In his framework, he includes nine evaluati,ve dimen- sions to compare structured systems analysis tech- niques with traditional analysis techniques. Whether a technique provides strong coverage, low coverage, or does not address the issue are the three classifications of these techniques. It is not clear from his paper, how- ever, what the rationale is behind selecting the particu- lar set of evaluative dimensions. Moreover, :some of these dimensions, such as the structural dimension, provide little help in deciding what should be the final outcome of the requirement determination stage and which technique is more appropriate to document the 0 1988 ACM 0001.0782/88/0900-1090 51.50 1090 Communications of the ACM September 1988 Volume 31 Number 9

Welcome message from author
This document is posted to help you gain knowledge. Please leave a comment to let me know what you think about it! Share it to your friends and learn new things together.
Transcript
COMPUTING PRACTICES
Edgar H. Sibley Panel Editor
A comparison of systems analysis techniques, the Data Flow Diagram (DFD) and part of the Integrated Definition Method (IDEFo), is done using a new developmental framework.
COIUPARISON OF AUALYSIS TECHNIQUES FOR lUFORlUATllOhl REQUIREMEIUT DETERIUINA~ION
SURYA B. YADAV, RALPH R. BRAVOCO, AKEMI T. CHATFIELD, AND T. M. RAJKUMAR
It is widely recognized that determining a complete and the requirement determination level: Structured Analy- correct set of requirements of an organization is vital to sis and Design Technique (SADT) [12], Data Flow Dia- the design of an effective information system. To do gram (DFD) [9], Business Information Analysis Tech- this, however, one must first understand the organiza- nique (BIAIT), Integrated Definition Method (IDEF) [2], tion [IS, 171. Organizations are generally complex sys- [5], Interpretive Structured Modeling Software (ISMS) tems, and this makes the task of determining require- [lo]. Some of these techniques compete with each ments very difficult. In addition, Davis [8] suggests other. It is not clear to educators and practicing profes- three other reasons for the difficulty in obtaining a sionals which techniques are better suited for require- complete and correct set of requirements: ment analysis.
(1) The limitations of humans as information proces- sors and problem solvers.
(2) The variety and complexity of information require- ments.
(3) The complex patterns of interaction among users and analysts in determining requirements.
Some of these constraints, however, can be overcome by the use of a systematic method. Specifically, a struc- tured modelling technique can help analysts manage the complexity of an organization by studying each part of the organization separately while not losing the over- all context. Several structured techniques have been developed to help an analyst model an organization at
Research to compare these techniques is scarce, although there are some articles [6, 11, 131 that report efforts to do so. Colter [6] has proposed a comparative framework for comparing systems analysis techniques. In his framework, he includes nine evaluati,ve dimen- sions to compare structured systems analysis tech- niques with traditional analysis techniques. Whether a technique provides strong coverage, low coverage, or does not address the issue are the three classifications of these techniques. It is not clear from his paper, how- ever, what the rationale is behind selecting the particu- lar set of evaluative dimensions. Moreover, :some of these dimensions, such as the structural dimension, provide little help in deciding what should be the final outcome of the requirement determination stage and which technique is more appropriate to document the 0 1988 ACM 0001.0782/88/0900-1090 51.50
1090 Communications of the ACM September 1988 Volume 31 Number 9

Computing Practices
final outcome. Most of the existing comparisons are primarily based on the authors’ experiences and intui- tive thoughts about the techniques. There is no empiri- cal research that has compared these techniques objec- tively.
This article presents a new framework to compare and contrast requirement analysis techniques. We pro- vide rationale for the framework and develop criteria based on the dimensions of the framework. Also speci- fied are the operational measures for each of the crite- ria on which techniques can be evaluated. The article also reports on an experiment to evaluate the two most widely used techniques-IDEFo (SADT) and DFD. IDEFo (the function modelling part of IDEF) [Z] is a technique used to produce a functional model that is a structured representation of the functions of the object system (an organization) being analyzed. To model an object system in a top-down fashion, it provides five basic elements: function, input, output, control, and mechanism.
The DFD [9] technique is used to show the flow of data through a system. It uses the concepts of dataflow, datastore, and process to model the flow of data through a system in a top-down fashion. These two techniques were compared in terms of their support for the modelling process and their final outcome. The experiment was conducted in a graduate class of sys- tems analysis and design. An Expert Review Committee (ERC) was set up to evaluate the final outcome and aspects of the modelling process. The ERC applied the measures that we will discuss in detail to evaluate the models. The rest of the data were collected by adminis- tering questionnaires to the subjects of the experiment.
A FRAMEWORK FOR COMPARISON OF ANALYSIS TECHNIQUES In this section we first develop the framework and then present hypotheses based on the framework.
The Framework A framework to compare analysis techniques should address all aspects of requirement analysis. There are three basic questions with respect to requirement analysis. These are:
(1) What should requirements be? (2) How should requirements be stated? (3) How should requirements be derived?
The first question deals with the content, the second deals with the form of the content and the third deals with the process of determining the content. Very few researchers have addressed the first question. What are all the traits of a system that should be included in the requirement specification in order to make it a com- plete specification? For management people a verbal statement of requirement seems to be sufficient. Tech- nical people usually include functional architecture, system context, performance specification, measure- ment, and test conditions as part of the total require- ment specification.
What should the requirement be? Yeh [18] answers this question as follows:
A system requirement is a set of precisely stated prop- erties or constraints that a system must satisfy. A requirement should specify the solution space of a problem. Boundaries of the solution space are set by the constraints and properties which can be used to test whether a proposed solution is indeed a valid one.
Ross [12] defines requirements as:
Requirements definition includes, but is not limited to, the problem analysis that yields a functional specifica- tion. It is much more than that. Requirements defini- tion must deal with three subjects:
(1)
(2)
(3)
Context analysis: The reason why the system is to be created, and why certain technical, operational and economic feasibilities are the criteria which form the boundary conditions for the system. Functional specification: A description of what the system is to be, in terms of the functions it must accomplish. Design constraints: A summary of conditions specifying how the required system is to be constructed and implemented.
We believe the requirement specification contains information for the user, designer, implementer, and tester of the system and should include:
(1) Functional specification: what functions a system must perform.
(2) System context, constraints, and assumptions. This establishes boundary for the system.
(3) Performance specification about the dynamic prop- erties of the system.
(4) Measurement and test conditions-an organized testing process to verify that the system is behaving properly.
How Should Requirements Be Stated? In the literature, there is very little agreement on how requirements should be stated. Different techniques emphasize different frameworks for stating require- ments (PSL/PSA, RSL, Young [19]). For example, PSL/ PSA emphasizes concepts such as INPUT, PROCESS, OUTPUT, and ENTITY, whereas RSL emphasizes the information flows through the system using the concept of petrinets. In some techniques, processes are dis- guised in the definition of relationships among inputs and outputs [18]. A deeper analysis of these techniques however, reveals that all of them describe some or most of the following:
(1) activities (2) inputs and outputs (3) data definition (4) processing requirements.
This leads us to conclude that a requirement specifi- cation should be described in the form of
September 1988 Volume 31 Number 9 Communications of the ACM 1091
Computing Practices
(1) a functional model of the object system
(2) a data dictionary defining the various components of the functional model
(3) a set of performance and test specifications for the system.
How Should Requirements Be Derived? We need to concentrate on the final outcome of the requirement analysis as well as on the process of arriv- ing at the final outcome [17]. This implies that an analysis technique should support a modelling process to he1.p derive information requirements. An analysis technique should address the three questions just dis- cussed. It should provide mechanisms.
(1) to develop a functional model of the object system (2) to define various components of the model (3) to specify performance and test conditions.
In addition, since an analysis technique is used by a team of people, it should have communication ability and it. should be easy to learn and easy to use.
Framework Dimensions A framework to evaluate analysis techniques should include criteria for comparison. We propose a frame- work that provides criteria to compare techniques in terms of
(1) the modelling process supported by a technique (2) the final outcome of the technique.
The proposed framework has four dimensions:
(1) syntactic (2) semantic (3) communicating ability (4) usability
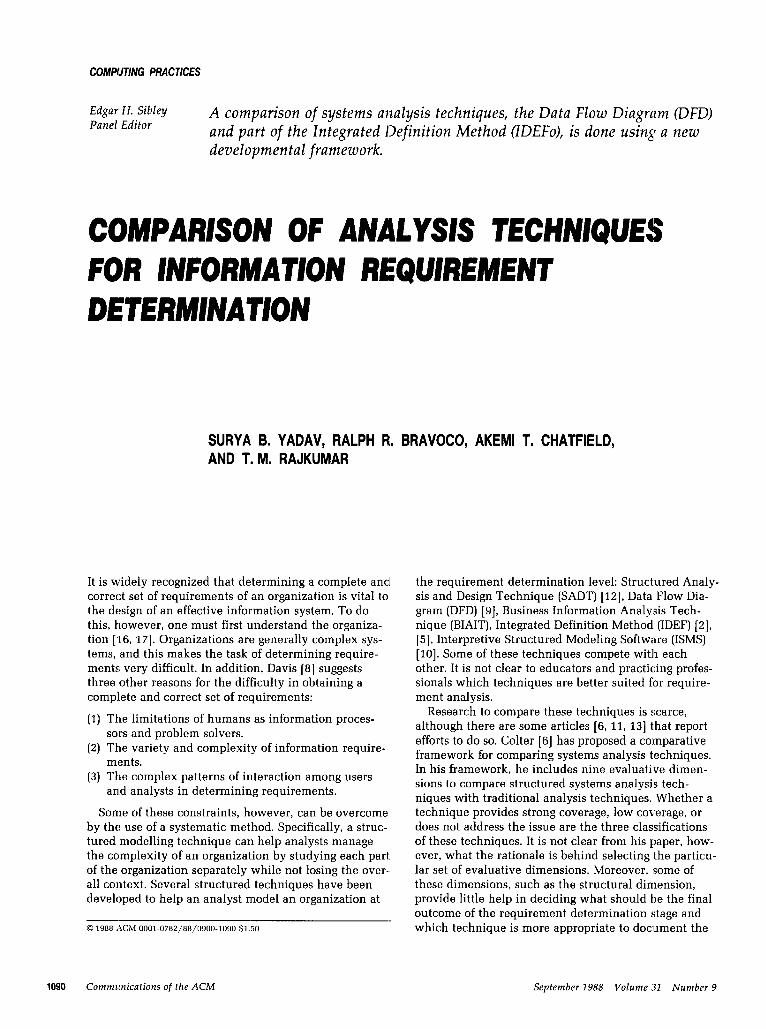
The syntactic dimension includes criteria that evalu- ates syntactical rules for the modelling process as well as for the final outcome of a technique. Similarly, the semantic dimension provides criteria to evaluate the meaning of the modelling process as well as the mean- ing of the final outcome. Table I summarizes the first two dimensions of the framework.
Syntactic Dimensions Syntactic rules are constraints in the sense that they descri.be logically what is represented graphically. If the syntactic rules are not satisfied or are violated in the graphic display, the constraint. has not been met, and the resulting model is deficient with respect to that particular constraint.
Five different types of syntactic criteria are distin- guished depending on the decomposition process or the final outcome. In the area of modelling process we have:
Consistent Level of Abstraction and Detail This criterion pertains to the consistency in decompos- ing one function into a set of sub-functions at the next lower level of refinement. All of the decomposed sub-
TABLE I. The First Two Dimensions of the Framework
Syntactic
Semantic
1. Consistent level of abstraction and detail
2. Consistent view- point and purpose
3. Complexity of the syntax
1. Appropriate level of abstraction
2. Proper viewpoint and purpose
3. Type of decompo sition
4. Complexity/under- standability of the problem
1. Correctness and completeness of the model
a. Inputs b. Outputs c Functions
1. Correctness and completeness of the model in ternIs of inputs, outputs and functions
functions should be at the same abstraction at a partic- ular level. The measure for this criteria is the rating of the decomposition process by the ERC.
Consistent Viewpoint and Purpose This criterion refers to the maintenance of the same viewpoint and purpose for all the levels of refinement in the model. The measure for these criteria is the rating by the ERC.
Complexity of the Syntax This criterion relates to the understandability of the syntax rules of a technique. The measure for these cri- teria is a questionnaire response from users.
In the area of outcome we have:
Syntactical Correctness of the Model This criterion relates to the degree to which. a model has been accurately constructed, labelled, and identi- fied; that is, the degree to which syntactic relations have been represented appropriately in the graphics and constraints obeyed. The measure for these criteria is the check for the adherence to constraints by the ERC.
Syntactic Completeness of the Model The syntactic completeness refers to the degree to which all required field-entries, labels, boxes, arrows, and identifying notations are present in a model. The measure for these criteria is the check for adherence to the proper syntax.
Semantic Dimensions Semantics is a term that has been applied to a wide range of factors that have each had some effect on the meaning of labels, functions, and the decomposition of a model. In order to establish criteria useful for evaluat- ing models, those aspects of meaning that relate to the consistent and unambiguous naming of data and func- tions in IDEFo and DFD will be dealt with. Criteria for evaluating the overall story, message, or sense of a model
1092 Communications of the ACM September 1988 Volume .31 Number 9

will be addressed in terms of accessing complexity. As with syntax, semantic criteria are determined by the modelling process and the final outcome. In the area of the modelling process we have:
Appropriate Level of Abstraction This criterion relates to the degree to which an abstrac- tion (decomposition) is appropriate for a particular level. The measure for this criterion is the rating by the ERC.
Proper Viewpoint and Purpose This criterion examines whether the viewpoint and purpose of the model is proper and meaningful. The measure for these criteria is the rating by ERC.
Type of Decomposition This criterion relates to the quality of the decomposi- tion-whether the decomposition is functional or by any other type. The measure for this criterion is again a rating by the ERC.
Complexity/Understandibility Understandability is an important but difficult criterion to measure in assessing model quality, mainly because of its abstract and subjective connotations. Another source of the problems associated with measuring understandability is the strong interrelationship of syntactic and semantic factors. Since we are defining understandability as a function of how well the content of the model is portrayed via the syntax, the relevant measures would be derived from both syntax and semantics. Thus, no single feature of semantics would appear to be a sufficient index of how well an evaluator could understand a complete model.
Measuring complexity, however, is a more feasible task. We are suggesting that understandability and complexity be viewed as dual measures-that is, some- thing that is highly complex can be expected to be hard to understand; and similarly, something that has a low complexity value is probably much more accessible to a user and more easily understood.
We define these criteria as:
(1) extent to which the purpose of a model is clear to the evaluator;
(2) degree to which “what the model says” is accu- rately depicted via the syntax.
The measures are:
(1) ease of finding the “main path”; (2) number of activations/boxes; (3) ease and success of “refining the layout.”
These measures are used by the ERC to evaluate techniques against this criteria.
Semantic Correctness of the Model Correctness is perhaps the most subjective of the seman- tic characteristics presented in this section, chiefly because the final standard for assessment must come
September 1988 Volume 31 Number 9
computing Practices
from the opinion of individuals who have the most complete knowledge of the subject matter being model- led. The ERC evaluates models for correctness based on the “extent to which information expressed in a model is an accurate description of the system being model- led.”
Semantic Completeness of the Model Completeness refers to the sufficiency of information content to cover the subject matter. The ERC looks at the degree of adequate coverage of information with respect to the bounded context of the parent.
Communicability Dimension The communication ability of an analysis technique refers to the readability and understandability of the document produced by the use of the technique. Read- ers of the documents are asked to evaluate the com- municability of the two techniques.
Usability Dimension This dimension measures how usable a technique is. In other words, it relates to the degree of difficulty faced by an analyst applying a technique. The usability of a technique depends on its approach and its syntax. The usability of a technique can be hampered by a very rigorous or very vague syntax. The measure for this criterion is a direct response from the user.
Research Hypotheses Hypotheses being investigated are derived from our conceptual framework for techniques comparison, which delineates the criteria used to compare two of the most widely used system analysis techniques. Spe- cific hypotheses are stated in the null form. In light of the exploratory nature of this investigation, directions of alternative hypotheses are not specified. Instead, we employ two-tailed alternative hypotheses.
Syntactic Hypotheses H1: Syntactical correctness and completeness of
final models does not significantly differ between DFD and IDEFo groups.
H2: Syntactic consistency and appropriateness of modelling process does not significantly differ between DFD and IDEFo groups.
Semantic Hypotheses H3: Semantic correctness and completeness of final
models does not significantly differ between DFD and IDEFo groups.
H4: Semantic consistency and appropriateness of modelling process does not significantly differ between DFD and IDEFo groups.
Analyst Response Hypotheses H5: Analyst’s perception of ease of learning syntac-
tic rules does not significantly differ between DFD and IDEFo groups.
H6: Analyst’s perception of ease of drawing dia- grams does not significantly differ between DFD and IDEFo groups.
Communications of the ACM 1093
Computing Practices
H7: Analyst’s perception of ease of understanding the diagrams drawn by his team member does not significantly differ between DFD and IDEFo groups.
H8: Analyst’s overall confidence in the syntactic correctness and completeness of final models does not significantly differ between DFD and IDEFo groups.
H9: Analyst’s overall confidence in the semantic correctness and completeness of final models does not significantly differ between DFD and IDEFo groups.
HlO: Analyst’s overall confidence in the utility of the technique to specify the requirement analysis does not significantly differ between DFD and IDEFo groups.
Hll: Analyst’s preference of a technique he can choose for a similar future project does not sig- nificantly differ between DFD and IDEFo groups.
HK?: Analyst’s assessment of the utility of the tech- nique to enhance communication between team members does not significantly differ between DFD and IDEFo groups.
EXPERIMENT METHOD
Experimental Subjects An experiment was conducted to test these hypotheses. In this exploratory experiment, the subjects were grad- uate students enrolled in the graduate level systems analysis course offered by the Information Systems and Quantitative Sciences Department of the College of Business Administration at Texas Tech University.
Experimental Treatment In the systems analysis course, DFD and IDEFo were taught. to a class of 20 students, using four class periods each, :in the order of the DFD and then the IDEFo. Assignments were given to all students to ensure the required level of competency for each technique. After learning the two techniques, subjects were classified into h:igh, medium, and low cognitive style categories based upon the Group Embedded Figures Test (GEFT) scores [15]. Scores ranged from 10 to 18, with a median score of 17 and a mean of 15.85. The lower score was associated with the cognitive style characterized by heuristic orientation whereas the higher score was associated with that characterized by analytic orienta- tion. Since the score distribution was highly skewed to the right, we identified 12 subjects as analytic cognitive style, four as mixed cognitive style, and four as heuris- tic cognitive style.
Two subjects were then randomly selected from each cognitive style category to form a team. A total of 10 teams were formed and then randomly assigned to use either DFD or IDEFo to develop a requirement analysis specification for a hypothetical case involving an orga- nization of medium complexity. Teams assigned to the
DFD technique or the IDEFo technique are henceforth referred to as the DFD group or the IDEFo group, respectively.
Each technique group had three analytic teams, one mixed team, and one heuristic team. In an effort to determine that the DFD group (a total of five teams) and the IDEFo group (a total of five teams) did not significantly differ in any way other than the different technique to which they were assigned, the Analyst Background Survey was administered. Statistical tests performed on the survey items showed that they did not differ in important dimensions such as age, educa- tional background, work experience, and knowledge or use of systems analysis technique prior to this experi- ment. Teams had a total of four weeks to work on the case. At the end of each week, teams were encouraged to submit their intermittent models to the ERC for com- ments. At the end of the four-week experiment, teams were required to turn in their final models.
Since a significantly large weight was given to the outcome of the final models in determining the course grade, all teams demonstrated high motivation through- out the four-week experiment. Determination of levels of diagrams necessary to specify the requirements analysis was left to each team. In other words, some teams produced four levels of decompositions, whereas others produced three levels. Instruction as to the required levels of decompositions was not given since systems analysts working on any practical project have to make this decision themselves.
At the termination of the experiment, all subjects were given the Analyst Response Questionnaire, whose objective was to assess the analyst’s subjective evalua- tions of the technique. This questionnaire was adminis- tered to individual subjects, not to a team. The dimen- sions of the technique outlined earlier were assessed. Although the psychometric properties of the question- naire were, at this point, not evaluated, the content validity [7] was established by the ERC.
Diagrams drawn by teams were reviewed indepen- dently by each of the four members of the EZRC. In reviewing the final models, each ERC member followed a set of criteria as shown in Table II. A set of weights were assigned to the criterion of each dimension according to the perceived importance, also shown in Table II. A final score could theoretically range any- where from zero to 20 on the continuum. After each member independently assigned a final score to each team, the ERC as a group came to a consensus on the final score for each team using an iterative method very similar to the Delphi method.
There are many factors that may violate internal validity, causing experimental data to be invalid [4, 71. Care was taken to control experimental factors that might bias Ss, including the experimenter bi.as. Throughout the experiment, each team used the team code assigned in submitting any models. Thus the ERC member was kept blind to any information pertaining to an experimental subject such as name, cognitive style, work experience, or academic performance. This
1094 Communications of the ACM September 1988 Volume 21 Number 9
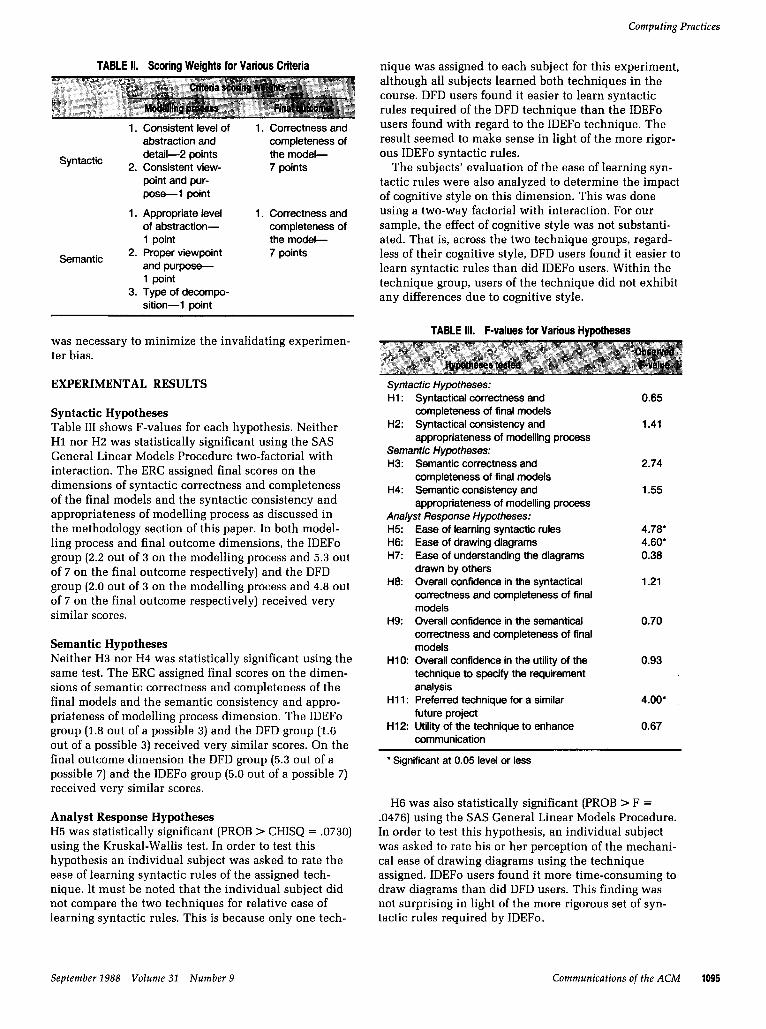
TABLE II. Scoring Weights for Various Criteria
1.
Syntactic *,
1.
Semantic 2.
3.
Consistent level of abstraction and detail-2 points Consistent view- point and pur- pose-l point
1.
Appropriate level 1. of abstraction- 1 point Proper viewpoint and purpose- 1 point Type of decompo- sition-l point
Correctness and completeness of the model- 7 points
Correctness and completeness of the model- 7 points
was necessary to minimize the invalidating experimen- ter bias.
EXPERIMENTAL RESULTS
Syntactic Hypotheses Table III shows F-values for each hypothesis. Neither Hl nor HZ was statistically significant using the SAS General Linear Models Procedure two-factorial with interaction. The ERC assigned final scores on the dimensions of syntactic correctness and completeness of the final models and the syntactic consistency and appropriateness of modelling process as discussed in the methodology section of this paper. In both model- ling process and final outcome dimensions, the IDEFo group (2.2 out of 3 on the modelling process and 5.3 out of 7 on the final outcome respectively) and the DFD group (2.0 out of 3 on the modelling process and 4.8 out of 7 on the final outcome respectively) received very similar scores.
Semantic Hypotheses Neither H3 nor H4 was statistically significant using the same test. The ERC assigned final scores on the dimen- sions of semantic correctness and completeness of the final models and the semantic consistency and appro- priateness of modelling process dimension. The IDEFo group (1.8 out of a possible 3) and the DFD group (1.6
out of a possible 3) received very similar scores. On the final outcome dimension the DFD group (5.3 out of a possible 7) and the IDEFo group (5.0 out of a possible 7) received very similar scores.
Analyst Response Hypotheses H5 was statistically significant (PROB > CHISQ = .0730)
using the Kruskal-Wallis test. In order to test this hypothesis an individual subject was asked to rate the ease of learning syntactic rules of the assigned tech- nique. It must be noted that the individual subject did not compare the two techniques for relative ease of learning syntactic rules. This is because only one tech-
nique was assigned to each subject for this experiment, although all subjects learned both techniques in the course. DFD users found it easier to learn syntactic rules required of the DFD technique than the IDEFo users found with regard to the IDEFo technique. The result seemed to make sense in light of the more rigor- ous IDEFo syntactic rules.
The subjects’ evaluation of the ease of learning syn- tactic rules were also analyzed to determine the impact of cognitive style on this dimension. This was done using a two-way factorial with interaction. For our sample, the effect of cognitive style was not substanti- ated. That is, across the two technique groups, regard- less of their cognitive style, DFD users found it easier to learn syntactic rules than did IDEFo users. Within the technique group, users of the technique did not exhibit any differences due to cognitive style.
TABLE III. F-values for Various Hypotheses
Syntactic Hypotheses: Hl : Syntactical correctness and
completeness of final models H2: Syntactical consistency and
appropriateness of modelling process Semantic Hypotheses: H3: Semantic correctness and
completeness of final models H4: Semantic consistency and
appropriateness of modelling process Analyst Response Hypotheses:
0.65
1.41
2.74
1.55
H5: H6: H7:
H6:
Ease of learning syntactic rules Ease of drawing diagrams Ease of understanding the diagrams drawn by others Overall confidence in the syntactical correctness and completeness of final models
4.78’ 4.60* 0.38
1.21
H9: Overall confidence in the semantical correctness and completeness of final models
0.70
HlO: Overall confidence in the utility of the technique to specify the requirement analysis Preferred technique for a similar future project
0.93
Hll: 4.00*
H12: Utility of the technique to enhance 0.67
l Significant at 0.05 level or less
H6 was also statistically significant (PROB > F = .0476) using the SAS General Linear Models Procedure. In order to test this hypothesis, an individual subject was asked to rate his or her perception of the mechani- cal ease of drawing diagrams using the technique assigned. IDEFo users found it more time-consuming to draw diagrams than did DFD users. This finding was not surprising in light of the more rigorous set of syn- tactic rules required by IDEFo.
September 1988 Volume 31 Number 9 Communications of the ACM 1095

Computing Practices
When H6 was analyzed using a two-factorial model ject was asked to rate his or her overall confidence in with interaction, two main effects, Technique (PR > the semantic correctness and completeness of the F = .0476) and Cognitive Style (PR > F = .OSOO), and team’s final models using the same five-point scale. the interactive effect Technique X Cognitive Style Both the IDEFo group (mean confidence level of 72.5 (PR > F = .0602), were all statistically significant. All percent) were fairly confident about the semantic cor- IDEFo users, regardless of their cognitive style, thought rectness and completeness of the final models they sub- it was time-consuming to mechanically draw diagrams. mitted. Although it was not statistically significant, the Nevertheless, there were some response differences IDEFo group, on the average, exhibited a slightly higher among DFD users depending on their cognitive style. confidence level than did the DFD group.
Heuristic subjects of the DFD group generally thought that it was as equally time-consuming as did all IDEFo users. Analytic subjects of the DFD group rated it less time-consuming than did IDEFo users, while mixed cognitive style subjects rated it more time- consuming. Mixed cognitive style subjects fall some- where in the middle of the continuum of cognitive style dimension whose bipolar ends are characterized by highly analytic orientation and highly heuristic ori- entation. It is possible that two subjects assigned into a team exhibit different degrees of mixed orientations (i.e., one possessed more analytic than heuristic orien- tation while the other more heuristic than analytic ori- entation). It is also possible to speculate that two mixed cognit:ive style subjects find it more difficult to incorpo- rate different perceptions on diagrams.
H7 was not statistically significant. An individual subject rated the degree of ease of understanding the diagrams drawn by his or her teammates using the five- point scale. Both the IDEFo group and the DFD group found it fairly easy to understand the diagrams drawn by others.
Neither HlO nor Hl2 was statistically sign:ificant. Both groups agreed that the technique they used was useful to specify the information requirement analysis and communicate their understanding of the case to their teammates.
CONCLUSIONS
HI1 was statistically significant (PROB > F = .0715) using the SAS GLM two-factorial with interaction. In order to test this hypothesis, an individual subject was asked to choose between IDEFo and DFD as a preferred technique for a similar future project. All subjects could choose IDEFo as the preferred technique, even though only half of them were assigned to use IDEFo. Similarly, all subjects could choose DFD. Neither of these occurred. An analysis showed that IDEFo users tended to choose the IDEFo for similar future projects, while DFD users tended to choose the DFD. In selecting the preferred technique for a future project both tech- nique groups were equally certain about the technique choice. It was interesting to note, however, that a higher proportion of IDEFo group (four IDEFo users out of 10) chose DFD instead, in comparison to the DFD group, where two DFD users out of 10 chose IDEFo. Neither cognitive style effect nor interaction effect was statistically significant.
We presented a comparative framework to compare analysis techniques for information requirement deter- mination. We also conducted an experiment to com- pare IDEFo and DFD modelling techniques using the framework. With a limited sample, it is difficult to make any definitive statements on the results. Based upon our experiment, however, it seems that DFD is easier to learn and easier to use. It is not clear which technique produces a better result. Further experi- ments are necessary to determine whether any of these techniques will produce a better model.
REFERENCES 1. Alford, M.W. A requirements engineering methodology for real time
processing requirements. IEEE Trans. Softw. Eng. SE-3, 1 (Jan. 1977). 2. Bravoco, R., and Yadav, S.B. A Methodology to Model the Func-
tional Architecture of an Organization. Comput. Ind. 6, 5 (Oct. 1965). 3. Bravoco. R.. and Yadav. S.B. Reouirement definition architecture-
An overview. Comau!. Ind. 6.4 rkue. 19651. 4. Campbell, D.T.. anb Stanley,‘J.d. E.&erimekl and Quasi-experimental
Designs for Research. Rand McNally College Publishing Company, Chicago, Illinois, 1963.
H8 was not statistically significant using the two- factorial SAS GLM procedure. In order to test this hypothesis, an individual subject was asked to rate his or her overall confidence in the syntactic correctness and completeness of the team’s final models using a five-point scale ranging from 100 percent confident to 0 percent confident. Both the IDEFo group (mean confi- dence level of 82.5 percent) and the DFD group (mean confidence level 75 percent) were fairly confident about the syntactic correctness and completeness of the final models they submitted. Although not statistically sig- nificant, the IDEFo group on the average exhibited a slightly higher confidence level than did the DFD group.
5. Carlson, W.M. Business information and analysis technique (BIAIT)-The new horizon. DATABASE, Spring 1979. pp. 3-9.
6. Colter, M.A. A comparative examination of systems analysis tech- niques. MlS Quarterly. To be published.
7. Cronbach, L.J. Essentials of Psychological Testing, 3rd Edition. Harper and Row, New York, N.Y.. 1970.
6. Davis G.B. Strategies for information requirements determination. Working Paper Series MISRC-WP-62-02. University of Minnesota, Minneapolis, Minnesota, Sept. 1961.
9. Gane, C., and Sarson, T. Structured Systems Analysis: TXIIS and Tech- niques. Prentice-Hall, Englewood Cliffs, N.J., 1979.
10. Hansen. J.V., McKell, L.J.. and Meitger, L.E. ISMS: Conputer aided analysis for design of decision support systems. Manage. Sci. 25, 11 (Nov. 1979), 1069-1081.
H9 was not statistically significant using the same test. In order to test this hypothesis, an individual sub-
11. Monro, MC, and Davis, G.B. Determining management information needs: A comparison of methods. MIS Q. 1, 2 (1977). 55-77.
12. Ross, D.T.. and Schoman. K.E.. Jr. Structured analysis for require- ment definition. IEEE Trans. Softw. Eng. Se-3, 1 (Jan. 1977).
13. Taggart, W.M., and Tharp, M.O. A survey of information require- ments analysis techniques. ACM Compuf. Sum 9.4 (1!177], 273-290.
14. Tiechroew, D., and Hershey, E.A. PSL/PSA: A computer aided tech- nique for structured documentation and analysis of information processing systems. ZEEE Trans. Softw. Eng. SE-3, 1 (Jan. 1977).
15. Witkin, H.A.. Oltman, P.K.. Raskin, E., and Karp. S.A. Manual for the Embedded Figures Test. Consulting Psychologists Press, Palo Alto, CA, 1971.
1096 Communications of the ACM September 1988 Volume ,::I Number 9
Computing Practices
16. Yadav, S.B. A methodology for modelling an organization to deter- mine and derive information systems requirements. Ph.D. disserta- tion, Dept. of IS, Georgia State Univ., Atlanta. Available through University Microfilm International, Ann Arbor, Michigan, 1981.
17. Yadav, S.B. Determining an organization’s information require- ments: A state of the art survey. DATA BASE, Spring 1983, pp. 3-20.
18. Yeh, R.T.. Araya, A., et al. Software requirements engineering-A perspective. Structured Software Development, State of the Art Re- port. Info&h. Intl. 2. 1979.
19. Young. J.W., and Kent, H. Abstract formulation of data processing problems. I. Ind. Eng. (Nov.-Dec., 1958). 471-479.
CR Categories and Subject Descriptors: D.2.1 [Software Engineer- ing]: Tools and Techniques; K.6.1 [Management of Computing and In- formation Systems]: Project and People Management
Additional Key Words and Phrases: Framework for comparing analysis techniques, information requirement determination, systems analysis and design, systems analysis techniques
Received 9/&V; accepted 12/87
ABOUT THE AUTHORS:
SURYA B. YADAV is an associate professor at Texas Tech University in Lubbock. His research interests include systems analysis and design, knowledge-based systems for problem identification, automatic code generation, database systems, and software engineering.
RALPH R. BRAVOCO is an associate professor of Information Systems and Quantitative Sciences at Texas Tech University in
Lubbock, as well as president of Bravoco Associates, a private consulting firm that specializes in CAD/CAM and manufactur- ing management information systems. His research interests include information system analysis and design.
AKEMI T. CHATFIELD is an assistant professor of MIS at the University of Nevada in Las Vegas. Her research interests in- clude DSS design and implementation methodologies, knowl- edge-based DSS, and organizational information requirement determination.
T. M. RAJKUMAR is a doctoral candidate in management information systems at Texas Tech University in Lubbock. His research interests include DSS, GDSS, object-oriented systems extensible and temporal databases. Authors’ present addresses: Surya B. Yadav, Ralph R. Bravoco and T.M. Rajkumar, Infor- mation Systems and Quantitative Sciences, College of Business Administration, Texas Tech University, Box 4320, Lubbock, Texas 79409-4320; Akemi T. Chatfield, Department of Management, College of Business and Economics, University of Nevada, 4505 South Maryland Parkway, Las Vegas, Nevada 89154.
Permission to copy without fee all or part of this material is granted provided that the copies are not made or distributed for direct commer- cial advantage, the ACM copyright notice and the title of the publication and its date appear, and notice is given that copying is by permission of the Association for Computing Machinery. To copy otherwise, or to republish, requires a fee and/or specific permission.
ACM SPECIAL INTEREST GROUPS ARE YOUR TECHNICAL SIGCAPH Newsletter, Cassette Edition SIGMICRO Newsletter
INTERESTS HERE? (Microprogramming) SICCAPH Newsletter, Print and Cassette
Editions SIGMOD Record (Management of Data)
The ACM Sped Interest Groups further the ad- vancement of cmlputer sdence and pmtice in
SIGCAS Newsletter (Computers and SIGNUM Newsletter (Numerical
Society) Mathematics) many qeciafized areas. Members of each SIG receiveasoneoftheirbenefitsapefkxWex- SIGCHI Bulletin (Computer and Human SIGOIS Newsletter (Office Information
dusively devoted to the special interest. The fol- Interaction) Systems)
lowing are the publications that are available- umugh lllembetshii or special subsaiption.
SIGCOMM Computer Communication SIGOPS Operating Systems Review
Review (Data Communication) (Operating Systems)
SIGCPR Newsletter (Computer Personnel SIGPLAN Notices (Programming
SIGACT NEWS (Automata and Research) Languages)
Computability Theory) SIGCSE Bulletin (Computer Science
SIGPLAN FORTRAN FORIJM (FORTKAK]
SlGAda Letters (Ada) Education) SIGSAC Newsletter (Security, Audit,
SIGAPL Quote Quad (APL) SIGCUE Bulletin (Computer Uses in and Control)
Education)
SIGARCH Computer Architecture News SIGSAM Bulletin (Symbolic and Algebraic
(Architecture of Computer Systems] SIGDA Newsletter (Design Automation) Manlpulatlon)
SIGART Newsletter (Artificial SIGDOC Asterisk (Systems SIGSIM Simuletter (Simulation and
Intelligence) Documentation) Modeling)
SIGBDP DATABASE (Business Data SIGGRAPH Computer Graphics SIGSMALL/PC Newsletter (Small and
Processing) (Computer. Graphics] Personal Computing Systems and Appllcatlons)
SIGBIO Newsletter (Biomedical SIGIR Forum (Information Retrieval) SIGSOFT Software Engineering Notes Computing)
SIGMETRICS Performance Evaluation (Software Engineering)
SIGCAPH Newsletter (Computers and the Review (Measurement and SIGUCCS Newsletter (Umversity and Physically Handicapped) Print Edition Evaluallon) College Computing Services]
September 1988 Volume 31 Number 9 Communications of the ACM 1097
Related Documents