Water Research 36 (2002) 4193–4202 Comparison of anaerobic dechlorinating enrichment cultures maintained on tetrachloroethene, trichloroethene, cis-dichloroethene and vinyl chloride Melanie Duhamel a , Stephan D. Wehr a , Lawrence Yu a , Homa Rizvi a , David Seepersad a , Sandra Dworatzek a , Evan E. Cox b , Elizabeth A. Edwards a, * a Department of Chemical Engineering and Applied Chemistry, University of Toronto, Toronto, Ont., Canada b GeoSyntec Consultants, Guelph, Ont., Canada Received 1 June 2001; received in revised form 1 March 2002; accepted 22 March 2002 Abstract An anaerobic mixed microbial culture was enriched from soil and groundwater taken from a site contaminated with trichloroethene (TCE). This enrichment culture was divided into four subcultures amended separately with either perchloroethene (PCE), TCE, cis-dichloroethene (cDCE) or vinyl chloride (VC). In each of the four subcultures, the chlorinated ethenes were rapidly, consistently, and completely converted to ethene at rates of 30–50 mmol/l of culture per day, or an average 160 m-electron equivalents/l of culture per day. These cultures were capable of sustained and rapid dechlorination of VC, and could not dechlorinate 1,2-dichloroethane, differentiating them from Dehalococcoides ethenogenes, the only known isolate capable of complete dechlorination of PCE to ethene. Chloroform (CF) and 1,1,1- trichloroethane, frequent groundwater co-contaminants with TCE and PCE, inhibited chlorinated ethene dechlorina- tion. Most strongly inhibited was the final conversion of VC to ethene, with complete inhibition occurring at an aqueous CF concentration of 2.5 mM. Differences in rates and community composition developed between the different subcultures, including the loss of the VC enrichment culture’s ability to dechlorinate PCE. Denaturing gradient gel electrophoresis of amplified bacterial 16S rRNA gene fragments identified three different DNA sequences in the enrichment cultures, all phylogenetically related to D. ethenogenes. Based on the PCR-DGGE results and substrate utilization patterns, it is apparent that significant mechanistic differences exist between each step of dechlorination from TCE to ethene, especially for the last important dechlorination step from VC to ethene. r 2002 Elsevier Science Ltd. All rights reserved. Keywords: Anaerobic reductive dechlorination; DGGE; Microorganisms; Bioaugmentation 1. Introduction The microbially mediated dechlorination of chlori- nated ethenes to non-toxic ethene has been observed in the laboratory since 1989 [1] and in the field since 1991 [2]. Given the widespread and serious nature of chlorinated solvent groundwater contamination, much attention has been focused on understanding and optimizing in situ biological remediation of these contaminants. Biological reductive dechlorination of perchloroethene (PCE) or trichloroethene (TCE) occurs readily at many field sites and in many laboratory cultures. However, only partial dechlorination to cis- dichloroethene (cDCE) is often observed. A significant challenge is to understand the factors that prevent complete dechlorination beyond cDCE and vinyl chloride (VC) to ethene. While many PCE-dechlorinat- ing organisms have been isolated [3–9], only one, Dehalococcoides ethenogenes Strain 195, is capable of *Corresponding author. Tel.: +1-416-946-3506; fax: +1- 416-978-8605. E-mail address: [email protected] (E.A. Edwards). 0043-1354/02/$ - see front matter r 2002 Elsevier Science Ltd. All rights reserved. PII:S0043-1354(02)00151-3

Welcome message from author
This document is posted to help you gain knowledge. Please leave a comment to let me know what you think about it! Share it to your friends and learn new things together.
Transcript
Water Research 36 (2002) 4193–4202
Comparison of anaerobic dechlorinating enrichment culturesmaintained on tetrachloroethene, trichloroethene,
cis-dichloroethene and vinyl chloride
Melanie Duhamela, Stephan D. Wehra, Lawrence Yua, Homa Rizvia,David Seepersada, Sandra Dworatzeka, Evan E. Coxb, Elizabeth A. Edwardsa,*
a Department of Chemical Engineering and Applied Chemistry, University of Toronto, Toronto, Ont., Canadab GeoSyntec Consultants, Guelph, Ont., Canada
Received 1 June 2001; received in revised form 1 March 2002; accepted 22 March 2002
Abstract
An anaerobic mixed microbial culture was enriched from soil and groundwater taken from a site contaminated with
trichloroethene (TCE). This enrichment culture was divided into four subcultures amended separately with either
perchloroethene (PCE), TCE, cis-dichloroethene (cDCE) or vinyl chloride (VC). In each of the four subcultures, the
chlorinated ethenes were rapidly, consistently, and completely converted to ethene at rates of 30–50 mmol/l of culture
per day, or an average 160m-electron equivalents/l of culture per day. These cultures were capable of sustained and
rapid dechlorination of VC, and could not dechlorinate 1,2-dichloroethane, differentiating them from Dehalococcoides
ethenogenes, the only known isolate capable of complete dechlorination of PCE to ethene. Chloroform (CF) and 1,1,1-
trichloroethane, frequent groundwater co-contaminants with TCE and PCE, inhibited chlorinated ethene dechlorina-
tion. Most strongly inhibited was the final conversion of VC to ethene, with complete inhibition occurring at an
aqueous CF concentration of 2.5 mM. Differences in rates and community composition developed between the different
subcultures, including the loss of the VC enrichment culture’s ability to dechlorinate PCE. Denaturing gradient gel
electrophoresis of amplified bacterial 16S rRNA gene fragments identified three different DNA sequences in the
enrichment cultures, all phylogenetically related to D. ethenogenes. Based on the PCR-DGGE results and substrate
utilization patterns, it is apparent that significant mechanistic differences exist between each step of dechlorination from
TCE to ethene, especially for the last important dechlorination step from VC to ethene. r 2002 Elsevier Science Ltd.
All rights reserved.
Keywords: Anaerobic reductive dechlorination; DGGE; Microorganisms; Bioaugmentation
1. Introduction
The microbially mediated dechlorination of chlori-
nated ethenes to non-toxic ethene has been observed in
the laboratory since 1989 [1] and in the field since 1991
[2]. Given the widespread and serious nature of
chlorinated solvent groundwater contamination, much
attention has been focused on understanding and
optimizing in situ biological remediation of these
contaminants. Biological reductive dechlorination of
perchloroethene (PCE) or trichloroethene (TCE) occurs
readily at many field sites and in many laboratory
cultures. However, only partial dechlorination to cis-
dichloroethene (cDCE) is often observed. A significant
challenge is to understand the factors that prevent
complete dechlorination beyond cDCE and vinyl
chloride (VC) to ethene. While many PCE-dechlorinat-
ing organisms have been isolated [3–9], only one,
Dehalococcoides ethenogenes Strain 195, is capable of
*Corresponding author. Tel.: +1-416-946-3506; fax: +1-
416-978-8605.
E-mail address: [email protected]
(E.A. Edwards).
0043-1354/02/$ - see front matter r 2002 Elsevier Science Ltd. All rights reserved.
PII: S 0 0 4 3 - 1 3 5 4 ( 0 2 ) 0 0 1 5 1 - 3
completely reducing PCE to ethene [10]. Moreover,
there is now evidence from laboratory and field
investigations that organisms closely related to D.
ethenogenes are present where complete dechlorination
is observed, and are absent where dechlorination is
incomplete [11–13].
In 1996, we constructed microcosms with soil and
groundwater samples obtained from a TCE-contami-
nated site in Southern Ontario. This particular site was
chosen because a geochemical investigation revealed
high concentrations of TCE and daughter products
including high levels of ethene (270 mM) in the ground-
water [14], suggesting that organisms capable of
complete dechlorination to ethene were active in situ.
Indeed, TCE was rapidly converted to ethene in
microcosms constructed with freshly collected site soil
and groundwater (collected aseptically and anaerobi-
cally) and incubated in the laboratory under anaerobic
conditions. Here, we describe the characteristics of
stable enrichment cultures derived from these original
TCE-dechlorinating microcosms, and demonstrate that
significant differences develop between enrichment
cultures established on each individual chlorinated
ethene.
The motivation for this study is the growing under-
standing and appreciation of the function and distribu-
tion of dechlorinating organisms in the subsurface
[12,13,15–17]. With a focus on managing the innumer-
able chlorinated ethene-contaminated sites worldwide,
new insight into the mechanisms and organisms involved
could significantly impact the optimization of biological
remediation strategies. We have conducted a number of
laboratory and field bioaugmentation studies using the
TCE enrichment culture described herein as inoculum
[18–20]. These studies and those of others have indicated
that the reason for stalled or incomplete dechlorination
in the field may not be the lack of appropriate conditions
in situ, but rather the lack of appropriate organisms to
carry the dechlorination to completion [13]. Since, many
contaminated sites do not exhibit dechlorination past
cDCE, and only one isolate is known to perform this
function, the discovery of new organisms capable of
dechlorinating cDCE and VC to ethene is clearly
needed. Ultimately, one could envisage a strategy where
bioaugmentation with specific dechlorinating enrich-
ment cultures could be used to stimulate slow dechlor-
ination steps in situ.
2. Materials and methods
2.1. Chemicals
Chlorinated alkanes and alkenes (>98% purity,
Sigma-Aldrich) were used to amend cultures and for
analytical standards. Methanol (HPLC Grade), ethanol,
sodium lactate, and a hydrogen gas mix (80% H2/20%
CO2, Praxair Specialty Gases and Equipment, Danbury,
CT) were used as electron donors. An 80% N2/20% CO2
gas mix (Praxair) was used as an anaerobic purge gas.
A 1% gas mix of methane, ethene and ethane in nitrogen
(Scotty II mix 216, Alltech Associates, Deerfield, IL) was
employed as an analytical standard.
2.2. Enrichment of dechlorinating cultures
The dechlorinating culture under study was originally
enriched anaerobically from soil and groundwater
obtained from a Southern Ontario TCE-contaminated
site. TCE (15 mM) present in the sample groundwater
was dechlorinated to ethene within a few weeks. After
several repeated amendments of TCE and methanol to
the microcosms, supernatant (30% v/v) from shaken
microcosms was transferred into sterile anaerobic
defined mineral medium [21]. Complete dechlorination
of progressively higher concentrations of TCE to ethene
was sustained through repeated transfers (10% v/v) into
sterile defined mineral medium. After 1 year, this TCE-
dechlorinating enrichment culture (referred to as KB-1)
was routinely fed TCE (150mM aqueous concentration)
and methanol (1.5 mM) every 2 weeks.
In 1998, four separate sets of cultures of KB-1 were
prepared that were amended with either PCE, TCE,
cDCE, or VC (referred to as KB-1/PCE, KB-1/TCE,
KB-1/cDCE and KB-1/VC, respectively). These cultures
were amended every 2 weeks with 100–300 mM (aqu-
eous) of one of the four chlorinated ethenes as electron
acceptor and about 1–3 mM methanol as electron
donor. PCE, TCE, and cDCE were added from
solutions of chlorinated ethenes in methanol. VC was
added as a neat gas using a gas-tight syringe. In the VC-
amended cultures, methanol was added from a separate
neat stock. These cultures have since been repeatedly
transferred to select for organisms specifically required
for each dechlorination step. Incubation of all enrich-
ment cultures was carried out statically in an anaerobic
chamber (Coy Lab. Products Inc., Glasslake, MI) at
room temperature. For all culture transfers and for
sampling, either sterile disposable syringes and needles
were used or needles were sterilized with an incandescent
loop in the anaerobic chamber immediately prior to use.
Culture stoppers were wiped with isopropyl alcohol
immediately before sampling to maintain sterility and
prevent cross-contamination.
2.3. Electron donors and chlorinated electron acceptors
used by KB-1
A variety of substrates were tested to determine the
range of electron donors and acceptors used by KB-1
culture amended with TCE (called KB-1/TCE). For
each substrate tested, a set of vials sealed with Mininert
M. Duhamel et al. / Water Research 36 (2002) 4193–42024194
screw caps (VICI Precision Sampling, Inc., Baton
Rouge, LA) was filled with anaerobic medium. The
vials were amended with equal electron-mole equivalents
of each donor or acceptor being tested and inoculated
with 5% (v/v) KB-1/TCE culture. Each condition was
tested in duplicate or triplicate. Vials were sampled every
2–3 days for chlorinated ethenes, ethene and methane
concentrations.
2.4. Effect of chloroform (CF) and 1,1,1-trichloroethane
(1,1,1-TCA) on TCE dechlorination
In a preliminary experiment, the effects of CF and
1,1,1-TCA on the dechlorination process were evaluated
at concentrations ranging from 4 to 20 mM (aqueous).
CF was found to have a much stronger inhibitory effect
on TCE dechlorination than 1,1,1-TCA, therefore, a
second experiment was conducted to look at the effects
of CF more closely. Twenty-four 40-ml vials sealed with
Mininert caps were prepared as follows. The vials were
amended with excess methanol (1 mM) and equal
electron equivalents of one of either TCE, cDCE or
VC (corresponding to aqueous concentrations of 14 mM
TCE, 21mM cDCE and 42 mM VC) along with either
zero, 0.4, 2.5 or 6.7mM (aqueous) CF. Each condition
was tested in duplicate, and all treatments received an
identical 10% (v/v) inoculum from the same bottle of
KB-1/TCE culture.
2.5. Cross-acclimation study
This experiment was designed to determine if the
cultures KB-1/TCE, KB-1/cDCE, and KB-1/VC could
still dechlorinate chlorinated ethenes more chlorinated
than their respective enrichment substrates. These
cultures had not been exposed to more chlorinated
ethenes for over 2 years. A series of glass bottles sealed
with Teflon-coated butyl rubber stoppers were amended
with the equal electron equivalents of either PCE, TCE,
cDCE or VC and neat methanol (in excess) as electron
donor.
2.6. Denaturing gradient gel electrophoresis (DGGE) of
amplified bacterial 16S rRNA gene fragments
DNA was extracted from each enrichment culture
using a method adapted from Miller et al. [22]. Briefly,
50 ml of culture was centrifuged to pellet cells, and
resuspended in TENS buffer (50 mM Tris-HCl; 20 mM
EDTA pH 8; 100 mM NaCl; 1% w/v SDS). Glass beads
(106mm) were then added to the mixture. After
vortexing, the samples were incubated at 701C for
20 min, and then homogenized in a Mini-BeadbeaterTM
Model 3110 BX (Biospec Products, Bartlesville, OK) on
medium speed for 190 s. The samples were then
centrifuged, and the supernatant was transferred to
fresh (1.5 ml) Eppendorf tubes. DNA was precipitated
using sodium acetate and 100% ethanol, centrifuged,
and then washed with 70% ethanol to remove salts. The
final DNA pellet was resuspended in TE buffer (10 mM
Tris-HCl pH 8; 1 mM EDTA pH 8; in autoclaved water)
and frozen at �201C. DGGE analysis, including PCR
amplification of 16S rRNA gene fragments, DGGE, and
sequencing of bands was conducted by Microbial
Insights Inc. (Rockford, TN). 16S rRNA gene fragments
were amplified from genomic DNA using the general
bacterial primers 50-CGCCCGCCGCGCGCGGCGGGC-
GGGGCGGGGGCACGGGGGGCCTACGGGAGGCA-
GCAG-30 and 50-ATTACCGCGGCTGCTGG-3’ as
described in Muyzer et al. [23], except that 35 thermo-
cycles were carried out per amplification. These primers
amplify a region of the 16S rRNA gene corresponding to
positions 341–533 in E. coli. DGGE was performed
using a 16� 16 cm gel system (BioRad, Hercules, CA)
maintained at a constant temperature in TAE buffer
(40 mM Tris-HCl; 40 mM glacial acetic acid; 1 mM
EDTA pH 8). A gradient ranging from 20% to 55%
denaturant (7 M urea with 40% v/v deionized forma-
mide) as denaturant was employed. After electrophor-
esis, the gel was stained with ethidium bromide and gel
images were captured using an Alpha Imagers system.
The central portions of bands of interest were excised
and soaked in elution buffer (0.3 M NaCl, 0.3 mM
EDTA, 30 mM Tris, pH=7.6) overnight at 371C. The
DNA was purified using a Gene-Cleans kit and
reamplified with the same primers as for the initial
PCR reaction. The reamplified products were again
purified and sequenced (each sample sequenced only
once) with an ABI-Prism automatic sequencer using the
reverse primer listed above, resulting in a sequence of
about 145 base pairs long. Sequence comparisons were
performed using the BLASTN facility of the National
Center for Biotechnology Information (http://ncbi.nlm.-
nih.gov/BLAST) and the ‘‘Sequence Match’’ facility of
the Ribosomal Database Project (RDPII, [24]) (http://
www.cme. msu.edu/RDP/analyses.html).
2.7. Analytical procedures
Chlorinated ethenes and ethanes, methane, and ethene
were analyzed by injecting a 300 ml headspace sample
onto a Hewlett-Packard 5890 Series II Gas Chromato-
graph (GC) fitted with a GSQ 30 m� 0.53 mm I.D.
PLOT column (J&W Scientific, Folsom, CA) and a
flame ionization detector. The oven temperature was
programmed to hold at 351C for 2 min to elute methane
and ethene, then to increase to 1801C at 601C/min, and
finally hold for 4 min at 1801C. Calibration was with
external standards. Chlorinated ethene aqueous stan-
dard solutions were prepared gravimetrically from
concentrated methanolic stock solutions (also prepared
gravimetrically). GC peak areas were correlated to the
M. Duhamel et al. / Water Research 36 (2002) 4193–4202 4195
total mass of chlorinated ethene added to a given
calibration bottle. Calibration bottles were prepared
with the same volumes of headspace and liquid as in
experimental bottles. The dimensionless Henry’s law
constants used to estimate actual aqueous phase
concentrations at 251C were 0.93 for PCE, 0.48 for
TCE, 0.31 for cDCE and 0.95 for VC [25]. For methane
and ethene, a purchased gas standard containing a mix
of 1% methane, ethene and ethane in nitrogen was used
for calibration. Because of the significant volatility of
the chlorinated ethenes, ethene, and methane, mole
balances and absolute rates of dechlorination were
calculated using total moles or electron-mole equivalents
per bottle (in both the gas and liquid phases). However,
for the sake of comparison with other studies, aqueous
concentrations are often reported. Protein concentration
in cultures was measured by the method of Bradford [26]
using a microassay kit (Bio-Rad) and bovine serum
albumin as a standard. The detection limit for protein
was 3mg/ml of sample. Lower detection limits were
achieved by first concentrating a culture sample by
centrifugation.
3. Results and discussion
3.1. Enrichment of KB-1 and development of subcultures
A stable TCE-dechlorinating culture, called KB-1/
TCE, was enriched from initial microcosms. Subcultures
maintained with either PCE, cDCE, or VC for over 2
years (referred to as KB-1/PCE, KB-1/cDCE and KB-1/
VC, respectively) were generated from the original TCE-
fed culture. In all cultures, dechlorination rates have
steadily increased with time. Of particular interest was
the sustained dechlorination in the KB-1/VC enrichment
cultures. These cultures, when closely monitored,
sustained dechlorination rates of up to 100mmol VC/l/
day with either methanol or hydrogen as electron donor.
Flynn et al. [27] also described an enrichment culture
capable of sustained VC dechlorination in a completely
defined medium. Sustained dechlorination of VC in the
absence of other chlorinated ethenes is significant, since
dechlorination of VC with D. ethenogenes Strain 195 is
cometabolic and cannot be sustained without exposure
to a higher chlorinated ethene, as well as anaerobic
digestor sludge supernatant [28]. The long-term viability
(>3 years) and high dechlorination rates in enrichment
cultures sustained on weekly additions of PCE, TCE,
cDCE, and VC suggested that dechlorination was
associated with growth. Moreover, protein concentra-
tion increased more in cultures amended with chlori-
nated ethenes compared to cultures to which donor, but
no chlorinated ethenes, had been added (data not
shown). Specific rates of dechlorination normalized to
total protein concentration were calculated for 14
different enrichment cultures dechlorinating different
chlorinated ethenes. Overall, these dechlorination rates
were similar and averaged about 1.0 (70.4) mmol/h/mg
total protein. Protein concentrations were typically
around 5 mg/l, but values as high as 20 mg/l were
obtained in some cultures. However, in a mixed culture,
total protein concentration may not be a particularly
good quantity for normalization, because it includes not
only the protein from active dechlorinating organisms,
but also the protein from non-dechlorinating organisms
such as acetogens and methanogens, and possibly
inactive organisms as well. Therefore, when comparing
our own enrichment cultures in this report, rates are
reported per unit volume of culture medium. In any
case, care should be taken in comparing dechlorination
rates from different studies, as they are frequently
normalized to different quantities, such as total biomass,
total protein, or culture volume.
3.2. Electron donors used by KB-1
Methanol, ethanol, hydrogen, lactate, and propionate
(but not acetate) could all serve as electron donors for
sustaining dechlorination. Moreover, when a stable
toluene-degrading, non-dechlorinating methanogenic
culture [29] was mixed with KB-1, toluene could also
serve as an effective electron donor. Although methanol
is not thought to be a good substrate for dechlorination
because it is a substrate for methanogenic bacteria and
does not yield a large amount of hydrogen on
fermentation, we used methanol for long-term culture
maintenance since it worked well. Varying the initial
methanol concentration did not significantly affect the
rate or extent of dechlorination, but did have a profound
effect on the amount of methane produced. By feeding
lower concentrations of methanol, we could minimize
methane production. Dechlorination rates with metha-
nol were always equal to or better than rates with other
donors. It is possible that the methanol-degrading
organisms, known to synthesize high concentrations of
cobalt-containing cofactors [30], may be providing key
trace nutrients to the dechlorinators.
3.3. Maximum concentrations of chlorinated ethenes
dechlorinated by specific KB-1 cultures
Complete dechlorination readily occurred with initial
aqueous concentrations of TCE up to a maximum of
1.5 mM, VC up to 1.4 mM, cDCE up to 800 mM, and
PCE up to 800mM. It is possible that the lower
concentration maximum for cDCE was due to the
presence of CF or other contaminants in the cDCE, as
reported by others [17]. With PCE, dechlorination
stopped abruptly, even when H2 was added as a direct
electron donor, when concentrations approached the
solubility of PCE (about 800mM). This inhibition may
M. Duhamel et al. / Water Research 36 (2002) 4193–42024196
have been related to the development of a separate, non-
aqueous PCE phase.
3.4. Compounds dechlorinated by KB-1/TCE
The ability of KB-1/TCE to dechlorinate a variety of
other chlorinated substrates, including 1,1-DCE and
trans-1,2-DCE, 1,2-dicloroethane, 1,1,1-trichloroethane
and chloroform, at concentrations of approximately 30–
50mM was evaluated. KB-1/TCE rapidly and sustain-
ably dechlorinated 1,1-DCE at a rate comparable to that
of cDCE. In contrast, KB-1/TCE dechlorinated trans-
DCE at a rate that was approximately five times slower
than that with cDCE, and an increase in rate with time
was not observed. No dechlorination of 1,2-dichlor-
oethane (1,2-DCA) was observed over several months of
incubation. This is in contrast to other TCE-dechlor-
inating pure and mixed cultures that have been shown to
also readily dechlorinate 1,2-DCA [3,28,31]. CF and
1,1,1-TCA (3–30mM) were not significantly dechlori-
nated by KB-1/TCE over a 1-month period in incuba-
tions with and without chlorinated ethenes present. This
was somewhat unexpected given the possibility for
cometabolic degradation of these compounds by metha-
nogens [32,33].
3.5. Effect of CF and 1,1,1-TCA on TCE dechlorination
Since many sites are contaminated with mixtures of
chlorinated solvents, a better understanding of co-
contaminant effects is needed for the selection of
appropriate remediation strategies. 1,1,1-TCA [34] and
especially CF [35] are known to inhibit methanogenesis,
and may also interfere with reductive dechlorination
[36,17]. A preliminary experiment with KB-1/TCE
demonstrated that both CF and 1,1,1-TCA slowed
dechlorination. Most notably, ethene production from
VC was completely inhibited at a CF aqueous concen-
tration of 3.8mM (450mg/l) and at a 1,1,1-TCA
concentration of between 5.2 and 22mM (700 and
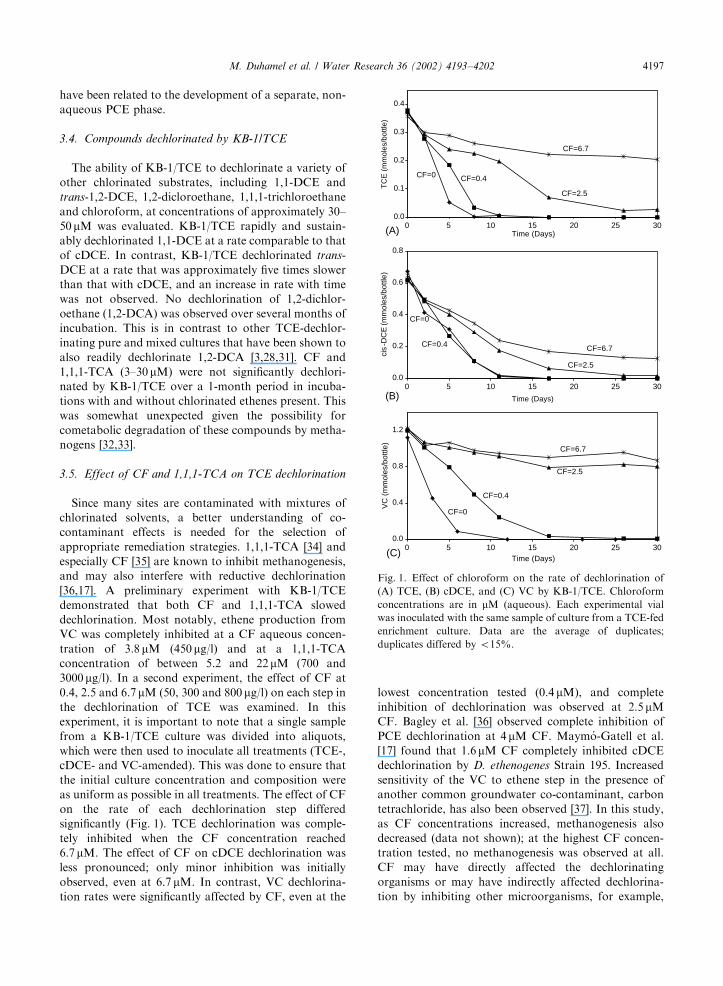
3000mg/l). In a second experiment, the effect of CF at
0.4, 2.5 and 6.7mM (50, 300 and 800mg/l) on each step in
the dechlorination of TCE was examined. In this
experiment, it is important to note that a single sample
from a KB-1/TCE culture was divided into aliquots,
which were then used to inoculate all treatments (TCE-,
cDCE- and VC-amended). This was done to ensure that
the initial culture concentration and composition were
as uniform as possible in all treatments. The effect of CF
on the rate of each dechlorination step differed
significantly (Fig. 1). TCE dechlorination was comple-
tely inhibited when the CF concentration reached
6.7mM. The effect of CF on cDCE dechlorination was
less pronounced; only minor inhibition was initially
observed, even at 6.7 mM. In contrast, VC dechlorina-
tion rates were significantly affected by CF, even at the
lowest concentration tested (0.4 mM), and complete
inhibition of dechlorination was observed at 2.5 mM
CF. Bagley et al. [36] observed complete inhibition of
PCE dechlorination at 4 mM CF. Maym !o-Gatell et al.
[17] found that 1.6mM CF completely inhibited cDCE
dechlorination by D. ethenogenes Strain 195. Increased
sensitivity of the VC to ethene step in the presence of
another common groundwater co-contaminant, carbon
tetrachloride, has also been observed [37]. In this study,
as CF concentrations increased, methanogenesis also
decreased (data not shown); at the highest CF concen-
tration tested, no methanogenesis was observed at all.
CF may have directly affected the dechlorinating
organisms or may have indirectly affected dechlorina-
tion by inhibiting other microorganisms, for example,
0.0
0.1
0.2
0.3
0.4
0 5 10 15 20 25 30Time (Days)
TC
E(m
mol
es/b
ottle
)
(A)
CF=6.7
CF=2.5
CF=0.4CF=0
0.0
0.2
0.4
0.6
0.8
0 5 10 15 20 25 30
Time (Days)
cis
-DC
E(m
mol
es/b
ottle
)
(B)
CF=6.7
CF=2.5
CF=0
CF=0.4
0.0
0.4
0.8
1.2
0 5 10 15 20 25 30Time (Days)
VC
(m
mol
es/b
ottle
)
(C)
CF=6.7
CF=2.5
CF=0.4
CF=0
Fig. 1. Effect of chloroform on the rate of dechlorination of
(A) TCE, (B) cDCE, and (C) VC by KB-1/TCE. Chloroform
concentrations are in mM (aqueous). Each experimental vial
was inoculated with the same sample of culture from a TCE-fed
enrichment culture. Data are the average of duplicates;
duplicates differed by o15%.
M. Duhamel et al. / Water Research 36 (2002) 4193–4202 4197
methanogenic bacteria, on which the dechlorinating
organisms depended.
3.6. Direct comparison of the four enrichment cultures
To better understand differences between the micro-
bial populations responsible for each dechlorination
step, the four enrichment cultures were directly com-
pared in two experiments: (1) a cross-acclimation study
to evaluate any changes in substrate range and (2) a
molecular study to contrast bacterial community com-
position.
3.7. Cross-acclimation study
This study was performed to determine if, over the 2
years since their creation in 1998, the KB-1 enrichment
cultures sustained on less chlorinated ethenes had
lost the ability to transform any of the higher
chlorinated ethenes. The most significant finding was
that PCE was no longer dechlorinated by the KB-1/VC
enrichment culture (Table 1). This result has also
been observed for another VC enrichment culture [27].
In addition, while both TCE and cDCE were dechlori-
nated by the KB-1/VC enrichment culture, dechlorina-
tion rates decreased as the extent of chlorination
increased. Results for both the KB-1/cDCE and
the KB-1/TCE enrichment cultures revealed a similar
trend, although PCE was still dechlorinated by
these cultures (Table 1); a similar result was observed
by Maym !o-Gatell et al. [17] for D. ethenogenes
Strain 195.
3.8. Microbial community composition
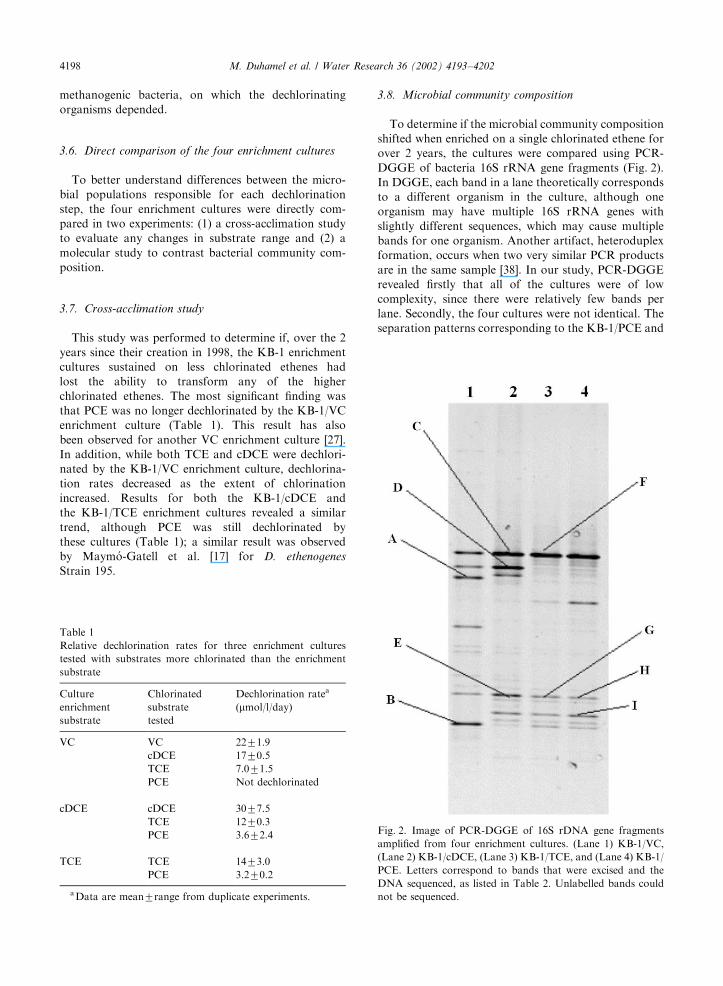
To determine if the microbial community composition
shifted when enriched on a single chlorinated ethene for
over 2 years, the cultures were compared using PCR-
DGGE of bacteria 16S rRNA gene fragments (Fig. 2).
In DGGE, each band in a lane theoretically corresponds
to a different organism in the culture, although one
organism may have multiple 16S rRNA genes with
slightly different sequences, which may cause multiple
bands for one organism. Another artifact, heteroduplex
formation, occurs when two very similar PCR products
are in the same sample [38]. In our study, PCR-DGGE
revealed firstly that all of the cultures were of low
complexity, since there were relatively few bands per
lane. Secondly, the four cultures were not identical. The
separation patterns corresponding to the KB-1/PCE and
Table 1
Relative dechlorination rates for three enrichment cultures
tested with substrates more chlorinated than the enrichment
substrate
Culture
enrichment
substrate
Chlorinated
substrate
tested
Dechlorination ratea
(mmol/l/day)
VC VC 2271.9
cDCE 1770.5
TCE 7.071.5
PCE Not dechlorinated
cDCE cDCE 3077.5
TCE 1270.3
PCE 3.672.4
TCE TCE 1473.0
PCE 3.270.2
a Data are mean7range from duplicate experiments.
Fig. 2. Image of PCR-DGGE of 16S rDNA gene fragments
amplified from four enrichment cultures. (Lane 1) KB-1/VC,
(Lane 2) KB-1/cDCE, (Lane 3) KB-1/TCE, and (Lane 4) KB-1/
PCE. Letters correspond to bands that were excised and the
DNA sequenced, as listed in Table 2. Unlabelled bands could
not be sequenced.
M. Duhamel et al. / Water Research 36 (2002) 4193–42024198
KB-1/TCE cultures were similar. There was a clear shift
in the population composition between the KB-1/TCE
and KB-1/cDCE cultures, and another substantial shift
between the KB-1/cDCE and KB-1/VC cultures. These
data provide evidence for different microbial commu-
nities in each culture, consistent with the cross-acclima-
tion study results.
The brightest bands in the denaturing gradient gel
(labeled with letters in Fig. 2) were excised and the
reamplified DNA fragments were partially sequenced
and compared to known sequences using BLASTN and
the RDP (Table 2). Certain bands in the gel corre-
sponded to organisms closely related to D. ethenogenes
Strain 195 or another very similar organism based on
16S rRNA sequence; called CBDB1 [40]. The separation
of KB-1 DNA by DGGE yielded three different bands
with sequences very similar to that of Dehalococcoides
ethenogenes. These data suggested that perhaps three
different microorganisms related to D. ethenogenes were
present in the cultures. The six sequences retrieved from
these three band positions (C, E, F, G, H and I) were
aligned with the sequence of D. ethenogenes Strain 195.
Unfortunately, only a limited amount of sequence data
(145 bp) was provided by Microbial Insights, corre-
sponding to positions 303–449 of the D. ethenogenes 16S
rRNA sequence. Overall, there was a maximum of 3
differences between the sequences obtained from DNA
fragments in the gel and D. ethenogenes Strain 195 in
this region. All of the sequences had a G deletion at
position 432 of the D. ethenogenes sequence. Sequences
for bands E, G, H and I had a T deletion at position 441
and band I had an A to C substitution at position 394.
These slight differences in sequences were consistent
with the observation of three distinct bands on a
denaturing gradient gel. It is unlikely that these
differences were due to PCR, sequencing errors, or
chimeras since the same three bands were observed in
sequences derived from three separate DNA extractions
(i.e. the three lanes corresponding to the KB-1/cDCE,
KB-1/TCE, and KB-1/PCE cultures). Recently, Hen-
drickson et al. [13] found two distinct Dehalococcoides
sequences in a KB-1/TCE enrichment culture sample
that we sent to them (GenBank Accession numbers
AF388540 and AF388539). However, the differences we
found in this present study using DGGE do not
correspond to the same differences reported by Hen-
drickson et al. Further cloning work is underway to
identify all of the Dehalococcoides 16S rRNA sequences
in KB-1 enrichment cultures.
The sequences of the other bands in the DGGE gel
indicated the presence of common soil organisms. Band
D, whose 145 bp sequence was 100% match to several
Acetobacterium species, was intense in the KB-1/cDCE
separation pattern and to a lesser degree in the KB-1/VC
separation pattern, but not in the KB-1/TCE and KB-1/
PCE patterns. Although this may seem to illustrate that
Acetobacterium species are present in greater number in
KB-1/VC and KB-1/cDCE, biases in the DNA extrac-
tion steps and PCR amplification make quantitative
assessment unreliable. Acetobacterium species can grow
on CO2 plus H2 and other organic substrates such as
methanol [41].
Of the four gel patterns, the one corresponding to KB-
1/VC was the most distinct, containing two bright bands
(A and B) not seen in other patterns. Band A may
correspond to a distant relative of Sulfurospirillum
deleyianum, an organism that has been shown to use
H2 and sulfide as electron donors and acetate as a
carbon source with a variety of electron acceptors [42].
Band B shared up to 99% similarity with many
uncultured soil organisms, although its closest isolated
relative (89% similarity) was Hippea maritima, a
Table 2
DGGEa band sequencing results
Band Best matches Accession numbers Similarityb (%)
A Sulfurospirillum deleyianum Y13671 83
B Uncultured soil bacterium PBS-111-32a AJ390460 99
Hippea maritima Y18292 89
D Acetobacterium paludosum X96958 100
Acetobacterium psammolithicum AF132739 100
Acetobacterium carbinolicum X96956 100
C and F Dehalococcides ethenogenes AF004928 98
CBDB1 AF230641 99 (F); 100 (C)
E, G, H Dehalococcides ethenogenes AF004928 96
CBDB1 AF230641 98
I Dehalococcides ethenogenes AF004928 98
CBDB1 AF230641 97
a DGGE shown in Fig. 2.b Based on BLASTn search of ca.145 bp fragments [39].
M. Duhamel et al. / Water Research 36 (2002) 4193–4202 4199
thermophilic sulfate-reducer found in submarine hot
vents [43]. No potential role for the population
associated with this band has yet been identified.
Another distinguishing feature of the KB-1/VC gel
pattern is that one of the bands for D. ethenogenes-like
sequences (corresponding to band I) was absent.
Perhaps this band corresponds to a strain similar to D.
ethenogenes Strain 195 that cannot grow on VC alone.
Efforts are underway to isolate dechlorinating organ-
isms from KB-1/VC.
The observed differences in degradative abilities and
community composition between the various KB-1
cultures are consistent with the results of carbon
fractionation studies done with KB-1 and other de-
chlorinating cultures [44,45]. These studies showed that
isotope fractionation during each dechlorination step
was reproducible, was different for each step in the
dechlorination pathway, and fit to a Raleigh model
[44,45]. The fractionation factor, the parameter of the
Raleigh model, is a characteristic of the reaction.
Significantly different fractionation factors were ob-
served for each dechlorination step, implying that a
different reaction mechanism is used for each dechlor-
ination step.
4. Conclusions
* A set of highly enriched and effective dechlorinating
enrichment cultures have been developed that use
methanol, hydrogen and other electron donors and
dechlorinate PCE, TCE, cDCE or VC completely to
ethene.* Cultures enriched on cDCE, TCE and PCE may
harbor three distinct close relatives of D. ethenogenes
Strain 195, an organism that completely dechlori-
nates chlorinated ethenes and 1,2-dichloroethane to
ethene in pure culture.* The KB-1/TCE enrichment culture does not dechlor-
inate 1,2-dichloroethane (in contrast to D. etheno-
genes Strain 195 and other dechlorinating enrichment
cultures).* The KB-1/VC enrichment culture can be maintained
on VC indefinitely and, after a prolonged period of
time, lost the ability to dechlorinate PCE.* CF and 1,1,1-TCA, frequent groundwater co-con-
taminants with chlorinated ethenes, are potent
inhibitors of chlorinated ethene dechlorination by
KB-1/TCE.
Acknowledgements
The authors would like to thank David Major, Phil
Dennis (GeoSyntec Consultants, Guelph, ON), Ed
Hendrickson (DuPont, Wilmington, DE), Anna Ro-
bertson (McMaster University, ON), Frank Loffler
(Georgia Institute of Technology), Sophie Walewijk,
Kirsten Krastel, and Kaiguo Mo (University of Tor-
onto) for their advice and assistance. The authors would
also like to thank the anonymous reviewers for their
very helpful comments. This research was financially
supported by research grants from GeoSyntec Con-
sultants, from the Natural Sciences and Engineering
Research Council of Canada (NSERC), and from the
University of Toronto.
References
[1] Freedman DL, Gossett JM. Biological reductive dechlor-
ination of tetrachloroethylene and trichloroethylene to
ethylene under methanogenic conditions. Appl Environ
Microbiol 1989;55:2144–51.
[2] Major DM, Hodgins EW, Butler BJ. Field and laboratory
evidence of in situ biotransformation of tetrachloroethene
to ethene and ethane at a chemical transfer facility in
North Toronto. In: Hinchee RE, Olfenbuttel RF, editors.
On-site bioremediation. Stoneham: Butterworth-Heine-
mann, 1991. p. 147–71.
[3] Chang YC, Hatsu M, Jung K, Yoo YS, Takamizawa K.
Isolation and characterization of a tetrachloroethylene
dechlorinating bacterium, Clostridium bifermentans DPH-
1. J Biosci Bioeng 2000;89:489–91.
[4] Gerritse J, Drzyzga O, Kloetstra G, Keijmel M, Wiersum
LP, Hutson R, Collins MD, Gottschal JC. Influence of
different electron donors and accepters on dehalorespira-
tion of tetrachloroethene by Desulfitobacterium frappieri
TCE1. Appl Environ Microbiol 1999;65:5212–21.
[5] Holliger C, Hahn D, Harmsen H, Ludwig W, Schumacher
W, Tindall B, Vazquez F, Weiss N, Zehnder AJB.
Dehalobacter restrictus gen. Nov. and sp. nov., a strictly
anaerobic bacterium that reductively dechlorinates tetra-
and trichloroethene in an anaerobic respiration. Arch
Microbiol 1998;169:313–21.
[6] Krumholz LR, Sharp R, Fishbain SS. A freshwater
anaerobe coupling acetate oxidation to tetrachloroethylene
dehalogenation. Appl Environ Microbiol 1996;62:4108–13.
[7] Miller E, Wohlfarth G, Diekert G. Studies on tetra-
chloroethene respiration in Dehalospirillum multivorans.
Arch Microbiol 1997;166:379–87.
[8] Scholz-Muramatsu H, Neumann A, Messmer M, Moore
E, Diekert G. Isolation and characterization of Dehalos-
pirillum multivorans gen-nov, sp-nov, a tetrachloroethene-
utilizing, strictly anaerobic bacterium. Arch Microbiol
1995;163:48–56.
[9] Wild AP, Hermann R, Leisinger T. Isolation of an
anaerobic bacterium which reductively dechlorinateds
tetrachloroethene and trichloroethene. Biodegradation
1996;7:507–11.
[10] Maym!o-Gatell X, Chien Y-T, Gossett JM, Zinder SH.
Isolation of a bacterium that reductively dechlorinates
tetrachloroethene to ethene. Science 1997;276:1568–71.
[11] Elberson MA, Tabinowski JA, Ebersole RC, Ellis DE,
Hendrickson ER. Detection and characterization of
M. Duhamel et al. / Water Research 36 (2002) 4193–42024200
Dehalococcoides ethenogenes’ 16S rRNA sequences in
groundwater and soils from waste sites contaminated with
PCE and TCE (Poster Presentation). In: 100th General
Meeting of the American Society for Microbiology,
Abstract Q-125. Los Angeles, CA: American Society for
Microbiology.
[12] Fennell DE, Carroll AB, Gossett JM, Zinder SH.
Assessment of indigenous reductive dechlorinating poten-
tial at a TCE-contaminated site using microcosms,
polymerase chain reaction analysis, and site data. Environ
Sci Technol 2001;35:1830–9.
[13] Hendrickson ER, Payne JA, Young RM Starr MG, Perry
MP, Fahnestock S, Ellis DE, Ebersole RC. Molecular
analysis of Dehalococcoides 16S rDNA from chloroethene-
contaminated sites throughout North America and Eur-
ope. Appl Environ Microbiol 2002;68:485–96.
[14] Edwards E, Cox E. Field and laboratory studies of
sequential anaerobic–aerobic chlorinated solvent biode-
gradation. In: In situ and on-site bioremediation, vol. 3,
Fourth International Symposium on In Situ and On-Site
Bioreclamation, New Orleans, LA. Columbus, OH:
Battelle Press, 1997. p. 261–5.
[15] Loffler FE, Sun Q, Li JR, Tiedje JM. 16S rRNA gene-
based detection of tetrachloroethene-dechlorinating Desul-
furomonas and Dehalococcoides species. Appl Environ
Microbiol 2000;66:1369–74.
[16] Magnuson JK, Romine MF, Burris DR, Kingsley MT.
Trichloroethene reductive dehalogenase from Dehalococ-
coides ethenogenes: sequence of tceA and substrate
range characterization. Appl Environ Microbiol 2000;66:
5141–7.
[17] Maym !o-Gatell X, Nijenhuis I, Zinder SH. Reductive
dechlorination of cis-1,2-dichloroethene and vinyl chloride
by ‘‘Dehalococcoides ethenogenes’’. Environ Sci Technol
2001;35:516–21.
[18] Cox E, McMaster M, McAlary TA, Major DW, Lehmicke
L, Edwards EA. Accelerated bioremediation of trichlor-
oethene: from field and laboratory studies to full scale. In:
First International Conference on Remediation of Chlori-
nated and Recalcitrant Compounds. Monterey, California:
Battelle, 1998.
[19] Duhamel M. Optimization of conditions for bioaugmenta-
tion of TCE-contaminated sites. B.A.Sc. thesis, University
of Toronto, 2000.
[20] Major DW, McMaster ML, Cox EE, Lee BJ, Gentry EE,
Edwards EA, Dworatzek S. Successful field demonstration
of bioaugmentation to degrade PCE and TCE to ethene.
In: In Situ and On-site Bioremediation Conference. San
Diego, CA: Battelle, 2001.
[21] Edwards EA, Grbic-Galic D. Anaerobic degradation of
toluene and o-xylene by a methanogenic consortium. Appl
Environ Microbiol 1994;60:313–22.
[22] Miller DN, Bryant JE, Madsen EL, Ghiorse WC.
Evaluation and optimization of DNA extraction and
purification procedures for soil and sediment samples.
Appl Environ Microbiol 1999;65:4715–24.
[23] Muyzer G, Dewaal EC, Uitterlinden AG. Profiling of
complex microbial populations by denaturing gradient gel
electrophoresis analysis of polymerase chain reaction-
amplified genes coding for 16S rRNA. Appl Environ
Microbiol 1993;59:695–700.
[24] Maidak BL, Cole JR, Lilburn TG, Parker CTJ, Saxman
PR, Farris RJ, Garrity GM, Olsen GJ, Schmidt TM,
Tiedje JM. The RDP-II (Ribosomal Database Project).
Nucleic Acids Res 2001;29:173–4.
[25] Mackay D, Shiu WY. A critical review of Henry’s Law
constants for chemicals of environmental interest. J Phys
Chem Ref Data 1981;10:1175–99.
[26] Bradford M. A rapid and sensitive method for the
quantitation of microgram quantities of protein utilizing
the principle of protein-dye binding. Anal Biochem
1976;72:248–54.
[27] Flynn SJ, Loffler FE, Tiedje JM. Microbial community
changes associated with a shift from reductive dechlorina-
tion of PCE to reductive dechlorination of cis-DCE and
VC. Environ Sci Technol 2000;34:1056–61.
[28] Maym!o-Gatell X, Anguish T, Zinder SH. Reductive
dechlorination of chlorinated ethenes and 1,2 dichloro-
ethane by ‘‘Dehalococcoides ethenogenes’’ 195. Appl
Environ Microbiol 1999;65:3108–13.
[29] Ficker M, Krastel K, Orlicky S, Edwards E. Molecular
characterization of a toluene degrading methano-
genic consortium. Appl Environ Microbiol 1999;65:
5576–85.
[30] Florencio L, Field JA, Lettinga G. Importance of cobalt
for individual trophic groups in an anaerobic methanol-
degrading consortium. Appl Environ Microbiol
1994;60:227–34.
[31] Wild AP, Winkelbauer W, Leisinger T. Anaerobic
dechlorination of trichloroethene, tetrachloroethene and
1,2-dichloroethane by and acetogenic mixed culture in a
fixed-bed reactor. Biodegradation 1995;6:309–18.
[32] Chen C, Ballapragada BS, Puhakka JA, Strand SE,
Ferguson JF. Anaerobic transformation of 1,1,1-trichloro-
ethane by municipal digester sludge. Biodegradation
1999;10:297–305.
[33] Vogel TM, McCarty PL. Abiotic and biotic transforma-
tion of 1,1,1-trichloroethane under methanogenic condi-
tions. Environ Sci Technol 1987;21:1208–13.
[34] Erasin BR, Turner APF, Wheatley AD. A fixed-film
bioassay for the detection of micropollutants toxic to
anaerobic sludges. Anal Chim Acta 1994;298:1–10.
[35] Chidthaisong A, Conrad R. Specificity of chloroform, 2-
bromoethanesulfonate and fluoroacetate to inhibit metha-
nogenesis and other anaerobic processes in anoxic rice field
soil. Soil Biol Biochem 2000;32:977–88.
[36] Bagley DM, Lalonde M, Kaseros V, Stasiuk KE, Sleep
BE. Acclimation of anaerobic systems to biodegrade
tetrachloroethene in the presence of carbon tetrachloride
and chloroform. Water Res 2000;34:171–8.
[37] Adamson DT, Parkin GF. Impact of mixtures of
chlorinated aliphatic hydrocarbons on a high-rate, tetra-
chloroethene-dechlorinating enrichment culture. Environ
Sci Technol 2000;34:1959–65.
[38] Ferris MJ, Ward DM. Seasonal distributions of
dominant 16S rRNA-defined populations in a hot
spring microbial mat examined by denaturing gradient
gel electrophoresis. Appl Environ Microbiol 1997;63:
1375–81.
[39] Altschul SF, Gish W, Miller W, Myers EW, Lipman DJ.
Basic local alignment search tool. J Mol Biol
1990;215:403–10.
M. Duhamel et al. / Water Research 36 (2002) 4193–4202 4201
[40] Adrian L, Szewzyk U, Wecke J, Gorlsch H. Bacterial
dehalorespiration with chlorinated benzenes. Nature
2000;408:580–3.
[41] Kevbrina MV, Pusheva MA. Excretion of acetate in
homoacetogenic bacteria. Microbiol 1996;65:10–4.
[42] Eisenmann E, Beuerle J, Sulger K, Kroneck PMH,
Schumacher W. Lithotrophic growth of Sulfurospirillum
deleyianum with sulfide as electron-donor coupled to
respiratory reduction of nitrate to ammonia. Arch Micro-
biol 1995;164:180–5.
[43] Miroshnichenko ML, Rainey RF, Rhode M, Bonch-
Osmolovskaya EA. Hippea maritima gen. nov., sp. nov.,
a new genus of thermophilic, sulfur-reducing bacterium
from submarine hot vents. Int J Syst Bacteriol
1999;49:1033–8.
[44] Bloom Y, Aravena R, Hunkeler D, Edwards E, Frape SK.
Carbon isotope fractionation during microbial dechlorina-
tion of trichloroethene, cis-1,2 dichloroethene, and vinyl
chloride: implications for assessment of natural attenua-
tion. Environ Sci Technol 2000;34:2768–72.
[45] Slater GF, Lollar BS, Sleep BE, Edwards EA. Variability
in carbon isotope fractionation during biodegradation of
contaminated ethenes: implications for field applications.
Environ Sci Technol 2001;35:901–7.
M. Duhamel et al. / Water Research 36 (2002) 4193–42024202
Related Documents


![Biochimica et Biophysica Acta - gchemhoffman.cm.utexas.edu/courses/wood_lungdahl_1.pdf · waste water treatment facility [16] and a dechlorinating community that has been enriched](https://static.cupdf.com/doc/110x72/5c73eca709d3f2123b8bd2ac/biochimica-et-biophysica-acta-waste-water-treatment-facility-16-and-a-dechlorinating.jpg)


