International Journal of Systematic and Evolutionary Microbiology (2000), 50, 665–677 Printed in Great Britain Comparison of AFLP and rep-PCR genomic fingerprinting with DNA–DNA homology studies : Xanthomonas as a model system Jan L. W. Rademaker, 1 † Bart Hoste, 5 Frank J. Louws, 1,3,4 Karel Kersters, 6 Jean Swings, 5,6 Luc Vauterin, 7 Paul Vauterin 7 and Frans J. de Bruijn 1,2,3 Author for correspondence : Frans de Bruijn. Tel : ›1 517 353 2229. Fax: ›1 517 353 9168. e-mail : debruijn!pilot.msu.edu 1,2,3 MSU-DOE Plant Research Laboratory 1 , Department of Microbiology 2 and NSF Center for Microbial Ecology 3 , Michigan State University, East Lansing, Michigan 48824, USA 4 Department of Plant Pathology, North Carolina State University, Raleigh, North Carolina 27695, USA 5,6 BCCM/LMG Bacteria Collection 5 and Laboratorium voor Microbiologie 6 , Rijksuniversiteit Gent, Ledeganckstraat 35, B-9000 Ghent, Belgium 7 Applied Maths BVBA, Derbystraat 331, B-9051 Ghent, Belgium The genus Xanthomonas contains a large number of strains, which have been characterized by a variety of phenotypic and genotypic classification methods. The Xanthomonas collection constitutes one of the largest groups of bacteria that have been characterized phylogenetically by DNA–DNA homology studies and genomic fingerprinting. Presently, a total genomic DNA–DNA homology value of 70 % represents an internationally accepted criterion to define bacterial species levels. However, the complexity of DNA–DNA reassociation kinetics methods precludes the rapid analysis of large numbers of bacterial isolates, which is imperative for molecular microbial diversity studies. Therefore, the aim of this study was to compare more facile PCR-based genomic fingerprinting techniques, such as repetitive-sequence-based (rep)- PCR and AFLP genomic fingerprinting, to DNA–DNA hybridization studies. Using three different primer sets, rep-PCR genomic fingerprint patterns were generated for 178 Xanthomonas strains, belonging to all 20 previously defined DNA–DNA homology groups, and one Stenotrophomonas maltophilia strain. In addition, AFLP genomic fingerprints were produced for a subset of 80 Xanthomonas strains belonging to the 20 DNA–DNA homology groups and for the S. maltophilia strain. Similarity values derived from rep-PCR- and AFLP- generated fingerprinting analyses were calculated and used to determine the correlation between rep-PCR- or AFLP-derived relationships and DNA–DNA homology values. A high correlation was observed, suggesting that genomic fingerprinting techniques truly reveal genotypic and phylogenetic relationships of organisms. On the basis of these studies, we propose that genomic fingerprinting techniques such as rep-PCR and AFLP can be used as rapid, highly discriminatory screening techniques to determine the taxonomic diversity and phylogenetic structure of bacterial populations. Keywords : rep-PCR, AFLP, Xanthomonas, DNA–DNA homology studies, molecular phylogeny ................................................................................................................................................................................................................................................................................................................. † Present address : The Netherlands Culture Collection of Bacteria (NCCB), PO Box 80056, 3508 TB Utrecht, The Netherlands. Abbreviations : ARDRA, amplified rDNA restriction enzyme analysis ; BER, individual BOX-, ERIC- and REP-PCR generated genomic fingerprints combined linearly using the ‘ combined gel ’ option of the GELCOMPAR program (BER profile) ; BOX-PCR, PCR based on primers targeting the highly conserved repetitive DNA sequences of the BOXA subunit of the BOX element of Streptococcus pneumoniae ; DAF, DNA amplification fingerprinting ; ERIC, enterobacterial repetitive intergenic consensus ; RAPD, random amplified polymorphic DNA ; rep-PCR, repetitive-sequence-based PCR ; REP, repetitive extragenic palindromic sequence ; UPGMA, unweighted pair group method using averages. 01227 # 2000 IUMS 665

Welcome message from author
This document is posted to help you gain knowledge. Please leave a comment to let me know what you think about it! Share it to your friends and learn new things together.
Transcript

International Journal of Systematic and Evolutionary Microbiology (2000), 50, 665–677 Printed in Great Britain
Comparison of AFLP and rep-PCRgenomic fingerprinting with DNA–DNAhomology studies: Xanthomonas as amodel system
Jan L. W. Rademaker,1† Bart Hoste,5 Frank J. Louws,1,3,4
Karel Kersters,6 Jean Swings,5,6 Luc Vauterin,7 Paul Vauterin7
and Frans J. de Bruijn1,2,3
Author for correspondence: Frans de Bruijn. Tel : 1 517 353 2229. Fax: 1 517 353 9168.e-mail : debruijn!pilot.msu.edu
1,2,3 MSU-DOE PlantResearch Laboratory1,Department ofMicrobiology2 and NSFCenter for MicrobialEcology3, Michigan StateUniversity, East Lansing,Michigan 48824, USA
4 Department of PlantPathology, NorthCarolina StateUniversity, Raleigh,North Carolina 27695,USA
5,6 BCCM/LMG BacteriaCollection5 andLaboratorium voorMicrobiologie6,Rijksuniversiteit Gent,Ledeganckstraat 35,B-9000 Ghent, Belgium
7 Applied Maths BVBA,Derbystraat 331, B-9051Ghent, Belgium
The genus Xanthomonas contains a large number of strains, which have beencharacterized by a variety of phenotypic and genotypic classification methods.The Xanthomonas collection constitutes one of the largest groups of bacteriathat have been characterized phylogenetically by DNA–DNA homology studiesand genomic fingerprinting. Presently, a total genomic DNA–DNA homologyvalue of 70% represents an internationally accepted criterion to definebacterial species levels. However, the complexity of DNA–DNA reassociationkinetics methods precludes the rapid analysis of large numbers of bacterialisolates, which is imperative for molecular microbial diversity studies.Therefore, the aim of this study was to compare more facile PCR-basedgenomic fingerprinting techniques, such as repetitive-sequence-based (rep)-PCR and AFLP genomic fingerprinting, to DNA–DNA hybridization studies.Using three different primer sets, rep-PCR genomic fingerprint patterns weregenerated for 178 Xanthomonas strains, belonging to all 20 previously definedDNA–DNA homology groups, and one Stenotrophomonas maltophilia strain. Inaddition, AFLP genomic fingerprints were produced for a subset of 80Xanthomonas strains belonging to the 20 DNA–DNA homology groups and forthe S. maltophilia strain. Similarity values derived from rep-PCR- and AFLP-generated fingerprinting analyses were calculated and used to determine thecorrelation between rep-PCR- or AFLP-derived relationships and DNA–DNAhomology values. A high correlation was observed, suggesting that genomicfingerprinting techniques truly reveal genotypic and phylogeneticrelationships of organisms. On the basis of these studies, we propose thatgenomic fingerprinting techniques such as rep-PCR and AFLP can be used asrapid, highly discriminatory screening techniques to determine the taxonomicdiversity and phylogenetic structure of bacterial populations.
Keywords : rep-PCR, AFLP, Xanthomonas, DNA–DNA homology studies,molecular phylogeny
.................................................................................................................................................................................................................................................................................................................
†Present address: The Netherlands Culture Collection of Bacteria (NCCB), PO Box 80056, 3508 TB Utrecht, The Netherlands.
Abbreviations: ARDRA, amplified rDNA restriction enzyme analysis ; BER, individual BOX-, ERIC- and REP-PCR generated genomic fingerprints combinedlinearly using the ‘combined gel’ option of the GELCOMPAR program (BER profile) ; BOX-PCR, PCR based on primers targeting the highly conserved repetitiveDNA sequences of the BOXA subunit of the BOX element of Streptococcus pneumoniae ; DAF, DNA amplification fingerprinting; ERIC, enterobacterialrepetitive intergenic consensus; RAPD, random amplified polymorphic DNA; rep-PCR, repetitive-sequence-based PCR; REP, repetitive extragenic palindromicsequence; UPGMA, unweighted pair group method using averages.
01227 # 2000 IUMS 665

J. L. W. Rademaker and others
Table 1. DNA–DNA homology groups and strains analysed by AFLP and rep-PCR genomic fingerprinting
Taxon Host Geographical origin LMG strain no.*
Group 1
X. fragariae Fragaria ananassa Greece, USA 706, 708T
Group 2
X. hortorum pv. hederae Hedera helix USA 733†X. h. pelargonii Pelargonium sp. New Zealand, France, Belgium 7314†, 7356, 7585, 7712X. h. vitians Lactuca sativa Zimbabwe 938
Group 3
X. populi Populus canadensis France 974, 5743T, 5753Group 4
X. arboricola corylina Corylus sp. UK, USA 688, 689†, 8658, 8660
X. a. juglandis Juglans regia New Zealand, TheNetherlands
747†, 8047
X. a. poinsettiicola Euphorbia pulcherrima New Zealand 5403
X. a. populi Populus euramericana The Netherlands 12141†X. a. pruni Prunus sp. New Zealand 852†, 8680
Group 5
X. cassavae Manihot esculenta Malawi, Rwanda 670, 673†, 5264
Group 6
X. codiaei Codiaeum variegatum USA 8677, 8678
Group 7
X. bromi Bromus sp. France, New Zealand (947), 8269, 8272Group 8
X. cucurbitae Cucurbita maxima New Zealand 690†, 8662
Group 9
X. axonopodis alfalfae Medicago sativa Australia, Sudan 497†, 8079X. a. axonopodis Axonopus scoparius Colombia 538T, 539X. a. bauhiniae Bauhinia racemosa India 548X. a. begoniae Begonia sp. Belgium, New Zealand, UK 551, 7178, 7188, 7226, 7303†,
7304, 7601X. a. cajani Cajanus cajan India, Sudan 558†, 7387t1X. a. cassavae Manihot esculenta Niger 8049X. a. cassiae Cassia tora India 675†X. a. citri (A) Citrus aurantifolia, C. latifolia,
C. limon, C. reticulataBrazil, India, New Zealand,Pakistan, USA
681, (682†), 8650, 8654, 8657,9176, 9321, 9665, 9671
X. a. aurantifolii (citri B) Citrus limon Argentina 9179, 9183X. a. aurantifolii (citri C) Citrus aurantifolia Brazil 8655, 9181, 9658X. a. aurantifolii (citri D) Citrus aurantifolia Mexico 9182X. a. citrumelo (citri E) Poncirus trifoliata¬Citrus
sinensis, Citrus paradisiUSA 9160, 9167, 9172, 9175, 9325
X. a. clitoriae Clitoria biflora India 9045†X. a. coracanae Eleusine coracana India 686†, 7476X. a. cyamopsidis Cyamopsis tetragonolobus India 691†X. a. desmodii Desmodium dichotomum India 692†X. a. desmodiigangetici Desmodium gangeticum India 693†X. a. desmodiilaxiflori Desmodium laxiflorum India 9046†X. a. desmodiirotundifolii Desmodium styracifolium India 694†X. a. dieffenbachiae Anthurium sp., Dieffenbachia
sp.Brazil, USA 695†, 7399, 8664
X. a. erythrinae Erythrina variegata India 698†X. a. glycines Glycine max Sudan 712†X. a. lespedezae Lespedeza sp. USA 757†X. a. malvacearum Gossypium sp. Sudan, Uganda 761†, 7429X. a. manihotis Manihot esculenta Brazil, Nigeria 771, 773†, 778, 784†X. a. patelii Crotalaria juncea India 811†X. a. phaseoli Phaseolus vulgaris Romania 7455†, 8014
X. a. phaseoli var. fuscans Phaseolus vulgaris Germany, South Africa, USA 837t1, 7511, 8036X. a. phyllanthi Phyllanthus niruri Sudan 844†X. a. poinsettiicola Euphorbia pulcherrima India 849†X. a. rhynchosiae Rhynchosia memnonia Sudan 8021†X. a. ricini Ricinus communis Ethiopia, Hong Kong, India,
Zimbabwe861†, 862, 7441, 7443
666 International Journal of Systematic and Evolutionary Microbiology 50

Genomic fingerprinting vs DNA–DNA homology studies
Table 1 (cont.)
Taxon Host Geographical origin LMG strain no.*
X. a. sesbaniae Sesbania sesban Unknown 867†X. a. tamarindi Tamarindus indica India 869, 955†X. a. vasculorum Saccharum officinarum,
Thysanolaena maximaAustralia, Mauritius 895, 899, 901†, 903
X. a. vesicatoria Capsicum sp., Lycopersiconesculentum
Morocco, USA 905, 910, 929t1
X. a. vignaeradiatae Vigna radiata Sudan 936†X. a. vignicola Vigna unguiculata India, Sudan, USA 828, 8139, 8752†X. a. vitians Lactuca sp. Colombia, USA 937†Group 10
X. oryzae oryzae Oryza sativa Philippines 795, 5047T, 6518X. o. oryzicola Oryza sativa Malaysia, Philippines 665, 793, 797†Group 11
X. vasicola holcicola Sorghum sp., Holcus sp. New Zealand, USA 736†, 7416, 7489
X. v. vasculorum Saccharum officinarum, Zeamays
Malagasy Republic, SouthAfrica
900, 902, 8284
Group 12
X. pisi Pisum sativum Japan 847†Group 13
X. melonis Cucumis melo Brazil 8670†, 8672
Group 14
X. vesicatoria Lycopersicon esculentum Italy, New Zealand 911t1†, 920t1
Group 15
X. campestris aberrans Brassica oleracea L. var.capitata L.
Australia 9037†
X. c. armoraciae Iberis sp., Armoracialapathifolia
Tanzania, USA 535†, 7383t2
X. c. barbareae Barbarea vulgaris USA 547†, 7385
X. c. campestris Brassica oleracea, Raphanussativus
France, Malawi, Burundi, NewZealand, UK
567, 568T, 571, 573, 583, 7514,8032
X. c. incanae Matthiola sp. USA 7421, 7490†X. c. raphani Raphanus sativus USA 860†, 7505, 8134
Group 16
X. translucens arrhenatheri Arrhenatherum elatius Switzerland 727t1†X. t. cerealis Bromus inermis, Hordeum
vulgareCanada, USA 679†, 880
X. t. graminis Lolium perenne, Dactylisglomerata
Belgium, Switzerland 713, 726†
X. t. hordei Hordeum vulgare, Dactylisglomerata
Canada, India, Japan, NewZealand
737†, 879, 882, 8279
X. t. phlei Phleum pratense Belgium, Norway 716, 730†X. t. phleipratensis Phleum pratense USA 843†X. t. poae Poa trivialis Switzerland 594, 728†X. t. secalis Secale cereale Canada 883†, 7507X. t. translucens Hordeum vulgare, Secale
cerealeUSA 876†, 5259, 5260
X. t. undulosa Triticum sp. Canada 885, 888, 892†Group 17
X. hyacinthi Hyacinthus orientalis The Netherlands 739†, 742, 8041
Group 18
X. theicola Camellia sinensis Japan 8684†Group 19
X. sacchari Saccharum officinarum Guadeloupe 471, 476
Group 20
X. albilineans Saccharum officinarum Mauritius, Fiji 842, 494T
Group 21
Stenotrophomonas maltophilia Human with mouth cancer Unknown 958T
*Strains indicated in bold were also used in AFLP analysis, strains in parentheses were not used in rep-PCR genomic fingerprinting.t1, t2 and t3 indicate several stable colony types.
†Pathovar reference strain.
International Journal of Systematic and Evolutionary Microbiology 50 667

J. L. W. Rademaker and others
INTRODUCTION
Polyphasic taxonomy is increasingly being accepted asa comprehensive approach to microbial systematics(Colwell, 1970; Vandamme et al., 1996). However, thedetermination of total genomic DNA–DNA hom-ology values has persisted as a dominant component oftaxonomic analyses (Wayne et al., 1987; Murray et al.,1990). In fact, it has been referred to as the ‘goldstandard’ for the definition of bacterial species(Stackebrandt & Goebel, 1994), and 70% DNA–DNAhomology values are considered to be the ‘specieslimit ’ (Wayne et al., 1987; Murray et al., 1990).DNA–DNA homology-based approaches to classi-fication are clearly impractical when analysing largecollections of environmental isolates, due to theexperimental limitations of analysing large numbers ofstrains by DNA–DNA reassociation methods in apair-wise fashion. The analysis of 16S or 23S rDNAgenes by DNA sequence analysis (Woese, 1987) orrestriction enzyme digestion (ARDRA; Vaneechoutteet al., 1993) have become more useful approaches toassess the phylogenetic and taxonomic diversity ofbacterial isolates (Heyndrickx et al., 1996; Moyer etal., 1996). However, the power of rDNA-based pro-tocols resides at a low phylogenetic or taxonomic levelof resolution, which is valuable for classifying bacteriafrom the genus to even the kingdom level but which isinsufficient to classify bacteria at the (sub)species level(Woese, 1987; Fox et al., 1992; Stackebrandt &Goebel, 1994; Hauben et al., 1997). Therefore, wepostulated that rapid molecular genomic finger-printing methods would be valuable, high-resolutionalternative approaches to the classification of bacteria,especially on the species-, subspecies- or strain-specificlevel (Louws et al., 1994, 1995, 1997; Janssen et al.,1996; Lin et al., 1996; Rademaker & de Bruijn, 1997;Rademaker et al., 1997, 1998; Bragard et al., 1997).
Recently described genomic fingerprinting methodssuch as repetitive-sequence-based (rep)-PCR (Versa-lovic et al., 1991, 1994, 1998; de Bruijn, 1992), randomamplified polymorphic DNA (RAPD) or DNA ampli-fication fingerprinting (DAF) (Caetano-Anolle! s et al.,1991) and AFLP genomic fingerprinting (Vos et al.,1995) analyses have been suggested as accurateapproaches to determine taxonomic and}or phylo-genetic relationships between bacteria (Janssen et al.,1996; Huys et al., 1996; Clerc et al., 1998). However,the correlation between genomic fingerprinting andDNA–DNA homology studies has not been inves-tigated on a sufficiently large scale to validate theformer approaches as an alternative to, or a pre-screenprecursor of, DNA–DNA homology-based bacterialspeciation methods.
In this study, we chose the genus Xanthomonas as amodel system to examine the relationship betweenphylogenetic relationships in bacteria based on DNA–DNA homology studies (Vauterin et al., 1995) andcomplemented by a variety of phenotypic methods(Vauterin et al., 1991, 1995, 1996; Yang et al., 1993) to
those derived from genomic structure (fingerprinting)analyses based on rep-PCR or AFLP genomic finger-printing approaches.
The rep-PCR-generated genomic fingerprints of 177Xanthomonas strains, representing all 20 DNA–DNAhomology groups (Vauterin et al., 1995), and oneStenotrophomonas maltophilia strain were employed toderive dendrograms of genetic relatedness using theGC program (Vauterin & Vauterin, 1992). Inaddition, a subset of 80 Xanthomonas strains, repre-senting the same 20 DNA–DNA homology groups,was analysed by AFLP analysis. On the basis of theresults obtained, we suggest that the genomic structureof a bacterium, as deduced from its genomic finger-print, represents an accurate reflection of its taxonomicand phylogenetic position based on total genomicDNA–DNA hybridization values.
METHODS
Bacterial strains. The 180 strains used in this study are listedin Table 1. Totals of 178 and 80 strains were selected for rep-PCR genomic fingerprinting and AFLP analysis, respect-ively (Table 1). The S. maltophilia type strain was included inthe study as a control. The Xanthomonas strains selectedcomprise 20 genospecies and over 80 pathogenic variants,originating from 40 different countries (Table 1), and wereobtained from the BCCM}LMG culture collection of theLaboratorium voor Microbiologie, Universiteit Gent,Ghent, Belgium.
DNA–DNA hybridization analysis. The global DNA–DNAhomology matrix of 791 values, derived as described by DeLey et al. (1970) from the same 180 strains used for genomicfingerprinting, was obtained from Vauterin et al. (1995).Each DNA–DNA homology value represents the mean ofbetween two and eight independent experiments (Vauterin etal., 1995).
Genomic fingerprinting. DNA was extracted from thebacterial strains as described by Rademaker & de Bruijn(1997). BOX-PCR (based on primers targeting the highlyconserved repetitive DNA sequences of the BOXA subunitof the BOX element of Streptococcus pneumoniae), ERIC-PCR (based on primers targeting the highly conservedenterobacterial repetitive intergenic consensus) and REP-PCR (based on primers targeting the repetitive extragenicpalindromic sequence) genomic fingerprints were obtainedas described by Rademaker & de Bruijn (1997) andRademaker et al. (1998). AFLP fingerprints were generatedas described by Janssen et al. (1996), using restrictionenzymes EcoRI and TaqI and one 3« cytosine as selectivebase in both primers. Electrophoresis was performed in TBEbuffer at 120 W and 50 °C for 2 h (Janssen et al., 1996).
Computer-assisted analysis of genomic fingerprints. Com-puter-assisted analysis of the genomic fingerprints wasperformed by using the commercially available GCversion 4.1 software program (Applied Maths) (Vauterin &Vauterin, 1992), as described previously (Rademaker & deBruijn, 1997; Rademaker et al., 1997, 1999). Briefly, rep-PCR genomic fingerprints were analysed using a resolutionof 400 and AFLP profiles of 1200 data points. Using theGC software, the similarity between pairs of sep-arate or linearly combined BOX-, ERIC- and REP-PCR
668 International Journal of Systematic and Evolutionary Microbiology 50

Genomic fingerprinting vs DNA–DNA homology studies
genomic fingerprints was calculated by using the product-moment correlation coefficient (r value; Pearson, 1926),applied to the whole densitometric curves of the gel tracks(Ha$ ne et al., 1993; Rademaker & de Bruijn, 1997;Rademaker et al., 1999). Four full 178-by-178 similaritymatrices of the respective rep-PCR fingerprints and one 80-by-80 matrix of r values for AFLP patterns were obtained(31684 and 6400 values, respectively). Cluster analysis of thepairwise similarity values was performed by using theUPGMA (unweighted pair group method using averages)algorithm (Sneath & Sokal, 1973).
Regression and other statistical analyses. The set of 791DNA–DNA homology values derived from pairs of 180strains (Vauterin et al., 1995) was compared with thesimilarities between pairs of AFLP and separate or linearlycombined BOX-, ERIC- and REP-PCR genomic finger-prints generated from the same 180 strains. The resultingdata were analysed by using the BN (AppliedMaths) and 7.5 (SPSS Inc.) software packages. Product-moment and Kendall’s tau correlation values, scatterplotsand second-degree regression curve fits were obtained foreach combination of genomic fingerprint similarity values (rvalues) and the DNA–DNA homology values.
RESULTS AND DISCUSSION
The primary goal of this work was to determinewhether clusters derived from genomic fingerprintscorresponded to DNA–DNA homology-derivedclusters and to determine the correlation between theprimary similarity matrix values derived from genomicfingerprint patterns with actual DNA–DNA hom-ology values (Fig. 1).
Cluster analysis of rep-PCR genomic fingerprintsversus DNA–DNA homology groupings
First, BOX-, ERIC- and REP-PCR genomic finger-prints were generated from purified chromosomalDNA of 177 xanthomonad strains used previously forDNA–DNA hybridization experiments (Vauterin etal., 1995), including more than 80 pathovars of 20genomic species and one strain classified as S. malto-
.................................................................................................................................................
Fig. 1. Scheme illustrating direct and indirect comparison ofgenomic fingerprint analyses and DNA–DNA homology studies.
philia (Table 1). The rep-PCR-amplified bacterialgenomic fragments were resolved on agarose gels,resulting in complex fingerprint patterns with multiplebands of distinct intensities (Fig. 2). These patternswere analysed with the GC software package(Vauterin & Vauterin, 1992), as described byRademaker et al. (1999). Pearson’s product-momentcorrelation (r) values were calculated separately for theBOX-, ERIC- and REP-PCR genomic fingerprintsand for the three linearly combined patterns (BOX-ERIC-REP; referred to as BER; Fig. 2). Twenty-fivedistinct and coherent clusters were observed aftercomputer-assisted pattern analysis of the separateBOX-, ERIC- and REP-PCR genomic fingerprintsand, to an even more precise extent, of the threelinearly combined profiles (Fig. 2; boxes numbered 1to 8, 9-1 to 9-6 and 10 to 20). Groups 1–8 and 10–20(Fig. 2) were found to correspond precisely to thoseidentified by DNA–DNA homology studies (DNAhomology groups 1–8 and 10–20; Vauterin et al.,1995).
Group 9 (Xanthomonas axonopodis), as identified byVauterin et al. (1995), contains the strains of thecollection with the lowest DNA–DNA homologyvalues and was also found to be heterologous on thebasis of rep-PCR genomic fingerprinting. Group 9includes six genetic clusters on the basis of rep-PCRgenomic fingerprints (9.1, 9.2 etc. ; Fig. 2). IndividualBOX-, ERIC- or REP-PCR genomic fingerprint datasets tended to group strains into similar subclusterswith a few exceptions. A more detailed rep-PCRgenomic fingerprinting analysis, using a much largercollection of strains from DNA–DNA homologygroup 9, will be presented elsewhere.
Cluster analysis of AFLP genomic fingerprints versusDNA–DNA homology groupings
AFLP fingerprints were generated from 82 xantho-monad strains belonging to the collection of strainsanalysed by DNA–DNA homology studies (Vauterinet al., 1995) and rep-PCR genomic fingerprinting (thisstudy), including the pathotype of each of the 20genomic species (Table 1) and the S. maltophilia strain.The AFLP genomic fingerprint patterns obtained werefound to be similar in complexity to the rep-PCR-generated patterns (Fig. 3), and were analysed by usingthe GC software. Similarity values betweenthe AFLP fingerprints were calculated. Subsequentcluster analysis yielded 24 groups, 19 of which cor-responded to clusters identified by DNA–DNA hom-ology studies (Fig. 3; boxes numbered 1 to 8, 9-1 to 9-5 and 10 to 20).
The AFLP clusters were found to be virtually identicalto those generated by rep-PCR genomic fingerprinting(Figs 2 and 3). Strains classified within all but twoDNA–DNA homology groups formed the same co-herent clusters in AFLP and rep-PCR genomic finger-printing analyses, the exceptions being DNA–DNAhomology groups 9 and 4. Strains classified within
International Journal of Systematic and Evolutionary Microbiology 50 669

J. L. W. Rademaker and others
.................................................................................................................................................................................................................................................................................................................
Fig. 2. UPGMA/product-moment cluster analysis of 178 linearly combined BOX-, ERIC- and REP-PCR-generated genomicfingerprints of the Xanthomonas strains listed in Table 1. The DNA–DNA homology groups are those determined byVauterin et al. (1995) and subclusters within group 9 are as indicated.
670 International Journal of Systematic and Evolutionary Microbiology 50

Genomic fingerprinting vs DNA–DNA homology studies
.................................................................................................................................................................................................................................................................................................................
Fig. 3. UPGMA/product-moment cluster analysis of 80 AFLP genomic fingerprints of the Xanthomonas strains listed inTable 1. DNA–DNA homology groups (Vauterin et al., 1995) are shown. Moreover, subgroups of DNA–DNA homologygroup 9, as determined by rep-PCR genomic fingerprinting (see Fig. 2) are indicated in boxes with dotted lines.
DNA–DNA homology group 9 were found to be moresimilar to each other than to strains in any othergroup, but at a substantial lower level than within anyother DNA–DNA homology group. Moreover, someof the subclusters found by AFLP analysis belongingto DNA–DNA homology group 9 corresponded tothose observed by rep-PCR analysis (Figs 2 and 3;boxes numbered 9-1 to 9-6). Xanthomonas arboricolapv. populi strain LMG 12141 was separated from theother members of DNA–DNA homology group 4 inthe cluster analysis of the AFLP patterns. Thisobservation is supported by similar results obtained byanalysing BOX-PCR fingerprinting patterns (data notshown; Rademaker et al., 1997).
Correlation between similarity matrices using theproduct-moment correlation coefficient
The topology of the dendrograms obtained by rep-PCR and AFLP genomic fingerprinting analyses wasfound to be in excellent agreement with the groupsobtained by DNA–DNA homology studies. However,
groupings derived from fingerprint similarity andDNA–DNA homology values could be regarded as‘secondary data’, while similarity matrices derivedfrom fingerprint patterns and initial DNA–DNAhomology matrices constitute ‘primary data’, whichare more suitable for direct comparison (Fig. 1).Therefore, a correlation study of the relevant primarydata was carried out using the estimates of geneticsimilarity from rep-PCR or AFLP genomic finger-prints and DNA–DNA homology values as input.
First, the Pearson’s product-moment correlation co-efficient was employed, since it permitted a directcomparison of our results with those fromother studies(see below). Subsequently, the non-parametricKendall’s tau coefficient was used.
Product-moment (r) values were calculated betweenthe DNA–DNA homology matrix and the corre-sponding similarity matrices of the respective genomicfingerprints from BOX-, ERIC- and REP-PCR-, BER-and AFLP-based analyses (see above). A highlysignificant correlation was observed between the
International Journal of Systematic and Evolutionary Microbiology 50 671
J. L. W. Rademaker and others
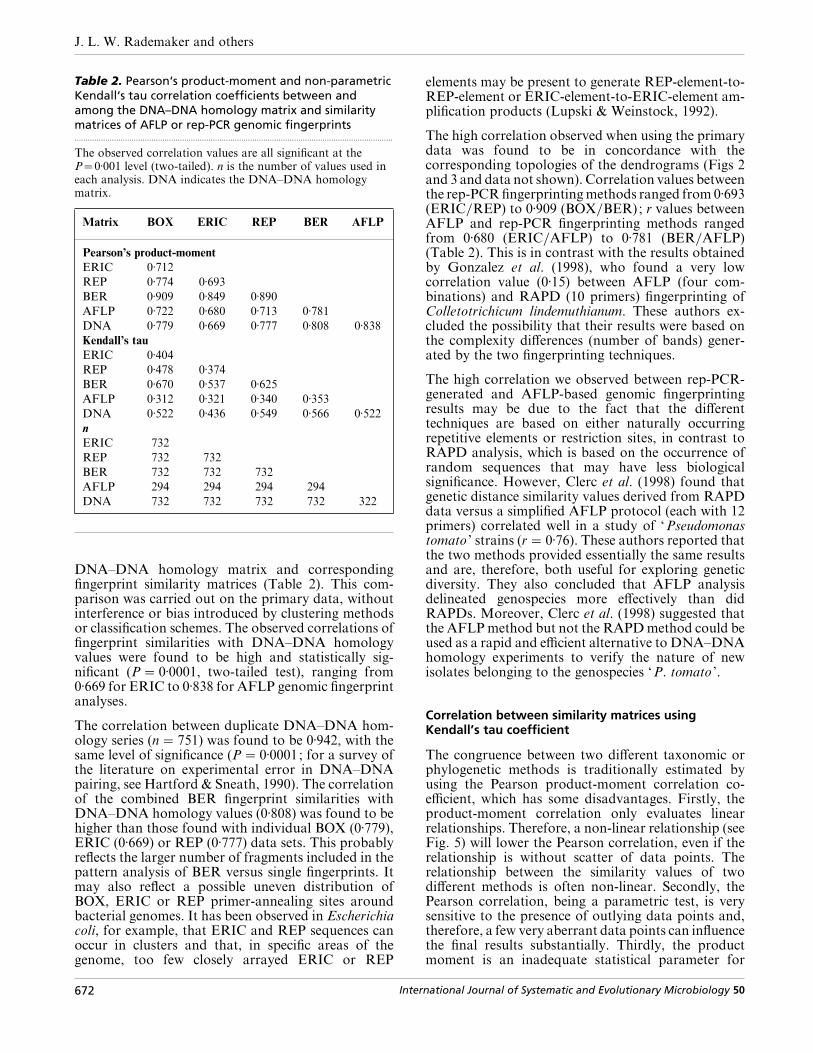
Table 2. Pearson‘s product-moment and non-parametricKendall‘s tau correlation coefficients between andamong the DNA–DNA homology matrix and similaritymatrices of AFLP or rep-PCR genomic fingerprints.................................................................................................................................................
The observed correlation values are all significant at theP¯0±001 level (two-tailed). n is the number of values used ineach analysis. DNA indicates the DNA–DNA homologymatrix.
Matrix BOX ERIC REP BER AFLP
Pearson’s product-moment
ERIC 0±712
REP 0±774 0±693
BER 0±909 0±849 0±890
AFLP 0±722 0±680 0±713 0±781
DNA 0±779 0±669 0±777 0±808 0±838
Kendall’s tau
ERIC 0±404
REP 0±478 0±374
BER 0±670 0±537 0±625
AFLP 0±312 0±321 0±340 0±353
DNA 0±522 0±436 0±549 0±566 0±522
n
ERIC 732
REP 732 732
BER 732 732 732
AFLP 294 294 294 294
DNA 732 732 732 732 322
DNA–DNA homology matrix and correspondingfingerprint similarity matrices (Table 2). This com-parison was carried out on the primary data, withoutinterference or bias introduced by clustering methodsor classification schemes. The observed correlations offingerprint similarities with DNA–DNA homologyvalues were found to be high and statistically sig-nificant (P¯ 0±0001, two-tailed test), ranging from0±669 for ERIC to 0±838 for AFLP genomic fingerprintanalyses.
The correlation between duplicate DNA–DNA hom-ology series (n¯ 751) was found to be 0±942, with thesame level of significance (P¯ 0±0001; for a survey ofthe literature on experimental error in DNA–DNApairing, see Hartford & Sneath, 1990). The correlationof the combined BER fingerprint similarities withDNA–DNA homology values (0±808) was found to behigher than those found with individual BOX (0±779),ERIC (0±669) or REP (0±777) data sets. This probablyreflects the larger number of fragments included in thepattern analysis of BER versus single fingerprints. Itmay also reflect a possible uneven distribution ofBOX, ERIC or REP primer-annealing sites aroundbacterial genomes. It has been observed in Escherichiacoli, for example, that ERIC and REP sequences canoccur in clusters and that, in specific areas of thegenome, too few closely arrayed ERIC or REP
elements may be present to generate REP-element-to-REP-element or ERIC-element-to-ERIC-element am-plification products (Lupski & Weinstock, 1992).
The high correlation observed when using the primarydata was found to be in concordance with thecorresponding topologies of the dendrograms (Figs 2and 3 and data not shown). Correlation values betweenthe rep-PCR fingerprinting methods ranged from 0±693(ERIC}REP) to 0±909 (BOX}BER); r values betweenAFLP and rep-PCR fingerprinting methods rangedfrom 0±680 (ERIC}AFLP) to 0±781 (BER}AFLP)(Table 2). This is in contrast with the results obtainedby Gonzalez et al. (1998), who found a very lowcorrelation value (0±15) between AFLP (four com-binations) and RAPD (10 primers) fingerprinting ofColletotrichicum lindemuthianum. These authors ex-cluded the possibility that their results were based onthe complexity differences (number of bands) gener-ated by the two fingerprinting techniques.
The high correlation we observed between rep-PCR-generated and AFLP-based genomic fingerprintingresults may be due to the fact that the differenttechniques are based on either naturally occurringrepetitive elements or restriction sites, in contrast toRAPD analysis, which is based on the occurrence ofrandom sequences that may have less biologicalsignificance. However, Clerc et al. (1998) found thatgenetic distance similarity values derived from RAPDdata versus a simplified AFLP protocol (each with 12primers) correlated well in a study of ‘Pseudomonastomato ’ strains (r¯ 0±76). These authors reported thatthe two methods provided essentially the same resultsand are, therefore, both useful for exploring geneticdiversity. They also concluded that AFLP analysisdelineated genospecies more effectively than didRAPDs. Moreover, Clerc et al. (1998) suggested thatthe AFLP method but not the RAPD method could beused as a rapid and efficient alternative to DNA–DNAhomology experiments to verify the nature of newisolates belonging to the genospecies ‘P. tomato ’.
Correlation between similarity matrices usingKendall’s tau coefficient
The congruence between two different taxonomic orphylogenetic methods is traditionally estimated byusing the Pearson product-moment correlation co-efficient, which has some disadvantages. Firstly, theproduct-moment correlation only evaluates linearrelationships. Therefore, a non-linear relationship (seeFig. 5) will lower the Pearson correlation, even if therelationship is without scatter of data points. Therelationship between the similarity values of twodifferent methods is often non-linear. Secondly, thePearson correlation, being a parametric test, is verysensitive to the presence of outlying data points and,therefore, a few very aberrant data points can influencethe final results substantially. Thirdly, the productmoment is an inadequate statistical parameter for
672 International Journal of Systematic and Evolutionary Microbiology 50

Genomic fingerprinting vs DNA–DNA homology studies
.................................................................................................................................................
Fig. 4. Concordant and discordant pairs of similarity values (forexplanation see text).
deciding whether the correlation is significant up to acertain confidence level. Unjustifiable assumptionsmay have to be made for the application of the productmoment, e.g. that the data set follows a two-dimensional Gaussian distribution function.
For these reasons, a non-parametric statistic is avaluable alternative. Here, we applied Kendall’s taucoefficient (Kendall, 1970). This coefficient ranks andconsiders all possible pairs of similarity values andcounts the number of concordant and discordant pairs.A pair is called concordant if both techniques agreeupon the ordering of the similarities between thecorresponding organisms and discordant if they do not(Fig. 4).
Kendall’s tau value is defined as (concordant®discordant)}(concordantdiscordant) values(Kendall, 1970). This value will be high (close to one)in the case of a positive relationship, positive meaningthat both values are increasing in the same direction.Because it only involves the relative orderings ofsimilarity values, it is relatively insensitive to ‘outliers ’.Moreover, the statistical significance of the relation-ship can be calculated directly without any furtherassumptions. The observed congruence of the genomicfingerprinting methods with DNA–DNA homologyvalues using Kendall’s tau coefficient was found to behighly significant (P¯ 0±0001, two-tailed test ; Table2). The closest relationships were observed whencomparing DNA–DNA homology values with BER(0±566) or REP (0±549) genomic fingerprint similarityvalues. The comparison between AFLP or BOX-PCRfingerprint similarity and DNA–DNA homologyvalues yielded a Kendall’s tau coefficient of 0±522(Table 2). The lowest Kendall’s tau coefficient value(0±436) was observed with ERIC-PCR genomic finger-print similarities versus DNA–DNA homology values,as observed with the product moment coefficient (seeabove). Among genomic fingerprints, the lowestKendall’s tau value was found when comparing AFLPand rep-PCR fingerprint similarity matrices (Table 2).Among the individual rep-PCR fingerprint similaritymatrices, the largest Kendall’s tau coefficient (0±478)
was observed when comparing REP- and BOX-PCRgenomic fingerprint matrices.
Regression analysis
Since DNA–DNA homology values and genomicfingerprint similarity values between pairs of strainslead to highly similar groupings, we attempted todescribe their relationship. While the previous sectiondealt with overall levels of correlation between theDNA–DNA homology matrix and genomic finger-print similarity matrices and among the fingerprintsimilarity matrices, we also explored their specificrelation.
DNA–DNA homology values were plotted against theproduct-moment-generated similarities between pairsof BOX-, ERIC- and REP-PCR, BER and AFLPgenomic fingerprints (Fig. 5). A second-degree poly-nomial was fitted to the data, subject to the constraintsof being monotonically increasing and passing throughthe (100%, 100%) position. The relationships betweenDNA–DNA hybridization and each of the finger-printing techniques were found to be comparable. Theregression analysis highlighted important relationshipsamong the different data sets (Fig. 5). For example, inthe case of BOX-PCR-generated fingerprints, essen-tially all similarity (r) values above 0±5 correlated wellwith DNA–DNA hybridization values of more then50%, r values above 0±7 correlated with homologyvalues above 70% and the product-moment valuesabove 0±8 correlated with DNA–DNA homologyvalues above 85% (Fig. 5a). The regression curvesbetween DNA–DNA homology values and ERIC- orREP-PCR similarity values were found to be verysimilar to those obtained for BOX-PCR similarityvalues (curves not shown).
The relationship between DNA–DNA homologyvalues and the r values of BER analysis is shown inFig. 5(b). The scatter in this plot is lower than thatobserved in plots of the individual rep-PCR fingerprintsimilarities and is, in fact, directly comparable with thefit between duplicate DNA–DNA homology values(data not shown). Essentially all BER fingerprintsimilarity values above 0±40 were found to correlatewith DNA–DNA homology values exceeding 50%,above 0±5 with values exceeding 70% and above 0±8with values exceeding 90%.
The relationship between DNA–DNA homologyvalues and the r values of AFLP fingerprints is shownin Fig. 5(c). In essence, AFLP similarity values above0±50 correlated with DNA–DNA homology valuesexceeding 50%, above 0±65 with values exceeding 70%and above 0±8 with values exceeding 85%. The trendline for AFLP fingerprint similarities versus DNA–DNA homology values is based on a smaller numberof data sets (322), but was still found to be comparableto the regression curves based on the collection of 732similarity values (Table 2). Even an analysis of only160 pairs of similarity values resulted in trend lines
International Journal of Systematic and Evolutionary Microbiology 50 673

J. L. W. Rademaker and others
100
80
60
40
20
0
BO
X-P
CR
r v
alu
e (×
100)
(a)
20 40 60 80 100DNA–DNA homology (%)
100
80
60
40
20
0
BER
r v
alu
e (×
100)
(b)
20 40 60 80 100DNA–DNA homology (%)
100
80
60
40
20
0
AFL
P r
valu
e (×
100)
(c)
20 40 60 80 100DNA–DNA homology (%)
.....................................................................................................
Fig. 5. Scatter plots of genetic similaritiesderived from rep-PCR and AFLP genomicfingerprint analyses and DNA–DNAhomology studies. The relationships ofDNA–DNA homology values (%) to BOX-PCR(a), BER (b) and AFLP (c) genomic fingerprintproduct-moment similarities (r values) areindicated by second-degree regressioncurves. Confidence intervals are as indicated.The number of similarity values used isindicated in Table 2.
essentially identical to those generated based on alarger number of similarity values, not only for AFLPbut also for all rep-PCR fingerprint types presentedhere (data not shown).
The trend lines between the different genomic finger-printing techniques were also determined (data notshown). The product-moment correlation betweenBER and the individual rep-PCR fingerprints wasfound to be high (0±909, 0±849 and 0±890 for BERversus BOX-, ERIC- and REP-PCR fingerprints). Thelinear relationship was also found to have an interceptclose to zero and a slope of approximately one,suggesting that the corresponding similarity valuesobtained from these data sets are almost identical. Thelowest scatter was found with BOX-PCR fingerprintsimilarity values, supporting earlier observations thatBOX-PCR may be the most robust of the three rep-PCR methods analysed here. The highest data pointscatter was observed with ERIC-PCR fingerprint
similarity values, which are more sensitive to disturb-ances.
Conclusions
rep-PCR- or AFLP-generated genomic fingerprintanalyses yield results that are in close agreement withDNA–DNA homology studies, as determined bycluster analyses (indirect), as well as by direct com-parison of primary similarity values. The observedhigh correlation between DNA–DNA homologystudies and rep-PCR and AFLP genomic fingerprintanalyses suggests that genomic fingerprint methodscan function as core techniques in polyphasic tax-onomy, regardless of the statistical model employed.The conclusion from the comparison of rep-PCRgenomic fingerprinting with DNA–DNA homologystudies is supported by the results of a smaller-scalestudy comparing rep-PCR genomic fingerprinting and
674 International Journal of Systematic and Evolutionary Microbiology 50

Genomic fingerprinting vs DNA–DNA homology studies
dot-blot-mediated DNA–DNA homology studies(Nick et al., 1999). With regard to AFLP genomicfingerprinting versus DNA–DNA homology studies,our conclusions are also supported by other studies ona variety of bacteria (Huys et al., 1996; Janssen et al.,1996, 1997; Janssen & Dijkshoorn, 1996; Clerc et al.,1998; Pedersen et al., 1998), although some contro-versy exists about this issue (Esteve, 1997).
Studies carried out by our laboratory and others on avariety of different bacterial genera and species haverevealed that, at fine taxonomic resolution, phylo-genetic trees derived from BOX-, ERIC- and REP-PCR genomic fingerprinting are not always identical.This is to be expected, since different numbers of bandsmay be generated with each primer set, the annealingconditions vary between primers or sets, and theprevalence}distribution of the target repetitive ele-ments in question may vary. A similar variation mayoccur with restriction-enzyme-dependent finger-printing methods like RFLP, ARDRA and AFLP,depending on the restriction enzyme that is used.However, the phylogenetic ‘ trees ’ derived using eachprimer set separately are only slightly different. More-over, our studies have shown that, regardless of theindividual primer set used for rep-PCR genomicfingerprinting, the correlation of the phylogenetic treeswith those derived from DNA–DNA homologystudies is highly significant (Table 2). However, wewant to emphasize here that the most highly significantand consistent results were obtained by combining thedata obtained from BOX-, ERIC- and REP-PCRfingerprints (BER). This is logical, since the totalnumber of data points (bands}peaks) is greatly in-creased. Moreover, the genome is more extensivelycovered, since certain regions may have more (properlyspaced) copies of a particular element than others(Lupski & Weinstock, 1992). Informative rep-PCRand}or AFLP genomic fingerprint patterns have beengenerated from all Gram-negative and several Gram-positive bacteria analysed so far in studies that supportour conclusions [see Versalovic et al. (1994) andRademaker et. al. (1998) for lists of bacterial speciestested]. To our knowledge, the Archaea have not yetbeen examined by rep-PCR genomic fingerprinting.
Similarities between genomic fingerprints, as well asDNA–DNA homology values, represent indirectmeasurements of sequence homologies and are de-pendent on the specific experimental conditions andanalysis methods employed, and it is recognized that ahierarchy exists in terms of general applicability andstandardization. Total DNA–DNA hybridization ex-periments are likely to be the most general, followed byAFLP and rep-PCR fingerprinting analyses. However,we stress in this paper that, in the bacterial specieswhere significant comparative studies have been car-ried out, the results are comparable. Most important,however, is the applicability of the methods used to theanalysis of large(r) collections of strains. There, anopposite (inverse) hierarchy exists, which demon-strates clearly that rep-PCR genomic fingerprinting is
the least experimentally demanding and possibly themost discriminatory method of choice.
In any case, rep-PCR and AFLP genomic finger-printing techniques appear to reflect the genotypic,phylogenetic and taxonomic relationships of organ-isms and, therefore, we propose that these genomicfingerprinting techniques can be used as a rapid meansof determining taxonomic diversity and phylogenicstructure, especially of large collections of bacterialisolates.
ACKNOWLEDGEMENTS
The development of the rep-PCR genomic fingerprintingmethod for the analysis of plant-associated and soil microbeshas been supported by the DOE (DE FG 0290ER20021), theNSF Center for Microbial Ecology (DIR 8809640), Heinz,Roger Seeds and Procter & Gamble and by the Consortiumfor Plant Biotechnology Research (DE – FC05-92OR22072)and the states of Michigan and North Carolina. We alsogratefully acknowledge Maria Schneider, Jessica Wallace,Robert Jaros, Junko Yasuda (MSU), Lysiane Hauben,Sylvie VanEygen (RUG, Belgium) and Jim Lupski (BaylorCollege of Medicine, Houston) for technical support andmany useful discussions on rep-PCR genomic fingerprinting.
REFERENCES
Bragard, C., Singer, E., Alizadeh, A., Vauterin, L., Maraite, H. &Swings, J. (1997). Xanthomonas translucens from small grains :diversity and phylopathological relevance. Phytopathology 87,1111–1117.
de Bruijn, F. J. (1992). Use of repetitive (repetitive extragenicpalindromic and enterobacterial repetitive intergenic consen-sus) sequences and the polymerase chain reaction to fingerprintthe genomes of Rhizobium meliloti isolates and other soilbacteria. Appl Environ Microbiol 58, 2180–2187.
Caetano-Anolle! s, G., Bassam, B. J. & Gresshoff, P. M. (1991).DNA amplification fingerprinting using very short arbitraryoligonucleotide primers. Biotechnology 9, 553–557.
Clerc, A., Manceau, C. & Nesme, X. (1998). Comparison ofrandomly amplified polymorphic DNAwith amplified fragmentlength polymorphism to assess genetic diversity and geneticrelatedness within genospecies III of Pseudomonas syringae.Appl Environ Microbiol 64, 1180–1187.
Colwell, R. R. (1970). Polyphasic taxonomy of bacteria. InCulture Collections of Microorganisms, pp. 421–436. Edited byH. Iizuka & T. Hasegawa. Tokyo: University of Tokyo Press.
De Ley, J., Cattoir, H. & Reynaerts, A. (1970). The quantitativemeasurement of DNA hybridization from renaturation rates.Eur J Biochem 12, 133–142.
Esteve, C. (1997). Is AFLP fingerprinting a true alternative to theDNA-DNA pairing method to assess genospecies in the genusAeromonas? Int J Syst Bacteriol 47, 245–246.
Fox, G. E., Wisotzkey, J. D. & Jurtshuk, P., Jr (1992). How close isclose : 16S rRNA sequence identity may not be sufficient toguarantee species identity. Int J Syst Bacteriol 42, 166–170.
Gonza! lez, M., Rodrı!guez, R., Zavala, M. E., Jacobo, J. L.,Herna! ndez, F., Acosta, J., Martı!nez, O. & Simpson, J. (1998).Characterization of Mexican isolates of Colletotrichum linde-muthianum by using differential cultivars and molecularmarkers. Phytopathology 88, 292–299.
Ha$ ne, B. G., Ja$ ger, K. & Drexler, H. G. (1993). The Pearson
International Journal of Systematic and Evolutionary Microbiology 50 675

J. L. W. Rademaker and others
product-moment correlation coefficient is better suited foridentification of DNA fingerprinting profiles than band match-ing algorithms. Electrophoresis 14, 967–972.
Hartford, T. & Sneath, P. H. (1990). Experimental error in DNA-DNA pairing: a survey of the literature. J Appl Bacteriol 68,527–542.
Hauben, L., Vauterin, L., Swings, J. & Moore, E. R. B. (1997).Comparison of 16S ribosomal DNA sequences of all Xantho-monas species. Int J Syst Bacteriol 47, 328–335.
Heyndrickx, M., Vauterin, L., Vandamme, P., Kersters, K. & DeVos, P. (1996). Applicability of combined amplified ribosomalDNA restriction analysis (ARDRA) patterns in bacterialphylogeny and taxonomy. J Microbiol Methods 26, 247–259.
Huys, G., Coopman, R., Janssen, P. & Kersters, K. (1996). High-resolution genotypic analysis of the genus Aeromonas by AFLPfingerprinting. Int J Syst Bacteriol 46, 572–580.
Janssen, P. & Dijkshoorn, L. (1996). High resolution DNAfingerprinting of Acinetobacter outbreak strains. FEMS Micro-biol Lett 142, 191–194.
Janssen, P., Coopman, R., Huys, G., Swings, J., Bleeker, M., Vos,P., Zabeau, M. & Kersters, K. (1996). Evaluation of the DNAfingerprinting method AFLP as a new tool in bacterialtaxonomy. Microbiology 142, 1881–1893.
Janssen, P., Maquelin, K., Coopman, R., Tjernberg, I., Bouvet, P.,Kersters, K. & Dijkshoorn, L. (1997). Discrimination of Acineto-bacter genomic species by AFLP fingerprinting. Int J SystBacteriol 47, 1179–1187.
Kendall, M. G. (1970). Rank Correlation Methods, 3rd edn.London: Charles Griffin.
Lin, J. J., Kuo, J. & Ma, J. (1996). A PCR-based DNA finger-printing technique: AFLP for molecular typing of bacteria.Nucleic Acids Res 24, 3649–3650.
Louws, F. J., Fulbright, D. W., Stephens, C. T. & de Bruijn, F. J.(1994). Specific genomic fingerprints of phytopathogenicXanthomonas and Pseudomonas pathovars and strains gener-ated with repetitive sequences and PCR. Appl Environ Microbiol60, 2286–2295.
Louws, F. J., Fulbright, D. W., Stephens, C. T. & de Bruijn, F. J.(1995). Differentiation of genomic structure by rep-PCR finger-printing to rapidly classify Xanthomonas campestris pv. vesica-toria. Phytopathology 85, 528–536.
Louws, F. J., Schneider, M. & de Bruijn, F. J. (1997). Assessinggenetic diversity of microbes using repetitive sequence-basedPCR (rep-PCR). In Nucleic Acid Amplification Methods for theAnalysis of Environmental Microbes, pp. 63–94. Edited by G.Toranzos. Lancaster, PA: Technomic Publishing.
Lupski, J. R. & Weinstock, G. M. (1992). Short, interspersedrepetitive DNA sequences in prokaryotic genomes. J Bacteriol174, 4525–4529.
Moyer, C. L., Tiedje, J. M., Dobbs, F. C. & Karl, D. M. (1996). Acomputer-simulated restriction fragment length polymorphismanalysis of bacterial small-subunit rRNA genes: efficacy ofselected tetrameric restriction enzymes for studies of microbialdiversity in nature. Appl Environ Microbiol 62, 2501–2507.
Murray, R. G. E., Brenner, D. J., Colwell, R. R., De Vos, P.,Goodfellow, M., Grimont, P. A. D., Pfennig, N., Stackebrandt, E.& Zavarzin, G. A. (1990). Report of the ad hoc committee onapproaches to taxonomy within the Proteobacteria. Int J SystBacteriol 40, 213–215.
Nick, G., Jussila, M., Hoste, B., Niemi, M., Kaijalainen, S., deLajudie, P., Gillis, M., de Bruijn, F. J. & Lindstro$ m, K. (1999).Rhizobia isolated from root nodules of tropical leguminous tree
characterized using DNA-DNA dot-blot hybridisation and rep-PCR genomic fingerprinting. Syst Appl Microbiol 22, 287–299.
Pearson, K. (1926). On the coefficient of racial likeness. Bio-metrika 18, 105–117.
Pedersen, K., Verdonck, L., Austin, B. and 9 other authors (1998).Taxonomic evidence that Vibrio carchariae Grimes et al. 1985 isa junior synonym of Vibrio harveyi (Johnson and Shunk 1936)Bauman et al. 1981. Int J Syst Bacteriol 48, 749–758.
Rademaker, J. L. W. & de Bruijn, F. J. (1997). Characterizationand classification of microbes by rep-PCR genomic finger-printing and computer assisted pattern analysis. In DNAMarkers: Protocols, Applications and Overviews, pp. 151–171.Edited by G. Caetano-Anolle! s & P. M. Gresshoff. New York:John Wiley.
Rademaker, J. L. W., Louws, F. J., Schultz, M. H., Rossbach, U.,Vauterin, L., Swings, J. & de Bruijn, F. J. (1997). Molecularsystematics of xanthomonads by rep-PCR genomic finger-printing and computer-assisted pattern analysis. Phyto-pathology 87, S81.
Rademaker, J. L. W., Louws, F. J. & de Bruijn, F. J. (1998).Characterization of the diversity of ecologically importantmicrobes by rep-PCR genomic fingerprinting. In MolecularMicrobial Ecology Manual, supplement 3, chapter 3.4.3, pp.1–26. Edited by A. D. L. Akkermans, J. D. van Elsas & F. J. deBruijn. Dordrecht : Kluwer.
Rademaker, J. L. W., Louws, F. J., Rossbach, U., Vinuesa, P. & deBruijn, F. J. (1999). Computer-assisted pattern analysis of mol-ecular fingerprints and database construction. In MolecularMicrobial Ecology Manual, supplement 4, chapter 7.1.3, pp.1–33. Edited by A. D. L. Akkermans, J. D. van Elsas & F. J. deBruijn. Dordrecht : Kluwer.
Sneath, P. H. A. & Sokal, R. R. (1973). Numerical Taxonomy. SanFrancisco: Freeman.
Stackebrandt, E. & Goebel, B. M. (1994). Taxonomic note : aplace for DNA-DNA reassociation and 16S rRNA sequenceanalysis in the present species definition in bacteriology. Int JSyst Bacteriol 44, 846–849.
Vandamme, P., Pot, B., Gillis, M., de Vos, P., Kersters, K. & Swings,J. (1996). Polyphasic taxonomy, a consensus approach tobacterial systematics. Microbiol Rev 60, 407–438.
Vaneechoutte, M., De Beenhouwer, H., Claeys, G., Verschraegen,G., De Rouck, A., Paepe, N., Elaichouni, A. & Portaels, F. (1993).Identification of Mycobacterium species by using amplifiedribosomal DNA restriction analysis. J Clin Microbiol 31,2061–2065.
Vauterin, L. & Vauterin, P. (1992). Computer-aided objectivecomparison of electrophoresis patterns for grouping andidentification of microorganisms. Eur Microbiol 1, 37–41.
Vauterin, L., Swings, J. & Kersters, K. (1991). Grouping ofXanthomonas campestris pathovars by SDS-PAGE of proteins.J Gen Microbiol 137, 1677–1687.
Vauterin, L., Hoste, B., Kersters, K. & Swings, J. (1995). Re-classification of Xanthomonas. Int J Syst Bacteriol 45, 472–489.
Vauterin, L., Yang, P., Alvarez, A., Takikawa, Y., Roth, D. A.,Vidaver, A. K., Stall, R. E., Kersters, K. & Swings, J. (1996).Identification of non-pathogenic Xanthomonas strains associ-ated with plants. Syst Appl Microbiol 19, 96–105.
Versalovic, J., Koeuth, T. & Lupski, J. R. (1991). Distribution ofrepetitive DNA sequences in eubacteria and application tofingerprinting of bacterial genomes. Nucleic Acids Res 19,6823–6831.
Versalovic, J., Schneider, M., de Bruijn, F. J. & Lupski, J. R. (1994).
676 International Journal of Systematic and Evolutionary Microbiology 50

Genomic fingerprinting vs DNA–DNA homology studies
Genomic fingerprinting of bacteria using repetitive sequencebased PCR (rep-PCR). Methods Mol Cell Biol 5, 25–40.
Versalovic, J., de Bruijn, F. J. & Lupski, J. R. (1998). Repetitivesequence-based PCR (rep-PCR) DNA fingerprinting of bac-terial genomes. In Bacterial Genomes: Physical Structure andAnalysis, pp. 437–454. Edited by F. J. de Bruijn, J. R. Lupski &G. M. Weinstock. New York: Chapman & Hall.
Vos, P., Hogers, R., Bleeker, M. and 8 other authors (1995).AFLP: a new technique for DNA fingerprinting. Nucleic AcidsRes 23, 4407–4414.
Wayne, L. G., Brenner, D. J., Colwell, R. R. and 9 other authors(1987). Report of the ad hoc committee on reconciliation ofapproaches to bacterial systematics. Int J Syst Bacteriol 37,463–464.
Woese, C. R. (1987). Bacterial evolution. Microbiol Rev 51,221–271.
Yang, P., Vauterin, L., Vancanneyt, M., Swings, J. & Kersters, K.(1993). Application of fatty acid methyl esters for the taxonomicanalysis of the genus Xanthomonas. Syst Appl Microbiol 16,47–71.
International Journal of Systematic and Evolutionary Microbiology 50 677
Related Documents