University of Nebraska - Lincoln DigitalCommons@University of Nebraska - Lincoln USGS Staff -- Published Research US Geological Survey 2017 Comparison of Acoustic Recorders and Field Observers for Monitoring Tundra Bird Communities Skyler T. Vold Montana State University Colleen M. Handel U.S. Geological Survey, [email protected] Lance B. McNew Montana State University Follow this and additional works at: hp://digitalcommons.unl.edu/usgsstaffpub Part of the Geology Commons , Oceanography and Atmospheric Sciences and Meteorology Commons , Other Earth Sciences Commons , and the Other Environmental Sciences Commons is Article is brought to you for free and open access by the US Geological Survey at DigitalCommons@University of Nebraska - Lincoln. It has been accepted for inclusion in USGS Staff -- Published Research by an authorized administrator of DigitalCommons@University of Nebraska - Lincoln. Vold, Skyler T.; Handel, Colleen M.; and McNew, Lance B., "Comparison of Acoustic Recorders and Field Observers for Monitoring Tundra Bird Communities" (2017). USGS Staff -- Published Research. 1003. hp://digitalcommons.unl.edu/usgsstaffpub/1003

Welcome message from author
This document is posted to help you gain knowledge. Please leave a comment to let me know what you think about it! Share it to your friends and learn new things together.
Transcript

University of Nebraska - LincolnDigitalCommons@University of Nebraska - Lincoln
USGS Staff -- Published Research US Geological Survey
2017
Comparison of Acoustic Recorders and FieldObservers for Monitoring Tundra BirdCommunitiesSkyler T. VoldMontana State University
Colleen M. HandelU.S. Geological Survey, [email protected]
Lance B. McNewMontana State University
Follow this and additional works at: http://digitalcommons.unl.edu/usgsstaffpub
Part of the Geology Commons, Oceanography and Atmospheric Sciences and MeteorologyCommons, Other Earth Sciences Commons, and the Other Environmental Sciences Commons
This Article is brought to you for free and open access by the US Geological Survey at DigitalCommons@University of Nebraska - Lincoln. It has beenaccepted for inclusion in USGS Staff -- Published Research by an authorized administrator of DigitalCommons@University of Nebraska - Lincoln.
Vold, Skyler T.; Handel, Colleen M.; and McNew, Lance B., "Comparison of Acoustic Recorders and Field Observers for MonitoringTundra Bird Communities" (2017). USGS Staff -- Published Research. 1003.http://digitalcommons.unl.edu/usgsstaffpub/1003

Tools And Technology
Comparison of Acoustic Recorders and FieldObservers for Monitoring Tundra BirdCommunities
SKYLER T. VOLD,2 U.S. Geological Survey, Alaska Science Center, 4210 University Drive, Anchorage, AK 99508, USA
COLLEEN M. HANDEL ,1 U.S. Geological Survey, Alaska Science Center, 4210 University Drive, Anchorage, AK 99508, USA
LANCE B. MCNEW,2 U.S. Geological Survey, Alaska Science Center, 4210 University Drive, Anchorage, AK 99508, USA
ABSTRACT Acoustic recorders can be useful for studying bird populations but their efficiency and accuracyshould be assessed in pertinent ecological settings before use. We investigated the utility of an acousticrecorder for monitoring abundance of tundra-breeding birds relative to point-count surveys in northwesternAlaska, USA, during 2014. Our objectives were to 1) compare numbers of birds and species detected by afield observer with those detected simultaneously by an acoustic recorder; 2) evaluate how detectionprobabilities for the observer and acoustic recorder varied with distance of birds from the survey point;and 3) evaluate whether avian guild-specific detection rates differed between field observers and acousticrecorders relative to habitat. Compared with the observer, the acoustic recorder detected fewer species(bMethod¼�0.39� 0.07) and fewer individuals (bMethod¼�0.56� 0.05) in total and for 6 avian guilds.Discrepancies were attributed primarily to differences in effective area surveyed (91% missed by device were>100m), but also to nonvocal birds being missed by the recorder (55% missed <100m were silent). Theobserver missed a few individuals and one species detected by the device. Models indicated that relativeabundance of various avian guilds was associated primarily with maximum shrub height and less so withshrub cover and visual obstruction. The absence of a significant interaction between survey method(observer vs. acoustic recorder) and any habitat characteristic suggests that traditional point counts andacoustic recorders would yield similar inferences about ecological relationships in tundra ecosystems.Pairing of the 2 methods could increase survey efficiency and allow for validation and archival of surveyresults. Published 2017. This article is a U.S. Government work and is in the public domain in the USA.
KEY WORDS acoustic recorder, detection probability, habitat, passerines, point counts, population monitoring,shorebirds, subarctic Alaska, survey techniques, tundra.
Automated acoustic recording devices are increasingly beingrecognized as a useful tool for studying bird and anuranpopulations across broad landscapes because of the capacityof recorders to collect large amounts of vocalization data(Haselmayer and Quinn 2000, Acevedo and Villanueva-Rivera 2006, Hutto and Stutzman 2009, Furnas and Callas2015, Sidie-Slettedahl et al. 2015). Up to 94% of birdsrecorded during point counts are detected aurally by fieldobservers, suggesting utility of acoustic recorders forornithological research and monitoring (Simons et al.2007). Advantages of automated recorders include theprogrammable collection of acoustic data 24 hr/day without askilled observer in the field, thus maximizing sampling effort
and providing controlled spatial and temporal replication formonitoring (Haselmayer and Quinn 2000, Hobson et al.2002, Acevedo and Villanueva-Rivera 2006). An additionaladvantage is elimination of inter-observer errors because allrecordings can be analyzed by a single qualified interpreter;this individual’s analysis can be validated by otherinterpreters (Hobson et al. 2002, Rempel et al. 2005,Celis-Murillo et al. 2009). In contrast to field observations,recordings can be rechecked repeatedly by ear and withspectrograms. This capability makes acoustic recordersespecially useful for surveys during periods of very highbird activity, such as the dawn chorus, because a fieldobserver’s ability to detect birds can decline by 50% as birddensity increases (Bart and Schoultz 1984).Despite advantages of acoustic recorders for surveying
birds, relatively little information exists about detection ratesof recorders relative to those of actual field observers(Sidie-Slettedahl et al. 2015). Acoustic recorders are unableto detect nonvocalizing birds, suggesting species-specificbiases in detectability. Without triangulation to determine
Received: 26 May 2016; Accepted: 1 April 2017Published: 26 July 2017
1E-mail: [email protected] affiliation: Montana State University, Department of Animaland Range Sciences, Bozeman, MT 55901, USA.
Wildlife Society Bulletin 41(3):566–576; 2017; DOI: 10.1002/wsb.785
566 Wildlife Society Bulletin � 41(3)

position of birds in the survey area or visual observations todetect moving birds, it is often difficult to discern from arecording how many individuals of a species may bevocalizing in the survey area. Thus, occurrence at a site isoften reduced to presence–absence for a species instead ofquantified as abundance. In addition, the effective samplingdistance of aurally detected birds may differ from that of afield observer; this detection bias may vary with survey andhabitat conditions (Furnas and Callas 2014, McNew andHandel 2015). Although acoustic devices may record fewerdetections, especially for nonvocal species, they may haveutility as a supplement to, or replacement for, field observersif the difference between methods in detection rates isconsistent across variable environmental conditions. Thus,information on spatially variable detection rates and theeffective survey distance of acoustic recorders is needed todesign surveys and facilitate statistical analyses (Hutto andStutzman 2009). Previous research has shown that acousticrecorders often perform as well as, or better than, fieldobservers at measuring species diversity (Haselmayer andQuinn 2000, Acevedo and Villanueva-Rivera 2006) andoften have greater detection rates than human observerswhen many individuals of various species are vocalizingsimultaneously (Celis-Murillo et al. 2009). Nevertheless,acoustic recorders have also been found to perform poorlyrelative to trained field observers during songbird surveys indensely forested landscapes, suggesting that additional workis needed to evaluate relative biases of acoustic recorders inother habitat types and under spatially variable surveyconditions (Hutto and Stutzman 2009).We conducted a series of point-count surveys of tundra-
breeding birds in northwestern Alaska, USA, using a trainedfield observer and an acoustic recorder simultaneously acrosshabitats with varying shrub conditions. We were interestedin the potential use of programmable acoustic recorders as atool to assess seasonal patterns of avian abundance across abroad array of tundra habitats, which are difficult andexpensive to survey with human observers. Our objectiveswere to 1) compare the numbers of tundra-breeding birdsand species detected by a field observer with those detectedsimultaneously by an acoustic recorder; 2) evaluate howdetection probabilities for the observer and the acousticrecorder varied with distance of birds from the survey point;and 3) evaluate whether avian guild-specific detection ratesdiffered between field observers and acoustic recordersrelative to shrub characteristics. We predicted that a humanobserver would detect more birds and species overall than anacoustic recorder because the device would miss non-vocalizing birds. We also predicted that careful analysis ofacoustic recordings would likely detect some birds missed bythe field observer during periods of high song activity.Finally, we predicted that detection rates of different birdguilds would vary relative to shrub characteristics at surveysites due to effects on both abundance and detectionprobability. We were particularly interested in determiningwhether differences in detection rates of acoustic recordersand field observers would vary depending on shrubcharacteristics, which would render acoustic recorders less
useful in the absence of correction for habitat-specificdetection probability.
STUDY AREA
The Seward Peninsula of northwestern Alaska encompassesthe transition zone between the interior boreal forest andArctic tundra biomes. The 53,000-km2 peninsula ischaracterized by latitudinal, longitudinal, and elevationalgradients in ecosystem types, with a diversity of avianhabitats across a relatively limited spatial extent (Kessel1989). Vegetation classes range from high-elevation alpinetundra to tidally influenced marshlands and lowland borealforest, with a variety of shrub-dominated vegetation ofvarying heights (<10 cm to>5m) at intermediate elevations(Hanson 1953, Swanson et al. 1985). Permafrost conditionvaries from continuous (>90% coverage) to absent, and awarming climate has resulted in a significant degradation ofpermafrost and alteration of hydrology during the past 50years (Yoshikawa and Hinzman 2003). Climate on theSeward Peninsula is characterized by long cold winters (�20to �308C), and the growing season (May–Sep) is cool andwet along the coast with warmer and drier conditions inland(Hammond and Yarie 1996). Precipitation increases along anorth–south gradient during all seasons and over anelevational gradient in the winter. Average climate recordsfor Nome (a coastal weather station) indicated consistentgrowing-season daily temperatures (7.7� 5.58C) andprecipitation (0.4� 0.02 cm/day) during the past 25 years.We sampled birds and vegetation at 59 sites separated by
�500m along 5 transects, which were selected in accessibleareas from a larger collection of transects used for long-termavian monitoring on the Seward Peninsula (McNew et al.2013; Thompson et al. 2016, 2017). Transects were locatednear Grant Creek (65.548N, 165.058W), Neva Creek(65.488N, 164.768W), Bunker Hill (65.158N, 164.758W),Horton Creek (65.698N, 164.038W), and Fox River(64.848N, 163.768W). Survey points ranged in elevationfrom 50m to 458m and encompassed gradients of physicaland biotic habitat conditions ranging from dwarf shrub mattundra at higher elevations to mixed stands of tall shrubs andsparse woodlands along lowland margins of the boreal forest(Fig. 1).
METHODS
Field ProceduresA single experienced observer (SV) conducted 1–3 10-minpoint counts while simultaneously recording all bird soundswith an acoustic recording device at each of the 59 surveysites during the peak breeding season between 1 and 17June 2014. After arrival at each survey site, the observermounted a commercially available recorder (Model SM2;Wildlife Acoustics, Inc., Maynard, MA, USA) on a tripod ata height of 1m. Additional foam covers were attached to therecorder’s 2 omnidirectional microphones to minimizeinterference from wind and rain noise. Before beginningeach survey, the observer recorded cloud cover, ambient airtemperature, wind speed, and precipitation, and announced
Vold et al. � Acoustic Monitoring of Tundra-Breeding Birds 567

into the recorder’s microphone the survey site, date, andtime. Surveys were not conducted if wind speed exceeded15 km/hr, fog limited visibility to<250m, or there was morethan a light rain shower. Surveys were conducted using astandard point-count protocol in which all individual birdsdetected by sight or sound were identified to species (Ralphet al. 1995). For each individual bird detected, the observerrecorded 1) distance to the bird in intervals of 0–25m,26–50m, 51–100m, 101–250m, and �250m; 2) minute ofthe survey during which the bird was first detected; and 3)vocalization type and behavior when the bird was firstdetected. Vocalization, when given, was recorded as fullsong, partial song, call, alarm call, or winnow; behavior ofobserved birds was recorded as flying, flight display, feeding,sitting, or walking. Data were collected under a study planwith procedures approved by the U.S. Geological SurveyAlaska Science Center’s Animal Care and Use Committee(protocol 2012-9).Vertical structure, density, and diversity of shrubs can
influence both the occurrence and detectability of birds inArctic and subarctic ecosystems (Kessel 1989, Amundson
et al. 2014, McNew and Handel 2015). To test for suchassociations, we measured 9 vegetation characteristics relatedto shrubs at 10 subsampling points associated with each birdsurvey location immediately after all bird surveys had beencompleted for the season (29 Jun–21 Jul 2014). We placed 5subsampling plots along each of 2 20-m transects oriented ina random direction (0–3598); one transect originated at thebird survey point and the other began at a point selectedrandomly within 250m of the bird survey point. At eachsubsampling point, we measured height of the tallest shrub(to 0.01m) and estimated overlapping coverages within a0.5-m� 0.5-m quadrat frame for 4 types of shrub: alder(Alnus viridis), dwarf birch (Betula spp.), ericaceous shrubs(e.g., Empetrum, Vaccinium spp.), and willow (Salix spp.).Percent cover was categorized as 0%, 1–5%, 6–25%, 26–50%,51–75%, 76–95%, or 96–100% of the quadrat frame; weconverted these to the midpoints of each category foranalysis. We also measured visual obstruction, an index ofvegetation height and density ranging from 0 to 5, at eachsubsampling point from a distance of 2m and height of 0.5mas described in Robel et al. (1970).
Figure 1. Location of avian survey areas during 2014 on the Seward Peninsula, northwestern Alaska, USA. Photographs illustrate the range of habitats in theArctic–boreal transition zone sampled in this study: 1) First author (SV) with acoustic recorder at Grant Creek (elevation 458m), dwarf shrub mat tundra,dominated by lichens, herbaceous, graminoid, and low ericaceous vegetation; 2) Neva Creek (131m), dwarf shrub meadow, dominated by tussock-formingcottongrass (Eriophorum spp.) and other sedges, interspersed with low ericaceous shrubs, dwarf birch (Betula spp.), and dwarf willow (Salix spp.); 3) Bunker Hill(106m), medium shrub thicket, dominated by stands of alder (Alnus viridis), willow, dwarf birch and ericaceous shrubs, interspersed with graminoid vegetation;4) Horton Creek (239m), sparse stands of low shrub thicket (primarily willow <1m tall) across dwarf shrub mat tundra; and 5) Fox River (53m), coniferouswoodland and tall shrub thicket, with sparse white spruce (Picea glauca) in matrix of tall willows (>2.5m tall).
568 Wildlife Society Bulletin � 41(3)

Laboratory AnalysisWe downloaded acoustic files from the recorder’s memorycard and converted them into .wav format with KaleidoscopeConverter software (Wildlife Acoustics, Inc.). To eliminateinter-observer bias, the same observer (SV) who conductedthe point-count surveys in the field analyzed the acousticrecordings. The analyst located the 10-min recordingwindows that corresponded with simultaneous 10-min pointcounts, and recorded the survey site, date, and start time ofthe recording. For each distinguishable bird heard producingan identifiable vocalization, the analyst recorded species, typeof vocalization, and the minute within the 10-min sound fileduring which the vocalization was first detected. Eachindividual bird was counted only once, regardless of howmany times it vocalized during the 10-min recording or howmuch of a vocalization was recorded. When multipleindividuals of the same species were heard vocalizingsimultaneously, they were counted as separate individuals.Nonoverlapping songs were always treated as the sameindividual because of the potential for undetected movement;thus, our conservative protocol likely resulted in negative biasin the number of individuals of some species detected at eachsite. Although each recording was listened to one time,segments of the recording were often replayed during thelistening session to distinguish multiple birds that werevocalizing simultaneously. The analyst, who had 2 years offield experience on the study area and was familiar with thebirds and local dialects, spent 12–13min to listen to, andrecord data from, each 10-min recording.For each bird detected on a recording, we matched it to the
individual detected during the point count that it was mostlikely to be and assigned it to the same distance class. Weassumed that birds vocalizing closer to the recording devicewould have a greater likelihood of being recorded relative tomore distant birds. Therefore, we assigned birds detected onrecordings to distance classes determined by field observa-tions beginning with those detected closest to the surveypoint. For example, if 3 individuals of a species were recordedduring the point-count survey at 50m, 100m, and 250m and2 were identified on the acoustic recording, we assumed thatthe 2 birds recorded by the device were those detected at 50mand 100m by the field observer and that the bird occurring at250m was not detected by the acoustic recorder.
Data AnalysisWe performed all statistical analyses in Program R (version3.0.2; R Core Team 2013). We used distance models toestimate the probability that an individual bird would bedetected within 250m by the human observer or by theacoustic recorder (Buckland et al. 2001; R package“Distance”). We analyzed all birds together, regardless ofspecies, because of limited sample sizes in this exploratorystudy. Although there was heterogeneity among species indetection probability, interspecific differences were minimalclose to the recorder; thus, overall model estimates should bepooling robust (Burnham et al. 2004). We treated detectionsof groups of birds as single detections to avoidpseudoreplication, ignoring the potential effect of flock
size on detection probability because there were so few (6.2%of detections by observer; 3.6% by acoustic recorder). Weused a half-normal function with cosine adjustment terms tomodel the detection probabilities.To examine the potential effects of survey method and
shrub characteristics on number of birds and speciesdetected at each survey point, we pooled our species-levelobservation data into 6 groups representing guilds ofbreeding birds with similar ecological niches, behavior, andvocalization characteristics and limited to those withsufficient detections to model (Table 1). Groups includedshorebirds (Charadriidae and Scolopacidae), thrushes andOld World flycatchers (Turdidae and Muscicapidae),longspurs (Calcariidae), Old and New World warblers(Phylloscopidae and Parulidae), sparrows (Emberizidae),and redpolls (Fringillidae).For each survey point, we constructed 3 composite variables
to represent different characteristics of shrub vegetationwithin the 250-m-radius sampling area around the point.We calculated VO, which represented an index of averagevegetation height and density, as the mean visual obstructionindex across the 10 subsamples/point. We derived cover,which provided an index of total shrub cover, by summingthe percent cover for the 4 shrub types (birch, willow, alder,ericaceous) in each subsample and then calculating the meanacross the 10 subsamples. MaxHt was the maximum height(m) of any shrub type across all 10 subsamples.We used paired t-tests (R package “stats”) to compare the
number of species detected per transect and per point by thefield observer vs. the acoustic recorder. We then usedgeneralized linear models with the log-link function and aPoisson error structure (R package “glm”) to evaluate howsurvey method and shrub characteristics affected na€ıvespecies richness and the number of birds counted in eachbird group. We restricted these analyses to data collectedduring the first visit to each point to assure independence ofcounts. We created 12 candidate models representing ourhypotheses regarding the effects of survey method andshrub characteristics on the number of birds and speciesdetected. These models were 1) null model, no effect ofsurvey method or shrub characteristics; 2) method-onlymodel, counts of birds differed by method but wereunrelated to shrub characteristics; (3–9) methodþ shrubmodels, counts of birds differed between methods but alsovaried with one or more shrub characteristics in an additivefashion; and (10–12) method� shrub simple interactionmodels, the effect of one of the shrub characteristics oncounts of birds differed between methods. Support for aninteraction model would suggest limited utility of aparticular method when site-specific habitat conditionsinfluence detection rates. We used Akaike’s InformationCriterion adjusted for small sample sizes (AICc) to evaluatesupport for each model (Burnham and Anderson 2002). Formodels with DAICc� 2 that differed from the top model bya single parameter (K), we considered the additionalparameter to be uninformative (Burnham and Anderson2002, Arnold 2010). Original data and associated metadatahave been archived at: doi:10.5066/F7V98674.
Vold et al. � Acoustic Monitoring of Tundra-Breeding Birds 569

RESULTS
The field observer detected 915 birds representing 38 speciesat the 59 survey points during the first visit to each site(Table S1, available online in Supporting Information).Overall, 500 (55%) of the birds detected by the observer inthe field were also detected on the acoustic recordings. Inaddition, 22 individual birds representing 13 species,including 1 new species, were identified from acousticrecordings that were not recorded by the field observer. Theproportion of birds detected by the field observer that werealso detected by the acoustic recorder declined with distancefrom the survey point, from 84% for birds in the 0–25-minterval to 28% for birds observed �250m from the surveypoint (Fig. 2). For all species combined, the overallprobability of detecting a bird (or flock) within 250m was0.15� 0.01 (SE) for the human observer and 0.10� 0.009for the acoustic recorder, based on the detection functionfitted to the distance data. Estimated detection probabilitieswithin 100m were 0.58� 0.05 for the observer and0.46� 0.04 for the acoustic recorder. Most of the birdsmissed by the acoustic recorder (91% of 415) were atdistances >100m. Among the 38 individuals missed within100m, 21 (55%) were silent and detected only by visualobservation. In other cases, multiple individuals of the samespecies were singing and thus underestimated from therecordings and others were simply not discernible on therecordings.
Relative Abundance Models by GroupThe total number of birds detected across all species was bestexplained by an additive model that included the main effects
of survey method and all 3 shrub characteristics, which had72% of the support within the candidate model set(AICcwi¼ 0.72; Table 2). On average, the acoustic recorderdetected fewer total birds than the field observer(bMethod¼�0.56� 0.05 SE); detections for both methodsincreased strongly with maximum shrub height (bMaxHt¼0.16� 0.02; Fig. 3A), moderated slightly by increases in total
Figure 2. Total numbers of birds (all species combined) detected by atrained field observer (filled bars) and on simultaneous acoustic recordings(open bars) relative to distance from the survey point during 10-min pointcounts of tundra-breeding birds at 59 sites on the Seward Peninsula,northwestern Alaska, USA, 2014. Solid symbols and line indicate theproportion (�SE) of birds detected by the observer that were also detectedon the acoustic recording within each distance interval, given the assumptionthat vocalizations of the birds closest to the recording device were most likelyto be recorded.
Table 1. Species, ecological groups for analysis, and counts of breeding birds detected by field observers and acoustic recorders during point-count surveys ontundra habitats at 59 sites on the Seward Peninsula, northwestern Alaska, USA, 2014.
No. detected
Group Species Scientific name Field observer Acoustic recorder
Shorebirds American golden-plover Pluvialis dominica 14 8Pacific golden-plover Pluvialis fulva 8 6Whimbrel Numenius phaeopus 2 0Bristle-thighed curlew Numenius tahitiensis 5 2Western sandpiper Calidris mauri 12 3Wilson’s snipe Gallinago delicata 59 33
Thrushes and bluethroat Bluethroat Luscinia svecica 24 11Gray-cheeked thrush Catharus minimus 61 35American robin Turdus migratorius 32 15Varied thrush Ixoreus naevius 17 13
Longspurs Lapland longspur Calcarius lapponicus 67 27Old and New World warblers Arctic warbler Phylloscopus borealis 20 14
Northern waterthrush Parkesia noveboracensis 30 18Orange-crowned warbler Oreothlypis celata 16 9Yellow warbler Setophaga petechia 31 20Blackpoll warbler Setophaga striata 10 7Yellow-rumped warbler Setophaga coronata 0 1Wilson’s warbler Cardellina pusilla 23 17
Sparrows American tree sparrow Spizelloides arborea 16 10Savannah sparrow Passerculus sandwichensis 57 31Fox sparrow Passerella iliaca 118 87White-crowned sparrow Zonotrichia leucophrys 17 8Golden-crowned sparrow Zonotrichia atricapilla 52 39
Redpolls Common and hoary redpoll Acanthis flammea and A. hornemanni 162 88Other species 62 20Total birds 915 522
570 Wildlife Society Bulletin � 41(3)

shrub cover (bCover¼ 0.005� 0.001) and decreases in visualobstruction (bVO¼�0.04� 0.02).Counts of 6 species of shorebirds were pooled into a single
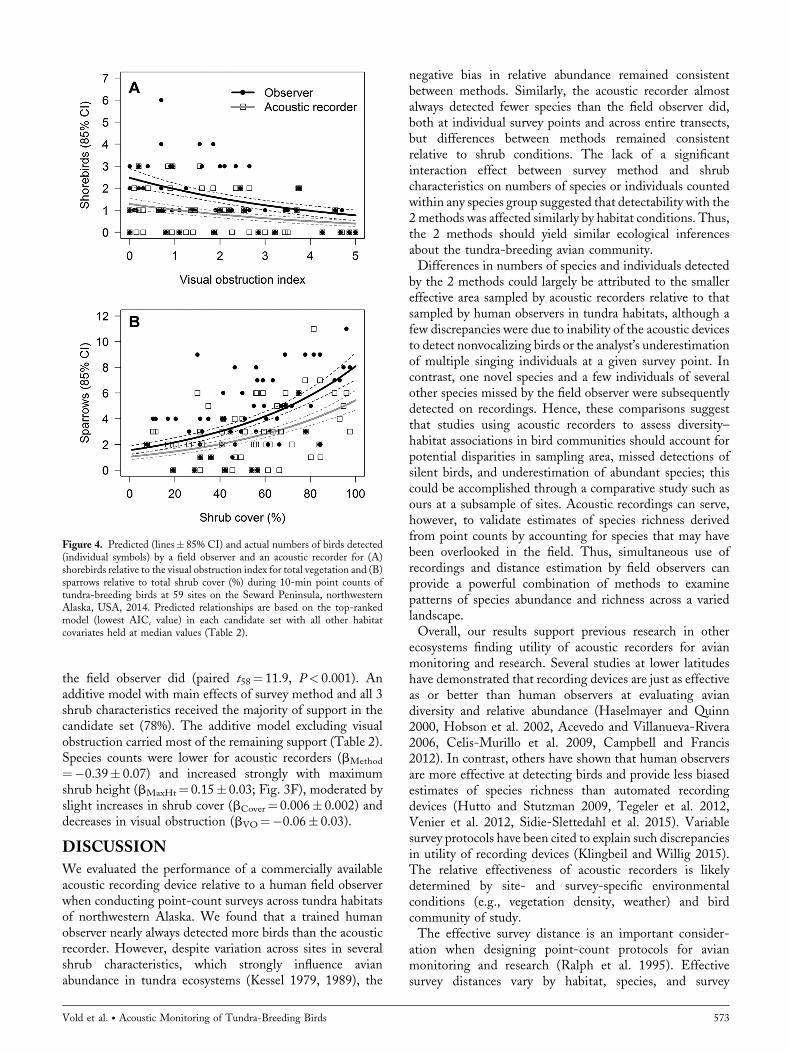
shorebird group (Table 1). The field observer and acousticrecorder detected 100 and 52 individual shorebirds,respectively. The top model included the main effects ofsurvey method and visual obstruction and had 40% of therelative support of the data (Table 2). Additionalparameters for shrub height, cover, and an interactioneffect between method and visual obstruction wereuninformative (sensu Arnold 2010) in other models; thus,the top model essentially received all of the support in thecandidate set. Counts of shorebirds were lower for theacoustic recorder (bMethod¼�0.65� 0.17) and decreased asvisual obstruction of the surrounding vegetation increased(bVO¼�0.23� 0.06; Fig. 4A).Three species of New World thrushes and the thrush-like
OldWorld bluethroat (Luscinia svecica) were detected duringpoint-count surveys (Table 1). The field observer detected134 birds within the “thrush” group and the acoustic recorderdetected 74. An additive model with the effects of surveymethod and all 3 shrub characteristics received virtually all ofthe support of the data (96%; Table 2). The acoustic recorderdetected fewer thrushes than the field observer (bMethod¼�0.59� 0.14) and detections by both methods increasedprimarily with shrub height (bMaxHt¼ 0.41� 0.06; Fig. 3B),moderated by increases in cover (bCover¼ 0.011� 0.004) anddecreases in visual obstruction (bVO¼�0.27� 0.07).
The field observer and acoustic recorder detected 67 and27 Lapland longspurs (Calcarius lapponicus), respectively,at the 59 survey sites. The best model had 68% of thesupport of the data and included additive effects of surveymethod, maximum shrub height, and shrub cover(Table 2). The next best model added visual obstruction,which proved to be an uninformative parameter (cf. Arnold2010); thus, the remainder of the support could also beattributed to the top-ranked model. Acoustic recordersdetected fewer longspurs than the field observer on average(bMethod¼�0.91� 0.23) and counts from both methodsdeclined rapidly with both maximum shrub height(bMaxHt¼�1.63� 3.2; Fig. 3C) and total shrub cover(bCover¼�0.025� 0.006).The observer detected 6 species of New World warblers
and the ecologically similar Old World arctic warbler(Phylloscopus borealis) across the 59 survey sites (Table 1).The field observer and acoustic recorder detected 130 and86 warblers, respectively. An additive model with maineffects of survey method, maximum shrub height, and shrubcover had the majority of support (73%) and also garneredthe remainder of the weight from the next best model,which added visual obstruction, an uninformative parameter(Table 2). The acoustic recorder detected fewer birds thanthe field observer (bMethod¼�0.41� 0.14) and detectionsby both methods increased strongly with shrub height(bMaxHt¼ 0.60� 0.06; Fig. 3D) and less so with shrubcover (bCover¼ 0.019� 0.004).
Table 2. Model selection for effects of survey method (field observer vs. acoustic recorder) and shrub characteristics on counts of breeding birds by speciesgroup and on species richness in tundra habitats at 59 sites on the Seward Peninsula, northwestern Alaska, USA, 2014. Characteristics of shrubs modeled ateach site include maximum height (MaxHt), average percent cover (Cover), and a visual obstruction index (VO). We present number of parameters (K),Akaike’s Information Criterion corrected for small sample size (AICc), difference in AICc between model and top-ranked model in candidate set (DAICc),model weight (wi), cumulative model weight within candidate set, and log likelihood (LL) for each model. Only models with DAICc< 5 are shown.
Model K AICc DAICc wi Cumulative wi LL
All birdsMethodþMaxHtþCoverþVO 5 742.26 0 0.72 0.72 �365.86MethodþMaxHtþCover 4 744.28 2.02 0.26 0.99 �367.96
ShorebirdsMethodþVO 3 335.80 0 0.40 0.40 �164.80MethodþVOþMaxHt 4 337.12 1.32 0.21 0.60 �164.38Method�VO 4 337.73 1.92 0.15 0.76 �164.69MethodþVOþCover 4 337.94 2.14 0.14 0.89 �164.79MethodþVOþMaxHtþCover 5 339.03 3.22 0.08 0.97 �164.24
Thrushes and bluethroatMethodþMaxHtþCoverþVO 5 361.43 0 0.96 0.96 �175.44
Lapland longspurMethodþMaxHtþCover 4 205.18 0 0.68 0.68 �98.41MethodþMaxHtþCoverþVO 5 206.69 1.50 0.32 1.00 �98.08
Old and New World warblersMethodþMaxHtþCover 4 388.08 0 0.73 0.73 �189.86MethodþMaxHtþCoverþVO 5 390.05 1.97 0.27 1.00 �189.76
SparrowsMethodþCoverþMaxHt 4 519.97 0 0.67 0.67 �255.81MethodþCoverþMaxHtþVO 5 521.61 1.64 0.29 0.96 �255.54
RedpollsMethodþMaxHtþVO 4 397.34 0 0.41 0.41 �194.49MethodþMaxHtþCoverþVO 5 397.67 0.33 0.35 0.76 �193.57MethodþCoverþVO 4 399.39 2.05 0.15 0.91 �195.52MethodþMaxHt 3 401.41 4.07 0.05 0.96 �197.60
Species richnessMethodþMaxHtþCoverþVO 5 565.81 0 0.78 0.78 �277.64MethodþMaxHtþCover 4 568.47 2.66 0.21 0.98 �280.06
Vold et al. � Acoustic Monitoring of Tundra-Breeding Birds 571

Observations of 5 species of sparrows were combined into asingle sparrow group at each survey site (Table 1). The fieldobserver and acoustic recorder detected 260 and 175sparrows, respectively, at all sites. The top-ranked modelincluded additive effects of survey method, maximum shrubheight, and shrub cover with 67% of the support; visualobstruction was again an uninformative parameter, resultingin 96% of cumulative support for the top model (Table 2).On average, acoustic recorders detected fewer sparrows persite than the field observer did (bMethod¼�0.38� 0.18).Detections for both methods increased strongly with totalshrub cover (bCover¼ 0.016� 0.002; Fig. 4B) and maximumshrub height (bMaxHt¼ 0.12� 0.04).Counts of common and hoary redpolls (Acanthis flammea
and A. hornemanni, respectively) were pooled into a singleredpoll group (Table 1). The field observer detected 162redpolls while 88 individual redpolls were identifiable from
acoustic recordings. A single model with additive effects ofsurvey method, maximum shrub height, and visualobstruction had 41% of the support; a model that alsoincluded shrub cover, an uninformative parameter, hadanother 35%, thereby resulting in 76% of cumulativesupport for the top-ranked model (Table 2). Counts ofredpolls were lower using acoustic recorders (bMethod¼�0.61� 0.13), but increased with both maximum shrubheight (bMaxHt¼ 0.16� 0.04; Fig. 3E) and visual obstruc-tion (bVO¼ 0.12� 0.075).
Relative Species RichnessAt the transect level, the acoustic recorder detected slightlyfewer species than did the field observer (acoustic recorder¼ 18.2� 2.4 SD; observer¼ 21.4� 4.1; paired t4¼ 2.76,P¼ 0.05). At the scale of the individual survey point, acousticrecorders detected 2.9� 1.9 fewer species on average than
Figure 3. Predicted (lines� 85%CI) and actual numbers of birds detected (individual symbols) by a field observer and an acoustic recorder relative to maximumshrub height (m) for (A) all birds, (B) NewWorld thrushes plus bluethroat, (C) longspurs, (D) Old and NewWorld warblers, (E) redpolls, and (F) number ofspecies (na€ıve richness) during 10-min point counts of tundra-breeding birds at 59 sites on the Seward Peninsula, northwestern Alaska, USA, 2014. Predictedrelationships are based on the top-ranked model (lowest AICc value) in each candidate set with all other habitat covariates held at median values (Table 2).
572 Wildlife Society Bulletin � 41(3)
the field observer did (paired t58¼ 11.9, P< 0.001). Anadditive model with main effects of survey method and all 3shrub characteristics received the majority of support in thecandidate set (78%). The additive model excluding visualobstruction carried most of the remaining support (Table 2).Species counts were lower for acoustic recorders (bMethod
¼�0.39� 0.07) and increased strongly with maximumshrub height (bMaxHt¼ 0.15� 0.03; Fig. 3F), moderated byslight increases in shrub cover (bCover¼ 0.006� 0.002) anddecreases in visual obstruction (bVO¼�0.06� 0.03).
DISCUSSION
We evaluated the performance of a commercially availableacoustic recording device relative to a human field observerwhen conducting point-count surveys across tundra habitatsof northwestern Alaska. We found that a trained humanobserver nearly always detected more birds than the acousticrecorder. However, despite variation across sites in severalshrub characteristics, which strongly influence avianabundance in tundra ecosystems (Kessel 1979, 1989), the
negative bias in relative abundance remained consistentbetween methods. Similarly, the acoustic recorder almostalways detected fewer species than the field observer did,both at individual survey points and across entire transects,but differences between methods remained consistentrelative to shrub conditions. The lack of a significantinteraction effect between survey method and shrubcharacteristics on numbers of species or individuals countedwithin any species group suggested that detectability with the2 methods was affected similarly by habitat conditions. Thus,the 2 methods should yield similar ecological inferencesabout the tundra-breeding avian community.Differences in numbers of species and individuals detected
by the 2 methods could largely be attributed to the smallereffective area sampled by acoustic recorders relative to thatsampled by human observers in tundra habitats, although afew discrepancies were due to inability of the acoustic devicesto detect nonvocalizing birds or the analyst’s underestimationof multiple singing individuals at a given survey point. Incontrast, one novel species and a few individuals of severalother species missed by the field observer were subsequentlydetected on recordings. Hence, these comparisons suggestthat studies using acoustic recorders to assess diversity–habitat associations in bird communities should account forpotential disparities in sampling area, missed detections ofsilent birds, and underestimation of abundant species; thiscould be accomplished through a comparative study such asours at a subsample of sites. Acoustic recordings can serve,however, to validate estimates of species richness derivedfrom point counts by accounting for species that may havebeen overlooked in the field. Thus, simultaneous use ofrecordings and distance estimation by field observers canprovide a powerful combination of methods to examinepatterns of species abundance and richness across a variedlandscape.Overall, our results support previous research in other
ecosystems finding utility of acoustic recorders for avianmonitoring and research. Several studies at lower latitudeshave demonstrated that recording devices are just as effectiveas or better than human observers at evaluating aviandiversity and relative abundance (Haselmayer and Quinn2000, Hobson et al. 2002, Acevedo and Villanueva-Rivera2006, Celis-Murillo et al. 2009, Campbell and Francis2012). In contrast, others have shown that human observersare more effective at detecting birds and provide less biasedestimates of species richness than automated recordingdevices (Hutto and Stutzman 2009, Tegeler et al. 2012,Venier et al. 2012, Sidie-Slettedahl et al. 2015). Variablesurvey protocols have been cited to explain such discrepanciesin utility of recording devices (Klingbeil and Willig 2015).The relative effectiveness of acoustic recorders is likelydetermined by site- and survey-specific environmentalconditions (e.g., vegetation density, weather) and birdcommunity of study.The effective survey distance is an important consider-
ation when designing point-count protocols for avianmonitoring and research (Ralph et al. 1995). Effectivesurvey distances vary by habitat, species, and survey
Figure 4. Predicted (lines� 85% CI) and actual numbers of birds detected(individual symbols) by a field observer and an acoustic recorder for (A)shorebirds relative to the visual obstruction index for total vegetation and (B)sparrows relative to total shrub cover (%) during 10-min point counts oftundra-breeding birds at 59 sites on the Seward Peninsula, northwesternAlaska, USA, 2014. Predicted relationships are based on the top-rankedmodel (lowest AICc value) in each candidate set with all other habitatcovariates held at median values (Table 2).
Vold et al. � Acoustic Monitoring of Tundra-Breeding Birds 573

conditions (Faanes and Bystrak 1981, Alldredge et al. 2007,Simons et al. 2007), suggesting regional or site-specificevaluation is necessary. Our data agree with previous studiesfinding that the proportion of birds detected by the fieldobserver that are also detected by an acoustic recorderdeclines with distance from the survey point (Acevedo andVillanueva-Rivera 2006, Tegeler et al. 2012, Venier et al.2012). Relative to the field observer, the acoustic recorderaccounted for most birds occurring within 100m of thesurvey point (80%), but much lower detection rates beyond100m (48%) suggest limited utility of recording devicesoutside this range in tundra habitats. Similar results werefound in a study of anurans in tundra meadows in subarcticCanada (Mannan et al. 2014). Given the relatively lowdensities of tundra-breeding birds, the efficiency of acousticrecorders at northern latitudes is much lower than that intemperate or tropical ecosystems in terms of numbers ofindividuals and species recorded. Thus, studies envisionedfor monitoring tundra ecosystems with acoustic recordersshould carefully assess the number of sites needed toestimate a target parameter with the desired precision.Acoustic recorders sometimes outperform human field
observers in detecting species in areas of high species richnessand abundance because recordings can be replayed todistinguish between overlapping calls within and amongspecies (Haselmayer and Quinn 2000, Acevedo andVillanueva-Rivera 2006). A drawback of the sole use ofrecorders, however, is that ensuing estimates of speciesrichness are compromised by the lack of a defined area ofinference. Periods of high bird activity often result in a lowerproportion of total birds detected by a point-count observeras a result of overlapping songs and increased difficulty ofdetection as singing frequency increases and quick identi-fications must be made (Bystrak 1981, Bart and Schoultz1984, Haselmayer and Quinn 2000, Hutto and Stutzman2009). Arctic and subarctic habitats tend to have lower avianabundance and diversity relative to those in temperate andtropical regions (e.g., MacArthur 1972, Hawkins et al.2003). Relatively low bird densities on our study areasreduced the initial count-recording frenzy that results fromlarge numbers of active and vocalizing birds during the dawnchorus. Celis-Murillo et al. (2009) found that acousticrecorders provided a more accurate pattern of temporal birddetection throughout the recording period because record-ings during high bird activity could be replayed to determinethe exact minute a species or individual was first detected.Although activity periods are most intense during the earlymorning hours, the continuous daylight of the subarcticsummer likely acts to reduce the intensity of the dawn choruswhen compared with areas at lower latitudes (Ashley et al.2013, Steiger et al. 2013).Vegetation density and structure affect the abundance and
probability of detection for many species of birds (McSheaand Rappole 1997, Pacifici et al. 2008). As expected, birdcounts at our study sites were influenced by shrub conditionsfor all bird groups we evaluated, a pattern we recentlyconfirmed more broadly across the Seward Peninsula(Thompson et al. 2016). Importantly, however, statistically
significant interactions between survey method and shrubcharacteristics were not supported for our models ofindividual counts. Both survey methods yielded similarinference regarding the effect of shrub conditions on relativeabundance and species richness for all groups considered.Thus, our data suggest that acoustic recorders may haveutility for studies evaluating the ecological patterns of relativeabundance for most tundra-breeding passerines and shore-birds. Similar findings of relative performance of acousticrecorders for other avian communities in variable ecosystemssuggest broad utility of recording devices for monitoring andresearch (Hobson et al. 2002, Hutto and Stutzman 2009,Celis-Murillo et al. 2012, Tegeler et al. 2012, Klingbeil andWillig 2015).We have previously shown that raw species counts (i.e.,
na€ıve species richness) recorded by field observers can resultin biased and often incorrect inferences regarding theinfluence of shrubs on species richness in tundra habitats andrecommended that site-specific detection probabilities beincorporated into estimates (McNew and Handel 2015). Inthis study, we found significant associations between one ormore shrub characteristics and na€ıve species richness andabundance estimates for all species groups at the study sites.Maximum height of shrubs was the strongest correlate ofoverall species richness and abundance for 5 of 7 groupsof birds considered, which confirms the importance ofvegetation height and vertical structural diversity to birds inAlaska and elsewhere (MacArthur and MacArthur 1961;Kessel 1979, 1989, 1998). All bird groups respondedpositively to increases in shrub vegetation except shorebirdsand longspurs, both of which select open meadows or dwarfshrub habitat for nesting (Kessel 1989). The amount of leafarea (Pacifici et al. 2008) or woody vegetation in otherwiseopen habitat (Weller et al. 2012) can strongly influence bothdetection probability and actual abundance of birds;therefore, it is important to use analytical methods thataccount for detectability effects at the site level to drawproper ecological inference about species abundance andrichness (e.g., Royle and Dorazio 2008, Amundson et al.2014). In addition, although we analyzed detections forguilds of birds because of limited sample sizes in this initialstudy, individual species within these guilds are likely toexhibit species-specific responses, some of which may benonlinear relative to shrub characteristics. Such relationshipsshould be investigated with a more robust data set (cf.Thompson et al. 2016).The distribution and structure of vegetation types in
boreal and Arctic ecosystems have been changing rapidlyin response to climatic changes, with significant implica-tions for avian abundance, biodiversity, and life-historyphenology (Hinzman et al. 2005; Marcot et al. 2015;Stralberg et al. 2015, 2016). Carefully designed deploy-ments of acoustic recorders may provide a cost-effectivetechnique for monitoring ecosystem-level changes to birdcommunities. An optimal sampling strategy can be derivedfrom estimates of time and costs involved in purchasing,deploying, and retrieving recorders; conducting pointcounts; and analyzing the recordings. Field costs will be
574 Wildlife Society Bulletin � 41(3)

dictated by accessibility of the sampling sites and level ofdesired precision of the estimates, which will in turndepend upon species abundance and variability across thestudy area. Time required to analyze recordings willdepend upon species richness and abundance at each siteand will be minimized if the analyst is familiar with thebirds and dialects of the area. Even if data collected byautomated recording devices cannot be analyzed immedi-ately because of time constraints or lack of funding, subsetscan be analyzed and the full data set can be archived forfuture analysis (Hobson et al. 2002).In conclusion, our results suggest that acoustic recorders
have utility for avian monitoring and research in the tundraecosystems of Alaska and elsewhere. The time and expenserequired to use human observers to conduct point-countsurveys in wilderness areas, coupled with the paucity oftrained observers, brevity of the breeding season, andinaccessibility of remote wilderness areas, greatly restrictthe capacity of a monitoring program based solely on suchsurveys. Acoustic recorders are relatively inexpensive and,once deployed, can provide nearly continuous survey datafor an entire breeding season. Programmed, replicatedrecordings at fine temporal resolution (e.g., hourly, daily)can produce high-quality survey data sets suitable toestimate occupancy, abundance, and species richness usinghierarchical models, as well as site-specific phenology ofmigration and breeding activity. Conducting point-countsurveys simultaneously with a subset of acoustic recordingswill allow direct assessment of detection probability andeffective sampling area relative to vegetation and othersite-specific characteristics, if distance sampling is usedand vocalization behavior is recorded. This combinedanalytical approach will enable use of the more extensiveacoustical data set to estimate densities and speciesrichness (including nonvocal species) relative to sitecharacteristics. Digitally archived acoustic recordingsover time can provide records of changes to birdcommunities relative to management treatments, environ-mental changes, or other factors of interest. As technologyadvances and new acoustic recorders are developed, it willbe important, particularly for long-term monitoringprograms, to calibrate the units relative to detectiondistances to account for potential changes over time ineffective sampling area.
ACKNOWLEDGMENTS
We thank R. M. Richardson for essential help in the field,particularly with collecting habitat data, and S. J. Thomp-son for assistance in data analysis, insightful discussions,and review of the manuscript. We also thank AssociateEditor C. Boal, J. M. Pearce, and 2 anonymous reviewersfor helpful suggestions that improved the manuscript. Thiswork is part of the U.S. Geological Survey’s (USGS)Changing Arctic Ecosystem Initiative and was supported byfunding from the Wildlife Program of the USGSEcosystem Mission Area. Use of any trade names is fordescriptive purposes only and does not imply endorsementby the U.S. Government.
LITERATURE CITEDAcevedo, M. A., and L. J. Villanueva-Rivera. 2006. Using automated digitalrecording systems as effective tools for the monitoring of birds andamphibians. Wildlife Society Bulletin 34:211–214.
Alldredge, M.W., T. R. Simons, and K. H. Pollock. 2007. Factors affectingaural detections of songbirds. Ecological Applications 17:948–955.
Amundson, C. L., J. A. Royle, and C. M. Handel. 2014. A hierarchicalmodel combining distance sampling and time removal to estimatedetection probability during avian point counts. Auk 131:476–494.
Arnold, T. W. 2010. Uninformative parameters and model selection usingAkaike’s information criterion. Journal of Wildlife Management74:1175–1178.
Ashley, N. T., I. Schwabl, W. Goymann, and C. L. Buck. 2013. Keepingtime under the midnight sun: behavioral and plasma melatonin profiles offree-living Lapland longspurs (Calcarius lapponicus) during the Arcticsummer. Journal of Experimental Zoology Part A: Ecological Geneticsand Physiology 319:10–22.
Bart, J., and J. D. Schoultz. 1984. Reliability of singing bird surveys: changesin observer efficiency with avian density. Auk 101:307–318.
Buckland, S. T., D. R. Anderson, K. P. Burnham, J. L. Laake, D. L.Borchers, and L. Thomas. 2001. Introduction to distance sampling:estimating abundance of biological populations. Oxford University Press,New York, New York, USA.
Burnham, K. P., and D. R. Anderson. 2002. Model selection andmultimodel inference: a practical information-theoretic approach. Secondedition. Springer, New York, New York, USA.
Burnham, K. P., S. T. Buckland, J. L. Laake, D. L. Borchers, T. A.Marques,J. R. B. Bishop, and L. Thomas. 2004. Further topics in distance sampling.Pages 307–392 in S. T. Buckland, D. R. Anderson, K. P. Burnham, J. L.Laake, D. L. Borchers, and L. Thomas, editors. Advanced distancesampling. Oxford University Press, New York, New York, USA.
Bystrak, D. 1981. The North American Breeding Bird Survey. Studies inAvian Biology 6:34–41.
Campbell, M., and C. M. Francis. 2012. Using microphone arrays toexamine effects of observers on birds during point count surveys. Journal ofField Ornithology 83:391–402.
Celis-Murillo, A., J. L. Deppe, and M. F. Allen. 2009. Using soundscaperecordings to estimate bird species abundance, richness, and composition.Journal of Field Ornithology 80:64–78.
Celis-Murillo, A., J. L. Deppe, and M. P. Ward. 2012. Effectiveness andutility of acoustic recordings for surveying tropical birds. Journal of FieldOrnithology 83:166–179.
Faanes, C. A., and D. Bystrak. 1981. The role of observer bias in the NorthAmerican Breeding Bird Survey. Studies in Avian Biology 6:353–359.
Furnas, B. J., and R. L. Callas. 2015. Using automated recorders andoccupancy models to monitor common forest birds across a largegeographic region. Journal of Wildlife Management 79:325–337.
Hammond, T., and J. Yarie. 1996. Spatial prediction of climatic state factorregions in Alaska. Ecoscience 3:490–501.
Hanson, H. C. 1953. Vegetation types in northwestern Alaska andcomparisons with communities in other Arctic regions. Ecology34:111–140.
Haselmayer, J., and J. S. Quinn. 2000. A comparison of point counts andsound recording as bird survey methods in Amazonian Southeast Peru.Condor 102:887–893.
Hawkins, B. A., E. E. Porter, and J. A. F. Diniz-Filho. 2003. Productivityand history as predictors of the latitudinal diversity gradient of terrestrialbirds. Ecology 84:1608–1623.
Hinzman, L. D., N. D. Bettez, W. R. Bolton, F. S. Chapin, M. B.Dyurgerov, C. L. Fastie, B. Griffith, R. D. Hollister, A. Hope, H. P.Huntington, A. M. Jensen, G. J. Jia, T. Jorgenson, D. L. Kane, D. R.Klein, G. Kofinas, A. H. Lynch, A. H. Lloyd, A. D. McGuire, F. E.Nelson, W. C. Oechel, T. E. Osterkamp, C. H. Racine, V. E.Romanovsky, R. S. Stone, D. A. Stow, M. Sturm, C. E. Tweedie, G. L.Vourlitis, M. D.Walker, D. A. Walker, P. J. Webber, J. M.Welker, K. S.Winker, and K. Yoshikawa. 2005. Evidence and implications of recentclimate change in northern Alaska and other Arctic regions. ClimaticChange 72:251–298.
Hobson, K. A., R. S. Rempel, G. Hamilton, B. Turnbull, and S. L. V.Wilgenburg. 2002. Acoustic surveys of birds using electronic recordings:new potential from an omnidirectional microphone system. WildlifeSociety Bulletin 30:709–720.
Vold et al. � Acoustic Monitoring of Tundra-Breeding Birds 575

Hutto, R. L., and R. J. Stutzman. 2009. Humans versus autonomousrecording units: a comparison of point-count results. Journal of FieldOrnithology 80:387–398.
Kessel, B. 1979. Avian habitat classification for Alaska. Murrelet 60:86–94.Kessel, B. 1989. Birds of the Seward Peninsula, Alaska. University of AlaskaPress, Fairbanks, USA.
Kessel, B. 1998. Habitat characteristics of some passerine birds in westernNorth American taiga. University of Alaska Press, Fairbanks, USA.
Klingbeil, B. T., and M. R. Willig. 2015. Bird biodiversity assessments intemperate forest: the value of point count versus acoustic monitoringprotocols. PeerJ 3:e973.
MacArthur, R. H. 1972. Geographical ecology: patterns in the distributionof species. Princeton University Press, Princeton, New Jersey, USA.
MacArthur, R. H., and J. W. MacArthur. 1961. On bird species diversity.Ecology 42:594–598.
Mannan,R.N.,G.Perry,D.E.Andersen,andC.W.Boal.2014.Callbroadcastingand automated recorders as tools for anuran surveys in a subarctic tundralandscape. Journal of North American Herpetology 2014:47–52.
Marcot, B. G., M. T. Jorgenson, J. P. Lawler, C. M. Handel, and A. R.DeGange. 2015. Projected changes in wildlife habitats in Arctic naturalareas of northwest Alaska. Climatic Change 130:145–154.
McNew, L., C. Handel, J. Pearce, T. DeGange, L. Holland-Bartels, andM.Whalen. 2013. Changing Arctic ecosystems: the role of ecosystem changesacross the boreal–Arctic transition zone on the distribution and abundanceof wildlife populations. USGS Fact Sheet 2013-3054. http://pubs.usgs.gov/fs/2013/3054/. Accessed 19 Jun 2017.
McNew, L. B., and C.M. Handel. 2015. Evaluating species richness: biasedecological inference results from spatial heterogeneity in detectionprobabilities. Ecological Applications 25:1669–1680.
McShea, W. J., and J. H. Rappole. 1997. Variable song rates in three speciesof passerines and implications for estimating bird populations. Journal ofField Ornithology 68:367–375.
Pacifici, K., T. Simons, and K. Pollock. 2008. Effects of vegetation andbackground noise on the detection process in auditory avian point-countsurveys. Auk 125:600–607.
R Core Team. 2013. R: a language and environment for statisticalcomputing. R Foundation for Statistical Computing, Vienna, Austria.https://www.r-project.org/. Accessed 28 Apr 2016.
Ralph, C. J., J. R. Sauer, and S. Droege. 1995. Monitoring bird populationsby point counts. General Technical Report PSW GTR-149. U.S.Department of Agriculture, Forest Service, Pacific Southwest ResearchStation, Albany, California, USA.
Rempel, R. S., K. A. Hobson, G. Holborn, S. L. Van Wilgenburg, and J.Elliott. 2005. Bioacoustic monitoring of forest songbirds: interpretervariability and effects of configuration and digital processing methods inthe laboratory. Journal of Field Ornithology 76:1–11.
Robel, R. J., J. N. Briggs, A. D. Dayton, and L. C. Hulbert. 1970.Relationships between visual obstruction measurements and weight ofgrassland vegetation. Journal of Range Management 23:295–297.
Royle, A. J., and R. M. Dorazio. 2008. Hierarchical modeling and inferencein ecology. Academic Press, San Diego, California, USA.
Sidie-Slettedahl, A. M., K. C. Jensen, R. R. Johnson, T. W. Arnold, J. E.Austin, and J. D. Stafford. 2015. Evaluation of autonomous recording
units for detecting 3 species of secretive marsh birds. Wildlife SocietyBulletin 39:626–634.
Simons, T. R., M. W. Alldredge, K. H. Pollock, and J. M. Wettroth. 2007.Experimental analysis of the auditory detection process on avian pointcounts. Auk 124:986–999.
Steiger, S. S., M. Valcu, K. Spoelstra, B. Helm, M. Wikelski, and B.Kempenaers. 2013. When the sun never sets: diverse activity rhythmsunder continuous daylight in free living Arctic-breeding birds.Proceedings of the Royal Society B: Biological Sciences280:20131016.
Stralberg, D., S. M. Matsuoka, A. Hamann, E. M. Bayne, P. Solymos,F. K. A. Schmiegelow, X. Wang, S. G. Cumming, and S. J. Song. 2015.Projecting boreal bird responses to climate change: the signal exceeds thenoise. Ecological Applications 25:52–69.
Stralberg, D., S. M. Matsuoka, C. M. Handel, F. K. A. Schmiegelow, A.Hamann, and E. M. Bayne. 2016. Biogeography of boreal passerine rangedynamics in western North America: past, present, and future. Ecography39:1–17. doi:10.1111/ecog.02393
Swanson, J. D., M. Schuman, and P. C. Scorup. 1985. Range survey of theSeward Peninsula reindeer ranges, Alaska. U.S. Department of Agricul-ture, Soil Conservation Service, Anchorage, Alaska, USA.
Tegeler, A. K., M. L.Morrison, and J. M. Szewczak. 2012. Using extended-duration audio recordings to survey avian species.Wildlife Society Bulletin36:21–29.
Thompson, S. J., C. M. Handel, and L. B. McNew. 2017. Autonomousacoustic recorders reveal complex patterns in avian detection probability.Journal of Wildlife Management 81:1228–1241.
Thompson, S. J., C. M. Handel, R. M. Richardson, and L. B. McNew.2016. When winners become losers: nonlinear responses of Arctic birds toincreasing woody vegetation. PLoS ONE 11(11):e0164755.
Venier, L. A., S. B. Holmes, G. W. Holborn, K. A. McIlwrick, and G.Brown. 2012. Evaluation of an automated recording device for monitoringforest birds. Wildlife Society Bulletin 36:30–39.
Weller, F., G. Blackwell, and H. Miller. 2012. Detection probability forestimating bird density on NewZealand sheep& beef farms. NewZealandJournal of Ecology 36:371–381.
Yoshikawa, K., and L. D.Hinzman. 2003. Shrinking thermokarst ponds andgroundwater dynamics in discontinuous permafrost near Council, Alaska.Permafrost and Periglacial Processes 14:151–160.
Associate Editor: Boal.
SUPPORTING INFORMATION
Additional supporting information may be found in theonline version of this article at the publisher’s web-site.
Table S1. Total number of birds detected and missed by fieldobservers and acoustic recorders during 10-min point-countsurveys on tundra habitats at 59 sites on the SewardPeninsula, northwestern Alaska, USA, June 2014.
576 Wildlife Society Bulletin � 41(3)
Related Documents