1 COMPARISON BETWEEN THE PHOTOCATALYTIC INACTIVATION OF GRAM- POSITIVE E. FAECALIS AND GRAM-NEGATIVE E. COLI FAECAL CONTAMINATION INDICATOR MICROORGANISMS. Rafael van Grieken, Javier Marugán*, Cristina Pablos, Laura Furones, Ainhoa López Department of Chemical and Environmental Technology, ESCET, Universidad Rey Juan Carlos, C/ Tulipán s/n, 28933 Móstoles (Madrid), Spain. * Tel: +34 91 664 7466, Fax +34 91 488 7068, E-mail: [email protected] Published on Applied Catalysis B: Environmental, 100: 212-220 (2010). doi:10.1016/j.apcatb.2010.07.034

Welcome message from author
This document is posted to help you gain knowledge. Please leave a comment to let me know what you think about it! Share it to your friends and learn new things together.
Transcript
1
COMPARISON BETWEEN THE PHOTOCATALYTIC INACTIVATION OF GRAM-
POSITIVE E. FAECALIS AND GRAM-NEGATIVE E. COLI FAECAL
CONTAMINATION INDICATOR MICROORGANISMS.
Rafael van Grieken, Javier Marugán*, Cristina Pablos, Laura Furones, Ainhoa López
Department of Chemical and Environmental Technology, ESCET, Universidad Rey Juan
Carlos, C/ Tulipán s/n, 28933 Móstoles (Madrid), Spain.
* Tel: +34 91 664 7466, Fax +34 91 488 7068, E-mail: [email protected]
Published on
Applied Catalysis B: Environmental, 100: 212-220 (2010).
doi:10.1016/j.apcatb.2010.07.034
2
ABSTRACT
Photocatalytic inactivation of two different faecal contamination indicator
microorganisms, the Gram-negative Escherichia coli and the Gram-positive Enterococcus
faecalis, has been studied using TiO2 in suspension and immobilized onto the photocatalytic
reactor wall. The effect of the main variables of the photocatalytic process on the disinfection
efficiency in deionized water and simulated effluent of wastewater treatment plant (WTP)
effluents has been analyzed. Noticeable differences were observed between both types of
bacteria during photolytic experiments without TiO2 in deionized water, probably due to the
higher sensibility of E. coli to the osmotic stress, which leads to a higher cell membrane
permeability and consequently a lower amount of hydroxyl radical attacks required to
overcome the inactivation threshold. In contrast, despite their structural differences, Gram-
positive and Gram-negative bacteria seem to follow the same inactivation mechanism,
showing no significant differences in the experiments carried out with TiO2 in suspension
either in deionized water or in WTP simulated effluent, and similar responses to changes in
the concentration of catalysts and irradiation power (both variables involved in the hydroxyl
radical generation). Similar results are observed using immobilized TiO2 in deionized water.
However, disinfection experiments of WTP simulated effluent using immobilized TiO2
showed much longer initial delays before the beginning of the inactivation for E. faecalis,
suggesting a critical effect of the water composition of the bacteria-catalyst interaction. In any
case, the irradiation time required to achieved the inactivation below the experimental
bacterial detection limit is similar for both microorganisms, and experiments with mixtures of
E.faecalis and E.coli in WTP simulated effluent show no significant differences. Therefore, it
can be concluded that the results of photocatalytic disinfection experiments using E. coli as
model bacteria could be reasonably extrapolated to other types of bacteria or bacterial
mixtures.
KEYWORDS: Disinfection, E. coli, E. faecalis, photocatalysis, titanium dioxide,
immobilized TiO2.
3
1. Introduction
Water disinfection is still a scientific and technical challenge since traditional methods
used to supply drinking water such as chlorination and ozonation have shown disadvantages
related to the formation of potentially hazardous disinfection by products (DBP’s), resulting
from the reaction of the oxidant species with the natural organic matter present in the water
[1].
Advanced Oxidation Technologies (AOT) have been investigated with the aim of
developing new disinfection methods to supply drinking water. Among them, heterogeneous
photocatalysis is considered a promising technology. It is based on the interaction between
light and solid semiconductor particles to produce highly oxidising hydroxyl radicals (·OH).
Main efforts have been focused on TiO2 photocatalysis as the catalyst is inexpensive, non-
toxic and stable, allowing the operation under ambient conditions of pressure and temperature
and without addition of chemicals different from the air [2]. Moreover, its low energy
consumption and the possibility of using solar energy will be crucial for developing countries
where about 90% of infectious diseases is attributed to unsafe water supply, inadequate
sanitation and hygiene [3].
Several studies have reported the feasibility of photocatalytic processes for both
organic matter degradation and bacteria inactivation [4,5]. However, very few studies have
reported the photocatalytic inactivation of microorganisms in real waters [6-9] and most of
them have only used one model bacteria group. Considering that some differences in
photocatalytic inactivation response have been reported for different type of microorganisms
and waters with different chemical composition [10], more efforts should be focused on the
establishment of possible differences in the photocatalytic disinfection efficiency depending
on the selected indicator microorganism.
The most commonly accepted photocatalytic inactivation mechanism is based on the
attack of ·OH radicals and other reactive oxygen species (ROS) to the bacteria cell wall,
where the bacteria-catalyst contact takes place [11,12]. Cumulative damage leads to the cell
membrane disorder, increasing its permeability, demonstrated by the leakage of potassium
ions [13,14], and finally the cell lysis and death. Therefore, since the attack occurs on the
bacteria outer wall, more attention must be paid to the differences of wall structure which may
4
also lead to different photocatalytic inactivation efficiency. In this sense, the differences
between Gram-negative and Gram-positive bacteria, two groups of prokaryotic
microorganisms, could be considered as example. Gram-negative microorganisms have a
thinner peptidoglycane cell wall than Gram-positive, but they have an additional outer
membrane containing two lipid bilayers which provide them a higher complexity [15,16].
The aim of this work is to compare the efficiency of the photocatalytic inactivation of
the Gram-negative Escherichia coli and the Gram-positive Enterococcus faecalis, two
bacterial species commonly used as faecal contamination indicator microorganisms with a
different cell structure. The investigation has been focused on the influence of the main
variables of the process, such as catalyst concentration, irradiation power and initial bacterial
concentration, together with the use of two different ways of using TiO2 catalytic system,
slurry and immobilized wall reactor.
2. Experimental
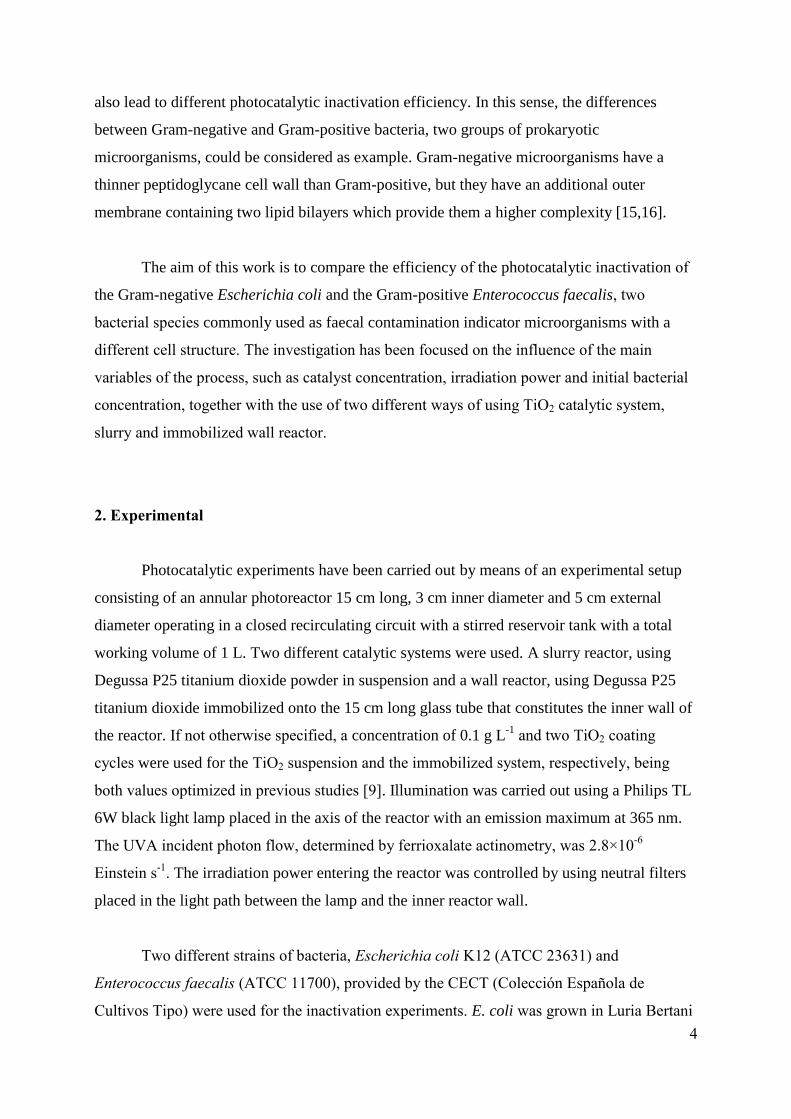
Photocatalytic experiments have been carried out by means of an experimental setup
consisting of an annular photoreactor 15 cm long, 3 cm inner diameter and 5 cm external
diameter operating in a closed recirculating circuit with a stirred reservoir tank with a total
working volume of 1 L. Two different catalytic systems were used. A slurry reactor, using
Degussa P25 titanium dioxide powder in suspension and a wall reactor, using Degussa P25
titanium dioxide immobilized onto the 15 cm long glass tube that constitutes the inner wall of
the reactor. If not otherwise specified, a concentration of 0.1 g L-1
and two TiO2 coating
cycles were used for the TiO2 suspension and the immobilized system, respectively, being
both values optimized in previous studies [9]. Illumination was carried out using a Philips TL
6W black light lamp placed in the axis of the reactor with an emission maximum at 365 nm.
The UVA incident photon flow, determined by ferrioxalate actinometry, was 2.8×10⁻⁶
Einstein s-1
. The irradiation power entering the reactor was controlled by using neutral filters
placed in the light path between the lamp and the inner reactor wall.
Two different strains of bacteria, Escherichia coli K12 (ATCC 23631) and
Enterococcus faecalis (ATCC 11700), provided by the CECT (Colección Española de
Cultivos Tipo) were used for the inactivation experiments. E. coli was grown in Luria Bertani
5
Broth (Miller’s LB Broth, Scharlab) and LB nutrient agar (Miller’s LB Agar, Scharlab) as
liquid and solid culture media whereas Tryptic Soy Broth (TSB, Scharlab) and Tryptic Soy
Agar (TSA, Scharlab) were used for E. faecalis.
Fresh liquid cultures with stationary concentrations around 109 CFU mL
-1 were
prepared collecting 100 µL of a mother culture in the stationary growing phase corresponding
to E. coli or E. faecalis and inoculating them in 20 mL of fresh growing medium. Then, they
were incubated at 37 °C for 24 hours on a rotary shaker. The suspensions for reaction, of
about 106 CFU mL
-1 if not otherwise specified, were prepared by centrifuging 5 mL of the
liquid culture at 3000 rpm for 15 minutes. After resuspension with 5 mL sterile deionized
water (Milli-Q®, 18.2 MΩ cm), 1 mL of the suspension was added to water and made up to 1
L. For the experiments carried out with mixtures of E. coli and E. faecalis, the initial
concentration of the total bacteria suspension was also of about 106 CFU mL
-1.
Two aqueous media were used: i) deionized water (Milli-Q®, 18.2 MΩ cm), and ii)
synthetic municipal wastewater [17] diluted to an average total organic carbon value of 15 mg
L-1
to simulate wastewater treatment plant (WTP) effluents. The concentration of viable
bacteria along the reaction was followed through a standard serial dilution procedure. Each
decimal dilution was spotted 8 times on nutrient agar plates and incubated at 37 ºC for 24 h
before counting. LB nutrient agar was used to follow the total inactivation. To follow E. coli
and E. faecalis inactivation individually two selective agars were used, Colinstant
Chromogenic Agar and Slanetz & Bartley Agar, (Scharlab), respectively.
3. Results and Discussion
3.1. Non-photocatalytic reference experiments
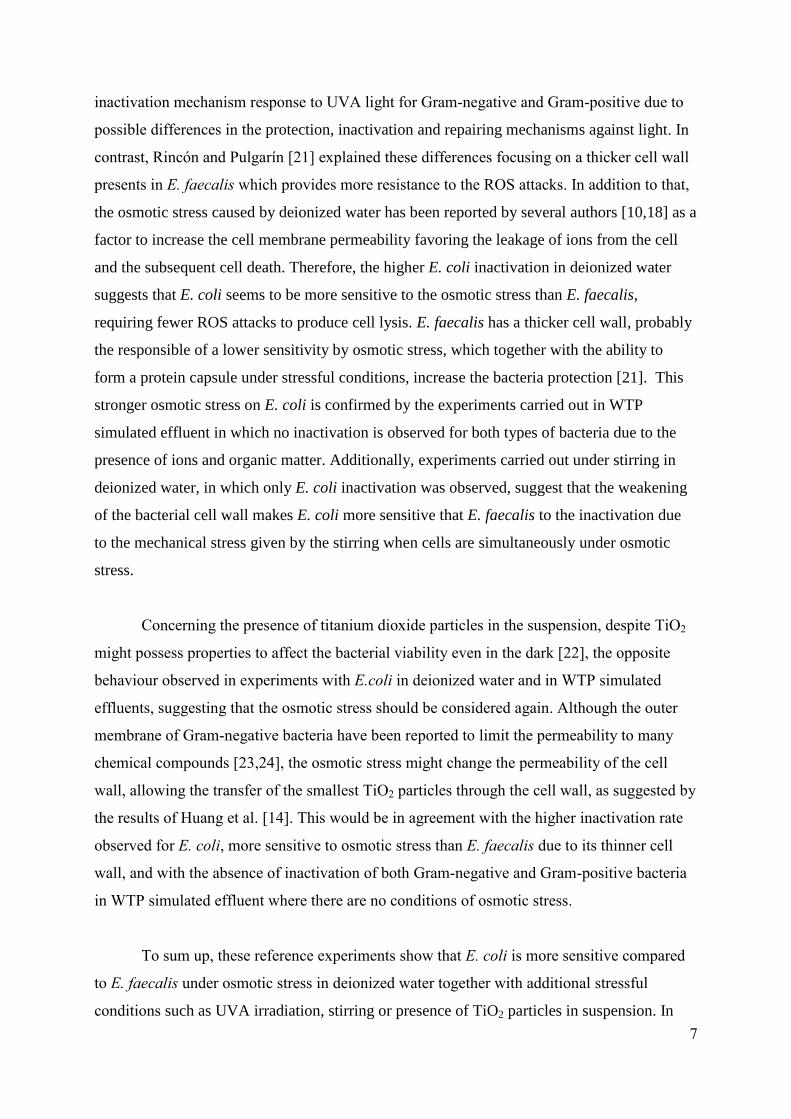
Before studying the photocatalytic inactivation of both types of bacteria, preliminary
experiments of non-photocatalytic inactivation under different stressful conditions were
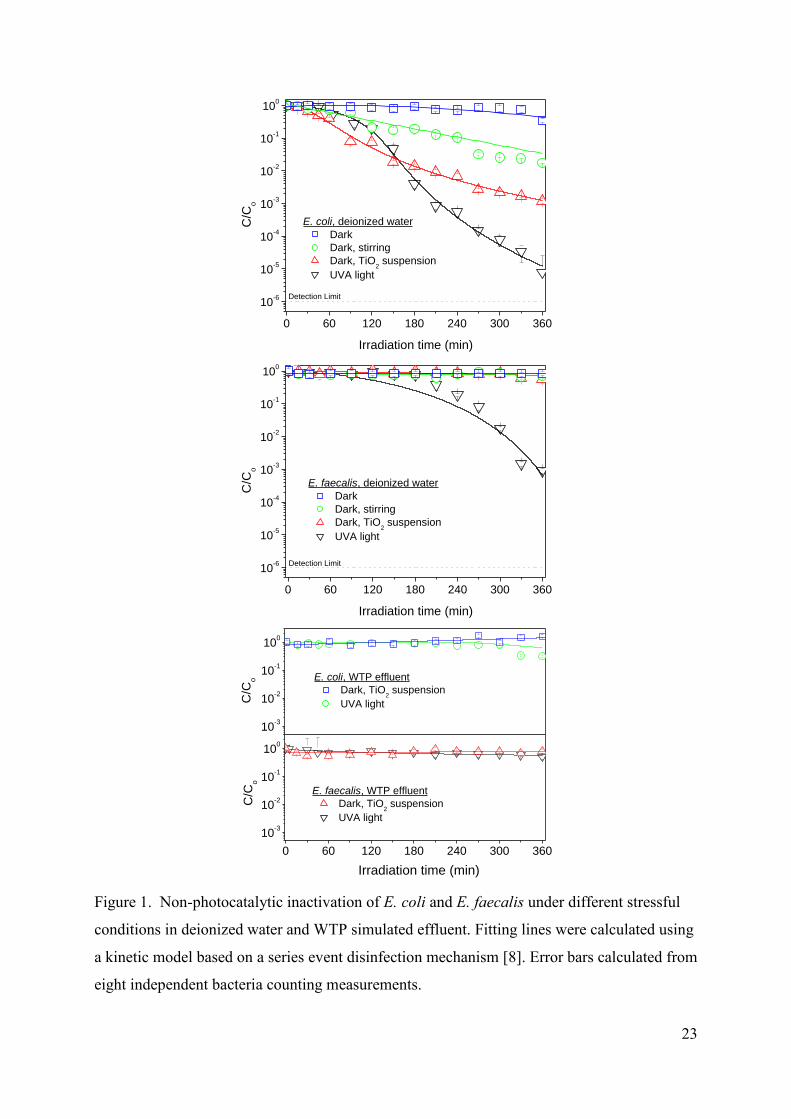
carried out. Figure 1 shows the effect of UVA ligth irradiation, stirring and presence of TiO2
particles in suspension (in dark conditions) on the decrease in the concentration of E. coli and
E. faecalis viable bacteria both in deionized water and in WTP effluents All the experiments
6
carried out in WTP effluents show null inactivation, including those carried out in the dark
with and without stirring (not shown).
FIGURE 1.
No significant inactivation is observed for both types of bacteria suspended in
deionized water in the dark, even after a week (not shown in the figure). However, when the
system is stirred a significant decrease in the amount of viable E. coli bacteria is observed,
whereas the effect is negligible on E. faecalis. Therefore, E. coli seems to be very sensitive
(more than E faecalis) to mechanical damages derived from the stirring, as also observed by
Sichel et al [18].
The presence of TiO2 particles in the stirred suspension using deionized water without
irradiation increases even more the inactivation rate of E. coli, whereas the effect on E.
faecalis can be also neglected. In contrast, the inactivation of E. coli in WTP simulated
effluent is negligible even in the presence TiO2 particles, being in this case the results
comparable to those of E. faecalis.
UVA light irradiation in deionized water leads to significant differences between both
microorganisms, since E. coli shows a 5 log-decrease of the concentration of viable bacteria
after six hours of phototreatment whereas for E. faecalis, only a 3 log-decrease is observed,
with a longer initial delay. In contrast, no inactivation has been observed for both kinds of
bacteria during the same UVA light irradiation time in WTP simulated effluent. The
inactivation response showed by both E. coli and E. faecalis in deionized water is probably
due to the DNA damage to the bacteria caused by the reactive oxygen species (ROS)
produced by UVA radiation [19]. Nevertheless, the lack of inactivation in WTP simulated
effluent cannot be explained by competence between bacteria and ions and organic matter for
the ROS, as they are formed within the cell. Moreover, absorption of photons by anions and
organic matter can be dismissed since it does not occur under the studied wavelength range.
Consequently, these results could be due to the fact that the chemical species present in water
might serve as nutrients for bacteria [7] or more probably to an osmotic effect.
The different UVA inactivation behaviour observed between E. coli and E. faecalis is
still unclear since opposite explanations have been suggested by different authors. For
instance, Robertson et al. [19] and Chung et al. [20] suggested a possible different
7
inactivation mechanism response to UVA light for Gram-negative and Gram-positive due to
possible differences in the protection, inactivation and repairing mechanisms against light. In
contrast, Rincón and Pulgarín [21] explained these differences focusing on a thicker cell wall
presents in E. faecalis which provides more resistance to the ROS attacks. In addition to that,
the osmotic stress caused by deionized water has been reported by several authors [10,18] as a
factor to increase the cell membrane permeability favoring the leakage of ions from the cell
and the subsequent cell death. Therefore, the higher E. coli inactivation in deionized water
suggests that E. coli seems to be more sensitive to the osmotic stress than E. faecalis,
requiring fewer ROS attacks to produce cell lysis. E. faecalis has a thicker cell wall, probably
the responsible of a lower sensitivity by osmotic stress, which together with the ability to
form a protein capsule under stressful conditions, increase the bacteria protection [21]. This
stronger osmotic stress on E. coli is confirmed by the experiments carried out in WTP
simulated effluent in which no inactivation is observed for both types of bacteria due to the
presence of ions and organic matter. Additionally, experiments carried out under stirring in
deionized water, in which only E. coli inactivation was observed, suggest that the weakening
of the bacterial cell wall makes E. coli more sensitive that E. faecalis to the inactivation due
to the mechanical stress given by the stirring when cells are simultaneously under osmotic
stress.
Concerning the presence of titanium dioxide particles in the suspension, despite TiO2
might possess properties to affect the bacterial viability even in the dark [22], the opposite
behaviour observed in experiments with E.coli in deionized water and in WTP simulated
effluents, suggesting that the osmotic stress should be considered again. Although the outer
membrane of Gram-negative bacteria have been reported to limit the permeability to many
chemical compounds [23,24], the osmotic stress might change the permeability of the cell
wall, allowing the transfer of the smallest TiO2 particles through the cell wall, as suggested by
the results of Huang et al. [14]. This would be in agreement with the higher inactivation rate
observed for E. coli, more sensitive to osmotic stress than E. faecalis due to its thinner cell
wall, and with the absence of inactivation of both Gram-negative and Gram-positive bacteria
in WTP simulated effluent where there are no conditions of osmotic stress.
To sum up, these reference experiments show that E. coli is more sensitive compared
to E. faecalis under osmotic stress in deionized water together with additional stressful
conditions such as UVA irradiation, stirring or presence of TiO2 particles in suspension. In
8
contrast, in WTP simulated effluent, without osmotic stress, both E. coli and E. faecalis seems
to show a much higher resistance against mechanical and radiative stressfull factors.
Consequently, it seems that the activity of the osmoregulatory system of E. coli inhibits the
action of the protection, inactivation and repairing mechanisms against other stressful factors
such as UVA light or mechanical damage.
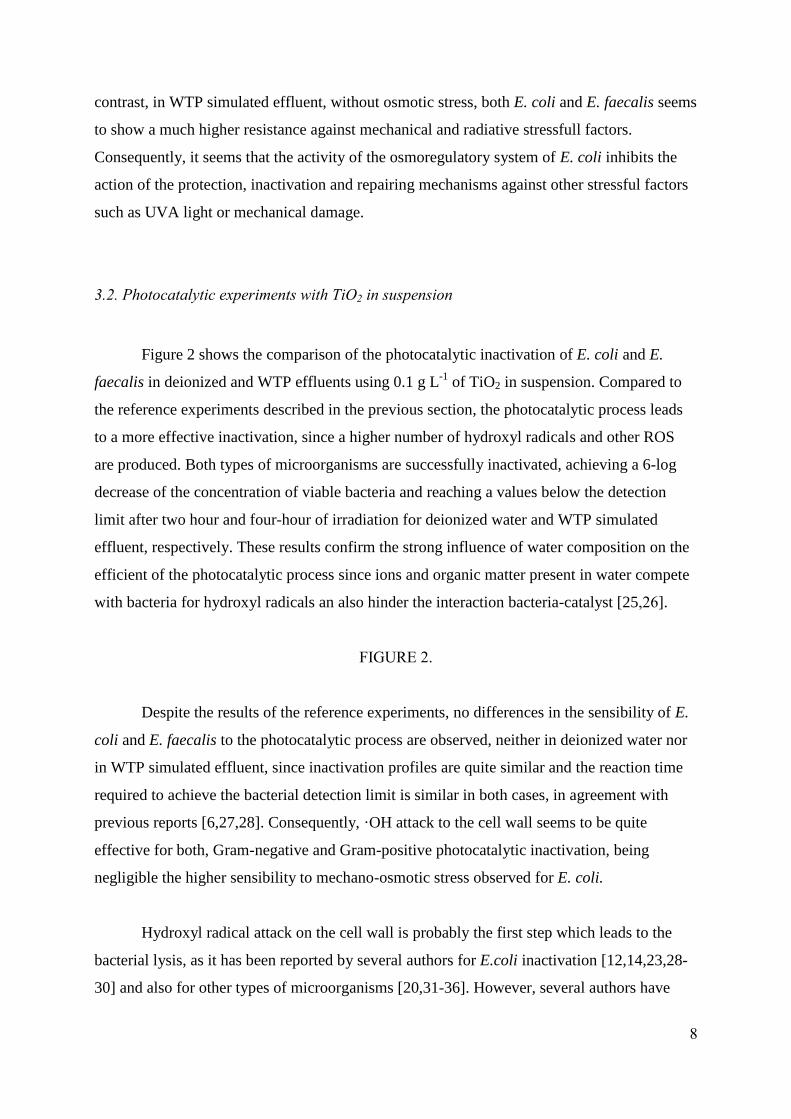
3.2. Photocatalytic experiments with TiO2 in suspension
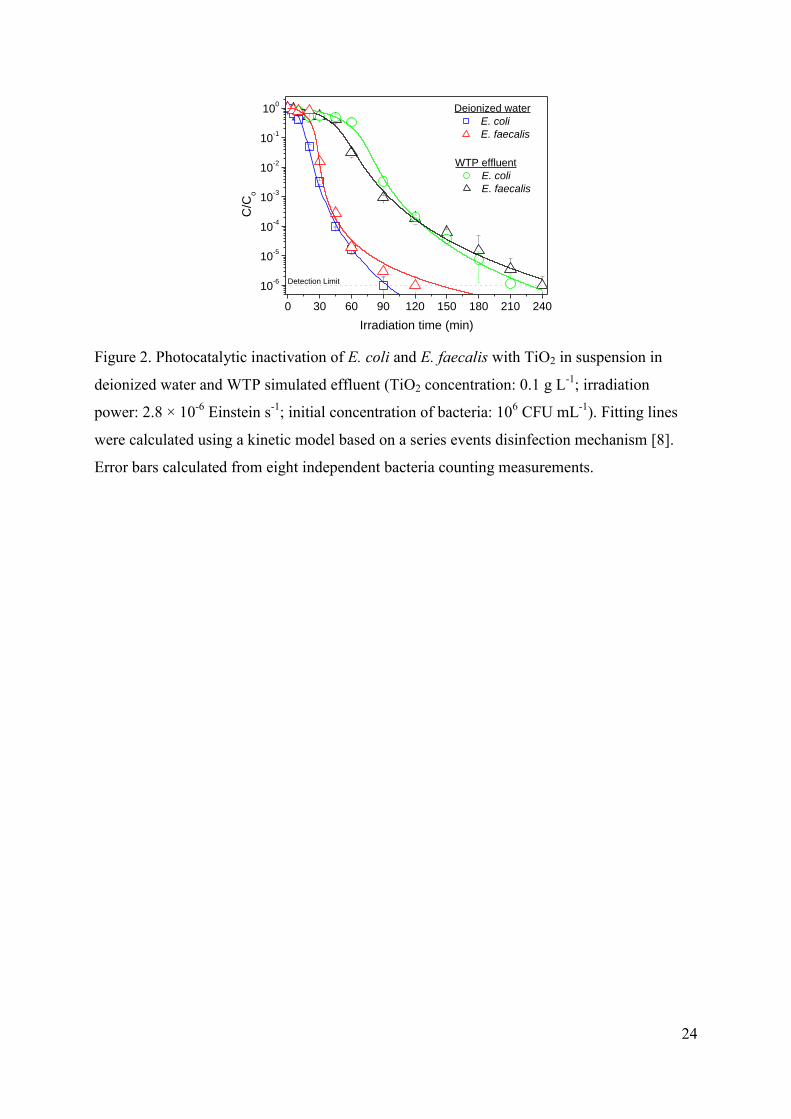
Figure 2 shows the comparison of the photocatalytic inactivation of E. coli and E.
faecalis in deionized and WTP effluents using 0.1 g L-1
of TiO2 in suspension. Compared to
the reference experiments described in the previous section, the photocatalytic process leads
to a more effective inactivation, since a higher number of hydroxyl radicals and other ROS
are produced. Both types of microorganisms are successfully inactivated, achieving a 6-log
decrease of the concentration of viable bacteria and reaching a values below the detection
limit after two hour and four-hour of irradiation for deionized water and WTP simulated
effluent, respectively. These results confirm the strong influence of water composition on the
efficient of the photocatalytic process since ions and organic matter present in water compete
with bacteria for hydroxyl radicals an also hinder the interaction bacteria-catalyst [25,26].
FIGURE 2.
Despite the results of the reference experiments, no differences in the sensibility of E.
coli and E. faecalis to the photocatalytic process are observed, neither in deionized water nor
in WTP simulated effluent, since inactivation profiles are quite similar and the reaction time
required to achieve the bacterial detection limit is similar in both cases, in agreement with
previous reports [6,27,28]. Consequently, ·OH attack to the cell wall seems to be quite
effective for both, Gram-negative and Gram-positive photocatalytic inactivation, being
negligible the higher sensibility to mechano-osmotic stress observed for E. coli.
Hydroxyl radical attack on the cell wall is probably the first step which leads to the
bacterial lysis, as it has been reported by several authors for E.coli inactivation [12,14,23,28-
30] and also for other types of microorganisms [20,31-36]. However, several authors have
9
suggested different inactivation mechanisms for Gram-negative and Gram-positive bacteria
[16,20,37] and some of them even have pointed out different photocatalytic response,
showing a strong contradiction [16,35].
Gram-positive has been reported to be photocatalytically more resistant than Gram-
negative due to a thicker cell wall. As a result, a higher number of hydroxyl radical attacks for
Gram-positive bacteria are needed to get to a complete bacterial inactivation [11,20,31,38,39].
Chung et al. [20] and Shaomin et al. [36] reported similar photocatalytic inactivation
mechanism for Gram-positive and Gram-negative bacteria, but the thinner wall of E. coli
provided less protection against oxidant species. In addition to this, several authors have
reported a higher adhesion of E. coli onto immobilized TiO2, which favors the interaction
bacteria-catalyst and consequently the inactivation [40-42].
In contrast, Gram-negative has been also suggested being more resistant to the
photocatalytic process due to a more complex structure given by the additional outer
membrane which might protect it towards disinfectant agents [23,24,33,43]. Although the
thicker cell wall of Gram-positive bacteria is hardly broken by hydroxyl radicals, the lack of
this outer membrane makes easier for the hydroxyl radicals to damage the bacterial DNA.
Although Skorb et al. [35] found Gram-negative cells more sensitive, they also highlighted
the possible influence of the chemical composition of the cell wall, which might lead to a
different resistance to ·OH and to differences in hydrophobicity or electrostatic charge.
Demidova and Hamblin [44] also explained the higher resistance showed by Gram-negative
against Gram-positive due to the differences in chemical composition of the cell wall and
protection mechanisms, and finally, Sinton et al. [45] supported the different results observed
for both kinds of microorganisms as a function of water composition together with different
defense mechanisms.
To try to shed light on this controversy, we have carried out further experiments in
different experimental conditions of catalyst concentration, irradiation power, initial bacterial
concentration, and also using and immobilized TiO2 system in which presumably a different
bacteria-catalyst interaction takes place.
3.2.1. Effect of TiO2 concentration
10
Experiments carried out using different concentrations of titania in deionized water in
the range from 0.02 to 0.5 g L-1
showed similar trends for both microorganisms, with an
improvement in the efficiency of the process as the TiO2 concentration increases, reaching a
plateau for 0.1-0.2 g L-1
, in agreement with previous results of E.coli inactivation in this
reactor [46]. Similar trends have been reported for E. coli by other authors [7,47-50] what has
been obviously attributed to the increase in the amount of photons that can be absorbed for
higher amounts of titania before reaching a maximum corresponding to the total absorption of
the incident radiation.
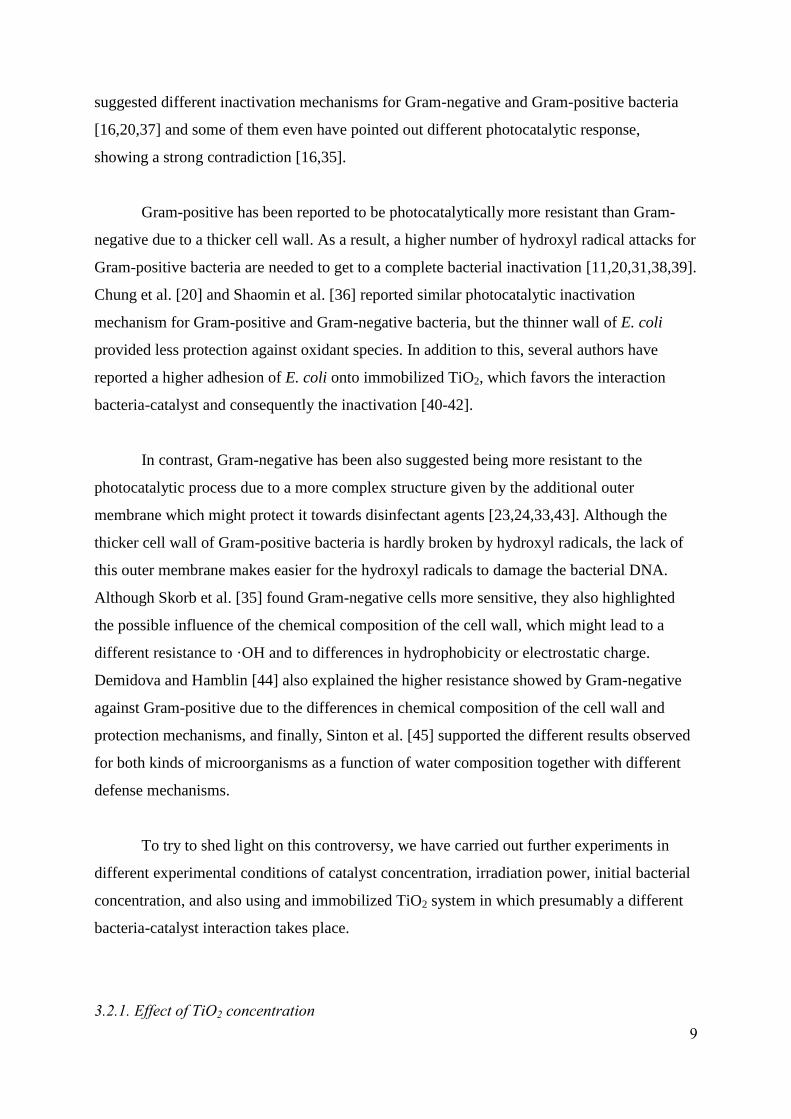
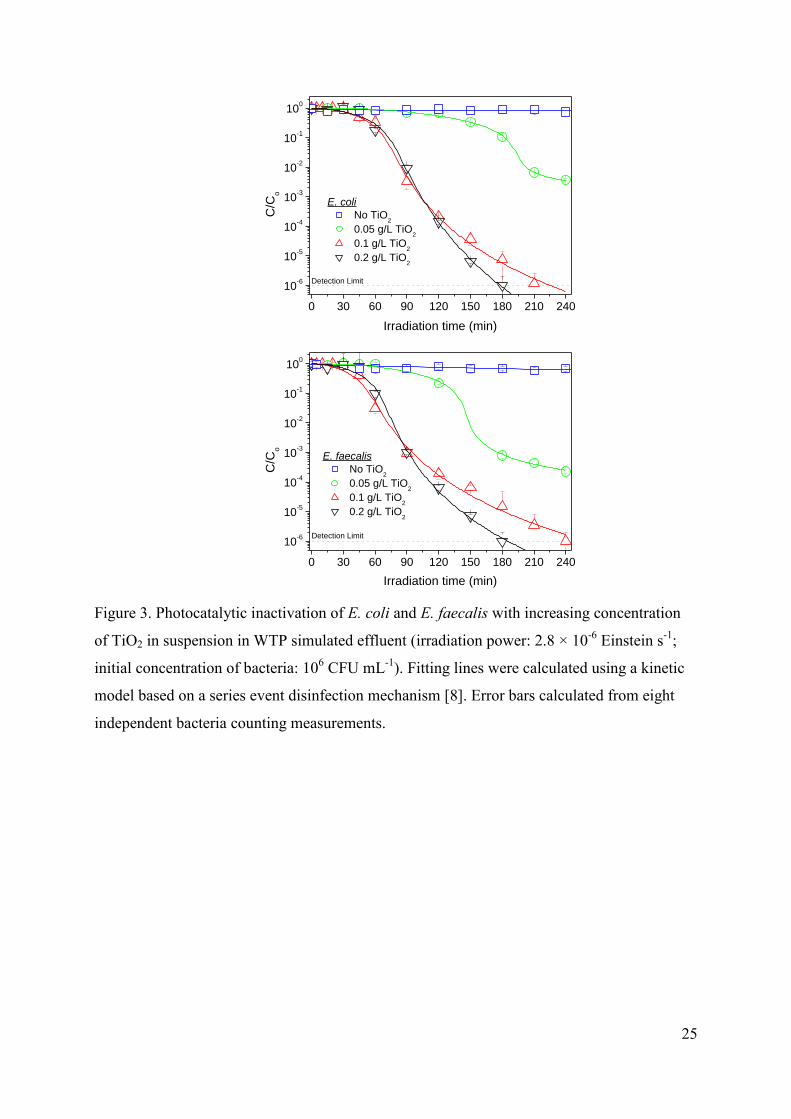
Concerning experiments in WTP simulated effluent, Figure 3 shows the comparison of
the inactivation of both types of bacteria for increasing concentrations of titania. Although the
irradiation time required for the total inactivation is obviously higher in comparison with
experiments in deionized water, once again, similar trends are observed for both
microorganisms, showing the maximum inactivation efficiency for values similar values
around 0.1 – 0.2 g L-1
of TiO2.
FIGURE 3.
Summarizing, no significant differences have been observed between the
photocatalytic inactivation of Gram-negative and Gram-positive bacteria for all experiments
and the optimal concentration of TiO2 seems to be the same independently on the type of
bacteria or the type of water. Consequently, it can be concluded that despite their differences
in cell wall structure both E. coli and E. faecalis show similar interaction with the catalyst,
being the influence of this variable essentially related to the absorption of radiation.
3.2.2. Effect of irradiation power
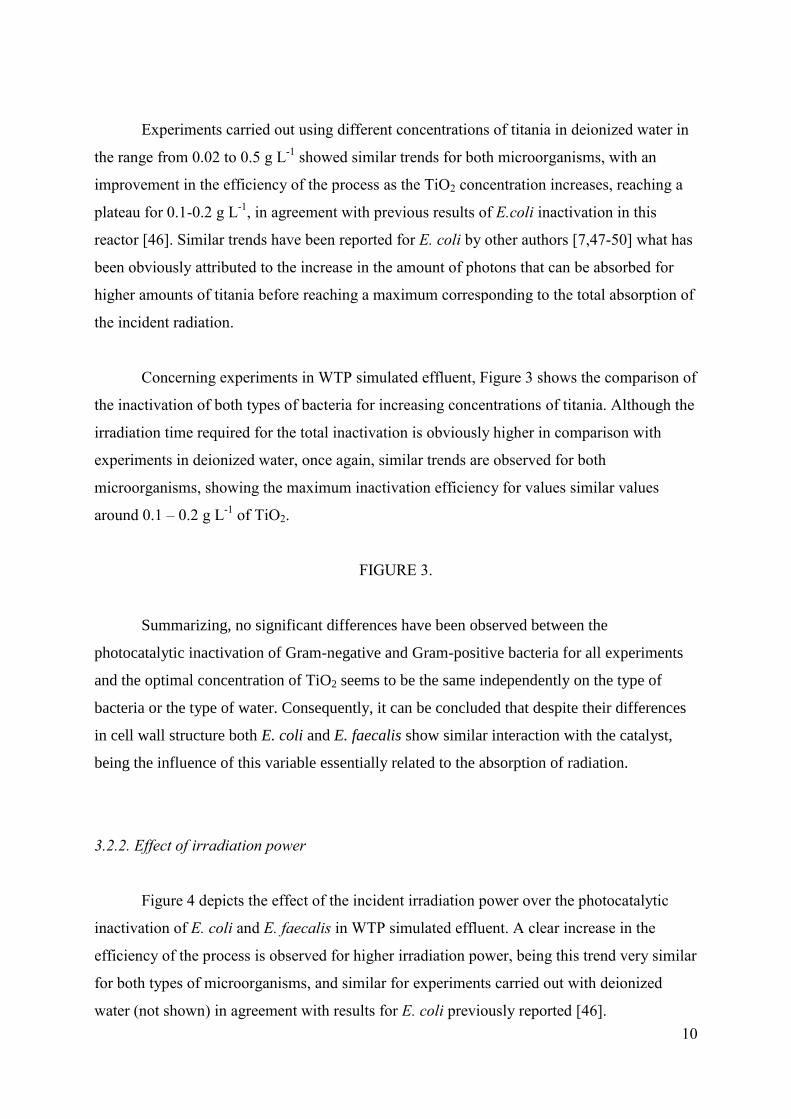
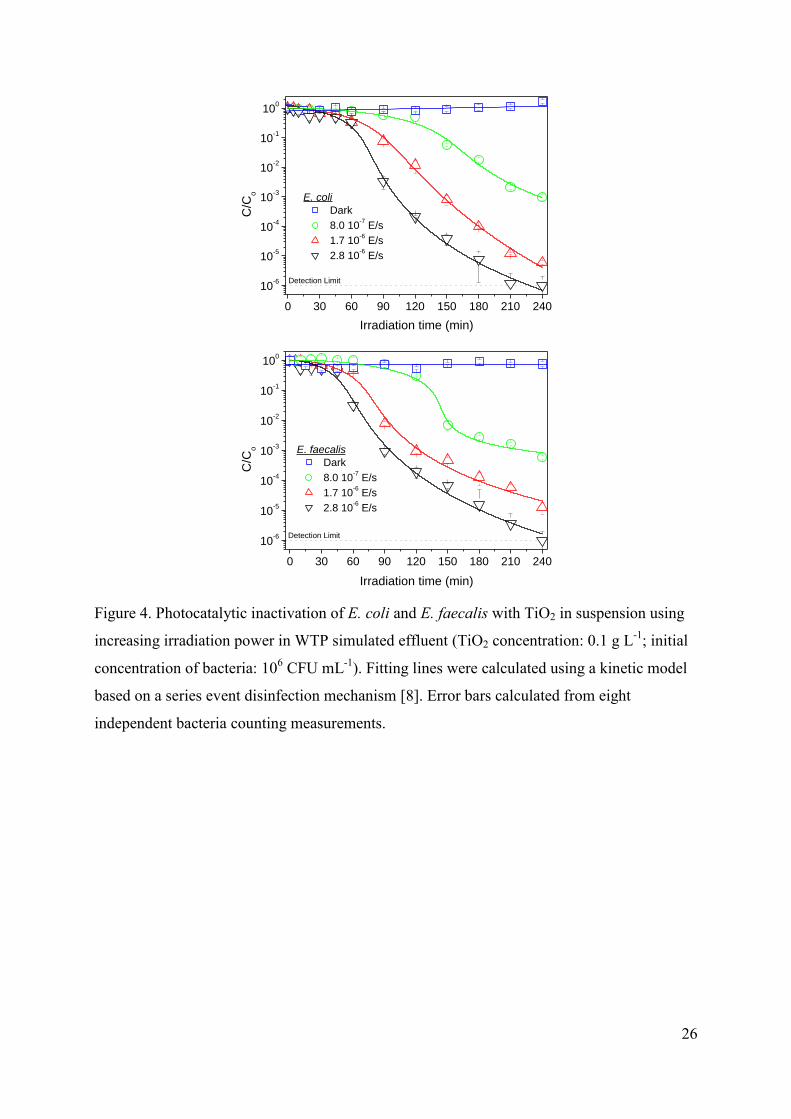
Figure 4 depicts the effect of the incident irradiation power over the photocatalytic
inactivation of E. coli and E. faecalis in WTP simulated effluent. A clear increase in the
efficiency of the process is observed for higher irradiation power, being this trend very similar
for both types of microorganisms, and similar for experiments carried out with deionized
water (not shown) in agreement with results for E. coli previously reported [46].
11
FIGURE 4.
This faster inactivation of E. coli for increasing irradiation power has been also
reported for other research groups [7,47-53] and is obviously related to an increase in the
hydroxyl radical production. This relation seems to be close to the linear dependence between
photocatalytic inactivation and ·OH radical concentration found by Cho et al. [12], what
suggests that the range of incident irradiation power used in these experiments is in the low
intensities linear region corresponding to the optimal light utilization [2,54].
The most important conclusion of this section is that no significant differences have
been observed between the photocatalytic inactivation of Gram-negative and Gram-positive
bacteria. Consequently, it can be concluded that irradiation power and catalyst concentration
are responsible for the rate of radiation absorption and hydroxyl radical generation, being
negligible the differences in the interaction with each type of bacteria. Moreover, for
equivalent rates of generation of hydroxil radicals, the inactivation of both microorganism is
very similar, what leads to the conclusion that the mechanism should be quite similar, despite
the differences in the external cell wall.
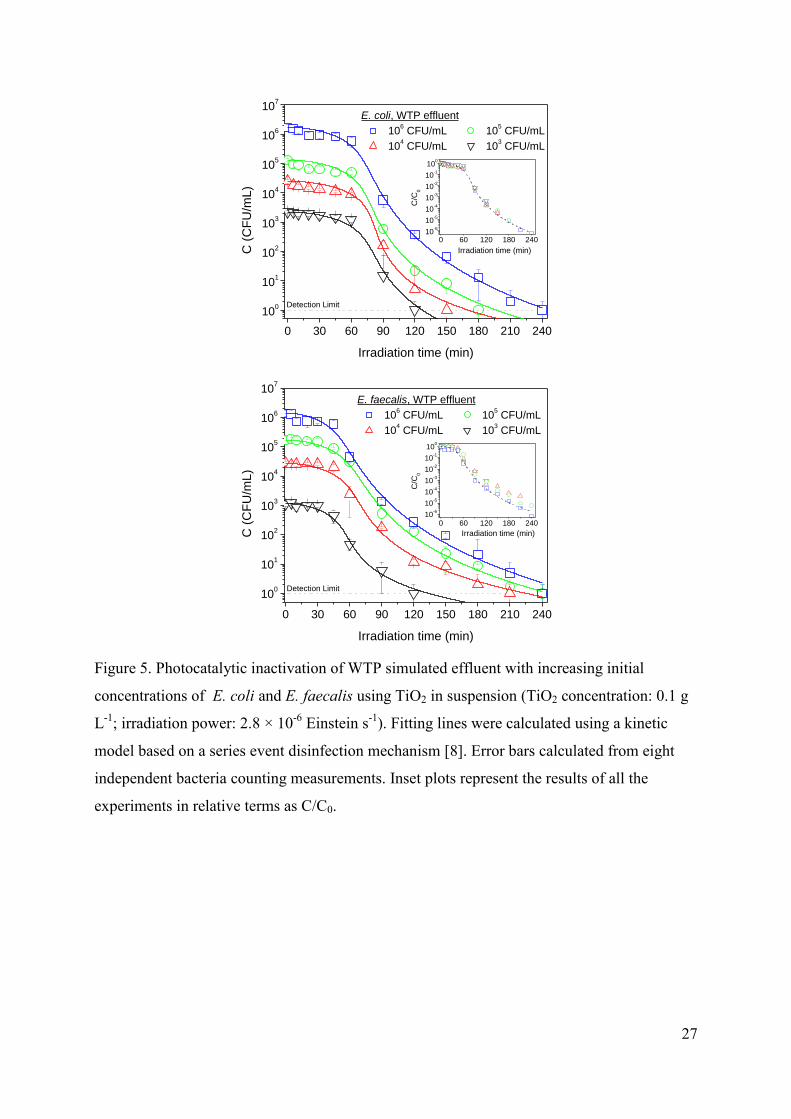
3.2.3. Effect of the initial concentration of bacteria
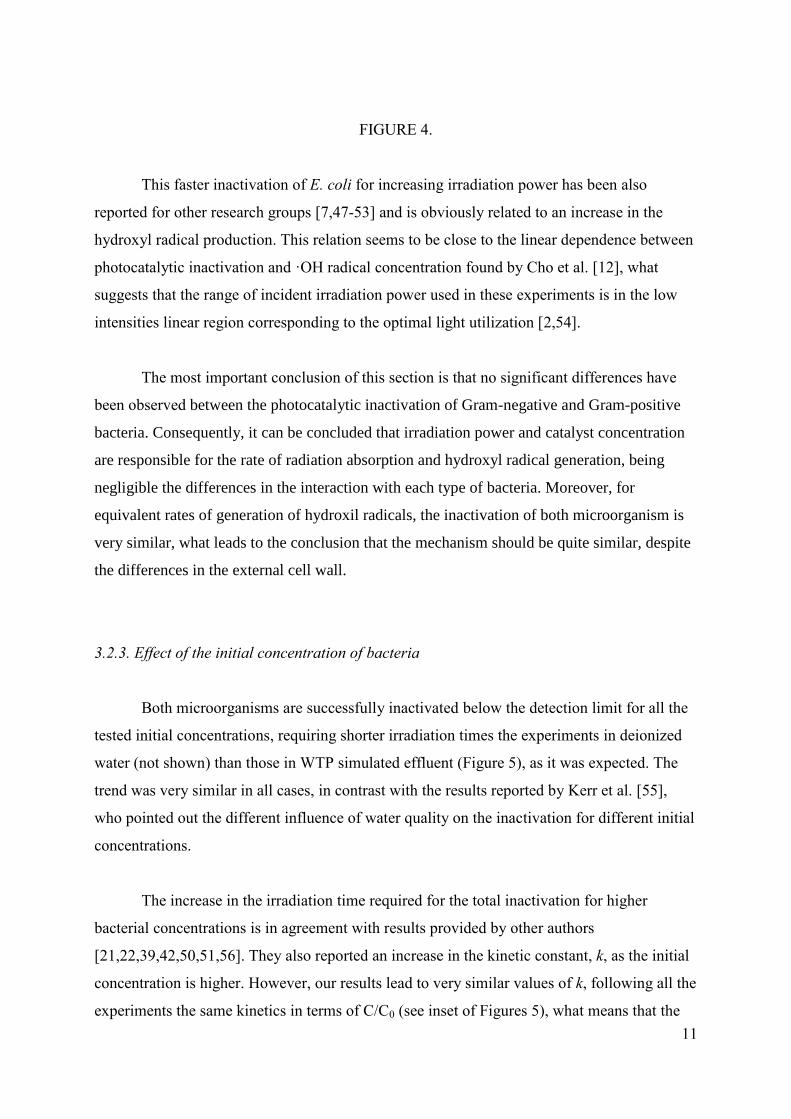
Both microorganisms are successfully inactivated below the detection limit for all the
tested initial concentrations, requiring shorter irradiation times the experiments in deionized
water (not shown) than those in WTP simulated effluent (Figure 5), as it was expected. The
trend was very similar in all cases, in contrast with the results reported by Kerr et al. [55],
who pointed out the different influence of water quality on the inactivation for different initial
concentrations.
The increase in the irradiation time required for the total inactivation for higher
bacterial concentrations is in agreement with results provided by other authors
[21,22,39,42,50,51,56]. They also reported an increase in the kinetic constant, k, as the initial
concentration is higher. However, our results lead to very similar values of k, following all the
experiments the same kinetics in terms of C/C0 (see inset of Figures 5), what means that the
12
time required for a complete inactivation is not as significant as the increase in initial bacterial
concentration. Therefore, these results are in agreement with the independence of k for initial
concentrations between 103 and 10
10 CFU mL
-1, as it was reported by Fernández-Ibáñez [57].
FIGURE 5.
It can be concluded that both microorganisms are inactivated through a similar
sequence of first-order processes with a kinetic constant dependent on the catalyst
concentration and the irradiation power but with a reaction rate limited by the concentration
of bacteria.
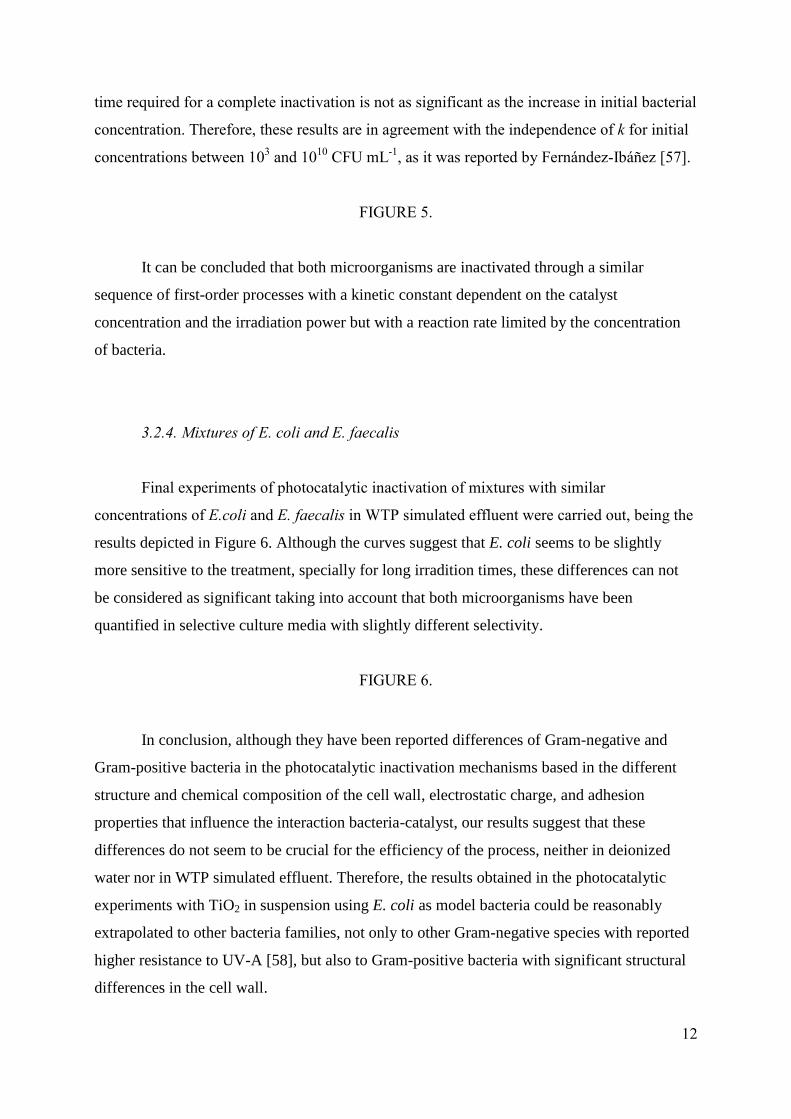
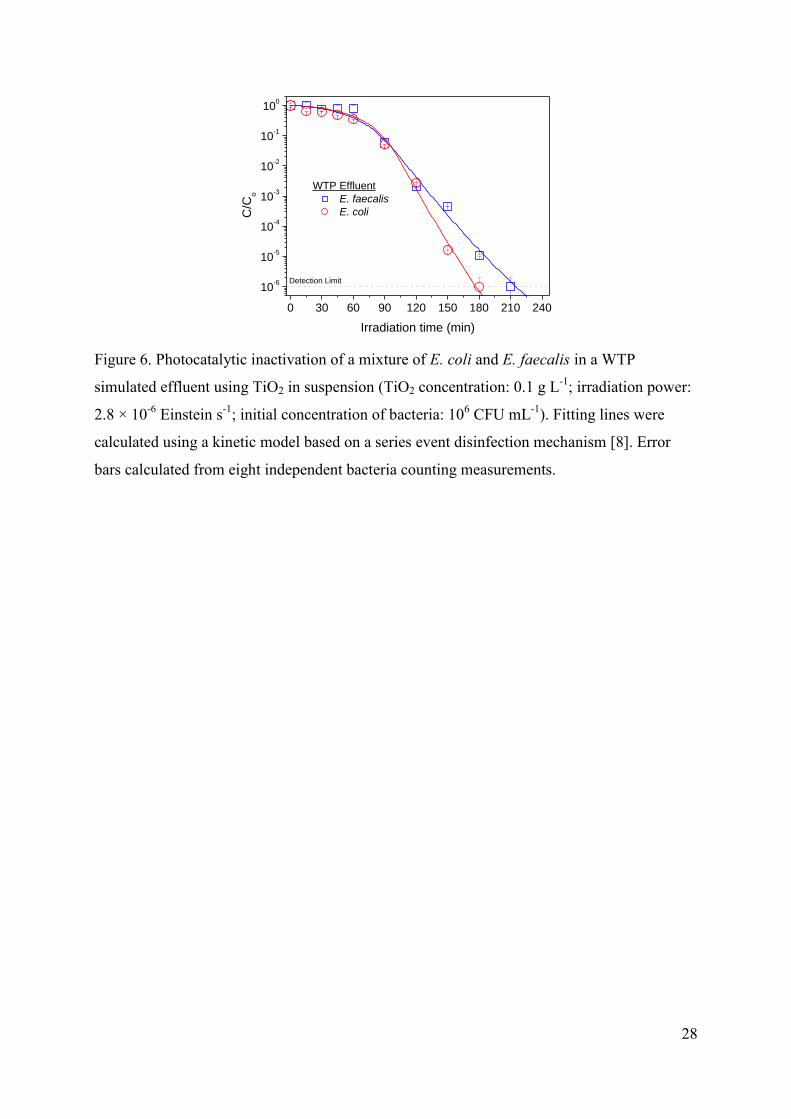
3.2.4. Mixtures of E. coli and E. faecalis
Final experiments of photocatalytic inactivation of mixtures with similar
concentrations of E.coli and E. faecalis in WTP simulated effluent were carried out, being the
results depicted in Figure 6. Although the curves suggest that E. coli seems to be slightly
more sensitive to the treatment, specially for long irradition times, these differences can not
be considered as significant taking into account that both microorganisms have been
quantified in selective culture media with slightly different selectivity.
FIGURE 6.
In conclusion, although they have been reported differences of Gram-negative and
Gram-positive bacteria in the photocatalytic inactivation mechanisms based in the different
structure and chemical composition of the cell wall, electrostatic charge, and adhesion
properties that influence the interaction bacteria-catalyst, our results suggest that these
differences do not seem to be crucial for the efficiency of the process, neither in deionized
water nor in WTP simulated effluent. Therefore, the results obtained in the photocatalytic
experiments with TiO2 in suspension using E. coli as model bacteria could be reasonably
extrapolated to other bacteria families, not only to other Gram-negative species with reported
higher resistance to UV-A [58], but also to Gram-positive bacteria with significant structural
differences in the cell wall.
13
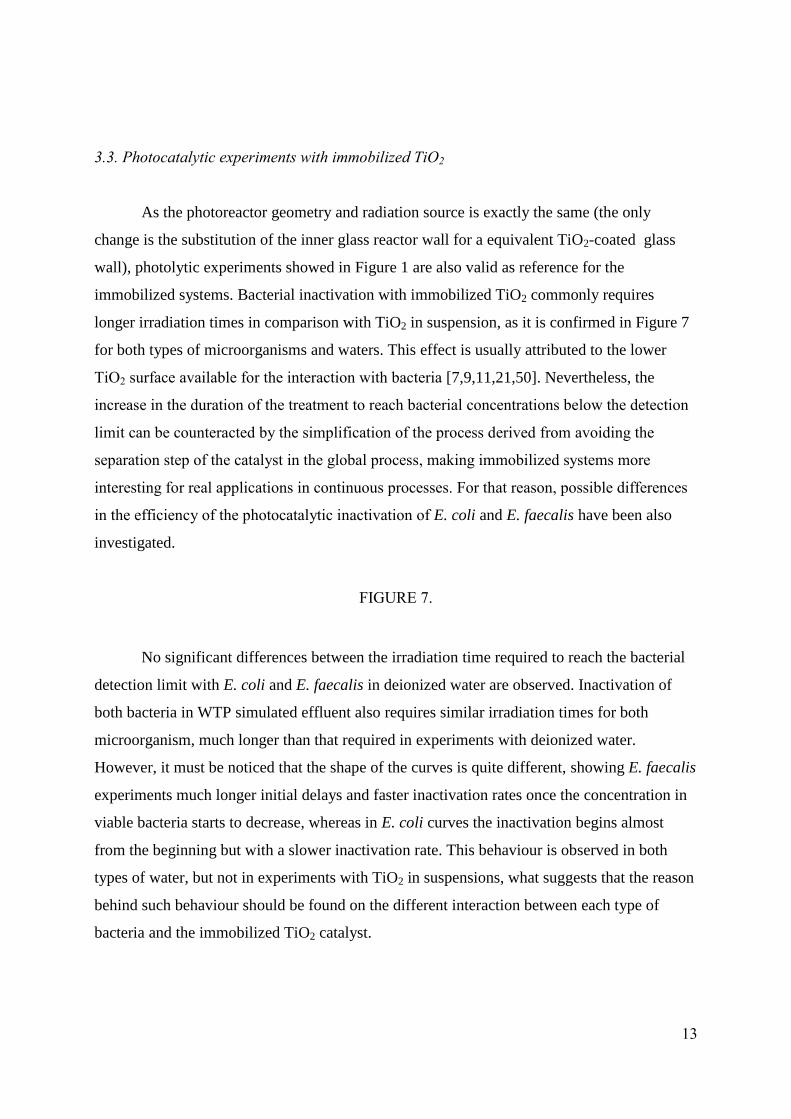
3.3. Photocatalytic experiments with immobilized TiO2
As the photoreactor geometry and radiation source is exactly the same (the only
change is the substitution of the inner glass reactor wall for a equivalent TiO2-coated glass
wall), photolytic experiments showed in Figure 1 are also valid as reference for the
immobilized systems. Bacterial inactivation with immobilized TiO2 commonly requires
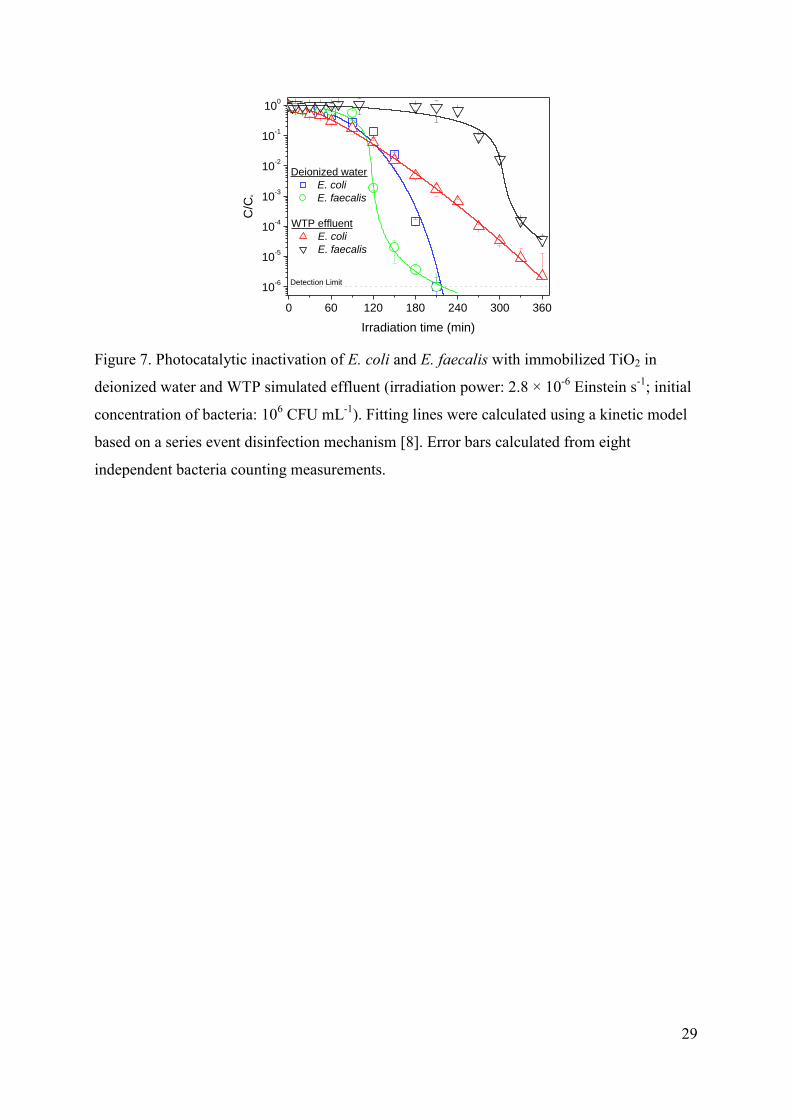
longer irradiation times in comparison with TiO2 in suspension, as it is confirmed in Figure 7
for both types of microorganisms and waters. This effect is usually attributed to the lower
TiO2 surface available for the interaction with bacteria [7,9,11,21,50]. Nevertheless, the
increase in the duration of the treatment to reach bacterial concentrations below the detection
limit can be counteracted by the simplification of the process derived from avoiding the
separation step of the catalyst in the global process, making immobilized systems more
interesting for real applications in continuous processes. For that reason, possible differences
in the efficiency of the photocatalytic inactivation of E. coli and E. faecalis have been also
investigated.
FIGURE 7.
No significant differences between the irradiation time required to reach the bacterial
detection limit with E. coli and E. faecalis in deionized water are observed. Inactivation of
both bacteria in WTP simulated effluent also requires similar irradiation times for both
microorganism, much longer than that required in experiments with deionized water.
However, it must be noticed that the shape of the curves is quite different, showing E. faecalis
experiments much longer initial delays and faster inactivation rates once the concentration in
viable bacteria starts to decrease, whereas in E. coli curves the inactivation begins almost
from the beginning but with a slower inactivation rate. This behaviour is observed in both
types of water, but not in experiments with TiO2 in suspensions, what suggests that the reason
behind such behaviour should be found on the different interaction between each type of
bacteria and the immobilized TiO2 catalyst.
14
Fu et al. [23] and Page et al. [24] support that since E. faecalis cell wall is thicker than
that of E. coli, it needs more hydroxyl radical attacks to be broken. However, when the cell
wall is damaged, it is easier for the OH radicals to reach the citoplasmic membrane since E.
faecalis has a less complex morphological structure than E. coli. Because of that, a longer
initial delay is observed for the E. faecalis kinetic profile, but the detection limit is achieved at
comparable irradiation times than E. coli. However, this explanation is not in agreement with
the results observed using TiO2 suspensions, in which no significant differences between the
shapes of the curves are found. Bui et al. [56] reported that the surface area, particle size and
surface charge modify the bacteria-TiO2 interaction since different inactivation activities were
observed when different kinds of TiO2 in suspension were used. These differences in bacteria-
TiO2 adhesion were also reported by Cohen-Yaniv et al. [42] who observed differences in the
photocatalytic activity for different Gram-negative bacteria using slurry and immobilized
catalysts. The photocatalytic activity was higher for the most hydrophobic bacteria tested
when immobilized catalyst was used. Due to the higher hidrophylicity of E. coli, other Gram-
negative bacteria, more hydrophobic than E. coli kept more adhesion and interaction with the
immobilized catalyst, while no differences in efficiency were observed with TiO2 in
suspension. Manjón et al. [27] also observed higher photocatalytic activity for E. faecalis than
for E. coli using a hydrophobic ruthenium (II) catalyst, whereas Li and Logan [40] also
reported a higher Gram-negative – TiO2 adhesion than Gram-positive – TiO2 adhesion, so
these differences might be more important when the catalyst is immobilized, since the surface
available for bacteria-TiO2 interaction decreases. Consequently, it seems that the chemical
composition of the microorganisms cell wall leads to differences in hydrophobicity which
might significantly affect the cell-catalyst adhesion, as it is also shown by Sichel et al. [59] for
other types of non-bacterial microorganisms.
These differences in the bacteria-TiO2 interaction are not so pronounced in
experiments in deionized water, what means that the chemical composition of the suspension
must be also taken into account. The presence of chemicals in the water remove the bacterial
osmotic stress existing in deionized water and compite for the hydroxyl radicals responsible
for the inactivation, but also influences the bacteria-catalyst adhesion. In fact, Demidova and
Hamblin [44] reported that compounds present in the suspension could get into more easily to
some bacteria than to others due to their differences in charge, chemical composition and cell
structure, and could even modify the bacterial electrostatic charge, leading to changes in the
bacteria-catalyst interaction [25,59]. Moreover, at slightly alkaline pH values (typical for
15
WTP effluents) TiO2 would be negatively charged, and then surrounded by a cations layer.
Since E. coli is more negatively charged than Gram-positive bacteria in a range of pH from 4
to 9 [41], the E. coli atraction towards the catalyst might be more favoured than that of E.
faecalis.
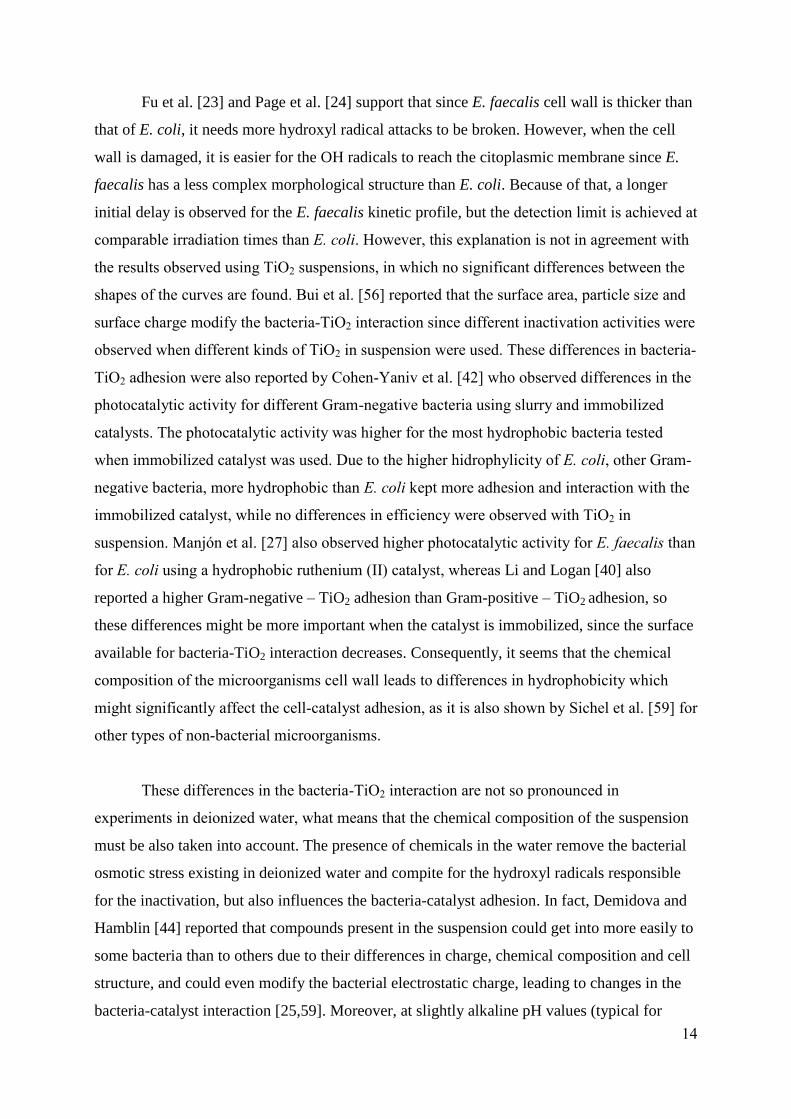
3.3.1. Effect of irradiation power
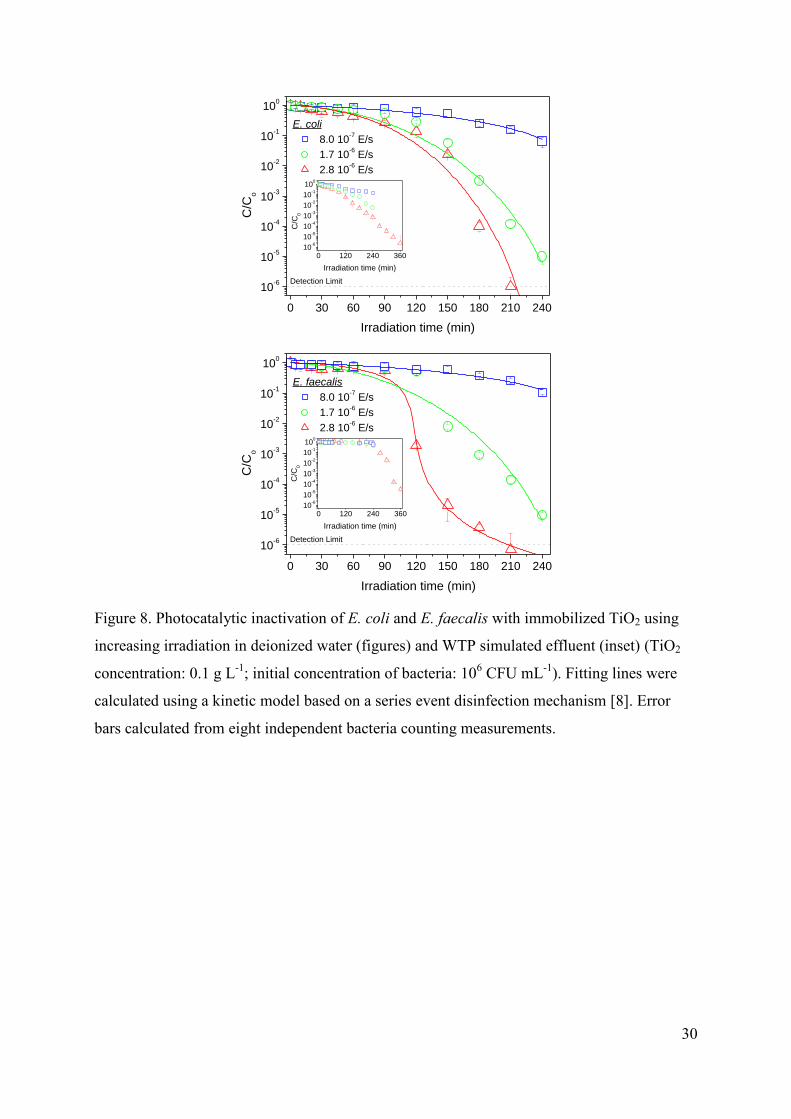
Figure 8 shows the influence of the irradiation power in the E. coli and E. faecalis
photocatalytic inactivation, both in deionized water (figures) and WTP simulated effluent
(inset). In all cases it is observed an increase in the disinfection efficiency as the irradiation
power increases, obviously due to the higher amount of available photons to activate the TiO2
catalyst, and consequently a higher production of hydroxyl radicals. Concerning the
differences in the shape of the curves and the influence of the water composition, the results
confirm the apparently different interaction existing between E. faecalis and E. coli and the
immobilized TiO2, attributed to differences in the charge and hydrophobicity of the cell wall.
In any case, and despite the significantly higher inactivation rate of E. coli cell at short
irradiation times, the duration of the treatment to reach the bacterial detection limit is
comparable for both microorganisms.
FIGURE 8.
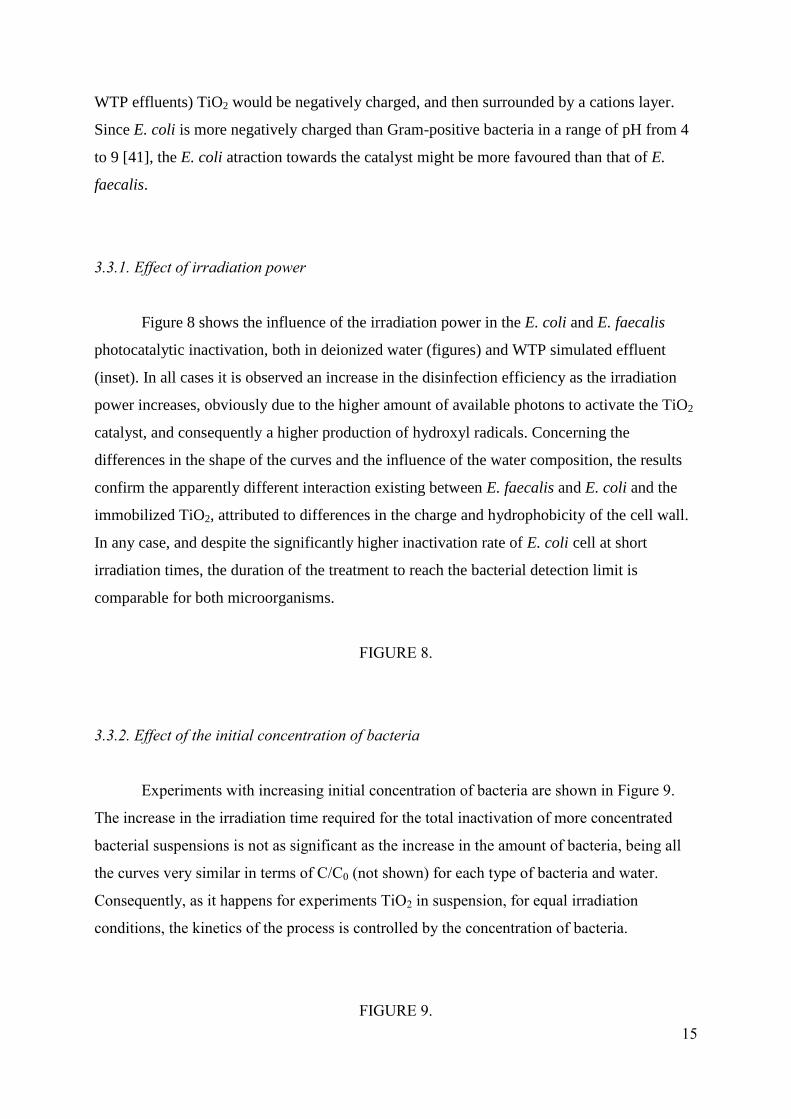
3.3.2. Effect of the initial concentration of bacteria
Experiments with increasing initial concentration of bacteria are shown in Figure 9.
The increase in the irradiation time required for the total inactivation of more concentrated
bacterial suspensions is not as significant as the increase in the amount of bacteria, being all
the curves very similar in terms of C/C0 (not shown) for each type of bacteria and water.
Consequently, as it happens for experiments TiO2 in suspension, for equal irradiation
conditions, the kinetics of the process is controlled by the concentration of bacteria.
FIGURE 9.
16
Figure 9 also confirms the reported differences in the shape of the inactivation curves
of both microorganisms, with an initially faster inactivation of E. coli but a delayed E.
faecalis inactivation that leads to comparable irradiation times to reach the bacterial detection
limit, especially in deionized water. These results suggest again the different interaction
bacteria-TiO2 between Gram-positive and Gram-negative bacteria, independently on the
experimental conditions.
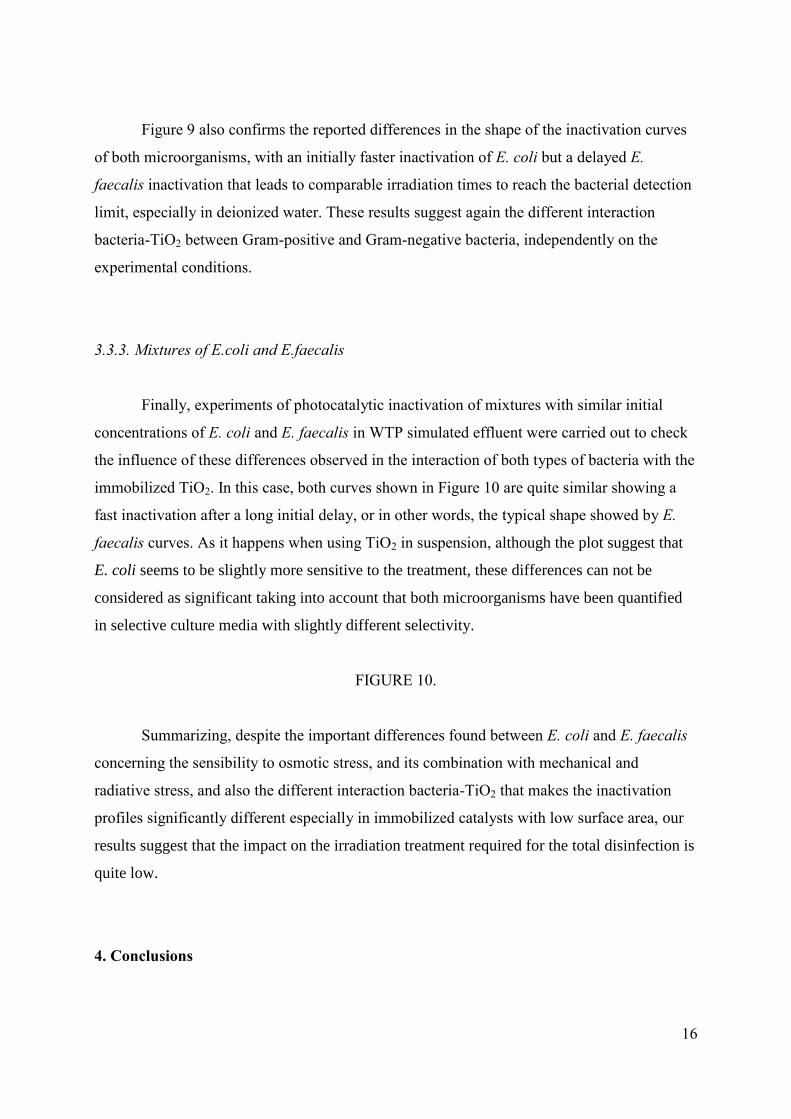
3.3.3. Mixtures of E.coli and E.faecalis
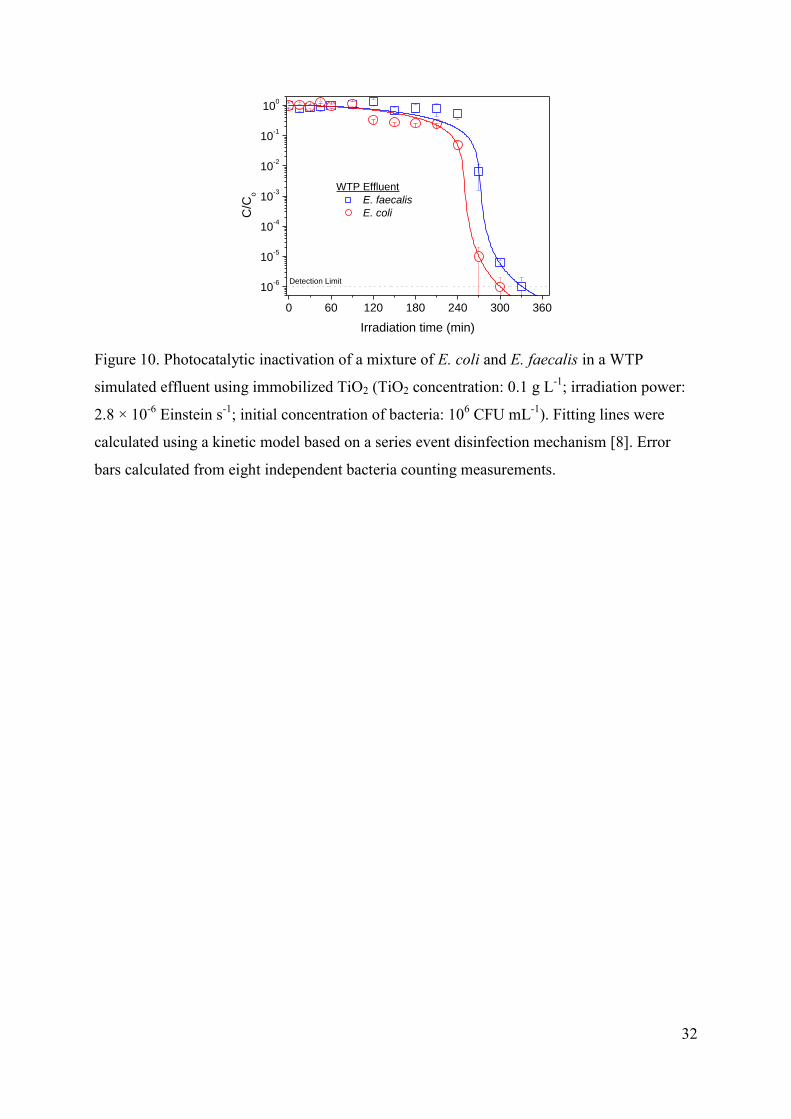
Finally, experiments of photocatalytic inactivation of mixtures with similar initial
concentrations of E. coli and E. faecalis in WTP simulated effluent were carried out to check
the influence of these differences observed in the interaction of both types of bacteria with the
immobilized TiO2. In this case, both curves shown in Figure 10 are quite similar showing a
fast inactivation after a long initial delay, or in other words, the typical shape showed by E.
faecalis curves. As it happens when using TiO2 in suspension, although the plot suggest that
E. coli seems to be slightly more sensitive to the treatment, these differences can not be
considered as significant taking into account that both microorganisms have been quantified
in selective culture media with slightly different selectivity.
FIGURE 10.
Summarizing, despite the important differences found between E. coli and E. faecalis
concerning the sensibility to osmotic stress, and its combination with mechanical and
radiative stress, and also the different interaction bacteria-TiO2 that makes the inactivation
profiles significantly different especially in immobilized catalysts with low surface area, our
results suggest that the impact on the irradiation treatment required for the total disinfection is
quite low.
4. Conclusions
17
Non-photocatalytic inactivation experiments show that E. coli is more sensitive than
E. faecalis when the osmotic stress coming from suspensions in deionized water was
combined with other kinds of stress, such as stirring or UV-A light. Despite the more complex
external structure of Gram-negative bacteria, osmotic stress may induce a higher weakening
of E. coli cell wall, enhancing the permeability to the oxidant species. However, the
composition of water plays an important role, as no differences betweeen both
microorganisms were found in WTP simulated effluent, in which osmotic stress is
significantly reduced.
Photocatalytic experiments with TiO2 in suspension do not show any differences
between the inactivation efficiency of E. coli and E. faecalis, both in deionized and WTP
simulated effluent. Both microorganisms seem to follow the same inactivation mechanism,
being similar the influence of operational variables such as catalyst concentration and
irradiation power, responsible for the rate of hydroxyl radical generation. Moreover,
differences in morphology and chemical composition, charge or hydrophobicity of the
external cell structure between both types of bacteria do not seem to lead to significant
differences in the microorganism-catalyst adhesion, showing similar inactivation profiles and
comparable irradiation times required for the total inactivation below the detection limit.
Consequently, E. coli photocatalytic inactivation results with TiO2 in suspension can be
extrapolated to the photocatalytic inactivation of other types of bacteria.
In contrast, some differences in E. coli and E.faecalis inactivation curves appeared
when immobilized TiO2 was used, especially in WTP simulated effluent, showing E. faecalis
a much longer initial delay. In this case, the differences in morphology and in chemical
composition of the external cell structure can lead to differences in electrostatic charge or
hydrophobicity and consequently can also lead to differences in the bacteria-catalyst
adhesion. This aspect adquires more importance when TiO2 is immobilized, since the
available titania surface for bacteria-catalyst interaction is reduced in comparison with TiO2 in
suspension. However, despite these differences in the shape of the inactivation profiles, both
types of microorganisms required similar irradiation times to achieve the complete
inactivation, being this fact confirmed by experiments of inactivation of mixtures of E. coli
and E. faecalis. Therefore, for real water disinfection applications, conclusions provided by
experiments using E. coli as model microorganism could be also reasonably extrapolated to
other types of bacteria consortia when using immobilized TiO2, making possible the
18
development of continuous water disinfection processes with purposes of drinking water
supply or reuse of WTP effluents.
Acknowledgements
The authors gratefully acknowledge the financial support of the Ministerio de Educación y
Ciencia of Spain through the program Consolider-Ingenio 2010 (project CSD2006-00044
TRAGUA) and Comunidad de Madrid through the program REMTAVARES (S2009/AMB-
1588). Cristina Pablos also acknowledges Ministerio de Ciencia e Innovación for its FPU
grant (AP2008-04567).
References
[1] L.K. Wang, P.C. Yuan, Y.T. Hung, in: L.K. Wang, Y.T. Hung, N.K. Shammas (Eds.),
Handbook of environmental engineering: physicochemical treatment processes, Humana
Press, Totowa N.J., 2004, pp. 271-314.
[2] J.M. Herrmann, Catal. Today 53 (1999) 115-129.
[3] World Health Organization, Water, sanitation and hygiene links to health. Facts and
figures, (2004).
[4] J. Blanco-Gálvez, P. Fernández-Ibáñez, S. Malato-Rodríguez, J. Solar Energy Eng. 129
(2007) 4-15.
[5] C. McCullagh, J.M.C. Robertson, D.W. Bahnemann, P.K.J. Robertson, Res. Chem.
Intermed. 33 (2007) 359-375.
[6]
J.A. Herrera Melián, J.M. Doña Rodríguez, A. Viera Suárez, E. Tello Rendón, C. Valdés do
Campo, J. Araña, J. Pérez Peña, Chemosphere 41 (2000) 323-327.
[7] A.G. Rincón, C. Pulgarín, Appl. Catal. B: Environ. 44 (2003) 263-284.
[8] J. Marugán, R. van Grieken, C. Sordo, C. Cruz, Appl. Catal. B: Environ. 82 (2008) 27-36.
19
[9] R. van Grieken, J. Marugán, C. Sordo, C. Pablos, Catal. Today 144 (2009) 48-54.
[10] T.P. Cushnie, P.K.J. Robertson, S. Officer, P.M. Pollard, C. McCullagh, J.M.C.
Robertson, Chemosphere 74 (2009) 1374-1378.
[11] S. Malato, Blanco J., D.C. Alarcón, M.I. Maldonado, P. Fernández-Ibáñez, W. Gernjak,
Catal. Today 122 (2007) 137-149.
[12] M. Cho, H. Chung, W. Choi, J. Yoon, Water Res. 38 (2004) 1069-1077.
[13] J.A. Ibáñez, M.I. Litter, R. A. Pizarro, J. Photochem. Photobiol. A: Chem. 157 (2003)
81-85.
[14] Z. Huang, P-C. Maness, D.M. Blake, E.J. Wolfrum, J. Photochem. Photobiol. A: Chem.
130 (2000) 163-170.
[15] M.T. Madigan, J.M. Martinko, J. Parker, Brock Biology of microorganisms, 10th
edition,
Pearson Prentice Hall, 2003.
[16] A. Pal, S.O. Pehkonen, L.E. Yu, M.B.V. Ray, J. Photochem. Photobiol. A: Chem. 186
(2007) 335-341.
[17] M. Kositzi, I. Poulios, S. Malato, J. Cáceres, A. Campos, Water Res. 38 (2004) 1147-
1154.
[18] C. Sichel, J. Blanco, S. Malato, and P. Fernández-Ibañez, J. Photochem. Photobiol. A:
Chem. 189 (2007) 239-246.
[19] J.M.C. Robertson, P.K.J. Robertson, L.A. Lawton, J. Photochem. Photobiol. A: Chem.
175 (2005) 51-56.
[20] C.-J. Chung, H.-I. Lin, C.-M. Chou, P.-Y. Hsieh, C.-H. Hsiao, Z.-Y. Shi, J.-L. He , Surf.
Coat. Technol. 203 (2009) 1081-1085.
20
[21] A.G. Rincón, C. Pulgarín, Appl. Catal. B: Environ. 49 (2004) 99-112.
[22] A.I. Gomes, J. Santos, V.J.P. Vilar, R.A.R. Boaventura, Appl. Catal. B: Environ. 88
(2009) 283-291.
[23] G. Fu, P.S. Vary, C.-T. Lin, J. Phys. Chem. B 109 (2005) 8889-8898.
[24] K. Page, R.G. Palgrave, I.P. Parkin, M. Wilson, S.L.P. Savin, A.V. Chadwick, J. Mater.
Chem. 17 (2007) 95-104.
[25] Y. Koizumi, M. Taya, Biotechnol. Lett. 24 (2002) 459-462.
[26] G. Gogniat, M.Thyssen, M. Denis, C. Pulgarín, S. Dukan, Microbiol. Lett. 258 (2006)
18-24.
[27] F. Manjón, L. Villén, D. García-Fresnadillo, G. Orellana, Environ. Sci. Technol. 42
(2008) 301-307.
[28] P. Wu, R. Xie, J. A. Imlay, J.K. Shang, Appl. Catal. B: Environ. 88 (2009) 576-581.
[29] K. Sunada, T. Watanabe, K. Hashimoto, J. Photochem. Photobiol. A: Chem. 156 (2003)
227-233.
[30] V.A. Nadtochenko, A.G. Rincón, S.E. Stanca, J. Kiwi, J. Photochem. Photobiol. A:
Chem. 169 (2005) 131-137.
[31] K.P. Kühn, I.F. Chaberny, Massholder K., M. Stickler, V. W. Benz, H.-G. Sonntag, L.
Erdinger, Chemosphere 53 (2003) 71-77.
[32] O. Seven, B. Dindar, S. Aydemir, D. Metin, M.A. Ozinel, S. Icli, J. Photochem.
Photobiol. A: Chem. 165 (2004) 103-107.
[33] Y. Lan, C. Hu, X. Hu, J. Qu, Appl. Catal. B: Environ. 73 (2007) 354-360.
21
[34] E. Bae, J.W. Lee, B.H. Hwang, J. Yeo, J. Yoon, H.J. Cha, W. Choi, Chemosphere 72
(2008) 174-181.
[35] E.V. Skorb, L.I. Antonouskaya, N.A. Belyasova, D.G. Shchukin, H. Möhwald, D.V.
Sviridov, Appl. Catal. B: Environ. 84 (2008) 94-99.
[36] L. Shaomin, G. Gaoli, X. Bihua, G. Wenqi, M. Guangjum, J. Wuhan Univ. Technol. 24
(2009) 557-561.
[37] H.L. Liu, T.C.-K. Yang, Proc. Biochem. 39 (2003) 475-481.
[38] A.-G. Rincón, C. Pulgarín, Catal. Today 101 (2005) 331-344.
[39] A.I. Gomes, V.J.P. Vilar, R.A.R. Boaventura, Catal. Today 144 (2009) 55-61.
[40] B. Li, B. Logan, Colloids Surf. B 36 (2004) 81-90.
[41] C. Hu, X. Hu, J. Guo, J. Qu, J. Amer. Chem. Soc. 40 (2006) 5508-5513.
[42] V. Cohen-Yaniv, N. Narkis, R. Armon, Water Sci. Technol. 58.1. (2008) 247-252.
[43] L. Villén, F. Manjón, D. García-Fresnadillo, G. Orellana, Appl. Catal. B: Environ. 69
(2006) 1-9.
[44] T.N. Demidova, R. Hamblin, Antimicrob. Agents Ch. 49 (2005) 2329-2335.
[45] L.W. Sinton, C.H. Hall, P.A. Lynch, R.J. Davies-Colley, Appl. Environ. Microbiol. 68
(2002) 1122-1131.
[46] J. Marugán, R. van Grieken, C. Pablos, C. Sordo, Water Res. 44 (2010) 789-796.
[47] X.Z. Li, M. Chang, H. Chua, Water Sci. Technol 33 (1996) 111-118.
[48] N. Huang, Z. Xiao, D. Huang, C. Yuan, Supramol. Sci. 5 (1998) 559-564.
22
[49] A.K. Benabbou, Z. Derriche, C. Felix, P. Lejeune, C. Guillard, Appl. Catal. B: Environ.
76 (2007) 257-263.
[50] F. Chen, X. Yang, F. Xu, Q. Wu, Y. Zhang, Environ. Sci. Technol. 43 (2009) 1180–
1184.
[51] P.S.M. Dunlop, J.A. Byrne, N. Manga, B.R. Eggins, J. Photochem. Photobiol. A: Chem.
148 (2002) 355-363.
[52] D. Gumy, C. Morais, P. Bowen, C. Pulgarín, S. Giraldo, R. Hajdu, J. Kiwi, Appl. Catal.
B: Environ. 63 (2006) 76-84.
[53] C. Sichel, J. Tello, M. de Cara, P. Fernández-Ibáñez, Catal. Today 129 (2007) 152-160.
[54] L. Vincze, T.J. Kemp, J. Photochem. Photobiol. A: Chem. 87 (1995) 257-260.
[55] M. Kerr, M. Fitzgerald, J.J. Sheridan, D.A. McDowll, I.S. Blair, J. Appl. Microbiol. 87
(1999) 833–841.
[56] T.-H. Bui, C. Felix, S. Pigeot-Remy, J.-M. Herrmann, P. Lejeune, C. Guillard, J. Adv.
Oxid. Technol. 11 (2008) 510-518.
[57] P. Fernández Ibáñez, in: M.A. Blesa, B Sánchez (Eds.), Eliminación de contaminantes
por fotocatálisis heterogénea, Ciemat, Madrid, 2004, pp. 259-276.
[58] J.A. Ibañez, M.I. Litter, R.A. Pizarro, J. Photochem. Photobiol. A: Chem. 157 (2003) 81-
85.
[59] C. Sichel, M. de Cara, J. Tello, J. Blanco, P. Fernández-Ibáñez, Appl. Catal. B: Environ.
74 (2007) 152-160.
23
0 60 120 180 240 300 360
10-6
10-5
10-4
10-3
10-2
10-1
100
E. coli, deionized water
Dark
Dark, stirring
Dark, TiO2 suspension
UVA light
Detection Limit
C/C
o
Irradiation time (min)
0 60 120 180 240 300 360
10-6
10-5
10-4
10-3
10-2
10-1
100
E. faecalis, deionized water
Dark
Dark, stirring
Dark, TiO2 suspension
UVA light
Detection Limit
C/C
o
Irradiation time (min)
0 60 120 180 240 300 360
10-3
10-2
10-1
100
10-3
10-2
10-1
100
E. faecalis, WTP effluent
Dark, TiO2 suspension
UVA light
C/C
o
Irradiation time (min)
E. coli, WTP effluent
Dark, TiO2 suspension
UVA light
C/C
o
Figure 1. Non-photocatalytic inactivation of E. coli and E. faecalis under different stressful
conditions in deionized water and WTP simulated effluent. Fitting lines were calculated using
a kinetic model based on a series event disinfection mechanism [8]. Error bars calculated from
eight independent bacteria counting measurements.
24
0 30 60 90 120 150 180 210 240
10-6
10-5
10-4
10-3
10-2
10-1
100
Deionized water
E. coli
E. faecalis
WTP effluent
E. coli
E. faecalis
Detection Limit
C/C
o
Irradiation time (min)
Figure 2. Photocatalytic inactivation of E. coli and E. faecalis with TiO2 in suspension in
deionized water and WTP simulated effluent (TiO2 concentration: 0.1 g L-1
; irradiation
power: 2.8 × 10⁻⁶
Einstein s-1
; initial concentration of bacteria: 106 CFU mL
-1). Fitting lines
were calculated using a kinetic model based on a series events disinfection mechanism [8].
Error bars calculated from eight independent bacteria counting measurements.
25
0 30 60 90 120 150 180 210 240
10-6
10-5
10-4
10-3
10-2
10-1
100
E. coli
No TiO2
0.05 g/L TiO2
0.1 g/L TiO2
0.2 g/L TiO2
Detection Limit
C/C
o
Irradiation time (min)
0 30 60 90 120 150 180 210 240
10-6
10-5
10-4
10-3
10-2
10-1
100
E. faecalis
No TiO2
0.05 g/L TiO2
0.1 g/L TiO2
0.2 g/L TiO2
Detection Limit
C/C
o
Irradiation time (min)
Figure 3. Photocatalytic inactivation of E. coli and E. faecalis with increasing concentration
of TiO2 in suspension in WTP simulated effluent (irradiation power: 2.8 × 10⁻⁶
Einstein s-1
;
initial concentration of bacteria: 106 CFU mL
-1). Fitting lines were calculated using a kinetic
model based on a series event disinfection mechanism [8]. Error bars calculated from eight
independent bacteria counting measurements.
26
0 30 60 90 120 150 180 210 240
10-6
10-5
10-4
10-3
10-2
10-1
100
E. coli
Dark
8.0 10-7 E/s
1.7 10-6 E/s
2.8 10-6 E/s
Detection Limit
C/C
o
Irradiation time (min)
0 30 60 90 120 150 180 210 240
10-6
10-5
10-4
10-3
10-2
10-1
100
E. faecalis
Dark
8.0 10-7 E/s
1.7 10-6 E/s
2.8 10-6 E/s
Detection Limit
C/C
o
Irradiation time (min)
Figure 4. Photocatalytic inactivation of E. coli and E. faecalis with TiO2 in suspension using
increasing irradiation power in WTP simulated effluent (TiO2 concentration: 0.1 g L-1
; initial
concentration of bacteria: 106 CFU mL
-1). Fitting lines were calculated using a kinetic model
based on a series event disinfection mechanism [8]. Error bars calculated from eight
independent bacteria counting measurements.
27
0 30 60 90 120 150 180 210 240
100
101
102
103
104
105
106
107
0 60 120 180 24010
-6
10-5
10-4
10-3
10-2
10-1
100
Detection Limit
E. coli, WTP effluent
106 CFU/mL 10
5 CFU/mL
104 CFU/mL 10
3 CFU/mL
C (
CF
U/m
L)
Irradiation time (min)
Irradiation time (min)
C/C
0
0 30 60 90 120 150 180 210 240
100
101
102
103
104
105
106
107
0 60 120 180 24010
-6
10-5
10-4
10-3
10-2
10-1
100
Detection Limit
E. faecalis, WTP effluent
106 CFU/mL 10
5 CFU/mL
104 CFU/mL 10
3 CFU/mL
C (
CF
U/m
L)
Irradiation time (min)
C/C
0
Irradiation time (min)
Figure 5. Photocatalytic inactivation of WTP simulated effluent with increasing initial
concentrations of E. coli and E. faecalis using TiO2 in suspension (TiO2 concentration: 0.1 g
L-1
; irradiation power: 2.8 × 10⁻⁶
Einstein s-1
). Fitting lines were calculated using a kinetic
model based on a series event disinfection mechanism [8]. Error bars calculated from eight
independent bacteria counting measurements. Inset plots represent the results of all the
experiments in relative terms as C/C0.
28
0 30 60 90 120 150 180 210 240
10-6
10-5
10-4
10-3
10-2
10-1
100
WTP Effluent
E. faecalis
E. coli
Detection Limit
C/C
o
Irradiation time (min)
Figure 6. Photocatalytic inactivation of a mixture of E. coli and E. faecalis in a WTP
simulated effluent using TiO2 in suspension (TiO2 concentration: 0.1 g L-1
; irradiation power:
2.8 × 10⁻⁶
Einstein s-1
; initial concentration of bacteria: 106 CFU mL
-1). Fitting lines were
calculated using a kinetic model based on a series event disinfection mechanism [8]. Error
bars calculated from eight independent bacteria counting measurements.
29
0 60 120 180 240 300 360
10-6
10-5
10-4
10-3
10-2
10-1
100
Deionized water
E. coli
E. faecalis
WTP effluent
E. coli
E. faecalis
Detection Limit
C/C
o
Irradiation time (min)
Figure 7. Photocatalytic inactivation of E. coli and E. faecalis with immobilized TiO2 in
deionized water and WTP simulated effluent (irradiation power: 2.8 × 10⁻⁶
Einstein s-1
; initial
concentration of bacteria: 106 CFU mL
-1). Fitting lines were calculated using a kinetic model
based on a series event disinfection mechanism [8]. Error bars calculated from eight
independent bacteria counting measurements.
30
0 120 240 36010
-6
10-5
10-4
10-3
10-2
10-1
100
0 30 60 90 120 150 180 210 240
10-6
10-5
10-4
10-3
10-2
10-1
100
E. coli
8.0 10-7 E/s
1.7 10-6 E/s
2.8 10-6 E/s
Detection Limit
C/C
o
Irradiation time (min)
Irradiation time (min)
C/C
0
0 120 240 36010
-6
10-5
10-4
10-3
10-2
10-1
100
0 30 60 90 120 150 180 210 240
10-6
10-5
10-4
10-3
10-2
10-1
100
E. faecalis
8.0 10-7 E/s
1.7 10-6 E/s
2.8 10-6 E/s
Detection Limit
C/C
o
Irradiation time (min)
Irradiation time (min)
C/C
0
Figure 8. Photocatalytic inactivation of E. coli and E. faecalis with immobilized TiO2 using
increasing irradiation in deionized water (figures) and WTP simulated effluent (inset) (TiO2
concentration: 0.1 g L-1
; initial concentration of bacteria: 106 CFU mL
-1). Fitting lines were
calculated using a kinetic model based on a series event disinfection mechanism [8]. Error
bars calculated from eight independent bacteria counting measurements.

31
0 30 60 90 120 150 180 210 240
100
101
102
103
104
105
106
107
0 120 240 36010
0
101
102
103
104
105
106
Det.
Limit
E. coli
106 CFU/mL
105 CFU/mL
104 CFU/mL
103 CFU/mL
C (
CF
U/m
L)
Irradiation time (min)
C (
CF
U/m
L)
Irradiation time (min)
0 30 60 90 120 150 180 210 240
100
101
102
103
104
105
106
107
0 120 240 36010
0
101
102
103
104
105
106
E. faecalis
106 CFU/mL
105 CFU/mL
104 CFU/mL
103 CFU/mL
Det.
Limit
C (
CF
U/m
L)
Irradiation time (min)
Irradiation time (min)
C (
CF
U/m
L)
Figure 9. Photocatalytic inactivation of deionized water (figure) and WTP simulated effluent
(inset) with increasing initial concentrations of E. coli and E. faecalis using immobilized
TiO2 (TiO2 concentration: 0.1 g L-1
; irradiation power: 2.8 × 10⁻⁶
Einstein s-1
). Fitting lines
were calculated using a kinetic model based on a series event disinfection mechanism [8].
Error bars calculated from eight independent bacteria counting measurements.
32
0 60 120 180 240 300 360
10-6
10-5
10-4
10-3
10-2
10-1
100
WTP Effluent
E. faecalis
E. coli
Detection Limit
C/C
o
Irradiation time (min)
Figure 10. Photocatalytic inactivation of a mixture of E. coli and E. faecalis in a WTP
simulated effluent using immobilized TiO2 (TiO2 concentration: 0.1 g L-1
; irradiation power:
2.8 × 10⁻⁶
Einstein s-1
; initial concentration of bacteria: 106 CFU mL
-1). Fitting lines were
calculated using a kinetic model based on a series event disinfection mechanism [8]. Error
bars calculated from eight independent bacteria counting measurements.
Related Documents


