Comparison Between Retinal Thickness Analyzer and Optical Coherence Tomography for Assessment of Foveal Thickness in Eyes With Macular Disease ANTONIO POLITO, MD, SYED M. SHAH, MBBS, JULIA A. HALLER, MD, INGRID ZIMMER-GALLER, MD, RAN ZEIMER, PHD, PETER A. CAMPOCHIARO, MD, AND SUSAN VITALE, PHD, MHS ● PURPOSE: To use the retinal thickness analyzer (RTA) and optical coherence tomography (OCT) scanners for quantitative measurement of retinal thickness in eyes with macular disease. ● DESIGN: In a cross-sectional study, 44 patients (55 eyes) with macular disease and sufficient media clarity to visualize the fundus using clinical biomicroscopy under- went an ophthalmologic examination, fluorescein angiog- raphy, RTA, and OCT during the same visit. ● METHODS: Foveal and foveal center (foveolar) retinal thickness measurements were obtained by RTA and by OCT. ● RESULTS: Retinal thickness measurements were ob- tained by OCT in all 55 eyes and by RTA in 34 eyes (62%, primarily due to interference from media opaci- ties). In the 34 eyes in which measurements were obtained by both instruments, mean foveal thickness was 291 and 269 m for OCT and RTA, respectively; foveolar thickness was 277 and 265 m, respectively. OCT and RTA measurements of foveal thickness were strongly correlated (intraclass correlation coefficient 0.89), as were measurements of the foveolar thickness (intraclass correlation coefficient 0.94). Topographic maps generated by the two techniques yielded qualita- tively similar information. ● CONCLUSIONS: Overall, there was excellent agreement between RTA and OCT measurements. Each technique has advantages that may make its use preferable in a particular subgroup of eyes or to describe a particular disease process. An important consideration is that media opacities create less interference for OCT than for RTA, so that in study populations with a moderate-to-high prevalence of media opacity, images can be obtained in a greater percentage of eyes by OCT than by RTA. (Am J Ophthalmol 2002;134:240 –251. © 2002 by Elsevier Science Inc. All rights reserved.) M ACULAR EDEMA IS A MAJOR CAUSE OF VISUAL loss in various disease processes, including isch- emic retinopathies, inflammatory eye disease, peripheral retinal dystrophies, and after intraocular surgi- cal procedures. While numerous treatment modalities are available for the multiple causes of macular edema, treat- ment results are often unsatisfactory, with poor visual outcomes. For example, the Early Treatment Diabetic Retinopathy Study (ETDRS) demonstrated that patients with diabetic macular edema fare better with focal laser treatment than with no treatment, but visual results are often disappointing. 1 Likewise, nonsteroidal anti-inflam- matory drops can have a beneficial effect in patients with post-surgical macular edema, but the effect is modest and there are many patients who do not respond to this treatment. 2–4 Clearly, new approaches are needed for patients with macular edema. Evaluation of new treatments requires reproducible quantitative assessment of macular edema. Currently, the gold standard is masked grading of stereoscopic fundus photographs. As shown in the ETDRS, this technique can be used to demonstrate a beneficial treatment effect. Accepted for publication April 2, 2002. From the Wilmer Eye Institute, The Johns Hopkins University School of Medicine, Baltimore, Maryland. This work was supported by grants from Michael Panitch, the National Eye Institute (EY12693-01 [SV] and core grant P30EY1765), Research to Prevent Blindness (a Lew R. Wasserman Merit Award [PAC], and an unrestricted grant). PAC is the George S. and Dolores Dore Eccles Professor of Ophthalmology and Neuroscience. Ran Zeimer holds a patent on the Retinal Thickness Analyzer and is a consultant for Talia Technologies, Ltd, Neve Ilan, Israel. The Johns Hopkins University, in accordance with its conflict of interest policies, is managing the terms of this arrangement. Reprint requests to Peter Campochiaro, MD, Maumenee 719, The Johns Hopkins Hospital, 600 N. Wolfe Street, Baltimore, MD 21287- 9277; fax: (410) 614-7083; e-mail: [email protected] © 2002 BY ELSEVIER SCIENCE INC.ALL RIGHTS RESERVED. 240 0002-9394/02/$22.00 PII S0002-9394(02)01528-3

Welcome message from author
This document is posted to help you gain knowledge. Please leave a comment to let me know what you think about it! Share it to your friends and learn new things together.
Transcript
Comparison Between Retinal ThicknessAnalyzer and Optical Coherence Tomography
for Assessment of Foveal Thickness in EyesWith Macular Disease
ANTONIO POLITO, MD, SYED M. SHAH, MBBS, JULIA A. HALLER, MD,INGRID ZIMMER-GALLER, MD, RAN ZEIMER, PHD, PETER A. CAMPOCHIARO, MD, AND
SUSAN VITALE, PHD, MHS
● PURPOSE: To use the retinal thickness analyzer (RTA)and optical coherence tomography (OCT) scanners forquantitative measurement of retinal thickness in eyeswith macular disease.● DESIGN: In a cross-sectional study, 44 patients (55eyes) with macular disease and sufficient media clarity tovisualize the fundus using clinical biomicroscopy under-went an ophthalmologic examination, fluorescein angiog-raphy, RTA, and OCT during the same visit.● METHODS: Foveal and foveal center (foveolar) retinalthickness measurements were obtained by RTA and byOCT.● RESULTS: Retinal thickness measurements were ob-tained by OCT in all 55 eyes and by RTA in 34 eyes(62%, primarily due to interference from media opaci-ties). In the 34 eyes in which measurements wereobtained by both instruments, mean foveal thickness was291 and 269 �m for OCT and RTA, respectively;foveolar thickness was 277 and 265 �m, respectively.OCT and RTA measurements of foveal thickness werestrongly correlated (intraclass correlation coefficient �0.89), as were measurements of the foveolar thickness(intraclass correlation coefficient � 0.94). Topographic
maps generated by the two techniques yielded qualita-tively similar information.● CONCLUSIONS: Overall, there was excellent agreementbetween RTA and OCT measurements. Each techniquehas advantages that may make its use preferable in aparticular subgroup of eyes or to describe a particulardisease process. An important consideration is that mediaopacities create less interference for OCT than for RTA,so that in study populations with a moderate-to-highprevalence of media opacity, images can be obtained in agreater percentage of eyes by OCT than by RTA. (AmJ Ophthalmol 2002;134:240–251. © 2002 by ElsevierScience Inc. All rights reserved.)
M ACULAR EDEMA IS A MAJOR CAUSE OF VISUAL
loss in various disease processes, including isch-emic retinopathies, inflammatory eye disease,
peripheral retinal dystrophies, and after intraocular surgi-cal procedures. While numerous treatment modalities areavailable for the multiple causes of macular edema, treat-ment results are often unsatisfactory, with poor visualoutcomes. For example, the Early Treatment DiabeticRetinopathy Study (ETDRS) demonstrated that patientswith diabetic macular edema fare better with focal lasertreatment than with no treatment, but visual results areoften disappointing.1 Likewise, nonsteroidal anti-inflam-matory drops can have a beneficial effect in patients withpost-surgical macular edema, but the effect is modest andthere are many patients who do not respond to thistreatment.2–4 Clearly, new approaches are needed forpatients with macular edema.
Evaluation of new treatments requires reproduciblequantitative assessment of macular edema. Currently, thegold standard is masked grading of stereoscopic fundusphotographs. As shown in the ETDRS, this technique canbe used to demonstrate a beneficial treatment effect.
Accepted for publication April 2, 2002.From the Wilmer Eye Institute, The Johns Hopkins University School
of Medicine, Baltimore, Maryland.This work was supported by grants from Michael Panitch, the National
Eye Institute (EY12693-01 [SV] and core grant P30EY1765), Research toPrevent Blindness (a Lew R. Wasserman Merit Award [PAC], and anunrestricted grant). PAC is the George S. and Dolores Dore EcclesProfessor of Ophthalmology and Neuroscience.
Ran Zeimer holds a patent on the Retinal Thickness Analyzer and is aconsultant for Talia Technologies, Ltd, Neve Ilan, Israel. The JohnsHopkins University, in accordance with its conflict of interest policies, ismanaging the terms of this arrangement.
Reprint requests to Peter Campochiaro, MD, Maumenee 719, TheJohns Hopkins Hospital, 600 N. Wolfe Street, Baltimore, MD 21287-9277; fax: (410) 614-7083; e-mail: [email protected]
© 2002 BY ELSEVIER SCIENCE INC. ALL RIGHTS RESERVED.240 0002-9394/02/$22.00PII S0002-9394(02)01528-3
However, grading of macular thickening by a trainedobserver who makes comparisons with a standard set ofimages is semiquantitative at best and has a subjectivecomponent, which requires vigilance with regard to qualitycontrol. Fluorescein angiography may be very helpful inthe detection of leakage, but it does not provide aquantitative assessment of retinal thickening. Slit-lampbiomicroscopy is also not quantitative and may not detectsubtle macular thickening.
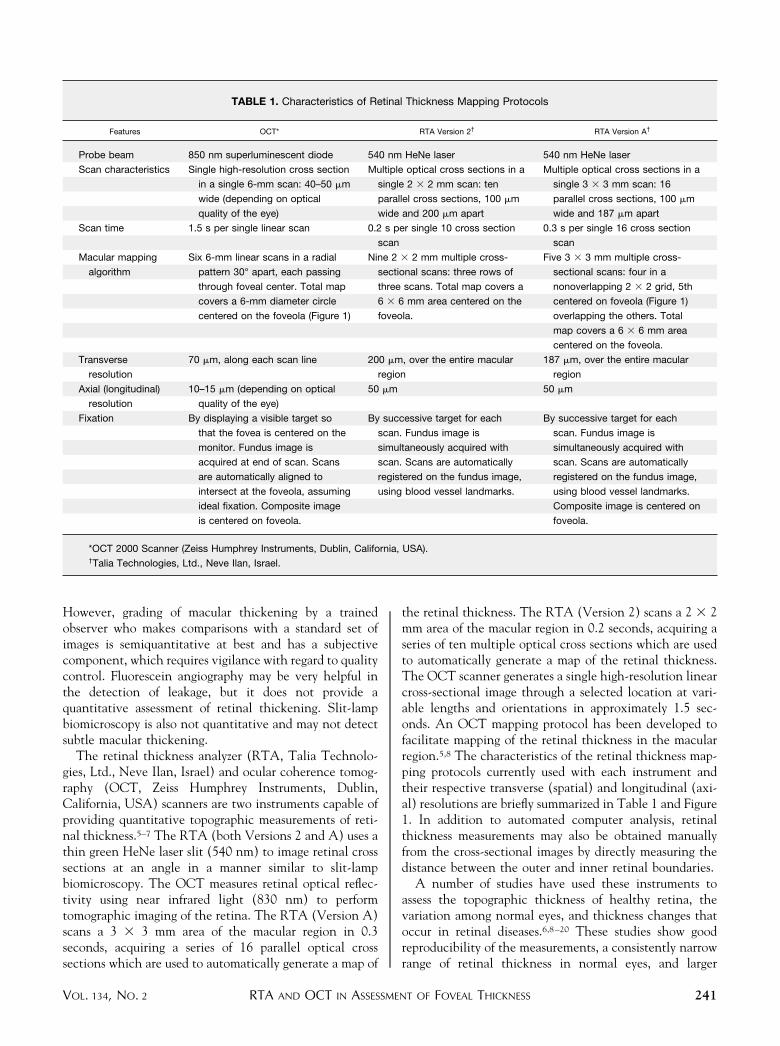
The retinal thickness analyzer (RTA, Talia Technolo-gies, Ltd., Neve Ilan, Israel) and ocular coherence tomog-raphy (OCT, Zeiss Humphrey Instruments, Dublin,California, USA) scanners are two instruments capable ofproviding quantitative topographic measurements of reti-nal thickness.5–7 The RTA (both Versions 2 and A) uses athin green HeNe laser slit (540 nm) to image retinal crosssections at an angle in a manner similar to slit-lampbiomicroscopy. The OCT measures retinal optical reflec-tivity using near infrared light (830 nm) to performtomographic imaging of the retina. The RTA (Version A)scans a 3 � 3 mm area of the macular region in 0.3seconds, acquiring a series of 16 parallel optical crosssections which are used to automatically generate a map of
the retinal thickness. The RTA (Version 2) scans a 2 � 2mm area of the macular region in 0.2 seconds, acquiring aseries of ten multiple optical cross sections which are usedto automatically generate a map of the retinal thickness.The OCT scanner generates a single high-resolution linearcross-sectional image through a selected location at vari-able lengths and orientations in approximately 1.5 sec-onds. An OCT mapping protocol has been developed tofacilitate mapping of the retinal thickness in the macularregion.5,8 The characteristics of the retinal thickness map-ping protocols currently used with each instrument andtheir respective transverse (spatial) and longitudinal (axi-al) resolutions are briefly summarized in Table 1 and Figure1. In addition to automated computer analysis, retinalthickness measurements may also be obtained manuallyfrom the cross-sectional images by directly measuring thedistance between the outer and inner retinal boundaries.
A number of studies have used these instruments toassess the topographic thickness of healthy retina, thevariation among normal eyes, and thickness changes thatoccur in retinal diseases.6,8–20 These studies show goodreproducibility of the measurements, a consistently narrowrange of retinal thickness in normal eyes, and larger
TABLE 1. Characteristics of Retinal Thickness Mapping Protocols
Features OCT* RTA Version 2† RTA Version A†
Probe beam 850 nm superluminescent diode 540 nm HeNe laser 540 nm HeNe laser
Scan characteristics Single high-resolution cross section
in a single 6-mm scan: 40–50 �m
wide (depending on optical
quality of the eye)
Multiple optical cross sections in a
single 2 � 2 mm scan: ten
parallel cross sections, 100 �m
wide and 200 �m apart
Multiple optical cross sections in a
single 3 � 3 mm scan: 16
parallel cross sections, 100 �m
wide and 187 �m apart
Scan time 1.5 s per single linear scan 0.2 s per single 10 cross section
scan
0.3 s per single 16 cross section
scan
Macular mapping
algorithm
Six 6-mm linear scans in a radial
pattern 30° apart, each passing
through foveal center. Total map
covers a 6-mm diameter circle
centered on the foveola (Figure 1)
Nine 2 � 2 mm multiple cross-
sectional scans: three rows of
three scans. Total map covers a
6 � 6 mm area centered on the
foveola.
Five 3 � 3 mm multiple cross-
sectional scans: four in a
nonoverlapping 2 � 2 grid, 5th
centered on foveola (Figure 1)
overlapping the others. Total
map covers a 6 � 6 mm area
centered on the foveola.
Transverse
resolution
70 �m, along each scan line 200 �m, over the entire macular
region
187 �m, over the entire macular
region
Axial (longitudinal)
resolution
10–15 �m (depending on optical
quality of the eye)
50 �m 50 �m
Fixation By displaying a visible target so
that the fovea is centered on the
monitor. Fundus image is
acquired at end of scan. Scans
are automatically aligned to
intersect at the foveola, assuming
ideal fixation. Composite image
is centered on foveola.
By successive target for each
scan. Fundus image is
simultaneously acquired with
scan. Scans are automatically
registered on the fundus image,
using blood vessel landmarks.
By successive target for each
scan. Fundus image is
simultaneously acquired with
scan. Scans are automatically
registered on the fundus image,
using blood vessel landmarks.
Composite image is centered on
foveola.
*OCT 2000 Scanner (Zeiss Humphrey Instruments, Dublin, California, USA).†Talia Technologies, Ltd., Neve Ilan, Israel.
RTA AND OCT IN ASSESSMENT OF FOVEAL THICKNESSVOL. 134, NO. 2 241
measurements in eyes whose retinas appear thickened bybiomicroscopy. This suggests that both RTA and OCT canreliably identify and quantify increased retinal thicknessand monitor thickness changes over time. But there hasnot been a comparison of measurements made with RTAand OCT in the same group of eyes. In this study, we havesought to make such a comparison.
METHODS
THE STUDY WAS DESIGNED TO PROVIDE A CROSS-SEC-
tional comparison of RTA and OCT in a consecutiveseries of eyes with retinopathies affecting the macularthickness. The study protocol was approved and monitoredby the Johns Hopkins University Joint Committee onClinical Investigation. All participants engaged in aninformed consent process and signed a written consentdocument before study procedures were carried out. Thesubject of this report is 55 eyes of 44 patients who wereexamined over a 5-month period by one of two retina
specialists (P.A.C., J.A.H.). Eligibility criteria included adiagnosis of retinopathy affecting the macular thickness,sufficient media clarity to visualize the fundus using clini-cal biomicroscopy, provision of informed consent, andscanning with the RTA and OCT. The patients under-went a complete ophthalmic evaluation, including mea-surement of Snellen visual acuity, slit-lamp biomicroscopy,stereoscopic fundus photography, and fluorescein angiog-raphy. The study protocol attempted to enroll consecutivepatients during this time period. However, although notselected for degree of macular thickening or for otherocular characteristics, otherwise eligible patients may nothave participated because of lack of consent, lack ofavailability of personnel to perform OCT or RTA imaging,or lack of time for the clinicians in a clinic setting toidentify potential study patients.
Examination by OCT and RTA was performed on thesame day through a dilated pupil by an ophthalmologist(A.P.) who was familiar with the clinical findings. Theoperator did not have access to quantitative results of the
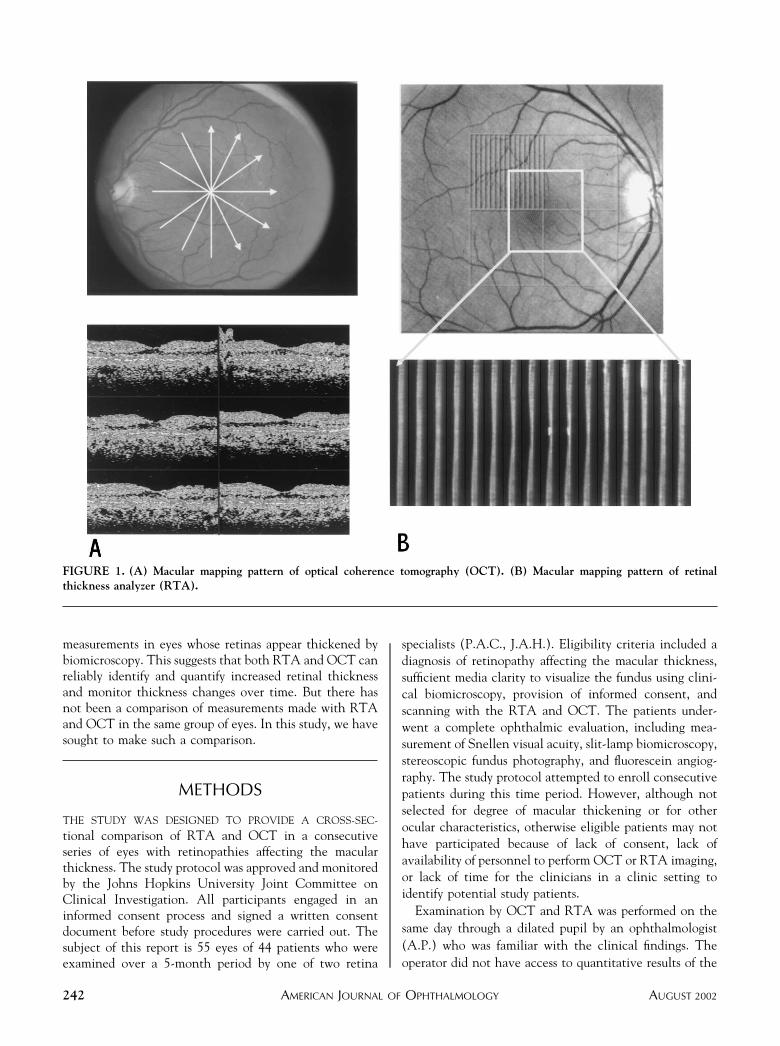
FIGURE 1. (A) Macular mapping pattern of optical coherence tomography (OCT). (B) Macular mapping pattern of retinalthickness analyzer (RTA).
AMERICAN JOURNAL OF OPHTHALMOLOGY242 AUGUST 2002
scans while scans were being acquired. Patients with mediaopacities impairing the biomicroscopic view of the fundus,poor mydriasis, or high refractive error were excluded.
Each eligible eye underwent OCT scanning using theOCT 2000 scanner (Zeiss Humphrey Instruments, Dublin,California, USA) with the A6.1 version software. OCTscans were performed by selecting the “radial lines” scanpattern which performs six OCT linear scans 6 mm inlength centered on the fovea at equally spaced angularorientations (Figure 1). Each scan line runs from thefollowing clock dial positions: 6:00 to 12:00, 7:00 to 1:00,8:00 to 2:00, 9:00 to 3:00, 10:00 to 4:00, and 11:00 to 5:00.The images were automatically analyzed by the OCTcomputer software using the “retina map” algorithm,which determines retinal thickness from the OCT sectionby an edge detection technique that uses the reflectionpattern of the cross section. The first reflection representsthe anterior border of the retina (that is, the vitreoretinalinterface) and the second reflection represents the anteriorborder of the choriocapillaris/retinal pigment epitheliuminterface. The software samples macular thickness at 600points, 70 �m apart, along each of the intersecting linesand records resulting data in a false-color topographic mapand as numeric averages of the measurements for each ofnine ETDRS retinal fields. The foveal thickness (FTH),defined as the mean height of the neurosensory retina in acentral 1 mm diameter disk, and the foveolar centerthickness (CEN), defined as the mean of the six centralmacular measurements, were recorded.
RTA scanning was performed with two different RTA(Talia Technology Ltd, Neve Ilan, Israel) versions: Ver-sion 2 (the first seven eyes enrolled in the study) and themore recent Version A (all subsequent eyes). Version Awas designed to obtain the same retinal thickness infor-mation as Version 2, but each individual scan covers alarger area, so that a smaller number of targets is requiredto cover the same area of the macula. The instruments arebased on identical optical principles and the underlyingtechnology has not been modified. With the older Version2, the retinal thickness map is obtained by an analysis ofnine individual scans, each composed of a series of tenparallel cross-sectional slit images 200 �m apart, coveringa 2 � 2 mm area and acquired in 0.2 seconds. The totalarea covered by the nine (Version 2) RTA scans (arrangedin three rows of three scans) measures 6 � 6 mm. In thenewer Version A, the 6 � 6 mm map (Figure 1) isgenerated by an analysis of five individual scans, eachcomposed of a series of 16 parallel slit images, 187 �mapart, covering a 3 � 3 mm area and acquired in 0.3seconds. Four of the scans (arranged in two rows of twoscans) cover a 6 � 6 mm area around the fovea, analogousto that of the older version, and the fifth scan covers the(overlapping) 3 � 3 mm area centered over the fovealcenter (Figure 1). In both versions, each slit image isformed by an anterior reflection, corresponding to the
location of the retinal interface at the level of the innerlimiting membrane and a posterior reflection, correspond-ing to location of the retinal interface between the retinalpigment epithelium and the choroid. The locations of theanterior and posterior (that is, the vitreoretinal and cho-rioretinal) interfaces are detected by previously describedmethods.6,21 The same software is used to analyze scansfrom Version A and Version 2. The automated computeranalysis (software version 4.075) of the distance betweenthe two reflections generates a two- and three-dimensionalretinal thickness map and a report containing retinalthickness summary parameters and their deviation fromnormal values. The retinal thickness summary parametersexamined for this study were the foveal average thickness(FAV), which corresponds to the average thickness of themeasurements over a central 1.2 mm diameter disk and thefoveolar average thickness (VAV), which represents theaverage thickness over a 600 �m diameter disk centered onthe fixation point.
We studied the association between the two measures offoveal thickness (OCT FTH vs RTA FAV), and betweenthe two measures of foveolar thickness (OCT CEN vsRTA VAV). In some of the eyes (seven for RTA and onefor OCT), computerized measurement of foveal thicknesswas precluded by artifacts that prevented automated de-lineation of the inner and/or outer border of the retina(more details below). In these instances, the optical crosssection was used to manually measure retinal thicknessusing the manufacturer’s software.
Statistical comparisons of RTA and OCT foveal andfoveolar thickness measurements were compared by calcu-lating the intraclass correlation coefficient (ICC), a mea-sure of exact agreement, assuming random graders.22 TheICC was computed using an SAS macro, INTRACC(Robert M. Hamer, Virginia Commonwealth University,1991). The ICC was computed for both the raw datavalues and log-transformed values to evaluate the possibleeffect of outliers in the data. The ICC is the ratio ofamong-subjects variation to the sum of among-subject andwithin-subject variation. Values close to one mean thatthe agreement between methods is good, relative to thevariation among subjects. Values close to zero mean theagreement among methods is poor (large relative to vari-ation among subjects). Because heterogeneous groups ofsubjects will have relatively large among-subject variationand hence inflate the ICC,23 we computed ICCs separatelyfor the subgroups with retinal thickness values less than300 �m and greater than 300 �m. In addition, simplelinear regression models of the RTA parameters on theOCT parameters were fitted to obtain slope and interceptestimates, along with the proportion of variation ac-counted for by the linear model (r2). Values which differedby more than the reproducibility of either instrument (50�m) were examined to determine whether characteristicsof the RTA or OCT scans for that eye could explain thediscrepancy.
RTA AND OCT IN ASSESSMENT OF FOVEAL THICKNESSVOL. 134, NO. 2 243
RESULTS
FIFTY-FIVE EYES FROM 44 PATIENTS WITH VARIOUS RETINAL
diseases were examined with OCT and RTA. The patientswere aged 45 to 86 years (median, 68 years); 21 were maleand 23 were female. In all 55 eyes it was possible to obtainOCT scans that were adequate for analysis, either auto-mated or manual. RTA scans could not be obtained in 21eyes primarily because of media opacities including mildcorneal edema, dense cortical lens opacities, moderate-to-severe nuclear or posterior subcapsular lens opacities, orvitreous haziness. In the remaining 34 eyes that could bescanned by both RTA and OCT (the subject of thisreport), clinical diagnoses included diabetic retinopathy(19 eyes), post-surgical or inflammatory cystoid macularedema (six eyes), parafoveal teleangectasia (two eyes),branch retinal vein occlusion (two eyes), choroidal neo-vascularization (two eyes), and macular pucker (threeeyes).
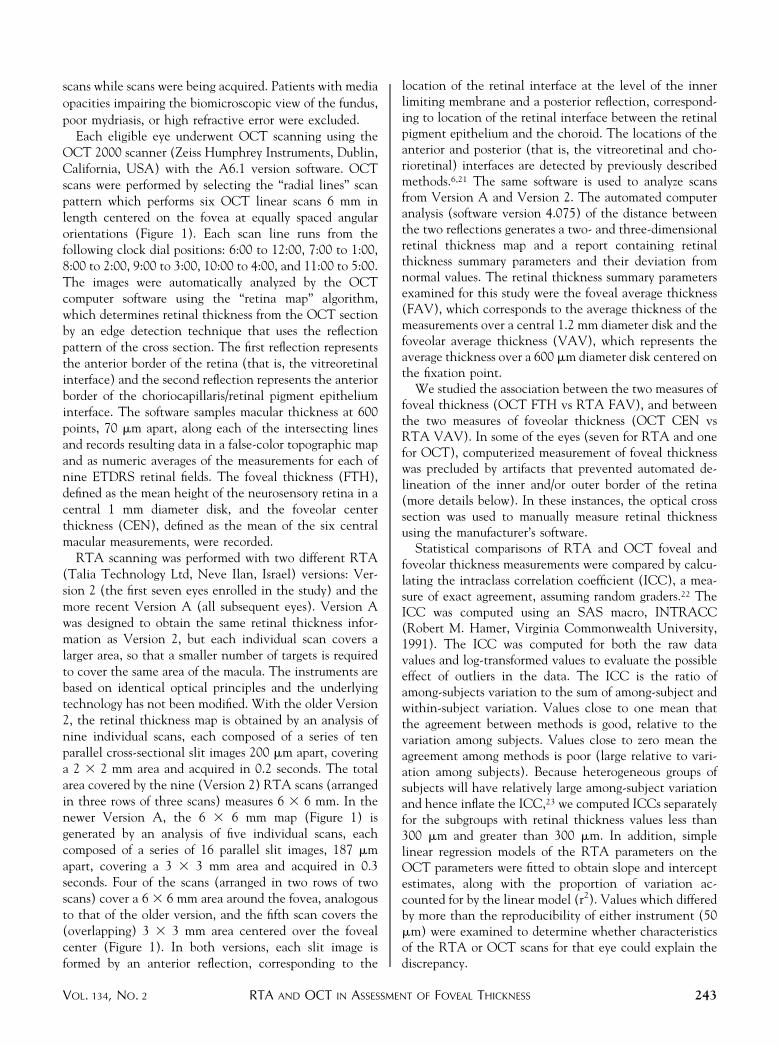
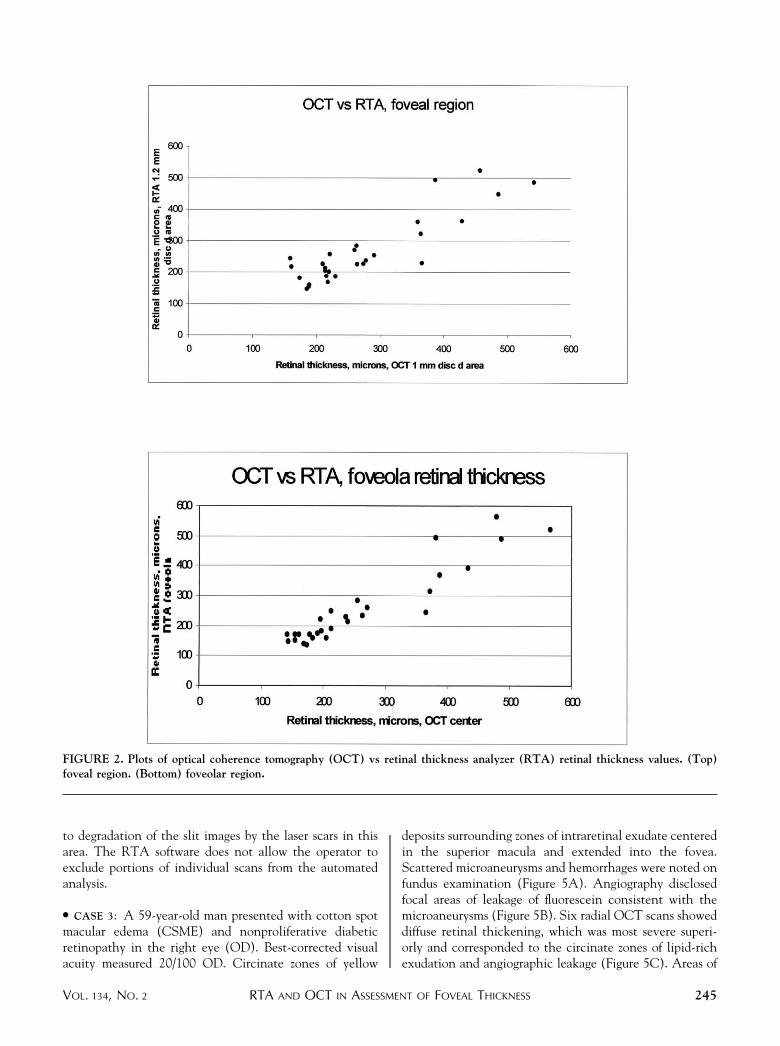
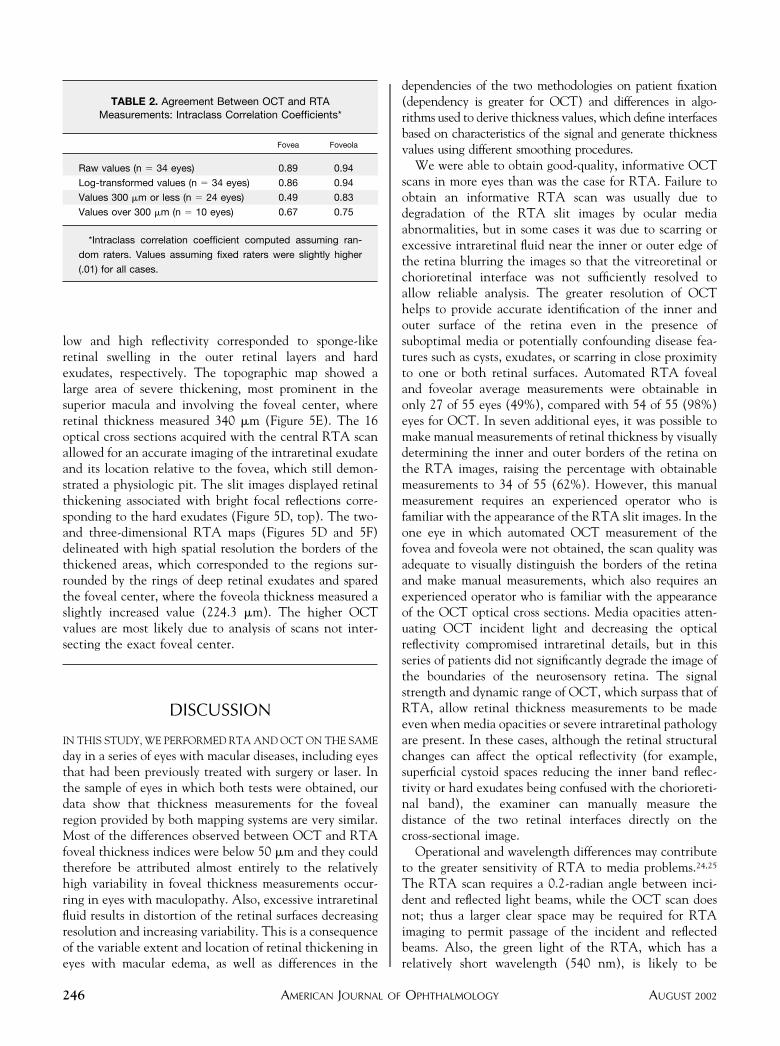
For the 34 eyes in which measurements were obtainedwith both instruments, the mean (� SD) foveal thicknesswas 268.5 � 115.4 �m with RTA (coefficient of variation,43%) and 290.9 � 113.8 �m with OCT (coefficient ofvariation, 39%). The mean (� SD) foveolar thickness was264.9 � 132.5 �m with RTA (coefficient of variation,50%) and 277.2 � 127.0 �m with OCT (coefficient ofvariation, 46%). As expected, the mean thickness mea-surements were above the normal range with both instru-ments, since all the examined eyes had pathologiesaffecting macular thickness. Overall, the agreement be-tween the two instruments was good, particularly for thefoveolar measurements (Figure 2). Intraclass correlationcoefficients were high (Table 2) and did not change muchwhen computed for log-transformed values.
Greatest numerical differences in retinal thickness mea-surements were found for values exceeding twice thenormal retinal thickness. The ICCs computed for the teneyes with retinal thickness greater than 300 �m weresomewhat lower than for the overall data (Table 2).Fixation tends to be poor in such eyes, which may be morereliably measured using RTA, as RTA registers scan datausing fundus landmarks and is not as dependent on fixationas the OCT. When restricted to the 24 eyes with retinalthickness 300 �m or less, ICCs remained excellent for thefoveola, but decreased to 0.49 for the fovea.
The topographic display of retinal thickening by retinalthickness maps was very similar for both instruments,particularly for the foveal region. Although one mightpredict peripheral topographic information generated bybilinear interpolation in the wedges between OCT opticalsections to be less accurate than the map generated by themore finely spaced RTA grid, the overall information didnot show marked disagreement, although the case reportsshow that RTA provides more detailed information insome cases.
CASE REPORTS
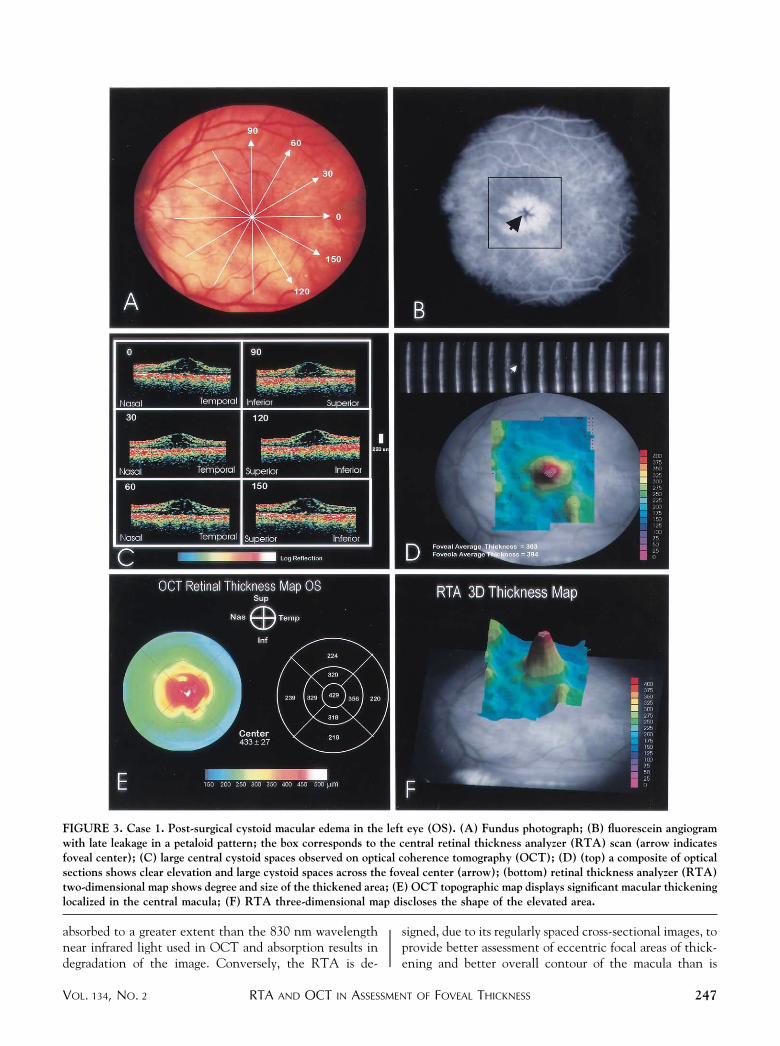
● CASE 1: An 86-year-old man was referred 7 months afterremoval of a cataract and implantation of an intraocularlens in the left eye (OS). Visual acuity measured 20/70 OSand slit lamp biomicroscopy revealed a thickened maculawith cystic changes in the fovea (Figure 3A). Fluoresceinangiography was typical for cystoid macular edema, withhyperfluorescence in the macula due to leakage and pool-ing of dye in a petaloid pattern (Figure 3B). Radial OCTscans illustrated localized thickening of the central maculawith large areas of low reflectivity corresponding to in-traretinal cystoid spaces (Figure 3C). The map generatedfrom six radial OCT scans showed a thickened region witha diameter of approximately 3 mm centered on the foveola,where the thickening was greatest and measured 433 � 27�m (Figure 3E). Foveolar average thickness measured 394�m with the RTA (Figure 3D). The contour of thethickened (red) area shown on the RTA map (Figures 3Dand 3F) appeared to correspond more closely to thecontour of the areas of leakage shown on fluoresceinangiography than did the contour of the thickened (red)area on the OCT map.
● CASE 2: A 63-year-old woman with bilateral prolifera-tive diabetic retinopathy and macular edema had previ-ously undergone scatter photocoagulation and focal lasertreatment OS. Her best-corrected visual acuity measured20/150 OS and biomicroscopy revealed residual NVEsuperonasal to the fovea and numerous laser scars, partic-ularly temporal to the fovea (Figure 4A). Fluoresceinangiography revealed an area of hyperfluorescence superiorto the fovea (Figure 4B). Six radial OCT scans displayedan enlarged foveal depression, an area of thickeningsuperonasal to the fovea, and an area of retinal thinningtemporal to the fovea (Figure 4C). The hyper-reflectivityof the retinal pigment epithelium band and choroidalshadowing in the 30 degrees cross section corresponded tohyperpigmented laser scars. The OCT map showed aregion of thickening superonasal to the fovea correspond-ing to the area of hyperfluorescence and a region ofdecreased thickness in the region of laser scars, temporal tothe fovea (Figure 4E). The OCT foveal center thicknessmeasured 142 � 38 �m. The two- and three-dimensionalRTA maps (Figures 4D and 4F) provided better topo-graphic resolution of the location and extent of areas ofthickened and thinned retina than the OCT map. Theautomated foveolar average thickness value calculated bythe RTA was higher than that calculated by the OCTbecause of the inferior displacement of foveal center on theRTA map caused by the eye’s eccentric fixation. Auto-mated RTA foveolar thickness was 247.9 �m and themanually calculated RTA foveolar thickness was 170 �m(Figure 4D). The three peaks of thickened retina measuredin excess of 300 �m (Figure 4F). The thickening demon-strated at the temporal edge of the map is an artifact due
AMERICAN JOURNAL OF OPHTHALMOLOGY244 AUGUST 2002
to degradation of the slit images by the laser scars in thisarea. The RTA software does not allow the operator toexclude portions of individual scans from the automatedanalysis.
● CASE 3: A 59-year-old man presented with cotton spotmacular edema (CSME) and nonproliferative diabeticretinopathy in the right eye (OD). Best-corrected visualacuity measured 20/100 OD. Circinate zones of yellow
deposits surrounding zones of intraretinal exudate centeredin the superior macula and extended into the fovea.Scattered microaneurysms and hemorrhages were noted onfundus examination (Figure 5A). Angiography disclosedfocal areas of leakage of fluorescein consistent with themicroaneurysms (Figure 5B). Six radial OCT scans showeddiffuse retinal thickening, which was most severe superi-orly and corresponded to the circinate zones of lipid-richexudation and angiographic leakage (Figure 5C). Areas of
FIGURE 2. Plots of optical coherence tomography (OCT) vs retinal thickness analyzer (RTA) retinal thickness values. (Top)foveal region. (Bottom) foveolar region.
RTA AND OCT IN ASSESSMENT OF FOVEAL THICKNESSVOL. 134, NO. 2 245
low and high reflectivity corresponded to sponge-likeretinal swelling in the outer retinal layers and hardexudates, respectively. The topographic map showed alarge area of severe thickening, most prominent in thesuperior macula and involving the foveal center, whereretinal thickness measured 340 �m (Figure 5E). The 16optical cross sections acquired with the central RTA scanallowed for an accurate imaging of the intraretinal exudateand its location relative to the fovea, which still demon-strated a physiologic pit. The slit images displayed retinalthickening associated with bright focal reflections corre-sponding to the hard exudates (Figure 5D, top). The two-and three-dimensional RTA maps (Figures 5D and 5F)delineated with high spatial resolution the borders of thethickened areas, which corresponded to the regions sur-rounded by the rings of deep retinal exudates and sparedthe foveal center, where the foveola thickness measured aslightly increased value (224.3 �m). The higher OCTvalues are most likely due to analysis of scans not inter-secting the exact foveal center.
DISCUSSION
IN THIS STUDY, WE PERFORMED RTA AND OCT ON THE SAME
day in a series of eyes with macular diseases, including eyesthat had been previously treated with surgery or laser. Inthe sample of eyes in which both tests were obtained, ourdata show that thickness measurements for the fovealregion provided by both mapping systems are very similar.Most of the differences observed between OCT and RTAfoveal thickness indices were below 50 �m and they couldtherefore be attributed almost entirely to the relativelyhigh variability in foveal thickness measurements occur-ring in eyes with maculopathy. Also, excessive intraretinalfluid results in distortion of the retinal surfaces decreasingresolution and increasing variability. This is a consequenceof the variable extent and location of retinal thickening ineyes with macular edema, as well as differences in the
dependencies of the two methodologies on patient fixation(dependency is greater for OCT) and differences in algo-rithms used to derive thickness values, which define interfacesbased on characteristics of the signal and generate thicknessvalues using different smoothing procedures.
We were able to obtain good-quality, informative OCTscans in more eyes than was the case for RTA. Failure toobtain an informative RTA scan was usually due todegradation of the RTA slit images by ocular mediaabnormalities, but in some cases it was due to scarring orexcessive intraretinal fluid near the inner or outer edge ofthe retina blurring the images so that the vitreoretinal orchorioretinal interface was not sufficiently resolved toallow reliable analysis. The greater resolution of OCThelps to provide accurate identification of the inner andouter surface of the retina even in the presence ofsuboptimal media or potentially confounding disease fea-tures such as cysts, exudates, or scarring in close proximityto one or both retinal surfaces. Automated RTA fovealand foveolar average measurements were obtainable inonly 27 of 55 eyes (49%), compared with 54 of 55 (98%)eyes for OCT. In seven additional eyes, it was possible tomake manual measurements of retinal thickness by visuallydetermining the inner and outer borders of the retina onthe RTA images, raising the percentage with obtainablemeasurements to 34 of 55 (62%). However, this manualmeasurement requires an experienced operator who isfamiliar with the appearance of the RTA slit images. In theone eye in which automated OCT measurement of thefovea and foveola were not obtained, the scan quality wasadequate to visually distinguish the borders of the retinaand make manual measurements, which also requires anexperienced operator who is familiar with the appearanceof the OCT optical cross sections. Media opacities atten-uating OCT incident light and decreasing the opticalreflectivity compromised intraretinal details, but in thisseries of patients did not significantly degrade the image ofthe boundaries of the neurosensory retina. The signalstrength and dynamic range of OCT, which surpass that ofRTA, allow retinal thickness measurements to be madeeven when media opacities or severe intraretinal pathologyare present. In these cases, although the retinal structuralchanges can affect the optical reflectivity (for example,superficial cystoid spaces reducing the inner band reflec-tivity or hard exudates being confused with the chorioreti-nal band), the examiner can manually measure thedistance of the two retinal interfaces directly on thecross-sectional image.
Operational and wavelength differences may contributeto the greater sensitivity of RTA to media problems.24,25
The RTA scan requires a 0.2-radian angle between inci-dent and reflected light beams, while the OCT scan doesnot; thus a larger clear space may be required for RTAimaging to permit passage of the incident and reflectedbeams. Also, the green light of the RTA, which has arelatively short wavelength (540 nm), is likely to be
TABLE 2. Agreement Between OCT and RTAMeasurements: Intraclass Correlation Coefficients*
Fovea Foveola
Raw values (n � 34 eyes) 0.89 0.94
Log-transformed values (n � 34 eyes) 0.86 0.94
Values 300 �m or less (n � 24 eyes) 0.49 0.83
Values over 300 �m (n � 10 eyes) 0.67 0.75
*Intraclass correlation coefficient computed assuming ran-
dom raters. Values assuming fixed raters were slightly higher
(.01) for all cases.
AMERICAN JOURNAL OF OPHTHALMOLOGY246 AUGUST 2002
absorbed to a greater extent than the 830 nm wavelengthnear infrared light used in OCT and absorption results indegradation of the image. Conversely, the RTA is de-
signed, due to its regularly spaced cross-sectional images, toprovide better assessment of eccentric focal areas of thick-ening and better overall contour of the macula than is
FIGURE 3. Case 1. Post-surgical cystoid macular edema in the left eye (OS). (A) Fundus photograph; (B) fluorescein angiogramwith late leakage in a petaloid pattern; the box corresponds to the central retinal thickness analyzer (RTA) scan (arrow indicatesfoveal center); (C) large central cystoid spaces observed on optical coherence tomography (OCT); (D) (top) a composite of opticalsections shows clear elevation and large cystoid spaces across the foveal center (arrow); (bottom) retinal thickness analyzer (RTA)two-dimensional map shows degree and size of the thickened area; (E) OCT topographic map displays significant macular thickeninglocalized in the central macula; (F) RTA three-dimensional map discloses the shape of the elevated area.
RTA AND OCT IN ASSESSMENT OF FOVEAL THICKNESSVOL. 134, NO. 2 247
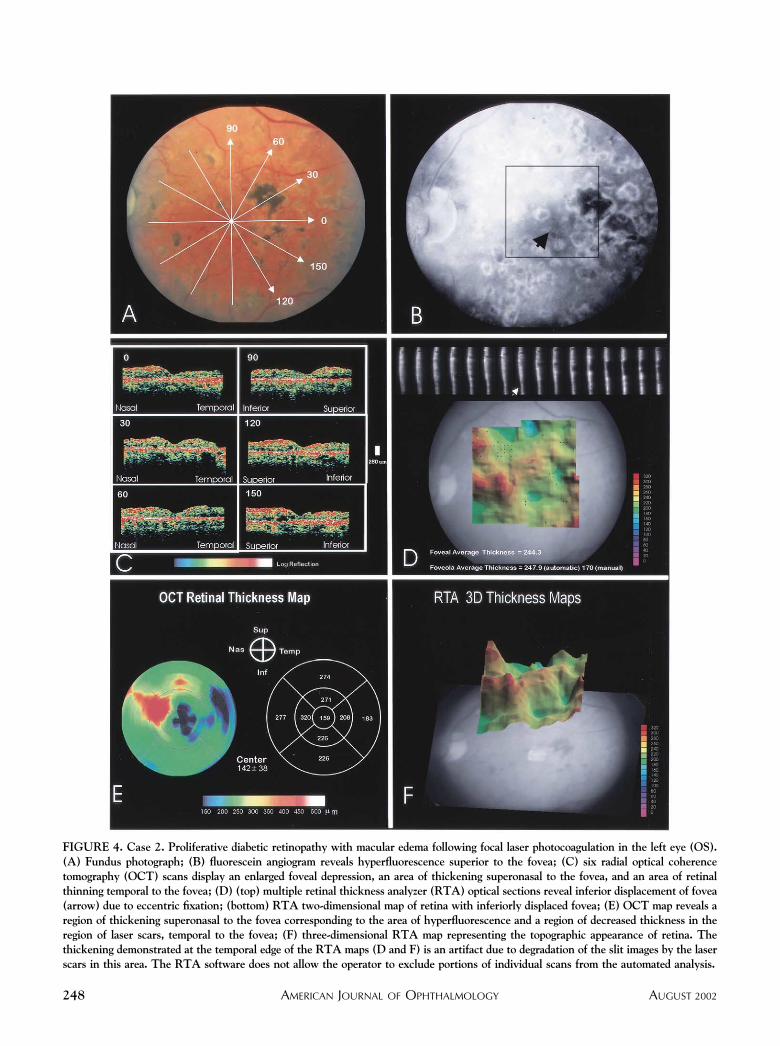
FIGURE 4. Case 2. Proliferative diabetic retinopathy with macular edema following focal laser photocoagulation in the left eye (OS).(A) Fundus photograph; (B) fluorescein angiogram reveals hyperfluorescence superior to the fovea; (C) six radial optical coherencetomography (OCT) scans display an enlarged foveal depression, an area of thickening superonasal to the fovea, and an area of retinalthinning temporal to the fovea; (D) (top) multiple retinal thickness analyzer (RTA) optical sections reveal inferior displacement of fovea(arrow) due to eccentric fixation; (bottom) RTA two-dimensional map of retina with inferiorly displaced fovea; (E) OCT map reveals aregion of thickening superonasal to the fovea corresponding to the area of hyperfluorescence and a region of decreased thickness in theregion of laser scars, temporal to the fovea; (F) three-dimensional RTA map representing the topographic appearance of retina. Thethickening demonstrated at the temporal edge of the RTA maps (D and F) is an artifact due to degradation of the slit images by the laserscars in this area. The RTA software does not allow the operator to exclude portions of individual scans from the automated analysis.
AMERICAN JOURNAL OF OPHTHALMOLOGY248 AUGUST 2002
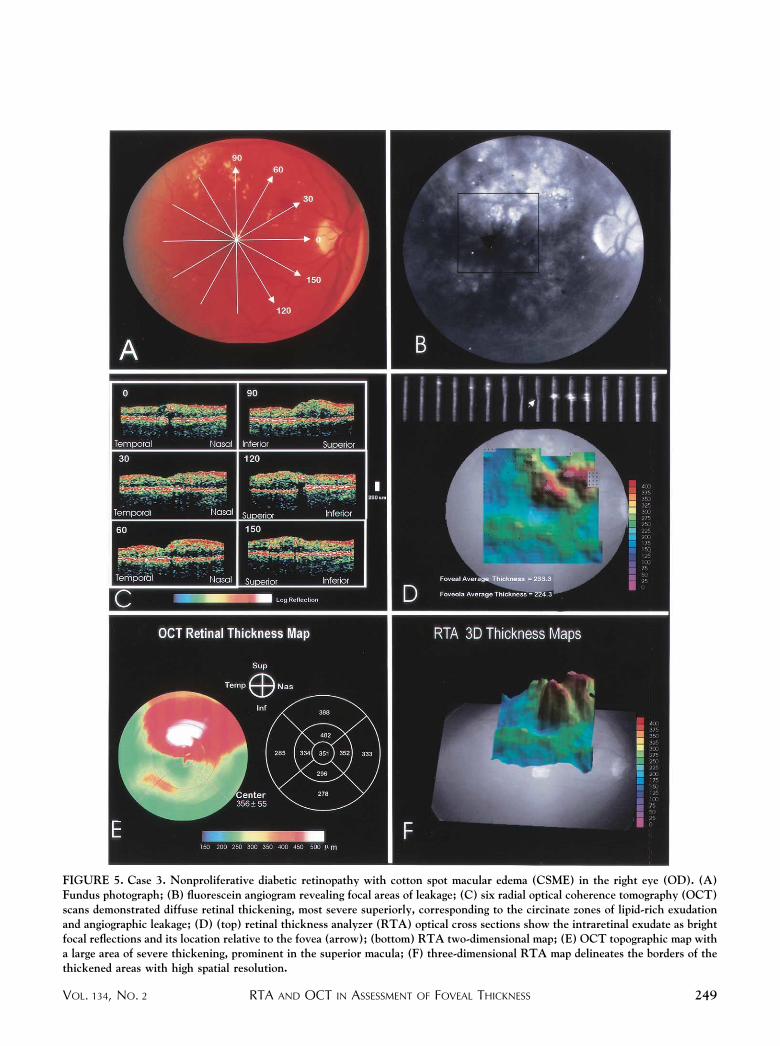
FIGURE 5. Case 3. Nonproliferative diabetic retinopathy with cotton spot macular edema (CSME) in the right eye (OD). (A)Fundus photograph; (B) fluorescein angiogram revealing focal areas of leakage; (C) six radial optical coherence tomography (OCT)scans demonstrated diffuse retinal thickening, most severe superiorly, corresponding to the circinate zones of lipid-rich exudationand angiographic leakage; (D) (top) retinal thickness analyzer (RTA) optical cross sections show the intraretinal exudate as brightfocal reflections and its location relative to the fovea (arrow); (bottom) RTA two-dimensional map; (E) OCT topographic map witha large area of severe thickening, prominent in the superior macula; (F) three-dimensional RTA map delineates the borders of thethickened areas with high spatial resolution.
RTA AND OCT IN ASSESSMENT OF FOVEAL THICKNESSVOL. 134, NO. 2 249
possible with radial scan pattern of OCT. Althoughquantification of the overall macular contour is beyond thescope of the current study, the case reports provide aqualitative illustration of this advantage of the RTA.
Reliable retinal thickness measurements can only beobtained from scans of adequate quality. The evaluation ofscan quality requires an experienced examiner who canidentify artifacts such as those due to cataract, extensivecystic changes, poor fixation, or inadequate adjustment offocus or brightness. This assessment of quality is alsorequired for the evaluation of test results of any othermedical technology: interpretation of visual fields, ultra-sound, x-rays, and even blood tests must be evaluated inlight of effects of other conditions. Therefore, we recom-mend careful operator monitoring of RTA and OCT scanquality to rule out possible falsely high or low readingsdisplayed on the retinal thickness maps. If artifacts com-promise the validity of the automated analysis of scans, itmay still be possible to perform a manual measurement ofthe retinal thickness, as long as the interfaces can beunequivocally distinguished on a degraded image by visualinspection.
The validity and reproducibility of measurements hasbeen established for both OCT and RTA. Our study foundthat the retinal thickness measures obtained by the twoinstruments were very similar, particularly for retinas withmild-to-moderate edema (�300 �m). Although the RTAhas the advantages of rapid scanning of a large area offundus by multiple optical cross sectioning in one measure-ment and a short acquisition time, thereby minimizingartifacts caused by eye motion and allowing identificationof the location of each scan on the fundus image, its utilityis limited by its sensitivity to media opacities. The OCThas the advantages of greater resolution and robustness tothe presence of ocular media opacities, but due to its longeracquisition time and resultant difficulty with assessingfixation, its utility may be limited in performing measure-ments in the same locations over time.
The choice of imaging instruments for a particular studydepends on the characteristics of disease that need to bedescribed (for example, overall contour of the macula vs asingle summary measure in a defined region) and on thelikely ocular comorbidities in the study population ofinterest. Regardless of the instrument used, we believe thequantitative assessment of retinal thickening is a valuabletool and an important advance for studies of maculardisease and its treatment.
REFERENCES
1. Early Treatment Diabetic Retinopathy. Study researchgroup. Photocoagulation for diabetic macular edema. EarlyTreatment Diabetic Retinopathy Study report number 1.Arch Ophthalmol 1985;103:1796–1806.
2. Kraff MC, Sanders DR, Jampol LM, Peyman GA, Lieberman
HL. Prophylaxis of pseudophakic cystoid macular edemawith topical indomethacin. Ophthalmology 1982;89:885–890.
3. Flach AJ, Dolan BJ, Irvine AR. Effectiveness of ketorolactromethamine 0.5% ophthalmic solution for chronic aphakicand pseudophakic cystoid macular edema. Am J Ophthalmol1987;103:479–486.
4. Flach AJ, Stegman RC, Graham J, Kruger LP. Prophylaxis ofaphakic cystoid macular edema without corticosteroids. Apaired-comparison, placebo-controlled double-masked study.Ophthalmology 1990;97:1253–1258.
5. Hee MR, Puliafito CA, Wong C, et al. Quantitative assess-ment of macular edema with optical coherence tomography.Arch Ophthalmol 1995;113:1019–1029.
6. Zeimer R, Shahidi M, Mori M, et al. A new method for rapidmapping of the retinal thickness at the posterior pole. InvestOphthalmol Vis Sci 1996;37:1994–2001.
7. Gieser JP, Rusin MM, Mori M, et al. Clinical assessment ofthe macula by retinal topography and thickness mapping.Am J Ophthalmol 1997;124:648–660.
8. Hee MR, Puliafito CA, Duker JS, et al. Topography ofdiabetic macular edema with optical coherence tomography.Ophthalmology 1998;105:360–370.
9. Asrani S, Zeimer R, Goldberg MF, Zou S. Application ofrapid scanning retinal thickness analysis in retinal diseases.Ophthalmology 1997;104:1145–1151.
10. Asrani S, Zou S, d’Anna S, et al. Noninvasive mapping ofthe normal retinal thickness at the posterior pole. Ophthal-mology 1999;106:269–273.
11. Chauhan DS, Marshall J. The interpretation of opticalcoherence tomography images of the retina. Invest Ophthal-mol Vis Sci 1999;40:2332–2342.
12. Massin P, Vicaut E, Haouchine B, et al. Reproducibility ofretinal mapping using optical coherence tomography. ArchOphthalmol 2001;119:1135–1142.
13. Konno S, Akiba J, Yoshida A. Retinal thickness measure-ments with optical coherence tomography and the scanningretinal thickness analyzer. Retina 2001;21:57–61.
14. Suzuma K, Kita M, Yamana T, et al. Quantitative assessmentof macular edema with retinal vein occlusion. Am J Oph-thalmol 1998;126:409–416.
15. Yasukawa T, Kiryu J, Tsujikawa A, et al. Quantitativeanalysis of foveal retinal thickness in diabetic retinopathywith the scanning retinal thickness analyzer. Retina 1998;18:150–155.
16. Antcliff RJ, Stanford MR, Chauhan DS, et al. Comparisonbetween optical coherence tomography and fundus fluores-cein angiography for the detection of cystoid macular edemain patients with uveitis. Ophthalmology 2000;107:593–599.
17. Sourdille P, Santiago PY. Optical coherence tomography ofmacular thickness after cataract surgery. J Cataract RefractSurg 1999;25:256–261.
18. Otani T, Kishi S, Maruyama Y. Patterns of diabetic macularedema with optical coherence tomography. Am J Ophthal-mol 1999;127:688–693.
19. Giovannini A, Amato G, Mariotti C, Scassellati-SforzoliniB. Optical coherence tomography findings in diabetic mac-ular edema before and after vitrectomy. Ophthalmic SurgLasers 2000;31:187–191.
20. Hirakawa H, Iijima H, Gohdo T, Tsukahara S. Opticalcoherence tomography of cystoid macular edema associatedwith retinitis pigmentosa. Am J Ophthalmol 1999;128:185–191.
21. Hee MR, Izatt JA, Swanson EA, et al. Optical coherencetomography of the human retina. Arch Ophthalmol 1995;113:325–332.
AMERICAN JOURNAL OF OPHTHALMOLOGY250 AUGUST 2002

22. Shrout PE, Fleiss JL. Intraclass correlations: uses in assessingrater reliability. Psychol Bull 1979:428–429.
23. Winer BJ. Statistical principles in experimental design. NewYork: McGraw-Hill, 1962.
24. Oshima Y, Emi K, Yamanishi S, Motokura M. Quantitativeassessment of macular thickness in normal subjects and
patients with diabetic retinopathy by scanning retinal thick-ness analyser. Br J Ophthalmol 1999;83:54–61.
25. Weinberger D, Axer-Siegel R, Landau D, Yasur Y. Retinalthickness variation in the diabetic patient measured by theretinal thickness analyser. Br J Ophthalmol 1998;82:1003–1006.
RTA AND OCT IN ASSESSMENT OF FOVEAL THICKNESSVOL. 134, NO. 2 251
Related Documents