ORIGINAL PAPER Comparison between regression and ANN models for relationship of soil properties and electrical resistivity Fahad Irfan Siddiqui & Dur Muhammad Pathan & Syed Baharom Azhar Bin Syed Osman & Munawar Ali Pinjaro & Safiullah Memon Received: 20 April 2014 /Accepted: 16 September 2014 # Saudi Society for Geosciences 2014 Abstract Precise determination of engineering properties of soil is essential for proper design and successful construction of any structure. The conventional methods for determination of engineering properties are invasive, costly, and time-con- suming. Geoelectrical survey is a very attractive tool for delineating subsurface properties without soil disturbance. Proper correlations of various soil parameters with electrical resistivity of soil will bridge the gap between geotechnical and geophysical engineering and also enable geotechnical engi- neers to estimate geotechnical parameters from electrical re- sistivity data. The regression models of relationship between electrical resistivity and various soil properties used in the current research for the purpose of comparison with artificial neural network (ANN) models were adopted from the work of Siddiqui and Osman (Environ Earth Sci 70:259–26, 2013). In order to obtain better relationships, ANN modeling was done using same data as regression analysis. The neural network models were trained using single input (electrical resistivity) and single output (i.e., moisture content, plasticity index, and friction angle). Twenty (20) multilayer feedforward (MLFF) networks were developed for each properties, ten (10) each for two different learning algorithms, Levenberg-Marquardt (LM) and scaled conjugate gradient (SCG). The numbers of neurons in hidden layer were experimented from 1 to 10. Best network with particular learning algorithm and optimum num- ber of neuron in hidden layer presenting lowest root mean square error (RMSE) was selected for prediction of various soil properties. ANN models show better prediction results for all soil properties. Keywords Artificial neural network . Geophysics . Electrical resistivity . Regression . Soil properties Introduction Stability of natural and engineered structures, such as build- ing, roads, tunnels, slopes, bridges, and dams, is the most vital aspect of geotechnical engineering. Precise determination of engineering properties of soil is essential for proper design and successful construction of any structure (Cosenza et al. 2006). The conventional method of obtaining these engineering pa- rameters is laboratory investigations performed on soil sam- ples acquired from site/field through borehole sampling. However, bore hole sampling is in general time-consuming and expensive. Soil properties are subjected to high spatial and temporal variations. For accurate assessment of soil prop- erties, high-density sampling will be required, but borehole sampling would be very costly and time-consuming option in such condition (Pozdnyakova and Pozdnyakova 2002). Geophysical methods have become increasingly practiced in engineering site characterization as being noninvasive, non- destructive, rapid, and cost-effective method. Among these methods, geoelectrical survey is a very attractive tool for F. I. Siddiqui (*) : M. A. Pinjaro : S. Memon Department of Mining Engineering, Mehran University of Engineering and Technology, Jamshoro, Pakistan 76062 e-mail: [email protected] M. A. Pinjaro e-mail: [email protected] S. Memon e-mail: [email protected] D. M. Pathan Department of Mechanical Engineering, Mehran University of Engineering and Technology, Jamshoro, Pakistan 76062 e-mail: [email protected] S. B. A. B. S. Osman Civil Engineering Department, University Technology PETRONAS, Seri Iskandar, Tronoh, Malaysia e-mail: [email protected] Arab J Geosci DOI 10.1007/s12517-014-1637-y

Welcome message from author
This document is posted to help you gain knowledge. Please leave a comment to let me know what you think about it! Share it to your friends and learn new things together.
Transcript
ORIGINAL PAPER
Comparison between regression and ANNmodels for relationshipof soil properties and electrical resistivity
Fahad Irfan Siddiqui & Dur Muhammad Pathan &
Syed Baharom Azhar Bin Syed Osman &
Munawar Ali Pinjaro & Safiullah Memon
Received: 20 April 2014 /Accepted: 16 September 2014# Saudi Society for Geosciences 2014
Abstract Precise determination of engineering properties ofsoil is essential for proper design and successful constructionof any structure. The conventional methods for determinationof engineering properties are invasive, costly, and time-con-suming. Geoelectrical survey is a very attractive tool fordelineating subsurface properties without soil disturbance.Proper correlations of various soil parameters with electricalresistivity of soil will bridge the gap between geotechnical andgeophysical engineering and also enable geotechnical engi-neers to estimate geotechnical parameters from electrical re-sistivity data. The regression models of relationship betweenelectrical resistivity and various soil properties used in thecurrent research for the purpose of comparison with artificialneural network (ANN) models were adopted from the work ofSiddiqui and Osman (Environ Earth Sci 70:259–26, 2013). Inorder to obtain better relationships, ANN modeling was doneusing same data as regression analysis. The neural networkmodels were trained using single input (electrical resistivity)and single output (i.e., moisture content, plasticity index, and
friction angle). Twenty (20) multilayer feedforward (MLFF)networks were developed for each properties, ten (10) each fortwo different learning algorithms, Levenberg-Marquardt(LM) and scaled conjugate gradient (SCG). The numbers ofneurons in hidden layer were experimented from 1 to 10. Bestnetwork with particular learning algorithm and optimum num-ber of neuron in hidden layer presenting lowest root meansquare error (RMSE) was selected for prediction of varioussoil properties. ANNmodels show better prediction results forall soil properties.
Keywords Artificial neural network . Geophysics . Electricalresistivity . Regression . Soil properties
Introduction
Stability of natural and engineered structures, such as build-ing, roads, tunnels, slopes, bridges, and dams, is the most vitalaspect of geotechnical engineering. Precise determination ofengineering properties of soil is essential for proper design andsuccessful construction of any structure (Cosenza et al. 2006).The conventional method of obtaining these engineering pa-rameters is laboratory investigations performed on soil sam-ples acquired from site/field through borehole sampling.However, bore hole sampling is in general time-consumingand expensive. Soil properties are subjected to high spatialand temporal variations. For accurate assessment of soil prop-erties, high-density sampling will be required, but boreholesampling would be very costly and time-consuming option insuch condition (Pozdnyakova and Pozdnyakova 2002).Geophysical methods have become increasingly practiced inengineering site characterization as being noninvasive, non-destructive, rapid, and cost-effective method. Among thesemethods, geoelectrical survey is a very attractive tool for
F. I. Siddiqui (*) :M. A. Pinjaro : S. MemonDepartment of Mining Engineering, Mehran University ofEngineering and Technology, Jamshoro, Pakistan 76062e-mail: [email protected]
M. A. Pinjaroe-mail: [email protected]
S. Memone-mail: [email protected]
D. M. PathanDepartment of Mechanical Engineering, Mehran University ofEngineering and Technology, Jamshoro, Pakistan 76062e-mail: [email protected]
S. B. A. B. S. OsmanCivil Engineering Department, University Technology PETRONAS,Seri Iskandar, Tronoh, Malaysiae-mail: [email protected]
Arab J GeosciDOI 10.1007/s12517-014-1637-y
delineating subsurface properties without soil disturbance(Samouëlian et al. 2005).
The phenomenon of electrical resistivity in soils and itsrelationship with other soil properties have been investigatedthrough various studies. Water content and electrical resistiv-ity of soil have been successfully correlated by various re-searchers (Cosenza et al. 2006; Kalinski and Kelly 1993;Ozcep et al. 2009, 2010; Pozdnyakov et al. 2006;Pozdnyakova and Pozdnyakova 2002; Schwartz et al. 2008;Siddiqui and Osman 2012a, b, 2013; Son et al. 2009; Yoonand Park 2001). The obtained correlation models showednonlinear relationship between soil moisture and resistivity.
The knowledge of electrical resistivity is also used todetermine thermal resistivity of soil for installation ofunderground electrical transmission lines (Erzin et al.2010; Sreedeep et al. 2005). Some researchers evaluatedhydraulic conductivity of compacted clay liners usingelectrical resistivity method (Abu-Hassanein et al.1996; Kalinski and Kelly 1994; McCarter 1984).
Electrical resistivity survey also used for investigatingchemical weathering index (CWI) (Son et al. 2009), soilmoisture determination for agricultural purposes(Bristow et al. 2001; Nijland et al. 2010), structuralheterogeneity of soil (Séger et al. 2009), foundationstructure of old buildings (Abu-Zeid et al. 2006), foun-dation stabilization work (Santarato et al. 2011), detect-ing water seepage through earth dam (Panthulu et al.2001; Sjödahl et al. 2008), and groundwater movement(Arora and Ahmed 2011; Majumdar et al. 2000).
Applications of electrical resistivity survey in evalu-ation of geotechnical properties of soil have been dem-onstrated by many researchers (Braga et al. 1999;Cosenza et al. 2006; Giao et al. 2003; Liu et al. 2008;Oh and Sun 2008; Siddiqui and Osman 2013). Siddiquiand Osman (2013) conducted preliminary experimentsto establish the relationship between electrical resistivityand various soil parameters of naturally occurring soilsaround Universiti Teknologi, Petronas, Malaysia. A totalof 79 soil samples were obtained from 10 boreholes.From grain size distribution analysis, it was found that43 soil samples were silty sand and 36 soil sampleswere course-grained sandy soils. The correlations be-tween electrical resistivity and various properties of soilsamples were evaluated using least-square regressionmethod. Regression analysis has shown weak correla-tions between electrical resistivity and soil properties.
The geotechnical properties of soil and rock have avery complex and nonlinear relationship with each otherdue to heterogeneity and anisotropy. In order to under-stand the complex behavior and spatial variability ofthese materials, traditional form relationship modelsmay not provide reliable result. In such condition, arti-ficial neural network (ANN) could play an importantrole in establishing reliable relationship models as it isnonlinear, flexible, self-learning, and self-adaptive.Shahin et al. (2001) thoroughly reviewed the published
.
.
.
ω1
ω2
ω3
ωn b
ϕ
X1
X2
X3
Xn
y
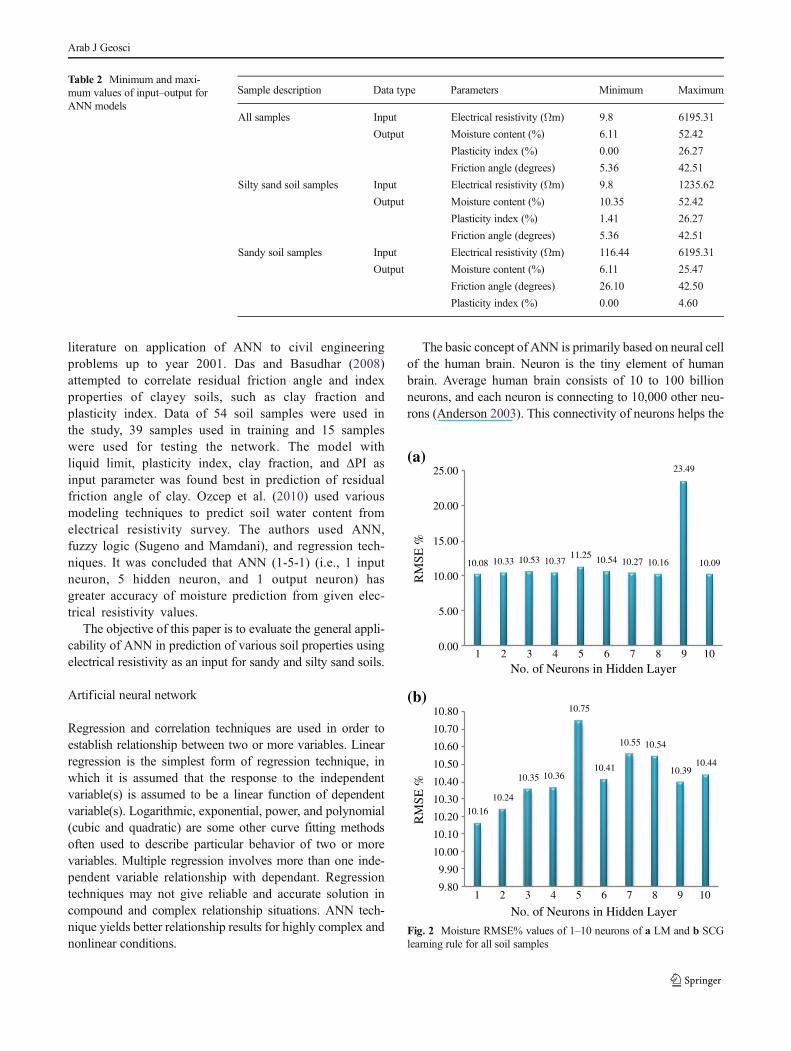
Fig. 1 Basic architecture of feedforward multilayer perceptron (MLP)neural network
Table 1 Summary of simple regression equations after Siddiqui and Osman (2013)
Soil properties Sample description Equations Equation no. Determinationcoefficient (R2)
Moisture content (%) All soil samples 0.9756ρ−0.263 Eq. 2 0.57
Silty sand samples 0.6261ρ−0.156 Eq. 3 0.26
Sandy samples 0.1954e−2E-04 ρ Eq. 4 0.50
Friction angle (o) All soil samples 3.9722 ln(ρ)+1.9778 Eq. 5 0.30
Silty sand samples 3E-07ρ2-0.0017ρ+34.312 Eq. 6 0.05
Sandy samples 10.574ρ0.0891 Eq. 7 0.04
Plasticity index (%) All soil samples −3.276 ln(ρ)+26.329 Eq. 8 0.42
Silty sand samples 13.731e−0.001ρ Eq. 9 0.15
Sandy samples −0.707 ln(ρ)+6.4154 Eq. 10 0.25
ρ=electrical resistivity (Ohm.m)
Arab J Geosci
literature on application of ANN to civil engineeringproblems up to year 2001. Das and Basudhar (2008)attempted to correlate residual friction angle and indexproperties of clayey soils, such as clay fraction andplasticity index. Data of 54 soil samples were used inthe study, 39 samples used in training and 15 sampleswere used for testing the network. The model withliquid limit, plasticity index, clay fraction, and ΔPI asinput parameter was found best in prediction of residualfriction angle of clay. Ozcep et al. (2010) used variousmodeling techniques to predict soil water content fromelectrical resistivity survey. The authors used ANN,fuzzy logic (Sugeno and Mamdani), and regression tech-niques. It was concluded that ANN (1-5-1) (i.e., 1 inputneuron, 5 hidden neuron, and 1 output neuron) hasgreater accuracy of moisture prediction from given elec-trical resistivity values.
The objective of this paper is to evaluate the general appli-cability of ANN in prediction of various soil properties usingelectrical resistivity as an input for sandy and silty sand soils.
Artificial neural network
Regression and correlation techniques are used in order toestablish relationship between two or more variables. Linearregression is the simplest form of regression technique, inwhich it is assumed that the response to the independentvariable(s) is assumed to be a linear function of dependentvariable(s). Logarithmic, exponential, power, and polynomial(cubic and quadratic) are some other curve fitting methodsoften used to describe particular behavior of two or morevariables. Multiple regression involves more than one inde-pendent variable relationship with dependant. Regressiontechniques may not give reliable and accurate solution incompound and complex relationship situations. ANN tech-nique yields better relationship results for highly complex andnonlinear conditions.
The basic concept of ANN is primarily based on neural cellof the human brain. Neuron is the tiny element of humanbrain. Average human brain consists of 10 to 100 billionneurons, and each neuron is connecting to 10,000 other neu-rons (Anderson 2003). This connectivity of neurons helps the
Table 2 Minimum and maxi-mum values of input–output forANN models
Sample description Data type Parameters Minimum Maximum
All samples Input Electrical resistivity (Ωm) 9.8 6195.31
Output Moisture content (%) 6.11 52.42
Plasticity index (%) 0.00 26.27
Friction angle (degrees) 5.36 42.51
Silty sand soil samples Input Electrical resistivity (Ωm) 9.8 1235.62
Output Moisture content (%) 10.35 52.42
Plasticity index (%) 1.41 26.27
Friction angle (degrees) 5.36 42.51
Sandy soil samples Input Electrical resistivity (Ωm) 116.44 6195.31
Output Moisture content (%) 6.11 25.47
Friction angle (degrees) 26.10 42.50
Plasticity index (%) 0.00 4.60
10.08 10.33 10.53 10.3711.25 10.54 10.27 10.16
23.49
10.09
0.00
5.00
10.00
15.00
20.00
25.00
1 2 3 4 5 6 7 8 9 10
RM
SE %
No. of Neurons in Hidden Layer
(a)
10.16
10.24
10.35 10.36
10.75
10.41
10.55 10.54
10.3910.44
9.80
9.90
10.00
10.10
10.20
10.30
10.40
10.50
10.60
10.70
10.80
1 2 3 4 5 6 7 8 9 10
RM
SE %
No. of Neurons in Hidden Layer
(b)
Fig. 2 Moisture RMSE% values of 1–10 neurons of a LM and b SCGlearning rule for all soil samples
Arab J Geosci
brain to perform difficult tasks, for instance complex patternrecognitions, solving compound equations etc. A brain neuronhas typically three parts: an input branch (dendrites), cell body(soma), and output (axon). The axon of one cell connects tothe dendrites of another through a synapse. The neuron is amany-inputs or one-output unit. The output can be eitherexcited or not excited (Hassoun 1995). Neurons in the brainhave a great ability to learn from experience withoutpredefined knowledge.
ANNs are nonlinear data-driven self-adaptivemodels as opposed to the traditional correlation andregression models. ANN models can identify and learncorrelated patterns between input data and correspond-ing target values. After training, ANNs can be used topredict outcomes of new independent input data.ANNs mimic the learning process of the human brainand can process problems involving nonlinear andcomplex data even if the data are imprecise and noisy(Jha 2007).
The architecture of ANN consists of three layers: aninput layer, an output layer, and one or more hiddenlayers. The communication between neurons is through
bias-weighted functions. The bias weight tends to nar-row down the difference between the actual targetvalues and output produced by ANN model in eachiteration cycle called epoch. Each neuron is connectedto all the neurons in the next layer. Data is provided toneural network through input layer. The output layercontains the output produced by network as per inputprovided. The hidden layers help the network to delin-eate the complex relationship between inputs and outputs.This ANN architecture is usually known as a fully intercon-nected multilayer feedforward (MLFF). Mathematically, itcan be written as follow:
y ¼ φXn
i¼1wixi þ b
� �¼ φ WTX þ b
� � ð1Þ
where W denotes the vector of weights, X is the vector ofinputs, b is the bias, and φ is the activation function. Inaddition, there is also a bias, which is only connected toneurons in the hidden and output layers, with modifiableweighted connections (Erzin et al. 2010). The basic architec-ture of MLFF is shown in Fig. 1.
(a)
10.96
11.39
10.30
10.75
11.45
11.9712.33 12.21
11.18
12.25
9.00
9.50
10.00
10.50
11.00
11.50
12.00
12.50
1 2 3 4 5 6 7 8 9 10
RM
SE %
RM
SE %
No. of Neurons in Hidden Layer
(b)
10.4011.09 11.16 10.91
12.45
10.84 11.27 10.77
15.3514.48
0.00
2.00
4.00
6.00
8.00
10.00
12.00
14.00
16.00
18.00
1 2 3 4 5 6 7 8 9 10
No. of Neurons in Hidden Layer
Fig. 3 Moisture RMSE% values of 1–10 neurons of a LM and b SCGlearning rule for silty sand soil samples
(a)
3.86 4.283.61 3.74 3.63 3.89 4.06 3.81 3.82
10.02
0.00
2.00
4.00
6.00
8.00
10.00
12.00
1 2 3 4 5 6 7 8 9 10
No. of Neurons in Hidden Layer
(b)4.12
3.683.64
3.72 3.743.68
4.04
3.30
3.40
3.50
3.60
3.70
3.80
3.90
4.00
4.10
4.20
1 2 3 4 5 6 7 8 9 10
RM
SE %
RM
SE %
No. of Neurons in Hidden Layer
Fig. 4 Moisture RMSE% values of 1–10 neurons of a LM and b SCGlearning rule for sandy soil samples
Arab J Geosci
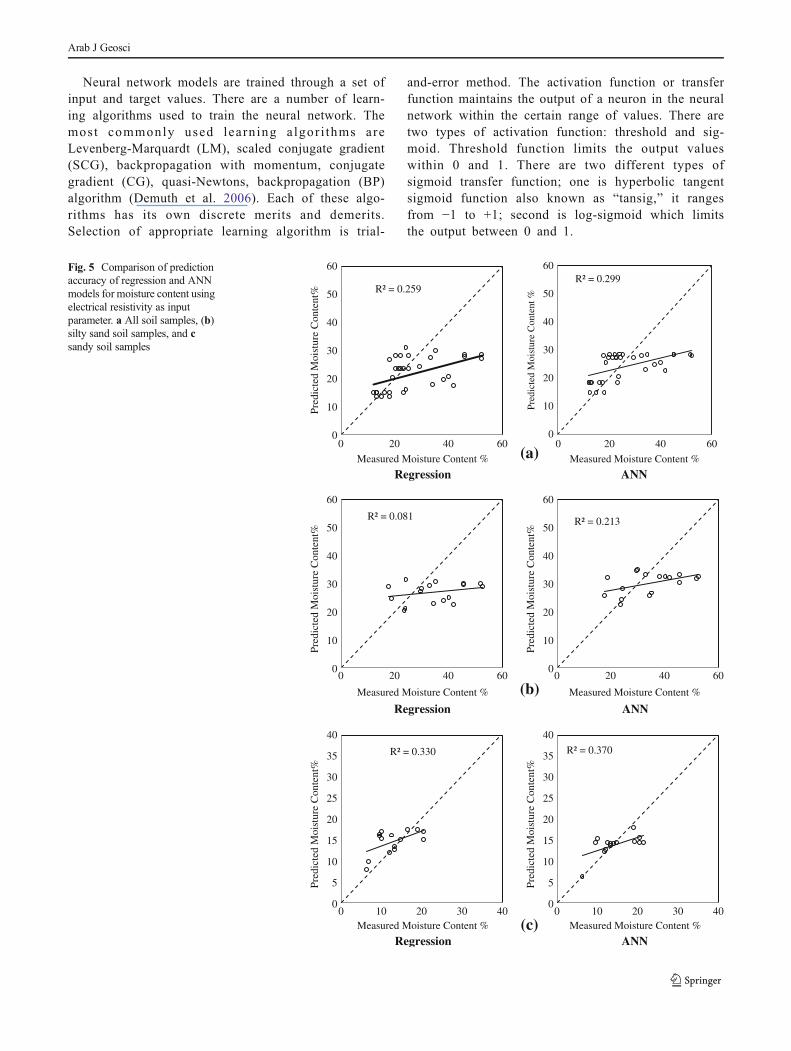
Neural network models are trained through a set ofinput and target values. There are a number of learn-ing algorithms used to train the neural network. Themost commonly used learn ing algor i thms areLevenberg-Marquardt (LM), scaled conjugate gradient(SCG), backpropagation with momentum, conjugategradient (CG), quasi-Newtons, backpropagation (BP)algorithm (Demuth et al. 2006). Each of these algo-rithms has its own discrete merits and demerits.Selection of appropriate learning algorithm is trial-
and-error method. The activation function or transferfunction maintains the output of a neuron in the neuralnetwork within the certain range of values. There aretwo types of activation function: threshold and sig-moid. Threshold function limits the output valueswithin 0 and 1. There are two different types ofsigmoid transfer function; one is hyperbolic tangentsigmoid function also known as “tansig,” it rangesfrom −1 to +1; second is log-sigmoid which limitsthe output between 0 and 1.
Regression ANN
Regression ANN
Regression ANN
R² = 0.081
0
10
20
30
40
50
60
0 20 40 60
Measured Moisture Content %
R² = 0.259
0
10
20
30
40
50
60
0 20 40 60
Measured Moisture Content %
R² = 0.299
0
10
20
30
40
50
60
0 20 40 60
Pred
icte
d M
oist
ure
Con
tent
%
Measured Moisture Content %
R² = 0.213
0
10
20
30
40
50
60
0 20 40 60
Pred
icte
d M
oist
ure
Con
tent
%
Measured Moisture Content %
R² = 0.330
0
5
10
15
20
25
30
35
40
0 10 20 30 40Measured Moisture Content %
R² = 0.370
0
5
10
15
20
25
30
35
40
0 10 20 30 40
Pred
icte
d M
oist
ure
Con
tent
%
Measured Moisture Content %
(a)
(b)
(c)
Pred
icte
d M
oist
ure
Con
tent
%Pr
edic
ted
Moi
stur
e C
onte
nt%
Pred
icte
d M
oist
ure
Con
tent
%
Fig. 5 Comparison of predictionaccuracy of regression and ANNmodels for moisture content usingelectrical resistivity as inputparameter. a All soil samples, (b)silty sand soil samples, and csandy soil samples
Arab J Geosci
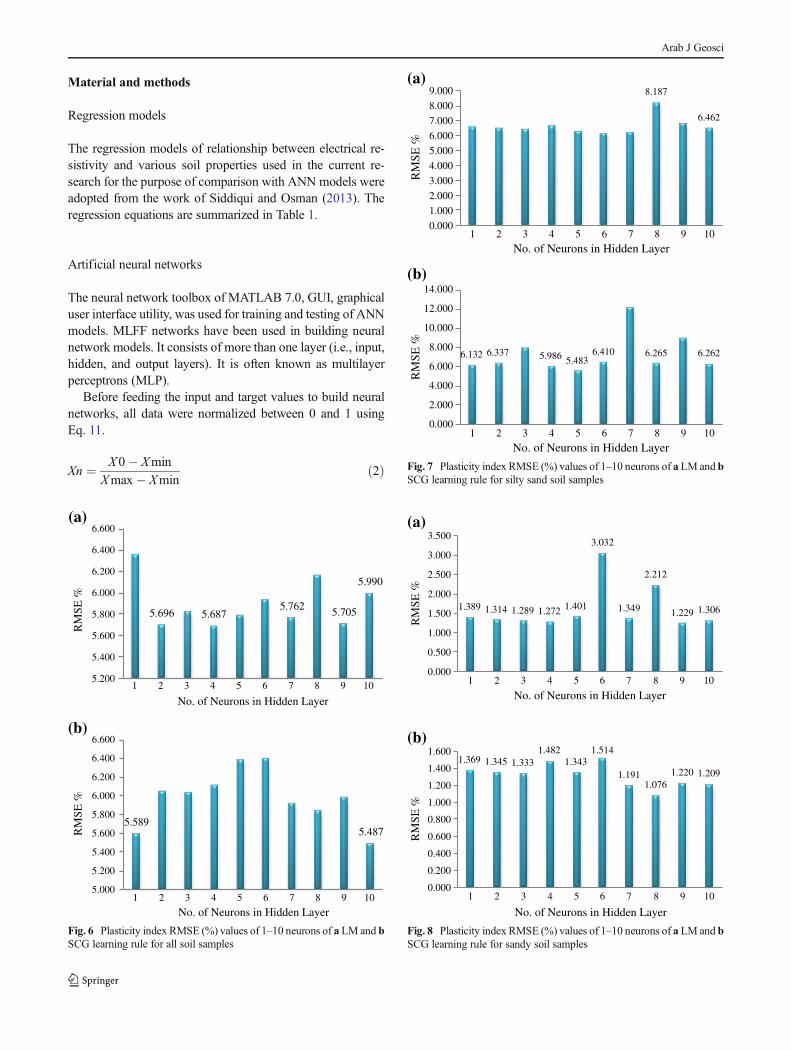
Material and methods
Regression models
The regression models of relationship between electrical re-sistivity and various soil properties used in the current re-search for the purpose of comparison with ANN models wereadopted from the work of Siddiqui and Osman (2013). Theregression equations are summarized in Table 1.
Artificial neural networks
The neural network toolbox of MATLAB 7.0, GUI, graphicaluser interface utility, was used for training and testing of ANNmodels. MLFF networks have been used in building neuralnetwork models. It consists of more than one layer (i.e., input,hidden, and output layers). It is often known as multilayerperceptrons (MLP).
Before feeding the input and target values to build neuralnetworks, all data were normalized between 0 and 1 usingEq. 11.
Xn ¼ X0� Xmin
Xmax� Xminð2Þ
(a)
5.696 5.6875.762 5.705
5.990
5.200
5.400
5.600
5.800
6.000
6.200
6.400
6.600
1 2 3 4 5 6 7 8 9 10
No. of Neurons in Hidden Layer
(b)
5.5895.487
5.000
5.200
5.400
5.600
5.800
6.000
6.200
6.400
6.600
1 2 3 4 5 6 7 8 9 10
RM
SE %
RM
SE %
No. of Neurons in Hidden Layer
Fig. 6 Plasticity index RMSE (%) values of 1–10 neurons of a LM and bSCG learning rule for all soil samples
(a)8.187
6.462
0.000
1.000
2.000
3.000
4.000
5.000
6.000
7.000
8.000
9.000
1 2 3 4 5 6 7 8 9 10
RM
SE %
No. of Neurons in Hidden Layer
(b)
6.132 6.337 5.986 5.4836.410 6.265 6.262
0.000
2.000
4.000
6.000
8.000
10.000
12.000
14.000
1 2 3 4 5 6 7 8 9 10
RM
SE %
No. of Neurons in Hidden Layer
Fig. 7 Plasticity index RMSE (%) values of 1–10 neurons of a LM and bSCG learning rule for silty sand soil samples
(a)
1.389 1.314 1.289 1.272 1.401
3.032
1.349
2.212
1.229 1.306
0.000
0.500
1.000
1.500
2.000
2.500
3.000
3.500
1 2 3 4 5 6 7 8 9 10
RM
SE %
No. of Neurons in Hidden Layer
(b)1.369 1.345 1.333
1.4821.343
1.514
1.1911.076
1.220 1.209
0.000
0.200
0.400
0.600
0.800
1.000
1.200
1.400
1.600
1 2 3 4 5 6 7 8 9 10
RM
SE %
No. of Neurons in Hidden Layer
Fig. 8 Plasticity index RMSE (%) values of 1–10 neurons of a LM and bSCG learning rule for sandy soil samples
Arab J Geosci
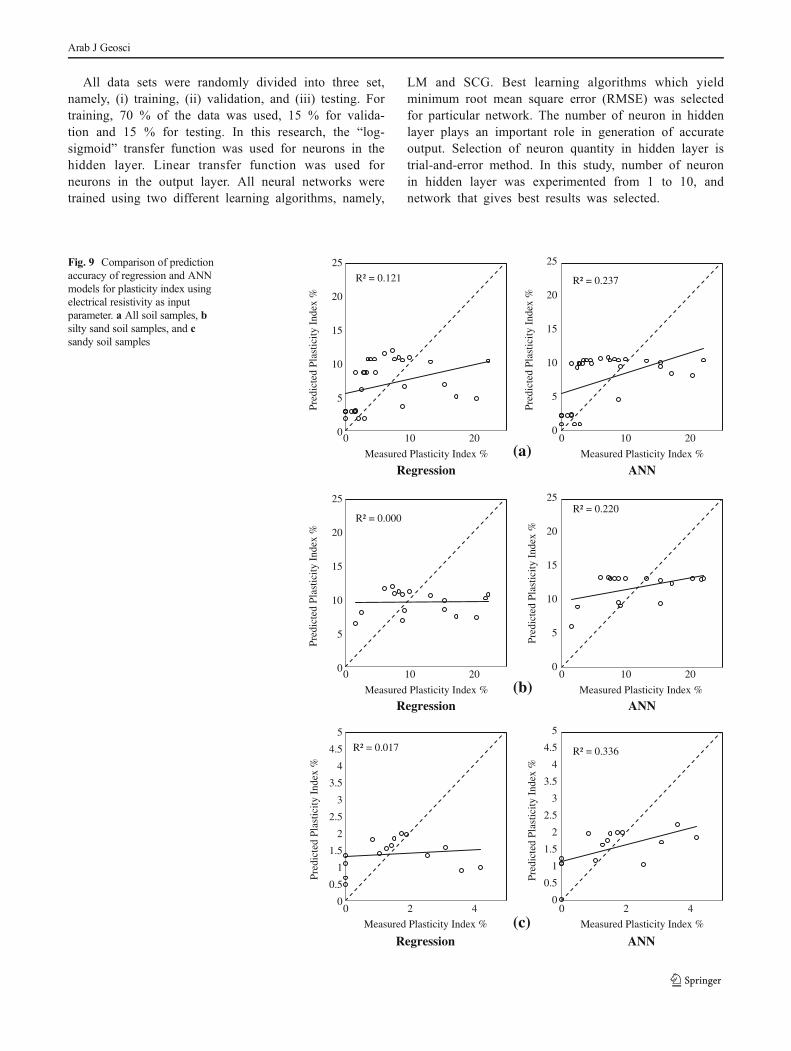
All data sets were randomly divided into three set,namely, (i) training, (ii) validation, and (iii) testing. Fortraining, 70 % of the data was used, 15 % for valida-tion and 15 % for testing. In this research, the “log-sigmoid” transfer function was used for neurons in thehidden layer. Linear transfer function was used forneurons in the output layer. All neural networks weretrained using two different learning algorithms, namely,
LM and SCG. Best learning algorithms which yieldminimum root mean square error (RMSE) was selectedfor particular network. The number of neuron in hiddenlayer plays an important role in generation of accurateoutput. Selection of neuron quantity in hidden layer istrial-and-error method. In this study, number of neuronin hidden layer was experimented from 1 to 10, andnetwork that gives best results was selected.
(a)
(b)
(c)
Regression ANN
Regression ANN
Regression ANN
R² = 0.121
0
5
10
15
20
25
0 10 20
Pred
icte
d Pl
astic
ity I
ndex
%
Measured Plasticity Index %
R² = 0.000
0
5
10
15
20
25
0 10 20
Pred
icte
d Pl
astic
ity I
ndex
%
Measured Plasticity Index %
R² = 0.017
0
0.5
1
1.5
2
2.5
3
3.5
4
4.5
5
0 2 4
Pred
icte
d Pl
astic
ity I
ndex
%
Measured Plasticity Index %
R² = 0.237
0
5
10
15
20
25
0 10 20
Pred
icte
d Pl
astic
ity I
ndex
%
Measured Plasticity Index %
R² = 0.220
0
5
10
15
20
25
0 10 20
Pred
icte
d Pl
astic
ity I
ndex
%
Measured Plasticity Index %
R² = 0.336
0
0.5
1
1.5
2
2.5
3
3.5
4
4.5
5
0 2 4
Pred
icte
d Pl
astic
ity I
ndex
%
Measured Plasticity Index %
Fig. 9 Comparison of predictionaccuracy of regression and ANNmodels for plasticity index usingelectrical resistivity as inputparameter. a All soil samples, bsilty sand soil samples, and csandy soil samples
Arab J Geosci
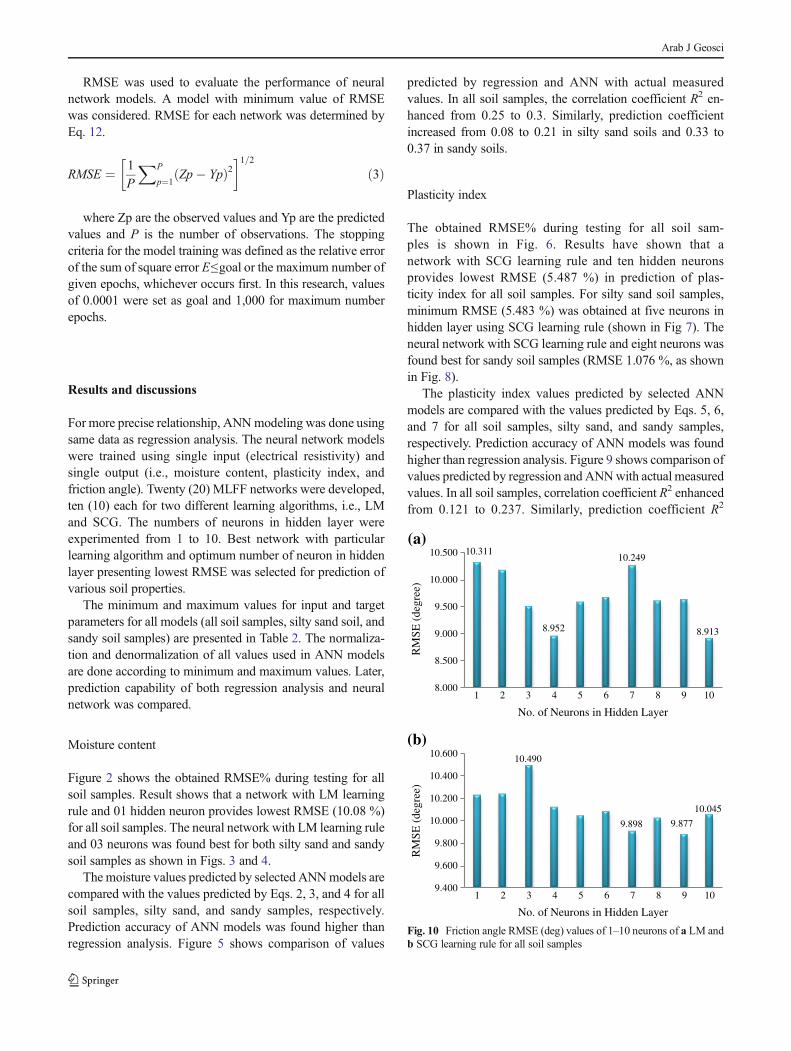
RMSE was used to evaluate the performance of neuralnetwork models. A model with minimum value of RMSEwas considered. RMSE for each network was determined byEq. 12.
RMSE ¼ 1
P
XP
p¼1Zp� Ypð Þ2
� �1=2ð3Þ
where Zp are the observed values and Yp are the predictedvalues and P is the number of observations. The stoppingcriteria for the model training was defined as the relative errorof the sum of square error E≤goal or the maximum number ofgiven epochs, whichever occurs first. In this research, valuesof 0.0001 were set as goal and 1,000 for maximum numberepochs.
Results and discussions
For more precise relationship, ANNmodeling was done usingsame data as regression analysis. The neural network modelswere trained using single input (electrical resistivity) andsingle output (i.e., moisture content, plasticity index, andfriction angle). Twenty (20) MLFF networks were developed,ten (10) each for two different learning algorithms, i.e., LMand SCG. The numbers of neurons in hidden layer wereexperimented from 1 to 10. Best network with particularlearning algorithm and optimum number of neuron in hiddenlayer presenting lowest RMSE was selected for prediction ofvarious soil properties.
The minimum and maximum values for input and targetparameters for all models (all soil samples, silty sand soil, andsandy soil samples) are presented in Table 2. The normaliza-tion and denormalization of all values used in ANN modelsare done according to minimum and maximum values. Later,prediction capability of both regression analysis and neuralnetwork was compared.
Moisture content
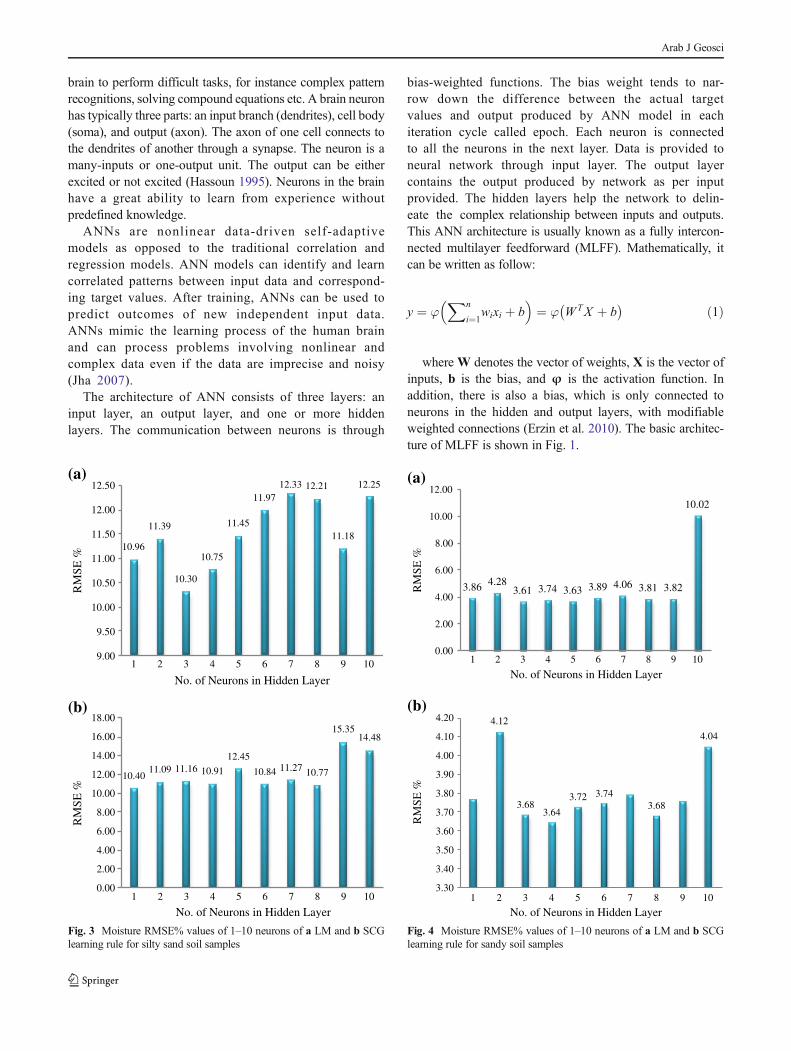
Figure 2 shows the obtained RMSE% during testing for allsoil samples. Result shows that a network with LM learningrule and 01 hidden neuron provides lowest RMSE (10.08 %)for all soil samples. The neural network with LM learning ruleand 03 neurons was found best for both silty sand and sandysoil samples as shown in Figs. 3 and 4.
The moisture values predicted by selected ANNmodels arecompared with the values predicted by Eqs. 2, 3, and 4 for allsoil samples, silty sand, and sandy samples, respectively.Prediction accuracy of ANN models was found higher thanregression analysis. Figure 5 shows comparison of values
predicted by regression and ANN with actual measuredvalues. In all soil samples, the correlation coefficient R2 en-hanced from 0.25 to 0.3. Similarly, prediction coefficientincreased from 0.08 to 0.21 in silty sand soils and 0.33 to0.37 in sandy soils.
Plasticity index
The obtained RMSE% during testing for all soil sam-ples is shown in Fig. 6. Results have shown that anetwork with SCG learning rule and ten hidden neuronsprovides lowest RMSE (5.487 %) in prediction of plas-ticity index for all soil samples. For silty sand soil samples,minimum RMSE (5.483 %) was obtained at five neurons inhidden layer using SCG learning rule (shown in Fig 7). Theneural network with SCG learning rule and eight neurons wasfound best for sandy soil samples (RMSE 1.076 %, as shownin Fig. 8).
The plasticity index values predicted by selected ANNmodels are compared with the values predicted by Eqs. 5, 6,and 7 for all soil samples, silty sand, and sandy samples,respectively. Prediction accuracy of ANN models was foundhigher than regression analysis. Figure 9 shows comparison ofvalues predicted by regression and ANNwith actual measuredvalues. In all soil samples, correlation coefficient R2 enhancedfrom 0.121 to 0.237. Similarly, prediction coefficient R2
(a)10.311
8.952
10.249
8.913
8.000
8.500
9.000
9.500
10.000
10.500
1 2 3 4 5 6 7 8 9 10
RM
SE (
degr
ee)
No. of Neurons in Hidden Layer
(b)10.490
9.898 9.877
10.045
9.400
9.600
9.800
10.000
10.200
10.400
10.600
1 2 3 4 5 6 7 8 9 10
RM
SE (
degr
ee)
No. of Neurons in Hidden Layer
Fig. 10 Friction angle RMSE (deg) values of 1–10 neurons of a LM andb SCG learning rule for all soil samples
Arab J Geosci
(a)
(b)
(c)
Regression ANN
Regression ANN
Regression ANN
R² = 0.122
0
5
10
15
20
25
30
35
40
45
0 20 40
Pred
icte
d Fr
ictio
n A
ngle
(de
g)
Measured Friction Angle (deg)
R² = 0.155
0
5
10
15
20
25
30
35
40
0 10 20 30 40
Pred
icte
d Fr
ictio
n A
ngle
(de
g)Measured Friction Angle (deg)
R² = 6E-06
0
5
10
15
20
25
30
35
40
45
50
0 20 40
Pred
icte
d Fr
ictio
n A
ngle
(de
g)
Measured Friction Angle (deg)
R² = 0.301
0
5
10
15
20
25
30
35
40
45
50
0 20 40
Pred
icte
d Fr
ictio
n A
ngle
(de
g)
Measured Friction Angle (deg)
R² = 0.560
0
5
10
15
20
25
30
35
40
45
50
0 20 40
Pred
icte
d Fr
ictio
n A
ngle
(de
g)
Measured Friction Angle (deg)
R² = 0.209
0
5
10
15
20
25
30
35
40
45
50
0 20 40Pr
edic
ted
Fric
tion
Ang
le (
deg)
Measured Friction Angle (deg)
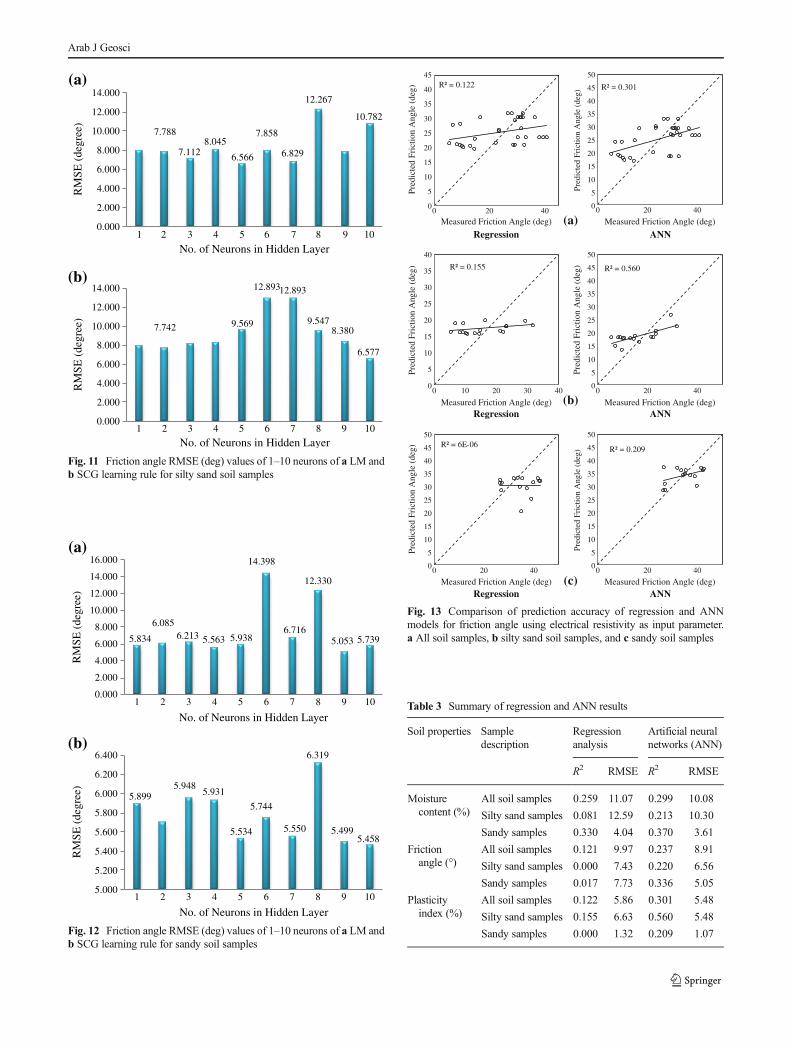
Fig. 13 Comparison of prediction accuracy of regression and ANNmodels for friction angle using electrical resistivity as input parameter.a All soil samples, b silty sand soil samples, and c sandy soil samples
(a)
5.834
6.0856.213 5.563 5.938
14.398
6.716
12.330
5.053 5.739
0.000
2.000
4.000
6.000
8.000
10.000
12.000
14.000
16.000
1 2 3 4 5 6 7 8 9 10
RM
SE (
degr
ee)
No. of Neurons in Hidden Layer
(b)
5.8995.948
5.931
5.534
5.744
5.550
6.319
5.4995.458
5.000
5.200
5.400
5.600
5.800
6.000
6.200
6.400
1 2 3 4 5 6 7 8 9 10
RM
SE (
degr
ee)
No. of Neurons in Hidden Layer
Fig. 12 Friction angle RMSE (deg) values of 1–10 neurons of a LM andb SCG learning rule for sandy soil samples
(a)
7.788
7.1128.045
6.566
7.858
6.829
12.267
10.782
0.000
2.000
4.000
6.000
8.000
10.000
12.000
14.000
1 2 3 4 5 6 7 8 9 10
RM
SE (
degr
ee)
No. of Neurons in Hidden Layer
(b)
7.742 9.569
12.89312.893
9.5478.380
6.577
0.000
2.000
4.000
6.000
8.000
10.000
12.000
14.000
1 2 3 4 5 6 7 8 9 10
RM
SE (
degr
ee)
No. of Neurons in Hidden Layer
Fig. 11 Friction angle RMSE (deg) values of 1–10 neurons of a LM andb SCG learning rule for silty sand soil samples
Table 3 Summary of regression and ANN results
Soil properties Sampledescription
Regressionanalysis
Artificial neuralnetworks (ANN)
R2 RMSE R2 RMSE
Moisturecontent (%)
All soil samples 0.259 11.07 0.299 10.08
Silty sand samples 0.081 12.59 0.213 10.30
Sandy samples 0.330 4.04 0.370 3.61
Frictionangle (°)
All soil samples 0.121 9.97 0.237 8.91
Silty sand samples 0.000 7.43 0.220 6.56
Sandy samples 0.017 7.73 0.336 5.05
Plasticityindex (%)
All soil samples 0.122 5.86 0.301 5.48
Silty sand samples 0.155 6.63 0.560 5.48
Sandy samples 0.000 1.32 0.209 1.07
Arab J Geosci
increased from 0.000 to 0.22 in silty sand soils and 0.017 to0.336 in sandy soils.
Friction angle
RMSE values obtained by different neural networkswith different learning rule and number of neurons inhidden layers for estimation of friction angle are pre-sented in Figs. 10, 11, and 12 for all soil samples, siltysand samples, and sandy soil samples, respectively.ANN with LM learning algorithm and ten neurons inhidden layer yields lowest RMSE (8.913°) for all soilsamples. In silty sand soil samples, minimum RMSE(6.566°) was obtained at five neurons in hidden layerusing LM learning rule. The neural network with LMlearning rule and 09 neurons was found best for sandysoil samples (RMSE 5.053°).
Comparative analysis of predicted values of frictionangle (φ) by regression and ANN methods is presentedin Fig. 13. ANN models show better prediction accura-cy in all cases. The R2 for friction anlge values predict-ed by Eq. 8 and selected ANN model for all soilsamples was increased from 0.122 to 0.301. Similarly,comparison of friction angle values predicted by Eq. 9and Eq. 10 and selected ANN models shows that pre-diction coefficient R2 increased from 0.155 to 0.560 insilty sand soils and 0.000 to 0.209 in sandy soils.
ANN models generally show better prediction results ascompared to regression analysis for all the properties in alltypes of soils. It was also found that networks trained with LMalgorithm yields lower RMSE as compared to SCG algorithm.Summary of regression and ANN results are presented inTable 3.
Conclusions
The current research was an attempt to compare regres-sion and ANNs in order to establish significant relation-ship between electrical resistivity and various soil prop-erties. The regression models of relationship betweenelectrical resistivity and various soil properties used inthe current research for the purpose of comparison withANN models were adopted from the work of Siddiquiand Osman (2013). ANN models showed better predic-tion results than regression models for all the propertiesin all types of soils.
Acknowledgments This research study is supported by UniversitiTeknologi PETRONAS under Graduate Assistantship scheme.
References
Abu-Hassanein ZS, Benson CH, Blotz LR (1996) Electrical resistivity ofcompacted clays. J Geotech Eng ASCE 122:397–406
Abu-Zeid N, Botteon D, Cocco G, Santarato G (2006) Non-invasivecharacterisation of ancient foundations in Venice using the electricalresistivity imaging technique. NDT E International 39:67–75
Anderson JA (2003) An introduction to neural networks. Prentice HallArora T, Ahmed S (2011) Characterization of recharge through complex
vadose zone of a granitic aquifer by time-lapse electrical resistivitytomography. J Appl Geophys 73:35–44
Braga A, Malagutti W, Dourado J, Chang H (1999) Correlation ofelectrical resistivity and induced polarization data with geotechnicalsurvey standard penetration test measurements. J Environ EngGeophys 4:123–130
Bristow KL, Kluitenberg GJ, Goding CJ, Fitzgerald TS (2001) A smallmulti-needle probe for measuring soil thermal properties, watercontent and electrical conductivity. Comput Electron Agric 31:265–280
Cosenza P, Marmet E, Rejiba F, Jun Cui Y, Tabbagh A, CharleryY (2006) Correlations between geotechnical and electricaldata: a case study at Garchy in France. J Appl Geophys60:165–178
Das SK, Basudhar PK (2008) Prediction of residual friction angle of claysusing artificial neural network. Eng Geol 100:142–145
Demuth H, Beale M, Hagan M (2006) Neural Network Toolbox User’sGuide. The Math Works, Inc., Natick
Erzin Y, Rao BH, Patel A, Gumaste SD, Singh DN (2010) Artificialneural network models for predicting electrical resistivity of soilsfrom their thermal resistivity. Int J Therm Sci 49:118–130
Giao PH, Chung SG, Kim DY, Tanaka H (2003) Electric imaging andlaboratory resistivity testing for geotechnical investigation of Pusanclay deposits. J Appl Geophys 52:157–175
Hassoun MH (1995) Fundamental of Artificial Neural Networks. MITPress, Cambridge
Jha GK (2007) Artificial neural networks and its applicationsKalinski RJ, Kelly WE (1993) Estimating water content of soils from
electrical resistivity. Geotech Test J 16:323–329Kalinski RJ, Kelly WE (1994) Electrical-resistivity measurements for
evaluating compacted-soil liners. J Geotech Eng ASCE 120:451–457
Liu SY, Du YJ, Han LH, Gu MF (2008) Experimental study on theelectrical resistivity of soil-cement admixtures. Environ Geol 54:1227–1233
Majumdar RK, Majumdar N, Mukherjee AL (2000) Geoelectric investi-gations in Bakreswar geothermal area, West Bengal, India. J ApplGeophys 45:187–202
McCarter WJ (1984) Electrical resistivity characteristics of compactedclays. Geotechnique 34:263–267
Nijland W, van der Meijde M, Addink EA, de Jong SM (2010)Detection of soil moisture and vegetation water abstraction ina Mediterranean natural area using electrical resistivity to-mography Catena
Oh S, Sun CG (2008) Combined analysis of electrical resistivity andgeotechnical SPT blow counts for the safety assessment of fill dam.Environ Geol 54:31–42
Ozcep F, Tezel O, Asci M (2009) Correlation between electrical resistiv-ity and soil-water content: Istanbul and Golcuk International. J PhysSci 4:362–365
Ozcep F, Yildirim E, Tezel O, Asci M, Karabulut S (2010) Correlationbetween electrical resistivity and soil-water content based artificialintelligent techniques International. J Phys Sci 5:47–56
Panthulu TV, Krishnaiah C, Shirke JM (2001) Detection of seepage pathsin earth dams using self-potential and electrical resistivity methods.Eng Geol 59:281–295
Arab J Geosci

Pozdnyakov AI, Pozdnyakova LA, Karpachevskii LO (2006)Relationship between water tension and electrical resistivity in soils.Eurasian Soil Sci 39:S78–S83
Pozdnyakova A, Pozdnyakova L (2002) Electrical fields and soil prop-erties Proceedings of 17th World Congress of Soil Science,Thailand, 14–21 August paper 1558
Samouëlian A, Cousin I, Tabbagh A, Bruand A, Richard G (2005)Electrical resistivity survey in soil science: a review. Soil TillageRes 83:173–193
Santarato G, Ranieri G, Occhi M, Morelli G, Fischanger F, Gualerzi D(2011) Three-dimensional electrical resistivity tomography to con-trol the injection of expanding resins for the treatment and stabili-zation of foundation soils. Eng Geol 119:18–30
Schwartz BF, Schreiber ME, Yan T (2008) Quantifying field-scale soilmoisture using electrical resistivity imaging. J Hydrol 362:234–246
Séger M, Cousin I, Frison A, Boizard H, Richard G (2009)Characterisation of the structural heterogeneity of the soil tilled layerby using in situ 2D and 3D electrical resistivity measurements. SoilTillage Res 103:387–398
Shahin MA, Jaksa MB, Maier HR (2001) Artificial neural networkapplications in geotechnical engineering. Aust Geomech 36:49–62
Siddiqui FI, Osman SBABS (2012a) Electrical resistivity based non-destructive testing method for determination of soil’s strength prop-erties. Adv Mater Res 488:1553–1557
Siddiqui FI, Osman SBABS (2012b) Integrating geo-electrical and geo-technical data for soil characterization international. J Appl PhysMath 2:104–106
Siddiqui FI, Osman SBABS (2013) Simple and multiple regressionmodels for relationship between electrical resistivity and varioussoil properties. Environ Earth Sci 70:259–267
Sjödahl P, Dahlin T, Johansson S, Loke MH (2008) Resistivity monitor-ing for leakage and internal erosion detection at Hällby embankmentdam. J Appl Geophys 65:155–164
Son Y, Oh M, Lee S (2009) Estimation of soil weatheringdegree using electrical resistivity. Environ Earth Sci 59:1319–1326
Sreedeep S, Reshma AC, Singh DN (2005) Generalized relationship fordetermining soil electrical resistivity from its thermal resistivity. ExpThermal Fluid Sci 29:217–226
Yoon GL, Park JB (2001) Sensitivity of leachate and fine contents onelectrical resistivity variations of sandy soils. J Hazard Mater 84:147–161
Arab J Geosci
Related Documents